GREATER PERTH POPULATION AND HOUSING ...
84
Greater Perth Population and Housing Discussion Paper No. 2 GREATER PERTH POPULATION AND HOUSING DISCUSSION PAPER TWO Prepared for: WESTERN AUSTRALIAN PLANNING COMMISSION August 2003
-
Upload
khangminh22 -
Category
Documents
-
view
1 -
download
0
Transcript of GREATER PERTH POPULATION AND HOUSING ...

Greater Perth Population and Housing Discussion Paper No. 2
GREATER PERTH
POPULATION AND HOUSING DISCUSSION PAPER TWO
Prepared for: WESTERN AUSTRALIAN PLANNING COMMISSION
August 2003

Greater Perth Population and Housing Discussion Paper No. 2
ii
State of Western Australia Published by the
Western Australian Planning Commission Albert Facey House
469 Wellington Street Perth, Western Australia 6000
Published August 2003
ISSN: 0 7309 9405 8
Internet: http://www.wapc.wa.gov.au E-mail: [email protected]
Fax: (08) 9264 7566 Phone: (08) 9264 7777 TTY: (08) 9264 7535 Infoline: 1800 626 477
Copies of this document are available in alternative formats on application to the
Disability Services Co-ordinator
Disclaimer
This document has been published by the Western Australian Planning Commission. Any representation, statement, opinion or advice expressed or implied in this publication is made in good faith and on the basis that the Government, its employees and agents are not liable for any damage or loss whatsoever which may occur as a result of action taken or not taken (as the case may be) in respect of any representation, statement, opinion or advice referred to herein. Professional advice should be obtained before applying the information contained in this document to particular circumstances.
Greater Perth Population and Housing Discussion Paper No. 2
iii
CONTENTS SUMMARY ................................................................................................................ 1 1. INTRODUCTION..................................................................................... 4 2. POPULATION AND PERTH’S URBAN FORM ....................................... 5 2.1 Social Drivers of Perth’s Urban Form ...................................................... 5 2.2 Development of Perth’s Residential Areas .............................................. 6 2.3 Australian Culture and the Detached House ......................................... 10 2.4 Contemporary Housing Preferences ..................................................... 12 2.5 Housing Affordability ............................................................................. 17 3. STATE GOVERNMENT PLANNING AND HOUSING STRATEGIES... 24 3.1 Role of Planning and the State Planning Strategy................................. 24 3.2 Role of Housing and Works and the State Housing Strategy ................ 25 3.3 Whole-of-Government Approach and Sustainability.............................. 27 4. GREATER PERTH'S POPULATION WILL CONTINUE TO GROW ..... 29 4.1 Background ........................................................................................... 29 4.2 Trends ................................................................................................... 30 4.3 Issues and Implications ......................................................................... 36 5. PERTH METROPOLITAN REGION'S POPULATION GROWTH RATE IS
EXPECTED TO FALL ........................................................................... 37 5.1 Background ........................................................................................... 37 5.2 Trends ................................................................................................... 38 5.3 Issues and Implications ......................................................................... 44 6 THE NUMBER OF BABIES BORN PER WOMAN IS DECLINING ....... 46 6.1 Background ........................................................................................... 46 6.2 Trends ................................................................................................... 49 6.3 Issues and Implications ......................................................................... 49 7 THE GREYING POPULATION.............................................................. 53 7.1 Background ........................................................................................... 53 7.2 Trends ................................................................................................... 53 7.3 Issues and Implications ......................................................................... 58 8 HOUSEHOLDS WILL CONTAIN FEWER PEOPLE.............................. 59 8.1 Background ........................................................................................... 59 8.2 Trends ................................................................................................... 60 8.3 Issues and Implications ......................................................................... 66 9 INNER CITY PERTH'S GROWTH IS EXPECTED TO CONTINUE ...... 67 9.1 Background ........................................................................................... 67 9.2 Trends ................................................................................................... 68 9.3 Issues and Implications ......................................................................... 72 10 Glossary ................................................................................................ 73 11 References............................................................................................ 74
Greater Perth Population and Housing Discussion Paper No. 2
iv
List of Charts
Chart 2.1 Perth Growth Rates: Median Lot Price, Wages and Construction Costs,
1979-2002 ............................................................................................. 21 Chart 2.2 Residential Lot Production, Metropolitan Perth 1985-2002 ................... 22 Chart 3.1 Housing Market Segments .................................................................... 26 Chart 3.2 Housing Strategy WA: Housing System Model ..................................... 27 Chart 4.1 Age Sex Pyramid for Greater Perth 1996, 2001 and 2031 .................... 35 Chart 5.1 Components of Population Growth in Western Australia 1974-2001..... 39 Chart 5.2 Net Interstate Migration in Greater Perth 1991-1996 & 1996-2001 ....... 42 Chart 5.3 Net Intrastate Migration in Greater Perth 1986-1991, 1991-1996 ............. and 1996-2001 ...................................................................................... 43 Chart 5.4 Component of Greater Perth’s Population growth ’Existing v/s New’
Residents 2001-2031 ............................................................................ 44 Chart 5.5 Component of Greater Perth’s Population growth ’Existing v/s New’
Residents by 2031................................................................................. 44 Chart 6.1 Age Sex Pyramid for Perth Metropolitan Region 1971, 1996 and 203151 Chart 6.2 Age Sex Pyramid for Western Australia 2051 ...................................... 52 Chart 7.1 Timing and Speed of Structural Ageing by State/Territory in Australia.. 56 Chart 8.1 Household Size in Western Australia 1971 and 2001 ........................... 61 Chart 8.2 Historical and Projected Occupancy Rates by Planning Sector 1971-2031 ............................................................................................. 64 List of Tables
Table 2.1 Household Income for Home Purchasers, Private Renters, All Households in WA: 2001.................................................................. 17 Table 2.2 Property Market Indicators: May 2003................................................... 18 Table 4.1 Estimated and Projected Population for Greater Perth and Western
Australia 1901 –2031 ............................................................................ 29 Table 4.2 Population Estimates and Projections for LGAs in Perth Metropolitan
Area 1981-2031.................................................................................... 31 Table 4.3 Distribution of Local Government Area populations of Greater Perth's
Outer Regions in 2001 .......................................................................... 34 Table 5.1 Average Annual Growth Rte of Population in the Perth Metropolitan
Region by Planning Sectors 1961-2031 ................................................ 37 Table 5.2 Net Migration in Greater Perth, Rest of State and WA 1986-1991 ........ 40 Table 5.3 Net Migration in Greater Perth, Rest of State and WA 1991-1996 ........ 41 Table 5.4 Net Migration in Greater Perth, Rest of State and WA 1996-2001 ........ 41 Table 6.1 Total Fertility Rates for Local Government Areas b Planning Sector in
Perth Metropolitan Area 1976, 1986 and 1996..................................... 49 Table 7.1 Median Ages of the Population of Perth Metro LGAs 1996-2016......... 54 Table 7.2 Population Dependency Ratio by State/Territory in Australia 2001-2051
.............................................................................................................. 57 Table 8.1 Occupancy Trends in Private Dwellings, WA 1947-1996 ...................... 59 Table 8.2 Historical and Projected Occupancy Rates by Planning Sector ............ 62 Table 8.3 Projected Total Private Dwelling Need in Greater Perth, 2001 to 2031 .................................................................................................. 65

Greater Perth Population and Housing Discussion Paper No. 2
v
Table 8.4 Ten Yearly New Private Dwelling Need in Greater Perth, 2001 to 2031 .................................................................................................. 65 Table 9.1 Population, Dwellings and Workforce Change in the Perth Central
Business District 1961–2001................................................................. 70 Table 9.2 Distribution of Employment by Industry in the CBD 1961-2001............. 71

Greater Perth Population and Housing Discussion Paper No. 2
vi
List of Figures
Figure 1 Local Government Areas in Greater Perth Outer Region ........................ 3 Figure 2 Progressive Urban Development in Perth Metro Region 1925-2002...... 9 Figure 4.1 Predicted Population Change in the Local Government Areas of the
Metropolitan Region 2001-2016 ............................................................ 32 Figure 4.2 Predicted Population Change in Non Metropolitan Local Government
Areas of Greater Perth 2001-2016 ........................................................ 33 Figure 7.1 Distribution of Projected 1996-2016 Increase in Elderly Population in the Perth Metropolitan Region........................................................... 55 Figure 8 Change in Occupancy Rate 1996 – 2031 in Selected Area of Perth
Metropolitan Region by 1996 Census Collection Districts ..................... 63 Figure 9 Perth City 2001 Census Collection Districts and Journey to Work Census Zones ....................................................................................... 67

Greater Perth Population and Housing Discussion Paper No. 2
1
SUMMARY The Western Australian Planning Commission has prepared a set of technical papers as part of its Plan for the Sustainable Development of Greater Perth. The plan is being prepared using the technical resources of the Department for Planning and Infrastructure. Population and Housing encompasses issues that a burgeoning Western Australia will face as its current population of just under two million reaches nearly three million by 2031. Greater Perth’s population is projected to increase from 1.55 million in 2001 to 2.39 million in the next thirty years, representing 82 per cent of the State’s total increase. Most of these people are expected to seek a home in the Perth, Mandurah and Murray areas. This paper looks at addressing the needs and aspirations of this “new” population, the majority of which will come from immigration, while about a third will be from births in the community. Over recent years, Greater Perth has witnessed an increasing demand for bigger houses, although fewer people are living in them. Planners must respond to this trend, which is expected to continue, and the need to provide at least an additional 13,500 new houses, on average every year, to accommodate the 2031 population. This means land for about 400,000 new homes will be needed, , 370,000 of which are expected to be in the Perth, Mandurah and Murray areas.
Greater Perth’s increasing proportion of older people, which is typical of the developed world, is forecast to continue with the 1971 median age of 26.2 years becoming 40.8 years by 2031. The ratio of “dependent” people, namely children aged 0-14 and the over 65 age group, will be 55.2 per cent by 2031. The “greying” of our population gives rise to enormous social, economic and political issues, as the huge shift from a youth to aged-dominated community gathers pace.
Further key trends include declining fertility rates, increasing survival rates and the uncertain but important force of migration. Western Australia is expected to continue to attract about 10 per cent of all immigration to Australia but if no migration occurs, the population in Greater Perth would actually decline from 2027.
Age-sex Pyramid for Perth Metropolitan , Peel and Greater Bunbury RegionSchemes Showing Growth From 1971 to 2001 and Projected 2031 Population
020000400006000080000100000
males
1971 2001 2031
0 20000 40000 60000 80000 100000
females
1971 2001 2031
0-4
20-24
30-34
40-44
50-54
10-14
60-64
70-74
80-84
Source: 1971Census, 2001 ABS ERP preliminary, 2031 DPI Medium Series Projection

Greater Perth Population and Housing Discussion Paper No. 2
2
A key challenge for planners is accommodating the future behaviour and demands of the unpredictable and ageing Baby Boomers, the impact of falling fertility and ageing of the population on the number of workers available to support the non-working sector. In addition, there will be fewer younger people to house and care for their ageing family members. The impact of these demographic change has been a more rapid increase in houses than people, a preference for private car usage and single homes on large blocks leading to a low density city. However, there are signs that these preferences are changing and acceptance of smaller single residential lots and medium density housing is increasing as people become more concerned about housing affordability, urban sprawl and sense of community. Key challenges for planners and the community include the type, affordability and location of new dwellings; the efficient and effective supply of infrastructure including gas, water and telecommunications; the provision of roads and public transport; ensuring the availability of appropriately skilled labour; and making provision for that labour to work in locations that are appropriate to their needs and the needs of the wider community as well. In addition, the location and accessibility of health services and housing for both the active and frail aged must be considered. As the population ages, the location of schools and their potential for use as other community services becomes an issue. There must be adequate provision and location of passive and active recreation areas. All this needs to be achieved within the framework of more liveable and sustainable communities. A key challenge will be to keep a finger on the population pulse by closely monitoring and maintaining a global focus on immigration and population change to ensure these issues are at the forefront of public and policy focus. Emphases in decision making will need to change to reflect the ageing population. While the impacts of this change are minimal in the short term (five years), the long term implications of an ageing population, change in households and family structures cannot be ignored as they become more acute.

Greater Perth Population and Housing Discussion Paper No. 2
3

Greater Perth Population and Housing Discussion Paper No. 2
4
1. INTRODUCTION Population and Housing Paper The Population and Housing Working Paper is one of eleven technical papers presenting facts and considerations that could help finalise a new strategic plan for Greater Perth. Greater Perth consists of Perth Metropolitan Region, the Peel Region Scheme comprising the City of Mandurah, Murray and Waroona, Greater Bunbury Region Scheme (the City of Bunbury, Harvey, Dardanup and Capel) and Avon Arc/Gingin (the Shires of Beverley, Brookton, Chittering, Gingin, Northam, Toodyay, York and the Town of Northam). This paper is also an update of Population Issues, Metropolitan Working Paper No. 5 released in September 2001 together with eleven other background papers intended to generate discussion and help to formulate options for the new plan. Working Paper No. 5 was constrained to the Perth Metropolitan Region, whereas this paper also presents facts and considerations related to the three non-metropolitan areas of Greater Perth, namely the Peel Region Scheme, Greater Bunbury Region Scheme and Avon Arc/Gingin area. The other technical papers cover topics including employment, infrastructure, environment and sustainability. The Population and Housing paper provides an understanding of the demographic and associated drivers of population change in the Greater Perth Region. It articulates the interrelationships between population change, demography and household components. The report reviews past patterns and examines likely future outcomes in population distribution in the Greater Perth Region.
Greater Perth Population and Housing Discussion Paper No. 2
5
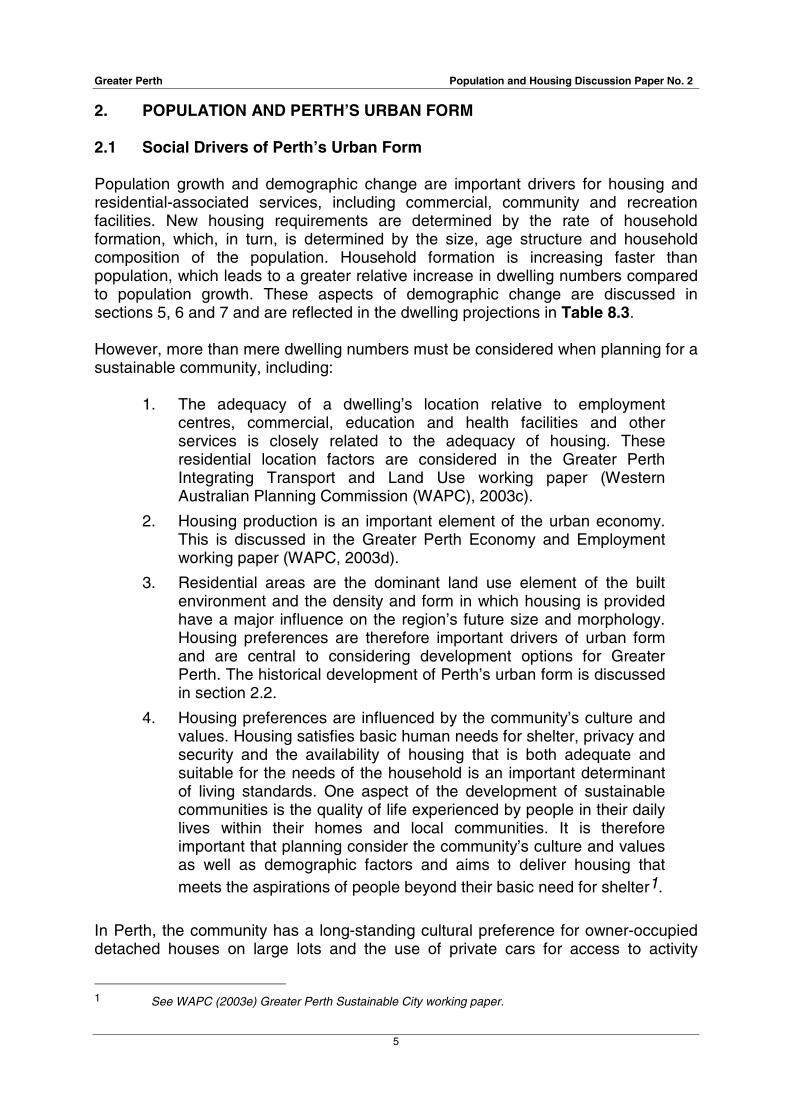
2. POPULATION AND PERTH’S URBAN FORM 2.1 Social Drivers of Perth’s Urban Form Population growth and demographic change are important drivers for housing and residential-associated services, including commercial, community and recreation facilities. New housing requirements are determined by the rate of household formation, which, in turn, is determined by the size, age structure and household composition of the population. Household formation is increasing faster than population, which leads to a greater relative increase in dwelling numbers compared to population growth. These aspects of demographic change are discussed in sections 5, 6 and 7 and are reflected in the dwelling projections in Table 8.3. However, more than mere dwelling numbers must be considered when planning for a sustainable community, including:
1. The adequacy of a dwelling’s location relative to employment
centres, commercial, education and health facilities and other services is closely related to the adequacy of housing. These residential location factors are considered in the Greater Perth Integrating Transport and Land Use working paper (Western Australian Planning Commission (WAPC), 2003c).
2. Housing production is an important element of the urban economy. This is discussed in the Greater Perth Economy and Employment working paper (WAPC, 2003d).
3. Residential areas are the dominant land use element of the built environment and the density and form in which housing is provided have a major influence on the region’s future size and morphology. Housing preferences are therefore important drivers of urban form and are central to considering development options for Greater Perth. The historical development of Perth’s urban form is discussed in section 2.2.
4. Housing preferences are influenced by the community’s culture and values. Housing satisfies basic human needs for shelter, privacy and security and the availability of housing that is both adequate and suitable for the needs of the household is an important determinant of living standards. One aspect of the development of sustainable communities is the quality of life experienced by people in their daily lives within their homes and local communities. It is therefore important that planning consider the community’s culture and values as well as demographic factors and aims to deliver housing that meets the aspirations of people beyond their basic need for shelter1.
In Perth, the community has a long-standing cultural preference for owner-occupied detached houses on large lots and the use of private cars for access to activity
1 See WAPC (2003e) Greater Perth Sustainable City working paper.

Greater Perth Population and Housing Discussion Paper No. 2
6
centres. The outcome is significant land consumption by residential uses and a large, low-density metropolitan region, which has doubled in size since 1962. Section 2.2 discusses the expansion of settlement in the Perth Metropolitan Region. However, there are signs that the acceptability of both smaller single residential lots and medium density housing is changing as people become concerned about issues of housing affordability, urban sprawl and sense of community. Housing preferences are therefore an important driver of metropolitan form and are central to considering development options for Greater Perth. In sections 2.3 and 2.4, the cultural basis of the strong historical preference for the single detached house is discussed, current preferences are identified and the outlook for change is considered. 2.2 Development of Perth’s Residential Areas 2.2.1 Early Development and Residential Preferences At the beginning of the post war period, Perth was a relatively compact city in
which residential expansion relied heavily on access to public transport. Land within walking distance of train, tram and trolley bus routes formed “corridors” of development radiating from central Perth (Marsh, 1979).
A period of economic prosperity, the ‘long boom’ from 1947 to the early 1970s, coupled with rapid post-war population growth due to high birth rates and immigration2, stimulated major expansion of the housing stock in Perth as in all Australian capitals. Rising real incomes and low unemployment (around one per cent) provided unprecedented security for wage earners. Government support for low interest home loans encouraged home ownership and rapid urban development occurred (Davidson, 1995; Forster, 1999).
Although economic prosperity and population growth motivated urban expansion, they do not explain the characteristic spreading, suburbanised form of Australian cities. This arose largely from the strong cultural preference for single detached houses on large lots that is embedded in Australian society. The origins of this, and contemporary preferences, are discussed in section 2.3.
By the 1950s, the preference for suburban living in detached houses was enabled by the emergence of the car as an affordable means of private transport. In Perth, it facilitated development of previously inaccessible land between and beyond the public transport routes and an abundance of cheap land provided ample space for low-density suburbs (Marsh, 1979; Frost and Dingle, 1995; Forster, 1999). Suburbanisation was rapid, and thus:
“The sprawling, decentralised, automobile dependent, ethnically diverse cities most of us live in today are mainly a legacy of the 1950s and 1960s.” (Forster, 1999: 18)
2 See sections 5.2 and 6.1

Greater Perth Population and Housing Discussion Paper No. 2
7
In Perth, suburbanisation was also facilitated by the even topography and sandy soils of the Swan Coastal Plain, which presented few impediments to development, and the urban area became characterised by spacious suburbs of single lots of around 750m2. (Yiftachel and Hedgcock, 1992). Separate houses, as a proportion of all dwellings, peaked at 93 per cent in Perth in 1961, which was the highest of all Australian capitals (Forster, 1999). A boom in flat building occurred in the 1960s, reducing occupied houses to 81 per cent of total occupied dwellings by 1971. The decline thereafter, to 78 per cent in 2001, was marginal.
2.2.2 Spatial Extent of Urban Development in Perth
Perth’s existing urban form is characterised by low-density, spreading suburbs predicated on a cultural preference for owner-occupied detached houses on large lots and the use of private cars to access activity centres. The approximate extent of residential development in 2002, derived from the StreetSmart metropolitan street directory (Department of Land Administration (DOLA), 2002) is shown in Figure 2. These areas include some non-residential areas, such as local parks, shopping centres and other residential-associated uses. Urban extents in 1925, 1962, 1974 and 1983, derived from the Perth Region Data Book (Metropolitan Region Planning Authority (MRPA), 1985), show the area of all urban-associated uses, including major industrial areas. They are not strictly comparable with the 1995 and 2002 maps but, nevertheless, Figure 2 indicates that the urbanised area of the Perth Metropolitan Region has more than doubled since 1962.
Perth’s metropolitan population in 1925 was about 200,000 and most residential development was associated with the original settlement nodes of Perth, Fremantle and Guildford and their suburban extensions along train and tram routes including Cottesloe, Claremont, Subiaco, Leederville, North Perth, South Perth, Bassendean and Midland. There were also small pockets of development as far away as Kalamunda in the east and Rockingham in the south as well as the northern beaches.
In 1962, the development front was mostly about 10km from the Perth GPO, with extensions to 15-20km in the north-east to Midland, south of Fremantle, and south-east along the Albany Highway/Armadale railway. Small pockets of urban development existed in the hills east of Perth, particularly at Armadale, Kalamunda and Mundaring. Rockingham to the south-west was a retirement location and holiday centre and Kwinana had been established to house the workforce of the Kwinana Industrial Area.
There was extremely rapid growth in the late 1960s stimulated by the commencement of iron ore mining in the Pilbara and high interstate and overseas immigration. This lead to unprecedented demand for housing (MRPA, 1970). Urban corridors extending along routes connecting Perth to its agricultural hinterland were emerging to the east and south-east. Both routes were associated with major industrial development and transportation functions – Midland’s historic railway workshops and abattoir at the head of

Greater Perth Population and Housing Discussion Paper No. 2
8
the Eastern Corridor and Welshpool-Kewdale industrial area in the South East Corridor, established in the 1960s. The development of the Kwinana industrial area and associated town in the 1950s and 60s brought the South West Corridor into being. The North West Corridor did not exist but planning for new suburbs in the Whitfords area had been initiated as the northern extension of (then) recently established residential estates in Greenwood and Duncraig. To the north-east, the Swan Valley remained rural, although serviced by major road and rail routes to the State’s northern agricultural and mining areas (MRPA, 1970).
The current metropolitan form was initiated by the Corridor Plan for Perth (MRPA, 1970), which built on the preferred pattern of urban growth evident during the 1960s. By 1974, further development of the middle suburbs, including Morley and Dianella to the north-east and Booragoon to the south, was complete. Extension into the corridors was evident, including the first neighbourhoods of the Whitfords estates in the north-west, some development south of Rockingham, substantial expansion of Gosnells and consolidation and expansion of hills communities to the east and south-east of Midland.
With the development of Noranda, Willetton and Bullcreek and extension of Booragoon, by the mid-80s, most of the Middle Sector (within 15 km of Perth GPO) was developed. The only remaining substantial undeveloped area was the former Somerville Pine Plantation that was subsequently developed into the suburbs of Winthrop, Murdoch and Kardinya. A strong corridor form had emerged to the north-west, but to the south-west and south-east, corridor development was more limited due to association with industry and/or inland location and the availability of land in the southern middle suburbs.
During the 1990s, Metroplan (Department of Planning and Urban Development (DPUD), 1990) continued to direct most urban development into the outlying corridors of the metropolitan region, while encouraging consolidation and medium density development in the urban core.
Two elongated coastal corridors to the north-west and south-west have emerged as an expression of community preferences for coastal living environments. To the east, fragile hills environments precluded the development of a strong urban corridor but a north-east corridor is now emerging north of the Swan Valley. Figure 2 shows that by 2002 the development front was 37km north-west of Perth (Butler) and 47km to the south-west (Port Kennedy) but the inland south-east corridor has not developed to the same extent.

Greater Perth Population and Housing Discussion Paper No. 2
9
10km
20km
30km
40km
50km
The urban extent is anapproximation taken from1962
1974
1983
Approximate Extent of Urban Development in -
257 sq km
378 sq km
495 sq km
Neither source shows the two sources indicated.
land exactly equivalentto either the developed parts of the MRS UrbanZone or to residential land use.
Source:
STREETSMART
PERTH REGIONDATA BOOK
Source:
MRPA (1985)
1996 & 2003PERTH STREETDIRECTORIES
1925 66 sq km
1995 559 sq km
FIGURE
2 PROGRESSIVE URBAN DEVELOPMENT, 1925 - 2002PERTH METROPOLITAN REGION
Prepared by Research Branch, Department for Planning and Infrastructure
�
2002 631 sq km

Greater Perth Population and Housing Discussion Paper No. 2
10
2.3 Australian Culture and the Detached House Australians have a long-standing preference for single detached houses, which originated at the time of the first European settlement. This coincided with the emergence of the suburb as the solution to the overcrowding and pollution in British industrial cities. By the 1820s, the merchant elite in London were moving from city terraces to suburbs and villages in the countryside in search of privacy, a relaxed lifestyle, sunlight and fresh air. Physical separation from “uncouth and possibly dangerous” working class neighbours was also an objective (Davidson, 1993). Preference for single suburban houses was brought to the Australian colonies by the officials and businessmen who made decisions about layout and lot sizes of colonial towns. The working classes in British cities also aspired to suburban living, although they could not afford it. These working class people, who aspired to suburban living, were well represented among Australian immigrants. The prospect of securing their own suburban house, an improved lifestyle and the possibility of home ownership, often motivated migration. With this heritage, preference for single detached housing on large suburban lots became embedded in Australian culture (Davidson, 1993, 1995; Frost and Dingle, 1995). Perth’s current urban form is dominated by residential areas and has been strongly influenced by its development history (Hedgcock and Hibbs, 1992), which expresses a cultural preference for single detached housing. The colonial townsite plans of Perth and Fremantle provided spacious layouts with lots in excess of a quarter of an acre (1012m2)3. Crown control over subdivision was lost once land was alienated, and while growth was slow, this mattered little. The gold rushes of the 1890s brought massive population growth and high demand for building sites, and colonial land grants were subdivided (Hedgcock and Hibbs, 1992). With no overall town planning scheme in place, each subdivision was carried out independently, such that:
“…street layouts differ one to another, determined within by the boundaries of the estate, which often became roads. In this way the old land grants have imprinted their image on the street pattern of the inner suburbs of Perth and Fremantle - Mount Lawley, Inglewood, Leederville … and others.” (Pitt-Morrison, 1979:54)
A dispersed urban form, relative to other Australian cities, has been evident for over 100 years. Perth was described by The West Australian newspaper in 1899 as having its inhabitants:
“… dispersed over a wide area rather than their concentration within relatively narrow limits.” (Webb, 1979:366)
Perth’s initial urban growth came at a time when the effects of overcrowding and poor sanitation had been recognised by the urban reform movements of the mid-late nineteenth century. Nevertheless, the inner city was overcrowded by 1895, the spacious layout of the colonial era overtaken by a “jumble of lots sizes, street widths and back alleys” (Hedgcock and Hibbs, 1992:67). The lack of reticulated water and
3 Lots in Perth were as large as nine-tenths of an acre (3,642m2) and in Fremantle were approximately a
quarter of an acre (1,012m2) (Hedgcock and Hibbs, 1992).

Greater Perth Population and Housing Discussion Paper No. 2
11
sewerage caused water-borne diseases such as typhoid, and outbreaks of bubonic plague associated with rats and fleas occurred, especially in the hastily built tent towns accommodating prospectors. (Hedgcock and Hibbs, 1992; Webb, 1979). Self-government and Federation in 1901 generated local pride and interest in emerging urban problems, including needs for public works, workers’ homes and health protection. Lot sizes were considered to be too small and the establishment of an acceptable minimum size became an important public issue (Hedgcock and Hibbs, 1992). The West Australian, in 1904:
“asked why, with such climatic and natural advantages for an outdoor life ‘should there be any recourse to unsanitary and ill-ventilated structures, pressing closely upon each other, and tending to such fell diseases as typhoid and bubonic plague?’ ” (Webb, 1979:367).
The solution proposed was to facilitate the settlement of the working classes in the suburbs by providing trams for their work trips to central Perth. In 1911, the view of The West Australian was that:
“ ‘Modern transit facilities combining quickness and cheapness have greatly extended the living area for city workers, and apparently what is now required is the provision of cheap houses, the ownership of which is within the means of the average wage earner.’ ” (Webb, 1979:367)
In 1911, the Metropolitan Council of the Australian Labour Federation published a study of housing conditions. It recommended a minimum lot size of 150ft x 50ft (697m2)4 with one dwelling on each lot, which appeared to be in place in 1930 (Hedgcock and Hibbs, 1992; Webb, 1979). However, the lack of reticulated water supply and sewerage disposal necessitated the use of ground water and septic tanks, which concerned health authorities and lead to the adoption of the quarter acre (1,012m2) block5 to overcome the problem (Hedgcock and Hibbs, 1992). Consequently:
“… Perth’s quarter-acre suburban lots spread away from the city at a density that would continuously return to haunt future generations of planners. Suburbia gained enduring traditions of space, independence, privacy and self-containment, traditions that have been difficult to dispel in the face of late twentieth century urban realities.” (Hedgcock and Hibbs, 1979:69)
Forty years later, the Corridor Plan for Perth (MRPA, 1970:29) acknowledged that single dwellings on separate lots provided the preferred way of life for families and expected that most people would continue to live this way. Seddon (1972) observed that:
4 A 150ft x 50ft lot is equivalent to 0.172 acres ( �����-sixth of an acre), or �����2. Net residential
density is approximately 14.3 lots per hectare.
5 A quarter-acre lot = 0.25 acres, or �� �� 2. Net residential density is approximately 9.9 lots per hectare.

Greater Perth Population and Housing Discussion Paper No. 2
12
“The preference for the fully detached house on its own block of land – the suburban house – is even more marked in Perth than in Melbourne and Sydney. It is perfectly clear that this is how most West Australians want to live.” (Seddon, 1972:256)
The single suburban dwelling continues to be the housing form of choice for families (Market Equity, 2000) and Perth residents can be expected to follow preferences evident in the Australian population generally.
“In spite of changing gender roles and work habits, rising mortgage payments and declining rates of capital accumulation, lengthening journeys to work and shrinking suburban allotments, the suburban home remains a goal to which most young Australians continue to aspire.” (Davidson, 1993:69)
However, community attitudes to housing expressed in the Future Perth Focus Groups reveal that community concern for “urban sprawl” and acceptability of smaller lot sizes is beginning to emerge (Market Equity, 2000). Changing attitudes to small residential lots and medium density housing are discussed below. 2.4 Contemporary Housing Preferences 2.4.1 Lot Sizes and Dwelling Type
From its inception in 1928, the (former) Town Planning Board adopted relatively large minimum lot sizes that resulted in an “extended and uniform suburban metropolitan environment” (Australian Institute of Urban Studies (AIUS), 1983:56). In the post-war period, the minimum standard residential lot size was 680m2 (AIUS, 1983), which is similar to the 1930 standard. However, in the 1950s and 1960s, development of many unsewered areas required a minimum lot size of 1,012m2 (the “quarter acre block”). These inner and middle suburbs, typically with a grid or modified grid subdivision pattern, consumed substantial land area at the time of subdivision. There was a flat building boom in the 1960s and in metropolitan Perth occupied flats, units and apartments as a proportion of total occupied private dwellings increased from seven per cent to 19 per cent between 1961 and 1971.
From the 1970s, most Perth residential subdivision was in fully-serviced residential estates, enabling a reduction in the prevailing new residential lot size to around 700m2. This coincided with the commencement of major growth in the Perth’s outer sector urban corridors (see section 5.1) and the widespread subdivision of residential estates based on curvilinear streets and culs-de-sac street patterns.
In the 1960s and 1970s, development of dwellings other than houses tended to focus on large, multi-storey buildings intended mainly as rental accommodation. The Strata Titles Act, introduced in 1975, facilitated ownership of individual dwellings within multi-unit developments. In 1982, Residential R-Codes were introduced and medium density codes were subsequently applied within the town planning schemes for many inner and
Greater Perth Population and Housing Discussion Paper No. 2
13
middle suburban areas. The minimum lot size for a single house was reduced to 450m2 and although a dramatic increase in metropolitan density was not expected, the new codes created the opportunity for greater variety and choice in new areas and infill and redevelopment opportunities in the inner areas (AIUS, 1983).
The Review Group (SPC, 1987:36-37) reported an increasing demand for medium density housing in the 1980s, especially in the inner suburbs, coinciding with growing numbers of small households. This trend spilled over into the middle suburbs and continued during the 1990s (MFP, 1999:40). Paradoxically, Australian Bureau of Statistics (ABS) census data for metropolitan Perth shows that occupied flats, units and apartments as a percentage of total occupied permanent private dwellings peaked at 19 per cent in 1971, and have remained virtually stable over the last 30 years – increasing to 21 per cent in 1986 and 22 per cent in 2001. However, Census dwelling-type data is no longer an appropriate indicator of changing housing mix and density. Changes to the R-Codes and the Strata Titles Act in the 1990s facilitated development of separate (rather than attached) houses on their own small lots (e.g. at R-Codes 25 – 40). These small-lot houses are not captured by the census as flats, units and apartments, so that using housing type as an indicator of urban consolidation is no longer useful. It is now necessary to develop new methods of monitoring residential densities that integrate housing type, lot size and land consumption. An initial analysis is carried out in the Greater Perth Residential Land Balance paper (WAPC, 2003f).
In the meantime, trends in lot sizes in new subdivisions suggest that increases in density are being achieved. The estimated median size of new residential lots created in the Perth Metropolitan Region decreased during the ten years 1991-92 to 2000-01 from 698m2 to 598m2 (WAPC, 2002). In 2000-01, lots less than 500m2 comprised 24 per cent of new lots created compared to eight per cent in 1991-92. Current residential densities are considered in the Greater Perth Residential Land Balance paper (WAPC, 2003f).
Metroplan (DPUD, 1990) promoted urban consolidation and ensuing infill sewerage programs enabled subdivision and redevelopment of 1950s and ‘60s “quarter-acre blocks” in the inner and middle suburbs. The rectangular shape of lots in older grid pattern suburbs facilitated redevelopment on an individual lot-by-lot basis as older home owners began to satisfy needs for smaller gardens and generate retirement income from their original investment in the family home. Increasing densities in the irregularly shaped lots of the post-‘70s suburbs will be more difficult.
2.4.2 Changing Attitudes to Medium Density Housing
Recent trends towards increasing residential densities in the inner and middle suburbs are related to factors such as affordability, changing demand as the ageing of the population reduces demand for family houses (section 7.2) and growing concern for the problems of urban sprawl and the long travel

Greater Perth Population and Housing Discussion Paper No. 2
14
distances it creates (see WAPC, 2003b; 2003c). These factors are now beginning to change the historical expression of a culture that places great emphasis on living in separate houses on large suburban lots.
It is worth noting that in the 1970s and ‘80s, planning and land development professionals attempted to curb Perth’s spread of urban development by encouraging a housing mix including higher density development (MRPA, 1970; AIUS, 1983; Review Group, 1987; DPUD, 1990; DPUD, 1992). However, analysis of community attitudes to medium density housing reveals that a strong and enduring cultural preference for separate houses on large lots produced resistance to widespread medium density development - a situation that persisted until the mid 1990s.
The Green Street Joint Venture, a joint initiative between all levels of government and the land development and housing industries, aimed to achieve greater housing choice and affordability through innovative residential development practices. Implementation of change to more innovative and efficient practices was slow. Although the issues were well understood by policy makers and the land and housing industries, preference for large lots tended to predominate (Green Street Joint Venture, 1991).
Many local authority town planning schemes in Perth’s Inner and Middle Sectors allowed for medium density development/redevelopment in established, predominantly single residential suburbs. In many areas, this spawned concerted community action to maintain the status quo. This was expressed through objections to town planning scheme proposals and many local authorities commissioned surveys to ascertain community views. DPUD (1992:36-37) summarises a number of surveys6 of residents’ attitudes to higher density development in Perth’s inner suburbs that were undertaken in 1990 or 1991:
• In Wembley, 78 per cent of respondents opposed higher density
development, notwithstanding that many recognised that more efficient use of land, a better range of housing and improved public transport and local amenities would result. Perceived problems included loss of residential character, increased road danger for children, increased crime and noise and reduced privacy.
• A significant minority of residents in five inner western local authorities supported increased densities in the locality. Those opposed amounted to 44% in Claremont, 57% in Cottesloe and 54% in Nedlands. The majority would accept higher densities if they were strictly controlled. They were overwhelmingly in favour of increasing densities of selected lots to allow existing residents who could not continue to live on quarter acre blocks to remain in the municipality.
6 Surveys undertaken mainly by consultants on behalf of local government authorities.
Greater Perth Population and Housing Discussion Paper No. 2
15
• In the City of Melville, residents were generally concerned about noise, traffic, streetscape and parking, as well as the adverse social impacts of increasing densities. The majority objected to group housing being developed next to their property. The most important reasons were that it would reduce privacy, increase noise from traffic and people, make the neighbourhood too high in physical density and increase traffic. Duplex development on a neighbouring property was more acceptable.
• A study of three suburbs (Leederville, Tuart Hill and Carine) revealed spatial variation in attitudes to higher density housing, with approval increasing closer to the city where some higher density development already existed. Opposition to urban consolidation tended to be lower among younger people. Longer travel times arising from urban dispersal had not yet impacted on suburban residents and intense, anti-consolidation attitudes prevailed in the outer suburbs, where the only favoured housing type was the single detached house. Based on the spatially uneven spread of opposition and variation between age groups, it was concluded that although resistance to higher density development exists, there is a definite receptiveness to urban consolidation in suitable locations and among certain age groups.
Based on the experience of medium density developments of the 1980s, these surveys indicated that there was considerable opposition to a widespread increase in densities in the inner and middle suburbs. DPUD (1992) suggested that much of the higher density development existing at that time had shortcomings and community opposition was in the context of this experience. Well designed medium density development does not elicit the same response. Residents are reluctant to accept higher density development close to their own dwelling, but nevertheless acknowledge that there is a need to allow some density increases. Control over the design of medium density development emerged as being a very important issue.
During the 1990s, the Commission’s Liveable Neighbourhoods initiative (WAPC, 2000a) began to facilitate subdivision practices promoting sustainable communities. Greater diversity of housing types and lots sizes – including smaller lots – can be achieved using these principles.
The Liveable Neighbourhoods approach applies to greenfields subdivision where there is no existing community. Although the subdivision statistics indicate a trend towards increased residential density in recent years, the widespread raising of densities in existing areas remains difficult. At a 1998 Commission seminar, McLure (1998) reported on an informal telephone survey of 15 local government authority planners in the Inner and Middle Sectors regarding medium density planning and development. All were experiencing demand for grouped dwellings, yet all proposed to either maintain current R-Codes or “down code”7 in the future, although some small
7 i.e. decrease the maximum density by reducing the R-Code applicable to residential zoned land.

Greater Perth Population and Housing Discussion Paper No. 2
16
pockets of “up coding” were contemplated. It seems that while the community at large is increasingly supportive of smaller lot sizes (Market Equity, 2000) local responses tend to reflect the probability that many individuals support the idea but “not in my backyard”.
From this discussion, it can be seen that serious attempts to increase residential densities in Perth have been made over the last 20 years or so, and some progress has been made. While there has been long-standing community resistance to the introduction of more compact residential forms, a new suburban culture now appears to be emerging as ideas about the benefits of compact cities gain currency (WAPC, 2003c). This is not readily captured by traditional indicators of urban density and further work is needed to effectively monitor residential densities and housing types and relate these to community aspirations for the liveability of the urban environment.

Greater Perth Population and Housing Discussion Paper No. 2
17
2.5 Housing Affordability Private Dwellings The 1992 National Housing Strategy affordability benchmark defines income thresholds as a basis for providing guidance on acceptable housing expenditure for low-income households. The benchmark is based on the notion that the proportion of household income spent on housing is reasonable and leaves sufficient income to meet other needs such as food, clothing, health, education and transport. Households in the bottom 40 per cent of the income distribution with housing costs greater than 30 per cent of household income are considered to be in housing stress. Affordability is a measure of the ongoing cost of housing in relation to income, whether paying a mortgage or renting, and accessibility relates to the cost of becoming a home purchaser or securing a rental tenancy. Although a dwelling may be affordable and accessible, it may not necessarily be either adequate or appropriate to meet the household’s requirements (e.g. not enough rooms, not in good condition). Table 2.1 Household Income for Home Purchasers, Private Renters, All
Households in WA: 2001 Household Income Home Purchasers Private Renters All Households ($/week) ($/week) ($/week) Mean 1,163 742 914 Median (50%) 1,104 649 788 Second quintile (40%) 954 539 631 First quintile (20%) 659 351 370 Source: ABS 2001 census data. Table prepared by Department of Housing and Works Western Australia, "Housing Strategy WA Issues Paper, Affordability, October 2002". Purchasers The number of households repaying mortgages increased by 18 per cent from 187,300 in 1996 to 220,500 in 2001. The median monthly mortgage repayment for WA in 2001 was $842, a 13 per cent increase on the 1996 median repayment of $745. The 2001 figure represents 18 per cent of the median weekly household income for homebuyers. Although the 2001 census data suggests that approximately 3.5 per cent of WA’s total households are experiencing some level of housing stress due to repayment costs (households making accelerated repayments may be inflating this figure), the majority, approximately 96 per cent, are not experiencing this type of stress.

Greater Perth Population and Housing Discussion Paper No. 2
18
Renters The number of households in private rental in WA increased by 6.3 per cent from 114,700 in 1996 to 121,900 in 2001. The median rent paid by private renters was $147, which represented 23 per cent of the median weekly income of private renters. Approximately four per cent of WA’s private rental households are experiencing some level of housing stress from rental costs. The 1999 Australian Housing Survey (AHS) indicated that households most vulnerable to housing stress are single parents and lone persons. These households have the highest proportion of private rental tenants and represent 77 per cent of CRA (Commonwealth Rent Assistance) recipients. According to Australian Bureau of Statistics (ABS) analysis of the 1999 AHS, renter households were more likely than owner households to spend a high proportion of their income on housing costs. In the long-term, those choosing to purchase their dwelling are likely to eventually spend less of their household income in housing costs, leaving a greater proportion of of disposable income. This may have an impact on their quality of life, the health care they can afford and their ability to provide for themselves as they age. The 1999 AHS also shows that older people have higher levels of equity in their home. Less than a quarter (23 per cent) of 15-23 year olds has $100,000 or more in equity, compared with more than half (56 per cent) of baby boomers (34-53 year olds) and more than three-quarters (77 per cent) aged 60 years and over. Costs House price movements published by the Real Estate Institute of WA (REIWA) indicate that the median house price in Perth grew from $14,600 in 1971 to $171,800 in 2001. This represents a 30-year average annual growth rate of 8.6 per cent, compared with a 6.7 per cent inflation rate for the same period. Figures for 2003 are shown in Table 2.2. Table 2.2 Property Market Indicators: May 2003 Property values (Median price)
May 2003 Change from 12 months ago
Perth House $208,200 12.5% Units $158,300 14.6% Land sales $97,000 7.8% Regional WA House $154,200 13.5% Source: Property Market Indicators REIWA. Note The latest available CPI change is 3.3 % and relates to the year ending March 2003 - ABS Cat No 6401.0.
Greater Perth Population and Housing Discussion Paper No. 2
19
Factors influencing land and housing price increases are addressed below. . The Costs of Urban Form Paper looks at the indicative development cost, comprising earthworks, road works, drainage, sewerage, water, underground power etc., per allotment for the fringe land. The family income required to ensure that mortgage repayments for a typical house in Australian State capital cities in 2002 does not exceed 30 per cent of gross income were computed by ACIL Tasman (Land cost: the impact of land costs on housing affordability, second edition, March 2003, Table 8). The results indicate that a typical house was most affordable in Perth followed by Adelaide, Brisbane, Sydney and Melbourne. The ACIL Tasman report also found that "affordability is very sensitive to increase in price, given that distribution of household income is heavily concentrated in the bottom half of the income range. If land development costs were to rise by $10,000, around 234,000 income earning households, representing four per cent of Australian income-earning households, would be unable to afford the $150,000 house/land package". Non-private dwellings On census night 2001, seven per cent of people aged 60 years and over were counted in a non-private dwelling. The majority of these (59 per cent) were in a nursing home or accommodation for the aged, while a further 17 per cent were in hospital. The financial situation of these over 60 year olds is not readily available and their housing affordability status cannot be derived. However, between 2001 and 2031, this group is projected to increase almost two and a half fold, from 242,000 in 2001 to 584,000 in 2031. If we assume the same proportions as indicated by the 2001 census data, an extra 14,000 nursing home places (from 10,000 in 2001 to 24,000) and 4,000 additional hospital beds (from 3,000 in 2001 to 7,000) will be required. Land Costs and their Impact Family economics underwent major changes in the post-war period. Until the 1960s, most families depended on one income. With more married women in employment, families gained additional income. That income was largely spent on building bigger houses, more household appliances and leisure. Over time, a significant part of the increased income was captured by landowners and major land developers as it allowed for increased land prices at higher rates than land development costs and the Consumer Price Index (CPI). Such rises occur because land is an extraordinary commodity. It is fundamental to our well-being - similar to air, water and food. We all require space that is well connected to other spaces to live, work, recreate, participate in family and community life. The value of land arises from its location and accessibility to other valuable land that support these activities. Further urban development of the Perth metropolitan region will require land that is mostly held by a limited number of developers. Viable

Greater Perth Population and Housing Discussion Paper No. 2
20
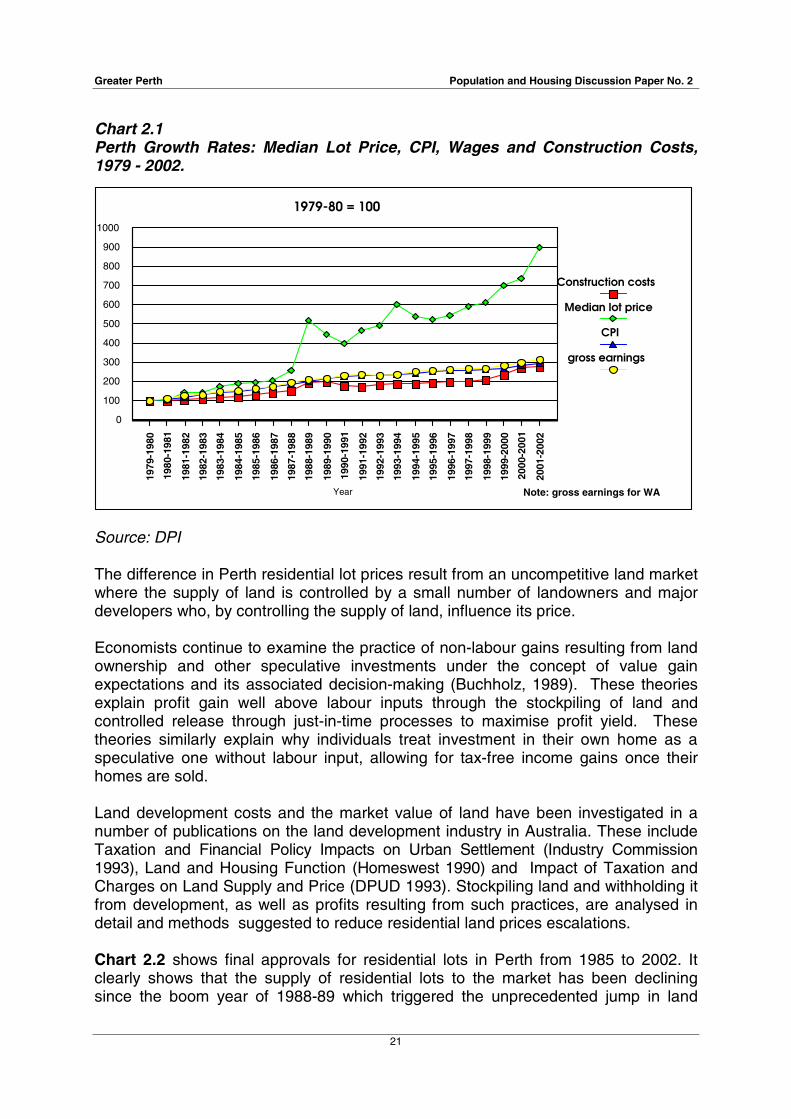
alternatives to Perth as WA’s major urban region are hard to imagine and extremely difficult to realise. Chart 2.1 shows growth in wages, residential lot prices, CPI and construction costs, which are also representative of growth in land development costs. There is a strict relationship between wages (labour costs), CPI and construction-land development costs but not with residential lot prices. The latter grow much faster than all other costs, especially since 1987-88, when the average annual immigration to Perth doubled. Between 1980 and 2002, the median price of a residential lot in the Perth Metropolitan Region increased over nine times while the size of the average lot decreased by one third. In the same period, CPI and construction costs increased only three times. If residential lot prices grew at the same rate as CPI, wages and construction-development costs, the median price of an average residential lot in June 2002 would be just over $35,000, not $106,000. The first major jump in residential lot prices since 1980 occurred in 1987-89. Large immigration levels to Perth and increased investment in land following the stock market crash of late 1987 caused unusually high demand for housing. The 1994 peak was caused by delayed demand from the price jump in the previous boom. The last two peaks were in 1998-2000 and 2001-02. The first was caused by the pre-GST boom in construction. The second followed demand growth when the Commonwealth Government offered a $14,000 grant to first home builders. Although the grant was $14,000, land prices jumped by over $20,000 soon after, and were accompanied by a 40 per cent increase in construction costs (see Chart 2.1). Changes in housing affordability can also be estimated by comparing changes in the ratio of the mean annual household income to the median house and land prices over time. In 1986, gross mean household income could almost buy a median priced residential lot in metropolitan Perth while in 2002 it could buy only 47 per cent of a median priced lot, even though lot sizes were reduced. Similarly, in 1986 such income could pay for 55 per cent of the median established house price while in 2002 it could pay for only 24 per cent . Although sudden jumps in demand tend to be absorbed into profits by price increases rather than increased production, in a free market, continuous ad infinitum growth in prices above inflation and labour costs is not sustainable.
Greater Perth Population and Housing Discussion Paper No. 2
21
Chart 2.1 Perth Growth Rates: Median Lot Price, CPI, Wages and Construction Costs, 1979 - 2002.
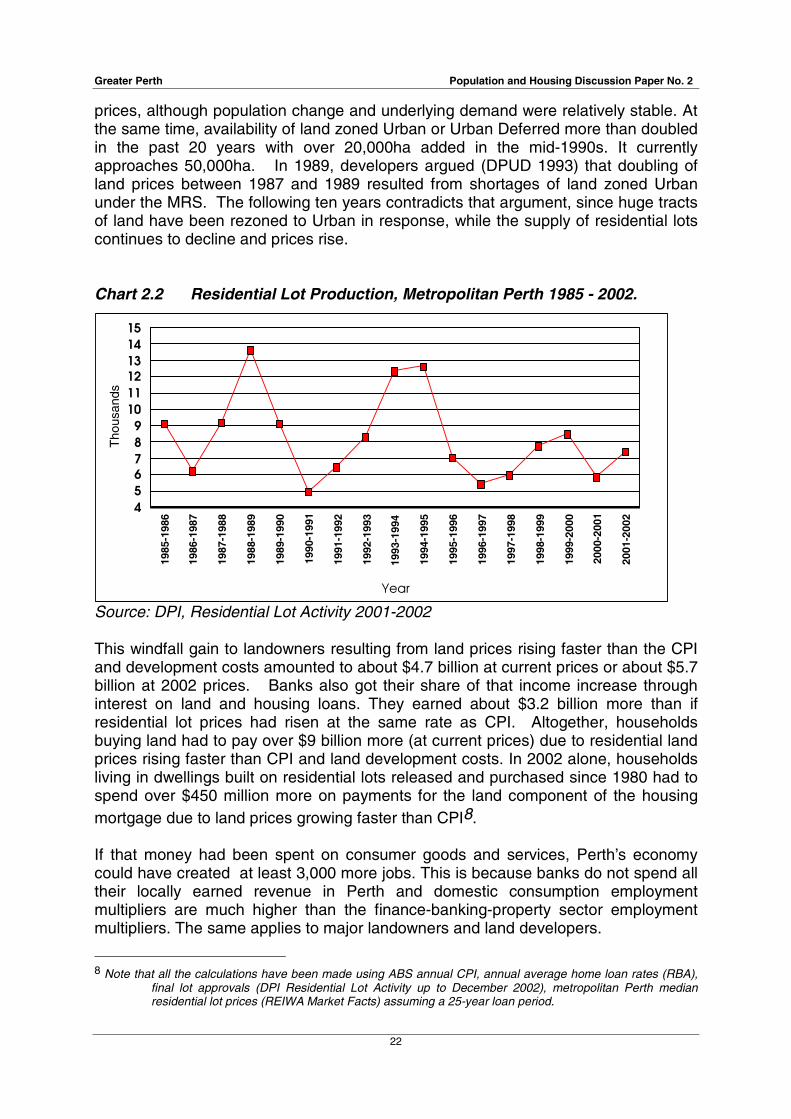
Source: DPI The difference in Perth residential lot prices result from an uncompetitive land market where the supply of land is controlled by a small number of landowners and major developers who, by controlling the supply of land, influence its price. Economists continue to examine the practice of non-labour gains resulting from land ownership and other speculative investments under the concept of value gain expectations and its associated decision-making (Buchholz, 1989). These theories explain profit gain well above labour inputs through the stockpiling of land and controlled release through just-in-time processes to maximise profit yield. These theories similarly explain why individuals treat investment in their own home as a speculative one without labour input, allowing for tax-free income gains once their homes are sold. Land development costs and the market value of land have been investigated in a number of publications on the land development industry in Australia. These include Taxation and Financial Policy Impacts on Urban Settlement (Industry Commission 1993), Land and Housing Function (Homeswest 1990) and Impact of Taxation and Charges on Land Supply and Price (DPUD 1993). Stockpiling land and withholding it from development, as well as profits resulting from such practices, are analysed in detail and methods suggested to reduce residential land prices escalations. Chart 2.2 shows final approvals for residential lots in Perth from 1985 to 2002. It clearly shows that the supply of residential lots to the market has been declining since the boom year of 1988-89 which triggered the unprecedented jump in land
1979
-198
0
1980
-198
1
1981
-198
2
1982
-198
3
1983
-198
4
1984
-198
5
1985
-198
6
1986
-198
7
1987
-198
8
1988
-198
9
1989
-199
0
1990
-199
1
1991
-199
2
1992
-199
3
1993
-199
4
1994
-199
5
1995
-199
6
1996
-199
7
1997
-199
8
1998
-199
9
1999
-200
0
2000
-200
1
2001
-200
2
Year
0
100
200
300
400
500
600
700
800
900
1000
Construction costs
Median lot price
CPI
gross earnings
Note: gross earnings for WA
1979-80 = 100
Greater Perth Population and Housing Discussion Paper No. 2
22
prices, although population change and underlying demand were relatively stable. At the same time, availability of land zoned Urban or Urban Deferred more than doubled in the past 20 years with over 20,000ha added in the mid-1990s. It currently approaches 50,000ha. In 1989, developers argued (DPUD 1993) that doubling of land prices between 1987 and 1989 resulted from shortages of land zoned Urban under the MRS. The following ten years contradicts that argument, since huge tracts of land have been rezoned to Urban in response, while the supply of residential lots continues to decline and prices rise. Chart 2.2 Residential Lot Production, Metropolitan Perth 1985 - 2002.
Source: DPI, Residential Lot Activity 2001-2002 This windfall gain to landowners resulting from land prices rising faster than the CPI and development costs amounted to about $4.7 billion at current prices or about $5.7 billion at 2002 prices. Banks also got their share of that income increase through interest on land and housing loans. They earned about $3.2 billion more than if residential lot prices had risen at the same rate as CPI. Altogether, households buying land had to pay over $9 billion more (at current prices) due to residential land prices rising faster than CPI and land development costs. In 2002 alone, households living in dwellings built on residential lots released and purchased since 1980 had to spend over $450 million more on payments for the land component of the housing mortgage due to land prices growing faster than CPI8. If that money had been spent on consumer goods and services, Perth’s economy could have created at least 3,000 more jobs. This is because banks do not spend all their locally earned revenue in Perth and domestic consumption employment multipliers are much higher than the finance-banking-property sector employment multipliers. The same applies to major landowners and land developers.
8 Note that all the calculations have been made using ABS annual CPI, annual average home loan rates (RBA),
final lot approvals (DPI Residential Lot Activity up to December 2002), metropolitan Perth median residential lot prices (REIWA Market Facts) assuming a 25-year loan period.
1985
-198
6
1986
-198
7
1987
-198
8
1988
-198
9
1989
-199
0
1990
-199
1
1991
-199
2
1992
-199
3
1993
-199
4
1994
-199
5
1995
-199
6
1996
-199
7
1997
-199
8
1998
-199
9
1999
-200
0
2000
-200
1
2001
-200
2
Year
456789
101112131415
Tho
usan
ds

Greater Perth Population and Housing Discussion Paper No. 2
23
Land price Increases, however, have benefited major landowners and developers as well as all households already owning or being in the process of purchasing land and their own dwelling. Profits are cashed when the property, or parts of it, are sold. This trend benefits households owning real estate, however, it is sustainable only as long as the number of households which can afford to enter the established land/house market balance the supply of established houses and infill land. With fertility rates below replacement levels for two decades, and still falling, this trend is not sustainable unless immigration levels are increased beyond the associated population decline and immigrants have sufficient funds to enter the market. Rising land costs, have the most adverse implications for households entering the market and, to a lesser extent, consequential job numbers in Perth. In the long run, rising land costs are likely to reduce Perth’s competitiveness in attracting interstate migrants. High land costs also add to operational costs of businesses entering the market or leasing premises. The magnitude of this factor, however, is difficult to estimate. Long-term solutions to alleviate the problem of excessively high land prices may include legislative measures and a return to the abandoned practice of public sector developers (currently Landstart and LandCorp) supplying large numbers of lots in attractive locations at much lower prices. Another solution may be the development of alternative urban centres to Perth. With more urban centres, it is easier to keep land costs low through legislation and competition from other centres. Medium-sized centres also offer shorter work trips, less congestion and fuel consumption. In the long term, these centres could even substantially restrain growth in metropolitan Perth.

Greater Perth Population and Housing Discussion Paper No. 2
24
3. STATE GOVERNMENT PLANNING AND HOUSING STRATEGIES
3.1 Role of Planning and the State Planning Strategy
Land availability is essential for the supply of housing. Land use planning influences housing supply indirectly by two principal means. Firstly, housing development is facilitated through the management of land supply using zoning and other regulatory mechanisms. Secondly, quality of life and the creation of communities are influenced through structure planning and subdivision approval processes. These activities do not provide housing directly, as in the construction or financing of housing, but nevertheless facilitating the availability of well-located residential lots in a timely manner and guiding the design and land use composition of housing estates have an important effect on the provision of affordable and appropriate housing. Planning, particularly its regulatory role, also provides the framework within which the land development industry operates and thus the physical context within which housing is supplied to the community. These activities are reflected in the State Planning Strategy (Western Australian Planning Commission (WAPC), 1997), the Government’s land use planning strategy for the State’s development to 2029. The State Planning Strategy aims to develop a land use planning system to help the State achieve key goals in “generating wealth, conserving and enhancing the natural environment, and building vibrant and safe communities for the enjoyment of this and subsequent generations of Western Australians.” (WAPC, 1997, Part 1: 1). Land use planning facilitates rather than drives these processes, “ensuring that land use and planning decisions improve the opportunities of the community to fulfil the multiple goals of creating wealth, caring for the environment, and building communities of which we can feel proud”. (WAPC, 1997, Part 1: 1) The State Planning Strategy provides the context within which strategic planning decisions are made through the identification of key environmental, community, economic, infrastructure and regional development principles that planning should recognise to ensure integrated decision-making throughout government (WAPC, 2003a). Strategies and actions for each principle are aimed, overall, at managing the impacts of growth and achieving sustainable development9 within the State. The objectives of Greater Perth are set by the State Planning Strategy’s Community Principle:
9 The State Planning Strategy (WAPC, 1997, Final Report: 12) adopts the World Commission on
Environment and Development’s definition of sustainable development: “ …development that meets the needs of the present without compromising the ability of future generations to meet their own needs.” (WCED, 1987). The State Planning Strategy interprets this as enabling achievement of full economic potential provided that growth is balanced with conserving and enhancing the natural environment and provides a better quality of life for the present and future population.

Greater Perth Population and Housing Discussion Paper No. 2
25
“to respond to social changes and facilitate the creation of vibrant, accessible, safe and self-reliant communities”. (WAPC, 1997, Final Report: 33)
This principle, as articulated by the State Planning Framework Policy, includes the statement that:
“planning anticipates and responds to the needs of existing and future communities through the provision of zoned and serviced land for housing…[and]…should recognise the need for and, as far as practicable, contribute towards more sustainable communities…” (WAPC, 2000)
In relation to housing, this involves:
• “Accommodating future population growth and providing housing choice and diversity to suit the needs of different households, including specialist housing needs, and the services they require;
• “Providing land for a range of accessible community resources including affordable housing…;
• “Encouraging high standards of urban design and a sense of neighbourhood and community identity in residential suburbs.” (WAPC, 2000)
The State Planning Strategy has a thirty-year horizon and the Commission undertakes population and housing projections for this period. Long-range planning is unusual among Government agencies since most have five-year strategic plans complemented by one-year operational plans. Many agencies carry out their planning activities independently, thus impacting on each other and leading to a lack of integrated planning at the State level (Market Equity, 2000). The State Planning Strategy is intended to overcome this problem by co-ordinating a whole-of-government approach to decision-making. This over-arching role in looking at possible planning conflicts and co-ordinating planning at the State level received strong support from government agencies included in the Future Perth Focus Groups Programme (Market Equity, 2000). It provides a mechanism for integrating housing issues relevant to Greater Perth with those addressed by a State housing strategy. 3.2 Role of Housing and Works and the State Housing Strategy One of the major roles of the Department of Housing and Works is to provide “housing for Western Australians who cannot otherwise afford their own home by arranging affordable home finance, rental housing and land”. Programmes target low-income homebuyers and renters, disadvantaged groups, people with special housing needs and other government agencies, and include dwelling construction and land development (DHW, 2001). The State government is committed to preparing a State housing strategy - Housing Strategy WA - that will be the first attempt to address housing at a State strategic
Greater Perth Population and Housing Discussion Paper No. 2
26
level10. It will complement a number of existing and proposed State Government strategies, including the State Planning Strategy and Greater Perth, and has the following vision: “Our vision is a responsive housing system in Western Australia, that
meets the changing needs, aspirations and choices of all citizens in a sustainable way.”
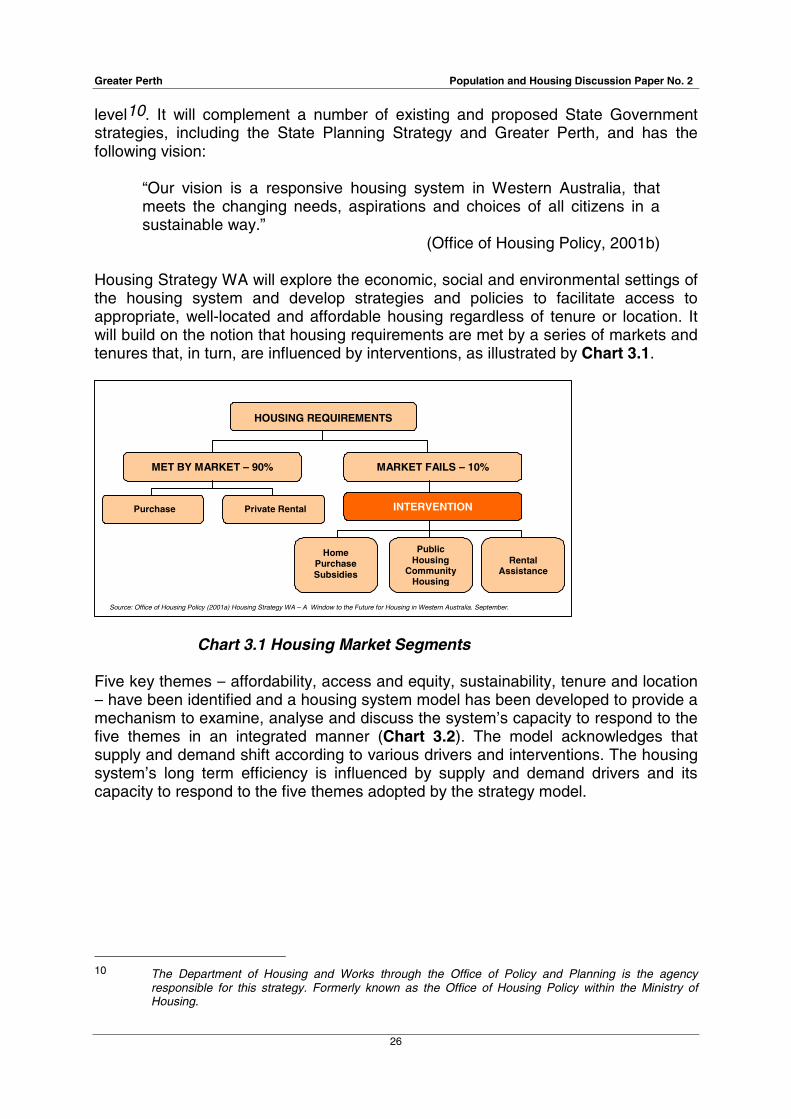
(Office of Housing Policy, 2001b) Housing Strategy WA will explore the economic, social and environmental settings of the housing system and develop strategies and policies to facilitate access to appropriate, well-located and affordable housing regardless of tenure or location. It will build on the notion that housing requirements are met by a series of markets and tenures that, in turn, are influenced by interventions, as illustrated by Chart 3.1.
HOUSING REQUIREMENTS
MET BY MARKET – 90% MARKET FAILS – 10%
INTERVENTION Purchase Private Rental
Home Purchase Subsidies
Rental Assistance
Public Housing
Community Housing
Source: Office of Housing Policy (2001a) Housing Strategy WA – A Window to the Future for Housing in Western Australia. September.
Chart 3.1 Housing Market Segments Five key themes – affordability, access and equity, sustainability, tenure and location – have been identified and a housing system model has been developed to provide a mechanism to examine, analyse and discuss the system’s capacity to respond to the five themes in an integrated manner (Chart 3.2). The model acknowledges that supply and demand shift according to various drivers and interventions. The housing system’s long term efficiency is influenced by supply and demand drivers and its capacity to respond to the five themes adopted by the strategy model.
10 The Department of Housing and Works through the Office of Policy and Planning is the agency
responsible for this strategy. Formerly known as the Office of Housing Policy within the Ministry of Housing.

Greater Perth Population and Housing Discussion Paper No. 2
27
Chart 3.2 Housing Strategy WA: Housing System Model The themes acknowledge that housing should be affordable and accessible but delivered in an economically sustainable way for a range of tenures. Similarly, to improve social and environmental outcomes by enhanced access to employment and services, location is an important consideration for Perth and regional WA. Since dwellings and residential lots are inextricably linked in delivering housing needs to the community, these aspects of the model highlight the need for a strong link with the planning system. Housing demand is driven by population growth, particularly household size and demographic change. These elements of the model are analysed in this paper. Related papers, including the Greater Perth Residential Land Balance and the Greater Perth Liveability and Rejuvenation working papers (WAPC 2003a, 2003b) discuss the planning aspects of other elements of the model. 3.3 Whole-of-Government Approach and Sustainability The State Government has adopted a holistic approach to sustainable11 development and has identified both Greater Perth12 and Housing Strategy WA as important Government initiatives that will reinforce the State Sustainability Strategy (Government of Western Australia, 2002).
11 Sustainability is defined as “meeting the needs of current and future generations through simultaneous
environmental, social and economic improvement” (Government of Western Australia, 2002:8).
12 The Greater Perth Plan was initiated as ‘Future Perth’ and is identified as such in Government of Western Australian (2002).
AFFORDABLE-Ownership & Rental
ACCESSIBLE-Marginalised-Complex Needs-Indigenous-Youth, Aged etc
SUSTAINABLE-Social-Economic-Environmental
TENURE-Home Ownership-Private Rental-Public Housing-Community Housing
LOCATION-Perth-Regional & Remote
EFFICIENCY
HOUSINGSUPPLY
INDUSTRYCAPACITY
FINANCE, TAX &
WELFARESETTINGS
EXISTINGHOUSING
STOCK
•Land & Servicing
•Labour & Materials
•Technology
HOUSINGDEMAND
EXTERNALINFLUENCES
ECONOMIC &POPULATION
OUTLOOK
SOCIETAL CHANGE &
ASPIRATIONS
DemandProfile
HousingCareers
INTERVENTIONDEMAND
DRIVERS
SUPPLY
DRIVERS
Source: Office of Policy and Planning, Department of Housing and Works

Greater Perth Population and Housing Discussion Paper No. 2
28
Work in progress on Housing Strategy WA acknowledges that the delivery of housing is closely related to the planning system but there is also a need to extend the analysis and debate into many areas beyond the spatial domain of planning (OPP, pers. comm., 2001). The Department of Housing and Works (DHW) has an operational role in land subdivision and the construction and leasing of housing to eligible clients and Housing Strategy WA will provide a strategic direction for these activities. However, the strategy will also extend beyond the conventional, interventionist role of the DHW in providing housing for low income and other disadvantaged households because it considers the housing system in a holistic way. For example, the private sector’s role in providing appropriate and affordable housing and facilitating the provision of social housing by not-for-profit and similar community organisations is important. . Similarly, the State Planning Strategy and the Commission’s other, more specific policies and plans have an important role in facilitating the supply of land for housing and guiding the design and land use components of residential areas13. In general, planning with respect to housing aims to minimise costs and provide an adequate mix of residential lots to meet the needs of the whole community. The housing strategy emphasis is the characteristics, suitability, affordability etc of the housing stock – including dwellings and the land on which they exist. Thus, a strategic housing strategy is inextricably linked to planning strategies that have whole-of-government responsibility for guiding the development of residential lots and the physical structure of communities. Greater Perth will play an important role in establishing long-term objectives for residential land development in the Perth Metropolitan Region. Part of the Greater Perth process must be to establish the relationship between the strategies of the Greater Perth Plan and Housing Strategy WA by identifying the housing-related strategies and actions that should be implemented by each.
13 See WAPC (2003a) Greater Perth Planning Context working paper.

Greater Perth Population and Housing Discussion Paper No. 2
29
4. GREATER PERTH’S POPULATION WILL CONTINUE TO GROW 4.1 Background According to the latest available Australian Bureau of Statistics (ABS) Estimated Resident Population (ERP) figures, Western Australia’s population increased from 1,030,469 in 1971 to 1,906,100 in 2001,. Over this time, the average annual growth rate decreased from 2.35 per cent per annum between 1971 and 1981 to 2.32 per cent per annum during 1981-1991 and declined further to 1.54 per cent per annum during1991-2001. The average annual growth rate for the 30-year period 1971 to 2001 was 2.07 per cent per annum. The current projections indicate that the State’s population is expected to grow at about 1.4 per cent per annum through equal increases in natural increase (births over deaths) and migration between 2001-2031. Table 4.1 Estimated and Projected Population for Greater Perth and Western
Australia 1901 -2031 Area/Year 1901 1921 1954 1971 2001p 2011 2021 2031 Metro Perth
36,274 170,213 395,049 703,199 1,397,048 1,640,100 1,869900 2,078,000
Peel Region
na 4,405 7,518 11,995 63,561 91,300 118,100 141,000
Bunbury Region
na 11,330 19,685 28,508 65,264 77,900 90,400 101,600
Avon Arc/Gingin
na 14,258 20,072 18,479 27,411 36,200 50,300 66,000
Greater Perth
na 200,206 442,324 762,181 1,553,284 1,845,500 2,128,700 2,386,600
Western Australia
188,566 332,732 639,771 1,030,469 1,906,114 2,264,800 2,602,200 2,907,700
Share of Greater Perth’s population Metro Perth
na 85.0% 89.3% 92.3% 89.9% 88.9% 87.8% 87.1%
Peel Region
na 2.2% 1.7% 1.6% 4.1% 4.9% 5.5% 5.9%
Bunbury Region
na 5.7% 4.5% 3.7% 4.2% 4.2% 4.2% 4.3%
Avon Arc/Gingin
na 7.1% 4.5% 2.4% 1.8% 2.0% 2.4% 2.8%
Share of Western Australia’s population Greater Perth
na 60.2% 69.1% 74.0% 81.5% 81.5% 81.8% 82.1%
na – not available. Projected figures for 2011 to 2031 have been rounded to the nearest 100. Components may not add up to total due to rounding. Source: 1901 to 1971 ABS (Australian Bureau of Statistics) census data, 2001 ABS preliminary Estimated Resident Population (ERP) Cat 3218.0 July 2002. 2011, 2021 and 2031 DPI (Department for Planning and Infrastructure) medium scenario projections, Population Report No 4 October 2000 Western Australia Tomorrow.

Greater Perth Population and Housing Discussion Paper No. 2
30
4.2 Trends Perth Metropolitan Region and its Planning Sectors The Department for Planning and Infrastructure (DPI) prepares the official state, statistical division and local government area (LGA) population projections. The projections are produced in three series - low, medium and high - based on differing levels of interstate and overseas migration and fertility assumptions. The migration levels are difficult to predict because of changing government immigration policy and prevailing socio-economic conditions. The medium series projections are the most often used and published. Table 4.2 shows the Australian Bureau of Statistics (ABS) historical estimated resident population (ERP) figures 1981 to 2001, preliminary figures and DPI’s medium scenario population projections for 2001 to 2031. The Perth Metropolitan Region (PMR) captured 19 per cent of the State’s population in 1901, increasing to 51 per cent in 1921 and 73 per cent by 2001. However, PMR's share of the State's population is expected to stay at around 72 per cent for the next 30 years. Perth's population reached one million in 1984 and about 1.4 million in 2001. Perth is Australia’s fourth largest capital city. The population of the PMR is expected to grow to 2.1 million by 2031. This represents an increase of about 680,600 persons over the 30-year period or an average growth rate of 1.3 per cent per annum. The current boundary of the City of Perth was created on 1 July 1994 and now encompasses the “inner” Perth area only. The recent resurgence of inner city living has come from new developments and redevelopment of older sites, e.g. East Perth, West Perth, and the conversion of commercial buildings into apartments in the centre of the City . In 1991, the population of the City of Perth was 4,706, increasing to 5,600 in 1996 and 7,964 in 2001 (ABS preliminary ERP). During the ten-year period 1991-2001, Wanneroo recorded the fastest growth rate in the PMR with 6.1 per cent per anum, followed by the City of Perth with 5.4 per cent in front of Rockingham also on 5.4 per cent per annum. Swan was fourth with 4.6 per cent per annum and Serpentine-Jarrahdale fifth (3.6 per cent per annum). All planning sectors within the PMR recorded growth between 1981 and 2001. The current projections also indicate that the total population of all Planning Sectors will grow between 2001 and 2031. However, a handful of local government areas within the Middle and Outer sectors will experience temporary small declines at various times. The Middle sector will continue to contain the highest population in the region with 553,700 persons by 2031 followed by the North-West sector with 429,400. However, it is the latter which will experience the greatest absolute growth to 2031. The South-West sector will have the third highest population with 301,500 in 2031, followed by the Eastern sector, 292,600, Inner sector, 279,400 and South-East sector, 221,500. Figure 4.1 shows predicted population change between 2001 and 2016 in the PMR.

Greater Perth Population and Housing Discussion Paper No. 2
31
Table 4.2 Population Estimates and Projections for Local Government Authorities in Perth Metropolitan Area: 1981-2031
Sector Local Historical ERP Projection (Medium Series) Indicative Projections 1981 1991 2001p 2001 2006 2011 2016 2021 2026 2031 INNER Claremont 8,477 9,392 9,206 9,700 9,900 10,300 10,600 10,900 11,200 11,500 Cottesloe 6,949 7,652 7,387 7,700 7,900 8,200 8,300 8,500 8,700 8,700 East Fremantle 6,331 6,466 6,759 6,700 6,800 6,900 7,000 7,200 7,300 7,400 Fremantle 23,061 23,967 25,857 26,000 27,600 29,300 30,700 32,100 33,200 34,000 Mosman Park 7,235 7,706 8,364 8,200 8,400 8,800 9,200 9,700 10,200 10,900 Nedlands 20,350 20,643 21,417 21,800 23,200 24,400 25,700 27,100 28,100 28,800 Peppermint 1,614 1,551 1,686 1,800 1,800 1,900 2,000 2,100 2,100 2,200 Perth pre 1994 79,997 80,037 86,587 85,500 91,800 97,300 100,300 104,400 107,800 110,700 Cambridge n.a. 24,244 24,382 24,500 25,400 26,500 26,800 27,500 27,900 28,400 Perth n.a. 4,706 7,964 6,700 8,200 9,300 9,500 9,700 9,900 10,100 Victoria n.a. 25,297 27,906 27,900 30,000 31,800 33,000 34,400 35,400 36,300 Vincent n.a. 25,790 26,335 26,400 28,100 29,800 31,100 32,800 34,600 35,900 South Perth 32,186 35,442 37,375 37,800 39,400 41,000 42,300 43,800 44,900 45,500 Subiaco 14,160 15,312 15,740 15,700 16,700 17,500 18,000 18,700 19,200 19,600 Total (b) 200,360 208,168 220,378 220,800 233,600 245,600 254,200 264,500 272,700 279,400 MIDDLE Bassendean 12,185 13,874 14,025 14,800 14,700 14,600 15,100 15,700 16,100 16,400 Bayswater 39,748 46,401 56,983 57,700 59,500 62,100 64,600 66,200 68,700 70,600 Belmont 30,389 27,446 29,995 30,500 34,800 38,800 40,900 43,200 44,800 46,000 Canning 54,556 69,678 77,135 77,600 79,200 79,300 78,400 76,200 76,000 76,100 Melville 63,006 90,065 96,633 98,900 101,400 104,300 108,100 110,800 114,700 117,300 Stirling 167,077 180,002 177,281 178,200 183,300 191,000 197,400 205,000 213,100 227,400 Total (b) 366,961 427,466 452,052 457,600 472,800 490,100 504,400 517,000 533,500 553,700 NORTH-WEST Wanneroo 96,338 175,346 240,368 242,400 270,400 293,400 325,100 356,900 394,000 429,400 pre 1994 Wanneroo n.a. 46,631 84,374 81,500 105,500 129,700 158,200 191,000 228,200 263,000 Joondalup n.a. 128,715 155,994 160,900 164,900 163,700 166,800 165,900 165,800 166,300 Total (b) 96,338 175,346 240,368 242,400 270,400 293,400 325,100 356,900 394,000 429,400 EASTERN Kalamunda 36,354 48,503 48,790 50,700 51,400 50,700 51,900 51,900 52,300 53,100 Mundaring 21,304 30,683 35,496 36,700 37,300 37,200 38,300 40,500 42,500 45,600 Swan 32,412 54,635 85,649 85,100 102,000 125,000 149,200 168,100 182,800 193,900 Total (b) 90,070 133,821 169,935 172,500 190,700 212,900 239,400 260,400 277,700 292,600 SOUTH-EAST Armadale 37,152 49,196 52,601 55,300 59,200 62,100 66,800 70,700 73,200 75,800 Gosnells 53,995 72,026 83,691 84,300 88,200 92,200 97,300 103,200 106,700 109,400 Serpentine- 5,071 8,244 11,752 11,700 15,800 20,700 23,500 27,500 32,100 36,300 Total (b) 96,218 129,466 148,044 151,300 163,300 174,900 187,600 201,300 212,000 221,500 SOUTH-WEST Cockburn 32,547 52,461 69,703 70,200 82,800 93,300 97,800 100,200 100,900 100,400 Kwinana 13,998 17,833 21,872 23,100 25,600 30,400 35,300 39,600 41,500 42,600 Rockingham 25,545 44,201 74,696 72,000 85,600 99,600 113,200 130,000 145,300 158,600 Total (b) 72,090 114,495 166,271 165,300 194,000 223,200 246,200 269,800 287,700 301,500 Perth Metro 922,037 1,188,762 1,397,048 1,410,000 1,524,900 1,640,100 1,756,900 1,869,900 1,977,60 2,078,000
Source: 1981 and 1991 Estimated Resident Population (ERP) ABS, 2001 preliminary ABS ERP; 2001-2031 DPI medium scenario projections September 2000. (a) Separate figures for the City of Perth and Towns of Vincent, Cambridge and Victoria Park, which were created on 1 July 1994, are not available for years prior to 1991.
(b) Components may not add totals due to rounding. (c) Separate figures for the City of Joondalup which was created on 1 July 1998 from Wanneroo are not available for years prior to 1991.
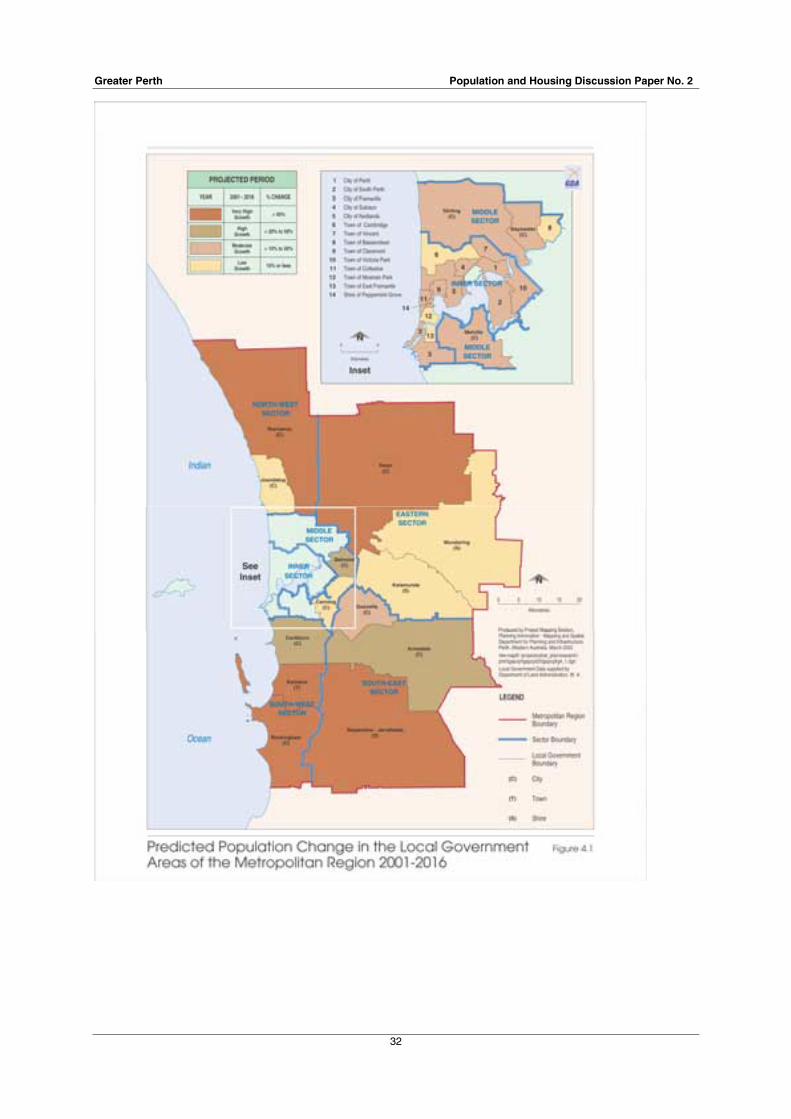
Greater Perth Population and Housing Discussion Paper No. 2
32

Greater Perth Population and Housing Discussion Paper No. 2
33
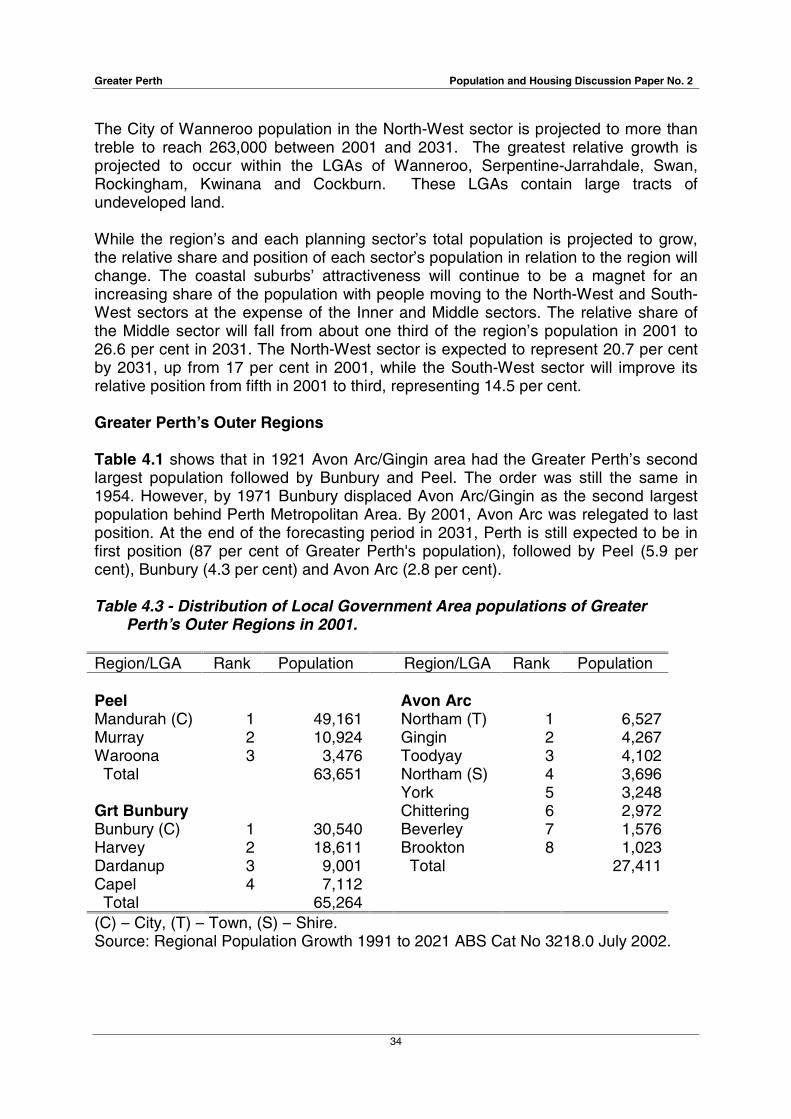
Greater Perth Population and Housing Discussion Paper No. 2
34
The City of Wanneroo population in the North-West sector is projected to more than treble to reach 263,000 between 2001 and 2031. The greatest relative growth is projected to occur within the LGAs of Wanneroo, Serpentine-Jarrahdale, Swan, Rockingham, Kwinana and Cockburn. These LGAs contain large tracts of undeveloped land. While the region’s and each planning sector’s total population is projected to grow, the relative share and position of each sector’s population in relation to the region will change. The coastal suburbs’ attractiveness will continue to be a magnet for an increasing share of the population with people moving to the North-West and South-West sectors at the expense of the Inner and Middle sectors. The relative share of the Middle sector will fall from about one third of the region’s population in 2001 to 26.6 per cent in 2031. The North-West sector is expected to represent 20.7 per cent by 2031, up from 17 per cent in 2001, while the South-West sector will improve its relative position from fifth in 2001 to third, representing 14.5 per cent. Greater Perth’s Outer Regions Table 4.1 shows that in 1921 Avon Arc/Gingin area had the Greater Perth’s second largest population followed by Bunbury and Peel. The order was still the same in 1954. However, by 1971 Bunbury displaced Avon Arc/Gingin as the second largest population behind Perth Metropolitan Area. By 2001, Avon Arc was relegated to last position. At the end of the forecasting period in 2031, Perth is still expected to be in first position (87 per cent of Greater Perth's population), followed by Peel (5.9 per cent), Bunbury (4.3 per cent) and Avon Arc (2.8 per cent). Table 4.3 - Distribution of Local Government Area populations of Greater
Perth’s Outer Regions in 2001. Region/LGA Rank Population Region/LGA Rank Population Peel Avon Arc Mandurah (C) 1 49,161 Northam (T) 1 6,527 Murray 2 10,924 Gingin 2 4,267 Waroona 3 3,476 Toodyay 3 4,102 Total 63,651 Northam (S) 4 3,696 York 5 3,248 Grt Bunbury Chittering 6 2,972 Bunbury (C) 1 30,540 Beverley 7 1,576 Harvey 2 18,611 Brookton 8 1,023 Dardanup 3 9,001 Total 27,411 Capel 4 7,112 Total 65,264 (C) – City, (T) – Town, (S) – Shire. Source: Regional Population Growth 1991 to 2021 ABS Cat No 3218.0 July 2002.
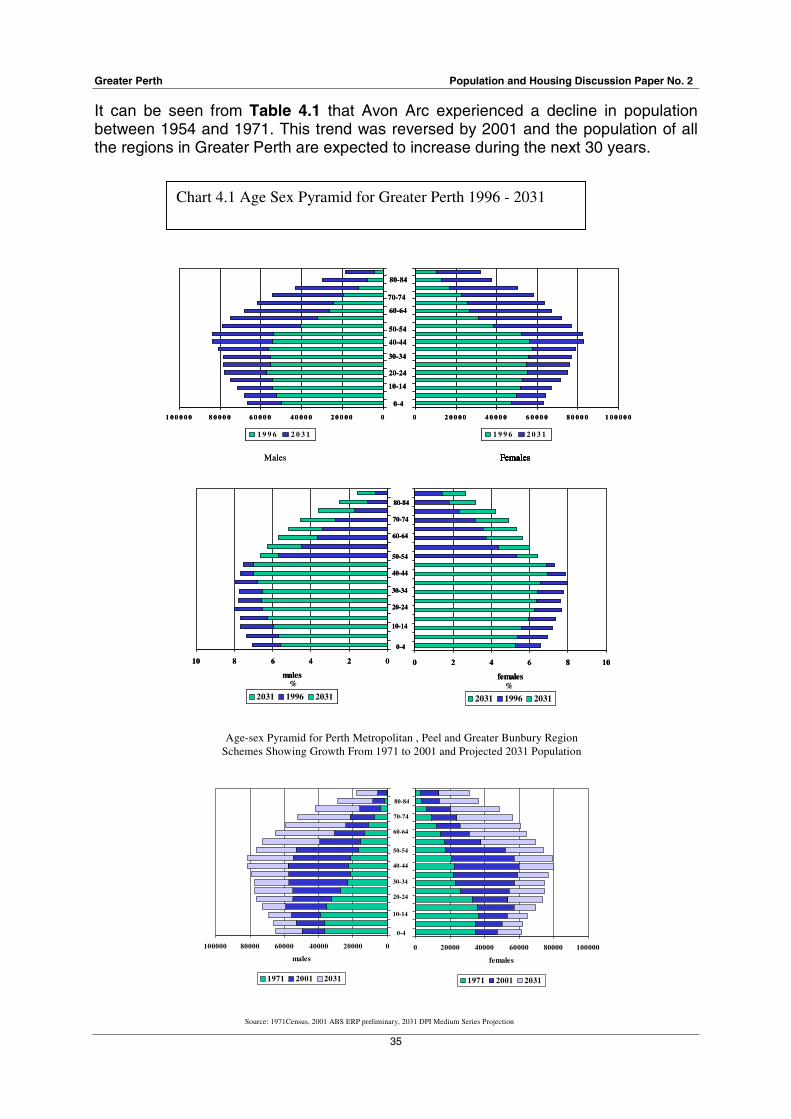
Greater Perth Population and Housing Discussion Paper No. 2
35
It can be seen from Table 4.1 that Avon Arc experienced a decline in population between 1954 and 1971. This trend was reversed by 2001 and the population of all the regions in Greater Perth are expected to increase during the next 30 years.
Chart 4.1 Age Sex Pyramid for Greater Perth 1996 - 2031
0246810
males
2031 1996 2031
0 2 4 6 8 10
females
2031 1996 2031
0-4
20-24
30-34
40-44
50-54
10-14
60-64
70-74
80-84
% %
0246810
males
2031 1996 2031
0 2 4 6 8 10
females
2031 1996 2031
0-4
20-24
30-34
40-44
50-54
10-14
60-64
70-74
80-84
% %
Age-sex Pyramid for Perth Metropolitan , Peel and Greater Bunbury RegionSchemes Showing Growth From 1971 to 2001 and Projected 2031 Population
020000400006000080000100000
males
1971 2001 2031
0 20000 40000 60000 80000 100000
females
1971 2001 2031
0-4
20-24
30-34
40-44
50-54
10-14
60-64
70-74
80-84
Source: 1971Census, 2001 ABS ERP preliminary, 2031 DPI Medium Series Projection
02 0 0 0 04 0 0 0 06 0 0 0 08 0 0 0 01 0 0 0 0 0
1 9 9 6 2 0 3 1
0 2 0 0 0 0 4 0 0 0 0 6 0 0 0 0 8 0 0 0 0 1 0 0 0 0 0
1 9 9 6 2 0 3 1
0-4
20-24
30-34
40-44
50-54
10-14
60-64
70-74
FemalesFemalesFemalesMales
80-84
02 0 0 0 04 0 0 0 06 0 0 0 08 0 0 0 01 0 0 0 0 0
1 9 9 6 2 0 3 1
0 2 0 0 0 0 4 0 0 0 0 6 0 0 0 0 8 0 0 0 0 1 0 0 0 0 0
1 9 9 6 2 0 3 1
0-4
20-24
30-34
40-44
50-54
10-14
60-64
70-74
FemalesFemalesFemalesMales
80-84

Greater Perth Population and Housing Discussion Paper No. 2
36
4.3 Issues and Implications The impact of population growth is the demand and therefore cost associated to establish and maintain social and physical infrastructure such as health care, education, roads, housing, community services, transport etc. Among other considerations, State and local government authorities include population growth and structure to determine funding requirements. The impact of population varies according to the location of growth and the demographic structure of the population. Different demographic groups have differing needs. A growing young population within the newer Perth suburbs on the urban fringe will have quite different requirements to inner city dwellers or elderly people requiring special services. A growing population will increase the number of persons with special needs , such as the disabled. Another factor to consider is that, whether the population grows or remains stable, it is the rate of consumption which will determine the impact of the demand for infrastructure. The rate of water and energy consumption will increase as a direct result of a growing population but a stable population may also increase consumption if per capita rates rise. Redevelopment of older areas may be more expensive than new development in the Outer sectors and issues such as capacity constraints and maintenance costs of older infrastructure need to be addressed. The demand for services depends upon the age structure of the local population. Areas with young families will create higher demands for child health services and schools while areas with significant numbers of elderly persons will require services such as specialist health care, special housing and transport . In addition, individual or household income may impact on the demand for some services. A growing population naturally means an increase in housing. More specifically, however, the housing demand is generated by age structure and household composition which determine the rate of household formation, which in turn determines housing type. Like housing, transport usage is determined by population growth and age structure. It is also determined by employment location, income levels and investment in private and public transport. Sustainable modes of transport, such as public transport, walking and cycling, should be encouraged together with better integration of housing, employment, shopping and other trip generating uses to reduce the impact of car usage which cause air pollution, congestion and traffic accidents. The relationship between population growth and environmental impact is difficult to define. Increased population equates with increased consumption and per capita rates of consumption need to be assessed. Urban land use planning should promote better integration of housing, employment, shopping, recreation, etc to minimise environmental and economic cost.

Greater Perth Population and Housing Discussion Paper No. 2
37
5. PERTH METROPOLITAN REGION’S POPULATION GROWTH RATE IS EXPECTED TO FALL
5.1 Background Table 5.1 below shows the average annual growth rate for the Planning Sectors, Perth Metropolitan Region (PMR) and Perth City. It can be seen that, overall, the growth rates for the earlier periods are higher than those towards the end of the projection period. All the Planning Sectors, excluding the Inner, display a similar growth pattern. The Inner Sector was the only one to experience population decline (during 1971-1976 and 1976-1981). The North-West Sector had the highest population growth rate during 1971-1976 at 46 per cent per annum. Table 5.1 Average Annual Growth Rate of Population in the Perth Metropolitan
Region by Planning Sectors 1961-2031 YEAR
INNER MIDDLE NORTH-WEST
EASTERN SOUTH-EAST
SOUTH-WEST
TOTAL PMR
PERTH CITY
1961-1966 (a) 0.59% 5.65% 7.07% 2.00% 3.30% 10.99% 3.29% n.a.
1966-1971 (a) 0.32% 5.28% 28.14% 8.18% 13.61% 15.26% 4.70% n.a.
1971-1976 (a) -1.81% 1.18% 45.72% 4.61% 12.04% 4.34% 2.76% n.a.
1976-1981 (b) -1.20% 0.69% 10.75% 4.54% 5.80% 2.80% 2.06% n.a.
1981-1986 (b) 0.36% 1.69% 6.89% 3.83% 3.52% 4.44% 2.64% n.a.
1986-1991 (b) 0.41% 1.38% 5.46% 4.25% 2.51% 5.03% 2.51% n.a.
1991-1996 (b) 0.40% 0.37% 4.00% 2.76% 1.40% 4.38% 1.73% 3.54%
1996-2001 (c) 0.78% 1.00% 2.58% 2.39% 1.74% 3.11% 1.71% 3.65%
2001-2006 (c) 1.13% 0.66% 2.21% 2.03% 1.54% 3.25% 1.58% 4.12%
2006-2011 (c) 1.01% 0.72% 1.65% 2.23% 1.38% 2.84% 1.47% 2.55%
2011-2016 (c) 0.69% 0.58% 2.07% 2.37% 1.41% 1.98% 1.39% 0.43%
2016-2021 (d) 0.80% 0.49% 1.88% 1.70% 1.42% 1.85% 1.25% 0.42%
2021-2026 (d) 0.61% 0.63% 2.00% 1.29% 1.04% 1.29% 1.13% 0.41%
2026-2031 (d) 0.49% 0.75% 1.74% 1.05% 0.88% 0.94% 1.00% 0.40%
(a) Based on census data.
(b) Based on ABS final Estimated Resident Population.
(c) Based on DPI Medium Scenario Projections.
(d) Based on DPI Medium Scenario Indicative Projections.
n.a. - Not available as there was a significant change in Perth City’s boundaries.
Source: 1966-1971 Census data, 1981-1996 ABS ERP, 2001-2031 DPI medium scenario projection October 2000.
Greater Perth Population and Housing Discussion Paper No. 2
38
5.2 Trends It is difficult to sustain high population growth rates The figures from Table 5.1 indicate that Perth’s population growth rate declined from 4.7 per cent per annum during 1966-1971 to 1.71 per cent per annum during 1996-2001 and is projected to be around one per cent per annum during 2026-2031.
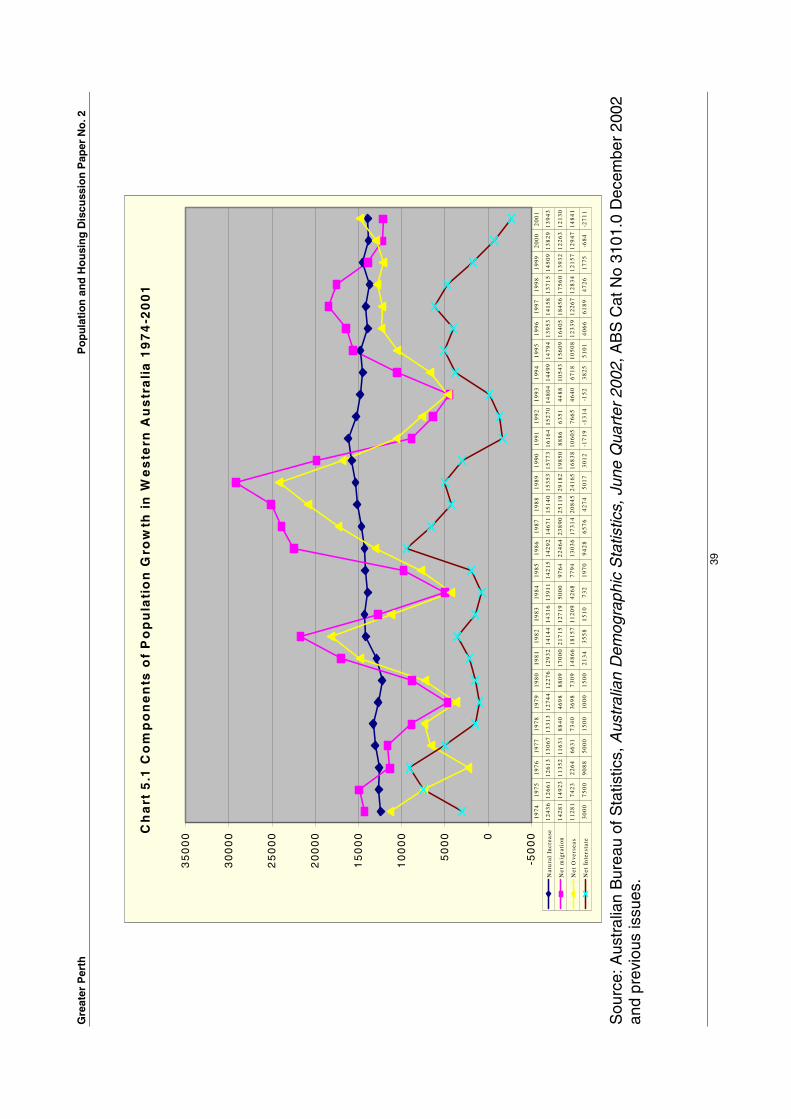
Gre
ater
Per
th
P
op
ula
tio
n a
nd
Ho
usi
ng
Dis
cuss
ion
Pap
er N
o. 2
39
Sou
rce:
Aus
tral
ian
Bur
eau
of S
tatis
tics,
Aus
tral
ian
Dem
ogra
phic
Sta
tistic
s, J
une
Qua
rter
200
2, A
BS
Cat
No
3101
.0 D
ecem
ber
2002
an
d pr
evio
us is
sues
.
Ch
art
5.1
Co
mp
on
en
ts o
f P
op
ula
tio
n G
row
th i
n W
es
tern
Au
str
ali
a 1
97
4-2
00
1
-50
000
50
00
10
00
0
15
00
0
20
00
0
25
00
0
30
00
0
35
00
0
Nat
ura
l In
crea
se1
24
36
12
66
11
26
13
13
06
71
33
13
12
74
41
22
76
12
93
21
41
44
14
31
61
39
11
14
21
51
42
92
14
67
11
51
40
15
35
31
57
73
16
16
41
52
70
14
80
41
44
99
14
79
41
39
53
14
15
81
37
15
14
50
91
38
29
13
94
3
Net
mig
rati
on1
42
81
14
92
31
13
52
11
63
18
84
04
69
88
80
91
70
00
21
71
51
27
19
50
00
97
64
22
46
42
38
90
25
11
92
91
82
19
85
08
88
66
35
14
48
81
05
43
15
60
91
64
05
18
45
61
75
60
13
93
21
22
63
12
13
0
Net
Ove
rsea
s1
12
81
74
23
22
64
66
31
73
40
36
98
73
09
14
86
61
81
57
11
20
94
26
87
79
41
30
36
17
31
42
08
45
24
16
51
68
38
10
60
57
66
54
64
06
71
81
05
08
12
33
91
22
67
12
83
41
21
57
12
94
71
48
41
Net
In
ters
tate
30
00
75
00
90
88
50
00
15
00
10
00
15
00
21
34
35
58
15
10
73
21
97
09
42
86
57
64
27
45
01
73
01
2-1
71
9-1
31
4-1
52
38
25
51
01
40
66
61
89
47
26
17
75
-68
4-2
71
1
19
74
19
75
19
76
19
77
19
78
19
79
19
80
19
81
19
82
19
83
19
84
19
85
19
86
19
87
19
88
19
89
19
90
19
91
19
92
19
93
19
94
19
95
19
96
19
97
19
98
19
99
20
00
20
01

Greater Perth Population and Housing Discussion Paper No. 2
40
The very high growth rate of 46 per cent per annum experienced by the North-West Sector during 1971-1976 highlights a few points. The population of Wanneroo (North-West Sector) had a low base population of 8,400 in 1971 and reached 55,300 in 1976 an increase of 46,900. In order to maintain the same growth rate in the following period, Wanneroo would have had to grow by 308,800 to reach 364,000 persons in 1981. Therefore, as the population of an area grows, there is a tendency for its growth rate to decline although the population may still continue to grow in absolute numbers. The baby boomers (born between 1946 and 1964) reached the family formation stage during 1971-1976 and contributed to the demand for new housing in Western Australia, including the Perth Metropolitan Region (PMR). The booming economy from 1971-76 attracted overseas migrants to Western Australia and Perth (see Chart 5.1), further increasing the housing demand. Declining fertility and mortality rates, migration and growth rates The general trend is for fertility and mortality rates to decline. The yearly natural increase, that is, the total number of babies born in an area during the year minus the total number of deaths occurring in that place during the same year, is decreasing. This means that the population is ageing and that, if there was no migration, the population of PMR would start to decline after 2027. Migration is the most important (and volatile) component of population growth. The importance of migration is magnified because migrants also contribute towards a positive natural increase in the population. Table 5.2 - Net Migration in Greater Perth, Rest of State and Western Australia
1986-1991 In 1991 In 1986 Perth Peel Bunbury Avon Arc Greater
Perth Rest of State
Total WA
Perth 0 4,526 179 609 5,314 -10,461 -5,147 Peel -4,526 0 -72 -217 -4,815 -1,977 -6,792 Bunbury -179 72 0 -82 -189 -2,246 -2,435 Avon Arc -609 217 82 0 -310 -441 -751 Greater Perth -5,314 4,815 189 310 0 -15,125 -15,125 Rest of State 10,461 1,977 2,246 441 15,125 0 15,125 Total WA 5,147 6,792 2,435 751 15,125 -15,125 0 Total ex Perth 5,147 2,266 2,256 142 9,811 -4,664 5,147 Other States (a)
50,719 1,798 1,511 509 54,537 15,076 69,613
Overseas (a) 78,935 802 1,099 277 81,113 8,090 89,203 (a) Total in-migration. Source: ABS customised tables.
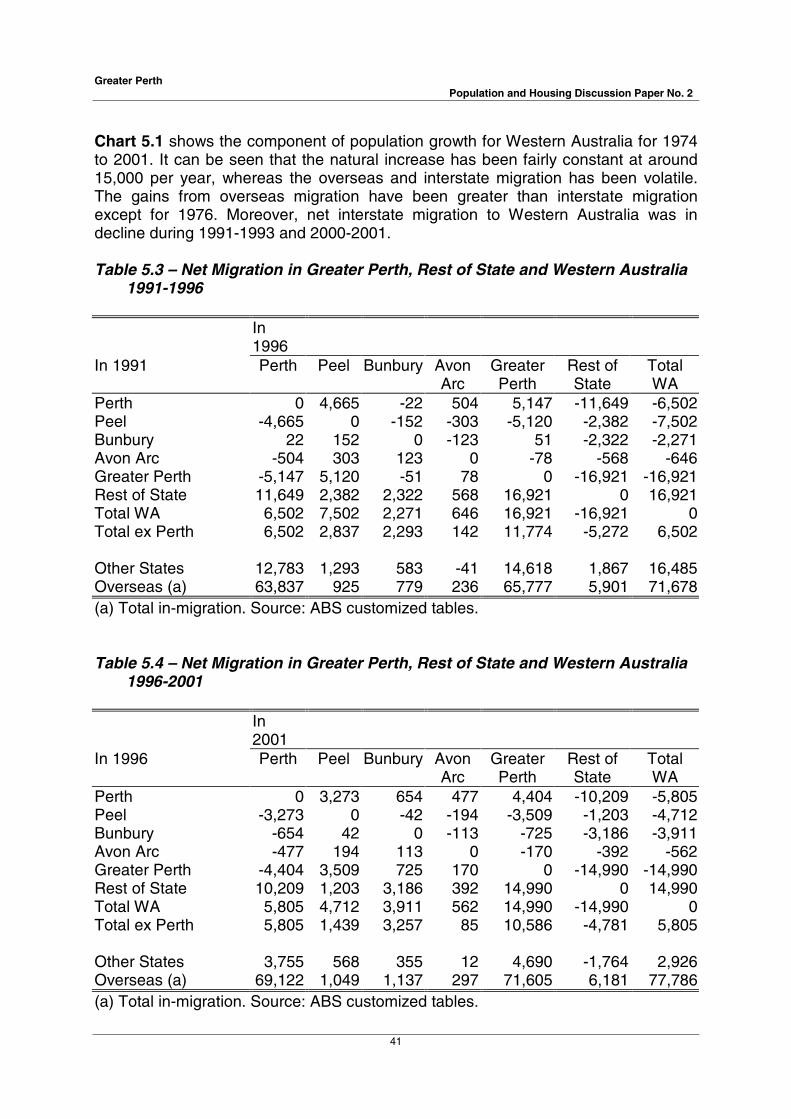
Greater Perth Population and Housing Discussion Paper No. 2
41
Chart 5.1 shows the component of population growth for Western Australia for 1974 to 2001. It can be seen that the natural increase has been fairly constant at around 15,000 per year, whereas the overseas and interstate migration has been volatile. The gains from overseas migration have been greater than interstate migration except for 1976. Moreover, net interstate migration to Western Australia was in decline during 1991-1993 and 2000-2001. Table 5.3 – Net Migration in Greater Perth, Rest of State and Western Australia
1991-1996 In
1996
In 1991 Perth Peel Bunbury Avon Arc
Greater Perth
Rest of State
Total WA
Perth 0 4,665 -22 504 5,147 -11,649 -6,502 Peel -4,665 0 -152 -303 -5,120 -2,382 -7,502 Bunbury 22 152 0 -123 51 -2,322 -2,271 Avon Arc -504 303 123 0 -78 -568 -646 Greater Perth -5,147 5,120 -51 78 0 -16,921 -16,921 Rest of State 11,649 2,382 2,322 568 16,921 0 16,921 Total WA 6,502 7,502 2,271 646 16,921 -16,921 0 Total ex Perth 6,502 2,837 2,293 142 11,774 -5,272 6,502 Other States 12,783 1,293 583 -41 14,618 1,867 16,485 Overseas (a) 63,837 925 779 236 65,777 5,901 71,678 (a) Total in-migration. Source: ABS customized tables. Table 5.4 – Net Migration in Greater Perth, Rest of State and Western Australia
1996-2001 In
2001
In 1996 Perth Peel Bunbury Avon Arc
Greater Perth
Rest of State
Total WA
Perth 0 3,273 654 477 4,404 -10,209 -5,805 Peel -3,273 0 -42 -194 -3,509 -1,203 -4,712 Bunbury -654 42 0 -113 -725 -3,186 -3,911 Avon Arc -477 194 113 0 -170 -392 -562 Greater Perth -4,404 3,509 725 170 0 -14,990 -14,990 Rest of State 10,209 1,203 3,186 392 14,990 0 14,990 Total WA 5,805 4,712 3,911 562 14,990 -14,990 0 Total ex Perth 5,805 1,439 3,257 85 10,586 -4,781 5,805 Other States 3,755 568 355 12 4,690 -1,764 2,926 Overseas (a) 69,122 1,049 1,137 297 71,605 6,181 77,786 (a) Total in-migration. Source: ABS customized tables.
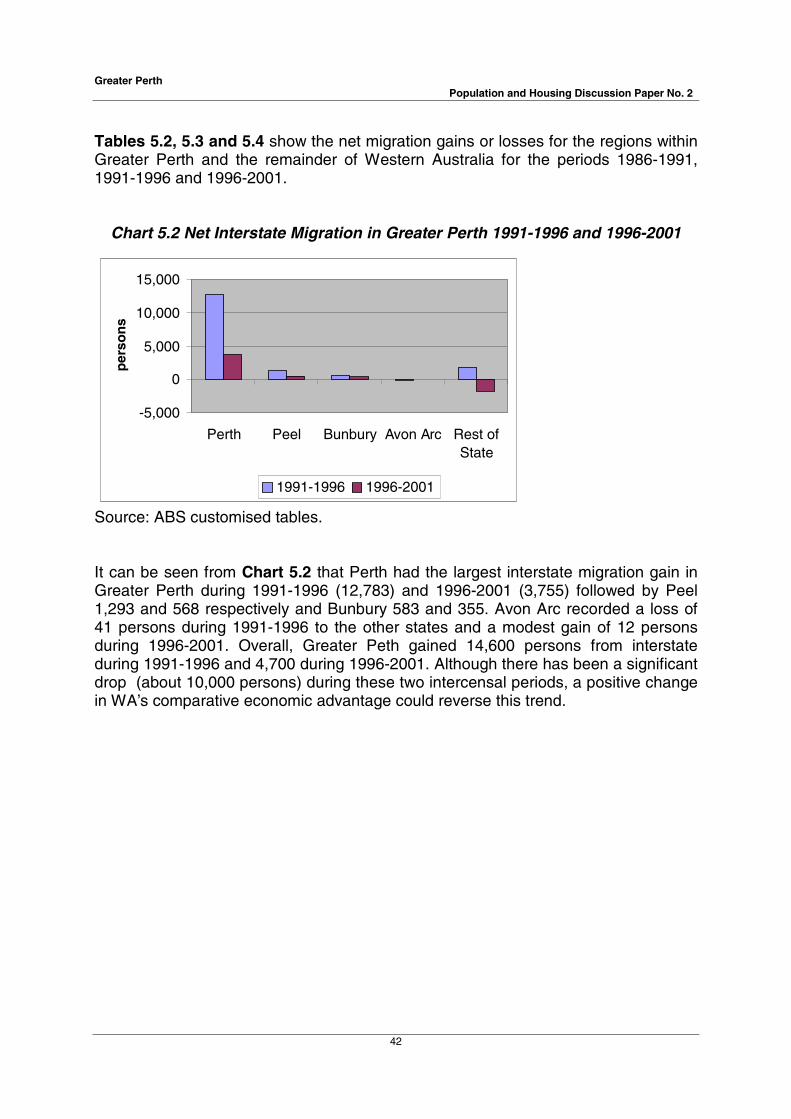
Greater Perth Population and Housing Discussion Paper No. 2
42
Tables 5.2, 5.3 and 5.4 show the net migration gains or losses for the regions within Greater Perth and the remainder of Western Australia for the periods 1986-1991, 1991-1996 and 1996-2001.
Chart 5.2 Net Interstate Migration in Greater Perth 1991-1996 and 1996-2001
Source: ABS customised tables. It can be seen from Chart 5.2 that Perth had the largest interstate migration gain in Greater Perth during 1991-1996 (12,783) and 1996-2001 (3,755) followed by Peel 1,293 and 568 respectively and Bunbury 583 and 355. Avon Arc recorded a loss of 41 persons during 1991-1996 to the other states and a modest gain of 12 persons during 1996-2001. Overall, Greater Peth gained 14,600 persons from interstate during 1991-1996 and 4,700 during 1996-2001. Although there has been a significant drop (about 10,000 persons) during these two intercensal periods, a positive change in WA’s comparative economic advantage could reverse this trend.
-5,000
0
5,000
10,000
15,000
Perth Peel Bunbury Avon Arc Rest ofState
per
son
s
1991-1996 1996-2001

Greater Perth Population and Housing Discussion Paper No. 2
43
Chart 5.3 Net Intrastate Migration in Greater Perth 1986-1991, 1991-1996 and 1996-2001
Source: ABS customized tables. Chart 5.3 indicates that Greater Perth has gained population from other parts of Western Australia during the last three intercensal periods. The net intrastate gains were 15,100 during 1986-1991, 16,900 during 1991-1996 and 15,000 for 1996-2001. Migration will become an increasingly significant factor in Perth’s future population growth. Without migration, the Greater Perth population would level out at about 1.6 million in the mid 2020s and then start to decline around 2030, at which point deaths would exceed births (Chart 5.4). This is due to the long-term trend for people to have fewer children.
-20,000
-15,000
-10,000
-5,000
0
5,000
10,000
PerthPeel
Bunbury
Avon A
rc
Rest of S
tate
per
son
s
GP 1986-1991 GP 1991-1996 GP 1996-2001

Greater Perth Population and Housing Discussion Paper No. 2
44
Chart 5.4 Component of Greater Perth’s Population growth ’Existing v/s New’ Residents 2001-2031
Source: DPI
Chart 5.5 Component of Greater Perth’s Population Growth ’Existing v/s New’ Residents by 2031
Source: DPI Charts 5.4 and 5.5 illustrate that from a base of 1.55 million persons in 2001 the population of Greater Perth, excluding migration, is expected to be around 1.6 million. Half a million of these would be the offspring of the base residents or children of the current residents. During the 30 year period 2001 to 2031, migration (overseas, interstate and intrastate) would boost the population by about half a million and an additional 0.2 million from the children of these migrants/new Greater Perth residents. 5.3 Issues and Implications Declining population growth rates are likely to bring population issues and policies into public focus. The emphasis on the provision of health services, schooling and welfare will change to reflect the demographic transition of the ageing population.
0
500,000
1,000,000
1,500,000
2,000,000
2,500,000
2001 2006 2011 2016 2021 2026 2031
Year
Per
son
s
Current Gt Perth Residents Births to Current Gt Perth Residents
New Gt Perth Residents (In-Migrants) Births to New Gt Perth Residents
50%
21%
21%
8%Current Gt PerthResidents
Births to Current GtPerth Residents
New Gt PerthResidents (In-Migrants)
Births to New Gt PerthResidents
Greater Perth Population and Housing Discussion Paper No. 2
45
There could also be a shortage of persons employed in the provision of services to the young retirees (55-70) and the elderly retirees. Australians can move from any State to any other States/Territories (interstate movement) and anywhere within the same State/Territory (intra-state movement). It follows that any policy trying to influence the population outcome in a particular area, by directing newcomers to that area, may not succeed in retaining these persons. Immigration (overseas) policies are mainly decided at the Federal Government level, although consultation with the States is held annually prior to finalising annual immigration targets. Western Australia’s overseas migration share is about 11 per cent of the national intake and Perth attracts about 80 per cent of those. Hence, Perth’s opinion, in proportion to the other States, does not carry much weight. In 1991, the National Population Council explored the impact of population growth on the environment, Australia’s future level of population etc. No official population policy came out of these enquiries as groups and opinions differed and there is no unified political stance. Some policies aiming to encourage and increase fertility have been tried in certain parts of Europe without great success. These policies usually provide additional assistance such as childcare, free education, financial assistance etc. On 1 July 2002, the Baby Bonus claim was introduced in Australia. Eligible families are entitled to $500.00 a year for up to five years. In some cases, they may be entitled to more. The Family Tax Benefit, which has been in effect for a while, is also intended to help families raise their dependent children. The future will tell if these policies change Australia’s fertility rate. Some people associate higher population levels with economic growth. For example, more people means increasing demand for goods and services, of which housing is one of the more important components. Others, however, have different opinions and associate increases in population with increases in greenhouse gases, effect on biodiversity etc. The links between population increase and the environment is complex and this topic is addressed elsewhere in the series of Greater Perth papers. The implications of population change may be minimal or negligible in the short term (five years) so that business as usual is acceptable. However, in the long run, the implications cannot be ignored as the consequences of an ageing population and change in family structure become more acute.
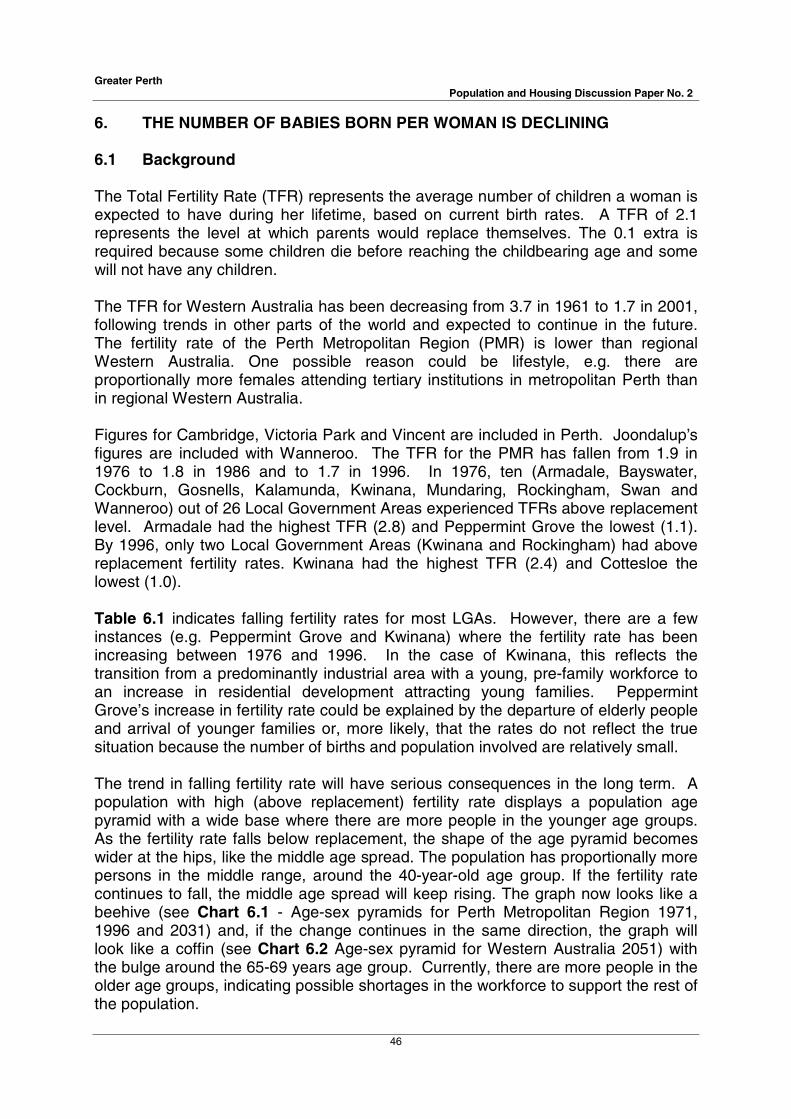
Greater Perth Population and Housing Discussion Paper No. 2
46
6. THE NUMBER OF BABIES BORN PER WOMAN IS DECLINING 6.1 Background The Total Fertility Rate (TFR) represents the average number of children a woman is expected to have during her lifetime, based on current birth rates. A TFR of 2.1 represents the level at which parents would replace themselves. The 0.1 extra is required because some children die before reaching the childbearing age and some will not have any children. The TFR for Western Australia has been decreasing from 3.7 in 1961 to 1.7 in 2001, following trends in other parts of the world and expected to continue in the future. The fertility rate of the Perth Metropolitan Region (PMR) is lower than regional Western Australia. One possible reason could be lifestyle, e.g. there are proportionally more females attending tertiary institutions in metropolitan Perth than in regional Western Australia. Figures for Cambridge, Victoria Park and Vincent are included in Perth. Joondalup’s figures are included with Wanneroo. The TFR for the PMR has fallen from 1.9 in 1976 to 1.8 in 1986 and to 1.7 in 1996. In 1976, ten (Armadale, Bayswater, Cockburn, Gosnells, Kalamunda, Kwinana, Mundaring, Rockingham, Swan and Wanneroo) out of 26 Local Government Areas experienced TFRs above replacement level. Armadale had the highest TFR (2.8) and Peppermint Grove the lowest (1.1). By 1996, only two Local Government Areas (Kwinana and Rockingham) had above replacement fertility rates. Kwinana had the highest TFR (2.4) and Cottesloe the lowest (1.0). Table 6.1 indicates falling fertility rates for most LGAs. However, there are a few instances (e.g. Peppermint Grove and Kwinana) where the fertility rate has been increasing between 1976 and 1996. In the case of Kwinana, this reflects the transition from a predominantly industrial area with a young, pre-family workforce to an increase in residential development attracting young families. Peppermint Grove’s increase in fertility rate could be explained by the departure of elderly people and arrival of younger families or, more likely, that the rates do not reflect the true situation because the number of births and population involved are relatively small. The trend in falling fertility rate will have serious consequences in the long term. A population with high (above replacement) fertility rate displays a population age pyramid with a wide base where there are more people in the younger age groups. As the fertility rate falls below replacement, the shape of the age pyramid becomes wider at the hips, like the middle age spread. The population has proportionally more persons in the middle range, around the 40-year-old age group. If the fertility rate continues to fall, the middle age spread will keep rising. The graph now looks like a beehive (see Chart 6.1 - Age-sex pyramids for Perth Metropolitan Region 1971, 1996 and 2031) and, if the change continues in the same direction, the graph will look like a coffin (see Chart 6.2 Age-sex pyramid for Western Australia 2051) with the bulge around the 65-69 years age group. Currently, there are more people in the older age groups, indicating possible shortages in the workforce to support the rest of the population.

Greater Perth Population and Housing Discussion Paper No. 2
47
Table 6.1 Total Fertility Rates for Local Government Areas by Planning Sector
in Perth Metropolitan Area 1976, 1986 and 1996.
Sector Local Government Area 1976 1986 1996
Inner Claremont 1.6 1.3 1.1
Cottesloe 1.2 1.3 1.0
East Fremantle 1.6 1.6 1.5
Fremantle 2.1 1.6 1.4
Mosman Park 1.3 1.4 1.2
Nedlands 1.3 1.6 1.5
Peppermint Grove 1.1 1.1 1.8
Perth 1.6 1.5 1.4
South Perth 1.3 1.2 1.2
Subiaco 1.2 1.1 1.3
Middle Bassendean 2.0 2.0 1.9
Bayswater 2.3 1.8 1.7
Belmont 1.9 1.7 1.8
Canning 2.0 2.0 1.8
Melville 1.8 1.7 1.4
Stirling 1.7 1.5 1.5
North-West Wanneroo 2.6 2.1 1.9
Eastern Kalamunda 2.3 2.1 1.8
Mundaring 2.4 2.2 1.9
Swan 2.2 2.1 2.1
South-East Armadale 2.8 2.3 2.1
Gosnells 2.4 2.0 2.0
Serpentine-Jarrahdale 1.4 1.9 1.9
South-West Cockburn 2.4 2.1 1.9
Kwinana 2.2 2.1 2.4
Rockingham 2.2 2.0 2.1
Perth Metropolitan Area 1.9 1.8 1.7
Source: DPI calculated from the average births over the three-year periods 1975-1977, 1985-1987 and 1995-1997 and corresponding ABS ERP for female population at 30 June 1976, 1986 and 1996.

Greater Perth Population and Housing Discussion Paper No. 2
48
At the coffin shape stage (see Chart 6.2), there will be pressure to promote high levels of migration to boost the workforce. Unfortunately, many European countries will be in the same situation and there will be strong competition to entice potential newcomers. Unless there is a significant increase in migration and/or reversal of the fertility trend, Perth could be moving towards the coffin shape age distribution in the long term (beyond 50 years). Fertility by country of birth "Nearly one quarter of births registered in Australia in 2000 occurred to women who were born overseas. This level has remained constant over the past decade. During 2000, women resident in Australia who were born overseas had a Total Fertility Rate (TFR) of 1.73 babies per woman, marginally lower than the fertility of women born in Australia at 1.74. Between 1992 and 1997, the TFR of women born overseas had been higher than for women born in Australia peaking at a 3% difference in 1993. Since then the TFRs of both groups of women have declined and since 1998 women born overseas have had a lower TFR than women born in Australia…. International Comparison “Current fertility levels indicate that many women in Australia who were born overseas appear to adopt a similar fertility level as those who were born in Australia. In other words, they do not necessarily keep the same level of fertility as women in their country of birth. There are several reasons why this may happen. The attitudes and situations of the women in Australia who were born overseas may not necessarily be similar to those in their country of birth. The fertility of the women migrating to Australia may also be affected by their reasons for migrating such as study or work and by their age at arrival. One exception to this was women born in Lebanon who have a much higher level of fertility in Australia (3.5) than the women in Lebanon (2.2). Other women in Australia born in countries such as Turkey continue to have a similar level of fertility in Australia (2.5) as women in Turkey (2.3). When comparing the level of fertility of women born overseas living in Australia to that of women in their country of birth, the most extreme difference noted was for women from Laos. These women had a similar level of fertility to the women born in Australia (1.9) while the fertility of women in Laos was much higher (4.8). Similarly, the fertility of women born in Papua New Guinea but living in Australia (1.8) was nowhere near as high as the fertility of women in Papua New Guinea (4.3). Conversely, women born in Spain living in Australia also had a fertility rate similar to the women born in Australia (1. 7) but the fertility of women in Spain was much lower (1. 1).” (Australian Demographic Statistics June Quarter 2002 ABS Cat No 3101.0). Country of Birth of Parents Figures from the 2001 census indicate that 47 per cent of Western Australia's population stated that both parents were born in Australia compared to 37 per cent where both parents were born overseas. About ten per cent stated that their father only was born overseas and about six per cent that their mother only was born overseas.
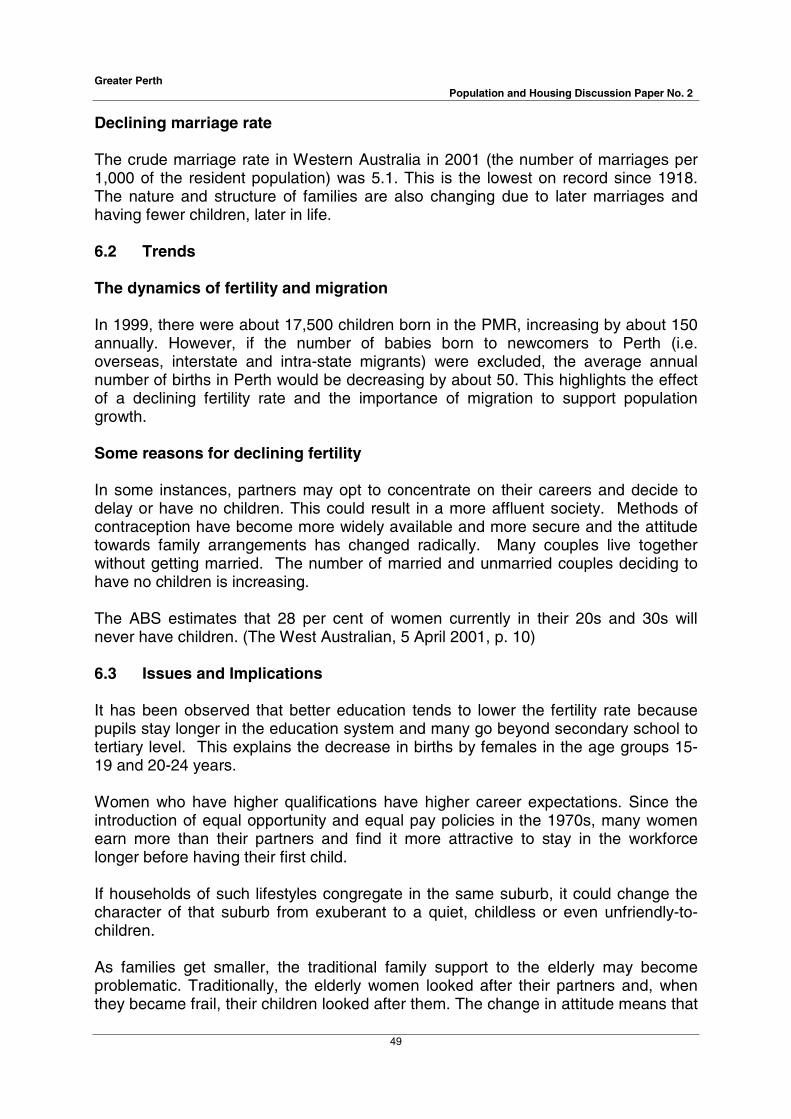
Greater Perth Population and Housing Discussion Paper No. 2
49
Declining marriage rate The crude marriage rate in Western Australia in 2001 (the number of marriages per 1,000 of the resident population) was 5.1. This is the lowest on record since 1918. The nature and structure of families are also changing due to later marriages and having fewer children, later in life. 6.2 Trends The dynamics of fertility and migration In 1999, there were about 17,500 children born in the PMR, increasing by about 150 annually. However, if the number of babies born to newcomers to Perth (i.e. overseas, interstate and intra-state migrants) were excluded, the average annual number of births in Perth would be decreasing by about 50. This highlights the effect of a declining fertility rate and the importance of migration to support population growth. Some reasons for declining fertility In some instances, partners may opt to concentrate on their careers and decide to delay or have no children. This could result in a more affluent society. Methods of contraception have become more widely available and more secure and the attitude towards family arrangements has changed radically. Many couples live together without getting married. The number of married and unmarried couples deciding to have no children is increasing. The ABS estimates that 28 per cent of women currently in their 20s and 30s will never have children. (The West Australian, 5 April 2001, p. 10) 6.3 Issues and Implications It has been observed that better education tends to lower the fertility rate because pupils stay longer in the education system and many go beyond secondary school to tertiary level. This explains the decrease in births by females in the age groups 15-19 and 20-24 years. Women who have higher qualifications have higher career expectations. Since the introduction of equal opportunity and equal pay policies in the 1970s, many women earn more than their partners and find it more attractive to stay in the workforce longer before having their first child. If households of such lifestyles congregate in the same suburb, it could change the character of that suburb from exuberant to a quiet, childless or even unfriendly-to-children. As families get smaller, the traditional family support to the elderly may become problematic. Traditionally, the elderly women looked after their partners and, when they became frail, their children looked after them. The change in attitude means that

Greater Perth Population and Housing Discussion Paper No. 2
50
there are likely to be more elderly single males needing outside support in the future. Similarly, with diminishing number of children, the frail aged will also have to rely on outside help/support. Consideration should be given to allow older able persons (over 65 years) to stay in the workforce to alleviate the burden of supporting the dependent population.

Greater Perth Population and Housing Discussion Paper No. 2
51
0 2 4 6 8 10 12
85+
75-79
65-69
55-59
45-49
35-39
25-29
15-19
5 - 9
2031
0 2 4 6 8 10 12
85+
75-79
65-69
55-59
45-49
35-39
25-29
15-19
5 - 9
2031
024681012 024681012
AgeBeehive
% Males % Females
0 2 4 6 8 10 12
85+
75-79
65-69
55-59
45-49
35-39
25-29
15-19
5 - 9
1996
0 2 4 6 8 10 12
85+
75-79
65-69
55-59
45-49
35-39
25-29
15-19
5 - 9
1996
024681012 024681012
Age
% Males % Females
0 2 4 6 8 10 12
85+
75-79
65-69
55-59
45-49
35-39
25-29
15-19
5 - 9
1971
0 2 4 6 8 10 12
85+
75-79
65-69
55-59
45-49
35-39
25-29
15-19
5 - 9
1971
024681012 024681012
Age
% Males % Females
AGE-SEX PYRAMIDPERTH METROPOLITAN REGION
1971, 1996 and 2031
Pyramid
Middle-age spread
Source: 1971 ABS Census data, 1996 ABS ERP, 2031 MfP Medium Scenario Projections October 2000
Chart 6.1 Age Sex Pyramid Perth Metropolitan Region

Greater Perth Population and Housing Discussion Paper No. 2
52
Chart 6.2 Age-Sex Pyramid Western Australia 2051
Source: ABS series ll Population Projections Australia 1991 to 2101 Cat No 3222.0 August 2000.
02468
males
2051
0 2 4 6 8
females
2051
0-4
20-24
30-34
40-44
50-54
10-14
60-64
70-74
80-84
% %
Coffin
WA Age Sex Pyramid 2051
02468
males
2051
0 2 4 6 8
females
2051
0-4
20-24
30-34
40-44
50-54
10-14
60-64
70-74
80-84
% %
Coffin
WA Age Sex Pyramid 2051

Greater Perth Population and Housing Discussion Paper No. 2
53
7. THE GREYING POPULATION 7.1 Background In 1976, half the Perth Metropolitan Region’s population was older than 27.5 years (i.e. the median age). By 1996, Perth’s median age increased to 33.4 years and DPI projections for 2031 are a further increase of about 6.9 years to 40.3 years. This indicates that the difference between the number of young persons entering the population through births and migration and the number of older people exiting the population through migration and mortality is getting smaller. If this trend continues in the long run, the situation will reverse. There will be a natural decline and the population will start to shrink. 7.2 Trends We live longer Male life expectancy increased from 68 years in 1971 to 77 years in 1999 and from 75 years to 83 years for females. The dramatic increase in longevity during the last 30 years has been brought about by developments in medical technology such as by-pass operations, new drugs and greater access to health services such as Medicare. Life expectancy improvements are expected to continue but at a slower pace. Grey power and those with less power The generation of baby boomers (people born between 1946 and 1964) are now reaching retirement age (55 years and over). Many of the younger retirees (55-70 years) are still in good health and are sometimes referred to as “grey power”. They have superannuation, own their own homes and some also have regular income in the form of superannuation pensions that they can spend on recreation or other goods and services. There are also young retirees who are asset rich but income poor in that they own their homes but do not have a regular pension. Moreover, there are others who do not own their homes and depend on government pensions. In the Metropolitan Region, the youngest LGA (Wanneroo) is expected to have the greatest increase in elderly population (persons 65 years and over) in the next decade. The North-West Sector is projected to experience the greatest growth (255 per cent i.e. from 13,750 to 48,800 persons) of persons aged 65 years and over from 1996 to 2016 and also the highest absolute growth (35,000 persons). The Middle Sector is next with an absolute increase of 21,800 persons, followed by the South-East Sector (17,100), the Eastern Sector (15,500) and the South-West Sector (15,000). The Inner Sector is predicted to have the lowest increase (5,100) and also the lowest percentage growth of 15 per cent.
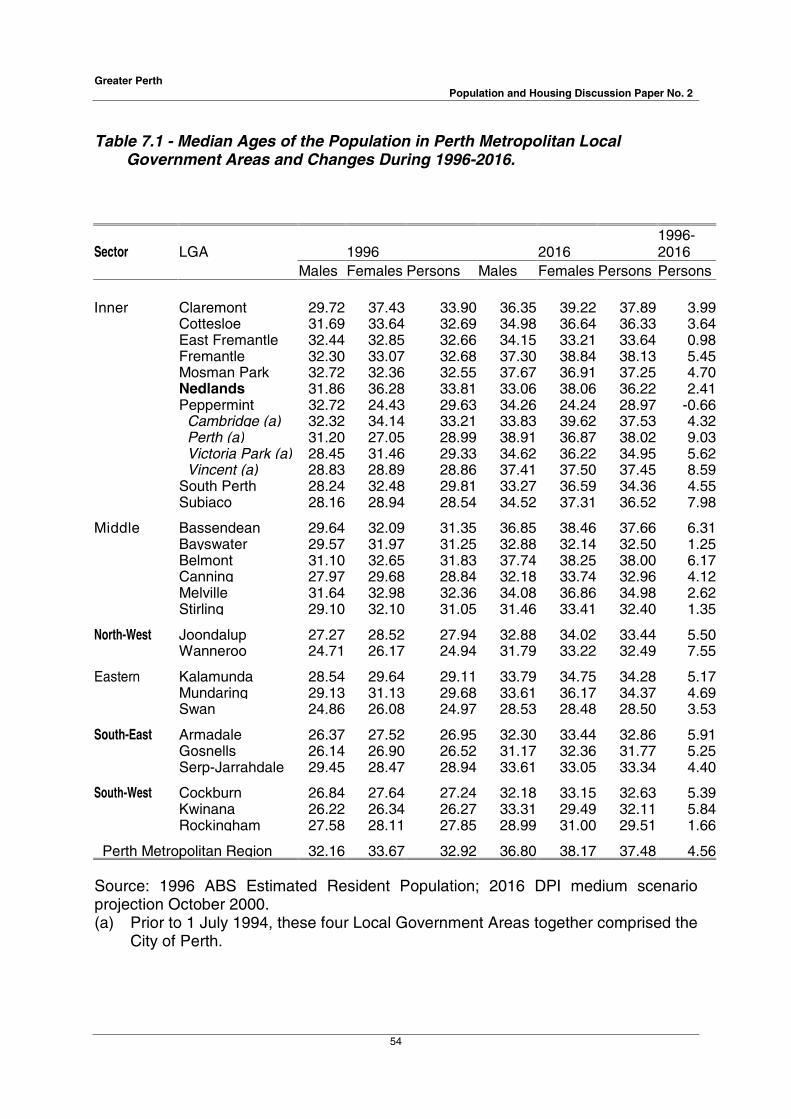
Greater Perth Population and Housing Discussion Paper No. 2
54
Table 7.1 - Median Ages of the Population in Perth Metropolitan Local
Government Areas and Changes During 1996-2016. Sector LGA 1996 2016
1996-2016
Males Females Persons Males Females Persons Persons Inner Claremont 29.72 37.43 33.90 36.35 39.22 37.89 3.99 Cottesloe 31.69 33.64 32.69 34.98 36.64 36.33 3.64 East Fremantle 32.44 32.85 32.66 34.15 33.21 33.64 0.98 Fremantle 32.30 33.07 32.68 37.30 38.84 38.13 5.45 Mosman Park 32.72 32.36 32.55 37.67 36.91 37.25 4.70 Nedlands 31.86 36.28 33.81 33.06 38.06 36.22 2.41 Peppermint 32.72 24.43 29.63 34.26 24.24 28.97 -0.66 Cambridge (a) 32.32 34.14 33.21 33.83 39.62 37.53 4.32 Perth (a) 31.20 27.05 28.99 38.91 36.87 38.02 9.03 Victoria Park (a) 28.45 31.46 29.33 34.62 36.22 34.95 5.62 Vincent (a) 28.83 28.89 28.86 37.41 37.50 37.45 8.59 South Perth 28.24 32.48 29.81 33.27 36.59 34.36 4.55 Subiaco 28.16 28.94 28.54 34.52 37.31 36.52 7.98
Middle Bassendean 29.64 32.09 31.35 36.85 38.46 37.66 6.31 Bayswater 29.57 31.97 31.25 32.88 32.14 32.50 1.25 Belmont 31.10 32.65 31.83 37.74 38.25 38.00 6.17 Canning 27.97 29.68 28.84 32.18 33.74 32.96 4.12 Melville 31.64 32.98 32.36 34.08 36.86 34.98 2.62 Stirling 29.10 32.10 31.05 31.46 33.41 32.40 1.35
North-West Joondalup 27.27 28.52 27.94 32.88 34.02 33.44 5.50 Wanneroo 24.71 26.17 24.94 31.79 33.22 32.49 7.55
Eastern Kalamunda 28.54 29.64 29.11 33.79 34.75 34.28 5.17 Mundaring 29.13 31.13 29.68 33.61 36.17 34.37 4.69 Swan 24.86 26.08 24.97 28.53 28.48 28.50 3.53
South-East Armadale 26.37 27.52 26.95 32.30 33.44 32.86 5.91 Gosnells 26.14 26.90 26.52 31.17 32.36 31.77 5.25 Serp-Jarrahdale 29.45 28.47 28.94 33.61 33.05 33.34 4.40
South-West Cockburn 26.84 27.64 27.24 32.18 33.15 32.63 5.39 Kwinana 26.22 26.34 26.27 33.31 29.49 32.11 5.84 Rockingham 27.58 28.11 27.85 28.99 31.00 29.51 1.66
Perth Metropolitan Region 32.16 33.67 32.92 36.80 38.17 37.48 4.56 Source: 1996 ABS Estimated Resident Population; 2016 DPI medium scenario projection October 2000. (a) Prior to 1 July 1994, these four Local Government Areas together comprised the
City of Perth.

Greater Perth Population and Housing Discussion Paper No. 2
55
Greater Perth and Perth Metropolitan Region The median age of Greater Perth’s population will increase from 33.6 years in 1996 to 40.8 years in 2031, while the median age of metropolitan Perth will increase from 33.4 years to 40.3 years in 2031. At the same time, the median age of enrolled voters in Perth and Greater Perth will increase to about 48 years. Figure 7.1 Distribution of Projected 1996�2016 Increase in Elderly Population in the Perth Metropolitan Region
. Source: DPI Medium Scenario Projections October 2000 Note: The yellow/brown peaks indicate high population and the blue low population. The range varies from brown, to yellow, green and blue depressions. Figure 7.1 above depicts Wanneroo, the youngest LGA in the metropolitan area in 1996 (median age of 24.9 years), to have the greatest increase in elderly population (17,700) followed by Joondalup, also from the North-West Sector, with 17,300 persons by 2016. Gosnells is predicted to have the highest increase in the South-East Sector with 8,800. Cockburn will top the South-West with 7,200 persons, Swan in the Eastern sector with 6,900 elderly, Stirling in the Middle Sector with 6,200 and finally Fremantle in the Inner Sector with 1,000 aged persons. Greater Perth Between 1996 and 2031, the number of Greater Perth residents aged 70 years and over will triple. By 2031, there will be about 324,000 persons aged 70 and over and another 125,000 residents will be aged between 65 and 69. These people will demand services including public transport and leisure activities. A number may be looking to move to a new home, and possibly buy a second one after realising the capital value of the ’family home’, to take advantage of various ’lifestyles’ on offer throughout the South West of the State.

Greater Perth Population and Housing Discussion Paper No. 2
56
Changes in how we ’save’ and ’spend’ leisure time are putting new demands on the South West of the State. Changes in demography and lifestyle preferences will create change in demand for recreational services and facilities. The lifestyle preference of the active elderly aged 65 to 74 years will constitute a significant economic market with those resident in Greater Perth expected to increase from 91,900 in 1996 to 237,600 in 2031. Timing and speed of ageing In Australia, the timing and speed of ageing are occurring at substantially different rates for the states and territories. The shift to natural decline is expected to create many social, economic and political predicaments where it is first experienced. Tasmania will be the first to enter natural decline, soon followed by South Australia but the youngest states and territories are not expected to reach this point for several years. . These diverging demographic forces will have many implications for the complex mixture of federal, state and local government that currently adjudicates over policy making and implementation, especially collection of taxes, distribution of the goods and services of the Welfare State and a large element of fiscal redistribution. Chart 7.1 Timing and speed of structural ageing by State/Territory in Australia
Forecast Timing and Speed of Structural Aging
(65+ age group growing from 10% to 20% of Population)
37
25
36
43
44
42
42
38
36
1960 1970 1980 1990 2000 2010 2020 2030 2040 2050 2060 2070 2080 2090 2100
NT
ACT
WA
QLD
NSW
Australia
VIC
SA
TAS
Year
Source: ABS Population projections Australia 1999-2101 Cat No 3222.0 and As the Population Clock winds Down… Journal of Population Research Vol 19 No 2 November 2002 Natalie Jackson & Bruce Felmingham Chart 7.1 shows that the speed at which each region is ageing, as measured by the number of years taken by the population aged 65 years or over, will increase from 10 to 20 per cent. The importance of this indicator is that it demonstrates the ’force’ or intensity of ageing, that is, the number of years within which the main effect of ageing will be compressed. Tasmania and South Australia will be the first to contend with the major implications of population ageing. The force of ageing for these states (36-38 years) will be greater than for Victoria, New South Wales, and Queensland (42-44 years). However, the most acute force will ultimately be experienced by the ACT in 25 years.

Greater Perth Population and Housing Discussion Paper No. 2
57
No research has yet been done into the implications of this aspect of the disparity. However, the institutional lag that tends to accompany social change is one factor that will certainly need to be addressed. For example, the partial underwriting of local government funding by the Local Government Grants Commission is typically reviewed on a five-yearly basis and committed to up to nine years in advance of perceived needs. Although ’age profile’ is one of the ’disability factors’ upon which such funding is determined, the future dynamics of population ageing are not adequately addressed by this criterion. The approximate year of onset of natural decline, that is, the year in which deaths are projected to exceed births inclusive of births and deaths to migrants, is as follows: Tasmania (around 2021) , South Australia (2025), Victoria (2032), New South Wales (2035), Queensland and ACT (2040), Western Australia (2045) and Northern Territory (around 2060). No specific importance is attached to the particular date of onset of natural decline but this unprecedented event will be separated in the oldest and youngest regions by a period of at least four decades (or two decades if the Northern Territory is excluded). Table 7.2 – Population Dependency Ratio by State/Territory and Australia (a) Year Australia NSW Vic Qld SA WA Tasmania NT ACT 2001 48.4 49.3 48.1 47.7 51.1 46.0 52.2 40.8 40.6 2006 47.1 48.1 47.1 46.2 49.9 44.5 50.8 38.9 40.4 2011 47.1 48.1 46.8 45.8 49.9 44.5 50.8 37.7 41.2 2016 49.7 50.6 49.7 48.1 53.8 47.5 55.3 38.5 44.3 2021 52.7 53.4 53.1 51.1 58.5 50.8 60.8 39.7 47.5 2026 57.0 57.5 57.5 55.3 64.5 54.6 68.1 41.0 51.5 2031 60.8 61.3 61.6 58.2 69.5 58.0 73.6 42.2 54.6 2036 63.4 63.9 65.0 61.0 73.0 60.3 77.9 43.1 56.7 2041 65.6 66.1 67.8 62.9 75.4 62.3 81.2 43.5 58.5 2046 66.7 67.2 68.9 63.9 76.7 63.4 83.5 43.7 59.5 2051 68.1 68.6 70.4 65.3 78.3 64.7 86.9 44.5 60.5 (a) Dependency ratio is the number of children (aged 0-14) and elderly (aged 65 or over) per 100 persons of working age (15-64). Source: ABS Population Projections Australia 1999-2101 Cat No 3222.0 August 2000. It can be seen from Table 7.2 that Tasmania had the highest dependency ratio in 2001 and will maintain this position. In 2031, it will reach 73.6 and by 2051 increase to 86.9. Western Australia was the third lowest in 2001 (46.0) and is projected to maintain this position with 58.0 in 2031 and 64.7 in 2051. Western Australia’s projected dependency ratios are lower than Tasmania’s because, historically, Western Australia had relatively high net migration. It is possible that in the future the States that are presently receiving a higher proportion of overseas migrants (New South Wales, Queensland and Western Australia) will experience greater competition for migrants from the other States and Territories.
Greater Perth Population and Housing Discussion Paper No. 2
58
As the dependency ratio increases, there will be increased pressure for young people to join the workforce instead of going to tertiary education, with the possibility of a decline in university enrolments. In the younger age groups, there will be a decrease in demand for primary and secondary schools as the number of children decline. However, as the number of elderly increases there will be more demand for support and health programs and increased pressure for the fit to remain in the workforce longer. The timing of ageing will affect the current practice of distribution of resources and funds. The implementation of new procedures will certainly affect the State and, ceteris paribus, Greater Perth as it contains 80 per cent of Western Australia’s population. 7.3 Issues and Implications As people live longer, there will be more elderly requiring health services to maintain an acceptable quality of life. The continuous health care required by the aged can be very expensive. There will be a greater burden on the working population to support them. The young suburbs/LGAs of today will have to plan for the expected increase in the elderly population within the next decade. With a greater number of more diverse migrants coming to Australia there will be a need to provide the elderly with special services such as languages other than English, special diet etc. As mentioned earlier, falling fertility will reduce the availability of the family and children to look after their parents in old age. As the reliance on the car increases and as the elderly lose their access to the private car, there will be a need to improve public transport, services delivered at home and use of the Internet for shopping and other services. There is a general trend for governments to recover part of their costs in the form of "user pays". There will be a dilemma for those who will not be able to afford these services (water, electricity, health, housing etc) as they decide which ones to do without.

Greater Perth Population and Housing Discussion Paper No. 2
59
8. HOUSEHOLDS WILL CONTAIN FEWER PEOPLE 8.1 Background Population and Household change Between 1947 and 2001, the population of Western Australia grew by a factor of 3.8 to 1,906,100 (ABS preliminary estimated resident population) while the total number of occupied private dwellings increased by a factor of 5.6 to 695,600. With households (occupied private dwellings) growing faster than population, the occupancy rate has decreased from 4.17 persons per dwelling in 1947 to 2.55 in 2001. The State’s occupancy rate increased from 4.26 persons per dwelling in 1911 to 4.74 in 1921 and has continued to decline. The occupancy rate decline is a product of changes in household size and structure. In 1947, 50.5 per cent of total households contained four persons or more but by 2001 this had decreased to 28.5 per cent. The number of three-person households decreased from 20.4 per cent to 15.9 per cent in the same period. Table 8.1 Occupancy Trends in Private Dwellings, WA, 1947-1996 Census Year Occupancy
Rate (*)
Rooms per Dwelling
Persons per Room
Bedrooms per Dwelling
1911 4.26 3.66 1.16 n.a. 1921 4.74 4.17 1.14 n.a. 1931 4.50 4.38 1.03 n.a. 1947 4.17 4.55 1.02 n.a. 1954 4.07 4.77 0.85 n.a. 1961 3.94 5.07 0.78 n.a. 1966 4.01 5.18 0.77 n.a. 1971 3.68 4.91 0.75 2.78 1976 3.44 5.56 0.62 2.96 1981 3.16 5.64 0.56 2.86 1986 3.08 n.a. n.a. 2.94 1991 2.95 n.a. n.a. 2.98 1996 2.78 n.a. n.a. 3.12 2001 2.55 n.a. n.a. 3.16 (*) Estimated from total population divided by private occupied dwellings. n.a. – not available Source: ABS census.
Greater Perth Population and Housing Discussion Paper No. 2
60
8.2 Trends Changing household structure and, specifically, the decline in the number of persons per household or occupancy rate, has been dramatic. Table 8.1 shows estimates of household size from the 1911 census to the 2001 census and the decrease in occupancy rate from 4.26 persons per dwelling to 2.55 persons. It can be seen from Chart 8.1 that between 1971 and 2001, one and two-person- households increased while all the other household sizes decreased. In 1971, two-person households were the most popular (25.8 per cent of total households or 73,300 of a total of 284,400 households), four-person households second, three-person households third, five-person households fourth, one-person households fifth (12.4 per cent or 35,300 households) and six-person households last. The order of magnitude of household size in 2001 was slightly different. Two-person households were still at the top (32.7 per cent or 217,500 out of 664,900 households). However, one-person households displaced four-person households for second position (22.9 per cent or 152,000 households) and the remaining household sizes kept their relative positions. For example, four-person households came third followed by three-person households, five-person households and finally six-person households. The greatest increase occurred in lone person households. The increases in two-person households and one-person household can be explained by: - Declining fertility rates;
- Improved life expectancy and the tendency for couples and widowed persons to maintain themselves as individual households;
- Increase in divorce rates, resulting in families being split into smaller units;
- Post war baby-boomers passing from household formation age to empty nester/retirement.

Greater Perth Population and Housing Discussion Paper No. 2
61
Chart 8.1 Household Size in Western Australia
1971 & 2001
1 2 3 4 5 6+0
5
10
15
20
25
30
35
perc
enta
ge
1971 2001
Source: ABS 1971 and 2001 Census data. Table 8.1 also shows that at the same time that household size was declining, people were actually living in progressively larger dwellings, as demonstrated by the increasing number of rooms or bedrooms per dwelling and declining numbers of persons per room. As houses have been getting larger, blocks have been getting smaller. DPI subdivision statistic figures reveal that the estimated median size of residential lots has gradually declined from around 730 square metres in 1991 to around 600 square metres by 2002. Household size in Perth Metropolitan Region’s Planning Sectors Table 8.2 shows the decline and variation in the occupancy rate within Perth’s Planning Sectors between 1971 and 1996. Over the years, the Middle and Outer sectors have maintained higher occupancy rates than the Inner sector. Overall, the rate has declined from 3.12 to 2.54 over the 25 years. In 1996, the North-West sector had the highest occupancy rate with 2.99 persons per household. The lowest rate was in the Inner sector with 2.09. By 2031, it is projected that the Outer sectors will continue to have higher occupancy rates than the Inner and Middle sectors. Most areas are expected to show a decline in household size between 2001 and 2031 and the overall household size for the Perth region is projected to decline from 2.5 to 2.27 .

Greater Perth Population and Housing Discussion Paper No. 2
62
Table 8.2 Historical and Projected Occupancy Rates by Planning Sector Historical Sector 1971 1976 1981 1981 1991 1996 Inner 2.68 2.42 2.18 2.10 2.08 2.09 Middle 3.39 3.02 2.70 2.54 2.45 2.41 North West na 3.30 3.28 3.11 3.05 2.99 Eastern 3.37 3.22 3.04 2.92 2.85 2.84 South East 3.49 3.35 3.21 3.09 2.96 2.85 South West
3.19 3.06 2.78 2.68 2.61 2.65
PMR 3.12 2.90 2.70 2.60 2.55 2.54 Projected Sector 2001 2006 2011 2016 2021 2026 2031 Inner 2.04 2.04 2.06 2.05 2.07 2.06 2.05 Middle 2.38 2.32 2.30 2.27 2.24 2.22 2.20 North West 2.89 2.75 2.62 2.57 32.50 2.46 2.45 Eastern 2.78 2.64 2.51 2.44 2.38 2.33 2.28 South East 2.80 2.65 2.52 2.45 2.43 2.39 2.36 South West 2.58 2.54 2.48 2.42 2.36 2.32 2.29 PMR 2.50 2.44 2.38 2.35 2.32 2.29 2.27 Source: DPI Metropolitan Land Use Forecasting System. Figure 8 shows the change in occupancy rate between 1996 and 2031 by Census Collection District (CCD) for a section of the PMR only. Many CCDs of the Inner and Middle sectors are either maintaining their occupancy rate or experiencing a small increase while the Outer sectors are expected to experience a decline. The Outer sectors currently attract young persons at the family formation stage. Towards the end of the forecast period, the children from these earlier families would have moved on, leaving behind the ‘empty-nesters’ and reducing the occupancy rate. In contrast, the increasing occupancy rates of the CCDs within the Inner and Middle sectors is the result of people moving back to these areas.
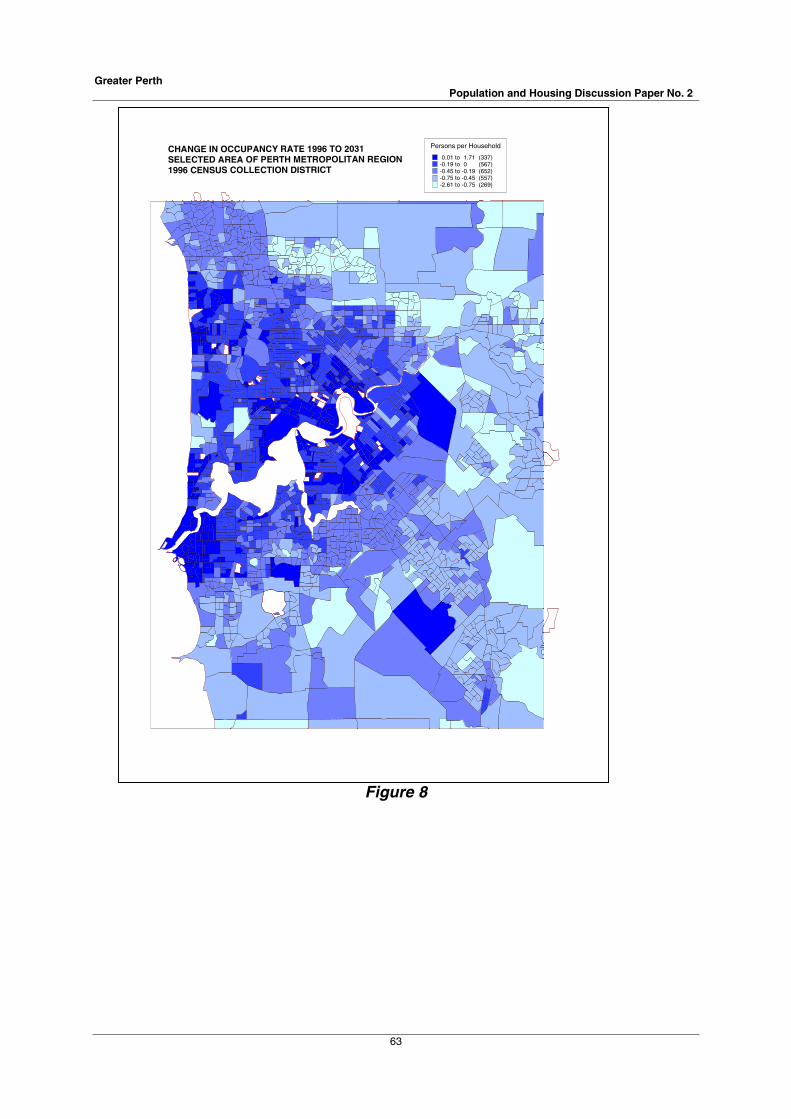
Greater Perth Population and Housing Discussion Paper No. 2
63
Figure 8
Persons per Household
0.01 to 1.71 (337)-0.19 to 0 (567)-0.45 to -0.19 (652)-0.75 to -0.45 (557)-2.61 to -0.75 (269)
CHANGE IN OCCUPANCY RATE 1996 TO 2031SELECTED AREA OF PERTH METROPOLITAN REGION1996 CENSUS COLLECTION DISTRICT

Greater Perth Population and Housing Discussion Paper No. 2
64
Against the metropolitan trend, occupancy rates in the City of Perth are projected to increase slightly to 1.63 in 2031 from 1.41 in 1996. New housing developments within the inner city will boost the population as more younger people are attracted to the lifestyle it offers. This will have a direct impact on occupancy rates. Chart 8.2 illustrates the overall historical and projected decline in occupancy rates by sector between 1971 and 2031.
Chart 8.2 Historical and Projected Occupancy Rates by Planning Sector 1971 - 2031
0.00
0.50
1.00
1.50
2.00
2.50
3.00
3.50
4.00
1971
1976
1981
1986
1991
1996
2001
2006
2011
2016
2021
2026
2031
Per
son
s p
er H
ou
seh
old
Inner Middle North-West Eastern South-East South-West
Source: DPI Metropolitan Land Use Forecasting System. Smaller Family Sizes Households are continuing to decrease in size because of later family formation, smaller families and longer life expectancies. In simple terms, the average household size in Greater Perth in 1971 was 3.34 persons per household, falling to 2.54 by 2001. Projected household growth in Greater Perth over the first twenty years of the 21st Century is expected to be higher than the Australian average. WA is projected to have the fastest growth in lone person households (particularly people in their 20s and over 70) of all Australian States and Territories as well as an above Australian average increase in one-parent families. These trends indicate that by 2011 the average Greater Perth household size may fall to 2.44 and to 2.31 by 2031. The definition of family has also changed since the days of ’two parents with two children’ was the norm. In 1996, couples with children made up 49 per cent of all Western Australian families but by 2021 the ABS projects this will fall to somewhere between 31 per cent and 45 per cent (ABS Household and Family Projections Australia, 1996 to 2021, Cat No 3236.0). This projected fall in the numbers of ’traditional families’ has important planning implications as children under 15 years are more likely to live in Perth’s outer sectors due to a combination of housing affordability and lifestyle preferences.

Greater Perth Population and Housing Discussion Paper No. 2
65
Dwelling Requirements Table 8.3 Projected Total Private Dwelling Need in Greater Perth, 2001 to 2031 Area 2001 2006 2011 2016 2021 2026 2031 Metro Perth
552,000 612,200 672,300 730,300 787,400 842,000 892,900
Peel Region
29,300 35,800 42,300 48,200 53,300 57,800 61,700
Bunbury Region
25,000 27,400 30,300 32,800 35,400 38,300 41,100
Avon Arc/Gingin
12,800 14,500 16,400 18,800 22,200 25,500 28,800
Total 619,200 689,900 761,300 830,000 898,300 963,600 1,024,500 Note: figures have been rounded to nearest 100. Source: DPI Dwelling projections for Perth Metropolitan Region were extracted from Table B2 of Population Report No 5, Tomorrow’s Dwellings and Labour Force in Western Australia, May 2002. Figures for Mandurah and Murray were produced using the same methodology of household headship rate. Projections for the remaining areas of Greater Perth (Waroona, Bunbury Region and Avon Arc/Gingin) were derived from projected population for the area and applying assumed declining levels of occupancy ratios and stock losses. Table 8.4 Ten Yearly New Private Dwelling Need In Greater Perth, 2001 to 2031 Area 2001/2011 2011/2021 2021/2031 Total Metro Perth 120,300 115,100 105,500 340,900 Peel Region 13,000 11,000 8,500 32,400 Bunbury Region
5,300 5,100 5,600 16,000
Avon Arc/Gingin
3,500 5,800 6,600 16,000
Total 142,100 137,000 126,200 405,300 Note: figures have been rounded to nearest 100. Source: DPI Table 8.4 indicates that Greater Perth will need to provide about 13,500 new homes, on average, every year from 2001 to 2031. The average yearly provision falls gently over time from an average of 14,200 in the first decade to 13,700 in the second decade and 12,600 dwellings per annum in the final decade. The corresponding average annual growth rate for new private dwellings required in Greater Perth for the three decades are 2.09 per cent, 1.67 per cent and 1.32 per cent. As could be expected, these rates are higher than the corresponding rates for population growth of 1.74 per cent, 1.44 per cent and 1.15 per cent (calculated from Table 4.1) as household sizes get smaller.
Greater Perth Population and Housing Discussion Paper No. 2
66
8.3 Issues and Implications According to Department for Planning and Infrastructure projections, the number of households between 1996 and 2031 is expected to grow by around 400,000 but is dependent on a number of factors including occupancy rates and prevailing economic conditions. The implications of smaller households are multi-fold. In addition to increasing the dwelling stock to house the growing population, there needs to be a greater choice in the size, type and quality of dwellings to satisfy the needs of diverse households. Communities of young families in the outer sectors will have different housing requirements to ‘empty nesters’, ageing householders or inner city dwellers. The Increasing housing density will have ramifications for the provision of physical and social infrastructure. The smaller household trend , which is related to the population’s demographic structure, is expected to continue. This may have significant impacts on housing densities. Areas previously occupied by traditional family homes that have undergone redevelopment into higher density housing do not always experience an increase in population levels if the new housing is occupied by one or two persons. In fact, population levels may decline. The overall appearance of a locality may change as increasing housing density can, if not properly planned, appear bulky, especially when residential lot sizes are declining. In some established areas, multi-unit housing should be further encouraged close to public transport and employment areas. The Commission’s Liveable Neighbourhoods Community Design Code seeks to encourage the innovative development of urban land by facilitating the creation of walkable neighbourhood communities containing employment, retail and community facilities. The underlying demographic trends outlined above, including smaller households, are expected to continue.

Greater Perth Population and Housing Discussion Paper No. 2
67
9. INNER CITY PERTH’S GROWTH IS EXPECTED TO CONTINUE 9.1 Background There have been quite significant changes to the City of Perth in the last 30 years. The local government area boundary changed radically on 1 July 1994. Four local government authorities, the towns of Cambridge, Victoria Park and Vincent, and the new City of Perth, were etched out of the old Perth local government area. The estimated resident population of the City of Perth in 2001 was 7,964. This represents only 9.2 per cent (86,600) of the population based on the old boundaries. The ABS Estimated Resident Population (ERP) for the city of Perth was 4,706 persons in 1991 increasing by 19 per cent to 5,600 in 1996 and 42 per cent to 7,964 (ABS preliminary figures) by 2001. On the current trend and assuming the availability of affordable dwellings, the DPI medium scenario population projection figure of 10,100 persons for Perth City for 2031 could be reached sooner. Some changes that occurred during 1961-2001 are illustrated in Table 9.1. The boundaries in Figure 9 reflect 2001 Census Collection District (CCD) boundaries aggregated to census zones level. Census zones were used because historical data is not readily available for the current boundaries of the city of Perth due to the changes made in 1994 and CCD boundary change between censuses. Figure 9 Perth City 2001 Census Collection Districts and Journey to Work Census Zones
Source: Census 2001 Census Basics. Note: Census Zones 130, 131, 132, 133 and 134 make up the CBD (Central Business District. Census Zone 132 is also known as the CBD centre.

Greater Perth Population and Housing Discussion Paper No. 2
68
9.2 Trends From doughnut to café society Perth has followed the trends of other capital cities in Australia and around the world where the “doughnut” effect was experienced during the 1960s followed by a return to population increase in the 1990s. The doughnut effect was partly explained by the theory that as the inner cities were perceived to be less attractive than outer suburbs, there was net migration loss to the outer areas. Some of the push factors were increased pollution, congestion, less friendly environment, unsafe and too expensive. However, in the 1990s the pull factors seemed to outweigh the push factors and the populations in the inner capital cities started to increase. There is a new generation, the 'Chardonnay-café society', that finds inner city living very appealing. Many of these new city-dwellers are young, affluent and work in the city. They are prepared to relinquish the traditional quarter acre block and consequential gardening for a newly redeveloped inner city residential apartment in Northbridge, East Perth or along King's Park. With the resulting increase in free time, they readily partake in the recreational activities offered by the city, theatres, restaurants, sporting events etc. Population At the 2001 census, 13,463 persons were counted in the City of Perth. However, 46 per cent of these (6,172) were visitors and the ABS preliminary estimated the resident population of the City is 7,964. Visitors include persons from overseas, interstate and intrastate. CBD (Central Business District) The Central Business District (CBD) area as defined in the Journey to Work study was used because data for the current boundaries of the City of Perth are not readily available prior to 1991. The Journey to Work study relates to Australian Bureau of Statistics data gathered as part of the population census about destination (work place location, type of industry) of the workforce and the corresponding origin (place of residence) for each member of the working population in the study area. The CBD in the Journey to Work study include census zones 130, 131, 132, 133 and 134 (see Figure 9). This definition of the CBD makes up 83.5 per cent of the current (1996 boundaries onwards) 2001 census count of the population of the City of Perth. Zone 132 in Table 9.1 is referred to as 'CBD centre' as it is a close approximation of a smaller set of boundaries, which is also referred to as the Perth CBD by some researchers. Zone 132 is contained within the railway line in the north, the Swan River in the south, Spring and Milligan streets in the west and Victoria Avenue and Lord Street in the east.

Greater Perth Population and Housing Discussion Paper No. 2
69
The CBD population halved between 1961 and 1981, from 10,651 to 5,574. It increased to 6,497 in 1996, fell slightly in 1991 and increased to 8,110 in 1996. In 2001, the population reached 11,238. The CBD includes about 83.5 per cent of the City’s population and the CBD centre contains 32.2 per cent of the CBD’s population. Between 1996 and 2001, the CBD population counted on census night increased by 39 per cent from 8,110 to 11,238 persons. In the CBD centre, that is Census Zone (CZ) 132, the population increased by 29 per cent from 2,813 to 3,618. The most dramatic increase, 321 per cent from 324 to 1,365 persons, was recorded in CZ 130 and reflects the advanced stage of the East Perth Redevelopment in 2001. CZ 131 grew by 22 per cent from 3,669 to 4,462 persons, whereas CZ 133 grew by 19 per cent from 678 to 806 persons and CZ 134 grew by 58 per cent from 626 to 987 persons. Change in Journey to Work Boundaries and Compilation In 1961 and 1971, the Journey to Work study area consisted of the Perth Metropolitan Region. Mandurah was added in 1981 and in 1991, Murray, Gingin, Chittering, Toodyay, the Town of Northam, the Shire of Northam, York, Beverley, Wandering and Boddington. Till 1996, the Journey to Work data was processed/adjusted by DPI to comply with the place of origin totals from the census count figures. This was necessary because ABS randomises, that is, changes the value of a small cell (e.g. values of 1,2,3) to a random number, in order to preserve confidentiality of census respondents. The 2001 Journey to Work study area includes the whole State of Western Australia. Moreover, the place of origin has been expanded to cover the whole of Australia. Western Australians who were interstate were also included in the study and consequently there is a break in the series. In order to understand the change between 1996 and 2001, the Journey to Work data for 1996 was increased by 4.5 per cent (see footnote (f) of Table 9.1) to bring the census count figure to a usual resident base equivalent. The 2001 Journey to Work data is only preliminary as other consistency checks still need to be done. Dwellings The number of CBD private dwellings decreased from 3,033 in 1971 to about 1,700 in 1991 but by 2001 more than doubled to about 4,200. The number of private dwellings is expected to further increase as the population increases. It can be seen from Table 9.1 that the average number of persons living in private dwellings has fallen from 1.9 to 1.6 and this is likely to continue in the future although the 1996 figure was slightly less than 2001. The CBD non-private dwelling population proportion has increased from 41 per cent in 1971 to 65 per cent in 1991 and decreased slightly to 51 per cent in 2001. During the same period, the CBD centre changed from 82 per cent in 1971, 96 per cent in 1991 and back to 82 per cent in 2001.

Greater Perth Population and Housing Discussion Paper No. 2
70
Employment The Journey to Work employment figures for the CBD increased from 61,900 in 1961 to 80,500 in 1971, falling to 75,200 in 1976, increasing to 86,600 in 1996 and 91,500 in 2001 (preliminary). The picture for the CBD centre is somewhat different. In 1961, employment in the CBD centre was 41,700. This increased to 51,700 in 1971, followed by a fall to 49,100 in 1976. It then oscillated, rising to 51,400 in 1981, falling to 37,900 in 1991 and rising to 41,054 in 1996 and 49,400 in 2001 (preliminary). The CBD centre’s share of total employment in the CBD has fluctuated between 67.4 per cent and 44.3 per cent. Table 9.1 Population, Dwellings and Workforce Change in the Perth Central
Business District 1961–2001
Area 1961 1971 1981 1986 1991 1996 2001
Population counted at the census
CBD 10,651 8,521 5,574 6,497 6,286 8,110 11,238
CBD centre 1,953 2,231 1,938 1,881 2,027 2,813 3,618
% 18.3% 26.2% 34.8% 29.0% 32.2% 34.7% 32.2%
Total private dwellings
CBD n.a. 3,033 2,088 1,697 1,703 2,294 4,203 (c)
CBD centre n.a. 263 166 69 * 6 158 595 (d)
% n.a. 8.7% 8.0% 4.1% * 0.4% 6.9% 14.2%
Average number of persons per occupied private dwelling
CBD n.a. 1.89 1.66 1.68 1.65 1.58 1.65 (e)
CBD centre n.a. 1.67 1.49 1.72 * 14.17 1.54 1.76 (f)
Population in occupied private dwellings
CBD n.a. 5,028 2,690 2,400 2,217 2,933 5,533 (g)
CBD centre n.a. 393 195 103 85 207 649 (h)
% n.a. 7.8% 7.2% 4.3% 3.8% 7.1% 11.7%(i)
Percentage of population in non private dwellings
CBD n.a. 41.0% 51.7% 63.1% 64.7% 63.8% 50.8%
CBD centre n.a. 82.4% 89.9% 94.5% 95.8% 92.6% 82.1%
Number of persons working in
CBD 61,893 80,539 78,058 85,651 85,558 86,592 (a) 91,500 (j)
CBD centre 41,703 51,676 51,375 49,259 37,879 41,054 (b) 49,400 (j)
% 67.4% 64.2% 65.8% 57.5% 44.3% 47.4% 54.0%
n.a. - not available * - Not reliable, figure was probably affected by randomisation process adopted by ABS to protect the confidentiality of small cells.

Greater Perth Population and Housing Discussion Paper No. 2
71
(a) Estimate of persons working in CBD in 1996 is 90,900 and (b) 42,900 for CBD centre, that is, adjusted to usual residence base data to be
comparable to 2001 figures. There was an oddity in the CBD centre where one or more private four-story buildings contained 42 units and housed 209 persons. This yields an average occupancy ratio of about 5 persons per dwelling which raises the possibility that these may relate to non-private dwellings. If this were the case then the 2001 adjusted figures should be around:
(c) 4,161 total private dwellings in the CBD and (d) 553 in the CBD centre. (e) 1.61 persons per occupied private dwelling in CBD and (f) 1.35 for CBD centre. (g) 5,324 persons living in occupied private dwellings in the CBD and (h) 440 in CBD centre. (i) 8.3% of the total population living in the occupied private dwellings in rhe CBD
were located in the CBD centre. (j) Break in series due to change in the scope and coverage of 2001 Journey to
Work census data. Source: ABS 1961-2001 Census data; Perth Region Data Books 1961-1981, The Metropolitan Region Planning Authority, Western Australia. Table 9.2 Distribution of Employment by Industry in the CBD 1961-2001 Industry 1961 1971 1981 1991 2001 Primary & Mining 0.35% 2.08% 3.07% 3.41% 4.47%Manufacturing 16.01% 7.90% 7.17% 3.99% 2.69%Gas, Water, Elect 2.53% 1.87% 2.44% 1.32% 1.48%Build & Const 4.36% 5.82% 5.10% 3.86% 2.88%Wholesale & Retail 29.00% 24.68% 14.20% 9.75% 8.93%Transport & Storage 6.04% 5.50% 4.67% 4.60% 2.69%Communications 3.76% 4.65% 4.96% 3.21% 3.28%Finance & Property 9.60% 19.67% 24.85% 26.76% 34.76%Public Admin 9.07% 12.23% 12.22% 14.81% 12.05%Community Services 12.70% 9.45% 14.15% 19.98% 18.27%Sport, Rec, & Entertainment 6.57% 6.13% 7.18% 8.31% 8.48%Source: ABS 1961-2001 Census data; Perth Region Data Books 1961-1981, The Metropolitan Region Planning Authority, Western Australia. Figures in Table 9.2 show that there has been a steady increase in the proportion of people working in the ’primary and mining’ sectors during 1961 to 2001. The ’finance and property’ sector also experienced consistent growth during the same period. ’Manufacturing’, ’wholesale and retail’ and ’transport and storage’ experienced a decline throughout the whole period. ’Building and construction’ has experienced a decline since 1971 while ’sport, recreation and entertainment’ recorded increases. The remaining four sectors, ’gas, water and electricity’, ’communications’, ’public administration’ and ’community services’ fluctuated between gains and losses.

Greater Perth Population and Housing Discussion Paper No. 2
72
9.3 Issues and Implications Perth’s temperate climate makes it an attractive city to live and work. The Swan River and Kings Park are two attributes that make Perth appealing to tourists. It shares the same time zone as Singapore, Hong Kong and Malaysia, so it is convenient for international companies to have branch offices in Perth from which to conduct business with the region. Recently, many warehouses and other older buildings have been converted to apartments as well as the new developments in East Perth, West Perth and Northbridge. Major retail chains are opening in the city and Northbridge continues to develop as the premier entertainment precinct in the metropolitan area. The city’s employment growth may increase traffic congestion and potential new city dwellers may regard the population growth as a push factor. The cost of housing is increasing as Perth becomes more attractive, resulting in cheaper housing becoming less available. This could displace the city’s less affluent workers who will have to commute by car or public transport.

Greater Perth Population and Housing Discussion Paper No. 2
73
10. GLOSSARY ABS Australian Bureau of Statistics AIUS Australian Institute of Urban Studies Avon Arc/Gingin also referred to as Avon Arc in this paper consisting
of Beverley, Brookton, Chittering, Gingin, Northam, Toodyay, York shires and Northam town.
CBD Central Business District CCD Census Collection District DHW Department of Housing and Works DOLA Department of Land Administration DPI Department for Planning and Infrastructure DPUD Department of Planning and Urban Development (a
precursor of DPI) ERP Estimated Resident Population calculated by ABS GDP Gross Domestic Product Greater Bunbury region scheme intercensal period
also referred to as Greater Bunbury in this paper consisting of Bunbury City, and Harvey, Dardanup and Capel shires period between two censuses usually 5 years eg 1986-1991
JtoW Journey to Work LGA Local Government Authority/Area MDP Metropolitan Development Program median age age at which half of the population is older and half of
the population is younger MFP Ministry for Planning (a predecessor of DPI) MLUFS Metropolitan Land Use Forecasting System MRPA Metropolitan Region Planning Authority n.a. Not available natural increase excess of births over deaths NIMBY not in my backyard PCA Perth Central Area Peel Region Scheme also referred to as Peel Region in this paper
consisting of Mandurah City, Murray and Waroona shires
PMR Perth Metropolitan Region or Perth Statistical Division
PSD Perth Statistical Division or Perth Metropolitan Region
SWUS South West Urban System TFR Total Fertility Rate WAPC Western Australian Planning Commission WCED World Commission on Economic Development
Greater Perth Population and Housing Discussion Paper No. 2
74
11. REFERENCES ACIL Tasman, Landcost: The Impact of Land Costs on Housing Affordability, March 2003 Australian Bureau of Statistics, Australian Demographic Statistics, June Quarter
2002, ABS Cat No 3101.0 December 2002 and previous issues. Australian Bureau of Statistics, 1994 National Aboriginal and Torres Strait Islander
Survey, Western Australia, ABS Cat No 4190.5, September 1996. Australian Bureau of Statistics, Australian Demographic Statistics June Quarter 2002,
ABS Cat No 3101.0 December 2002. Australian Bureau of Statistics, Census 1996, unpublished data. Australian Bureau of Statistics, Demography, Western Australia 1998, ABS Cat No
3311.5, December 1999. Australian Bureau of Statistics, Household and Family Projections Australia, 1996 to
2021, ABS Cat No 3236.0 October 1999. Australian Bureau of Statistics, Population Projections Australia 1991 to 2101, Cat
No 3222.0 August 2000. Australian Bureau of Statistics, Regional Population Growth, ABS Cat No 3218.0 July
2002.
Australian Bureau of Statistics, Western Australia’s Baby Boomers, A Profile of Persons Born 1946-1965, ABS Cat No 4149.5 June 2003.
Australian Institute of Urban Studies (1983) Housing Policy in the Perth Region: Density and Form. AIUS Publication No. 110. Canberra.
Bucholz, Todd (1989) New Ideas from Dead Economists. Penguin Putnam Group,
New York.
Commonwealth Bureau of Census and Statistics, Western Australian Office April
1968, Western Australian Year Book No 7 - 1968.
Davidson, G. (1993) The past and future of the Australian suburb. The Australian Planner. 11: 63-69.
Davidson, G. (1995) Australia – the first suburban nation? Journal of Urban History. 22: 40-74.
Department of Housing and Works (2001) About Us: Major Roles. Web site http://www.dhw.wa.gov.au. Accessed in April 2002.

Greater Perth Population and Housing Discussion Paper No. 2
75
Department of Housing and Works, Housing Strategy WA, Issues Paper, Affordability, October 2002
Department of Infrastructure, Victoria 2000, Victoria in Future, implications of population change for Metropolitan Melbourne.
Department of Land Administration (1996) StreetSmart 1996 Perth Street Directory. Edition 37. Harper Collins Publishers: place unknown. UDATE
Department of Planning and Urban Development (1990) Metroplan: A Planning Strategy for the Perth Metropolitan Region. Department of Planning and Urban Development: Perth, Western Australia.
Department of Planning and Urban Development (1993) Impact of Taxation and Charges on Land Supply and Price Department of Planning and Urban Development: Perth, Western Australia.
Department of Planning and Urban Development (1992) Metropolitan Regional Residential Density Policy: Background Report. Department of Planning and Urban Development: Perth, Western Australia.
Forster, C. (1999) Australian Cities: Continuity and Change. Oxford University Press: Melbourne. Second Edition.
Frost, L. and T. Dingle (1995) Sustaining suburbia: an historical perspective on Australia’s urban growth. In: Australian Cities: Issues, Strategies and Policies for Urban Australia in the 1990s. (P. Troy, ed) pp. 20-38. Cambridge University Press: Melbourne.
Government of Western Australia (2002) Focus on the Future: The Western Australian State Sustainability Strategy: Consultation Draft. Sustainability Policy Unit, Department of the Premier and Cabinet: Perth, Western Australia.
Government of Western Australia April 1994, Task Force on Aboriginal Social Justice, Report of the Task Force, April 1994, Volume 1
Graeme Hugo, Declining Fertility and Policy Intervention in Europe: Some Lessons
for Australia? Journal of Population Research, Vol. 17, No 2, 2000 Green Street Joint Venture (1991) Attitudes to Housing in Australia: A Summary of
the Findings: Green Street Joint Venture Market Research Study. Green Street Joint Venture Secretariat, Department of Industry, Technology and Commerce: Canberra.
Hedgcock, D. and T. Hibbs (1992) Perth’s suburban traditions: from orthodoxy to innovation. In: Urban and Regional Planning in Western Australia: Historical and Cultural Perspectives. (D. Hedgcock and O. Yiftachel, eds) pp.64-78. Paradigm Press: Perth.
Greater Perth Population and Housing Discussion Paper No. 2
76
Homeswest (1990) Land and Housing Function. Homeswest, Perth.
McLure, C (1998) The Local government Response. In Western Australian Planning Commission: Housing Market Trends: Facts Figures and Fallacies – a one day seminar to explore change in demographics, housing choice and trends in residential development. Perth, WA.
Mark Mallabone, Lack of Mr Right Hits Birth Rate, The West Australian, April 5, 2001
Market Equity (2000) Future Perth: What’s important to the Community – Focus Group Outcomes. Western Australian Planning Commission: Perth, Western Australia.
Marsh, C. J. (1979) Retailing. In: Western Landscapes (J. Gentilli, ed. pp445-464) University of Western Australia Press for the Education Committee of the 150th Anniversary Celebrations 1979: Perth.
Metropolitan Region Planning Authority (1970) Corridor Plan for Perth. Government Printer: Perth, Western Australia.
Metropolitan Region Planning Authority (1985) Perth Region Data Book, 1981. Metropolitan Region Planning Authority: Perth, Western Australia.
Ministry for Planning (1999) Future Perth Indicators. Western Australian Planning Commission: Perth, WA.
Ministry for Planning, Demographic Monitoring Report Population and Household Change to 1996, Draft Issue 6, July 1998 (unpublished)
Ministry for Planning, Subdivision Statistics System, internal data Natalie Jackson & Bruce Felmingham, As the Population Clock winds Down:
Indicative Effects of Population Ageing in Australia’s States and Territories, Journal of Population Research Vol 19 No 2 November 2002
Office of Housing Policy (2001a) Housing Strategy WA – A Window to the Future for Housing in Western Australia. September.
Office of Housing Policy (2001b) Housing Strategy WA: Outcomes of the workshop to establish a vision and goals for the strategy. September. Unpublished.
Peter McDonald and Rebecca Kippen, The Impact of Immigration on the Ageing of Australia's Population, International Migration into the 21st Century, Essays in Honour of Reginald Appleyard edited by M.A.B. Siddique (2001).
Pitt-Morrison, M. (1979) Settlement and development: the historical context. In: Western Towns and Buildings (M. Pitt-Morrison and J. White, eds.) pp. 1-73. University of Western Australia Press: Nedlands. Published for the Education Committee of the 150th Anniversary Celebrations 1979: Perth.

Greater Perth Population and Housing Discussion Paper No. 2
77
Review Group (1987) Planning for the Future of the Perth Metropolitan Region: Report of the Review Group to the State Planning Commission of Western Australia. State Planning Commission: Perth.
Seddon, G. (1972) Sense of Place: A Response to an Environment, the Swan Coastal Plain, Western Australia. University of Western Australia Press: Perth.
Webb, M. (1979) Urban expansion, town improvement and the beginning of town planning in metropolitan Perth. In: Western Landscapes. (J. Gentilli, ed.) pp. 359-380. University of Western Australia Press: Nedlands. Published for the Education Committee of the 150th Anniversary Celebrations 1979: Perth.
Western Australian Planning Commission (1997) State Planning Strategy: Manual. Western Australian Planning Commission: Perth, Western Australia.
Western Australian Planning Commission (2000) Statement of Planning Policy No.8: State Planning Framework Policy (Variation No.1). Western Australian Government Gazette No.98, 30 May 2000.
Western Australian Planning Commission (2002) Residential Lot Activity, Western Australia: Financial Year2001 – 2002. Western Australian Planning Commission: Perth W.A.
Western Australian Planning Commission (2003a) Greater Perth Planning Context Working Paper. Western Australian Planning Commission: Perth W.A.
Western Australian Planning Commission (2003b) Greater Perth Liveability and Rejuvenation Working Paper. Western Australian Planning Commission: Perth W.A.
Western Australian Planning Commission (2003c) Greater Perth Integrating Transport and Land Use working paper. Western Australian Planning Commission: Perth W.A.
Western Australian Planning Commission (2003d) Greater Perth Economy and Employment working paper. Western Australian Planning Commission: Perth W.A.
Western Australian Planning Commission (2003e) Greater Perth Sustainable City working paper. Western Australian Planning Commission: Perth W.A.
Western Australian Planning Commission (2003f) Greater Perth Residential Land Balance working paper. Western Australian Planning Commission: Perth W.A.
Western Australian Planning Commission, Future Perth Indicators, June 1999 Western Australian Planning Commission, Liveable Neighbourhoods – A Western
Australian Government Sustainable Cities Initiative Edition 2, June 2000. Western Australian Planning Commission, Metropolitan Development Program,
Urban Land Release Plan 2000/01 to 2004/05 Strategic Statement, December 2000.
Western Australian Planning Commission (2000a) Liveable Neighbourhoods: A
Western Australian Government Sustainable Cities Initiative. Edition 2.

Greater Perth Population and Housing Discussion Paper No. 2
78
Western Australian Planning Commission, Population Report No 4, October 2000,
Western Australia Tomorrow: Population Projection for the Statistical Divisions, Planning regions and Local Government Areas of Western Australia.
Western Australian Planning Commission, Population Report No 5, May 2002, Tomorrow’s Dwellings and Labour Force in Western Australia.
World Commission on Environment and Development (1987) Our Common Future. Oxford University Press. Oxford. (The Brundtland Report).
Yiftachel, O. and D. Hedgcock (1992) Theories of metropolitan planning. In: Urban and Regional Planning in Western Australia (D. Hedgcock and O. Yiftachel, eds) pp 149-161. Paradigm Press: Perth.