
South African Health Review 2012/13 - IIS Windows Server
346
South African Health Review 2012/13
-
Upload
khangminh22 -
Category
Documents
-
view
1 -
download
0
Transcript of South African Health Review 2012/13 - IIS Windows Server

So
uth
Afr
ican
He
alt
h R
ev
iew
2
01
2/1
3


South AfricanHealth Review
2012/13
Published byHealth Systems Trust

The information contained in this publication may be freely distributed and reproduced, provided that the source is acknowledged and it is used for non-commercial purposes.
Layout by Lynda Campbell, The Press Gang : Telephone +27 (0)82 410 9936
Information presented in this Review is based on best available data derived from numerous sources. Discrepancies between different sources reflect the current quality of data. All data should thus be interpreted carefully and with recognition of potential inaccuracy.
The views expressed in this Review are those of the individual authors and do not represent the views of their respective organisations / institutions or Health Systems Trust.
Also available on CD and on the HST website
http://www.hst.org.za/publications/south-african-health-review-2012/13
Health Systems Trust Email: [email protected]
34 Essex Terrace Website: http://www.hst.org.za
Westville 3630 Tel: +27 (0)31 266 9090
Durban Fax: +27 (0)31 266 9199
South Africa
ISBN 978-1-919839-73-8
March 2013
Suggested citation, for example:
Gray A, Vawda Y, Jack C. Health Policy and Legislation. In: Padarath A, English R, editors. South African Health Review 2012/13. Durban: Health Systems Trust; 2013. URL: http://www.hst.org.za/publications/south-african-health-review-2012/13
This publication was supported by a grant from the South African National Department of Health.

Foreword
It gives me great pleasure to introduce the 16th edition of the South African Health Review (SAHR). This year’s edition provides information on selected issues that are relevant to the six building blocks of health systems strengthening, the Negotiated Service Delivery Agreement and primary health care re-engineering.
A range of experts provide commentary on topics such as social determinants of health, non-communicable diseases, climate change and occupational health. The Review also contains a section on core health issues where recent developments in health information, medicines selection and pricing and health legislation and policy are discussed.
The Review is aimed at policy makers, planners, health managers, researchers, students and local and international health and development organisations. Feedback from delegates attending Health Systems Trust’s 20 year anniversary celebration reaffirmed the value of the Review both nationally and internationally and we are grateful for the various ways in which the public health community support the production of the Review. In recognition of the need to build the public health capacity and expertise within the health arena and as part of HST’s 20 year celebrations, we have initiated the Emerging Public Health Practitioner Award in recognition of the best article submitted by a young and emerging public health professional for inclusion in the South African Health Review (SAHR). Two entries are included in this edition.
A strong team within the HST has worked throughout the year to bring the Review to completion with support from a cadre of highly regarded peer reviewers and authors. On behalf of the Board I wish to extend our thanks and appreciation to all HST staff that have been involved in the production of the Review and to the authors, peer reviewers and the SAHR Editorial Advisory Committee who provided oversight and direction to the Editorial Team.
The collective input of internal and external peer reviewers and the willingness of authors to accommodate collegial feedback and editorial comment has strengthened the Review and ensured that a diverse range of thoughts and views are represented in the publication.
We also extend our gratitude to the National Department of Health for supporting the production of this Review.
We trust that you will find this Review a worthy contribution to building health systems in South Africa.
Welile Shasha
Chairperson of the Board of Trustees

ii SAHR 2012/13

SAHR 2012/13 iii
Table of Contents
Editorial vii
Legislation and Financing
1 Health Policy and Legislation 3
Andy Gray, Yousuf Vawda, Caron Jack
2 National Health Insurance: The first 18 months 21
Malebona Precious Matsoso, Robert (Bob) Fryatt
Service Delivery
3 HIV Treatment in South Africa: The challenges of an increasingly successful antiretroviral programme 37
Francois Venter
4 Maternal, Newborn and Child Health 49
Lesley Bamford
5 Occupational Health Challenges Facing the Department of Health: Protecting employees against tuberculosis and caring for former mineworkers with occupational health disease 67
Shahieda Adams, Rodney Ehrlich, Nabeel Ismail, Zara Quail, Mohamed F Jeebhay
6 Citizen Reporting on District Health Services 83
Kerry Cullinan
Social and Environmental Determinants of Health
7 Mainstreaming the Social Determinants of Health in South Africa: Rhetoric or reality? 89
Laetitia Rispel, Sara Nieuwoudt
8 Violence, Alcohol Misuse and Mental Health: Gaps in the health system’s response 103
Joanne Corrigall, Richard Matzopoulos

iv SAHR 2012/13
9 Chronic Non-communicable Diseases in South Africa: Progress and challenges 115
Thandi R Puoane, Lungiswa P Tsolekile, Sam Caldbick, Ehimario U Igumbor, Kashmeera Meghnath, David Sanders
10 Public Health Impact of and Response to Climate Change in South Africa 127
Jonathan Elliot Myers, Hanna-Andrea Rother
Leadership and Governance
11 The State of the National Health Research System in South Africa 141
Flavia Senkubuge, Bongani M Mayosi
12 Health Policy and Systems Research: Needs, challenges and opportunities in South Africa – a university perspective 151
Marsha Orgill, Nonhlanhla Nxumalo, Woldekidan Amde, Ermin Erasmus, Uta Lehmann, Jane Goudge, Lucy Gilson
13 Crises, Routines and Innovations: The complexities and possibilities of sub-district management 161
Soraya Elloker, Patti Olckers, Lucy Gilson, Uta Lehmann
Medicines, Vaccines and Technology
14 Medicines Selection and Procurement in South Africa 177
Bada Pharasi, Jacqui Miot
Emerging Public Health Practitioner Awards
15 The Language Barrier: The overlooked challenge to equitable health care 189
Nadia Hussey
16 Barriers to the Implementation of Tuberculosis Infection Control among South African Healthcare Workers 197
Oluwatoyin Adeleke
Health Information
17 Health and Related Indicators 207
Candy Day, Andy Gray

SAHR 2012/13 v
Acknowledgements
Editors
Ashnie Padarath and René English
Editorial Advisory Committee
We extend our thanks to the Editorial Advisory Committee members, Peter Barron, Lilian Dudley, Andy Gray, Thulani Masilela, Tracey Naledi, Anban Pillay and Ronel Visser. Their contribution helped to guide the development of the Review and maintain high standards of academic rigour.
Contributing Authors
We acknowledge with gratitude the individual authors’ commitments to contributing to the Review and for responding to editing demands, often at short notice, despite their other competing responsibilities.
Peer Reviewers
We express our sincere thanks to all the peer reviewers who, in the spirit of collegiality, made many insightful comments and thus enhanced the quality of the chapters in this Review. In particular we are grateful to the following people: Duane Blaauw, Mark Blecher, Candy Day, David Rees, Tanya Doherty, Adila Hassim, Jeanette Hunter, Stephen Knight, Leslie London, Refilwe Nancy Phaswana-Mafuya, Di McIntyre, Heather McLeod, Julia Moorman, Saloshni Naidoo, Shan Naidoo, Antoinette Ntuli, Dingie Janse van Rensburg, Friedrich Soltau, Fatima Suleman, Myra Taylor and Gustaaf Wolvaardt.
Access to Data
We are grateful to the National Department of Health for providing access to various data sets used in this Review.
Other Support
Compiling a publication like the South African Health Review is a huge undertaking that requires collective input and support from a wide range of people. We owe a debt of gratitude to Barbara English and Susan van Tonder of Wordsmiths English Consultancy for their meticulous editing. We acknowledge the contributions of Stephanie Ortynsky, Catherine Pagett and Michael Cadegan for their work on the referencing. Thanks are due to Lynda Campbell of the Press Gang for maintaining the high standard of layout and design that the Review has become associated with. We thank staff members of Health Systems Trust for providing various types of assistance and support: Rakshika Bhana, Candy Day, Jabulile Dube, Julia Elliot, Delene King, Jeanette Hunter, Hlengiwe Ngcobo, Catherine Pagett, Tamlyn Seunanden and Nompumelelelo Xulu. We are also grateful to Peter Barron for his continuous support and assistance. The role of the Board of Trustees, particularly the input of the Health Systems Research sub-committee, is gratefully acknowledged.
As HST celebrates its 20th anniversary this year, we pay tribute to all previous editors of the SAHR and the pioneers who were instrumental in conceptualising and developing it. We thank them for having the vision and passion to create a product that has become a flagship publication and is consistently associated with excellence and quality.
Funders
This publication was supported by a grant from the South African National Department of Health.
Cover
The cover photo entitled “Usuku Empilweni” is an original painting by Siyabonga Sikosana, which depicts a day in the life of a South African rural community.

vi SAHR 2012/13

SAHR 2012/13 vii
Eighteen years into democracy and three years after the national 2009 general elections that ushered in new national health leaders and a range of new legislation, South Africa finds itself in the throes of implementing numerous health sector reform policies aimed at transforming the public and private health landscapes and overcoming ever increasing inequities between its society’s wealthiest and poorest. The current focus is on implementing the components of key strategies such as the Negotiated Service Delivery Agreement (NSDA) which presents four strategic outputs to be achieved by the South African government. Output four, which is to strengthen the effectiveness of health systems, primarily through the introduction of primary health care re-engineering and the 14-year-long planned implementation of National Health Insurance (NHI) as a financing mechanism for the health system, has received significant attention in the year 2012.
However, a range of programmatic activities designed to move towards attaining output one (increasing life expectancy), output two (decreasing maternal and child mortality) and output three (combating HIV and AIDS and decreasing the burden of disease from TB) have been substantially prioritised, escalated and supported by the release of a raft of plans and national strategies intended to be implemented on a wide scale. To this end, 11 NHI pilot sites have been identified that will serve as the basis for testing the process of overhauling the health system, and the generation of models, good practices and lessons to inform further implementation and future scale up to more districts. Much of what has spurred South Africa’s commitment to re-engineering the health system has also been driven by South Africa’s overwhelming quadruple burden of disease fuelled by a range of risk factors – such as unsafe sex and sexually transmitted disease; interpersonal violence; alcohol, tobacco smoking and obesity; maternal and childhood malnutrition; and decreased physical activity amongst other factors. The high prevalence of these and other risk factors, including rising non-communicable disease rates, has turned policymakers’ attention to addressing the social determinants of disease.
Twenty years after the inception of the Health Systems Trust, this 16th edition of the South African Health Review (SAHR) broadly focuses on some of the key building blocks of the health system: financing, governance and leadership, medical products and service delivery. Throughout the Review, authors make reference to issues that relate to human resources and information. The Review also focuses on the social determinants of health and South Africa’s quest to start addressing these. While the SAHR aims to provide a broad country perspective, this edition heralds the start of a move towards supplementing evidence of change with examples of actual change and activities on the ground through the inclusion of case studies, vignettes and profiles of interesting innovations. Below, we also introduce the newly launched Emerging Public Health Practitioner Award which provides a voice to young and upcoming under-35-year-old public health professionals. We hope that in years to come this award will inspire these practitioners to add to
new and ongoing public health debates and to present innovative solutions to problems that plague our health system.
This year’s SAHR kicks off with two chapters that deal with legislation and financing respectively. Chapter 1 on Health Policy and Legislation focuses on the period 2011/12. Andy Gray and colleagues report that no new health-related legislation was passed during this period but that two health-related Bills are before Parliament namely the National Health Amendment Bill (Bill 2 of 2011) and the Mental Health Care Amendment Bill (Bill 39 of 2012). Secondary and tertiary legislation in the form of Regulations were published for comment or finalised by the Minister of Health, and board notices were issued by statutory health councils. In this chapter attention is paid to legislative barriers with regard to telemedicine and an intellectual property policy released for comment by the Department of Trade and Industry. The authors conclude that despite progress, some critical elements in the field of health policy and legislation remain unresolved.
Malebona Precious Matsoso and Robert Fryatt summarise progress against a plan of action and present future plans for introducing the NHI policy since the launch of the Green Paper in August 2011. In this chapter, entitled National Health Insurance: The first 18 months (Chapter 2), a discussion on the NHI Green Paper and legislative process is presented. This discussion covers management reforms and designation of hospitals; hospital reimbursement reforms; and public health facility audit, quality improvement and certification processes. Progress in implementing the primary health care re-engineering policy is outlined and work to enable provinces to plan, manage, modernise, rationalise and transform infrastructure for public sector hospital infrastructure and equipment is presented. The authors also report on progress in terms of human resources for health, information management and systems support, and provide an overview of progress towards strengthening district health authorities, financing, establishment of the NHI Fund and considerations for accreditation and contracting private providers. A list of five key challenges accompanied by their risks and proposed mitigation is also presented under the headings of ‘consultation and communication’, ‘harnessing cost-effective health technology’, ‘making change happen’, ‘building up knowledge on what works’ and ‘retaining the focus on equity’. A number of case studies are presented and the authors conclude that universal coverage is no longer merely a dream for South Africa.
Chapter 3 heralds a shift in focus from legislation and financing to service delivery-related matters and focuses on HIV Treatment in South Africa: The challenges of an increasingly successful antiretroviral programme. South Africa has the largest number of people with HIV in the world and now has the largest and possibly the most ambitious antiretroviral (ART) programme globally. The author, Francois Venter, examines political, policy, programmatic and other issues entailed by the initiation and expansion of the South African ART programme and frames most of his discussion within three politically related eras spanning the period 2004
Editorial

viii SAHR 2012/13
to 2012. The role of non-profit organisations and civil society is also discussed, with mention of the role of activism, litigation and negotiations at all levels in the ultimate development of a successful widely implemented and supported programme. Francois Venter highlights successes – such as statistics showing that 2 million people were accessing ART at the end of 2012; a shift to improved treatment regimens; good viral suppression; retention in care and clinical outcomes; an increase in life expectancy attributed to increased access to ART; and a reduction in the national mother-to-child transmission of HIV rate from 30% to below 3%. Despite the undoubted gains, mostly made during the post-2008 era when a new political dispensation and subsequent reorientation and scale up of the programme occurred, the South African government still faces a number of challenges. The cost and scale of the programme, evolving HIV treatment guidelines, the failure of past and current prevention programmes, the need to continuously integrate HIV with TB and antenatal services, and the implications of adopting a ‘treatment as prevention’ programme in South Africa are also discussed. Good governance is required and the author highlights that provincially, with the exception of one province, poor financial and programme planning have proven to be major obstacles to seamless implementation and scale up. The chapter emphasises in its conclusion the need for strong medicines supply and service delivery systems which, if weak, can threaten the ongoing expansion of the treatment programme. Government is challenged to consider thinking creatively about how to best manage HIV as a chronic disease through developing systems that will facilitate ongoing disease monitoring and reducing the number of health facility visits.
Chapter 4 explores output 2 of the NSDA and is entitled Maternal, Newborn and Child Health. Lesley Bamford reports that, although South Africa continues to experience unacceptably high rates of maternal, newborn and child mortality, a decline in the under-five and maternal mortality ratio has been observed. The chapter provides an overview of global and national commitments and strategies aimed at improving the health of mothers, newborns and children, and discusses progress towards implementing priority interventions as outlined in the first National Maternal, Newborn, Child and Women’s Health and Nutrition (MNCWH&N) Strategic Plan. An overview of global mortality rates and trends, including the primary causes of mortality within the groups under review is provided and the author attributes mortality in children to undernutrition. Evidence shows that increased coverage of proven interventions should specifically be aimed at the poorest and most disadvantaged children to overcome the increasingly observed disparity in mortality between the wealthiest and most deprived quintiles. Thus four international commitments and strategic documents are discussed, including the global strategy for women’s and children’s health that sets out key areas where action is urgently required for financing, policy and service delivery improvements, to the global strategy for elimination of new HIV infections among children. This strategy aims to reduce the number of HIV-related maternal deaths and to reduce the number of new childhood HIV infections. Eight local commitments and interventions are also presented, which range from a number of related strategic documents to the Tshwane Declaration to promote exclusive breastfeeding. In an attempt to track progress in implementing key interventions and programmes, Bamford presents the package of priority maternal and child health interventions as outlined in the MNCWH&N Strategic Plan, highlighting the 56 essential interventions that – when implemented
in packages relevant to the local setting – are most likely to save lives. The chapter concludes with a caution that without the needs of the health system being addressed, which include increasing the availability of adequate numbers of well-trained healthcare workers at facility and community levels; strengthening monitoring and evaluation systems; addressing equity; increasing accountability; and ensuring that all the components of the MNCWH&N Strategic Plan are implemented, South Africa will not attain the goals it has set for itself.
Occupational health comes under the spotlight in Chapter 5, where Shahieda Adams and colleagues take an interesting look at two occupational populations for which the National Department of Health has legal responsibility, namely healthcare workers at risk of contracting tuberculosis, including multidrug-resistant TB, and former mineworkers with occupational lung disease due to exposure to hazardous dust. The Department’s responsibility towards the former group is as an employer, and for the latter group it bears legal responsibilities for examination and compensation. The authors express their concern at the rising incidence and prevalence of multi-drug-resistant and extremely drug-resistant TB in healthcare workers. Global and local policies, statutory provisions and local institutional frameworks for managing TB among healthcare workers are presented but it is stressed that no uniform national strategy that actively supports TB risk management and limited active enforcement of current regulations exists. They argue that greater emphasis on intensified case finding and isoniazid prophylaxis and improved infection control is required for healthcare workers. For former mineworkers, the authors specifically discuss the problem of the failure of statutory examination and compensation systems for occupational lung disease. They question what the appropriate health system response to the combined silica/silicosis and TB epidemics should be, given that in the case of mineworkers these conditions have their roots in the private mining sector yet become the problem of the public sector. In response a review of key legislation that touches on the management of lung diseases in mineworkers, access to benefit medical examinations by former mineworkers, and claims management are presented. The chapter concludes with a range of recommendations, a central one of which is instituting measures to hold the mining industry accountable for reducing the root causes of the epidemic (the risk of exposure to silica dust at source) and for legal, financial and managerial reforms of compensation systems.
A key component of the district health system is the community and in South Africa, as has been reflected in many chapters of this Review, civil society has played and continues to play a pivotal role in shaping health policy, particularly in the era of HIV and AIDS. Kerry Cullinan, in the chapter entitled Citizen Reporting on District Health Services (Chapter 6), describes an innovative pilot project conducted in half of the NHI pilot districts that is aimed at reporting on health conditions at the district level in order to improve service provision. The underlying premise is that where political structures fail in the area of service delivery, collective citizen action (‘social accountability’) by or on behalf of the poor will spur policymakers and service providers into action. Numerous national examples of media-driven social accountability through the use of citizen journalists are presented and a description of the initiative is provided. The author states that this form of reporting will create more opportunities for district-level grievances and successes to be profiled and to be given the attention they deserve.

SAHR 2012/13 ix
Chapters 7 to 10 shift the reader’s focus to social and environmental determinants of health, and cover injuries, violence and alcohol; non-communicable diseases; and climate change. Mainstreaming the Social Determinants of Health in South Africa: Rhetoric or reality? is the seventh chapter in this Review. Here Laetitia Rispel and Sara Nieuwoudt draw from a range of government policy documents and budget speeches, as well as key informant interviews, and present an analytical perspective on the social determinants of health in South Africa. The chapter gives an overview of key global developments, including the 2008 Commission on Social Determinants of Health report. The authors report that locally, the NSDA recognises the importance of addressing the social determinants of health with some determinants linked to explicit actions, whereas the linkages in other policies are less clear. Furthermore, details on specific areas and mechanisms for intersectoral collaboration are not described in any of these policy documents. Their discussion on local action, highlighting progress and challenges made with regard to addressing the social determinants of health, provides a detailed analysis of the extent to which the determinants are reflected in the 2012 national and provincial budget speeches with a specific focus on intersectoral governance structures and corresponding governance actions. The authors conclude that rhetoric on the social determinants of health in South Africa exists in policy and at national and provincial levels with structural mechanisms ranging from narrow bilateral departmental arrangements to integrated planning approaches. The lack of prioritisation of intersectoral initiatives, however, casts doubt on government’s capacity and ability to make substantial and measurable progress in this regard. Key barriers to intersectoral action and to addressing the social determinants of health can be characterised as being related to legislative and policy design, governance and leadership, gaps between policy and implementation, lack of or insufficient resources and resourcing, and lack of monitoring and evaluation. The chapter concludes with a call to learn from local and international experiences in order to thrust South Africa beyond rhetoric and lists a set of proposed activities to this end. Finally, there is also a call for more research evidence on the social determinants of health, as well as for a more critical discourse and focus on overcoming inequities.
Joanne Corrigall and Richard Matzopoulos, in Chapter 8, on Violence, Alcohol Misuse and Mental Health: Gaps in the health system’s response, continue the discussion for the need for better intersectoral collaboration and make the point that the leading causes of disease burden in South Africa are inextricably linked. The authors provide evidence to support this claim. In their discussion of the interrelationship between alcohol abuse, violence and mental ill health the association between the three are explored. They attribute gaps in the health services to a lack of governmental recognition and prioritisation of the multi-directional links between the ‘triad’ as presented above which have knock-on effects of poor data availability, policies and interventions that can address these problems in an integrated manner. Other gaps relate to under-resourcing of the health system, the under-detection and inadequate management of these conditions within healthcare settings, and decreased access that results from a range of logistic-, cultural- and knowledge-related barriers. Surveillance is identified as a key component in supporting the identification and management of these public health problems; in particular, the institutionalisation of an injury mortality surveillance system. The authors present a case for better intersectoral responses within the health sector and
between relevant sectors, given the nature and overlap of the risk factors for violence, alcohol abuse and mental disorders. They present an example of an integrative approach at a national level – the establishment of the Inter-Ministerial Committee on Combating Substance Abuse in 2010 – and propose the establishment of a similar committee that will provide a joint platform for the three public health priorities with oversight provided at the highest level; that is, the Cabinet.
Non-communicable diseases have increasingly become a topic of debate given their contributions to rising morbidity and mortality rates both globally and locally. Thandi Puoane and colleagues in their chapter on Chronic Non-communicable Diseases in South Africa: Progress and challenges (Chapter 9) describe the current status of chronic non-communicable diseases and the key drivers of these in South Africa, and provide a five-year overview of local policies and practices. In South Africa, non-communicable diseases account for 37% of all-cause mortality and 16% of disability-adjusted life years. South Africa has shown commitment to focusing on these diseases through convening a summit in 2011. A strategic plan for non-communicable diseases is also under development. The chapter focuses on the ‘big four’ non-communicable diseases – heart disease, cancer, type II diabetes and chronic obstructive pulmonary disease – with a focus on their risk factors as presented within a framework ranging from biological, behavioural (e.g., tobacco use, obesity, physical inactivity, alcohol misuse), and societal (e.g., employment, poverty, education, accommodation, socio-economic status and behavioural risk factors) to structural and environmental (e.g., food environment, marketing of unhealthy products and behaviours) determinants. A range of policy responses is discussed, examples of initiatives and programmes targeting chronic non-communicable disease in South Africa are presented. A list of population-wide interventions to promote healthy diet, physical activity, and a healthy environment that the South African government should consider is included. The authors conclude that a wide range of interventions should be targeted at the broad range of determinants (e.g. individual and societal) with a specific focus on the development of policy responses to address the structural environment.
Jonathan Myers and Hanna-Andrea Rother discuss the Public Health Impact of and Response to Climate Change in South Africa in Chapter 10. They reflect on recent global declarations in the field of climate change and health and present key concepts and definitions that serve to frame their discussion on the potential impact of climate change on health in the country. Attention is paid to South African public sector responses to climate change and health with a review of what is being done at a national and provincial level. The authors conclude with a discussion on the barriers and enablers to the implementation of climate change interventions and underline the need for enhanced knowledge and understanding of the potential impacts of climate change on health in South Africa, particularly on the existing burden of disease. This requires the modelling of local climatological data to understand the health-equity implications of these changes. It also requires use of and access to mortality and morbidity data at the lower levels so that ‘climate scenarios’ can be produced. Transversal and cross-sectoral collaborations are proposed as being key to successful policy development and implementation. Research, development and collaborative work between academic health institutions and the health system, which focuses on the link between climate change and its potential impact on South Africa’s burden disease, are called for.

x SAHR 2012/13
Governance and leadership is a key building block of the health system. Chapters 11 to 13 touch on the national research system in South Africa; a university perspective of health policy and systems research; and leadership and management at sub-district level.
Given the inclusion of research and development strengthening in the 2009 to 2014 South African 10 Point Plan, Flavia Senkubuge and Bongani Mayosi, in Chapter 11 on The State of the National Health Research System in South Africa, present an assessment of the performance of the national health research system as envisaged by the Health Research Policy of 2001. The authors state that evidence shows that large economic return on investments can be observed when medical research is invested in at country level, and that global commissions have shown that health research is not given its rightful place in improving health, equity and development in low- and middle-income countries. A key recommendation is given by the authors that the latter countries spend at least 2% of their health programme budgets on health research, with donors adding at least 5%. In this chapter a framework for assessing national health research systems is used to determine the state of the South African national health research system with a focus on stewardship, financing, creating and sustaining resources, and producing, synthesising and utilising research. It is noted that because of declining investigator-initiated original clinical research over the past few years, South Africa should revitalise clinical research. Seven challenges and recommendations for the revitalisation of the health system are presented. These are increasing the financial allocation to health research; increasing funding to increase the number of relevant human resources; investing in health research facilities and infrastructure; creating of a National Priority Health Research Fund to stimulate new and innovative research and address key health system priorities; developing a National Regulatory Framework; establishing a planning, coordination and translation of research findings body; and finally ensuring the institution of national mechanisms for monitoring and evaluation of research conducted in the country.
Chapter 12, Health Policy and Systems Research: Needs, challenges and opportunities in South Africa – a university perspective, provides a South African higher education perspective on the growth of the field of health policy and systems research in response to the increasing international recognition of the need to deliver cost-effective health interventions within a strengthened health system. Marsha Orgill and colleagues list the key milestones in the development of the field and provide basic definitions and seek to frame health policy and systems research within the broader terrain on health research in general. They present three health policy and systems research groups located within higher educational institutions and a capacity assessment of these. The authors also set out the findings of a Public Health Association of South Africa pre-conference health policy and systems research workshop and discuss the challenges facing future local development of this field, at individual, organisational and system levels. The authors argue that this form of research, which adopts a ‘systems thinking’ approach, has a multi-disciplinary base that encompasses both social science and more traditional health research perspectives. They also propose that more research with a systems focus rather than an intervention focus is required, with a need to understand what policies mean, how they will impact on and reshape health systems functioning and to continuously learn from implementation.
Of importance is the need for research to ask questions such as why implementation fails and what it is that guides implementation at service delivery levels. Interrogating the roles of power and politics, among other things, is also needed. They conclude with a call to establish a community of practice for sharing and engagement across projects and institutions.
An exploration of the complexities and challenges of managing a sub-district and framing a debate on the role of districts and sub-districts using systems thinking and management theory with regard to strategic policy direction setting and operational service implementation is presented in Chapter 13, entitled Crises, Routines and Innovations: The complexities and possibilities of sub-district management. Soraya Elloker and colleagues present a case study on an action-learning project in a South African sub-district with a specific focus on leadership and management. The authors focus on the intangible software of the health system such as relationships, communication practices, values and norms and its role in determining the behaviours of those working in the health system and the location of organisational practices and routines within this software dimension. Three innovations for galvanising actors at the sub-district level and for building capacity to improve routines and relationships are presented: developing pro-active management; developing local service-improvement priorities; and generating local knowledge, priorities and action. The authors conclude that numerous competing demands, actors, existing organisational cultures and legacies undermine progress towards decentralisation and innovation and highlight the influence that organisational software has in this sphere. Ultimately, managers are expected, and should be willing and able, to manage in ‘calculated chaos’, hence management and leadership development programmes should focus on developing the software elements as well as technical skills and capacities.
Medicines, vaccines and technology are key building blocks and hardware of health systems. There is, however, a tendency to neglect the importance of these elements and supporting processes when key health system success factors are under discussion – in particular those related to procurement and management of these elements. In Chapter 14, Bada Pharasi and Jacqui Miot seek to shed light on Medicines Selection and Procurement in South Africa with a focus on these components in the 1996 National Drug Policy. The authors focus on medicines selection in the private sector; in particular, medicine formularies and guidelines and selection of medicines under prescribed minimum benefits. Standard treatment guidelines, the essential medicines list and the role of the pharmacy and therapeutics committees in the public sector, are discussed. The shift towards medicines procurement centralisation with the establishment of the Central Procurement Agency in 2011 and the Department of Health taking over the management of medicines tenders from the National Treasury are discussed. The authors emphasise the importance of applying evidence-based medicine, pharmacoeconomics and budget impact analysis when selecting medicines and that a coherent approach is required – especially in preparation for NHI. They highlight, however, that more attention needs to be given to medicine supply chain management at lower levels in the health system, particularly at the district level. They call for a monitoring and evaluation plan to measure the impact of the National Drug Policy’s implementation and for a national review of implementation thus far.

SAHR 2012/13 xi
Health Systems Trust is committed to developing young health policy and system researchers who work within the broad field of public health. Creating a space to hear these voices and to provide a platform for the introduction of new ideas, research and perspectives is considered to be crucial for expanding the body of public and private health sector and system researchers. To this end, we proudly launch the Emerging Public Health Practitioner Voices series. In the second half of 2012, we introduced the Emerging Health Practitioner Award and called for young and emerging public health practitioners under the age of 35 to submit a well-written and comprehensive piece of work that (1) bears relevance to the local and international public health community and current policy environment, (2) has a degree of innovation and originality, (3) identifies good practices and hindrances to policy implementation and (4) is scientifically rigorous and intellectually clear. Through a process of anonymous peer review two articles submitted for consideration in 2012 were assessed as being worthy of inclusion in this year’s SAHR. These are presented below.
Nadia Hussey, a medical student at the University of Cape Town, takes a closer look at the effects of language barriers on the access patients and communities have to quality health care. Her chapter, entitled The Language Barrier: The overlooked challenge to equit-able health care (Chapter 15), provides an insightful glimpse into the challenges language barriers pose to work efficiency and holistic treatment. She presents a case study of Madwaleni Hospital in the Amathole district in the Eastern Cape and explores current language difficulties, methods of overcoming these barriers, and proposes future broad health system solutions touching on effective translation and interpretation models. She discusses the need for developing a culture of multilinguism, through adopting a bilingual worker model, and explores the ‘explanatory model’ approach. In this approach a patient’s personal and cultural experience of illness is addressed in order to gain an understanding of the patient’s personal and cultural experience of illness in an environment where language barriers preclude easy understanding of the patient’s condition and perception of disease.
The author draws attention to the absence of language as a component in key health sector reform policies, despite it being mentioned in the Patients’ Rights Charter and the National Health Act (Act 61 of 2003). She also asserts that health promotion, prevention and community involvement cannot succeed without engagement in a dialogue in the language of the patient. Finally, she calls for the application of a multifaceted solution to ensure provision of multilingual healthcare in a multilingual society.
Adeleke Oluwatoyin, in Chapter 16, writes on the Barriers to Implementation of Tuberculosis Infection Control among South African Healthcare Workers. This author, from the School of Public Health and Family Medicine at the University of Cape Town, provides an overview of health system factors that influence health worker performance in implementing tuberculosis infection control in primary care clinics at district level. This chapter, which complements Chapter 5’s presentation of occupational health challenges facing the Department of Health, provides a closer look at the barriers and enablers to implementing tuberculosis infection control and discusses how lessons learned from the work presented in this chapter could influence health policy reform and inform managers about ways in which health-worker performance could be improved in high-risk settings. The work, based on the author’s
own research, lists the enablers of tuberculosis infection control implementation among health workers to be availability of resources in the form of infrastructure, human resources and consumables, leadership, supervision, collective practice and screening for TB in healthcare workers. Key barriers were identified as being non-proactive use of respirators, healthcare worker perceptions of tuberculosis concentration in certain sections of clinics, non-responsive compensation policies, patient non-compliance, issues pertaining to prioritising prevention activities, and training deficits. From a policy perspective, bureaucratic compensation delays were highlighted as a major barrier to building trust in the health system. Mechanisms to address these barriers were identified as key future areas for research.
Finally in Chapter 17, Candy Day and Andy Gray present key Health and Related Indicators. A comprehensive range of routine and non-routine data are presented and for each section that authors discuss recent developments. The content includes demographic, socio-economic, health services and health financing indicators. Provincial maps, colour graphs and indicator definitions are also included.
As South Africa focuses on the implementation of the many recently developed policies aimed at reforming the healthcare system and strives to move as close as possible to achieving the Millennium Development Goals (MDGs), it is perhaps also prudent to think about how the health sector will position itself in the post-2015 development agenda. Key issues are likely to be how to respond to the unfinished MDG health agenda, as many countries – including South Africa – will not meet the MDG goals for 2015. The changing agenda for global health that has been identified by the United Nations involves moving away from addressing disease-specific issues to a more equity- and social-justice-oriented approach that is rooted in the concept of understanding health as an indivisible human right that cannot be realised without tackling the economic, social and environmental determinants of health. In this regard, issues such as universal health coverage, addressing non-communicable diseases and ensuring access to services from an equity perspective will feature more prominently on the global health agenda. Attention is also likely to be focused on health in the context of sustainable development, where health is understood as both a potential beneficiary of and a contributor to sustainable development. Improvements in the physical environment and the implementation of mitigation and adaptation strategies to reduce the effects of climate change, for example, can result in reduced burdens of infectious diseases. In the case of health being understood as contributor to sustainable development, gains in implementing initiatives such as universal health coverage and fostering a more healthy population can contribute to poverty reduction and increased economic growth, resulting in progress towards creating sustainable livelihoods. This year’s edition of the Review has begun to cover many of these issues and will continue to do so in future editions.
René English and Ashnie Padarath
Health Systems Trust

xii SAHR 2012/13

SAHR 2012/13 1
Legis
latio
n a
nd
Fin
ancin
g

SAHR 2012/132
Legis
latio
n a
nd
Fin
ancin
g

Authors:
3SAHR 2012/13
1111111
Andy Grayi Yousuf Vawdaii Caron Jackiii
i Discipline of Pharmaceutical Sciences, University of KwaZulu-Natalii School of Law, University of KwaZulu-Nataliii Discipline of Telemedicine and Telehealth, University of KwaZulu-Natal
The statute books reflected no new health-related legislation passed in 2011/12. Only two health-related Bills are currently before Parliament – the National Health Amendment Bill (Bill 24 of 2011) and the Mental Health
Care Amendment Bill (Bill 39 of 2012).
On the basis of the deliberations before the Portfolio Committee on Health, extensive amendments to the National Health Amendment Bill can be expected. This Bill will introduce the Office of Health Standards Compliance as an independent structure outside of the Department of Health. However, the means to ensure its independence are still being debated.
The major policy focus remains the planned introduction of National Health Insurance, for which a Green Paper was released for comment in August 2011. The Green Paper has been criticised for lacking many critical details, and the White Paper is eagerly awaited.
In terms of secondary legislation, the most controversial is probably the draft Regulations issued in terms of the Tobacco Products Control Act. There has been no obvious progress in implementing the Medicines and Related Substances Amendment Act of 2008, and the 2011 draft Bill (containing further amendments) has not yet been tabled in Parliament. Despite this, the South African Health Products Regulatory Authority is expected to be in operation by April 2013.
Health Policy and Legislation
The major policy focus remains the planned
introduction of National Health Insurance. A Green
Paper was introduced in August 2011 and a White Paper is eagerly awaited.

4 SAHR 2012/13
Introduction
As in 2010-2011, the statute books reflected no new health-related legislation passed in 2011-2012. The list of laws for which the Minister of Health bears responsibility therefore remains as catalogued in the corresponding chapter of the South African Health Review (SAHR) of 2011.1 The 2010-11 Annual Report of the National Department of Health (NDoH) also provides an extensive listing of the non-health-related legislation with which the NDoH (and, by extension, the health system) is expected to comply.2
This chapter focuses on those health-related legislative instruments that have been the subject of change since 2011. In the main, they are secondary and tertiary legislation, in the form of Regulations published for comment or finalised by the Minister of Health, or Board Notices issued by statutory health councils. Given the ire that telemedicine has raised in recent years, an elaboration of the legislative barriers to the practice of telehealth and, in particular, electronic prescribing is provided. In addition, the effect of intellectual property law on access to medicines and other health technologies and the expected policy developments in this space are covered in some detail. A number of court actions of relevance to health are also covered.
No new provincial health legislation has been produced in the period under review and, as before, no review of health-related municipal by-laws has been attempted in this chapter. In terms of new policy, few documents were issued in 2011-2012, and attention is still firmly focused on the promised White Paper on National Health Insurance (NHI).
Health-related legislation
The National Health Act3
Efforts to redirect South Africa’s health policy are underway, with the introduction of a form of National Health Insurance (NHI). A final policy document, in the form of a White Paper, is believed to be imminent.
Much attention has been paid to the process of ‘piloting’ the NHI policy in 10 selected districts, across all nine provinces. The NDoH’s Annual Performance Plan 2012/2013 explains the intended process clearly.4 The draft NHI policy document, approved by Cabinet, was published for public comment in the form of a Green Paper in August 2011.5 The initial two-month comment period was extended to the end of December 2011.6 The NDoH Annual Report documents the extensive feedback received in response to the Green Paper following its release for comment on 12 August 2011. In addition, the Department arranged a two-day national health consultative forum in December 2011, in the form of the National Health Insurance Conference. Additional community dialogues on the NHI Policy are also planned for 2013.
The Green Paper proposes that the NHI should be implemented “gradually in three phases over a 14-year period starting in 2012”. The first phase (five years) involves “policy and legislative reform, strengthening of the health system, improving the service delivery platform and piloting various components of the NHI”. The Department has specifically recognised that an important prerequisite for the NHI will be the strengthening of the public health system:
In the first five years strengthening of the health system in preparation for the full roll-out of the NHI will focus on improving the management of health facilities and health districts including hospital CEOs; quality improvement; infrastructure development; improvements to medical equipment and supplies; human resources planning and development; information management and system support; and in the latter years of the first phase, the establishment of the NHI Fund.
The initial focus of the 10 selected pilot districts is therefore predominantly on the functioning of the public sector, rather than on the integration of the public and private sectors that will be necessary once the NHI Fund is in place – “The pilot districts will test innovations that are necessary for implementing the NHI whilst also strengthening the functioning of the district health system”.4
Each pilot district aims to develop systems and frameworks that will enable the implementation of the NHI. These include establishing district health authorities that will be capable of contracting for services from a range of providers, and strengthening the district health management teams. The business plans for each of the pilot districts are accessible from the NDoH’s website.
Each pilot district also focuses on strengthening health systems. In line with the focus on maternal and child mortality, these systems-strengthening efforts take the form of “re-engineering” interventions: the deployment of district specialist teams, school health teams and municipal based outreach teams. In 2012, the Integrated School Health Policy was issued jointly by the Departments of Health and Basic Education.7 The issues covered by this policy include nutrition and exercise, personal and environmental hygiene, chronic illnesses (including HIV and tuberculosis (TB)), and abuse (sexual, physical and emotional abuse, including bullying and violence). The policy also deals with sexual and reproductive health, menstruation, contraception, sexually transmitted infections (including HIV and AIDS) and male circumcision (including male medical circumcision). In addition, teenage pregnancy, termination of pregnancy, prevention of mother-to-child transmission of HIV, HIV counselling and testing, stigma mitigation and mental health issues (including drug and substance abuse, depression, anxiety and suicide) are covered by the policy.
The Annual Performance Plan also lists other key preparatory steps that are being taken in anticipation of the NHI rollout. These steps include “the establishment of the Office of Health Standards Compliance; the audit of public health facilities aimed at improving quality; appointment of District Clinical Specialist Support Teams; training of Primary Health Care Agents; and improving Information Management and Systems Support”. The first of these requires the passage of the National Health Amendment Bill, which was tabled in late 2011.8 This section 76 Bill (an ordinary Bill that affects the provinces and therefore requires attention by the National Council of Provinces and the National Assembly) has been referred to the Portfolio Committee on Health. The committee was briefed by the Minister of Health and a team from the Department in February 2012. Public hearings were then held on two days in March 2012, and were addressed by a wide range of industry bodies and professional associations. Towards the end of May 2012, the NDoH addressed the committee in response to the submissions made.

Health Policy and Legislation 1
SAHR 2012/13 5
Health Policy and Legislation 1
In the notes of this meeting prepared by the Parliamentary Monitoring Group, it was clear that the major issue in contention was the independence of the proposed Office of Health Standards Compliance (OHSC).9 The Bill aims to substitute chapter 10 of the National Health Act (Act 61 of 2003) with a new version, which creates the OHSC as a juristic body outside of the NDoH.
The Parliamentary Legal Adviser drew the attention of the committee to the 2011 Constitutional Court ruling commonly known as “Glenister”.10 This judgment dealt with the establishment of the Directorate for Priority Crime Investigation (the “Hawks”), which replaced the Directorate of Special Operations (the “Scorpions”), and the extent to which the new structure was truly independent of political influence. Both the Parliamentary Legal Adviser and the Director-General of Health appeared to support the establishment of a governance structure, in the form of a board, to provide oversight for the Chief Executive Officer (CEO) as envisaged by the Bill. On the following day, the Director-General further informed the committee that Cabinet had requested an additional amendment, to change “port health services” from a provincial to a national competence.a
Further deliberations were held in mid-June 2012, again attended by the Director-General. Although a list of amendments agreed to by the committee, which included the creation of a board for the OHSC, was discussed, a new version of the Bill has yet to be issued. As noted by the Parliamentary Monitoring Group, the proposed board was to consist of the:
Chief Executive Officer, the Chief Financial Officer, the Director-General, or an official designated by that person, four members who had specialist knowledge of economics or accounting, legal matters, quality assurance, health research or epidemiology, one member nominated by the national Minister for Trade and Industry, and one representative each from the private healthcare industry, organised labour or civil society or the community.11
Whether this will be sufficient to address stakeholders’ concerns about the independence of this structure, and its ability to resist political influence, remains to be seen. As yet, no firm timeline has been set for the completion of the remaining steps in the legislative process. However, the OHSC is considered to be a key preparatory step towards implementing the NHI and is, therefore, expected to enjoy priority.
The 2010/2011 Annual Report of the NDoH stated that “[d]uring the period under review, we have processed and published 60 regulations to ensure the full force and effect of the National Health Act of 2003”.2 The 2011/2012 Annual Report indicated that 104 Regulations had been produced during the financial year “to provide the legislative framework required to enhance the performance of the health sector”.12 The following final Regulations were issued in March 2012:
➢ Regulations relating to artificial fertilisation of persons;13
➢ Regulations regarding the rendering of a clinical forensic medicine service;14
a Port health services are responsible for the monitoring and evaluation of all foodstuffs, cosmetics, disinfectants, hazardous substances and medicines entering the country through ports and airports. In addition, port health officers are responsible for preventing the entry of contagious diseases such as yellow fever, cholera, plague and Severe Acute Respiratory Syndrome.
➢ Regulations relating to the use of human biological material;15
➢ Regulations relating to the registration of microbiological laboratories and the acquisition, importation, handling, maintenance and supply of human pathogens;16
➢ Regulations relating to blood and blood products;17
➢ Regulations regarding the general conduct of human bodies, tissue, blood, blood products and gametes;18
➢ Regulations relating to the import and export of human tissue, blood, blood products, cultured cells, stem cells, embryos, zygotes and gametes;19
➢ Regulations relating to tissue banks; and20
➢ Regulations relating to stem cell institutions or organisations.21
With these final Regulations in place, a number of sections of the Act that were brought into effect on 10 May 2010, including sections 55, 56 and 68, could become fully operative.22 A commencement notice issued on 27 February 2012 brought sections 11, 35, 41 to 46, 50 to 54, 57 to 67, 71 and 93 into operation from 1 March 2012.23 This means that, apart from those sections being amended, the National Health Act has now been promulgated in its entirety.
Although a detailed description of the extensive provisions included in these finalised Regulations is beyond the scope of this chapter, a number of elements can be highlighted where actions that stem from the new Regulations will need to be taken. The Regulations on artificial fertilisation require the Director-General to “establish an electronic central data bank into which all information regarding gamete and embryo donations is stored” (Regulation 5). These Regulations also limit the number of zygotes or embryos that can be implanted (Regulation 12) and prohibit pre-implantation and prenatal testing for selecting the sex of a child, except in the case of “serious sex linked or sex limited genetic conditions” (Regulation 13).
Clinical forensic medicine services are defined as those required “in the determination of cause and manner of injuries to living victims of sexual assault”. In this regard, the Regulations also create a new advisory structure, the National Forensic Medicine Service Committee, to advise the Minister on policy, norms and standards in this field (Regulations 15 and 16). The Regulation on the use of human biological material permits the use of excess embryos obtained from in vitro fertilisation to produce embryonic stem cell lines, for the purposes of research (Regulation 7). The Regulations regarding the general conduct of human bodies, tissue, blood, blood products and gametes contain an interesting requirement that the registers maintained by recipients of tissues or bodies record the “name, population group, sex and age at the time of death of the deceased concerned” (Regulation 16). This is a rare mention of ethnicity in a post-apartheid legal instrument and may prove challenging to comply with in some circumstances. No rationale for its inclusion has been offered.
A number of Regulations intended to be issued in terms of the National Health Act, which was passed by Parliament in 2003, have not yet been finalised. Some, such as the Regulations intended to deal with “the development of an essential drugs list and medical and other assistive devices list” (as provided for in section 90(1)(d)), have yet to be drafted. A 2008 judgment of the Cape High Court drew attention to the impact of such delays.24

6 SAHR 2012/13
In this case, which dealt with the compulsory admission and continued isolation of extensively drug-resistant TB patients, it was pointed out that the National Health Act did not provide for the powers necessary to effect such admissions and isolation, but that these powers were expected to be dealt with in the Regulations. However, the Regulations were still in draft form only. Although existing Regulations published in terms of the 1977 Health Act were still in place, the court noted that “it was argued, these regulations have become ‘practically unworkable’ due to the repeal of large parts of the previous Health Act” (para 51). Despite finding grounds to order the admission of the respondents of the case, the court noted that “it is undoubtedly preferable that the full statutory and regulatory framework be put into place and implemented as soon as practically possible” (para 58).24
A draft policy document on the management of public hospitals and the accompanying draft Regulations, which relate to categories of hospitals and had been published for comment in August 2011, were issued in final form in March 2012.25,26 The document stipulates the post level for managers of district- (level 12), regional- (level 13), tertiary- (level 14) and central hospitals (level 15). More importantly the document requires that every hospital CEO holds a “degree/advanced diploma in a health-related field”, with a “degree/diploma in management” as an “added advantage”. General requirements for the members of hospital boards are set out, and guidance on selection criteria provided (although these criteria are vague and open to interpretation; for instance, prospective board members are required to “think strategically” and “communicate effectively”).
The classification scheme described in the policy refers to public sector hospitals only (and requires that they be managed in accordance with a policy to be determined by the Minister). The Regulations include two categories of private hospitals (for-profit and not-for-profit). As was noted when the draft versions were published, the Regulations were issued in terms of section 35 of the National Health Act, which requires the Minister to “classify all health establishments”. This is a necessary step before the remaining provisions in chapter 6 of the Act, notably the certificate of need (section 36), can be implemented. The mere designation of private hospitals as ‘for-profit’ or ‘not-for-profit’ would not suffice for this purpose. The certificate of need therefore remains an elusive and, perhaps, abandoned concept.
The National Health Act has been cited in two additional documents. In May 2012, the Minister approved a document entitled “Policy Framework for the Ethics Approval and Endorsement of Health Research by the National Department of Health”.27 Although the framework does not provide any new requirements for researchers, it does summarise the various ethical and regulatory approvals that are required for clinical trials and other research. In June 2012, the Minister established a National Advisory Committee on the Prevention and Control of Cancer to advise him on “all matters related to the National Prevention and Control of Cancer”.28
Tobacco Products Control Act29
Considerable controversy has followed the publication of draft Regulations in terms of the Tobacco Products Control Act (Act 83 of 1993) in March 2012.30 The draft Regulations prohibit smoking in any “public place”, and also in a range of “outdoor public places” such as:
“a) stadiums, arenas, sports facilities, playgrounds, zoos;
b) premises of schools, or child care facilities;
c) health facilities;
d) outdoor eating or drinking areas;
e) venues when outdoor events take place;
f) covered walkways and covered parking areas;
g) service areas and service lines; and
h) beaches where public bathing is permitted, not less than 50 metres away from the closest person near the demarcated swimming area.” (Regulation 2)
In addition, smoking is to be prohibited “within a 10 metre distance from a window of, ventilation inlet of, doorway to or entrance into a public place”. Those in charge of public places or workplaces are to be allowed to designate outdoor smoking areas (Regulation 4), provided that these areas are not “adjacent to an entrance to the premises” or “to walkways and other areas where persons generally congregate or walk”. Such areas are also to be out of bounds for anyone under 18 years of age; may not permit the serving of food or refreshments or the provision of entertainment; and are to have ashtrays installed and cleaned regularly. Smokers are to be discouraged from “remaining in the area longer than is necessary to smoke a cigarette” (Regulation 5). However, public places and workplaces can also be declared smoke free.
Predictably, these draft Regulations have been lauded by the National Council Against Smoking and attacked by the industry and various free market advocates. For instance, the executive director for the Free Market Foundation was quoted as characterising the Regulations as a “vicious assault on people’s lifestyle choices” by “nicotine nazis”.31 The same media report quoted the CEO of the Tobacco Institute of Southern Africa, who noted that the Tobacco Products Control Act 1993 made provision for the Minister to prescribe Regulations for designated indoor smoking areas, but that the draft Regulations prohibited smoking outdoors. The Tobacco Institute of Southern Africa believed this was “not in line with the spirit and purpose of the Act”.
In its response, British American Tobacco South Africa pointed to the expense the hospitality industry had incurred in providing designated smoking areas in public places and stated:
We believe that the government should allow the owners of businesses in the hospitality industry to continue making provisions for adult smokers as they account for a significant percentage of their revenue. That being said, we strongly support the fact that these designated smoking areas must be equipped with adequate air extraction in, for example, nightclubs, bars and cafes.32

Health Policy and Legislation 1
SAHR 2012/13 7
Health Policy and Legislation 1
British American Tobacco South Africa’s Head of Corporate and Regulatory Affairs asked:
In other countries around the world, where indoor smoking has been banned, smokers are allowed to smoke right outside pubs and restaurants. Should the regulation be passed in its current format, this won’t be possible in South Africa (SA) as no-one will be able to smoke within 10 metres of a door or window. Can you imagine how that will impact upon businesses?
Support for the draft Regulations has come from a range of actors, including the South African Medical Association, the Junior Doctors Association of South Africa, the Cancer Association of South Africa, the Heart and Stroke Foundation and the Public Health Association of South Africa.33
A key element of the existing smoking legislation was tested in the courts in 2012.34 A decision of the North Gauteng High Court was upheld by the Supreme Court of Appeal, although with the costs order set aside. This judgment confirmed that the provisions of the Tobacco Products Control Act relating to restrictions on advertising and promotion were constitutional. It was held that the restriction imposed on the right of expression (in the form of commercial speech) was both justified and proportional. The Act prohibits not only the advertising of tobacco products but also the indirect marketing of these products, such as through sponsorships. In particular, SA’s obligations as a signatory to the 2005 Framework Convention on Tobacco Control (WHO FCTC) were emphasised. In this regard, it is worth noting the theme of World No Tobacco Day 2012, which was “tobacco industry interference”.35 In announcing the theme, the World Health Organization (WHO) noted that:
As more and more countries move to meet their obligations under the WHO FCTC fully, the tobacco industry’s efforts to undermine the treaty are becoming increasingly energetic. For example, in an attempt to halt the adoption of pictorial health warnings on packages of tobacco, the industry recently adopted the novel tactic of suing countries under bilateral investment treaties, claiming that the warnings impinge on tobacco companies’ attempts to use their legally registered brands. Meanwhile, the industry’s attempts to undermine the treaty continue on other fronts, particularly with regard to countries’ attempts to ban smoking in enclosed public places and to ban tobacco advertising, promotion and sponsorship. World No Tobacco Day 2012 aimed to educate policy makers and the general public about the tobacco industry’s nefarious and harmful tactics.
Although no draft legislation has yet been developed, there have been indications that the Minister of Health plans to address alcohol-related legislation.36 Speaking in Mpumalanga in March 2012, he stated:
I’m taking over from where Dr Dlamini-Zuma left off ... I’m going to ask Parliament to pass a law that no alcohol adverts be played on TV or radio.37
In the July 2012 issue of the South African Medical Journal, Parry et al. presented the public health case for a total ban on alcohol advertising.38
Medicines and Related Substances Act39
Two issues predominated in relation to legislation pertaining to medicines in 2011-2012: the promised move to establish the South African Health Products Regulatory Authority, and the ongoing medicines pricing interventions.
The Medicines and Related Substances Amendment Act (Act 72 of 2008), which provides for the creation of the South African Health Products Regulatory Authority, has been assented to by the President, but no sections have yet been promulgated.40 Although an external consultant-led task team has been established within the NDoH to facilitate the creation of the new authority, the process followed has been opaque and little visible evidence of progress exists, despite predictions that the authority would be in place by April 2013.
A draft Bill to amend the Medicines Act further was published for comment in March 2012.41 No explanatory text was provided, so the intent of the draft Bill is difficult to gauge. However, one intention seems to be to re-focus some of the key provisions of the Act back onto “medicines” and not the catch-all phrase “products”. This would, presumably, allow for a more directed regulatory process for medical devices, in vitro diagnostic devices and other health products that fall within the ambit of the authority. In this regard, it was notable that the draft Bill extended the remit of the authority to include foodstuffs, cosmetics, and (presumably) disinfectants. As drafted, the Bill states that “[t]he Authority is responsible for the regulatory oversight of cosmetics and foodstuffs as defined in terms of the Foodstuffs, Cosmetics and Disinfectants Act, 1972 (Act 54 of 1972)”. Accordingly, a “health product” is redefined as being “a medicine, scheduled substance, medical device, IVD, cosmetic or foodstuff”.
Little clarity is provided in the draft Bill about the modus operandi of the proposed authority. The authority is merely re-positioned as “an organ of state within the public administration but outside the public service”. As a result, the draft Bill provides that the following components of the NDoH will cease to exist and “together with their employees be incorporated into the Authority”: the Cluster Pharmaceutical, Trade and Product Regulation; the Directorate Radiation Control; the Directorate Health Technology; and the Directorate Food. The balance of the transitional arrangements in the Bill deal with labour and tax issues, applications for registration of medicines in process at the time of the transition, moveable assets and monies owed.
No advisory structures are mentioned in the Bill other than the committee provided for in section 4 of the Act, as amended by the 2008 Amendment Act, which is to “advise or act as a consultative body for the Minister and the Authority on matters concerning corporate governance of the Authority”. It has been suggested that national and international best practice requires an independent board located at the centre of the corporate governance framework.42 This requirement should not be left to be inserted by means of Regulations, but should be integral to the Act itself. However, in other medicines regulatory authorities, extensive use is made of expert committees, which can advise the staff on technical issues. The US Food and Drug Administration, for instance, has advisory committees on human medicine, veterinary medicine, blood, vaccines and biological products, food, medical devices

8 SAHR 2012/13
and radiation-emitting products, and tobacco, among others. The extent to which such advice is binding on the authority and the extent to which it is made public are key design elements of the system.
One of the most important enabling changes in relation to the proposed authority will be in the scale of fees charged. The 2008 Ministerial Task Team report recommended a 50% cost recovery in the form of fees. It was therefore notable that the fees charged for a number of items in terms of the existing legislation were increased markedly in July 2012.43 For example, the fees for generic medicine registrations were increased from R12 500 to R25 000 per application, new licence fees for manufacturers from R3 500 to R20 000, and renewals from R3 500 to R17 500. The inspection fees for international manufacturing sites were increased from R400 per hour to R3 600 per hour.
Perhaps linked to the delay in instituting the authority, no final versions of the draft General Regulations to the Medicines Act – issued for comment in July 2011 – have been issued. These were to establish a regulatory system for the assessment of medical devices and to amend the existing General Regulations.44,45 As was noted in the 2011 issue of the SAHR, while some of the proposed changes were uncontroversial, the change that created a new definition for “complementary medicine” was likely to be contested by some actors.1 No progress was apparent in 2011-2012, beyond an extension of the period allowed for submission of comments (to 30 November 2011).46
The medicines pricing system has also continued to evolve. In January 2012, the Minister set the maximum increase for single exit prices for the year at 2.14% and stipulated the information that was to be submitted by manufacturers and importers in relation to their single exit prices.47,48 The information provided was then used to populate the medicines price database maintained by the NDoH. In relation to the challenging issue of regulating dispensing fees in the private sector, the Minister published a notice in July 2011 that called for the submission of prescribed data by pharmacists, for the annual review of the dispensing fee.49 In June 2012, the Minister decided, on the recommendation of the Pricing Committee, that because of the poor response about expenditure information “a determination regarding a revised fee for 2012 could not be conducted”.50 Comment on this decision was invited within three months, with a promise that the issue would receive priority in 2013. The Minister also warned that this “requires co-operation from pharmacists with regards to supply of relevant information relating to dispensing”.
Also related to medicines pricing, the Minister published another set of draft Regulations in July 2012, which provided further details on what would be considered a “bonus system, rebate system or any other incentive scheme”.51 This attempt to remove perverse practices that had emerged since the introduction of the single exit price was broadly welcomed. More details were also provided on what would be covered by the logistics fee, and a definition for a “logistics fee cap” was introduced. The logistics fee relates to a proportion of the single exit price that is paid by manufacturers to logistics service providers (wholesalers and distributors). At present, while the medicines price database shows a logistics fee for each medicine, this amount is not available to all logistics service providers. The actual fees paid are not transparent and are
negotiated between each manufacturer and each logistics service provider.
No finality has been reached in relation to two draft Regulations issued in December 2010 (in relation to the methodology for international benchmarking of medicine prices)52 and March 2011 (in relation to capping the logistics fees).53
Foodstuffs, Cosmetics and Disinfectants Act54
Despite the signalled move to the new South African Health Products Regulatory Authority, considerable action has taken place in relation to the regulation of foodstuffs. In October 2011, the Minister issued Regulations that prohibited the manufacturing, importation, export and sale of polycarbonate infant feeding bottles containing bisphenol A, on the basis of toxicity concerns.55 Three sets of draft Regulations have also been issued for comment: these relate to the use of sweeteners in foodstuffs,56 to foodstuffs for infants and young children,57 and to reducing the sodium content of a range of foods – including bread, butter spreads and processed meats.58 Each can be seen as an extension of an existing policy, such as promoting breastfeeding and addressing the contributory causes of non-communicable diseases. The restrictions on the marketing of breast-milk substitutes and infant foods were issued in final form in early December 2012.59 In essence, these bring local regulation in line with the intent of the International Code of Marketing of Breast-Milk Substitutes, which has been in place for more than 30 years.
Mental Health Care Act60
Late in the 2012 Parliamentary term, a Bill was introduced to amend the Mental Health Care Act (Act 17 of 2002).61 The provisions of the Bill are technical in nature and do not appear to be controversial. The Bill’s first aim was to enable the Director-General of the NDoH to delegate certain powers to officials within the NDoH in relation to the care of involuntary healthcare users. For example, this might entail the transfer of state patients from detention centres to health establishments, as ordered by a court. The second target of the Bill might be referred to as “house-keeping”. When the Mental Health Care Act was first passed in 2002, the laws repealed in terms of section 73 of the Act included the Mental Health Care Act (Act 8 of 1973), but not chapter 8 of that Act. Chapter 8 of the 1973 Act dealt with the establishment and operation of hospital boards. As these functions are now covered by chapter 6 of the National Health Act, the 2012 Amendment Bill aim to repeal the remaining chapter of the 1973 Act. This Bill is expected to be handled by Parliament in terms of section 75 of the Constitution, as an ordinary Bill not affecting the provinces.
Statutory health councils
No major changes to the primary legislation governing professions registered with the various statutory health councils occurred in the period under review. However, a steady stream of secondary and tertiary legislation was issued, in the form of Regulations and Board Notices.

Health Policy and Legislation 1
SAHR 2012/13 9
Health Policy and Legislation 1
Health Professions Council of South Africa
A large number of draft and final Regulations relevant to the Health Professions Council of South Africa (HPCSA) and the Health Professions Act were issued by the Minister of Health. These included:
➢ Final Regulations relating to the qualifications for speech therapists, audiologists and hearing aid acousticians;62
➢ Final Regulations on the scope of the profession of psychology;63
➢ Draft Regulations defining the scope of the profession of audiology;64
➢ Final Regulations relating to the qualifications of dental assistants;65
➢ Draft Regulations relating to the qualifications of environmental health officers;66
➢ Draft Regulations relating to the education of audiologists;67
➢ Draft Regulations relating to the education of speech language therapists;68
➢ Final Regulations relating to the registration of various categories of medical technicians;69,70,71
➢ Draft Regulations defining the scope of the profession of environmental health officers;72
➢ Draft Regulations relating to the registration of speech language therapy students;73
➢ Final Regulations relating to the registration of intern psychologists;74
➢ Final Regulations relating to the registration of student dental assistants75 and defining the scope of their profession;76 and
➢ Final Regulations relating to the qualifications of biokine-ticists.77
In 2012 the HPCSA gazetted Board Notices in relation to the registration of additional qualifications for speech therapists and audiologists,78 and for medical practitioners and dentists.79 While each of these pieces of secondary and tertiary legislation provides an important part of the mosaic of health professions regulation, no wide-ranging changes to existing scopes of practice or educational processes have been made.
South African Pharmacy Council
Few new documents have been issued in relation to the South African Pharmacy Council (SAPC). Final versions of the draft Regulations on continuing professional development, published for comment in May 2011, have not yet been issued.80 Also no apparent progress has been made in the planned introduction of a new category of authorised pharmacist prescribers, and new categories of pharmacy support personnel (to be termed “pharmacist’s assistants”, “pharmacy technical assistants” and “pharmacy technicians).81,82
In addition, no finality has been reached in the dispute between the NDoH and the SAPC in relation to the dispensing of prescriptions written by health personnel other than medical practitioners and dentists. This has also now affected the new cadre of clinical associates, with the SAPC issuing an official statement to the effect
that any prescription written by such a person will have to be signed in person by a medical practitioner before it can be dispensed by a pharmacist.83 This will limit the usefulness of clinical associates and place an added burden on the medical officers with whom they work. This issue was not, however, raised in a review of the clinical associate programme published in November 2012.84
South African Nursing Council
As was highlighted in the 2011 issue of the SAHR, there has been considerable confusion over prescribing and dispensing by nurses.1 Without the necessary Regulations to allow for the operation of section 56(1) to (5) of the Nursing Act (Act 33 of 2005), the only mechanism available to enable nurses to prescribe remains that provided by section 56(6). In accordance with the transitional arrangements, any nurse issued with a section 38A permit in terms of the 1978 Nursing Act can continue to practise as enabled by that permit, and the Regulation that covered such permits is still used in relation to section 56(6) permits.85 The draft Regulations published for comment in December 2011, which deal with prescribing and dispensing, were therefore an important step.86
A problem exists in that the draft Regulation has conflated these two parts of section 56 and is therefore not in accordance with the requirements of either. Instead of specifically dealing only with the requirements for a nurse to be authorised in terms of section 56(6), draft Regulation 3 includes elements that appear to be more relevant to section 56(1) to (5). These elements include the requirement for “proof of payment as outlined in section 58(1)” and “evidence of requisite training and competency achieved”. Section 56(6) of the Nursing Act makes no mention of training or competency, only the place of employment. In the past, nurses issued with section 38A permits were given in-service training, but were not required to have completed any designated qualifications.
Section 56(6) also starts with the clear statement that it must be read “[d]espite the provisions of this Act, the said Medicines and Related Substances Act, 1965, the Pharmacy Act, 1974 (Act No. 53 of 1974), and the Health Professions Act, 1974 (Act No. 56 of 1974)”. This statement has been interpreted as allowing a nurse who operates in terms of this section to dispense medicines to her own patients, without having to hold a section 22C(1)(a) dispensing licence. This was certainly the case with nurses authorised in terms of section 38A and informed the design of the 1984 Regulations. However, sub-regulation 4(1) demands that a nurse, in order to be authorised, “[h]olds a relevant qualification in terms of section 56(1) of the Act” and “[h]as successfully completed a relevant dispensing course that is accredited by the South African Pharmacy Council”. A nurse who is not an authorised prescriber in terms of the Medicines Act (i.e. has not been deemed competent by the Nursing Council) cannot complete the dispensing course approved by the Pharmacy Council and cannot apply for a dispensing licence.
Draft Regulation 10 required the authorising person to keep a re- gister of such authorisations and to provide this to the South African Nursing Council (SANC) each year. While onerous, and not specifically enabled by the Act, a publicly accessible register of nurses authorised in terms of section 56(6) would be useful. Those nurses who eventually meet the requirements for section 56(1) to (5) will appear in the specialist registers maintained for that purpose. However, this will only occur once the qualification has been specified by the council and implemented by the appropriate

10 SAHR 2012/13
providers of nursing education. No such qualifications have yet been specified.
Extensive draft Regulations that deal with the accreditation of nursing education institutions were issued in 2011.87 Appended to these draft Regulations was the competency framework for nursing practice. Among the assessment criteria for professional nurses was this statement: “Pharmacological preparations and treatment are managed in ways that ensure the correct storage of drugs, and the correct preparation and administration of pharmacological treatment.” This seems to cover the conventional role of the nurse and not the roles of prescribing or dispensing. However, another statement reads: “Childhood illnesses, minor and common ailments are accurately diagnosed and managed according to generally accepted treatment guidelines.” This seems to be akin to what is expected of the current primary healthcare nurse practitioners, who are enabled with a section 56(6) permit.
In August 2011, the Minister published draft Regulations that deal with the conduct of inquiries into alleged unfitness to practise due to disability or impairment.88 Other draft Regulations issued in 2012 deal with the minimum requirements for registration by professional nurses,89 staff nurses,90 maintenance of registers,91 and the conduct of inquiries into alleged unprofessional conduct.92
Allied Health Professions Council of South Africa
In November 2011, the Allied Health Professions Council of South Africa (AHPCSA) issued a Board Notice that declared any involvement by a practitioner registered in terms of the Act in a telemedicine scheme as unprofessional conduct. Telemedicine was defined as unprofessional conduct, as it was held to constitute “a breach of patients’ rights”.93
Interim Traditional Health Practitioners Council of South Africa
In August 2011, the Minister of Health published a final Regulation providing for the appointment of members of the Interim Traditional Health Practitioners Council of South Africa.94 Nominations were then called for, with a due date of 31 January 2012. Research conducted in 2012 by Mbatha et al. identified the establishment of this council as a key step in ensuring the acceptance by employers of sick certificates issued by traditional health practitioners.95 Such certificates are not currently recognised in terms of the Basic Conditions of Employment Act, but are accepted by some employers. These authors estimated that there are about 200 000 traditional health practitioners in SA, who belong to over 100 separate organisations.
Telemedicine – legislative barriers
The potential that eHealth offers for making health systems more efficient was acknowledged in a World Health Assembly resolution in 2005.96 For various reasons this expectation of technology has not been realised globally, and not been matched by uptake and utilisation in practice.97 A National eHealth Strategy for South Africa 2012/13-2016/17 was issued in July 2012.98 This document includes under the umbrella of eHealth the domains of telemedicine, mobile (or mHealth) interventions and all information and communication technologies for supporting, facilitating and
strengthening health care.
Telemedicine uses information and communication technologies to deliver healthcare over a distance.99 The World Medical Association defines telemedicine broadly as “the practice of medicine over a distance, in which interventions, diagnostics and treatment decisions and recommendations are based on data, including voice and images, documents and other information transmitted through telecommunication systems”.100 Telemedicine is closely allied to “health information technology”, which refers more commonly to electronic medical records and health information systems.
The strategy document reaffirms the commitment to realising the strategic objectives previously set out by the NDoH. The overall aim of this strategy is to provide a single, harmonised and comprehensive eHealth strategy that:
➢ supports the medium-term priorities of the public health sector;
➢ paves the way for future public sector eHealth requirements; and
➢ lays the requisite foundations for the future integration and coordination of all eHealth initiatives in the country (both in the public and private sectors).
Telemedicine has been on the NDoH’s agenda since 1995, when the National Health Information Systems Committee of South Africa was established. This committee was tasked with the design of a comprehensive national health information system for SA. While progress has been slow, some success has been shown in the form of the District Health Information System (DHIS) and also in the ‘paperless’ Inkosi Albert Luthuli Central Hospital and eThekweni Hospital in Durban, KwaZulu-Natal.
In 2007 the HPCSA circulated draft clinical guidelines for the practice of telemedicine in SA to various experts for comment. These guidelines contained serious omissions and provisions that would significantly limit the uptake of telemedicine and have not yet been finalised. The guidelines that were available from the NDoH in 1998 had been adapted from a code of conduct for commercial product suppliers and were not relevant to clinical practice.101
Little consensus exists on the definition of an electronic health record. One definition that is generally accepted is “[a]n electronic record of health-related information on an individual that is created, gathered, managed, and consulted by authorized health care clinicians and staff.”102 Efforts to introduce an electronic health record system date back to 2008, when the State Information Technology Agency (SITA) awarded a tender to provide the NDoH with a system to be known as eHR.za.103 The SITA document outlining the National Strategic Framework for implementation in SA may be found on the internet, but does not reflect authorship or time frames.104
Central to any discussion on patient records, whether in an electronic or paper format, is the need to ensure that the best interests of the patient are paramount. Privacy of patient information and proper informed consent are universal ethical concerns but seem to be a particular barrier when an electronic health record is integrated into a healthcare facility. In SA, the right to privacy and autonomy is recognised as a fundamental right in the Constitution, and specific legislation on health records requires a patient’s consent before any information may be shared (National Health Act). Section 6(1) of

Health Policy and Legislation 1
SAHR 2012/13 11
Health Policy and Legislation 1
the National Health Act defines what constitutes proper informed consent, and section 6(2) states that the healthcare provider concerned must, where possible, provide relevant information to a user in a language that he or she understands and in a manner that takes into account the patient’s level of literacy. Section 17 highlights security- and privacy-related issues and addresses the protection of health records. It states, for instance, that “the person in charge of a health establishment in possession of a user’s health records must set out proper control measures to prevent unauthorised access to those records and to the storage facility in which, or system by which, records are kept”.
Section 17 anticipates the potential for improper access to electronic records, and so includes as offences the acts of gaining unauthorised access to, or of intercepting, information without authority.
More broadly, the Electronic Communications and Transactions Act (Act 25 of 2002), referred to as the “ECTA”, provides for the facilitation and regulation of electronic communications and transactions. An electronic health record would fall under the definition of an electronic transaction or communication, as provided in the Act. An electronic communication is defined as “a communication by means of data messages”; a transaction is “a transaction of either a commercial or non-commercial nature, and includes the provision of information and e-government services”. Importantly, the Act defines an electronic signature as “data attached to, or incorporated in, or logically associated with other data, and which is intended by the user to serve as a signature”.
Medical data are highly sensitive, and would therefore meet the criteria for “critical data”, declared by the Minister in terms of section 53 to be of importance “to the protection of the national security of the Republic or the economic and social well-being of its citizens”. “Personal data” is defined in broad and encompassing terms, and includes data on race, gender, sex, pregnancy, ethnic origins, blood type, and physical or mental health. Chapter 8 of the ECTA addresses the protection of personal information and sets out principles that must be adhered to when such information is collected. Specifically, section 51(1) states that “[a] data controller must have the express written permission of the data subject for the collection, collation, processing or disclosure of any personal information on that data subject unless he or she is permitted or required to do so by law”.
The demands of both the National Health Act and the ECTA were highlighted when Discovery Health launched its Apple iPad application called HealthID in 2012.105 The company described this as the “first electronic health record application of its kind in SA, which puts patients’ health records in their doctor’s hands”. It elaborated on the application as follows:
The electronic health record is at the heart of the application, where valuable clinical information derived from claims data and from pathology laboratories is stored. Doctors are able to access their patients’ data and details of their previous doctor and hospital visits. Doctors can view previously prescribed medicines, blood test results and patients’ health measures such as body mass index and blood pressure … HealthID will reduce the administration burden on doctors as they have the patient’s information at their fingertips, which will enable them to apply online for chronic medicines and get real-time approval, as well
as to script medicines with full information on which medicines are covered. Very often a patient cannot remember the last time they suffered from a particular disease or, in the case of elderly patients, all the medication that they are currently on. HealthID will close this critical gap for patients and for doctors.
Patients were to be asked to provide signed consent, which could be achieved in real time by signing on the iPad screen, before allowing their medical practitioner to use the application. Whether this meets the requirements for proper informed consent continues to be debated among ethicists, as the process does not appear to provide the necessary information about risks, benefits, or costs.
In addition, questions have been raised about the validity of electronic prescriptions issued by means of this application. The existing General Regulations to the Medicines Act require that all prescriptions “must be written in legible print, typewritten or computer generated and signed in person by a medical practitioner, dentist, veterinarian or authorised prescriber”.106 This has always been interpreted by pharmacists as requiring a “hard copy” of any electronic prescription, and such copies are provided at the two hospitals (Inkosi Albert Luthuli Central Hospital and the eThekweni Hospital in Durban) that operate ‘paperless’ systems.
It remains to be seen whether the Medicines Act and its Regulations can be read together with the ECTA and an “electronic signature” deemed to meet the requirements of General Regulation 28. A joint communication from the Pharmacy Council and Medicines Control Council might assist in this regard; for instance, by clarifying whether “signed in person” is intended to mean “handwritten” or whether the definition can accommodate an electronic signature if accredited in terms of the ECTA.
Intellectual property – an unfinished agenda
Although a new intellectual property (IP) policy was to be released for comment by the Department of Trade and Industry (dti) in July 2012, this did not happen. A regulatory impact assessment of the draft policy was expected to serve before Cabinet in December 2012. The draft policy is therefore expected to be ready for public consultation in early 2013. An early draft has been circulated to certain interest groups. This draft proceeds on the basis that, while SA needs to align its policy and legislation to international treaties and norms, South African policy and legislation must be consonant with the developmental stage appropriate to the country. The objectives of the draft policy are therefore, among others:
to develop a legal IP framework to empower all strata of citizens; one that provides a conducive environment for economic opportunities; the policy is to apply alongside other government policies to contribute to development; it would interface with related new emerging issues; and to improve and strengthen enforcement.
The draft is presented in 17 chapters. Only those sections that have an impact on health are discussed here:
➢ Chapter 1 focuses on the four main types of IP: trademarks, copyright, patents and designs. It includes recommendations to amend legislation to incorporate the Doha Declaration “flexibilities” and incentive schemes in areas of IP that advance
12 SAHR 2012/13
developmental goals, such as poverty alleviation and health. It discusses the necessity for competition law to be applied to patent law where there is over-concentration, dominance or abuse by IP holders. It argues against “general blanket data protection” of information submitted to regulators, as this would frustrate generic entry. Interestingly, the document identifies the need to explore alternatives to IP such as subsidies or a prize fund, but does not develop this theme further.
➢ Chapter 2 deals with IP and its impact on public health. It recommends the use of compulsory licences and parallel importation to introduce affordable medicines, and the balancing of trade and health interests in patent protection. It points to the need for an increase in public funding for research and development into diseases of the poor, and suggests that IP, competition and trade policies be aligned with health policy objectives. It recommends that provisions for entry of generic competition be made, that trade and health departments reconcile their policy stances and address the pricing of drugs to ensure access, and that stricter rules apply to patenting.
➢ Chapter 5 deals with competition, public policy, compulsory licensing and technology transfer. It warns that trade and investment treaties pose the danger of undermining sovereignty, and recommends against adopting the World Intellectual Property Organization (WIPO) Roadmap. The Roadmap seeks a harmonised patent regime, which could lead to policy compromises.
➢ Chapter 8 deals with institutional capacity and notes that SA has weak institutional capacity and lacks skilled and experienced personnel. For this reason the country uses a depository system instead of a substantive search and examination method for patent applications. It recommends that the country’s meagre resources not be used for IP administration (presumably enforcement) and that it adopt a multifaceted approach for the registration of patents (a combination of the depository and examination systems).
➢ Chapter 9 deals with the international architecture of IP. The chapter points out that this is coordinated mainly by the WIPO and the World Trade Organization (WTO), which cater primarily for the needs of the developed countries and their private sectors. However, other organisations such as the WHO, World Customs Organization and other United Nations (UN) agencies are also affected. Further problems identified are: the problem that medicines in transit through Europe are impounded; the fact that WIPO technical assistance does not focus on flexibilities; and that developed countries demand the WTO’s Trade-Related Aspects of Intellectual Property Rights (TRIPS)-plus standards in negotiations with developing countries. It recommends that the dti “cautiously filter advices” coming from developed countries and institutions such as the WTO and WIPO and that SA not enter into trade agreements that undermine the exceptions and flexibilities it is entitled to or that are TRIPS-plus.
➢ Chapter 10 deals with IP and development, and notes that IP confers both costs and benefits to individuals, companies and society. It explains that developed countries used IP as a flexible tool to propel them to industrialisation but are now demanding ‘harmonisation’, which makes it virtually
impossible for developing countries to ‘catch up’. The chapter recommends the implementation of the Doha Development Agenda. It suggests reconciling IP and competition policy, increasing incentives for technology transfer, and increasing funding to promote indigenous scientific and technological capability. It also recommends that SA does not support the “global enforcement and harmonisation of patent” agendas.
➢ Chapter 15 deals with enforcement of IP. It puts forward a ‘bare minimum’ obligations approach and resistance to TRIPS-plus requirements in policy, law, and trade agreements.
The issue of IP and access to medicines remains a contested one. The recent judgment handed down in the Supreme Court of Appeal on 26 July 2012 in the matter between Aventis Pharma SA and Others v Cipla Life Sciences and Others (with the Treatment Action Campaign (TAC) intervening as amicus curiae)107 – commonly known as the “Docetaxel” case – is examined here. While essentially a dispute about whether a holder of a pharmaceutical patent can obtain an interdict against an alleged infringer, this was a significant test case for the extent to which courts are required to apply broad constitutional principles (in this instance, the right of access to healthcare services and medicines) in IP disputes. The principle that public interest applies in IP disputes had already been established in a previous unsuccessful application for a compulsory licence.108 The disputed patent in the “Docetaxel” case related to a composition of unpatented products that, when combined, facilitate the intravenous administration of docetaxel, a treatment for cancer. The holder of the patent (Aventis Pharma SA) maintained that the generic manufacturer (Cipla Life Sciences) had infringed its patent by registering and commencing the manufacture and marketing of a cheaper version of the medicine. Cipla countered that the patent was invalid on account of ambiguity and the lack of novelty and inventive step, essential requirements for patentability under South African law. A key complication is that the South African patents office does not conduct substantive examinations of the merits of each patent application, nor does any opportunity exist for an interested party to oppose such applications. For this reason these court proceedings presented a first opportunity for any tribunal to consider the substantive merits of the docetaxel patent.
In its submissions, the TAC argued, first, that the provisions of the Patents Act (Act 57 of 1978) must be interpreted in a manner consistent with the Constitution and the rights of the patent holder need to be balanced with those of people who require, but are unable to afford, the relevant medication. Second, when considering the requirement of ‘balance of convenience’ in interdict proceedings that potentially threaten the right to access medicines, the party requesting the interdict must prove that its grant will not harm the public interest. Third, while the evidence to enable the court to assess whether the rights of cancer patients would be harmed was inadequate, on the available information on record the interdict seeker failed to discharge its onus of proof. And, finally, it argued that, in line with courts in the United States of America (USA) and India, the Court must assess whether a satisfactory alternative remedy (such as damages) was available to the party seeking the interdict.
In its judgment, the Court accepted the TAC’s argument that the broader public interest, and not merely the interests of the litigating parties, ought to be considered in determining the balance of convenience in interdict proceedings. It cited both South African

Health Policy and Legislation 1
SAHR 2012/13 13
Health Policy and Legislation 1
and USA Supreme Court case law. However, the Court concluded that the public interest would not be served by denying an interdict on the facts of this case. It noted that Cipla’s opposition was based on commercial considerations; namely, its need to establish a presence in the generics market. Furthermore, it noted that there was no evidence before it that Aventis could not continue to meet the demand for the medicine. Cipla was also unable to demonstrate that its product offered superior medicinal benefits, or more than a marginal saving on the cost of its generic version of Docetaxel in relation to Aventis’ generic version (marketed as Docetere). And, finally, it held that there would be no material disruption of medicine supply to patients if the interdict was granted.
While the Court made a concession to the consideration of the public interest when determining the balance of convenience, its judgment was not unexpected given the constraints imposed by the legislation and the mindset of the judiciary.
The Court took a rather narrow view of the question of awarding damages (royalties) should the patent ultimately be found to be valid, holding that this would be tantamount to granting a compulsory licence. This approach is out of step with other jurisdictions such as India and the USA.
The decision once again highlights the need for the amendment of South African patent laws to specify and apply properly the strict standards of novelty and inventive step required for the granting of a patent. They should also prioritise the public interest in disputes concerning life-saving medicines.
The decision also highlights the perversity of the ‘right’ of patent holders to frustrate generic competition, and in this way access to cheaper medicines, by introducing their own generic versions when such a threat is imminent. While Cipla’s commercial motives were foregrounded, the motives of Aventis in registering and marketing Docetere only at the stage that Cipla intended to produce a generic docetaxel were not investigated. Neither was an investigation conducted into the long-term impact of such practices on accessibility and affordability of medicines.
SA, like many middle-income countries and particularly those in the emerging Brazil, Russia, India, China, South Africa. (BRICS) group, is trying to balance industrial policy and concerns about access to healthcare technologies. In this regard the experiences of India are instructive for a number of reasons. India did not grant patent protection on medicines in terms of its 1970 patent legislation, an industrial policy choice that enabled it to grow its local pharmaceutical manufacturing capacity.109 The proliferation of local companies that manufacture generic versions of medicines patented and marketed expensively elsewhere has enabled India to supply cheaper products to many countries in the developing and developed world. This practice has earned it the reputation of the ‘pharmacy of the poor’.
When obliged to recognise pharmaceutical product patents in terms of the WTO’s Trade-Related Aspects of Intellectual Property Rights Agreement, India included a number of important ‘flexibilities’ in its 2005 legislation, in order to facilitate access to affordable medicines.110 Two provisions, which relate to higher standards for patentability and to the issuance of compulsory licences, have already been tested. India has utilised section 3(d) of its Patents Act to deny Novartis a patent on the anti-leukaemia drug imatinib (sold as Glivec) on the grounds that it did not meet the patent
standards of being truly new and innovative. The decision has been challenged, and the case is proceeding.111 India has also granted a compulsory licence for a generic version of Bayer’s anti-cancer drug sorafenib (sold as Nexavar) on the basis that the local generic manufacturer Natco Pharma was able to supply the drug at 3% of Bayer’s price, which was exorbitant.112 Both these decisions by the Indian authorities are being challenged in the highest courts. Their outcomes are keenly awaited as they will determine India’s future prospects as a major global supplier of low-cost essential medicines, and signal to other countries whether they should consider adopting these ‘flexibilities’ in their domestic legislation.
With these elements in mind, the following issues should be considered when finalising SA’s IP policy:
➢ It is important that the policy objectives clearly focus on the developmental aspects of all policy in post-apartheid SA and are consonant with the country’s development status. Further, the policy must benefit society as a whole, and ensure that it prioritises the most vulnerable and marginalised: the poor, sick, infirm, elderly, children and other disadvantaged sectors.
➢ The policy should be clear that extension to the patent period will not be permitted under any circumstances; Also, full disclosure in all pharmaceutical patent applications should be made, which includes the use of the international non-proprietary or generic name.
➢ Additionally, the policy should ensure that key flexibilities that facilitate access to medicines are incorporated. These flexibilities are strict patents standards; a proper examination system; opposition procedures before and after the grant of a patent; compulsory licences on all permissible grounds, including for public health purposes; and an expeditious administrative procedure to deal with applications for compulsory licences.
➢ Under no circumstances should data exclusivity be adopted. The current data protection rules, which protect clinical trial data submitted by an innovator from unfair commercial use but which allow a regulator to reference the data for the purpose of approving a generic equivalent, are fully TRIPS-compliant. They should not be tampered with, nor conceded in trade or other negotiations.
➢ It should be clarified that patents will not be granted for new uses and new formulations of existing medicines, that no legal barriers should be placed on parallel importation and compulsory licences, and that royalty rates should be legislated to facilitate licensing and avoid disputes in this regard.
➢ Clear guidelines should be drawn up for the examination of patent applications, with the public interest being paramount, and the right of interested parties to challenge such applications entrenched in law, as is the case with some jurisdictions.
The dti must consider the impact of IP on the development of local industry, as per its stated intentions in terms of both the proposed SA Pharmaceutical Sector Profile (unpublished) and the Industrial Policy Action Plan (2012/13-2014/15).113 In particular, it needs to acknowledge and address the reality that foreign pharmaceutical companies are the main beneficiaries of its lax patent laws and that, if examined properly, approximately 80% of patents would not have been granted.114,115

14 SAHR 2012/13
Developing jurisprudence
In yet another decision that affects the health profile of SA’s prison population, in March 2012 the Supreme Court of Appeal (SCA) held, in the case of Minister of Correctional Services v Lee, that a prisoner who became infected with TB while incarcerated in Pollsmoor Prison had failed to prove a causal link between his infection and his incarceration at the prison. This was despite the Court’s accepting that the prison authorities had failed to take reasonable measures to prevent the spread of the causative agent.116
This matter was then taken on appeal to the Constitutional Court. The Court was asked to develop the common law of causation to the effect that this requirement will be satisfied where it is proved that the negligence of the prison authorities created a material increase in the risk of a prisoner being infected with TB, under the present conditions of chronic overcrowding and high TB infection rates. A spokesperson for the TAC, the Wits Justice Project and the Centre for Applied Legal Services, which were admitted as amici curiae in the matter, criticised the judgment of the SCA, stating that
[I]t held that Lee must either identify the ‘source’ of his infection or show that there would have been no risk of becoming infected if the prison authorities had not been negligent. The SCA thereby asked Lee to prove that which is impossible to prove.117
The judgment of the Constitutional Court was delivered in early December 2012.118 The majority (five of nine justices) held that the SCA, in applying the test for factual causation, had used an “inflexible kind of logic” (para 45) in the way that it applied the “but-for” test (conditio sine qua non). By this standard, they believed it unlikely that any prison inmate would ever be able to overcome the hurdle of causation. Instead, the Court stated that “[o]ur existing law does not require, as an inflexible rule, the use of the substitution of notional, hypothetical lawful conduct for unlawful conduct in the application of the but-for test for factual causation” (para 50). Put in simpler terms:
There was thus nothing in our law that prevented the High Court from approaching the question of causation simply by asking whether the factual conditions of Mr Lee’s incarceration were a more probable cause of his tuberculosis, than that which would have been the case had he not been incarcerated in those conditions. That is what the High Court did and there was no reason, based on our law, to interfere with that finding. (para 55).
Accordingly, the order of the SCA was set aside and, Mr Lee having been successful, the case was referred to the Cape High Court for determination of the damages. The Constitutional Court judgment also echoed important sentiments expressed in the SCA ruling. It stated: “It is indeed so that [p]risoners are amongst the most vulnerable in our society to the failure of the state to meet its constitutional and statutory obligations”, and that “a civilised and humane society demands that when the state takes away the autonomy of an individual by imprisonment it must assume the obligation … inherent in the right … to ‘conditions of detention that are consistent with human dignity’” (para 65).
The minority judgment, while agreeing with the finding in favour of Mr Lee, took the view that the “Supreme Court of Appeal, having
concluded that the High Court judgment in Mr Lee’s favour was unsustainable on the basis of the traditional ‘but-for’ test for causation, was therefore obliged to consider developing the common law” (para 111). This was because the result of leaving Mr Lee without a remedy was “unacceptable in our constitutional state” (para 97). The problem arises from “the rigidity of the common law test for causation, which requires claimants to prove more probably than not that the defendant’s negligence caused their injury” (para 94). This means that the appropriate course would be to remit the matter to the trial court for it to consider “the manner in which the common law ought to be developed” (para 116).
Miscellaneous issues
The disposal of health-related waste has been of concern for some years, with periodic cases of improper disposal being reported in the media. It is therefore of interest that in 2012 the Minister of Water and Environmental Affairs published draft Regulations in terms of the National Environmental Management: Waste Act (Act 59 of 2008), which deal specifically with healthcare waste.119 Once finalised, these Regulations will need to be read together with other legislative measures. These include Regulations made in terms of the Medicines Act and the Good Pharmacy Practice standards issued by the SAPC, for instance.
A Bill that deals with the prevention and combating of torture may not, at first glance, be of direct relevance to the healthcare context.120 However, there have been concerns about the involvement of medical practitioners in the interrogation and, arguably, torture of detainees in various settings. A report entitled “Preventing torture: the role of physicians and their professional organisations: principles and practice” has documented examples of such participation in torture, in the form of “the provision of medical knowledge to interrogators, disregard of medical confidentiality, force-feeding of rational people on hunger strike, and falsification of medical records or death certificates”.121 In a 2011 article, Hall pointed out that the 1997 World Medical Association Statement on the Licensing of Physicians Fleeing Prosecution for Serious Criminal Offences “states uncompromisingly that a physician who perpetrates torture, war crimes, or crimes against humanity is unfit to practise medicine”.122
Lastly, mention needs to be made of the use of section 100 of the Constitution by the Executive to intervene in the administration of a provincial DoH (in this case, Limpopo). Section 100 states that “[w]hen a province cannot or does not fulfil an executive obligation in terms of the Constitution or legislation, the national executive may intervene by taking any appropriate steps to ensure fulfilment of that obligation, including –
a) issuing a directive to the provincial executive, describing the extent of the failure to fulfil its obligations and stating any steps required to meet its obligations; and
b) assuming responsibility for the relevant obligation in that province to the extent necessary to –
i) maintain essential national standards or meet established minimum standards for the rendering of a service;
ii) maintain economic unity;
iii) maintain national security; or

Health Policy and Legislation 1
SAHR 2012/13 15
Health Policy and Legislation 1
iv) prevent that province from taking unreasonable action that is prejudicial to the interests of another province or to the country as a whole”.
This option is never exercised lightly. Its use in relation to a provincial DoH reflects the seriousness with which health is regarded, and the extent to which the state is bound to ensure the progressive realisation of the rights enshrined in section 27 of the Constitution.
Conclusion
Although no health-related Bills had been passed by Parliament in 2011/2012 at the time of writing, intense interest existed in the way in which the National Health Amendment Bill (Bill 24 of 2011) is evolving. Intense interest has also been expressed in at least some of the secondary legislation produced in the period under review. The Tobacco Regulations in particular promise to be highly controversial, even though entirely justified. Progress has been made in bringing further provisions of the National Health Act into effect, but some critical elements remain unresolved. Nonetheless, all these developments will pale into insignificance as soon as the White Paper on NHI is issued.
An element that has not, as yet, enjoyed any attention is the cost associated with developing health-related legislation. A 2012 costing study of New Zealand legislation showed that an Act of Parliament cost the central government US$ 2.6 million, and a Regulation cost US$ 382 000.123 The authors suggested that “such costs be included in economic evaluations of public health interventions that involve new legislation”. Such an approach would also focus attention on the costs of poorly drafted or conceptualised legislation and on the extensive resources that are expended in the process. The New Zealand study used a central government perspective, which ignores costs borne by actors outside of government. Including such costs, in a societal perspective, would be expected to raise the estimate even further. While essential to the effective development of policy, none of the processes outlined in this chapter are free of costs, to a wide range of actors. They deserve careful scrutiny and handling.

16 SAHR 2012/13
References
1 Gray A, Vawda Y, Jack C. Health policy and legislation. In: Padarath A, English R, editors. South African Health Review 2011. Durban: Health Systems Trust; 2011.
2 National Department of Health. Annual Report 2010/2011. Pretoria: National Department of Health; 2011.
3 Republic of South Africa. National Health Act (Act 61 of 2003).
4 National Department of Health. Annual Performance Plan 2011/2012.
5 Minister of Health. National Health Insurance in South Africa Policy Paper. Government Notice 657. Government Gazette No. 34523, 12 August 2011.
6 National Department of Health. National Health Insurance Green Paper: extension of the comment period. Government Notice No. 743, Government Gazette No. 34606, 15 September 2011.
7 Ministers of Health and Basic Education. Integrated School Health Policy. October 2012.
8 Minister of Health. National Health Amendment Bill (Bill 24 of 2011). Government Gazette No. 34739, 8 November 2011.
9 Parliamentary Monitoring Group. National Health Amendment Bill: Department response to submissions. 29 May 2012.
10 Glenister v President of the Republic of South Africa and Others (CCT 48/10) [2011] ZACC 6; 2011 (3) SA 347 (CC) (17 March 2011).
11 Parliamentary Monitoring Group. National Health Amendment Bill [B24-2011]: deliberations. 13 June 2012.
12 National Department of Health. Annual Report 2011/2012. Pretoria: National Department of Health; 2012.
13 Minister of Health. Regulations relating to the artificial fertilization of persons: draft. Government Notice R. 175. Government Gazette No. 35099, 2 March 2012.
14 Minister of Health. Regulations relating to the rendering of clinical forensic medicine services: draft. Government Notice R. 176. Government Gazette No. 35099, 2 March 2012.
15 Minister of Health. Regulations relating to the use of human biological material: draft. Government Notice R. 177. Government Gazette No. 35099, 2 March 2012.
16 Minister of Health. Regulations relating to the registration of microbiological laboratories and the acquisition, importation, handling, maintenance and supply of human pathogens: draft. Government Notice R. 178. Government Gazette No. 35099, 2 March 2012.
17 Minister of Health. Regulations relating to blood and blood products: draft. Government Notice R. 179. Government Gazette No. 35099, 2 March 2012.
18 Minister of Health. Regulations regarding the general conduct of human bodies, tissue, blood, blood products and gametes: draft. Government Notice R. 180. Government Gazette No. 35099, 2 March 2012.
19 Minister of Health. Regulations relating to the import and export of human tissue, blood, blood products, cultured cells, stem cells, embryos, zygotes and gametes: draft. Government Notice R. 181. Government Gazette No. 35099, 2 March 2012.
20 Minister of Health. Regulations relating to tissue banks: draft. Government Notice R. 182. Government Gazette No. 35099, 2 March 2012.
21 Minister of Health. Regulations relating to stem cell institutions or organisations: draft. Government Notice R. 183. Government Gazette No. 35099, 2 March 2012.
22 President of the Republic of South Africa. Commencement of certain sections of the National Health Act, 2003 (Act 61 of 2003). Government Notice R. 20. Government Gazette No. 33187, 14 May 2010.
23 President of the Republic of South Africa. Commencement of certain sections of the National Health Act, 2003 (Act No. 61 of 2003). Government Notice No. 11, Government Gazette No. 35081, 27 February 2012.
24 Minister of Health of the Province of the Western Cape v Goliath and Others (13741/07) [2008] ZAWCHC 41; 2009 (2) SA 248 (C) (28 July 2008).
25 Minister of Health. Policy on the management of public hospitals. Government Notice 186. Government Gazette No. 35101, 2 March 2012.
26 Minister of Health. Regulations relating to categories of hospitals. Government Notice R. 185. Government Gazette No. 35101, 2 March 2012.
27 Department of Health. Policy Framework for the Ethics Approval and Endorsement of Health Research by National Department of Health. Approved by the Minister on 24 May 2012.
28 Minister of Health. Call for the establishment of a National Advisory Committee on the Prevention and Control of Cancer. Government Notice R. 462, Government Gazette No. 35447, 15 June 2012.
29 Republic of South Africa. Tobacco Products Control Act (Act 83 of 1993).
30 Minister of Health. Regulations relating to smoking in public places and certain outdoor public places. Government Notice R. 264, Government Gazette No. 35198, 30 March 2012.
31 SAPA. New smoking law under attack. Health-e [serial on the Internet], 16 July 2012. URL: http://www.health-e.org.za/news/article.php?uid=20033633
32 British American Tobacco South Africa. Public place smoking media release. 1 July 2012. URL: http://www.batsa.co.za/group/sites/BAT_7N3ML8.nsf/vwPagesWebLive/DO8VTJ75?opendocument&SKN=1
33 Stassen W. Support for new smoking regulations. Health-e [serial on the Internet]. 26 July 2012. URL: http://www.health-e.org.za/news/article.php?uid=20033682
34 BATSA v Minister of Health (463/2011) [2012] ZASCA 107 (20 June 2012).
35 World Health Organization. World No Tobacco Day 2012. Theme: tobacco industry interference 16 September 2011. URL: http://www.who.int/tobacco/wntd/2012/announcement/en/index.html
36 Hartley W. Motsoaledi takes aim at alcohol adverts, smoking. Business Day, 20 February 2012.
37 Government Communication and Information Service. Motsoaledi resolute on banning alcohol ads. 2 March 2012.
38 Parry C, Burnhams NH, London L. A total ban on alcohol advertising: presenting the public health case. SAMJ 2012;102(7):602-4.
39 Republic of South Africa. Medicines and Related Substances Act (Act 101 of 1965).

Health Policy and Legislation 1
SAHR 2012/13 17
Health Policy and Legislation 1
40 Republic of South Africa. Medicines and Related Substances Amendment Act (Act 72 of 2008).
41 Minister of Health. Publication of Medicines and Related Substances Amendment Bill, 2012. General Notice 216 of 2012, Government Gazette No. 35151, 15 March 2012.
42 Vawda Y. Ensuring access through the Medicines and Related Substances Amendment Act 72 of 2008 – another lost opportunity? South African Law Journal. 2009:126(4):667-77.
43 Minister of Health. Medicines and Related Substances Act, 1965 (Act 101 of 1965) schedules. Government Notice R. 502, Government Gazette No. 35487, 2 July 2012.
44 Minister of Health. Regulations relating to medical devices: draft. Government Notice R.586. Government Gazette No. 34463, 22 July 2011.
45 Minister of Health. General Regulations made in terms of the Medicines and Related Substances Act, 1965 (Act No. 101 of 1965): amendment. Government Notice R.587. Government Gazette No. 34463, 22 July 2011.
46 Minister of Health. General Regulations made in terms of the Medicines and Related Substances Act, 1965 (Act 101 of 1965). Government Notice R. 875, Government Gazette No. 34693, 19 October 2011.
47 Minister of Health. Regulations relating to a transparent pricing system for medicines and scheduled substances. Government Notice R. 47, Government Gazette No. 34959, 19 January 2012.
48 Minister of Health. Information to be provided by manufacturers and or importers of medicines and related substances for the single exit price adjustment for the year 2012. Government Notice R. 48, Government Gazette No. 34959, 19 January 2012.
49 Minister of Health. Medicines and Related Substances Act: Regulations: Transparent pricing system for medicines and scheduled substances: Information to be supplied by pharmacist for review of annual dispensing fee. Government Notice R. 584, Government Gazette No. 34468, 18 July 2011.
50 Minister of Health. Medicines and Related Substances Act: regulations: transparent pricing system for medicines and scheduled substances: amendment (draft dispensing fee for pharmacists). Government Notice R. 484. Government Gazette No. 35464, 29 June 2012..
51 Minister of Health. Regulations relating to a transparent pricing system for medicines and scheduled substances: amendment. Government Notice R. 510, Government Gazette No. 35481, 6 July 2012.
52 Minister of Health. Regulations relating to a transparent pricing system for medicines and scheduled substances: methodology for international benchmarking of prices of medicines and scheduled substances in South Africa: draft. Government Notice R. 1211. Government Gazette No. 33878, 17 December 2010.
53 Minister of Health. Regulations relating to a transparent pricing system for medicines and scheduled substances: logistics fee component of a transparent pricing system: draft. Government Notice R. 184. Government Gazette No. 34071, 4 March 2011.
54 Republic of South Africa. Foodstuffs, Cosmetics and Disinfectants Act (Act 54 of 1972).
55 Minister of Health. Regulations relating to the prohibition of the manufacturing, importation, exportation and sale of polycarbonate infant feeding bottles containing bisphenol A. Government Notice R. 879, Government Gazette No. 34698, 21 October 2011.
56 Minister of Health. Regulations relating to the use of sweeteners in foodstuffs and related matters: draft regulations. Government Notice R. 880, Government Gazette No. 34698, 21 October 2011.
57 Minister of Health. Regulations relating to foodstuffs for infants and young children. Government Notice R. 184, Government Gazette No. 35100, 2 March 2012.
58 Minister of Health. Regulations relating to the reduction of sodium in certain foodstuffs and related matters. Government Notice R. 533, Government Gazette No. 35509, 11 July 2012.
59 Minister of Health. Regulations relating to foodstuffs and infants and young children. Government Notice R. 991, Government Gazette No. 35941, 6 December 2012.
60 Republic of South Africa. Mental Health Care Act (Act 17 of 2002).
61 Minister of Health. Mental Health Care Amendment Bill (Bill 39 of 2012).
62 Minister of Health. Regulations relating to the qualifications for registration of speech therapists, speech therapists and audiologists, audiologists, and hearing aid acousticians. Government Notice R. 618, Government Gazette No. 34494, 5 August 2011.
63 Minister of Health. Regulations defining the scope of the profession of psychology. Government Notice R. 704, Government Gazette No. 34581, 2 September 2011.
64 Minister of Health. Regulations defining the scope of the profession of audiology. Government Notice R. 803, Government Gazette No. 34632, 30 September 2011.
65 Minister of Health. Regulations relating to the qualifications for registration of dental assistants: amendment. Government Notice R. 120, Government Gazette No. 35045, 14 February 2012.
66 Minister of Health. Regulations relating to environmental health officers of additional qualifications: amendment. Government Notice R. 265, Government Gazette No. 35199, 30 March 2012.
67 Minister of Health. Regulations relating to the undergraduate curricula and professional examinations in audiology. Government Notice R. 387, Government Gazette No. 35350, 15 May 2012.
68 Minister of Health. Regulations relating to the undergraduate curricula and professional examinations in speech-language therapy. Government Notice R. 388, Government Gazette No. 35351, 15 May 2012.
69 Minister of Health. Regulations relating to the registration of medical technicians in the category virology. Government Notice R. 389, Government Gazette No. 35352, 15 May 2012.
70 Minister of Health. Regulations relating to the registration of medical technicians in the category immunology. Government Notice R. 390, Government Gazette No. 35352, 15 May 2012.
71 Minister of Health. Regulations relating to the registration of medical technicians in the category tuberculosis (bacterium). Government Notice R. 399, Government Gazette No. 35367, 21 May 2012.
72 Minister of Health. Regulations defining the scope of the profession of environmental health officers: amendment. Government Notice R. 391, Government Gazette No. 35354, 15 May 2012.
73 Minister of Health. Regulations relating to the registration of speech language therapy students. Government Notice R. 392, Government Gazette No. 35355, 15 May 2012.

18 SAHR 2012/13
74 Minister of Health. Regulations relating to the registration of intern psychologists. Government Notice R. 394, Government Gazette No. 35362, 21 May 2012.
75 Minister of Health. Regulations relating to the registration of student dental assistants: amendment. Government Notice R. 395, Government Gazette No. 35363, 21 May 2012.
76 Minister of Health. Regulations defining the scope of the profession of dental assistants. Government Notice R. 396, Government Gazette No. 35364, 21 May 2012.
77 Minister of Health. Regulations relating to the qualifications for registration of biokineticists. Government Notice R. 398, Government Gazette No. 35366, 21 May 2012.
78 Health Professions Council of South Africa. Rules relating to the registration by speech therapists, speech therapists and audiologists, and audiologists of additional qualifications. Board Notice 40 of 2012, Government Gazette No. 35258, 20 April 2012.
79 Health Professions Council of South Africa. Rules relating to the registration by medical practitioners and dentists of additional qualifications: amendment. Board Notice 122 of 2012, Government Gazette No. 35517, 20 July 2012.
80 Minister of Health. Regulations relating to continuing professional development: draft. Government Notice R. 395. Government Gazette No. 34254, 6 May 2011.
81 South African Pharmacy Council. Scope of practice and qualification for authorised pharmacist prescriber. Board Notice 122 of 2011. Government Gazette No. 34428, 1 July 2011.
82 South African Pharmacy Council. Scope of practice, supervision of pharmacy support personnel and qualifications. Board Notice 123 of 2011. Government Gazette No. 34428, 1 July 2011.
83 South African Pharmacy Council. Official statement concerning the dispensing of clinical associates’ prescriptions by pharmacists. Undated.
84 Doherty J, Couper I, Fonn S. Will clinical associates be effective for South Africa? SAMJ. 2012;102(11):833-35.
85 Minister of Health. Regulations relating to the keeping, supply, administering or prescribing of medicines by registered nurses. Government Notice No. R. 2418, 2 November 1984.
86 Minister of Health. Regulations relating to the keeping, supply, administering, prescribing or dispensing of medicines by registered nurses. Government Notice R. 1044, Government Gazette No. 34851, 14 December 2011.
87 Minister of Health. Regulations relating to the accreditation of institutions as nursing education institutions. Government Notice R. 1045, Government Gazette No. 34852, 14 December 2011.
88 Minister of Health. Nursing Act: regulations: conducting inquiries into alleged unfitness to practise due to disability or impairment of persons registered: draft. Government Notice R. 619. Government Gazette No. 34494, 5 August 2011.
89 Minister of Health. Regulations relating to the approval of and the minimum requirements for the education and training of a nurse leading to registration as a professional nurse. Government Notice R. 1046, Government Gazette No. 34852, 14 December 2012.
90 Minister of Health. Regulations relating to the approval of and the minimum requirements for the education and training of a nurse leading to registration as a staff nurse. Government Notice R. 1047, Government Gazette No. 34852, 14 December 2012.
91 Minister of Health. Regulations relating to the particulars to be furnished to the Council for keeping of the register for nursing practitioners, the manner of affecting alterations to the register, and certificates that may be issued by the Council: amendment. Government Notice R. 1050, Government Gazette No. 34852, 14 December 2012.
92 Minister of Health. Regulations relating to the institution and conduct of inquiries into alleged unprofessional conduct of persons registered with the South African Nursing Council. Government Notice R. 1051, Government Gazette No. 34852, 14 December 2012.
93 Allied Health Professions Council of South Africa. Unprofessional conduct: telemedicine. Board Notice 185 of 2011. Government Gazette No. 347676, 25 November 2011.
94 Minister of Health. Regulations relating to the appointment of members of the Interim Traditional Health Practitioners Council of South Africa. Government Notice R. 685. Government Gazette No. 34546, 22 August 2011.
95 Mbatha N, Street RA, Ngcobo M, Gcaleni N. Sick certificates issued by South African traditional health practitioners: current legislation, challenges and the way forward. SAMJ. 2012;102(3):129-31.
96 World Health Assembly Resolution WHA58.28 (2005). eHealth. In: Fifty-eighth World Health Assembly, Geneva; 2005 May 16-25. Annex. Resolutions and decisions (WHA58/2005/REC/1). Geneva: World Health Organization.
97 Al-Shorbaji N, Geissbuhler A. Establishing an evidence base for e-health: the proof is in the pudding. Bull World Health Organ. 2012;90:357-64 | doi:10.2471/BLT.11.099424
98 National Department of Health. National eHealth Strategy, South Africa 2012-2016. Pretoria: National Department of Health; 2012.
99 Mars M, Jack C. Why is telemedicine a challenge to the regulators? SAJBL.2010;3:55-8.
100 WMA statement on guiding principles for the use of telehealth for the provision of health care. Adopted by the 60th World Medical Association General Assembly, New Delhi, India; 2009 Oct.
101 TeleMedicine Technical Working Group 2000. Technical Working Document 2000. [Internet] National Department of Health; 2000. URL: www.doh.gov.za/programmes/tele/telefinal.html
102 HIPAA. The Definition of Electronic Health Record [Internet]. 2009.URL: http://www.hipaa.com/2009/05/the-definition-of-electronic-health-record/
103 Engelbrecht L. SITA awards R1bn e-health tender [Internet]. IT web; 2008 March 7. URL: http://www.itweb.co.za/index.php?option=com_content&view=article&id=2878&catid=160
104 The National Strategic Framework for eHR Implementation in South Africa [Internet]. URL: http://www.sita.co.za/documents/invitations/504_2006/RFB 504EHR Strategy.doc
105 Discovery Health. Discovery Health launches HealthID™ [Internet]. 2012 May 29. URL: http://www.discovery.co.za/discovery_za/web/logged_out/about_discovery/media/press_release_content/2012/2012_content/discovery_health_launches_healthid.xml
Health Policy and Legislation 1
SAHR 2012/13 19
Health Policy and Legislation 1
106 Minister of Health. General Regulations made in terms of the Medicines and Related Substances Act, 1965 (Act No. 101 of 1965), as amended. Government Notice R. 510, Government Gazette No. 24727, 10 April 2003.
107 Cipla Medpro v Aventis Pharma (139/12) Aventis Pharma SA v Cipla Life Sciences (138/12) [2012] ZASCA 108 (26 July 2012)
108 Syntheta (Pty) Ltd v Janssen Pharmaceutica NV & Another 1999 (1) SA 85 SCA.
109 Basheer S. ‘Policy style’ reasoning at the Indian Patent Office. Intellectual Property Quarterly. 2005;3:309-23.
110 Government of India. Patents (Amendment) Act 2005.
111 Grogan K. Novartis India patent case postponed to August 22. Pharma Times [Internet]. 2012 Jul 9. URL: http://www.pharmatimes.com/Article/12-07-09/Novartis_India_patent_case_postponed_to_August_ 22.aspx
112 Reuters. Analysis: India cancer ruling opens door for cheaper drugs [Internet]. 2012 Mar 13. URL: http://www.reuters.com/article/2012/03/13/us-india-drugs-idUSBRE82C0IN20120313
113 Department of Trade and Industry. Industrial Policy Action Plan (IPAP) 2012/13-2014/15. URL: http://www.info.gov.za/view/DownloadFileAction?id=162797
114 Vawda YA. Pharmaceutical innovation, incremental patenting and compulsory licensing country case study: South Africa [Internet]. 2011. URL: http://www.fixthepatentlaws.org/?p=329
115 Pouris A, Pouris A. Patents and economic development in South Africa: managing intellectual property rights. South African Journal of Science [serial on the Internet]. 2011;107(11/12): Art. #355, 10 pages. URL: http://dx.doi.org/10.4102/sajs.v107I11/12.355
116 Minister of Correctional Services v Lee (316/11) [2012] ZASCA 23; 2012 (1) SACR 492 (SCA); 2012 (3) SA 617 (SCA).
117 Politicsweb. Organisation says justice requires ConCourt to adapt law in TB transmission case [Internet]. 2012 Aug 8. URL: http://www.politicsweb.co.za/politicsweb/view/politicsweb/en/page71654?oid=317845&sn=Detail&pid=71616
118 Lee v Minister of Correctional Services CCT 20/12 [2012] ZACC 30.
119 Minister of Water and Environmental Affairs. Draft health care waste management regulations. General Notice 452 of 2012, Government Gazette No. 35405, 1 June 2012.
120 Minister of Justice and Constitutional Development. Prevention and Combating of Torture of Persons Bill (Bill 21 of 2012).
121 Augustin YS, Birch M, Bodini C, Boulton F, Robertson E, Spada VM, et al. Prevention of torture by doctors and organisations. Lancet. 2011;378(9809):e22-e23.
122 Hall P. Doctors and torture, victims and justice. Lancet. 2011;378(9809):e26.
123 Wilson N, Nghiem N, Foster R, Cobiac L, Blakely T. Estimating the cost of new public health legislation. Bull World Health Organ. 2012;90:532-39.

20 SAHR 2012/13

Authors:
21SAHR 2012/13
222222222222
Malebona Precious MatsosoRobert (Bob) Fryatt
National Department of Health
National Health Insurance: The first 18 months
South Africa is poised at the brink of effecting significant and much needed change to its health system; a change based on the principles of social solidarity, equity and fairness. A National Health Insurance (NHI) is the
vehicle which is intended to bring about this change and is expected to have a lasting and recurring impact on the health of all South Africans. The policy objective of NHI is to ensure that everyone has access to appropriate, efficient and quality health services. Intended to be phased in over a period of 14 years, such a system will require significant overhaul of existing service delivery structures, administrative and management systems.
This chapter summarises the progress and future plans for introducing the NHI in South Africa. Since the NHI Green Paper was launched in August 2011 there has been considerable progress in preparing the final NHI policy and in preparing South Africa’s health system for the introduction of NHI. This chapter summarises progress against the key features of the NHI’s development as outlined in the Green Paper and includes input on key areas and initiatives that have been identified for the successful implementation of NHI. This includes, amongst others, management reforms, hospital reimbursement reforms, establishment of the Office for Health Standards Compliance, undertaking of the national health facility audit, quality improvement and certification, and strengthening of district health authorities.
Many challenges and risks exist but plans to mitigate these are being put in place; in particular, to continue the process of consultation, improving on communications (including the timetable for changes to happen), strengthening oversight of the reform process in existing and future pilot districts and keeping a focus on equity to ensure that introducing the NHI will lead to a fairer healthcare system.
The policy objective of NHI is to ensure
that everyone has access to
appropriate, efficient and quality health
services.
Acknowledgements
This chapter has been prepared using contributions from key people involved in the work on the NHI in the National Department of Health and from others who are providing support.

22 SAHR 2012/13
Introduction
This chapter provides a brief summary of the progress made in preparing for the NHI since the launch of the Green Paper in August 2011.1 It also comments on some of the key challenges to be overcome in implementing the NHI and discusses the way forward.
The 2010 edition of the South African Health Review (SAHR) provided extensive information on a proposed NHI for South Africa (SA) from a variety of perspectives,2 while the 2011 edition3 provided an overview of the key issues contained in the Green Paper.
The principles that provide the basis for developing the NHI were made clear in the Green Paper. The NHI will improve access to quality healthcare services and provide financial risk protection against health-related catastrophic expenditure for the whole population. Such a system will provide a mechanism for improving cross-subsidisation, according to which funding contributions would be linked to an individual’s ability to pay and benefits from health services would be in line with an individual’s needs. Everyone will have access to a comprehensive package of healthcare services, provided through accredited and contracted public and private providers, with a strong focus on health promotion and prevention services at the community and household level. There will be clear lines of accountability at all levels of the health service and transparency of decision making. The NHI’s objectives are:
➢ to improve access to quality health services for all South Africans, irrespective of whether they are employed or not;
➢ to pool risks and funds so that equity and social solidarity will be achieved through the creation of a single NHI fund;
➢ to procure services on behalf of the entire population and efficiently mobilise and control key financial resources; and
➢ to strengthen the under-resourced and strained public sector in order to improve the health system’s performance.
Progress
The first five years of NHI development will aim at strengthening the public sector in preparation for new NHI systems, with the launch of the new central NHI fund envisaged in 2014/15. In the Green Paper a timetable was set for the development of the NHI. We review progress here against that plan of action.
NHI White Paper and legislative process
Following the launch of the Green Paper, the National Department of Health (NDoH) had several consultations with medical scheme administrators, labour, the pharmaceutical industry, professional associations for different occupations, statutory bodies, government departments, academia, civil society and parliament. Over 100 submissions were made to the NDoH. In December 2011 an international conference was held, with experts from a number of countries and institutions around the world sharing their experience of introducing NHI-like arrangements and moving to universal health coverage.4 The Minister of Health’s ‘road-show’ to each of the NHI districts involved meeting a wide range of stakeholders, including: independent doctors, mayors and councillors responsible for health, religious leaders, traditional leaders, managers of health
facilities, health workers and their unions, and principals and school governing bodies. All 11 pilot districts were included, which involved a total of over 15 300 stakeholders. The knowledge gained from the consultations will contribute towards the development of Government’s White Paper on National Health Insurance in consultation with the Treasury.
Experience from other countries has shown the importance of positioning health reform within a legal framework.5 Other legislative changes will be required for health service tariffs. Countries that have successfully introduced universal coverage have well established mechanisms for pooling funding that address equity, efficiency, and sustainability of health expenditure.6 The White Paper is expected to be launched in 2013, after which there will be further consultations and completion of a final NHI Policy Document. At this point the NHI legislative processes will commence.
Management reforms and designation of hospitals
➢ Publication of regulations on designation of hospitals: Regulations on designations of hospitals and policy on management were released for public comment on 2 March 2012.7 They provided clarity on the categorisation of hospitals into districts (small, medium and large), regional, tertiary, central and special (e.g. psychiatric) and the services that should be provided within each. This has allowed for chief executive officer (CEO) job descriptions to be more clearly defined – a key step in ensuring the appointment of competent and skilled managers, the decentralisation of management and the development of accountability frameworks.
➢ Policy on the management of hospitals: The separation of purchaser and provider functions is of particular importance for the management of hospitals. These complex institutions need highly skilled, empowered senior managers to ensure efficiency and the provision of quality services. The NDoH has prepared draft guidance for strengthening all hospital boards in the public sector. In addition, the NDoH is aiming at stronger oversight and greater accountability of central hospitals. Work has started with three central hospitals in Gauteng (Charlotte Maxeke, George Mukhari, and Steve Biko). These hospitals render highly specialised tertiary and quaternary service on a national basis and are a platform for the training of health workers and research. They also function as referral units for the other hospitals and employ highly trained staff. Initial work has focused on revenue generation, collection and retention as a first step in strengthening their information and administration systems.
➢ Advertisement and appointment of health facility managers: Following the assessment of competencies of all public sector CEOs, the filling of 86% (102) of the 118 new CEO positions has been completed. In future, all senior managers will need to undergo specialist training and be accredited by a newly established South African Leadership and Management Academy.
National Health Insurance: The first 18 months 2
SAHR 2012/13 23
National Health Insurance: The first 18 months 2
Hospital reimbursement reform
Regulations are in place to allow hospitals to raise revenue from the clinical and other services they provide to those who have access to other sources of financial protection. The 2009 Uniform Patient Fee Schedule (UPFS) was developed to provide a simpler charging mechanism for public sector hospitals.8 Various initiatives are progressing and are described below.
➢ Central hospitals: To prepare hospitals for the future NHI the World Bank is assisting the NDoH with a project to improve administration and management capacity in three of the central hospitals in Gauteng. The project focuses on: upgrading information technology infrastructure; improving financial management; and identification and implementation of efficiency savings in work-flow processes using short-term placement of interns to prepare for new financing mechanisms. Information Technology (IT) ‘rescue-plans’ have been de-veloped for the three hospitals. A case study on the financial management processes in Charlotte Maxeke has been written, which covers new models of financial management under the NHI. The work has also identified an additional R37 million over five months from users covered by medical schemes.
➢ Other sources of income: The revenue derived from patient fees is a consistent funding stream to augment current operational budgets. Revenue enhancement strategies aim at improving revenue collection, resource management and administration, with a financial incentive to retain surplus revenue generated. Revenue collected by provinces is directed into the provincial revenue fund, which is incorporated into the annual budget allocation. The revenue performance for the two past fiscal years was R842 million in 2010/11 and R671 million in 2012/13 (up to third quarter) totalling approximately R1.5 billion. Details are as follows:
- Road Accident Fund (RAF): The potential to improve revenue collection from the RAF is considerable. The NDoH was previously hampered by limited liability for certain road accident victims, but since the change in legislation in 2003 the NDoH has displayed a positive revenue growth. Challenges still persist in respect to the onerous processes of lodging claims against the Fund. The NDoH collected a total of R630 million in 2010/11 and 2011/12 (up to the third quarter);
- Medical schemes: Raising funds from medical schemes has proven to be difficult, as medical scheme rules create barriers to effectively collect revenue due to the application of prescribed minimum benefits. The NDoH has collected a total of over R408 million for this period. More work is now required on reimbursement reforms to raise revenue from medical schemes.
- Intergovernmental organs: The public sector also raises funds from providing services to other state organs. The total income generated was R299 million.
- Subsidised patients:a The NDoH statutory obligation is to decrease or eradicate any user fees raised against the patients who should be subsidised patients. Currently, this
a “Subsidised patients’” are those who do not fall in the category of full paying patients (as per the national UPFS guidance). Subsidised patients are also categorised on their ability to pay for health services: H0 (fully subsidised); H1 and H2 (partially subsidised).
obligation cannot be fulfilled because of a lack of patient identification systems. The income generated from those without medical scheme cover (including those who should be subsidised) equates to R175 million over this period.
➢ Coding systems: The implementation of the NHI will also require a comprehensive health service coding for hospitals and other health establishments and work required in this area is being mapped out.
- Diagnostic coding: An ICD-10 coding system exists in South Africa9 (SA) but is not yet operating satisfactorily in all public health institutions whereas the private sector uses it for billing purposes. The Minister of Health has appointed a task team to advise on necessary changes that must be considered in SA and to keep pace with changes that are implemented internationally. The task team has sub-groups working on morbidity, mortality, privacy and confidentiality, and communications and monitoring. A key priority for 2013 is training and improving the skills of those involved in coding.
- Procedural and other coding: There is no standardised National Procedural Coding System available in SA, which leads to fragmented procedural coding systems. To compound this problem, the Intellectual Property (IP) of these different procedural coding schemas is in the hands of private organisations. It is important, therefore, that a process of developing all these different coding schemas into a preferred standardised national coding system commence as soon as possible. Such a schema will ensure that government is able to do version controls and updates without seeking permission from IP holders. When a preferred schema is identified, it will be customised to suit the South African health sector environment. A case-based hospital payment system (based on Diagnostic Related Groupsb) is being piloted in several hospitals including: Umtata (Eastern Cape), Universitas (Free State), Inkosi Albert Luthuli (KwaZulu-Natal), and Steve Biko (Gauteng). Other coding systems that will be required include unique provider numbers, facility numbers, specialty codes, and a laboratory-results coding system. These codes will need to be contained collectively in some form of ‘National Health Data Dictionary’, as in other countries.10
Establishment of the Office for Health Standards Compliance
The National Assembly will shortly vote on the final version of the National Health Amendment Bill required for the Office for Health Standards Compliance (OHSC) to be established in 2013 following promulgation by the President.11 The objectives of the Office are to protect and promote the health and safety of users of health services by (a) monitoring compliance by health establishments with norms and standards prescribed by the Minister in relation to the national health system; and (b) ensuring consideration, investigation and disposal of complaints relating to non-compliance with prescribed norms and standards in a procedurally fair, economical and expeditious manner. It will have three sections. The first will be an inspection unit that will arrive unannounced to check and report
b Diagnostic Related Groups: A patient classification scheme that provides a means of relating the number and types of patients treated in a hospital to the resources required by the hospital, as represented by a code.

24 SAHR 2012/13
on compliance, with problematic hospitals having frequent visits, and others less frequent. The second will be an ombudsperson to whom dissatisfied members of the public can complain. Finally a certification unit will certify every health establishment that meets the required standard or withdraw certification as part of a set of progressive sanctions. Improvement in the quality of services through ensuring compliance with standards will remain the responsibility of health service providers.
Public health facility audit, quality improvement and certification
➢ Audit of health facilities: An audit of all 3 880 public sector facilities has now been completed. This covered all public health facilities (including clinics, community health centres and district, regional, specialised and tertiary hospitals) in all nine provinces and used standardised measurement tools.12 The assessment included the range of health services provided, the profile of each facility, the state of the physical infrastructure, the availability and basic functionality of medical equipment, the degree of compliance with national quality standards, the allocation and availability of human resources, the status and utilisation of Health Information Systems, the utilisation rates of healthcare services and facilities and the budget and expenditure reports for the health facilities.
➢ Facility improvement teams (FITs): These teams have been established, trained in quality improvement13 and started in the NHI pilot districts, to strengthen the supervision of services and help ensure that the many problems identified in the audit are systematically addressed. Approximately 1 000 facilities have been covered. There is a need now to systematically scale up the initiative, whilst evaluating and learning from the current experiences and successes, as shown in Boxes 1 and 2. Some problems are more systemic and require longer-term strategies to improve leadership and culture.
Box 1: Facility Improvement Team (FIT): Sedibeng – reducing waiting times
The overall methodology of FITs is to focus on the worst performing facilities according to data obtained in the national audit and use the best performing facilities as local benchmarks for comparison.
Discussions with staff covered the six priority areas – availability of medicines, cleanliness, patient safety, infection prevention and control, positive and caring attitudes and waiting times. The last area was a particular concern in the district.
Sub-district ‘FITs’ were formed, led by sub-district managers, and the problem of waiting times assessed using root cause analysis, and process maps to identify bottlenecks. (see Figure 1)
Problems were categorised into those that could be sorted out immediately and those that had to be taken up with provincial authorities, such as that many of the facility managers were acting and critical staff vacancies existed.
‘Quick win’ improvements were then designed to improve waiting times. (See Figure 2) These included re-organising the waiting area, arranging triage by a professional nurse and having fast queues for emergencies, children, family planning and pregnant women. Other ‘best practices’ identified included a booking system for chronic diseases, and vital signs, laboratory tests and dispensing done by the primary health nurse in each consulting room. Regular reviews were done by ‘quality circles’ where teams discuss performance on a daily basis.
Box 2: Facility Improvement Team (FIT): Pixley Ka Seme – community participation and partnership
The FIT took the following innovative approach to their work. They constituted teams consisting of a national, provincial and district member for each sub-district. By the end of July 2012, a facility improvement plan was developed for each facility in the district. This gives every facility certain targets at certain times to achieve. Meetings were held with Mayors and role players in all the sub-districts. As a result a stakeholder forum for each sub-district was established. Community dialogues on health issues were started in one sub-district. The stakeholder forums, led by the Mayors, meet monthly to assess progress attained in addressing challenges and assess individual facility performance in respect to performance in the six quality priority areas and other health service delivery matters. Facilities then had to report monthly on progress made. For each of the sub-districts there has been substantive progress. Despite the major problem of insufficient staff, many quick wins were identified and resolved with the help of the community.
➢ Inspection of facilities: The work of the OHSC has already started, with inspectors recruited and trained to carry out inspections of public facilities on a voluntary basis. By end January 2013, 171 establishments had been inspected against the national standards and the results discussed with facility managers, with a further 80 inspections planned by end March 2013. These are “mock” or training inspections at present, with both the tools and the procedures being progressively refined, and the norms to be prescribed still being developed. They have thus far covered every province and all types of hospitals and primary care establishments, although the numbers are still small and should be interpreted with caution. Initial results show that central hospitals (as would be expected) are closest to the probable future compliance threshold of 80%, although with a range between 59% and 92% in the overall scores, and even the top-performing hospitals presenting with areas requiring improvement. District hospitals, community health centres and clinics have been further from the desired threshold, with a significant proportion scoring below 50% overall (with some as low as 24%) though with some excellent establishments in this same group scoring over 90%. Re-inspection visits to review whether corrective action has resulted in an improvement will be initiated from April 2013, focusing on the highest-risk and lowest-scoring establishments. Direct feedback and validation has been built into the routine of each inspection, for each individual unit and for the establishment as a whole. This is used to convey the intent of the standard being assessed and the gaps found in a process that is acknowledged by establishments as contributing to their knowledge and understanding. Once the OHSC becomes properly established, inspections will be mandatory, in both the public and private sectors. Great effort has therefore been put into an extensive communication process. Since late 2011, national meetings on this matter in every province have been followed by extensive dissemination throughout the health services. This effort is currently being reinforced, with a focus on effective ways of reaching frontline staff and using recognised quality improvement methods to close identified gaps.
➢ Inspection of NHI districts: The Inspectorate has started inspections in 8 of the NHI pilot districts and will be increasing the coverage in the coming months to reach 15% coverage of establishments. The overall audit scores vary per district and also per type of establishment, with hospitals generally scoring higher than clinics in the same district. The inspections

National Health Insurance: The first 18 months 2
SAHR 2012/13 25
National Health Insurance: The first 18 months 2
Entry into the facility
Waiting in 1st queue 60 minutes
Waiting in 3rd queue 60 minutes
EXITAfter 240-300 minutesRecord exit time
Waiting in 4th queue for medication/Doctor
Consultation 20 minutes
Registration 80 minutes Record entry time
Waiting in 2nd queue 60 minutes
Taking vital signs 20 minutes
Figure 1: Process map to identify bottlenecks, developed by Sedibeng Facility Improvement Team
Entry into the facility
1st queue TB, HIV and other new chronics
3rd queue Children and pregnant women
Collect medication from pharmacy
Waiting times for each group be 120-180 minutes set target
Registration Record entry time in file
2nd queue e.g. family planning, medication collection
Vital signs taking
Triaging and sorting clients
Figure 2: Planning to reduce waiting times, Sedibeng Facility Improvement Team

26 SAHR 2012/13
have included an assessment of four NHI pilot district offices as they are involved in critical components of the delivery of quality care, although they are not strictly “health establishments”. These offices (or even provincial offices in some cases) implement a number of support services such as human resources (HR), finance, procurement or infrastructure. District offices should play a key role in providing leadership, oversight and support in relation to compliance with the core standards in all establishments for which they are responsible. The district offices that were inspected, however, found this to be a new concept and something they are not well-prepared to do, scoring low in assessments.
Primary health care re-engineering
If SA is to provide access to quality health services for all its population, experience from other parts of the world shows that effective primary health care (PHC), with a focus on prevention and health promotion, must be at the centre of service delivery.14-15 Services need to be based within all communities to promote good health and prevent ill health and act as the first point of contact for most health care.16 This will provide some balance to the current dominance of hospital-centred curative care.17 The PHC platform in SA is being established across the country based as three complementary components, referred to as streams.18
➢ District Clinic Specialist Teams (DCSTs): These newly established teams will focus on improving both the quality of health care and health outcomes for mothers, newborns and children.19 As of December 2012, over 43% of positions have been filled, with a target for every district to have a dedicated senior obstetrician and gynaecologist, paediatrician, family physician, midwife, paediatric and PHC nurse. Their induction and orientation programme is now underway with five modules to be completed over one year:
- status of maternal child health in SA and the national vision for the DCST and PHC;
- team building, role clarification and tools for conducting baselines;
- clinical orientation; leadership, mentoring and coaching; and
- outreach support.
The induction programme is well underway in KwaZulu-Natal, Gauteng, Limpopo, North West and the Free State, with a schedule having been agreed upon for all the remaining provinces.
➢ Municipal ward-based primary health care: Evidence from many countries suggests that provision of home- and community-based health services and their links with fixed PHC facilities in particular are critical to attaining good health outcomes, especially child health outcomes. Literature has shown that the role of community health workers (CHWs) in many countries has contributed to better health outcomes.20 Each municipal ward in SA will have one or more PHC outreach teams. These teams are composed of a professional nurse, environmental health and health promotion practitioners, as well as CHWs. The main functions of these teams is to promote good health and prevent ill health through a variety of interventions based on the concept of a healthy community, a healthy family, a
healthy individual and a healthy environment. Approximately 25% of the 40 000 CHWs have been re-trained in the new, national approach to community-orientated PHC. While this brings many challenges, and may take some time to implement fully, the CHW will be at the centre of the future PHC system and the contact point for all households.
➢ School-based PHC services: The new national Integrated School Health Policy was launched with the Departments of Basic Education and Social Development in October 2012.21 A database of school nurses has been established by the NDoH. The policy focuses on the most disadvantaged schools in the country. School nurses will be supported by mobile clinics to provide preventative and promotive services, reduce health barriers to learning, and facilitate access to health and other services where required. In 2012 an additional 30 mobile clinics were deployed and a further 60 are currently being purchased by the NDoH. The package of services includes:
- Health education and promotion – including: nutrition and exercise; personal and environmental hygiene; chronic illnesses (including HIV and TB); abuse (sexual, physical and emotional abuse, including bullying and violence); sexual and reproductive health; menstruation; contraception; sexually transmitted infections (STIs) including HIV and AIDS; male circumcision including male medical circumcision (MMC); teenage pregnancy; choice of termination of pregnancy (CTOP); prevention of mother-to-child transmission (PMTCT) of HIV; HIV counselling and testing (HCT) and stigma mitigation; and mental health issues including drug and substance abuse, depression, anxiety and suicide.
- Learner assessment and screening – including: conducting vision, speech and basic hearing screening; measurement of height, weight and calculation of body mass index (BMI) linked to appropriate nutritional interventions; checking for fine and gross locomotor problems; conducting oral health screening; screening for chronic illness or long-term health conditions, including both communicable diseases, (such as TB and HIV and AIDS) as well as non-communicable diseases; and performing a basic mental health and/or psychosocial risk assessment.
Public hospital infrastructure and equipment
Work is underway to enable provinces to plan, manage, modernise, rationalise and transform infrastructure.
➢ Refurbishment and equipping nursing colleges: To date over 70 nursing colleges and schools are being refurbished as shown in Table 1.

National Health Insurance: The first 18 months 2
SAHR 2012/13 27
National Health Insurance: The first 18 months 2
Table 1: Refurbishment of nursing colleges, 2012
Province Number of nursing colleges refurbishedEastern Cape 11Free State 4Gauteng 15KwaZulu-Natal 12Limpopo 6Mpumalanga 4Northern Cape 1North West 8Western Cape 11
➢ Refurbishment of public sector facilities: The NDoH is now following up with provinces for them to respond to the issues identified in the facilities audit. This includes:
- expanding on existing facilities where there are problems with space, but where there is room for expansion;
- fixing and repairing problems that were identified in the audit, such as dilapidated facilities;
- building new infrastructure where long-term solutions are required; and
- where there are acute problems of access, supplying services through mobile or prefabricated facilities.
➢ Building of flagship hospitals and medical facilities through public-private partnerships (PPPs): Major infrastructure projects are also underway in the tertiary centres. Feasibility studies are at an advanced stage in five centres: Polokwane Academic Hospital (Limpopo), Chris Hani Baragwanath Academic Hospital (Gauteng), Dr George Mukhari Hospital (Gauteng), Nelson Mandela Academic Hospital (Eastern Cape), and King Edward VIII Hospital (KwaZulu-Natal). The pre-qualification of six international and national competitors has been completed for the bidding for the design work.
Human Resources for Health
➢ National Human Resources for Health Strategy: The strategy was launched in October 2011.22 Work has started on the determination of norms and staffing needs for the country for primary and secondary care. This is being done with support from the World Health Organization (WHO) using the Workload Indicators of Staffing Needs (WISN)23 method with the aim of improving the HR data extraction, capture and analysis. This will ensure the appropriate level and mix of staff at facilities. Six provinces have been trained in WISN and it will be used within all 11 NHI pilot districts to estimate and cost future staff requirements. The challenge posed by the various professional categorisations is being resolved following the completion of the review of the Occupational Specific Dispensation. The report has been completed and its recommendations are now being implemented.
➢ Leadership and Management Academy: As envisaged in the human resources for health (HRH) strategy, the Leadership and Management Academy was launched in October 2012.24 Its vision is to be a centre of excellence and a beacon of good practice in health leadership and management. Its aims are to develop outstanding leadership and management in health in order to improve people’s health and their experience of the
NHI. It will create an industry-wide benchmark of accredited programmes for all levels of leaders and managers, com-missioning programmes necessary to meet identified needs and identifying, developing and promoting best practice. The academy recognises that good leadership and management are about improving health equity and outcomes, committing to professionalism, championing equality and diversity, and encouraging innovation and continuous improvement. The committee’s first task was to prepare an induction and orientation programme for the newly recruited CEOs, which took place over five days in early February 2013 for 88 of the 102 newly appointed CEOs. Various national and international experts are now working together to inspire and encourage this new group of leaders to respond to their needs and concerns and to facilitate sharing of experiences and best practices through teamwork and support. A longer-term programme of support and development will be based on the individual needs of CEOs.
➢ Increase in production of doctors: Training of new doctors has been increased through increasing the intake in training institutions and sending 1 000 medical students to Cuba to be trained. Since the launch of the strategy, an extra 40 doctors started training in SA in 2011/12 and 125 in 2012/13. Also, 95 medical specialists are being recruited from Cuba and will start work in SA in 2013. In addition, the number of professionals undertaking community service is steadily increasing, with 7 162 placements across all provinces in 2012, covering doctors, dentists, pharmacists, and other specialties.
➢ Increase in production of nurses: In October 2011, the Minister of Health appointed a task team on Nurse Education and Training to take forward the recommendations from the April 2011 Nursing Summit. This has resulted in a National Strategic Plan25 being completed in February 2013. Nursing colleges will be declared higher education institutions in compliance with the provisions of the Higher Education Act (as amended in 2008). Nurse Education and Training is be regarded as a national competence accounting to the Director-General of Health to help address current provincial inequalities, decrease fragmentation and improve national clinical training and accountability. The South African Nursing Council (SANC) will be requested to develop and finalise an accreditation framework for Nursing Education Institutions. The task team also recommended that nursing students be awarded the status of full student (rather than employee) while undergoing their training and that clinical education and training be strengthened. A Continuing Professional Development (CPD) system for all nurses and midwives, linked to licensing and professional progression, will be introduced and include professionalism and ethics as a compulsory component. Provision of a uniform allowance will be phased out and will be replaced with the direct provision of contemporary white uniforms provided by employers. An office of the Chief Nursing Officer (CNO) is to be established and will facilitate the development and implementation of the national core curriculum for nursing and also a national framework for financing nurse education and clinical training to overcome current inefficiencies and inequities. These actions will help bring clear leadership and management nursing structures

28 SAHR 2012/13
at all levels of government health services. The standards for the Positive Practice Environment (PPE) are in the national core standards, and will be extended to cover other recommendations in the MTT report. National nursing norms will be finalised to strike a balance between ideal staffing, what is a safe and what is affordable using a combination of the WHO’s population-based norms and an activity based workload approach in SA.
Information management and systems support
An effective NHI is reliant on an effective set of information systems that helps health workers and facility managers keep track of the services and the quality of care provided, and for the contracts between purchasers and providers to be properly monitored. Considerable efforts are required to improve the quality, coverage and standardisation of information across the public and private healthcare systems. While much still needs to be done, progress has been made in some critically important areas such as the e-Health strategy (see below) which was officially launched in 2012 and an agreement on national indicators and targets for the priority areas in the NSDA for health,26 through the work of the Health Data Advisory and Coordination Committee.27 Norms and standards for national health and information systems have been developed in partnership with the CSIR. In addition a variety of initiatives designed to improve the health information system in the country have been undertaken. These include the following:
➢ National Health Information Repository and Database (NHIRD): The vision of NHIRD is to provide up-to-date information on routine National Indicator/Data Sets (NIDS) data and indicators and to provide a unified and integrated repository for data such as the annual HIV and syphilis survey, demographic and health surveys, child health and HIV counselling and testing campaigns, aggregated financial data from the basic accounting system (BAS) and municipal financial systems including District Health Expenditure Review (DHER) data, HR data from government (PERSAL) and municipal HR systems, and a range of data sets from other government departments (e.g. Statistics South Africa, Human Sciences Research Council, Medical Research Council) and national and international development partners. This national database is now established and also contains data from the audit of all public sector facilities. It also has information on service access and determinants of health (e.g. deprivation and household income) and is being made available to provinces. In the future it will be routinely available to districts and service providers.
➢ Data capturers: The District Health Management Information System (DHMIS) Policy approved in October 201128 stipulates different categories of Health Information Systems (HIS) personnel required at different levels of the health system, including data capturers responsible for capturing the data at all fixed facilities, sub-district or higher levels, and then forwarding the data to the next level. By the end of 2011/12, a total of 1 721 cadres had already been appointed, with an additional 550 employed by December 2012. These are young unemployed South Africans with at least a matriculation
certificate, who are recruited by the NDoH, and sent for training. During 2013/14, a total of 503 of these data capturers will continue to work in the public health sector on contracts and the NDoH aims to add 900 additional data capturers in 2013 to meet its target of 3 535.
➢ Information Communication and Technology (ICT) graduates: As part of the internship programme for young, unemployed South African graduates, 137 graduates with IT were employed. They have been provided with opportunities to gain work experience in the public health sector and will prove to be an invaluable asset for health information systems strengthening in SA in the near future.
➢ Patient records: Many innovations using both simple and complex electronic systems are being used across the country. This is an area that requires further work for both primary- and hospital-based care.
Strengthening of District Health Authorities
➢ NHI district management and government structures: One of the gaps in the health sector is building a strong cadre of executive leaders capable of managing the complex healthcare environment and leading the re-engineering of PHC and hospitals in the build-up to the NHI rollout. The South African Executive Leadership Programme in Health (SAELPH) is one initiative that will help to fill this transformation gap. It is a partnership involving the University of Pretoria (UP), the University of Fort Hare (UFH), the Harvard School of Public Health and others in collaboration with the NDoH. Since its start in 2012 it has engaged 60 district managers in its programme on “Transformation of Health Districts” and a further 30 on “Leadership in Health Districts”. It also holds policy seminars and round table meetings, including ones on NHI and pilot districts that enable district managers to engage with national and international experts and policy makers.29 Preparatory work to develop District Health Authorities is a priority for 2013 and this is now underway.
➢ NHI pilot districts: In April 2012 the first wave of 11 pilot districts were announced. The districts are situated in every province and specifically in areas with high levels of under-served communities. (See Table 2) The specific aims of the district pilots are to:
- assess the ability of districts to assume greater responsibility with a ‘purchaser-provider split’;
- assess the feasibility, acceptability, effectiveness and affordability of engaging the private sector; and
- assess the costs of introducing a fully fledged District Health Authority and implications for scaling-up.
District NHI Business Plans provide an opportunity for ‘bottom-up’ learning and experience to inform central NHI-related policy and the rollout of reforms to other districts.30

National Health Insurance: The first 18 months 2
SAHR 2012/13 29
National Health Insurance: The first 18 months 2
Table 2: NHI pilot districts
District (Population, 2012) Province OR Tambo (1 754 499) Eastern Cape Thabo Mofutsanyane (771 610) Free State City of Tshwane (2 520 435) GautengAmajuba (517 279) KwaZulu-Natal uMgungundlovu (1 071 606) KwaZulu-Natal Umzinyathi (517 806) KwaZulu-Natal Vhembe (1 312 197) Limpopo Gert Sibande (946 719) MpumalangaPixley ka Seme (192 572) Northern CapeDr Kenneth Kaunda (905 675) North West Eden (567 993) Western Cape
Some additional funds have been made available through a conditional grant to catalyse initiatives to strengthen the district health system, to improve access to quality health services, to look for efficiencies, to improve health system performance, and to improve management of services. Links between the pilot districts and academic groups specialising in health systems and public health research are being encouraged to provide some rigour to the learning process. This work will inform national debate on the options and costs for establishing stronger management and accountability mechanisms at the district level through establishing District Health Authorities. Implementation will require considerable efforts to strengthen the capacity of existing district management teams and their oversight mechanisms in areas such as financial management, planning, monitoring, evaluation and contracting.
➢ The service package to be offered under the NHI pilot sites: International experience on defining a package of services to be made available under the NHI has been carefully reviewed, and a starting point for SA is the Minister’s agreement of a ‘non-negotiable’ set of services to be universally available.31
The NDoH is now overseeing work to ensure that all these are adequately budgeted and provided for as part of the national and provincial support to districts.
NHI Conditional Grant
The NDoH has made available R150 million to develop new systems and capacities in pilot districts and central hospitals, provided through a new conditional grant as mentioned above. These grants will fund the implementation of ‘NHI business plans’ in all of the 11 pilot districts and average R11.5 million in each district.30 The main purpose is to pilot and test new interventions required for the successful implementation of NHI so that those that are shown to work can be rolled out more widely. They will see a scale up of activities in 2013/14 including R300 million from the grant, and R450 million in 2014/15.32 These grants include R5 million to strengthen revenue collection and related systems and test innovations around revenue retention and management in central hospitals.
Costing
Background work on two costing models was done prior to the release of the Green Paper. One was a costing model based on work by McLeod et. al.33 who explored a range of alternative assumptions about the scope and efficiency of health service delivery. Using data from existing medical schemes with different
kinds of benefit combinations, they estimated fully comprehensive benefits to cost R234 billion. However, costs varied hugely depending on the comprehensiveness of benefits included and the service delivery efficiency assumed, ranging from R78 billion to R334 billion. The Actuarial Society of South Africa (ASSA)34 also developed a comprehensive costing model drawing on medical scheme data. They estimated that a comprehensive package, with efficiency savings, would cost R235 billion, similar to the previous model, but that it could be as high as R336 billion for NHI at full implementation in 2025/26, if modelled on the current private sector. The Treasury and the NDoH have now taken forward more detailed costing work.
➢ Costing based on NHI Pilot Districts: The NDoH has com-missioned a detailed costing exercise in the 11 NHI pilot districts to inform future planning. This will focus on the specific intervention requirements for each pilot district: including strengthening District (and sub-district) Management Teams and creation of District Health Authorities, comprehensive service benefits, strengthening health facilities, the three PHC streams, contracting private providers, emergency medical services, strengthened referral systems, and other preparatory activities related to specific district needs. The work is now underway and will be completed in the first half of 2013.
➢ Green Paper model: The resource requirements for NHI set out in the Green Paper were derived from a model built on projected utilisation trends by five year age-group and average-unit costs. A revised version of these projections has been prepared by the National Treasury, based on more recent estimates of the costs of the NHI pilots and other reforms currently being implemented. Implicit in this projection is a partial shift over time from medical scheme coverage to NHI, as NHI becomes fully functional and citizens gain trust in the system, and the broadening of NHI coverage to include purchasing of some private services. This transition cannot be adequately modelled yet, as it depends on the NHI benefit design and medical scheme regulatory reforms that are both complex and inter-related.
➢ Determinants of healthcare costs: There are broad similarities in the results of the costing models. However, a great deal of variation can be obtained by adopting alternative inputs and assumptions, providing insights into the future costs of NHI:
- Demographic projections: Changes in the population structure and its epidemiological profile significantly affect changing health needs, including a likely shift in the burden of disease from communicable to non-communicable diseases.
- Health inflation: Various factors tend to drive health sector costs above consumer price inflation – these include rising professional qualifications and remuneration levels, new technologies, new equipment and improved drugs.
- Utilisation changes: Hospitalisation and primary care visit rates tend to rise as incomes and education levels rise, but there is considerable variation internationally. There is scope for shortening lengths of stay in hospitals through improved case management, appropriate self-care and alternative options for complementary or alternative private provision.

30 SAHR 2012/13
- Benefit packages: A critical set of policy choices concerns what should be included in the universal service package and what should be excluded and might be covered through top-up benefits or insurance options.
- Unit costs of improved resourcing: It is recognised that public services need to be better resourced to improve quality, but there is also scope for better use of existing resources through use of appropriate referral rules, diagnostic and therapeutic protocols and rationing some procedures.
- Provider payment methods: International experience shows us that the way in which hospitals and medical service providers are paid influences both volume and price of services delivered. Costs can be contained through volume-based global budgets and case-load payments for hospitals, and through bundled capitation payments rather than fee-for-service charges for general practitioners and other primary care providers. However, this brings considerable complexity into the negotiation and management of alternative reimbursement arrangements and it will take time to implement payment reforms.
- Supply side constraints: Service delivery expansion will be limited over the medium term by capacity limits, including the availability of doctors and professional nurses, and the time needed for improvements in health infrastructure.
➢ Conclusions from costing work: The design of an NHI system and the effective management of health financing reforms offer wide-ranging opportunities for containing costs and improving efficiency. A gradual and phased set of reforms is more favourable than a big-bang approach, with progressive re-evaluation as the country proceeds along the path to NHI.
Population registration
A partnership has been established with the Department of Science and Technology and consultations with the Council for Scientific and Industrial Research (CSIR) are underway on population enrolment for NHI and linkage to facilities. Considerable data is already available in the Department of Home Affairs (through identity documents) and public health facilities. A strategy for filling in gaps is being defined, which will then be piloted to learn lessons before agreeing a full acquisition strategy for a population register.35
Information Communication Technology
The NDoH recently launched its e-Health strategy to harness information communication technologies to help transform the health system.36 This strategy aims to resolve the problems of the past, clearly articulated in the NSDA 2010-2014:
Although large sums of money have been used to procure health ICT and Health Information Systems (HIS) in SA in the past, the ICT and HIS within the health system is not meeting the requirements to support the business processes of the health system thus rendering the healthcare system incapable of adequately producing data and information for management and for monitoring and evaluating the performance of the national health system. This results from the lack of technology regulations and a lack of policy frameworks for all aspects of infrastructure delivery.
The new strategy is based on a set of principles starting with getting the basics right (infrastructure, connectivity, basic ICT literacy, human resources and affordability planning). It proposes an incremental approach, building on what already exists and looking for early wins in implementations and benefits to build the confidence of health professionals, patients and the public. It aims to constantly evaluate and measure improvements in order to build an evidence base. National coordination will come through enabling integration between systems, enforcing common standards, norms and systems and establishing common data standards and terminology across information systems. A collaborative approach is required, which will leverage partnerships with the private sector, NGOs, other government departments, other country governments, and research organisations. Lessons globally show the importance of protecting information, confidentiality and patient privacy at all times and promoting information governance in order to use information better. Getting value for money is a key consideration, including consideration of available open source solutions. A key aim is to build the capacity and the systems to obtain official health statistics from a single official source and adhere to the established principles for national HIS information management. Another key principle is that the intellectual property ownership of public sector e-health initiatives should be vested in government.
Establishment of the NHI Fund
The pre-payment of all health services under the future NHI will be through a central fund, with its own management arrangements and governance mechanism. Work has now started on the different options for the roles, responsibilities and relationships of the future NHI funding body, building on considerable and well documented international experience.37 Key to successful NHI implementation is the introduction of financial incentives to improve performance, create efficiency gains and control costs. The future “purchasing” and provider payment systems should be linked to service delivery and management improvements. As for the options for funding the NHI, the Treasury is completing its work for the future NHI including consideration of a payroll tax (payable by both employees and employers), a higher value-added tax rate or surcharge on taxable income, or some combination of these. A paper will be available for comment and consultation later in 2013. Also, under the NHI, national procurements will become increasingly important to gain from efficiencies of scale, and a national unit has been set up to manage this.
Accreditation and contracting private providers
Under the future NHI, there will be a clearer delineation of functions, between those responsible for purchasing of services, and those many providers, both public and private, that can provide them. It will be several years before this ‘purchaser-provider split’ will be fully operational, but opportunities are already arising for exploring these new relationships.
➢ Contracting General Practitioner services: From early 2013, the NDoH will start contracting approximately 600 private general practitioners (GPs) to provide services in the 11 pilot NHI districts. They will be located in facilities for communities that are currently under-served. The GPs will provide services that enhance the current PHC model including:

National Health Insurance: The first 18 months 2
SAHR 2012/13 31
National Health Insurance: The first 18 months 2
- health promotion and preventative care, focusing on non-communicable diseases, maternal child health, HIV and TB;
- personal curative services for patients referred by the PHC nurses, ward-based PHC agents and school health teams;
- ensuring effective chronic disease management based on a chronic disease patient record;
- support to antenatal and postnatal care services as determined by the clinical protocols; and
- clinical governance including training and capacity building of the PHC team.
Future phases of this work will focus on locating GPs in clinics where there is currently insufficient space by expanding infrastructure and options for licensing and accrediting existing GP practices under the NHI.
➢ GP contract model: A new national contract model has been developed in collaboration with national and international experts in this area. The national contract will allow for a basic rate as for now, with allowances for the experience of the GP, the amount of travel, working in rural areas, and additional incentives for working in very deprived areas. In addition there will be performance incentives both financial and non-financial such as for Continuing Professional Development. These performance agreements will be agreed locally with oversight from the family physicians in the DCSTs. Initially they will cover basic activity data and simple measures of quality, such as quality of case records, referrals and adherences to HIV, TB and maternal child health protocols as judged by a regular review of case records by members of the DCSTs. The initial agreement will include an upfront commitment to move to more sophisticated performance assessments in future years, focusing on areas such as risk assessments (e.g., smoking activity and alcohol consumption), and finally on outcomes (e.g. the percentage of diabetic patients with blood pressure values under 140/90). GP academic centres in KwaZulu-Natal, Gauteng and the Western Cape will provide the induction and orientation programme for newly contracted GPs, in line with current programmes being used for DCSTs.
Challenges, risks and their mitigation
Consultation and communication: As the quality of public sector services improves, more people and employers are expected to use these facilities. This will have implications for the sector as a whole, requiring further analysis and consultation. Similarly, continued consultation will be required with the various health professions to better understand the implications of more services being required from medical specialists, GPs, and other health professions. Whilst the preparatory work for NHI is now well established, there is still much to be debated. The publication of the NHI White Paper will provide an opportunity to discuss the vision of the NHI and its implications with a wide range of stakeholders. Within districts more emphasis must be placed on discussing the NHI with local communities to better understand local needs and to help ensure expectations are consistent with future NHI plans and timetables.
Harnessing cost-effective health technology: Breakthroughs in technology can improve outcomes and make the delivery of services more efficient, but can be a key driver in raising the cost of services.
A policy and institutional mechanism is required to assess the cost effectiveness of new health technology and make recommendations for inclusion or not in NHI-funded services. This will then need to be backed up by appropriate legislation. Collaborations in this area are being explored with other countries, such as with the United Kingdom’s National Institute for Health and Clinical Excellence.
Making change happen: As with all major public sector reforms, changing the way districts and central hospitals function in the pilots will be difficult at first. The district work will now be overseen by senior Facility Improvement Project Managers in each province, reporting directly to the Head of Provinces and the NDoH. Once these project managers are all in place, implementation of the NHI business plans in each district should become easier, with more coherent and continuous oversight and supervision.
Building up our knowledge on what works: The experience of other major health sector reforms, such as in China and Mexico, have shown the importance of embedding evaluation, monitoring and assessment into the reform process. The slogan ‘experimentation, evaluation, expansion’ has been used by the current Minister of Health of China to summarise their approach to reform, which is happening on a large scale and parallels many of the challenges faced in SA.38 Learning from experience is critically important using the milestones from countries that have successfully reached Universal Health Coverage such as Brazil and Thailand and also form the monitoring, evaluation and operational research of the South African NHI pilot sites.
Retaining the focus on equity: Experience in many other countries shows that health reforms often do not benefit those for whom they are intended.39 A continued effort will be required to ensure that those who are currently under-served, such as in informal settlements and deep rural areas, get specific attention.
Way forward
SA is building a better understanding of what NHI is and why it must be implemented. There will likely remain many who question the policy for good and bad reasons, so continued consultation and dialogue by all players in society will be essential. The NDoH has agreed on a timetable for implementing the NHI, which is ambitious by international standards, but definitely possible. This review has shown that there has been good progress in many areas but in others there is still considerable work to be done. It will take time for these major changes in the financing and delivery of services to impact on people’s lives. Expectations of what will happen and when need to be carefully managed. As SA prepares to launch the White Paper on the introduction of the NHI, we are confident that we are on the right track. Universal coverage is no longer a dream for SA and if all players work together it will become an increasing certainty.

32 SAHR 2012/13
References
1 Minister of Health. National Health Insurance in South Africa Policy Paper. Government Notice 657. Government Gazette No. 34523, 12 August 2011.
2 Fonn S, Padarath A, editors. South African Health Review 2010. Durban: Health Systems Trust; 2010.
3 Padarath A, English R, editors. South African Health Review 2011. Durban: Health Systems Trust; 2011.
4 National Department of Health. National Health Insurance Conference: Lessons for South Africa. National Consultative Health Forum (NCHF); 7-8 December 2011; Johannesburg, South Africa.
5 The Lancet. Mexico: Celebrating universal health coverage. The Lancet. 2012;380(9842)622.
6 Savedoff WD, de Ferranti D, Smith Al, Fan V. Political and economic aspects of the transition to universal health coverage. The Lancet. 2012; 380(9845):924-32.
7 National Department of Health. Policy on the management of public hospitals. Pretoria: National Department of Health; 2011.
8 National Department of Health. Uniform patient fee schedule for paying patients attending public hospitals. Pretoria: National Department of Health; 2009.
9 National Task Team for the Implementation of ICD -10. South African ICD-10 Coding Standards. Version 5. Pretoria: National Department of Health and Council for Medical Schemes; February 2012.
10 Australian Institute of Health and Welfare (AIHW) 2012.National health data dictionary 2012, version 16. Cat. no. HWI 119. Canberra: AIHW; 2012.
11 Minister of Health. National Health Amendment Bill (Bill 24 of 2011). Government Gazette No. 34739, 8 November 2011.
12 Health Systems Trust.Project: National Health Facility Audit (Baseline Audit) [internet]. 2012 [cited 26 Feb 2013]. URL:http://www.hst.org.za/content/project-national-health-facility-audit-baseline-audit
13 National Department of Health. Quality improvement guide: Quality improvement – the key to providing improved quality of care. Pretoria: National Department of Health; 2012.
14 Macinko J, Marinho de Souza Mde F, Guanais FC, da Silva Simões CC. Going to scale with community-based primary care: an analysis of the family health program and infant mortality in Brazil, 1999-2004.MacinkoJSocSci Med. November 2007;65(10):2070-80.
15 Knaul FM, González-Pier E, Gómez-Dantés O, García-Junco D, Arreola-Ornelas H, Barraza-Lloréns M, et al. The quest for universal health coverage: Achieving social protection for all in Mexico. The Lancet. 2012;380(9846):1259-1279.
16 World Health Organization. The World Health Report 2008. Geneva: World Health Organization; 2008.
17 Mayosi BM, Lawn JE, van Niekerk A, Bradshaw D, Abdool Karim SS, Coovadia HM. Health in South Africa: Changes and challenges since 2009. The Lancet. 2012;380(9858): 2029-43.
18 Pillay Y, Barron P. The implementation of PHC re-engineering in South Africa. Public Health Association of South Africa [internet]. 15 November 2011. [cited 26 February 2013]URL:http://www.phasa.org.za/articles/the-implementation-of-phc-re-engineering-in-south-africa.html
19 Ministerial Task Team. District Clinical Specialist Teams in South Africa: Report to the Honourable Minister of Health, Dr Aaron Motsoaledi. Pretoria: National Department of Health; July 2012. URL:http://www.doh.gov.za/docs/reports/2012/District_Clinical_Specialist_Teams_in_South_Africa_Report.pdf
20 World Health Organization. Community health workers: What do we know about them? The state of the evidence on programmes, activities, costs and impact on health outcomes of using community healthworkers. Geneva: World Health Organization; 2007.
21 National Departments of Health and Basic Education. Integrated School Health Policy. Pretoria; National Departments of Health and Basic Education; 2012.
22 National Department of Health. Human Resources for Health South Africa. HRH strategy for the health sector: 2012/13-2016/17. Pretoria: National Department of Health; 2011.
23 World Health Organization. Workload indicators of staffing needs (WISN): User Manual. Geneva: World Health Organisation; 1999.
24 Minister of Health. Launch of the Academy for Leadership and Management in Health Care [internet]. 6 October 2012. National Department of Health [cited: 26 February 2013] URL:http://www.doh.gov.za/show.php?id=3806
25 National Department of Health. Strategic plan for nursing education, training and practice 2012/13 to 2016/17. Pretoria; National Department of Health; 2013.
26 National Department of Health. Negotiated Service Delivery Agreement. A long and healthy life for all South Africans. Pretoria: National Department of Health; 2010.
27 National Department of Health. Health Data Advisory and Co-ordination Committee report 2012. Pretoria: National Department of Health; 2012.
28 National Department of Health. District health management information system policy. Pretoria: National Department of Health. 2011.
29 South Africa Executive Leadership Programme in Health (SAELPH) [cited 26th February 2013] URL:https://www.sapartners.org/what-we-do/education/93-south-african-executive-leadership-program-in-health-saelph.html
30 National Department of Health. Business plans for the NHI conditional grant. Pretoria: National Department of Health; 2012.
31 Minister of Health. Presentation on NHI pilot districts [internet]. 22 March 2012. National Department of Health. [cited 26 February 2013] URL:http://www.doh.gov.za/docs/presentations/2012/nhipilot.pdf
32 Blecher M. National Treasury: Financing NHI and Pilot Districts. GEMS Annual Symposium 2012; 15-16 August 2012; Sandton, South Africa. National Treasury; 2012.
33 McLeod H, Grobler P, van der Berg S. Preliminary Estimate of NHI Costing in 2009 Rand Terms. McLeod-Grobler-Van der Berg Model Methodology and Assumptions. A briefing paper prepared for National Treasury; 18 February 2010
34 Actuarial Society of South Africa. Discussion Document: Burden of Disease. Actuarial Society of South Africa NHI Model; 8 March 2010.

National Health Insurance: The first 18 months 2
SAHR 2012/13 33
National Health Insurance: The first 18 months 2
35 Council for Scientific and Industrial Research. Information and Communications Technology in support of NHI. 4th Biennial Conference. Mathew Chetty. 9th October 2012 [cited 26th February]. URL:http://www.conference2012.csir.co.za/sites/default/files/ICT%20for%20NHI%20CSIR%20Conference%202012%20-%20Matthew%20Chetty.pdf
36 National Department of Health. e-health strategy. Pretoria; National Department of Health; 2012.
37 McIntyre D. What healthcare financing changes are needed to reach universal coverage in South Africa? South Afr Med J2012;102:489–90.
38 Eggelston K. Health care for 1.3 billion: An overview of China’s health system. Asia Health Policy Program working paper # 28. Stanford, California: Stanford University; 9 January 2012.
39 Gwatkin DR, Wagstaff A, Yazbeck AS. Reaching the poor with health, nutrition and population services: What works, what doesn’t and why. Geneva: World Bank; 2005.

34 SAHR 2012/13

PROOF
2 Mar 2013
SAHR 2012/13 35
Serv
ice D
eliv
ery

PROOF 2 Mar 2013
SAHR 2012/1336
Serv
ice D
eliv
ery

Author:
37SAHR 2012/13
3333333
Francois Venter
Wits Reproductive Health and HIV Institute, University of the Witwatersrand, Johannesburg
HIV Treatment in South Africa: The challenges of an increasingly successful antiretroviral programme
South Africa has both the most people with HIV in the world and the largest antiretroviral treatment (ART) programme. The programme, now almost a decade old, has been influenced by the complex political responses to the
epidemic in the country.
The programme is now internationally recognised as successful despite a slow start, and is responsible for recent dramatic improvements in South African life expectancy. However, the scale and cost of the programme have presented many challenges to the healthcare system and to funders. In addition, evolving HIV treatment guidelines constantly challenge healthcare delivery services, even while promising new data suggest that escalating treatment may be the most effective mechanism for preventing new infections.
This chapter examines the political, policy, programmatic and other issues surrounding the initiation and expansion of the ART programme.
The programme is now internationally recognised
as successful and is responsible for recent
improvements in South African life expectancy.
However, the scale and cost of the programme have
presented many challenges to the healthcare system
and to funders.

38 SAHR 2012/13
Introduction
The scale of the South African HIV epidemic remains huge. More HIV-positive people live in South Africa (SA) than in any other country. This is despite the fact that the country’s population is small when measured against those of China, India and the United States of America (USA), all of which acknowledge their HIV epidemics as significant public health issues.1-3 In population size SA dwarfs its neighbours. Combined with a very high prevalence, this means that there are more people with HIV inside its borders than all its immediate neighbours (Botswana, Lesotho, Mozambique, Namibia, Swaziland, Zimbabwe) combined, despite these countries having similar HIV prevalence rates.1,4,5
The HIV epidemic in SA until 1990 had a similar pattern to the European and American epidemics, small in number and predominantly affecting haemophiliacs, men who have sex with men (MSM), and intravenous drug users.6 The 1990s heralded a sudden and dramatic increase in new infections and, despite much research, the drivers of this increase are still poorly understood. Several theories have attempted to explain the increase, from sexual and cultural behavioural issues, to peculiar characteristics of the local virus, to medical practices, to inherent susceptibility of the local population. Data on how needle re-use as part of the syphilis and trypanosomiasis control programmes in the last century provided an explanation for the establishment of a central and East African epidemic do not satisfactorily explain SA’s epidemic.7-9 Commonly cited theories regarding distinct forms of sexual partnering as causally explaining the huge difference between southern African incidence rates and the rest of the world have increasingly been challenged.10 The lack of clarity about the driving forces behind the increase has meant that prevention efforts have been unsuccessful.
SA has several large independently run observational HIV prevalence studies, which have documented the growth of the epidemic in the past two decades, with some of the most accurate statistics on HIV prevalence in the world.5,11-13 Different robust mathematical models – with different assumptions and data use based on different surveys and observed cohorts – have been used to estimate total numbers of infections. These models demonstrate very similar findings and show that between 1.3% and 1.5% of South Africans, or just over 300 000 citizens, are currently infected annually. Some criticism has been expressed of the models’ continued accuracy, when taking into account increasing life expectancy and changes in CD4 thresholds.14 A large and complex HIV-positive paediatric population, previously estimated at 70 000 per year, has been part of the treatment challenge, but has decreased since the advent of effective prevention of mother-to-child transmission (PMTCT) programmes.
The extent of this adult and paediatric epidemic, both in absolute numbers and overall prevalence, has made SA a focus of public health advocates, donors, researchers and political commentators.15 Attention on SA has been magnified, as the world’s largest and arguably most ambitious antiretroviral (ARV) programme is being rolled out across the country at considerable expense.16 The government programme, available since April 2004, has transformed care from simple palliation for people dependent on the public sector to the institutionalisation of HIV as a chronic disease requiring life-long care. As of the end of 2012, about two million people were accessing antiretroviral therapy (ART), with a
projected return to normal life expectancy for those that started treatment timeously and very low mother-to-child transmission (MTCT) rates.15,17-19
Political and policy history of the South African HIV treatment programme
It is helpful to distinguish three politically related eras in ART care: pre-2004, during which period ART was not available in the public sector; 2004-2008, during which the public programme was launched and run, despite interference from senior political figures; and after 2008 which heralded a new political dispensation and a subsequent reorienting and scale-up of the programme.
In 2002, the head of the South African HIV programme assembled a group of clinicians and economists to design the ART component of the HIV programme. The political pressure leading up to this event was significant. The then Thabo Mbeki-led government had come under increasing pressure from local and international bodies for its public policy towards HIV, especially on the issue of ART usage and availability in the public sector.20 Owing to a variety of personal opinions in the ranks of senior leadership within the African National Congress (ANC) on the existence of HIV and the efficacy of ART, there was little coherence or leadership shown in the approach to HIV and its treatment.21 The Treatment Action Campaign (TAC), a South African civil society and community-based HIV treatment advocacy group, strategically employed mass protest, litigation and media interaction to leverage action from the National Department of Health (NDoH). The TAC together with the then AIDS Law Project (now Section27), a non-governmental organisation (NGO), legally challenged government policy on HIV treatment. Strategic alliances in these legal cases, which included large local clinician groups, such as the Southern African HIV Clinicians Society and Médecins Sans Frontières, allowed for a broad and united front against the government’s denialism, and against pharmaceutical patent holders as a means to decrease antiretroviral costs.5,21-25
The issue of denying HIV care on the basis of whether ART worked or not grew increasingly contentious. Internal to the ruling ANC, several senior members began advocating that treatment be available including Nelson Mandela.26 The Deputy Health Minister Nozizwe Madlala Routledge, a strong supporter of ART treatment, was dismissed in 2007, after she spoke out against government AIDS policy and coordinated broad consultation of a new AIDS plan.23,27,28
In 2009, Dr Aaron Motsoaledi was appointed as Minister of Health by newly elected President Zuma. Motsoaledi immediately made HIV treatment a priority in the NDoH. Since then, political controversy around the ART programme has dissipated. SA was introduced at the 2010 International AIDS Conference as a worldwide treatment success, with senior politicians receiving a standing ovation – a far cry from the country’s reception at the same conference a decade earlier.29
In addition, the South African National AIDS Council (SANAC), responsible for coordination of the HIV response between

The challenges of an increasingly successful antiretroviral programme 3
SAHR 2012/13 39
government and civil society, was revived in 2011 and led the generation of the widely acclaimed 2012-2017 National Strategic Plan (NSP).3 The political normalisation of the ART programme has allowed for focus on several scientific, medical and operational challenges that underpin the South African health system’s most ambitious programme.
The parlous state of HIV prevention has been revealed by the country’s surveys, but was obscured for a decade by the political battle during the Mbeki era. Despite large amounts of money given to communication and condom programmes, and evidence that infection rates are decreasing, new infections remain very high.1,30 An article in The Lancet commented that the field as a whole, not just in SA, “lacked credibility with data from prevention trials showing little or no decrease in incident HIV”, although the article expressed hope in the rise in number of several biological interventions. These interventions include expanding treatment, vaccines and microbicides, which may be available within the next decade.31,32 The failure of prevention means that continuing resources will be required for ART for those 300 000 people added annually over the next few years, until effective prevention is implemented.33
Developments in the scale-up of ART
Prior to 2004 ART was available only in the private sector, through private funding, workplace programmes, research projects and medical aid schemes. An assessment undertaken in 2006 estimated that 100 000 people were on treatment through these mechanisms.34 Medical insurance schemes began to provide ART early in the 2000s. Initially, this was because it was often cheaper than providing hospital care and later as HIV care fell into a legally binding set of prescribed minimum benefits that meant that medical aid schemes had to, at a minimum, match programmes available in the state sector. Monitoring and evaluation (M&E) figures in this sector are still not readily available, although informal discussions with key manufacturers suggest a figure in the private sector of about 250 000 in care at the end of 2012.a ART has formed part of the rise of “managed care”, with large internal treatment oversight structures within many medical aid schemes. These structures oversee doctor-prescribing decisions, as a mechanism for containing costs and enforcing rational prescribing practices on the clinician community, which is often unfamiliar with treating HIV. In addition, the well-maintained databases of medical aid schemes have allowed for several useful long-term research studies to emerge. These research studies have largely demonstrated the cost effectiveness of these programmes, and the huge costs associated with hospitalising those diagnosed and treated with ART at a late stage.35,36
The public ART programme commenced officially in April 2004 in selected districts and sites. Guidelines broadly in line with World Health Organization (WHO) guidance were written and extensively reviewed by local and international experts the previous year. The local guidelines contained many restrictions on access, such as few selected sites per district with lengthy training preparation, onerous preparation for patient adherence, and prescribed staffing norms (e.g. site-level dietician).
a Personal communication with senior member of a major pharmaceutical company supplying ARVs to the state programme. November 2012.
Initial access to ART for state-dependent patients was slow, very doctor-centred and generally confined to large central hospitals, despite large numbers of ill patients that required immediate therapy. Provincial autonomy meant that guidelines were variably interpreted, with reports of some patients requiring protracted adherence training before initiation. This training was often applied in specialist clinics, especially for paediatrics. Some hospitals insisted that in-patient initiation take place. Target setting was often arbitrary, with provinces simply setting ART treatment numbers they decided were practical with little regard for the rapidly escalating HIV disease burden. Delays in start-up and implementation of the programme had profound mortality implications. One academic estimation, which compared the speed of rollout between SA and its neighbouring countries, found that – under the Mbeki reign – conservatively over 300 000 adults died while 35 000 children were unnecessarily infected with HIV due to delays.37
Critically, a severe lack of integration existed between the HIV programme, on the one hand, and both tuberculosis (TB) and antenatal services, on the other, despite evidence that 70% of patients were TB-infected and that half of HIV-positive people were likely to acquire TB during their lifetime, and that over a third of pregnant women were HIV-positive.38 This was partly as a result of the political environment at the time, with some government officials suggesting that the programmes be kept apart, so as not to stigmatise TB patients as all being HIV positive.39 In addition, the TB programme had been underfunded for decades, despite evidence of a rising new incidence problem, and was performing very poorly in terms of cure and completed treatment protocols. This rising burden of TB on the existing health services, with a new focus on targets but without the requisite resources, meant that the TB programme responded poorly to the integration demands of the HIV programme. This began to change from 2008, partly with the recognition of the TB prevention and treatment benefits of rapid ART initiation and recognition of the multidrug-resistant (MDR)-TB epidemic. Currently, the programmes still have much to do regarding integration, but new diagnostics, new drugs and the recognition of infection control have instilled much needed vitality within the TB programme.40
Antenatal services integration issues were complex. Initially, the PMTCT programme relied largely on HIV testing in pregnancy, coupled with a very simple prevention regimen during labour and immediately after delivery.41 As more effective but complex drug regimens became part of the programme, several operational deficiencies within the antenatal services began to have an impact on PMTCT provision of care. In particular, late booking within the service and the high loss to follow-up after initiation of ART within antenatal services were challenges. Referral to dedicated ART sites by antenatal services simply led to an unacceptably high loss to follow-up rate. The establishment of treatment sites within the antenatal services was attempted, with variable success.42 Ambitious expanded PMTCT guidelines have been heavily debated, with many arguing that services are not strong enough to sustain the newer treatment options.
Under Minister Motsoaledi, the HIV programme began normalising.15,43 The Minister publically insisted on better integration between the HIV, TB and antenatal programmes, and questioned why nurses were not allowed to initiate and monitor ART, as they were doing in other countries. New guidelines allowed

40 SAHR 2012/13
for a shift from a cheap but toxic and twice-daily dosed drug, stavudine, to a better tolerated once-a-day regimen for both adults and children, with simplified monitoring, expanded treatment for TB and improved regimens for the PMTCT.44 Large reductions in tender ART price secured in cooperation with the Clinton Health Access Initiative and the President’s Emergency Plan for AIDS Relief (PEPFAR), with decreased monitoring and task shifting to lower tiers of staff, meant that the annual inclusive cost of treatment began to drop below R5 000.45,46
Coverage of ART expanded rapidly after 2008, and Statistics South Africa (StatsSA) and the NDoH announced that South African life expectancy was increasing for the first time in decades owing to the success of the rollout. Data suggested that MTCT had dramatically decreased with the effective use of ART, leaving fewer children to treat.11,19 As the politics around HIV and ART subsided, the programme began to focus on setting more long-term goals, such as retention in care and raising the CD4 count at initiation. Newer guidelines focused on accelerating access to ART and single-dose formulations, expanding access to all TB patients and infants, and improving the quality of PMTCT regimens.19,46
Challenges in ART scale-up
In 2008, the Free State stopped initiation of new patients on ART almost overnight, citing a lack of funding.47 This occurred during the transition from the Tshabalala-Msimang era to the leadership of Barbara Hogan, a veteran from other government financial oversight agencies. Hogan publically expressed concern about the levels of poor financial planning and overall performance within the department.
The Free State took several months to reverse the decision to suspend ART provision, despite extensive mobilisation of civil society and threats of legal action. Money was urgently transferred from the NDoH to pay for medication, funds that were initially used by the province to pay other outstanding health bills. The Southern African HIV Clinicians Society conservatively estimated that during the interruption of services about 30 people died daily unnecessarily within the province while large numbers of infants were infected.48 The crisis revealed that health financial and programme planning within all the provinces was poor with the exception of Western Cape. At the time, the health departments of KwaZulu-Natal (KZN) and Gauteng had spent their entire budgets, but did not curtail services. In 2012, the Free State, Gauteng and Limpopo were subsequently put under curatorship by the Treasury as a result of poor financial management.49
The ART programme became the ‘canary in the coal mine’, as many donor programmes demanded regular reporting. Antiretroviral drug stock-outs and restrictions on access to ART, poor laboratory performance and other indicators were investigated over the years that followed and usually revealed broader systems failure within the health departments. At the start of 2012, antiretroviral stock-outs of one of the first-line adult therapy drugs, tenofovir, because of poor coordination between the roleplayers meant that large numbers of patients had the drug substituted with more toxic but widely available drugs. In some cases, paediatric formulations were inappropriately used, which led to a shortage in ART for this subpopulation too. Drug stock-outs continued to be a problem throughout 2012, largely due to poor coordination between
provincial supply depots and clinics. Additionally, the non-payment of suppliers led to multiple interruptions in other services. At the time of writing, fraud and corruption investigations into large drug-supply depots in Gauteng and the Eastern Cape were being conducted, again accompanied by broad reports of stock-outs of medicines for several chronic diseases.50 HIV is no longer a routine health political flashpoint. Activist organisations such as the TAC have focused more on securing safer and more varied medication within the state programme and the AIDS Law Project has been incorporated into a much broader legal social movement – Section27 – which continues to play a role, although a lower profile one, in the field of health.51
Despite the large supply-line and operational difficulties, the transformation of policy responses to the HIV epidemic – from the Mbeki to the Zuma era – could not have been more profound. Widespread acknowledgement of the scale of the HIV problem now exists, with none of the mixed messages of the previous administration. SANAC, which was supposed to direct the overall HIV responses from every sector within the country, has been reconstituted and has new and dynamic leadership.52 Civil society also now appears to play a far more directive role in the HIV response, which includes a stronger coordinating role when it comes to donors.
South African treatment debates
The South African public and private ART guidelines have broadly followed WHO guidelines, although amendments have often been delayed in the case of public guidelines. Drug choices and laboratory monitoring currently reflect WHO and regional guidelines and are similar to the guidelines in many developed countries. Exceptions are the restrictions in access to more expensive medicines and less laboratory monitoring.53,54 Theoretically, a South African state-dependent patient should receive similar ARVs to counterparts in New York or London. This has been the result of widespread activism, with litigation threats, and of negotiations between generic manufacturers and the originator. Patients with highly drug-resistant virus are an increasing problem. The NDoH and Southern African HIV Clinicians Society are currently formulating guidelines for both the public and private sectors, with new provision of ART for these patients in the state sector.46
A large international public health debate hinges on ”when to start” in terms of immunological criteria, measured by the CD4 count. There is clear benefit to the individual in starting HIV treatment before reaching a CD4 count of 350 cells/ul. In addition, large benefits in terms of TB control, maternal mortality and MTCT are realised at this level.55 During 2012, SA raised the treatment threshold to a CD4 count from 200 to 350 cells/ul for all; pregnant women and anyone with TB are given ART irrespective of CD4 count.19,44
The big HIV treatment and prevention news of 2011 was a study called HPTN 052, which demonstrated that treating people on ART essentially renders them non-infectious.56,57 This study, coupled with several compelling observational studies, has led to widespread and popular calls for the introduction of “treatment as prevention” – initiation of antiretrovirals irrespective of immune status. However, the study’s early data demonstrated marginal clinical benefit for the individual’s health when starting early, which leads to the question:
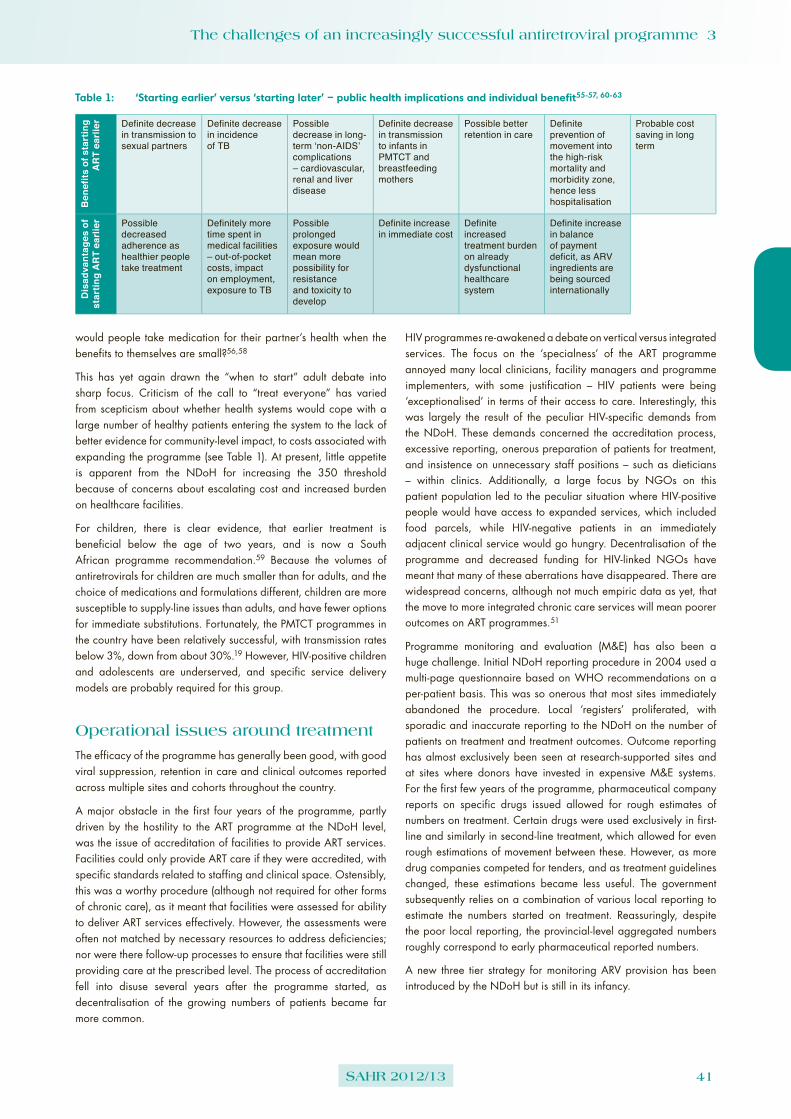
The challenges of an increasingly successful antiretroviral programme 3
SAHR 2012/13 41
would people take medication for their partner’s health when the benefits to themselves are small?56,58
This has yet again drawn the “when to start” adult debate into sharp focus. Criticism of the call to “treat everyone” has varied from scepticism about whether health systems would cope with a large number of healthy patients entering the system to the lack of better evidence for community-level impact, to costs associated with expanding the programme (see Table 1). At present, little appetite is apparent from the NDoH for increasing the 350 threshold because of concerns about escalating cost and increased burden on healthcare facilities.
For children, there is clear evidence, that earlier treatment is beneficial below the age of two years, and is now a South African programme recommendation.59 Because the volumes of antiretrovirals for children are much smaller than for adults, and the choice of medications and formulations different, children are more susceptible to supply-line issues than adults, and have fewer options for immediate substitutions. Fortunately, the PMTCT programmes in the country have been relatively successful, with transmission rates below 3%, down from about 30%.19 However, HIV-positive children and adolescents are underserved, and specific service delivery models are probably required for this group.
Table 1: ‘Starting earlier’ versus ‘starting later’ – public health implications and individual benefit55-57, 60-63B
enef
its o
f sta
rtin
g A
RT
earli
er Definite decrease in transmission to sexual partners
Definite decrease in incidence of TB
Possible decrease in long-term ‘non-AIDS’ complications – cardiovascular, renal and liver disease
Definite decrease in transmission to infants in PMTCT and breastfeeding mothers
Possible better retention in care
Definite prevention of movement into the high-risk mortality and morbidity zone, hence less hospitalisation
Probable cost saving in long term
Dis
adva
ntag
es o
f st
artin
g A
RT
earli
er Possible decreased adherence as healthier people take treatment
Definitely more time spent in medical facilities – out-of-pocket costs, impact on employment, exposure to TB
Possible prolonged exposure would mean more possibility for resistance and toxicity to develop
Definite increase in immediate cost
Definite increased treatment burden on already dysfunctional healthcare system
Definite increase in balance of payment deficit, as ARV ingredients are being sourced internationally
Operational issues around treatment
The efficacy of the programme has generally been good, with good viral suppression, retention in care and clinical outcomes reported across multiple sites and cohorts throughout the country.
A major obstacle in the first four years of the programme, partly driven by the hostility to the ART programme at the NDoH level, was the issue of accreditation of facilities to provide ART services. Facilities could only provide ART care if they were accredited, with specific standards related to staffing and clinical space. Ostensibly, this was a worthy procedure (although not required for other forms of chronic care), as it meant that facilities were assessed for ability to deliver ART services effectively. However, the assessments were often not matched by necessary resources to address deficiencies; nor were there follow-up processes to ensure that facilities were still providing care at the prescribed level. The process of accreditation fell into disuse several years after the programme started, as decentralisation of the growing numbers of patients became far more common.
HIV programmes re-awakened a debate on vertical versus integrated services. The focus on the ‘specialness’ of the ART programme annoyed many local clinicians, facility managers and programme implementers, with some justification – HIV patients were being ‘exceptionalised’ in terms of their access to care. Interestingly, this was largely the result of the peculiar HIV-specific demands from the NDoH. These demands concerned the accreditation process, excessive reporting, onerous preparation of patients for treatment, and insistence on unnecessary staff positions – such as dieticians – within clinics. Additionally, a large focus by NGOs on this patient population led to the peculiar situation where HIV-positive people would have access to expanded services, which included food parcels, while HIV-negative patients in an immediately adjacent clinical service would go hungry. Decentralisation of the programme and decreased funding for HIV-linked NGOs have meant that many of these aberrations have disappeared. There are widespread concerns, although not much empiric data as yet, that the move to more integrated chronic care services will mean poorer outcomes on ART programmes.51
Programme monitoring and evaluation (M&E) has also been a huge challenge. Initial NDoH reporting procedure in 2004 used a multi-page questionnaire based on WHO recommendations on a per-patient basis. This was so onerous that most sites immediately abandoned the procedure. Local ‘registers’ proliferated, with sporadic and inaccurate reporting to the NDoH on the number of patients on treatment and treatment outcomes. Outcome reporting has almost exclusively been seen at research-supported sites and at sites where donors have invested in expensive M&E systems. For the first few years of the programme, pharmaceutical company reports on specific drugs issued allowed for rough estimates of numbers on treatment. Certain drugs were used exclusively in first-line and similarly in second-line treatment, which allowed for even rough estimations of movement between these. However, as more drug companies competed for tenders, and as treatment guidelines changed, these estimations became less useful. The government subsequently relies on a combination of various local reporting to estimate the numbers started on treatment. Reassuringly, despite the poor local reporting, the provincial-level aggregated numbers roughly correspond to early pharmaceutical reported numbers.
A new three tier strategy for monitoring ARV provision has been introduced by the NDoH but is still in its infancy.

42 SAHR 2012/13
The movement to a nurse-based initiation and monitoring HIV programme – as implemented in most other African countries – was very slow, and the programme therefore remains largely hospital based and doctor centred.61 However, research has demonstrated that nurse-based care is safe and effective if adequate training and referral mechanisms exist.64 Significant resistance has been shown by nurses and doctors to the treatment of children. Children are more complex to manage in terms of both dosing and adherence, which often has to be negotiated with a caregiver.
Medication stock-outs have emerged as a major threat to the programme, as detailed above. The sheer scale of manufacture and tight margins, reliance on international sources for active pharmaceutical ingredients, and intense competition between drug companies mean that manufacturing is susceptible to disruption if anything goes wrong. Poor forecasting and untimely ordering by provinces further stress manufacturing capacity. Even where drugs are available, supply lines seem poor, with slow and often inadequate distribution from the depots to local clinics.
Laboratory infrastructure was sorely tested by the ART programme. The National Health Laboratory Services (NHLS) provides comprehensive laboratory services to all government-run facilities. SA’s decision to use viral load monitoring created an unintended crisis within the NHLS – the machines used for this purpose were not constructed to deal with large volumes of samples. Suddenly new technicians and laboratory space were required across the country, and the NHLS had to decide to what extent the service needed to be centralised. In addition, constraints in CD4 monitoring capacity escalated, along with polymerase chain reaction testing for infants – both expensive procedures. Fortunately, the NHLS has an active Research and Development department, which had earlier identified a simpler and cheaper way to measure CD4 accurately and to use dried blood spots to facilitate infant testing. In 2011, a funding crisis hit the NHLS. Gauteng and KZN defaulted on payments that totalled billions of rands of debt owed to the NHLS.65 The NHLS, unable to carry the large deficit, lost a large number of skilled staff, as rumours of bankruptcy loomed until a partial settlement was achieved with the NDoH. Premature implementation of the GeneXpert rapid TB diagnostic machine at a facility level further stressed the system, when the NHLS was asked to expand access to the machine for poorly prepared clinics. However, the NHLS is an important component of new implementation programmes (such as the new proposed cryptococcal prevention programme) and is an underutilised M&E resource.66
Access to care of specific subpopulation
Adolescent patients pose a specific challenge to ART programmes.67-69 While many female adolescents acquire HIV during their late teens, most adolescents who require ART acquired HIV perinatally. Childhood HIV frequently leads to stunting, especially when HIV diagnosis and ART are delayed. This adds to the psychological complexity of an already difficult time in the life of an individual. Limited data suggest that many parents delay informing children about their diagnosis, for fear of inadvertent ‘playground disclosure’, sometimes into adolescence. Attempts to provide specialised adherence, psychological and treatment services are hampered by the wide distribution of this age group
throughout the country and the lack of a functional school health programme.
Foreigners are eligible for ART through the public health sector. A circular in 2005 from the NDoH clarified that possession of a green identity book, previously used as an entry criterion for accessing care, was not required for access to public health facilities.70 In areas with high densities of non-nationals, such as Hillbrow in Johannesburg, treatment programmes have demonstrated HIV treatment results at least as good as those seen with South African citizens.71 Widespread anecdotes of services being restricted by xenophobic healthcare staff have been reported. However, in contrast to other countries, SA has a relatively non-restrictive access policy to primary care services. This means that treatment for TB and HIV, when uncomplicated, can be given to foreigners – even those illegally within the country.
Data suggest that African MSM are at higher risk for HIV acquisition than is the general population. This also applies in SA.69,72,73 In many other countries, aggressive homophobic rhetoric from political leaders and restrictive legislation have attracted international condemnation for driving this already stigmatised group underground. SA has very progressive laws regarding gay rights, which include the right to marry, but has seen reports of homophobic statements and even attacks on people who have publically declared themselves as gay.74,75 However, the NSP has identified the gay community as a key subpopulation and pays more attention to gay issues. With dedicated funding from donor agencies, such as PEPFAR and others, it appears that progress may be made within this group.3
While sex workers contribute only a small percentage of estimated HIV infections within the South African epidemic, they are identified as a discrete and important subgroup for prevention and treatment services.3,69 Access to this group is largely hampered by the fact that the profession is criminalised and that this population is poorly understood.76,77 The new NSP calls for the decriminalisation of sex work as a mechanism to address HIV prevention more efficiently and get sex workers into care.
Gender access has also been an issue, with disproportionate numbers of women accessing the ART programme.17 One reason may be that women are often more familiar with clinical services, as they access these routinely for pregnancy and contraceptive services and are often caregivers to children. This familiarity with services may mean that they attend earlier and more consistently once they get ill. Other reasons may be more complex masculine perceptions around illness. Currently, over 60% of the adults that access the programme are women. This is grossly disproportional to the distribution and profile of the epidemic by gender. Accessing men with more innovative approaches, such as the current male circumcision or HIV testing programmes in workplaces, may improve this ratio.

The challenges of an increasingly successful antiretroviral programme 3
SAHR 2012/13 43
Financing of the ARV programme
How countries will probably deal with the continuing and increasing HIV treatment burden appears to vary according to prevalence and income. Low-prevalence countries – such as Vietnam, Brazil and Thailand – internally fund their responses to the epidemic while poorer high-burden countries remain heavily dependent on donor funding.16,78 Currently 50% to 75% of the cost of the programmes in most countries is consumed by antiretrovirals. SA is seen as a unique case – high HIV burden, but with the ability and necessary resources to deal with the growing number of people that need treatment.
Although its initiation and expansion were initially supported by donors, the South African programme was self-sustained from the beginning, as it was almost entirely funded from the national fiscus. In most developing countries, over 80% of the HIV programmes are funded by donors. In SA, this figure has not exceeded 20% at any point and it is currently probably less than 10%.16 At present the HIV programme consumes just under 10% of the South African government’s total health expenditure and 0.82% of the country’s GDP. This last figure is projected to rise to 1.13% in 2015 and thereafter to fall during the next 15 years.16 As patients accrue on the programme, the medication budget will increase commensurately. One modelling exercise suggests that the HIV programme will double in cost between 2010 and 2017 and projects that SA will spend US$ 64 per citizen to combat the disease by 2031.16 The overall cost of the programme has drawn criticism from politicians, health planners and the Treasury.79
Detailed costing of the public ART programme has allowed for identification of cost-saving potential.45,46 In 2010, the NDoH convened a large group of clinicians, which advised decreasing the number of routine laboratory tests. This was supported by local data, which suggested this could be done safely. A similar consultation on choices of antiretrovirals in first-, second- and subsequent regimens occurred in 2012, and a R6 billion tender has been awarded for the 2013-2014 period.46
The largest part of the cost of the ART programme in SA is staff costs, driven by relatively high health salaries when measured against other African countries. Task shifting of ART to less skilled and lower paid staff has been shown to be effective in SA,80,81 but the move to nurse-based ART initiation and monitoring only really began in 2010. This was despite several successful and innovative projects within KZN years prior to this date.
This delay in moving to a nurse-controlled model of care meant that there was a disproportionate focus on hospital-based and doctor-driven ART clinics. Helen Joseph Hospital’s HIV clinic in central Johannesburg had almost 30 000 patients on ART in 2012b and may be the largest ART clinic in the world, despite efforts to down-refer patients. More decentralised models in the inner city in Johannesburg and elsewhere have successfully demonstrated that primary health clinics can effectively initiate and monitor treatment.82 However, these decentralised models rely on constant support, especially for up-referral of patients.
In addition to task shifting, the idea of an informed patient has gained credibility within programmes. High levels of adherence and problem-solving ability have been seen in patients who have
b Personal Communication: Ian Sanne, 2012.
been taught about their illness and their medication. Excellent adherence levels, previously only seen in transplant programmes, have been seen in most well-run ART programmes. The contrast with other programmes has been noted by several commentators, including MSF. Spontaneous patient interventions – protests over medication stock-outs, arranging medication ‘pick up’ clubs – have been supplemented by support and adherence clubs in several pilot projects. These initiatives work in conjunction with community mobilisation and treatment literacy campaigns. In communities with high treatment literacy interventions, mobilising protests around treatment interruptions, perceived poor service delivery or other programme and policy issues has meant direct engagement between patients and their communities, and implementers and politicians. This engagement has often led to the rapid resolution of problems.
The rise of donor agencies in support of ART
International funding for HIV, TB and malaria reached US$ 26.66 billion in 2010.78 The Joint United Nations Programme on HIV/AIDS (UNAIDS) estimates that 26 out of the 33 worst-affected countries are reliant on donors for more than half of their HIV spending.1
In Malawi, for example, where 40% of all government funding comes from donors, funding has been frozen in reaction to poorly performing programmes and for politically motivated reasons around human rights and freedom of speech, which include homophobic legislation.83 Donors have often been accused of driving a homosexual agenda or of driving corruption because of poor oversight of spending.74,84 Concern has been expressed in donor-supported countries, where ambitious and expensive amendments to HIV treatment guidelines have been made with no evident consideration for the cost. PEPFAR and the Global Fund programmes have been criticised for allocating a large percentage of their contribution to middle-income countries, although these have been hyper-prevalent countries such as SA, Botswana, Namibia and Swaziland. PEPFAR has also been accused of driving several controversial programmes such as those that discourage condom use.
Donor engagement with HIV treatment programmes in SA has been significant. In 2003, USA President George W. Bush announced the launch of PEPFAR, the multi-billion dollar programme that largely supports HIV treatment, care and prevention programmes. PEPFAR now accounts for half of all international spending on HIV.1 PEPFAR’s large donation to SA, coupled with ambitious international treatment targets, helped kick start the South African ARV programme in 2004.
PEPFAR was not immune to criticism. The onerous application process, M&E requirements and financial reporting placed a large burden on recipient NGOs. Critics have charged that this deflected already overburdened organisations towards administrative tasks and away from their core business. In addition, there was suspicion regarding the conservative politics of the USA, especially when PEPFAR programmes in other countries were seen as undermining condom use and where a large percentage of prevention funding was focused on controversial abstinence programmes. However, the bulk of its funding in SA went towards funding direct service delivery, medication, and training and salaries supporting greater access to treatment.

44 SAHR 2012/13
Recently, controversy has surrounded the withdrawal of funding by donor programmes. PEPFAR has announced a 50% reduction in funding over five years to 2017, requiring most PEPFAR-funded programmes to transfer staff and patients back into the government health sector (referred to by the Health Minister as the “nationalisation” of the HIV programme).85 In addition, the influx of donor funding meant many NGOs grew dramatically, and the withdrawal of funding has recently led to down-sizing.86 In some areas, the South African NDoH is ill-prepared for this influx of patients, which has led to outcries that patient care has been compromised. The government, which often deals with multiple stock-outs of drugs, has not provided care at the level that many NGOs have been able to do with focused HIV treatment and care programmes. As a consequence the transition process has been fraught with delays and disturbances in some places.
Similarly, the Global Fund to Fight AIDS, TB and Malaria, formed in 2002, has had a major impact on treating HIV, with the Fund claiming that 8.7 million lives have been saved by its programmes internationally.87 Despite evidence that the Fund is in most cases well administered – accounting for one-fifth of all HIV-linked investment in 2009 – several high-profile cases of corruption and poor programme implementation in 2011 dented the Fund’s image. This occurred alongside the global recession and many national governments not meeting their obligations in terms of pledges to the Fund. The effect was the ‘cancelling’ of new funding obligations to many poorer countries that had critically underfunded ARV programmes.86 Many commentators have said that this was a cynical way for donor governments to skirt their commitments. The Global Fund has had a long history with SA, with over US$ 300 million flowing to the country, two-thirds of which is being spent on the ART programme.
Other large funders, including the Netherlands and Nordic countries, European Union, DFID, and the Bill and Melinda Gates Foundation, continue to fund aspects of SA’s HIV response and have been major supporters of NGOs. However, the recession and financial crisis have meant that many funding programmes have been rationalised and funding amounts decreased. These challenges have led to a renewed focus on internal funding of non-governmental groups and there has been criticism of external funding mechanisms and the lack of local accountability of internal funding of NGOs through large donors such as the National Lottery.88
Conclusion
Expanding treatment access up to the CD4 count of 350 cells/ul threshold remains the priority for the ARV programme. This will realise the benefits of ‘treatment as prevention’, decreased maternal mortality and paediatric infections, decreased burden on outpatient and inpatient clinical care, and decreased community-wide TB.89 In addition, economic consequences, especially out-of-pocket expenses for patients, will decrease. Continued focus on regular HIV testing is required to ensure that treatment is initiated as close to the CD4 350 threshold as possible. The NSP plans to put over 400 000 people on treatment annually, a situation that will continue for as long as prevention programmes are not effective. Challenges lie in the continued assurance of adherence and a growing number of patients requiring ‘third-line’ medication. Special groups, such as adolescents, mobile populations, refugees, foreigners, sex workers and others, require tailored services.
However, the state of many public health systems, especially in terms of medicines supply and service delivery, threatens the expansion of successful treatment programmes.51,61 Interventions related to the proposed National Health Insurance system and the establishment of core standards of care for all health facilities will hopefully address these challenges.15 However, creative thinking is required to allow the huge number of healthy patients on ART to avoid unnecessary (and dangerous in the case of TB exposure) visits to health facilities. In many other countries patients with chronic diseases, including HIV, have laboratory results reviewed distantly and their medication delivered at home if they have no complaints. The management of HIV lends itself to this approach, as the vast majority of patients are rendered asymptomatic.
The ARV rollout has been a complicated and qualified success, teaching us much about public health programmes that have grand ambition. Maintaining and improving the rollout in the context of complicated policy and operational challenges will, however, continue to challenge us if we are to maintain this success.

The challenges of an increasingly successful antiretroviral programme 3
SAHR 2012/13 45
References
1 UNAIDS. Global report on the global AIDS epidemic 2012. Geneva: Joint United Nations Programme on HIV/AIDS ; 2012.
2 Abdool Karim SS, Churchyard GJ, Abdool Karim Q, Lawn SD. HIV infection and tuberculosis in South Africa: An urgent need to escalate the public health response. The Lancet. 2009;374(9693):921-33.
3 National Department of Health. The National Strategic Plan on HIV, STIs and TB 2012-2016. Pretoria: National Department of Health; 2011.
4 Central Intelligence Agency – The World Factbook. Country Comparison: HIV/AIDS – People living with HIV/AIDS [database on the Internet]. Washington (DC): Central Intelligence Agency. 2013 – [cited 03 December 2012]. URL: https://www.cia.gov/library/publications/the-world-factbook/rankorder/2156rank.html
5 Coovadia H, Jewkes R, Barron P, Sanders D, McIntyre D. The health and health system of South Africa: Historical roots of current public health challenges. The Lancet. 2009;374(9692):817-34.
6 Sher R. HIV infection in South Africa, 1982-1988 – A review. S Afr Med J. 1989;76(7):314-8.
7 Timberg C, Halperin D. Tinderbox: How the West sparked the AIDS epidemic and how the world can finally overcome it. New York: Penguin Press; 2012.
8 Pepin J. The origins of AIDS. Cambridge: Cambridge University Press; 2011.
9 Johnson LF, Rehle TM, Dorrington RE, Hallett TB. The effect of changes in condom usage and antiretroviral treatment coverage on human immunodeficiency virus incidence in South Africa: A model-based analysis. J R Soc Interface. 2012;9(72):1544-54.
10 Lurie MN, Rosenthal S. Concurrent partnerships as a driver of the HIV epidemic in sub-Saharan Africa? The evidence is limited. AIDS Behav. 2010;14(1):17-24.
11 Statistics South Africa. Mid-year population estimates. Statistical release P0302. Pretoria: Statistics South Africa; 2010.
12 National Department of Health. The 2011 National Antenatal Sentinel HIV and Syphilis Prevalence Survey. Pretoria: National Department of Health; 2011.
13 Rehle TM, Hallet TB, Shisana O, Pillay-van Wyk V, Zuma K, Carrara H, et al. A decline in new HIV infections in South Africa: Estimating HIV incidence from three national HIV surveys in 2002, 2005 and 2008. PLoS One. 2010;5(6):e11094.
14 Gerritsen A, Mitchell J, Johnson S, Delva W. Challenges with using estimates when calculating ART need among adults in South Africa. S Afr Med J. 2012;102(10):798-9.
15 Mayosi BM, Lawn JE, van Niekerk A, Bradshaw D, Abdool Karim SS, Coovadia HM, for The Lancet South Africa team. Health in South Africa: Changes and challenges since 2009. The Lancet. 2012;380(9858):5-19.
16 Hecht R, Stover J, Bollinger L, Muhib F, Case K, de Ferranti D. Financing of HIV/AIDS programme scale-up in low-income and middle-income countries, 2009. The Lancet. 2010;376(9748):1254-60.
17 Johnson LF. Access to antiretroviral treatment in South Africa, 2004-2011. South Afr J HIV Med. 2012;13(1).
18 Johnson L, Mossong J, Dorrington R, Schomaker M, Hoffmann C, Keiser O, et al. Life expectancies of HIV-positive adults receiving antiretroviral treatment in South Africa. In: Actuarial Society of South Africa (ASSA) 2012 Convention; 16-17 October 2012; Cape Town, South Africa; 2012.
19 Pillay Y. Opening plenary. In: Southern African HIV Clinicians Society Conference. Cape Town, South Africa; 2012.
20 Cullinan K. HIV does cause AIDS but it’s hard to prescribe the drugs, says South Africa’s ANC. Bull World Health Organ. 2002;80(5):421-2.
21 Gevisser M. Thabo Mbeki: The dream deferred. Johannesburg: Jonathan Ball; 2007.
22 Nattrass N. Mortal combat: AIDS denialism and the struggle for antiretrovirals in South Africa. Scottsville, South Africa: University of KwaZulu-Natal Press; 2007.
23 Geffen N. Debunking delusions: The inside story of the Treatment Action Campaign. Auckland Park, South Africa: Jacana Media; 2010.
24 Cullinan K. Court orders South Africa to treat pregnant HIV-positive women with nevirapine. Bull World Health Organ. 2002;80(4):335.
25 Honermann B, Heywood M. Ten years since the TAC case: a judgment that saved a million lives. Health-e [serial on the Internet]. 05 July 2012 [cited 03 December 2012]. URL: http://www.health-e.org.za/news/article.php?uid=20033607
26 Timberg C. Mandela says AIDS led to death of son. The Washington Post [newspaper online]. 07 January 2005 [cited 03 December 2012]. URL: http://www.washingtonpost.com/wp-dyn/articles/A52781-2005Jan6.html
27 Nattrass N. Defending the boundaries of science: AIDS denialism, peer review and the Medical Hypotheses saga. Sociol Health Illn. 2011;33(4):507-21.
28 Cullinan K. Is AIDS denialism defeated? Health-e [serial on the Internet]. 18 June 2007 [cited 03 December 2012]. URL: http://www.health-e.org.za/news/article.php?uid=20031694
29 James JS. Durban conference status, May 2000: interview with conference chair Coovadia HM. AIDS Treat News. 2000;(343):4-6.
30 Bèarnighausen T, Tanser F, Newell ML. Lack of a decline in HIV incidence in a rural community with high HIV prevalence in South Africa, 2003-2007. AIDS Res Hum Retroviruses. 2009;25(4):405-9.
31 Padian NS, Isbell MT, Russell ES, Essex M. The future of HIV prevention. J Acquir Immune Defic Syndr. 2012;60 (Suppl 2):S22-6.
32 Padian NS, McCoy SI, Karim SS, Hasen N, Kim J, Bartos M, et al. HIV prevention transformed: The new prevention research agenda. The Lancet. 2011;378(9787):269-78.
33 Venter WD. The failure of HIV prevention is South Africa’s biggest health crisis. S Afr Med J. 2006;96(4):298,300.
34 Joint Civil Society Monitoring Forum. In: 7th Joint Civil Society Monitoring Forum; 26 March 2006; Orkney; 2006.
35 Nachega JB, Leisegang R, Bishai D, Nguyen H, Hislop M, Cleary S, et al. Association of antiretroviral therapy adherence and health care costs. Ann Intern Med. 2010;152(1):18-25.

46 SAHR 2012/13
36 Leisegang R, Cleary S, Hislop M, Davidse A, Regensberg L, Little F, et al. Early and late direct costs in a Southern African antiretroviral treatment programme: A retrospective cohort analysis. PLoS Med. 2009;6(12):e1000189.
37 Chigwedere P, Seage G, Gruskin S, Lee T-H, Essex M. Estimating the lost benefits of antiretroviral drug use in South Africa. J Acquir Immune Defic Syndr. 2008;49(4):410-415.
38 Lawn SD, Harries AD, Wood R. Strategies to reduce early morbidity and mortality in adults receiving antiretroviral therapy in resource-limited settings. Curr Opin HIV AIDS. 2010;5(1):18-26.
39 Cullinan K. Integrate TB-HIV services! Health-e [serial on the Internet]. 06 June 2010 [cited 15 January 2010].URL: http://www.health-e.org.za/news/article.php?uid=20032821
40 Raviglione M, Marais B, Floyd K, Lönnroth K, Getahun H, Migliori GB, et al. Scaling up interventions to achieve global tuberculosis control: progress and new developments. The Lancet. 2012;379(9829):1902-13.
41 Cotton MF, Rabie H, van Zyl GU. Another milestone in minimizing risks to mothers exposed to single-dose nevirapine for prevention of vertical transmission of HIV-1 to infants: what next? Clin Infect Dis. 2010;50(6):909-11.
42 Black V, Hoffman RM, Sugar CA, Menon P, Venter F, Currier JS, et al. Safety and efficacy of initiating highly active antiretroviral therapy in an integrated antenatal and HIV clinic in Johannesburg, South Africa. J Acquir Immune Defic Syndr. 2008;49(3):276-81.
43 Motsoaledi A. Health Budget speech. Pretoria. 2010.
44 Director-General: Health. Accelerating access to ART services and uptake [circular]. Pretoria: National Department of Health; 14 March 2012.
45 Meyer-Rath G, Miners A, Santos AC, Variava E, Venter WD. Cost and resource use of patients on antiretroviral therapy in the urban and semi-urban public sectors of South Africa. J Acquir Immune Defic Syndr. 2012;61(3):e25-32.
46 Agence France Presse. Motsoaledi hails deal for ARVs. IOL news [newspaper online]. 30 November 2012 [cited 15 January 2013].URL: http://www.iol.co.za/news/south-africa/motsoaledi-hails-deal-for-arvs-1.1433243#.UPVLtR3qle8
47 Adams O. Sello Mokhalipi and the stories from the Free State free stock-outs. Equal Treatment Magazine for The Treatment Action Campaign [magazine online]. September 2009 [cited 15 January 2013].URL: http://www.tac.org.za/community/files/file/etmag/ET29/ET29English.pdf
48 Treatment Action Campaign, AIDS Law Project, South African HIV Clinicians’ Society, Health Systems Trust, Free State HIV/AIDS Coalition, Public Service Accountability Monitor, National Education, Health and Allied Workers’ Union. Letter to Minister of Health Dr Aaron Motsoaledi: Concern about AIDS programmes [Internet]. 10 September 2009.
URL: http://www.tac.org.za/community/files/LetterToMinisterOfHealth-10September2009.pdf
49 Parliamentary Monitoring Group. National government interventions in Gauteng, Free State and Limpopo: Ministerial briefings [Internet]. 09 February 2012. URL: http://www.pmg.org.za/report/20120209-national-government-interventions-gauteng-free-state-and-limpopo-mini
50 Budget Expenditure Monitoring Forum, Rural Health Advocacy Project, Treatment Action Campaign, Rural Doctors Association of Southern Africa, Médecins Sans Frontières, Southern African HIV Clinicians Society. Immediate action required to solve the systemic crisis at Mthatha Medical Depot [Press release]. eHealth; 28 November 2012. URL: http://www.health-e.org.za/news/article.php?uid=20033916
51 Heywood M. Not ‘the end of AIDS’ – Moving from quantity to quality in order to sustain the results of global AIDS activism. Speech to European Parliament Working Group on Reproductive Health, HIV/AIDS and Development. 2012.
52 IRIN/PlusNews. Straight talk with Fareed Abdullah, Head of the South African AIDS Council. PlusNews, 2012.
53 World Health Organization. Antiretroviral therapy for HIV infection in adults and adolescents: Recommendations for a public health approach: 2010 revision. Geneva: World Health Organization; 2010.
54 Southern African HIV Clinicians Society. Guidelines for antiretroviral therapy in adults. South Afr J HIV Med. 2012;13(3):114-33.
55 Venter W. What is the optimal CD4 count to start antiretrovirals in HIV-infected adults? South Afr J Epidemiol Infect. 2009;24(2):1.
56 Cohen MS, Chen YQ, McCauley M, Gamble T, Hosseinipour MC, Kumarasamy N, et al. Prevention of HIV-1 infection with early antiretroviral therapy. N Engl J Med. 2011;365(6):493-505.
57 Cohen MS, Muessig KE, Smith MK, Powers K, Kashuba A. Antiviral agents and HIV prevention: Controversies, conflicts and consensus. AIDS. 2012;26(13):1585-98.
58 Delva W, Wilson DP, Abu-Raddad L, Gorgens M, Wilson D, Hallett TB, et al. HIV treatment as prevention: Principles of good HIV epidemiology modelling for public health decision-making in all modes of prevention and evaluation. PLoS Med. 2012;9(7):e1001239.
59 Violari A, Cotton MF, Gibb DM, Babiker AG, Steyn J, Madhi SA, et al. Early antiretroviral therapy and mortality among HIV-infected infants. N Engl J Med. 2008;359(21):2233-44.
60 Meyer-Rath, G. and M. Over, HIV Treatment as Prevention: Modelling the Cost of Antiretroviral Treatment – State of the Art and Future Directions. PLoS Med, 2012. 9(7): p. e1001247. 61
61 Boyd MA, Cooper DA. Optimisation of HIV care and service delivery: doing more with less. The Lancet. 2012;380(9856):1860-6.
62 Cain LE, HIV-CAUSAL Collaboration, Logan R, Robbins JM, Sterne JA, Sabin C, et al., When to initiate combined antiretroviral therapy to reduce mortality and AIDS-defining illness in HIV-infected persons in developed countries: an observational study. Ann Intern Med. 2011;154(8): 509-15.
63 Sterne JA, May M, Costagliola D, de Wolf F, Phillips AN, Harris R, et al. Timing of initiation of antiretroviral therapy in AIDS-free HIV-1-infected patients: a collaborative analysis of 18 HIV cohort studies. The Lancet. 2009;373(9672):1352-1363.
64 Georgeu D, Colvin CJ, Lewin S, Fairall L, Bachmann MO, Uebel K, et al. Implementing nurse-initiated and managed antiretroviral treatment (NIMART) in South Africa: a qualitative process evaluation of the STRETCH trial. Implement Sci. 2012;7:66.

The challenges of an increasingly successful antiretroviral programme 3
SAHR 2012/13 47
65 Khan T. National Health Laboratory Service still struggling with tardy provincial payments. Business Day [newspaper online]. 10 October 2012 [cited 15 January 2013].URL: http://www.bdlive.co.za/business/healthcare/2012/10/10/national-health-laboratory-service-still-struggling-with-tardy-provincial-payments
66 Jarvis JN, Harrison TS, Govender N, Lawn SD, Longley N, Bicanic T, et al. Routine cryptococcal antigen screening for HIV-infected patients with low CD4+ T-lymphocyte counts –time to implement in South Africa? SAMJ. 2011;101(4):232-4.
67 Li, R.J., et al., Positive futures: a qualitative study on the needs of adolescents on antiretroviral therapy in South Africa. AIDS Care, 2010. 22(6) 751-8.
68 Nglazi MD, Kranzer K, Holele P, Kaplan R, Mark D, Jaspan H, et al. Treatment outcomes in HIV-infected adolescents attending a community-based antiretroviral therapy clinic in South Africa. BMC Infect Dis. 2012;12(1):21.
69 Scheibe A, Brown B, Duby Z, Bekker L. Key populations, key solutions: A gap analysis and recommendations for key populations in South Africa, and recommendations for the National Strategic Plan for HIV/AIDS, STIs and TB (2012-2016); 2011.
70 National Department of Health. Access to comprehensive HIV & AIDS care including antiretroviral treatment. National Department of Health. Pretoria; 2005.
71 McCarthy K, Chersich MF, Vearey J, Meyer-Rath G, Jaffer A, Simpwalo S, et al. Good treatment outcomes among foreigners receiving antiretroviral therapy in Johannesburg, South Africa. Int J STD AIDS. 2009;20(12):858-62.
72 Lane T, Fisher Raymond H, Dladla S, Rasethe J, Struthers H, McFarland W, et al. High HIV prevalence among men who have sex with men in Soweto, South Africa: Results from the Soweto Men’s Study. AIDS Behav. 2011;15(3):626-34.
73 Arnold MP, Struthers H, McIntyre J, Lane T. Contextual correlates of per partner unprotected anal intercourse rates among MSM in Soweto, South Africa. AIDS Behav. 2012;12.
74 Semugoma P, Nemande S, Baral SD. The irony of homophobia in Africa. The Lancet. 2012;380(9839):312-4.
75 Alsop Z. Ugandan Bill could hinder progress on HIV/AIDS. The Lancet. 2009;374(9707):2043-4.
76 Richter M, Luchters S, Ndlovu D, Temmerman M, Chersich MF. Female sex work and international sport events – No major changes in demand or supply of paid sex during the 2010 Soccer World Cup: A cross-sectional study. BMC Public Health. 2012;12:763.
77 Richter M. Sex work, reform initiatives and HIV/AIDS in inner-city Johannesburg. Afr J AIDS Res. 2008;7(3):10.
78 Atun R, Knaul FM, Akachi Y, Frenk J. Innovative financing for health: what is truly innovative? Lancet. 2012;380(9858):2044-9.
79 Bodibe K. AIDS funding cuts had been coming ‘long ago’ – Motsoaledi. Health-e [serial on the Internet]. 09 December 2011 [cited 15 January 2013].URL: http://www.health-e.org.za/news/article.php?uid=20033374
80 Sanne I, Orrell C, Fox MP, Conradie F, Ive P, Zeinecker J, et al. Nurse versus doctor management of HIV-infected patients receiving antiretroviral therapy (CIPRA-SA): A randomised non-inferiority trial. The Lancet. 2010;376(9734):33-40.
81 Fairall L, Bachmann MO, Lombard C, Timmerman V, Uebel K, Zwarenstein M, et al. Task shifting of antiretroviral treatment from doctors to primary-care nurses in South Africa (STRETCH): A pragmatic, parallel, cluster-randomised trial. The Lancet. 2012;380(9845):889-98.
82 Webster PD, Sibanyoni M, Malekutu D, Mate KS, Venter F, Barker PM, et al. Using quality improvement to accelerate highly active antiretroviral treatment coverage in South Africa. BMJ Qual Saf. 2012;21(4):315-24.
83 Donnelly J. Battles with donors cloud Malawi’s HIV prevention plan. The Lancet. 2011;378(9787):215-6.
84 Johnson P. Abuse of HIV/AIDS-relief funds in Mozambique. The Lancet Infect Dis. 2009;9(9):523-4.
85 Govender P. US hands more control to South Africa in its AIDS fight. Reuters [newspaper online]. 07 August 2012 [cited 15 January 2013].URL: http://www.reuters.com/article/2012/08/07/us-clinton-safrica-aids-idUSBRE8760ZU20120807
86 Gonzalez LL. First to go: How communities are being affected by the Global Fund crisis. Open Society Initiative for Southern Africa (OSISA) [publication online]. 24 July 2012 [cited 15 January 2013].URL: http://www.osisa.org/open-debate/hiv-and-aids/regional/first-go-how-communities-are-being-affected-global-fund-crisis
87 Global Fund [homepage on the Internet]. Geneva: The Global Fund; c2012 [cited 30 November 2012]. URL: http://www.theglobalfund.org/en/
88 Section27 Submission to Lotteries Board to fund social justice work [homepage on the Internet]. Braamfontein: +Section27 catalysts for social justice; c2012 [cited 15 January 2013]. URL: h ttp://section27.org.za.dedi47.cpt1.host-h.net/2012/05/24/section27-submission-to-lotteries-board-to-fund-social-justice-work/
89 Bartlett JA, Shao JF. Successes, challenges, and limitations of current antiretroviral therapy in low-income and middle-income countries. The Lancet Infect Dis. 2009;9(10):637-49.

48 SAHR 2012/13

Author:
49SAHR 2012/13
4444444
Lesley Bamford
National Department of Health, School of Health Systems and Public Health, University of Pretoria
Maternal, Newborn and Child Health
Maternal and child mortality rates are declining on a global level, although progress remains insufficient to achieve Millennium Development Goals 4 and 5 by 2015. Although South Africa (SA) continues to experience
unacceptably high maternal, newborn and child mortality rates for a middle-income country, the under-five mortality rate has declined significantly in recent years whilst recent data suggest that the maternal mortality ratio (MMR) has also begun to decline.
The past few years have been characterised by a number of international and national commitments and interventions that focus on improving maternal, newborn and child health. At an international level ensuring provision of evidence-informed packages of care to all women and children continues to be regarded as the key to improving maternal and child health, while the importance of addressing equity, increasing accountability and strengthening the health system are increasingly recognised. In SA, the Negotiated Service Delivery Agreement highlights reductions in maternal and child mortality rates as one of the four strategic outcomes for which the health sector must account, while the first National Maternal, Newborn, Child and Women’s Health and Nutrition (MNCWH&N) Strategic Plan provides a road-map for achieving improved survival and health for women and children. Restructuring of primary health care (PHC) also provides an opportunity to improve coverage and quality of maternal and child health services through reaching learners in schools, reaching households through visits by community health workers and improving clinical governance at district level through deployment of clinical specialist teams.
Weaknesses and inefficiencies in the health system will need to be addressed if current gains in maternal and child survival are to be maintained and accelerated, and the potential benefits of PHC restructuring and other efforts to improve maternal and child health are to be realised. Human resource capacity to deliver quality maternal and child health services will need to be strengthened, while monitoring systems must be improved to facilitate both improved planning and greater accountability.
Programmatic priorities include improving care at district hospital level, especially with regard to management of obstetric emergencies, newborn care and better care for acutely ill children. As child survival improves, more emphasis must also be paid to ensuring that all children reach their full potential – this will require improvements in the nutritional status of all children, ensuring that all children receive the full package of preventive health services and implementation of other early childhood interventions at scale.
This chapter provides an overview of maternal, newborn and child survival, global and national commitments and strategies that aim to improve maternal and child health, as well as progress in implementing priority interventions outlined in the MNCWH&N Strategic Plan. In the final section, priority actions are identified.
Restructuring of primary health care provides an opportunity to improve
coverage and quality of maternal and child health services through reaching
learners in schools, reaching households through visits by
community health workers and improving clinical
governance at district level through deployment of
clinical specialist teams.

50 SAHR 2012/13
Maternal, newborn and child survival
Global mortality rates and trends
Recognition that improvements in the health of women and children hold the key to making progress towards all development goals and the approach of 2015 – the target year for achievement of the Millennium Development Goals (MDGs) – have served to refocus global attention on maternal and child survival.1
Overall there is reason for optimism, especially with regard to progress in reducing child mortality. The number of under-five deaths worldwide has declined, from nearly 12 million in 1990 to 6.9 million in 2011, and the rate of decline has accelerated – from 1.8% per year during the 1990s to 3.2% per year between 2000 and 2010.2 While that translates into 4 000 fewer children dying every day in 2011 than in 1990, 19 000 children under five years of age still died every day in 2011 and the MDG 4 target of reducing child deaths by two-thirds by 2015 will not be achieved.3 Under-five mortality is also increasingly concentrated in particular regions, with 70% of the world’s under-five deaths in 2009 occurring in only 15 countries and about half of the deaths occurring in just five countries (India, Nigeria, Democratic Republic of the Congo, Pakistan, and China). In addition, although data are available for only 38 countries, a recent review concluded that more countries experienced an increase than a decrease in relative disparity in child mortality rates between rich and poor over the last two decades. The inference is that, even though national under-five mortality rates have been reduced in many countries, disparity in mortality rates between poor and rich has generally increased and that child deaths (and undernutrition) are, therefore, becoming increasingly concentrated in the poorest and most deprived communities.4
Maternal mortality has declined more slowly, although the annual rate of decline at a global level has risen – from 2% between 1990 and 2000 to 3.4% between 2000 and 2010.5 Globally, an estimated 287 000 maternal deaths occurred in 2010, a decline of 47% from levels in 1990, but far below the three-quarters reduction required by 2015 for the achievement of MDG 5.3 Maternal mortality is also becoming more concentrated in certain regions, with sub-Saharan Africa and southern Asia accounting for 56% and 29% respectively of the global burden in 2010.5
Globally, the neonatal mortality rate has declined by approximately one-third, from 32 deaths per 1 000 live births in 1990 to 22 deaths per 1 000 live births in 2011 – an average decline of 1.8% a year. This is much slower than for under-five mortality and means that the proportion of under-five deaths that occur within the first month of life (the neonatal period) has increased, from 36% in 1990 to 43% in 2010.2
At a global level, haemorrhage remains the leading cause of maternal death, followed by hypertension and other indirect causes.1 The leading causes of death among children under age five are pneumonia (18% of all under-five deaths); preterm birth complications (14%); diarrhoea (11%); intrapartum-related complications, complications during birth (9%); and malaria (7%). Child mortality is strongly associated with undernutrition, with more than a third of under-five deaths being attributable to undernutrition.2
South Africa: mortality rates and trends
Estimates of maternal and child mortality in SA, which have historically been characterised by lack of consensus and a reliance on outdated figures, have been reviewed in detail in previous editions of the South African Health Review.6,7 This section, therefore, focuses on recent developments, particularly with regard to progress that has been made in reaching consensus on the methodologies to be used in calculating official national estimates of maternal and child mortality rates and trends.
The Health Data Advisory and Co-ordination Committee (HDACC), which was appointed to improve the quality and integrity of data on health outcomes and to advise on indicators, baseline values and targets for the Negotiated Service Delivery Agreement (NSDA) for the period 2010 to 2014, recommended that Rapid Mortality System (RMS) data be used for monitoring child deaths.8 The committee further recommended that Statistics South Africa (StatsSA) data on cause of death be used to monitor maternal deaths and adjusted District Health Information Systems (DHIS) data be used to calculate neonatal mortality. RMS data are based on notification of deaths and provide limited data on each death within a shorter period of time as compared with vital registration data. The RMS data are adjusted for deaths that are registered but are not on the national population register, as well as for deaths that have not been registered. The committee has further recommended that population estimates produced by the ASSA2008 AIDS and Demographic Model be used for calculating mortality-related indicators.9
Baseline values contained in the HDACC report as well as figures calculated using the same methodology for subsequent years are shown in Table 1. The targets proposed by HDACC for achievement by 2014 are also shown.
Maternal deaths
As shown in Table 1, maternal deaths were estimated to increase from 310 per 100 000 live births in 2008 to 333 per 100 000 live births in 2009.10 The Saving Mothers Reports also reported an increase in the institutional Maternity Mortality Ratio (iMMR) from 152 deaths per 100 000 live births for the 2005 to 2007 triennium11 to 176 deaths per 100 000 live births for the period 2008 to 2010.12 These results were disappointing, particularly given that the revised prevention of mother-to-child-transmission (PMCTCT) guidelines, which included initiation of antiretroviral therapy at a CD4 count of 350, were introduced at the beginning of the 2009/10 financial year. However, the 2011 interim report showed a decrease in the iMMR to 153 deaths per 100 000 live births. This represents a 13% reduction, which is almost entirely the result of the reduction in deaths from non-pregnancy-related infections (mainly deaths in HIV-infected pregnant women complicated by tuberculosis (TB) and pneumonia).13 Although confirmation from other sources is still required, these figures suggest that maternal mortality peaked in 2009 or 2010 and is now declining.

Maternal, Newborn and Child Health 4
51SAHR 2012/13
Table 1: Maternal and child mortality rates, South Africa
Indicator 2008 2009 2010 2011 Target 2014Under-5 Mortality Rate (U5MR)
56 per 1 000 live births 53 per 1 000 live births 42 per 1 000 live births 50 per 1 000 live births (10% reduction)
Infant Mortality Rate (IMR)
40 per 1 000 live births 37 per 1 000 live births 30 per 1 000 live births 36 per 1 000 live births (10% reduction)
Neonatal Mortality Rate (<28 days)
14 per 1 000 live births 13 per 1 000 live births 14 per 1 000 live births 12 per 1 000 live births (10% reduction)
Maternal Mortality Ratio (MMR)
310 per 100 000 live births
333 per 100 000 live births
270 per 100 000 live births (reverse increasing trend)
Source: National Department of Health, 2011;8 Medical Research Council, 2012.10
The Saving Mothers Reports have consistently identified five major causes of maternal deaths: non-pregnancy-related infections, mainly AIDS; obstetric haemorrhage; complications of hypertension; pregnancy-related infections; and complications of pre-existing medical conditions such as cardiac conditions and diabetes.11 The most recent Triennial Saving Mothers Report found that non-pregnancy-related infections accounted for 40.5% of maternal deaths, while maternal deaths due to obstetric haemorrhage and hypertension accounted for 28% of deaths (14% each).12 Together these top three causes accounted for almost 70% of all maternal deaths. Forty percent of all maternal deaths were classified as avoidable with maternal deaths due to obstetric haemorrhage and hypertension being thought to be possibly and probably preventable in 81% and 61% of cases respectively. Maternal deaths due to non-pregnancy-related infections, obstetric haemorrhage and hypertension were the three biggest contributors to preventable maternal deaths, accounting for two-thirds of avoidable deaths with most of these deaths occurring in level 1 and level 2 hospitals.
Child deaths
As indicated in Table 1, infant and under-five mortality rates have declined rapidly since 2009 and by 2011 had exceeded the targets for 2014 recommended by the HDACC.10 This is in line with data from a retrospective review of child mortality data, which found that infant and under-five mortality rates remained roughly stable between 1998 and 2007, although at levels higher than those in the early 1990s, before beginning to decline around 2006 or 2007.14
It should be noted that these national estimates remain slightly lower than those published by the United Nations Inter-agency Group for Child Mortality Estimation, which estimated SA to have under-five- and infant mortality rates of 47 and 35 per 1 000 live births respectively in 2011.2 However, both datasets show a similar rapid decline in child mortality rates since the mid-2000s, albeit at a rate insufficient to achieve the MDG 4 target of an under-five mortality of 20 per 1 000 live births by 2015. This decline can primarily be attributed to successful implementation of the PMTCT programme (see below), as well as the introduction of new vaccines against invasive pneumococcal disease and rotavirus in 2008.
Many children continue to live in poverty and child poverty remains an important underlying or contributing factor to child deaths in SA. Children who are born to poor parents and grow up in poor households are likely to remain poor, and there is evidence that disparities in income are coupled with inequities in access to services and treatment.15,16 Child mortality rates have been found to be four times higher in the poorest quintile (87 per 1 000 live births) than in the wealthiest quintile (22 per 1 000 live births).17
Data from child mortality audits show that the majority of deaths in children are due to a small number of conditions, with five conditions accounting for 82.6% of deaths in infants between one month and one year of age and 74.2% of deaths in children between one and five years of age.18 These conditions are acute respiratory infections (mostly pneumonia) (28.9%), diarrhoea (20.7%), septicaemia or possible serious bacterial infection (16.2% of deaths), TB (7.1%) and meningitis (6.6%). The audits also indicated that more than half of children who died had evidence of HIV infection or exposure, while 60% of children were undernourished (as evidenced by underweight-for-age or severe malnutrition).
Newborn deaths
Neonatal mortality rates fell from approximately 18 deaths per 1 000 live births in 1997 to approximately 14 deaths per 1 000 live births in 2001; this may reflect the fact that the proportion of births occurring in health facilities increased substantially during this period.14 However for the period 2006 to 2011, the neonatal mortality rate remained static at between 13 and 14 per 1 000 live births.10 This means that approximately one-third of all under-five deaths occur during the newborn period; this proportion is likely to increase unless the decline in post-neonatal deaths is matched by a similar decline in newborn deaths.
The most recent Saving Babies Report identified the important causes of death in the early neonatal period as immaturity (45%), intrapartum hypoxia (30%), infection (10%) and congenital abnormalities (7%). Intrapartum hypoxia affects mostly larger babies and improvements in maternal care, especially intrapartum monitoring and care, would prevent many of these deaths.19 Although preterm labour is mostly not preventable, provision of simple standardised care could prevent many of the newborn deaths associated with prematurity.20,21
Stillbirths
The stillbirth rate in SA is estimated to be between 21 and 25 per 1 000 births.22 This is comparable with rates in other middle-income countries, although the intrapartum stillbirth rate is higher than in these countries, which suggests that intrapartum care needs to be improved. A high proportion of both fresh stillbirths (18%) and macerated stillbirths (48%) is unexplained. Antepartum haemorrhage (15%), intrapartum asphyxia and birth trauma (14%), hypertension (13%) and infections (5%) are also important contributors to stillbirths.19

52 SAHR 2012/13
Table 2: Interventions that are most likely to save the lives of women and children
Continuum of Care
Adolescence & Pre-pregnancy
Pregnancy (Antenatal) Childbirth
Postnatal (Mother)
Postnatal (Newborn)
Infancy & Childhood
CommunityPrimaryReferral
•Family planning (advice, hormonal and barrier methods)
•Prevent and manage sexually transmitted infections and HIV
•Folic acid fortification/supplementation to prevent neural tube defects
• Iron and folic acid supplementation
•Tetanus vaccination
•Prevention and management of malaria with insecticide-treated nets and antimalarial medicines
•Prevention and management of sexually transmitted infections (STIs) and HIV, including with antiretroviral medicines
•Calcium supplementation to prevent hypertension (high blood pressure)
• Interventions for cessation of smoking
•Prophylactic uterotonics to prevent postpartum haemorrhage (excessive bleeding after birth)
•Manage postpartum haemorrhage using uterine massage and uterotonics
•Social support during childbirth
•Family planning advice and contraceptives
•Nutrition counselling
• Immediate thermal care (to keep the baby warm)
• Initiation of early breastfeeding (within the first hour)
•Hygienic cord and skin care
•Exclusive breastfeeding for 6 months
•Continued breastfeeding and complementary feeding from 6 months
•Prevention and case management of childhood malaria
•Vitamin A supplementation from 6 months of age
•Routine immunisation plus H.influenzae, meningococcal, pneumococcal and rotavirus vaccines
•Management of severe acute malnutrition
•Case management of childhood pneumonia
•Case management of diarrhoea
Primary and referral
•Family planning (hormonal, barrier and selected surgical methods)
•Screening for and treatment of syphilis
• Low dose aspirin to prevent pre-eclampsia
•Antihypertensive drugs (to treat high blood pressure)
•Magnesium sulphate for eclampsia
•Antibiotics for preterm prelabour rupture of membranes
•Corticosteroids to prevent respiratory distress syndrome in preterm babies
•Safe abortion•Post-abortion care
•Active management of third stage of labour (to deliver the placenta) to prevent postpartum haemorrhage (as above plus controlled cord traction)
•Management of postpartum haemorrhage (as above plus manual removal of placenta)
•Screen and manage HIV (if not already tested)
•Screen for and initiate or continue antiretroviral therapy for HIV
•Treat maternal anaemia
•Neonatal resuscitation with bag and mask (by professional health workers for babies who do not breathe at birth)
•Kangaroo mother care for preterm (premature) and for less than 2 000g babies
•Extra support for feeding small and preterm babies
•Management of newborns with jaundice (‘yellow’ newborns)
• Initiate prophylactic antiretroviral therapy for babies exposed to HIV
•Comprehensive care of children infected with, or exposed to, HIV
Referral •Family planning• (surgical methods)
•Reduce mal-presentation at term with External Cephalic Version
• Induction of labour to manage prelabour rupture of membranes at term (initiate labour)
•Caesarean section for maternal/foetal indication (to save the life of the mother/baby)
•Prophylactic antibiotic for Caesarean section
• Induction of labour for prolonged pregnancy (initiate labour)
•Management of postpartum haemorrhage (as above plus surgical procedures)
•Detect and manage post-partum sepsis (serious infections after birth)
•Presumptive antibiotic therapy for newborns at risk of bacterial infection
•Use of surfactant to prevent respiratory distress syndrome in preterm babies
•Continuous positive airway pressure (CPAP) to manage babies with respiratory distress syndrome
•Case management of neonatal sepsis, meningitis and pneumonia
•Case management of meningitis

Maternal, Newborn and Child Health 4
53SAHR 2012/13
Interventions and initiatives to reduce maternal, newborn and child deaths
At an international level, recent efforts to improve maternal, newborn and child survival have focused on ensuring full coverage with packages of interventions with proven effectiveness. It is argued that the key to making progress towards improving maternal, neonatal and child survival is to reach every mother, newborn and child in every district with a set of priority cost-effective interventions.23-25
These packages should be provided through a continuum-of-care approach in order to lower costs, promote greater efficiencies and reduce duplication of resources.26
In order to facilitate decision making in low- and middle-income countries about how to allocate limited resources for maximum impact on the health of women and children, a review of existing evidence about the impact of different interventions on the main causes of maternal, newborn and child deaths was undertaken. The study reviewed more than 50 000 scientific papers to determine the proven effectiveness of interventions and impact on survival, identifying 56 essential interventions that when implemented in packages relevant to local settings are most likely to save lives.25 The proposed interventions and packages are shown in Table 2.
Continuum of Care
Adolescence & Pre-pregnancy
Pregnancy (Antenatal) Childbirth
Postnatal (Mother)
Postnatal (Newborn)
Infancy & Childhood
CommunityStrategies
•Home visits for women and children across the continuum of care
•Women’s groups
•Family planning interventions at referral level include those provided at the primary level
Source: Partnership for Maternal Newborn and Child Health, 2011.25
Recognition that progress in reducing childhood deaths has been accompanied by increases in within-country inequities, as evidenced by a widening of the mortality gap between the wealthiest and most deprived quintiles, has highlighted the need to aim specifically at increased coverage among the poorest and most disadvantaged children.27 Modelling undertaken by Carrera et al. suggests that an equity-focused approach that prioritises services for the poorest and most marginalised can be more effective and cost effective than mainstream approaches that incrementally increase population coverage from the easier to the more difficult to reach populations.28 Analysis of data from middle- and low-income countries has demonstrated that those countries with the largest overall coverage with key interventions achieved this coverage primarily through achieving the greatest increase among the poorest quintiles.29
The importance of health system strengthening, of greater accountability (which depends on improved monitoring) and more sustainable financing have also been highlighted.
Key international commitments and strategic documents
Global Strategy for Women’s and Children’s Health
The Global Strategy for Women’s and Children’s Health was launched by Ban Ki-moon in 2010 in an effort to mobilise commitments by governments, civil society organisations and development partners to accelerate progress towards achievement of MDGs 4 and 5.1 The strategy sets out the key areas where action is urgently required to enhance financing, strengthen policy and improve service delivery. These key areas include:
➢ support for country-led health plans, supported by increased, predictable and sustainable investment;
➢ integrated delivery of health services and life-saving interventions;
➢ stronger health systems, with adequate numbers of skilled health workers at their core;
➢ innovative approaches to financing, product development and the efficient delivery of health services; and
➢ improved monitoring and evaluation to ensure the accountability of all actors for results.
The Commission on Information and Accountability for Women’s and Children’s Health
Following the launch of the Global Strategy, the World Health Organization (WHO) was tasked with coordinating a process to determine the most effective international institutional arrangements for global reporting, oversight and accountability on women’s and children’s health.30 The recommendations of the commission focused on ensuring the availability of “better information for better results”. Countries are challenged to improve their systems for recording vital events through the establishment or the strengthening of systems for registration of births, deaths and causes of death, and having well-functioning health information systems that combine data from facilities, administrative sources and surveys. Emphasis is also placed on improving the tracking of resources for women’s and children’s health and on ensuring better oversight of results and resources both nationally and globally.
A set of 11 health indicators on reproductive, maternal and child health, which are disaggregated for gender and other equity considerations, should be used for the purpose of monitoring progress towards the goals of the Global Strategy. These, together with their preferred source of data, are shown in Table 3.

54 SAHR 2012/13
Table 3: Current primary data sources and preferred data sources for the 11 core indicators of women’s and children’s health
Indicator Current Primary Data Source Preferred Data Source
Maternal mortality ratio Surveys Vital registration
Under-five child mortality (with the proportion of newborn deaths) Surveys Vital registration
Stunting prevalence Surveys SurveysDemand for family planning satisfied (met need for contraception)
Surveys Surveys
Antenatal care (four or more visits) Surveys Surveys and facility reports
Antiretrovirals for HIV-positive pregnant women* Facility reports Facility reports
Skilled attendant at birth Surveys Surveys and facility reports
Postnatal care for mothers and babies within two days of birth Surveys Surveys and facility reports
Exclusive breastfeeding (0 to 5 months of age)** Surveys SurveysThree doses of combined diphtheria-tetanus-pertussis vaccine (DTP3) immunisation coverage Surveys and facility reports Surveys and facility reports
Antibiotic treatment for childhood pneumonia Surveys Surveys and facility reports
* This indicator comprises antiretroviral drugs for HIV-positive pregnant women to reduce the risk of mother-to-child transmission of HIV and for their own health.
** Up to the last day of the fifth month of life.
Source: World Health Organization, 2011.31
Committing to Child Survival: a Promise Renewed
Led by the United Nations Children’s Fund (UNICEF), this strategy aims to revitalise commitment to child survival under the banner of A Promise Renewed.32 The strategy, which aims to ensure that under-five mortality rates are below 20 per 1 000 live births in all countries by 2035, focuses on scaling up essential interventions through strengthening of evidence-informed country plans, transparency and mutual accountability, and global communication and social mobilisation.
The strategy focuses on:
➢ concentrating resources on countries and regions with the most child deaths;
➢ increasing efforts among high-burden and underserved populations;
➢ focusing on high-impact solutions by targeting the biggest opportunities for impact – e.g. neonatal conditions – by scaling up and sustaining demand and supply of highest impact and evidence-informed solutions and investing in innovation to accelerate results;
➢ creating a supportive environment for child survival; and
➢ fostering mutual accountability by creating transparency and mutual accountability, unifying child survival voices, improving monitoring and evaluating, and sharing knowledge.
Global strategy for elimination of new HIV infections among children
This strategy recognises the synergy between maternal and child health and focuses on accelerating progress towards the elimination of new child infections by 2015.33 The strategy defines two key targets – namely to reduce the number of new childhood HIV infections by 90% and to reduce the number of HIV-related maternal deaths. Strategies for achieving the first target include reducing the transmission of HIV from a mother to her child, as well
as reducing the HIV incidence in women of reproductive age and increasing the use of family planning services for women living with HIV. Achievement of the second target is dependent on provision of a broader package of HIV and maternal, newborn and child health services.
Key national commitments and interventions
This section provides an overview of important national commitments and strategies that aim to reduce maternal and child mortality.
Negotiated Service Delivery Agreement
NSDA was signed on behalf of the health sector by the Minister of Health in October 2010 and is a contract or “charter that reflects the commitment of key sectoral and intersectoral partners linked to the delivery of identified outputs”. The NSDA outlines four key strategic outputs that the health sector must achieve within the next five years. These are:
➢ Output 1: Increasing life expectancy
➢ Output 2: Decreasing maternal and child mortality
➢ Output 3: Combating HIV and AIDS and decreasing the burden of disease from TB
➢ Output 4: Strengthening health systems effectiveness.34
The NSDA, therefore, places maternal and child mortality and the need to reduce the number of mothers and children who die in SA firmly on the country’s agenda and requires that all levels of the health system report on and account for progress or lack thereof.

Maternal, Newborn and Child Health 4
55SAHR 2012/13
Establishment of ministerial mortality committees
The establishment of three mortality committees has provided impetus to efforts to address maternal-, perinatal- and child mortality. The National Committee on Confidential Enquiries into Maternal Deaths (NCCEMD),which collects data on all maternal deaths occurring within health facilities in order to monitor trends and address identified deficiencies, was established in 1998. The National Perinatal Mortality and Morbidity Committee (NaPeMMCo) and the Committee on Mortality and Morbidity in Children (CoMMiC) were established in 2008 and do not collect primary data but collate and interpret data regarding mortality rates. All three committees advise the National Department of Health (NDoH) on gaps in service delivery and how these can be addressed.
The recommendations contained in the most recent reports of the three committees are shown in Box 1.
MNCWH and Nutrition Strategic Plan
The country’s first MNCWH&N Strategic Plan, launched in 2012, focuses on identifying and strengthening those priority interventions that can be expected to have the greatest impact on reducing maternal, newborn and child mortality.36 These priority interventions are shown in Box 2.
The plan provides a road-map of how these interventions can be effectively implemented. Their focus is on improving coverage, quality and equitable access to this package of core services through the implementation of eight key strategies for achieving improvements in maternal, newborn and child health:
1. Address inequity and social determinants of health.
2. Develop a comprehensive and coordinated framework for MNCWH service delivery.
3. Strengthen community-based MNCWH.
4. Scale up provision of key MNCWH&N interventions at PHC and district levels.
5. Scale up provision of key MNCWH&N interventions at district hospital level.
6. Strengthen the capacity of the health system to support the provision of MNCWH&N services.
7. Strengthen the human resource capacity for the delivery of MNCWH&N services.
8. Strengthen systems for monitoring and evaluation of MNCWH&N interventions and outcomes.
The plan also contains a set of key indicators for monitoring progress in improving maternal and child health outcomes.
The Campaign for Accelerated Reduction in Maternal and Child Mortality in Africa strategy
The Campaign for Accelerated Reduction in Maternal and Child Mortality in Africa (CARMMA) was launched by the Fourth Session of the African Union (AU) Conference of Ministers of Health held in Addis Ababa, Ethiopia in May 2009, under the theme: “Universal Access to Quality Health Services: Improve Maternal, Neonatal and Child Health Mortality in Africa (CARMMA)”. The campaign was launched under the slogan “Africa Cares: No Woman Should Die While Giving Life!”37 and focuses on four main areas: building on existing efforts (particularly best practices); generating and providing data on maternal and newborn deaths; mobilising political commitment and support of key stakeholders; and accelerating actions aimed at the reduction of maternal-, infant- and child mortality in Africa.
The campaign was launched in SA in May 2012. The South African campaign focuses on six priorities. These are:
1. Strengthen and promote access to comprehensive sexual and reproductive health services, with a specific focus on family planning services.
2. Promote early antenatal care and attendance of appointments.
3. Improve access to skilled birth attendants by allocating dedicated obstetric ambulances to every sub-district to ensure prompt transfer of women in labour and women with obstetric emergencies to the appropriate level of care. Establish maternity waiting homes.
4. Strengthen human resources for maternal and child health by:
- providing training on ESMOE to doctors and midwives;
- intensifying midwifery education and training;
5. Improve child survival by:
- promoting and supporting exclusive breastfeeding for at least six months;
- providing facilities for lactating mothers (boarder mothers) in health facilities where children are admitted;
- promoting Kangaroo Mother Care (KMC) for stable low birth weight (LBW) babies at all levels of care;
- advocating for appropriate care and support for pregnant women and lactating mothers in the workplace;
- improving immunisation and vitamin A coverage;
- intensifying management of severe malnutrition in health facilities;
- intensifying case management of sick children;
- improving implementation of key family practices, including diarrhoea management at home;
- strengthening implementation of IMCI in all PHC facilities;
- strengthening clinical skills for the management of severe diseases, including pneumonia and diarrhoea in referral facilities;
6. Intensify management of HIV-positive mothers and children by:
- improving access to treatment for both mothers and children;
- improving management of co-infections; and
- eliminating mother-to-child-transmission (MTCT) of HIV.

56 SAHR 2012/13
Box 1: Summary of the recommendations of the three ministerial mortality committees
SAVING MOTHERS 2008-2010: FIFTH REPORT ON THE CONFIDENTIAL ENQUIRIES INTO MATERNAL DEATHS
IN SOUTH AFRICA
The committee has summarised its recommendations in five key categories as shown below.13
HIV and AIDS 1. Promote the “know your status” and “plan your pregnancy”
messages in communities and in the health sector and ensure non-judgemental approaches.
2. Ensure that every maternity facility is able to screen for HIV, perform early initiation of highly active antiretroviral therapy (HAART), and recognise and treat co-infections – especially respiratory infections.
Haemorrhage 3. Promote preventive interventions: provide community education,
prevent prolonged labour, prevent anaemia; use safe methods for the induction of labour; and practise active management of the third stage of labour.
4. Severe obstetric haemorrhage must have the status of a ‘major alert’ requiring a team approach and immediate attention must be given to diagnosing the cause of the haemorrhage, resuscitation, and a stepwise approach to arresting the haemorrhage.
Hypertension 5. All maternity facilities must provide calcium supplementation to all
women throughout their antenatal care and ensure the detection, early referral and timely delivery of women with hypertension in pregnancy.
6. All maternity facilities must be able to recognise severe hypertension (and related conditions) and provide appropriate management.
7. Promote family planning services in the population at large.
Health worker training8. Train all healthcare workers involved in maternity care in the
Essential Steps in the Management of Obstetric Emergencies – Emergency Obstetric Simulation Training (ESMOE-EOST) programme and obstetric anaesthetic module.
9. Train all healthcare workers who deal with pregnant women in HIV advice, counselling, testing and support (ACTS); initiation of HAART; monitoring of HAART; and the recognition, assessment, diagnosis and treatment of severe respiratory infections.
Health system strengthening 10. Ensure 24-hour access to functioning emergency obstetric care
(both basic and comprehensive).11. Ensure accessible and appropriate contraceptive services for
all women, which are integrated into all levels of health care and which must be available on site for women post-miscarriage and postpartum.
NATIONAL PERINATAL MORTALITY AND MORBIDITY COMMITTEE (NAPEMMCO)
The report includes 10 general recommendations,as well as re-commendations regarding specific conditions to reduce maternal deaths, stillbirths and newborn deaths. The general recommendations are summarised below.22
Improving access to appropriate health care1. Appoint regional clinicians to establish, run and monitor and
evaluate outreach programmes for maternal and neonatal health.2. Improve the transport system for patients and establish referral
routes.3. Government to ensure that constant health messages are
conveyed to all and understood by all. This includes community members, patients/clients and healthcare providers.
Improving quality of care 4. Improve the training of healthcare professionals and emphasise
maternal and newborn care guidelines during pre-service training and training in clinical skills – especially with regard to training in medical, obstetric and neonatal emergency care, including resuscitation.
5. Follow national maternal and neonatal guidelines in all healthcare facilities.
6. Improve provision and delivery of postnatal care.7. Normalise HIV as a chronic disease.
Ensuring that adequate resources are available 8. Provide adequate nursing and medical staff and adequate
equipment for the health needs of both mothers and babies, especially the equipment required for emergency and critical care.
9. Provide an adequate number of hospital beds for the health needs of mothers and babies at all levels of health care, including critical care beds.
Auditing and monitoring 10. Improve data collection and collation (through the use of
standardised registers) and ensure that healthcare workers and managers review and receive feedback regarding their performance.
FIRST REPORT OF THE COMMITTEE ON MORBIDITY AND MORTALITY IN CHILDREN UNDER FIVE YEARS (COMMIC)
The report gives eight key recommendations.35 These are:1. Develop a national child health strategy.2. Develop a framework for the delivery of essential healthcare
services: - develop an essential package of care - define norms and standards for child health services
3. Strengthen community-based-care services: - give a booklet at the birth of the child that outlines 16 key family
practices for child survival - implement a community health worker programme
4. Strengthen and complement existing priority child survival programmes: - HIV/AIDS – PMTCT and paediatric HAART - PHC services – integrated management of childhood illnesses
(IMCI), expanded programme on immunisation (EPI), vitamin A supplementation, nutrition and TB and childhood emergencies
- hospital services – enhance management of common emerg-encies and foster non-rotation of core staff
5. Strengthen pre-service, postgraduate and in-service training in child health and paediatrics.
6. Institute a system of geographically defined and population-focused child health coordination and support by specially trained paediatricians or child health workers.
7. Strengthen essential data systems: including vital registration; the District Health Information System (DHIS); the Demographic Health Survey (DHS); Child Healthcare Problem Identification Programme (Child PIP); and the Road to Health booklet.
8. Identify key drivers to sustain the actions required to improve the health of children across the country: - establish district child health forums - establish provincial child health forums
Sources: National Committee for Confidential Enquiries into Maternal Deaths, 2012;13 National Perinatal Mortality and Morbidity Committee, 2012;22 Committee on Mortality and Morbidity in Children, 2012.35

Maternal, Newborn and Child Health 4
57SAHR 2012/13
The Tshwane Declaration: promoting exclusive breastfeeding
In response to the 2010 WHO guidelines on HIV and infant feeding,38 which re-established promotion of breastfeeding as a key child survival strategy, a national breastfeeding consultative meeting was convened in August 2011. The meeting concluded with the Tshwane Declaration of Support for Breastfeeding, which declared SA to be a country that actively promotes, protects and supports exclusive breastfeeding as the infant feeding option of choice, irrespective of the mother’s HIV status.
The declaration recommended the following additional actions:
➢ National Regulations on the International Code on Marketing of Breast Milk substitutes are finalised, adopted into legislation within 12 months, fully implemented and the outcomes monitored.
➢ Legislation regarding maternity among working mothers is reviewed in order to protect and extend maternity leave. Measures are to be implemented to ensure that all workers, including domestic and farm workers, benefit from maternity protection.
➢ Comprehensive services are to be provided to ensure that all mothers are supported to breastfeed their infants exclusively for six months and, thereafter, to give appropriate complementary foods and continue breastfeeding up to two years of age and beyond.
➢ Human milk banks are promoted and supported as an effective approach, especially in post-natal wards and neonatal intensive care units, to reduce early neonatal and post-natal morbidity and mortality for babies who cannot breastfeed.
➢ Implementation of the Mother and Baby Friendly Health Initiative (MBFHI) and KMC are mandated such that all public hospitals and health facilities are MBFHI accredited by 2015. All private hospitals and health facilities should be partnered to be MBFHI accredited by 2015.
➢ Communities are supported to be ‘baby friendly’ and community-based interventions and support are implemented as part of the continuum of care, with facility-based services to promote, protect and support breastfeeding.
➢ Continued research, monitoring and evaluation should inform policy development and strengthen implementation.
➢ Formula feeds will no longer be provided at public health facilities, except on prescription by appropriate healthcare professionals for mothers, infants and children with approved medical conditions.
National HIV and AIDS and STI Strategic Plan
In line with international trends, the National HIV and AIDS and STI Strategic Plan (NSP)explicitly links efforts to reduce mortality and morbidity associated with HIV infection with efforts to improve maternal and child health. 39 The NSP aims to reduce MTCT to less than 2% at six weeks after birth and less than 5% at 18 months by 2016. The plan recognises that this will require strengthening the management, leadership and coordination of the PMTCT programme and ensuring its integration with maternal and child health programmes.
The NSP has identified four strategic objectives to reach its five-year goals. These are:
➢ address social and structural factors that influence the three diseases;
➢ prevent new HIV, TB and STI infections;
➢ sustain health and wellness by:
- ensuring access to quality treatment, care and support services for those with HIV, STIs and/or TB;
- supporting people so that they stay on treatment and developing programmes that focus on wellness;
- improving community-level PHC, number of treatment centres and specialist referral for difficult cases; and
➢ protect rights of people living with HIV by working to end stigma, discrimination, human rights violations and gender inequality.
National Early Childhood Development strategy
It is increasingly recognised that early childhood – especially between birth and two years of age – represents a critical window of opportunity to shape the long-term physical, cognitive and emotional health and development of children and that the best way to give children the best start in life is through an integrated approach to early childhood development (ECD).40
As the first step in developing a new ECD strategy for the country, a Diagnostic Review of Early Childhood Development was undertaken in 2012, The review found that many elements of comprehensive ECD support and services were already in place and that some aspects of basic services provision were assessed as performing well; these include birth registration, social security, health care for women and children, early child care and education, and preparation for formal schooling. 41
Important needs highlighted in the review included: support for parenting, prevention of stunting among young children, safe and affordable child care for very young children and for families needing assistance, and access to services for the most at-need families and children with disabilities.
The Buffalo City Declaration, which emanated from the National ECD Conference held in September 2012, called for:
➢ a comprehensive review and harmonisation of policy and legislation within the ECD sector moving towards universal access;
➢ a multisectoral, integrated, coordinated approach to the effective provisioning of ECD services by government, non-governmental organisations, civil society and business;
➢ strengthening the role of parents and caregivers, families and communities in the provisioning of ECD services;
➢ deliberately extending ECD services to include children with special needs and children in rural areas; and
➢ adequate resourcing of ECD services, including infrastructure provisioning.42

58 SAHR 2012/13
Health systems strengthening and PHC re-engineering
Delivery of comprehensive, quality MNCWH&N services depends on a well-functioning health system. Deficiencies in the quality of maternal and child health services have been extensively documented and gains in maternal and child health are unlikely to be achieved in the absence of improved service delivery. This will require substantial investment in human resources to ensure improved availability, skills and motivation of healthcare workers who provide maternal and child health services at community, PHC and hospital levels.16
Government initiatives to improve the noted deficiencies include the introduction of the National Health Insurance, introduction of national core standards and PHC re-engineering. PHC re-engineering specifically aims to improve maternal and child outcomes and is, therefore, described in more detail below.
Establishment of ward-based PHC outreach teams
The ward-based PHC outreach teams which are based on the model used to improve health outcomes in Brazil will play an important role in delivering community-based MNCWH&N promotion and other services to communities and households, and will facilitate access to routine and curative health and other services where these are required. Each team should consist of a team leader (professional or enrolled nurse) and four to five community health workers. They will be expected to provide services to approximately 7 500 households. In the long term, teams are expected to cover all of the 4 227 wards.43
Establishment of district clinical specialist teams
District clinical specialist teams will be made up of an obstetrician, a paediatrician, a family physician, an anaesthetist, an advanced midwife, an advanced paediatric nurse and a PHC nurse.44 The teams will be tasked with improving clinical governance in the districts in which they are deployed. They will, therefore, play a key role in ensuring the provision of quality MNCWH&N Strategic Plan services at all levels within the district. Particular attention will be paid to ensuring supervision and support of MNCWH&N Strategic Plan services at district hospital level.
Expansion and strengthening of school health services
Strengthening school health services will contribute towards improved health and learning outcomes for children and youth. The new Integrated School Health Programme (ISHP) aims to build on and strengthen existing school health services, although with some important changes. These include:45
➢ a commitment to close collaboration between all role players, with the Departments of Health and Basic Education taking joint responsibility for ensuring that the ISHP reaches all learners in all schools;
➢ provision of services to learners in all educational phases;
➢ provision of a more comprehensive service, which addresses not only barriers to learning but also other conditions that contribute to morbidity and mortality among learners during both child- and adulthood;
➢ more emphasis on provision of health services in schools, with a commitment to expanding the range of services over time; and
➢ a more systematic approach to implementation. The phased approach (as outlined in the 2003 school health policy), which focused on district-level implementation, did not translate into adequate coverage at sub-district, school and learner levels.46 Although the ISHP will initially target the most disadvantaged schools, sequenced plans for progressive coverage aim to ensure that all learners are reached.
The ISHP aims to ensure that this package of services is provided for all learners by 2016.
Progress in implementing key interventions and programmes
Sustaining reductions in maternal and child mortality depends on translating the commitments and strategies outlined above into workable programmes and services that can achieve and sustain high coverage. This section focuses on the package of priority maternal and child health interventions as outlined in the national MNCWH&N (see Box 2). These packages include all of the 56 essential interventions outlined in Box 1, although calcium supplementation to prevent hypertension for all pregnant women has not been widely implemented and surfactant is generally not available at district hospital level.

Maternal, Newborn and Child Health 4
59SAHR 2012/13
Box 2: Package of priority maternal- and child-health interventions as outlined in the National MNCWH&N Strategic Plan
Maternal health
❖ basic antenatal care (BANC);
❖ HIV testing during pregnancy, with initiation of ART and provision of other PMTCT services where indicated;
❖ improved access to care during labour through introduction of dedicated obstetric ambulances and establishment of maternity waiting homes (where appropriate);
❖ improved intrapartum care; and
❖ post-natal care within six days of delivery.
Newborn health
❖ promotion of early and exclusive breastfeeding, ensuring that breastfeeding is made as safe as possible for HIV-exposed infants;
❖ provision of PMTCT;
❖ resuscitation of newborns;
❖ care for small/ill newborns according to standardised protocols;
❖ KMC for stable LBW infants; and
❖ post-natal visit within six days, which includes newborn care and helping mothers to practise exclusive breastfeeding.
Child health
❖ promotion of breastfeeding and appropriate complementary feeding practices for infants and young children;
❖ provision of preventative services. These include: immunisation, growth monitoring and promotion, vitamin A supplementation and regular deworming;
❖ correct management of common childhood illnesses using the IMCI case management process (including early identification and management of children with HIV and TB);
❖ early identification of HIV-infected children and appropriate management (which includes initiation of ART where indicated);
❖ improved hospital care for ill children, especially for those with common conditions (pneumonia, diarrhoea and severe malnutrition), using standardised protocols;
❖ expansion and strengthening of school health services; and
❖ developing services for children with long-term health conditions.
Community interventions
❖ provision of a package of community-based MNCWH&N Strategic Plan services by generalist community health workers working as part of ward-based PHC outreach teams;
❖ multi-sectoral action to reduce poverty and inequity, and improve access to basic services, especially improved water and sanitation; and
❖ development of an MNCWH&N Strategic Plan communication strategy.
Source: National Department of Health, 2012.36
Maternal health care
Antenatal care
Antenatal care (ANC) should be provided through the Basic Antenatal Care (BANC) approach, which has been shown to be as effective as more traditional antenatal care models in terms of maternal and perinatal outcomes, as well as acceptable to users.47 The BANC approach requires that every woman attends ANC at least four times during her pregnancy, starting in the first trimester. Early attendance is particularly important, given that the current PMTCT guidelines recommend that ART be commenced at 14 weeks’ gestation in eligible women. The approach also emphasises promotion of healthy behaviours (such as adequate nutrition and moderate exercise, safe sex and smoking and alcohol avoidance and cessation), and identifies and refers women with high-risk pregnancies.
As shown in Table 4 although DHIS data for 2011 show that ANC coverage was above 100%, only 40% of pregnant women attended ANC before 20 weeks gestation and only four provinces achieved an average of four visits per antenatal client. HIV counselling and testing rates were reported to have attained full coverage, although retesting rates (at 32 weeks) were far lower. ART initiation rates reflect the proportion of eligible pregnant women who were initiated on ART. While this rate has increased over time, the low rates in some provinces (i.e. Northern Cape and Free State) are of concern.48 From April 2013, all HIV-infected pregnant and breastfeeding women will be eligible to receive ART.
Data from the DHIS and other sources are used to assess progress regarding implementation, while ongoing challenges and their possible solutions are highlighted.

60 SAHR 2012/13
Table 4: ANC and PMTCT coverage indicators, 2011
ANC coverage%
ANC coverage before 20 weeks
%
Average no. of ANC visits per
ANC client
ANC clients who tested for HIV
(first test)%
ANC clients who tested for HIV (second test
32 weeks)%
Eligible ANC clients who
were initiated on HAART
%Eastern Cape 99.7 33.0 3.0 95.4 33.4 71.1
Free State 86.1 46.3 4.3 96.8 45.1 62.6
Gauteng 117.0 34.4 3.7 88.3 50.5 77.9
KwaZulu-Natal 93.8 40.2 4.4 110.1 36.7 90.0
Limpopo 113.7 41.6 3.5 102.7 44.3 75.4
Mpumalanga 99.3 37.8 3.5 111.2 32.6 65.7
North West 100.3 41.9 3.6 107.8 38.3 71.7
Northern Cape 95.1 52.4 4.5 99.8 42.2 52.3
Western Cape 81.7 55.6 4.5 91.4 35.6 99.5
South Africa 100.6 39.9 3.0 99.3 40.3 78.7
Source: National Department of Health, 2012.48
Intrapartum care
Although 90% of women deliver in facilities (see Table 5), it is postulated that many women do not reach hospital during labour or present late in labour primarily due to difficulties related to accessing transport after the onset of labour. This issue is addressed specifically in the CARMMA strategy through the introduction of dedicated obstetric ambulances and the establishment of maternity waiting homes. PHC outreach team members will also play an important role in ensuring that expectant mothers are assisted to develop birthing plans.
However, late presentation is not the only factor in high levels of maternal mortality and morbidity. The ESMOE is a practical modular training programme, which has been shown to result in a significant improvement of interns’ knowledge and skills. It is currently being scaled-up with all healthcare workers that supervise deliveries at all levels of care, being targeted for training.49
Table 5: Intrapartum and post-partum care, 2011
Deliveries occurring in facilities
%
Women who receive post-natal care within
6 days of delivery%
Eastern Cape 81.8 44.1
Free State 79.1 79.7
Gauteng 97.3 64.2
KwaZulu-Natal 83.3 55.7
Limpopo 113.1 64.5
Mpumalanga 89.3 40.0
North West 83.9 75.5
Northern Cape 89.4 38.0
Western Cape 84.8 Does not report
South Africa 89.7 52.5
Source: National Department of Health, 2012.48
Post-natal care
The lack of provision of post-natal care has been identified as a gap in the continuum of care both internationally and in SA.50 Post-natal care visits can play an important role in providing care to the mother and newborn, especially by helping mothers to practise exclusive breastfeeding and by ensuring that the mother/infant pair receives the post-natal component of PMTCT. The National Maternity Care Guidelines prescribe that these visits should be made at six hours, at six days and at six weeks after delivery.51
Reported coverage of post-natal care within six days of delivery has increased substantially, from a national figure of 4.8% in 2009 to 52.5% in 2011.48 However, considerable variation in coverage between provinces (shown in Table 5) persists.
Newborn care
The newborn care package outlined in the MNCWH&N Strategic Plan aims both to prevent deaths by targeting the leading causes of death during the newborn period and to promote PMTCT and exclusive breastfeeding – two interventions that have important implications for improving survival and health throughout infancy and childhood. Data on perinatal mortality rates provide an indication of the quality and coverage of newborn care, although provincial rates hide wide intra-provincial variation.48

Maternal, Newborn and Child Health 4
61SAHR 2012/13
Table 6: Perinatal mortality rate, 2011
Perinatal Mortality (deaths per 1 000 deliveries)
Eastern Cape 37.1
Free State 41.0
Gauteng 30.9
KwaZulu-Natal 31.6
Limpopo 32.3
Mpumalanga 33.6
North West 35.4
Northern Cape 36.9
Western Cape 23.1
South Africa 32.4
Source: National Department of Health, 2012.48
Preventing deaths: caring for sick and small newborns
Complications related to prematurity and LBW are the leading cause of death in newborn babies. Mortality rates for small newborns are high in district hospitals when compared with those in regional tertiary and central hospitals – notwithstanding that most small infants are cared for in district hospitals.22
Studies have shown that provision of KMC to stable small newborns where the baby is carried on the front of the mother’s chest (with direct skin-to-skin contact) is an effective and safe way of caring for these babies. Data collected through perinatal mortality audits have shown that public hospitals that have implemented KMC have reduced their mortality rates among small babies (weighing between 1 kg and 2 kg) by 30%.52 KMC is an important component of the CARMMA strategy and should be implemented in all facilities that provide newborn care.
Most neonatal deaths in large babies result from asphyxia. Improvements in intrapartum care and emergency management can be expected to prevent many of these deaths. All healthcare workers who deliver babies should be able to recognise promptly those newborns that require resuscitation and start resuscitation immediately.
Prevention of Mother-to-Child Transmission
As outlined above, the NSP aims to reduce MTCT to less than 2% at six weeks after birth and less than 5% at 18 months by 2016.39 The 2011 PMTCT Effectiveness Study found the national MTCT transmission rate to be 2.7% among HIV-exposed infants that attended a representative sample of PHC facilities for their six-week immunisation.53 This is compared with a figure of 3.5% for 2010 and of 8% for 2008.54 Figures for transmission rates at 18 months are less certain, as a result of low routine-testing coverage and challenges in following up infants, even in research settings.
Critical actions that facilitated the improvement in the PMTCT programme outcomes included: rapid implementation of changes in PMTCT policy at the field level through training and guideline dissemination; ensuring good coordination with technical partners, such as international health agencies and international and local non-governmental organisations and making use of data on and
indicators of all aspects of the PMTCT programme. Enabling healthcare staff at primary care facilities to initiate ART and expanding laboratory services for measuring CD4 T-cell counts and for polymerase chain reaction (PCR) testing were also identified as factors that facilitated improvements.55
Exclusive breastfeeding
Exclusive breastfeeding is recognised as being the single most effective intervention for reducing under-five mortality in low-income settings.56 SA has experienced the erosion of its breastfeeding culture over the past years due to among other reasons, aggressive marketing of breast milk substitutes by the infant feeding industry and a lack of clarity regarding optimal infant feeding practices in the context of HIV and AIDS. Studies have reported that between 8% and 25.7% of children aged 0 to 6 months were exclusively breastfeeding,57,58 while breastfeeding practices have proven resistant to interventions (such as a programme of home visitation in addition to routine facility infant feeding counselling), which have proved more successful in other settings.59
Implementation of the Tshwane Declaration is, therefore, a priority. Regulations regarding infant feeding, which are in line with the international Code on Marketing of Breast Milk Substitutes, were gazetted in December 2012, and breastmilk substitutes (formula) are no longer provided at public health facilities (except for approved medical conditions). Progress with regard to ensuring that all mothers are supported to breastfeed their infants is less certain, and is likely to require sustained attention and effort.
Child health
As outlined above, child mortality rates have shown a rapid decline in recent years, primarily as a result of the decline in the HIV burden in children. This provides an opportunity to address other important child health issues that have tended to be neglected in the past.
Optimal nutrition and ECD
Undernutrition remains an important problem for children in SA. The 2005 National Food Consumption Survey found that 18% of children were stunted, 9.3% were underweight and 4.5% were wasted.60 Levels for all three indices were higher in young children (one to three years) than in older children (seven to nine years). Stunting was higher in children living in rural farming areas (24.5%), tribal areas (19.5%) and urban informal areas (18.5%). Micronutrient deficiencies were also documented.
The ECD strategic review specified that reductions in the prevalence of stunting should be one of the key components of ECD interventions. PHC outreach teams will be well placed to ensure that caregivers are supported to feed their children optimally and that growth faltering is identified, corrected and managed. It is important that this is recognised and protected as one of their key roles.

62 SAHR 2012/13
Ensuring full coverage of preventive health services
Ensuring full coverage of preventive services, which include immunisation, growth monitoring and promotion, vitamin A supplementation and regular deworming, is a key component of ensuring the optimal health and development of all children. In order for this goal to be achieved, children need to access PHC services on a regular basis. The average number of visits to PHC facilities for children under-five has remained fairly stable in the past few years (increasing from 4.3 in 2008 to 4.6 in 2011). However, there is considerable variation between provinces, with children in the Free State only visiting health facilities an average of 3.6 times in 2011.48
Immunisation rates remain relatively high, although the low rates in Mpumalanga, North West and Eastern Cape are of concern. Discrepancies between DHIS figures and figures obtained through population-based surveys are also apparent and efforts are underway to understand and address these discrepancies.
Ensuring that children aged one to five receive vitamin A supplementation remains a challenge. PHC outreach teams are expected to play an important role in ensuring that children receive preventive services, including early identification of growth faltering and undernutrition.
Prevention and treatment of common illnesses
Pneumonia and diarrhoea remain the leading causes of death in children outside of the newborn period. DHIS data on these two conditions are shown in Table 8. These figures represent routine data from facilities; this means that variations in reported incidence may reflect access to health services and differences in case identification rather than real differences in the burden of disease.
Data on the proportion of children that receive the correct treatment, i.e. oral rehydration for diarrhoea and antibiotics for pneumonia, can only be accurately collected through population-based surveys.
The 2003 DHS showed that health care was sought for two-thirds of the children that were sick with a cough or fever, while 63% of children with diarrhoea received oral rehydration solution or sugar salt solution.57 There is an urgent need to ensure that more recent data are available for these indicators.
Management of HIV infection
An estimated 450 000 children under 15 years of age were living with HIV in SA, and HIV infection is a contributing factor in between 30% and 60% of child deaths.18,61 The 2010 HIV guidelines include the provision of ART for all HIV-infected infants and this has recently been extended to cover all children under five. ART should be provided at all PHC facilities as part of the routine management of young children, using the IMCI case management guidelines. The number of children receiving ART has increased, with 40 000
Table 8: Diarrhoea and pneumonia in children under five years of age: incidence, admissions, deaths and case fatality rates, 2011
Incidence of diarrhoea with
dehydration(cases per 1 000 children under
five years of age)
Admissions for diarrhoea (per 1 000
children under five years
of age)
Case fatality rate %
Incidence of pneumonia
(cases per 1 000 children under
five years of age)
Admissions for pneumonia
(cases per 1 000 children under
five years of age)
Case fatality rate%
Eastern Cape 12.5 7.6 8.3 59.5 9.1 5.2
Free State 7.2 7.7 8.2 94.0 9.2 7.0
Gauteng 13.9 3.1 5.0 57.3 5.3 4.2
KwaZulu-Natal 22.7 7.4 5.0 155.0 9.0 3.8
Limpopo 16.2 5.7 9.0 55.1 10.1 5.8
Mpumalanga 9.3 4.8 9.9 42.7 6.8 8.3
North West 10.8 8.3 4.9 76.7 9.0 5.1
Northern Cape 11.9 16.9 3.7 95.8 15.1 3.0
Western Cape 16.7 14.3 0.2 72.0 13.6 0.4
South Africa 15.2 7.2 5.2 84 8.9 4.3
Source: National Department of Health, 2012.48
Table 7: PHC utilisation and coverage with key preventive interventions, 2011
Average no. of PHC visits for children under five years of age
Children who are fully immunised by one year of age,%
Vitamin A Coverage amongst children one to five years of age %
Eastern Cape 4.5 81.5 43.1
Free State 3.6 90.8 45.2
Gauteng 4.1 115.4 46.2
KwaZulu-Natal 4.5 97.0 40.0
Limpopo 6.3 95.9 44.6
Mpumalanga 4.8 71.9 37.5
North West 4.3 81.5 33.8
Northern Cape 4.6 94.1 30.5
Western Cape 4.8 88.7 37.7
Total 4.6 94.2 41.4
Source: National Department of Health, 2012.48

Maternal, Newborn and Child Health 4
63SAHR 2012/13
children (under 15 years of age) being initiated on ART during 2011.62 However, significant challenges remain in ensuring that all eligible children are initiated on ART as early as possible and that systems for tracking progress in initiating and maintaining children on ART are strengthened.
Hospital care
Strategies for monitoring and improving the care that children receive in public hospitals have not been implemented on a large scale. This has resulted in a wide variation in the quality of care provided in different hospitals. DHIS data reveal enormous variation with regard to child mortality rates (see Table 9) and mortality audits continue to identify many modifiable factors that have or may have contributed to the deaths of children in hospitals.
Table 9: In-hospital fatality rates for children, 2011
In-hospital fatality rate
children under one year
%
In-hospital fatality rate
children under five years
%Eastern Cape 7.2 5.8
Free State 10.2 8.4
Gauteng 7.2 2.5
KwaZulu-Natal 7.0 5.2
Limpopo 10.9 6.8
Mpumalanga 9.7 6.3
Northern Cape 8.5 6.1
North West 6.9 5.3
Western Cape 2.8 1.8
South Africa 6.9 4.5
Source: National Department of Health, 2012.48
Data from hospital audits undertaken between 2005 and 2009 also highlight deficiencies in the quality of emergency care, with more than one-third of deaths occurring within 24 hours of admission and a disproportionate number of modifiable factors occurring in the emergency care setting. Assessment and management of children in this setting appeared to be a particular problem, and highlights the need for the introduction of a standard approach to the provision of emergency care.18
The establishment of district clinical specialist teams provides an important opportunity for improving the quality of care at regional and district hospital levels. The teams will be expected to ensure that appropriate guidelines and protocols are available and that healthcare workers are appropriately trained and supported to provide high-quality services.
Children with long-term health conditions
Services for ensuring that children with long-term health conditions and disabilities receive the care that they deserve are lacking.63 International data indicate that 15% to 20% of children are affected by a chronic or long-term health condition. These include a range of congenital and acquired conditions, which include medical conditions (such as asthma and rheumatic heart disease), developmental delay and disabilities.
Conclusions and recommendations
Despite recent progress, SA continues to face a high burden of disease and high maternal and child mortality rates. Reducing maternal and child deaths has been included as one of the four strategic outputs of the NSDA. This means that all levels of the health system are required to report on progress in reducing these rates. This requirement has not only increased accountability but has provided impetus to efforts to improve the health of mothers and children.
At a global level, ensuring provision of evidence-informed packages of care to all women and children continues to be regarded as the key to improving maternal and child health. Strengthening the health system, addressing equity and increasing accountability play a parallel role. In SA, the packages of maternal and child health services, as outlined in the MNCWH&N Strategic Plan, are in line with those interventions that have been identified as most likely to save the lives of women and children. However, weaknesses and inefficiencies in the health system will need to be addressed if current gains are to be maintained and accelerated and the potential benefits of PHC restructuring and other efforts to improve maternal and child health are to be realised. International experience also suggests that gains in combatting child mortality will stall unless issues related to equity are dealt with more explicitly through reaching the most disadvantaged communities.
The MNCWH&N Strategic Plan, together with the CARMMA strategy, recommendations from the three ministerial mortality committees and other key documents, provide SA with a detailed road-map for improving maternal, newborn and child health. Efforts to improve maternal and child health should, therefore, focus on ensuring that all the components of the plan are implemented. These should include those components that address the strengthening of health system supports and human resources.
Priority actions include:
➢ Ensure the availability of adequate numbers of well-trained healthcare workers at facility and community levels. District clinical specialist teams and PHC outreach teams represent a valuable human resource at community and district levels; systems will need to be in place to ensure that these teams identify and address key barriers to the provision of MNCH services at household, community and facility levels. It will be particularly important to ensure that PHC outreach team members are not overloaded with too many tasks and to ensure that provision of maternal and child health services remains one of their core tasks.
➢ Strengthen systems for monitoring and evaluation to improve planning and service delivery and encourage greater accountability. This includes:
- strengthening the use of routinely collected data at national, provincial and local levels;
- improving the availability of population-based data on health status and outcomes and on coverage with key interventions. Such surveys need to collect data regarding socio-economic indicators to measure coverage and other gaps between different wealth quintiles and groups with other socio-economic and educational characteristics;

64 SAHR 2012/13
- expanding and institutionalising mortality audits as these have been effective in identifying deficiencies in care and galvanising action to improve service delivery;
➢ Monitor and address issues related to inequity more explicitly. Although this is included in the strategic plan, the strategies and interventions through which this will be achieved need to be more clearly defined.
➢ Prioritise current efforts to improve management of HIV infection and of obstetric emergencies as these services have the greatest potential to improve maternal survival.
➢ Address newborn mortality needs in a systematic manner. In addition to improving maternal care, all hospitals should provide a package of care to newborns, which includes provision of routine care (including breastfeeding support and PMTCT), neonatal, resuscitation, special care for small/sick newborns and KMC. As outlined in the NaPeMMCo recommendations, this will require improvements in access to appropriate care and in the quality of care, as well as ensuring that adequate resources are available and that auditing and monitoring are strengthened.
➢ As mortality from HIV infection in children declines, pay more attention to addressing other conditions and to ensuring optimal development of all children. These include:
- ensuring that undernutrition in children is addressed in a systematic way. This needs to form a key component of a comprehensive package of ECD interventions, which include promotion of breastfeeding and ensuring that children access all routine preventive and promotive health services;
- improving the quality of care that children receive in hospital. Emergency care needs to be improved as well as care for common conditions, especially diarrhoea, pneumonia, malnutrition and HIV infection; and
- improving services for children with long-term health conditions, including disability.

Maternal, Newborn and Child Health 4
65SAHR 2012/13
References
1 The Partnership for Maternal, Newborn and Child Health. Global Strategy for Women’s and Children’s Health. New York: The Partnership for Maternal, Newborn and Child Health; 2010.
2 UNICEF, WHO, World Bank and UN Population Division. The Inter-Agency Group for Child Mortality Estimation. Levels and trends in child mortality: 2012 report. New York: UNICEF; 2012.
3 United Nations. Millennium Development Goals Report 2012. New York: United Nations; 2012.
4 You D, Jones G, Hill K, Wardlaw T, Chopra M. Levels and trends in child mortality, 1990-2009. The Lancet. 2010;376(9745):931-33.
5 World Health Organization. Trends in maternal mortality, 1990 to 2010. Geneva: World Health Organization; 2012.
6 Blaauw D, Penn-Kekana M. Maternal health. In: Fonn S, Padarath A, editors. South African Health Review 2010. Durban: Health Systems Trust; 2010.
7 McKerrow N, Mulaudzi M. Child mortality in South Africa: Using existing data. In: Fonn S, Padarath A, editors. South African Health Review 2010. Durban: Health Systems Trust; 2010.
8 National Department of Health. Health Data Advisory and Coordination Committee report. Pretoria: National Department of Health; 2011.
9 Actuarial Society of South Africa. ASSA2008 AIDS and Demographic Model [Internet]. 2011. URL: www.actuarialsociety.org.za
10 Bradshaw D, Dorrington RE, Laubscher R. Rapid mortality surveillance report 2011. Cape Town: South African Medical Research Council; 2012.
11 Graham W, editor. Saving mothers 2005-2007: Fourth report on confidential enquiries into maternal deaths in South Africa Pretoria: National Department of Health; 2008.
12 Pattinson RC, editor. Saving mothers 2008-2010: Fifth report on the confidential enquiries into maternal deaths in South Africa. Pretoria: National Department of Health; 2012.
13 Pattinson RC, editor. Ninth interim report on confidential enquiries into maternal deaths in South Africa. Pretoria: National Department of Health; 2011.
14 Nannan N, Dorrington RE, Laubscher R, Zinyakatira N, Prinsloo M, Darikwa TB, et al. Under-5 mortality statistics in South Africa: Shedding some light on the trends and causes 1997-2007. Cape Town: South African Medical Research Council; 2012.
15 Hall K, Woolard I. Children and inequality: An introduction and overview. In: Hall K, Woolard I, Lake L, Smith C, editors. South African Child Gauge 2012. Cape Town: Children’s Institute, University of Cape Town; 2012.
16 Sanders D, Reynolds L, Lake L. Addressing inequities in child health: Opportunities and challenges. In: Hall K, Woolard I, Lake L, Smith C, editors. South African Child Gauge 2012. Cape Town: Children’s Institute, University of Cape Town; 2012.
17 World Health Organization. World Health Statistics 2007. Geneva: World Health Organization; 2007.
18 Stephen CR, Bamford LJ, Patrick ME, Wittenberg DF, editors. Saving children 2009: Five years of data: A sixth survey of child healthcare in South Africa. Pretoria: Tshepesa Press, Medical Research Council, Centers for Disease Control and Prevention; 2011.
19 Pattinson RC, editor. Saving babies 2008-2009: Seventh report on perinatal care in South Africa. Pretoria: Tshepesa Press; 2011.
20 March of Dimes, Partnership for Maternal, Newborn and Child Health, World Health Organization. Born too soon: Report on Preterm Birth. Geneva: World Health Organization; 2012.
21 Chang HH, Larson J, Blencowe H, Spong CY, Howson CP, Cairns-Smith S, et al. Preventing preterm births: Analysis of trends and potential reductions with interventions in 39 countries with very high Human Development Index. The Lancet 2013;381(9862):223–34.
22 National Perinatal Mortality and Morbidity Committee. Triennial report (2008-2010). Pretoria: National Department of Health; 2012.
23 Jones G, Steketee RW, Black RE, Bhutta ZA, Morris SS and the Bellagio Child Survival Group. How many child deaths can we prevent this year? The Lancet. 2003;362(9377):65-71.
24 Adam T, Lim SS, Mehta S, Bhutta ZA, Fogstad H, Mathai M, et al. Cost effectiveness analysis of strategies for maternal and neonatal health in developing countries. British Medical Journal. 2005;331(7525):1107-10.
25 The Partnership for Maternal, Newborn & Child Health. A global review of the key interventions related to Reproductive, Maternal, Newborn and Child Health (RMNCH). Geneva: The Partnership for Maternal, Newborn and Child Health; 2011.
26 Kerber KJ, de Graft-Johnson JE, Bhutta ZA, Okong P, Starrs A, Lawn JE. Continuum of care for maternal, newborn, and child health: From slogan to service delivery. The Lancet. 2007;370(9595):1358-69.
27 Gwatkin DR, Bhuiya A, Victora CG. Making health systems more equitable. The Lancet. 2004;364(9441):1273-80.
28 Carrera C, Azrack A, Begkoyian G, Pfaffmann J, Ribaira E, O’Connell T, et al. Equity in child survival, health, and nutrition series: The comparative cost-effectiveness of an equity-focused approach to child survival, health, and nutrition: A modelling approach. The Lancet. 2012;380(9850):1341-51.
29 Victora CG, Barros AJD, Axelson H, Bhutta ZA, Chopra M, França GVA, et al. How changes in coverage affect equity in maternal and child health interventions in 35 countdown to 2015 countries: An analysis of national surveys. The Lancet. 2012;380(9848):1149-56.
30 World Health Organization. Keeping promises, measuring results: Commission on Information and Accountability for Women’s and Children’s Health. Geneva: World Health Organization; 2011.
31 World Health Organization. Monitoring maternal, newborn and child health: understanding key progress indicators. Geneva: World Health Organization; 2011.
32 UNICEF. Committing to child survival: A promise renewed. New York: UNICEF; 2012.
33 Joint United Nations Programme on HIV/AIDS (UNAIDS). Countdown to zero: global plan towards the elimination of new HIV infections among children by 2015 and keeping their mothers alive 2011-2015. Geneva: UNAIDS; 2011.
34 National Department of Health. Negotiated Service Delivery Agreement. A long and healthy life for all South Africans. Pretoria: National Department of Health; 2010.
66 SAHR 2012/13
35 Committee on Mortality and Morbidity in Children. First report of the Committee on Morbidity and Mortality in Children under 5 Years (CoMMiC). Pretoria: National Department of Health; 2011.
36 National Department of Health. National Strategic Plan for Maternal, Newborn, Child and Women’s Health and Nutrition 2012-2016. Pretoria: National Department of Health; 2012.
37 National Department of Health. South Africa’s National Strategic Plan for a Campaign on Accelerated Reduction of Maternal and Child Mortality in Africa (CARMMA). Pretoria: National Department of Health; 2012.
38 World Health Organization. Guidelines on HIV and infant feeding 2010: Principles and recommendations for infant feeding in the context of HIV and a summary of evidence. Geneva: World Health Organization; 2010.
39 National Department of Health. National Strategic Plan on HIV, STIs and TB: 2012-2016. Pretoria: National Department of Health; 2011.
40 Grantham-McGregor S, Cheung YB, Cueto S, Glewwe P, Richter L, Strupp B. Developmental potential in the first 5 years for children in developing countries. The Lancet. 2006;369(9555):60-70.
41 Richter L, Biersteker L, Burns J, Desmond C, Fezan, Harrison D et al. Diagnostic Review of Early Childhood Development. Pretoria: National Department of Performance, Monitoring and Evaluation and Inter-Departmental Steering Committee on Early Childhood Development; 2012.
42 Buffalo City Declaration, South African Early Childhood Development Conference [Internet]. [cited 24 September 2012].URL: http://www.dsd.gov.za/index2.php?option=com_docman&task=doc_view&gid=282&Itemid=3
43 National Department of Health. Provincial guidelines for the implementation of the three streams of PHC re-engineering. Unpublished.
44 National Department of Health. District clinical specialist teams in South Africa: Ministerial task team report. Pretoria: National Department of Health; 2012.
45 National Department of Health and National Department of Basic Education. Integrated school health policy. Pretoria: Department of Health; 2012.
46 National Department of Health. School health policy and implementation guidelines. Pretoria: National Department of Health; 2003.
47 World Health Organization. WHO antenatal care randomized trial: Manual for implementation of the new model. Geneva: World Health Organization; 2002.
48 National Department of Health. District Health Information Database (DHIS); Extracted 01 December 2012.
49 Frank K, Lombaard H, Pattinson RC for the ESMOE Group. Does completion of the Essential Steps in Managing Obstetric Emergencies (ESMOE) training package result in improved knowledge and skills in managing obstetric emergencies? S Afr J Obstet Gynaecol. 2009;15(3):93-99.
50 Chopra M, Daviaud E, Pattinson R, Fonn S, Lawn JE. Health in South Africa 2: Saving the lives of South Africa’s mothers, babies, and children: Can the health system deliver? The Lancet. 2009;374(9692):835-46.
51 National Department of Health. Guidelines for maternity care in South Africa. Pretoria: National Department of Health; 2007.
52 Pattinson RC, Bergh A-M, Malan AF, Prinsloo R. Does Kangaroo Mother Care save lives? J Trop Paediatr. 2006;52(6):438-41.
53 Goga A, Dinh TH, Jackson D, Dlamini N, Mosala T, Lombard T, et al. Impact of the National Prevention of Mother to Child Transmission of HIV (PMTCT) Program on Perinatal Mother-to-Child Transmission of HIV (PMTCT) measured at 6 weeks postpartum, South Africa (SA): Results of the first year of implementation of the 2010 PMTCT guidelines recommended by the World Health Organization (WHO). Presented at the International AIDS Conference; 22-27 July 2012; Washington, DC.
54 Goga AE, Dinh TH, Jackson DJ. Evaluation of the effectiveness of the National Prevention of Mother-to-Child Transmission (PMTCT) Programme measured at six weeks postpartum in South Africa, 2010. South African Medical Research Council, National Department of Health and PEPFAR/US Centers for Disease Control and Prevention; 2012.
55 Barron P, Pillay Y, Doherty T, Sherman G, Jackson D, Bhardwaj S et al. Eliminating mother-to-child HIV transmission in South Africa. Bull World Health Organ 2013;91:70–4.
56 Jones G, Steketee RW, Black RE, Bhutta ZA, Morris SS. How many child deaths can we prevent this year? The Lancet. 2003;362(9377):65-71.
57 National Department of Health, Medical Research Council, OrcMacro. South Africa Demographic and Health Survey 2003. Pretoria: Department of Health; 2007.
58 Shisana O, Rehle T, Simbayi LC, Zuma K, Jooste S, Pillay-van Wyk V, et al. The South African National HIV Prevalence, Incidence, Behaviour and Communication Survey, 2008: A turning tide among teenagers? Cape Town: Human Sciences Research Council Press; 2009.
59 Tylleskär T, Jackson D, Meda N, Engebretsen IM, Chopra M, Diallo AH, et al. Exclusive breastfeeding promotion by peer counsellors in sub-Saharan Africa (PROMISE-EBF): A cluster-randomised trial. The Lancet. 2011;378(9789):420-7.
60 National Department of Health. National Food Consumption Survey-Fortification Baseline (NFCS-FB): South Africa, 2005. Unpublished.
61 Bradshaw D, Nannan N, Groenewald P, Joubert J, Laubscher R, Nijilana B, et al. Provincial mortality in South Africa, 2000 – priority-setting for now and a benchmark for the future. S Afr Med J. 2005;95(7):496-503.
62 Giese S, editor. Children’s HIV and AIDS scorecard 2011: Monitoring South Africa’s response to children and HIV and AIDS. Durban: Children’s Rights Centre; 2011.
63 Lachman PI, Zwarenstein MF. Child health and health care utilization. A community based survey in Mitchell’s Plain, CP. S Afr Med J. 1990;77(9):467-70.

Authors:
67SAHR 2012/13
555555555555
Shahieda Adamsi
Rodney Ehrlichi
Nabeel Ismailii
Zara Quaili
Mohamed F Jeebhayi
i Centre for Occupational and Environmental Health Research, School of Public Health and Family Medicine, University of Cape Town
ii Western Cape Department of Health
Occupational Health Challenges Facing the Department of Health: Protecting employees against tuberculosis and caring for former mineworkers with occupational health disease
Healthcare workers, who are increasing in number in
the South African workforce, are at risk of tuberculosis
from their occupational activity and from exposure
as members of communities with a high HIV and
tuberculosis disease burden.
In addition, the Department of Health has a statutory obligation to provide for
free medical examinations and timeous compensation
for former mineworkers, a large population with
a high burden of silicosis, tuberculosis and HIV
infection.
This chapter reviews two occupational populations for which the South African Department of Health has legal responsibilities, although in different ways. These are healthcare workers at risk of tuberculosis, to which the Department
has responsibilities as an employer, and former mineworkers with occupational lung disease, to which the Department has legal responsibilities for examination and compensation under the Occupational Diseases in Mines and Works Act (ODMWA). Both of these mandates have implications for the healthcare system in South Africa.
Healthcare workers, who are increasing in number in the South African workforce, are at risk of tuberculosis from their occupational activity and from exposure as members of communities with a high HIV and tuberculosis disease burden. Local epidemiologic studies are limited, but suggest rising occupational risk, which includes the risk of contracting multidrug-resistant tuberculosis. One such study is a provincial audit of administrative compliance with occupational health and safety requirements relevant to the protection of staff from tuberculosis in the Western Cape. This audit has revealed substantial gaps.
Besides infection control and prevention measures, protection of healthcare workers requires an integrated management system that incorporates commitment from top management; comprehensive, locally appropriate and practicable policies; appropriate training; continued surveillance; and the provision of comprehensive occupational health services to healthcare workers.
Among the growing population of former mineworkers, the Department of Health has major shortcomings in fulfilling its legal mandate of providing statutory medical examinations (in addition to the treatment of tuberculosis and HIV-related disease in all public healthcare facilities). The Department is also failing to adjudicate and arrange for the payment of compensation to workers with occupational lung disease. Legal, financial and managerial reform of the ODMWA system is required.

68 SAHR 2012/13
Source: Western Cape Department of Health, 2011.4
Figure 1: Employment distribution pattern of the healthcare workforce in Western Cape Department of Health, 2010/11 (n=28 500)
6 333 Enrolled nursesand auxiliaries,
22%
488 Managers,2% 9 829 Administrative,
general support and technical staff,
34%
5 479 Professional nurses,
19%
2 545 Doctors and dentists,
9% 362 Pharmacists,
1%
2 068 Allied healthand technicians,
7%
1 619 Emergency medical staff,
6%
Introduction
This chapter focuses on two growing problems facing the South African health system and specifically the Department of Health. The first problem is tuberculosis (TB), which includes multidrug-resistant tuberculosis (MDR-TB), among healthcare workers. The second is the failure of the statutory examination and compensation system for occupational lung disease among former mineworkers.
In response to the first of these problems, the state’s responsibility is primarily that of employer and its responsibilities are those conferred by the doctrine of duty of care, national policy and occupational health and safety legislation. In the second, the state’s responsibility is a historical one defined by statute. The occupational contexts are different. In the case of healthcare workers the context is caring for infected patients; in the case of mineworkers the context is exposure to hazardous dust. However, the HIV and TB epidemic is common to both.
Both challenges provide case studies of the functioning of the occupational health and safety dispensation in South Africa. Both also have implications for the functioning of the public healthcare system. It is contended that properly addressing the occupational health needs of healthcare workers; i.e., “caring for the carer”, will positively affect the quality of care that public sector staff provide to clients. In the case of former mineworkers, while the burden of lung disease has been ‘externalised’ from the industry to the public healthcare system, it is a matter of social justice that the historical contract between mineworkers and the state be upheld. This does not preclude continued efforts aimed at the prevention of disease being firmly rooted in changed industry practices.
Employment in health care and mining
The characteristics of the South African working population have changed in the past eight years. The community, social and personal services sector, the second-largest sector, constitutes an increasing proportion of the total labour force. In contrast the mining population as a percentage of the total labour force has remained static over this period. (See Table 1) The healthcare workforce comprises a large proportion of the community, social and personal services sector, with the state being the major employer at the national, provincial and local levels. In contrast, the private sector is the major employer of workers in the mining industry.
Healthcare workers
Since 2004, the number of health professionals in the public sector has grown, with a considerable increase of 153 383 to 210 511 between 2004 and 2010 reported. This increase has been mainly in the nursing category.3 The distribution of the healthcare workforce in a province, with the Western Cape as an example, is outlined in Figure 1. More than 60% of the workforce is engaged in providing healthcare services to patients, which exposes them directly to occupational risks associated with patient care. Nursing staff comprise the biggest such category (41%). The introduction of National Health Insurance (NHI) will most likely result in a further expansion of this workforce.3
Mineworkers
Although the proportion of mineworkers as a part of the total non-agricultural labour force has remained more or less constant, the number of employees in the mining sector also increased between 2002 and 2012. (See Table 1) In 2011, platinum group metals (38%), gold (28%) and coal (15%) were the dominant employment sectors by commodity, as outlined in Figure 2 and Table 2. A striking feature, however, is the decline of gold mining employment relative to platinum, iron ore and coal. This has implications for the risk of occupational lung disease, as the platinum, iron ore and coal sectors carry lower silicosis risks than gold mining, which has historically been responsible for the major occupational lung disease burden in the mining industry.
Table 1: Trends in the distribution of employment in the community, social and personal services and mining and quarrying sectors in SA, 2004-2012
Total no. of employees x 103
(% of total of all formal non-agricultural industries)Dec 2004 June 2006 June 2009 June 2012
Industry No.(x 103) (%)
No.(x 103) (%)
No.(x 103) (%)
No.(x 103) (%)
Community, social and personal services 1 782 25.0 2 001 27.4 2 180 26.4 2 358 28.0
Mining and quarrying 456 6.4 459 6.3 492 6.0 533 6.3
Source: Statistics South Africa, 2012; 2006.1,2

Occupational Health Challenges 5
SAHR 2012/13 69
Figure 2: Mining employment distribution by commodity, 2011
Source: Chamber of Mines, 2012.5
7 086 Aggregate and sand
2%
28 938 Other mines and quarries,
6%145 561 Gold,
28%
12 030 Diamonds,2%
7 356 Manganese,2%
16 389 Chrome,3%
22 342 Iron ore,4%
194 929 Platinum group metals,
38%
78 580 Coal,15%
Table 2: Mining employment trends (numbers) by commodity, 2002-2011
Commodity 2002 2006 2011
Gold 199 378 159 782 145 561
Platinum group metals 111 419 168 530 194 929
Iron ore 5 389 8 859 22 342
Copper 5 107 3 993 N/A
Chrome 5 404 7 899 16 389
Manganese 2 581 3 332 7 356
Diamonds 16 346 19 686 12 030
Coal 47 469 57 778 78 580
Aggregate and sand 3 220 5 133 7 086
Other mines and quarries 19 675 21 345 28 938
Total 415 988 456 337 513 211
Source: Chamber of Mines, 2012.5
Tuberculosis in healthcare workers
SA is currently ranked third among the high TB burden countries, with an estimated 0.40 to 0.59 million incident cases in 2010, and is outranked only by India and China.6 While all of the high burden countries have demonstrated declines or stabilisation in their incident rates, SA has shown an increasing trend in new cases, with the latest TB incidence estimated to be 1 170 per 100 000 of the population. The importance of HIV infection as a risk factor is underscored by the latest estimate of a 60% HIV prevalence among incident TB cases in SA.
Within this context, this review covers the epidemiology of TB risk in healthcare workers in SA and the regulatory and management frameworks applicable for ensuring their occupational health and well-being. Findings from an audit conducted to evaluate health and safety policy and practice in Western Cape Department of Health facilities are presented to illustrate the gap between employer policy and practice, and to highlight areas that require intervention within provincial health departments.
Healthcare workers globally find themselves at the coal face of the dual epidemic of TB and HIV. It is well recognised that they have an increased risk of contracting TB on account of their occupational exposure to tubercle bacilli.7-9 Furthermore, this risk has been demonstrated to be greater for healthcare workers in low- and middle-income countries, which have a higher TB burden than high-income countries.
Healthcare workers in high TB-incidence countries thus experience increased exposure to TB in their dual role as carers to those who have contracted TB and as members of communities where TB is highly prevalent. While they are considered a high-risk occupational grouping for contracting TB, limited research exists that quantifies their risk in this regard. There is, however, a growing recognition globally that the increasing impact of TB and HIV on healthcare workers in such settings could have a negative impact on public health programmes and the capacity of health systems to respond to the challenges of TB and HIV.
Tuberculosis – burden of disease among healthcare workers
As discussed above, the occupational risks of TB and HIV among South African healthcare workers are greater than those in developed countries.10
A 2003 review of 51 studies summarised the burden of TB in healthcare workers in low- and middle-income countries.9 The prevalence of latent tuberculosis infection (LTBI) among healthcare workers was found to be 54% (range 33% to 79%) and was positively associated with increasing age and duration of employment in a healthcare facility. LTBI incidence was measured in six studies, which showed an annual risk of infection that ranged from 3.9% to 14.3%. The attributable risk fraction from occupational exposure ranged from 2.6% to 11.3%.
TB disease incidence was found to be higher than in the general population. The estimated incidence due to nosocomial exposure was between 25 and 5 361/100 000 per year. A positive association was made between low healthcare worker : TB patient ratio and a higher incidence of TB disease.
While healthcare workers are recognised as a vulnerable and high-risk population for contracting TB, only a few small-scale studies have been conducted in SA to quantify this problem or evaluate factors associated with this risk. (See Table 3)
An early study by Balt et al., who reviewed staff health records between 1986 and 1997 from four dedicated TB centres in Mpumulanga (MP), concluded that healthcare workers were not at increased risk of TB when compared to the general population.11 Wilkinson et al., in a 1998 study, similarly demonstrated a lower incidence of TB among staff at a South African district hospital when compared to the general population during the same period. However, they also demonstrated an increasing incidence of TB among healthcare workers, which they attributed to the rising HIV epidemic during this period.12
More recent studies have shown an increase in TB risk and disease burden. In a 2006 retrospective cohort study, which involved staff from eight regional hospitals in KwaZulu-Natal (KZN), Naidoo et al. demonstrated a consistently higher incidence of TB in healthcare workers than in the general population, with a median incidence of 1 133/100 000.13 Increased risk was associated with the younger

70 SAHR 2012/13
age group (25 to 29) and paramedical occupational category. Extra-pulmonary TB, which is generally more difficult to diagnose than pulmonary disease, was diagnosed in 23% of cases. The study further demonstrated poor treatment outcomes, with only 41% of TB cases completing treatment.
Table 3: Epidemiological studies of TB in South African healthcare workers
TB prevalence/incidence Setting / N
Incidence 275/100 000 Staff at four TB centres in MP 11
Incidence 690/100 000 Staff at a hospital in KZN (n=723) 12
Incidence 1 133/100 000 Healthcare workers at hospitals in KZN (n= 49 392)
13
Incidence 4 477/100 000 Desmond Tutu healthcare workers research staff in WC (n=182)
14
Prevalence 5% TB/HIV care association community health workers in WC (n=215)
15
Studies of staff located in facilities or projects that deal with TB and HIV-infected patients are instructive, although their findings are not generalisable to the healthcare workforce as a whole. A 2010 screening programme of healthcare workers employed as adherence counsellors and support staff in TB programmes located in the Western Cape (WC) demonstrated a TB and HIV prevalence of 5% and 20% respectively.15 Another 2010 study showed a 2.3-fold increased TB incidence in a small cohort of research workers when compared to TB incidence in the communities where the researchers worked.14
The advent of extremely drug-resistant tuberculosis (XDR-TB) has also affected healthcare workers, with studies demonstrating increased risk and relatively poor treatment outcomes.16,17 Healthcare workers were shown to be at greatly increased risk of being hospitalised for MDR-TB (incidence rate ratio, 5.46 [95% CI, 4.75 to 6.28]) and XDR-TB (incidence rate ratio, 6.69 [CI, 4.38 to 10.20]) compared to non-healthcare workers.
The studies have also shown that HIV infection in healthcare workers, which greatly enhances susceptibility to contracting TB and progressing from latent to active TB, approximates that of the general population, and ranges from 11.5% to 20%.15,18,19 (See Table 4)
Table 4: Epidemiological studies of HIV prevalence in South African healthcare workers
HIV Prevalence (%) Population 15.7% 595 healthcare workers from KZN, MP, *FS, **NW 18
11.5% Healthcare workers from 2 hospitals in ***GP 19
20.0% Adherence supporters TB/HIV Care Association in WC
15
*FS – Free State Province; **NW – North West Province; ***GP – Gauteng Province
In the absence of large-scale surveillance and screening programmes among South African healthcare workers, it is difficult to arrive at an accurate estimate of TB and HIV prevalence in this population. What is evident is the trend towards increasing incidence and prevalence over time and the markedly increased risk of MDR and XDR-TB.
Policy, statutory provisions and local institutional framework for managing tuberculosis among healthcare workers
A series of initiatives has taken place over the past few years to address the increasing risk of TB in healthcare workers globally and at a national level. (See Table 5) At global level, a policy guideline for promoting access to care for healthcare workers, with a specific focus on TB and HIV, was published in 2010.20 The Joint WHO-ILO-UNAIDS Policy Guidelines on Improving Health Workers’ Access to HIV and TB Prevention, Treatment, Care and Support Services outlines various recommendations with regard to policy, access to care, workplace practices, adequate budget and the need for monitoring and evaluation. The guideline promotes the strengthening of occupational health policy to better protect healthcare workers and advocates for regular screening, improved infection control, and access to prophylactic and effective treatment for those at risk of or infected with TB and HIV.
At national level in SA numerous policies and occupational health and safety legislation exist. These include regulations that address infective occupational health risks in healthcare workers. Despite legislative and policy provisions the current institutional framework for dealing with this problem is fragmented. What is lacking is an integrated approach that identifies evidence-informed strategies for prevention, surveillance, access to care, treatment and compensation for TB in healthcare workers.
Workers’ compensation for pulmonary TB in healthcare workers is provided for under the Compensation for Occupational Injuries and Diseases Act (COIDA), (Act 130 of 1993). The disease is listed in Schedule 3 as an occupational disease and the specific criteria for acceptance of a claim are outlined in the Circular Instruction published by the Department of Labour.21 Recently, Schedule 3 has been amended so that TB is now specifically listed as an occupational disease rather than included under a blanket reference to “infectious or parasitic diseases contracted in an occupation where there is a particular risk of contamination caused by biological agents”.

Occupational Health Challenges 5
SAHR 2012/13 71
Table 5: Policy and legislative framework for TB and HIV in healthcare workers in SA
Policy Scope Agency
GlobalWHO TREAT guideline (2010) Policy guidelines on improving health worker access to prevention, treatment and care services for
HIV and TBWHO
WHO policy on TB infection control on healthcare facilities, congregate settings and households (2009)
Proposes a set of measures to promote TB infection control at national and facility levels, which include on-site surveillance of TB disease among healthcare workers
WHO
South African Labour Statutes
Occupational Health and Safety Act (Act 85 of 1993)
Provides for a healthy and safe working environment *DoL
Regulations for Hazardous Biological Agents (HBA) (2001)
•Mandates regular risk assessment every 2 years and specifies that records need to be kept for 40 years
•Requires the provision of information and training to employees on potential risks of HBA and risk reduction
•Provides for medical surveillance based on risk assessment or presence of an occupational disease directly related to exposure
DoL
Labour Relations Act (Act 66 of 1995)
•Prevents discrimination and unfair dismissal of workers afflicted with occupational disease or injury
•Allows for workplace accommodation
DoL
Code of Good Practice on key aspects of HIV/AIDS and employment (2000)
Provides for:•Establishment of a workplace HIV policy and programme•Elimination of discrimination
DoL
Compensation for Occupational Injuries and Diseases Act (130 of 1993)
Recognises and mandates the reporting of occupational diseases to the Department of Labour DoL
Circular Instruction Regarding Compensation For Pulmonary Tuberculosis In Health Care Workers (2003)
•Mandates the reporting of occupational pulmonary TB and advises on reporting TB and compensation for disability caused in healthcare workers
DoL
South African DoH PolicyNational Core Standards for Health Establishments in SA (2011)
•Develop a common definition of quality care, a benchmark and certification for compliance for all health establishments in SA
•Staff are protected from workplace hazards through effective occupational health and safety systems (responsibilities under Occupational Health and Safety Act; active health and safety committees; medical surveillance based on risk assessment in place; measures in place to minimise occupational injuries and diseases)
**DoH
SA National TB Management Guidelines (2009)
All categories of healthcare personnel have an increased risk of TB when compared to the general population. In addition to reducing their exposure, specific measures that target healthcare personnel are required:• Informing healthcare personnel of the signs and symptoms of TB and encouraging early
recognition of symptoms and presentation for sputum tests•Ensuring that all healthcare personnel with signs and symptoms are evaluated as “high-risk TB
suspects” and have 2 sputum specimens sent for evaluation (a spot specimen for smear and an early morning specimen for smear and culture and drug susceptibility testing)
•Providing voluntary counselling and testing (VCT) and encouraging healthcare personnel to know their HIV status
•Advocating/providing precautionary measures for HIV-positive staff, such as TB preventive therapy and antiretroviral therapy
•Appropriately placing HIV-positive staff in low TB risk areas of the facility
DoH
Guidelines for TB preventive therapy among HIV-infected individuals in SA (2010)
All HIV-positive individuals should be provided with isoniazid preventive therapy (IPT) once active TB has been excluded (HIV-positive healthcare workers recognised as a high-risk population and eligible for IPT)
DoH
Draft National Infection Control Plan for TB, MDR TB and XDR TB (2007)
• Increasing awareness of TB in healthcare workers• Increasing access to VCT•Providing personal protective equipment •Reducing spread of infection with MTB in healthcare settings
DoH
*DoL – Department of Labour; **DoH – Department of Health

72 SAHR 2012/13
2005 2006 2007 2008 2009 2010Year
Num
ber
TB MDR
12
10
8
6
4
2
0
Western Cape provincial figures indicate that an increasing number of healthcare workers have received workers’ compensation for TB. (See Figure 3) However, there is evidence of underreporting when these figures are compared to findings of epidemiological studies in this province. Despite underreporting, Pulmonary TB is the third most frequently reported occupational disease in SA.22
Figure 3: Trends in the number of TB and MDR-TB cases compensated by the Western Cape Department of Health, 2005-2010
In summary, while several policies address various aspects of TB risk to healthcare workers, currently no uniform national strategy is available that actively supports the management of TB risk in healthcare workers. Specifically staff in healthcare institutions are not universally provided with the tools and resources to implement policy recommendations. Little active enforcement takes place of regulations such as those mandating risk assessment of healthcare institutions and work environments or training of healthcare workers. This weak enforcement capability contributes to ineffective risk management when labour statutes are contravened. These elements are examined in more detail in the next section in the context of a single province.
The problem is compounded by a lack of data and poor reporting systems, which are unable to provide an accurate picture of the extent of the problem. Furthermore, while strategies have been adopted to improve the performance of the national TB programme, such as focusing on intensified case finding, isoniazid prophylaxis and improved infection control, these interventions have been aimed at TB patients. Little or no focus has been put on healthcare workers tasked with the delivery of such care to patients.25,26
Management of occupational health and safety in the provincial health sector – example of the Western Cape
A number of policies and guidelines address health and safety measures to manage the increased risk of occupational TB among healthcare workers. However, information is lacking on programmes and practical measures that have been implemented to better manage this risk.
Data from a 2010 audit conducted in districts and substructures, under the jurisdiction of the Western Cape Department of Health, from 106 healthcare facilities, clearly illustrate the gap between policy and practice in occupational health and safety management.23 The data also provide a benchmark against which other provinces can compare their performance.
The audit was aimed at ascertaining the level of occupational health and safety compliance as a first step towards assessing the effectiveness of the Western Cape Department of Health in addressing the health risks of its workforce. (See Figure 4.) The survey found that while formal (79%) and functional (70%) health and safety committee structures were in place, and 83% reported having dedicated officials to coordinate occupational health and safety in the districts and facilities, there was no consistency between the operations of committees in metropolitan and rural districts. In both contexts, the general trend is for smaller facilities to form part of a committee at a larger institution or at sub-district level. This appears to be more practical and allows for greater support and capacity to deal with issues. However, it creates a problem of a “one size fits all” approach to occupational health and safety and setting priorities, based on the occupational health and safety needs of larger institutions. These needs may be very different from those of smaller clinics and facilities.
Furthermore, while officials were adequately nominated, only 55% of facilities reported that members were formally appointed under section 16.2 of the Occupational Health and Safety Act and only 61% reported that their roles and responsibilities were clearly defined. These problems underscore the need to develop capacity
Source: Western Cape Department of Health. 2011.23
Much of the focus on addressing TB in healthcare workers has been through general infection prevention and control approaches in healthcare facilities that are determined by the National Infection Prevention and Control Policy and Strategy of 2007.24 These approaches generally include surveillance, environmental management, waste management, outbreak investigation, cleaning, disinfection and sterilisation, employee health, and quality management in infection control.
At district and facility levels, these programmes are meant to be overseen by multidisciplinary committees established specifically for this purpose. Committees are made up of, among others, microbiologists, clinicians, and management representatives. They are also made up of healthcare workers from areas in the facility such as pharmacy, sterilising, and housekeeping and training services. The committee is also meant to ensure the development and updating of infection prevention and control policies, guidelines and protocols within the facility. These committees have historically operated separately from the occupational health and safety committees required by the Occupational Health and Safety Act. (See section below.)
The 2011 promulgation of the National Core Standards for Health Establishments in South Africa is an attempt to address failings in the public healthcare sector by setting clear norms that health facilities should meet to be considered institutions that promote quality health care and are ready for NHI rollout. The Standards specifically address the need for occupational health and safety systems to limit occupational injuries and diseases among healthcare staff. At provincial level, health departments have adopted various approaches within these broad policy frameworks and legislative requirements, some more extensive than others.

Occupational Health Challenges 5
SAHR 2012/13 73
Total percentage
Dedicated officer responsible for
coordinating OHS
0 10 20 30 40 50 60 70 80 90
Established OHS committee
Functional OHS committee
Regular committee meetings
Committee members appointed
Roles and responsibilitiesclearly defined
83%
79%
70%
74%
55%
61%
Total percentage
Risk assessment
0 10 20 30 40 50 60 70 80
Biological monitoring
Medical surveillance
Annual screening
Infection Control Plan
46%
25%
39%
63%
68%
in occupational health and safety skills within the Western Cape Department of Health.
These committees have been tasked with ensuring that risk assessments and specific risk management programmes are developed for priority risks through the implementation of specific policies and standard operational procedures. The committees and programmes are also expected to ensure the early detection of occupational infections and other diseases through monitoring and surveillance.
Figure 4: Occupational health and safety (OHS) committees in Western Cape healthcare facilities (n=106)
senior management. This attitude fosters a reactive approach to occupational health and safety issues that only attracts attention and resources when occupational health and safety failures become too difficult or costly for the institution to conceal or ignore.
A limitation of the above audit is that it is based on self-report, which is likely to err in the direction of overstating performance. Actual practice is likely to fall short of the figures given below.
Figure 5: Occupational health and safety (OHS) programmes in place in Western Cape healthcare facilities (n=106)
Source: Western Cape Department of Health, 2011.23
In practice, however, the Western Cape audit found that only 46% of facilities had a risk assessment programme, despite the legal requirement that such an assessment be carried out every two years.27 (See Figure 5.) A number of facilities indicated that occupational health and safety staff and representatives lacked the requisite training, skills, and in-house tools and resources to conduct risk assessments. In certain facilities an outside service provider was sourced at considerable cost. In some facilities, the Facilities Risk Assessment Tool for Tuberculosis (FRATT) was used for conducting risk assessments and implementing relevant measures to control the spread of TB.
The audit also found that 25% of facilities had a biological monitoring programme (which focused on exposure to chemicals such as ethylene oxide and radiation exposure); 39% had medical surveillance programmes (aimed at detecting TB and Hepatitis B); and 63% had annual screening programmes. (See Figure 5.) Wellness screenings, which focused on non-communicable diseases and HIV, AIDS and TB, were conducted in certain health establishments.
Despite the obvious infection risk in these healthcare facilities, only 68% of facilities reported having a mandatory and functional Infection Control Plan in place. These plans focused on outbreak investigation and testing, health surveillance, vaccination, employee placement, post-exposure prophylaxis and control measures.
In a number of facilities, occupational health and safety and infection control measures were viewed as a supplementary activity, with a low level of commitment and accountability among
Source: Western Cape Department of Health, 2011.23
Programme integration and governance
The above review suggests that if provincial departments are to achieve progress in controlling TB in their staff, coordination and integration of the various policies and activities at all levels are required.
Recent initiatives in the Western Cape have attempted to address this fragmentation of occupational health and safety, infection control activities, employee wellness and quality assurance through the establishment of a single body, the Provincial Quality Improvement Committee (PQIC). This committee falls under the Directorate of Health Impact Assessment. The committee aims to establish a basis for accountability for various actions using the legal requirements of the Occupational Health and Safety Act and the 2011 National Core Standards for Health Establishments in SA.
The objectives of such moves are to ensure uniform and structured health and safety programmes as well as monitoring and evaluation in health facilities and districts throughout the province. With regard to managing the TB risk in staff, there is a need to operationalise national strategies, such as the National Tuberculosis Strategic Plan for SA (2007-2011), and ensure compliance with international standards and national legislation and policies on occupational health and safety and employee health and wellness.

74 SAHR 2012/13
Compensation for occupational lung disease among former mineworkers
Compensation for occupational lung diseases among former mineworkers has long been a contentious issue in South Africa. This section thus deals with a very different group affected by Department of Health operations – former mineworkers. Despite cyclical variation in its profits and prospects, the South African mining industry remains a pillar of the economy, with a net asset value in 2010 of R18 trillion and employment of 500 000 people.a While violent wage strikes and mine accidents such as rock falls make front page news, the high burden of lung disease in the mining industry has only recently captured the concern of politicians, the public and the public health community.
Silica, silicosis and tuberculosis – burden of disease among gold miners
A raft of studies have confirmed a substantial epidemic of silicosis (nodular fibrosis of the lung due to silica dust) among active and former gold miners. (See Table 6) Among those with histories of relatively long periods of working in dust, prevalences in the order of 20% and more have been recorded in cross-sectional surveys. (See Table 6) These high prevalences are in contrast to the steadily declining prevalence and severity of silicosis in developed countries28-30 and in China.31
The elevated risk of pulmonary TB associated with mining and particularly gold mining has recently focused the attention of the health authorities and public health community on occupational risks in the mining population.41-43
The close association between silica, silicosis and TB has been known for over a century and has been confirmed in modern studies.37,44 This particular hazard arises from biological impairment by silica dust of the lung’s natural defences against TB.45 The added risk factors of close contact in mining accommodation and working spaces and HIV infection associated with a migrant mineworker population46 have created a ‘perfect storm’ for TB among mineworkers. (See Tables 6 and 7) Gold miners now have what is probably the highest annual incidence of TB in the world,
a Personal Communication: Prof. Barry Kistnasamy, August 22, 2012.
Table 6: Prevalence (%) of silicosis and past or current TB among active or former gold miners
Study Yr of study Average length of service of sample (yr) (range)
Silicosis prevalence TB (past or current) prevalence
Active miners32 1984 - Overall: 1.3% Age 51-55 y: 15%
-
Botswana ex-miners33 1994 15.5 (2-42)
27%, 31%* 29% (history) 24% (CXR)
Former Transkei+ ex-miners34,35 1996 12.2 (0.5-34)
22%, 36%* 51% (history) 33% (CXR)
Active miners36,37 2000-2001 21.8 (6-34.5)
19% 19% (history) 17%, 28%*
Basotho ex-miners38,39 1999-2001 25.6** (0.9-40.2)
Baseline: 24% Follow-up: 27%***
26% (history) 6% (active)
Black miners at autopsy40 1975-2007 7.7 (1.1-48) 1975: 3% (autopsy) 2007: 32% (autopsy)
History: self-reported. CXR: chest x-ray. *2 CXR readers **At baseline, ***Among those attending both rounds+ Now part of the Eastern Cape Province.
with high rates of recurrence and inevitably rising rates of MDR-TB. (See Table 7)
Disease now overshadows injuries. In the gold mining sector, while the fatality frequency rate decreased from about 0.44 in 2002 to 0.17 in 2011 (a decline of 61.3%),5 the proportion of active pulmonary TB discovered at statutory autopsy escalated from approximately 0.29 (290/1 000) to 0.37 (370/1 000) between 2002 and 2007, which represents an increase of 21.6%.47
Table 7: TB in gold miners in SA: epidemiological indicators
Measure (study)
Incidence48 Approx. 3 per 100 person-years(range 1-7 per 100 person-years)
Prevalence of latent TB infection49
89%
Recurrence rate of pulmonary TB48
HIV positive: 19 per 100 person-yearsHIV negative: 7.7 per 100 person-years
Proportion of MDR-TB cases50
Previously TB untreated: 2.8%Previously TB treated: 20-25%
HIV prevalence51 22-30%
The consequences of this mining-related epidemic are being felt throughout the subcontinent.52 In particular, the epidemic has spread the burden of healthcare for these diseases from the private mining industry to the public healthcare systems of these countries.
What is the appropriate health system response to this combined epidemic with its roots in the private mining sector? For the purposes of a volume devoted to a review of health policy, we take as our starting point the statutory responsibility of the government and, particularly, the Department of Health.
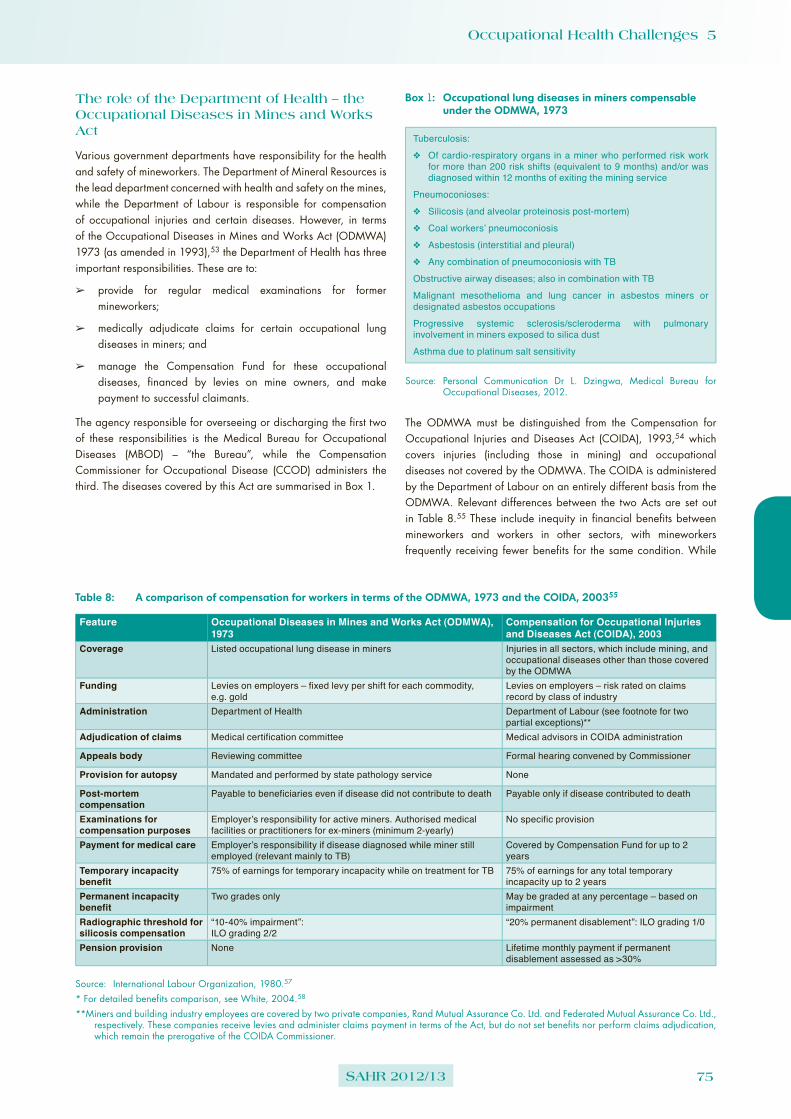
Occupational Health Challenges 5
SAHR 2012/13 75
The role of the Department of Health – the Occupational Diseases in Mines and Works Act
Various government departments have responsibility for the health and safety of mineworkers. The Department of Mineral Resources is the lead department concerned with health and safety on the mines, while the Department of Labour is responsible for compensation of occupational injuries and certain diseases. However, in terms of the Occupational Diseases in Mines and Works Act (ODMWA) 1973 (as amended in 1993),53 the Department of Health has three important responsibilities. These are to:
➢ provide for regular medical examinations for former mineworkers;
➢ medically adjudicate claims for certain occupational lung diseases in miners; and
➢ manage the Compensation Fund for these occupational diseases, financed by levies on mine owners, and make payment to successful claimants.
The agency responsible for overseeing or discharging the first two of these responsibilities is the Medical Bureau for Occupational Diseases (MBOD) – “the Bureau”, while the Compensation Commissioner for Occupational Disease (CCOD) administers the third. The diseases covered by this Act are summarised in Box 1.
Box 1: Occupational lung diseases in miners compensable under the ODMWA, 1973
Tuberculosis:
❖ Of cardio-respiratory organs in a miner who performed risk work for more than 200 risk shifts (equivalent to 9 months) and/or was diagnosed within 12 months of exiting the mining service
Pneumoconioses:
❖ Silicosis (and alveolar proteinosis post-mortem)
❖ Coal workers’ pneumoconiosis
❖ Asbestosis (interstitial and pleural)
❖ Any combination of pneumoconiosis with TB
Obstructive airway diseases; also in combination with TB
Malignant mesothelioma and lung cancer in asbestos miners or designated asbestos occupations
Progressive systemic sclerosis/scleroderma with pulmonary involvement in miners exposed to silica dust
Asthma due to platinum salt sensitivity
Source: Personal Communication Dr L. Dzingwa, Medical Bureau for Occupational Diseases, 2012.
The ODMWA must be distinguished from the Compensation for Occupational Injuries and Diseases Act (COIDA), 1993,54 which covers injuries (including those in mining) and occupational diseases not covered by the ODMWA. The COIDA is administered by the Department of Labour on an entirely different basis from the ODMWA. Relevant differences between the two Acts are set out in Table 8.55 These include inequity in financial benefits between mineworkers and workers in other sectors, with mineworkers frequently receiving fewer benefits for the same condition. While
Table 8: A comparison of compensation for workers in terms of the ODMWA, 1973 and the COIDA, 200355
Feature Occupational Diseases in Mines and Works Act (ODMWA), 1973
Compensation for Occupational Injuries and Diseases Act (COIDA), 2003
Coverage Listed occupational lung disease in miners Injuries in all sectors, which include mining, and occupational diseases other than those covered by the ODMWA
Funding Levies on employers – fixed levy per shift for each commodity, e.g. gold
Levies on employers – risk rated on claims record by class of industry
Administration Department of Health Department of Labour (see footnote for two partial exceptions)**
Adjudication of claims Medical certification committee Medical advisors in COIDA administration
Appeals body Reviewing committee Formal hearing convened by Commissioner
Provision for autopsy Mandated and performed by state pathology service None
Post-mortem compensation
Payable to beneficiaries even if disease did not contribute to death Payable only if disease contributed to death
Examinations for compensation purposes
Employer’s responsibility for active miners. Authorised medical facilities or practitioners for ex-miners (minimum 2-yearly)
No specific provision
Payment for medical care Employer’s responsibility if disease diagnosed while miner still employed (relevant mainly to TB)
Covered by Compensation Fund for up to 2 years
Temporary incapacity benefit
75% of earnings for temporary incapacity while on treatment for TB 75% of earnings for any total temporary incapacity up to 2 years
Permanent incapacity benefit
Two grades only May be graded at any percentage – based on impairment
Radiographic threshold for silicosis compensation
“10-40% impairment”: ILO grading 2/2
“20% permanent disablement”: ILO grading 1/0
Pension provision None Lifetime monthly payment if permanent disablement assessed as >30%
Source: International Labour Organization, 1980.57
* For detailed benefits comparison, see White, 2004.58
**Miners and building industry employees are covered by two private companies, Rand Mutual Assurance Co. Ltd. and Federated Mutual Assurance Co. Ltd., respectively. These companies receive levies and administer claims payment in terms of the Act, but do not set benefits nor perform claims adjudication, which remain the prerogative of the COIDA Commissioner.

76 SAHR 2012/13
this inequity is a pressing political and economic question in the mining sector, the focus of this review is on the Department of Health’s responsibilities under the ODMWA.
As will be argued below, the Department has failed to exercise these responsibilities properly and fully extend the benefits enjoyed mainly by white mineworkers prior to 1994 to the large majority of black mineworkers. This is despite the legislative changes enacted in 1993 to deracialise the legislation.56 This failure may be at least partly because the ODMWA mandate is an anomalous historical legacy, and one that has been marginal to the main policy tasks facing the National Department of Health over the past two decades.
The belated realisation of the mining industry’s contribution to the country’s TB epidemic41 and a number of internal institutional factors have recently focused the Department of Health’s attention on the ODMWA. Poor financial management of the CCOD has resulted in a series of negative audits.59 The ODMWA Compensation Fund itself was described as “technically insolvent” after an external audit in 2003.60 The subsequent increase in levies pursued by the ODMWA Commissioner elicited a failed court challenge by the Chamber of Mines.61 Administration of the CCOD has been repeatedly criticised in parliamentary hearings, which have elicited admissions by the Minister and the Director-General that the CCOD was dysfunctional and that the Department had mismanaged it.59,62 In 2012, the Minister placed the MBOD and CCOD under the line management of a chief director within the National Department of Health.62
As background to what is required of the Department of Health to meet its ODMWA responsibilities, it is necessary to understand the statutory and institutional framework for the examination and treatment of mineworkers for occupational lung disease.
Statutory and institutional framework for managing lung disease among mineworkers
The prevention of occupational lung disease in the mining industry is the responsibility of the Department of Mineral Resources, via the Mine Health and Safety Act (MHSA) (Act 29 of 1996).63 This Act requires the medical examination of mineworkers at entry to employment, at regular intervals while in service and at exit.64 The latest in a series of Acts aimed at maintaining safety, and later health in mining operations, this legislation effectively transferred all responsibility for establishing medical fitness for mine work and ongoing medical surveillance during employment to private mine owners.b
The other piece of legislation relevant to managing lung disease among mineworkers, and the more important for the purposes of this section, is the ODMWA. In terms of this legislation, the Bureau, located in Johannesburg, employs panels of medical practitioners to adjudicate claims for mining-related diseases. The Director of the Bureau is also responsible for arranging “benefit” (compensation) medical examinations for former employees of mines. The CCOD, also located in Johannesburg, performs the administrative tasks of confirming work histories and identities of claimants and making payment according to a schedule defined in the Act.
b Prior to the latest Act, white workers were required to obtain a certificate of fitness (“red ticket”) from the Bureau or one its sub-bureaux. Medical examination of black workers was historically devolved to the mines or their recruiting agencies.
Compensation is paid from funds financed by levies on mining companies, which pay a fixed amount per risk shift on the basis of the commodity mined. Gold mining companies now pay R7.14 per shift (up from 39 cents per shift in 1998),65 platinum R1.79 and coal R1.44.c The assets of the ODMWA Compensation Fund were R1.75 billion in 2010/11, just short of its liabilities of R1.8 billion.a
The Act provides for lump sum compensation awards at two levels only. “First degree” awards are for scheduled non-malignant conditions, mainly pneumoconiosis and chronic obstructive pulmonary disease. “Second degree” awards are typically made for pneumoconiosis plus TB or for cancer. (See Box 1 above.) The maximum amounts payable are currently R47 000 and R105 000 respectively. These are based on a “capped” monthly wage of R3 000, which is below the current average wage in the industry of R4 904.66
In 1989/90, the last year for which racially differentiated statistics were reported, 865 new or upgraded certifications were recorded in living and deceased white and coloured claimants (all mining types). Among black claimants, 4 231 certifications were recorded for compensable TB and 2 046 for other compensable diseases.67 By 2011, the total number of certifications had fallen to 3 875.c
The ODMWA was transferred to the Department of Health from the (then) Department of Mines in 1984.68 Current attempts to reverse a prolonged period of stasis will require vigorous policy action on the part of the Department. This is considered below in two parts. The first concerns the provision of benefit medical examinations and the second the management of the Bureau and CCOD.
Access to benefit medical examinations by former mineworkers
Mineworkers still in employment who are diagnosed with a compensable disease have their medical benefit examinations carried out by mine medical services. However, for former mineworkers, obtaining a benefit medical examination is the responsibility of the individual. Mineworkers who have not reached second degree compensation (see above) are entitled to an examination every two years. This entitlement affects large numbers of people and creates a substantial service mandate for the South African state. This is in addition to the established responsibility for treating TB in former miners in SA through the Tuberculosis Control Programme.
Approximately 12 000 benefit medical examinations were conducted in 2011.c The 2012/13 to 2014/15 Annual Performance Plan of the Department of Health calls for an increase to 22 000 by 2014.69 However, the actual number of living ex-miners and, therefore, the true population entitled to these examinations is not known. The largest affected group includes gold miners because of the role of silica dust from gold mining ore in producing silicosis and silico-TB. Employment on the gold mines fell from 480 000 in 1988 to 160 000 by 2006.70 Approximately half of the 2007 workforce was from neighbouring countries, mainly Mozambique and Lesotho.71 The implication is that active miners are now outnumbered by former gold miners, many of them not in SA. The second-largest claimant group is likely to be former asbestos mineworkers from the smaller, and now defunct, asbestos mining industry.72
c Personal Communication: Dr L. Dzingwa, Acting Director, Medical Bureau for Occupational Diseases. 2012.

Occupational Health Challenges 5
SAHR 2012/13 77
Accessibility to such examinations by former mineworkers depends on their home location and on their understanding of this entitlement, both of which have been strongly patterned by the racialised history of the mining industry. Prior to 1993, only whites had access to these examinations at the fully equipped Bureau in Johannesburg, and to sub-bureaux in Welkom, Klerksdorp, Carletonville Rustenburg, Dundee, Kuruman and Bellville. After deracialisation of the system in 1993, the Bureau was opened to all. However, the sub-bureaux were closed in the 1990s and no attempt was made to replace them with equivalent services closer to where the majority of former mineworkers live.
Similarly, while whites tend to be familiar with the medical examination entitlement under the Act, the same does not apply to black miners. A recent study in the Eastern Cape of 200 former miners found that none were familiar with the system of benefit medical examinations.73
Currently, any medical practitioner may carry out a medical benefit examination and submit the required forms and test results, including chest x-rays, to the Bureau. However, in order to be paid for the examination (October 2012 rate: R330),c prior authorisation is required from the Director of the Bureau. Currently a few authorised general practitioners, mainly in the Eastern Cape, perform these examinations.
The default situation is that former mineworkers are required to find their way to provincial health facilities in SA. The Bureau has from time to time sought to establish specific examination points in rural areas of SA.74 The 2012/13 to 2014/15 Department of Health Annual Performance Plan lists 190 “service providers” that offer benefit medical examinations, with the target of increasing these to 240 by 2013/14.69 In practice, however, few state facilities are able to conduct and submit the required examinations. These facilities face a multitude of problems in assisting former miners, related to shortages and turnover of knowledgeable healthcare staff; limitations of equipment, space and transport; and claimant and agent fraud.75 Attempts by the Chamber of Mines to establish benefit medical examination points in Nongoma, KwaZulu-Natal, and Umtata in the Eastern Cape, have yet to be evaluated.
Mineworkers in neighbouring countries have even fewer options. Former mineworkers in Botswana are offered free benefit medical examinations,c but otherwise no special arrangements for examinations currently exist in these countries.
Accessibility of the families of deceased former miners, specifically black miners, to statutory autopsies provided for by the ODMWA is predictably worse. Potential barriers include lack of understanding by the family of the statutory entitlement and unwillingness to consent to having the heart and lungs removed. Unavailability of a medical practitioner equipped or willing to remove the heart and lungs, prior to storage and transport to the National Institute of Occupational Health laboratory service in Johannesburg, is also a problem. Currently, former mineworkers account for a very small proportion of autopsies conducted on black mineworkers and, apart from a few resulting from a small programme in Lesotho, effectively none from former mineworkers in neighbouring countries.d
In attempting to improve access to benefit medical examinations and autopsy services, the Department of Health is faced with a
d Personal Communication: Prof. J. Murray, National Institute for Occupational Health.
conundrum. The Act effectively creates a vertical programme for former mineworkers, with special requirements for the examinations, specific forms that need to be completed and a complex claims procedure. This structure runs contrary to the Department’s main policy thrusts of comprehensive primary health care and NHI.
A hybrid solution could aim at the training of primary care staff to identify potential ODMWA claimants in the areas where former mineworkers live, followed by referral to specialised examination points or clinics. Such training would need to be more or less continuous to take into account staff turnover. Referral points would also require a resource commitment over and above normal primary care activities.
Links to the major recruiting agency for the gold mines, TEBA, could assist in validating work records and tracking gold miners in rural areas. This administrative and tracking component is an essential part of the benefit medical examination and, seemingly, the stage at which many claims under the OMDWA currently run aground.76
The work required will, however, add further costs to the benefit examination process.
A private model of relevance is the Asbestos and Kgalagadi Relief Trusts, set up following a lawsuit settlement to provide medical examinations to a population exposed to asbestos from the operations of a number of qualifying mines in the Northern Cape, Limpopo and Mpumalanga provinces. The Trusts took responsibility not only for soliciting and adjudicating claims but also for recruiting and training general practitioners in assessment of asbestos-related disease (which included office spirometry). Working with a small full-time office staff and a panel of radiologists and occupational medicine specialists that operated on a part-time basis, the Trusts managed approximately 14 000 claims between 2005 and 2011.e Activities by the Trusts in these areas have also resulted in a substantial increase in deceased former mineworkers being referred for autopsies under ODMWA provisions.
Claims management: reform of the Bureau and CCOD
Expansion of access to benefit medical examinations will be a wasted effort if the functioning of the Bureau and particularly the CCOD is not improved.
The first requirement is timeous assessment of claims. The Bureau code of conduct (written in terms of section 43 of the Act) requires that it certify cases within six months of receipt of documentation. Section 48.1 also explicitly states that it must inform claimants within 10 days of certification. In a 2010 review of claims delays, the efficiency of the Bureau was found to have deteriorated significantly from a median response time of 8 months during the 1993-2000 period to 13.5 months during 2001-2005.76 The overall range was 1 to 46 months. Other complaints about the Bureau have included poor registration of claims, lost documents and difficulty getting information on claims.77
Public scrutiny of the Bureau’s operations is not currently possible since, contrary to the requirement of section 7 of the Act, the Bureau has not issued an annual report since 1999. Reportedly, the claims turnaround time has been reduced to under six months and annual
e teWaterNaude et al. Medical Report for the period ended 29 February 2012. Asbestos Relief Trust and Kgalagadi Relief Trust. August 2012 (private communication).

78 SAHR 2012/13
reports are being prepared for the past few years. A significant obstacle to sustaining this improvement is the difficulty of recruiting qualified medical staff at the remuneration level currently being offered by the MBOD.c
The financial woes of the CCOD and the failure of the Department of the Health, by its own admission, to manage and staff the CCOD properly have been noted above. The Maiphetlho and Ehrlich study of 2010 found that in less than half of the claims processed by the CCOD the claimants were confirmed to have received their awards, with the average delay for the whole claims process being over four years.76 A 2002 audit of compensation of postmortem (autopsy) certifications found a payment rate of only 7%.78 As of 2011 the backlog of claims stood at around 13 000.62
The recent re-organisation of the line structure of the Bureau and CCOD signals a new intention within the Department to deal with the problem.62 However, budgetary constraints remain. While levies on the mining industry can be increased to underwrite compensation payments, the administration costs of the Bureau (including the costs of examining former mineworkers) and CCOD have to come from the Department of Health’s budget. This amounted to a call on taxpayers of approximately R38 million in 2011.69 The assumption of these costs by the state reflects the history of accommodation of successive pieces of compensation legislation to the needs of the mining industry and pressures from mineworkers, particularly white organised labour.
However, a case can be made for these costs to return to the Compensation Fund, which is funded through employer premiums. The defrayment of administration costs from premium revenue is the norm for insurance funds, which includes the fund provided for by the COIDA. It can also be argued that the mining industry would have a greater stake in ensuring the efficiency of the Bureau and CCOD if it were responsible for their financing. Such a move would also relieve the pressure on the public sector or on a future NHI fund to fund medical benefit examinations.
It can also be argued that while the organisation of medical benefit examinations and, arguably, the medical adjudication of claims fall within the core business of the Department of Health, the non-medical functions of administration and payment of claims do not. More recent attempts to move the administrative function of the CCOD to Rand Mutual Assurance Co. Ltd have reportedly been shelved. Rand Mutual Assurance is the assurance company that administers all mining industry occupational disease claims not covered by the ODMWA (for example, noise-induced hearing loss) and all mining occupational injury claims. Turning the CCOD around will be a major task for a department burdened financially and managerially by major reform initiatives in other areas of the public healthcare system.
Conclusion
Healthcare workers in SA are at increased risk of contracting TB by virtue of their occupation. This risk is compounded by high rates of HIV infection and the lack of implementation of effective occupational health and safety measures to protect them adequately. The extremely high risk of acquiring drug-resistant TB among this vulnerable group is further testimony to the inadequacy of the protection measures currently in place. Recognising this
risk and developing policy in this area do not constitute sufficient protection and will do little to modify the risk. The protection of healthcare workers needs to be supported by a dedicated focus that incorporates commitment from top management; comprehensive, locally appropriate and practicable policies; the implementation of effective infection control measures informed by and integrated with other occupational health and safety measures; training; ongoing surveillance; and the provision of comprehensive occupational health services to healthcare workers.
In the mining sector, it has long been apparent that a large burden of occupational lung disease has been externalised from the mining industry to impoverished areas of the southern African region. The mining industry must be held accountable for reducing one of the root causes of this epidemic at source; namely, the exposure of miners, particularly gold miners, to hazardous levels of silica dust. More complex root causes are the century-long reliance on the migrant labour system by parts of the industry and the nature of mine accommodation. These factors have created fertile soil for the spread of TB and HIV infection. However, the Department of Health remains responsible for providing statutory medical examinations (in addition to treatment of TB and HIV-related disease) for the growing population of former miners. It must also adjudicate and arrange the payment of compensation for occupational lung disease. There is a need for the Department of Health to recover a sense of accountability and urgency about this mandate.
Recommendations
Healthcare workers
➢ Protecting healthcare workers against TB needs to be assigned priority by those tasked with managing healthcare programmes, facilities and human resources.
➢ Health and safety management systems should be strengthened where they exist and developed where they are absent to better address and prioritise this risk.
➢ Systems need to be developed to support a strategy of continued surveillance for TB in this high-risk population. This will ensure an accurate picture of the true extent of the problem and the impact of interventions. Such surveillance programmes may need to employ both active and passive case-finding strategies.
➢ The provision of comprehensive occupational health services to healthcare workers will enable the delivery of large-scale surveillance and employee wellness services in an integrated fashion.
➢ Strengthening and visibility of occupational health and safety enforcement initiatives by the Department of Labour may contribute positively to protecting healthcare workers against TB risk.
➢ Ongoing monitoring and evaluation of strategies employed to manage TB risk are imperative to close the gap between policy and practice.

Occupational Health Challenges 5
SAHR 2012/13 79
Mineworkers
Legal, financial and managerial reform of the ODMWA system is long overdue.
Shorter-term goals include the following:
➢ A rural infrastructure to increase access for conducting benefit medical examinations should be provided and financed.
➢ A formal evaluation of the nature and effectiveness of the “190 service points” mentioned in the 2012/13 to 2014/15 Annual Performance Plan of the Department of Health is needed.
➢ Cross-border arrangements for occupational lung disease detection and compensation with relevant agencies need to be negotiated, particularly in Lesotho and Mozambique.
➢ “In house” targets include attracting qualified staff to the Bureau to ensure rapid turnaround of claims and vigorous management of the CCOD to remove the blot of 13 000 backlogged claims.
Intermediate policy goals should be to shift the responsibility of financing the administration of the system to the Compensation Fund and to give serious consideration to outsourcing the administrative functioning of the CCOD to the private sector.
Finally, inequity between the financial benefits obtainable by various categories of workers under the ODMWA and COIDA is probably the single most contentious political and economic aspect of the system and requires urgent high-level policy and legal reform.
Conflict of interest
Rodney Ehrlich has written expert technical reports for use by attorneys for the plaintiffs in compensation litigation and current silicosis litigation.
Acknowledgements
The authors wish to thank the following individuals for providing invaluable information towards the compilation of this review: Dr J. teWaterNaude (Asbestos Relief Trust), Dr L. Dzingwa (Medical Bureau for Occupational Diseases), Prof. J. Murray (National Institute for Occupational Health), Mrs S. Newman (Western Cape Department of Health), Prof. H. Bhorat (Development and Policy Research Unit, University of Cape Town) and Mr D. Tseng (Development Policy Research Unit, University of Cape Town).

80 SAHR 2012/13
References1 Statistics South Africa. P0277 – Quarterly Employment
Statistics, June 2012. Pretoria: Statistics South Africa; 2012.
2 Statistics South Africa. P0277 – Quarterly Employment Statistics, June 2006. Pretoria: Statistics South Africa; 2006.
3 National Department of Health. Human Resources for Health South Africa 2030: HRH strategy for the health sector: 2012/13-2016/17. Pretoria: National Department of Health; 2011.
4 Western Cape Department of Health. Healthcare 2020: The future of health care in the Western Cape. A draft framework for dialogue, November 2011. Cape Town: Western Cape Department of Health; 2011.
5 Chamber of Mines. Annual Report 2012. Johannesburg: Chamber of Mines; 2012.
6 World Health Organization. WHO report 2011: Global tuberculosis control. Geneva, Switzerland: World Health Organization; 2011.
7 Baussano I, Nunn P, Williams B, Pivetta E, Bugiani M, Scano F. Tuberculosis among health care workers. Emerg Infect Dis. 2011;17(3):488-94.
8 Menzies D, Joshi R, Pai M. Risk of tuberculosis infection and disease associated with work in health care settings. Int J Tuberc Lung D. 2007;11(6):593-605.
9 Joshi R, Reingold AL, Menzies D, Pai M. Tuberculosis among health-care workers in low- and middle-income countries: A systematic review. PLoS Med. 2003;3(12):e494.
10 National Department of Health. A national human resources plan for health. Pretoria: National Department of Health; 2006.
11 Balt E, Durrheim D, Weyer K. Nosocomial transmission of tuberculosis to health care workers in Mpumalanga. S Afr Med J. 1998;88(11):1363,1366.
12 Wilkinson D, Gilks C. Increasing frequency of tuberculosis among staff in a South African District hospital: Impact of the HIV epidemic on the supply side of health care. T Roy Soc Trop Med H. 1998;92(5):500-2.
13 Naidoo S, Jinabhai C. TB in health care workers in KwaZulu-Natal, South Africa. Int J Tuberc Lung D. 2006;10(6):676-82.
14 Claassens MM, Sismanidis C, Lawrence KA, Godfrey-Faussett P, Ayles H, Enarson DA, et al. Tuberculosis among community-based health care researchers. Int J Tuberc Lung D. 2010;14(12):1576-81.
15 Kranzer K, Bekker L, van Schaik N, Thebus L, Dawson M, Caldwell J, et al. Community health care workers in South Africa are at increased risk for tuberculosis. S Afr Med J. 2010;100(4):224,226.
16 O’Donnell MR, Jarand J, Loveday M, Padayatchi N, Zelnick J, Werner L, et al. High incidence of hospital admissions with multidrug-resistant and extensively drug-resistant tuberculosis among South African health care workers. Ann Intern Med. 2010;153(8):516-22.
17 Jarand J, Shean K, O’Donnell M, Loveday M, Kvasnovsky C, Van der Walt M, et al. Extensively drug-resistant tuberculosis (XDR-TB) among health care workers in South Africa. Trop Med Int Health. 2010;15(10):1179-84.
18 Shisana O, Hall E, Chaveau J, Schwabe C. HIV/AIDS prevalence among South African health workers. S Afr Med J. 2004;94(10):846-50.
19 Connelly D, Veriava Y, Roberts S, Tsotetsi J, Jordan A, DeSilva E, et al. Prevalence of HIV infection and median CD4 counts among health care workers in South Africa. S Afr Med J. 2007;97(2):115-20.
20 World Health Organization. The joint WHO-ILO-UNAIDS policy guidelines on improving health workers’ access to HIV and TB prevention, treatment, care and support services. Geneva, Switzerland: World Health Organization; 2010.
21 National Department of Labour. Circular instruction no. 178 – Circular instruction regarding compensation for pulmonary tuberculosis in healthcare workers. Pretoria: National Department of Labour; 1993.
22 Adams S, Morar R, Kolbe-Alexander T, Jeebhay MF. Health and health care in the workplace. In Harrison S, Bhana R, Ntuli A, editors. South African Health Review 2007. Durban: Health Systems Trust; 2007.
23 Western Cape Department of Health. Chief Directorate Human Resource, Western Cape. Transformation: Employee health & wellness component. Status of occupational health & safety in the Department of Health. Department of Health; 2011.
24 National Department of Health. The National Infection Prevention and Control Policy and Strategy. Pretoria: National Department of Health; 2007.
25 World Health Organization. Guidelines for intensified tuberculosis case-finding and isoniazid preventive therapy for people living with HIV in resource-constrained settings. WHO guidelines 2011. Geneva, Switzerland: World Health Organization; 2011.
26 World Health Organization. WHO policy on TB infection control in health-care facilities, congregate settings and households. Geneva, Switzerland: World Health Organization; 2009.
27 Republic of South Africa. Regulations for hazardous biological agents: Occupational Health and Safety Act. Government Notice R. 7233. Government Gazette No. 22956, 27 December 2001.
28 Westerholm P. Silicosis. Observations on a case register. Scand J Work Environ Health 1980;6 Suppl 2:1-86.
29 De Klerk NH, Ambrosini GL, Pang SC, Musk AW. Silicosis compensation in Western Australian gold miners since the introduction of an occupational exposure standard for crystalline silica. Ann Occup Hyg. 2002;46(8):687-92.
30 Bang KM, Attfield MD, Wood JM, Syamlal G. National trends in silicosis mortality in the United States, 1981-2004. Am J Ind Med. 2008;51(9):633-9.
31 Lou J, Zhou C. The prevention of silicosis and prediction of its future prevalence in China. Am J Public Health. 1989;79(12):1613-6.
32 Cowie RL. Silicosis, pulmonary dysfunction and respiratory symptoms in South African gold miners [MD thesis]. Cape Town: University of Cape Town, Department of Medicine; 1987.
33 Steen TW, Gie KM, White NW, Gaosianelwe T, Ludick S, Mazonde GN, et al. Prevalence of occupational lung disease among Botswana men formerly employed in the South African mining industry. Occup Environ Med. 1997;54(1):19-26.
34 Trapido A, Mqoqi NP, Williams BG, White NW, Solomon A, Goode RH et al. Prevalence of occupational lung disease in a random sample of former mineworkers, Libode District, Eastern Cape Province, South Africa. Am J Ind Med. 1998;34(4):305-13.
35 White NW, Steen TW, Trapido ASM, Davies JC, Mabongo NM, Monare N, et al. Occupational lung diseases among former goldminers in two labour sending areas. S Afr Med J. 2001;91(7):599-604.

Occupational Health Challenges 5
SAHR 2012/13 81
36 Churchyard GJ, Ehrlich R, teWaterNaude JM, Pemba L, Dekker K, Vermeijs M, et al. Silicosis prevalence and exposure-response relations in South African gold miners. Occup Environ Med. 2004;61(10):811-6.
37 teWaterNaude JM, Ehrlich RI, Churchyard GJ, Pemba L, Dekker K, Vermeis M, et al. Tuberculosis and silica exposure in South African gold miners. Occup Environ Med. 2006;63(3):187-92.
38 Girdler-Brown BV, Churchyard G, Ehrlich RI, White N. The burden of silicosis, pulmonary tuberculosis and COPD among former Basotho gold miners. Am J Ind Med. 2008;51(9):640-7.
39 Park HH, Girdler-Brown BV, Churchyard GJ, White NW, Ehrlich RI. Incidence of tuberculosis and HIV and progression of silicosis and lung function impairment among former Basotho Gold Miners. Am J Ind Med. 2009;52(12):901-8.
40 Nelson G, Girdler-Brown B, Ndlovu N, Murray J. 2010. Three decades of silicosis: disease trends at autopsy in South African gold miners. Environ Health Perspect. 2010;118(3):421-6.
41 National Department of Health. Tuberculosis Strategic Plan for South Africa. 2007-2011. Pretoria: National Department of Health; 2007.
42 Bateman C. Collaborative push to address TB crisis on the mines. S Afr Med J. 2009;99(12):852-5.
43 Southern African Development Community. Declaration on TB in the Mining Sector. Final Draft. Pretoria: National Department of International Relations and Cooperation; 2012.
44 Hnizdo E, Murray J. Risk of pulmonary tuberculosis relative to silicosis and exposure to silica dust in South African gold miners. Occup Environ Med. 1998;55(7):496-502.
45 Pasula R, Britigan BE, Turner J, Martin WJ 2nd. Airway delivery of silica increases susceptibility to mycobacterial infection in mice: Potential role of repopulating. J Immunol. 2009;182(11):7102-9.
46 Corno L, de Walque D. Mines, Migration and HIV/AIDS in Southern Africa. J Afr Economies. 2012;21(3):465-98.
47 Ndlovu N, Nelson G, Davies T, Murray J. Pathology Division surveillance report: Demographic data and disease rates for January to December 2007. NIOH Report. Johannesburg: National Institute for Occupational Health; 2008.
48 Glynn JR, Murray J, Bester A, Nelson G, Shearer S, Sonnenberg P. High rates of recurrence in HIV-infected and HIV-uninfected patients with tuberculosis. J Infectious Dis. 2010;201(5):704-11.
49 Hanifa Y, Grant AD, Lewis J, Corbett EL, Fielding K, Churchyard G. Prevalence of latent tuberculosis infection among gold miners in South Africa. Int J Tuberc Lung D. 2009;13(1):39-46.
50 Van Halsema CL, Fielding KL, Chihota VN, Lewis JJ, Churchyard GJ, Grant AD. Trends in drug-resistant tuberculosis in a gold-mining workforce in South Africa, 2002–2008. Int J Tuberc Lung D. 2012;16(7):967-73.
51 Corbett EL, Charalambous S, Moloi VM, Fielding K, Grand AD, Dye C, et al. Human Immunodeficiency Virus and the prevalence of undiagnosed tuberculosis in African gold miners. Am J Respir Crit Care Med. 2004;70(6):673-9.
52 Treatment Action Campaign. The mining sector, tuberculosis and migrant labour in Southern Africa. Cape Town: Treatment Action Campaign; 2008.
53 Republic of South Africa. Occupational Diseases in Mines and Works Amendment Act (Act 208 of 1993).
54 Republic of South Africa. Compensation for Occupational Injuries and Diseases Act (Act 130 of 1993).
55 Ehrlich R. A century of miners’ compensation in South Africa. Am J Ind Med. 2012;55(6):560-9.
56 Abdullah F, Jeebhay M, Myers J. Occupational Diseases in Mines and Works Act, 1993 (opinion). S Afr Med J. 1994;84:132-3.
57 International Labour Organization. Guidelines for the use of ILO International Classification of Radiographs of Pneumoconioses. Occupational Safety and Health Series No. 22. Geneva, Switzerland: International Labour Organization;1980.
58 White N. Is the ODMW Act fair? A comparison of the Occupational Diseases in Mines and Works Amendment Act, 1993 and the Compensation of Occupational Injuries and Diseases Act, 1993 with respect to compensation of pneumoconiosis. Cape Town: University of Cape Town; 2004.
59 Parliamentary Monitoring Group. Minister and Department of Health on Compensation Commission for Occupational Diseases 2009/10 Annual Report: hearings. Cape Town: Parliamentary Monitoring Group: 2011.
60 Morris R. Financial controls a shambles. Business Report [newspaper in print]. 21 February 2005.
61 Van Rensburg D. Another silicosis ruling hits miners. MiningMx [newspaper online]. 05 May 2012 [cited 12 February 2013]. URL: http://www.miningmx.com/news/markets/Another-silicosis-ruling-hits-miners.htm
62 Kahn T. Health Director-General replaces Compensation Commissioner. Business Day Online [newspaper online]. 22 August 2012 [cited 12 February 2013].URL: http://www.bdlive.co.za/national/health/2012/08/22/health-director-general-replaces-compensation-commissioner
63 Republic of South Africa. Mine Health and Safety Act (Act 29 of 1996).
64 National Department of Minerals and Energy. Guideline for the compilation of a mandatory code of practice for an occupational health programme (Occupational hygiene and medical surveillance). Pretoria: National Department of Minerals and Energy; 2002.
65 Republic of South Africa. Occupational Diseases in Mines and Works Act (Act 79 of 1973).
66 Labour Research Service. Snapshot of Wage Settlements in 2012. Updated May to August 2012. http://www.lrs.org.za/docs/Snapshot%20of%20Wage%20Settlements%20May-August%202012.pdf
67 Republic of South Africa. Report of the Medical Bureau for occupational diseases. 1 April 1989 to 31 March 1990. Johannesburg: Medical Bureau for Occupational Diseases; 1990.
68 Benjamin P, Greef J. Report of the Committee of Inquiry into a National Health and Safety Council in South Africa (1997). Pretoria: National Department of Labour; 1997.
69 National Department of Health. Annual Performance Plan. 2012/13 – 2014/15. Pretoria: National Department of Health; 2012.
70 Harington JS, McGlashan ND, Chelkowska EZ. A century of migrant labour in the gold mines of South Africa. J S Afr Institute Mining and Metallurgy. 2004;104(2):65-71.
71 Rees D, Murray J, Nelson G, Sonnenberg P. Oscillating migration and the epidemics of silicosis, tuberculosis and HIV infection in South African gold miners. Am J Ind Med. 2010;53(4):398-404.

82 SAHR 2012/13
72 Ehrlich R (unpublished). Estimates of cases expected of mesothelioma, lung cancer and asbestosis among a cohort of workers exposed to asbestos on Gencor owned asbestos mines from 1964 to 1983. Report prepared for the applicant in court settlement with Gencor et al. 2002. In: Applicant’s supplementary affidavit: pp 1395-1405.
73 Roberts J. The hidden epidemic amongst former miners: silicosis, tuberculosis and the Occupational Diseases in Mines and Works Act in the Eastern Cape, South Africa. Durban: Health Systems Trust; 2009.
74 National Department of Health. Annual Report 2008/2009. Pretoria: National Department of Health.
75 Roberts J. The hidden impact amongst former miners: Silicosis, tuberculosis, and the occupational disease in Mines and Works Act in the Eastern Cape, South Africa. Durban: Health Systems Trust; 2009.
76 Maiphetlho L, Ehrlich R. Claims experience of former gold miners with silicosis – A clinic series. Occup Health Southern Afr. 2010;16:10-6.
77 Calver A. Miners compensation. Who cares? S Afr Labour Bulletin. 2008;32:26-8.
78 Murray J, Coetzee L, Back P, Banyini A, Ross M. Analysis of occupational lung disease identified at autopsy and compensated in the South African mining industry. Occup Health Southern Afr. 2002;8(3):3-5.

Author:
83SAHR 2012/13
666666666666
Kerry Cullinan
Managing editor of Health-e News Service, founder of the OurHealth project
Citizen Reporting on District Health Services
When the village clinic in Lusikisiki failed to open because the Eastern Cape Department of Health had not paid the rent, the news was circulated on the web that very day, along with pictures of patients locked outside.
Community activist Mtshana Mvlisi had returned to the rural village from training as a citizen journalist two days before the clinic’s closure in October 2012. He was able to use his new skills to write a short news report and send the report and photographs via a tablet computer to Health-e News Service, where these were edited, loaded onto the Health-e website and read by thousands of people.
Mvlisi is part of OurHealth, a small but ambitious pilot project aimed at reporting on, and ultimately improving, health conditions at district level. It was started by Health-e News Service, which has been reporting on health news for the mainstream media since 1999.
OurHealth is based in 5 of the 10 pilot districts for the National Health Insurance (NHI): OR Tambo district (Eastern Cape), Vhembe (Limpopo), Tshwane (Gauteng), Umgungundlovu (KwaZulu-Natal) and Thabo Mofutsanyane (Free State). As funding becomes available, it will be expanded to all NHI pilot districts and ultimately to as many of the country’s 52 health districts as is financially feasible.
The main aims of OurHealth are to:
➢ expose the health issues and challenges experienced by some of the poorest, most marginalised areas of the country;
➢ obtain reports directly from the people who use public health facilities every day about their experiences;
➢ hold the district service providers accountable for conditions and services at clinics and hospitals and hold accountable the municipalities that supply services that affect health, such as water and sanitation; and
➢ report on inspirational people and projects that improve the health of ordinary people.
A growing body of research demonstrates that, where formal accountability such as democratic elections fails to deliver better services to poor people, collective action by or on behalf of the poor can make policy makers and service providers more responsive and accountable.

84 SAHR 2012/13
Such collective action, defined as “social accountability”, involves current efforts by civil society groups, which include the media, to hold public officials and service providers accountable for service delivery. This accountability is achieved first through providing people with information and then “imposing reputational and political costs on providers by making state failures public”1 through, for example, the media and public meetings. This, in turn, can “trigger formal accountability mechanisms”, which in the case of South Africa could be court action or investigations by the Public Protector and the SA Human Rights Commission.1
International examples of how media-driven social accountability has had an impact on service delivery include India, where government responded better to floods and drought in places with good newspaper penetration, and Brazil, where radio station reports on local government candidates’ expenditure records had an effect on their re-election chances.2
Health-e’s current and sustained record of reporting on health service delivery, particularly in underreported provinces and areas, forms part of the development of a culture of social accountability in South Africa. This social accountability attempts to hold service providers accountable and to empower people both to make healthier choices and to demand the health services that they have the right to. OurHealth is taking this one step further by obtaining reports from people who live in communities and use public health facilities.
New York University Journalism Professor Jay Rosen defines citizen journalism as:
When the people formerly known as the audience employ the press tools they have in their possession to inform one another.3
The Internet, combined with a rise of social media tools such as Facebook and Twitter, has enabled citizen journalists to report on a wide variety of events with relative ease and to distribute their reports widely.
In some cases, citizen journalists and bloggers that use social media have had a major impact on social events, particularly in countries where freedom of expression is suppressed and conventional media outlets are censored. The so-called “Arab Spring” or uprising, particularly in Egypt in 2011, is one example where Facebook and Twitter played an important role in mobilising and organising people against their repressive governments.4
While none of the OurHealth citizen journalists have a media background, they have all been active in organisations such as the Treatment Action Campaign, Black Sash and loveLife Groundbreakers and have some experience in educating and mobilising people and in dealing with local authorities. Each citizen journalist has a tablet computer on which to write their reports. They are expected to submit one story a week of about 300 words and are paid per story.
OurHealth aims to collect human stories, particularly from people in rural areas and informal settlements. These people often experience the worst services yet are least likely to have the agency to reach the media or decision makers.
Since the OurHealth pilot was launched in October 2012, the citizen journalists have reported on a number of interesting and
important stories that otherwise would have been unlikely to receive coverage or attention.
From Lusikisiki, Mtshana Mvlisi and Thandeka Vinjwa have continued to track the village clinic’s closure and the subsequent relocation of patients to a park home without water or electricity. They have also reported on conditions at Madwaleni Hospital, which had only one doctor during 2012. Mvlisi’s story on a strike at the medicine depot in Mthatha and its effect on provincial hospitals featured in national newspapers.
From Vhembe, one of the stories Surprise Nemalale followed concerned taps being without water in Matavhela and Mufulwi villages for two-and-a-half months. Her reports played a role in getting the water supply restored.
From the Free State, Thamsanqa Majola reported on the many health issues facing residents of Selahliwe informal settlement near Bethlehem as a result of poor sanitation and toilet facilities.
Selloane Molakeng reported on a five-year-old girl who had been hit by a car and died while waiting to be attended to by nurses at Phekolong Hospital in Bethlehem. Only two nurses were on duty in the casualty department and no beds were available.
From KwaZulu-Natal, Lungile Ngubane has focused mainly on organisations and people trying to improve communities around Howick in the Midlands. One example is Ethembeni Care Centre, which provides free medical assistance and distributes food parcels to people in Mpophomeni.
Edendale-based Thandiwe Mazanqinqi-Zamisa has drawn on her own experiences as an HIV-positive mother and a counsellor for HIV-positive pregnant women for her stories.
In Tshwane, Mishack Mahlangu has reported on a number of organisations in Winterveldt that face closure because they no longer receive funding from the President’s Emergency Plan for AIDS Relief. These include the Winterveldt HIV/AIDs Project, which cares for 1 200 orphans, and Hope for Life, which provides antiretroviral treatment and social support to 1 200 people living with HIV.
All the stories are loaded onto the Health-e website, which has a daily average of 12 600 visitors and had an annual page-view readership of 4.6 million in 2012.
When Health-e staff members met Health Minister Dr Aaron Motsoaledi in November 2011 to discuss the OurHealth project, he was enthusiastic about it as an example of how civil society could monitor government service delivery. He asked that the citizen journalists establish contact with the Ombudsperson offices being set up in all the provinces. This, he said, would ensure that serious issues and complaints could be dealt with immediately by health officials.
Since the launch of OurHealth, the Department of Performance Monitoring and Evaluation in The Presidency has contacted Health-e and is considering OurHealth as a pilot for citizen monitoring of government service delivery.
After three months of operating, OurHealth has a stable group of citizen reporters. It can now formalise links with district health officials and start to put pressure on them to report back on progress made to address problems identified.

Citizen Reporting on District Health Services 6
SAHR 2012/13 85
OurHealth journalists will also take part in the Tendai project, a partnership that is working in 15 Southern African Development Community (SADC) countries to improve access to essential medicine. Tendai is coordinated by the Southern Africa Regional Partnership on Access to Medicines and Diagnostics, which is collaborating with the SADC Secretariat to implement its pharmaceutical business plan.
As part of the project the journalists will each be assigned to a small number of clinics and will visit the pharmacy at the clinic once a month to check on the supply of 12 essential medicines. At present, these medicines are Acyclovir, Amphotericin, Cotromoxazole, Efavirenz, Fluconazole, Lopinovir/Rotinavir, Morphine, Para-cetamol, Rifampicin, Isoniazid, Tenofovir and Zinc Sulphate.
The journalists will send monthly reports to Tendai via mobile phones preloaded with a reporting template. The phones will have a geographic positioning system that captures the location and confirms that the journalists have actually visited the clinics.
The OurHealth project is currently being run on a tight budget, with support from the DG Murray Trust and The Atlantic Philanthropies. However, many possibilities exist for groundbreaking citizen reporting on health service delivery that will ensure that serious district-level grievances and successes receive the profile and attention they deserve.

86 SAHR 2012/13
References
1 Centre for the Future State. How social accountability can improve service delivery for poor people. Brighton, UK: Institute of Development Studies; 2010.
2 Ringold D, Holla A, Koziol M, Srinivasan S. Citizens and service delivery: assessing the uses of social accountability approaches on human development. New York, NY: World Bank; 2005.
3 Rosen J. A most useful definition of citizen journalism. PressThink [Internet]. 14 July 2008 [cited 21 May 2012].URL: http://archive.pressthink.org/2008/07/14/a_most_useful_d.html
4 Hamdy N. Arab citizen journalism in action: challenging mainstream media, authorities and media laws. London, UK: Communications and Media Research Institute; 2009.

SAHR 2012/13 87
So
cia
l and
Env
iro
nm
enta
l D
ete
rmin
ants
of
Health

SAHR 2012/1388
So
cia
l and
Env
iro
nm
enta
l D
ete
rmin
ants
of
Health

Authors:
89SAHR 2012/13
7777777
Laetitia RispelSara Nieuwoudt
School of Public Health, University of the Witwatersrand, Johannesburg
Mainstreaming the Social Determinants of Health in South Africa: Rhetoric or reality?
This chapter provides an analytical perspective on the discourse and action focusing on the social determinants of health (SDH) in South Africa and aims to provide insights into the complexities of practical action on the SDH. It is
based on a rapid appraisal of government policy documents and budget speeches, combined with interviews with 10 purposively selected key informants.
Discussion on the SDH from the health sector is encouraging, with the Negotiated Service Delivery Agreement recognising the importance of addressing “upstream” factors (e.g. SDH) that impact on health. All of the provinces have articulated the importance of the SDH, and have listed structural mechanisms, ranging from more narrow bilateral departmental arrangements (e.g. between health and social development) to an overall philosophical approach of integrated planning and a ‘whole of society’ wellness approach. However, no prioritisation of the many intersectoral initiatives is apparent, which leads to doubt about the ability and capacity of government as a whole, and the health sector in particular, to make measureable progress. Interviews with key informants revealed numerous constraints, including problems of policy design, governance and leadership of SDH, gaps between policy and implementation, insufficient resources, and a lack of monitoring and evaluation.
Nonetheless, the global movement on SDH and developments within the country create an enabling environment for more concrete action. Moving beyond rhetoric requires the following activities: good epidemiological information and clear indicators that can be used to monitor disease trends and progress on SDH over a period of time; comprehensive community-based prevention programmes; involvement of communities and various stakeholders in intersectoral activities; legislative and structural interventions to address more underlying determinants; innovative media campaigns; and monitoring and evaluation of the SDH. All of these require dedicated financial and human resources. Finally, a more critical SDH discourse is needed – one that interrogates and addresses the structural determinants of health inequities and the unequal power relationships that exacerbate such inequities.
The global movement on social determinants of
health and developments within the country create an
enabling environment for more concrete action.

90 SAHR 2012/13
Introduction
In the past decade, there has been a resurgence of interest in action to address the social determinants of health (SDH), in part a response to the persistent health inequities between and within countries; changing disease profiles and the complexity thereof; and inadequate or poorly performing health systems.1-4 The SDH are:
the social and economic factors that influence health, and include income, education, social safety networks, employment and working conditions, unemployment and job security, early childhood development, gender, ‘race’, food insecurity, housing, social exclusion, access to health services, and disability.1
These factors are, in the main, influenced by government policies and practices of resource allocation and distribution, as well as legislation that reinforces or counters harmful social norms.1 As such, there is value in reviewing how the SDH are acknowledged and addressed by government, in this case using the health sector as a departure point.
In South Africa (SA), notwithstanding huge social and economic transformation since the democratic elections in 1994, the country remains one of the most unequal in the world.5,6 Gender, ‘race’ and geographical location remain the key markers of social and economic inequities and of poor health outcomes.7,8 These inequities are exacerbated by the concomitant challenges of a quadruple burden of disease and the sub-optimal performance of the health system.7,9-19
In response to these problems, the Minister of Health signed the Negotiated Service Delivery Agreement (NSDA) for the Health Sector in October 2010.20 In terms of the NSDA, the four strategic outputs for the health sector are: increasing life expectancy; decreasing maternal and child mortality; combating HIV and AIDS and decreasing the burden of disease from tuberculosis (TB); and strengthening health system effectiveness.20 The re-engineering of primary health care (PHC) is at the core of revitalising and strengthening the health system.20,21 The principles of the re-engineered system are: a population-orientation to health care; meeting priority health needs in a comprehensive manner; improving health outcomes; developing a well-functioning district health system; and a focus on the “upstream” factors that impact on health; i.e. the SDH.22 It is on this final principle that we focus in this chapter.
The chapter provides an analytical perspective on the discourse and action, focusing on the SDH in SA within the health sector and aims to provide insights into the complexities of practical action on the SDH. The chapter combines an analysis of government health policy documents and budget speeches with interviews with 10 purposively selected key informants from national and provincial health departments. The interviews explored: knowledge of key global developments in SDH; whether the attention being paid to the SDH over the past few years is simply rhetoric, or whether there is there real action on SDH as a means of improving population health and reducing health inequities. The first part of the chapter focuses on key global developments in SDH and the extent to which the discourse centering on SDH is reflected in the NSDA. This latter document was selected as it provides the foundation for health ministerial action and the subsequent development of health
sector policies; for example, the Green Paper on National Health Insurance (NHI)23 and the Human Resources for Health (HRH) strategy.24 The second section of the chapter explores intersectoral action taken on the SDH, and what is being done at national and provincial government levels in SA to address the SDH. The section also looks at constraints or barriers that impede progress. The final section highlights successful intersectoral initiatives both in SA and elsewhere and draws out lessons for the country on practical action on the SDH.
Overview of global developments on SDH
In 2005, the World Health Organization (WHO) set up the Commission on Social Determinants of Health (CSDH) to collect and synthesise the evidence on what can be done to address the SDH, promote health equity, and foster a global movement to achieve it.1 The CSDH presented its final report in 2008 and made three over-arching recommendations:
➢ improve daily living conditions – i.e. the circumstances in which people are born, grow, live, work, and age;
➢ tackle the inequitable distribution of power, money, and resources (i.e. the structural drivers); and
➢ measure the problem, evaluate action, expand the knowledge base, develop a workforce that is trained in the SDH and raise public awareness about the SDH.1
This emphasis on SDH is not new, as can be seen from Table 1, and was first highlighted as far back as three decades ago.

Mainstreaming the Social Determinants of Health in South Africa 7
91SAHR 2012/13
Table 1: Timeline of high-level key global developments in SDH
Year Milestone Highlights1978 Alma-Ata Declaration on
PHC25,26•Emphasises values of equity, social justice and health as a fundamental human right•Expresses the need for urgent action to protect and promote the health of people •PHC strategies include access to: good quality health care – including preventive and promotive services
– intersectoral action to address the root causes of ill-health and enhanced community participation and accountability
1986 Ottawa Charter for Health Promotion27
•Focuses on health promotion•Reaffirms values of equity in health as a fundamental right•Emphasises that achievement of health goes beyond the health sector•Highlights the importance of intersectoral action
2000 Millennium Declaration28 •Global attempt at addressing unacceptable inequalities within and between countries •Consists of eight Millennium Development Goals (MDGs) and 20 development targets to be achieved by
2015•MDGs range from eradicating extreme poverty to developing a global partnership for development
2008 CSDH1 •Emphasises the values of equity and social justice•Synthesises evidence of SDH, and includes action needed at local, national and global levels•Focuses attention on the structural drivers of inequality and the need for ongoing measurement, monitoring
and evaluation of health inequalities2009 World Health Assembly
Resolution 6229•Focuses on the reduction of health inequities through action related to the SDH
2011 Rio Political Declaration on SDH3
•Reiterates WHO member states’ commitment to achieve social and health equity through action on SDH and a comprehensive intersectoral approach
•Endorses five priority action areas of: improved governance at national level; community participation; re-orientation of the health system to address equity; strengthened global governance and collaboration; and accountability and monitoring of progress
2012 65th World Health Assembly •Endorses the recommendations of the Rio Declaration 2012 Declaration of the Third
People’s Health Assembly30• Identifies the neo-liberal model of globalisation as the root of the global health crisis •Endorses collective global and local action to transform prevailing social, political, and economic systems
and structures that entrench and exacerbate health inequities
Notwithstanding all these global developments, more than 30 years after the Alma-Ata PHC Declaration, the goal of “health for all” remains elusive in many countries and huge inequities remain between and within countries.1,25,31 But to what extent is the SDH reflected in current health care reforms?
The NSDA is explicit in the linkages between the disease burden and health system effectiveness on the one hand and the SDH on the other.20 The NSDA reiterates the importance of the PHC approach as enunciated at Alma-Ata and the need for an intersectoral approach in order to improve health outcomes. The NSDA emphasises that the “improvement of the health status of all South Africans is a responsibility that cuts across a number of sectors, both internal and external to the government systems and processes and not just the Department of Health.”20 The document is impressive in the listing of key partners and stakeholders, both at national and international levels, in the implementation of each of the NSDA output areas.20
Table 2 summarises the four key outputs and associated targets of the NSDA, the extent to which the SDH are reflected in the situational analysis and the proposed activities to address the SDH.

92 SAHR 2012/13
Tabl
e 2
: Su
mm
ary
of o
utpu
ts a
nd t
arge
ts o
f the
NSD
A a
nd li
nks
to S
DH
NSD
A o
utpu
tTa
rget
for 2
014,
w
ith 2
009
base
line
valu
esSp
ecifi
c SD
H id
entif
ied
in N
SDA
Prop
osed
act
iviti
es to
add
ress
SD
H1
Incr
ease
life
exp
ecta
ncy
Incr
ease
life
exp
ecta
ncy
from
53.
9 to
58
year
s fo
r mal
es a
nd 5
7.2
to 6
0 ye
ars
for f
emal
es
•G
loba
lisat
ion
(inte
rnat
iona
l tra
vel a
nd tr
ade)
as
sour
ce o
f co
mm
unic
able
dis
ease
thre
ats,
suc
h as
mal
aria
•In
ters
ecto
ral a
ctio
n re
quire
d to
add
ress
the
burd
en o
f dis
ease
re
sulti
ng fr
om v
iole
nce
and
inju
ries
•H
ighl
ight
s th
at in
crea
sed
acce
ss to
pre
vent
ion,
scr
eeni
ng a
nd
early
det
ectio
n an
d ef
fect
ive
man
agem
ent o
f dis
ease
s w
ill im
prov
e lif
e ex
pect
ancy
•C
olla
bora
tion
with
nei
ghbo
urin
g co
untri
es to
pre
vent
mal
aria
•Li
sts
spec
ific
inte
rsec
tora
l act
ions
and
initi
ativ
es fo
r pre
vent
ion
or e
arly
de
tect
ion
of n
on-c
omm
unic
able
and
chr
onic
dis
ease
s•
Spec
ifies
the
need
for p
lans
to im
prov
e an
d ex
pand
hea
lthca
re a
cces
s an
d pr
even
tive
and
prom
otiv
e he
alth
ser
vice
s
2D
ecre
ase
mat
erna
l and
ch
ild m
orta
lity
Dec
reas
e un
der-f
ive
mor
talit
y ra
te fr
om
104to≤20per1000
•N
otes
the
links
bet
wee
n ch
ild m
orta
lity
and
the
SDH
suc
h as
cl
ean
wat
er, s
anita
tion,
chi
ld p
rote
ctio
n, a
nd p
over
ty a
nd c
hild
m
orta
lity
•H
ighl
ight
s lin
ks b
etw
een
SDH
and
men
tal h
ealth
•G
ende
r pow
er im
bala
nces
iden
tifie
d as
lim
iting
wom
en’s
repr
oduc
tive
and
sexu
al h
ealth
(RSH
) opt
ions
, exa
cerb
ated
by
limite
d (o
r lat
e) a
cces
s to
qua
lity
RSH
car
e•
Una
vaila
bilit
y of
tran
spor
t lin
ked
to p
reve
ntab
le c
hild
and
m
ater
nal d
eath
s
•PH
C re
-eng
inee
ring
to in
crea
se a
cces
s to
and
impr
ove
qual
ity o
f RSH
car
e•
‘Tan
gibl
e’ im
prov
emen
ts in
hea
lth s
yste
m e
ffect
iven
ess,
incl
udin
g pr
omot
ive
and
prev
entiv
e se
rvic
es a
nd a
func
tiona
l ref
erra
l sys
tem
•
(Re)
desi
gn ru
ral f
acilit
ies
to re
duce
nee
d fo
r tra
nspo
rt•
Cam
paig
ns to
de-
stig
mat
ise
abor
tion
Dec
reas
e in
fant
mor
talit
y ra
te fr
om 5
3 to≤18per1000
Dec
reas
e m
ater
nal m
orta
lity
rate
from
625to≤100per100000
3C
omba
t HIV
and
AID
S an
d de
crea
se th
e bu
rden
of d
isea
se fr
om
TB
Red
uce
new
HIV
infe
ctio
ns b
y 50
%•
HIV
am
ong
wom
en a
nd m
othe
r-to-
chi
ld tr
ansm
issi
on li
nked
to
gend
er p
ower
imba
lanc
es
•TB
link
ed to
ove
rcro
wdi
ng a
nd p
oor s
ocia
l con
ditio
ns•
Impr
oved
hea
lth s
yste
m e
ffect
iven
ess
need
ed
•Pr
omot
e an
d fa
cilit
ate
open
dia
logu
e am
ong
com
mun
ities
, civ
il so
ciet
y an
d so
cial
par
tner
s to
add
ress
the
SDH
to re
duce
stig
ma
and
proa
ctiv
ely
addr
ess
gend
er is
sues
that
put
wom
en a
t ris
k•
Impr
ove
heal
th s
yste
m e
ffect
iven
ess,
not
ably
PH
C re
-eng
inee
ring
and
incr
easi
ng e
arly
acc
ess
to p
reve
ntio
n an
d ca
re a
s w
ell a
s ac
coun
tabi
lity
by
inte
grat
ing
HIV
and
TB
serv
ices
•In
ters
ecto
ral f
ocus
on
high
risk
are
as fo
r TB
cont
rol
Eigh
ty p
erce
nt a
cces
s fo
r all
thos
e el
igib
le fo
r hig
hly
activ
e an
tiret
rovi
ral
ther
apy
(HAA
RT)
Incr
ease
TB
cure
rate
from
64%
to
85%
4St
reng
then
hea
lth
syst
em e
ffect
iven
ess
Re-
engi
neer
PH
CIm
plem
ent N
HI s
yste
m•
Rec
ogni
tion
that
cha
nges
mus
t be
coup
led
with
the
exis
tenc
e of
relia
ble
and
equi
tabl
e ac
cess
to d
ecen
t hou
sing
, cle
an w
ater
, sa
nita
tion,
nut
ritio
n an
d ed
ucat
ion
•C
alls
for c
omm
unity
par
ticip
atio
n an
d in
ters
ecto
ral c
olla
bora
tion
in th
e pr
ovis
ion
and
deliv
ery
of h
ealth
care
ser
vice
s
•O
verh
aul t
he h
ealth
ser
vice
s de
liver
y pl
atfo
rm•
Impr
ove
man
agem
ent a
nd s
uper
visi
on•
Impr
ove
phys
ical
infra
stru
ctur
e to
mot
ivat
e he
alth
wor
kers
to p
rovi
de b
ette
r car
e•
Accr
edit
of h
ealth
faci
litie
s th
roug
h an
inde
pend
ent b
ody
and
impr
ove
patie
nt
satis
fact
ion
and
qual
ity o
f car
e•
Incl
ude
non-
heal
th s
take
hold
ers
in p
lann
ing
for h
uman
reso
urce
s fo
r hea
lth•
Res
ourc
es to
ens
ure
com
mun
ity in
volv
emen
t in
gove
rnan
ce s
truct
ures
Sour
ce:
Ada
pted
from
: Nat
iona
l Dep
artm
ent o
f Hea
lth, 2
010.
20

Mainstreaming the Social Determinants of Health in South Africa 7
93SAHR 2012/13
As can be seen from Table 2, the NSDA recognises the importance of addressing the SDH. Some identified health determinants are linked to clear actions; e.g. providing ambulances to address unavailable transport for mothers requiring higher-level care. However, other determinants have less clear corresponding actions, such as gender power imbalances that make it difficult for women to access reproductive services. Furthermore, while intersectoral actors are identified for each output, the specific areas of collaboration and mechanisms for intersectoral action not described in the NSDA.
In light of the well-recognised gaps between policy and implementation, the next section of the chapter explores intersectoral action focusing on the SDH, and what is being done at national and provincial government levels in SA to address the SDH. Barriers that impede progress are also explored.
Action on SDH: progress and challenges
Overall, the establishment and deliberations of the National Planning Commission present an important country-level initiative to ensure integrated planning, development and implementation to “address the social determinants that affect health and disease”.32 The initiative provides a broad strategic framework to guide key choices and actions, and is explicit on the need to address the SDH. However, the section on the SDH is somewhat limited on the proposed actions, which include a comprehensive approach to early life (i.e. early childhood development) collaboration across sectors and healthy diets and physical activity.32
This section examines the discourse on SDH through the lens of the health sector. The approach taken was to analyse the 2012 budget speeches of the national Minister of Health and the provincial health Members of Executive Councils (MECs) for a focus on the
SDH, especially for SDH-related strategies. The budget speeches were selected, as these documents tend to review progress against the budget for the previous year (2011/12) and they map out key strategic priorities for the following financial year (2012/13).33-42
There are several limitations in analysing these budget speeches. First, these are political documents that tend to highlight achievements and service delivery for the money spent in the previous financial year and that justify intended actions for the new budgets allocated. For this reason, the speeches would tend to downplay challenges or non-delivery. Second, proposed actions or strategies do not always translate into actual implementation and the extent to which budget speeches accurately reflect back on previous commitments varies. Third, the analysis might be generous in attributing actions or activities to the SDH because of lack of detail or specifics in the budget speeches. For example, reference to alcohol control to deal with non-communicable diseases (NCDs) would only be an SDH issue if the control measures included addressing the upstream factors, such as restricting industry advertising.
Notwithstanding these limitations, an analysis of budget speeches provides useful insights into the complexities of practical action on the SDH (Table 3). The analysis was conducted, using an analytical framework for intersectoral governance, proposed by McQueen et al.43 The framework consists of two, overlapping domains: intersectoral governance structures, and governance actions. Governance structures include ministerial linkages, cabinet committees and secretaries, parliamentary committees, inter-departmental committees and units, joint budgeting, delegated financing, public, stakeholder and industry engagement. Governance actions include evidence support, setting goals and targets, coordination, advocacy and monitoring and evaluation. Policy guidance, financial support, providing legal mandate and implementation and management would be other governance actions.

94 SAHR 2012/13
Table 3: Extent to which SDH is reflected in ministerial budget speeches
Institution Intersectoral governance structures Governance actionNational Department of Health
• Intersectoral structures not explicitly mentioned•Parliamentarians should be called on to assist with:
addressing social structural drivers of HIV, STIs and TB; prioritising prevention; sustaining health and wellness; and ensuring protection of human rights and access to justice
•NSDA and challenges of disease burden and health system constitute core focus
• Lists new strategic plan on HIV, AIDS and TB, which expresses a 20-year vision for combating disease burden due to HIV and TB
•Provides information on the nature of NCDs and their risk factors•Alcohol control as major initiative to deal with NCD risk factors•Specific measures to improve health system effectiveness; e.g. Office
of Health Standards Compliance to improve quality of care, universal coverage through NHI in pursuit of equity and social justice
Eastern Cape
•Multi-agency working group to ensure a corruption-free department and public service
• Improved working relationship between the Department of Health (DoH) and Office of the Premier and Public Service Commission
•Engaging communities in PHC
•Highlights the links between education initiatives and provision of quality health care, and importance of preventative and promotive health
• Lists DoH’s contribution to creation of decent work and the fight against crime and corruption
•Highlights importance of water to the functionality of health facilities, especially in rural areas
•Rollout of the community-based TB model• Lists provincial efforts with NSDA outcomes
Free State •Mentions spirit of collective effort and partnerships•Establishment of Traditional Practitioner’s Health
Committee•Strengthen provincial council on AIDS and support to
district and local AIDS councils•Partnership with people living with AIDS and civil
society organisations•Partnership with private sector to train nurses
•SDH or joint action not explicitly mentioned• Lists provincial efforts with NSDA outcomes and re-iterates NSDA targets
as priorities• List achievements on HIV prevention• Implementation of school health services• Integrated school health services will focus on quintile one and two
schools in collaboration with provincial departments of education, social development and local municipalities in community settings
Gauteng •Collaboration with provincial social development and rural development departments to assist with poverty-alleviation projects
•Service level agreements with municipalities to deliver emergency medical services
•Collaboration with provincial infrastructure development and finance departments to ensure optimal support for infrastructure management
•Appointment of hospital boards and mental health review boards to ensure governance of hospitals
•Need to ensure responsiveness to community expectations
•SDH or joint action not explicitly mentioned• List provincial efforts with NSDA outcomes •Report on turn-around strategy with five pillars: strategic leadership
and desirable organisational culture; environmental controls for good governance; communication and social mobilisation; human resources management and development; and health infrastructure development and rehabilitation
•Strengthen PHC approach with increased focus on health promotion and prevention of infectious and chronic diseases
•Note that defining features of community-based services are promotion of healthy lifestyle by emphasising healthy diet, physical exercise, stopping smoking, responsible use of alcohol, and responsible sexual behaviour
KwaZulu-Natal
•Collaboration with traditional initiation schools and with the Amakhosi on HIV prevention activities and other health issues
•Establishment of support groups for people living with HIV
•Collaboration between departments of health and social development to ensure an integrated community care giver model which will assist in addressing problems faced by communities
•Close collaboration with non-governmental organisations
•Establishment of a Provincial Health Council to promote integration of services between the provincial and local spheres of government
•Engagement with and beneficiary of investment of the private sector regarding infrastructure development
•Bilateral government partnerships with Denmark and Taiwan regarding rehabilitation services
•Service level agreement with disabled people of SA – KZN to provide community-based rehabilitation services
•Partnership with local radio station and church to provide additional wheelchairs
• List provincial efforts with NSDA outcomes and re-iterate NSDA targets as priorities
•Encourage healthy lifestyles through health promotion • Launch of integrated wellness and healthy lifestyle programmes for own
employees at different levels of health system• Launch of anti-sugar-daddy awareness campaign to encourage community
leadership and stigma of older men who seek sex with young girls, particularly those between the ages of 14 and 21
•HIV prevention campaign• List the DoH’s contribution to creation of decent work•Oral health promotion outreach programmes in schools

Mainstreaming the Social Determinants of Health in South Africa 7
95SAHR 2012/13
Institution Intersectoral governance structures Governance actionLimpopo •Call on all to work together in partnership to reach
the goal of improving the health profile of all South Africans
•Engagement with and beneficiary of investment by the private sector regarding infrastructure development
•Host of the Southern African Development Community (SADC) Malaria Day
• List provincial efforts with NSDA outcomes and targets and reiterate priorities
•Highlight provincial priorities to: step up vaccinations; enhance capacity to control infectious diseases; re-introduce family planning delivery; recognise tobacco use as a health hazard; and ensure decline in deaths from coronary heart diseases and stroke
•Highlight PHC as a people-centred approach to health that makes prevention as important as cure and that tackles the root causes of ill health
•Strengthen public education efforts to encourage people to use PHC clinics •Recognise obesity; lack of exercise (physical inactivity); unhealthy diets
including excessive salt intake; tobacco use and harmful use of alcohol are serious health hazards and require ‘serious action’ if NCDs are to be prevented
•Announce public campaigns against alcohol and tobacco use, advocate for the reduction of salt intake, and promote public awareness about diet and physical activity, in support of national efforts announced by the Minister of Health
•Announce free health (screening) tests at all strategic locations in the province, including farms, taxi ranks, and shopping malls
•Encourage corporates, government departments and entities including the Limpopo Provincial Legislature to set aside at least an hour once a week for physical activity
• Initiation of health walk and aerobics sessions for staff membersMpumalanga •Establishment of hospital boards and clinic
committees•Note the need to improve the general living conditions of people •Stress that poverty not only undermines the dignity of people, but that it is
also a negative SDH• List provincial efforts with NSDA outcomes, as well as progress •Note that the key approach to management of HIV is prevention•Recognise importance of positive lifestyle including but not limited to safe
sex, avoiding smoking and excessive use of alcohol, good nutrition and exercise
•Emphasise centrality of health promotionNorthern Cape
•Mention collaboration between health and education as an intersectoral activity
• Launch of Provincial Strategic Plan for HIV, STIs and TB 2012 – 2016 with partners that include the Provincial AIDS Council, community and religious groups
•Engagement with and beneficiary of investment by the private sector regarding infrastructure development
•Note linkages between equity, social justice and health •Reiterate provincial support for NSDA outcomes, progress and importance
of NSDA targets and strategies•Recognise that focus on prevention and health promotion is essential for
tackling the burden of disease •Note the importance of dealing with the economic determinants and SDH in
order to combat TB• Indicate that PHC teams are critical in the war against poverty•Reiterate the importance of gender equality and women’s emancipation for
their health•Report on installing hot water solar systems at community health centres
as part of the effort towards energy efficiency and to reduce greenhouse emissions
North West •Engagement with and beneficiary of investment by private sector regarding infrastructure development
•Acknowledge contribution made by developmental partners, community-based organisations, traditional leaders and healers, faith-based organisations and the private sector
•Collaboration with the Department of Social Development, women, children and people with disabilities on profiling of households
•Acknowledge contribution of Home Affairs and National Prosecution Authority and academic partners to health
• List provincial efforts with NSDA outcomes and targets and reiterate priorities
•Only mention prevention and health promotion in context of NHI package of services

96 SAHR 2012/13
Institution Intersectoral governance structures Governance actionWestern Cape
• List public-private partnerships•Establishment of an independent health foundation•Establishment of six working groups on violence and
road injury prevention; healthy lifestyles; women’s health; maternal and child health; infectious diseases (HIV and TB); and mental health
•Working groups coordinated through the Provincial Transversal Management System, in support of the strategic objective of increasing wellness
•Mention various structures such as facility boards, clinic committees, health forums and district health councils for the purpose of working better together
•Budget speech framed from an economic perspective•Report on wellness summit, hosted by premier, and attended by different
stakeholders, with the aim of reducing the burden of disease•Stress the shift in focus from curing illness to one of promoting and seeking
wellness• Introduce the notion of wellness clinics focusing on healthy lifestyles, early
detection, prevention and referral for treatment and funded by the private sector
•Note that the department will focus on strengthening its advocacy role to ensure that the upstream factors are addressed by the appropriate departments and stakeholders
•Provincial progress on national health priorities• Indicate that the focus of PHC will be on the prevention of disease and the
promotion of health or wellness, in particular: maternal and child health; chronic diseases of lifestyle, including the impact of substance abuse; mental well-being; and infectious diseases such as HIV and AIDS, and TB.
• Indicate that building of future health facilities will be environment friendly and energy efficient
• Indicate support for draft provincial legislation to ensure the safety of children in transport
Notwithstanding the limitations of analysing budget speeches noted earlier, the key issues that emerge from this assessment are:
➢ institutionalisation of the NSDA (itself seen as a mechanism to encourage intersectoral action) in all provinces, with progress reported on some or all of the NSDA outcomes;
➢ recognition of the linkages between current disease burden and the SDH;
➢ existence of numerous intersectoral structures, more in some provinces than others, although the effectiveness of these is not known;
➢ emphasis on disease prevention and health promotion that include approaches targeting the SDH; and
➢ health system challenges and efforts to improve its functioning and effectiveness at reaching all segments of society in all the budget speeches.
Interviews with key informants revealed that the establishment of structures or mechanisms for intersectoral action appears to be the most visible demonstration of ‘action’ on the SDH. The ‘cluster’ system of government is operational in all provinces. These provincial social clusters include the Departments of Health, Education, and Social Development, and focus on matters pertaining to ‘all social services’. In the Western Cape the Provincial Transversal Management System (PTMS) provides a structured mechanism to mobilise role players outside of the health department to address the SDH. The PTMS has reportedly been prioritised by the Provincial Cabinet, which gives ‘political weight’ to intersectoral collaboration. The philosophy is of “thinking and acting in a united and coordinated way around a common set of objectives as a whole of society and a whole of government”. For example, the Healthy Lifestyles Workgroup includes all relevant line departments and its activities focus on schools, workplaces, and community settings. Another example is the Violence Prevention through Urban Upgrading (VPUU) project, led by the City of Cape Town, which is a holistic approach to urban upgrading that is unique in the Cape Town context in the way that it has integrated all forms of development and not only the physical upgrading. VPUU aims to reduce violent crime and improve social conditions in communities across the Cape Flats.
In Gauteng, the intersectoral AIDS programme has been in operation for more than a decade, and the stewardship is provided by the DoH. The key elements of the Gauteng provincial AIDS strategy include multisectoral partnerships, social mobilisation and communication; prevention, treatment and care; and leadership and programme organisation. The Integrated Development Planning (IDP) structures are seen as a vehicle to address the SDH, although it was pointed out that the SDH is not a regular item on the agenda of IDP structures. Other initiatives that started a few years ago include the War on Poverty Programme, coordinated by the Department of Social Development, and the Integrated Nutrition Programme coordinated by the Department of Agriculture.
In KwaZulu-Natal, the Premier is reported to have implemented a successful Sukuma Sakhe Programme (Stand up and let’s build!). Each mayor in the province is responsible for the entire integrated development of the municipality, and the various MECs have been directed to adopt a municipality, and to take a keen interest in the overall development of the entire municipality and not just the function for which the MEC is responsible. The Premier of the Free State has also established Operation Hlasela, which means ‘attack poverty in all its manifestations’.
At face value, these developments look impressive, and the language of SDH has found its way into government structures and action plans. But what are the barriers to intersectoral action to address the SDH? These are shown in Table 4 and are based on interviews with key informants.

Mainstreaming the Social Determinants of Health in South Africa 7
97SAHR 2012/13
Table 4: Reported barriers to intersectoral action and addressing the SDH
Constraint/ barrier Brief descriptionLegislation or policy design •The amended National Health Act does not address SDH, making it difficult for the various budget
programmes to deal with it. Health inequities are highlighted in all strategic plans, but precise action or interventions to address health inequities has never been an explicit focus of government’s health policy agenda
•The NSDA, strategic plans and the annual performance plans and indicators highlight the SDH, but there is limited guidance on how the SDH can be addressed in an integrated manner
•Unrealistic expectations of community health workers to identify health problems early on and prevent diseases when many of the problems stem from the difficult structural issues of unemployment, poverty, and income disparities that the health sector cannot address directly
Governance and leadership •Weak governance in government institutions•General lack of political champions of SDH• Lack of accountability and sub-optimal performance management•Silo planning and implementation of separate government, private sector- and non-governmental
organisations action hinder an integrated approach to addressing SDH• Lack of community involvement and lack of awareness on SDH•Poor or lack of functioning of existing governance structures (e.g. clinic committees, hospital boards) that
could be mobilised to address SDHGap between policy and implementation
•Although health policy is geared towards PHC, historically the bulk of spending was on curative, highly specialised tertiary care
•Prevention actions remain largely focused on individual awareness raising or behaviour change; e.g. HIV counselling and testing versus SDH
•Disjointed or lack of integrated implementation in some instances that minimises potential impact Lack of or insufficient resources and resourcing
•Mis-management of existing government resources• Lack of integrated budgeting, and separate budget votes for each line department • Lack of additional resources (staff and money) for integrated activities•Time required to attend all the meetings of intersectoral committees or work groups
Lack of monitoring and evaluation •Absence of updated/current and credible baseline demographic information to inform decision making• Lack of clear indicators on SDH
A perspective that did not emerge in the interviews or the budget speeches is the role of structural drivers of health outcomes or inequities, such as global trade agreements, or broader income or educational inequities. However, this is probably the result of the limited number of key informants interviewed, who are all working in government. Nonetheless, the experience in other countries as well as SA has shown the importance of addressing such factors. In the next section lessons to move towards concrete action to address the SDH are presented.
Moving towards concrete action to address the SDH
SA and other countries show successful intersectoral action to address the SDH. The budget speeches reveal promising examples, which may provide examples of best practice in years to come.
The country’s more recent approach to dealing with the HIV epidemic provides a good example of intersectoral action to overcome the challenges of a catastrophic HIV epidemic. This approach includes good government leadership and stewardship; establishment of intersectoral structures and action that unite different stakeholders towards a common purpose; increasing resource allocation to combat the epidemic; capacity building within and outside government; addressing structural drivers (e.g. tackling the pharmaceutical industry to reduce the price of antiretroviral medicines); confronting harmful social norms and individual behaviours (e.g. promoting condom use); and genuine community participation and involvement of people living with HIV. The results are evident from a stabilising epidemic, increasing life expectancy, a vast reduction in mother-to-child-transmission of HIV and a reduction in stigma and discrimination.44
Another South African example is legislation to reduce tobacco use that makes the healthy choice the easier choice. Tobacco use is a risk factor for six of the eight leading causes of death and is the leading preventable cause of death in the world. The most effective intervention against tobacco use is a combination of tobacco taxation, bans of tobacco sales to teenagers, comprehensive bans on advertising and dissemination of health information on the dangers of smoking, all contained in South African legislation. A 26% drop in tobacco consumption between 1993 and 2002 has been attributed to this legislative action and a sharp increase in excise taxes.45 The government decision to address the policy environment instead of individual behaviour to abstain from or reduce smoking illustrates an SDH approach that recognises the role of structural drivers (e.g. the tobacco industry) in promoting harmful products and individual behaviours.
SA is taking action to address population health through public health policy is that of the recently gazetted draft regulations46 that address the salt content of processed food, including bread. Drawing on epidemiological evidence that hypertension in SA was increasing, in part due to high salt intake, bread was identified as one of the most significant sources of non-discretionary salt intake.46 Economic modelling demonstrated the health impact of reducing salt content at the point of manufacture.47 Importantly, early engagement with the food industry enabled identification of salt reduction that could be achieved without significantly affecting the taste of the food products, thus reducing industry opposition. As a result, the legislation is expected to reduce salt levels at the stage of production with consequent reductions in the proportion of individuals developing hypertension in the population. Like SA’s tobacco control legislation, this strategy makes the healthy choice the easier choice without sole reliance on changing individuals’ eating habits which would be much harder to achieve.

98 SAHR 2012/13
SA can also learn from successful intersectoral action in other low- and middle-income countries (LMIC). The City without Slums Arusha initiative in Tanzania introduced a community development committee mechanism that allowed community-led prioritisation of environmental issues that could be addressed internally, and identification of those issues that required external interventions. By allowing community members a seat on governance councils, accountability to Arusha’s slum dwellers was improved and key infrastructure and sanitation measures were introduced that involved the participation of both local and external actors.1 In Uganda, the Katine Community Partnerships Project (KCCP) was a partnership between the Guardian Newspaper in the United Kingdom, Barclays Bank, the African Medical and Research Foundation and local government in the Soroti district in Northern Uganda.48 The overall goal of the five-year KCPP, which commenced in October 2007, was to improve the well-being and quality of life of people living in Katine through an integrated and community-based development approach to address the underlying SDH. The project consisted of five interlocking components designed to increase access to: improved community health; quality education delivered in improved schools; safe water and sanitation within easy reach of homesteads; modern farming methods and new income-generating opportunities; and community empowerment to increase engagement in local governance to achieve sustainability. The project achieved significant results in the five-year period, including a 29% increase in primary school enrolment, with the enrolment in the number of girls exceeding that of boys for the first time in 2009 and 2010; increased immunisation rates and antenatal attendance; increased coverage with safe water and sanitation; and increased income generation of communities. A by-product has been the increased economic independence of women, resulting from their access to increased income and sustainable livelihood activities.48
In Thailand, the Thai Health Promotion Foundation (ThaiHealth) was established in 2001 as a statutory, independent public organisation.49 Funding comes from a 2% excise tax on alcohol and cigarettes. ThaiHealth has played a leading role in the movement against tobacco use, with proceeds from the tax also being used to fund campaigns to prevent drunken driving and to reduce alcohol consumption and activities to promote physical activity.50
While the experience of countries with developed economies is very different to that of LMICs, it is nonetheless useful to examine selected examples. In North Karelia in Finland, a comprehensive community-based prevention programme was implemented in 1972 in response to the exceptionally high coronary heart disease mortality rates in the area. The experience over a 25-year period has shown that epidemiological information on prevalence and risk factors combined with carefully planned community-based programmes, re-orientation of health and other social services, school-based programmes, innovative media campaigns and intersectoral action to address modifiable risk factors were critical in achieving the reduction in chronic disease mortality and its risks.50 Communities were integrally involved and stakeholders included local and national authorities, and various ‘experts’.50,51 These initiatives have been supported by public health legislation and a comprehensive monitoring and evaluation system was part of the programme.50,51
In British Columbia in Canada, the ActNow BC is a cross-government health-promotion initiative that aims to improve the health of British Columbians by taking steps to address common risk factors and reduce chronic disease, in light of research that found that inactivity, poor nutrition, overweight and obesity, tobacco use and unhealthy choices in pregnancy were the key risk factors contributing to the main chronic disease categories in the area.52 ActNow BC is led by the Ministry of Health and involves all provincial ministries as well as key external partners. The programme supports schools, employers, local governments and communities to develop and promote programmes that make healthy choices the easy choices for all British Columbians. For example, the Community Food Action Initiatives support the development and implementation of community food security plans and activities that improve access to safe, culturally acceptable, nutritionally adequate diets through a sustainable food system. As part of ActNow BC, the Union of BC Municipalities is also leading initiatives to support communities in developing healthy public policies and to encourage public leaders to talk about healthy planning in their communities.52
The key factors for successful intersectoral action that emerge from this analysis are highlighted in Box 1 below.
Box 1: Ingredients for successful intersectoral action to address the SDH
❖ Legislation and/or policy design and structural interventions to address more underlying determinants (e.g. power imbalances, trade agreements)
❖ High-level political stewardship and leadership, combined with awareness among and support from civil servants responsible for implementation
❖ Diverse strategies and mechanisms to foster collaboration in government
❖ Dedicated financial and human resources
❖ Strong partnerships with civil society organisations, including involvement of affected or relevant communities in intersectoral activities
❖ Good epidemiological information and clear indicators that could be used to monitor disease trends and progress on SDH over a period of time
❖ Balancing planning and action on the ground
❖ Comprehensive community-based prevention programmes
❖ Innovative media campaigns targeting all sectors of society
❖ Monitoring and evaluation of the SDH

Mainstreaming the Social Determinants of Health in South Africa 7
99SAHR 2012/13
Conclusion
In this chapter, we have set out to review whether mainstreaming of the SDH in SA is merely rhetoric or whether there has been significant action to address the SDH. The approach was a rapid review, combining limited key informant interviews with an analysis of the NSDA and budget speeches. An alternative approach for future appraisals may be to review provincial planning processes and annual reports to analyse action. Similarly, reviewing budget speeches of non-health sector MECs (e.g. transport, environment) could give insight into the extent to which health is mainstreamed into other sectors where the SDH are prominent. Indeed, there are a number of tools and indices, some validated, which could be used to track SA’s progress on addressing the SDH.53 These include checklists and tools for the assessment of health equity impact, gender analysis, support structures and decision making, intersectoral action and policy analysis.53
Notwithstanding the limitations of our rapid review, we have found that there is encouraging rhetoric on SDH, with the NSDA recognising the importance of addressing the SDH. In addition to the national minister’s budget speech, all the provincial budget speeches have articulated the importance of SDH, and have listed structural mechanisms, ranging from more narrow bilateral departmental arrangements (e.g. between health and social development) to an overall philosophical approach of integrated planning and a ‘whole of society’ wellness approach found in some provinces. However, it is not possible to comment on the functioning of these structures or their effectiveness in achieving the desired health impact. There does not appear to be any prioritisation of the many intersectoral initiatives, thus raising doubt as to the ability and capacity of government as a whole, and the health sector in particular, to make measureable progress. Interviews with key informants revealed numerous constraints, including problems of policy design, governance and leadership of SDH, gaps between policy and implementation, insufficient resources, and a lack of monitoring and evaluation.
The global movement on SDH and developments within SA create an enabling environment for more concrete action. There is a great deal that can be learned from the experience both from within SA and from other countries that will move beyond rhetoric. Specifically, this reality must include the following activities: good epidemiological information and clear indicators that can be used to monitor disease trends and progress on SDH over a period of time; comprehensive community-based prevention programmes that address SDH; involvement of communities and various stakeholders in intersectoral activities; legislative and structural interventions; innovative media campaigns, and monitoring and evaluation of SDH.
More research evidence is needed both on the SDH and to support action to address them. While recommending a comprehensive research agenda goes beyond the scope of this chapter, possible research areas include: the impact of structural determinants on population health outcomes; demonstrating the links between the SDH and health inequalities; how strong public service systems contribute positively to universal access to health care and education; how participation of civil society in local and national planning,
budget and implementation processes contribute to improved service delivery; and how monitoring and evaluation of key SDH indicators enhance accountability to users and communities.
Finally, a more critical SDH discourse that interrogates and addresses the structural determinants of health inequities as well as the unequal power relationships that exacerbate such inequities is needed.

100 SAHR 2012/13
References
1 Commission on Social Determinants of Health. Closing the gap in a health generation: Health equity through the social determinants of health. Geneva: World Health Organization; 2008.
2 World Health Organization. The World Health Report 2008: Primary health care, now more than ever. Geneva: World Health Organization; 2008.
3 World Health Organization. Rio Political Declaration on Social Determinants of Health, World Conference on Social Determinants of Health, Rio de Janeiro, Brazil, 21 October 2011.
4 World Health Organization. Social determinants of health: outcome of the World Conference on Social Determinants of Health. Report by the Secretariat, 65th World Health Assembly A65/16, Provisional agenda item 13.6. Geneva: World Health Organization; 2012.
5 The Republic of South Africa. A nation in the making: a discussion document on macro-social trends in South Africa. Pretoria: The Presidency; Undated.
6 United Nations Development Programme. Human Development Report 2011. Sustainability and equity: A better future for all. New York: Palgrave Macmillan; 2011.
7 Coovadia H, Jewkes R, Barron P, Sanders D, McIntyre D. The health and health system of South Africa: Historical roots of current public health challenges. The Lancet 2009;374(9692):817-34.
8 Bhorat H, van der Westhuizen C, Jacobs T. Income and non-income inequality in post-apartheid South Africa: What are the drivers and possible policy interventions? Cape Town: Development Policy Research Unit; 2009.
9 Barron P, Roma-Reardon J, editors. South African Health Review 2008. Durban: Health Systems Trust; 2008.
10 Chopra M, Daviaud E, Pattinson R, Fonn S, Lawn JE. Saving the lives of South Africa’s mothers, babies, and children: can the health system deliver? The Lancet 2009;374(9692):835-46.
11 Fonn S, Padarath A, editors. South African Health Review 2010. Durban: Health Systems Trust; 2010.
12 Harrison D. An overview of health and health care in South Africa, 1994 – 2010. Priorities, progress and prospects for new gains. A discussion document commissioned by Henry J Kaiser Family Foundation to help inform the National Health Leaders Retreat Muldersdrift January 24 - 26, 2010. Johannesburg: Unpublished document; 2009.
13 Padarath A, English R, editors. South African Health Review 2011. Durban: Health Systems Trust; 2011.
14 Rispel L, Moorman J. Analysing health legislation and policy in South Africa: Context, process and progress. In: Fonn S, Padarath A, editors. South African Health Review 2010. Durban: Health Systems Trust; 2010.
15 Rispel L, Setswe G. Stewardship: Protecting the public’s health In: Harrison S, Bhana R, Ntuli A, editors. South African Health Review 2007. Durban: Health Systems Trust; 2007.
16 Rispel LC, Barron P. Can disease control priorities improve health systems performance in South Africa? S Afr Med J 2010;100(12):801-6.
17 Van Rensburg HCJ, editor. Health and health care in South Africa. Pretoria: Van Schaik; 2012.
18 Centre for Development and Enterprise. Reforming health care in South Africa: What role for the private sector? Johannesburg: Centre for Development and Enterprise; 2011.
19 Integrated Support Team. Consolidated report of the Integrated Support Team: Review of health over-spending and macro-assessment of the public health system in South Africa. Pretoria: National Department of Health; 2009.
20 National Department of Health. Negotiated Service Delivery Agreement. A long and healthy life for all South Africans Pretoria: National Department of Health; 2010.
21 National Department of Health. National Department of Health Strategic Plan 2010/11-2012/13. Pretoria: Department of Health; 2010.
22 National Department of Health. Re-engineering primary health care in South Africa: Discussion document. Pretoria: National Department of Health; 2010.
23 Minister of Health. National Health Insurance in South Africa Policy Paper. Government Notice 657. Government Gazette No. 34523, 12 August 2011.
24 National Department of Health. Human resources for health South Africa. HRH strategy for the health sector: 2012/13-2016/17. Pretoria: National Department of Health; 2011
25 Lawn JE, Rohde J, Rifkin S, Were M, Paul VK, Chopra M. Alma-Ata 30 years on: Revolutionary, relevant and time to revitalise. The Lancet 2008;372(9642):917-27.
26 World Health Organization. Alma-Ata 1978: Primary Health Care. Geneva: World Health Organization; 1978.
27 World Health Organization. Ottawa Charter for Health Promotion. First International Conference on Health Promotion. Ottawa: World Health Organization: 1986
28 United Nations. The Millennium Development Goals Report 2011. New York: United Nations, Inter-Agency and Expert Group on MDG Indicators; 2011.
29 World Health Assembly. Reducing health inequities through action on the social determinants of health. 62nd World Health Assembly 22 May 2009.
30 People’s Health Movement. Third Peoples’ Health Assembly: Cape Town Call to Action. Cape Town: People’s Health Movement; 2012.
31 Rohde J, Cousens S, Chopra M, Tangcharoensathien V, Black R, Bhutta ZA, et al. 30 years after Alma-Ata: Has primary health care worked in countries? The Lancet 2008;372(9642):950-61.
32 National Planning Commission. National Development Plan: Vision 2030. Pretoria: National Planning Commission; 2011.
33 Motsoaledi A. Department of Health Budget Vote Speech 2012/13 by Minister of Health at: National Assembly; 24 April 2012; Cape Town, Western Cape.
34 Botha A. Western Cape Health Budget Speech 2012 by WC Member of Executive Council of Health at: Western Cape Provincial Legislature; 26 March 2012; Cape Town, Western Cape.
35 Dhlomo S. Budget Presentation by KZN Health Member of Executive Council for Health at: KwaZulu-Natal Provincial Legislature; 07 June 2012; Pietermaritzburg KwaZulu- Natal.
36 Gqobana S. Budget and Policy Speech by EC Member of Executive Council of Health at: Eastern Cape Provincial Legislature; 20 March 2012; Bisho , Eastern Cape.
37 Mabasa N. Budget Speech for the Department of Health 2012/13 by Limpopo Health Member of Executive Council for Health at: Limpopo Provincial Legislature; 23 March 2013; Lebowakgomo, Limpopo.

Mainstreaming the Social Determinants of Health in South Africa 7
101SAHR 2012/13
38 Mahlangu D. Mpumalanga Deparment of Health Policy and Budget Speech for 2010/11 by Member of Executive Council for Health DG Mahlangu at: Mpumalanga Provincial Legislature; 11 May 2012; Nelspruit, Mpumalanga.
39 Masike M. Departmental Budget Vote and Policy Speech for Financial Year 2012/2013 by Member of Executive Council for Health at: North West Provincial Legislature; 16 May 2012; Mmabatho, North West Province.
40 Mekgwe N. 2012/13 Health Budget Vote by Member of Executive Council for Health at: Gauteng Provincial Legislature; 01 June 2012; Johannesburg, Gauteng.
41 Ngubentombi F. Budget Vote Speech (Vote 5) of the Free State Department of Health by Member of Executive Council for Health at: Jacob Zuma Community Hall; 20 March 2012; Fauresmith, Free State.
42 Sokatsha MS. Northern Cape Department of Health Budget Vote Speech by Member of Executive Council for Health at: Northern Cape Legislature; 17 May 2012; Kimberley, Northern Cape.
43 McQueen DV, Wismar M, Lin V, Jones CJ, Davies M, editors. Intersectoral governance for health in all policies: Structures, actions and experiences. Denmark: World Health Organization, on behalf of European Observatory on Health Systems and Policies; 2012.
44 National Department of Health. National Strategic Plan on HIV, STIs and TB, 2012-2016. Pretoria: National Department of Health; 2011.
45 van Walbeek C. Recent trends in smoking prevalence in South Africa: Some evidence from AMPS data. S Afr Med J 2002;92(6):467-72.
46 Minister of Health. Regulations relating to the reduction of sodium in certain foodstuffs and related matters. Government Notice R. 533, Government Gazette No. 35509, 11 July 2012.
47 Bertram M, Steyn K, Wentzel-Viljoen E, Tollman S, Hofman K. Reducing the sodium content of high-salt foods: Effect on cardiovascular disease in South Africa. S Afr Med J 2012;102(9):743-5.
48 Evaluation of the Katine Community Partnerships Project (KCCP), October 2007 — September 2011. Nairobi: AMREF; 2011.
49 World Health Organization. 2008-2013: Action plan for the global strategy for the prevention and control of non-communicable diseases. Geneva: World Health Organization; 2008.
50 Puska P. Successful prevention of non-communicable diseases: 25 years experiences with North Karelia Project in Finland. Public Health Medicine 2002;4(1):5-7.
51 Pekka P, Pirjo PUU. Influencing public nutrition for non-communicable disease prevention: from community intervention to national programme– experiences from Finland. Public Health Nutrition 2002;5(1A):245–51.
52 Geneau R, Fraser R, Legowski B, Stachenko S. Mobilizing intersectoral action to promote health: The case of ActNowBC, in British Columbia. Ottawa: Public Health Agency of Canada, WHO Collaborating Centre on Chronic, Non-Communicable Disease policy; 2009.
53 Mendell A, Dyck L, Ndumbe-Eyoh S, Morrison V. Tools and approaches for assessing public health action on the social determinants of health and health equity: Comparative tables. Quebec City: National Collaborating Determinants of Health and National Collaborating Centre for Healthy Public Policy; 2012.

102 SAHR 2012/13

Authors:
103SAHR 2012/13
888888888888
Joanne Corrigalli
Richard Matzopoulosi,ii
i School of Public Health and Family Medicine, University of Cape Townii Burden of Disease Research Unit, Medical Research Council
Violence, Alcohol Misuse and Mental Health: Gaps in the health system’s response
Access to mental health and substance misuse
services in South Africa is low, with evidence
suggesting extremely poor rates of detection and a major gap between
demand for and supply of treatment services.
Violence, alcohol misuse and mental disorders are inextricably linked and are leading contributors to the burden of disease in South Africa, each in their own right but particularly where they overlap to produce a perpetuating
cycle of harmful outcomes. South African homicide rates are estimated at more than eight times the global average among males and five times the global average among females. Similarly, South African drinkers rank in the top five riskiest drinkers in the world, with approximately 33% to 40% of drinkers consuming alcohol at risky levels. The South African Stress and Health Survey estimates the lifetime prevalence of mental illness amongst adults to be at 30.3%. This chapter outlines the evidence linking alcohol misuse, mental illness and violence. Access to mental health and substance misuse services in South Africa is low, with evidence suggesting extremely poor rates of detection and a major gap between demand for and supply of treatment services, particularly for substance misuse. Surveillance data, which is necessary to inform and monitor outcomes of relevant evidence-based policies and interventions, is sorely lacking for mental illness and substance abuse. In terms of violence, only mortality data are available, which will likely underestimate violence against women and also carry a significant time lag. Owing to the intersectoral nature of many of the risk factors for violence, alcohol abuse and common mental disorders, many of the related policies, legislation and interventions rely on government departments other than health. This gives rise to numerous opportunities but also to many challenges, which impact on policy development and service delivery.

104 SAHR 2012/13
Introduction
Violence, alcohol misuse and mental disorders are inextricably linked and pose a major public health challenge in South Africa (SA), each in their own right but particularly where they overlap to produce a perpetuating cycle of harmful outcomes. These outcomes not only affect health but also create a wide range of socio-economic ills.
Interpersonal violence was ranked second among the leading causes of death and disability in SA in 2000 and accounted for 6.5% of all disability adjusted life years (DALYs).1 Age-standardised homicide rates, estimated by Norman et al. in 2007, placed SA among the most violent countries in the world, and the chances of dying violently in South Africa were some 30% higher than in the World Health Organization’s (WHO) AFROa region,2 where intentional deaths are more often the result of war and conflict than interpersonal violence.3 Globally, South African homicide rates were estimated at more than eight times the global average among males and five times the global average among females.2 The excess burden of male mortality in SA was confirmed by data from the National Injury Mortality Surveillance System (NIMSS), which collects data on injury deaths mainly from urban mortuaries. The data showed that there are more than six male homicides for every female homicide.4
Violence is common within the domestic environment and in the community. A nationally representative sample of female homicides in 1999 revealed that approximately half of all women murdered were killed by an intimate partner. At 8.8 per 100 000 population the national intimate partner homicide rate was the highest recorded in the world.5 Domestic violence also has direct effects on children, with one local study suggesting a high proportion of cases in which young children were injured unintentionally during parental domestic violence.6 Homicide rates among children in SA aged 0 to 14 years were double the global average in 2000.2
Apart from being at risk of abuse or being the victims of violence in the home, South African children are frequently exposed to violence to others in the home and to high levels of community violence.7 For example, in the Lavender Hill and Steenberg areas in Cape Town, over 70% of a sample of primary school children reported having witnessed violence8 and another cross-sectional study in Gauteng revealed that more than 50% of children had experienced violence, either as victims or as perpetrators.9 A study of youth from Khayelitsha in Cape Town, of whom half were selected from a children’s home and half from an informal settlement known for high levels of violence, recorded all of the 60 respondents as having witnessed community violence. Of these, 56% had been victims and 45% had witnessed at least one murder. The psychological impact of these experiences manifested in 22% of these children meeting the diagnosis for post-traumatic stress disorder (PTSD), 32% for dysthymia and 7% for major depression.10
Mental health disorders, both trauma- and non-trauma related, are also a leading contributor to SA’s burden of disease, yet remain largely unseen, as these disorders are not generally reflected in mortality data but result in a major disease burden and load on health facilities. The South African Stress and Health Survey (SASH) conducted between 2002 and 2004 is a nationally representative
a The WHO’s African Regional Office (AFRO) represents countries in sub-Saharan Africa.
household survey, which estimates the prevalence of mental illness amongst adults. The results show a 30.3% lifetime prevalence of any psychiatric disorder.11 Aside from these data, there is currently no other source of reliable data on the prevalence of mental disorders in SA.12
Mental illness results in significantly greater disability than most physical illness and as such accounts for a large proportion of the burden of disease. According to the WHO, 5 of the 10 leading causes of disability, moreover, are classifiable as psychiatric conditions (including depression and alcohol abuse).12 In terms of future trends, global projections indicate that the situation will worsen, with depression predicted to be the second leading cause of disability worldwide in 2020.13 The impact of mental health will be grossly underestimated, however, if one excludes the role it plays in physical illness. Mental disorders are associated with substance abuse, smoking, and unsafe sex and, as such, mental illness results in a higher risk for injuries, cardiovascular disorders, and HIV.14
The mental health burden is compounded by the burgeoning abuse of substances, in particular alcohol, which is the most widespread drug of abuse in SA.15 Alcohol abuse is an important risk factor for violence and other mental health problems, as well as a large number of other health conditions. South African drinkers rank in the top five riskiest drinkers in the world, with approximately 33%16 to 40%17 of drinkers consuming alcohol at risky levels.b Alcohol was found to be the third largest contributing risk factor to death and disability in SA, after unsafe sexual practices and interpersonal violence, both of which are strongly linked with alcohol abuse.18 Alcohol affects both the consumer and the non-consumer and, as such, SA is also a global leader in terms of alcohol-related harms, with eight times the global average for male homicides and twice the global average for road injury deaths.2 Alcohol use also imposes sizeable economic costs, which have been estimated at approximately R220 billion per annum.19
Substantial data are available on the mechanisms through which alcohol abuse affects drinkers and non-drinkers. Recent analysis on the burden of alcohol-related harm found that intentional injuries (interpersonal violence and suicide) were the leading alcohol-related harm (25% of all harms) as shown in Figure 1. Infectious diseases also feature prominently, with tuberculosis (TB) (19%) and HIV and AIDS (13%) being the largest contributors to this domain. Non-communicable diseases accounted for the remaining alcohol-attributable DALYs, with neuropsychiatric disorders (alcohol use disorders, epilepsy and common mental illnesses) being the single largest component (12%).20
b Defined as having had at least 60 grams or more of pure alcohol on at least one occasion weekly.

Violence, Alcohol Misuse and Mental Health: Gaps in the health system’s response 8
SAHR 2012/13 105
Cardiovasculardisorders
7%
Cancer4%
Liver Cirrhosis2%
Neuropsychiatricdisorders
12%
HIV/AIDS13%
Unintentional injuries
16%
Tuberculosis19%
Intentional injuries
25%
Lower respiratorytract infections
2%Maternal and
perinatal conditions0%
Figure 1: Estimated alcohol-attributable DALYs, South Africa, 2004
Source: Obot, 2006.21
To reduce alcohol abuse and its harms significantly it is critical for anti-abuse projects to target the major harms caused by alcohol in SA, with prevention of violence, HIV and AIDS, TB, mental illness (including alcohol abuse itself) and road injuries – particularly pedestrian road injuries – taking priority.
Interrelationship between alcohol abuse, violence and mental ill-health
The interrelatedness of violence, mental health and alcohol use is well documented.
Alcohol misuse and mental health
Alcohol misuse affects mental health in two ways. First, alcohol- and other drug use affect mental health via the following biological mechanisms:
➢ The use of addictive substances may lead to dependence, and this in itself is a mental health outcome.21
➢ The drug has a direct action on the body – for instance, alcohol is a central nervous system depressant, which may contribute to the development of depression.22
Secondly, alcohol misuse has a range of health, legal and social outcomes, including contributions to interpersonal violence, death and injury in road traffic accidents, increased levels of risky sexual behaviour, and relationship problems that may also negatively affect mental health.21 In addition, alcohol misuse may worsen the prognosis for existing mental health disorders.23
Studies indicate a bi-directional association between substance misuse and mental illness. A large population-based study in Australia found that 0.5% of the Australian population had both PTSD and a substance use disorder; among those with PTSD, alcohol use disorders were most common (24.1%).24 Large studies in the United States (US) population indicate that, with regard to
alcohol abuse (not dependence, which is a more severe problem), 12.3% of those who met criteria for alcohol abuse also met criteria for a mood disorder, and 29.1% for an anxiety disorder (of which PTSD was the most common).22 Percentages were much higher with regard to alcohol dependence: 29.2% had a comorbidc mood disorder and 36.9% a comorbid anxiety disorder.22 Alcohol use disorders also often precede the onset of a depressive disorder, particularly in men.22 Substance use during pregnancy and during infancy is another risk factor for increasing the burden of disease, as prenatal substance exposure can lead to a range of mental health problems in the infant.25
Similar relationships between alcohol and mental disease hold in the local context. The 2004 SASH study of 12-month and lifetime prevalence of mental health disorders found alcohol abuse to be the most prevalent individual lifetime disorder, affecting 11.4% of adult South Africans, with alcohol dependence affecting 2.6%. The comparative figures for other substances of abuse were 3.9% and 0.6% respectively.15 In a recent study of psychopathology and substance use among high school students in Cape Town, significant associations were found between alcohol use and both PTSD and depression.26
The prominent contribution of alcohol to mental illness in SA is reflected in the disease burden, with estimated alcohol-attributable fractions for neuropsychiatric disorders ranging from 11%20 to 44%.27
Alcohol misuse as a risk factor for violence
With regard to violence, alcohol is an important situational risk factor that can precipitate violence and is associated with all forms of interpersonal violence, as well as suicide.28 Three meta-analyses of the association between alcohol use and interpersonal violence described by Parry and Dewing in 2006 attribute between 27%
c In other words, a mood disorder as well as the pre-existing alcohol dependence condition.

106 SAHR 2012/13
and 47% of intentional injuries directly to the use of alcohol.29-32 In SA, where per capita consumption among the drinking population is high and binge drinking is rife, particularly among the victims and perpetrators of violence, the contribution of alcohol may be even greater. The South Africa Demographic and Health Survey data suggest that alcohol use significantly increases the risk of being exposed to violence.33 A study of patients presenting to trauma units in Cape Town, Durban and Port Elizabeth found that, on average, more than half of patients presenting for injuries caused by violence tested positive for alcohol use.34 The same pattern presents among violence-related fatalities. According to a sentinel study of primarily urban mortuaries across SA, more than half of the victims of fatal violence were alcohol positive and 86 were males.4
As well as increasing vulnerability, alcohol has been shown to precipitate aggressive behaviour.35 Several studies have found a link between alcohol dependence and child abuse,36,37 and excessive drinking by men is significantly associated with partner violence across different settings.38 Women who live with heavy drinkers have a far greater risk of physical abuse from their partners.39,40 Although there continues to be some debate about whether there is direct causality between alcohol consumption and violence, evidence regarding this association is consistently found after taking into account other associated factors.41-43 In reviewing this evidence, Rehm et al. in 2003 concluded that there is evidence of a causal link between alcohol consumption and interpersonal violence.44 Some of the confusion may arise from the fact that alcohol has vastly different effects on individuals with different character traits. For example, people with high levels of trait aggression are exponentially more prone to violent behaviour after consuming alcohol than those with low trait aggression.45,46 In SA, a study of three provinces found that conflict over the male partner’s drinking was also a risk factor for intimate partner violence, and more important than his drinking.47 A 2006 study by Abrahams et al. also found that men who use violence against an intimate partner were more likely to report problematic alcohol use.48 Reasons for why men who are drunk beat their partners are complex, and it has been suggested that some men use alcohol to gain the courage to beat their partners when inebriated, as this may be socially expected of them.47 Alcohol is also implicated in the precipitation of and participation in violence and crime.49
Violence as a risk factor for alcohol misuse and mental illness
A considerable body of global evidence associates experiences of violence or abuse with the development of mental health problems, and several studies from SA demonstrate similar findings.50 Such violence might include partner violence, child abuse, or interpersonal violence more generally, and all are associated with disorders that include depression, suicidal tendencies, substance abuse, PTSD and other anxiety disorders.44,51-62
Although causality is difficult to establish because of the ethical issues in conducting longitudinal studies and experimental studies (including randomised controlled trials) in this area, a consideration of the evidence using Bradford Hill criteriad supports a causal relationship:51,63,64
d The Bradford Hill criteria are a set of nine factors that are used to provide evidence of causality. These are: strength of association; temporality; consistency; theoretical plausibility; coherence; specificity in the causes; dose response relationships; experimental evidence; and analogy.
➢ Prevalence rates are higher among women experiencing domestic violence than among the general population (biological gradient).
➢ Exposure to violence and PTSD symptoms appear to follow a dose-response relationship; i.e. the greater the exposure, the more and/or the more severe the symptoms (biological gradient).
➢ Odds ratios calculated in studies where comparison groups are used are high, ranging from 3.55 to 3.80 in studies of depression, suicidality and PTSD, and from 5.56 to 5.62 in studies of substance misuse (strength of association).
➢ The magnitude of associations is consistently observed across different populations (consistency and coherence).
➢ Depression tends to remit once domestic violence ceases (temporality).
South African studies are mostly cross-sectional, but demonstrate both high rates of exposure to a range of violence and the same associated mental health problems as identified above in diverse population groups.65-78 Children’s Court Inquiry data from the Western Cape suggest that in 2005 at least 9% of children in the Western Cape experienced severe maltreatment.79 This can perpetuate a cycle of violence, alcohol abuse and mental health problems, as exposure to intimate partner violence as a child contributes to violent behaviour in adults.80
A recent study in a Cape Town day hospital showed that 94% of participants had experienced at least one traumatic event in their lifetimes, and that 19.9% had current PTSD, with depression, panic-disorder and somatisation disorder with frequent co-morbidities. While many people are resilient in their exposure to traumatic incidents,such exposure can result in high rates of PTSD, depression, anxiety, substance misuse, and somatic symptoms.81 Although at present no studies exist within the healthcare services to suggest rates of PTSD among children, representative studies of children’s exposure to violence in Cape Town suggest that children show similarly high rates of PTSD to those of adults.74,82
Violence may also impact on common mental disorders, including substance misuse, through two other mechanisms: social disorganisation and fear of crime. High levels of crime and violence in a community are an indicator of social disorganisation, which refers to a disruption in the social structure of a community so that its ability to realise common values and exert social control over members is weakened.83,84 Most of the evidence in this area is from high-income countries and is based on cross-sectional studies, but it amounts to a weight of evidence which suggests that neighbourhood social disorganisation plays a role in parenting, mental health and violence. For instance, neighbourhood social cohesion (the opposite of social disorganisation) has been found to buffer the link between hostile parenting and children’s externalising problems, including violence.85 Mothers’ perceptions of poor neighbourhood quality have been found to be related to children’s social skills and often mediate through greater supervision and limitation of activities in worse neighbourhoods.86 Mothers in unsafe neighbourhoods have also been found to be more likely to be depressed and to use inconsistent discipline.87 Communities high in social disorganisation are also likely to be high in child maltreatment.88,89 Poverty is not the deciding factor: qualitative data from the US suggest that social

Violence, Alcohol Misuse and Mental Health: Gaps in the health system’s response 8
SAHR 2012/13 107
disorganisation can be separated from poverty and that it is social disorganisation that affects parenting.90
Very little evidence from SA is available in this area. However, a longitudinal study of a birth cohort of South African children in 1999 investigated the effects of both personal experience of violence and the experience of living with high levels of community violence. Maternal distress was associated both with family violence and with community danger, and distressed mothers were more likely to have distressed children. Ambient community violence was associated with children having attention problems, aggression and symptoms of anxiety and depression. Findings were similar regardless of economic advantage or disadvantage.65
A body of evidence also exists for the association between fear of crime and the prevalence of common mental disorders91-93 (positive association) and self-rated health93 (negative association) but most of these data are taken from cross-sectional studies and, while confounders were adequately adjusted for, it is impossible to establish temporality. It seems reasonable to postulate a bidirectional association between mental illness and fear of crime.92 The effect of fear of crime on mental illness is thought to occur via two mechanisms: first, the negative impact on affect and, second, by creating “time-space inequality”, which refers to a restriction of movement in terms of time (e.g. not going out after dark) and/or space (avoiding certain areas). This restriction limits social engagement, participation and access to social support.92
Gaps in health services
Given the strong interdependence of mental illness, alcohol abuse and violence, provision of mental health services for children and adults is a critical part of primary-, secondary- and tertiary prevention of both alcohol misuse and violence. Access to mental health services in SA is low, with inpatient staff/bed ratios for SA’s nine provinces ranging from 0.20 to 0.59, much lower than in high-income countries.94 Rates of detection for mental health disorders are poor. For example, Carey et al. found that despite high rates of psychopathology detected by researchers, primary care clinicians had not identified any of the traumatic events or psychopathology present in an urban, Xhosa-speaking primary care population in Cape Town.95 This is particularly concerning, as primary care is the most likely route patients will use to access the mental health system. Other problems in the health system include: a lack of implementation of policies and programmes for decentralisation and integration of services into general health systems; and the low priority given to mental health services with associated minimal resource allocation.96
In terms of post-traumatic mental illnesses, interventions immediately after a traumatic experience can either prevent the development of later symptoms or prevent existing symptoms from becoming chronic.97 Since many patients present to the healthcare system with physical injuries after experiencing a traumatic event, those involved in injury care (for instance, in emergency rooms and orthopaedic and plastic-surgery clinics) should be equipped to screen patients for post-traumatic mental health symptoms, and to make appropriate referrals as necessary.97,98 In addition, healthcare providers should be made aware that patients presenting with adverse mental health symptoms or unexplained physical symptoms may have experienced trauma.
The detection and appropriate management of substance abuse and dependence in general medical services also needs urgent review. International research indicates that between 50% and 90% of primary health care workers fail to recognise substance abuse in their outpatient population.99 The availability of quick, highly sensitive and specific tools to detect substance abuse indicates that the problem lies with the training and supervision of healthcare workers.99 The lack of addictionologists precludes ongoing training and assessment of service provision. Inadequate screening for substance abuse is also likely to be related to the lack of treatment services; overloaded health workers are unlikely to screen for a condition for which there is no available treatment.
In terms of access to treatment for substance abuse, including alcohol abuse, demand outweighs supply. Access is hampered by unequal geographical distribution and fragmented administration through both the welfare and health sectors, which have led to a lack of integration of mental health and substance abuse services. In particular, access to services by black South Africans is hampered by logistical, cultural and knowledge-related barriers.100
In terms of a health response to violence, the Burden of Disease Reduction Project commissioned by the Provincial Government of the Western Cape in 2006, which included violence and injuries as well as mental health among the key focal areas for prevention, provides several useful precedents. There are also several opportunities within the current health service to support violence prevention; for example:
➢ integrating injury prevention activities into the health service, such as motivational interviewing for patients presenting with alcohol-related injuries; and
➢ improving referral to tertiary services that specialise in rehabilitative services.
The National Health Department is well positioned to support violence prevention undertaken by external agencies outside the health sector by providing outcome information to target prevention activities on groups at risk in high-risk areas and at high-risk times. Furthermore, an evidence-informed research approach has applicability and relevance for effective and cost-effective injury prevention. The Western Cape Provincial Transversal Management System has constituted several inter-departmental working groups, including an injury prevention working group, which has been tasked by the Provincial Cabinet to develop a provincial violence prevention policy to guide the development and implementation of evidence-informed and upstream prevention strategies.
Reviewing key Department of Health policy documents at a national level, such as the Human Resources for Health Strategy,101 the Primary Health Care Re-engineering Strategy102 and the National Health Insurance Green Paper,103 it is clear that violence and mental illness, including alcohol, are recognised by the Department of Health as major contributors to the burden of disease. However, service strategies to address these burdens appear vague, and integration between alcohol abuse, trauma and mental health services is not apparent. Mental health is identified as an important area for investment in human resourcese and mention is also made of the provision of psychosocial support as part of the re-engineering of primary health care. Services to address alcohol abuse and services to address violence are only mentioned by name under school health services.
e Personal Communication: Crick Lund, November 2, 2012.

108 SAHR 2012/13
Available surveillance
Collecting surveillance data is a critical component in identifying and effectively managing any public health problem. First, the practice of monitoring provides useful data with which to influence policy development and helps to determine the outcomes, effectiveness and efficiency of intervention programmes. Without such data, decision makers do not have the information they need for policy design or resource allocation.104 Second, a good monitoring system allows decision makers to determine whether a programme was actually implemented; whether it was implemented in the manner originally intended; and, if not, how this may have influenced effectiveness. Despite the massive burden of disease caused by alcohol abuse, violence, trauma and mental health problems, surveillance data on these critical public health concerns are sorely lacking.
In terms of alcohol abuse, population prevalence data are reliant on occasional cross-sectional studies, namely the Demographic and Health Surveys conducted in 1998 and 2003 and the single SASH study conducted between 2002 and 2004. Data on the prevalence of alcohol abuse among trauma ward clients or clients attending any level of state health facilities are also not routinely collected.
Morbidity data on adult and child mental disorders are similarly lacking. A review of available mental health data sources in the Western Cape in 2006, for example, found that health services do not collect routine data on common mental disorders or child and adolescent mental illnesses.12 The only surveillance data available are suicide mortality rates collected by the National Injury Mortality Surveillance System (NIMSS). Suicide mortality is clearly a poor proxy measure for mental illness, as only a small fraction of those with mental health problems attempt suicide and an even smaller proportion complete suicide. Again, the single SASH study has provided the only measure of population prevalence of mental disorders and this study excluded people under the age of 18.
Data on violence are relatively more readily available, but remain largely confined to homicide data. The NIMSS and its provincial equivalents, the Provincial Mortality Surveillance systems (PIMSS), are currently the primary sources of data arising from the health sector that can be used for violence-prevention action and policy. However, homicide deaths are likely to represent only the tip of the iceberg of violence. Violence may not result in a physical injury at all and – even where it does – the injury may not result in death. As a proxy measure, it is also not clear whether the injury profile of non-fatal injuries is in any way similar to that of fatal injuries (indeed, a pilot study demonstrates that there are significant differences).105 The use of the data for monitoring the need for and success of interventions is also limited by current delays in the availability of these data (the most recent report being from 2009), the lack of detailed information about injury location and the small number of cases. A major advantage of the data system is that blood alcohol levels are tested in a proportion of cases, which is helpful in providing data on alcohol-related homicide.
A commonly used alternative data source for violence is the crime statistics of the South African Police Service (SAPS). However, there are several significant drawbacks to these data: there is a significant time lag in the availability of data, which are only available annually as summary statistics. The crime categories do not correlate well
with definitions or categories of injuries or trauma, as they measure only alleged crime reported to the police and not actual crime. The measurement of actual crime is only possible after a lengthy judicial process. It is likely that a large proportion of violence is not reported (particularly rape and domestic violence) and a strong possibility of reporting bias exists (given that a reduction in rates of violence and/or traffic injuries is used as a measure of effective police performance).
Intersectoral confluences and conflicts
Owing to the intersectoral nature of many of the risk factors for violence, alcohol abuse and common mental disorders, many of the related policies, legislation and interventions rely on government departments other than health. This gives rise to opportunities but also to many challenges, which impact on policy development and on service delivery.
Despite the fact that alcohol disorders are internationally defined as psychiatric disorders and despite high levels of comorbidity of alcohol problems and mental illness, in SA these two overlapping areas are addressed by different government departments (the departments of social development and health respectively). The lack of integration of alcohol misuse- and mental health services results in a paucity of services that offer treatment for both substance and other mental disorders.106 As such, the efficacy of treatment of both mental- and substance disorders is seriously compromised.
One example of an integrative approach at a national level was the establishment of an Inter-Ministerial Committee (IMC) on Combating Substance Abuse in 2010, which comprised the Departments of Social Development, Correctional Services, Health, Basic Education, Higher Education, Science and Technology, Economic Development, Transport, Trade and Industry and the SAPS.107 One outcome has been the development of a substance abuse health sector plan, which aims to institutionalise the screening and management of substance abuse at selected health programmes, including trauma units. The plan also aims to capacitate health workers to better detect and manage substance abuse.108 The 2nd Biennial Anti-Substance Abuse Summit in 2011, which evolved from the IMC, specifies several relevant resolutions, such as:
➢ the harmonisation of all laws and policies to facilitate effective governance of alcohol, including production, sales, distribution, marketing, consumption and taxation and the implementation of a continuum of care; and
➢ a public health approach that provides for prevention, early detection, treatment, rehabilitation and after care services.
However, these are but two of the 34 resolutions that were adopted and only the first of these has progressed as a focal area for implementation in the Anti-Substance Abuse Programme of Action for 2011 to 2016.107
In terms of mental health policy, the Minister of Health held a mental health summit in April 2012, attended by more than 400 mental health stakeholders from a range of sectors.e A new mental health policy is currently being drafted and a national action plan for mental health has been developed. Reviewing the draft policy, it appears that early childhood development, maternal mental

Violence, Alcohol Misuse and Mental Health: Gaps in the health system’s response 8
SAHR 2012/13 109
health, adolescents and HIV clients are major focus groups for interventions.108 By contrast, there is no specific mention of trauma or substance abuse settings as key focal areas for mental health promotion and prevention and, in general, budget commitments remain vague. The policy refers to the importance of intersectoral integration of services, but no details of the nature and focus of such integration are provided.
Although the Anti-Substance Abuse Programme of Action and the Mental Health Summit specify a broad range of departmental role players, it should be recognised that the structure of government encourages a silo-based- rather than an intersectoral approach.109 The transversal approach as adopted in the Western Cape, for example, is laudable, but its viability remains to be seen. In terms of reducing alcohol abuse and alcohol-related harm, the evidence demonstrates very clearly that the most effective way to achieve this is to reduce access to alcohol, through, for example, limiting the trading hours and number of liquor outlets.110 In SA, the responsibility for developing this legislation has rested nationally with the Department of Trade and Industry (dti) and provincially with the provincial departments of economic development and tourism (DEDAT), which have economic development, rather than public health, as a primary goal. In developing liquor legislation, while the dti and DEDAT have consulted other departments, the final mandate and decision-making powers have rested outside of the social sector. In September 2011, the dti partnered with the liquor industry to host a workshop on educational/informational interventions (for example, road shows) targeted at adolescents, despite adolescents not being a major risk group and a limited evidence base for the proposed interventions. In the same year, several provincial DEDAT partnered with South African Breweries on their Responsible Trader Programme, which has been shown to increase alcohol sales, turnover and profit while evidence for a reduction in alcohol abuse remains absent.19,111 These examples highlight the conflicts of interest within government to reduce alcohol abuse and demonstrate how these conflicts impact on which interventions are funded and undertaken by government.
A silo-based approach similarly undermines violence prevention. The criminal justice sector is considered as the custodian of safety, whereas the international experience of successful intervention suggests that an intersectoral response that encompasses primary-, secondary- and tertiary prevention is preferable. The security focus is also evident through increased spending on private security systems and personnel and increased quotas of national and metropolitan police officers, which is out of kilter with where costs accrue. For example, Alda and Cuesta in 2010 provided a comprehensive estimate of the cost of crime in SA using accounting methodology, in which health costs alone accounted for one quarter of the aggregated cost of crime estimate of US$ 22.1 billion in 2007, or 7.8% of Gross Domestic Product (GDP).112 Yet the health service response too is reactive and largely confined to the treatment and immediate emergency response to violence. A more primary preventive approach would include addressing, for example, substance abuse and other mental health disorders.
Similarly, legislation about domestic violence that supports social services, such as the Domestic Violence Act (Act 116 of 1998) and the Children’s Amendment Act (Act 30884 of 2007), focuses predominantly on the tertiary response and rehabilitative needs of survivors. Across all sectors negligible investment is made in primary
prevention to address the upstream antecedents of violence, such as public infrastructure, access to services, and unemployment.
Conclusions and recommendations
Several key conclusions can to be drawn from the preceding situational analysis relating to health systems, health services and surveillance. It should also be recognised that while the recommendations made here may be adopted as stand-alone interventions, every effort should be made to adopt an integrated approach in high-risk areas. Since the most vulnerable groups are those that experience multiple dimensions of poverty or deprivation, multifaceted interventions are likely to be the most effective.
Health services
The health service gaps identified relate primarily to a lack of recognition and prioritisation of the multi-directional links between violence, mental illness and alcohol misuse. Not recognising or prioritising these links results in a lack of data, policies and interventions that could address these problems in a sufficiently integrated manner. It also results in inadequate resource allocation. This gap is also evident at the clinical level, where mental illness, trauma or substance misuse is not adequately detected or managed. Clearly, it is important to train staff in services where they encounter trauma victims to screen for and provide management of substance misuse and mental illness. Detection and management of mental illness and substance misuse in other high-risk groups, including adolescents and perpetrators of violence, also need dramatic improvement.
An exhaustive review of evidence-informed interventions, which addressed these interlinked areas, was conducted for the Western Cape Burden of Disease project in 2007.113 The review highlighted some of the interventions necessary to achieve these goals. Health service recommendations included the recruitment and training of primary care workers and other health workers in screening and brief interventions for substance abuse and dependence; and the integration of mental health services into general medical services (with adequate provision for human resources, training, facilities, protocols and information management). The review also recommended expanding the budgetary allocation and provision of mental health and substance abuse services across all levels of care. Regarding staff, the review recommended appointing relevant specialists and sub-specialists (addictionologists, public health specialists, trauma specialists); providing dedicated mental health professionals and resources to maternal and trauma services; and increasing the number of trauma-competent mental health staff in general health services. Improving the staff competency and providing more focused services would involve training mental health professionals in substance misuse; introducing trauma-focused psychotherapy and pharmacotherapy; and developing postgraduate training programmes in trauma and substance misuse.
The review also identified important interventions that extend beyond health services. These included multifaceted community development interventions, the development of adequate referral networks for traumatised people across sectors, and evaluation of and support for non-governmental organisations currently filling the gaps in services, e.g. Child Welfare, Rape Crisis, FAMSA, and Lifeline.

110 SAHR 2012/13
Surveillance
The institutionalisation of injury mortality surveillance within the health service, as undertaken in the Western Cape, is an important first step to ensure an informed prevention response to both violence and mental health.114 However, the lack of detailed information about injury locations and the relatively few recorded deaths limit the utility to prioritising and monitoring interventions at a neighbourhood level. Further consideration needs to be given to how these data can be integrated with data from secondary and tertiary facilities and with data from emergency medical services. Where possible, mortality surveillance should be supported by cross-sectional studies of non-fatal cases, or at least sentinel surveillance in high-risk areas. In addition, given that most trauma patients may be under the influence of alcohol, it would be worth investing in rapid alcohol tests, such as breathalysers, so that emergency centres can facilitate the collection of data on alcohol-related trauma and to provide appropriate referral or rehabilitation.34,105 Similarly, including screening and detection of mental illness in this client base would provide at least some data on mental health morbidity in this high-risk group and facilitate access to mental health services for these clients.
Sentinel site surveillance should be considered as a means of obtaining regular data on the prevalence of common mental health disorders, including substance misuse disorders and child and adolescent mental health problems, particularly in high-risk settings and geographical areas. High-risk settings could include health settings (such as HIV, TB, family planning, maternal and chronic disease settings), and those falling under other sectors, such as police stations, courts and social services.
Ideally, at least some of the surveillance data should include data on violence and mental health problems, including substance use disorders, collected from the same cohort. In this way, common risk factors and groups at risk for multiple health outcomes can be easily identified and the impact of integrated interventions measured.
Building an effective intersectoral response
This chapter calls for the improved integration of mental health-, trauma- and substance abuse- services both within the health sector and among other relevant sectors. The establishment of an interministerial committee, much like the one that was convened to address substance abuse specifically, might also provide a platform for these three public health priorities to be addressed simultaneously. Creating an effective mechanism and avoiding devolution into departmental silos will require high-level oversight and accountability. The tensions that may manifest between the social and economic clusters, such as have been evident in the regulation of liquor, suggest that this oversight would preferably be accorded to Cabinet. Similar oversight is required to facilitate primary prevention and to address the numerous upstream factors that have an impact on a wide range of health conditions and the social circumstances that undermine health and wellness more generally.

Violence, Alcohol Misuse and Mental Health: Gaps in the health system’s response 8
SAHR 2012/13 111
References
1 Bradshaw D, Nannan N, Laubscher R, Groenewald P, Joubert J, Nojilana B, et al. South African National Burden of Disease Study 2000: Estimates of Provincial Mortality. Cape Town: Medical Research Council; 2004.
2 Norman R, Matzopoulos R, Groenewald P, Bradshaw D. The high burden of injuries in South Africa. Bull World Health Organ. 2007;85(9):695-701.
3 Matzopoulos R, Bowman B, Butchart A, Mercy JA. The impact of violence on health in low- to middle-income countries. Inj Control Saf Promot. 2008;15(4):177-87.
4 Matzopoulos R, editor. A profile of fatal injuries in South Africa: Sixth annual report of the National Injury Mortality Surveillance System. Cape Town: Medical Research Council; 2005.
5 Mathews S, Abrahams N, Martin LJ, Vetten L, Van der Merwe L, Jewkes R. “Every six hours a woman is killed by her intimate partner”: A national study of female homicide in South Africa. MRC Policy Brief. Cape Town: Medical Research Council; 2004.
6 Fieggen AG, Wiemann M, Brown C, van As AB, Swingler GH, Peter JC. Inhuman shields – Children caught in the crossfire of domestic violence. S Afr Med J. 2004;94(4):293-6.
7 Emmet T. Social disorganisation, social capital and violence prevention in South Africa. Afr Saf Promot. 2003;1(2):4-18.
8 Van der Merwe AV, Dawes A. Prosocial and antisocial tendencies in children exposed to community violence. J Child Adolesc Ment Health. 2000;12(1):29-37.
9 Swart L-A, Seedat M, Stevens G, Ricardo I. Violence in adolescents’ romantic relationships: Findings from a survey amongst school-going youth in a South African community. J Adolescence. 2002;25(4):385-95.
10 Ensink K, Robertson BA, Zissis C, Leger P. Post-traumatic stress disorder in children exposed to violence. S Afr Med J. 1997;87(11):1526-30.
11 Stein DJ, Seedat S, Herman A, Moomal H, Heeringa SG, Kessler RC, et al. Lifetime prevalence of psychiatric disorders in South Africa. BJ Psych. 2008;192(2):112-7.
12 Draper B, Corrigall J. Report on the scoping exercise to deliver the existing intervention profile that addresses the provincial burden of disease. Cape Town: Western Cape Government; 2006.
13 World Health Organization. Prevention of mental disorders: Effective interventions and policy options. Geneva, Switzerland: World Health Organization; 2004.
14 Herman H, Jané-Llopis E. Mental health promotion in public health. Glob Health Promot. 2005;12(no. 2 suppl):42-7.
15 Herman A, Stein D, Seedat S. The South African Stress and Health (SASH) study: 12-month and lifetime prevalence of common mental disorders. S Afr Med J. 2009;99(5 Pt 2):339-44.
16 National Department of Health, Medical Research Council, Demographic and Health Surveys Macro International Inc. South Africa Demographic and Health Survey 1998. Full report. Pretoria: National Department of Health; 2001.
17 World Health Organization. Global status report on alcohol and health 2011. Geneva, Switzerland: World Health Organization; 2011.
18 Norman R, Bradshaw D, Schneider M, Joubert J, Groenewald P, Lewin S, et al. A comparative risk assessment for South Africa in 2000: Towards promoting health and preventing disease. S Afr Med J. 2007;97(8):637-42.
19 Truen S, Ramkolowan Y, Corrigall J, Matzopoulos R. Baseline study of the liquor industry: Including the impact of the National Liquor Act 59 of 2003. Pretoria: Department of Trade and Industry; 2011.
20 Rehm J, Kehoe T, Rehm M, Patra J. Alcohol Consumption and related harm in WHO Africa region in 2004. Toronto, Canada: Centre for Addiction and Mental Health; 2009.
21 Obot I. Alcohol use and related problems in sub-Saharan Africa. Afr J Drug Alcohol Stud. 2006;5(1):17-26.
22 Petrakis IL, Gonzalez G, Rosenheck R, Krystal JH. Comorbidity of alcoholism and psychiatric disorders. Alc Res Hlth. 2002;26(2):81-9.
23 Strakowski SM, DelBello MP, Fleck DE, Arndt S. The impact of substance abuse on the course of bipolar disorder. Biol Psychiatry. 2000;48(6):477-85.
24 Mills KL. Trauma, PTSD, and substance use disorders: Findings from the Australian National Survey of Mental Health and Well-being. Am J Psychiatry. 2006;163(4):652-8.
25 Fischer G, Bitschnau M, Peternell A, Eder H, Topitz A. Pregnancy and substance abuse. Arch Womens Ment Health. 1999;2(2):57.
26 Saban A, Flisher AJ, Distiller G. Association between psychopathology and substance use among school-going adolescents in Cape Town, South Africa. J Psychoactive Drugs. 2010;42(4):467-76.
27 Schneider M, Norman R, Parry C, Bradshaw D, Plüddemann A. Estimating the burden of alcohol abuse in South Africa in 2000. Methodological note. Cape Town: Medical Research Council; 2007.
28 Krug EG, Dahlberg LL, Mercy JA, Zwi AB, Lazano R. World Report on Violence and Health. Geneva: World Health Organization; 2002.
29 English D, Holman C, Milne E, et al. The quantification of drug-caused morbidity and mortality in Australia. Canberra, Australia: Commonwealth Department of Human Services and Health; 1995.
30 Shultz JM, Rice DP, Parker DL, Goodman RA, Stroh G, Chalmers N. Quantifying the disease impact of alcohol with ARDI software. Public Health Rep. 1991;106(4):443-50.
31 Single E, Robson L, Xie X, Rehm J. The economic costs of alcohol, tobacco and illicit drugs in Canada,1992. Addiction.1998;93(7):991-1006.
32 Parry CDH, Dewing S. A public health approach to addressing alcohol related crime in South Africa. Afr J Drug Alcohol Stud. 2006;5(1):41-56.
33 Doolan K. A quantitative analysis of socio-economic position and violence in South Africa. Cape Town: University of Cape Town; 2006.
34 Plüddemann A, Parry C, Donson H, Sukhai A. Alcohol use and trauma in Cape Town, Durban and Port Elizabeth, South Africa: 1999-2001. Inj Control Saf Promot. 2004;11(4): 265-7.
35 Gallagher KE, Hudepohl AD, Parrott DJ. Power of being present: The role of mindfulness on the relation between men’s alcohol use and sexual aggression toward intimate partners. Aggress Behav. 2010;36(6):405-13.
36 Golding JM. Sexual assault history and limitations in physical functioning in two general population samples. Res Nurs Health. 1996;19(1):33-44.
37 Strauss M, Gelles RJ. Societal change and change in family violence from 1975 to 1985 as revealed by two national surveys. J Marriage Fam. 1986;48(3):465-79.

112 SAHR 2012/13
38 Black DA, Schumacher JA, Smith Slep AM, Heyman RE. Partner, child abuse risk factors literature review. New York, NY: Stony Brook, State University of New York; 1999.
39 Johnson H. Dangerous domains: Violence against women in Canada. Scarborough, ON: Nelson Canada; 1996.
40 Rodgers K. Wife assault: The findings of a national survey. Juristat. 1994;14(9):1-21.
41 Grisso JA, Schwarz DF, Hirschinger N, Sammel M, Brensinger C, Santanna J, et al. Violent injuries among women in an urban area. N Engl J Med. 1999;341(25):1899-905.
42 Kyriacou DN, Anglin D, Taliaferro E, Stone S, Tubb T, Linden JA, et al. Risk factors for injury to women from domestic violence. N Engl J Med. 1999;341(25):1892-8.
43 Lipsky S, Caetano R, Field CA, Larkin GL. Psychosocial and substance-use risk factors for intimate partner violence. Drug Alcohol Depend. 2005;78(1):39-47.
44 Rehm J, Room R, Graham K, Monteiro M, Gmel G, Sempos CT. The relationship of average volume of alcohol consumption and patterns of drinking to burden of disease: An overview. Addiction. 2003;98(9):1209-28.
45 Giancola PR. The influence of trait anger on the alcohol-aggression relation in men and women. Alcohol Clin Exp Res. 2002;26(9):1350-8.
46 Giancola PR, Saucier DA, Gussler-Burkhardt N. The effects of affective, behavioral, and cognitive components of trait anger on the alcohol-aggression relation. Alcohol Clin Exp Res. 2003;27(12):1944-54.
47 Jewkes R, Levin J, Penn-Kekana L. Risk factors for domestic violence: Findings from a South African cross-sectional study. Soc Sci Med. 2002;55(9):1603-17.
48 Abrahams N, Jewkes R, Laubscher R, Hoffman M. Intimate partner violence: Prevalence and risk factors for men in Cape Town, South Africa. Violence Vict. 2006;21(2):247-64.
49 Mercy JA, Butchart A, Farrington D, Cerda M. Youth violence. In: Krug EG, Dahlberg LL, Mercy JA, Zwi AB, Lozano R, editors. World report on violence and health. Geneva: World Health Organization; 2002.
50 Krug EG, Dahlberg LL, Mercy JA, Zwi AB, Wilson A, Lozano R, editors. The way forward: recommendations for action. In: Krug EG, Dahlberg LL, Mercy JA, Zwi AB, Lozano R, editors. World report on violence and health. Geneva: World Health Organization; 2002.
51 Golding JM. Intimate partner violence as a risk factor for mental disorders: A meta-analysis. JOFV. 1999;14(2):99-132.
52 Resnick HS, Acierno R. Health impact of interpersonal violence. 2: Medical and mental health outcomes. Behav Med. 1997;23(2):65-78.
53 Kaplan SJ, Pelcovitz D, Labruna V. Child and adolescent abuse and neglect research: A review of the past 10 years. Part I : Physical and emotional abuse and neglect. J Am Acad Child Adolesc Psychiatry. 1999;38(10):1214-22.
54 Kilpatrick DG, Acierno R. Mental health needs of crime victims: Epidemiology and outcomes. J Traum Stress. 2003;16(2):119-32.
55 Acierno R, Kilpatrick DG, Resnick HS, Saunders B, De Arellano M, Best C. Assault, PTSD, family substance abuse and depression as risk factors for cigarette use in youth: Findings from the National Survey of Adolescents. J Traum Stress. 2000;13(3):381-96.
56 Pelcovitz D, Kaplan SJ, DeRosa RR, Mandel FS, Salzinger S. Psychiatric disorders in adolescents exposed to violence and physical abuse. Am J Orthopsychiatry. 2000;70(3):360-9.
57 Anda RF, Felitti VJ, Bremner JD, Walker JD, Whitfield C, Perry BD, et al. The enduring effects of abuse and related adverse experiences in childhood: A convergence of evidence from neurobiology and epidemiology. Eur Arch Psychiatry Clin Neurosci. 2006;256(3):174-86.
58 Lesserman J. Sexual abuse history: Prevalence, health effects, mediators and psychological treatment. Psychosom Med. 2005;67(6):906-15.
59 Mabanglo MAG. Trauma and the effects of violence exposure and abuse on children: A review of the literature. Smith Coll Stud Soc. 2002;72(2):231-51.
60 Mulvihill D. The health impact of childhood trauma: An interdisciplinary review, 1997-2003. Issues Compr Pediatr Nurs. 2005;28(2):115-36.
61 Rowan AB, Foy DW. Post-traumatic stress disorder in child sexual abuse survivors: A literature review. J Traum Stress. 1993;6(1):3-20.
62 Viscarra B, Hassan F, Hunter WM, Munoz SR, Ramiro L, De Paula CS. Partner violence as a risk factor for mental health among women from communities in the Philippines, Egypt, Chile, and India. Inj Control Saf Promot. 2004;11(2):125-9.
63 Hill AB. The environment and disease: Association or causation? Proc R Soc Med. 1965;58(5):295-300.
64 Van der Kolk BA, MacFarlane AC, Weisaeth L. Traumatic stress: The effects of overwhelming experiences on mind, body and society. 1996.
65. Barbarin OA, Richter L, deWet T. Exposure to violence, coping resources, and psychological adjustment of South African children. Am J Orthopsychiatry. 2001;71(1):16-25.
66 Berard RM. Depression and anxiety in oncology: The psychiatrist’s perspective. J Clin Psychiatry. 2001;62 Suppl 8:58-61; discussion 62-3.
67 Collings SJ. The long-term effects of contact and noncontact forms of child sexual abuse in a sample of university men. Child Abuse Negl. 1995;19(1):1-6.
68 Collings SJ. Child sexual abuse in a sample of South African women students: Prevalence, characteristics, and long-term effects. S Afr J Psychol. 1997;27(1):37-42.
69 Jewkes R. Violence against women: An emerging health problem. Int Clin Psychopharmacol. 2000;15 Suppl 3:S37-45.
70 Kopel H, Friedman M. Posttraumatic symptoms in South African police exposed to violence. J Traum Stress. 1997;10(2):307-17.
71 Marais A, De Villiers PJ, Miller AT, Stein DJ. Domestic violence in patients visiting general practitioners – prevalence, phenomenology, and association with psychopathology. S Afr Med J. 1999;89(6):635-40.
72 Morojele NK, Brook JS. Substance abuse and multiple victimisation among adolescents in South Africa. Addict Behav. 2006;31(7):1163-76.
73 Peltzer K. Posttraumatic stress symptoms in a population of rural children in South Africa. Psychol Rep. 1999;85(2):646-50.
74 Seedat S, Nyamai C, Njenga F, Vythilingum B, Stein D. Trauma exposure and post-traumatic stress symptoms in urban African schools. Survey in CapeTown and Nairobi. Br J Psychiatry. 2004;184:169-75.
75 Ward CL, Flisher AJ, Lombard C. Exposure to violence and psychopathology amongst South African adolescents. Inj Prev. 2001;7(4):297-301.

Violence, Alcohol Misuse and Mental Health: Gaps in the health system’s response 8
SAHR 2012/13 113
76 Ward CL, Lombard CJ, Gwebushe N. Critical incident exposure in South African emergency services personnel: Prevalence and associated mental health issues. Emerg Med J. 2006;23(3):226-31.
77 Van As AB, Withers M, Du Toit N, Millar AJ, Rode H. Child rape – patterns of injury, management and outcome. S Afr Med J. 2001;91(12):1035-8.
78 Ward C, Flisher F, Zissis C, Muller ML, Lombard C. Exposure to violence and its relationship to psychopathology in adolescents. Inj Prev. 2001;7(4):297-301.
79 Dawes A, Long W, Alexander L, Ward CL. A situation analysis of children affected by maltreatment and violence in the Western Cape. Cape Town: Human Sciences Research Council; 2006.
80 Abrahams N, Jewkes R. Effects of South African men’s having witnessed abuse of their mothers during childhood on their levels of violence in adulthood. Am J Public Health. 2005;95(10):1811-6.
81 McNally R, Bryant R, Ehlers A. Does early psychological intervention promote recovery from post-traumatic stress? PSPI. 2003;4(2):45-79.
82 Seedat S, van Nood E, Vythilingum B, Stein D, Kaminer D. School survey of exposure to violence and post-traumatic stress symptoms in adolescents. J Child Adolesc Ment Health. 2000;12(1):38-44.
83 Sampson RJ. Family management and child development: Insights from social disorganization theory. In: McCord J, editor. Facts, frameworks and forecasts: Advances in criminological theory. New Brunswick, NJ: Transaction Publishers; 1992.
84 Bursik RJ. Social disorganization and theories of crime and delinquency: Problems and prospects. Criminology. 1988;26(4):519-51.
85 Silk JS, Sessa FM, Morris AS, Steinberg L, Avenevoli S. Neighbourhood cohesion as a buffer against hostile maternal parenting. J Fam Psychol. 2004;18(1):135-46.
86 O’Neil R, Parke RD, McDowell DJ. Objective and subjective features of children’s neighbourhoods: Relations to parental regulatory strategies and children’s social competence. J Appl Dev Psychol. 2001;22(2):135-55.
87 Hill NE, Herman-Stahl MA. Neighborhood safety and social involvement: Associations with parenting behaviours and depressive symptoms among African American and Euro-American mothers. J Fam Psychol. 2002;16(2):209-19.
88 Coulton CJ, Korbin JE, Su M. Neighbourhoods and child maltreatment: A multi-level study. Child Abuse Negl. 1999;23(11):1019-40.
89 Coulton CJ, Korbin JE, Su M, Chow J. Community level factors and child maltreatment rates. Child Dev. 1995;66(5):1262-76.
90 Furstenburg FFJR, Hughes ME. The influence of neighbourhoods on children’s development: A theoretical perspective and a research agenda. In: Hauser RM, Brown BV, Prosser WR, editors. Indicators of children’s well-being. New York: Russell Sage Foundation; 1997.
91 Aneshensel CS, Sucoff CA. The neighbourhood context of adolescent mental health. J Health Soc Behav. 1996;37(12):293-310.
92 Whitley R, Prince M. Fear of crime, mobility and mental health in inner-city London, UK. J Soc Sci Med. 2005;61(8):1678-88.
93 Chandola T. The fear of crime and area differences in health. Health Place. 2001;7(2):105-16.
94 Lund C, Flisher AJ. Staff/bed and staff/patient ratios in South African public sector mental health services. S Afr Med J. 2002;92(2):157-61.
95 Carey PD, Stein DJ, Zungu-Dirwayi N, Seedat S. Trauma and post-traumatic stress disorder in an urban, Xhosa primary care population: Prevalence, comorbidity, and service use patterns. J Nerv Ment Dis. 2003;191(4):230-6.
96 Kigozi FN. Challenges to the current provision of mental health services and development of psychiatry in Africa. S Afr J Psychol. 2003;9(2):27-8.
97 National Collaborating Centre for Mental Health. Post-traumatic stress disorder: The management of PTSD in adults and children in primary and secondary care. London, UK: National Health System London; 2005.
98 Katon W, Zatzick D, Bond G, Williams J. Dissemination of evidence-based mental health interventions: Importance to the trauma field. J Traum Stress. 2006;19(5):611-23.
99 McPherson TL, Hersch RK. Brief substance use screening instruments for primary care settings: a review. J Subst Abuse Treat. 2000;18(2):193-202.
100 Myers B, Parry C. Access to substance abuse treatment services for black South Africans: Findings from audits of specialist treatment facilities in Cape Town and Gauteng. Afr J Psych. 2005;8:15-9.
101 National Department of Health. Human Resources for Health South Africa. HRH Strategy for the health sector: 2012/13 -2016/17. Pretoria: National Department of Health; 2010.
102 National Department of Health. Re-engineering primary health care in South Africa. Discussion document. Pretoria: National Department of Health; 2010.
103 National Department of Health. National Health Insurance in South Africa: Policy paper. Pretoria: Government Gazette No. 34323; 2011.
104 Dawes A, Bray R. Conceptual foundations. In: Dawes A, Bray R, van der Merwe A, editors. Monitoring child rights and well-being: A South African approach. Cape Town: HSRC Press; 2004.
105 Govender I, Matzopoulos R, Makanga P, Corrigall J. Piloting a trauma surveillance tool for primary healthcare emergency centres. S Afr Med J. 2012;102(5):303-6.
106 Parry C. A review of policy-relevant strategies and interventions to address the burden of alcohol on individuals and society in South Africa. Afr J Psych. 2005;8(1).
107 National Department of Health. Anti-substance abuse programme of action: 2011-2016. Pretoria: National Department of Health; 2011.
108 Speaking notes for the Minister of Health Dr A.P. Motsoaledi at the National Mental Health Summit, 12 April, St Georges Hotel, Gauteng Province [Internet]. 2012 [cited 2012 Nov 6].URL: http://www.doh.gov.za/show.php?id=3505
109 Matzopoulos R, Myers JE, Bowman B, Mathews S, Butchart A, Corrigall J, et al. Reducing the burden of injury: an intersectoral preventive approach is needed. S Afr Med J. 2008 Sep;98(9):703-5.
110 Babor TF, Caetano R, Casswell S, Edwards G, Giesbrecht N, Graham K, et al. Alcohol: No ordinary commodity – Research and public policy. Oxford and London: Oxford University Press; 2003.
111 Moru D. SAB’s enterprise development programmes: An evaluation of Kick Start and Mahlasedi projects. Stellenbosch; University of Stellenbosch; 2008.

114 SAHR 2012/13
112 Alda E, Cuesta J. A comprehensive estimation of costs of crime in South Africa and its implications for effective policy making. J Int Dev. 2011;23(7)926-35.
113 Myers J, Naledi T, Corrigall J, Pienaar D, Matzopoulos R, Draper B, et al. Western Cape Burden of Disease Reduction Project. Cape Town: Western Cape Government; 2007.
114 Matzopoulos R, Martin LJ, Wadee S, Thomson V, Prinsloo M, Bourne D, et al. The Provincial Injury Mortality Surveillance System (PIMSS): A surveillance tool for the Western Cape. Injury Prevention. 2011;16(Supplement 1):A47-A48.

Authors:
115SAHR 2012/13
999999999999
Thandi R PuoaneLungiswa P Tsolekile Sam Caldbick Ehimario U Igumbor Kashmeera MeghnathDavid Sanders
School of Public Health, University of the Western Cape
Chronic Non-communicable Diseases in South Africa: Progress and challenges
In recent years, recognition of the rising threat of chronic non-communicable diseases (NCDs) as major contributors to preventable disease and premature mortality has placed these conditions firmly on the global development agenda.
A United Nations resolution taken on 13 May 2010 set in motion processes that culminated in a United Nations Security Council summit on NCDs in September 2011. This action has been important in highlighting NCDs, especially in low- and middle income countries such as South Africa, and placing them on a par with other global health priorities such as HIV and AIDS.
In this chapter, we describe the current status of chronic NCDs in South Africa and point to the drivers of the high and increasing burden of NCDs in the country. Building on the review of NCDs in the 2008 South African Health Review, we reflect on progress in local policies and practices over the past five years.
Our review shows that increasing attention is currently being paid to NCDs in South Africa but that this heightened focus has to be strengthened and sustained over the next decades to combat the current trend and achieve a real reduction in the NCD-related burden. Specifically, more stringent measures are required to address the common risk factors of chronic NCDs and reverse the burden of NCDs. To achieve this, action is required from several constituencies. Ultimately, South Africa will need to invest in NCD prevention and control as an integral part of sustainable socio-economic development.
Increasing attention is currently being paid to
NCDs in South Africa but this heightened focus has
to be strengthened and sustained over the next decades to combat the
current trend and achieve a real reduction in
the NCD-related burden.

116 SAHR 2012/13
Introduction
“Chronic non-communicable diseases” (NCDs) refers to a group of slowly progressive medical conditions or diseases of long duration (chronic), which are characteristically non-infectious and non-transmissible among people (non-communicable). They include heart disease, stroke, cancers, diabetes, chronic obstructive pulmonary disease (COPD), asthma, cataracts, and more. The chronic character of these diseases demands long-term care and they impose a continuous burden on an already overstretched health system similar to the way HIV infection does. Their non-infectious cause however points to a different set of determinants that need to be targeted.
Chronic NCDs, which account for approximately two-thirds of all deaths globally, are the leading cause of mortality worldwide.1-3
Cardiovascular disease, cancer, type II diabetes, and COPD make up the majority of the NCD-related burden. This burden is increasing in many countries that still suffer widespread infectious diseases, resulting in a double burden of disease.1 For example, approximately 83% of the global mortality from NCDs occurs in low- and middle-income countries (LMICs). Furthermore, it is estimated that the total deaths globally attributable to NCDs will increase by 15% in the next decade.3
In South Africa (SA), NCDs account for an estimated 37% of all-cause mortality and 16% of disability-adjusted life years.4 Ischaemic heart disease, stroke, diabetes mellitus, and COPD account for 6.6%, 6.5%, 2.6%, and 2.5% of all deaths respectively. This burden varies significantly between population groups. For example, the age standardised cardiovascular disease mortality rate is 606.9 per 100 000 for Asians and 375.3 for ‘Africans’.4
Evidence exists of a growing interest in tackling the burden of NCDs in SA. In September 2011, the South African government convened a summit on the “Prevention and Control of Non-Communicable Diseases”.5 The summit, which included various governmental departments, researchers, private sector stakeholders, and civil society, produced a declaration that endorsed action aimed at various levels of risk factors (behavioural, environmental, and structural). It also acknowledged the need for intersectoral collaboration.5 Furthermore, the national government will soon be releasing a “Strategic Plan for Non-Communicable Diseases, 2012-2016”, which will provide a short-term framework to reduce the burden of NCDs.
The recent acknowledgement given to NCDs in SA is important progress. Aside from the tremendous burden NCDs place on individuals, they also pose significant economic challenges to the country. NCDs can deepen poverty, reduce economic productivity, and strain an already under-resourced healthcare system. Action is urgently required: as a result of the demographic transition, NCD rates will increase regardless of progress made in reducing the prevalence of leading risk factors. For example, it is estimated that between 2001 and 2025 the proportion of the population aged 60 and older will increase from approximately 7.1% to 10%.6
However, there is reason for optimism. Many of the risk factors for NCDs are modifiable, which provides considerable opportunities for intervention. However, progress in reducing these risk factors will only be attained if appropriate attention is given to their social and structural determinants. A concerted effort from all government
departments and sectors in society is required to mitigate the future threat that NCDs pose to the country.
In this chapter, we describe the current status of chronic NCDs in South Africa and point to the drivers of the high and increasing burden of NCDs. Building on the review of NCDs in the 2008 South African Health Review2 we reflect on progress in policies and practices in the past five years. We deliberately focus on the ‘big four’ (heart disease, cancer, type II diabetes and COPD) because of the overall burden they make up in SA and the many risk factors they commonly share. Mental illness, a major contributor to the overall disease burden in SA,7 is not covered in this chapter. We then provide examples of interventions that have been implemented in SA and other countries. Finally, we conclude by highlighting the current challenges facing public health research in SA and offer a future direction for alleviating the NCD-related burden.
Risk factors for NCDs
Many factors increase an individual’s risk for NCDs. It is useful to visualise the various categories of risk factors or determinants as depicted in Figure 1 which highlights two main points: the relative distance of each group of risk factors to the disease outcome (i.e. “biological” – proximal; “structural” – distal), and the influence each group of risk factors has on another group (emphasised in Figure 1).
It is also useful to divide the risk factors into factors that are modifiable and non-modifiable. Modifiable risk factors are the behavioural, social, and structural determinants, in which it is feasible to intervene. Non-modifiable factors consist of an individual’s characteristics such as age, gender and genetic endowment. Success in reducing the prevalence and burden of NCDs in SA will rely on a comprehensive strategy that focuses on all modifiable determinants while recognising the role of individual and biological factors. Below we briefly review key risk factors and determinants, beginning with the more proximal and concluding with the distal, structural determinants.

Chronic Non-communicable Diseases in South Africa 9
117SAHR 2012/13
Figure 1: Determinants of health portrayed as concentric rings of risk factors
Source: Western Cape Burden of Disease Reduction Project, 2007.8
Individual determinants
Most NCDs are related to behavioural or ‘lifestyle’ factors, which in turn are significantly shaped by factors embedded in the social (working and living) environment and structured by more distal economic and political factors. However, certain populations have a heightened genetic susceptibility, which not only increases the likelihood of developing NCDs but also influences the age of onset. One of the most prominent evolutionary theories linking genetic endowment with NCDs is the ‘thrifty gene’ hypothesis, which explains why some populations are more susceptible to type II diabetes than others. Essentially, ‘thrifty genes’ increase fat storage during times of abundance to compensate for infrequent bouts of famine.9 This was an important evolutionary trait that increased survival in times when food supply was especially precarious.
In SA, some ethnic groups have been shown to have an increased risk for certain NCDs. For example, South African Indians are more susceptible to insulin resistance than other ethnic groups in the country, which has resulted in an increased risk for type II diabetes among this group.10 Also, approximately 1 in every 72 Afrikaners has familial hypercholesterolaemia, an autosomal dominant genetic disorder, which results in elevated low-density lipoprotein levels and an increased risk for ischaemic heart disease.11 Fortunately, genetic testing and counselling programmes have contributed significantly to the identification, prevention, and management of the disease for those at greater risk of developing these disorders as a result of their genetic endowment.
It is increasingly recognised that exposure to unhealthy risk factors such as inadequate nutrition and smoking during ‘critical periods’ of life such as pregnancy, foetal life and early childhood can increase one’s susceptibility to an array of chronic diseases later in life.12,13 There is evidence that this is a concern in SA. For example, using data from the baseline birth-to-ten study cohort, Steyn and colleagues showed that in 1990 in the greater Johannesburg area, approximately 6% of pregnant women were current smokers and that a significant association was found between smoking and low birth weight.14
Behavioural determinants
Most NCDs (heart disease, type II diabetes, and certain cancers) are associated with behavioural risk factors such as tobacco use, physical inactivity, unhealthy diets and alcohol abuse. These risk factors cluster in groups of individuals as a result of their socio-
Biological Behavioural Societal Structural
economic status (SES) and environment, and contribute to the disparity in health outcomes between groups.
Tobacco use
According to the World Health Organization (WHO), “tobacco is the single most preventable cause of death in the world today”.15 Approximately five million people in the world die each year as a result of tobacco use. Tobacco use has been causally associated with numerous NCDs such as ischaemic heart disease, COPD and a wide variety of cancers. Although great success has been achieved in many developed nations in reducing the prevalence of smoking, the burden is shifting to many LMICs, largely as a result of an aggressive business strategy by the tobacco industry.16
In SA, the prevalence of smoking is relatively high. The most recent national survey indicates that in 2003, 35% of adult men and 10% of adult women were considered to be daily or occasional smokers.17 The high prevalence of smoking in SA is also reflected in cancer rates. For example, lung cancer is the leading cause of death from cancer in men.18 Although SA has developed and implemented a comprehensive tobacco control policy, 2008 data suggest that virtually no progress has been made in decreasing the prevalence of smoking in SA youth over the past decade.19 Approximately 21% of youth in grades 8 to 11 are current smokers, measured by self-reported tobacco use in the past 30 days.19 Lack of progress on this front should be of concern for public health advocates in SA, given the well-established relationship between the age of onset of smoking and the likelihood of lifetime use.
Obesity
SA is currently experiencing an obesity epidemic. Obesity is associated with many chronic diseases, including type II diabetes, heart disease, certain cancers, and osteoarthritis. So strong is the link between obesity and type II diabetes that the term ‘diabesity’ has been coined to describe their dualistic occurrence in the population.20 A survey conducted in July 2010 among 500 adults in the country’s four biggest cities, on behalf of the pharmaceutical company GlaxoSmithKline (GSK), found that 72% of the residents of Cape Town, 68% of residents of Pretoria, 59% of those of Johannesburg, and 52% of those of Durban are overweight.21 In 2000, it was estimated that 87% of cases of type II diabetes and 7% of all deaths were attributable to excess body weight.22

118 SAHR 2012/13
According to national data obtained from the South Africa Demographic Health Survey (SADHS) of 2003, approximately 55% of women and 30% of men are considered overweight or obese.17 Disturbingly, youth appear to be following a similar pattern. For example, according to the South African Youth Risk Behaviour Survey of 2008, approximately 17% to 20% of youth aged 13 to 19 are overweight and 4% to 5% are considered obese.19
The continuing rise in prevalence of overweight and obesity in most ‘developed’ countries and in an increasing number of LMICs has been associated with a dramatic transition from diets constituted by ‘whole’ foods to diets increasingly composed of processed foods. Specific dietary components are associated with chronic diseases; for example, diets with high levels of saturated fat, salt, and refined carbohydrates are associated with cardiovascular disease and type II diabetes.23
In SA, limited data are available on individual or household dietary consumption patterns. Much of our knowledge of dietary patterns is derived from commercial sales statistics, a nationally representative survey of food consumption for children (one to nine years old), and small-scale dietary intake studies in various sub-populations throughout the country. These studies highlight the similarities and differences in diets according to SES, socio-demographic factors, and geography.23 For example, a 2011 study that investigated the prevalence of street food- and fast food consumption indicates that 19% of black Africans were considered frequent (≥ 2 a week) street food consumers in comparison to Indians (1.9%) and Whites (2.9%).24 Interestingly, when measuring fast food consumption, the rates were reversed: 14% of Indians, 12.5% of Whites, and 5.4% of Blacks were considered frequent consumers. Contrary to most developed nations, fast food consumption from large commercial outlets in SA is highest in high socio-economic groups.25
It is increasingly evident that an emerging trend of unhealthy ‘western’ eating is occurring in SA. A review undertaken in 2012 suggests that sugar consumption in SA is increasing.26 This is especially the case in regard to soft drink consumption. For example, from 1992 to 2010, per capita – per year consumption of Coca Cola products rose from 130 to 254 units.27 Furthermore, between 2005 and 2010 ready meals and snack bar sales increased by 43.1% and 42.6% respectively.27 Traditional diets, high in legumes and low in processed/refined carbohydrates, are being replaced by a ‘western’ diet that is implicated in NCDs.28 Although a noticeable difference in the dietary composition among South Africans still exists, the increasing changes to the food environment (discussed later) suggest that it is quite plausible that the ‘western’ unhealthy diet will one day be pervasive across the country.
Physical inactivity
Physical inactivity or sedentary lifestyles in general can be seen as a defining characteristic of modern life, especially in urban regions. Technological advancements, urbanisation, and infrastructural changes are some of the factors associated with sedentary lifestyles. This is of concern because physical inactivity is a risk factor for many NCDs. Aside from being a key determinant of body weight, physical activity is independently associated with a reduction in heart disease, type II diabetes, hypertension, and cancers of the breast and colon.29
In SA, an unfavourable trend of inactivity among youth appears to
be developing. The 2008 National Youth Risk Behaviour Survey indicates that an increasing number of youth (42% from 38% in 2002) neither participate in any activity nor perform a sufficient amount of exercise on a weekly basis.19
Alcohol misuse
Alcohol, when consumed in excess quantities, is associated with a wide range of social and biological maladies.30 In SA approxi-mately 12% of adolescents initiate alcohol use before they are 13 years old.31 Consumption patterns for adolescents (aged 13 to 19) between 1998 and 2008 largely remained the same. Although significant differences in alcohol consumption patterns between genders still exist, binge drinking among female adolescents, which was historically low, appears to be increasing.31
Social determinants
Social determinants generally refers to the conditions in which people live, work, and grow. The social determinants of health provide insight into how factors such as one’s employment, educational attainment, living accommodation, and ability to participate in society fully can affect the equitable distribution of health.
Employment, poverty and education
Poverty is the most obvious and significant determinant of poor health outcomes, which include many NCDs. Statistics South Africa data from 2012 Quarter 3 (the most recent data available at the time of writing) indicate that the unemployment rate is at a staggering 25%.32 Youth (15 to 24) are disproportionately affected, with an unemployment rate of 31.4%. Nationally, 22.3% of households receive their main source of income from grants.33 Provincial variation highlights the challenge of poverty. For example, 37.9% of the Eastern Cape population relies on grants for its main source of income, whereas this applies to only 10% of the Gauteng population.
The percentage of individuals aged 20 and older who had completed their Grade 12 increased from 21.5% in 2002 to 27.4% in 2011. Also, the percentage of people with no formal education decreased from 10.8% in 2002 to 6.5% in 2011.32
SA has a long history of occupational hazards, most notably in the mining sector.34 These hazards, which workers – often migrant labourers – have been exposed to for a long time, are strongly associated with COPD and other chronic diseases, and include tuberculosis.35
Accommodation
An important way of measuring standard of living is through the quality of accommodation. In SA, approximately 12.1% of the population resides in informal settlements.33 This section of the population is particularly concentrated in the Gauteng (20.4%), North West (18.4%), and the Western Cape (15.1%) provinces. Progress is being made in regard to living conditions. For example, the percentage of the population that received a government housing subsidy increased from 5.5% in 2002 to 9.5% in 2011. During the same period, the proportion of households connected to the main electricity supply increased from 76.8% to 82.7%.33

Chronic Non-communicable Diseases in South Africa 9
119SAHR 2012/13
Families that cook and heat their homes with biomass fuels such as wood substantially increase their risk of developing COPD and other conditions associated with indoor air pollutants.36 In SA, progress is slowly being made in eliminating this risk. For example, between 2002 and 2011 the proportion of households that used wood as a primary source of energy decreased from 19.7% to 13.3%.33 Moreover, the percentage of households that used electricity for cooking increased from 57.9% to 73.1% during the same period. The variation between provinces is significant. For example, in Limpopo approximately 44.5% of households cook with wood, whereas in Gauteng only 1.2% do so.33
Socio-economic status and behavioural risk factors
The relationship between SES and behavioural risk factors for NCDs in SA is beginning to follow a pattern that is commonly found in developed countries. For example, smoking and educational attainment (proxy for SES) are inversely related in SA.17 The 2003 SADHS17 showed that men who had only completed schooling up to grades 6 and 7 had a 35.4% prevalence of smoking. In comparison, men with an education level of higher than Grade 12 had a 22.3% prevalence of smoking.17 However, the evidence is not nearly as clear for risk factors such as obesity and hypertension.37 For example, a 2005 study in Limpopo, one of the poorest provinces in SA, reported that 51.7% of rural women are overweight or obese, which illustrates that risk factors for NCDs are not only present among the affluent.38 This observed phenomenon is perpetuated by the increasing penetration into poor communities of cheap processed and packaged food; the pattern of high obesity rates shifting from the affluent to the poor, which is commonly seen in the developed world, is likely to be occurring in SA already.
Structural and environmental determinants
The rise of NCDs in LMICs should be seen as a symptom of a larger transformative force. Globalisation has been increasingly altering the social, political, economic and environmental landscape over the past few decades. An important and fundamental feature of globalisation has been a dramatic increase in international trade and foreign direct investment, driven largely by multi-national corporations’ need to seek new markets to increase profits. In the following section, we use the food environment as a prime example of this transformative force.
Food environment
Food systems (production, manufacturing, and distribution) have undergone significant changes in the last few decades. These changes have resulted in a ‘nutrition transition’ in many LMICs as dietary consumption patterns have become more ‘westernised’.39 As a result of the growth of multi-national food corporations, the liberalisation of international food trade and investment, and an increase in the marketing of unhealthy food products, traditional diets, which were largely prepared from raw ingredients, are often being substituted by ready-made and energy-dense meals along with energy-dense and nutrient-deficient snacks.40 Much of this ready-made food is increasingly processed and linked to chronic diseases.41
In SA, this ‘transition’ has dramatically accelerated since the mid-90s when the post-apartheid government, under immense international pressure, opened the borders to an influx of trade and foreign direct investment. Since then, ‘Big Food’ (large commercial entities that dominate the food and beverage environment) has dominated the food supply by making its products more available and affordable. This has facilitated a shift in normative food culture, resulting in these products also becoming more acceptable.27 The increasing market share captured by large supermarket retailers and fast food outlets in urban and rural areas has catalysed a shift in dietary patterns. Many rural populations are purchasing the majority of their food in large supermarket chains that are heavily stocked with processed foods.42 Dietary diversity (the increasing quantity of available food options) is critical in preventing undernutrition and overnutrition; yet such healthier options are usually higher priced (especially when the costs of energy for cooking are included) and as a result out of reach for many South African families. For example, a study published in 2010 on the availability and price of healthy food options in rural Western Cape showed that for a family of five to purchase the healthier equivalents of their usual food items (e.g. whole wheat rather than white bread) would require an additional R1 090/month.43
Marketing of unhealthy products and behaviours
The diffusion of unhealthy products and behaviours could not have happened to the extent that it has, or certainly not as quickly, without the vigorous marketing efforts of many industries.
In SA, some progress has been made in limiting these marketing methods. In 1999, an amendment was made to the Tobacco Products Control Act, which prohibited the advertising and promotion of tobacco products.44 In 2007, an additional amendment was made to clarify various definitions, among other things, and close existing loopholes. These are important steps in cleansing the environment of posters, statements, and promotions that present tobacco products in a positive light.
Controlling the tobacco industry is supported by strong scientific evidence and political feasibility in several jurisdictions. This is not necessarily the case for other unhealthy products such as alcohol and food, for which there has been less success in regulation. For example, around R2 billion is spent annually in SA on marketing alcoholic beverages.45 Children are also bombarded with images that support unhealthy food options and diets. For example, a study undertaken in 2006 examined the content of commercial food advertisements during children’s television programming and found that over half of the food advertisements were for products that were of poor nutritional quality.46
Cultural determinants
Many traditional and cultural factors contribute to the increase in NCDs in SA. Various factors are altering the way of life for many South Africans. Arguably, no greater force exists than the increasing role that corporations play in ‘manufacturing lifestyles’ by affecting an individual’s tastes, desires, preferences, and activities.47 A disturbing trend that is contributing to a sedentary lifestyle for South African youth is the rise in television viewing. In 2008, 29% of South African youth reported viewing more than three hours of television

120 SAHR 2012/13
a day, in comparison to 25% in 2002.17 Another cultural factor that is contributing to the increasing risk of NCDs is the perception that many black women in SA hold, which is that being overweight is considered attractive, appropriate, and a sign of affluence and success.48 These beliefs appear to be prevalent in adolescents and are likely to be a strong factor in preventing many females from addressing their weight.49
Interventions to address chronic NCDs
Responding to chronic NCDs and their risk factors, a menu of interventions and strategies exists in SA. In line with the determinants of chronic NCDs, as outlined in Figure 1, interventions addressing NCDs can be grouped as those addressing the health service management of chronic NCDs which respond to biological risks including ensuring secondary prevention once disease is present; community-based responses, which respond to behavioural and societal risks; and broader policy or structural interventions. These interventions are described in more detail below.
Health service management of chronic NCDs
Health management of chronic NCDs comprises a package of care whose primary aim is to improve the health outcomes of the individual. Interventions that focus on individuals are as important as the population-based approaches to NCDs in the management and control of these conditions. This means that it is important to complement population-wide approaches with healthcare interventions for individuals who already have NCDs or who are at high risk of developing them.50,51 In SA people with chronic NCDs have access to health services through the private and public sectors. However, the health services have done little to identify those at risk and intervene. The focus has been primarily on management and the control and prevention of complications among individuals who are already diseased. A 2008 publication by Steyn and colleagues reported suboptimal primary care for patients with hypertension at public sector community health centres.52 The study was, however, based on a primary care audit conducted in the Western Cape Province that took place in 1999.52 There is a dearth of similar systematic audits, thus making it difficult to assess the current status of primary care management in public sector facilities. The government has adopted the primary health care (PHC) re-engineering strategy as a means of strengthening the effectiveness of the current health system. This approach, which is being piloted in several districts, has great potential to address NCDs comprehensively as it will focus on health promotion, disease prevention and referral for curative care to improve health outcomes.53 Furthermore, this approach will build the capacity of community health workers in the management of chronic conditions.
To strengthen the management of chronic diseases further the Practical Approach to Lung Health and HIV/AIDS (PALSA PLUS) programme has been expanded to address 40 common presenting symptoms and 20 chronic conditions.54 This is a standardised symptom-based approach to routine care of chronic disease and has been piloted in certain provinces in SA. It has improved the cost effectiveness of care for patients with chronic diseases, such as diabetes, hypertension, and chronic respiratory diseases, and the detection of depression.54
Community-based interventions
Community prevention programmes are important in influencing behaviours and health beliefs and for this reason such initiatives can be empowering to communities. The initiatives that are listed in Table 1 include programmes provided by a private medical aid company, government and research institutions. The interventions mentioned focus on one or two risk factors only; this shows that there is a lack of intervention programmes that encompass several risk factors.
Policy responses
Food-related policies
According to Charlton et al., in 2007 salt intake among South Africans exceeded the international guidelines of <6 g salt/day and the greatest contributing source of salt was bread.63 In response the government has drafted Regulations in the Foodstuffs, Cosmetics and Disinfectants Act (Act 54 of 1972), published in the Government Gazette (11 July 2012) to reduce the salt intake in processed foods.64 The process of reducing salt will occur in phases and food manufacturers will have until June 2016 to comply with the first set of sodium targets and another two years to reach the next targets.
Trans fatty acids have been found to increase the risk of cardio-vascular diseases and, according to the WHO, the recommended amount of energy that can be derived from trans fatty acids should not exceed 1% of the daily energy consumption. In order to prevent the problems caused by trans fatty acids, Regulations relating to trans fat in foodstuffs were passed in the Foodstuffs, Cosmetics and Disinfectants Act, 1972 in 2011.65 Under these Regulations, the sale, manufacturing and importation of any processed foods that exceed 2 g per 100 g of partially hydrogenated fats and oils are prohibited. However, these Regulations are not specific about the labelling of naturally produced trans fatty acids and, therefore, companies such as those in the dairy industry will not be affected by the Regulations. This means that the content of fatty acids in products may exceed 2 g per 100 g if the trans fatty acids in these products are not industrially produced.
New food labelling and advertising legislation came into being in March 2012. This legislation will ensure that food labels and advertising conform to a standard format. Furthermore, according to the amended Regulations, any claims used on food labels and in advertising will be removed. This will ensure that consumers are not misguided by false health claims.
Tobacco control
Tobacco control is said to be one of the most effective programmes for the prevention of cardiovascular disease in the world.66 SA has implemented progressive policies for tobacco control. Since 2008, several amendments have been made to the Tobacco Act 1993. In March 2012, a Regulation in the Tobacco Products Control Act, (Act 83 of 1993) was passed to prohibit smoking in public places and certain outdoor public places. The Regulation is aimed at protecting the public from the dangers of passive smoking.67

Chronic Non-communicable Diseases in South Africa 9
121SAHR 2012/13
Table 1: Examples of initiatives and programmes targeting chronic NCDs in South Africa
Programme Programme Description Programme Outcome
Discovery Vitality55,56 •Created by Discovery Insurance, this programme encourages members to lead healthier lifestyles by providing incentives, with the goal of lowering future healthcare costs
•Participants assess their health status, then participate in activities intended to improve their health (e.g. joining a gym, buying nutritious food)
•Completing an activity rewards the member with points, which accumulate to achieve blue, bronze, silver, or gold status
•Higher status allows the member to access higher levels of travel, leisure, and shopping discounts
•As of 2006, the programme had 591 134 members•Members with higher point statuses were found to
have lower costs per patient, shorter stays in hospital, and fewer admissions compared with those less engaged
•Admission rates were 7.4% lower for cardiovascular disease, 13.2% lower for cancers, and 20.7% lower for endocrine and metabolic diseases in the highly engaged group compared with those less engaged
HealthKick57,58 •Commenced in 2007 as an intervention among school-aged children to promote healthier diets and more physical activity
•Took place in 16 low-income disadvantaged urban and rural schools in the Western Cape
•Eight intervention schools were provided with an action planning process, and provided with a toolkit containing lesson plans, informational resources, and physical activity equipment to carry out the programme
•The control schools were given printed resources, but no help in implementing the programme
•Outcome and process evaluations are ongoing
Moving Matters59-61 •A programme for school children in grades 4 to 7 intended to improve the motor skills necessary for them to participate in physical activities successfully
•Focuses on balance, manipulation, and locomotion•Teachers are provided with a manual of lesson plans,
and learners are provided with an activity manual and equipment bag
• In 2011, 62 schools in Gauteng and the Eastern Cape participated
Siyadlala62 •A programme created by Sports and Recreation South Africa intended to increase participation in organised sports in disadvantaged communities in order to increase health and mobilise the community
•Hub and activity coordinators are trained in sports coaching, first aid, project planning, and events management
•Participation is encouraged among youth, the elderly, women, and people with disabilities
• In the Western Cape, 35 hubs were established to target six regions
• Identifies young talent and offers them support for further development
Smoking rates have decreased in SA; however, this may be unrelated to the country’s tobacco control policies. Peer and colleagues observed in 2009 that the decrease in smoking had been higher among the poor and this may be attributed to the increase in tax imposed on tobacco products.68 A positive outcome of the decline in smoking rates has been its consistency with the stabilisation in the number of smoking-related cardiovascular deaths.69
Recently the National Department of Health (NDoH) has made further amendments to the Tobacco Act (August 2012) by passing a draft Regulation that relates to the display of tobacco products at wholesale and retail outlets. Studies have shown that tobacco displays at retail stores are an important form of advertising and promoting tobacco products and such advertising has been linked to increased tobacco sales and use.70 Such legislation may assist in decreasing sales by making smoking less enticing.
Alcohol control
NCDs such as cancer, cardiovascular disease, liver disease, pancreatitis and diabetes have been linked to alcohol consumption.71 Despite this link, alcohol control has had little effect on reducing the rates of alcohol misuse.72
Studies in several countries have found that alcohol advertising has an influence on young people’s behaviours.73 Current national policies to reduce alcohol consumption in SA include restrictions on alcohol advertising and counter-advertising, regulation of retail alcohol sales, control of alcohol packaging, and increased alcohol taxation.31
Several new policies have been proposed at the national and provincial levels, but have not yet been implemented. Among these policies is a Bill that would ban all alcohol-related advertising in SA.74 However, the Bill has been met by strong opposition from the Department of Trade and Industry because of its economic implications.

122 SAHR 2012/13
Several provinces such as the Western Cape have formulated their Liquor Act to include trading hours; however, days and hours in which liquor can be sold in these provinces will be determined by the municipalities. The proposed Gauteng Liquor Bill of 2011 intended to prohibit the sale of alcohol to pregnant women in an effort to reduce foetal alcohol syndrome.75 The proposal drew criticism for limiting gender equity.
Proposed national policy and strategy for NCDs
Government has made progress in formulating and implementing population-wide interventions as highlighted in the section above. However, there are still a number of interventions that need to be focused on. Box 1 below outlines national policy and strategies that should be considered to address the main risk factors for NCDs.
Box 1: Population-wide interventions to promote healthy diet, physical activity, healthy environment and no smoking or harmful alcohol use
❖ Strengthen tobacco control, particularly among young people, and decrease passive smoke exposure of children in the home
❖ Support quitting-smoking programmes
❖ Promote healthy eating patterns that are low in fat and sugar and high in fruit and vegetables, in part by addressing access through intersectoral programmes that involve the agricultural sector
❖ Restrict access to alcohol (through addressing physical availability and pricing) and extend alcohol control legislation (particularly in the areas of alcohol marketing, and drinking and driving)
❖ Promote physical activity in schools and workplaces, and through urban planning for active commuting and access to safe public green space
❖ Reduce exposure to indoor biomass pollutants through electrification of households
❖ Control air pollution, including through reviewing and enforcing legislation related to polluted places of work
❖ Develop media and communication strategies to prevent NCDs
❖ Tax unhealthy foods and subsidise healthy foods
❖ Restrict import of processed foods
Source: Adapted from Bradshaw, Steyn, Levitt and Nojilana, 2011.76
Challenges in research and surveillance for NCDs
Strategic planning and effective policy development to address NCDs require a functional information system to track NCDs and their risk factors. Programmes and activities in epidemiological surveillance and research form the basis of an information system that would enable the assessment and monitoring of disease trends. Where set appropriately, this system would not only allow the measurement of health status (i.e. mortality and morbidity related to NCDs) but also track the prevalence of NCD risk factors and would be able to measure behavioural and social determinants of health. Unfortunately, these information systems are limited in SA.
Funding opportunities for research related to chronic NCDs are scarce. This has resulted in a large proportion of studies being cross-sectional and descriptive in nature, and often sub-national in extent, which makes them of limited generalisability. National surveys such as the Demographic and Health Survey and the Youth Risk Behaviour Survey have not been conducted in the past five years. However, in 2011-2012 the Human Sciences Research
Council launched the South African National Health and Nutrition Examination Survey, which will provide comprehensive information on the health and nutritional status of males and females of all ages in support of the priority health indicators of the NDoH.77
There are very few cohort studies in SA. Prospective cohort studies can provide valuable information on the association between the exposure to risk factors and health outcomes; they can help in calculating the incidence rate in both the exposed and non-exposed and can permit the assessment of multiple outcomes in the same study. Existing cohort studies include the “birth-to-twenty” cohort, which is a study of more than 3 200 children and their families in Soweto, Johannesburg.78 SA is also part of the Prospective Urban Rural Epidemiology (PURE) study, which is a global adult cohort study of 17 countries and more than 150 000 participants.79 Two PURE study sites have been set up in SA, with participants drawn from urban and rural communities in three provinces: North West, Eastern Cape and Western Cape. The PURE investigation in the country is led by researchers at the North West University and the University of the Western Cape and over 2 000 participants are enrolled at each site.
Also useful in providing epidemiological data to track NCDs and their risk factors in SA are health and socio-demographic surveillance sites (HSDSSs). In SA these include the Agincourt HSDSS and Africa Centre site in Hlabisa.80,81 However, these HSDSSs are currently based in rural parts of the country. A need exists to expand this work to different parts of the country so that issues such as rural-urban differences in NCDs, societal differences in NCDs and, more importantly, the drivers of the risk factors can be identified.
Conclusion
Chronic NCDs among South Africans are on the rise. Although NCDs affect all population groups, the poor are at increased risk because of their exposure to structural and environmental factors that are beyond their control.
The good news is that the South African government has made significant strides in formulating and implementing policies to address NCDs. These policies include strengthening tobacco control; enforcing Regulations relating to food; and implementing policies to reduce alcohol use.
Public health interventions need to be targeted at individual behavioural risk factors; however, these interventions need to be implemented in conjunction with policy responses whose aim is to address the structural environment in which these risk factors are shaped.
In addition there is a need to focus on structural determinants of health as they are more distal than behavioural risk factors, which both health professionals and government tend to emphasise. Future research should focus on defining and tracing the explicit pathways through which structural determinants affect health.

Chronic Non-communicable Diseases in South Africa 9
123SAHR 2012/13
Recommendations ➢ Comprehensive and integrated actions should be developed
to prevent and control NCDs. A multisectoral approach needs to be adopted, including at policy and implementation levels.
➢ Actions to prevent NCDs should include:
- Policies to deal with the built environment in order to address physical inactivity;
- Community interventions that target those at risk and those already affected to prevent complications; and
- Risk assessment tools applied at community level that identify those at risk and can be used by less qualified health workers such as community health workers.

124 SAHR 2012/13
References
1 United Nations. General Assembly. Sixty-sixth sessions. 3rd plenary meeting; New York, NY. 19 September 2011.
2 Puoane T, Tsolekile L, Parker W, Sanders D. Chronic non-communicable diseases. In: Barron P, Roma-Reardon J, editors. South African Health Review 2008. Durban: Health Systems Trust; 2008.
3 World Health Organization. Global status report on non-communicable diseases 2010. Geneva, Switzerland: World Health Organization; 2011.
4 Norman R, Bradshaw D, Schneider M, Joubert J, Groenewald P, Lewin S, et al. South African Comparative Risk Assessment Collaborating Group. A comparative risk assessment for South Africa in 2000: Towards promoting health and preventing disease. S Afr Med J. 2007;97:637-41.
5 National Department of Health. Summit on Prevention and Control of Non-Communicable Diseases [Internet]. 2011 [cited 01 November 2012]. URL: http://www.doh.gov.za/eventlist.php?eid=5
6 Joubert J, Bradshaw D. Population ageing and health challenges in South Africa. In: Steyn K, Fourie J, Temple N, editors. Chronic diseases of lifestyle in South Africa: 1995-2005. Technical Report. Cape Town: Medical Research Council; 2006.
7 Freeman M. Non-communicable diseases of high burden but low mortality. Pretoria: National Department of Health; 2011.
8 Meyers J, Naledi T, Corrigal J, Pienaar D, Matzopoulos R, Bourne D, et al. Western Cape Burden of Disease Reduction Project. Volume 1 of 7: Overview of the report. Executive summaries of volumes 2-7. Cape Town: Western Cape Government; 2007.
9 Diamond J. The double puzzle of diabetes. Nature. 2003;423(6940):599-602.
10 Bajaj M, Banerji MA. Type 2 diabetes in South Asians: A pathophysiologic focus on the Asian-Indian epidemic. Curr Diab Rep. 2004;4(3):213-18.
11 Steyn K, Goldberg YP, Kotze MJ, Steyn M, Swanepoel ASP, Fourie JM, et al. Estimation of the prevalence of familial hypercholesterolaemia in a rural Afrikaner community by direct screening for three Afrikaner founder low density lipoprotein receptor gene mutations. Hum Genet.1996;98(4):479-84.
12 World Health Organization. Programming of chronic disease by impaired fetal nutrition: Evidence and implications for policy and intervention strategies. Geneva, Switzerland: World Health Organization; 2002.
13 Lynch J, Smith GD. A life course approach to chronic disease epidemiology. Annu Rev Public Health. 2005;26:1-35.
14 Steyn K, De Wet T, Saloojee Y, Nel H, Yach D. The influence of maternal cigarette smoking, snuff use and passive smoking on pregnancy outcomes: The birth to ten study. Paediatr Perinat Epidemiol. 2006;20(2):90-9.
15 World Health Organization. Report on global tobacco epidemic. Geneva, Switzerland: World Health Organization; 2008.
16 Yach D, Wipfli H, Hammond R, Glantz S. Globalization and tobacco. In: Kawachi I, Wamala S, editors. Globalization and Health. Oxford, UK: Oxford University Press; 2007.
17 National Department of Health, Medical Research Council. South Africa Demographic and Health Survey 2003. Pretoria: National Department of Health; 2007.
18 Parkin DM, Sitas F, Chirenje M, Stein L, Abratt R, Wabinga H. Part I: Cancer in indigenous Africans – Burden, distribution, and trends. The Lancet Oncol. 2008;9:683-92.
19 Reddy SP, James S, Sewpaul R, Koopman F, Funani NI, Sifunda S, et al. Umthente Uhlaba Usamila – The South African Youth Risk Behaviour Survey 2008. Cape Town: Medical Research Council; 2010.
20 Zimmet P, Alberti KGMM, Shaw J. Global and societal implications of the diabetes epidemic. Nature. 2001;414(6865):782-7.
21 Health24. Fat South Africans in denial [Internet]. 2010 [cited 12 December 2012]. URL: http://www.health24.com/news/Weight_management_Obesity/1-955,58238.asp
22 Joubert J, Norman R, Bradshaw D, Goedecke JH, Steyn NP, Puoane T. Estimating the burden of disease attributable to excess body weight in South Africa in 2000. S Afr Med J. 2007;97(8 Pt 2):683-90.
23 Steyn NP. Nutrition and chronic diseases of lifestyle in South Africa. In: Steyn K, Fourie J, Temple N, editors. Chronic diseases of lifestyle in South Africa: 1995-2005. Technical Report. Cape Town: Medical Research Council; 2006.
24 Steyn N, Labadarios D. Street foods and fast foods: How much do South Africans of different ethnic groups consume? Ethn Dis. 2011;21(4):462-6.
25 Steyn N, Labadarios D, Nel J. Factors that influence the consumption of street foods and fast foods in SA. BMC Nutr J. 2011;10:104.
26 Steyn N, Temple N. Evidence to support a food-based dietary guideline on sugar consumption in South Africa. BMC Public Health. 2012;12(1):502.
27 Igumbor EU, Sanders D, Puoane TR, Tsolekile L, Schwarz C, Purdy C, et al. Big food, the consumer food environment, health, and the policy response in South Africa. PLoS Med. 2012;9(7):e1001253.
28 Pretorius S, Sliwa K. Perspectives and perceptions on the consumption of a healthy diet in Soweto, an urban African community in South Africa. SA Heart Journal. 2011;8(3):178-83.
29 World Health Organization. Global strategy on diet, physical activity and health [Internet]. 2009 [cited 12 October 2012]. URL: http://www.who.int/dietphysicalactivity/pa/en/index.html
30 Rehm J, Baliunas D, Borges GLG, Graham K, Irving H, Kehoe T, et al. The relation between different dimensions of alcohol consumption and burden of disease: An overview. Addiction. 2010;105(5):817-43.
31 Ramsoomar L, Morojele NK. Trends in alcohol prevalence, age of initiation and association with alcohol-related harm among South African youth: Implications for policy. S Afr Med J. 2012;102(7):609-12.
32 Statistics South Africa. Quarterly labour force survey: Quarter 3 (July to September). Pretoria: Statistics South Africa; 2012.
33 Statistics South Africa. General Household Survey 2011. Pretoria: Statistics South Africa; 2011.
34 Ehrlich R. A century of miners’ compensation in South Africa. Am J Ind Med. 2012;55(6):560-9.
35 Girdler-Brown BV, White NW, Ehrlich RI, Churchyard GJ. The burden of silicosis, pulmonary tuberculosis and COPD among former Basotho goldminers. Am J Ind Med. 2008;51(9): 640-7.

Chronic Non-communicable Diseases in South Africa 9
125SAHR 2012/13
36 World Health Organization. Indoor air pollution and health. Fact sheet No 292. Geneva, Switzerland: World Health Organization; 2011.
37 Puoane T, Steyn K, Bradshaw D, Laubscher R, Fourie J, Lambert V, et al. Obesity in South Africa: The South African Demographic and Health Survey. Obes Res. 2002;10(10):1038-48.
38 Alberts M, Urdal P, Steyn K. Stensvold I, Tverdal A, Nel JH, et al. Prevalence of cardiovascular diseases and associated risk factors in a rural black population of South Africa. Euro J Cardiovasc Prev Rehabil. 2005;12(4):347-54.
39 Popkin BM. The nutrition transition and obesity in the developing world. J Nutr. 2001;131(3):8715-35.
40 Labonté R, Mohindra K, Lencucha R. Framing international trade and chronic disease. Global Health. 2011;7(1):21.
41 Cordain L, Eaton SB, Sebastian A, Mann N, Lindeberg S, Watkins BA, et al. Origins and evolution of the Western diet: Health implications for the 21st century. Am J Clin Nutr. 2005;81(2):341-54.
42 D’Haese M, Van Huylenbroeck G. The rise of supermarkets and changing expenditure patterns of poor rural household’s case study in the Transkei area, South Africa. Food Policy. 2005;30(1):97-113.
43 Temple NJ, Steyn NP, Fourie J, De Villiers A. Price and availability of healthy food: A study in rural South Africa. Nutrition. 2011;27(1):55-8.
44 Republic of South Africa. Tobacco Products Control Amendment Act (Act 12 of 1999).
45 Parry C, Burnhams NH, London L. A total ban on alcohol advertising: Presenting the public health case. SAMJ. 2012;102(7):602-4.
46 Temple NJ, Steyn NP, Nadomane Z. Food advertisements on children’s programmes on TV in South Africa. Nutrition. 2008;24(7):781-2.
47 Freudenburg N. The manufacture of lifestyle: The role of corporations in unhealthy living. J Public Health Policy. 2012;33(2):244-56.
48 Puoane T, Fourie JM, Shapiro M, Rosling L, Tshaka NC, Oelefse A. ‘Big is beautiful’ – an exploration with urban black community health workers in a South African township. South Afr J Clin Nutr. 2005;18(1):6-15.
49 Puoane T, Tsolekile L, Steyn N. Perceptions about body image and sizes among black African girls living in Cape Town. Ethn Dis. 2010;20(1):29-34.
50 World Health Organization. Action plan for the global strategy for the prevention and control of non-communicable diseases. Geneva, Switzerland: World Health Organization; 2008.
51 World Health Organization. Prevention of cardiovascular disease: Guidelines for assessment and management of total cardiovascular risk. Geneva, Switzerland: World Health Organization; 2007.
52 Steyn K, Levitt NS, Patel M, Fourie J, Gwebushe N, Lombard C, et al. Hypertension and diabetes: Poor care for patients at community health centres. SAMJ. 2008;98(8):618-22.
53 National Department of Health. Controlling non-communicable diseases through health system strengthening: Concept paper for discussion at NCD summit-2011. Pretoria: National Department of Health; 2011.
54 Knowledge Translation Unit University of Cape Town Lung Institute. Primary care 101 [Internet]. 2011 [cited 05 October 2012]. URL: http://www.knowledgetranslation.co.za/content/programmes_101.html
55 Western Cape Government. Discovery Vitality. Cape Town: Western Cape Government; 2011.
56 Patel DN, Lambert EV, da Silva R, Greyling M, Nossel C, Noach A, et al. The association between medical costs and participation in the Vitality Health promotion program among 948,974 members of a South African health insurance company. Am J Health Promot. 2010;24(3):199-204.
57 Draper CE, de Villiers A, Lambert EV, Fourie J, Hill J, Dalais D, et al. HealthKick: A nutrition and physical activity intervention for primary schools in low-income settings. BMC Public Health. 2010;10:398.
58 De Villiers A. HealthKick: A school-based nutrition & physical activity intervention in disadvantaged school settings in the Western Cape, South Africa. Cape Town: Western Cape Government; 2012.
59 Nkosi B. Getting South Africa’s kids moving [Internet]. 28 June 2011 [cited 29 October 2012]. URL: http://www.mediaclubsouthafrica.com/index.php?option=com_content&view=article&id=2430:chiawelo&catid=42:landnews&Itemid=110
60 Mail & Guardian. Moving the nation towards good health [Internet]. March 2010 [cited 29 October 2012]. URL: http://www.movingmatters.co.za/information/mail-and-guardian.pdf
61 City of Johannesburg. Soweto children to get active [Internet]. 28 June 2011 [cited 29 October 2012]. URL: http://www.joburg.org.za/index.php?option=com_content&view=article&id=6806&
62 Western Cape Government. Siyadlala Community Mass Participation Programme [Internet]. 2012 [cited 29 October 2012]. URL: http://www.westerncape.gov.za/eng/directories/services/11548/10009
63 Charlton KE, Steyn K, Levitt D. Dietary intervention lowers blood pressure in South Africans with hypertension. Cape Town: Medical Research Council; 2007.
64 Republic of South Africa. Foodstuffs, Cosmetics and Disinfectants Act (Act 54 of 1972). Regulation no. R. 533. 11 July 2012.
65 Republic of South Africa. Foodstuffs, Cosmetics and Disinfectants Act (Act 54 of 1972). Regulation no. R.127. 17 February 2011.
66 Frieden T. A framework for public health action: The health impact pyramid. Am J Public Health. 2010;100(4):590-5.
67 Republic of South Africa. Tobacco Products Control Act (Act 83 of 1993). Regulation no. R. 264. 30 March 2012.
68 Peer N, Bradshaw D, Laubscher R, Steyn K. Trends in adult tobacco use from two South African demographic and health surveys conducted in 1998 and 2003. SAMJ. 2009;99(100):744-9.
69 Mayosi B, Flisher A, Lalloo U, Sitas F, Tollman SM, Bradshaw D. The burden of non-communicable diseases in South Africa. The Lancet. 2009;374(9693):934-47.
70 Carter SM. New frontier, new power: The retail environment in Australia’s dark market. Tob Control. 2003;12(Suppl III):iii95-iii101.
71 Parry C, Patra J, Rehm J. Alcohol consumption and non-communicable diseases: Epidemiology and policy implications. Addiction. 2011;106(10):1718-24.
72 Parry CDH, Myers B, Morojele NK, Flisher AJ, Bhana A, Donson H, et al. Trends in adolescent alcohol and other drug use: Findings from three sentinel sites in South Africa (1997-2001). J Adolesc. 2004;27(4):429-40.

126 SAHR 2012/13
73 Anderson P, de Bruijn A, Angus K, Gordon R, Hastings G. Impact of alcohol advertising and media exposure on adolescent alcohol use: A systematic review of longitudinal studies. Alcohol Alcohol. 2009;44:229-43.
74 Paton C. Battle looms over shock move to ban liquor ads. Business Day [newspaper online].16 April 2012 [cited 12 December 2012]. URL: http://www.bdlive.co.za/articles/2012/04/16/battle-looms-over-shock-move-to-ban-liquor-ads
75 IOL News. Gauteng liquor bill ‘hard to enforce’. IOL News [newspaper online]. 06 February 2012 [cited 12 December 2012]. URL: http://www.iol.co.za/news/politics/gauteng-liquor-bill-hard-to-enforce-1.1228226#.ULNH42c81Kx
76 Bradshaw D, Steyn K, Levitt NS, Nojilana B. Non-communicable diseases – A race against time. Cape Town: Medical Research Council [Policy Brief]. 2011 [cited 10 December 2012].URL: http://www.mrc.ac.za/policybriefs/raceagainst.pdf
77 Human Sciences Research Council. The South African National Health and Nutrition Examination Survey, 2011/2012. Pretoria: Human Sciences Research Council; 2012.
78 Richter L, Norris S, Pettifor J, Yach D, Cameron N. Cohort profile: Mandela’s children: The 1990 birth to twenty studies in South Africa. Int J Epidemiol. 2007;36(3):504-11.
79 Teo K, Chow CK, Vaz M, Rangarajan S, Yusuf S. The PURE Investigators Writing Group. The Prospective Urban Rural Epidemiology (PURE) study: Examining the impact of societal influences on chronic non-communicable diseases in low-, middle- and high income countries. Am Heart J. 2009;158(1):1-7.
80 Kahn K, Collinson MA, Gomez-Olive FX, Mokoena O, Twine R, Mee P, et al. Profile: Agincourt Health and Socio-demographic Surveillance System. Int J Epidemiol. 2012;41(4):988-1001.
81 INDEPTH Network. Africa Centre Demographic Information System (ACDIS) HDSS, South Africa. Mtubatuba: Africa Centre. Undated [cited 10 December 2012]. URL: http://www.indepth-network.org/leadership/Africa%20Centre%20HDSS.pdf

Authors:
127SAHR 2012/13
10101010101010
Jonathan Elliot MyersHanna-Andrea Rother
Centre for Occupational and Environmental Health Research, School of Public Health & Family Medicine, University of Cape Town
Public Health Impact of and Response to Climate Change in South Africa
Additional stress on the health system due to climate
change underscores the importance of health system
strengthening, primary health care re-engineering
and the rolling out of the National Health Insurance
system.
This chapter reviews recent developments relating to the impact of climate change on health and health services in South Africa. Since the COP-17 meeting in Durban in 2011, climate change policy developments have
increased in all three tiers of government. Policies have mostly been general in scope and have not focused specifically on the health sector, with a few notable exceptions. A national climate change and health adaptation policy has been finalised. At least two provinces, the Western Cape and KwaZulu-Natal, have climate change strategy documents, and the City of Cape Town and eThekwini municipalities have specific climate change and health adaptation policies.
As the southern African region becomes hotter and drier, climate-sensitive aspects of the burden of disease are being identified. Analysis of disease trends and linkage of climate scenarios to future health impacts allows predictions according to which health systems responses can be planned. The climate readiness of health and related facilities and emergency responses is starting to be audited by government. Additional stress on the health system due to climate change underscores the importance of health system strengthening, primary health care re-engineering and the rolling out of the National Health Insurance system. Responses to climate change, whether by mitigation of its effects or adaptation to them, will require strong and effective intersectoral organisation and effort within government at all levels along with interdisciplinary research and prevention efforts. Examples of the implementation of these responses are provided by the Western Cape Province and City of Cape Town.

128 SAHR 2012/13
Introduction
Reflection on public health responses to climate change in South Africa (SA) provides a gauge of whether or not health is truly playing a central role in the climate change arena. Chapter 12 of the 2010 South African Health Review (SAHR) set the stage for consideration of global and South African impacts of climate change on health and health services.1 McMichael, in his chapter on Climate change and human health, included in a Commonwealth Health Minister’s Update publication in 2009, puts it succinctly “human health can – indeed should – be viewed as the real ‘bottom line’ of climate change consequences”.2
In recent years increasing attention has been paid to the risks related to health, and subsequently health services. The most notable in terms of global developments was the hosting of the first Global Climate and Health Summit organised by Health Care Without Harm3 at the Conference of the Parties (COP)-17 in Durban. This Summit culminated in the Durban Declaration on Climate and Health4 and the sounding of an urgent call to action from the health sector.5 The Durban Declaration (Box 1) highlighted the need to recognise the health benefits of climate mitigation and to take steps to reduce global greenhouse gas emissions; ensure greater health sector representation on national delegations; and actively include
the participation of women and youth and indigenous people in the climate change process. A global call whereby public health practitioners, healthcare professionals and health government officials, among others, are called to endorse the Call to Action and to take concerted effort was also made (Box 2).
As alluded to above there is an increasing focus on the carbon footprint of health care. The Sustainable Development Unit of the United Kingdom’s National Health System has developed valuable guidance materials relevant for SA for reducing carbon emissions from health care.6 ‘Greening’ the health sector is an increasingly articulated goal worldwide, and Health Care Without Harm has set up a global ‘green’ hospital network with a detailed global agenda for action that is pertinent to the South African health sector.7
The 2012 Climate Vulnerability Monitor report of the Climate and Health Alliance entitled Cold Calculus for a Hot Planet estimates the cost of failure to act on climate change at US$ 1.2 trillion, with 400 000 excess deaths annually and an increase in this number to 700 000 by 2030.8 To put this in perspective, the World Health Organization (WHO) estimates that there are 80 000 malaria-, 60 000 extreme weather event-, 2.2 million diarrhoea-, and 3.5 million undernutrition-related deaths annually.9 AIDS, which has
Box 1: Durban Declaration on Climate and Health, Durban, 4 December, 2011
The World Health Organization predicts that unmitigated climate change will lead to significant increases in illness and death brought on by environmental changes. These include the spread of cholera, malaria, dengue and other diseases; the compromising of agricultural production and food security; an increase in extreme weather events, floods, droughts, heat waves and more. The health of many communities is already suffering as a consequence of climate change.
Indeed, according to the Lancet, climate change is the greatest global health threat of the 21st century.a
At the same time, there is strong evidence that action on climate change can deliver significant and immediate benefits to health. For instance, lowering greenhouse gas emissions from fossil fuels will also simultaneously reduce harmful air pollution that negatively impacts the health of millions of people around the world.
Here in Durban, at the UNFCCC’s 17th Conference of the Parties, the world’s governments have an opportunity to confront this threat and agree upon solutions. Governments can commit to reduce greenhouse gas emissions in a manner that is equitable, as well as economically and ecologically viable. Such effective and immediate action to mitigate climate change would protect and advance global public health.
An agreement that aims to avoid dangerous climate change, keeping global temperature rise below 2 degrees Celsius, must promote a transition from fossil fuels to clean, renewable energy and low carbon economies. It must foster major emissions reductions from those who pollute the most, while providing support for those least responsible for the crisis to develop a low carbon pathway that meets peoples’ needs. Such an agreement would have the added benefit of protecting local communities and large urban populations from the immediate health impacts of fossil fuel production and combustion, thereby reducing healthcare costs and saving lives.
Without such an agreement, climate change will increase the global burden of disease and deepen health inequities between and within countries. This will raise health care costs worldwide, while undermining and overwhelming public health infrastructure in both rich and poor countries. The overwhelming burden will fall on the most vulnerable – those living in poor countries, who have contributed least to greenhouse gas emissions.
Having gathered at the first Global Climate and Health Summit, in Durban on December 4, 2011, we—as health professionals, public health advocates, and healthcare policy makers from more than 30 countries-°©‐-°©‐ hereby call on national delegations to the UNFCCC’s 17th Conference of the Parties to:
❖ Recognize the health benefits of climate mitigation and take bold and substantive action to reduce global greenhouse gas emissions in order to protect and promote public health.
❖ Ensure greater health sector representation on national delegations as well as within key mechanisms of the UNFCCC, recognizing the role of the World Health Organization as the voice for public health within the UN system.
❖ Actively include the participation and empowerment of youth, women and indigenous peoples in the climate change processes.
❖ Adopt a strong second commitment period of the Kyoto Protocol which currently includes emission reduction targets for the time until 2012, to protect and continue the only binding climate law the world has;
❖ By 2015, negotiate a fair, ambitious and binding agreement that, consistent with the Prescription for a Healthy Planet, endorsed by more than 130 health organisations in Copenhagen in 2009: - Places the protection of human health as a primary objective of any agreement. - Establishes an ambitious fair shares framework to reduce global emissions (based on the principles of Equity and Common but Differentiated
Responsibilities and Respective Capabilities) in order to avoid a global public health disaster. - Fosters both energy efficiency and clean, renewable energy that protects public health by reducing both local and global pollution. - Provides the immediate necessary resources to operationalize the Green Fund, and in the longer term, appropriate mitigation and adaptation
funding required to address the health impacts of climate change, assuring all countries’ Rights to Sustainable Development and their ability to pursue a low carbon development pathway.
a “Managing the Health Effects of Climate Change” The Lancet, Volume 373, Issue 9676, Pages 1693-1733, 16 May 2009.

Public Health Impact of and Response to Climate Change 10
SAHR 2012/13 129
a major impact on the health system, has claimed at least one million lives annually in sub-Saharan Africa since 1998. A large proportion of these deaths occurred in SA – the country with the largest number of HIV-infected people in the world. In 2010, 5.6 million people were infected with the virus.10 Thus in SA, the impact of climate change is thought to be significant and will undoubtedly further stretch the capacity of the country to cope with an already high burden of disease that absorbs substantial public and private sector health resources
This chapter sets out to examine the impact of climate change on health and health services in SA. The conceptual approaches to examining the impact of climate change are first explored, followed by a presentation of findings from key literature on the topic, and a review of recent publications and activities since the 2010 edition of the SAHR. Public health sector responses, including integration approaches, and barriers and enablers are presented. The chapter concludes with a set of recommendations.
Conceptual approaches to examining the impact of climate change
Assessing the responses of SA’s health services to the health-related vulnerabilities associated with climate change necessitates a conceptual framing of health in relation to climate change. It also requires an understanding of some key concepts in terms of addressing climate change, namely mitigation, which is the primary prevention of climate change and mainly focuses on
Box 2: Protecting Public Health From Climate Change – A Global Call to Action Launched in Durban, South Africa – 4 December, 2011
We know that, according to The Lancet, climate change is the greatest global health threat of the 21st century.a
As leading healthcare providers, professionals and organizations, we know that the health impacts of climate change, such as the spread of vector-borne diseases, and the consequences of heat waves, droughts and extreme weather events are already being felt around the world, particularly in sub-Saharan Africa, where more people die as a consequence of climate change than anywhere else.
We are profoundly concerned that as greenhouse gas emissions continue to rise unabated, dangerous climate change will magnify existing health crises, deepening and broadening the global burden of disease. This will in turn raise health care costs worldwide, while undermining and overwhelming public health infrastructure everywhere. The overwhelming burden will fall on the most vulnerable – those living in poor countries, who have contributed least to greenhouse gas emissions.
We also know that what is good for the climate is good for health, and that an equitable resolution to climate change will result in major health benefits worldwide. Given the gravity and urgency of the situation – and the opportunity to promote public health by addressing climate change we call on our colleagues in public health organizations, health professional associations, hospitals, health systems and ministries of health around the world to endorse this Call to Action and take concerted action.
Having convened at the first Global Climate and Health Summit in Durban, South Africa, we hereby commit to: 1. Provide Leadership: As representatives of our organizations, we will drive the agenda for climate and health, promoting this Call to Action throughout
the world. 2. Engage and Inform: We will engage and inform our constituencies of millions of doctors, nurses, public health workers, hospitals, health systems
and health policy makers about the health risks from climate change, and the health benefits of climate action. As health professionals, we will also serve as messengers to our patients, our communities and our governments about the major health impacts of climate change and the steps they can take to reverse their impact.
3. Mitigate: We will lead by example and reduce the carbon footprint of our own institutions, practice and activities. We will strive to make our hospitals greener and healthier by reducing waste, investing in energy efficiency and clean energy sources, while promoting sustainable transport and resource consumption. By doing so, we commit to demonstrating how our societies can move toward carbon neutrality.
4. Adapt: We will strive to make our health systems more resilient and capable of withstanding and responding to the human toll of natural disasters, growing under-nutrition and the shifting burden of disease.
5. Advocate Locally and Nationally: We will work within our countries to advocate for emissions reductions and/or low-carbon development strategies that promote both a healthy climate and public health. We will call for solutions that reduce the local health impacts of fossil fuels; solutions that foster clean energy and social justice; solutions that save lives and money while protecting public health from climate change.
6. Advocate Globally: We will advocate for a fair and binding global agreement, as articulated in the Durban Declaration on Climate and Health, that: - Places the protection of human health as a primary objective of any agreement. - Establishes an ambitious fair shares framework to reduce global emissions (based on the principles of Equity and Common but Differentiated
Responsibilities and Respective Capabilities) in order to avoid a global public health disaster. - Fosters both energy efficiency and clean, renewable energy that protects public health by reducing both local and global pollution. - Provides the immediate necessary resources to operationalize the Green Fund, and in the longer term, appropriate mitigation and adaptation
funding required to address the health impacts of climate change, assuring all countries’ Rights to Sustainable Development and their ability to pursue a low carbon development pathway.
a “Managing the Health Effects of Climate Change” The Lancet, Volume 373, Issue 9676, Pages 1693 1733, 16 May 2009.
reducing greenhouse gas emissions and modified use of land, and adaptation, which is the term used to describe strategies and activities aimed at slowing down the impact of climate change.11 “Vulnerability” refers to the physical, social and economic aspects of a system12 and in the context of climate change the concept of vulnerability to climate change integrates exposure, sensitivity, health impacts and adaptive capacity as outlined in Figure 1.
Vulnerability = f (Exposure, Sensitivity, Adaptive Capacity)
Robert T. Watson, Chair of the Inter-Governmental Panel on Climate Change, defines vulnerability as:
the extent to which a natural or social system is susceptible to sustaining damage from climate change, and is a function of the magnitude of climate change, the sensitivity of the system to changes in climate and the ability to adapt the system to changes in climate. Hence, a highly vulnerable system is one that is highly sensitive to modest changes in climate and one for which the ability to adapt is severely constrained.13
More simply put, the greater the exposure or sensitivity in terms of climate exposure, the greater the vulnerability. Furthermore adaptive capacity is inversely related to vulnerability12 The Know Climate Change web resource poses an example illustrating that reducing vulnerability would for example be attempting to reduce exposure to adverse climate through implementing specific measures such as building a dyke in the case of a rise in sea level, whereas increasing adaptive capacity would encompass implementing activities that are closely aligned with development

130 SAHR 2012/13
Biological Behavioural Societal Structural
‘DOWNSTREAM’
‘UPSTREAM’
}}Exposure Sensitivity
Adaptive CapacityPotential Impact
Vulnerability
priorities.12 Thus better adaptive capacity leads to less vulnerability. SA is described as having a quadruple burden of disease that consists of four epidemics – the major infectious diseases (HIV and tuberculosis), intentional and unintentional injury, chronic disease (including mental health disorders) and maternal and child mortality.17 The current distribution of the burden of disease in SA is a useful starting point for considering the potential impact of climate change exposure on the future burden in this country. An article outlining a public health approach to the impact of climate change on health in southern Africa discusses the indirect negative effects of climate change on conditions that plague the public health systems of these countries, such as infectious diseases, violence and injury, mental health, chronic diseases, malnutrition, women’s and child health, and occupational health.18
When considering how to address climate change and its potential impacts, it is important to recognise that both health outcomes and exposure risks are amenable to prioritisation. For instance, a particular geographical area might be particularly susceptible to drought. If the health profile of the population in that area is known this will provide an indication of the priority health issues, which might be aggravated by a bout of or increasing drought. It is then possible to consider how individuals and society might adapt to optimally reduce the impact of the changed climate and prevent anticipated worsening of health status in that area. Thus the ability to prioritise climate exposures and the consequent health outcomes helps to identify principal vulnerabilities in a group living within that geographical area. This would therefore create opportunities to identify potentially modifiable risks and, as part of mitigation or adaptation strategies, implement proven or promising preventative interventions. An example could be that drought might be modified by developing an irrigation scheme, and the ability to do so is an example of the capacity for adaptation (see Figure 1) to limit potential negative health impacts. Health services constitute a key aspect of adaptive capacity as a consequence of primary and secondary preventive interventions to limit adverse health impacts, along with other individual and social responses.19
Box 3: Examples of adaptation strategies
❖ Establish/improve surveillance/early warning systems
❖ Disaster preparedness
❖ Better urban planning and housing design (climate-proofing, insulation, mosquito control)
❖ Improve infectious disease control programmes (vaccines, vector control, case detection and treatment).
❖ Institute community-based neighbourhood support activity
❖ Mobilise community partnerships and actions to identify and solve health problems.
❖ Ongoing monitoring & evaluation of adaptation strategies.
Figure 1: Components of vulnerability
Source: Government of Western Australia, 2008.14
Figure 2 shows that climate and climate change exposures are determinants of health and in terms of proximity are situated ‘upstream’ of individual biological and behavioural and societal determinants of disease. For instance, an extremely hot climate exposure can impact the cardiovascular system, particularly of the aged who are more sensitive, and who may be unable to modify their behaviour to remain cool, or be unable to afford or access a cool built environment (infrastructural changes) leading to an increased risk of stroke or heart attack fatality. The concept of risk factors as presented in the conceptual model presented in Figure 2 is expanded upon in Figure 3.
Figure 2: Conceptual model of risk factors for disease
Source: Western Cape Burden of Disease Reduction Study, 2008.15
Figure 3 provides a useful conceptual model that shows the complex causal connections between climate-related exposures, and direct and indirect adverse health outcomes. Moving from left to right across the columns the possibility of complex causal links from climate change variables like temperature can be seen to act directly and more simply on health in the form of a heat-related stroke, or more indirectly through causing change in the quantity and quality of water leading to an increase in mosquitoes and increasing the risk of infectious diseases like malaria. Socio-economic factors like wealth of the individual or society will modulate this causal chain by interrupting it. Figure 3 can be used to systematically understand the health implications of climate change.16

Public Health Impact of and Response to Climate Change 10
SAHR 2012/13 131
Change water supply
Change in air quality
Change in food security
Effect on vectors and infectious organisms
Water insecurity
Poor water quality
Ûvectors e.g. mosquitoes and snails
Ûcontamination and salt concentration
Û pollutants
Ûairborne pollens and spores
Loss of productive farm land Ú crop failure
Fish availability changed
Faster maturation of infectious organisms
Zoonotic effects
Û vector/pests
InfrastructuralLocal environment conditions
Infrastructure and logistics
Societal
Food availability
Income level and distribution
Population densitySocial stability
Pre-existing burden of disease
Quality and availability of public health care
Adaptive policies
Biological
Age (children, elderly)
Sex (women)
Direct effects
Death, injury, displacement, mental health, heat stroke etc.
Indirect effects
• Infectious diseases e.g. waterborne, vector borne, food borne, rodent borne diseases, Sexually transmitted infections
• Chronic diseases e.g. air pollution related effects; cardio vascular system disease
• Malnutrition• Violence and injury• Mental health• Women’s health• Child health• Occupational health
Climate change Environmental effects Risk factors Modulating factors Health effects
Climate change
Ûtemperature
Change precipitation
Climate variability leading to Ûextreme
events
ÛSea levels
Figure 3: Impact of climate change on health
Source: Myers et al., 2011.16
Given the availability of health and climate data, and statistics for different geographical localities, it becomes possible to examine the associations between health status and climate exposures as these change over time. It would then be possible to determine which adverse health conditions are climate-sensitive and which in turn help to predict adverse health impacts and likely future demands on the health and social services under different future climate scenarios.
Findings from the literature
There have been several recent publications relevant to climate change and health. As referred to above, an overview of climate change and health in southern Africa was published in 2010.20 A public health approach to health and climate change in SA,18 the elaboration of a potential research agenda,21 and a special issue of the journal Continuing Medical Education (CME)22 appeared in 2011. The CME issue integrated broader sustainability and public health issues with the impacts of climate change on health systems, health and lifestyle interventions and the practice of clinical medicine at the primary care level. The implications for community involvement in health care facilities in adapting to climate change were examined. Smit et al.23 examined climate change and health in the context of urbanisation and the built environment.
More specific health impacts of climate variability and change are increasingly being studied in SA, focusing on climate-sensitive health outcomes like diarrhoeal, respiratory, cardiovascular and vector-borne infectious diseases (e.g. malaria). High and low temperatures, along with high precipitation and drought, have been shown to influence morbidity as measured by hospital admissions and mortality.21 Scovronick and Armstrong provide evidence for housing type modifying temperature-mortality relationships. Specifically, informal housing was associated with higher temperature-related mortality while traditional housing in rural areas was more protective than informal urban housing.24 Mathee et al. found decreased productivity in outdoor workers exposed to high temperatures.25 Modelling predicts no overall increase in malaria incidence for sub-Saharan Africa, but rather a shift of vectors and malaria infection incidence from west to the south and east as climate change impacts with increasing temperatures and precipitation.26,27 However, the incidence of malaria cases in SA has been declining over recent years as a result of a shift in preventative interventions targeting mosquitos, such as the reintroduction of DDT and its replacement of vector-resistant products such as Deltamethrin.

132 SAHR 2012/13
Significant limitations in the published research include unavailability of data28 (especially at a small scale for both climate determinants and health outcomes), lack of a clear conceptual model for causal pathways from climate exposures to health outcomes, a lack of integrated or complex assessment methods, as well as poorly developed intersectoral perspectives and interdisciplinary engagement and experience in government and academia.18
Recent breakthroughs in the mechanistic understanding of tuberculosis (TB) susceptibility and vitamin D deficiency have shown seasonal and hence climate sensitivity.29 It might be that increasing temperatures and less precipitation will increase resistance to TB in the southern part of SA.
Public health sector responses
Societal responses to adverse health impacts of climate change will be driven by anticipated changes in the burden of disease. They will also be limited by current and future service delivery capacity in the health and social services. It is anticipated that there will be many extra demands on these services due to climate change over and above the usual demands.30
Prevention as the core activity of public health is multi-layered. Primary prevention of adverse health effects of climate change targets its root cause. This involves mitigation activities such as the reduction of greenhouse gases in the atmosphere. The health sector is increasingly being recognised as an important site of mitigation interventions, especially where both public and private sectors are substantial, as in SA, and where the size and reach of the health sector is set to expand with the introduction of National Health Insurance.6
Secondary prevention of climate change health impacts involves adaptation in anticipation of likely health impacts of expected climate changes, such as the provision of accessible cool facilities in communities on extremely hot days or once these changes have already occurred (e.g. better insulation of homes).9
Primary mitigation interventions are longer-term global solutions. More local adaptation interventions as secondary prevention of adverse health impacts would seem to be the major social response activity in the short- to medium term. To this end, an adaptation policy is being taken seriously by the South African Government at all levels and recent policy developments have occurred at national, provincial and municipal levels that have given rise to climate change and health adaptation plans. For example, in the Western Cape Province, there is an existing municipal climate change and health adaptation plan30 and a provincial climate change adaptation strategy covering health since 2008,31 which is currently undergoing revision. The National Climate Change and Health Adaptation Policy32 was finalised in October 2012.34 The eThekwini municipality in KwaZulu-Natal has a well-developed climate adaptation plan, which covers adaptation for health. Other provincial governments and local authorities (with some exceptions in the Eastern Cape) by contrast do not yet appear to have given systematic attention to the climate change health adaptation policies. Thus the response rate measured by provincial preparedness for addressing climate change in health terms is slow.
Table 1 integrates likely climate-related health outcomes (health vulnerability) with the health system responses required for successful adaptation to prevent these outcomes. Principal health systems adaptation activities involve data collection and the capacity to monitor population health and health facility readiness for anticipated climate-related impacts. Early warning systems for extreme weather events and effective response capacity at emergency services, health services and community levels will be critical. Disaster management stands out as a key response capacity, given anticipated extreme weather events that include heat waves, floods, droughts and storm surges.

Public Health Impact of and Response to Climate Change 10
SAHR 2012/13 133
Tabl
e 1:
H
ealt
h vu
lner
abili
ty d
eter
min
ants
, fac
ilitie
s re
adin
ess,
sur
veill
ance
, mon
itori
ng a
nd e
valu
atio
n
VULN
ERA
BIL
ITY/
HEA
LTH
IMPA
CT
ASS
ESSM
ENT
FAC
ILIT
IES
REA
DIN
ESS
ASS
ESSM
ENT
ADA
PTAT
ION
INTE
RVEN
TIO
N E
VALU
ATIO
N
Clim
ate
chan
ge
expo
sure
sEn
viro
nmen
tal
effe
cts
Sens
itivi
tyA
dapt
ive
capa
city
Hea
lth im
pact
Cur
rent
ada
ptiv
e pr
actic
esN
ew/p
ropo
sed
adap
tatio
n in
terv
entio
nsM
onito
ring
&
surv
eilla
nce
Eval
uatio
n
Tem
pera
ture
Wat
er –
inse
curit
y,
qual
ity, v
ecto
rs,
pollu
tant
s,
cont
amin
atio
n,
salin
isat
ion,
sa
nita
tion
Qua
drup
le B
urde
n of
Dis
ease
– H
IV,
Infe
ctio
us D
isea
se,
Chr
onic
Dis
ease
s,
inju
ry a
nd v
iole
nce
Stru
ctur
es a
nd
Polic
ies
in p
lace
for
clim
ate
chan
ge a
nd
heal
th a
dapt
atio
n
Dire
ct:
Rea
dine
ss fo
r di
sast
ers
and
proj
ecte
d in
crea
ses
Enha
nce
read
ines
s of
at-r
isk
faci
litie
sD
isea
se s
urve
illanc
e sy
stem
Au
dit t
o id
entif
y no
n-ro
bust
clin
ics
at ri
sk
from
clim
ate
chan
ge
effe
cts
Prec
ipita
tion
– sh
ifts
in fr
eque
ncy,
in
tens
ity a
nd
seas
onal
ity
Air –
qua
lity
(indo
or
and
outd
oor),
po
llutio
n, p
olle
ns,
spor
es, i
ncre
ased
te
mp.
inve
rsio
ns
Dis
rupt
ed
infra
stru
ctur
e of
he
alth
car
e, w
ater
an
d sa
nita
tion
Impl
emen
tatio
n po
ssib
ilitie
s an
d as
sess
men
t too
ls
Dea
th, i
njur
y,
disp
lace
men
t, he
at
stre
ss, h
ypot
herm
ia,
men
tal h
ealth
, bur
ns,
drow
ning
s
Dis
aste
r and
risk
m
anag
emen
t pol
icie
s an
d em
erge
ncy
plan
s (w
ater
and
po
wer
sup
ply;
col
d ch
ain;
tran
spor
t ro
utes
Se
rvic
e lo
ad
surv
eilla
nce
syst
emR
evie
w p
olic
ies
and
plan
s re
gula
rly in
the
light
of a
ntic
ipat
ed
clim
ate
chan
ge
effe
cts
Extre
me
even
ts,
wea
ther
and
win
d,
flood
s, fi
res,
sto
rms
Food
sec
urity
–
prod
uctiv
e la
nd
decr
ease
, cro
ps a
nd
fish
decl
ine
Nut
ritio
nal s
tatu
s,
food
sec
urity
, foo
d hu
nger
Infra
stru
ctur
e an
d Lo
gist
ics,
In
dire
ct:
Publ
ic s
ecto
r clin
ic
serv
ices
Serv
ice
leve
l ag
reem
ent w
ith
prov
ince
s to
pro
vide
un
com
prom
ised
he
alth
car
e de
spite
cl
imat
e ch
ange
ef
fect
s
An
nual
revi
ew
of s
ervi
ce le
vel
agre
emen
ts
Sea
leve
l ris
eVe
ctor
s an
d in
fect
ious
org
anis
ms:
fa
ster
gro
wth
, bi
gger
pop
ulat
ions
, zo
onos
es, r
ats,
bird
s
Dem
and
over
load
on
pub
lic h
ealth
car
e du
e to
dis
aste
rs,
and/
or m
igra
tion
from
oth
er d
isas
ter
area
s
Faci
litie
s re
adin
ess
(tool
s)H
IV +
/-inc
reas
eC
apac
ity to
dea
l w
ith c
limat
e-re
late
d di
seas
es
Incr
ease
cap
acity
eg.
An
nual
dia
rrhoe
al
dise
ase
plan
ov
erse
en b
y cl
imat
e ch
ange
com
mitt
ee;
follo
w-u
p of
not
ifiab
le
dise
ases
: Exp
ande
d Pr
ogra
mm
me
on
Imm
unis
atio
n
Dis
ease
not
ifica
tion
syst
em
Maj
or in
fect
ious
di
seas
es H
IV, T
BEm
erge
ncy
serv
ices
re
adin
ess
– w
ater
, fo
od, e
nerg
y
TB in
crea
seC
apac
ity to
dea
l w
ith c
limat
e-re
late
d w
ater
-rela
ted
dise
ase
vect
ors
City
-wid
e pl
an
for m
anag
emen
t of
all
sign
ifica
nt
wat
er b
odie
s;
fram
ewor
k po
licy
on
urba
nisa
tion
Mon
itorin
g of
wat
er
qual
ity; r
efus
e re
mov
al; s
anita
tion

134 SAHR 2012/13
VULN
ERA
BIL
ITY/
HEA
LTH
IMPA
CT
ASS
ESSM
ENT
FAC
ILIT
IES
REA
DIN
ESS
ASS
ESSM
ENT
ADA
PTAT
ION
INTE
RVEN
TIO
N E
VALU
ATIO
N
Clim
ate
chan
ge
expo
sure
sEn
viro
nmen
tal
effe
cts
Sens
itivi
tyA
dapt
ive
capa
city
Hea
lth im
pact
Cur
rent
ada
ptiv
e pr
actic
esN
ew/p
ropo
sed
adap
tatio
n in
terv
entio
nsM
onito
ring
&
surv
eilla
nce
Eval
uatio
n
Info
rmal
hou
sing
/se
ttlem
ents
, poo
r ce
iling
insu
latio
n an
d ve
ntila
tion,
dam
age
in e
xtre
me
even
ts
Inco
me
Wat
erbo
rne
ente
ric
dise
ase
incr
ease
(d
iarrh
oeal
dis
ease
s)
Educ
atio
n of
pub
lic
and
train
ing
of s
taff
on c
limat
e ch
ange
he
alth
impa
cts
and
thei
r miti
gatio
n
Exte
nd:
hand
was
hing
ca
mpa
igns
, hea
lth
and
hygi
ene
proj
ects
, hea
lth
prom
otio
n ou
treac
h,
diar
rhoe
al d
isea
se
prev
entio
n an
d tre
atm
ent.
New
tra
inin
g in
air
qual
ity
man
agem
ent
(coo
king
fuel
s an
d he
atin
g)
Le
vel o
f pub
lic
awar
enes
s of
the
dang
ers,
pre
vent
ion
and
resp
onse
to
clim
ate-
rela
ted
illnes
ses
Poor
bas
ic s
ervi
ces
wat
er s
uppl
y in
dw
ellin
gs, s
anita
tion,
en
ergy
Equi
tyAi
r pol
lutio
n re
spira
tory
dis
ease
in
crea
se (a
sthm
a,
alle
rgic
rhin
itis)
Res
earc
h co
llabo
ratio
ns
eg. A
cade
mic
in
stitu
tions
, Med
ical
R
esea
rch
Cou
ncil,
C
entre
s fo
r Dis
ease
C
ontro
l, W
este
rn
Cap
e D
epar
tmen
t of
Hea
lth, N
atio
nal
Inst
itute
for
Com
mun
icab
le
Dis
ease
Air q
ualit
y an
d cl
imat
e ch
ange
re
latio
nshi
p (U
CT)
;
Cha
nges
in
epid
emio
logy
of
vec
tor-b
orne
di
seas
es (N
atio
nal
Inst
itute
for
Com
mun
icab
le
Dis
ease
; Pro
med
; W
este
rn C
ape
Dep
artm
ent o
f H
ealth
); ai
r qua
lity
mon
itorin
g; im
pact
s of
ext
rem
e ev
ents
Indo
or/o
utdo
or a
ir po
llutio
n C
row
ding
den
sity
Food
-bor
ne d
isea
ses
Mal
nutri
tion
Lack
of s
ocia
l am
eniti
es, h
ealth
se
rvic
es, s
ecur
ity
serv
ices
, com
mun
al,
recr
eatio
nal
Qua
lity
and
avai
labi
lity
of p
ublic
he
alth
ser
vice
s
Vect
or-b
orne
–
Mal
aria
, den
gue
feve
r inc
reas
e
Soci
o-ec
onom
ic
stre
ss/p
over
ty/
ineq
uity
Qua
lity
and
avai
labi
lity
of
anci
llary
ser
vice
s
Inju
ry a
nd v
iole
nce
– tra
ffic
cras
hes
Men
tal h
ealth
di
sord
ers,
sub
stan
ce
abus
e, s
uici
de
Extre
mes
of a
ge –
ch
ildre
n an
d el
derly
C
ardi
ovas
cula
r di
seas
es.
Spec
ial r
isk
grou
ps –
ch
ildre
n, w
omen
and
th
e el
derly
Wom
en/s
ingl
e pa
rent
ho
useh
olds
O
ccup
atio
nal h
ealth
fo
r em
erge
ncy.
O
utdo
or a
nd h
ot
proc
esse
s w
orke
rs
Nut
ritio
n-in
fect
ion
inte
ract
ions
En
viro
nmen
tal
chem
ical
s/pe
stic
ides

Public Health Impact of and Response to Climate Change 10
SAHR 2012/13 135
At the time of COP-17 in November 2011, a draft national climate change and health adaptation plan was available. It underwent significant change between 2011 and 2012 and was finalised in October 2012.31 The previous exclusive focus on infectious disease was extended to cover all direct and indirect outcomes comprehensively. The plan outlines national intersectoral administrative structures and a course of action that links global and local knowledge to action at various levels of government.
In the Western Cape Province, an early climate change strategic plan that also covered health impacts was crafted as early as 2008, but the actual health content was limited.32 The provincial plan is currently being revised in a process spearheaded by the Department of Environmental Affairs and Development Planning with a concurrent process of sectoral plan development in the different departments, including health. In 2011 the City of Cape Town produced health-sector-based climate adaptation plans of action (CAPA) in much greater depth and breadth than the national and provincial plans showed. The City of Cape Town plan explicitly envisages the requisite intersectoral linkages key to promoting health and preventing adverse health impacts (e.g. the sectors managing water and air quality).
Integration
There are problems of integration across levels of government with little communication in the generation of national, provincial and municipal climate change and health adaptation policy development and planning. Similarly, there are challenges involved in working intersectorally across departmental silos within each level of government when it comes to climate change adaptation. Lack of integration is also reflected in academic institutions where climate change research and teaching are similarly silo-based and where the scope of activity is typically limited to disciplinary as opposed to interdisciplinary perspectives. For the health sector this is not new. Ever since the birth of the concept of Primary Health Care at the Alma Ata conference in 1978, progress in crossing sectoral divisions has been elusive.
However, the experience of the abovementioned provincial government shows that it is possible to institute the requisite transversal structures to facilitate and implement programmes that involve multiple sectors.33 The province has set up a number of cross-sectoral structures that correspond to principal provincial strategic objectives. One of these transversal structures deals in a transversal manner with mitigation and adaptation responses to climate change and is headed by the Department of Environmental Affairs and Development Planning. The Provincial Department of Health has an active climate change committee, which has already contributed to its 2020 Health Plan and is currently embarking on a climate change readiness audit of its facilities. The audit will be guided by the considerations arising from knowledge of the provincial burden of disease15,16 and expected climate change and disease patterns under these changes for the province. Similar audit work is being conducted for mitigation interventions across the province and within each of its departments. The transversal nature of these structures ensures that the health sector is an integral part of a “whole-of-government” approach to mitigation and adaptation and plays an important role in advancing a “health in all policies” approach. This provides a working example of what a provincial
government can do.
Slow progress with intersectoral action in government has its counterpart in the academic community where inter-disciplinary climate change research is still in its infancy. Lack of integrated assessment methodologies according to which researchers using different approaches from different disciplines can pool their knowledge and gain greater understanding of the impacts of climate change is a limitation.
There is currently little evidence-informed adaptation activity in the health sector. Risk assessment for climate change has not yet been implemented apart from in the cities of Cape Town and eThekwini. Isolated local examples of green healthcare facilities exist such as the management practices at the Lentegeur Psychiatric Hospital in Mitchell’s Plain and the green design Khayelitsha Hospital in Cape Town.
Barriers and enablers
Barriers to adaptive climate change interventions include weaknesses in public sector service delivery, economic and financial constraints, a culture of poor service provision, and disorganisation at community level. Intersectoral approaches and local community organisations are enablers, but attempts to get all these agencies working together are not often successful.33
Conclusions
McMichael has pointed out that climate change will not add wholly new dimensions to the burden of disease or demands on the capacity of health systems to address these.2 Health impacts of climate change will in all likelihood be closely linked with the current distribution of the burden of disease. Climate change will amplify those components that are in any way climate sensitive. Wholly novel health threats are not anticipated.2 Climate change, however, will aggravate existing problems besetting a weak health sector, and will alter the distribution of demands on the health system. Unexpected positive and adverse health impacts may arise directly or indirectly from climate change, such as more ultraviolet radiation improving vitamin D status of dark-skinned populations in the southernmost regions of the country. They may also arise as unintended results of mitigation or adaptation interventions. Health service capacity development (e.g. PHC re-engineering) will consequently need to be aligned with anticipated and actual impacts of climate change, thus necessitating adaptation plans in all provinces.
There is a growing availability of useful guidelines and tools aimed at mitigation of carbon emissions from the health sector. These can be usefully applied in SA at all levels of health facilities from the primary care level through to tertiary hospitals. There are useful local examples of green healthcare facilities that could be used as test cases and emulated if successful.
Key priorities for adapting to climate change in the health sector emerge from a consideration of the modifiability of the burden of disease and its associated health determinants for which data exist currently only at national level and for one province at provincial level. These data need ultimately to be available at the most local level for effective prevention.

136 SAHR 2012/13
There is little current research into climate change and health. This remains a difficult area limited by poor data availability and the complexity of the chain of causation along with uncertainties inherent in predicting climate change, especially at fine resolution in different localities around the country. For example, reliable climate predictions are currently limited to large areas and are not accurate for districts, suburbs or neighbourhoods. The same applies to health data, which are typically only available in the aggregate at provincial level. Important limitations include weak or absent data, lack of structural support for interdisciplinary thinking and research, intersectoral policy development and implementation. The silo mentality in government at all levels and the disciplinary nature of most academic research constitute strong barriers to vulnerability reduction.
The current South African national energy and transport policy is at odds with climate change and is likely to contribute negatively to both global and local health impacts. This is another example of the need for intersectoral collaboration both at the policy and intervention levels.
The situation with regard to other southern African countries is even less promising with regard to climate change health adaptation.15 SA could be an example for other countries, if adaptation interventions are successfully implemented nationally, provincially and at the local level.
Recommendations
In SA as well as globally we need to move as rapidly as possible to gain a better understanding of climate change and health. This involves better understanding of current climate-related fluctuations in morbidity and mortality, and the quantum of the burden of disease that is climate sensitive. Climate-sensitive burden of disease needs to be put together with climate scenarios modelled from local climatological data at the finest scale available to fully understand the health equity implications of likely changes. All this requires access to reliable and valid mortality and morbidity data, which currently are only available at national level, to some extent at the provincial level, but little of which is available at the level of the district and sub-district. Policy support is required for better institutional data acquisition and surveillance systems to be constructed.
Society’s response in the health and health-related sectors needs strengthening. Transversal or cross-sectoral organisational structures and perspectives are essential as vehicles for policy development and especially implementation. An example of provincial buy-in and support exists, with policy makers and management being proactive in developing a series of transversal structures to match its strategic objectives, which involves the whole of government as well as partners outside of government. Such structures are essential for developing successful adaptive interventions and need to be further supported and implemented. The operating principle of “health in all policies” lays the foundation for intersectoral thinking from the point of view of the health sector.
Climate change health adaptation policies are still at an early stage of development at all levels of government and have a long way to go in order to be implemented by integration into the normal operations of public services. Data are critically important for the necessary monitoring and evaluation functions that track policy
implementation. Early warning systems of climate stressors, early identification of climate-sensitive conditions, early mobilisation of disaster and emergency response services and continuous evaluation are key ingredients for successful adaptation.
While much may be learnt from the results of research, policy and service development, particularly in the developed world, local preventive interventions will need to be appropriate for less developed and resource-constrained conditions and realities. Much more local research is needed, but there should be few illusions about the difficulties in linking upstream climate-related health determinants to health outcomes at the end of the causal chain.
There is considerable scope for research, development and collaborative work between academic institutions and the health system. More specifically, the biggest contributors to the burden of disease, their climate sensitivity and the modifiability of their associated risk factors should be targeted for priority attention.

Public Health Impact of and Response to Climate Change 10
SAHR 2012/13 137
References
1 Rao M, Knight S, Samarth A. Environmental sustainability, climate change and health. In: Fonn S, Padarath A, editors. South African Health Review 2010. Durban: Health Systems Trust; 2011.
2 McMichael AJ. Climate change and human health. In: Commonwealth Secretariat, editor. Commonwealth Health Minister̀ s Update 2009. Woodbridge, UK: Pro-Brook Publishing Ltd.; 2009.
3 Health Care Without Harm [Internet]. 2012 [cited 10 October 2012]. URL: http://www.noharm.org/
4 Durban Declaration on Climate and Health [Internet]. 2011 [cited October 2012]. URL: http://www.climateandhealthcare.org/action/summit/durban-declaration/
5 Protecting Public Health from Climate Change – A Global Call to Action [Internet]. 2011 [cited 10 October 2012].URL: http://www.climateandhealthcare.org/action/summit/call-to-action/
6 National Health Service Sustainable Development Unit. Adaptation to climate change for health and social organisations. “Co-ordinated, resilient, prepared”. Cambridge, UK: NHS Sustainable Development Unit; 2012.
7 Global Green and Healthy Hospitals. A comprehensive environmental health agenda for hospitals and health systems around the world. Reston, VA: Healthy Care Without Harm; 2012.
8 DARA. Climate vulnerability monitor 2nd edition. A guide to the cold calculus of a hot planet. Madrid, Spain: DARA; 2012.
9 Campbell-Lendrum D. Climate change, health and health professionals. Slides from NET 2012 Conference – Networking in Healthcare Education; Cambridge, UK. September 2012.URL: http://sustainablehealthcare.org.uk/sustainable-healthcare-education/resources/2012/10/slides-net2012conference
10 UNAIDS. World AIDS Day Report. How to get to zero: Faster. Smarter. Better. Geneva, Switzerland: Joint United Nations Programme on HIV/AIDS (UNAIDS); 2011.
11 Solomon S, Qin D, Manning M, et al., editors. Climate Change 2007. The physical science basis. Contribution of Working Gp 1 to the Fourth Assessment Report of the IPCC. Cambridge: Cambridge University Press, 2007. URL: http://www.ipcc.ch/pdf/assessment-report/ar4/wg1/
12 Know Climate Change website: accessed 28 February 2013. URL: http://know.climateofconcern.org/index.php?option=com_content&task=article&id=144
13 Intergovernmental Panel on Climate Change (IPCC). Presentation of Robert Watson, Chair, Intergovernmental Panel on Climate Change, at the Sixth Conference of the Parties to the United Nations Framework Convention on Climate Change, The Hague, 13 November 2000.
14 Government of Western Australia. Environmental Health Directorate. Health impacts of climate change: Adaptation strategies for Western Australia. East Pert, WA: Western Australia Department of Health; 2008.
15 Western Cape Department of Health. Western Cape Burden of Disease Reduction Project. Abbreviated Report- “Popular Version” 2008. Cape Town: Western Cape Government; 2012.
16 Myers J, Young T, Galloway M, Manyike P, Tucker T. A public health approach to the impact of climate change on health in southern Africa – identifying priority modifiable risks. S Afr Med J 2011;101:817-820.
17 Bradshaw D, Nannan N, Laubscher R, Groenewald P, Joubert J, Nojilana B, et al. South African National Burden of Disease Study 2000: Estimates of Provincial Mortality. Cape Town: Medical Research Council; 2004.
18 Myers J, Young T, Galloway M, Manyike P, Tucker T. Responding to climate change in southern Africa –the role of research. S Afr Med J. 2011;101(11):820-822.
19 Willems B, Cameron N. Communities, climate change and the district health system: Climate change is inevitable – how can we adapt to these changes? CME March 2012 Vol.30 No.3.
20 Young T, Tucker T, Galloway M, Manyike P, Chapman A, Myers J. Climate change and health in SADC region: Review of the current state of knowledge. Cape Town: UCT Centre for Occupational and Environmental Health Research; 2010.
21 Thompson AA, Matamale L, Kharidza SD. Impact of climate change on children’s health in Limpopo Province, South Africa. Int J Environl Res and Public Health. 2012;9(3):831-54.
22 Mash R, editor. Climate Change and Health. Continuing Medical Education. 2012;30(3).
23 Smit W, Hancock T, Kumaresen J, Santos-Burgoa C, Meneses RS-K, Friel S. Toward a research and action agenda on urban planning/design and health equity in cities in low and middle-income countries. J Urban Health. 2011;88(5):875-85.
24 Scovronick N, Armstrong B. The impact of housing type on temperature-related mortality in South Africa, 1996-2015. Environ Res. 2012;113:46-51.
25 Mathee A, Oba J, Rose A. Climate change impacts on working people (the HOTHAPS initiative): Findings of the South African pilot study. Glob Health Action. 2010;3:5612-16.
26 Peterson A T. Shifting suitability for malaria vectors across Africa with warming climates. BMC Infectious Diseases. 2009;9:59.
27 Byass, P. Climate change and population health in Africa: Where are the scientists? Glob Health Action 2009;2:1-4.
28 Friel S, Vlahov D, Buckley RM. No data, no problem, no action: Addressing urban health inequity in the 21st century. J Urban Health. 2011;88(5):858-95.
29 Martineau AR, Nhamoyebonde S, Oni T, Rangaka MX, Marais S, Bangani N, et al. Reciprocal seasonal variation in vitamin D status and tuberculosis notifications in Cape Town, South Africa. Proceedings of the National Academy of Sciences of the United States of America. 2011;108(47):19013-7.
30 City of Cape Town. Report on the development and progress of the city’s health sector based Climate Adaptation Plan of Action (CAPA). Cape Town: City of Cape Town; 2011.
31 National Department of Health. National climate change and health adaptation plan 2012-2016. Pretoria: National Department of Health; 2012.
32 Department of Environmental Affairs and Development Planning, Western Cape. A climate change strategy and action plan for the Western Cape. Cape Town: Department of Environmental Affairs and Development Planning; 2008.

138 SAHR 2012/13
33 Naledi T, Househam KC, Myers J. Reducing the burden of disease in the Western Cape Province: Enablers and barriers for intersectoral action for health. Chapter in the State of the Province: Cape Town: Western Cape Government; 2009.

SAHR 2012/13 139
Lead
ers
hip
and
Govern
ance

SAHR 2012/13140
Lead
ers
hip
and
Govern
ance

Authors:
141SAHR 2012/13
11111111111111
Flavia Senkubugei
Bongani M Mayosiii
i School of Health Systems and Public Health, University of Pretoria ii Department of Medicine, Groote Schuur Hospital and University of Cape Town
The State of the National Health Research System in South Africa
Knowledge produced by health research contributes to the improvement of the health of individuals and populations. This knowledge also contributes to the development of evidence-informed policies and the enhancement of
performance of health systems. Using existing and new knowledge adapted to local conditions is particularly crucial in achieving the Millennium Development Goals. To achieve these and other health-related goals, a well-functioning health system must be able to produce, access and utilise research-based knowledge and the products of research.
The purpose of this chapter is to assess the performance of the national health research system that was envisaged by the Health Research Policy of 2001, and to highlight the recommendations of the National Health Research Summit of 2011 on the strengthening of research and development in South Africa (SA). The health research enterprise in SA is dominated by a small core of productive researchers, who are largely externally funded and focus on HIV, AIDS and tuberculosis. The representation of black research leaders is low.
The key priorities for strengthening the health research system are related to increasing funding from local governmental and non-governmental sources, developing human resources for health research, building the infrastructure for clinical research in academic health complexes, providing dedicated funding for priority health conditions, and improving the national regulatory framework for clinical trials.
Furthermore, there is a need for the development of a national system for the planning of research and its translation into policy, programmes, and practice. Finally, the health research system requires a mechanism for monitoring and evaluation to serve as a ‘feedback loop’ for the development of a robust health research system that is geared to addressing the priority health needs of South Africans.
A well-functioning health system must be able to
produce, access and utilise research-based
knowledge and the products of research.

142 SAHR 2012/13
Introduction
Knowledge produced by health research is a global public good.1,2 Knowledge contributes to the improvement of the health of individuals and populations, to the development of evidence-informed policies and the enhancement of performance of health systems.1,3 Using existing and new knowledge adapted to local conditions is particularly crucial in achieving the Millennium Development Goals.4 To achieve these and other health-related goals, a well-functioning health system must be able to produce, access and utilise research-based knowledge.2 The Commission on Macroeconomics and Health and the Consultative Expert Working Group on Research and Development Financing and Coordination have recommended a substantial increase in health research investments globally.5,6 It is universally accepted that health research and scientific knowledge play a central role in addressing the prevention and control of diseases and conditions that afflict populations.
Expenditure on medical research provides a huge economic return on investment – whether measured in terms of dollar value of lives saved, health costs saved, or jobs created.7 Three global commissions have repeatedly demonstrated that health research is not given its proper role in improving health, equity and development in lower- and middle-income countries.5,8,9 The Commission on Health Research for Development was among the first to recommend that lower- and middle-income countries should spend at least 2% of their health programme budgets on health research and that donors should match this with an allocation of 5% of their (externally provided) health programme funding. These percentages have been endorsed in subsequent ministerial declarations10,11 but allocation of these funds has been difficult to measure and has rarely been achieved.1
The historic strengths and weaknesses of South Africa’s participation in the global enterprise of medical research were reviewed recently in a report on the revitalisation of clinical research undertaken by the Academy of Science for South Africa (ASSAf).12 The report examines the legacy of colonialism, racism and inequality in medical research, and demonstrates how this history has shaped relationships between researchers, government, industry and the South African public. After 1994, significant strides were made in
re-orienting health care and medical research towards the needs of the majority at a policy level. The philosophy of essential national health research was embraced, which culminated in the publication of the Health Research Policy of 2001, which sought “to develop a national health research system that contributes to equitable health development.”13
The purpose of this chapter is to assess the performance of the national health research system as envisaged in the Health Research Policy of 2001. Another purpose is to highlight the recommendations of the National Health Research Summit of 2011 on the strengthening of research and development in South Africa (SA). This assessment is conducted within the framework presented by Pang et al. for national health research systems.1
A framework for national health research systems
A health research system is located at the intersection between the health system and the research system of a country.1 In SA, the health system is the responsibility of the Department of Health whereas the research system is under the purview of the Departments of Science and Technology, and Higher Education and Training. The National Health Research Committee, which is a statutory body established in terms of the National Health Act (Act 61 of 2003),14 is located in the Department of Health and is mandated to ensure that there is coordination between the activities of the public institutions (such as the Departments of Health, Science and Technology, and Higher Education and Training) in the development and management of the national health research system.
In terms of the framework of Pang et al., a health research system has two intrinsic goals: the advancement of scientific knowledge and the utilisation of knowledge to improve health and equity.1 The fundamental functions of a health research system include stewardship, financing, creating and maintaining resources, and producing and using research. The state of national health research is examined in the following sections, according to the fundamental functions of a national health research system. (See Table 1.)
Table 1: Summary of the functions and operational components of health research systems
Function Operational component
Stewardship • Define and articulate vision for a national health research system• Identify appropriate health research priorities and coordinate adherence to them• Set and monitor ethical standards for health research and research partnerships• Monitor and evaluate the health research system
Financing Secure research funds and allocate them in an accountable way
Creating and sustaining resources
Build, strengthen, and sustain the human and physical capacity to conduct, absorb, and utilise health research
Producing and using research • Produce scientifically valid research outputs• Translate and communicate research to inform health policy, strategies, practices, and public opinion• Promote the use of research to develop new tools (drugs, vaccines, devices, and other applications) to improve health
Source: Pang et al., 2003.1

The State of the National Health Research System in South Africa 11
SAHR 2012/13 143
The state of the South African national health research system
Stewardship
Stewardship is concerned with oversight of the entire health research system and is intended to cover both the public and private sectors.15 Two statutory bodies are entrusted with the stewardship of the national health research system in SA: the National Health Research Committee and the National Health Research Ethics Council, both of which are located in the Department of Health. The National Health Research Committee has a legislative mandate to advise the Minister of Health on health research priorities. In identifying health research priorities, the National Health Research Committee takes into account the following:
➢ the burden of disease;
➢ the cost-effectiveness of interventions to reduce the burden of disease;
➢ the availability of human and institutional resources for the implementation of interventions closest to affected communities;
➢ the health needs of vulnerable groups such as women, older persons, children and people with disabilities; and
➢ the health needs of communities.
Furthermore, the National Health Research Committee is required to:
➢ determine the health research to be carried out by public health authorities;
➢ ensure that health research agendas and research resources focus on health priorities;
➢ develop and advise the Minister on the application and implementation of an integrated national strategy for health research; and
➢ coordinate the research activities of public health authorities.
The new National Health Research Committee for the 2011-2013 term convened a National Health Research Summit of health research stakeholders in July 2011.16 The National Health Research Committee is carrying out the task of defining and articulating the vision for a national health research system and identifying health research priorities through a consultative process that involves the key actors in health research from academia, industry, and government.16 Through this work, the National Health Research Committee has highlighted the essential role for investment in health research to achieve a long and healthy life for South Africans,17 and has identified seven priorities for the strengthening of the national system for health research.16
In terms of its key functions the National Health Research Ethics Council, which sets and monitors ethical standards for health research and research partnerships, is required to:
➢ determine guidelines for the functioning of health research ethics committees;
➢ register and audit health research ethics committees;
➢ set norms and standards for conducting research on humans and animals, including norms and standards for conducting clinical trials;
➢ adjudicate complaints about the functioning of health research ethics committees and hear any complaint by a researcher who believes that he or she has been discriminated against by a health research ethics committee;
➢ refer to the relevant statutory health professional council matters involving the violation or potential violation of an ethical or professional rule by a healthcare provider;
➢ institute such disciplinary action as may be prescribed against any person found to be in violation of any norms and standards, or guidelines, set for the conducting of research in terms of the National Health Act; and
➢ advise the national department and provincial departments on any ethical issues concerning research.
While the National Health Research Committee and the National Health Research Ethics Council may be considered to be effective in the majority of areas of their functions, there are areas of research stewardship that are neglected, such as planning, coordination, and monitoring and evaluation of the health research system.16
Financing
The 2008/09 National Survey of Research and Experimental Development (R&D) recorded gross domestic expenditure on R&D (GERD) of R21.0 billion for all research in SA, which was a nominal increase of R2.4 billion from the R18.6 billion recorded for 2007/08.18 The 2008/09 expenditure represents a 13.0% nominal increase over that of the previous year, but was insufficient to keep up with the increase in the nominal Gross Domestic Product (GDP) of 14.2% over the corresponding period. As a consequence, R&D expenditure, expressed as a percentage of GDP, dropped slightly from 0.93% in 2007/08 to 0.92% in 2008/09. The largest proportion of research and development expenditure is on engineering and natural sciences (45% of total research and development expenditure), while expenditure on the health sciences is 14.8% of the total (about 0.14% of GDP). SA is aiming to spend R45 billion on research and development and reach its target for gross expenditure on research and development of 1.5% of GDP by 2014.19
The procurement and allocation of funds for research is the second central function of a health research system.1 There is consensus, however, that the health research system of SA is severely under-funded from local public and private sources.12,16 For example, the National Health Research Committee has estimated that the National Department of Health (NDoH) spent 0.37% (R416.5 million) of its health budget (R112.6 billion) in health research in the 2010/2011 financial year, which falls far short of the recommendation of the health research policy in SA of 2001 and subsequent undertakings by the Ministry of Health in Mexico10 and Bamako11 to invest 2% of the health budget in health research.
According to the ASSAf report:
[t]he key narrative of clinical research in SA over the last two decades has been that of a largely unplanned, but cumulative, disinvestment in publicly funded programmes, resulting from the withdrawal of the health departments of provincial governments from this sector (academic hospitals are now funded for service functions only), the absence of discounts for research tests from the business model of the National Health Laboratory Service,

144 SAHR 2012/13
chronic underfunding of the Medical Research Council despite its obviously important mandate for maintaining and developing medical/clinical research capacity in the country, and the lack of funding streams to universities that might in principle have been applied to meet the overall shortfall in support.12
This policy trajectory has had a chilling effect on indigenous clinical science in the country over the past 10-20 years.20
Creating and sustaining resources
Creating and sustaining human and physical resources for health research is the third central function of a health research system.1 The key strengths of the South African health research system with respect to human and physical resources include having a small but productive core group of highly skilled researchers that comprise experts in laboratory, clinical and epidemiological aspects of HIV and AIDS and tuberculosis (TB), non-communicable diseases, maternal and child health, and violence and injury.16 There are also several large AIDS and TB clinical research units (in KwaZulu-Natal, Gauteng and Western Cape)21-25 and demographic surveillance systems that are part of the international INDEPTH network (in KwaZulu-Natal and Mpumalanga).26
The main weaknesses include the low level of funding for health research from the South African government in human and infrastructural resources for health research (e.g. less than 30% of total funding for HIV and AIDS and TB research comes from local sources), which is partly a manifestation of the relatively low level of government investment in research and development in general (0.92% of GDP in 2009). As a result, SA has a small number of researchers relative to other countries in the Brazil, Russia, India, China and SA (BRICS) grouping. For example, there are 1.4 full-time equivalent (FTE) researchers per 1 000 employed people in SA compared with 8.2 per 1 000 in Russia.18
This under-resourcing of the health research system in SA is associated with a dearth of training programmes and career paths for health researchers, and a virtual absence of clinical research centres that are funded by the state in the academic health complexes that have the statutory mandate to produce new knowledge.12
The deficit of human resources for health research is being addressed at a policy level through the new Human Resources for Health Plan.27 This plan has made the revitalisation of education,
training and research one of its strategic priorities. The interventions and actions that have been identified are the growth of academic health practitioners through a doctorate driven National Health Scholars Programme28 and the establishment of Research Chairs in Health Sciences in the future. This plan endorses the major recommendations of the report on clinical research of the ASSAf.12
Producing, synthesising and utilising research
The production of valid research disseminated in scientific publications in peer-reviewed and grey (non-peer-reviewed) literature, policy publications, reports, books or discussion papers, patents and new processes is the fourth function of the health research system.1 Pouris reported the findings of a recent scientometric analysis of SA’s research outputs during the period 2000-2010, which evaluated the effects of policy interventions on research publications.29 A number of public policy interventions were introduced during the period under review, including the introduction in 2003 of a new funding formula that financially supports the higher education institutions according to their research outputs (number of publications and number of postgraduate students produced).30 In contrast to earlier investigations by Pouris, it was found that SA’s world share of publications had increased over the past decade.31,32 SA improved its overall international ranking by two positions during 2000-2010 and was ranked 33rd in the world during 2010 in terms of the absolute number of scientific publications in all fields of research.
The country’s share in world literature has increased in all disciplines of health sciences from an average of 0.40 (2000-2004) to 0.60 (2006-2010) (Table 2).29 The activity index, which is the ratio of the country’s share of the world publication output in a given field to the country’s share of the world publication output in all science fields, also increased in all fields of health sciences except for Clinical Medicine and Pharmacology and Toxicology (Table 2). An activity index of one indicates that the country’s research output in the given field corresponds to the world average; an indicator larger than one reflects a higher-than-average emphasis in the field. The falling activity index in Clinical Medicine and Pharmacology may be regarded as a manifestation of the disinvestment in clinical science over the past 20 years that was identified in the ASSAf report.12,20
Table 2: SA’s world share and activity indices in health sciences and related disciplines
Discipline
2000-2004 2006-2010
World share Activity index World share Activity index
Biology and Biochemistry 0.35 0.71 0.54 0.92
Clinical Medicine 0.40 0.82 0.45 0.76
Immunology 0.49 1.00 1.09 1.85
Microbiology 0.57 1.16 0.78 1.32
Neuroscience and Behaviour 0.17 0.35 0.22 0.37
Pharmacology and Toxicology 0.39 0.80 0.42 0.71
Psychiatry and Psychology 0.45 0.92 0.69 1.17
Overall 0.40 0.60
Source: Pouris, 2012.29

The State of the National Health Research System in South Africa 11
SAHR 2012/13 145
As presented in Table 3, a relative citation index above one indicates that the country’s publications in the particular field attract more than the average citations in the world and an index of less than one indicates that the field attracts fewer citations.29 Table 3 shows that all disciplines in health sciences are improving their impact except Psychiatry and Psychology. South African publications in Microbiology, Clinical Medicine, and Immunology attract more citations than the average citations in their fields. This shows that in Clinical Medicine, although the level of activity was declining in the period under review, the quality and impact of South African work in this field continue to improve. South African health researchers are publishing an increasing number of high-quality publications on priority conditions such as HIV and AIDS and TB in high-impact journals such as the New England Journal of Medicine, Science, Nature Medicine, and The Lancet.33-38
Table 3: Relative impact of South African publications during 2000-2004 and 2006-2010 in health sciences and related disciplines
Discipline
Relative impact
2000-2004 2006-2010
Biology and Biochemistry 0.56 0.81
Clinical Medicine 0.86 1.15
Immunology 0.71 1.09
Microbiology 1.00 1.27
Neuroscience and Behaviour 0.63 0.71
Pharmacology and Toxicology 0.58 0.70
Psychiatry and Psychology 0.67 0.61
Overall 0.72 0.91
Source: Pouris, 2012.29
SA is emerging as a leader in Africa in the fields of the synthesis and utilisation of research findings. The South African Cochrane Centre at the Medical Research Council is part of the international Cochrane Collaboration, which is a non-profit organisation operating worldwide that disseminates up-to-date systematic reviews on the effects of healthcare interventions carried out in order to help people make well-informed decisions.39 There are also several academic groups that are involved in translation and implementation science, such as the Knowledge Translation Unit at the University of Cape Town and the Priority Cost Effective Lessons for Systems Strengthening – SA (PRICELESS SA) at the University of the Witwatersrand.40,41 There is, however, no nationally agreed upon framework for the translation of research evidence into policy, programme and practice – such as the National Institute for Health and Clinical Excellence (NICE) in the United Kingdom (UK).42
Key findings and recommendations
There is an increasing realisation of the need to promote indigenous health research in SA. The decline in investigator-initiated original clinical research activity in the mid-2000s prompted the ASSAf to produce recommendations for the revitalisation of clinical research, including increased funding, the training of a new cadre of health researchers, the establishment of clinical research centres, and improved regulation and planning of the health research enterprise.12 The NDoH also recognised the essential role of health research in achieving a long and healthy life for all South Africans through its 10 Point Plan of 2009 to 2014, which includes “strengthening of research and development” as its 10th priority.43
The National Health Research Committee acted upon policy directives of the NDoH by convening a National Health Research Summit in July 2011, which identified seven challenges and produced recommendations for the revitalisation of the health research system in SA. These are presented in Table 4.16

146 SAHR 2012/13
Table 4: Key findings and recommendations for the strengthening of the health research system in SA
Key finding RecommendationFinancing: There is inadequate funding of health research by the Government of SA.
The NDoH should consider the progressive implementation of its commitment to the proportion of the national health budget allocated to research and development from 0.37% to 2.0% over the 2012-2014 period, as required by the National Health Research Policy of 2001 and commitments made in Mexico (2004) and Bamako (2008). This measure has the potential to lift the investment in health research from <R500 million at present to >R2 billion (fourfold increase).
Human Resources: There is a shortage of human resources for health research in SA, especially black South Africans and women.
The increased funding should be used to at least double the number of health researchers and academic clinicians over the next 10 years, in line with the Human Resources for Health Strategy of SA (2012/13-2016/17). The increased production of health researchers may be achieved by the creation of a ‘National Health Scholars Programme’ to fund doctoral studentships, post-doctoral fellowships, mid-career research posts, and research chairs in all healthcare fields, including medicine, dentistry and nursing.
Health Research Infrastructure: There is a lack of health research facilities and infrastructure in academic health complexes that are required by the National Health Act of 2003 to conduct research into priority health problems of South Africans.
The new funding should also be directed at developing the health research infrastructure of the academic health complexes. The ASSAf report on the revitalisation of clinical research identified the priority of creating clinical research centres in the academic health complexes to facilitate research occurring alongside service and teaching. Creating clinical research centres should form part of the hospital revitalisation programme in preparation for the introduction of the National Health Insurance scheme.
Priority Research Fields: The priority research areas are surveillance, knowledge translation, integration of care, health economic evaluation, diagnostics, therapeutics and vaccine development to address the quadruple burden of disease, social determinants of health, and strengthening the health system.
The new funding should also be used to create a National Priority Health Research Fund to stimulate and support new and innovative research programmes that address the research priorities related to the quadruple burden of disease, health systems strengthening, and combating the social determinants of health (that seek to achieve the outcomes of the Negotiated Service Delivery Agreement (NSDA) of the NDoH). These funds should be tied to measurable achievement of the objectives of the NSDA.
National Regulatory Framework: There is a cumbersome regulatory system for registration of new medicines and conducting of clinical trials under the Medicines Control Council (MCC).
The proposed South African Health Products Regulatory Authority should heed the recommendations of the ASSAf report on a progressive and efficient regulatory regime for health research in SA.12
Planning and Translation: There is a virtual absence of national planning, coordination and translation of research into health innovations, policy, programmes and practice.
A process should be commenced to establish a body that is similar to the NICE in the UK in order to ensure the orderly translation of research.
Monitoring and Evaluation: There is a lack of national mechanisms for monitoring and evaluation of the performance of the health research system of SA.
Consideration should be given to the development of a monitoring and evaluation tool as a module of the National Survey of R&D of the Department of Science and Technology.
Source: Mayosi et al., 2012.16
These recommendations, which have been accepted by the Ministry of Health,16 call for:
➢ increased funding for health research by the Department of Health, in line with the National Policy for Health Research of 2011 and the Mexico and Bamako declarations, from 0.37% to achieve the 2.0% of the national health budget;
➢ the training of a new generation of health researchers, especially black people and women, (through a National Health Scholars Programme);
➢ the development of health research infrastructure in the academic health complexes that will facilitate research-based re-engineering of primary health care (through the funding of clinical research centres);
➢ the funding of priority research projects designed to increase the lifespan of South Africans (through a national priority research projects fund);
➢ the improvement of the national regulatory framework for health research (through the new South African Health Products Regulatory Authority);
➢ the creation of a national mechanism for planning and timely translation of research findings into policy, programmes and practice (through a structure similar to the NICE in the UK); and
➢ the development of a national system for evidence-informed monitoring and evaluation of the effectiveness and impact of the health research system on the burden of disease in SA (possibly through the National Survey of R&D of the Department of Science and Technology).
Future editions of the Review will track the progress made in implementing these recommendations.

The State of the National Health Research System in South Africa 11
SAHR 2012/13 147
Conclusion
A new consensus is emerging on the fundamental importance of a national health research system in achieving a long and healthy life for all South Africans.44 The alignment between the 10 Point Plan, the scientific advice of expert committees and the health research community in general has resulted in a rapid uptake of recommendations to revitalise the health research system in SA.45 The South African Journal of Science has commented that:
[t]he present case is an example of how government policymaking can be productively influenced, by an expert committee (in this case the National Health Research Committee) acting on recommendations which were made by a panel appointed and managed by an independent national science academy (ASSAf) and debated by a cross section of stakeholders in the community. This process could be widely applied to the benefit of our society.45
If the recommendations of the National Health Research Summit of 2011 to strengthen the national health research system were implemented (Table 4), SA might be on a ‘high road’ to success in health research over the coming decades.

148 SAHR 2012/13
References
1 Pang T, Sadana R, Hanney S, Bhutta ZA, Hyder AA, Simon J. Knowledge for better health: A conceptual framework and foundation for health research systems. Bull World Health Organ. 2003;81(11):815-20.
2 Røttingen JA, Chamas C, Goyal L, Harb H, Lagrada L, Mayosi BM. Securing the public good of health research and development for developing countries. Bull World Health Organ. 2012;90(5):398-400.
3 Pardes H, Manton KG, Lander ES, Tolley HD, Ullian AD, Palmer H. Effects of medical research on health care and the economy. Science. 1999;283(5398):36-7.
4 Chopra M, Lawn JE, Sanders D, Barron P, Abdool Karim SS, Bradshaw D, et al. Achieving the Health Millennium Development Goals for South Africa: Challenges and priorities. The Lancet. 2009;374(9694):1023-31.
5 Sachs JD. Macroeconomics and health: Investing in health for economic development. Report of the Commission on Macroeconomics and Health [Internet]. 2001.URL: http://whqlibdoc.who.int/publications/2001/ 924154550x.pdf
6 World Health Organization. Research and development to meet health needs in developing countries: Strengthening global financing and coordination. Report of the Consultative Expert Working Group on Research and Development: Financing and coordination. Geneva: World Health Organization; 2012.
7 Rosenberg LE. Exceptional economic returns on investments in medical research. Med J Aust. 2002;177(7):368-71.
8 Commission on Health Research for Development. Health Research: Essential link to equity in development. New York: Oxford University Press; 1990.
9 Imrie H, Freel M, Mayosi BM, Davies E, Fraser R, Ingram M, et al. Association between aldosterone production and variation in the 11beta-Hydroxylase (CYP11B1) gene 10.1210/jc.2006-1481. J Clin Endocrinol Metab. 2006;91(12):5051-6.
10 Wiysonge CS, Bradley H, Mayosi B, Maroney R, Mbewu A, Opie L, et al. Beta-blockers for hypertension. Cochrane Database Syst Rev. 2007; 1(1469-493X (Electronic) IP - 1 DP - 2007): CD002003.
11 The Bamako call to action: Research for health. The Lancet 2008;372(9653):1855.
12 Mayosi BM, Dhai A, Folb P, Gevers G, Hussey G, Kirkman M, et al. Revitalising clinical research in South Africa: A study on clinical research and related training. Pretoria: Academy for Science of South Africa; 2009.
13 National Department of Health. Health research policy in South Africa. Pretoria: National Department of Health; 2001.
14 Republic of South Africa. National Health Act (Act 61 of 2003).
15 World Health Organization. The World Health Report 2000. Geneva, Switzerland: World Health Organization; 2000.
16 Mayosi BM, Mekwa JN, Blackburn J, Coovadia H, Froedman IB, Jeenah M, et al. Strengthening research for health, innovation and development in South Africa: Proceedings and recommendations of the 2011 National Health Research Summit. Pretoria: National Health Research Committee; 2012.
17 Buthelezi L. Health Department to spend five times more on research. BusinessReport [newspaper online]. 02 May 2012 [cited 24 January 2013].URL: http://www.iol.co.za/business/business-news/health-department-to-spend-five-times-more-on-research-1.1286794#.UQDNmI5QY0s
18 National Department of Science and Technology. National Survey of Research and Experimental Development (2008/09 Fiscal Year). Pretoria: National Department of Science and Technology; 2010.
19 National Department of Science and Technology. Strategic Plan for the Fiscal Years 2011–2016. Pretoria: National Department of Science and Technology; 2011.
20 Gevers W. Clinical research in South Africa: a core asset under pressure. The Lancet. 2009;374(9692):760-2.
21 Centre for the AIDS Programme of Research in South Africa [Internet]. c2009 [cited 27 November 2012]. URL: http://www.caprisa.org/SitePages/Home.aspx
22 WITS Health Consortium [Internet]. [cited 27 November2012]. URL: http://www.witshealth.co.za/Pages/default.aspx
23 Desmond Tutu HIV Foundation [Internet]. [cited 27 November 2012]. URL: http://www.desmondtutuhivcentre.org.za/
24 The AURUM Institute [Internet]. [cited 27 November 2012]. URL: http://www.auruminstitute.org/index.html
25 Desmond Tutu TB Centre [Internet]. [cited 27 November 2012]. URL: http://sun025.sun.ac.za/portal/page/portal/Health_Sciences/English/Centres/dttc
26 INDEPTH Network [Internet]. [cited 27 November 2012]. URL: http://www.indepth-network.org/
27 National Department of Health. Human Resources for Health South Africa . HRH strategy for the health sector : 2012/13-2016/17. Pretoria: National Department of Health; 2011.
28 Nordling L. South Africa invests in health research training. Nature News Blog [newspaper online]. 26 April 2012 [cited 27 November 2012].URL: http://blogs.nature.com/news/2012/04/south-africa-invests-in-health-research-training.html
29 Pouris A. Science in South Africa: The dawn of a renaissance? S Afr J Sci. 2012;108(7/8):1-6.
30 Steyn AGW, de Villiers AP. Public funding of higher education in South Africa by means of formulae [Internet]. 2004 [cited 25 November 2012]. URL: http://www.che.ac.za/documents/d000146/5-Review_HE_SA_2007.pdf
31 Pouris A. The writing on the wall of South African science: A scientometric assessment. S Afr J Sci. 1996;92:267–71.
32 Pouris A. South Africa’s research publication record: The last ten years. S Afr J Sci. 2003;99:425–8.
33 Abdool Karim SS, Naidoo K, Grobler A, Padayatchi N, Baxter C, Gray AL, et al. Integration of antiretroviral therapy with tuberculosis treatment. NEJM. 2011;365(16):1492-501.
34 Abdool Karim Q, Abdool Karim SS, Frohlich JA, Grobler AC, Baxter C, Mansoor LE, et al. Effectiveness and safety of tenofovir gel, an antiretroviral microbicide, for the prevention of HIV infection in women. Science. 2010;329(5996):1168-74.
35 Moore PL, Gray ES, Wibmer CK, Bhiman JN, Nonyane M, Sheward DJ, et al. Evolution of an HIV glycan-dependent broadly neutralizing antibody epitope through immune escape. Nat Med. 2012;18(11):1688-92.
36 Dheda K, Shean K, Zumla A, Badri M, Streicher EM, Page-Shipp L, et al. Early treatment outcomes and HIV status of patients with extensively drug-resistant tuberculosis in South Africa: A retrospective cohort study. The Lancet. 2010;375(9728):1798-807.

The State of the National Health Research System in South Africa 11
SAHR 2012/13 149
37 Kerstjens HAM, Engel M, Dahl R, Paggiaro P, Beck E, Vandewalker M, et al. Tiotropium in asthma poorly controlled with standard combination therapy. NEJM. 2012;367(13):1198-207.
38 Fairall L, Bachmann MO, Lombard C, Timmerman V, Uebel K, Zwarenstein M, et al. Task shifting of antiretroviral treatment from doctors to primary-care nurses in South Africa (STRETCH): A pragmatic, parallel, cluster-randomised trial. The Lancet. 2012;380(9845):889-98.
39 The South African Cochrane Centre [Internet]. [cited 25 November 2012]. URL: http://www.mrc.ac.za/cochrane/cochrane.htm
40 Knowledge Translation Unit, University of Cape Town Lung Institute [Internet]. [cited 25 November 2012]. URL: http://www.knowledgetranslation.co.za/
41 PRICELESS SA: Priority cost effective lessons for systems strenghthening - South Africa [Internet]. [cited 25 November 2012]. URL: http://www.pricelesssa.ac.za/Pages/default.aspx
42 National Institute for Health and Clinical Excellence [Internet]. [cited 25 November 2012]. URL: http://www.nice.org.uk/
43 The South African health improvement plan 2009 [Internet]. [cited 25 November 2012].URL: http://www.sarrahsouthafrica.org/LinkClick.aspx?fileticket=_cJl2FdD4-g%3D&tabid=2067
44 Mayosi BM, Lawn JE, van Niekerk A, Bradshaw D, Abdool Karim SS, Coovadia HM. Health in South Africa: Changes and challenges since 2009. The Lancet. 2012; 380(9858):2029-43.
45 Purposeful support for health research in South Africa. S Afr J Sci. 2012;108(5/6): 1. [cited 27 November 2012].URL: http://www.sajs.co.za/sites/default/files/publications/pdf/1268-9425-2-PB.pdf

150 SAHR 2012/13

Authors:
151SAHR 2012/13
12121212121212
Marsha Orgill,i Nonhlanhla Nxumalo,ii Woldekidan Amde,iii Ermin Erasmus,i
Uta Lehmann,iii Jane Goudgeii and Lucy Gilsoniv
i Health Economics Unit, School of Public Health and Family Medicine, University of Cape Townii Centre for Health Policy, School of Public Health, University of the Witwatersrand, Johannesburgiii School of Public Health, University of the Western Capeiv Health Economics Unit, School of Public Health and Family Medicine, University of Cape Town,
London School of Hygiene and Tropical Medicine, UK
Health Policy and Systems Research: Needs, challenges and opportunities in South Africa – a university perspective
How can HPSR contribute to strengthening health
systems given the range of transformation initiatives
currently in place?
The last two decades have seen growing international recognition of the need to strengthen health systems in order to deliver already available, cost-effective health interventions. This chapter describes the parallel global
growth of the field of Health Policy and Systems Research (HPSR) and outlines what this field of research is and what it is not. The chapter also clarifies how HPSR can contribute to strengthening health systems. The particular relevance of HPSR in SA is discussed, given the range of health system transformation initiatives in place. Drawing both on an HPSR capacity assessment conducted in three universities and discussions with a wider group of researchers and health system managers, the chapter also considers the existing assets for and challenges facing the development of the field in South Africa. It closes with suggested strategies and priorities for developing and building capacity in this field nationally.

152 SAHR 2012/13
Introduction
In November 2012, approximately 1 600 researchers, managers, and health activists met in Beijing for the second Global Symposium on Health Systems Research. The symposium saw the launch of two landmark activities for this burgeoning community: ‘Changing Mindsets’, the World Health Organization (WHO) strategy on Health Policy and Systems Research,1 and the community’s new society – Health Systems Global.
These events represent the most recent milestones in the formal development of the field of Health Policy and Systems Research (HPSR), which has slowly emerged since the late 1980s. As Box 1 outlines, critical events include the establishment of the Alliance for Health Policy and Systems Research, the WHO World Health Report of 2000, two Ministerial summits and their related resolutions (2004, Mexico and 2008, Bamako)2-4 and the first Global Symposium on Health Systems Research, held in 2010 in Montreux, Switzerland.
Box 1: Milestones in the development of HPSR
1990: Commission on Health Research for Development
1996: Ad Hoc Committee on Health Research relating to Future Intervention Options
1999: Establishment of the Alliance for Health Policy and Systems Research
2000: WHO World Health Report – Health Systems: Improving Performance
2004: WHO Task Force on Health Systems Research Priorities for Equity in Health
2004: WHO Report on Knowledge for Better Health
2004: Mexico Ministerial Summit on Health Research and Statement on Health Research
2005: World Health Assembly Resolution A58/22, related to Mexico statement
2008: High-level Task Force on Scaling up Research and Learning for Health Systems, Global Ministerial Forum on Health Research and the Bamako Call to Action for Research for Health
2009-10: WHO Strategy on Research for Health
2010: First Global Symposium on Health Systems Research in Montreux, Switzerland
2012: WHO Strategy for Health Policy and Systems Research, and Second Global Symposium on Health Systems Research in Beijing, China
Source: Adopted from Hoffman et al., 2012.5
Internationally, the importance of this form of research and analysis is based on the dual recognition, first, that stronger health systems are needed to deliver already available and cost-effective healthcare interventions, and so generate health improvement; and, second, that HPSR generates the evidence needed to support interventions to strengthen health systems. The importance of strong health systems has been specifically demonstrated by the challenges of scaling up efforts to tackle HIV, tuberculosis (TB) and malaria, and by the slow progress towards the attainment of the Millennium Development Goals in many settings. In 2007, the Director-General of the WHO, Margaret Chan, noted that weak health systems arise partly from a lack of investment but also from the fact that research on health systems has been so badly neglected and underfunded. The two go together… In the absence of sound evidence, we will have no good way to compel efficient investments in health systems.5
HPSR starts, therefore, with concern for the health system, the platform from which health services are delivered, and how that system can be strengthened. (See Box 2) It includes concern for how to promote the intersectoral action needed to address the social determinants of health.6 Several health system conceptual frameworks provide guidance for such research, as well as for action to strengthen health systems. All emphasise the ways in which different system dimensions or elements interact in generating system outcomes. The WHO framework, for example, specifically highlights six building blocks and stresses that:
[a] health system, like any other system, is a set of inter-connected parts that must function together to be effective. Changes in one area have repercussions for elsewhere. Improvements in one area cannot be achieved without contributions from others. Interaction between building blocks is essential for achieving better health outcomes.10
Therefore, while the longer-established field of health services research tends to focus primarily on service delivery issues, HPSR has a strong focus on the system elements that underpin service delivery (such as financing or human resource issues) and requires that all elements, including service delivery, are considered in relation to their place within and their contribution to the whole system. A 2012 paper on access to medicines provides a good example of this approach.11 HPSR also, for example, encourages consideration of how a specific service (e.g. provision of antiretroviral therapy) influences the system as a whole, or how system interventions, such as management strengthening, influence particular services.
Box 2: HPSR – definition and basic questions
HPSR “seeks to understand and improve how societies organize themselves in achieving collective health goals, and how different actors interact in the policy and implementation processes to contribute to policy outcomes. By nature it is interdisciplinary, a blend of economics, sociology, anthropology, political science, public health and epidemiology that together draw a comprehensive picture of how health systems respond and adapt to health policies, and how health policies can shape – and be shaped by – health systems and the broader determinants of health”.12
Its key questions are:
❖ What are health systems, how do they currently function and why do they function like that?
❖ What needs to be done to strengthen them?
❖ How can policy agendas on health system development be influenced?
❖ How can policies be developed and implemented in ways that strengthen health systems?
Source: Gilson, 2012.12
Given the whole system focus of HPSR, there is growing discussion of the value of ‘systems thinking’ approaches drawn from complexity science in understanding and supporting action to strengthen the health system.13,14 As Box 2 indicates, HPSR also seeks specifically to understand the processes of policy change. Using policy analysis perspectives, it gives specific attention to policy actors and their interests and values as forces that shape not only which ideas become priorities within policy agendas but also the practice of policy and programme implementation.15 Both systems thinking and policy analysis emphasise the central place of people within health systems, as patients, providers, managers, decision makers,

Health Policy and Systems Research: Needs, challenges and opportunities 12
SAHR 2012/13 153
Sub-individual level
Individual level
Micro
Meso
Macro
Societal level
Biomedical research
Clinical and behavioural
research
Population health
research
Health policy and systems research
Improvement scienceImplementation science
Delivery scienceOperations research
Management science
as individuals and as groups whose values, norms, cultures and identities represent a key facet of every health system. In this way people act to filter, translate and re-shape the system constantly. Drawing on a range of social science theory, they understand health policies and systems to be “artifices of human creation, embedded in social and political reality and shaped by particular, culturally determined ways of framing problems and solutions”.8
Four defining features of HPSR, thus, explain its position relative to the broader field of health research and to the growing body of instrumental ‘implementation science’ (Figure 1). These are:
➢ the types of questions it asks (Box 2), which may entail research across individual (micro), organisational (meso) and/or whole system (macro) levels;
➢ its focus on supporting action for health system development and policy implementation, whilst acknowledging that such action is always influenced by political and social forces, rather than primarily technical, and is itself an important focus of research;
➢ its multi-disciplinary base, which encompasses both social science perspectives and the more traditional health research bases of biomedical, clinical and population health sciences; and
➢ its acceptance of a range of quantitative and qualitative data collection and analysis methods as all equally valid, when rigorously applied and appropriate to the question of focus.
Figure 1: The place of HPSR in the broader terrain of health research
Source: Adapted from Hoffman et al., 2012.5
But what is the relevance of HPSR to South Africa (SA)? What HPSR assets do we have, and what key challenges confront the field’s development in the country?
The remainder of the chapter addresses these questions, drawing partially on work conducted for the Consortium on Health Policy and Systems Analysis in Africa (CHEPSAA), as well as the discussions of a special pre-conference workshop on HPSR organised at the 2012 South African Public Health Association (PHASA) Conference.
What is the relevance of HPSR to South Africa?
The major current South African health system reform initiatives, both National Health Insurance (NHI) and re-engineering primary health care, as well as other health system strengthening efforts, all address output four of the Negotiated Service Delivery Agreement (NSDA), which seeks to strengthen health system effectiveness. The 10-Point Plan of the National Health Sector Strategic Framework 2010-13 also specifically recognises the need “to generate information for health planning, service delivery and monitoring”16 and the related research priorities identified in the 2011 National Health Research Summit report are very wide ranging.17 They include, for example, epidemiological and clinical effectiveness data, assessment of maternal health service quality and economic evaluation studies – and:
➢ better understanding of why existing health policies are not being implemented effectively;
➢ consideration of how to replicate pockets of health system excellence more widely and of how to improve operational efficiency;
➢ monitoring whether reforms are generating gains in terms of improved equity of access to health systems; and
➢ reflection on how to translate evidence into policy and practice.
All the bulleted priority issues fall clearly within the particular terrain of HPSR, as outlined earlier. As noted by Margaret Chan, the Director-General of WHO, – action to improve health system effectiveness demands the sort of research that can guide and evaluate the necessary health system investments.
What are the HPSR assets of South Africa?
SA is fortunate to have a rich variety of groups working in HPSR. They include the university-based schools of public health as well as other university groups: for example, the Community Health Division, University of Stellenbosch, has recently developed a focus on Health Systems and Services Research (HSSR), and the University of KwaZulu-Natal houses both the Centre for Rural Health and the Health Economics and HIV/AIDS Research Division (HEARD), while the University of the Free State is home to the Centre for Health Systems Research. Outside the university environment, meanwhile, two other key groups are the Health Systems Trust (HST) and the intra-mural Health Systems Research Unit of the Medical Research Council (MRC). Although more commonly focused on programmatic research questions, other health researchers, such as those working on specific issues such as TB or HIV or reproductive health, also sometimes get drawn to HPSR issues. Finally, some specific HPSR projects have been conducted by groups outside the health sector, such as by the Society Work and Development Institute at the University of the Witwatersrand.18
To illuminate the situation and work of South African HPSR groups, more details are provided about three groups whose work falls in the HPSR terrain. While these three groups are not the only university-based units working in this area, as part of CHEPSAA 2011 they conducted a capacity assessment of themselves and the broader environment. Some of the findings of this assessment are presented below as a case study.

154 SAHR 2012/13
Case study
Brief overview of three CHEPSAA-affiliated HPSR groups
The School of Public Health, University of the Western Cape (SOPH UWC) falls within the Faculty of Health Sciences and was established in 1993 with the purpose of supporting the building of a district health system under the country’s new democratic dispensation. The SOPH has had a strong health systems focus and currently incorporates three main research areas – social determinants and social systems, health programmes and interventions, and health systems. Its health system work focuses in particular on health information systems, human resources, and health programme strengthening but also, increasingly, on a better understanding of whole systems functioning. It has recently been successfully awarded a National Research Foundation (NRF) South African Research Chairs Initiative (SARChI) research chair in Health Systems, Complexity and Social Change, which it has now filled.
The Centre for Health Policy (CHP), a research group within the School of Public Health, University of the Witwatersrand, was established in 1987 to support the development of health policy for a post-apartheid South Africa. Its mission as an independent, multi-disciplinary research organisation is to contribute to excellence in health policy and systems research and to be a critical participant in health policy processes. Its primary areas of current focus are health policy analysis, access to health care, health equity and financing, human resources for health and maternal health and health systems. CHP has recently successfully been awarded an NRF SARChI research chair in Health Policy and Systems Research which it intends to fill in 2013.
The Health Policy and Systems Programme (HPSP) and Health Economics Unit (HEU) of the School of Public Health and Family Medicine (SOPH&FM), University of Cape Town (UCT) – while the HPSP is a very new grouping, established only in 2008 to deepen UCT’s work in understanding health policy change and whole system functioning, the HEU was founded in 1990. Together the groups conduct work focused on governance and decision making, healthcare financing, health system equity, access to care, and the economic evaluation of interventions for diseases of public health concern. The HEU is home to the NRF-funded SARChI research chair in Health and Wealth, which focuses on healthcare financing reforms to move towards universal coverage and on the social determinants of health in South Africa.
To situate these groups against international experience, Table 1 below presents some organisational profile indicators. It shows that the groups are perhaps a little smaller in size than groups elsewhere but that they have average to relatively good levels of expertise compared to other groups (considering the director’s experience, and the proportion of staff with doctorate degrees). All groups have relatively few senior staff and limited administrative support, although CHP and HEU employ dedicated Communications Officers. Finally, the mean value of HPS grants these groups held at the end of 2011 was roughly comparable with one another (although UWC had a higher total number and value of grants), but appeared to be above that of the average for middle-income countries (MIC) (although all figures are quite crudely estimated).
Table 1: Organisational Profiles of the three CHEPSAA affiliated groups
CHP, Wits HPSP/HEU, UCT SOPH, UWC (doing HPSR work)
2010 MIC (64 groups surveyed)
Staff profile 2012Director has more than 10 years’ experience
Yes Yes Yes 51% of groups surveyed
Number of academic staff 16 12 13 18 (group mean)
Number of staff with Doctorates
5/16 (31%) 9/12 (75%) 4/13 (30%) 36% (group mean)
Number of senior academic staff (Associate Professor, Professor)
2/16 3/12 4/13 n/a
Number of administrative staff
5 including 1 part-time Communications Officer
5 including 1 full-time Communications Officer
14 for SOPH as a whole, not exclusive to HPSR
n/a
Grant funding (end 2011)Number of active HPS grants held
12 10 16 n/a
Total value of grants held R31.2 million R34.13 million R39.6 million n/a
Mean grant value (2011) R2.4 million (approx. $300 000)
R3.41 million(approx. $426 250)
R2.47 million(approx. $308 750)
$137 135 (approx. R1 mill) (2010)(across total of 94 grants)
Number of grant-funded academic posts
15/16 9/12 6/13 n/a
Grant funding sources* International bilateral or multilateral
9 (75%) 6 (60%) 8 (50%) 66%
Government 3 2 2 22%
Private/Other (international and national)
1 3 6 16%
* One grant could be funded by more than one source.
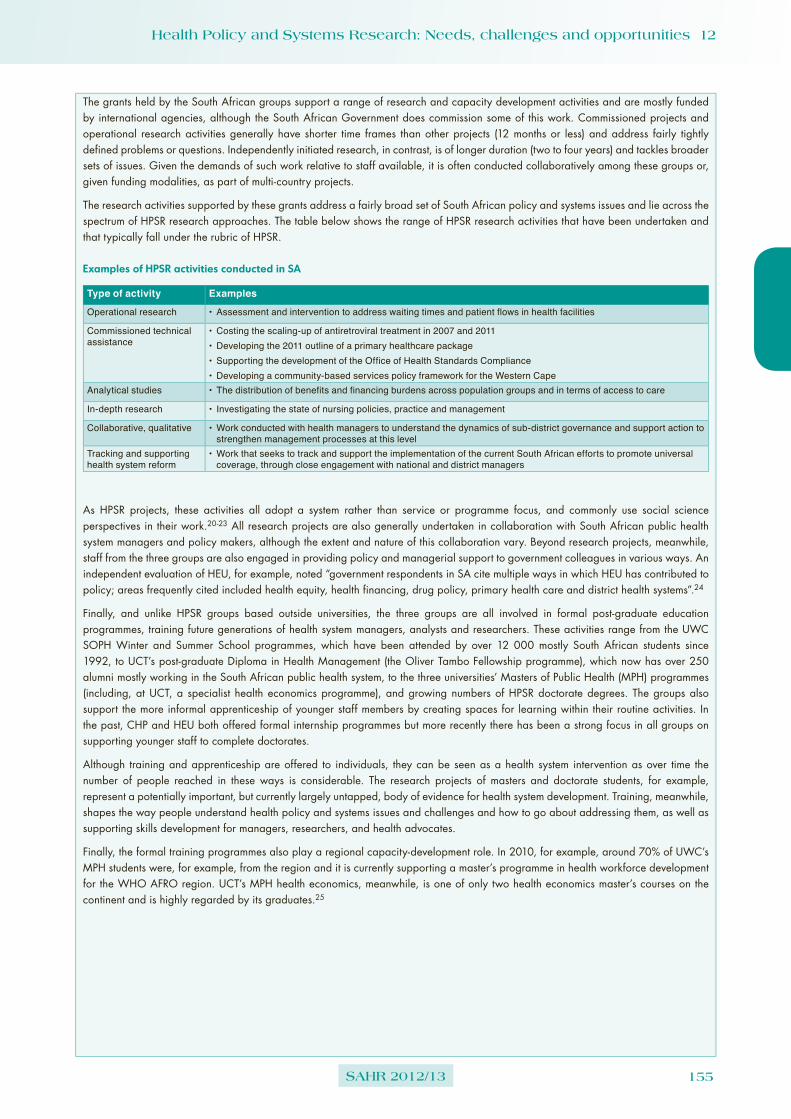
Health Policy and Systems Research: Needs, challenges and opportunities 12
SAHR 2012/13 155
The grants held by the South African groups support a range of research and capacity development activities and are mostly funded by international agencies, although the South African Government does commission some of this work. Commissioned projects and operational research activities generally have shorter time frames than other projects (12 months or less) and address fairly tightly defined problems or questions. Independently initiated research, in contrast, is of longer duration (two to four years) and tackles broader sets of issues. Given the demands of such work relative to staff available, it is often conducted collaboratively among these groups or, given funding modalities, as part of multi-country projects.
The research activities supported by these grants address a fairly broad set of South African policy and systems issues and lie across the spectrum of HPSR research approaches. The table below shows the range of HPSR research activities that have been undertaken and that typically fall under the rubric of HPSR.
Examples of HPSR activities conducted in SA
Type of activity Examples
Operational research •Assessment and intervention to address waiting times and patient flows in health facilities
Commissioned technical assistance
•Costing the scaling-up of antiretroviral treatment in 2007 and 2011•Developing the 2011 outline of a primary healthcare package •Supporting the development of the Office of Health Standards Compliance•Developing a community-based services policy framework for the Western Cape
Analytical studies •The distribution of benefits and financing burdens across population groups and in terms of access to care
In-depth research • Investigating the state of nursing policies, practice and management
Collaborative, qualitative •Work conducted with health managers to understand the dynamics of sub-district governance and support action to strengthen management processes at this level
Tracking and supporting health system reform
•Work that seeks to track and support the implementation of the current South African efforts to promote universal coverage, through close engagement with national and district managers
As HPSR projects, these activities all adopt a system rather than service or programme focus, and commonly use social science perspectives in their work.20-23 All research projects are also generally undertaken in collaboration with South African public health system managers and policy makers, although the extent and nature of this collaboration vary. Beyond research projects, meanwhile, staff from the three groups are also engaged in providing policy and managerial support to government colleagues in various ways. An independent evaluation of HEU, for example, noted “government respondents in SA cite multiple ways in which HEU has contributed to policy; areas frequently cited included health equity, health financing, drug policy, primary health care and district health systems”.24
Finally, and unlike HPSR groups based outside universities, the three groups are all involved in formal post-graduate education programmes, training future generations of health system managers, analysts and researchers. These activities range from the UWC SOPH Winter and Summer School programmes, which have been attended by over 12 000 mostly South African students since 1992, to UCT’s post-graduate Diploma in Health Management (the Oliver Tambo Fellowship programme), which now has over 250 alumni mostly working in the South African public health system, to the three universities’ Masters of Public Health (MPH) programmes (including, at UCT, a specialist health economics programme), and growing numbers of HPSR doctorate degrees. The groups also support the more informal apprenticeship of younger staff members by creating spaces for learning within their routine activities. In the past, CHP and HEU both offered formal internship programmes but more recently there has been a strong focus in all groups on supporting younger staff to complete doctorates.
Although training and apprenticeship are offered to individuals, they can be seen as a health system intervention as over time the number of people reached in these ways is considerable. The research projects of masters and doctorate students, for example, represent a potentially important, but currently largely untapped, body of evidence for health system development. Training, meanwhile, shapes the way people understand health policy and systems issues and challenges and how to go about addressing them, as well as supporting skills development for managers, researchers, and health advocates.
Finally, the formal training programmes also play a regional capacity-development role. In 2010, for example, around 70% of UWC’s MPH students were, for example, from the region and it is currently supporting a master’s programme in health workforce development for the WHO AFRO region. UCT’s MPH health economics, meanwhile, is one of only two health economics master’s courses on the continent and is highly regarded by its graduates.25

156 SAHR 2012/13
What challenges face the further development of HPSR in South Africa?
Despite the strong foundations that exist, participants in the 2012 PHASA pre-conference HPSR workshopa agreed that a range of challenges, at individual, organisational and system level, face the further development of South African HPSR work.
Individual level
A key challenge for the individuals involved in HPSR is that this work requires multiple perspectives. On the one hand, it is important to have some understanding of how health programmes, facilities and systems work in practice and of their challenges. On the other hand, an appreciation of the contribution of different social science disciplines to HPSR inquiry as well as a broader population health perspective is useful, as is a recognition of and sensitivity to the differing value of quantitative and qualitative methodological approaches to data collection and analysis. This breadth of perspectives requires, in turn, the confidence and ability to engage with people who sometimes have quite different experiences. Those working in HPSR have to be what are called “boundary spanners” – working across the boundaries of experience and approaches to knowledge and across sets of people and organisational environments.
However, students and young academics generally come to this field either primarily with health service experience and a very limited familiarity with social science perspectives, or with more of a social science base and a limited understanding of health programmes, services and systems. In either case, they need time and opportunity to broaden their horizons, with the best learning coming through active engagement and dialogue. It is also important to be able both to conduct analytical and research work and to make public presentations and write clearly, and for different audiences. Those working in academic environments must, in addition, be able to teach and facilitate, and to develop, run and manage courses and programmes intended to provide learning opportunities for others. Not surprisingly, therefore, younger staff working in the CHEPSAA-affiliated groups identified a range of current knowledge and skills gaps. These included conceptual limitations in relation to HPSR, needs in writing and presentation skills, a range of teaching and supervision skills, inter-personal confidence and skills for networking and mentoring, and research management competencies (such as grant writing and project and financial management).
Organisational level
Simply attracting younger academics into the field of HPSR and retaining them within the groups represents a first, key organisational challenge. Although public health and public policy, for example, are elements of other courses, HPSR is not itself taught at undergraduate level and so it is not widely known as a potential career option. Those who come to the field with some experience, meanwhile, can find the challenge of developing new skills and competencies tiresome, and may have unrealistic expectations of salary or career possibilities (particularly in academic organisations).
a This workshop was attended by around 30 participants drawn from government, universities and other research groups and sought to discuss both current South African HPSR work and future possibilities for strengthening it.
As Table 1 highlights, a sizeable proportion of posts in all three South African HPSR groups is grant funded. Not surprisingly, the relatively short-term and time-bound nature of such funding can generate contract instability. At an individual level, this makes planning the sort of long-term apprenticeship needed to develop HPSR capabilities very difficult; at an organisational level it can result in personnel turnover and instability. The pressure on senior staff in such groups is particularly intense. Beyond their own research, teaching activities and policy support work are the tasks of mentoring and coaching younger colleagues in their HPSR apprenticeship periods, as well as research, grant and teaching administration, including fund raising. Finally, as senior staff, they must also respond to broader organisational needs. Succession planning can be a real challenge in these situations.
The constant need of most groups to source and renew grants and to fulfil the very different, and sometimes demanding, reporting needs of different funders is a particular organisational demand. To support these activities, and lessen the burden on senior staff, some units have resorted to hiring extra staff to manage various operational and project management processes. However, such positions only add to the funding challenges, given limits on the level of overhead costs that can be included within research or other grants. A further funding issue is that some units do not hold any or many university-funded teaching posts, and so effectively cross-subsidise much of their teaching time from research grants (i.e. by allowing staff funded through research grants to spend some time teaching).
A final factor that commonly underpins resourcing challenges is the limited extent of organisational understanding and appreciation of HPSR. While all three CHEPSAA-affiliated HPSR groups are located within supportive schools of public health, for two, the broader environment remains primarily driven by the imperatives of clinical service provision and undergraduate health professional training. The multi-disciplinary knowledge base and trans-disciplinary approach of HPSR are just not always well understood or accepted by the biomedical paradigms of knowledge that dominate health research in the country.
System level
As already noted, HPSR can play an important role in supporting current South African health system reform efforts. Indeed, health systems research has been established as a South African priority since the Essential National Health Research Strategy of 2001. Yet various system-level challenges remain to the consolidation and development of such work in South Africa.
There are, for example, practical disjunctures. While policy makers seek fairly quick inputs to immediate needs, HPSR groups may find it difficult to respond quickly. Given their grant-funded basis, they have to take on projects to fund their staff and so are bound to particular activities and timeframes. As a senior researcher in one of the units noted:
I think the critical question for units like ours is how you find the balance between responding to the immediate short-term needs of politicians and civil servants versus some of the longer term issues.
University-based groups’ particular commitment to capacity development also brings the need to respect teaching timetables

Health Policy and Systems Research: Needs, challenges and opportunities 12
SAHR 2012/13 157
and respond to student needs. They often simply do not have the spare person power or flexibility in person use to take on commissioned work or to respond to calls for advice and assistance from government colleagues.
There is also some scepticism about ‘the other group’ on both sides. Although some individual researchers are held in high esteem by those in the policy world, there seems to be a broader suspicion among policy practitioners and managers about researchers. This seems to combine a sense that those working in HPSR, in particular, are not sufficiently engaged with real world experience, and a concern that all academics think first of publications for their own benefit and only second about engaging with health service needs or reporting back. Certainly, researchers do not always have appreciation of the daily realities of health service provision or the urgency and pressures of policy making. Their reliance on international funding (see Table 1) may also divert them from domestic research priorities, including engagement with health system practice. But, from the researchers’ perspective, governmental research leadership is not very strong and the pressures of health management make it difficult for government colleagues to engage with researchers or draw the available research into decision making. As a provincial government respondent noted:
I don’t really feel there’s anyone in the department that offers research leadership and if my unit is seen to be obstructive and bureaucratic and irritating, why would you even want to have a relationship within a unit like that? I think we haven’t helped. I think we have the image of being the typical bureaucratic slow inefficient unit.
For HPSR, research scepticism also seems to be linked to conceptual disconnects. In the wider health community the dominant clinical, biomedical, and epidemiological health service12 perspectives tend to focus on service rather than system issues, and particular forms of research. The issues identified as health systems research priorities at the 2011 National Health Research Summit,17 for example, tend to focus on specific service delivery issues, rather than the widely acknowledged system challenges of, say, health worker motivation, priority setting and planning or management. It appears these wider issues are somehow not seen to be researchable questions, or that the related research approaches are not well understood or appreciated. Indeed, in drawing on social science perspectives, HPSR may challenge the understandings of the world and of research that underpin the dominant perspectives of health and health research in South Africa.
These types of disjunctures are, in turn, underlain, first, by the quite limited regular engagement among those with shared concern for health system development, who both do and could use HPSR – whether based in universities, NGOs, or government. There are few opportunities simply to pool different types of knowledge and experience of existing challenges and possible approaches to tackling them, and so to develop shared, and richer, understandings of research priorities and relevant research approaches. Competition for funding and multiple workplace demands seem sometimes even to limit engagement among the research community. Yet such engagement is really critical because of the complexity of health systems and their development – no group has a monopoly on good insights and ideas; indeed, if the challenges were simple, they would have already been addressed. Provinces are responding to this challenge differently.
The second underlying problem is the lack of deliberate national action to develop this area of work. There has been, for example, no large-scale domestic scholarship support for post-graduate training in the field, at either master’s or PhD level. Until recently, few South Africans applied for the HEU Health Economics MPH, for example, and most of the three CHEPSAA-associated groups’ South African doctorate candidates are its own staff. At the same time, there are very few established positions within government for those with health system analytic skills – such as health economists, policy analysts, or process analysts. As one university respondent stated:
if you are someone who comes out with a degree there is nowhere for you to go to deploy your skills; you either do something else or you go to the private sector or you go to stay in the university.
Yet much of the analytic work that is currently commissioned and demanded by government would probably be better done in-house. There is a clear need for analysts working within government who have the range of skills necessary to support the translation of available evidence and research into decision making, as well as to commission research that cannot be done in house.
Funding remains the final challenge. The 2011 National Health Research Summit report notes that in 2011/12 the Department of Health invested only 0.37% of its budget in all forms of health research,17 falling well short of its commitment to meet the 2% of budget target set in the Mexico and Bamako ministerial meetings. Whilst it is not known what proportion of the national health research budget is directed specifically to HPSR, it can be estimated as very little. Only HST has any form of structured and limited funded relationship for research with government, and the MRC also allocates relatively little of its total budget to HPSR. In contrast, however, the NRF has made a significant contribution in approving three HPSR chairs within the SARChI. This funding has the added value of being linked to broad programmes of work, rather than very tightly defined projects over five-year periods and includes some scholarship funding at master’s, doctoral and post-doctoral levels.
Strengthening the capacity to generate and use evidence for health system development
As SA looks to the future – and pursues its goal of health system transformation, it is essential that it also takes action to develop the engine room of transformation – i.e. the knowledge and evidence base to support change, and the capacity to draw it into decision making. HPSR is vital to that effort as it addresses the systemic challenges that must be tackled to improve service delivery, support implementation of public health priority programmes, and so contribute to improved population health. The 2012 WHO HPSR strategy1 affirms that: “At its best, HPSR should function as the GPS of health decision-making, providing navigational support to the decision-maker, locating the starting point for the journey (the health problem), the desired destination (the health outcome) and options for getting there (health solutions).”
This strategy, and the wider literature, also confirms that the South African challenges to HPSR development are not unusual. However, the examples of middle-income countries that have successfully implemented large-scale health system transformation offer lessons from which SA can learn. Drawing on such experiences, the WHO

158 SAHR 2012/13
calls for “HPSR to become embedded in the ecosystem in which the decision makers operate”1 and identifies six broad areas of action (Box 3). Both researchers and decision makers must take action. Demand-driven research, for example, requires the transparent and collaborative identification of research priorities and decision makers who support evaluation of large-scale reforms and who are personally ready to use evidence in their decision making.
Box 3: WHO HPSR strategy actions
1 Embed research within decision-making processes
2 Support demand-driven research
3 Strengthen capacity for research and use of evidence
4 Establish repositories of knowledge
5 Improve the efficiency of investments in research
6 Increase accountability for actions
The lessons of experience suggest that a key step towards embedding HPSR in decision making is greater and more regular engagement among decision makers and researchers. It was timely, therefore, that the 2012 PHASA pre-conference workshop discussed the value of establishing a national network or community of practice for HPSR in South Africa. Bringing together researchers inside and outside government, with practitioners in all spheres of government and in NGOs, such a network would give the field a stronger voice and a credible presence.
Concretely, participants felt that such a network could:
➢ develop a common language for the field;
➢ synthesise experiences and research results;
➢ develop joint research agendas, and so avoid duplication; and
➢ better respond to government needs.
Its value would, however, lie very strongly in building relationships among interested groups – allowing different forms of experience and knowledge to be shared (from the tacit knowledge of managers and advocates to the theoretical knowledge and awareness of wider experience of researchers); generating more rounded and in-depth understanding of current challenges and opportunities for health system development; and allowing a greater appreciation of the range of research available and of the value of different types of evidence.
Greater recognition of HPSR could also be a key first step towards securing more funding for it. The importance of funding to sustaining HPSR worldwide led the WHO to identify three areas of action by funding bodies:1
➢ “Minimum targets for HPSR funding, as a proportion of all health research funding, could be established by donors and governments in order to ensure sufficient resources for the conduct of research.
➢ Allocate resources for HPSR as part of programme activities (planning, implementation, and evaluation) … to ensure adequate funding for relevant research to inform these processes.
➢ To facilitate the generation of evidence that responds to complex health system challenges that can only be understood over an extended period of time, efforts should be made to establish flexible funding mechanisms that are not restricted
to individual projects. Institutional endowments and/or cooperative agreements could be used by funders of research to support a range of trans-disciplinary research activities to address multi-faceted health system problems.”
In South Africa, the funding needs are not only for research but also, critically, for capacity development. Those engaged in teaching and capacity development must, therefore, be fully funded for their capacity-development roles. However, the restriction of the recently announced health scholars programme to health professionals eligible to register with health statutory councils only demonstrates the current system-bias against the broader perspectives of HPSR.
Beyond funding, moreover, SA must also consider how to attract a wider range of, and younger, people into HPSR – to work as researchers, analysts and managers and to sustain capacity development efforts. The necessary actions include efforts to develop the skills, knowledge and networks that enable boundary spanning, with clear training and apprenticeship opportunities. Supportive environments are also important – including retention incentives and career trajectories within the field that span organisational boundaries. Government posts must be established for those doing HPSR and more secure funding must be found for those groups working outside government. An HPSR community of practice could also both itself help to give value to this area of work, and develop practical recommendations on this range of issues.
Looking to the future, Box 4, finally, outlines the priority HPSR issues and methodological needs that the budding South African HPSR community itself identified at the PHASA pre-conference workshop.
Box 4: South African priorities for HPSR development
❖ Substantially more research with a systems rather than an inter-vention focus should be carried out.
❖ In relation to the NHI there is a great need to understand what the policy will mean and how it will impact on and reshape health systems functioning. There is also a need to track and monitor implementation and to learn from implementation continuously.
❖ More research needs to focus on the meso- and micro levels of systems’ development, rather than primarily the macro level.
❖ There is a need for research that investigates why implementation fails, what guides implementation at the level of service delivery, and that understands the role of power and politics in the development of health systems. Research should also investigate the role of actors and what guides people’s action. The factors that influence what people do are very important questions in this regard.
❖ We need to develop methods and approaches that recognise and provide insight into the complexity of health systems functioning, understanding that such research often takes time and defies single tools and quick solutions.
❖ There is a need for collaborative research approaches and initiatives, strengthening the applied research skills of all involved. This includes action-oriented research that covers the continuum from policy formulation to implementation. And it includes attention to user-friendly, participatory approaches that strengthen the researcher-practitioner link: researchers need to be informed by implementers’ needs and implementers need to see research results.
❖ We need to synthesise and share what we are learning across projects. At present there is too much fragmentation and research is disparate and uncoordinated. There is a need to create fora for such sharing and engagement across projects, institutions and research approaches.

Health Policy and Systems Research: Needs, challenges and opportunities 12
SAHR 2012/13 159
Acknowledgements
The work presented in this chapter was funded by the European Commission FP7-Africa-2010 (EC Grant Number: 265482). We thank all those who were involved in the capacity assessments presented here. We also thank our colleagues in the CHEPSAA consortium and, in particular, Tolib Mirzoev and the team at the Nuffield Centre for International Health and Development, University of Leeds, for their development of the assessment approach.

160 SAHR 2012/13
References
1 World Health Organization. Changing mindsets. Strategy on Health Policy and Systems Research. Geneva, Switzerland: World Health Organization; 2012.
2 World Health Organization. The World Health Report 2000 – Health systems: Improving performance. Geneva, Switzerland: World Health Organization; 2000.
3 World Health Organization. Global Ministerial Forum on Research for Health; Bamako, Mali. 17-19 November 2008.
4 World Health Organization. Ministerial Summit on Health Research; Mexico City, Mexico. 16-20 November 2004.
5 Hoffman SJ, Røttingen J, Bennett S, Lavis JN, Edge JS, Frenk J. Background paper on conceptual issues related to health systems research to inform a WHO Global Strategy on Health Systems Research. Geneva, Switzerland: Alliance for Health Policy and Systems Research; 2012.
6 World Health Organization. Closing the gap in one generation. Health equity through action on the Social Determinants of Health. Geneva, Switzerland: World Health Organization; 2008.
7 Gilson L, Hanson K, Sheikh K, Agyepong IA, Ssengooba F. Building the field of health policy and systems research: Social science matters. PLoS Medicine. 2011;8(8):e1001079.
8 Sheikh K, Gilson L, Agyepong IA, Hanson K, Ssengooba F. Building the field of health policy and systems research: Framing the questions. PLoS Medicine. 2011;8(8):1-6.
9 Van Olmen J, Marchal B, Damme W, Kegels G, Hill P. Health systems frameworks in their political context: Framing divergent agendas. BMC Public Health 2012;12(1):774.
10 World Health Organization. Scaling up research and learning for health systems: Now is the time. Geneva, Switzerland: World Health Organization; 2008.
11 Bigdeli M, Jacobs B, Tomson G, Laing R, Ghaffar A, Dujardin B, et al. Access to medicines from a health system perspective. Health Policy Plan. 2012 (Unpublished. Accepted 2012).
12 Gilson L, editor. Health policy and systems research. A methodology reader. Geneva, Switzerland: Alliance for Health Policy and Systems Research; 2012.
13 De Savigny D, Adam T, editors. Systems thinking for health systems strengthening. Geneva, Switzerland: Alliance for Health Policy and Systems Research; 2009.
14 Swanson RC, Cattaneo A, Bradley E, Chunharas S, Atun R, Abbas KM, et al. Rethinking health systems strengthening: Key systems thinking tools and strategies for transformational change. Health Policy Plan. 2012;27(Suppl 4):iv54-iv61.
15 Harrison S. Health Policy. In: Fulop N, Allen P, Clarke A, Black N, editors. Studying the organisation and delivery of health services: Research methods. London: Routledge; 2001.
16 National Department of Health. Strategic Plan 2010/11-2012/13. Pretoria: National Department of Health; 2010.
17 Mayosi BM, Mekwa NN, Blackburn J, Coovadia H, Friedman IB, Jeenah M, et al. 2011 National Health Research Summit Report. Pretoria: National Department of Health; 2011.
18 Von Holdt K. Nationalism, bureaucracy and the developmental state: The South African case. S Afr Rev Soc. 2010;41(1):4-27.
19 Penn-Kekana L, Blaauw D, Schneider H. “It makes me want to run away to Saudi Arabia”: Management and implementation challenges for public financing reforms from a maternity ward perspective. Health Policy Plan. 2004;19 Suppl 1:i71-i77.
20 Lehmann U, Gilson L. Actor interfaces and practices of power in a community health worker programme: A South African study of unintended policy outcomes. Health Policy Plan. (Unpublished, accepted 2012).
21 Schneider H, Blaauw D, Gilson L, Chabikuli N, Goudge J. Health systems and access to antiretroviral drugs for HIV in Southern Africa: Service delivery and human resources challenges. Reproductive Health Matters. 2006;14(27):12-23.
22 Ditlopo P, Blaauw D, Bidwell P, Thomas S. Analyzing the implementation of the rural allowance in hospitals in North West Province, South Africa. J Public Health Policy. 2011;32 Suppl 1:S80-S93.
23 Bennett S, Agyepong IA, Sheikh K, Hanson K, Ssengooba F, Gilson L. Building the field of health policy and systems research: An agenda for action. PLoS Medicine. 2011;8(8):e1001081.
24 Gilson L, Doherty J. South African managers speak out. Lessons for innovative health management. Innovative health management in the public sector. University of Cape Town: Oliver Tambo Fellowship Programme; 2010.
25 Mayosi BM, Lawn JE, Van Niekerk A, Bradshaw D, Abdool Karim SS, Coovadia HM. Health in South Africa: Changes and challenges since 2009. The Lancet. 2012;380(9858):2029-43.

Authors:
161SAHR 2012/13
13131313131313
Soraya Elloker,i Patti Olckers,ii Lucy Gilson,iii Uta Lehmanniv
i Manager, Mitchell’s Plain sub-district, City of Cape Town Department of Health.ii Manager, Mitchell’s Plain/Klipfontein sub-structure, Metro District Health System,
Western Cape Department of Health.iii School of Public Health and Family Medicine, University of Cape Town and
London School of Hygiene and Tropical Medicine, UK.iv School of Public Health, University of the Western Cape.
Crises, Routines and Innovations: The complexities and possibilities of sub-district management
Districts and sub-districts are crucial to the functioning of the district health system and the successful implementation of health sector reforms, which have been at the centre of public debate in the past few years. While policy
intentions and service challenges are much debated, little systematic discussion is held about the internal operations and functioning of sub-districts and districts. These dynamics will strongly influence the implementation of the reforms proposed.
This chapter discusses the complexities and challenges of managing a sub-district, using as a case study the Cape Town sub-district of Mitchell’s Plain. Drawing on debates in systems thinking and management theory the role of districts and sub-districts at the interface between strategic policy direction and operational service implementation is discussed. The chapter uses experience from an action learning project in Mitchell’s Plain to present examples of innovation aimed at strengthening leadership and routine management functions. We argue that routine management in an environment of stress, constraints and uncertainty requires that managers be resilient, reflective, and continuously able to learn, analyse and adapt. Management and leadership development programmes should focus on developing these capabilities (within and beyond the classroom), in addition to developing technical skills and capacities.
Routine management in an environment of stress,
constraints and uncertainty requires that managers
be resilient, reflective, and continuously able to learn,
analyse and adapt. These are the
characteristics of good leaders.

162 SAHR 2012/13
Introduction
The district is the cornerstone of South Africa’s health system. Since 1995 a series of policies and interventions have contributed to shaping the South African District Health System (DHS) in its present form. These policies and interventions have ranged from establishing district boundaries to clarifying the relative roles of provincial and local government in delegating authority and drawing up district health planning processes.1-4 The 2011 proposals for both Primary Health Care (PHC) re-engineering5 and National Health Insurance (NHI)6 reaffirm the foundational role of the DHS within the health system and as the vehicle through which PHC will be delivered. A core objective of the NHI pilot sites is the development of innovative ideas about how to strengthen the DHS.
Alongside structural and organisational innovations and interventions have been discussions and concerns about standards and the performance of the DHS. Politicians, officials, media and researchers have frequently pointed to uneven and often poor access to and quality of health services throughout the country. The Health Systems Trust’s annual District Health Barometer provides publicly available data on key indicators of structure and performance across all health districts in the country, which reflect vast unevenness in performance. One of government’s responses to its growing concern with quality and performance has been the move towards the establishment of an Office of Health Standards Compliance which will audit standards of care, from patient rights to infrastructure and clinical support in health facilities.
But while poor quality and inequitable access to health services are acknowledged, in contrast, little information is formally available about the dynamics, opportunities and challenges of routine operations in a South African health district (although the 2001 South African Health Review did air the voices of district managers).7 Yet change in the organisational culture of the South African health system is recognised as a key requirement for implementing current policy priorities and improving performance and quality of care.8,9
Understanding health system capacity and complexity
Literature from outside the health sector also highlights the importance of daily practices and routines to an organisation’s collective capacity; i.e.:
that combination of attributes that enables a system to perform, deliver value, establish relationships and to renew itself ... the abilities that allow systems – individuals, groups, organisations, groups of organisations – to be able to do something with some sort of intention and with some sort of effectiveness and at some sort of scale over time.10
As summarised in Figure 1, organisational capacity rests on three interacting dimensions: the hardware of infrastructure, technology and funding levels; the tangible software of knowledge, skills and processes of decision making; and the intangible software of relationships, communication practices, values and norms. The intangible features are particularly important in shaping the behaviours of those working in the organisation and underpin its “power to perform”. Organisational practices and routines are located in the software dimensions, but are shaped by the organisational hardware.
In the health literature the particular importance of the intangible capabilities of systems (and the time and patience it takes to build strong and resilient systems) has been highlighted in the 2011 publication Good Health at Low Cost – 25 years on.12 This publication reports on an assessment of the health systems of five countries (Bangladesh, Ethiopia, Kyrgyzstan, Tamil Nadu (India), Thailand) that have achieved better health outcomes than neighbouring countries with similar incomes. Beyond policy actions around human resources, healthcare financing and drug supply, government leadership and vision and organisational software were found to be important in sustaining health system resilience to withstand shocks and secure good health at low cost.
Values and norms
Relationships
Communication
Power
Management knowledge and
skills
Organisational systems and procedures
Infrastructure Technology Finances
Hardware
Tangible software
Intangible software: capabilities to commit and engage; adapt and self-renew; balance diversity and coherence through:
Figure 1: Organisational capacity to function as a resilient, strategic and autonomous entity
Source: Adapted from Aragón, 2010.11

The complexities and possibilities of sub-district management 13
SAHR 2012/13 163
Such shocks included the changing health demands associated with epidemiological and demographic transition, new drugs and technology, wider economic crisis – and the quite frequent waves of health reform initiatives in every setting.13,14 The key features of successful health systems identified in this study are summarised in Box 1 below.
Box 1: Key features of successful health systems
A health system has been found to be successful when it:
❖ has vision and long-term strategies;
❖ takes into account the constraints imposed by path dependency;
❖ builds consensus at societal level;
❖ allows flexibility and autonomy in decision making;
❖ is resilient and learns from experiences, which it feeds back into the policy cycle;
❖ receives support from the broader governance and socio-economic context in the country and is in harmony with cultural and popular preferences;
❖ achieves synergies among sectors and actors; and
❖ demonstrates openness to dialogue and collaboration between public and private sectors with effective government oversight.
Source: Balabanova et al., 2011.12
Worldwide, these and similar experiences are leading health system practitioners and scholars to look to complexity theory and systems-thinking approaches to aid their understanding of what health systems are, how they operate and how to strengthen them. Adams and de Savigny noted in 2012:
Health systems are complex. Failing to take this complexity into account will continue to hinder efforts to achieve better and more equitable health outcomes. Understanding and working with complexity requires ... dynamic and holistic approaches that appreciate the multifaceted and interconnected relationships among health system components, as well as the views, interest and power of its different actors and stakeholders.15
From this perspective health system strengthening is about building a learning culture and promoting collaboration across disciplines, sectors and organisations. Importantly, strengthening health systems involves developing leaders distributed across the system, who work to transform existing routines and practices.16
These understandings of collective capacity and systems suggest that strengthening the South African DHS requires better understanding of what a South African health district looks like from the inside – what the daily routines and challenges of district managers are and what opportunities they contain for strengthening the DHS software.
A case study in sub-district functioning and innovation
This chapter addresses these issues by presenting a case study of one urban sub-district as a stimulus for reflection elsewhere in the health system. Although not all provinces have yet established sub-districts, Naledi et. al.9 note the critical importance of stronger sub-district management in PHC strengthening. We also suggest that the experience presented here can stimulate debate about broader district functioning. Whilst the specifics of this sub-district will clearly be just that, specific to its context, many of its critical
features are likely to be more widely shared – importantly, the location of districts and sub-districts at the interface between strategic policy direction and operational service implementation. Early reviewers of this chapter, have confirmed that this particular experience is reflected in other areas of the country. Management commonly requires: working within multiple lines of authority and managing multiple demands and many sets of actors; seeking to lead and supporting others to lead; and challenging organisational cultures whilst being subject to continuing uncertainty and change in structural arrangements and delegations.
Some of the experiences from this case study indicate the possibility of innovating within this complexity, of initiating the processes of software change that are essential for implementing policy reforms and achieving service delivery improvements.9,17 We present them to encourage a wider sharing of experience about the processes of positive change that are already occurring, mostly unnoticed, within the South African health system. In addition, we argue that stimulating and generating positive organisational change is a key task of managers and leaders, which requires new understandings of the managerial/leadership role and new approaches to health system research. The case study reported on in this chapter, has been developed as part of a wider action learning project partnership between health services and academic groups – the DIALHS projecta – that seeks to understand and improve health system governance. Through collaborative action learning and reflective practice the case study draws on a combination of managerial tacit knowledge and scholarly understandings, brought together through a series of conversations and engagements among the authors.
This is a case study of the Mitchell’s Plain sub-district in Cape Town. Health service delivery in Mitchell’s Plain is under the dual authority of the Metro District Health System (MDHS) of the Western Cape Department of Health and the City of Cape Town (CoCT) health department.
Box 2 provides more details about the sub-district, which is a relatively low-income community (with 83 informal settlements). The community has a relatively poor health status and health problems that reflect the South African quadruple burden of disease. Although the Mitchell’s Plain 2010/11 PHC utilisation rate was not as high as in other areas in Cape Town, the MDHS as a whole managed a ten-fold headcount increase between 1994/5 and 2011/12 – reflecting the combination of a growing population and disease burden, and improved access. Relative to population and headcount levels, Mitchell’s Plain is under-resourced compared to other Cape Town sub-districts. Clinics in Mitchell’s Plain on average each serve a population of over 64 000 (the target for urban areas is 24 000). Daily workload averages in 2010/11 were 40 patients per medical officer in Community Health Centres (CHCs) and 50 patients per professional nurse in clinics and CHCs. Despite the challenges, a range of service indicators point to a strong health service performance in the sub-district. It also has a TB cure rate of 88%, immunisation coverage of 93% and 56% of antenatal care (ANC) visits occur before 20 weeks.
a The District Innovation and Action Learning for Health System Development (DIALHS) project is a partnership between the City of Cape Town and the Western Cape Department of Health and the Universities of Cape Town and the Western Cape funded by the Atlantic Philanthropies.

164 SAHR 2012/13
Box 2: Mitchell’s Plain health system profileb
Population: In 2010/11, the population was estimated at 510 267, 88% of which do not belong to a medical aid scheme.
Health status: Just over half (5.5%) of the children under-five present with failure to thrive. The infant mortality rate is 14 per 1 000 live births and there is a high incidence of diarrhoeal cases and other illnesses related to poverty. The tuberculosis (TB) incidence is 687 per 100 000 and the sub-district carries a quadruple burden of disease, with a co-infection rate of TB and HIV of 50% and non-communicable diseases, mental ill health and violence putting serious strain on services. Substance abuse affects most households.
Government health services
The following services are provided to the population by the government:
❖ community-based service platform managed through MDHS and environmental health services managed through CoCT;
❖ nine CoCT clinics staffed by nurses;
❖ four CHCs (3 MDHS, 1 CoCT), with medical and nursing staff; 1 offering 24-hour services, 3 offering 8-hour services; and
❖ one Level 1 hospital with 188 beds, which is currently being decommissioned. A new Level 1 hospital with a future capacity of 220 beds is under construction, to be opened in 2013.
Financing 2011/2012:c
❖ R358 per uninsured head (district average of R533; national average of R514)
❖ An average of R141.40 is spent on each PHC visit; the district average is R147.40, while the national average is R176.
Government health service performance indicators:
❖ The total headcount for PHC facilities was 9.9 million in 2010/11
❖ The 2010/11 PHC utilisation rate stood at 2.85 per uninsured head (district average of 3.7; national average of 2.3)
❖ In 2011/12 88% facilities were supervised monthly (district average 56%; national average of 68.8% in 2010/11)
Source: Day et al. 2011.18 Western Cape Department of Health, 2011.19
The complexity of the sub-district health system
Figure 2 shows the organisational complexity of the sub-district and how it is situated within municipal and provincial district structures. As Mitchell’s Plain is located in a metropolitan area, provincial and local government have dual, overarching responsibility. Managers from the MDHS sub-structured and from the CoCT sub-district independently manage the services that fall under their jurisdiction. They also coordinate services, through the Integrated Sub-district Management Team (ISDMT), in areas agreed within the annually renewed service level agreement (SLA). In addition, as elsewhere in the country, these managerial teams are jointly and separately responsible for: Level 1 hospitals and PHC facilities; specific health programmes (e.g. environmental health and TB/HIV); contracts with
b Figures are drawn from the 2011/12 MDHS District Health Expenditure Review (DHER) for sub-district and district data and from the 2010/11 District Health Barometer (DHB)18 for national averages. Note that the DHB data are not disaggregated to sub-district level and the 2010/11 DHER19 is the most recent that is publicly available.
c The DHER and DHB data differ in relation to district averages. For example, for expenditure per uninsured head the DHB district average is R648. However, the DHER figures reported here as the primary focus of this chapter relate to the sub-district and only the DHER reports these data disaggregated to sub-district level.
d The MDHS is divided into four sub-structures, each of which consists of two sub-districts. Each sub-structure manager thus is in charge of two sub-districts. This study focuses on the Mitchell’s Plain sub-district. In the rest of this chapter we will use the terms “sub-district” and “sub-district manager”, although the MDHS manager is, in fact, in charge of two sub-districts (Mitchell’s Plain and Klipfontein).
non-profit organisations (NPOs) that support community health workers (CHWs); and a range of support services (e.g. finance, supply chain and health information). The Mitchell’s Plain managers are answerable to the MDHS Chief Director and to the Executive Director of Health, CoCT, respectively. At district level, the district executive (DEX) provides joint oversight of services. Programme managers at CoCT and provincial level, such as TB/HIV managers, also provide some support to the sub-district. The MDHS Chief Director is, finally, responsible to the Deputy Director-General for the DHS at provincial level, and the Executive Director for Health to the City Manager.
Although they work within a complex hierarchical structure, local managers now hold substantial delegated decision-making power. Both city sub-district and provincial sub-structure managers, for example, have the authority to move posts between facilities within the sub-district, aided by relevant guidelines and tools and working within existing salary budgets. In the City structures drugs are procured via the Central Medicine Depot (CMD) by the sub-district pharmacist within an allocated budget. Additional funds need to be advocated to the district executive; e.g. when antiretroviral services are introduced in a new clinic. The increased pharmaceutical needs are then included in future planning. In the MDHS, however, each facility has a pharmaceutical budget and each pharmacist, together with the facility manager, is responsible for the management of this budget and for procurement from the CMD. Finally, in the provincial structure the securing of the budget for capital equipment is a centralised process, while procurement of equipment is a sub-structure function. Similarly, in the City, purchasing equipment is decentralised to the sub-district and procurement is based on the needs of facilities. The challenge, however, is that the budget for capital equipment is always insufficient.
Organisational complexity has historical and cultural dimensions in every setting. The South African health system has a particular history of severe health service fragmentation and inequity. Today only two authorities manage health services within Cape Town. However, different histories and cultures continue to influence interactions among the sub-district actors. These include differences in their past service responsibilities. For example, local government has always focused on preventive and promotive services, basic curative services for children, and infectious disease control while provincial government has focused on hospital curative care. Local government has also followed a nurse-led service model while the province has used a doctor-led model.
Management structures in the two authorities have, moreover, evolved at different paces. The MDHS is a very new structure, as it was only formalised during the 2008/09 financial year, in line with the National Health Act (Act 61 of 2003), with new managers appointed to Mitchell’s Plain in 2008. In contrast, CoCT health management structures were consolidated in 2000 and the Mitchell’s Plain sub-district manager has been in the post since 2005. At the same time, although CoCT sub-district managers were previously seen as having a fair degree of decentralised decision-making authority, MDHS sub-structure managers have in a fairly short period of time been given perhaps greater levels of decentralised authority.
However, organisational histories and cultures are slow to change and South African state bureaucracies come out of a history of autocratic hierarchy and deference, which complicate and

The complexities and possibilities of sub-district management 13
SAHR 2012/13 165
MDHSCoCT
DEX: Joint City and MDHSDistrict
Sub- district
Facility
Community
Community Health Committees
Executive Director Health
and team Chief Director MDHS and team
DD ComprServices:ADs:•Facility-based
service•TB/HIV•PMTCT•Rehab•CBS
DDs:HR,Finance, Supply ChainCEO Hospital FamMed physician
Admin Officer, HIO, Head EHP, SMO, Prg Coordinator
PHC andprg manager
TB/HIV/STIcoordinators
Clinics FM
Combinedfacility
NGOs
Glossary:Line management functionSupport functionCollaboration
Community Health
Centres FM
DD PHC
SD manager
SS Director
ISDMT
Figure 2: Lines of authority in the Cape Town Metropolitan Health District
AD – Assistant Director;CBS – Community Based Services;DD – Deputy Director; DEX – District Executive;EHP – Environmental Health Practitioners; FM – Facility Manager;HIO – Health Information Officer;HR – Human Resources;ISDMT – Integrated Sub-district Management Team;MSAT – Multi-Sectoral Action Teams.PMTCT – Prevention of mother-to-child transmission; SD – Sub-district;SS – Sub-structure; STI – Sexually Transmitted Infection.

166 SAHR 2012/13
delay moves to encourage initiative, innovation and distributed leadership:8,20 “… skills gaps and deference tend to elevate the importance of rules, procedures and hierarchy for their own sake, while at the same time ambivalence towards authority undermines these”.20 Many of the findings of the Local Government and Health Consortium, which reviewed the DHS in the early 2000s, are still relevant today, despite substantial de-facto decentralisation of decision-making powers: “People at every level, but particularly front line managers and providers, feel that they work in isolation from others at their own level, and face a top heavy and rigid management hierarchy that imposes multiple and often conflicting demands”.3
Health staff in the sub-district are often passive in their decision making and tend to wait for direction from above. At the same time, they experience managerial direction from higher levels as instructional and authoritative. The common use of bureaucratic procedures such as standard operating procedures and formal memos to guide the actions of lower-level staff adds to their experience of hierarchy and supports a compliance culture. As discussed later, these patterns represent a significant challenge for sub-district managers.
The complexity of sub-district management
Within these complex organisational health system structures, and given delegated authority, sub-district managers occupy a pivotal position: the point where strategic direction has to be translated into daily system functioning and service delivery. From this position they have to mediate between, translate and integrate national, provincial and local service plans and initiatives; take responsibility for meeting delivery targets; and manage the operational efficiency of the PHC system.
What does this mean for their routine managerial reality? This work provides three core insights, which are discussed in the sections below:
➢ Sub-district and managers routinely manage a mix of expected and unexpected demands, activities, and larger and smaller crises that occur at the front line of service delivery;
➢ They manage an intricate network of role players; and
➢ They engage in multiple formal and informal planning and management processes, either through meetings or through individual interactions with staff. (See Box 3)
Box 3: The 2010 measles campaign
A 2010 measles outbreak led to a large-scale vaccination campaign across the CoCT – at the time when the national (HIV Counselling and Testing) HCT campaign was beginning (and during which over 103 681 people were tested in the Mitchell’s Plain sub-district alone over a 15-month period). Over a period of three weeks 113 425 (82.3% coverage) children aged between 9 months and 15 years had to be vaccinated while routine services had to remain fully functional. This not only meant that thousands of dosages of vaccines had to be distributed and kept refrigerated; it also required large-scale collaboration with schools and crèches, which had to distribute and collect consent forms and make vaccination points available. Large numbers of staff had to be reallocated to vaccination points from facilities and close collaboration had to be maintained between city and provincial services.
Decisions about the campaign were taken at provincial level and some support was provided in the form of additional human and other resources. However, the temporary reconfiguration of services, engagement with other sectors, and the responsibilities for ensuring communication, mediating relationships, ironing out operational problems and reporting and accounting were undertaken by sub-district managers and their teams. Each outreach team was supported by volunteers, which included the health committees, and non-governmental organisation (NGO) and retired staff. In some instances additional staff was procured via labour brokers to assist where there was low coverage and in large geographical areas. The campaign included careful planning before it started and daily monitoring to support reallocations of resources and priority areas.
Managing behind the front line of service delivery
Like all managers, sub-district managers simultaneously have to translate strategic policy decisions into operational directions and have to account for operational performance in relation to strategic policy objectives and targets. Their daily practice is also composed of both routines and crises; they spend an inordinate amount of time dealing with service delivery dysfunctionality, very often generated by a lack of proactive management at lower levels of the system. From the sub-district managers’ perspective, facility and operational managers are often “unable to see the big picture” and some seem unable or unwilling to manage and see themselves as responsible and accountable for implementing policies.
Three typical and recurring examples of managing behind the front line are:
➢ efforts to enable and encourage facility managers to conduct daily assessments of clinic staffing needs relative to patient load and allocate staff to service these needs;
➢ encouraging facility managers to follow up and deal proactively with patient complaints (see Box 4); and
➢ addressing poor staff performance in such action.
In all cases the sub-district management challenge lies in enabling and encouraging facility managers to develop a proactive management role. Proactive management involves guiding or instructing facility staff, delegating tasks, and holding staff to account. Such proactive management is hampered by challenging working environments (which include very high patient numbers, staff shortages and abusive patients) and challenges of existing organisational culture, particularly nurses’ reluctance to hold doctors and older colleagues to account. Many facility managers are seen either as being invisible in the facility (and thus not guiding and supervising their staff) or as spending too much time delivering services instead of fulfilling their management roles.

The complexities and possibilities of sub-district management 13
SAHR 2012/13 167
Box 4: Dealing with patient complaints: an example of lack of proactive management in facilities
Both the CoCT and MDHS have instituted patient complaints procedures, which require that complaints are dealt with immediately and by relevant facility managers. This system demands significant amounts of time from managers and clinicians and is seen by staff members as an added burden to their workload. Staff members also see complaints as unfair criticism coming from ungrateful patients and are thus not keen to engage with the system.
In a concrete example, the sub-district health promotion officer was at a clinic involved in a health promotion activity when she observed a confrontation between a nurse and a client in which the nurse was rude to the client. The health promotion officer intervened politely and took the nurse aside to calm her down. The nurse showed the same behaviour towards her colleague. The health promotion officer reported the behaviour to the clinic manager and to the sub-district managers. On investigation she found that the clinic’s complaints book contained a large number of similar complaints about the nurse. A sub-district manager subsequently intervened and confronted the facility manager about her lack of response to and engagement with her staff member’s behaviour, which should have been addressed in terms of the City’s disciplinary code.
In sub-district managers’ experience, this lack of proactive action by facility managers is common and requires frequent and often repeated time-consuming intervention in the micro management of facilities.
Dealing with staff discipline, which includes dealing with theft and abuse of government resources, is another key feature of routine sub-district managerial practice. Although they vary in degrees of severity and formality, disciplinary processes are time- and energy consuming. They require numerous meetings and often conflictual engagements with relevant staff. Sub-district managers are also, ultimately, held responsible for patient complaints that originate at facility level. As shown in Box 4 responding personally to patients or following up on other managers tasked with dealing with complaints is time consuming. Having the experience and confidence to navigate the complexity of HR procedures and personal relationships is vital for sub-district managers.
Managing multiple actors
The central task in navigating the structural complexity of sub-districts described earlier is engagement with the multiple actors that inhabit these structures. (See Figure 3.)
Sub-district managers not only routinely engage with their teams and the staff who report to them, as described above (“managing down”), but also “manage up”.20 They do this through their formal lines of reporting and accounting to district level and by informal reporting and accounting through frequent, ad hoc meetings with district managers and politicians (e.g. when the member of executive council (MEC) or mayoral health committee member visits the sub-district). Managing up also includes advocacy for local priorities and needs within district planning and management processes and for resources to meet service delivery imperatives brought down the system from higher levels. These imperatives can be annual service delivery targets or centrally led campaigns, such as the 2010 HCT campaign, or unforeseen health ‘events’, such as the 2010 measles outbreak in Cape Town.
In addition, sub-district managers also “manage out” through multiple engagements with structures and processes beyond the health sector. These include engaging and ensuring the functionality of clinic committees; participating in civil society structures such as the City’s Multi-sectoral Action Teams (MSATs); and participating in, receiving instructions from and accounting to Integrated Development Plan (IDP) processes and public consultations. Engagement also takes place with colleagues and structures from the parallel authority, through the ISDMT, and in programme areas where the authorities share responsibility (e.g. the HIV, AIDS, STI and TB (HAST) programme).
ISDMT
Sub-district management
team
Facilitymanagers
Facilitystaff
MSATs
Service users
Clinic committees
NPOs and CHWs
Sub-district Manager
District manager
Managers of integrated
programmes (e.g. HAST)
Political structurese.g. MEC, mayoral committee, sub-councils, ward
councillors Actors from other sectors e.g. school principals
Non-allopathic and private providers
Figure 3: The sub-district manager’s actor network

168 SAHR 2012/13
Managing meetings and planning processes
The final set of managerial routines in Mitchell’s Plain, as in other sub-districts, encompasses a range of formal and informal, regular and ad hoc meetings and planning processes.
Regular meetings in “one-on-ones” provide an important space for sub-district managers to engage in depth with their staff, to discuss progress and challenges and to guide and mentor. These meetings are complemented by ad hoc meetings and engagements as the need arises and quarterly supervision visits to all facilities. In this sub-district the CoCT sub-district manager and PHC coordinator meet monthly on a one-on-one basis with all facility managers and conduct monthly supervision visits to all PHC facilities. In the MDHS, the Deputy-Director: PHC also ensures that all PHC facilities are visited monthly. Both authorities use audit tools in their supervision visits, although these are different tools. Supervisors prepare written reports on the basis of the visits.
Within the MDHS, and following provincial frameworks, a performance appraisal system also exists in which each employee, including facility managers, establishes a set of personal performance targets for quarterly review with line managers. These performance targets may lead to development plans in response to poor performance or cash bonuses for excellent performance (shared among all facility staff). In the CoCT, however, performance appraisal procedures currently apply only to sub-district managers, heads of environmental health, programme managers and programme coordinators and do not apply to facility managers.
The sub-district managers also meet regularly and on a personal basis with the MDHS Chief Director and the Executive Director for Health, CoCT, respectively. Budgets are a standing item at these meetings, which provides the opportunity to discuss changes, needs and challenges.
Formal meetings are used to make collective decisions through negotiation, mediation, instruction and persuasion. Joint meetings at different levels allow coordination between authorities within the broad framework of the SLA. Within each line of authority, meetings at different system levels provide opportunities for managers higher up the system to communicate with lower-level managers, hold them accountable for the performance of their services and offer them support and mentorship. Lower-level managers can bring service delivery problems and needs to the attention of higher-level managers at these meetings. The strong emphasis on performance accountability is indicated by the naming of several meetings as “plan, do, review (PDR) meetings”. This name indicates that these meetings are used to review service performance indicators against target levels with the intention of identifying problems that undermine service delivery and of considering appropriate remedies.
These various sub-district meetings are part of wider health planning processes. District health plans and district health expenditure reviews are nationally agreed processes that are aligned with national planning frameworks that emanate from National Treasury and the Department of Health (such as the Medium Term Strategic Framework and the NDoH Strategic Plan). This means that, as in other provinces, the Western Cape’s Annual Performance Plan (APP) is nested within the provincial five-year strategic plan and provides the basis for quarterly performance reports to the NDoH against a combined set of nationally prescribed indicators (and any identified by the PDoH as provincially relevant and aligned with
national health system objectives and targets). The annual MDHS District Health Plan links with the provincial APP and identifies priorities and sets performance targets for MDHS services and facilities. Through the SLA targets and priorities are set for those provided jointly with the CoCT.
In Mitchell’s Plain an additional complexity exists, which is working within the planning cycles of two authorities – including the different financial years of local and provincial governments. In parallel to the provincial government, the CoCT develops its own business plan. This plan is informed by the Integrated Develpment Plan (IDP), developed across sectors and through consultation at local level, and establishes priorities and targets for CoCT services and facilities. Targets that apply to the Mitchell’s Plain sub-district are, therefore, cascaded down the health system through both lines of authority and, as noted, are regularly reviewed in the PDR meetings.
Health planning processes seek to provide forward direction through health system complexity, in pursuit of improved health system performance – focused on future population health needs rather than past service provision. However, as elsewhere in South Africa, in Mitchell’s Plain this forward movement faces two key challenges. First, the link between plans, targets and operational budgets is tenuous as historical budgeting remains the norm across the country (with only year-on-year incremental adjustments linked to inflation). Second, planning processes are implemented within the wider organisational culture of hierarchy and deference. Nationally, the implementation of the Public Finance Management Act (PFMA), for example, is widely understood to be about compliance with specific rules rather than value for money in performance.21 In Mitchell’s Plain, target setting and review in PDR meetings is also quite widely perceived as an instructional and compliance process.
Nonetheless, the annual planning process provides a framework that has brought predictability and standardisation to planning and management across the MDHS. It has also established a joint planning platform for coordination not only of MDHS/CoCT service provision but also between programmes and facilities. Given the very fragmented service provision of the past, this represents a new way of doing business and one that is necessarily and appropriately oriented towards the provision of comprehensive PHC services. The provincial Comprehensive Service Plan of 2010-2020 has helped the Mitchell’s Plain sub-district with the construction of a new district hospital to strengthen the service platform. This has filled a severe key service gap.
Doing business differently
With the planned and actual devolution of authority to sub-districts, South African sub-district management must take on, as central to its work, the functions of managing strategically, guiding innovations and providing direction, and proactively planning for and managing resources to address local needs. “Doing things differently”, problem solving to improve service delivery, making better use of existing resources and translating strategic priorities and direction into operational functioning are the tasks that take up the time of sub-district managers. Yet, as the Mitchell’s Plain experience illustrates, the existing organisational culture, combined with staff not taking ownership of new actions, underpins operational inefficiency, undermines the persistent action necessary to sustain service improvement and prevents the benefits of higher-

The complexities and possibilities of sub-district management 13
SAHR 2012/13 169
level planning filtering down into daily practice. Those at the bottom of every health system have discretionary power and through their daily practices act, mostly inadvertently, to subvert new directions.
The existing ways of working are a constant reminder that mind shifts and learning to do things differently take time and require capacity, confidence and trust. Sub-district managers solve crises while simultaneously building the capability and commitment of operational and facility managers so that they can reduce the need for crisis management and improve service delivery.
Against this background, the three conceptualised innovations of the DIALHS project outlined below all aimed to encourage managers to plan ahead, take ownership of their authority and build confidence, either within routine processes or through new initiatives. The innovations aimed at providing constructive accountability among health system actors. All of the innovations have engaged front line staff and all represent adaptations of existing operational routines that aim to change mind-sets and link to larger-scale planning processes. In this sense, they represent “small wins” – changes in routines that are small enough to be accepted and easily implemented, but that have a ripple effect in the system and generate longer-term and larger-scale benefits.22
Three of these innovations are outlined in more detail below. Each sought to:
➢ support trust building and relationship development among actors at the front line of the sub-district health system and encourage collaborative and pro-active problem solving to improve operational efficiency; and
➢ develop personal confidence, technical skills and relationships of constructive accountability that can sustain action to improve policy implementation and service delivery.
Whereas two of the innovation ‘cases’ represent changes in routine management practices, the third case is a new initiative, which was aimed at modelling new ways of thinking about planning and management within a stronger population orientation for sub-district healthcare delivery. Of the three, the re-organisation of the monthly PDR meeting as the Management and Communication (M&C) meeting most clearly fits the definition of a small win. However, the facility manager “key performance area (KPA) process” also built on existing planning and HR management processes and even the community profiling initiative built on a history of community/service engagements and drew in existing clinic committee structures.
All three initiatives reflect the critical role of sub-district managers and their teams in galvanising actors in the sub-district and building capacity to improve routines and relationships.

170 SAHR 2012/13
Box 5: Innovations arising out of the DIALHS project
Innovation 1: Developing pro-active management
In late 2010, the sub-district manager initiated a discussion about the monthly PDR meeting with those who routinely attend it. The core features of the re-organisation were then decided and implemented in 2011.
In re-naming and re-organising the meeting, the sub-district intended to encourage facility managers to take a more proactive approach to problem solving and forward planning to improve services and operational efficiency. A new name, the M&C meeting, signalled the desire to move away from a confrontational stance that held people accountable for service targets to a new approach that emphasised a supportive engagement, sharing of good practice, collaborative learning and accountability for improved efforts.
Beyond the name, the core changes were:
❖ a different seating arrangement to allow small-group discussion and dispersed authority;
❖ a new agenda structure focused on joint planning for new activities; progress reports on planned activities; sharing of best practices among facility managers; review of selected programmes and other concerns;
❖ a chairing style that facilitated discussion and debate and challenged participants to improve services for population benefit rather than adopting a more didactic and instructional communication style; and
❖ careful minute taking to allow tracking and reporting of action over time.
The sub-district manager initiated the meeting re-organisation because she wanted to tackle the lack of understanding and ownership of new activities among facility managers and the perception that targets were imposed on them rather than an opportunity for service improvement. Her underlying intentions were to develop the meetings as a space to: a) generate a shared understanding among facility managers about the issues discussed and build their commitment to implementing agreed action; and b) build the relationships among all sub-district staff that enable coordination of service improvement efforts (e.g. between facility managers and sub-district administrative staff or between facility managers and EH staff). She also hoped to provide a role model of a meeting style that facility managers would use in their own staff meetings.
Her assumptions were that opening up the meetings to discussion and with a more problem-solving focus would make them less threatening; support a two-way flow of ideas between sub-district and facility managers; contextualise new activities implemented in facilities for programme and administrative support staff; and generate a sense of shared accountability.
The work carried out in the meetings is backed up by the sub-district manager’s efforts to:
❖ manage down through: special task teams that comprise various sub-district staff planning, which are established to support new activities; monthly facility supervision visits by sub-district managers; and the allocation of environmental health practitioners (EHPs) to facilities;
❖ manage across through: engagement in the ISDMT, or personally with MDHS colleagues where joint strategy or shared support is needed;
❖ manage up through: engagement with MDHS/CoCT district managers to tackle challenges faced in implementation or by securing support (agreement, guidance, resources) for implementation.
Innovation 2: Developing local service-improvement priorities
For the first time, in late 2010 and for the 2010-11 financial year, CoCT facility managers and other staff were asked to develop eight KPAs within the overarching priority areas of the IDP and CoCT Business Plan. The process was then repeated, focused on four KPAs in 2011, for the 2011-12 financial year.
The aim of the new process was to encourage forward planning for service improvement and sustained effort in tackling priority service delivery challenges. This initiative aimed to achieve this by setting clear local objectives and outlining activities, intended outcomes and monitoring and evaluation (M&E) approaches.
For PHC facilities, the key aims of the process were to:
❖ allow managers to set priorities that reflected their clinics’ local needs, while taking account of the overarching strategic planning frameworks and priorities and of their own job descriptions;
❖ focus on tackling critical service delivery challenges, the bottlenecks in the system that prevent the sub-district from implementing agreed on and planned service improvements;
❖ encourage/require managers to identify priorities with their staff – so that the initiative becomes a local initiative from the staff; and
❖ prepare a written document in which the priorities are summarised.
KPA examples include: tackling staff shortages (linked to use of staff), absenteeism and poor record keeping (all of these are system challenges for any service-improvement effort).
The sub-district manager initially discussed the new approach in the regularly monthly PDR meeting (as it was then still called) in late 2010. She then provided one-on-one mentoring support to facility managers in the development of their KPAs. This support was focused on helping the managers to formulate objectives, think about evaluation and reflect on the implications of these objectives for their management activities. A workshop was then organised for all sub-district staff (facility managers, doctors and all other managers) to present their KPAs to others. Quarterly reviews on a one-on-one basis allowed KPA implementation to be monitored over 2011. At the end of the year managers gave feedback on the implementation of one KPA in the monthly M&C meeting and presented a written report in which they evaluated their progress in meeting all their KPAs. In 2011, the process was repeated but this time focused on only four KPAs and used regular meetings as opportunities for review and reporting.
The sub-district manager initiated the KPA process with the intention of addressing a lack of understanding about planning among facility managers and their lack of ownership of sub-district priorities and related activities.
Her assumptions were that the process would:
❖ develop priorities of relevance to local settings nested within the IDP/Business Plan priority areas and within the wider system processes;
❖ generate a sense of ownership of higher-level priorities and related activities among facility managers and develop local priorities that would support their implementation;
❖ develop managers’ own capacities to use data and information in identifying problems and setting priorities, monitoring achievements, analysing the underlying causes of problems, and preparing written documents; and
❖ encourage managers to engage their own staff in thinking about problems and activities for addressing them, selecting priorities, and using information.
Priorities and feedback on meeting them were discussed in meetings as it was assumed that this would support mutual learning and understanding, generate debate and discussion, and allow opportunities for sharing ideas about how to manage crises and plan ahead. In this way it was hoped to build managerial confidence in coping with crises.
Overall, the KPA process can be seen as a capacity development initiative. It was a form of continuing professional development in that it strengthened managerial capacity to plan ahead and act proactively, and encouraged persistent and sustained effort. It was complemented by the re-organised management and communication meeting.

The complexities and possibilities of sub-district management 13
SAHR 2012/13 171
Innovation 3: Generating local knowledge, priorities and action
In early 2011 the sub-district initiated an activity that aimed to strengthen three inter-related planning and management priorities in the sub-district. The first priority was “shifting the lens” of service providers from a patient orientation to a stronger population orientation in health system organisation and functioning, as advocated by provincial and national policy guidelines. The second priority was to move the sub-district’s thinking and vision beyond one-year planning cycles and the third priority was to strengthen relationships between service providers and community representatives. Provincial and district management had recently emphasised the need to address the health of populations rather than patients alone. Yet facility managers had repeatedly expressed uncertainty and frustration that they “did not know the communities they were serving”, did not know how to engage with other role players or access other health resources in communities, and were overwhelmed with the need to service short-term targets instead of being responsive to local priorities and needs.
To explore and practise alternative ways of collaborative planning and prioritising a team consisting of service partners from both city and provincial health authorities, NPOs, statutory clinic committees and civic organisations and community-level partners conceptualised and implemented a series of multi-stakeholder workshops. Nurses, NGO staff, representatives from local community structures such as health committees and police fora, environmental health practitioners (EHPs) and others from a geographically defined local area met in “local area groups” to discuss and map available health resources to needs and gaps. While the physical maps that emanated from these workshops provided useful information, the workshops were more important in that they brought health stakeholders in Mitchell’s Plain into conversation with each other. Discussions led to a number of quite practical and immediate actions, such as negotiations with the local taxi association about the possibility of changing a taxi route to improve access to one facility. The initiative particularly emphasised the importance of EHPs as crucial players in a population-based approach to health planning. And, lastly, at the end of 2011 the local area groups that had been formed were invited to the sub-district’s annual planning event to contribute their ideas and priorities to the development of the 2012 sub-district plan. Apart from small but tangible wins, the initiative succeeded in overcoming or at least lowering perceived barriers between different groups and bringing actors into conversation with each other, thus confirming the importance of building networks, drawing on informal knowledge of multiple actors, and creating fora for engagement outside of established structures.
Despite initial enthusiastic support, the initiative was difficult to sustain in 2012. Work has continued, although haphazardly, in two of the four local groups. Their experience may provide lessons on how to re-energise the process across the whole sub-district. The potential value of this type of innovation is, moreover, receiving attention across the country, with a range of initiatives beginning to demonstrate the potential benefits of these sorts of community-level engagements to the health system (e.g. Letsema Circle).
Table 1: Preliminary signs of innovation impacts
M&C meetings KPA process Community profiling•Positive performance gains in activities
discussed in meetings; e.g. isoniazid coverage improvement from 35% to 60%
•Engagement of health promotion officer in supporting facility managers in reproductive health service provision in schools
•Sub-district perception that some facility managers have taken more ownership of activities and used information to make decisions
•Facility managers told the sub-district manager they felt it was very useful and long overdue
•Sub-district manager feels that skills have been developed; e.g. in setting objectives; process has been accepted and priorities are increasingly being ‘owned’; improved understanding of how to manage systems and processes to improve outcomes
In 2011 there was: •Great enthusiasm expressed for the collaborative
work among all participants, who often spoke about the benefit of getting to know other health actors and learning more about health services or the communities served
•Several groups began to take local action and deal with specific local health issues
•Very importantly, the sub-district’s annual planning was informed by the initiative in terms of format and substance
Across innovations, some early signs of positive impact are summarised in Table 1. However, it is still too early to judge whether they will take root in daily practice and will generate operational efficiency and performance benefits. Contextual pressures played an important role in constraining all Mitchell’s Plain activities in 2012. Unforeseen leadership changes and the dual lines of accountability in Mitchell’s Plain have maintained an uncertainty in the wider sub-district context that acts as a barrier to finding and embedding new ways of doing things. In addition, changing routines and mind-sets takes time and more time is needed to nurture, reinforce and track the persistence of the changes discussed here and what their spin-off effects might be. Small wins are small because they do not immediately destabilise the existing situation – the challenge is to identify the leverage point for spreading effects more widely.
Conclusions: lessons for health system development
This case study offers insights into the routines, activities and relationships that represent the complexity of one South African urban sub-district health system. It paints a picture of multiple demands, competing priorities and resource constraints, targets and policy directives. It also points to the need to manage and coordinate numerous actors within and outside the system and to the existence of organisational cultures and legacies of deference and hierarchy, which undermine efforts towards decentralisation and innovation. It demonstrates the influence of organisational software over collective capacity and resilience. Managing in this environment is a multifaceted and multi-dimensional task and requires a constant shift in focus, lens and pace.
Although many management models exist, the work of Henry Mintzberg offers explanations and understandings of management that have clear resonance with the experiences presented here and with the wider South African health experience.7,24 Mintzberg’s four facts about managers clearly reflect the Mitchell’s Plain and South African experience. (See Box 6) Describing managing as being about “calculated chaos” and “controlled disorder”, Mintzberg notes that “the pressures of the managerial environment do not encourage the development of reflective planners … This job breeds adaptive information manipulators who prefer the live, concrete situation”. His model of managing encompasses the three roles of managing up, out and down discussed earlier in this chapter. It sees managing as always several steps back from the action – and involved in working through other people to get

172 SAHR 2012/13
things done by using information and by “coaching, motivating, building teams, strengthening culture and so forth.”23 The model, nonetheless, places managers at its heart and emphasises that the way managers frame their work and how they schedule activities sets the context for the others with whom they work.
Box 6: Facts about managers
❖ Managers work at an unrelenting pace; their activities are typically characterised by brevity, fragmentation, and discontinuity; and they are strongly oriented to action.
❖ Managers tend to favour informal communication media, especially telephone calls, meetings and email.
❖ Managing is as much about lateral relationships among colleagues and associates as it is about hierarchical relationships.
❖ The manager is neither conductor nor puppet: control to the extent possible tends to be covert more than overt, by establishing some obligations to which the manager must later attend and by turning other obligations to the manager’s advantage (effective managers are not those with the greatest degree of freedom but those who use whatever degrees of freedom they can find).
Source: Mintzberg, 2009.23
In this chapter we have discussed the complexity of health sub-districts and districts. We have demonstrated that managers at this level must be able, willing and confident to manage in “calculated chaos”. We have also presented some ideas about the practice of managing in this complexity – of leading change from within the health system. These experiences suggest that it is important to develop the DHS’s daily routines, its software, to nurture the relationships of constructive accountability that support persistent and adaptive problem solving aimed at enhanced service delivery and patient care.
They also suggest that leadership development programmes must, first, help managers “deal with the calculated chaos of managing – its art and craft…”23, by developing the managerial mind-sets – or competencies – of reflection, analysis, worldliness, collaboration and action. Second, such programmes must allow learning to be carried back into the organisation – by supporting teams of managers in driving organisational change. As Gilson and Daire proposed in 2011, leadership development programmes must, therefore, focus on generating values-based leaders that are able to manage complexity; be provided beyond the classroom and in the workplace; and be sustained through continuous learning.8
They must also work towards changing the system within which people work, even as they develop people as leaders.
Strengthening the South African health system is, in essence, about generating an internal capacity to learn and adapt over time, about building its resilience and responsiveness to meet changing population health needs – for which management and leadership development is a central requirement.
Acknowledgements
We acknowledge the managers, health workers and community representatives who have worked with us over the past three years, allowing us access to and insight into their work and commitment to improve the health of communities in Mitchell’s Plain. We acknowledge our colleagues and fellow travellers on the DIALHS research team, who have contributed in various and important ways to this project. The DIALHS project has been learning and research in action for us all indeed.
We acknowledge the two district managers of the Cape Town metropolitan health districts, who made this project possible and who have engaged us critically and constructively.
And lastly, we thank two colleagues, Andrew Robinson and Cheryl Nelson, who commented and gave input into an earlier draft of this chapter.

The complexities and possibilities of sub-district management 13
SAHR 2012/13 173
References
1 Gilson L, Morar R, Pillay Y, et al. Decentralization and health system change in South Africa: National Report, Johannesburg: Health Policy Coordinating Unit. 1996
2 Haynes R, Hall W. District health systems and local government developments. In Ijumba P, Ntuli A, Barron P, editos. South African Health Review 2002. Durban: Health Systems Trust; 2002.
3 Local Government and Health Consortium. Decentralising health services in South Africa: Constraints and opportunities – a cross-cutting report. Durban: Health Systems Trust; 2004.
4 Schaay N, Sanders D, Kruger V. Overview of health sector reforms in South Africa. London: Department for International Development. Human Development Resource Centre; 2011.
5 Pillay Y, Barron P. The implementation of PHC re-engineering in South Africa [Internet]. Public Health Association of South Africa. 2011. URL: http://www.phasa.org.za/articles/the-implementation-of-phc-re-engineering-in-south-africa.html
6 Minister of Health. National health insurance in South Africa policy paper. Pretoria: Government Gazette No. 34524; 2011.
7 Masilela T, Molefakgotla P, Visser R. Voices of district managers. In Ntuli A, editor. South African Health Review 2001. Durban: Health Systems Trust; 2001
8 Gilson L, Daire J. Leadership and governance within the South African health system. In Padarath A, English R, editors. South African Health Review 2011. Durban: Health Systems Trust; 2011.
9 Naledi T, Barron P, Schneider H. Primary Health Care in SA since 1994 and implications of the new vision for PHC Re-engineering. In Padarath A, English R, editors. South African Health Review 2011. Durban: Health Systems Trust; 2011.
10 Morgan P. The concept of capacity: Draft version. Maastricht, The Netherlands: European Centre for Development Policy Management; 2006.
11 Aragón, AO (2010). A case for surfacing theories of change for purposeful organisational capacity development, IDS Bulletin 41(3):36-46.
12 Balabanova D, McKee M, Mills A. “Good health at low cost” 25 years on: What makes a successful health system? London, UK: London School of Hygiene and Tropical Medicine; 2011.
13 Franco LM, Bennett S, Kanfer R. Health sector reform and public sector health worker motivation: A conceptual framework. Soc Sci Med. 2002;54(8):1255-66.
14 Ssengooba F, Rahman SA, Hongoro C, Rutebemberwa E, Mustafa A, Kielmann T, et al. Health sector reforms and human resources for health in Uganda and Bangladesh: Mechanisms of effect. Human Resources for Health. 2007;5:3.
15 Adams T, de Savigny D. Systems thinking for strengthening health systems in LMICs: Need for a paradigm shift. Health Policy and Planning. 2012;27(4):iv1-3.
16 Swanson RC, Cattaneo A, Bradley E, Chunharas S, Atun R, Abbas KM, et al. Rethinking health systems strengthening: Key systems thinking tools and strategies for transformational change. Health Policy and Planning. 2012;27(4):iv54-iv61.
17 Barrett, SM. Implementation studies: Time for a revival? Personal reflections on 20 years of implementation studies. Public Administration. 2004;82(2):249-62.
18 Day C, Barron P, Massyn, N, Padarath A, English R. editors. District Health Barometer 2010/11. Durban: Health Systems Trust; 2012.
19 Metro District Health System (MDHS), Western Cape MDHS District Health Expenditure Review 2011/12. Unpublished report. Cape Town; Western Cape Department of Health; 2011.
20 Von Holdt K. Nationalism, bureaucracy and the developmental state: The South African case. South African Review of Sociology. 2010;41:4-27.
21 Moore MH. Creating public value. Bridgewater, NJ: Replica Books; 1997.
22 Penn-Kekana L, Blaauw D, Schneider H. “It makes me want to run away to Saudi Arabia”: Management and implementation challenges for public financing reforms from a maternity ward perspective. Health policy and planning. 2004;19(1):i71-7.
23 Weick KE. Small wins: Redefining the scale of social problems. American Psychologist. 1984;39(1):40-9.
24 Mintzberg H. Managing. San Francisco, CA: Berrett-Koehler Publishers; 2009.
25 Gilson L, Doherty J. South African managers speak out. Lessons for Innovative Health Management. Proceedings of Celebrating Innovative Health Management Conference; Cape Town, South Africa. 20-30 June 2011.

174 SAHR 2012/13

SAHR 2012/13 175
Med
icin
es,
Vaccin
es a
nd
Tech
no
logy

SAHR 2012/13176
Med
icin
es,
Vaccin
es a
nd
Tech
no
logy

Authors:
177SAHR 2012/13
14141414141414
Bada Pharasii
Jacqui Miotii
i Systems for Improved Access to Pharmaceuticals and Services (SIAPS), Management Sciences for Health, South Africa
ii Department of Pharmacy and Pharmacology, Faculty of Health Sciences, University of the Witwatersrand, Johannesburg
Medicines Selection and Procurement in South Africa
The main objective of South Africa’s National Drug Policy (NDP), adopted in 1996, was to support equitable access to medicines by addressing a full range of components: legislation, selection, pricing, procurement and
supply, human resources and traditional medicines as well as cooperation with regional and international organisations. The objective of this chapter is to review the medicines selection and procurement components of the NDP. Medicines selection in both the public and private sectors in South Africa has undergone significant transformation in the past 16 years. The implementation of the national Essential Medicines List and supporting structures in the form of provincial and facility-based Pharmacy and Therapeutics Committees has introduced levels of rigour in assessment of medicine selection but still needs improvement.
The procurement of medicines is also in the process of reform, with proposals for establishing a centralised procurement unit, referred to as the “Central Procurement Agency”. The relocation of medicines tender processes from the National Treasury to the National Department of Health appears to have had some impact in reducing the cost of medicines and improving access and availability. The potential role of state-owned manufacturing of pharmaceuticals is also discussed.
Medicines selection in both the public and
private sectors in South Africa has
undergone significant transformation in
the past 16 years.

178 SAHR 2012/13
National Development Objectives
❖ Ensure availability and accessibility of essential medicines to all citizens.
❖ Ensure the safety, efficacy and quality of medicines.
❖ Ensure good dispensing and prescribing practices.
❖ Promote the rational use of medicines by prescribers, dispensers and patients through provision of the necessary training, education and information.
❖ Promote the concept of individual responsibility for health, preventive care and informed decision making.
Health Objectives
Economic Objectives
❖ Improve the knowledge, efficiency and management skills of pharmaceutical personnel.
❖ Reorientate medical, paramedical and pharmaceutical education towards the principles underlying the NDP.
❖ Support the development of the local pharmaceutical industry and the local production of essential medicines.
❖ Promote the acquisition, documentation and sharing of knowledge and experience through the establishment of advisory groups in rational medicine use, pharmacoeconomics and other areas of the pharmaceutical sector.
❖ Lower the cost of medicines in both the private and public sectors.
❖ Promote the cost-effective and rational use of medicines.
❖ Establish a complementary partnership between government bodies and private providers in the pharmaceutical sector.
❖ Optimise the use of scarce resources through cooperation with international and regional agencies.
Introduction
It has been 16 years since South Africa’s National Drug Policy (NDP) was officially announced and adopted.1 The NDP sought to reform the health sector in a way that would bring about an improvement in medicines access and use in both the public and private health sectors. Figure 1 shows the three main objectives of the NDP, each with its specific set of sub-objectives.
The World Health Organization (WHO) identifies two key prerequisites for the successful implementation of an NDP.2 The first is to have a system for monitoring and evaluation. This is a constructive management tool that enables a continuous assessment of progress and helps in the decision making. The second is that the NDP should be periodically evaluated. Such evaluations should form an integral part of the pharmaceutical master plan (a prioritised implementation plan for the policy), with the necessary resources allocated from the start. Independent consultants or professionals from other countries or from the WHO may be invited to complement a national evaluation team.
Although the original policy document committed to conducting regular evaluations of the NDP, no official, comprehensive review of the South African NDP and its impact has been conducted since its adoption in 1996. However, some assessments have been carried out. Provincial surveys on the NDP were conducted by the National Department of Health (NDoH) between 1996 and 1998 in seven of South Africa’s (SA’s) nine provinces.3 These surveys were conducted to establish baselines for future monitoring of progress in terms of the implementation of selected aspects of the NDP. While medicines availability was found to be just over 85% both in the hospitals and primary health care (PHC) clinics in the provinces surveyed, awareness of the NDP was found to be quite
Figure 1: Objectives of the NDP
Source: National Department of Health, 1996.1
low (below 40% on average). Follow-up surveys were carried out in all the nine provinces and six metros of SA in 2003, with the aim of determining the impact of the NDP at PHC level.4 The availability of medicines was again found to be high (on average, 82% of a basket of key medicines). However, significant challenges were noted in terms of stock control (for instance, 50% of stock records were inaccurate) and rational medicines use (in 7% of facilities, 50% or fewer patients knew how to take their medicines). A marked increase in the proportion of patients prescribed an antibiotic was noted, up from an average of 25% in the 1996 to 1998 baseline surveys to 47% in 2003. However, some progress was noted in the percentage of patients that received an injection (down from 11% to 5%).
In 2005, the Human Sciences Research Council (HSRC) sought to evaluate the impact of the NDP on the availability of medicines in the public and private sectors of two provinces (Limpopo and Western Cape). The HSRC concluded that some notable progress had been achieved. However, considerable input, in terms of im-proved infrastructure and training of healthcare workers, would be required to improve procurement and distribution practices.5
All the public sector hospitals visited had a copy of the national Standard Treatment Guidelines (STGs), and this resource was also found in 77% of private general practitioners’ practices and 43% of private pharmacies, even though it was not officially applicable in such settings. This survey again found high levels of antibiotic prescribing in all settings.
Perhaps the most comprehensive assessments of progress in the public sector’s pharmaceutical services are the 2005/6 series of audits requested by the NDoH and conducted by Rational

Medicines Selection and Procurement in South Africa 14
SAHR 2012/13 179
Pharmaceutical Management Plus (RPM Plus), a USAID-funded programme managed by Management Sciences for Health (MSH).6 The purpose of the audits was to assess and measure the extent to which pharmaceutical services in the public sector complied with the Medicines and Related Substances Act (Act 101 of 1965) and the Pharmacy Act (Act 53 of 1974), to recommend ways of attaining such compliance, and to estimate what it would cost to bring public sector facilities to the required levels of compliance. However, the results of these audits have never been placed in the public domain, thereby making them inaccessible to other researchers or policy makers outside of the Department of Health.
Since 1997, chapters in various editions of the South African Health Review have been devoted to aspects of pharmaceutical services and to the implementation of the NDP, such as medicines pricing in the private sector and policy and legislation.7-11 Most recently, in the 2007 edition, Taylor discussed the rationing of medicines and healthcare technology and reviewed the impact of various legislative reforms, such as the dispensing fee and the single exit price (SEP), on the cost and utilisation of technologies.12 A review of health legislation and policy in 2010/11 describes the effect of various measures, which include the SEP and the logistics fee, aimed at regulating medicine prices in the private sector.13
Undoubtedly, much has happened in the country’s healthcare system and there is a need for a comprehensive review of the NDP. The decision to embark on a national health insurance (NHI) system has to be the most compelling reason for such a review to be undertaken.
The focus of this chapter is on the medicines selection and procurement aspects of the NDP. Medicines selection is discussed in the context of reforms that would be necessary as the country gradually moves towards NHI. The chapter also assesses recent developments in medicines procurement in the public sector, notably the impact of reforms in the tender system. Finally, the chapter discusses the merits of a state role in the manufacturing of active pharmaceutical ingredients (APIs) as an option for reducing medicines expenditure.
Medicines selection
Medicines selection is a key factor in the successful implementation of access to equitable health care.14 Medicines selection should be based on the principles of health technology assessment (HTA) and include assessment of the evidence-base for the medicine choice and pharmacoeconomic evaluations. Decisions around the selection of a medicine for inclusion on a formulary or medicines list should also take into account issues such as access and implementation. The funding of medicines is subject to further conditions such as budget impact (to the funder) and affordability (by the patient). In the private healthcare sector in SA, the funding of medicines is subject to complex medical scheme rules and policies regarding the type of health plan and the benefits that a member has selected. This is discussed in more detail below.
Medicines selection in the private sector
Medicine formularies and guidelines
Generally, clinical decisions regarding the selection of medicines for formularies are made within each medical scheme, as implemented by medical scheme administrators. The level and breadth of expertise utilised in the selection process can range from a single medical advisor to teams of evaluators made up of pharmacists, nurses, medical practitioners and other experts in public health or health economics.
The selection of medicines for private sector formularies is dependent on the type or class of medicine. For high-volume, low-cost medicines such as statins or angiotensin-converting-enzyme (ACE) inhibitors the selection is generally based on price. However, where high-cost medicines are considered for selection, these are subject to a more thorough evaluation, which includes clinical efficacy and effectiveness, cost-effectiveness and budget impact.
Selection of medicines under prescribed minimum benefits
Prescribed minimum benefits (PMBs) are defined to ensure a minimum benefit for all beneficiaries and are considered to be comprehensive and thorough. They cover nearly 270 conditions: for each condition, the minimum service level is comparable to that provided in the public sector. Medical schemes are allowed to manage their benefits and control costs with measures such as:
➢ designating service providers for PMB services;
➢ employing a formulary and associated management tools such as a pre-authorisation (i.e. patients must fulfil certain requirements as laid down by the medical scheme prior to authorisation for funding being issued) and protocols;
➢ establishing risk-sharing arrangements with different types of providers; and
➢ contracting with specified hospitals or hospital groups to provide services.
The Regulations to the Medical Schemes Act (Act 131 of 1998) also specify that schemes must pay for the diagnosis, medical management and medications of a specified list of common chronic conditions, estimated to cover about 75% of the chronic conditions seen in primary practice. The initial 25 chronic disease list (CDL) conditions, as drawn up in 2003, included, among others, asthma, cardiac failure, chronic obstructive pulmonary disease, diabetes, epilepsy, hyperlipidaemia, hypertension, Parkinson disease, schizophrenia and rheumatoid arthritis. The medical treatment options for each CDL condition were laid out in therapeutic algorithms, which were developed by the Council for Medical Schemes in 2003. The list was subsequently increased to 27 conditions, with the addition of the requirement that medical schemes provide at least the antiretroviral (ARV) treatment provided in the state (after 2004), and with the addition of the Bipolar Mood Disorders (BMD) Therapeutic Algorithm in 2009. However, the remainder of the algorithms have not been updated since they were published in 2003. The list of these medicines, in effect, constitutes a PMB formulary of medicines that must be funded for all patients, regardless of whether they have a Medical Savings Account or remaining funds in their plan type.
180 SAHR 2012/13
A review of the medicines listed in the CDLs in 2009 showed that all but three of the CDLs had generic alternatives to the medicines listed at the time of the study.15 The PMB formulary, however, does not necessarily specify particular medicines and may only prescribe a class of medicines (e.g. ACE inhibitors). Each medical scheme is allowed to use a selection process to create its own PMB formulary on the basis of principles of evidence-based medicine, cost- effectiveness and affordability. Often this is subject to negotiation with the pharmaceutical manufacturers on the price of the proposed medicine. In this way, substantial SEP reductions can be achieved for selected medicines for the whole of the private sector market.
However, certain medical schemes believe that being compelled to pay in full for the treatment of PMBs could negatively affect their sustainability. The Board of Healthcare Funders, to which most of the country’s medical schemes are affiliated, lost a court case in November 2011 against the Council for Medical Schemes, in which it attempted to get the court to place a limit on how much the schemes should pay for PMBs. The Minister of Health is reportedly in discussions with the Competition Commission over suitable mechanisms for addressing the issue of setting tariffs in the private healthcare sector.
Medicines selection in the public sector
The WHO advocates that procurement should take place against a list of essential medicines. The selection of medicines that are available for procurement in the public healthcare sector in SA takes place through the National Essential Medicines List Committee (NEMLC) and provincial and facility-based Pharmacy and Therapeutics Committees (PTCs).
In an unpublished analysis of provincial expenditure conducted by a Ministerial Task Team on Procurement in 2009, the following challenges were identified:
➢ high use of single-source medicines and medicines for which there were no generic equivalents;
➢ apparent lack of adherence to the nationally determined STGs;
➢ high levels of buyouts, outside of the nationally determined tenders;
➢ high usage of expensive medicines, particularly in oncology; and
➢ inappropriate usage of medicines that were not cost effective and were not listed on the national Essential Medicines List (EML).16
Standard Treatment Guidelines and Essential Medicines Lists
Currently the initial selection of medicines for the public sector is determined by the ministerially appointed NEMLC,a as advised by its Expert Review Committees. These review committees are made up of a mix of experts with clinical, process and methodological knowledge. Each expert takes responsibility for a set of STGs and the accompanying EMLs. These are the Primary Care STG/EML, the Hospital Level (Adult) STG/EML, the Hospital Level (Paediatric) STG/
a In South Africa the term “drug” was initially used when referring to the “Essential Drug Lists”. The WHO advises that the term “medicines” be used instead and, accordingly, the South African usage has changed.
EML, and the newly released Tertiary and Quaternary Care EML. The Tertiary and Quaternary Care EML is intended to be a dynamic document, which will be continually updated and issued only in electronic format. The first edition, published on 2 November 2012, is a list of medicines that are recommended, or, in some cases, that are not recommended, for use at tertiary provincial or quaternary (academic) hospitals.17 Each medicine was reviewed by the relevant committee in relation to specific clinical indications and settings. For example, a medicine (e.g. botulin toxin) may be recommended for focal dystonias, but not for spasticity. Where a medicine was explicitly stated as not recommended, this was because the committee had deemed it lacking in terms of availability of robust, high quality evidence regarding its efficacy and effectiveness or had identified a potential to cause undue harm.
While some experts serve on more than one committee, the Expert Review Committees generally act independently of each other. The decisions of the NEMLC, for the most part, guide procurement of medicines in the public sector and form the basis for initiating medicines tender processes. In relation to programmes funded through conditional grants (notably the ARV programme), these decisions are binding at provincial level.
The provincial PTCs also have a degree of autonomy, as their provincial Member of the Executive Council (MEC) or Head of Department enables them to make selections of medicines funded from provincial budgets. While the provincial PTCs may provide input into the NEMLC and take advice from that structure, no formal central advisory body exists that applies evidence-informed and health economic principles to making recommendations. Decision making regarding the selection of health products may, therefore, vary from province to province, which results in inequitable access to medicines and other health-related products. Enabling closer coordination between provincial PTCs and formalising the decision-making process are likely to be key challenges faced in the proposed NHI.
The challenge is especially acute in relation to high-cost items such as the new biologics and oncology medicines. Currently, selection decisions about high-cost medicines and technologies are not consistent and more often than not appear to be based on the persuasive powers of the specialists that request the product. Clinical evaluation is carried out, but formal investigation into the cost effectiveness of the product rarely occurs. In addition, no follow-up process exists that measures the outcomes (both clinical and cost) of selecting such products. Indeed, in most instances of medicine selection, measurement of costs and outcomes is lacking.
Nonetheless, a measure of success has been achieved with the application of pharmacoeconomic analysis in some selection processes. An example is the selection of capecitabine for the treatment of metastatic colorectal cancer, which led to the treatment being approved by the NEMLC in 2012.18
Role of the Pharmacy and Therapeutics Committees
While each of the provinces is expected to have a fully functional provincial PTC and local committees at each hospital, progress in this regard has been patchy. In the last quarter of 2011, the Gauteng Provincial PTC was re-instated with a range of sub-committees (Safety and Quality; Rational Medicines Utilisation;

Medicines Selection and Procurement in South Africa 14
SAHR 2012/13 181
Formulary; and Procurement Advisory). These sub-committees made significant progress in achieving their goals for 2012. The Western Cape and KwaZulu-Natal have been identified as more successful than the other provinces in selecting medicines. All of the PTCs that exist have faced considerable challenges in terms of their broader mandate, in particular in relation to pharmacovigilance and the promotion of rational medicines use.
As indicated, provincial medicines selection processes should be guided by the national STG/EMLs. However, cases may occur where a province requires access to specific medicines that are not on the national EML. This has especially been the case in those provinces with academic hospitals and specialist units, such as renal or cardiac transplant facilities. This process will be considerably aided by the publication of the Tertiary and Quaternary Care EML.
Provincial selection decisions may also result from upward motivation from the district and hospital PTCs. If a medicine that is required is not on the EML or the provincial formulary, it may be motivated for by a clinician, with the necessary supporting evidence. An alternative, which is also best managed by the provincial PTC, is to allow for access on a named-patient basis.
A 2011 qualitative study by the School of Public Health at the University of the Witwatersrand on the use of HTA in the selection and procurement of medicines showed that while the development, procurement and use of health technology falls within each province’s jurisdiction, not every province has a formalised health technology policy.19 Those provinces that lacked HTA guidelines and policies believed this resulted in faulty procurement, which may lead to medicines service delivery problems.
Medicines selection under National Health Insurance
Centralised health technology assessment body
The availability of robust, locally applicable HTA will greatly assist in informing medicines selection processes both in the public and private sectors.
It has been widely recognised that a centralised process for HTA (that assesses clinical efficacy and effectiveness, health economics and budget impact) is required to address the shortage of skilled resources in the areas of clinical evaluations and health economics assessment. A centralised HTA process will also create a united viewpoint to guide healthcare policy and coverage decisions.
Institutions such as the National Institute for Health and Clinical Excellence (NICE) in the United Kingdom, the Canadian Agency for Drugs and Technology in Health (CADTH) in Canada and the Pharmaceutical Benefits Advisory Committee (PBAC) in Australia have become recognised as opinion leaders in the field of HTA. These institutions guide clinical decision making around the world.
As SA moves towards an NHI system, it is envisaged that a similar centralised process for HTA will be required. The Human Resources for Health SA strategy paper indicates that an “NDoH National Coordinating Centre for Clinical Excellence in Health and Health Care will be established”.20 The operations of the Centre will be located in various sites, which will include academic sites of excellence, the Medical Research Council, and the NDoH.
However, a central office will provide a coordinating function and bring together associations, professional groups, provincial departments of health and the academic community to define and oversee clinical quality professional health care.
The establishment of such an institution requires vision, drive and resources. The need for training and skilling resources in evidence-informed medicine and pharmacoeconomics is increasingly recognised. Steps towards addressing this shortcoming have been taken by various academic institutions. The Health Economics Unit at the University of Cape Town, for example, offers a certificate diploma and master’s degree in health economics, while a master’s degree in pharmacoeconomics was introduced by the University of KwaZulu-Natal in 2011. Related topics are also covered within certain post-graduate courses at other universities, such as the master’s degrees in clinical epidemiology at the universities of Pretoria and Stellenbosch. In addition, basic training in evidence-based medicine and pharmacoeconomics is offered by various organisations and associations such as the Pharmaceutical Care Management Association of SA. Considerable involvement of all stakeholders and the political will to drive a process of co-ordinating a centralised HTA function are required for successful implementation and integration of these initiatives.
Medicines procurement – a shift towards centralisation
Medicines procurement in the public sector has been conducted under the auspices of the Coordinating Committee for the Provisioning of Medical Supplies (COMED) since 1988. However, while this structure has been hosted within the Department of Health, and has coordinated the efforts of the provinces and other participating departments (Correctional Services and Defence), the National Treasury has been responsible for awarding all contracts. Following reports of deterioration in medicines availability across the country, a Ministerial Task Team was established in 2009 to assess the state of medicines procurement in the public sector and make recommendations for procurement reforms. The Task Team favoured the strengthening of a more centralised role in the procurement of medicines, which included the establishment of a Central Procurement Agency (CPA). It was envisaged that the CPA might eventually migrate out of the NDoH and become an independent public entity responsible directly to the Minister of Health. Subsequent to this, support for the establishment of the CPA was secured in SA’s Round 10 grant from the Global Fund to Fight AIDS, Tuberculosis and Malaria (GFATM) in 2010. The establishment of the CPA was approved by the National Health Council in 2011, with the Directorate Affordable Medicines (DAM) effectively becoming its core structure. A number of critical posts were filled, supported by funding from the Global Fund, which enabled the DAM to strengthen its infrastructure and resources so that it could start the management of pharmaceutical tenders independently of the National Treasury.
The ability and capacity of the NDoH to prepare, advertise, adjudicate, award and manage the relatively large national medicines tenders on its own was put to the test with the decision to take over management of tenders for three critical priority programmes (anti-tuberculosis, anti-infective and family planning medicines) in 2011. Technical assistance with the preparation of the

182 SAHR 2012/13
tender process was provided by partners such as the USAID-funded Strengthening Pharmaceutical Systems (SPS) programme managed by the MSH, in close collaboration with the Clinton HIV/AIDS Initiative (CHAI, now known as the Clinton Health Access Initiative).
It may be too early to judge the impact of the NDoH’s taking over the management of medicines tenders from the National Treasury. There does appear to be concensus within the DAM and the provinces, though, that the NDoH is gradually achieving the required efficiencies in the tender process.
Being responsible for the management of its own tenders has given the NDoH the opportunity to take a broader view of the various functions in the supply chain and bring about linkages that should optimise scarce resources in the long run. Market intelligence is now applied for the first time in the tender process, with price adjustment applications being evaluated critically on the basis of global trends in API price increases and formulation costs. The option to conduct price negotiations with preferred bidders has been built into the special conditions of tender and price negotiations have resulted in additional savings on a number of contracts.
The NDoH has claimed significant savings in several tenders since it took over, compared to the previous tenders, as illustrated in Table 1 below. The savings have been calculated on the difference in the estimated cost implications, based on the quantities tendered for, between new and previous contract prices, for items that were awarded on both contracts.
These figures represent between 1% and 50% of the value of the same volume of items and a total saving of 27%. As the contracts were re-constituted (e.g. all antibiotics were grouped together, new specifications were drafted and items were removed), percentage savings on the total cost of the tenders cannot be meaningfully represented at this stage.
The re-organisation of the tender system at the central level has raised confidence levels in the DAM and led to expectations of considerable efficiency gains in the foreseeable future. This has to be attributed to the fact that the NDoH is in charge of the processes and is able to take responsibility for its actions and control the outcomes. Turn-around time of the tenders has been shortened from about nine months to as little as four months. The management of risk has also been brought closer to the department affected by the risk.
Table 1: Savings achieved on current tenders compared to previous year
Tender number Description Nominal savings on previous tenders
HP01-2011TB Tuberculosis Agents R68 million
HP02-2011AI Anti-infective Agents R170 million
HP04-2012ONC Oncology and Immunological Agents R70 million
HP06-2012VP Small Volume Parenteral and Insulin Devices R69 million
HP07-2012DAI Drops, Aerosols, Inhalers and Inhalants R3 million
HP08-2012SSD Semi-solid Dosage Forms R4.5 million
HP09-2012SD Solid Dosage Forms (tablets) R105 million
Source: Zeeman, 2012.21
Medicines availability in the provinces
The delivery of healthcare services is a provincial competence. Thus the imposition of any reform that includes central control of the pharmaceutical budget and of the medicines distribution chain is bound to be met with resistance. This is expected even though the majority of provinces are struggling to provide a high quality pharmaceutical service.
Yet, indications exist that the DAM has managed to secure the cooperation of provinces in implementing measures intended to improve medicines supply chain management and processes. One such example is employment of the so-called “ARV monitors”. In December 2009, following a request from the South African Government to the United States Government, the latter agreed to meet a portion of the two-year funding gap for ARVs by providing US$ 120 million over a period of two years. This support was contingent on a number of conditions. One of these was that measures be put in place to build capacity within the national and provincial departments of health to strengthen logistics and forecasting systems. In response to USAID’s request for USAID partners to support this initiative, the MSH-managed SPS programme placed technical advisors with appropriate pharmaceutical and logistics skills – and officially designated “ARV Monitors” in each of the provincial pharmaceutical depots and another at the NDoH. The agreement was that the posts would be supported for a period of 18 to 24 months by MSH. After this time the NDoH and the provinces would have the option of absorbing the posts into their staff establishments.
The ARV monitors reported on the availability of ARVs and tuberculosis medicines, vaccines, anti-malarial and tracer medicines at depots to the provincial authorities. Through the provincial authorities the monitors also reported to the NDoH. This monitoring process enabled the compilation of a national database on stock availability, supply challenges and usage patterns. Furthermore, the monitors were involved to a varying extent, depending on each province’s situation, in monitoring facilities and assisted with appropriate supplies to facilities in cooperation with provincial staff. Stock-outs of ARVs in the provincial depots reportedly decreased from 12% countrywide when monitoring first started to 2.4% at the end of the two-year intervention. Forecasted requirements for the remaining year of the contract period have been much more accurately determined and communicated to suppliers.

Medicines Selection and Procurement in South Africa 14
SAHR 2012/13 183
The ARV monitors, through their liaison with all the relevant stakeholders in the chain, have provided a valuable link between selection, procurement, distribution, clinical options and use. Their posts have been retained, with the majority of the incumbents being re-appointed with funds allocated by the Global Fund. This resource has the potential to achieve improved outcomes in all areas of medicines use and has to be seen as key to resolving forecasting problems for all classes of medicines in the pharmaceutical supply chain.
The litmus test of the efficacy of any public sector’s pharmaceutical supply system is the availability of medicines in PHC facilities. Sadly, the reality is that stock-outs at this level are still widely reported. Monitoring of availability at primary care facilities remains a challenge that needs to be addressed at district and provincial levels. A key attribute of the ARV monitor arrangement was that monitors were sufficiently funded to allow them to travel regularly between the depot and the facilities, which included the PHC facilities. This is in stark contrast to the situation of the district pharmacists in many of the provinces, who are often restricted to providing only remote support from their offices owing to budgetary restrictions on their mobility. The sustainability of the impact of the presence of ARV monitors in the districts will hinge largely on their continued ability to pay regular physical visits to the facilities. In addition, their focused activities set the ARV monitors apart from the district pharmacists. Furthermore, with the piloting of PHC re-engineering and the deployment of district-based clinical specialist teams in selected districts the role pharmaceutical services will play remains largely undefined. The current experience of the monitors may inform the future role of pharmaceutical personnel in the NHI districts.
The role of the state in pharmaceutical manufacturing
The production of APIs in the country has been keenly debated by the Department of Trade and Industry (dti) over many years. In 2008, the dti commissioned an investigation into the local production of APIs for ARVs.22 This was followed by a feasibility study into API production in the country, in which the dti collaborated with the NDoH and the Department of Science and Technology.b
According to the dti, the South African pharmaceutical industry is a key contributor to the country’s Gross Domestic Product (GDP). In 2008/09 it spent R11.95 billion, which included R4.40 billion on salaries and wages, R1.35 billion on capital investment and R1.75 billion on research and development (which incorporated clinical research). The industry paid taxes of R2.35 billion. This consisted of R1.60 billion in income tax and R740 million in value added tax. The sector’s spending on corporate social investment (CSI) was R640 million, with Roche’s support of the PheloPhepa Train an example of such spending.23
At the same time, though, the dti cautions that the country’s pharmaceutical manufacturing base has been eroded; 37 plants reportedly closed down between 1995 and 2010 and resulted in the loss of 6 500 jobs.23 This is perhaps indicative of global trends towards the concentration of pharmaceutical manufacturing in a limited number of settings. In addition, the medical products
b Personal Communication: A. Kudlinski, Department of Trade and Industry. September 6, 2011.
sector (pharmaceuticals, medical diagnostics and medical devices) has become the fifth largest contributor to South Africa’s imports burden. Imports of pharmaceuticals (excluding APIs) grew from R6.20 billion in 2002 to R15.96 billion in 2011. Pharmaceuticals in finished-dosage form account for 80% of the sector’s total imports, growing at 12.5% p.a. over the past four years, from R7.30 billion in 2006 to R11.6 billion in 2010. On the API side, SA imports 95% of its API requirements, which includes all APIs for ARVs and antibiotics. Some have argued that this is an untenable situation, as SA has the world’s largest HIV and AIDS burden and is accordingly the world’s largest consumer of ARVs, yet continues to rely wholly on imports of ARVs for the support of its treatment programme.
The Walwyn Report of 2008 noted, however, that local production of APIs for ARVs would face stiff competition from Chinese and Indian manufacturers and that a local production facility would only survive if it received government support. It recommended the establishment of a public-private partnership (PPP) with a local manufacturer. It reasoned that such a PPP would be able to compete over the medium term, if the government provided support in terms of the required capital and the private sector partner transferred state-of-the-art process technology and manufacturing expertise.
A further feasibility study on the same subject was presented to Cabinet in 2010 and was, by all accounts, approved for implementation. A media statement issued in February 2012 announced the establishment of such a joint PPP venture, which involved the South African Government.24
The potential success of this venture may be judged by carefully considering the Brazilian experience. The Government of Brazil, as one of the Latin American countries most affected by the HIV epidemic, pursued an aggressive HIV and AIDS strategy from the early 1990s. This included a mandatory ARV therapy programme through the public health system and the active promotion of the development of the Brazilian pharmaceutical industry, with state-owned laboratories part of this initiative. The provisions of the TRIPS Agreementc were applied to enable engagement in aggressive price bargaining with multinational pharmaceutical manufacturers. Implementation of the Generics Act, approved in 1995, fostered competition among producers and facilitated the reduction of prices. A further effect of the Act was that it strengthened the local pharmaceutical industry and the network of 18 publicly owned laboratories operated by various government units and universities.25
By 2006, 80% of all the medicines marketed in Brazil were locally produced and Brazilian companies accounted for 75% of the total sales value. In 2001, 63% of the ARVs were produced by local manufacturers. By 2006, 7 public laboratories produced multi-source versions of 8 of the 15 medicines used in ARV therapy.
Among the key success factors cited as contributing to the phenomenal growth of the Brazilian domestic pharmaceutical industry was the establishment of publicly supported institutions
c The Agreement on Trade Related Aspects of Intellectual Property Rights (TRIPS) is an international agreement administered by the World Trade Organization (WTO) that sets down minimum standards for many forms of intellectual property (IP) regulation as applied to nationals of other WTO Members. It was negotiated at the end of the Uruguay Round of the General Agreement on Tariffs and Trade (GATT) in 1994. In terms of TRIPS, developing countries may introduce legislation that allows them to introduce compulsory licensing or any other provision leading to the reduction of medicines prices in the particular country, in the interests of making health care accessible.

184 SAHR 2012/13
for biomedical research and development, which led to increased production capability of government-owned pharmaceutical facilities. According to some data, two-thirds of research and development spending in Brazil came from the government, while only one-third was invested by the private sector. An additional factor was the promulgation in 2004 of legislation that encouraged more public-private cooperation by making it easier for public and private enterprises to share resources, raise capital and clarify intellectual property rights.
The abovementioned positive points notwithstanding, critics point out that the real ‘secret’ behind the high local contents and reduction of penetration of imported pharmaceuticals in Brazil is the promulgation of Federal Act No. 12.349 / 2010 “Public Procurement Law” (enacted 15 December 2010), which mandated the use of government procurement to stimulate the economy.26 The Act established price preference for domestic products and services for all sectors of the economy (including pharmaceuticals) of up to 25% relative to imports. Imported finished pharmaceutical products are subject to customs duties from 15% to 17% in Brazil; in contrast South Africa imposes no duty on pharmaceuticals. Furthermore, while Brazil was successful in reverse-engineering technologies for ARV APIs such as stavudine, zidovudine, nevirapine and lamivudine in the early 2000s, it encountered technology barriers in its attempts to manufacture more advanced ARV APIs, such as efavirenz, emtricitabine, and lopinavir/ritonavir. Currently, Brazil imports most of its ARV APIs from India and China. Some experts maintain that technology barriers in the manufacture of advanced chemical APIs or biologics and vaccines are so high (as Brazil has learnt) that it is cheaper and safer to license a technology rather than develop it domestically.d
While complete autonomy in relation to API production for ARVs is probably not unachievable, any progress in this regard will require the highest levels of political will and massive investment of resources. The Brazilian experience has demonstrated aptly that the road to self-sufficiency in the production of APIs does have potholes. In addition the achievement of the goal of reducing the country’s trade deficit in the process of supporting the country’s massive ART programme may have to be aided by the enactment of unpopular legislative measures. API production in the country may have to remain a longer-term goal that will not impact on medicines availability in the foreseeable future.
Conclusion and recommendations
This chapter has provided examples of aspects of the NDP that are currently implemented with some degree of success, especially as far as reducing the cost of medicines is concerned. Although the impact may not have been quantified in all the cases, considerable anecdotal evidence exists of the impact that many of the measures based on the NDP and implemented by government have had on medicines affordability.
The selection of medicines is considered key in ensuring equitable access to health care. The processes of selection may differ, depending on the sector (public or private) in SA. The application of the principles of evidence-based medicine, pharmacoeconomics and budget impact analysis, however, should serve as strong
d Personal Communication: A. Kudlinski, Department of Trade and Industry. October 11, 2012.
criteria in the decision-making process and lead to effective medicines selection.
The selection of medicines requires a coherent approach. SA’s move towards NHI should provide an opportunity to engage with all stakeholders to ensure a successful transition to a more centralised system.
In addition, overseas examples of the use of academic units with expertise in the fields of health economics, evidence-based medicine, critical appraisal and other HTA aspects provides lessons that can be drawn on in SA. A willingness and enthusiasm in the academic sector to engage in these processes should be strongly encouraged and fostered.
Conducting full HTAs in SA may be unnecessary, as information can be drawn from other countries and institutions, which have the relevant expertise. While the HTA needs of the private and public healthcare sectors may differ presently, these are likely to become more streamlined with the introduction of NHI.
Developments in medicines procurement in the public sector in the past few years or so would seem to indicate that the transfer of the management of pharmaceutical tenders to the NDoH may ultimately lead a more cost-effective system of medicines procurement compared to previous years.
The fully fledged establishment of the CPA, which would centralise control of the country’s pharmaceutical budget, may have far-reaching Constitutional implications.
None of the measures implemented in the medicines supply chain seem to have a positive impact on medicines availability at PHC level. As indicated in this chapter, far more effort needs to be made at district level in this regard.
The move towards the production of APIs for the production of ARVs in the country is a positive one, but the fruits of such a venture, if eventually successful, may not be enjoyed in the foreseeable future. Also, little reason exists for believing that the establishment of a state-owned pharmaceutical manufacturing company will lead to a reduction of medicines prices.
Implementation of the country’s NDP was not accompanied by a monitoring and evaluation plan that would have allowed for a systematic assessment of its impact. Some clear benefits have emerged in some areas, such as in pricing and the establishment of the NEMLC and PTCs to oversee medicines selection and rational use. However, a comprehensive picture of the impact of the implementation of the NDP can only be gained through a robust review process. Such a review would also present an opportunity for the country’s pharmaceutical services to be realigned and re-engineered for NHI.

Medicines Selection and Procurement in South Africa 14
SAHR 2012/13 185
References
1 National Department of Health. National Drug Policy for South Africa. Pretoria: National Department of Health; 1996.
2 World Health Organization. How to develop and implement a national drug policy. Second edition. Geneva, World Health Organization; 2001.
3 South African Drug Action Programme (SADAP). Baseline study to measure the impact of the Essential Drugs Programme in seven provinces of South Africa. Pretoria: SADAP, National Department of Health; 1998.
4 South African Drug Action Programme (SADAP). National survey of the impact of the Essential Drugs Programme (EDP) at primary health care level: Concise report 2003. Second, revised draft of national report. Pretoria: SADAP, National Department of Health; 2003.
5 Peltzer K, Phaswana-Mafuya N, Mohlala G, Ramlagan S, Davids A, Zuma K, et al. Impact of the national drug policy on pharmaceuticals in two provinces in South Africa. Pretoria: Human Sciences Research Council (HSRC); 2005.
6 National Department of Health. Compliance in public sector facilities with the legislation relating to the supply of medicine in South Africa: Status report, June 2007. Unpublished.
7 Gray A, Eagles P. Drug policy. In: Barron P, editor. South African Health Review 1997. Durban: Health Systems Trust; 1997.
8 Gray A. Equity and the provision of pharmaceutical services. In: Ntuli A, editor. South African Health Review 1998. Durban: Health Systems Trust; 1998.
9 Gray A, Suleman F. Drug policy – From macro development to health district implementation. In: Crisp N, Ntuli A, editors. South African Health Review 1999. Durban: Health Systems Trust; 1999.
10 Gray A, Matsebula T. Drug pricing. In: Crisp N, Ntuli A, Clarke E, editors. South African Health Review 2000. Durban: Health Systems Trust; 2001.
11 Gray A, Gengiah T, Naidoo P. The pharmacist’s assistant – A case study of a mid-level worker option. In: Ijumba P, Barron P, editors. South African Health Review 2005. Durban: Health Systems Trust; 2005.
12 Taylor B. Rationing of medicine and healthcare technology. In: Harrison S, Bhana R, Ntuli A, editors. South African Health Review 2007. Durban: Health Systems Trust; 2007.
13 Gray A, Vawda Y, Jack C. Health policy and legislation. In: Padarath A, English R, editors. South African Health Review 2011. Durban: Health Systems Trust; 2011.
14 World Health Organization. The World Medicines Situation Report 2011. Selection of essential medicines. Geneva, Switzerland: World Health Organization; 2011.
15 Nicolosi E, Gray AL. Potential costs savings from generic medicines – Protecting the Prescribed Minimum Benefits. S Afr Fam Pract. 2009;51(1):59-63.
16 Ministerial Task Team for Medicines Procurement. Medicines procurement reform in the public sector. Challenges and opportunities for improvement of medicines procurement in South Africa’s public sector. August 2010. Unpublished report.
17 National Department of Health. Tertiary and quaternary level essential medicines recommendations. Pretoria: National Department of Health; 2012.
18 Steel G, Ruff P. Improving access to oncology treatments in a resource constrained setting using pharmacoeconomic analysis. Poster, International Conference on Improving Use of Medicines (ICIUM), Turkey; 2012.
19 Meuller DB, Govender M, Basu D. Health technology assessment in South Africa – Future promise. S Afr Med J. 2011;101(5):286-7.
20 National Department of Health. Human Resources for Health South Africa: Strategy for the health sector 2012/13-2016/17. Pretoria: National Department of Health; 2011.
21 Zeeman H, Director Affordable Medicines, National Department of Health. Presentation to Gauteng Annual Pharmacists Conference, Pretoria; 14 September 2012.
22 Walwyn D. An assessment of the local production of antiretroviral active pharmaceutical ingredients; What kind and level of government support will be required? Dr David Walwyn, Arvir Technologies (PTY) Ltd; 2008.
23 Kudlinski A. Address to DTI’s Intellectual Property and Public Health Workshop. Pretoria; September 13 2012.
24 Wild S. AIDS-drug plant to ‘help cut trade deficit’. Business Day, 13 February 2012.URL: http://www.bdlive.co.za/articles/2012/02/13/aids-drug-plant-to-help-cut-trade-deficit
25 Homedes N, Ugalde A. Improving access to pharmaceuticals: The cases of Brazil and Argentina. Health Policy Plan. 2006;21(2):123-31.
26 Brazil’s industrial policy: Dealing with the real; the government feels the manufacturers’ pain. The Economist, 6 August 2011, Sao Paulo. http://www.economist.com/node/21525439.

186 SAHR 2012/13

SAHR 2012/13 187
Em
erg
ing P
ub
lic H
ealth
Pra
ctitio
ner
Aw
ard
s

SAHR 2012/13188
Em
erg
ing P
ub
lic H
ealth
Pra
ctitio
ner
Aw
ard
s

Author:
189SAHR 2012/13
15151515151515
Nadia Hussey
MBChB undergraduate, University of Cape Town
The Language Barrier:The overlooked challenge to equitable health care
Commitment must be made to implementing strategies that provide a multilingual patient
base with a multilingual healthcare service.
This chapter examines the effects of language barriers on the access of patients and communities to quality health care. It also looks at communication challenges experienced by health professionals that provide this care. Using
a case study of a rural hospital, the chapter highlights some of the challenges posed by the language barrier and explores current methods that English-speaking health professionals at this hospital use to overcome these difficulties.
The case study findings indicate that the language barrier decreases work efficiency and the provision of holistic treatment. It makes communication time consuming, which increases frustration levels and decreases empathy, approachability and confidentiality. Current methods for overcoming problems include the use of untrained and ineffective interpreters – usually overworked nurses; linguistic codeswitching; and the use of a selection of key isiXhosa vocabulary. These methods have many drawbacks and are not suitable or sustainable.
Recommendations for improving communication include the promotion of a culture of multilingualism, which includes language education as a part of professional development and the employment of trained interpreters. For multilingualism to occur, more research needs to be conducted, and the political will to address this problem must be demonstrated. Overcoming the language barrier needs to be prioritised and commitment must be made to implementing strategies that provide a multilingual patient base with a multilingual healthcare service.
EMERGING PUBLIC HEALTH PRACTITIONER AWARD

190 SAHR 2012/13
Introduction
Good communication has long been acknowledged as the cornerstone of the health professional-patient relationship and plays an important role in the quality of healthcare delivery.1 A lack of proficiency in a common language, however, decreases the quality of verbal communication between people. This lack of linguistic mutuality means that language becomes a limiting barrier – and, like any barrier, the language barrier impedes and obstructs effective communication.
In South Africa (SA) the language barrier continues to compromise a large proportion of the population’s quality of and access to healthcare services. This compromising of quality and access extends beyond the scope of the language barrier itself. It reflects vast and interlinking divisions in South African society forged by disparate educational access, divergent socio-cultural backgrounds and various historical legacies.
Health care in this country has many challenges to overcome. A lack of material and human resources, ineffective management of these resources, and the HIV epidemic are some of the complex and diverse challenges that SA is currently facing. The provision of a monolingual health service to a multilingual society is an additional and yet commonly overlooked challenge – especially in a country where diversity is not only constitutionally acknowledged but part of a public “rainbow nation” discourse. Using a case study of Madwaleni, a rural hospital in the Eastern Cape, this chapter highlights some of the challenges posed by the language barrier and explores current methods that English-speaking health professionals at this institution use to overcome these difficulties.
The effects of the language barrier on health care
The true depth of the impact of the language barrier is often disregarded by health practitioners, administrators and policy makers. The literature reviewed showed that the problem is widespread and not only limited to peripheral rural areas. In a 2006 study conducted by Levin of a large, urban paediatric hospital, a survey showed that only 6% of medical interviews were conducted (wholly or partly) in the patients’ home language.2 Patients are generally interviewed in a second or third language despite the fact that they prefer to be consulted in their own language.3 The Patients’ Rights Charter provides that patients have access to health care and the right to health information that includes the availability of health services and how best to use such services and that such information shall be in the language understood by the patient.4
This sentiment is echoed in the Bill of Rights, which states that: “everyone has the right to have access to health services”.5 The language barrier is simply that: a barrier to the accessing of health care. English remains the dominant language used officially and unofficially in healthcare services. According to the Constitution (Act 108 of 1996), though, SA has 11 official languages, with each language having an equal standing in the eyes of the law. Furthermore, the Constitution states that:
recognising the historically diminished use and status of the indigenous languages of our people, the state must take practical and positive measures to elevate the status and advance the use of these languages.
The practical focus of healthcare reform emphasises structural, administrative and resource shortages. The importance of language, especially in doctor-patient communication, is ignored. According to Levin’s 2006 study, “language and cultural barriers were cited by more parents [of patients] as a major barrier to health care than structural and socioeconomic barriers”.2
While medical science does have an objective and examinable component, the importance of communication is irrefutable. In an article reporting on a 2010 study by Deumert, a doctor is cited as explaining:
I can put my stethoscope [on a chest] but I will be guided by what my patient has told me. If the patient, for instance, was taking, let’s say TB treatment, and she didn’t finish the treatment, I won’t hear it from the stethoscope.6
Along with the negative impact of the language barrier on health professionals shown by the case study findings described below, the consequences for patients can be devastating. According to Jacobs et al., people with a limited English proficiency are:
less likely to have a regular source of primary care and are less likely to receive preventive care. They also are less satisfied with the care that they do receive…, more likely to report overall problems with care… [and] may be at increased risk of experiencing medical errors.7
In an era of patient-centred care, patients continue to have a reduced ability to participate in decision making and dialogue, which results in a power shift in favour of the healthcare practitioner.8 The link between English proficiency and educational attainment in post-apartheid SA means that previously disadvantaged groups of people continue to be marginalised and to experience this power imbalance. In many cases, patients may even blame themselves for their own linguistic inability rather than hold health professionals accountable for the decreased quality of care.2
The inability to communicate can be a traumatic, fearful experience – one that eliminates empathy and humanity from the health services provided. Schlemmer and Mash in 2006 recorded this account from a health professional:
the other day a child died, and the mom stands there, and we literally sit and wait for half an hour for an interpreter, so that I can talk to this mother about her child that died.8
Studies have shown that miscommunication caused by the language barrier results in increased patient avoidance behaviour (which may result in later presentation of disease) and adds to the uncertainty and emotional stress experienced by patients.6,9 Miscommunication can result in increased errors (potentially life threatening) both in diagnosis and management. Thus patients experience decreased satisfaction with services and are less inclined to adhere to and comply with treatment and they also receive less health education.6,10
Language cannot be isolated from culture. Cultural competency by health practitioners is important and facilitates a greater respect from patients. For example, doctors need to understand that not questioning a doctor can be perceived as a sign of respect in some cultures even if the patient has not understood what the doctor has said.8 Consultations are the point of contact between two people

The Language Barrier 15
SAHR 2012/13 191
– patient and doctor – who both view the world through different cultural lenses. These different world views can ultimately affect the quality of consultations.11
Additionally, disciplines such as mental health, which rely heavily on communication and cultural competence for diagnosis and management, are more vulnerable to errors or neglect.11
Madwaleni Hospital: a case study
Madwaleni is a 180-bed hospital in the Mbashe sub-district within the greater district of Amathole in the Eastern Cape. The hospital services the entire population of 262 000 people, most of whom are mother-tongue (often exclusively) isiXhosa speakers. With this largely isiXhosa-speaking population in Madwaleni, the resident English-speaking doctors, physiotherapist and occupational therapist experience a language barrier that prevents them from providing the best possible care.
As with any problem, the non-Xhosa-speaking staff of Madwaleni adapt and find workable solutions for communicating with their patients; the most common solution is the use of Xhosa-speaking staff, often nursing staff, as interpreters. This is an effective short-term method but more sustainable and suitable solutions are necessary to provide more efficient care.
As part of the Madwaleni case study, qualitative interviews were conducted with health professionals during December 2011. Seven doctors, one occupational therapist and one physiotherapist were formally interviewed to find out what impact communication problems had on their work and what they thought were possible solutions.
Language difficulties in Madwaleni Hospital
Difficulties identified by doctors that arose from a lack of understanding isiXhosa included the inability to ascertain the main complaint or obtain a coherent past medical history and the inability to identify malingering and psycho-social problems. Difficulties arising from an inability to speak isiXhosa included a decrease in the ability to be empathetic, kind and approachable and to resolve psycho-social problems and a decrease in adherence counselling and patient education. One doctor described a vast distance between doctors and patients, which he described as, “health care taking place across a barrier”.
Difficulties that arose from cultural differences were also brought up in the interviews. Obtaining informed consent and maintaining patient confidentiality were mentioned as often unavoidably less practised because of these differences. However, while language was cited as a problem, health professionals interviewed saw structural problems, policies, leadership, and organisational culture and infrastructure issues as greater barriers to effective care.
Some of the doctors who were interviewed felt that a form of “paternalistic medicine” was practised at the hospital as a result of the language barrier. They suggested that patients didn’t seem to mind this practice as they were mostly silent, never demanded anything and rarely asked questions. This behaviour may be a result of language or cultural differences but may be symptomatic of a greater structural disempowerment. The silence also affected the patients’ understanding of their disease, consent and treatment adherence.
Doctors experienced a stark difference in treating English-speaking patients. They found that bonding between patient and doctor increased and that the doctor took more time to explain to the patient the disease, the prognosis and the treatment plans – which, undoubtedly, affects the quality of treatment.
In summary, the language barrier decreased work efficiency and the provision of holistic treatment; it increased frustration levels, was time consuming and decreased empathy and approachability. The experiences of these health professionals correlate with other health professionals’ experiences of the language barrier cited in other research6,8,13 and formed an almost singular collective experience of this language obstacle.
Methods of overcoming the language barrier at Madwaleni Hospital
One of the measures used to overcome the language barrier is a reliance on non-trained interpreters. The health professionals interviewed reported relying on interpreters, who were often professional staff, junior or student nurses, family members of the patients (often children) and auxiliary staff.
Typically, a communication barrier often exists between doctor and interpreter and between interpreter and patient. This perpetuates the metaphorical ‘broken telephone’ phenomenon that is reportedly common at Madwaleni. Doctors interviewed stated that a language barrier also exists between themselves and some nurses. One doctor recounted how he had asked a nurse to interpret “Is the patient having difficulty breathing?” The nurse had replied,“Yes, she is breathing.”
Doctors agreed that the efficiency and quality of communication depended on the interpreter. Junior nurses or student nurses often had acquired a less proficient use of English. Some interpreters filled in gaps with their own knowledge. One doctor suggested they could see more patients when they did not use an interpreter – which points to the time-consuming nature of translating.
Most health professionals interviewed felt that a simple question from them to a patient would lead to the nurse and patient having a five- minute-long conversation, with the only feedback from the nurse being either “yes” or “no”. Doctors felt that this led to a subversive disconnect between patient and doctor and some doctors reported writing on patient charts while the nurse and patient were talking.
The examples provided above illustrate the potential disadvantages of using interpreters. In addition, the health professionals acknowledged that the use of interpreters can make one lazy and prevent a faster acquisition of the language of the patients.
Interpreters do, however, serve as cultural mediators and can pick up on the semantic subtleties and underlying tones of patient discourse. At Madwaleni, it was reported that interpreters facilitate a greater reflection on culture-specific topics. Currently they are the best available communication method and for this reason are valuable.
Another method of overcoming the language barrier is codeswitching. Codeswitching is a linguistic phenomenon where speakers change between two languages in a single sentence or conversation. Doctors and rehabilitation staff have picked up some essential words that allow them to practise some independence in the absence of the ad hoc interpreters. While this is a drop in

192 SAHR 2012/13
the linguistic ocean, it provides some direct communication with the patient that allows for bonding and trust to develop between patient and doctor. It also allows for more rapid communication and is a practical tool for transferring instructions quickly.
Common phrases used include “buya date” (date of return), “you must go there ngomso (tomorrow)” and “kubuhlungu?” (is there pain?) or “uxolo” (sorry). “Hamba to the ifestile ngoku” is a common phrase that indicates that patients must go to the ‘window’ – which is the pharmacy. Most English-speaking health professionals at Madwaleni know a fair number of anatomical words – for example: “indlebe” (ears), “intloko” (head) and “amadolo” (knees). They have also mastered some action command verbs: “goba”, “lula”, “vala”, “vula”, “phefumla”. Doctors were observed to call out into the waiting room of the outpatient department “olungileyo” (next) or “omnye” (one) to signal that the next patient must enter. Additionally, most doctors changed their accents when speaking to patients and used simple English in the hope of transferring meaning.
Towards future solutions
Kaplan, Greenfield and Ware in a 1989 assessment of the effects of physician-patient interactions on the outcomes of chronic disease noted three aspects of communication that had a critical link with patients’ health outcomes: the amount of information exchanged between the patient and physician, the rapport between the patient and physician and, lastly, the patient’s control of the dialogue.12 Speaking and understanding the language of the patient allow for this and can be developed through effective translation and/or increasing the bilingual workforce. Additionally cultural competence is necessary for providing appropriate care in the language of the patient and developing rapport, understanding and respect.
Effective translation and interpretation
The five main models of interpreting are:10
➢ approximate-interpreting model – ad hoc interpretation from anyone available that can speak the language;
➢ tele-active model – using telephones or computerised interpretation devices;
➢ bilingual worker model – hiring of clinicians that have language skills;
➢ volunteer interpreter pool model – hiring interpreters and translators on an as-needed basis; and
➢ staff interpreter model – formally trained interpreters that are part of the clinical staff.
The staff interpreter model involves employing dedicated trained interpreters. This tackles the problem of the 11 official languages and varieties of cultures that exist in contemporary SA. Some doctors at Madwaleni preferred the idea of medically trained interpreters – which would give the interpreter background knowledge. Others preferred the idea of an interpreter with no medical knowledge – which would mean that the interpreter would repeat exactly what the doctor said.
Language translation is complex and training is necessary as bilingualism does not always equal or result in effective translation. To convey the true meaning and the nuances of a language, the interpreter may not always translate the language directly.
Additionally, certain words may not be easy to translate into another language as Swartz illustrates:13
A Xhosa-speaking psychologist translated the word “sad” as khatazekile. On back translation by two senior students of African languages, khatazekile was translated as “worried”. Sadness and worry have, from a psychiatric point of view, very different implications for diagnosis and treatment.
A 2010 study found that the use of professionally trained medical interpreters improved “communication (e.g. errors and comprehension), utilisation (of health services), clinical outcomes, and satisfaction with care for both Low-English proficiency (LEP) patients and health care practitioners.”10 Interpreters may increase the reception of preventive services, physician visits and adherence, which increase patient access to primary care.7
An interpreter inevitably becomes an intermediary in the doctor-patient relationship and this can have a negative impact on the communication between the doctor and patient.9 Interpreting staff may be frequently unavailable or may insert their own values and views into the conversation.3 In some cases interpreters have been shown to make many errors in translating and this affects patient care. Nurses particularly have been shown to be inaccurate interpreters.2,14 Training nurses to be interpreters and equipping them with the skills to translate may be a useful strategy for professionalising language mediation in the South African context – but the issue is complex, as nurses are already overworked and health facilities understaffed.
The use of family members (often small children), cleaners, administrative staff, other patients or any ad hoc bilingual person is not ideal. It affects patients’ confidentiality.8 These interpreters are unlikely to understand medical terminology, may struggle to break bad news to patients and translate and interpret sensitive issues and may have conflicting agendas or priorities.15 Neither are they counsellors and are not accountable legally for any mistakes or breaches of confidentiality.
The cost of hiring interpreters is an important consideration but the cost of not using interpreters may be even greater.7 Interpreter services have been shown to lower costs by decreasing the use of diagnostic testing or reducing post-emergency department visits.16 The short-term cost may increase as primary and preventive medicine increases in use – but over the long term this could see a possible reduction in cost, morbidity and mortality. The cost may also be overestimated. In recommendations to a study conducted in 2008, Deumert estimated that “200 interpreters would be sufficient to cover all the 34 public hospitals in the Western Cape”.6
Ultimately no single model exists that would provide the best method of translation for low-resource settings such as those found in SA.
Developing a culture of multilingualism – the bilingual worker model
The ideal is for the health service to employ health professionals who are already culturally and linguistically capable. Health professionals who would be proficient in the language of their patients should be identified and recruited. The already short-staffed nature of the health service prevents this but language-sensitive posting should be looked into.1

The Language Barrier 15
SAHR 2012/13 193
If mother-tongue speakers are not available, health professionals must learn to speak the language of the majority of their patients. The Faculty of Health Sciences at the University of Cape Town is attempting to achieve this by transforming its health sciences undergraduate curriculum:
The curriculum design principles of inclusiveness, participation and social responsiveness mirror the primary healthcare (PHC) approach. Furthermore, a client/patient-centred approach that strengthens inclusivity and participation has been given impetus with the integration of two of the indigenous languages [isiXhosa and Afrikaans], most frequently spoken in the Western Cape, and cultural competences into all curricula.17
The diversity of languages in SA may dictate that specific competency in every language cannot be prepared for in tertiary institutions. Competence in the language of future patients could, however, become a form of professional development or part of in-service training. In Schlemmer and Mash’s 2006 study, health professionals were shown to consider this:
As the doctors and nurses in this study requested, they should also be offered training in basic isiXhosa. Although language acquisition as an adult is not easy the idea is not to become bilingual in [isi]Xhosa, but rather to create sufficient basic understanding of medical isiXhosa and respect for the other’s culture.8
Additionally, as a starting point, medical institutions could provide short word lists, which include salutations and medical vocabulary.2 While language acquisition is a difficult and complex process, greetings and pronunciation of patients’ names should be seen as absolute necessities. At Madwaleni, self-taught vocabulary allowed for independence from interpreters and increased direct interaction with the patient. But this was felt to be no substitution for proper communication. This finding confirms the findings of other research. For example, a doctor interviewed in the Deumert 2010 study explained how rudimentary communication contradicts the “essentials” of medical practice emphasised during training:
A lot of the time a patient arrives, they are breathing heavily, so you think that it’s probably a respiratory problem, or a cardiac problem, and you want to ask them are they coughing, and you know the word is khohlela in isiXhosa, but more than that, you can’t really get. You want to ask, are you coughing? Is it productive? Is it painful when you cough? Is blood mixed in, in the cough? You know, there is a problem, I mean, every professor of medicine will tell you three-quarters of your diagnosis comes from the history. And that is verbal.6
While many doctors do show an interest in learning the language of their patients, the argument against health professionals’ learning of language is centred on the time-consuming nature of language acquisition over and above an already stressful workload. Additionally, doctors at Madwaleni explained that there were no role models or examples of people who had learned isiXhosa at that hospital and that the status quo of using nurses as interpreters was an easy habit to slip into. This may not be the global norm. For example renowned scholars Antia and Bertin noted in their 2004 Nigerian study: “irrespective of their home language, [practitioners] quickly acquired the languages of their patients.”1
A counter argument to the need for developing multilingual practitioners may be that patients can learn English – or acquire enough English to get by in a hospital setting. English as the lingua franca is viewed as a cost-effective and simple response to SA’s cultural and linguistic diversity and takes away the responsibility for learning a new language from health providers.6 Cultural and linguistic marginalisation, with an emphasis on English and Afrikaans as the languages of operation, echoes pre-1994 experiences and can damage cultural diversity as a hegemonic Western culture assumes dominance. This will inevitably – as in fact it already does – marginalise those who may not be able to acquire English easily: older patients and people with low socio-economic circumstances or poor inter-cultural and linguistic exposure (characteristic of rural areas).
The National Health Act (Act 61 of 2003)18 puts the responsibility on the healthcare provider to provide multilingual health care but does not point to the methods that can accomplish this:
The healthcare provider concerned must, where possible, inform the user as contemplated in subsection (1) in a language that the user understands and in a manner which takes into account the user’s level of literacy.18
This does not mean that patients should not take control of their own health. Patient empowerment and education must occur in institutions.
The language barrier is not new. Historically, this problem has always existed, but health professionals stayed much longer at one hospital – especially in the rural context. Increasing staff retention at hospitals, in itself, logically promotes the long-term acquisition of the language/s of that region. At the time the case study was conducted at the end of 2011 most health professionals at Madwaleni had been there for not more than one or two years. With the re-engineering of the health system long-term employment at one institution may be the single most sustainable method of eradicating the language barrier between doctor and patient.
Cultural competence
The “explanatory model approach” is an effective starting point for addressing a patient’s personal and cultural experience of illness. Using this framework, as outlined by Kleinman and Benson allows one to gain a better understanding of a patient’s experience of health.11 The framework also takes into consideration the pressures and time constraints of the modern hospital environment.
It involves the practitioner asking the patient:
➢ what do you call this problem?
➢ what do you believe is the cause of this problem?
➢ what course do you expect it to take?
➢ how serious is it?
➢ what do you think this problem does inside your body?
➢ how does it affect your body and your mind?
➢ what do you most fear about this condition? and
➢ what do you most fear about the treatment?

194 SAHR 2012/13
Policy implications and recommendations
Primary health care re-engineering is centred on health promotion, prevention and community involvement, none of which can occur without an acknowledgement of the multilingual nature of South African society. Promotion and prevention cannot begin to succeed if there is no dialogue. The institutional and structural silencing of patients’ and communities’ non-English voices prevents community involvement.
The Core Standards19 – a framework created by the Department of Health, for the assessment of health establishments – make no mention of the language barrier or even acknowledges it as a challenge to service-delivery quality. The Negotiated Service Delivery Agreement (NSDA), an intersectoral government agreement aimed at “a long and healthy life for all South Africans”,20 describes ways to increase patient care and satisfaction – but it too does not mention language. This ultimately demonstrates a lack of recognition or interest in the importance of language.
The Patients’ Rights Charter4 and the National Health Act (Act 61 of 2003)18 mention that services must be in a language that is understandable but this mere mention is perfunctory rather than enforced and prioritised in policy. A policy-implementation gap still exists and this is partially related to the fact that no mention is made of the strategies needed to overcome the language barrier in health services.
A directed and focused policy needs to be developed that engages with appropriate methods of overcoming the language barrier. For this to occur, first, combating the language barrier needs to be prioritised. The data discussed in this chapter point to the validity of this prioritisation. Second, more research needs to be conducted in the South African context to develop evidence-informed effective solutions. Third, increased awareness and discourse around the language problem must be cultivated. Last, these solutions or interventions need to be communicated to stakeholders and all involved should understand the need for these interventions.
Conclusion
The Bill of Rights provides that “everyone has the right to have access to health services”5 and states that the language barrier is simply that: a barrier to the accessing of health care. Provision of services in a patient’s own language is an integral part of the quality of care and “getting language right” has been shown to result in positive outcomes for all stakeholders – patients, doctors and administrators. However, the problem needs to be prioritised and commitment to implementation strategies must occur.
The answer to overcoming the language barrier in hospitals in SA may be a combination of all the strategies discussed in this chapter and some may be more applicable in certain districts than in others. The data are compelling and the importance of doctor-patient communication cannot be ignored. Yet there are perceived undercurrents of chronic resistance, lack of interest and claims of irrelevance. The solution to addressing the communication barrier begins with an acknowledgment of its existence and strong political will to address the problem at all levels. In the overhauling of the healthcare system, now is the time to provide a multilingual society with multilingual healthcare.
Acknowledgements
Thank you to the health professionals interviewed and the community of Madwaleni. Thank you to those who reviewed this paper (in alphabetical order): Amber Myers, Claire Tucker, Dr Cynthia Le Grange, Professor Gregory Hussey, Dr Nayna Manga, Dr Sharon Groenmeyer and Terry Mwesigwa.

The Language Barrier 15
SAHR 2012/13 195
References
1 Antia B, Bertin F. Multilingualism and healthcare in Nigeria: A management perspective. Commun Med. 2004;1(2):107-17.
2 Levin M. Language as a barrier to care for Xhosa-speaking patients at a South African paediatric teaching hospital. S Afr Med J. 2006;96(10):1076-9.
3 Pfaff C, Couper I. How do doctors learn the spoken language of their patients? S Afr Med J. 2009;99(7):520-2.
4 National Department of Health. The Patients’ Rights Charter. Pretoria: National Department of Health; 2007.
5 Republic of South Africa. The Constitution of the Republic of South Africa Act (Act 108 of 1996).
6 Deumert A. ‘It would be nice if they could give us more language’ – Serving South Africa’s multilingual patient base. Soc Sci Med. 2010;71(1):53-61.
7 Jacobs E, Shepard S, Suaya J, Stone E. Overcoming language barriers in health care: Costs and benefits of interpreter services. Am J Public Health. 2004;94(5):866-9.
8 Schlemmer A, Mash B. The effects of a language barrier in a South African district hospital. S Afr Med J. 2006;96(10):1084-7.
9 Saha S, Fernandez A. Language barriers in health care. J Gen Intern Med. 2007;22(Suppl 2):281-2.
10 Yakushko O. Clinical work with limited English proficiency clients: A phenomenological exploration. Prof Psychol Res Pr. 2010;41(5):449-55.
11 Kleinman A, Benson P. Anthropology in the clinic: The problem of cultural competency and how to fix it. PLoS Med. 2006;3(10):1673-6.
12 Kaplan SH, Greenfield S, Ware JE Jr. Assessing the effects of physician-patient interactions on the outcomes of chronic disease. Med Care.1989;27(3 Suppl):S110-27.
13 Swartz L. Culture and mental health: A southern African view. Cape Town: Oxford University Press; 2008.
14 Elderkin-Thompson V, Silver RC, Waitzkin H. When nurses double as interpreters: A study of Spanish-speaking patients in a US primary care setting. Soc Sci Med. 2001;52(9):1343-58.
15 Flores G. Language barriers to health care in the United States. N Engl J Med. 2006;355(3):229-31.
16 Brach C, Fraser I, Paez K. Crossing the language chasm. Health Aff (Millwood). 2005;24(2):424-34.
17 Hartman N, Kathard H, Perez G, Reid S, Irlam J, Gunston G, et al. Health sciences undergraduate education at the UCT: A story of transformation. S Afr Med J. 2012;102(6):477-80.
18 Republic of South Africa. The National Health Act (Act 61 of 2003).
19 National Department of Health. National core standards for health establishments in South Africa. Pretoria: National Department of Health; 2011.
20 National Department of Health. Negotiated Service Delivery Agreement. A long and healthy life for all South Africans. Pretoria: National Department of Health; 2010.

196 SAHR 2012/13

Author:
197SAHR 2012/13
16161616161616
Oluwatoyin Adeleke
School of Public Health and Family Medicine, University of Cape Town
Barriers to the Implementation of Tuberculosis Infection Control among South African Healthcare Workers
Some of the barriers identified were inadequate
training on tuberculosis infection control, a non-
responsive compensation policy and the perception that a busy clinic schedule
leaves no time for tuberculosis infection control
implementation.
This chapter provides an overview of health system factors that influence health worker performance in implementing TB infection control (TBIC) in primary care clinics at district level. Research in the form of a case study
was conducted among professional and lay healthcare workers (HCWs) to assess barriers to implementation of TBIC in two South African primary care clinics with high TB prevalence.
Barriers and enablers to TBIC implementation were linked with health systems and HCW motivation. Some of the barriers identified were inadequate HCW training on TBIC, a non-responsive compensation policy and the perception that a busy clinic schedule leaves no time for TBIC implementation. Resource availability, adequate human resources, supervision and leadership characterised by delegation enabled HCWs to implement TBIC.
Lessons drawn from this chapter could influence health policy reform and inform managers about how to improve health worker performance as regards safety in high-risk settings.
EMERGING PUBLIC HEALTH PRACTITIONER AWARD

198 SAHR 2012/13
Introduction
Healthcare workers (HCWs) and patients are at risk of acquiring tuberculosis (TB) infection in healthcare facilities.1 Such risk characterises TB as a dual public health threat – first, as a communicable disease and, second, as an occupational health hazard. Overall TB prevalence among HCWs in South Africa (SA) was 5% in 2009 while HIV prevalence was approximately 16% in 2002.2,3 HIV co-infection and TB drug resistance (DR-TB) worsen the overall problem of TB in South Africa.4 The burden of TB disease driven by a high HIV prevalence and increased vulnerability to TB increases the likelihood and significance of healthcare-associated TB transmission.5-7 “Healthcare-associated infections” refers to infections that are acquired by staff or users of health services within healthcare facilities.8 The risk of healthcare-associated TB has been recognised in healthcare settings worldwide.9,10 In SA, healthcare-associated infection is particularly an issue in communities with both a high drug-resistant TB prevalence and HIV prevalence.11-13
Khayelitsha is a poor urban township located 40 kilometres from Cape Town, and has an estimated population of 500 000.14 Within the South African health system, the district or sub-district level, such as Khayelitsha, is the primary level of care and first point of call for health service utilisation. There are ten primary care clinics in Khayelitsha and each of these clinics has been sensitised to TB Infection Control (TBIC) and have commenced implementation of such an initiative.15 As the largest township in the Western Cape, Khayelitsha has one of the highest TB and HIV co-infection rates in SA and globally, with a TB case notification rate of 1 158 per 100 000 per year.16 About 70% of all TB patients are also HIV-infected.17 One of the strategies aimed at reducing the TB burden in Khayelitsha is to prioritise TBIC in health facilities to limit nosocomial transmission. Although measures of TBIC have been implemented in all Khayelitsha clinics, such measures are difficult for HCWs to maintain.18 This study explores barriers to TBIC implementation among HCWs in two primary care clinics in Khayelitsha.
TBIC is part of a broad range of Infection Prevention and Control (IPC) measures recommended by the World Health Organization (WHO) and adopted locally in SA.19-21 Provisions for IPC in SA are documented in the Occupational Safety and Health Act (Act 85 of 1993)22 and Compensation for Occupational Injuries and Diseases Act (Act 130 of 1993).23 The WHO recommends TBIC as one of the three strategies for reducing the burden of TB in HIV-prevalent settings.24 These strategies are: isoniazid preventive treatment, intensified case finding and infection control.25
TBIC is a combination of measures used as part of a holistic approach to effectively reduce the risk of TB transmission within crowded settings, including healthcare facilities. TBIC comprises three categories of measures that are hierarchical but usually implemented simultaneously to reduce the risk of healthcare associated TB. These measures are administrative controls, environmental controls and the use of personal protective equipment (PPE). Administrative controls are the most prioritised of the three, described as the “first line of defence” against TB transmission in healthcare facilities because of their potential for removing infectious risk through prompt diagnosis and treatment.26 They include prompt identification of clients with TB symptoms, placing them on treatment and minimising time spent in a health facility. Other components of administrative controls include staff training,
establishing infection control committees, cough etiquette, health education and the use of paper masks by patients. Environmental control helps to reduce the number of infectious droplets in the air through controlling the direction of airflow and natural ventilation (i.e. keeping windows open) or mechanical ventilation (i.e. installation of vents and wind-driven air extractor turbines). The third measure of TBIC is the correct and consistent use of PPE (e.g. N95 respirators, which contain filters that prevent wearers from inhaling the TB bacilli).27 Implementing PPE for TBIC is ranked third because it is regarded as a last resort that complements administrative and environmental control measures. Whereas other measures prevent more than one person from becoming infected with TB, PPE protects only the wearer. Although there is little direct evidence, theory and mathematical modelling suggest that the consistent implementation of the trio of TBIC measures can significantly reduce TB transmission within healthcare facilities.7,10,13 HCWs are seen as the front-line implementers of TBIC in healthcare facilities and therefore play a vital role in the effective and consistent implementation process.
Since HCWs are an essential part of the health system that implement health policies within healthcare facilities, understanding what motivates them to implement TBIC is crucial for identifying barriers to implementation.
This chapter reports on a study conducted with healthcare workers from two clinics in Khayelitsha (Clinic A and Clinic B). Data was collected by direct observation of HCWs implementing TBIC in the clinics and key informant interviews among facility managers and a sub-district health representative (n=3), semi-structured interviews among professional HCWs (n=7) and focus group discussions among lay healthcare workers (n=3). An observational grid and interview guidelines were developed as data collection instruments.
Enablers of TBIC implementation among HCWs
This section outlines factors that enhanced TBIC implementation among HCWs in the two clinics surveyed.
Resource availability
Professional and lay HCWs are more likely to implement TBIC when resources are provided in the form of infrastructure, human resources and consumables (e.g. N95 and paper mask). Professional HCWs mentioned the crucial role of human resource availability in TBIC practice, especially with regard to reduced workload per staff member, which left more time to implement TBIC.
Last year, we asked for more staff. We are happy because they have recruited more people, now we can listen to TBIC. We have more people and more time to implement.
(Key informant one – Professional HCW)
In terms of resources provided by the health system (potentially enabling factors), both professional and lay HCWs in both clinics described respirators and paper masks as “generally available’”. Health system support characterised by leadership, resource availability and operational policies enabled HCWs to implement TBIC. This finding is in line with previous research that has shown how organisational support and commitment to health workers’ safety strongly motivates HCWs to implement TBIC.28

Barriers to the implementation of TB infection control 16
SAHR 2012/13 199
Leadership by delegation
As a further administrative control measure, a facility manager assigned responsibility for infection control (IC) to a professional HCW. Such delegation, combined with ongoing supervision, seemed to have underlined TBIC as a priority in Clinic B compared to Clinic A where an infection control committee is yet to be functional.
There is someone I have given the portfolio to who is championing IC. He is the one doing an IC audit on a monthly basis and then we discuss it with the general assistants.
(Key informant two – Professional HCW)
Supervision
It was observed that HCWs in Clinic B used respirators more consistently compared to those in Clinic A. A key informant interview revealed that in Clinic B, the facility manager who had earlier observed the inconsistent use of respirators among HCWs organised a fit test of N95 respirators to encourage sustained use of respirators among staff. The fit test enabled HCWs to use respirators:
Last year, we had fit testing sessions. I asked the TB/HIV coordinator to come and do a fit test for all the staff working in the TB room. So now it fits them properly.
(Key informant three – Professional HCW)
Although HCWs’ discomfort while they are using respirators is something the health system may not be able to address, fit tests can minimise the discomfort by helping HCWs to identify the most suitable respirators.
After the fit tests, one of the HCWs working in the TB unit was seen not wearing a respirator. The manager then requested a signed document stating the HCW was not willing to use the PPE provided by the clinic. This HCW was seen wearing a respirator during later observations. HCWs need to be supervised and constantly reminded about maintaining TBIC practices in clinics. Evidence suggests that if each clinic had a dedicated infection control officer, daily TBIC implementation would be likely to be more effective. However, a setback in hiring an infection control officer is the over-reliance of HCWs on the individual, whereas TBIC should be the collective responsibility of professional and lay HCWs. The experience of the head of the infection control committee in one of the clinics referred to the tendency of HCWs to avoid taking responsibility for infection control once a person has been assigned to champion the implementation process in clinics.
Collective practice
HCWs tend to be influenced by the social norm when colleagues wear PPE. One HCW declared:
In this particular clinic, I see that everybody wears a mask more than in other clinics which is encouraging….I think when you are working with people who are conscious of IC [infection control], it makes you more conscious of IC.
(Key informant four – Professional HCW)
Similar to our findings, another recent South African study associated support from colleagues with the implementation of TBIC among HCWs.29 In-service training could be a potential platform to garner support for implementing TBIC in clinics. After in-service training HCWs are more likely to remind each other about sustaining the TBIC practice they have learnt. Implementation challenges can be shared and resolved through active infection control within clinics.
Screening for TB
On HCW screening for TB, the health system makes diagnostic services readily available to staff. TB screening is voluntary and usually initiated by HCWs. When asked if TB screening is available to HCWs, one of the interviewees responded:
We are allowed to whenever you feel like. If I feel like I have a cough and want to have an x-ray because maybe I am suspecting TB, that is in place at work.
(Key informant five – Professional HCW)
Such provision of TB screening services to HCWs is an enabling factor for TBIC practice. If HCWs are provided with needed services that enhance their health such as screening for TB, they are more likely to feel supported by the health system and implement TBIC. If screening services are unavailable, HCWs are likely to feel demotivated.
Barriers to TBIC implementation among HCWs
Identified obstacles to implementing TBIC among healthcare workers are summarised in this section.
Uncomfortable respirators
Despite the fear and high risk attributed to TB, HCWs admitted they were not inclined to comply with PPE requirements due to the discomfort and suffocating nature of the respirators provided. They mentioned difficulty in breathing aggravated by personal health challenges, pregnancy or other conditions.
The challenge and demotivator is difficulty in breathing using the N95.
(Key informant six – Professional HCW)
Non-proactive use of respirators
An important finding is the reactive manner in which HCWs use respirators by only wearing them after they know the TB status of a patient.
I only wear mask when I know a patient has been diagnosed. It is suffocating, a communication barrier and feels hot.
(Key informant seven – Professional HCW)
This non-proactive use of respirators reflects a lack of understanding as to who is more likely to be infectious. Undiagnosed and untreated TB cases that will be infectious are mostly found in the waiting areas of clinics. Wearing respirators for known TB cases only is therefore a hindrance to consistent TBIC implementation among HCWs.

200 SAHR 2012/13
HCW perception of TB concentration in certain clinic sections
Lay HCWs not working in the area of TB did not see a need to use PPE because they did not perceive themselves at high risk of acquiring TB. In Clinic A, lay HCWs (assisting the TB team) did not use respirators while attending to patients because of their perceived low risk of contracting TB. Further probing on the possible reasons for this perceived low risk, revealed that HCWs associate consistent use of respirators with HCWs working in TB sections or working with diagnosed TB patients. As far as they are concerned, TB is concentrated in one section of the clinic – the TB section.
Therefore, the perception is that spending a few minutes in the TB room does not predispose HCWs to TB infection as stated by these respondents:
I don’t work in TB room full-time, just helping out so I don’t need to wear a mask.
(Key informant eight – Lay HCW)
When I was working in TB room, I used to wear a respirator but it choked me. I feel very uncomfortable, but now I no longer work there so I don’t have to use it.
(Key informant nine – Professional HCW)
The perception that an airborne infection such as TB is restricted to the TB section of the clinic is a barrier to TBIC implementation among HCWs that needs to be addressed during staff meetings. Information, Education and Communication posters should be displayed in all sections of the clinic. For example, a poster that reads: “TB somewhere in the clinic is TB everywhere in the clinic. Are you protecting yourself?” could be posted in each section of the clinic to inform HCWs and clients.
Non-responsive compensation policy
Another issue raised by HCWs was the non-responsive compensation policy, should they ever get active TB. Compensation for active TB disease is a regulatory factor that can motivate HCWs to sustain TBIC practices by being financially responsible for their TB disease. TB is a compensable disease, though, according to the Compensation for Occupational Injuries and Diseases Act (COIDA)(Act 130 of 1993). One HCW commented:
The thing is with TB and being a health worker, should I get it, I know it’s going to be my problem. I won’t be able to prove that I got it here. There is nothing in place that says if you are working in the TB department, you will be compensated. So I guess if you work here, it is at your own risk. That’s how I feel.
(Key informant three – Professional HCW)
A finding from a key informant interview revealed that HCWs are not required to prove the infection was healthcare associated. Further probing on the nature of compensation HCWs expect from the health system revealed both financial and non-financial incentives:
It could come in many different ways, remuneration is always a good thing, give me more money, sometimes recognition, even if it’s not in form of money.
(Key informant three – Professional HCW)
The COIDA policy serves as a regulatory document that supports reimbursement of HCWs who develop TB. However, because of bureaucratic processes and delays, HCWs see TB as a ‘personal problem’ and not an institutional problem. Previous research suggests that such lack of trust in the system can be a barrier to motivation of HCWs who implement TBIC.30
Patients’ non-compliant attitudes
One other demotivating factor mentioned by lay HCWs in both clinics was the disrespectful and non-compliant attitudes of patients. This finding is in line with that of an earlier study that recognised the contributing role of patients to effective TBIC practice.31 Patients sometimes rebel against the use of masks by wearing them inappropriately or not wearing masks at all, as illustrated by this respondent:
They are so rude…sometimes you talk to them nicely. You say “sisi, others are wearing masks, please you must,” but they say they can’t because they have rights. I usually tell them “yes, you have rights but before you use your rights, you must know others have rights too.”
(Key informant ten – Lay HCW)
No time for TBIC
Both professional and lay HCWs perceive TBIC as a separate item from their routine tasks. Although HCWs perceive they are at risk of getting TB and particularly dread being infected with DR-TB, they feel they are too busy to adhere fully to TBIC measures. It appears as though professional and lay HCWs are initially motivated by fear to implement TBIC but become so familiar with the working environment that the perceived risk of acquiring TB wanes over time. This perception suggests that TBIC is yet to be prioritised and integrated into service delivery procedures in clinics, as illustrated by this respondent:
I used to be scared when I started but I have gone past that now…like yesterday we were so busy here, there is no time to get paranoid.
(Key informant eleven – Professional HCW)
Training deficit
According to facility-specific policies on TBIC, in-service training is an administrative control measure. Other than professional training in medical and nursing schools, most (professional) HCWs had not received further training in TBIC. However, two professional HCWs had attended one-day training on TBIC organised by a non-governmental organisation. Although a prior needs-assessment report in both clinics has identified refresher training as integral to improved infection control, in-service training is yet to be implemented in these clinics. Two predisposing factors that determine sustained TBIC practice are HCWs’ perception of risk and the training they have received on TBIC. If HCWs perceive they are at risk, they are more likely to participate in training and implement TBIC in a consistent manner. Research suggests that improvements recorded in the “work and systematic training” of health workers at primary health care level contribute to successful TB control.32 Studies have also shown the benefit of in-service training to improved TB care in resource-constrained settings within South Africa.33 Sustained TBIC implementation requires training focused on behaviour change communication, rather than

Barriers to the implementation of TB infection control 16
SAHR 2012/13 201
knowledge acquisition.34 In-service training can easily bridge the gap between knowledge and practice identified as a barrier to TBIC practice in previous studies.29,33,35
Inadequate ventilation
Inadequate ventilation was cited as a barrier to effective TBIC in clinics. Most professional HCWs in both clinics complained about inadequate ventilation in consulting rooms and TB treatment rooms. While some HCWs generally request that vents be installed in consulting rooms and TB rooms, some HCWs who have attended dissemination meetings on infection control are specifically requesting for the installation of wind-driven roof turbines – ‘whirly birds’ – which may contribute to improved ventilation in rooms.35
I don’t see anything like an air vent here…that’s bad. I think it will be great if they can improve ventilation. Can they put whirly birds? After that study, I think it made an impact.
(Key informant twelve – Professional HCW)
One of the study clinics is an older-style building and does not conform to current policy recommendations,which results in poor ventilation in some waiting areas. 19 In this situation, while opening windows may assist with ventilation, issues of clinic design are, perhaps, more relevant. The health system needs to improve on physical infrastructure that supports natural ventilation in all sections of the clinic, otherwise HCWs will continue to experience challenges in implementing environmental controls.
Lack of shared responsibility among HCWs
Although all interviewed HCWs in one of the clinics knew there was an infection control committee, they seemed to be detached and unaware of the actual committee activities. The head of the infection control committee works in another section of the clinic, rather than in the TB section itself. When interviewed, the head of the infection control committee stated that one barrier to effective TBIC was the over reliance on the head of the infection control committee and a lack of shared responsibility among other HCWs:
The barrier is that they tend to rely on one person….it should be done by everybody. It should start with me and extend to everybody. It should be everybody’s responsibility.
(Key informant thirteen – Professional HCW)
There is a need to re-sensitise HCWs to their contribution to effective TBIC practices in clinics. The leadership of infection control committees could be rotated across various departments to encourage HCWs to develop a sense of responsibility for infection control.
Conclusion
Self-reported and directly observed barriers to the implementation of TBIC were limited time owing to heavy workload, uncomfortable N95 respirators, poor ventilation due to over-crowding in some waiting areas and patients’ non-compliance with the use of masks. Specific barriers related to the health system are a non-responsive compensation policy and inadequate training of HCWs on TBIC.
Bureaucratic delay in compensating HCWs (with active TB disease) is a major barrier to building trust in the health system. Such mistrust is an obstacle to sustained TBIC implementation among HCWs. Professional and lay HCWs are not implementing TBIC according to facility-specific policy. The last line of defence, PPE, was mostly prioritised by HCWs instead of administrative and environmental measures. TBIC is not likely to be effective in clinics where HCWs continue to prioritise PPE.
Protecting HCWs and patients from healthcare-associated infections is the responsibility of the health system. Professional and lay HCWs need to be trained (in service) on TB transmission risk and how to implement TBIC to ensure effective implementation in clinics. Sub-district health systems should prioritise TBIC by training HCWs and continue to provide resources needed to implement TBIC. In terms of HCWs, who are an integral part of the health system, there is a need to maximise resources provided and develop the motivation needed to maintain TBIC implementation. Further research should focus on identifying behavioural models that further explain barriers to TBIC implementation among HCWs and how to address these barriers despite patient workload, insufficient numbers of HCWs and other resource constraints that characterise poor urban townships.
Acknowledgements
Healthcare workers for their participation; Andrea Rother and Helen Cox for their supervision, tireless review and encouragement; Shaheen Mehtar, Virginia Azevedo, Lucy Gilson, Leslie London, Mokgadi Mothemela for their insights into TB infection control and health systems research. Also acknowledged is the City of Cape Town Health Department for the study approval and Médecins Sans Frontières in Khayelitsha for logistical support.

202 SAHR 2012/13
References
1 Joshi R, Reingold AL, Menzies D, Pai M. Tuberculosis among health-care workers in low- and middle-income countries: A systematic review. PLoS Med. 2006;3(12):2377-91.
2 Kranzer K, Bekker LG, van Schaik N, Thebus L, Dawson M, Caldwell J, et al. Community health care workers in South Africa at increased risk for tuberculosis. S Afr Med J. 2010;100(4):224,226.
3 Shisana O, Hall E, Maluleke R, Chauveau J, Schwabe C. HIV/AIDS prevalence among South African health workers. S Afr Med J. 2004;94(10):846-50.
4 Padayatchi N, Naido K, Dawood H, Kharsany ABM, Abdool Karim Q. A Review of progress on HIV, AIDS and tuberculosis. In: Fonn S, Padarath A, editors. South Africa Health Review 2010. Durban: Health Systems Trust; 2010.
5 Wood R, Middelkoop K, Myer L, Grant AD, Whitelaw A, Lawn SD, et al. Undiagnosed tuberculosis in a community with high HIV prevalence: Implications for tuberculosis control. Am J Respir Crit Care Med. 2007;175(1):87-93.
6 Bock NN, Jensen PA, Miller B, Nardell E. Tuberculosis infection control in resource-limited settings in the era of expanding HIV care and treatment. J Infect Dis. 2007;196(Suppl 1):S108-13.
7 Shenoi SV, Escombe AR, Friedland G. Transmission of drug-susceptible and drug-resistant tuberculosis and the critical importance of airborne infection control in the era of HIV infection and highly active antiretroviral therapy rollouts. Clin Infect Dis. 2010;50(Suppl 3):S231-7.
8 Mehtar S. Understanding infection prevention and control. Cape Town: Juta and Company Ltd; 2010.
9 Pai M, Kalantri S, Aggarwal A, Menzies D, Blumberg H. Nosocomial tuberculosis in India. Emerg Infect Dis. 2006;12:1311-8.
10 Basu S, Andrews JR, Poolman EM, Gandhi NR, Shah N, Moll A, et al. Prevention of nosocomial transmission of extensively drug-resistant tuberculosis in rural South African district hospitals: An epidemiological modelling study. The Lancet. 2007;370(9597);1500-7.
11 Bamford C, Taljaard J. Potential for nosocomial transmission of multidrug-resistant tuberculosis in a South African tertiary hospital. S Afr Med J. 2010;100(7);438-41.
12 O’Donnell MR, Jarand J, Loveday M, Padayatchi N, Zelnick J, Werner L, et al. High incidence of hospital admissions with multidrug-resistant and extensively drug-resistant tuberculosis among South African health care workers. Ann Intern Med. 2010;153(8);516-22.
13 Heysell SK, Moll AP, Gandhi NR, Eksteen FJ, Babaria P, Coovadia Y, et al. Extensively drug-resistant mycobacterium tuberculosis from aspirates, rural South Africa. Emerg Infect Dis. 2010;16(3);557-60.
14 Médecins Sans Frontières. Report of TB infection control assessment in Khayelitsha clinics. Cape Town: Médecins Sans Frontières; 2011.
15 Cox HS, McDermid C, Azevedo V, Muller O, Coetzee D, Simpson J, et al. Epidemic levels of drug resistant tuberculosis (MDR and XDR-TB) in a high HIV prevalence setting in Khayelitsha, South Africa. PLoS One. 2010;5(11):e13901.
16 HATIP. Integrating TB and HIV services: lessons from the field [Internet]. Aidsmap. 23 March 2010 [cited 14 February 2013].URL: http://www.aidsmap.com/Integrating-TB-and-HIV-services-lessons-from-the-field/page/1397719/
17 Médecins Sans Frontières, City of Cape Town Health. Scaling up diagnosis and treatment of drug-resistant tuberculosis in Khayelitsha, South Africa: an integrated community-based approach. 2011.
18 World Health Organization. WHO policy on TB infection control in health-care facilities, congregate settings and households. Geneva, Switzerland: World Health Organization; 2009.
19 National Department of Health. The South African National Tuberculosis Control Programme: practical guidelines. Pretoria: National Department of Health; 2004.
20 Mc Carthy K, Mosendane T, Tellie M. Implementing TB infection control in health care facilities. Johannesburg: Wits Reproductive Health and HIV Institute; 2009.
21 Republic of South Africa. Occupational Diseases in Mines and Works Amendment Act (Act 208 of 1993).
22 Republic of South Africa. Compensation for Occupational Injuries and Diseases Act (Act 130 of 1993).
23 World Health Organization. The joint WHO ILO UNAIDS policy guidelines for improving health workers’ access to HIV and TB prevention, treatment and care services. Geneva, Switzerland: World Health Organization; 2010.
24 World Health Organization. WHO Three I›’s meeting. Intensified case finding, isoniazid preventive therapy and TB infection control for people living with HIV. Report of a Joint World Health Organization HIV/AIDS and TB Department meeting held on 2-4 April 2008; Geneva, Switzerland.
25 Albuquerque da Costa P, Trajman A, Carvalho de Queiroz Mello F, Goudinho S, Monteiro Vieira Silva MA, et al. Administrative measures for preventing Mycobacterium tuberculosis infection among healthcare workers in a teaching hospital in Rio de Janeiro, Brazil. J Hosp Infect. 2009;72(1):57-64
26 Dharmadhikari A, Mphahlele M, Stoltz A, Venter K, Mathebula R, Masotla T, et al. Surgical face masks worn by multidrug-resistant tuberculosis patients: Impact on infectivity of air on a hospital ward. Am J Respir Crit Care Med. 2012;185:1104-9.
27 Yassi A, Lockhart K, Copes R, Kerr M, Corbière M, Bryce E, et al. Determinants of healthcare workers’ compliance with infection control procedures. Healthc Q. 2007;10(1);44-52.
28 Kanjee Z, Catterick K, Moll AP, Amico KR, Friedland GH. Tuberculosis infection control in rural South Africa: Survey of knowledge, attitude and practice in hospital staff. J Hosp Infect. 2011;79(4);333-8.
29 Gilson L. Trust and the development of health care as a social institution. Soc Sci Med. 2003;56(7):1453-68.
30 Sissolak D, Marais F, Mehtar S. TB infection prevention and control experiences of South African nurses – A phenomenological study. BMC Public Health. 2011;11(1);262-84.
31 Abreu G, Gonzaalez JA, Gonzaalez E, Bouza I, Velaazquez A, Pérez T, et al. Cuba’s strategy for childhood tuberculosis control, 1995-2005. MEDICC Rev. 2011;13(3):29-34.
32 Fairall L, Zwarenstein M, Bateman E, Bachmann M, Lambard C, Majara B, et al. Effect of educational outreach to nurses on tuberculosis case detection and primary care of respiratory illness: Pragmatic cluster randomised controlled trial. BMJ. 2005;331;750-4.

Barriers to the implementation of TB infection control 16
SAHR 2012/13 203
33 Kanjee Z, Catterick K, Moll A, Amico K, Friedland G. Tuberculosis infection control in rural South Africa: survey of knowledge, attitude and practice in hospital staff. J Hosp Infect. 2011;79(4):333-338.
34 Farley JE, Tudor C, Mphahlele M, Franz K, Perrin NA, Dorman S, et al. A national infection control evaluation of drug-resistant tuberculosis hospitals in South Africa. Int J Tuberc Lung Dis. 2012;16(1); 82-9.
35 Cox H, Escombe R, McDermid C, Mtshemla Y, Spelman T, Azevedo V, et al. Wind-driven roof turbines: A novel way to improve ventilation for TB infection control in health facilities. PLoS One. 2012;7(1):e29589.

204 SAHR 2012/13

SAHR 2012/13 205
Health In
form
atio
n

SAHR 2012/13206
Health In
form
atio
n

Authors:
207SAHR 2012/13
17171717171717
Candy Dayi Andy Grayii
i Health Systems Trustii Division of Pharmacology, Discipline of Pharmaceutical Sciences, University of KwaZulu-Natal
Health and Related Indicators
Contents
Introduction 208Data sources and collection 211
Demographic indicators 212Socio-economic indicators 215Health status indicators 217
Mortality 217Disability 221Infectious disease 223
Malaria 225Tuberculosis 227HIV and AIDS 230
Reproductive health 235Contraception, sexual behaviour, sexually transmitted infections and termination of pregnancy 235Maternal health 239
Child health 242Child mortality 243Child health status and services 247Immunisation 249
Nutrition 250Non-communicable diseases 252Behaviour and awareness 255Injuries 257
Health services indicators 259Health facilities 259Health personnel 264
Health financing 272Private sector financing 272Public sector financing 272
Acknowledgements 275Appendices 276
Provincial maps 276Colour graphs and maps 291National Indicator Data Set (NIDS) indicators from April 2013 293
Indicators Definitions 310References 315

208 SAHR 2012/13
Introduction
The 2011 edition of the South African Health Review noted the historic release of the Green Paper on National Health Insurance (NHI) that year, and predicted that “accurate data on health status and health services [will] be necessary to inform the design of the NHI”.1 It also predicted ever sharper debates about the adequacy and accuracy of indicator data, as the process of finalising the White Paper progressed. Specifically, the 2011 Indicator chapter noted that the extent to which private sector data were integrated with those generated in the public sector would be critical, as the NHI would need to harness the resources of both sectors. While such debates have continued, 2012 saw a more inward focus, one clearly located in the growing influence of the Negotiated Service Delivery Agreements (NSDA). However, health workers in the public sector could be forgiven for feeling like Coleridge’s Ancient Mariner, who cried
“Water, water, everywhere,And all the boards did shrink;Water, water, everywhere,Nor any drop to drink”.
They are surrounded by a plethora of strategic goals, targets and measures, global, national, provincial and, perhaps, even at district level. In the absence of the means to make significant changes to service quality and delivery, such targets can be meaningless exhortations, trotted out as rote recitations without meaning or impact. Nonetheless, human nature ensures that what is measured is valued, and at the very least the potential for improvement has to be welcomed.
In 2011, the Health Data Advisory and Coordination Committee (HDACC) had been tasked with “i) improving the quality and integrity of data on health outcomes, ii) establishing consensus among research experts from various academic institutions, research institutions and government departments on indicators and indicator values, identification of reliable empirical data sources to be used to monitor these indicators as well as mechanisms to improve data systems, and iii) advising on baseline values and targets for NSDA for the 2010-2014 period”.2 One of the key developments in this area will be the production of officially-sanctioned Annual Health Statistics, compiled on behalf of the National Department of Health by a team from Health Systems Trust, Medical Research Council and the University of Cape Town. The first edition is expected to be issued in early 2013.
At a government-wide level, the Medium Term Strategic Framework (MTSF) for 2009-2014 included an overarching outcome of “a long and healthy life for all South Africans”. The health-sector-wide NSDA, which sets out the Minister of Health’s Performance Agreement with the President of the Republic, has four specific outputs:
➢ increased life expectancy;
➢ reduction in maternal and child mortality rates;
➢ combating HIV and AIDS and decreasing the burden of disease from tuberculosis; and
➢ strengthening health systems effectiveness.
South Africa has also committed to the Millennium Development Goals (MDGs), for which the relevant health-related targets for the country are:
➢ a maternal mortality ratio of 38 per 100 000 live births;
➢ an infant mortality rate of 18 per 1 000 live births;
➢ an under-five mortality rate of 20 per 1 000; and
➢ life expectancy at birth of 70 years.
The corresponding baselines agreed to by HDACC were a maternal mortality ratio of 310 per 100 000 live births (for 2008), an infant mortality rate of 40 per 1 000 live births (2009), under-five mortality rate of 56 per 1 000 live births (2009) and life expectancy at birth of 54 years for males and 59 years for females (2009). These figures were therefore included in the NDoH Annual Performance Plan 2012/13-2014/15.3 Another set of obligations was listed in the form of the 10 Point Plan 2009-2014, for which an update of progress was included in the Annual Performance Plan. However, specific to the NSDA, the following targets were set for 2014/15:
➢ increasing life expectancy to 56 years for males and 61 years for females;
➢ decreasing the maternal mortality ratio to 270 per 100 000 live births;
➢ decreasing the child mortality rate to 50 per 1 000 live births;
➢ improving the TB success rate from a baseline of 73.9% (2009) to 85%; and
➢ increasing the total number of patients on antiretroviral treatment (ART) from a baseline of 1.1 million (2009) to 2.5 million.3
The Annual Performance Plan included broadly-stated sub-outputs for each of the four NSDA performance areas. Detailed sets of indicators for each performance area had been provided in the 2011 HDACC report, specifying the source of the data, the agency responsible for its collection and the frequency of such collection, as well as the baselines (2009) and targets (2014). The National Indicator Data Set (NIDS), which specifies the data elements to be collected by the routine data collection systems of all provinces, was revised during 2012 and will be implemented from the 2013/14 financial year. The approved NIDS requires the collection of data for 101 routine monthly indicators at facility level, covering child health (11 indicators), chronic conditions (12), the immunisation programme (15), HIV (8), the management of inpatients (5), management of PHC services (8), maternal and women’s health (27), nutrition (4), oral health (3), service quality (2) and TB (6). In addition, there are 48 quarterly indicators at facility level, which cover the ART programme, TB and service quality. Seven data elements provide ‘count indicators’ for ART and HIV. Lastly, another 52 indicators are collected on a monthly basis in relation to non-facility programmes, including Environmental Health Services (14), Emergency Medical Services (8), the Integrated School Health Programme (15, of which 4 will be reported nationally) and Ward-based Outreach Teams (15, of which 7 will be reported nationally).The list of indicators is given in the appendix: National Indicator Data Set (NIDS) indicators from April 2013.

Health and Related Indicators 17
SAHR 2012/13 209
However, 2012 also saw the approval of the National Development Plan (Vision for 2030), prepared by the National Planning Commission in 2011.4 The health-related targets in this document were:
➢ “By 2030, life expectancy should reach at least 70 for both men and women.
➢ The under-20 age group should largely be an HIV-free generation.
➢ The infant mortality rate should decline from 43 to 20 per 1 000 live births and the under-five mortality rate should be less than 30 per 1 000, from 104 today.
➢ Maternal mortality should decline from 500 to 100 per 100 000 live births.
➢ All HIV-positive people should be on treatment and preventive measures such as condoms and microbicides should be widely available, especially to young people.
➢ Reduce non-communicable diseases by 28 per cent and deaths from drug abuse, road accidents and violence by 50 per cent.
➢ Everyone has access to an equal standard of basic health care regardless of their income.”
The National Development Plan also included actions under the broad headings of addressing the social determinants of health, reducing the burden of disease, building human resources for the health sector, strengthening the national health system and implementing National Health Insurance. It was suggested that the health authorities set mid-term targets for the 2030 objectives, and in some cases examples of indicators were provided. An example for TB was the suggestion to track the “number of latently infected people receiving six months isoniazid treatment”.
Globally, Davis and colleagues have pointed to the increasing use of indicators in a wide variety of fields, and in particular those that have been ‘named’ and thus gained legitimacy and currency.5 Examples included the United Nations MDG indicators, the Human Development Index (HDI) produced by the United Nations Development Program, as well as Transparency International’s Corruption Perceptions Index. Such indicators may have pervasive power to influence decision-making at global and local levels. As Davis et al. put it: “Each indicator set bolsters a particular view of development with a combination of scientific authority and organizational strength.” These authors have offered a useful definition of such an indicator: “An indicator is a named collection of rank-ordered data that purports to represent the past or projected performance of different units. The data are generated through a process that simplifies raw data about a complex social phenomenon. The data, in this simplified and processed form, are capable of being used to compare particular units of analysis (such as countries, institutions, or corporations), synchronically or over time, and to evaluate their performance by reference to one or more standards.” The issue of ‘simplification’ is worth considering, but so is what Davis et al. refer to as the “ordinal structure enabling comparison and ranking and exerting pressure for ‘improvement’ as measured by the indicator”. An example is a study by Olafsdottir et al. that sought to examine the relationship between governance and health systems performance.6 The study used the under-five mortality rate (U5MR) as the health outcome measure, the ratio of U5MR in the wealthiest and poorest quintiles as the measure
of health equity, and two indices developed by the Mo Ibrahim Foundation as the governance measures. After controlling for possible confounders, such as finance, education, and water and sanitation, governance (as measured by the chosen indices) was significantly associated with U5MR, but not with equity in U5MR outcomes. The authors concluded that “the quality of governance may be an important structural determinant of health systems performance, and could be an indicator to be monitored”.
Recognising that the MDGs have been a positive force and have “help[ed] to promote global awareness, political accountability, improved metrics, social feedback, and public pressures”, Sachs has backed the call for post-2015 Sustainable Development Goals (SDGs). He has proposed the following major components, in “three broad categories of economic development, environmental sustainability, and social inclusion:
➢ SDG 1: by 2030, if not earlier, all the world’s people will have access to safe and sustainable water and sanitation, adequate nutrition, primary health services, and basic infrastructure, including electricity, roads, and connectivity to the global information network.
➢ SDG 2: from 2015 to 2030, all nations will adopt economic strategies that increasingly build on sustainable best-practice technologies, appropriate market incentives, and individual responsibility.
➢ SDG 3: every country will promote the wellbeing and capabilities of all their citizens, enabling all citizens to reach their potential, irrespective of class, gender, ethnic origin, religion, or race.
➢ SDG 4: governments at all levels will cooperate to promote sustainable development worldwide.”7
A World Health Organization (WHO) discussion paper on the post-2015 agenda has suggested using the movement towards Universal Health Coverage (UHC) as the animating force to guide the post-MDG agenda. Universal health coverage includes reducing the gap between need and use of services; improving quality of care so that services are effective; and assuring financial risk protection so that people are not impoverished as a consequence of paying for health services. An increase in life expectancy (as a summary measure of mortality at all ages and for all causes) has been proposed as an indicator and outcome of progress towards UHC.8
A discussion document issued in December 2012 acknowledged that fundamental questions remain about how to formally define and measure health coverage, and the authors proposed an economic model that could serve as a basis for developing an operational index of coverage.9
A concrete example of using the MDGs to track progress was provided by the 2012 update to the 2009 Lancet South Africa Series.10 Positive developments were noted in respect of the prevention of mother-to-child transmission of HIV and reduction in child mortality (but not neonatal mortality), as well as access to ART for pregnant women (but not in relation to antenatal HIV prevalence). While little change was noted in mortality from non-communicable diseases, a slight decrease in mortality from injuries was documented. In addition, this report also included a series of 10 targets for non-communicable diseases, taken from the South African Declaration on the Prevention and Control of Non-Communicable Diseases,11 as follows:

210 SAHR 2012/13
➢ “Reduce premature deaths (i.e. <60 years) from non-communicable disease by 25%
➢ Reduce tobacco use by 20%
➢ Reduce per head consumption of alcohol by 20%
➢ Reduce mean salt intake to less than 5g/day
➢ Reduce prevalence of obesity and overweight by 10%
➢ Increase prevalence of physical activity (defined as 150 min of moderate-intensity physical activity per week) by 10%
➢ Reduce prevalence of hypertension by 20% through lifestyle modification and medication
➢ Increase proportion of people receiving treatment for control of hypertension, diabetes, and asthma by 30%
➢ Offer screening to women with sexually transmitted diseases for cervical cancer at least once every 5 years, or to every woman at least three times in a lifetime
➢ Increase number of people screened and treated for mental illness by 30% (by 2030).”
In his commentary on the Lancet article, the Minister noted that “[t]here have been a range of successes in the past 3 years”.12 He cited, as the “most important”, the “increase in life expectancy from 56.5 to 60 years, and the decreases in child mortality from 56 to 40 per 1 000 children and in infant mortality from 40 to 30 per 1 000 infants”.
The non-communicable disease targets were also mentioned in the Annual Performance Plan.3 Thus, for example, for the Primary Health Care (PHC) Programme, a performance indicator is the number of districts implementing the Chronic Care Model (with a final target of 10 districts by 2014/15). However, other programmes may also include extensive sets of indicators and targets. A notable example is the National Strategic Plan for HIV and AIDS, STIs and TB, 2012-2016.13
Short Fabic et al.14 have reviewed the extent to which the data from Demographic and Health Surveys conducted in more than 80 countries have been utilised in research and have shown a steady increase in the number of peer-reviewed publications over time, claiming that these “have made a substantial contribution to the public health evidence base in developing countries”. It is therefore notable that there are no plans to repeat the South Africa Demographic and Health Survey, last conducted in 2003.15 Instead, the Annual Performance Plan notes the commitment to two different surveys: SABSSM4 and SANHANES. Both of these surveys are to be co-funded by the National Department of Health, but conducted primarily by the Human Sciences Research Council (HSRC), in collaboration with the Medical Research Council (MRC) and external partners. The South African National HIV, Behaviour and Health Survey 2012 (SABSSM4) is the fourth in a series, following surveys in 2002, 2005 and 2008. Fieldwork was intended to be complete by June 2012. The aim was to reach up to 15 000 households and 40 000 individuals, and to gather data on demographic and health indicators (including fertility, morbidity and mortality), health status, the use and access to child health, maternal health and general health services, HIV infection and sexual behaviour (including the proportion of circumcised males), and infant feeding practices. Estimates of infant, under-five and maternal mortality rates as well as current fertility trends were
planned. The first South African National Health and Nutrition Examination Survey (SANHANES-1) was planned for 2011-2012 and fieldwork started in 2012. Importantly, SANHANES is planned to have both cross-sectional and longitudinal components. The cross-sectional component is designed to provide representative data at the provincial level. Using a multi-stage disproportionate, stratified cluster sampling approach, a sample of 10 000 households will be selected (20 valid, occupied households from each of 500 Enumerator Areas (EA), representative of the socio-demographic profile of South Africa, based on the 2007 HSRC Master Sample). The longitudinal component will be addressed by recruiting a prospective cohort of 5 000 households to be followed up over time. Critically, in contrast to the self-reported data relied on for the General Household Survey, SANHANES will obtain questionnaire-based data as well as health measurements though clinical examination and the collection of blood specimens using mobile clinics. The overall objective is therefore to “generate information on the prevalence of specific diseases, together with the social determinants/drivers associated with the disease(s), nutritional status of South Africans as well as health promotion and disease prevention”.16
The specific objectives of SANHANES-1 are:
➢ “To evaluate the health status of South Africans with respect to the prevalence of non-communicable diseases (specifically cardiovascular disease, diabetes and hypertension) and their risk factors (diet, physical activity and tobacco use).
➢ To evaluate the knowledge, attitudes and behaviour of South Africans with respect to respect to non‐communicable and communicable infectious diseases.
➢ To evaluate the nutritional status of South Africans as an outcome of food security, dietary intake/behaviour including the consumption of alcohol, and body weight management.
➢ To evaluate South Africans’ general perceptions of health and healthcare services.
➢ To evaluate the health status of children under the age of 5 years with respect to early childhood development, breastfeeding, care of illness, immunisation and the use of the road to health booklet.
➢ To evaluate the health status of children between 2-9 years with respect to physical and/or mental disabilities.
➢ To determine the behavioural and social aspects of health of South Africans in terms of smoking, dietary quality and physical inactivity as well as household composition and amenities, level of education, age, gender, race, socio-economic status and geotype, and relate these to the health and nutritional status of the South African population.”
Important new data on socio-economic status is being generated from the National Income Dynamics Study (NiDS), which was first mooted in 2006. This study, conducted on behalf of the Presidency by the Southern Africa Labour and Development Research Unit (SALDRU) at the University of Cape Town, planned to follow a cohort of about 28 000 people (originally 7 305 households) over time. The ‘first wave’ was documented in 2008, with subsequent ‘waves’ planned every two years. NiDS aimed to “document the dynamic structure of a sample of household members in South Africa and changes in their incomes, expenditures, assets, access

Health and Related Indicators 17
SAHR 2012/13 211
to services, education, health and other dimensions of well-being”.17 Importantly, as members of these households moved out to set up their own households or returned, they would not be lost, but would be followed in subsequent ‘waves’. Wave 2 was conducted in 2010 and reported in 2012.18
As always, important lessons can be learned from the narrow, focused study, as well as from the wide, national-level survey. For instance, Mphatswe and colleagues conducted an intervention study in 58 antenatal clinics and 20 delivery wards in KwaZulu-Natal that provided prevention of mother-to-child prevention (PMTCT) services and reported data to the District Health Information System (DHIS).19 Data completeness increased from 26% before to 64% after the intervention, while data accuracy increased from 37% to 65%. Overall, the correlation between data in the information system and those from facility registers rose from 0.54 to 0.92. The important lesson here relates not just to the effectiveness of a simple intervention (involving training and feedback, monthly data reviews and data audits at facilities), but to the abysmal levels of data completeness and accuracy at baseline.
Lastly, in any country, the completion of a national Census provides fresh impetus to any accounting of the status of its citizens. While only the first statistical releases from Census 2011 have been published, amidst much controversy, the impact of new population estimates on any indicators that use such figures (as denominators, for instance) will be profound.20
In summary, there is no lack of targets, nor any lack of apparent political commitment to reach those targets. Whether there are adequate systems in place to measure progress towards the attainment of such targets with any degree of accuracy is quite another matter. Whether any significant progress has been made in integrating national health information systems, particularly across the persistent public-private gap, also remains in question. Such data will be crucial to tracking progress in relation to Universal Health Coverage. Nonetheless, there are an increasing number of sources, including planned large surveys, as well as planned longitudinal approaches, which promise new and exciting data.
Data sources and collection
As before, while this chapter attempts to identify most of the key international and national data sources and literature on a range of health indicators, it cannot claim to be exhaustive. Although known issues of data quality or interpretation are highlighted where possible, it is not possible in such a broad chapter to verify, adjust and correct every data source in detail. The reader is advised to be cautious about which types of indicators are presented and whether their use is suitable for the intended purpose. The data provided in this chapter are only a sub-set of those available. More data, particularly those showing trends over time, are stored in the Health Statistics Database, which can be accessed on the Health Systems Trust (HST) website (www.hst.org.za). In addition, a substantial set of district-level data are presented in the District Health Barometer reports, which can also be accessed from the HST website. Most importantly, detailed district- and local municipality-level data will also be issued in the form of the Annual Health Statistics publication, the first edition of which is expected in early 2013. This publication will provide data showing trends in population demography, morbidity and mortality patterns, financial and human resources and progress in relation to service
delivery, but focused on the public health sector. The indicators used in the Annual Health Statistics publication were collected from different sources, including routinely collected data, surveillance data and periodic surveys. In this chapter, in contrast, data are primarily disaggregated by province and ethnic group. Where data or maps are provided showing district-level details, these have followed the Municipal Demarcation Board’s determinations which came into effect with the municipal elections in May 2011. Some of the most important changes made at this time were the incorporation of all district-managed areas into districts, the creation of two new metropolitan municipalities (Buffalo City in the Eastern Cape and Mangaung in the Free State), the transfer of Mbizana Local Municipality and Ntabankulu Local Municipality from OR Tambo District to Alfred Nzo District in the Eastern Cape, and the incorporation of Metsweding Local Municipality into the Tshwane metro in Gauteng.
Indicator definitions: The definitions of all indicators appearing in the tables are given at the end of the chapter on page 310.
Trends and time-series: For most indicators data are given for several years, often from multiple different sources. In most cases these data can thus not be used to assess trends and changes over time due to possible differences in methodology and data presentation issues. Even data from regular surveys may not be comparable over time, or revised data for a historical time series may be released, as for example with the General Household Surveys and mid-year population estimates. This may result in different values being published compared to previous editions. Therefore, when using time series data, the most recent revisions should be obtained from the online database and not from previous printed editions of this chapter.

212 SAHR 2012/13
Demographic indicators
Context Demographic indicators are critical input variables for many other indicators, as they provide denominator data over time. In order to monitor progress towards equity, South Africa still tracks ethnic differences, using four self-attributed categories (African, Coloured, Indian, and White). These categories are thus used to show data that are available by ethnic group.
New data sources Some of the key new sources of national data included in this section are:
• StatsSA Census 2011 – various statistical reports
• StatsSA General Household Survey (GHS) 2011
• StatsSA Recorded Live Births 2011
Internationally:
• Population Reference Bureau World Population Data Sheet 2012
• United Nations Population Fund (UNFP) State of the World Population 2012
Key issues and trends ➢ StatsSA 2012 mid-year population estimates were delayed in order to incorporate findings from the Census, and will resume with the 2013 estimates.
➢ Although some results from Census 2011 were released in late 2012, small-area population estimates have not yet been incorporated into the denominators used for indicator calculations. At the provincial level, the mid-year estimates have also continued to be used. The same approach is expected to be followed in the first edition of the Annual Health Statistics publication.
Some results from Census 2011 were released in late 2012. A new total population estimate of 51 770 560 for the entire country was issued. In provincial terms, Gauteng (population 12 272 263) was reported to have overtaken KwaZulu-Natal (10 267 300) as the most populous.
In 2012, the UNFP’s State of the World Population 2012 report focused on the issues of access to modern family planning options and the extent to which women’s rights in this regard are being met globally.21 Estimates of fertility will be among the most contested elements of the Census 2011 results, once these are released.20 Already, serious concerns have been raised about the accuracy and validity of the demographic data that have been reported.22 In particular, questions have been asked about the relative sizes of the 0-4 year group and the 5-9 year group in the national population pyramid, and what this implies about changes in fertility over time. In terms of available vital registration data, StatsSA has reported that, by their estimate, the level of completeness of birth registration within the year of birth has improved consistently, from 47.9% in 2002 to 85.9% in 2011.23 Including late registration, the total number of births registered has fluctuated between 2008 and 2011. The total number of births registered in 2011 (1 202 377) declined by 7.1% from that registered in 2010 (1 294 694). This was in contrast to the steady increase in total registered births between 1992 (501 461) and 2003 (1 677 415), and the steady decline from 2004 (1 475 809) to 2007 (1 199 712). Of note, in 2011, 67.5% of submitted Notice of Birth forms (DHA-24) omitted mention of the father’s details. The accepted viewpoint is that South Africa has seen a rapid decline in total fertility since 1960, and that this has been the largest recorded decline on the African continent. Rossouw and colleagues from Stellenbosch have used data from Wave 1 (2008) of the National Income Dynamics Study (NiDS) to explore potential contributory factors to this decline.24 While attributing much of the decline to improved education levels and the lower prevalence of marriage, these authors have also noted that other factors may also be at play, including the influence of HIV/AIDS, increased use of contraceptives and “changes in intra-household relationships and the social role of women”. Total fertility
rates reported for South Africa (2.4) can be benchmarked against those reported by the Population Reference Bureau.25 The country with the highest total fertility rate (TFR) was Niger (7.1), with only one country in the top 10 being from outside Africa (Afghanistan; 6.2). The lowest TFR was recorded in Taiwan and Latvia (both 1.1), followed by Singapore, Bosnia-Herzegovina, South Korea and Hungary (all 1.2).
As attention is focused on non-communicable diseases, so the proportion of the population that is middle-aged and older becomes more important. While traditionally, an ageing population is associated with developed nations, it has been pointed out that the “developing world is going grey”.26 It is predicted that 80% of the 2 billion elderly people predicted for 2050 will be living in developing countries. South Africa is one of six countries (together with China, Ghana, India, Mexico, and Russia) contributing to the WHO Study on Global AGEing and Adult Health (SAGE).27 Baseline data for this survey were obtained from the 2002-2004 World Health Survey, the instruments were piloted in three countries in 2005, and Wave 1 was conducted in the six target countries between 2007 and 2010. Subsequent waves were planned for 2012 and 2014. Some Wave 1 data for South Africa have been reported.28 At a local level, some insights into the potential health implications of ageing have been explored using the Agincourt Health and Demographic Surveillance System.29-31 As part of the SAGE effort, all those aged 50 years and older were assessed during the 2006 annual census. In this rural setting, of a group with a mean age of 66.6 years, 75.2% were women, 45.6% were in a current partnership, and 65.8% had no formal education. Factors associated with poor health were age, female gender, not being in a current partnership, lack of education and unemployment.

Health and Related Indicators 17
SAHR 2012/13 213
Table 1: Demographic indicators by province
EC FS GP KZN LP MP NC NW WC SA RefAge dependency ratio1996 83.5 56.4 42.0 68.2 92.4 68.3 62.3 63.5 52.4 64.4 a
2001 75.7 55.4 38.1 64.8 81.8 64.6 56.4 57.0 48.2 58.7 b
2011 Census 66.0 52.8 38.9 58.4 67.3 56.0 55.7 52.2 44.9 52.6 c
Ageing index2001 13 12 12 10 10 9 13 12 14 11 d
2011 18 17 17 13 15 13 20 16 21 16 d
2011 Census 20 19 18 15 18 15 19 19 23 18 e
Annual population growth rate2001 1996-2001 0.42 0.55 3.62 2.23 1.75 1.49 -0.40 1.80 2.68 1.99 f
2010 - - - - - - - - - 1.10 g
2011 2001-2011 0.44 0.14 2.68 0.69 0.79 1.83 1.44 1.62 2.52 1.44 f
Area (square km)2011 168 966 129 825 18 178 94 361 125 754 76 495 372 889 104 882 129 462 1 220 813 c
Area as a % of total area of South Africa2011 13.8 10.6 1.4 7.7 10.3 6.3 30.5 8.7 10.6 100.0 c
Average household size1996 4.6 4.1 3.7 5.0 4.9 4.6 4.3 4.6 3.9 4.4 h
2001 4.1 3.6 3.2 4.2 4.3 4.0 3.8 3.7 3.6 3.8 i
2007 CS 4.1 3.5 3.3 4.6 4.3 3.9 4.0 3.7 3.8 3.9 j
2011 Census 3.7 3.2 3.0 3.9 3.7 3.7 3.7 3.2 3.4 3.4 k
Crude death rate (deaths per 1 000 population)2001 StatsSA - - - - - - - - - 11.9 l
2011 StatsSA - - - - - - - - - 11.7 l
Population2001 Census 6 436 763 2 706 775 8 837 178 9 426 017 5 273 642 3 122 990 822 727 3 669 349 4 524 335 44 819 778 m
2007 CS 6 527 746 2 773 066 10 451 709 10 259 230 5 238 286 3 643 435 1 058 057 3 271 946 5 278 591 48 502 066 j
2011 Census 6 562 053 2 745 590 12 272 263 10 267 300 5 404 868 4 039 939 1 145 861 3 509 953 5 822 734 51 770 561 c
2011 mid-year 6 829 959 2 759 644 11 328 203 10 819 128 5 554 657 3 657 181 1 096 731 3 253 390 5 287 863 50 586 757 n
2011 DHIS 6 654 852 2 930 369 10 929 388 10 622 198 5 261 983 3 661 839 1 158 080 3 497 832 5 553 968 50 270 509 o
2012 DHIS 6 671 956 2 941 267 11 091 033 10 703 919 5 282 562 3 689 833 1 162 538 3 519 130 5 641 880 50 704 118 o
Population % by province2001 Census 14.4 6.0 19.7 21.0 11.8 7.0 1.8 8.2 10.1 100.0 i
2007 CS 13.5 5.7 21.5 21.2 10.8 7.5 2.2 6.7 10.9 100.0 j
2011 Census 12.7 5.3 23.7 19.8 10.4 7.8 2.2 6.8 11.2 100.0 c
2011 mid-year 13.5 5.5 22.4 21.4 11.0 7.2 2.2 6.4 10.5 100.0 n
Population % composition2001 60+ years 9.2 7.3 6.2 6.9 7.7 6.3 8.2 7.3 7.8 7.3 i
2001 <15 years 36.8 30.7 23.6 34.7 39.4 35.0 30.6 31.3 27.3 32.1 i
2001 female 53.8 52.1 49.7 53.2 54.6 52.1 50.4 51.2 51.5 52.2 i
2007 60+ years 9.6 8.0 6.9 7.1 8.5 6.5 9.0 7.6 8.6 7.8 j
2007 <15 years 35.6 28.8 25.4 33.5 37.0 33.5 28.7 30.2 26.3 31.0 j
2007 female 52.9 51.6 50.3 52.5 53.8 51.4 50.9 49.7 51.3 51.7 j
2011 60+ 9.7 8.3 6.8 7.6 8.6 7.0 8.5 8.3 8.9 8.0 c
2011 <15 years 33.0 29.1 23.7 31.9 33.9 31.2 30.1 29.6 25.1 29.1 c
2011 female 52.9 51.6 49.5 52.5 53.3 51.1 50.7 49.3 50.9 51.3 c
Population density (people per km2)1996 38.4 21.0 448.4 95.1 41.7 36.7 2.3 29.9 31.5 34.4 h
2007 40.6 22.8 572.3 108.5 44.0 44.5 3.0 29.2 37.4 39.2 p
2011 40.4 21.3 623.2 114.7 44.2 47.8 2.9 31.0 40.8 41.4 r
2011 Census 38.8 21.1 675.1 108.8 43.0 52.8 3.1 33.5 45.0 42.4 c
Public sector dependent population2011 non med scheme 6 115 191 2 362 732 8 239 778 9 509 917 5 118 266 3 074 542 915 048 2 751 901 3 981 410 42 060 348 r
2012 GHS 5 931 369 2 441 252 8 440 276 9 387 337 4 902 218 3 158 497 1 011 408 3 040 528 4 225 768 42 540 755 s
Total fertility rate1996 3.5 2.8 2.4 3.1 3.6 3.2 2.7 2.8 2.4 - t
1998 SADHS 3.5 2.2 2.3 3.3 3.9 3.1 2.7 2.4 2.3 2.9 u
2001 CARe 3.3 2.5 2.4 3.0 3.6 3.1 2.4 2.8 2.4 2.8 v
2006 CS 3.0 2.7 2.2 3.0 3.5 3.0 2.8 3.0 2.1 2.8 w
2006 NiDS - - - - - - - - - 2.8 x

214 SAHR 2012/13
EC FS GP KZN LP MP NC NW WC SA Ref2006 StatsSA - - - - - - - - - 2.6 y
2011 StatsSA - - - - - - - - - 2.4 n
Reference notes (indicator definitions from page 310 and references from page 315)
a Census 1996.32 Calculated.b Census 2001.33 Calculation reported in Joubert J, Bradshaw D. Health
of Older Persons. In: Ijumba P, Day C, Ntuli A, editors. South African Health Review 2003/04.
c Census 2011.20 Census in Brief.d StatsSA Mid-year estimates.34 Calculated from source.e Census 2011.20 Calculated.f Census 2011.20 1996-2001 and 2001-2011. Per cent per annum. As
recorded in Census 2011 Municipal Fact Sheet.g StatsSA Mid-year estimates. For 2010-2011. 2011 mid-year estimates.h Census 1996.32
i Census 2001.33
j Community Survey 2007.35
k Census 2011.20 Statistical release P0301.4l StatsSA Mid-year estimates.34 2011 mid-year estimates. CDR
assumption used in population projections.m Census 2001.33 Preliminary independent demographic analyses of this
report suggest that the final figures probably reflect: an underestimate of children under the age of 5; an overestimate of children aged between 10 and 19; an underestimate of men relative to women; an underestimate of the white population. Data source also includes other tables with more levels of disaggregation than are shown here.
n StatsSA Mid-year estimates.34 2011 mid-year estimates.o DHIS Population Estimates.p StatsSA Mid-year estimates.34 Calculated from 2007 mid-year
estimates and provincial areas from Municipal Demarcation Board 2006.
q StatsSA Mid-year estimates.34 Calculated from Municipal Boundaries of South Africa GIS dataset received 2009-10-15 and latest StatsSA mid-year population estimates.
r Medical Schemes 2011-12.36 Calculated from total number of beneficiaries subtracted from total population (Stats SA mid-year estimates 2011).
s StatsSA GHS 2011.37 Calculated using provincial medical scheme coverage (GHS 2011) and National DoH/HISP Population Estimates for 2012.
t SAHR 2000 Ch4.38 Based on 1996 Census. Quoting Dorrington R, Nannan N, Bradshaw D. Current fertility rates in South Africa: 1996 Census revisited. (Submitted to) Southern African Journal of Demography 2000.
u SADHS 1998.39 The 1998 national TFR is considered to be an under-estimate. The real figure is considered to be about 3.2 (see Udjo EO, Lestrade-Jefferis J. Fertility and mortality in South Africa. (on request from StatsSA)) Differences between subgroups show that fertility rates are correlated with education level, urban/rural residence, province and population group. Table 11 pg 19.
v CARe Fertility.40
w CS Fertility 2007.41
x NiDS Demography Wave 1.42 Rates are estimated for the three year period preceding the survey. The indicated fertility rates for Whites and Indians are implausibly high from this survey, possibly due to the small sample size for these groups and issues with the weighting procedures.
y StatsSA Mid-year estimates.34 2010 mid-year estimates.
Table 2: Demographic indicators by ethnic group
African Coloured Indian White Other All RefAgeing index2001 8 12 19 51 - 11 a
2011 12 16 31 77 - 16 a
2011 Census 14 17 34 84 23 18 b
Population2001 Census 35 416 166 3 994 505 1 115 467 4 293 640 - 44 819 778 c
2007 CS 38 255 162 4 375 528 1 244 632 4 626 744 - 48 502 066 d
2011 Census 41 000 938 4 615 401 1 286 930 4 586 838 280 454 51 770 561 e
2011 mid-year 40 206 275 4 539 790 1 274 867 4 565 825 - 50 586 757 f
Population % by ethnic group2001 Census 79.0 8.9 2.5 9.6 - 100.0 g
2007 CS 78.9 9.0 2.6 9.5 - 100.0 d
2011 Census 79.2 8.9 2.5 8.9 0.5 100.0 e
2011 mid-year 79.5 9.0 2.5 9.0 - 100.0 f
Reference notes (indicator definitions from page 310 and references from page 315)
a StatsSA Mid-year estimates.34 Calculated from source.b Census 2011.20 Calculated.c Census 2001.33 Preliminary independent demographic analyses of this
report suggest that the final figures probably reflect an underestimate of the White population.
d Community Survey 2007.35
e Census 2011.20 Census in brief.f StatsSA Mid-year estimates.34 2011 mid-year estimates.g Census 2001.33
Health and Related Indicators 17
SAHR 2012/13 215
Socio-economic indicators
Context A number of key socio-economic indicators were among the early data released from the Census 2011. Some of these, such as measures of access to piped water and safe sanitation, and type of energy source, reflect important social determinants of health. Over time, trends in such measures are important indications of the effectiveness of social spending and infrastructure development.
New data sources Nationally, new data have been reported in the:
• StatsSA Census 2011
• StatsSA General Household Survey (GHS) 2011
• StatsSA Social profile of vulnerable groups in South Africa: 2002-2011
• StatsSA Quarterly Labour Force surveys
• National Income Dynamics Study Wave 1 and Wave 2
• StatsSA Labour Market Dynamics in South Africa 2011
• Blue Drop 2012 report on drinking water quality management
• Green Drop 2012 report on waste water management
Internationally, reports of interest include:
• UNICEF Progress on Drinking Water and Sanitation: 2012 Update
Key issues and trends Although progress in relation to access to piped water and sanitation services has been shown in both annual surveys and the Census 2011, the quality of such services is under increasing pressure. Unemployment remains unacceptably high and significant numbers of South Africans can be termed as belonging to vulnerable groups.
The General Household Survey 2011 showed that only 53.6% of households were living in dwellings that were fully owned, with the remainder partially owned, rented or having some other tenure arrangement.37 It also showed that 15.3% of households were living in ‘RDP’ or state-subsidised housing and that 12.1% of households were living in informal housing. Although access to electrical power was relatively high on a national basis (82.7%), 47.2% of households in Limpopo and 36.0% of households in the Eastern Cape still relied on wood or paraffin for cooking. Likewise, while nationally 89.5% of households had access to piped water, this figure was only 56.8% in the Eastern Cape. The proportion of households that had no access to sanitation or relied on the bucket system was still high in the Eastern Cape (17.0%), Limpopo (7.9%) and Northern Cape (7.6%). Results for the same measures were also reported for the national and provincial levels in the preliminary results from Census 2011.20 For example, 84.7% of households were reported to have access to electric lighting, 46.3% to piped water inside the dwelling and 60.1% to flush toilets. Ownership of household assets such as refrigerators had increased from 2001 (51.2%) to 2011 (68.4%), but the most dramatic change was in access to a cellular telephone (from 32.3% to 88.9%).
Based on data from successive General Household Surveys, StatsSA issued the third in a series of reports on the social profile of vulnerable groups in South Africa in 2012.43 The groups described were children, youth, women and the elderly. Also based on the same surveys, Ataguba et al. demonstrated the existence of socio-economic gradients in self-reported ill-health in South Africa.44 Put simply, this showed that the “burden of the major categories of ill-health and disability is greater among lower than higher socio-economic groups”. Although there were only limited data on two non-communicable diseases (diabetes and hypertension), it appeared that these conditions were becoming more evenly distributed over time. Importantly, this means that they cannot simply be dismissed as diseases of affluence.
Measures of access to piped water or sanitation methods do not, of course, necessarily reflect adequate quality of such services. In this regard, the 2012 updates to the reports from the Department of Water Affairs on drinking water quality management (Blue Drop 2012)45 and waste water management (Green Drop 2012)46 are important. In this regard, Wright et al. used data from General Household Surveys from 2002 to 2009 and detected an increasing (albeit small) proportion of those using in-house, piped supplies who believed their water was ‘unsafe’.47 They acknowledged though that since “consumer perception of drinking water safety seems largely dependent on the organoleptic properties of water supplies”, public opinion may not be altered by the release of water quality reports such as the Blue Drop reports. Globally, the UNICEF report Progress on Drinking Water and Sanitation – has provided an update on progress at a national level.48 Although the MDG drinking water target has been reached (in that the proportion of the global population still using unimproved water sources had declined from 24% in 1990 to 11% in 2012) and over 2 billion people had gained access to improved water sources, there was still evidence of marked disparities. Importantly though, the limitations of relying on the proxy measure of ‘improved methods’ which may not be ‘safe’ were noted.

216 SAHR 2012/13
Table 3: Socio-economic indicators by province
EC FS GP KZN LP MP NC NW WC SA RefDrinking Water System (Blue Drop) Performance Rating2010 79.4 48.5 85.5 65.9 55.0 65.4 46.9 66.0 92.5 67.2 a
2011 77.3 64.1 95.1 80.5 64.0 56.5 62.1 62.3 94.1 72.9 a
2012 82.1 73.6 98.1 92.1 79.4 60.9 68.2 78.7 94.2 87.6 b
Education level: percentage of population 20 years and older with no schooling2001 Census 22.8 16.0 8.4 21.9 33.4 27.5 18.2 19.9 5.7 17.9 c
2007 CS - - - - - - - - - 10.3 d
2011 Census 10.5 7.1 3.6 10.7 17.3 14.0 11.3 11.8 2.7 8.6 e
2011 no schooling 7.4 5.7 2.6 7.8 12.9 10.3 11.3 10.0 1.7 6.5 f
Percentage of households by type of housing2001 formal 47.3 62.9 65.6 56.6 70.7 67.3 80.2 68.6 78.4 63.8 c
2001 informal 11.0 26.1 23.9 10.8 6.6 16.0 12.5 22.3 16.2 16.4 c
2001 other 3.6 3.8 9.2 4.7 3.0 3.8 3.8 3.8 3.2 5.0 c
2001 traditional 38.1 7.2 1.3 27.9 19.7 12.9 3.5 5.3 2.2 14.8 c
2007 informal CS 8.0 18.4 22.7 8.6 5.6 11.7 10.5 23.8 14.2 14.4 d
2011 formal Census 63.2 81.1 79.8 71.6 89.8 83.8 82.4 76.2 80.4 77.6 e
2011 informal Census 7.7 15.7 18.9 8.3 5.2 10.9 13.1 21.2 18.2 13.6 e
2011 other Census 0.9 0.9 0.9 1.0 0.5 0.8 1.3 0.9 1.0 0.9 e
2011 traditional Census 28.2 2.4 0.4 19.0 4.5 4.5 3.2 1.7 0.5 7.9 e
2011 informal GHS 6.5 11.0 20.4 7.3 4.5 7.0 7.0 18.5 15.1 12.1 f
Percentage of households using electricity for cooking2001 Census 27.8 47.0 73.2 48.3 25.0 40.0 59.0 44.6 78.8 51.4 c
2007 CS 45.3 75.2 81.3 61.0 40.3 55.7 77.2 65.8 88.8 66.4 d
2011 Census 62.1 84.5 83.9 68.6 49.9 69.3 78.1 75.3 86.9 73.9 e
2011 59.8 88.0 79.3 71.2 50.4 67.5 79.8 75.6 89.5 73.1 f
Percentage of households with access to piped water2001 Census 62.4 95.7 97.5 73.2 78.0 86.7 96.6 86.2 98.3 84.5 c
2007 CS 70.8 97.3 97.9 79.3 83.6 91.1 94.4 89.9 98.9 88.7 d
2011 Census 77.8 97.8 98.2 85.9 86.0 87.4 97.4 91.6 99.1 91.2 e
2011 74.8 96.2 97.4 84.5 82.2 86.9 95.1 89.6 99.5 89.5 f
Percentage of households with no toilet / bucket toilet2001 Census 30.8 9.7 3.6 16.2 23.3 10.3 11.2 9.6 7.7 13.6 c
2007 CS 23.5 3.2 1.6 10.4 12.4 8.0 6.9 5.8 3.8 8.3 d
2011 Census 15.0 8.6 2.9 8.0 7.8 7.2 12.0 6.8 6.7 7.2 e
2011 17.0 4.6 1.1 4.8 7.9 6.7 7.6 5.5 3.4 5.7 f
Percentage of households with refuse removal2001 Census 36.6 58.6 84.2 49.2 14.2 38.7 68.7 37.0 87.8 55.4 c
2007 CS 37.2 74.5 85.1 50.6 17.7 39.7 70.1 52.6 90.3 60.1 d
2011 Census 43.5 72.7 89.9 53.1 21.8 43.7 66.3 50.2 91.1 63.6 e
Percentage of households with telephone (telephone in dwelling or cell phone)2001 Census 29.0 35.3 56.1 39.0 28.0 37.9 41.8 34.5 63.1 42.4 c
2007 CS 63.9 71.4 83.7 75.7 71.1 78.7 67.6 72.3 83.5 76.2 d
2011 84.0 88.7 93.9 93.5 92.0 93.4 80.7 88.7 89.4 90.9 g
Unemployment rate (official definition)2010 Q2 27.7 28.0 27.1 20.8 22.6 28.1 30.1 28.1 21.8 25.3 h
2011 Q1 26.9 27.9 26.9 20.3 19.3 30.8 31.3 25.0 22.2 25.0 h
2012 Q1 28.3 32.2 26.0 20.5 21.9 30.3 24.9 26.2 22.8 25.2 h
2012 Q2 28.6 32.9 25.4 19.8 20.2 28.9 29.9 26.2 23.2 24.9 h
2012 Q3 28.8 32.0 24.8 21.3 22.2 31.1 30.0 25.0 25.4 25.5 h
Reference notes (indicator definitions from page 310 and references from page 315):
a Blue Drop 2011.49
b Blue Drop 2012.45
c Census 2001.33 d Community Survey 2007.35
e Census 2011.20
f StatsSA GHS 2011.37 g StatsSA GHS 2011.37 Note that the Census 2011 did not appear to
report comparable information on this indicator and therefore the results are not presented here.
h StatsSA Labour Force Survey.50

Health and Related Indicators 17
SAHR 2012/13 217
Health status indicators
Mortality
Context The release of data from the Global Burden of Disease Study 2010 has galvanised this entire field. Locally, while some progress has been made, the quality of cause of death reporting still needs attention.
New data sources Nationally, new data have been reported in the:
• StatsSA Mortality and causes of death in South Africa, 2009: Findings from death notification
• StatsSA levels and trends in morbidity and mortality among children aged under-five years in South Africa, 2006-2010
• MRC Rapid Mortality Surveillance report 2011
Internationally, reports of interest include:
• Global Burden of Disease Study 2010
Key issues and trends South Africa’s life expectancy at birth has been estimated, based on rapid surveillance data from the National Population Register, to have increased to 60.0 years in 2011 (57.2 years for men and 62.8 years for women), exceeding the NSDA targets set for 2014. Progress has also been noted in relation to the under-five mortality rate and the infant mortality rate, but not the neonatal mortality rate. Data on the maternal mortality ratio are still subject to a 2-year delay, as they cannot be obtained from the Rapid Mortality Surveillance (RMS) system.
This quote from Professor Christopher Murray of the Institute for Health Metrics and Evaluation (IHME) captures the challenge of the Global Burden of Disease (GBD) Study 2010a perfectly: “As more data are made available and/or collected, the task of tracing global health epidemiology is much more challenging than when there was little data available. This may seem paradoxical but when there are no data; the task is actually easier to generate a model than when there are conflicting or complex patterns in the data that must be captured and reflected in the results. In other words, progress in global health measurement makes the task of tracking global health problems more complex and time consuming—not less”.51 The GBD 2010 was released as a themed issue of the Lancet in December 2012,b and immediately elicited major media commentary. An earlier release of malaria data had already caused a flurry by claiming a far larger mortality burden than had previously been accepted.52 The GBD 2010 was a major global research effort, conducted over a five-year period by 486 researchers at 302 institutions in 50 countries. Among the major findings was a nuanced interpretation of the epidemiological transition, in which emerging non-communicable burdens of disease did not replace infectious causes, but existed alongside them, as a ‘dual’ burden. Nonetheless, for sub-Saharan Africa, the majority of deaths were still due to infectious, maternal, neonatal and nutritional causes. AIDS remained the leading cause of death in southern and eastern Africa, and amongst young women in particular. One of the positive findings was the marked decline in the estimate of the number of children who died from measles, from 600 000 in in 1990 to 125 000 in 2010. This appeared to represent a major gain from vaccination, as well as other public health and quality of care interventions. One of the really challenging consequences of the GBD 2010 is the question of how to allocate (or re-allocate) resources in order to address leading causes of morbidity and mortality, but also to focus on those that are most amenable to cost-effective interventions. Dealing with the many confounders and also competition for scarce resources will occupy policymakers for many years.
a http://www.healthmetricsandevaluation.org/gbdb http://www.thelancet.com/themed/global-burden-of-disease
Locally, cause of death data from death notifications were updated for the 2009 year, as well as reflecting late registrations for the previous years covered (1997-2008).53 As expected, the total number of death notifications (572 673 in 2009) exceeded the number recorded in the National Population Register (NPR) (532 713 in 2009), as it included non-South African citizens who were temporarily in the country at the time of their deaths and all South African citizens and permanent residents who died before notice of their births had been registered or captured in the NPR. No major changes were noted over time in the proportion of deaths that were attributed to symptoms, signs and abnormal clinical and laboratory findings not elsewhere classified (codes R00-R99) or to ill-defined and unknown causes of mortality (codes R95-R99). In 2009, the most common main group of causes of death remained ‘certain infections and parasitic diseases’, accounting for 25.0% of all deaths. Importantly, this included 1 184 deaths due to multidrug-resistant tuberculosis (MDR-TB) and 151 deaths due to extensively drug-resistant tuberculosis (XDR-TB), representing increases of 65.6% and 11.0% over 2008, respectively. The second most common main group of causes of death was ‘diseases of the circulatory system’, which accounted for 14.7% of reported deaths.
In order to increase the public health utility of cause of death data, various adjustments can be made to proportionally redistribute deaths of unknown ages and deaths that have been misclassified as due to ill-defined symptoms and other ‘garbage’ codes.54 After this, the Years of Life Lost (YLLs) can be estimated for each age, sex and cause category by multiplying the observed number of deaths by the expected life expectancy in each age category. The YLLs are an estimate of premature mortality and thus highlight the causes of death that should be targeted by preventive interventions. The leading YLLs for South Africa, based on 2009 data, are shown in Figure 1.
The demographic and surveillance sites (DSSs) are not representative of the country, but do provide an incredibly rich source of data from which nuanced understanding of mortality changes can be drawn. For example, Sartorius described the complex interaction of highly

218 SAHR 2012/13
Rank Ind_short1 Tuberculosis2 Lower respiratory infection3 HIV/AIDS4 Diarrhoeal disease5 Cerebrovascular disease6 Hypertensive heart disease7 Road injuries8 Ischaemic heart disease9 Interpersonal violence10 Meningitis/encephalitis
20 4 6 8 10 12 14 16 18
17.312.1
10.38.7
4.03.9
3.6
2.92.9
2.4
Percentage of total YLLs
attributable multilevel factors on mortality risk in Agincourt, and Bor et al. link the gain in adult life expectancy of 11.3 years between 2003-2011 to the value of scaling up HIV treatment.55,56
Of direct importance to South Africa’s MDG efforts, StatsSA released an update on under-five morbidity and mortality in 2012, based on a variety of data from 2006 to 2010.57 Data for this report were drawn not only from administrative reporting of causes of death (2006-2009), but also from the General Household Surveys (2006-2010) and the Living Conditions Survey (2008/9).58 In 2009, the most common main group of causes of death in under-fives was ‘certain infectious and parasitic diseases’, accounting for 26.6% of recorded deaths. This was followed by perinatal conditions (24.8%) and diseases of the respiratory system (15.8%).
Given the time delay in cause of death data being released by StatsSA, a Rapid Mortality Surveillance (RMS) system was established to monitor trends in the number of deaths recorded on the NPR. A report from this system was released in August 2012 to wide acclaim.59 The primary cause of the excitement generated by this report was the claim that South Africa had, based on these data, already exceeded its life expectancy goals for 2014, for both men and women. This report provides very important details of the adjustments made to raw data in order to generate estimates of mortality measures, as well as the alternative source of information used for estimating the neonatal mortality rate (relying on the DHIS, as fewer than 10% of neonatal deaths were recorded on the NPR). The unexpectedly good life expectancy data were explained as due to “a significant decline in the mortality of children under the age of 1, but also to a decline in adult mortality, probably as a result of greater than expected roll-out of ARVs”.
While focused specifically on the wide range of sources of mortality data that are available in South Africa, their development and current performance, the comprehensive and accessible review published by Joubert et al. in December 2012 identifies actions that have far wider application.60 These authors have recommended three broad areas that need attention: data quality (such as improving the quality of fieldwork, addressing the completeness of vital registration and the accuracy of medical certification of death), data triangulation (for example, by promoting linkage and validation studies), and analytic capacity. The same could be said of all areas of health information, which require additional human and fiscal resources, not for their own sake, but to enable “enhanced resource and service distribution, and, eventually, better meeting the health needs of the population”.
Figure 1: Leading causes of Years of Life Lost (YLLs) for SA, 2009
Source: DHB 2011/12,54 based on analysis of StatsSA Causes of death 2009.

Health and Related Indicators 17
SAHR 2012/13 219
Table 4: Mortality indicators by province
EC FS GP KZN LP MP NC NW WC SA RefAdult mortality (45q15 - probability of dying between 15-60 years of age)2000 GBD 2010 female - - - - - - - - - 32.3 a
2000 GBD 2010 male - - - - - - - - - 44.5 a
2007 ASSA2008 45.2 56.2 46.0 60.2 37.8 55.1 39.3 50.3 33.2 48.6 b
2007 ASSA2008 female 60.5 48.6 39.0 51.9 34.4 51.0 32.0 40.8 27.1 41.2 b
2007 ASSA2008 male 52.6 63.8 52.9 68.4 41.3 59.2 46.5 59.9 39.2 56.1 b
2007 NiDS female - - - - - - - - - 52.0 c
2007 NiDS male - - - - - - - - - 57.0 c
2009 ASSA2008 41.7 51.7 41.3 53.6 33.1 50.2 36.0 48.6 31.3 44.4 b
2009 ASSA2008 female 58.1 44.2 34.5 45.4 29.3 46.1 29.5 40.8 25.7 37.4 b
2009 ASSA2008 male 53.2 59.2 48.1 61.7 36.8 54.2 42.6 56.4 36.9 51.4 b
2009 RMS - - - - - - - - - 46.0 d
2009 RMS female - - - - - - - - - 40.0 d
2009 RMS male - - - - - - - - - 52.0 d
2010 ASSA2008 40.0 49.0 40.0 52.0 33.5 47.6 36.7 46.3 31.9 43.1 b
2010 ASSA2008 female 53.5 41.1 33.7 44.0 29.3 42.9 30.4 38.6 26.5 36.3 b
2010 ASSA2008 male 50.9 56.8 46.3 60.0 37.8 52.2 43.0 54.0 37.4 50.0 b
2010 GBD 2010 female - - - - - - - - - 35.0 a
2010 GBD 2010 male - - - - - - - - - 44.1 a
2010 RMS - - - - - - - - - 43.0 d
2010 RMS female - - - - - - - - - 37.0 d
2010 RMS male - - - - - - - - - 49.0 d
2011 ASSA2008 39.4 47.2 39.4 51.3 33.9 46.1 37.2 44.8 32.5 42.6 b
2011 ASSA2008 female 46.0 39.6 33.5 43.6 29.5 41.3 31.2 37.6 27.2 36.1 b
2011 ASSA2008 male 46.6 54.8 45.3 59.0 38.4 51.0 43.2 52.1 37.7 49.2 b
2011 RMS - - - - - - - - - 40.0 d
2011 RMS female - - - - - - - - - 34.0 d
2011 RMS male - - - - - - - - - 46.0 d
2012 ASSA2008 40.1 46.3 39.2 51.1 34.3 45.5 37.6 44.1 32.9 42.5 b
2012 ASSA2008 female 46.1 39.0 33.8 43.7 29.8 40.8 31.9 37.3 27.9 36.2 b
2012 ASSA2008 male 46.4 53.5 44.7 58.4 38.7 50.3 43.3 50.8 37.9 48.8 b
2013 ASSA2008 40.5 45.8 39.2 51.1 34.5 45.4 37.9 43.7 33.3 42.6 b
2013 ASSA2008 female 53.3 38.9 34.2 44.1 30.2 40.8 32.5 37.5 28.5 36.7 b
2013 ASSA2008 male 46.5 52.7 44.3 58.1 38.9 49.9 43.4 50.0 38.0 48.6 b
Life expectancy at birth2001 StatsSA - - - - - - - - - 55.1 e
2001 StatsSA female - - - - - - - - - 57.8 e
2001 StatsSA male - - - - - - - - - 52.1 e
2003 Hlabisa DSS - - - 49.2 - - - - - - f
2007 ASSA2008 52.1 51.2 57.2 49.0 60.5 51.4 60.5 55.0 64.0 55.1 b
2007 ASSA2008 female 55.3 54.3 60.2 52.2 62.7 53.1 64.1 59.0 67.5 58.3 b
2007 ASSA2008 male 49.0 48.2 54.1 45.9 58.4 49.8 56.9 51.2 60.7 51.9 b
2007 StatsSA - - - - - - - - - 53.0 e
2007 StatsSA female - - - - - - - - - 54.9 e
2007 StatsSA male - - - - - - - - - 50.9 e
2009 ASSA2008 54.4 53.8 59.8 52.7 63.2 54.2 61.8 56.4 65.0 57.6 b
2009 ASSA2008 female 57.7 57.1 63.1 56.1 65.8 56.2 65.3 59.7 68.3 60.9 b
2009 ASSA2008 male 51.2 50.6 56.7 49.2 60.7 52.3 58.4 53.1 61.7 54.3 b
2009 RMS - - - - - - - - - 56.5 d
2009 RMS female - - - - - - - - - 59.0 d
2009 RMS male - - - - - - - - - 54.0 d
2009 StatsSA - - - - - - - - - 55.5 e
2009 StatsSA female - - - - - - - - - 57.5 e
2009 StatsSA male - - - - - - - - - 53.3 e
2010 ASSA2008 55.2 55.1 60.3 53.4 63.0 55.6 61.6 57.2 64.7 58.2 b
2010 ASSA2008 female 58.7 58.7 63.4 56.9 65.8 57.9 64.9 60.6 68.0 61.5 b
2010 ASSA2008 male 51.8 51.6 57.2 49.9 60.3 53.3 58.3 53.8 61.5 54.9 b
2010 RMS - - - - - - - - - 57.8 d
2010 RMS female - - - - - - - - - 60.3 d
2010 RMS male - - - - - - - - - 55.3 d

220 SAHR 2012/13
EC FS GP KZN LP MP NC NW WC SA Ref2010 StatsSA - - - - - - - - - 56.5 e
2010 StatsSA female - - - - - - - - - 58.5 e
2010 StatsSA male - - - - - - - - - 54.3 e
2011 ASSA2008 55.7 56.0 60.5 53.8 62.9 56.4 61.4 57.8 64.6 58.4 b
2011 ASSA2008 female 59.1 59.5 63.5 57.3 65.7 58.9 64.7 61.1 67.7 61.7 b
2011 ASSA2008 male 52.2 52.5 57.6 50.3 60.1 54.0 58.2 54.5 61.5 55.2 b
2011 Hlabisa DSS - - - 60.5 - - - - - - f
2011 RMS - - - - - - - - - 59.6 d
2011 RMS female - - - - - - - - - 62.4 d
2011 RMS male - - - - - - - - - 56.9 d
2011 StatsSA - - - - - - - - - 57.1 e
2011 StatsSA female - - - - - - - - - 59.1 e
2011 StatsSA male - - - - - - - - - 54.9 e
2012 ASSA2008 55.9 56.4 60.6 53.9 62.8 56.8 61.4 58.1 64.5 58.5 b
2012 ASSA2008 female 59.3 59.9 63.5 57.3 65.7 59.3 64.5 61.3 67.5 61.7 b
2012 ASSA2008 male 52.4 53.0 57.8 50.6 60.0 54.3 58.3 55.0 61.5 55.4 b
2013 ASSA2008 56.0 56.6 60.7 54.0 62.7 57.0 61.3 58.3 64.4 58.5 b
2013 ASSA2008 female 59.4 60.0 63.4 57.3 65.6 59.4 64.4 61.3 67.4 61.6 b
2013 ASSA2008 male 52.6 53.3 58.0 50.8 60.0 54.5 58.3 55.3 61.5 55.5 b
Reference notes (indicator definitions from page 310 and references from page 315):
a Global Burden of Disease 2010.61
b ASSA2008.62
c NiDS Demography Wave 1.42
d RMS 2011.59
e StatsSA Mid-year estimates.34 2011 mid-year estimates. Life expect-ancy assumptions used in development of the current mid-year estimates.
f Bor et al. 2013.55

Health and Related Indicators 17
SAHR 2012/13 221
Disability
Context Interpreting measures of the prevalence of disability over time require careful attention to the exact definitions used and the means by which responses are elicited in various surveys. The questions used in the StatsSA General Household Survey remain as introduced in 2009.
New data sources Nationally, new data have been reported in the:
• StatsSA General Household Survey (GHS) 2011
• StatsSA Census 2011
• District Health Information System (DHIS) (cataract surgery indicator)
Internationally, reports of interest include:
• Global Burden of Disease Study 2010
Key issues and trends At a global level, enormous amounts of data have been produced for the Global Burden of Disease Study 2010, including data on the burden accounted for by disabilities.
Two of the major papers that were produced from the Global Burden of Disease Study 2010 were entitled “Disability-adjusted life years (DALYs) for 291 diseases and injuries in 21 regions, 1990-2010: a systematic analysis for the Global Burden of Disease Study 2010” and “Years lived with disability (YLDs) for 1 160 sequelae of 289 diseases and injuries, 1990-2010: a systematic analysis for the Global Burden of Disease Study 2010”.63,64 The first of these presented a composite measure (disability adjusted life years or DALY) as the sum of the years of life lost (YLLs) and years lived with disability (YLDs) due to 291 causes, in 20 different age groups, both sexes, and for 187 countries. The following explanations of these terms were provided:
➢ “YLLs are computed by multiplying the number of deaths at each age x by a standard life expectancy at age x”.
➢ “YLDs are computed as the prevalence of different disease-sequelae and injury-sequelae multiplied by the disability weight for that sequela. Disability weights are selected on the basis of surveys of the general population about the loss of health associated with the health state related to the disease sequela”.
➢ “DALYs are an absolute measure of health loss; they count how many years of healthy life are lost due to death and non-fatal illness or impairment. They reflect the number of individuals who are ill or die in each age-sex group and location. Population size and composition influences the number of DALYs in a population”.
The bottom-line message from this analysis was as follows: “Global disease burden has continued to shift away from communicable to non-communicable diseases and from premature death to years lived with disability”. In this sense, ‘disability’ refers to “any short-term or long-term health loss, other than death”.
The second of the papers included estimates of the burden, expressed as YLDs, due to causes that are more commonly defined as disabilities. For instance, visual impairment accounted for 21.1 million YLDs or 2.7% of the global total. The most common causes of vision loss were trauma, occupational exposures, and idiopathic disorders. These were followed by uncorrected refractive error and cataracts. In terms of hearing loss, a substantial increase was detected from 1990 to 2010, driven by an ageing population. However, most of the burden of hearing loss, as measured by YLDs, was of mild-to-moderate severity. Intellectual disability and borderline intellectual impairment were responsible for 3.1 million
YLDs. At a global level, the main causes were idiopathic, Down’s syndrome, autism, preterm birth, and other congenital disorders, but there were major regional differences. Major preventable causes, for instances, included meningitis in west and central sub-Saharan Africa and cretinism in south Asia.
An analysis of the cost-effectiveness of strategies to combat vision and hearing loss in sub-Saharan Africa and South East Asia identified the treatment of chronic otitis media, extracapsular cataract surgery, trichiasis surgery, treatment of meningitis and annual screening of schoolchildren for refractive error as among the most cost effective.65 Some of these are already applied in South Africa’s public sector, but others may provide fruitful targets for the new Integrated School Health Programme.
The StatsSA General Household Survey 2011 reported that the percentage of persons over the age of five years with disabilities had increased from 5.7% in 2009 to 6.3% in 2010 before declining to 5.2% in 2011.37 In 2011, the highest reported prevalence of disability was in the Northern Cape (10.1%), and the lowest in Gauteng (3.3%). As explained in the StatsSA report, the questions posed to respondents “require each person in the household to rate their ability level for a range of activities such as seeing, hearing, walking a kilometre or climbing a flight of steps, remembering and concentrating, self-care, and communicating in his/her most commonly used language, including sign language”. If respondents state that they have difficulty with two or more of the activities or had a lot of difficulty/were unable to perform any one activity, they are then recorded as disabled.
StatsSA collected data on disability status in the censuses of 1996 and 2001 and in the large scale community survey conducted in February 2007. In each case, the definition of disability was that used by the 1980 WHO International Classification of Impairments, Disabilities and Handicaps (ICIDH), accordingly as a physical or mental handicap which has lasted for six months or more, or is expected to last at least six months, which prevents the person from carrying out daily activities independently, or from participating fully in educational, economic or social activities. From 2010, censuses have adopted a set of disability questions developed by the Washington Group (WG). These questions relate to difficulties people have in executing a series of activities; seeing, hearing, walking, communicating, and self-care, remembering and concentrating. Studies carried out prior to the Census 2011 showed that the use of WG questions led to much higher disability estimates

222 SAHR 2012/13
compared to the traditional questions and that the term ‘difficulty’ instead of ‘disabled’ seemed to be more acceptable among persons with impairments which do not prevent them from participating in life activities. However, as a result of the changes in the format of the disability questions, the Census 2011 data are not comparable with those from previous censuses.33 Although some of the Census 2011 figures relating to disability have been released, the overall calculated prevalence of disability has not yet been published and is thus not included in this Review.
At a very local level, a cross-sectional study was conducted to determine the prevalence and causes of vision loss in Cape Town residents over the age of 50 years.66 This was a large study, which recruited 2 750 of 3 100 eligible people in a randomly selected sample. As expected, the prevalence of vision loss was greatest among people over 80 years of age, but also in those in the poorest socio-economic group and those with no formal education. The socio-economic gradient was also evident in terms of access to cataract surgery, which was 68% coverage in the poorest socio-economic status tertile (68%) compared to 93% in the medium and 100% in the highest tertile.
Indicators for routine monitoring of cataract surgery services are in a state of flux. Previously, provincial-level data were collected by the national department and the rate per million uninsured population was calculated. More recently, the data have been collected by DHIS. However, data prior to 2011/12 were clearly incomplete. In addition, the current DHIS calculations use the 2010 National Indicator Data Set (NIDS) definition, in which the ‘total population’ is used as the denominator. The definition in the 2013 NIDS has been corrected to use the uninsured population as the denominator. Regardless of the definitions used, it is clear that coverage at a national level is substantially below the target, and that disaggregated data show that several areas of the country provide no cataract surgery services in the public sector.67
Table 5: Disability indicators by province
EC FS GP KZN LP MP NC NW WC SA RefCataract surgery rate (annualised)2009 603.9 422.3 30.3 198.6 689.3 588.3 - 25.3 1 067.0 387.6 a
2010 784.4 899.5 213.5 319.5 717.5 604.1 259.0 468.8 1 094.0 547.6 a
2011 1 002.1 821.3 555.6 633.6 765.3 629.4 416.7 363.9 1 209.7 729.5 b
Cataract surgery rate (surgeries per million uninsured population)2009 1 030 916 1 574 840 823 1 051 396 777 1 485 1 072 c
2010 1 102 1 329 1 345 681 717 962 471 778 1 501 1 016 c
Prevalence of disability (%)2009 GHS 5.3 9.1 5.3 7.7 4.8 3.7 5.6 4.9 4.0 5.7 d
2010 GHS 7.9 10.1 3.3 6.6 8.2 5.0 9.8 8.5 5.0 6.3 e
2011 GHS 6.1 6.7 3.3 4.6 6.1 5.5 10.2 7.7 4.4 5.2 f
Reference notes (indicator definitions from page 310 and references from page 315):
a DHIS. Incomplete data. For 2009/10 and 2010/11 financial years.b DHIS. Total surgeries: 36 862. For 2011/12 financial year.c DoH. Total surgeries: 43 943 in 2009 and 41 863 in 2010. Uninsured
population for the relevant year calculated from the most recent available data from StatsSA on mid-year population estimates and medical scheme coverage (General Household Surveys).
d StatsSA GHS 2009 revised.68 The question asks each person in the household to rate their ability level for a range of activities. These include: seeing, hearing, walking a kilometre or climbing a flight of steps, remembering and concentrating, self-care and communicating in his/her most commonly used language, including sign language. During the analysis individuals who said that they had some difficulty in two or more of the activities or a lot of difficulty/unable to do in any one activity were then ranked as disabled. Since this question is very different from the question asked in previous surveys, no comparison over time is possible. Note that this analysis only includes the percentage of persons aged 5 years and older with a disability. This is because children under five years are often mistakenly categorised as being unable to walk, remember, communicate or care for themselves when it is due to their level of development rather than any innate disabilities they might have.
e StatsSA GHS 2010.69 This analysis only includes the percentage of persons aged 5 years and older with a disability.
f StatsSA GHS 2011.37 This analysis only includes the percentage of persons aged 5 years and older with a disability.

Health and Related Indicators 17
SAHR 2012/13 223
Infectious disease
Context Traditionally, some of the most important data on infectious disease incidence were provided by the National Department of Health’s Notifiable Disease system. That system seems to have broken down completely and no reports have been issued for some time. The only sources of data now available are the various reports issued by the National Institute for Communicable Diseases (NICD).
New data sources Nationally, new data have been reported in the:
• The National Antenatal Sentinel HIV and Syphilis Prevalence Survey, 2011
• Surveillance data, surveillance bulletins and other reports issued by NICD
Internationally, reports of interest include:
• Sustaining the drive to overcome the global impact of neglected tropical diseases: Second WHO report on neglected tropical diseases
Key issues and trends A major change in relation to syphilis surveillance is planned from 2013, when this element of the annual Antenatal Sentinel HIV Prevalence Survey will be replaced with a focus on herpes simplex 2 infections.
As was indicated in the 2011 edition of the SA Health Review,1 no new national data on the incidence of most notifiable conditions can be provided, as no data have been reported from the National Department of Health. There is no evidence that the web-based system introduced for the World Cup in 2010 has survived and been rolled out as planned.70 However, some data on these conditions have been reported by the National Institute for Communicable Diseases (NICD), based on positive identification by their laboratories or surveillance sites or following their involvement in investigations of outbreaks. An example is the article summarising rabies data for 2005 to 2011, which appeared in the April 2012 issue of the NICD Communicable Disease Surveillance Bulletin.71
A major change in the availability of syphilis data will occur after 2011. The National Antenatal Sentinel HIV and Syphilis Prevalence Survey conducted in 2011 enrolled 33 446 first time antenatal care attendees at selected public sector facilities in all 52 districts.72 Each provided a sample for a Rapid Plasma Reagin (RPR) card test for active syphilis. The national prevalence of syphilis in 2011 was 1.6% (95% CI: 1.5-1.8), with the highest prevalence noted in Mpumalanga rather than the Northern Cape. However, from the 2012 survey, monitoring of syphilis prevalence among pregnant women will cease. Instead, the focus will be on monitoring of herpes simplex type 2 (HSV2). Data from selected pilot sites will be included in the 2012 report. However, routine testing for syphilis will still be conducted as part of antenatal care, although data will no longer be captured by the antenatal survey or reported by the DHIS.
Globally, progress in attaining the goal of reducing measles-associated mortality by 90% by 2010 has been documented.73 Despite an estimated 74% reduction in global mortality from measles between 2000 and 2010, further progress has been hampered by the lack of action in India and some parts of Africa. In 2010, India accounted for almost half of all measles-associated mortality and the WHO African region for more than a third.
Although South Africa is not particularly burdened by such conditions, the second WHO report on neglected tropical diseases did a high prevalence of human cysticercosis cases in some parts of the country.74 Neurocysticercosis may be fatal and is also an important cause of epilepsy. Cysticercosis, neurocysticercosis and taeniasis were added to the list of neglected tropical diseases by WHO in 2010. A validated strategy for controlling and eliminating these conditions is planned to be developed by 2015, and then implemented at scale in selected endemic countries by 2020.

224 SAHR 2012/13
Table 6: Selected infectious disease indicators by province
EC FS GP KZN LP MP NC NW WC SA RefReported cases of cholera2010 NICD lab confirmed cases - - 1 - - - - - - 1 a
2011 NICD lab confirmed cases - - - - 1 - - - - 1 b
2012 NICD lab confirmed cases - - - - - - - - - 0 c
Reported cases of measles2010 NICD lab confirmed cases 1 309 674 1 617 3 837 290 1 844 374 758 1 796 12 499 a
2011 NICD lab confirmed cases 4 2 36 23 1 2 8 8 8 92 b
2012 NICD lab confirmed cases 0 1 7 6 1 0 0 1 1 17 c
Reported cases of rabies2010 NICD lab confirmed cases 2 0 1 3 3 1 1 0 0 11 a
2011 NICD lab confirmed cases 2 0 0 1 3 0 0 0 0 6 b
2012 NICD lab confirmed cases 0 0 0 4 3 1 0 0 0 8 c
Syphilis prevalence rate (%) (antenatal)2010 ANC survey 2.1 1.2 2.8 0.3 0.5 2.1 3.6 1.3 1.2 [10] 1.5 d
2011 ANC survey 1.8 1.9 2.0 0.4 0.7 4.1 3.8 1.7 1.6 [11] 1.6 e
Reference notes (indicator definitions from page 310 and references from page 315):
a NICD surveillance. Communicable Diseases Surveillance Bulletin Mar 2011.75 Data for Jan-Dec 2010.
b NICD surveillance. Communicable Diseases Surveillance Bulletin Apr 2012.71 Data for Jan-Dec 2011.
c NICD surveillance. Communicable Diseases Surveillance Bulletin Nov 2012.76 Data for Jan-Sep 2012.
d Antenatal Survey 2010.77
e Antenatal Survey 2011.72

Health and Related Indicators 17
SAHR 2012/13 225
Malaria
Context Although malaria is only endemic in three provinces (KwaZulu-Natal, Mpumalanga, Limpopo), cases are increasingly being reported in other provinces. Many of these patients appear to have contracted malaria in neighbouring countries, but sought care in South Africa (notably in Gauteng).
New data sources Nationally, new data have been reported in the:
• NDoH malaria surveillance
• StatsSA Causes of Death 2009
Internationally, reports of interest include:
• WHO World Malaria Reports 2011 and 2012
Key issues and trends Globally, attention has been focused on the markedly increases estimates of malaria mortality published by the Institute for Health Metrics and Evaluation (IHME).
The WHO World Malaria report for 2012 shows that just 4% of the South African population is at high transmission risk (defined as ≥ 1 case per 1 000 population), 6% at low risk (0-1 case per 1 000 population), while the balance resides in malaria-free areas.78 Interventions are thus concentrated in the three malaria-endemic provinces (KwaZulu-Natal, Mpumalanga, Limpopo). The WHO report did note, however, that South Africa was one of only five countries in which domestic expenditure per capita on malaria control (based on the population at risk) exceeded US$ 5.00 per capita per year. The other countries in this group were Azerbaijan, Costa Rica, Malaysia, and Turkey. The WHO also reported that: “In the African Region, only 8 countries (Algeria, Botswana, Cape Verde, Namibia, Rwanda, Sao Tome and Principe, South Africa and Swaziland) and the island of Zanzibar (United Republic of Tanzania) have achieved reductions in malaria case incidence or malaria admission rates of 75% or more”. While noting that malaria has been a notifiable disease in South Africa since 1956, Moonasar et al. have pointed out that the National Department of Health’s surveillance of malaria has always had to deal with “irregularity of routine notifications, particularly from the private sector and public health facilities in non-endemic areas”.79 However, these authors have also noted that, “reporting appears to be gaining in efficiency, with an increase in malaria notifications from the non-endemic areas, especially Gauteng”. In 2010, malaria cases were reported from all nine provinces, with the number reported in Gauteng (960) exceeding the number reported in KwaZulu-Natal (380). The majority of cases were still reported in Limpopo (4 215) and Mpumalanga (2 195). The peak number of malaria-related deaths in Gauteng were recorded in January of each year, presumably related to travellers returning from malaria-endemic areas, particularly Mozambique. A review of malaria data from Mpumalanga for the period 2001 to 2009 showed that this province had reduced malaria morbidity and mortality by over 70%, but that is still faces challenges in terms of the “control of imported malaria cases; development of strategies to interrupt local transmission; and maintaining high quality surveillance and reporting system”.80
Globally, the cat was set among the proverbial pigeons by a report published in February 2012 from the Institute for Health Metrics and Evaluation (IHME).52 The IHME team used data from a variety of sources, including vital registration systems, published and unpublished verbal autopsy reports, and estimates of malaria transmission intensity, and then constructed a range of predictive models. Other factors included were data on Plasmodium falciparum prevalence, first-line antimalarial drug resistance and
vector control. In essence, the study suggested that there were about twice as many deaths from malaria that had been estimated in the WHO World Malaria Report 2011.81 An accompanying editorial in the Lancet called these results “surprising and, on the face of it, disturbing”.82 The editorialist spoke for many when writing: “The authors will need to make their data and assumptions fully available to others who will surely wish to reproduce their calculations”. Nonetheless, the Lancet called for “urgent technical and policy analyses …. to review these new data and their implications for malaria control programmes”.

226 SAHR 2012/13
Table 7: Malaria indicators by province
EC FS GP KZN LP MP NC NW WC SA RefCase fatality rate: malaria2010 0.0 0.0 1.1 1.3 0.9 1.2 8.3 2.2 0.0 1.1 a
2011 1.3 0.0 1.4 1.0 0.9 0.5 4.5 1.2 1.1 0.9 a
2012 0.0 0.0 2.0 0.6 0.8 0.5 4.0 0.0 0.0 0.9 b
Reported cases of malaria2010 9 34 960 380 4 215 2 195 12 186 75 8 066 a
2011 156 81 2 080 598 3 451 3 259 66 85 89 9 865 a
2012 2 34 1 136 355 1 642 2 074 25 17 1 5 286 b
Reported cases of malaria (per 100 000)2010 0.1 1.2 8.6 3.6 77.5 60.7 1.1 5.8 1.4 16.1 a
2011 2.3 2.9 18.4 5.5 62.1 89.1 6.0 2.6 1.7 19.5 a
2012 0.0 1.2 10.2 3.3 31.1 56.2 2.2 0.5 0.0 10.4 b
Reported deaths from malaria2007 DoH surveillance - - - 5 29 17 - - - 51 c
2007 Vital Registration 4 10 74 33 59 58 4 21 8 278 d
2008 DoH surveillance - - - 3 31 8 - 1 - 43 a
2008 Vital Registration 8 7 92 22 79 33 2 21 4 279 e
2009 DoH surveillance - - - 4 34 11 - 2 - 51 a
2009 Vital Registration 5 7 61 18 70 31 1 12 4 222 f
2010 DoH surveillance 0 0 11 5 40 26 1 4 0 87 a
2011 DoH surveillance 2 0 29 6 31 16 3 1 1 89 a
2012 DoH surveillance 0 0 23 2 13 10 1 0 0 49 b
Reference notes (indicator definitions from page 310 and references from page 315):a DoH Malaria Statistics. Data file received 2012-08-28. Data for Jan-
Dec.b DoH Malaria Statistics. Data file received 2012-08-28. Data for Jan-Jul.c DoH Malaria Statistics. Data file received 2010-10-28.d StatsSA Causes of death 2007.83 Calculated from StatsSA Causes of
Death online database using ICD-10 codes B50-B54 as underlying cause of death. Includes deaths occurring outside of SA.
e StatsSA Causes of death 2008.84 Calculated from StatsSA Causes of Death online database using ICD-10 codes B50-B54 as underlying cause of death. Includes deaths occurring outside of SA.
f StatsSA Causes of death 2009.53 Calculated from StatsSA Causes of Death online database using ICD-10 codes B50-B54 as underlying cause of death. Includes 13 deaths occurring outside of SA.

Health and Related Indicators 17
SAHR 2012/13 227
Tuberculosis
Context South Africa is one of the countries most affected by tuberculosis, with significant numbers of drug-resistant cases. An integrated approach to the management of HIV and TB is promoted in South Africa, but many systems remain fragmented.
New data sources Nationally, new data have been reported in the:
• NDoH Electronic Tuberculosis Register (ETR)
• StatsSA Causes of Death 2009
Internationally, reports of interest include:
• WHO Global Tuberculosis Report 2012
Key issues and trends Although treatment success rates in South Africa’s public sector TB programme have remained below target, the country has been recognised for the progress being made in relation to expanding access to isoniazid preventive therapy in HIV-positive patients and the early adoption of the Xpert MTB/RIF rapid molecular test. The use of this technology at scale is predicted to markedly increase the numbers of TB cases and MDR-TB cases diagnosed in South Africa. However, the diagnosis and management of children with TB remains challenging for many reasons.
Tuberculosis provides a perfect example of how averages can obscure real problems. The WHO Global Tuberculosis Report 2012 optimistically reported that the MDG target to halt and reverse the TB epidemic by 2015 had already been achieved.85 It noted that the TB mortality rate had decreased by 41% since 1990 and that “the world is on track to achieve the global target of a 50% reduction by 2015”. Despite these positive statements, the Report also noted that “the global burden of TB remains enormous”, in that there were an estimated 8.7 million new cases of TB in 2011, of which 13% were co-infected with HIV, and 1.4 million TB-associated deaths. Critically, it noted that “[g]lobal progress also conceals regional variations: the African and European regions are not on track to halve 1990 levels of mortality by 2015”. Resistance is also a concern. While the highest proportions of patients with MDR-TB are in eastern Europe and central Asia, just 4 countries (India, China, Russia and South Africa) account for almost 60% of the world’s MDR-TB cases. South Africa remains one of the 22 high-burden countries (the others being Afghanistan, Bangladesh, Brazil, Cambodia, China, the Democratic Republic of the Congo, Ethiopia, India, Indonesia, Kenya, Mozambique, Myanmar, Nigeria, Pakistan, the Philippines, the Russian Federation, Thailand, Uganda, the United Republic of Tanzania, Vietnam and Zimbabwe). In raw numbers, the largest number of incident cases in 2011 were reported in India (2.0 million-2.5 million), China (0.9 million-1.1 million), South Africa (0.4 million-0.6 million), Indonesia (0.4 million-0.5 million) and Pakistan (0.3 million-0.5 million). South Africa is also one of only seven high-burden countries which have failed to achieve the target of 85% treatment success for smear-positive pulmonary TB cases. The recorded success rates were: Brazil (74%), Ethiopia (83%), Nigeria (84%), the Russian Federation (53%), South Africa (79%), Uganda (71%) and Zimbabwe (81%). Success rates were even lower when expressed as a percentage of all new cases, with Brazil (72%), Ethiopia (77%), Nigeria (81%), the Russian Federation (66%), South Africa (53%), Thailand (83%), Uganda (68%) and Zimbabwe (76%) missing the target. However, the Report did contain a footnote to the effect that the South African data reported to WHO were incomplete, and that the figure of 53% was thus an underestimate. The costs of successfully treating a case with first-line agents is higher in South Africa and Russia than in any of the other high-burden countries. In addition, there are no reliable data on the expenditure on second-line agents in both of these countries. Nonetheless, some positive developments
were also noted, such as the contribution made by South Africa to increasing access to isoniazid preventive therapy in HIV-positive patients and in the early adoption of the Xpert MTB/RIF rapid molecular test. As of June 2012, South Africa was responsible for 37% of the Xpert instruments and 53% of the cartridges procured globally. The country has been able to gain from the significant reduction (from US$ 16.86 to US$ 9.98) enabled by a ‘buy-down’ deal struck between the manufacturer (Cepheid) and external funders (including the Gates Foundation, USAID, PEPFAR and UNITAID) in August 2012. It has been estimated that, at full scale, the application of the Xpert technology will increase the number of TB cases diagnosed per year in South Africa by 30-37% and the number of MDR-TB cases diagnosed by 69-71%.86
A review of available data on anti-tuberculosis drug resistance for the 2007-2010 period was published in late 2011.87 This showed that, on the basis of the available data, the proportion of MDR-TB cases that were extensively drug-resistant (XDR-TB) exceeded 10% in only four countries, being South Africa (10.5%), Estonia (19.7%), Latvia (15.1%), and Tajikistan (21.0%, as reported for one city and one district).
An area of persistent neglect, which was highlighted by an editorial in the Bulletin of the World Health Organization in 2011, is that of the diagnosis and treatment of TB in children.88 Estimates of the numbers of children with TB were included for the first time in the WHO Global Tuberculosis Report 2012. The global estimate was of 490 000 cases and 64 000 deaths among children in 2011.
Although South Africa has an integrated policy document for the management of HIV, TB and sexually transmitted diseases,13 integration at the level of care remains a challenge, and information systems are also separate. In reviewing the African response to TB and HIV in 2006, Corbett et al. made the trenchant observation that “[t]uberculosis control in Africa has yet to adapt to the new climate of antiretroviral availability”.89 Further, they have noted that “[m]any barriers exist, from drug interactions to historic differences in the way that tuberculosis and HIV are perceived, but failure to successfully integrate HIV and tuberculosis control will threaten the viability of both programmes”. Focusing only on the surveillance systems in a single Western cape district, Auld et al. showed that there were varying levels of completeness and concordance between data in the HIV and TB systems for co-infected patients.90

228 SAHR 2012/13
In particular, TB clinical variables did not appear in the HIV system and vice versa. Data from interviews with the responsible staff were revealing: “Many expressed frustration that they see no local benefit to their participation in surveillance data collection, do not have access to the data collected in the electronic registers and seldom receive reports back from central levels”.
The WHO Global Task Force on TB Impact Measurement has strongly recommended that 13 African and 9 Asian countries complete national TB prevalence surveys. South Africa is included in the African set, together with Ethiopia, Ghana, Kenya, Malawi, Mali, Mozambique, Nigeria, Rwanda, Sierra Leone, Uganda, the United Republic of Tanzania and Zambia. The Asian countries targeted are Bangladesh, Cambodia, China, Indonesia, Myanmar, Pakistan, the Philippines, Thailand and Vietnam.
Table 8: TB programme management and other indicators
EC FS GP KZN LP MP NC NW WC SA RefCase detection rate (all forms)2009 GlobalTB - - - - - - - - - 74 a
2010 GlobalTB - - - - - - - - - 72 b
2011 GlobalTB - - - - - - - - - 69 c
HIV prevalence in TB incident cases2011 GlobalTB - - - - - - - - - 65.0 c
Incidence of TB (all types) (per 100 000)2009 GlobalTB - - - - - - - - - 971 a
2010 GlobalTB - - - - - - - - - 981 b
2011 GlobalTB - - - - - - - - - 993 c
Treatment success rate (%)2010 GlobalTB - - - - - - - - - 79 c
Tuberculosis death rate per 100 0002008 vital registration 173 200 110 220 93 185 155 164 86 153 d
2009 vital registration 167 178 101 197 90 170 128 144 75 140 e
Tuberculosis death rate per 100 000 (excluding HIV)2008 GlobalTB - - - - - - - - - 54 a
2009 GlobalTB - - - - - - - - - 52 a
2010 GlobalTB - - - - - - - - - 50 b
2011 GlobalTB - - - - - - - - - 49 c
Tuberculosis prevalence rate per 100 000 population2009 GlobalTB - - - - - - - - - 808 a
2010 GlobalTB - - - - - - - - - 795 b
2011 GlobalTB - - - - - - - - - 768 c
Reference notes (indicator definitions from page 310 and references from page 315):
a Global TB database. Downloaded 2011-05-25.b Global TB Control 2011.91
c Global TB Control 2012.85
d StatsSA Causes of death 2008.84 Calculated from 74 863 deaths due to TB (ICD-10 A15-A19, U51 (MDR) and U52 (XDR TB)) and StatsSA mid-year population estimates for the relevant year. No adjustment has been made for under-reporting or ill-defined causes of death notification. The rate for South Africa includes deaths that are not allocated to a specific province and will therefore be higher than the average provincial value. Based on the recorded province of death.
e StatsSA Causes of death 2009.53 Calculated from 67 668 deaths due to TB (ICD-10 A15-A19), plus 1 184 due to ICD-10 U51 (MDR) and 151 due to ICD-10 U52 (XDR TB) and StatsSA mid-year population estimates for the relevant year. No adjustment has been made for under-reporting or ill-defined causes of death notification. The rate for South Africa includes deaths that are not allocated to a specific province and will therefore be higher than the average provincial value. Based on the recorded province of death.

Health and Related Indicators 17
SAHR 2012/13 229
Table 9: TB case finding indicators by province
EC FS GP KZN LP MP NC NW WC SA RefProportion of extra-pulmonary TB2009 TB register 10 17 17 15 15 9 8 11 10 13 a
2010 TB register 9 17 16 15 16 9 8 10 10 13 a
2011 TB register 9 14 15 16 17 9 7 10 12 13 a
Reported cases of TB (PTB new Sm+) (per 100 000)2009 TB register 369.0 340.9 195.1 300.0 176.1 312.6 374.4 354.0 305.9 281.6 a
2010 TB register 349.7 329.9 202.3 262.2 178.1 263.4 304.6 332.2 296.0 264.3 a
2011 TB register 332.0 296.7 187.3 300.8 167.9 260.7 307.0 273.3 267.4 257.3 a
Reported cases of TB (PTB)2009 TB register 57 017 20 273 42 424 102 464 19 230 25 032 9 646 28 042 44 175 348 303 a
2010 TB register 55 744 19 917 47 060 100 421 18 365 23 217 9 435 26 706 43 805 344 670 a
2011 TB register 54 380 19 520 46 892 100 329 18 282 22 329 9 300 25 239 42 424 338 695 a
Reported cases of TB (all types)2009 TB register 63 807 24 940 51 660 122 642 22 836 27 511 10 503 31 682 50 118 405 699 a
2010 TB register 62 029 24 395 56 501 120 421 22 138 25 683 10 252 29 789 49 840 401 048 a
2011 TB register 60 046 22 772 55 460 118 911 22 158 24 451 10 044 28 113 48 019 389 974 a
Reported cases of TB (all types) (per 100 000)2009 TB register 948.2 885.9 469.9 1 162.6 424.6 767.1 956.0 997.0 976.0 820.2 a
2010 TB register 919.8 863.7 504.8 1 131.2 407.0 709.9 928.7 930.6 954.1 802.2 a
2011 TB register 902.3 777.1 496.2 1 119.5 421.1 667.7 867.3 825.5 864.6 773.3 a
Reported cases of TB (new Sm+)2009 TB register 24 827 9 597 21 447 31 652 9 470 11 210 4 113 11 249 15 709 139 274 a
2010 TB register 23 584 9 318 22 641 27 913 9 689 9 528 3 363 10 633 15 462 132 131 a
2011 TB register 22 093 8 693 20 936 31 952 8 835 9 545 3 555 9 307 14 854 129 770 a
Smear positivity (percentage of PTB cases which are new Sm+)2009 TB register 44 47 51 31 49 45 43 40 36 40 a
2010 TB register 42 47 48 28 53 41 36 40 35 38 a
2011 TB register 41 45 45 32 48 43 38 37 35 38 a
Reference notes (indicator definitions from page 310 and references from page 315):
a DoH TB.
Table 10: TB case holding indicators by province
EC FS GP KZN LP MP NC NW WC SA RefCure rate (new Sm+ cases) (%)2008 TB register 60.9 70.9 78.7 62.9 66.7 64.5 65.6 58.3 79.4 67.5 a
2009 TB register 66.0 71.4 79.0 66.3 70.3 73.0 69.7 64.6 80.9 71.1 a
2010 TB register 67.1 73.0 78.2 71.3 74.7 72.6 70.9 66.6 81.7 73.1 a
Defaulter (interruption) rate (new Sm+ cases) (%)2008 TB register 7.5 4.7 5.9 8.3 7.9 8.2 5.8 9.3 8.2 7.5 a
2009 TB register 7.8 4.6 6.3 7.3 7.7 7.1 5.8 8.7 7.1 7.1 a
2010 TB register 7.8 4.8 5.5 7.2 6.0 7.5 6.4 8.8 6.8 6.8 a
Smear conversion rate (new Sm+ cases) (%)2008 TB register 58.1 73.2 77.0 57.3 58.5 59.0 55.5 48.7 70.6 62.5 a
2009 TB register 61.2 72.9 78.6 61.1 63.0 69.5 66.8 53.3 74.9 66.5 a
2010 TB register 60.6 73.5 80.1 66.6 65.1 60.3 70.8 55.5 75.5 68.1 a
2011 TB register 65.9 73.3 81.9 72.1 70.5 67.9 70.5 59.6 74.5 71.7 a
Successful completion rate (new Sm+) (%)2008 TB register 77.1 76.8 80.8 74.0 74.1 70.3 79.2 69.4 83.5 76.4 a
2009 TB register 76.9 76.4 80.0 73.8 74.5 77.4 80.4 73.4 83.3 77.1 a
2010 TB register 76.9 77.8 82.3 77.6 77.0 76.4 80.9 74.8 85.0 78.9 a
Reference notes (indicator definitions from page 310 and references from page 315):
a DoH TB.

230 SAHR 2012/13
HIV and AIDS
Context Instead of reflecting a deep and divisive rift, data on HIV and AIDS are now openly discussed, and the considerable gains made are celebrated as evidence of the impact of new leadership and a healed polity. Challenges remain, but are faced openly and with visible commitment.
New data sources Nationally, new data have been reported in the:
• The National Antenatal Sentinel HIV and Syphilis Prevalence Survey, 2011
• First (2010) and Second (2011) South African Prevention of Mother-to-Child Transmission Evaluations
• Comprehensive Care Management and Treatment (CCMT) statistics
• National Health Laboratory Service data on PCR tests
• Third South African National Communication Survey 2012
Internationally, reports of interest include:
• UNAIDS Report on the Global AIDS Epidemic 2012
• UNAIDS/MSF Speed Up Scale Up. Strategies, tools and policies to get the best HIV treatment to more people, sooner, 2012
Key issues and trends The National Strategic Plan for HIV and AIDS, STIs and TB, 2012-2016 has set an array of targets, not all of which are easily measured. Nonetheless, there is good evidence to show that significant gains have already been made in relation to preventing mother-to-child transmission. There is also evidence of an effect on life expectancy. Integrating monitoring and evaluation systems for HIV into the mainstream systems remains a challenge at all levels.
South Africa’s path from pariah status in the eyes of the HIV world to recognition of the progress made, notably in relation to mother-to-child transmission, but also in relation to the sheer size of the public sector antiretroviral treatment (ART) programme has been well documented.92 The same editorial also provided more details on the planned rollout of the ‘tiered’ system for capturing ART-related data. This system, adopted by the National Health Council in December 2010 encompasses a paper-based system (tier 1; based on the Western Cape’s model), a non-networked electronic register (tier 2) and a networked electronic register (tier 3). The aim was to have an electronic register working in at least one facility per district by March 2012. These plans need to be borne in mind when reading the report of a study of the HIV monitoring and evaluation system which was published in 2012.93 It was conducted in a single district in a largely rural province in April to July 2009. It described a plethora of paper-based parallel systems. In addition, facility staff in the district devised their own forms. This vertically-designed system was, at best, partially integrated with the DHIS. The authors’ concluding remarks are worth considering, even in the light of the TIER.net developments: “We view M&E integration as being about more than just merging data recording forms and reporting and dissemination mechanisms. It is about breaking away from historical silo funding that promotes disease-specific M&E systems over strengthening overall health information systems and about building the capacity of HIS personnel and health system managers to take on programme-specific M&E coordination responsibilities. It is an incremental learning process that will require political commitment and investment of time and resources. Leveraging earmarked HIV funding to provide the needed resources to build overall HIS capacity is a practical way of translating health system strengthening intents of national HIV policy into tangible action.”
The goals set for the National Strategic Plan for HIV and AIDS, STIs and TB, 2012-2016 are driven by the UNAIDS “Three Zeros” vision (adapted locally as “Zero new HIV and TB infections; Zero new infections due to vertical transmission; Zero preventable deaths associated with HIV and TB; Zero discrimination associated with
HIV and TB”).13 Specifically, the goals for the current strategic plan are:
➢ “Reduce new HIV infections by at least 50% using combination prevention approaches;
➢ Initiate at least 80% of eligible patients on antiretroviral treatment (ART), with 70% alive and on treatment five years after initiation;
➢ Reduce the number of new TB infections as well as deaths from TB by 50%;
➢ Ensure an enabling and accessible legal framework that protects and promotes human rights in order to support implementation of the NSP; and
➢ Reduce self-reported stigma related to HIV and TB by at least 50%”.
The strategy also includes a set of indicators, with clear definitions, sources, baselines and targets for 2016 for most of the proposed measures. Tools for the measurement of the impact on stigma were, however, left to be devised later.
The starting point for much of what is known about the HIV pandemic at a particular point in time is the National Antenatal Sentinel HIV and Syphilis Prevalence Survey. The 2011 report covered the 22nd such national survey conducted in South Africa and included data from 33 446 first time antenatal care attendees at 1 445 public sector antenatal clinics.72 In 2011, the estimated national HIV prevalence was 29.5% (95% CI: 28.7-30.2%). Although this was reported as a decrease of 0.7% in the point estimate, this was within the 95% confidence intervals for the estimate recorded in 2010 (30.2%; 95% CI: 29.4-30.9), and did not differ significantly from the estimates for 2007 to 2009. By this measure, the prevalence of HIV infections among pregnant women aged 15-49 years attending public sector clinics is stubbornly stable. Only in KwaZulu-Natal did there appear to be a significant reduction in prevalence. Based on the UNAIDS SPECTRUM model, the estimated national HIV prevalence among the general adult

Health and Related Indicators 17
SAHR 2012/13 231
population aged 15-49 years old had also remained stable (at around 17.3%) since 2005, and the total number of people living with HIV in South Africa was estimated as 5 600 000 [5 300 000-5 900 000] in 2011. A cross-sectional biomarker survey (which included markers diabetes and cholesterol as well as HIV testing of dried blood spot specimens) in the Agincourt DSS reported an HIV prevalence of 19.4% in those aged 15 years and older in 2010-11 in this rural setting.94
Despite the lack of progress noted with antenatal prevalence of HIV, there is evidence of significant reductions in mother-to-child transmission. The evidence was summarised by Barron et al. as follows: “Between 2008 and 2011, the estimated proportion of HIV-exposed infants younger than 2 months who underwent routine polymerase chain reaction (PCR) tests to detect early HIV transmission increased from 36.6% to 70.4%. The estimated HIV transmission rate decreased from 9.6% to 2.8%. Population-based surveys in 2010 and 2011 reported transmission rates of 3.5% and 2.7%, respectively”.95 One of the contributory factors to this success was claimed to be “making use of data and indicators on all aspects of the PMTCT programme”. However, these authors did also admit that “[s]ome health districts have done better than others in ensuring that good quality data are collected routinely and that data are used by health workers and managers to continuously monitor and improve the programme”, and that “there is also a need for mentoring and supportive supervisory systems that can help facilities use data effectively on a regular basis”. A comprehensive evaluation of the PMTCT programme (entitled “Evaluation of the Effectiveness of the National Prevention of Mother-to-Child Transmission (PMTCT) Programme Measured at Six Weeks Postpartum in South Africa, 2010”) was published in 2012.96 This was a large cross-sectional survey, involving 10 820 infants at 572 public sector facilities. Preliminary data from the 2011 follow-up survey, in 10 106 infants from 580 facilities, were released in mid-2012.97 It was this set of data which pointed to a 2.67% (95% CI: 2.13-3.21) MTCT rate, and to predictions that the 2015 target of <2% perinatal HIV transmission at 6 weeks was within reach. Other insights have been gained from assessments within particular NGO programmes,98 within a particular province,99 in cross-country comparisons,100 and in relation to breastfeeding practices.101 The impact of more effective prevention has been documented in terms of HIV prevalence and mortality among paediatric hospital admissions at Chris Hani Baragwanath Hospital.102
Two other important HIV-related surveys have been completed or are in progress. Results from the Third South African National Communication Survey were released in 2012.103 This was a nationally-representative cross-sectional survey conducted with 10 034 respondents to determine exposure to HIV communication programmes, as well as HIV knowledge, attitudes, self-efficacy and behaviour. One of the key findings was that condom use at first sex was now a ‘social norm’ among South Africans aged 16-55 years, with reported use increasing from 18% to 66%, over a 20 year period. The reach of testing and counselling efforts was also confirmed, with 64% reporting having ever tested. Knowledge and update of male medical circumcision was also increased. Overall, 83% of respondents had been reached by at least one of 19 communications interventions in the year prior to the survey. While no data have yet been reported, the fieldwork for the fourth South African National HIV, Behaviour and Health Survey 2012 has been completed.104
The last decade has seen considerable progress in ensuring access to ART across sub-Saharan Africa.105 UNAIDS and MSF issued a joint report on global treatment scale-up in mid-2012, highlighting the strategies, tools and policies that have been effective.106 By mid-2011, South Africa had exceeded the treatment target set by the 2007-2011 National Strategic Plan, with an estimated 1.79 million (95% CI: 1.65-1.93 million) on treatment.107 At that stage, the proportion of adults in need accessing treatment was estimated to be 79% (95% CI: 70-85%), based on the eligibility criterion of CD4<200/µl, but only 52% (95% CI: 46-57%) when using the updated criterion (CD4<350/µl). However, it was noted that access by men and children was lagging that by women. Using data from PEPFAR implementers, a description of paediatric access showed an increase from 2 412 children on treatment in September 2005 to 79 416 children in September 2010.108
Estimates of the impact of HIV-related interventions can be made using mathematical modelling.109 Some local examples have looked at the impact of condom usage and ART on incidence,110 and the effect of early ART on paediatric mortality.111 Contributing factors to MTCT have also been explored in this way.112 At an African level, the impact of ART on the age composition of the epidemic has also been modelled.113 Each of these modelling exercises can provide important guidance to policy and practice. Data from the Hlabisa demographic surveillance site (DSS) have shown a dramatic increase in adult life expectancy, from 49.2 years in 2003 to 60.5 years in 2011.55 This study also calculated the cost-benefit ratio from ART implementation, and reported that the per capita gains were “2-6 times larger than the per capita cost of providing lifelong ART to every person who contracts HIV in this community”. Perhaps most tantalisingly, data from the same site showed that when more than 30% of HIV-infected persons in an area were receiving ART, those who were uninfected in that area had a 38% lower risk of acquiring HIV than those living in an area with low (10% or less) ART coverage.114 These data have been hailed as important real-world confirmation of the promise of treatment as prevention (TasP), although they would need confirmation in prospective studies (such as cluster-randomised controlled trials).
Globally, the annual report from UNAIDS is eagerly awaited each year.115 The 2012 edition provided a ranking of countries in terms of the degree to which HIV incidence rates in adults aged 15-49 years had changed between 2001 and 2011. Nine countries showed increases exceeding 25%, 12 were rated as ‘stable’, 14 (including South Africa) had achieved decreases of 26-49%, but 25 had achieved decreases of 50% or more. Areas in which incidence was increasing were in the Middle East, North Africa, Eastern Europe and Central Asia. Notably, South Africa was one of six countries (including Burundi, Kenya, Namibia, Togo and Zambia), in which the number of newly infected children had declined by 40-59% from 2009 to 2011. In terms of prevalence, the global estimate was that 34.0 million [31.4 million-35.9 million] people were living with HIV at the end of 2011, of which 69% were in sub-Saharan Africa.

232 SAHR 2012/13
Table 11: HIV and AIDS indicators by province
EC FS GP KZN LP MP NC NW WC SA RefAIDS orphans (maternal orphans <18 years)2009 ASSA2008 154 204 78 836 224 215 364 280 86 239 117 962 9 871 97 351 38 611 1 122 086 a
2010 ASSA2008 163 805 83 937 243 216 383 803 89 427 125 987 10 794 103 449 41 541 1 202 727 a
2011 ASSA2008 171 190 87 341 257 667 397 715 93 590 131 613 11 758 107 775 45 005 1 264 771 a
2012 ASSA2008 176 955 89 353 268 550 407 190 98 219 135 452 12 729 110 540 48 708 1 313 260 a
2013 ASSA2008 181 485 90 299 276 490 413 145 102 965 138 031 13 673 112 088 52 397 1 351 144 a
AIDS sick (number of people with AIDS-defining conditions)2009 ASSA2008 58 175 38 790 123 228 143 241 24 712 47 490 5 131 45 740 17 262 492 425 a
2010 ASSA2008 57 821 36 085 122 551 143 549 28 508 44 720 6 044 44 222 21 119 495 374 a
2011 ASSA2008 60 525 35 390 126 240 149 621 32 285 44 827 6 868 44 230 24 533 519 214 a
2012 ASSA2008 64 849 36 010 132 375 158 413 36 035 46 712 7 617 45 384 27 595 553 253 a
2013 ASSA2008 69 948 37 490 139 348 168 173 39 672 49 513 8 293 47 342 30 323 591 116 a
Antenatal client HIV 1st test positive rate (%)2009 DHIS 21.3 25.6 26.0 29.2 19.7 29.9 12.6 25.0 14.0 24.2 b
2010 DHIS 19.4 23.9 24.9 27.2 17.0 30.6 11.8 23.6 12.5 22.6 b
2011 DHIS 17.4 21.7 22.5 24.5 15.8 28.9 10.1 21.4 10.6 20.6 b
Antiretroviral coverage2009 total - - - - - - - - - 37.0 c
2010 total - - - - - - - - - 55.0 d
2011 adults - - - - - - - - - 52.0 e
Early infant diagnosis coverage2009 NHLS - - - - - - - - - 51.8 f
2009 NHLS in DHB 34.6 36.3 51.6 35.6 35.6 41.5 45.3 44.6 65.5 41.8 g
2010 NHLS - - - - - - - - - 59.8 f
2010 NHLS in DHB 41.6 54.4 64.8 54.1 45.1 51.4 61.2 60.6 74.5 55.2 g
2011 NHLS - - - - - - - - - 70.4 f
2011 NHLS in DHB 55.5 69.9 68.9 64.6 50.0 56.1 67.7 70.0 79.1 63.3 g
HIV incidence (%)2009 total population 0.9 0.8 0.6 1.0 0.6 0.9 0.4 0.8 0.3 0.8 a
2010 total population 0.8 0.8 0.6 1.0 0.5 0.9 0.4 0.8 0.3 0.7 a
2011 total population 0.8 0.8 0.6 1.0 0.5 0.9 0.4 0.8 0.3 0.7 a
2012 total population 0.8 0.7 0.5 1.0 0.5 0.9 0.4 0.8 0.3 0.7 a
2013 total population 0.8 0.7 0.5 1.0 0.5 0.8 0.4 0.8 0.3 0.7 a
HIV prevalence (%) (age 15-49)2009 ASSA2008 16.7 18.6 17.0 23.3 11.0 19.6 10.2 19.0 7.8 16.9 a
2009 Spectrum/EPP - - - - - - - - - 17.2 h
2010 ASSA2008 16.8 18.6 17.0 23.1 11.1 19.6 10.3 18.9 7.9 17.0 a
2010 Spectrum/EPP - - - - - - - - - 17.9 h
2011 ASSA2008 16.9 18.5 16.9 23.0 11.2 19.6 10.4 18.8 8.0 17.0 a
2011 Spectrum/EPP - - - - - - - - - 17.3 h
2011 StatsSA - - - - - - - - - 16.6 i
2012 ASSA2008 17.0 18.5 16.8 22.9 11.3 19.5 10.4 18.8 8.0 17.0 a
2013 ASSA2008 17.1 18.4 16.7 22.8 11.4 19.5 10.4 18.7 8.0 17.0 a
HIV prevalence (%) (antenatal)2009 28.1 30.1 29.8 39.5 21.4 34.7 17.2 30.0 16.9 29.4 j
2009 age <20 - - - - - - - - - 13.7 j
2009 age 15-24 - - - - - - - - - 21.7 j
2009 age 20-24 - - - - - - - - - 25.6 j
2010 29.9 30.6 30.4 39.5 21.9 35.1 18.4 29.6 18.5 30.2 k
2010 age 10-14 - - - - - - - - - 9.1 k
2010 age 15-19 - - - - - - - - - 14.0 k
2010 age 15-24 - - - - - - - - - 21.8 k
2010 age 20-24 - - - - - - - - - 26.7 k
2011 29.3 32.5 28.7 37.4 22.1 36.7 17.0 30.2 18.2 29.5 l
2011 age 10-14 0.0 10.0 11.1 12.5 7.1 12.5 0.0 20.0 6.7 - l
2011 age 15-19 11.2 17.0 12.0 16.8 7.4 14.0 8.1 13.4 7.4 12.7 l
2011 age 15-24 20.7 23.0 18.7 25.5 13.6 25.0 12.8 21.3 11.7 20.5 l
2011 age 25-29 35.7 38.1 33.5 50.0 27.4 48.9 21.6 34.8 23.0 36.3 l
2011 age 30-34 45.7 48.3 42.2 53.1 33.5 53.8 22.3 40.7 24.9 42.2 l
2011 age 35-39 36.0 45.6 38.4 53.1 33.7 52.6 16.5 39.6 23.5 39.5 l

Health and Related Indicators 17
SAHR 2012/13 233
EC FS GP KZN LP MP NC NW WC SA Ref2011 age 40-44 37.9 37.8 26.8 43.2 22.9 34.0 20.0 42.6 16.7 31.7 l
2011 age 45-49 27.3 0.0 33.3 52.9 15.8 24.0 25.0 40.0 0.0 30.4 l
HIV prevalence (%) (total population)2009 ASSA2008 10.1 12.0 11.3 14.7 6.6 12.3 6.5 12.4 4.9 10.7 a
2009 StatsSA - - - - - - - - - 10.4 i
2010 ASSA2008 10.3 12.0 11.3 14.8 6.8 12.4 6.6 12.4 5.0 10.9 a
2010 StatsSA - - - - - - - - - 10.5 i
2011 ASSA2008 10.6 12.0 11.2 14.9 7.0 12.5 6.7 12.4 5.1 11.0 a
2011 StatsSA - - - - - - - - - 10.6 i
2012 ASSA2008 10.8 12.1 11.2 15.1 7.1 12.7 6.8 12.5 5.2 11.1 a
2013 ASSA2008 11.0 12.1 11.2 15.2 7.3 12.8 6.9 12.5 5.2 11.2 a
2013 ASSA2008 female 13.1 13.8 12.6 17.3 9.6 15.7 8.4 13.9 6.5 13.0 a
2013 ASSA2008 male 8.6 10.4 9.8 12.9 4.6 9.6 5.3 11.1 3.9 9.3 a
Mother-to-child transmission rate of HIV <2 months of age2009 NHLS - - - - - - - - - 6.2 f
2009 NHLS in DHB 5.4 5.7 5.2 6.1 7.0 6.5 6.0 5.5 4.2 5.7 m
2010 NHLS - - - - - - - - - 4.4 f
2010 NHLS in DHB 4.0 4.1 3.3 3.8 4.5 3.8 3.5 3.5 3.1 3.7 m
2010 PMTCT survey 4.7 5.9 2.5 2.9 3.6 5.7 1.4 4.4 3.9 3.5 n
2011 NHLS - - - - - - - - - 2.8 f
2011 NHLS in DHB 2.9 2.5 2.4 2.5 3.2 3.0 2.9 2.6 2.0 2.6 m
2011 PMTCT survey 3.8 3.8 2.1 2.1 3.1 3.3 6.1 2.6 2.0 2.7 o
Number of patients receiving ART2009 Children (<15) - - - - - - - - - 76 000 p
2009 Men - - - - - - - - - 283 000 p
2009 NGO programmes - - - - - - - - - 47 000 q
2009 Private sector - - - - - - - - - 117 000 q
2009 Public sector - - - - - - - - - 748 000 q
2009 Women - - - - - - - - - 553 000 p
2010 Children (<15) - - - - - - - - - 113 000 p
2010 Men - - - - - - - - - 396 000 p
2010 NGO programmes - - - - - - - - - 60 000 q
2010 Private sector - - - - - - - - - 154 000 q
2010 Public sector - - - - - - - - - 1 073 000 q
2010 Women - - - - - - - - - 777 000 p
2011 Children (<15) - - - - - - - - - 152 000 p
2011 Men - - - - - - - - - 551 000 p
2011 NGO programmes - - - - - - - - - 78 000 q
2011 Private sector - - - - - - - - - 190 000 q
2011 Public sector - - - - - - - - - 1 525 000 q
2011 Women - - - - - - - - - 1 090 000 p
2012 Adults (men) 63 105 31 384 129 768 160 904 39 776 34 440 6 576 43 431 41 108 550 492 r
2012 Adults (women) 107 448 68 564 238 663 331 223 96 403 61 035 13 152 77 020 67 071 1 060 579 r
2012 Children 10 824 9 732 22 785 43 783 11 547 5 435 3 758 9 847 6 908 124 619 r
People living with HIV2009 ASSA2008 676 159 346 974 1 196 652 1 526 404 377 781 464 361 72 594 422 850 257 437 5 350 803 a
2009 Spectrum/EPP - - - - - - - - - 5 400 000 h
2010 ASSA2008 695 707 348 832 1 207 378 1 550 955 394 221 472 882 74 963 427 023 266 180 5 467 182 a
2010 Spectrum/EPP - - - - - - - - - 5 500 000 h
2011 ASSA2008 715 736 351 746 1 215 856 1 576 025 409 161 482 288 76 966 431 576 273 114 5 577 812 a
2011 Spectrum/EPP - - - - - - - - - 5 600 000 h
2012 ASSA2008 736 404 355 466 1 222 605 1 602 236 423 400 492 287 78 711 436 670 278 889 5 685 424 a
2013 ASSA2008 756 979 359 406 1 227 020 1 628 536 436 918 502 186 80 225 441 816 283 550 5 786 603 a
Percentage of deaths due to AIDS2009 ASSA2008 27.9 38.2 38.5 39.5 21.1 42.0 16.3 41.0 11.9 32.9 a
2009 StatsSA - - - - - - - - - 46.4 i
2010 ASSA2008 26.5 35.0 36.8 38.0 22.5 38.8 18.0 38.7 13.7 31.7 a
2010 StatsSA - - - - - - - - - 44.3 i
2011 ASSA2008 26.1 33.0 35.9 37.6 23.7 37.1 19.2 37.2 14.9 31.3 a
2011 StatsSA - - - - - - - - - 43.6 i
2012 ASSA2008 26.3 32.1 35.6 37.7 24.7 36.5 20.1 36.5 15.9 31.5 a
2013 ASSA2008 27.0 31.8 35.5 38.1 25.6 36.6 20.9 36.2 16.7 31.9 a

234 SAHR 2012/13
EC FS GP KZN LP MP NC NW WC SA RefProportion of ANC clients tested for HIV2009 DHIS 100.9 94.9 85.3 97.8 86.5 99.4 104.7 113.7 87.9 93.7 b
2010 DHIS 95.9 97.9 98.8 98.3 113.3 108.1 71.2 111.2 91.8 99.9 b
2011 DHIS 94.3 97.4 85.1 114.2 101.6 110.9 74.7 106.2 91.3 98.0 b
Reference notes (indicator definitions from page 310 and references from page 315):
a ASSA2008.62
b DHIS. Data extracted June 2012. Data for financial year from April of the year to March of the following year (not calendar year).
c Universal Access 2010.116 Based on WHO 2010 guidelines for ART.d Universal Access 2011.117 Range: 52-58%. Based on 1 389 865 people
receiving antiretroviral therapy.e Johnson 2012.107 Based on CD4 threshold of 350.f Barron et al. 2013.95
g DHB 2011/12.54 2009/10, 2010/11 and 2011/12 financial years. Numerator: NHLS PCR tests under 2 months of age. Denominator: Live births in facility from DHIS x antenatal HIV prevalence from antenatal surveys to estimate HIV-exposed infants.
h Antenatal Survey 2011.72 Modelled from antenatal HIV survey using the Epidemic Projection Package.
i StatsSA Mid-year estimates.34 2011 mid-year estimates used in calculation of population projections.
j Antenatal Survey 2009.118
k Antenatal Survey 2010.77
l Antenatal Survey 2011.72 National value for prevalence in the 10-14 age group was not provided in source.
m DHB 2011/12.54 2009/10, 2010/11 and 2011/12 financial years.n PMTCT Survey 2010.96
o PMTCT Survey 2011 prelim.97
p Johnson 2012.107 Totals reflect ART enrolment over the 12 months up to the middle of the year. Includes public and private sector estimates.
q Johnson 2012.107 Totals reflect ART enrolment over the 12 months up to the middle of the year.
r AHS 2012.67 End of financial year 2011/12. CCMT statistics provided for the Annual Health Statistics Publication.

Health and Related Indicators 17
SAHR 2012/13 235
Reproductive health
Contraception, sexual behaviour, sexually transmitted infections and termination of pregnancy
Context In a country with a generalised HIV and AIDS epidemic, measures of sexual behaviour and contraceptive practice are important, as they can provide some indication of the impact of HIV prevention efforts. Changes in contraceptive practice are also linked with changes in fertility and women’s reproductive choices.
New data sources Nationally, new data have been reported in the:
• Third South African National Communications Survey 2012
• National Income Dynamics Study (NiDS) Wave 1 and Wave 2
• District Health Information System (DHIS)
Internationally, reports of interest include:
• Save the Children Fund. Every Women’s Right, 2012
• Guttmacher Institute and United Nations Population Fund (UNFPA). Adding It Up: Costs and Benefits of Contraceptive Services—Estimates for 2012
Key issues and trends Although the National Communication Survey has confirmed the high levels of exposure to HIV communications that were shown in 2009, there are still areas of reproductive health practice that need careful attention. Access to quality reproductive health services is important not only for women’s health, but also for the health of their children. As before, data on terminations of pregnancy are inadequate to allow for any effective monitoring of access to this essential service.
The Third National HIV Communication Survey (NCS) was conducted in early 2012, with key findings being made available in July 2012.103 Responses were obtained from 10 034 respondents in all nine provinces, with the sampling designed to be representative of 16-55 year-olds across all race groups. Responses were stratified by levels of exposure to HIV communication programmes. Although the overall the level of exposure to at least one communication survey in the last 12 months had decreased from 90% in 2009 to 83% in 2012, there was evidence of substantial increases in behaviours that reduce the risk of HIV. These included condom use, undergoing HIV counselling and testing and voluntary medical male circumcision. The data also are said to confirm that exposure to HIV communication programs had a direct impact on people practising these behaviours and that exposure to campaigns for medical male circumcision had increased demand for these services. Condom use at first sex was associated with a lower risk of being HIV positive in the future and also with using condoms with one’s most recent partner. Condom use at last sex was stratified by partner type and showed marked differences, with a greater percentage of individuals using a condom with a casual partner than those who had a live-in partner or spouse. A large household survey on condom usage conducted in the Free State, in which responses were elicited from 5 837 adults, was also reported in 2012.119 This study provided useful insights into the potential reasons for refusing to use a condom. Interestingly, given their access to counselling as well as to healthcare services, a high rate of unintended pregnancy was demonstrated in a cohort of ART patients.120 Of 170 pregnancies in a cohort of 850 women, 62% were unplanned, indicating a clear need to better integrate reproductive health and HIV care systems.
Increased condom use appears to be the most significant explanatory factor for the decline in HIV incidence in South Africa between 2000 and 2008 – a 27% decline using the STI-HIV model and a 31% decline using the ASSA2003 model.110 Beksinska et al. discussed progress and challenges in relation to male and female condom use in South Africa.121 They noted several challenges to promoting effective and consistent condom use, including the failure to promote condoms as a barrier method for pregnancy
and HIV/STI prevention. The latter issue is highlighted by a study reporting that a high prevalence of asymptomatic urethritis/cervicitis pathogens exists amongst HIV-infected individuals offered voluntary STI screening and also that sub-optimal condom use with a regular partner is a risk factor for asymptomatic trichomonas vaginalis infection.122
A second Young Africa Live (YAL) Sex Survey was conducted by the Praekelt Foundation, covering the period from May 2011 to May 2012.123 Although the representivity of the survey may be questioned, it does report on over 170 000 responses by YAL’s user community to more than 50 questions about the views and behavioural characteristics of the youth. Condom use was reported on by 7 775 individuals of whom 54% reported using condoms every time (and thus at the last sex act), 23% reported inconsistent condom use, and 23% reported never using condoms. Of the 8 132 respondents who answered a question about when they had first had sex, 15% had done so by their 16th birthday, 27% between 16 and 18 years, 21% between 18 and 21 years and 10% over the age of 21 whilst 25% were still virgins. Of the 1 736 sexually active young women who answered the question “Have you had to deal with the consequences of teenage pregnancy?” in the affirmative, 64% had been pregnant (made up of 50% who had delivered and 14% who had opted for a termination) whilst 36% were using some form of family planning. Of the 4 402 young men who answered the question whether they would choose a hospital or traditional circumcision, the majority (51%) chose “Hospital – I don’t want to risk my health”, whilst 33% opted for “traditional as it’s part of culture”, and only 16% said they did not believe in getting circumcised. This finding is in contrast to a study from Cape Town amongst 199 predominantly Xhosa men who were older (median age 28; interquartile range: 22-35).124 The majority (n=147) reported having undergone traditional circumcision and an unwillingness to undergo further medical circumcision if the foreskin was only partially removed (n=127, 80%). Of the 50 men who were not yet circumcised but were planning on being circumcised, 75% reported that a medical circumcision would be against their religion.

236 SAHR 2012/13
The total number of condoms distributed nationally in 2011/12 was 392 million, although only 272 million were recorded in DHIS. On average, 15.8 male condoms were distributed per male 15 years and older in 2011/12. This rate has been steadily increasing, with a more than three-fold improvement from a base of 4.6 in 2000/01.54
Findings from a study amongst 245 women in KwaZulu-Natal at high risk of acquiring HIV suggest that that gender inequality and access to formal education, as opposed to lack of HIV/AIDS knowledge, prevent safer sexual practices. Participants demonstrated a high level of HIV/AIDS knowledge. Overall, 60.3% of participants reported condom use. Reported condom use at last sexual encounter varied slightly by partner type (57.0% with steady versus 64.4% with casual partners), and self-perceived ability to choose to use a condom was significantly lower with steady partners compared to casual partners (p<0.01).125
Attention to HIV risk should not obscure the importance of contraception options for women’s reproductive health, as well as the health of their children.126 Put simply, “[t]here are strong links between the provision of family planning and improvements in child health and survival”. In 2012, the Guttmacher Institute and United Nations Population Fund (UNFPA) provided updated estimates of the numbers and proportions of women in the developing world using and in need of modern contraception methods.127 Adolescent sexual and reproductive health is often neglected, and needs to be addressed by the new Integrated School Health Programme. Data from the National Income Dynamics Study (NiDS) Wave 1 has shown that the greatest risk of teenage pregnancy is among those who have never entered secondary school.42 However, the greatest number of births to teenage mothers was recorded in those with an incomplete secondary school education. Karra and Lee have summarised the available data from two recent studies on teenage pregnancy – the Cape Area Panel Study and the Africa Centre Study.128 Both studies showed teenage mothers to be at risk of worse educational outcomes, and also documented adverse effects on maternal and child health.
One of the options open to a woman with an unplanned pregnancy in South Africa is a safe and legal abortion. Orner et al. have explored the available evidence on barriers to accessing such services, particularly for women living with HIV, contrasting the situation in Brazil, Namibia and South Africa.129 Despite the existence of an enabling policy and legislative framework, the authors pointed out that “many South African women continue to face numerous obstacles to safe abortions”, and that “changing laws is not enough”. One way to maintain pressure would be to insist on accurate and up-to-date reporting of the provision of such services. The large number of terminations of pregnancy recorded annually in DHIS (77 780 in 2011/12) suggests a significant unmet need for contraception. Globally, the abortion rate was stable between 2003 and 2008, but lower in countries with more liberal abortion laws.130 Worryingly, it appears that the proportion of abortions that are unsafe has increased over time. A rare insight into local public sector services was provided by a prospective audit conducted at a district health facility in KwaZulu-Natal between February and September 2009.131 Of the 645 women enrolled in the study, 34.4% had previously used a family planning method, with the most common (35.1%) being an injectable hormonal contraceptive. Notably, none of the women was offered an HIV test or given any information about sexually transmitted infections prior to discharge.

Health and Related Indicators 17
SAHR 2012/13 237
Table 12: Contraception and sexual behaviour indicators by province
EC FS GP KZN LP MP NC NW WC SA RefAge of first sex under 14 years (% having first had sex at age 14 or younger)2009 female age 16-19 - - - - - - - - - 4.0 a
2009 female age 16-24 - - - - - - - - - 5.0 a
2009 male age 16-19 - - - - - - - - - 8.0 a
2009 male age 16-24 - - - - - - - - - 14.0 a
Condom use at last sex (%)2009 - 61 - - - - - - - - b
2009 age 16-55 34 36 45 40 40 46 23 46 27 40 a
2012 overall - - - - - - - - - 60 c
2012 with a casual partner
- - - - - - - - - 76 d
2012 with a main/regular partner
- - - - - - - - - 65 d
2012 with spouse - - - - - - - - - 28 d
Couple year protection rate2009 DHIS 29.7 32.0 27.1 24.2 35.4 31.6 33.6 26.0 59.4 31.9 e
2010 DHIS 30.4 32.4 26.3 24.2 32.7 33.0 36.0 26.3 58.8 31.6 e
2011 DHIS 31.2 34.7 26.2 27.1 36.5 33.7 35.1 23.6 58.3 32.7 e
Ever had sex (%)
2009 age 16-24 - - - - - - - - - 70 a
2009 female age 16 - - - - - - - - - 31 a
2009 male age 16 - - - - - - - - - 17 a
HIV knowledge, people who know that a person can protect him / herself from HIV infection by condom2009 age 16-55 96.0 90.0 93.0 91.0 95.0 96.0 93.0 84.0 94.0 93.0 a
Male circumcision (% of men who are circumcised)2009 NCS 2009 73.0 34.0 46.0 18.0 77.0 36.0 17.0 33.0 42.0 42.0 f
2012 NCS 2012 - - - - - - - - - 48.1 g
Male condom distribution rate2009 DHIS 12.1 8.6 8.2 8.2 14.6 16.3 6.7 7.2 38.6 13.3 e
2010 DHIS 14.5 9.9 8.3 8.2 13.6 20.2 9.5 8.3 45.8 14.8 e
2011 DHIS 14.8 12.2 7.9 11.1 19.7 19.4 8.3 6.0 45.7 15.8 e
Male condoms distributed (thousands)2009 - - - - - - - - - 445 156 h
2010 69 186 29 853 87 075 72 020 52 116 51 289 15 002 44 492 71 165 492 198 i
2011 36 939 25 050 77 150 74 262 44 934 44 322 8 192 29 814 51 260 391 923 j
Reference notes (indicator definitions from page 310 and references from page 315):
a NCS 2009.132 Downloaded 2011-05-26.b Chandran et al. 2012.119 The sample (n = 5 837) consisted of 76% urban
and 24% rural residents. There were 57% women and 91% Africans compared to 52% and 87% respectively in the population of the Free State province. Most study participants were young (57% in the age group 18 to 29 years; 27% between 30-39 years, 12% between 40 to 49 years, and 4% were above 50 years). Almost 34% of the participants were married or living together. Most participants were unemployed or students. Seven per cent of the participants had completed higher education.
c NCS 2012.103 Estimated. 41.3% for those with least exposure to communication programmes and 63% for those with most exposure.
d NCS 2012.103
e DHIS. Data extracted June 2012. Data for financial year from April of the year to March of the following year (not calendar year).
f NCS 2009.132 Downloaded 2011-05-26. Survey sampled men aged 16-55.
g NCS 2012.103 Survey sampled men aged 16-55. Among the 5 471 890 men who said they were not circumcised: Almost a million said they definitely intended to get circumcised in the next 12 months. Of those that say they will definitely get circumcised, 80.5% (803 690) intend to have a medical circumcision.
h DoH Annual Report 2009/10.133
i AHS 2012.67 Data for financial year from April of the year to March of the following year (not calendar year). Target 1 billion. Funding for the procurement of an additional 500 million condoms to meet the demand generated by the HCT campaign was received late in December 2010 (DoH Annual Report 2010/11).
j AHS 2012.67 Data for financial year from April of the year to March of the following year (not calendar year). Delays in awarding the national tender for male condoms due to legal action initiated against National Treasury - Delays in the registration of approved service providers by provinces - Many service providers were unable to meet service demands (DoH Annual Report 2011/12).

238 SAHR 2012/13
Table 13: STI indicators by province
EC FS GP KZN LP MP NC NW WC SA RefSTI partner treatment rate (%)2009 DHIS 22.4 22.9 20.7 18.5 20.7 26.3 19.2 25.9 26.1 21.3 a
2010 DHIS 23.3 22.4 21.5 20.8 22.8 25.5 22.2 26.8 29.5 22.6 a
2011 DHIS 24.3 22.6 22.4 20.7 22.1 33.4 23.8 24.7 31.2 23.3 a
STI treated new episode incidence2009 DHIS 4.6 3.3 3.5 6.7 4.7 4.1 2.8 3.5 1.9 4.3 a
2010 DHIS 4.4 3.1 3.4 6.5 3.8 3.6 2.3 3.0 1.7 3.9 a
2011 DHIS 4.4 2.9 3.4 6.6 3.5 3.5 2.4 2.5 1.6 3.9 a
Reference notes (indicator definitions from page 310 and references from page 315):
a DHIS. Data extracted June 2012. Data for financial year from April of the year to March of the following year (not calendar year).
Table 14: Termination of pregnancy indicators by province
EC FS GP KZN LP MP NC NW WC SA RefToP facilities functioning (%)2009 CHCs - - - - - - - - - 25.0 a
2010 CHCs - - - - - - - - - 46.0 b
2011 - - - - - - - - - 57.0 c
ToP rate (%)2009 DHIS 5.3 8.0 9.9 1.9 5.7 2.6 3.4 6.7 10.6 5.9 d
2010 DHIS 4.9 7.4 8.5 1.8 5.9 2.7 4.4 7.5 9.4 5.6 d
2011 DHIS 7.2 7.8 8.3 2.3 6.3 3.3 4.1 8.3 8.8 6.1 d
ToPs (Terminations of Pregnancy)2009 DHIS 10 530 6 262 23 521 5 540 8 630 2 456 975 5 959 13 274 77 147 e
2010 DHIS 8 980 5 595 20 955 5 040 8 342 2 680 1 241 6 444 12 271 71 548 e
2011 DHIS 12 397 5 648 21 318 6 560 8 555 3 340 1 144 6 890 11 928 77 780 e
Reference notes (indicator definitions from page 310 and references from page 315):
a DoH Annual Report 2009/10.133 The main challenge was the high turnover rate among nurses trained to provide first trimester termination of pregnancy.
b DoH Annual Report 2010/11.134 Target 40%. Designation of ToP facilities is now a provincial responsibility, and consequently there has been a decrease in the designation of facilities, resulting in a higher proportion functioning.
c DoH Annual Report 2011/12.135 2011/12 financial year. Additional facilities were designated to provide CToP services during the reporting period.
d DHIS. ToPs as % of all expected pregnancies in catchment population. Data extracted June 2012. Data for financial year from April of the year to March of the following year (not calendar year).
e DHIS. Data extracted June 2012. Data for financial year from April of the year to March of the following year (not calendar year).

Health and Related Indicators 17
SAHR 2012/13 239
Maternal health
Context South Africa has committed to the African Union’s Campaign for Accelerated Reduction of Maternal and Child Mortality (CARMMA). At the national level, this is evident in the Strategic Plan for Maternal, Newborn, Child and Women’s Health (MNCWH) and Nutrition in South Africa 2012-2016.
New data sources Nationally, new data have been reported in the:
• Saving Mothers 2008-10
• Ninth Interim Report on the Confidential Enquiries into Maternal Deaths in South Africa 2011
• District Health Information System (DHIS)
Internationally, reports of interest include:
• WHO. Trends in maternal mortality: 1990 to 2010
Key issues and trends ➢ There is evidence from the most recent report of the National Committee for Confidential Enquiries into Maternal Deaths (NCCEMD) that institutional MMRs (iMMR) had decreased in 2011, compared with 2008-2010. This has been attributed to increasing access to ART in pregnant women.
➢ Establishment of District Clinical Specialist teams as part of PHC re-engineering is one initiative that is intended to strengthen maternal and child health services.
The targets set for the Strategic Plan for Maternal, Newborn, Child and Women’s Health (MNCWH) and Nutrition in South Africa 2012-2016 are those agreed to by the Health Data Advisory and Coordination Committee (HDACC) in 2011:
➢ reducing the Maternal Mortality Ratio from a baseline of 310 per 100 000 live births (2009) to 270 (2014);
➢ reducing the Under 5 mortality rate from a baseline of 56 per 1 000 live births (2009) to 50 (2014) and 40 (2016);
➢ reducing the Infant Mortality Rate from a baseline of 40 per 1 000 live births (2009) to 36 (2014) and 32 (2016); and
➢ reducing the Neonatal Mortality Rate from a baseline of 14 per 1 000 live births (2009) to 12 (2014) and 11 (2016).136
However, this strategy document also includes very detailed targets for individual interventions. For instance, increasing the percentage of children with diarrhoea who receive zinc from less than 5% to 95%.Other targets include working with pharmaceutical services to “decrease the % of PHC facilities which experience stock-outs of essential drugs” (for which no baseline data are provided, but a target of <5% of facilities is stipulated) and working with the National Blood Transfusion Service to “increase the % of hospitals where caesarean sections are performed that have blood available” (again with no baseline, but a target of 100%). The monitoring and evaluation framework noted that “[m]any of these indicators can only be collected through large-scale surveys which are conducted intermittently (often every three to five years)”.
In addition to this overarching strategic document, a document entitled “South Africa’s National Strategic Plan For A Campaign on Accelerated Reduction of Maternal And Child Mortality In Africa (CARMMA)” has also been produced, in support of the African Union’s initiative.137 This states that the “targets and indicators for CARMMA in South Africa are in line with the MDG4 (Reduce child mortality) and MDG5 (Improve maternal health), as harmonized with the Maputo Plan of Action for the Operationalization of the Continental Policy Framework”. The document then lists an extensive set of ‘key components’, as follows:
a) “Strengthen and promote access to comprehensive [sexual and reproductive health and rights] SRHR services, with specific focus on family planning services.
b) Advocacy and health promotion for early antenatal care and attendance/ booking.
c) Improve access to Skilled Birth Attendants by:
• Allocating dedicated obstetric ambulances to every sub-district to ensure prompt transfer of women in labour and women and children with obstetric and neonatal emergencies to the appropriate level of care.
• Establishment of maternity waiting homes.
d) Strengthening Human Resources for Maternal and Child Health by:
• Providing training on Essential Steps in Management of Obstetric Emergencies (ESMOE) to doctors and midwives.
• Intensifying midwifery education and training.
e) Improve child survival by:
• Promoting and supporting exclusive breastfeeding for at least 6 months.
• Providing facilities for lactating mothers (boarder mothers) in health facilities where children are admitted.
• Promotion of Kangaroo Mother Care (KMC) for stable low birth weight babies at all levels of care.
• Advocacy for appropriate care and support for pregnant women and lactating mothers in the workplace.
• Improving immunization and vitamin A coverage.
• Intensifying management of severe malnutrition in health facilities.
• Intensifying case management of sick children through:
• improving implementation of key family practices including diarrhoea management at home
- strengthening implementation of [the Integrated Management of Childhood Illnesses] IMCI in all primary health care facilities
- strengthening clinical skills for the management of severe diseases including pneumonia and diarrhoea in referral facilities
240 SAHR 2012/13
f) Intensifying management of HIV positive mothers and children by:
• Improving access to treatment for both mothers and children
• Improving management of co-infections and
• Eliminating Mother-to-Child Transmission of HIV”.
To this already daunting list must be added the re-engineering of Primary Health Care initiative, and the efforts to deploy district clinical specialist teams in 25 districts with poor maternal and child health outcomes. The potential data demands for such wide-ranging interventions are immense. A useful review of the evidence base for key interventions in this area was published by the Partnership for Maternal, Newborn & Child Health in 2011.138
Nationally, the most recent report from the National Committee for Confidential Enquiries into Maternal Deaths (NCCEMD), the ninth interim report, covers deaths that occurred in 2011, as reported up to August 2012.139 The report stated that the institutional Maternal Mortality Ratio (iMMR) had decreased in 2011, compared with that reported for the 2008-2010 period. The authors believed that this decrease “was virtually entirely limited to deaths due to non-pregnancy related infections, the vast majority of whom are HIV infected”, and that this was early evidence of the effect of increasing access to ART in pregnant women.
One of many avoidable factors that may contribute to poor maternal outcomes is late booking for antenatal care. The District Health Barometer (DHB) reported that only 40.2% of first antenatal visits recorded in DHIS took place before 20 weeks gestation.54 A study in North West province identified, through a process of community dialogues, a variety of reasons for booking late, including late disclosure of pregnancy by teenagers, fear of testing for HIV, and poor nurse attitudes.140 Furthermore, cultural beliefs cited as barriers included wanting to wait until the first trimester has passed for fear of miscarriage, and beliefs that iron supplementation provided during pregnancy risked “making the tummy larger”. Psychological reasons, including dealing with unplanned pregnancies and sexual assault, are also known to contribute to late booking. Additional reasons for a low antenatal 1st visit before 20 weeks are a lack of understanding and insufficient education on the importance of antenatal care, which may appear inconsequential to some. Furthermore, unsuitable hours for booking visits for school girls and working individuals, as well as transport issues, are considered to be important barriers.
Globally, WHO has reported on trends in maternal mortality for the period from 1990 to 2010.141 This also linked the increases seen in MMRs in southern African countries (specifically in Botswana, Lesotho, Namibia, South Africa and Swaziland) between 1990 and 2000 to HIV epidemic, and noted recent reversals of these trends. It was noted further that all of these countries had now met the 2001 UN General Assembly Special Session (UNGASS) goal of providing ARVs for PMTCT to 80% of pregnant women living with HIV.

Health and Related Indicators 17
SAHR 2012/13 241
Table 15: Maternal health indicators by province
EC FS GP KZN LP MP NC NW WC SA RefANC coverage (%)2009 DHIS 88.1 84.0 140.7 99.1 124.3 104.0 93.9 98.3 94.7 106.8 a
2010 DHIS 94.6 85.6 112.9 99.1 106.3 98.9 131.3 95.9 89.9 100.7 a
2011 DHIS 99.4 87.1 121.1 90.1 111.8 99.9 127.8 102.0 80.8 101.2 a
ANC visits per client2009 DHIS 3.0 4.3 3.2 3.8 2.9 3.4 4.5 3.7 4.7 3.5 a
2010 DHIS 3.0 4.2 3.6 4.0 3.4 3.5 3.5 3.9 4.5 3.7 a
2011 DHIS 3.1 4.3 3.7 4.6 3.6 3.5 3.7 3.5 4.6 3.8 a
Caesarean section rate (%)2009 Private hospitals - - - - - - - - - 68.0 b
2009 DHIS 22.3 18.7 20.8 25.8 14.7 15.6 16.6 15.4 20.8 20.3 c
2010 DHIS 24.3 20.8 23.0 26.9 14.6 15.8 17.6 16.1 22.9 21.6 c
2011 DHIS 25.0 22.5 24.3 28.6 14.9 16.4 19.5 16.7 24.5 22.7 c
Delivery rate in facility (%)2009 DHIS 71.4 77.5 104.1 79.3 99.2 91.4 85.0 80.1 94.3 87.3 a
2010 DHIS 75.8 78.2 98.5 80.6 104.6 86.8 90.1 78.3 89.9 87.4 a
2011 DHIS 83.4 79.8 96.3 84.2 114.2 90.5 85.6 84.6 83.9 90.1 a
Maternal mortality ratio (MMR)2009 VR adjusted - - - - - - - - - 333 d
2010 DHIS 148 237 94 197 142 161 91 205 - 139 e
2010 NCCEMD 2008-10 193 289 148 192 165 184 250 230 85 176 f
2010 WHO (2012 estimates) - - - - - - - - - 300 g
2011 DHIS 115 199 123 192 185 135 148 190 29 145 e
2011 IHME (2011 estimates) - - - - - - - - - 91 h
2011 NCCEMD - - - - - - - - - 157 i
Number of maternal deaths2009 NCCEMD 263 171 319 378 196 115 53 161 110 1 766 j
2010 DHIS 172 112 185 365 172 113 19 111 - 1 249 e
2010 NCCEMD 232 120 293 385 198 150 52 134 82 1 646 j
2010 WHO (2012 estimates) - - - - - - - - - 3 200 g
2011 DHIS 137 94 250 366 236 101 30 107 26 1 347 e
2011 IHME (2011 estimates) - - - - - - - - - 961 h
2011 NCCEMD - - - - - - - - - 1 466 i
PMDF (proportion maternal among deaths of females of reproductive age)2010 WHO (2012 estimates) - - - - - - - - - 2.3 g
Reference notes (indicator definitions from page 310 and references from page 315):
a DHIS. Data extracted June 2012. Data for financial year from April of the year to March of the following year (not calendar year).
b NaPeMMCo 2008-2010.142 Year of data not specified. Presumed to be an average of several years’ data around 2009. The three large hospital groups provided data from a total of 117 hospitals with delivery numbers for the individual hospitals ranging between around 4000 and less than 50 per year.
c DHIS. All types of facilities. Data extracted June 2012. Data for financial year from April of the year to March of the following year (not calendar year).
d RMS 2011.59 The MMR is calculated (according to the method proposed by HDACC) from adjusted vital statistics by proportional redistribution of the ill-defined natural causes (ICD codes R00-R99) among the specified natural causes. Thereafter, the number is adjusted to allow for the fact that about 7% of deaths are not registered.
e DHIS. Institutional (facility) MMR based only on maternal deaths in facilities. Data extracted June 2012. Data for financial year from April of the year to March of the following year (not calendar year). WC data not imported into DHIS for some years.
f Saving Mothers 2010.143 Average value for 2008-2010. Institutional (facility) MMR based only on maternal deaths in facilities, captured into the database for confidential enquiries into maternal deaths. Note that there are minor discrepancies between the provincial totals and sum of district values given in the publication. The calculated MMR may also vary from other sources depending on the number of live births used in the denominator.
g Maternal Mortality 1990-2010.141
h Lozano et al. 2011.144
i Saving Mothers report 2011,139 as reported by the media.j Saving Mothers 2010.143

242 SAHR 2012/13
Child health
Context Decreasing maternal and child mortality is one of four key outputs articulated in the Negotiated Service Delivery Agreement (NSDA) 2010-2014. Both maternal and child health are also the focus of a number of the Millennium Development Goals. The level of attention paid to these topics is evident from the large number of international reports issued. Two national committees (NaPeMMCo and CoMMiC) have also reported on perinatal and under-five mortality.
New data sources Nationally, new data have been reported in the:
• South African Child Gauge 2012
• UNICEF South Africa Annual Report 2011
• National Perinatal Mortality and Morbidity Committee (NaPeMMCo) Triennial Report (2008-2010) and interim 2010-2011 report
• 1st Triennial Report of the Committee on Morbidity and Mortality in Children Under 5 Years (CoMMiC) 2011
• StatsSA Levels and trends of morbidity and mortality among children aged under-five years in South Africa, 2006-2010 (2012)
• MRC Under-5 Mortality Statistics In South Africa: Shedding some light on the trend and causes 1997-2007 (2012)
• MRC Rapid Mortality Surveillance report 2011
• District Health Information System (DHIS)
Internationally, reports of interest include:
• UNICEF. The State of the World’s Children 2012
• Save the Children. The Child Development Index 2012
• WHO. Born too soon: The Global Action Report on Preterm Birth 2012
• Countdown to 2015 – various reports
• UNICEF. Committing to Child Survival: A Promise Renewed. 2012
• UN Inter-agency Group for Child Mortality Estimation updated estimates of child mortality (www.childmortality.org)
• UNICEF/WHO. Immunization Summary: A statistical reference containing data through 2011
Key issues and trends ➢ Targets have been set by both the Strategic Plan for Maternal, Newborn, Child and Women’s Health (MNCWH) and Nutrition in South Africa 2012-2016 and the School Health Policy and Implementation Guidelines (June 2011) updated in 2012 as the Integrated School Health Policy.
➢ As noted in the section on mortality, significant progress has been noted in relation to the under-five mortality rate and the infant mortality rate, but not the neonatal mortality rate.
The targets set for the Strategic Plan for Maternal, Newborn, Child and Women’s Health (MNCWH) and Nutrition in South Africa 2012-2016 have already been described.136 The School Health Policy and Implementation Guidelines also proposed a set of indicators.145,146 These are:
➢ the number of schools implementing school health programmes;
➢ the number of primary schools visited to conduct learner assessments;
➢ the proportion of learners referred for visual impairment, hearing impairment, speech impairment and oral health;
➢ the number of Grade 1 learners screened at primary schools;
➢ the proportion of learners referred for Tetanus Toxoid (Td) among 6-year-old learners and among 12-year-old learners;
➢ the proportion of learners referred for mental health problem or other health condition, and for social support;
➢ the number of learners who received deworming medication; and
➢ the proportion of follow-ups made by school health nurses.
Each of these implies the collection of routine data by personnel involved in this service. Selected indicators from the Integrated School Health Programme (ISHP) are included in the 2013 National Indicator Data Set (NIDS).
Each year, the UNICEF State of the World’s Children report presents a snapshot of the global situation.147 The 2012 edition focused on the status of children in urban settings. Already more than 1 billion children live in such settings. While, traditionally indicators of child health have been expected to be better in urban rather than rural settings, these figures have disguised the plight of the urban poor. The report noted the paucity of what it termed intra-urban data: “Reliable statistics can help illuminate the plight of poor and marginalized children in urban settings – after all, it is difficult to argue with facts. However, this seemingly straightforward process is hampered by the limited availability of urban data that are meaningfully disaggregated – by wealth, residence, gender, ethnicity, city size or other relevant criteria”.
Another aggregate set of data is presented in Save the Children’s Child Development Index 2012.148

Health and Related Indicators 17
SAHR 2012/13 243
Child mortality
As the definitions used in this area are overlapping and often confusing, they are depicted here for convenience (Figure 2). Two national committees have provided new reports in this area: the Committee on Morbidity and Mortality in Children Under 5 Years (CoMMiC)149 and the National Perinatal Mortality and Morbidity Committee (NaPeMMCo).142
Figure 2: Definitions of mortality in children
Stillbirths Early neonatal deaths
Late neonatal deaths
Post-neonatal deaths
Child deaths
>28 weeks gestation
Birth < end of the 7th day
8th day < end of 27th day
28th day < end of 365th day
1st year < end of 4th year
Perinatal Mortality
Neonatal Mortality Post-neonatal Mortality
Infant Mortality Child Mortality
Under-5 Mortality
The CoMMIC report was the first from this national committee, covering the period from 2008 to 2011.149 It was one of three national committees established to review maternal, perinatal and childhood deaths in South Africa. CoMMIC was tasked to “establish the magnitude of childhood deaths in the country, identify the direct and indirect causes of childhood mortality, offer recommendations to reduce childhood morbidity and mortality in South Africa, and assist in the development of implementation plans”. The committee reported that it had seen its role in this first three-year period as being to “establish a foundation for the ongoing collection of appropriate child mortality data, particularly within the public health system”. The committee’s primary concern, that “the country and the national health department lacks an overarching strategy for the health of children” would appear to have been addressed by the development of the Strategic Plan for Maternal, Newborn, Child and Women’s Health (MNCWH) and Nutrition in South Africa 2012-2016. However, much still remains to be achieved through effective implementation of all elements of that strategy. In relation to information systems, the committee emphasised the need to strengthen what it referred to as ‘essential data systems’, these being vital registration, the District Health Information system (DHIS), Demographic and Health Surveys (DHS), the Child healthcare Problem Identification Programme (Child PIP) and the Road to Health Booklet. Accordingly, it recommended modifications to death notification forms, the introduction of standardised children’s ward admission and discharge registers, improved collection and utilisation of DHIS data, and integration of Child PIP into quality improvement processes at hospital and district level. In order to drive these changes, it recommended the establishment of District Child Health Forums and Provincial Child Health Forums, which would “review and respond to local (district or provincial) child mortality data; hospital based workload, morbidity and mortality indicators; and primary healthcare child health programme (such as PMTCT, IMCI, EPI or nutrition) indicators”.
The NaPeMMCo report covered the 2008 to 2010 period.142
This committee, also established in 2008, was tasked to “audit all perinatal and neonatal deaths occurring in the country and produce annual reports and a final triennial report in 2011”. The report noted that there are currently two national systems for gathering such data: the DHIS records stillbirths and neonatal deaths occurring within public sector facilities, whereas the Department of Home Affairs (DHA) records deaths occurring in public and private sector facilities as well as in the community. Data from the DHA are then forwarded to StatsSA for analysis. In addition, information on the pathological and health system causes of perinatal and neonatal deaths are recorded by the Perinatal Problem Identification Program (PPIP), which falls under the auspices of the Medical Research Council. These data are collected from maternity and neonatal wards in public sector facilities, but not from other children’s wards (which contribute to the Child PIP dataset). Except for DHA/StatsSA, all the above-mentioned databases collect data primarily in the public sector only. The NaPeMMCo report did include data about neonatal deaths occurring in some private hospitals. The report emphasised that good quality national data required a process of review at both the healthcare facility and provincial levels – “by both those who collect it and those who need to use it on a regular basis”. The establishment of Provincial Perinatal Morbidity and Mortality Committees (ProPeMMCo) was therefore recommended. There are increasingly refined methods available to help identify targets areas for intervention, in terms of both the administrative areas (such as sub-districts) to select and the most important intervention to apply.150
An excellent summary of the available data on neonatal mortality was also published by Velaphi (who chaired NaPeMMCo) and Rhoda in 2012.151 Noting that “South Africa is one of the countries in which neonatal mortality has remained the same or increased over the last 20 years”, the authors listed the key clinical interventions that were known to make a difference: “providing basic and comprehensive emergency obstetric care, use of antenatal steroids for women in preterm labour, training in immediate care of the newborn and neonatal resuscitation, and post-resuscitation management and ongoing neonatal care (e.g. [continuous positive airway pressure] CPAP), especially to babies who are born preterm”. Preterm birth has been highlighted in a major international call to action, which has documented 15 million such births and 1.1 million deaths from preterm complications per year globally.152 Another target for action has been in relation to pneumonia and diarrhoeal disease, cited as “the deadliest diseases for the world’s poorest children”.153
As was detailed in the section on Mortality, StatsSA published a report on mortality and causes of death in children under five years, including a focus on diarrhoea and respiratory diseases, covering 2006 to 2009.57 To address the time lag in the availability of the cause of death reports, child mortality indicators based on the Rapid Mortality Surveillance (RMS) system were also produced up to 2011.59 The RMS data suggest a dramatic decline in the infant- and under-five mortality rates from 2009 to 2011.
South Africa’s mixed performance in relation to child health was particularly noted in the Child Development Index 2012 report.148
The country’s ranking on this index fell 24 places between the periods 1995-1999 and 2005-2010, as it was overtaken by countries making greater progress. Two major contributors were poverty and HIV, which again underline the importance both of

244 SAHR 2012/13
the Child Care Grant and progress with access to PMTCT and paediatric ART.
Given the international focus on child mortality, it is not surprising that reviews of available data from multiple countries have been published and progress tracked over time. Examples include a systematic analysis of available data on preterm birth in 184 countries between 1990 and 2010,154 a systematic analysis of data on the causes of child mortality from 2000 to 2010,155 a summary of the available data on progress from the United Nations Inter-agency Group for Child Mortality Estimation,156 UNICEF’s update on progress with improving child survival,157 and reports from the Countdown to 2015 tracking of maternal, newborn and child health interventions.158,159 There have also been attempts to explore relationships between various variable and child health outcomes. These have included a modelling of the effects of health systems determinants on infant, child and maternal mortality160 and exploration of the effect of maternal obesity on neonatal death in sub-Saharan Africa.161
The ongoing contestation between various estimates of under-five mortality, such as those issued by the United Nations Inter-agency Group for Child Mortality Estimation (UN IGME) and the Institute for Health Metrics and Evaluation (IHME), has also received attention.162 These authors offer a pragmatic conclusion and way forward: “Often differences are illustrative of the lack of reliable data and likely to decrease as more data become available. Improved transparency on methods and data used will help to improve understanding about the drivers of the differences”. Locally, a very comprehensive review of under-five mortality statistics in South Africa for 1997-2007 was issued by the MRC Burden of Disease Unit in April 2012.163 This team has identified why the IHME estimates can be questioned, and why the MDG Country Report estimate cannot be considered plausible. They have also suggested that the IGME estimates appear to be “more or less at the correct level”. An updated graph showing the various modelled time series estimates of the under-five mortality rate is given in the appendix of this chapter (Figure 4).
Table 16: Child mortality and related indicators by province
EC FS GP KZN LP MP NC NW WC SA RefInfant mortality rate (deaths under 1 year per 1 000 live births)2006 ASSA2008 60.1 54.0 32.9 57.8 37.3 51.9 28.5 41.2 22.9 44.6 a
2006 Inter-agency group (2012) - - - - - - - - - 50.0 b
2006 RMS 2011 - - - - - - - - - 46.1 c
2006 StatsSA - - - - - - - - - 46.8 d
2006 VR adjusted - - - - - - - - - 50.0 e
2007 ASSA2008 56.5 50.9 32.3 55.2 33.6 50.0 30.5 34.3 21.5 42.0 a
2007 Inter-agency group (2012) - - - - - - - - - 46.8 b
2007 RMS 2011 - - - - - - - - - 47.0 c
2007 StatsSA - - - - - - - - - 45.1 d
2007 VR adjusted - - - - - - - - - 48.6 e
2008 ASSA2008 53.3 47.3 27.5 49.5 29.9 45.4 27.5 32.4 20.5 37.8 a
2008 Inter-agency group (2012) - - - - - - - - - 44.9 b
2008 RMS 2011 - - - - - - - - - 46.9 c
2008 StatsSA - - - - - - - - - 42.1 d
2009 ASSA2008 50.0 43.7 25.3 45.3 28.3 41.4 26.9 30.8 20.1 35.2 a
2009 Inter-agency group (2012) - - - - - - - - - 41.4 b
2009 RMS 2011 - - - - - - - - - 39.6 c
2009 StatsSA - - - - - - - - - 40.6 d
2010 ASSA2008 47.9 41.9 25.2 44.0 28.2 38.9 26.3 30.7 19.7 34.5 a
2010 Inter-agency group (2012) - - - - - - - - - 35.5 b
2010 RMS 2011 - - - - - - - - - 37.0 c
2010 StatsSA - - - - - - - - - 39.1 d
2011 ASSA2008 46.5 40.7 24.7 43.1 27.7 37.5 25.5 30.1 19.0 33.8 a
2011 Inter-agency group (2012) - - - - - - - - - 34.6 b
2011 RMS 2011 - - - - - - - - - 29.8 c
2011 StatsSA - - - - - - - - - 37.9 d
2012 ASSA2008 45.4 39.8 24.3 42.4 27.2 36.4 24.8 29.6 18.3 33.2 a
2013 ASSA2008 44.4 39.1 23.8 41.7 26.7 35.6 24.1 29.1 17.7 32.5 a
2014 ASSA2008 43.6 38.5 23.4 40.9 26.2 35.0 23.5 28.5 17.1 31.9 a
2015 ASSA2008 42.8 37.8 22.9 40.3 25.8 34.3 22.9 28.0 16.5 31.3 a
Low birth weight rate (% live births <2500g)2009 PPIP CHC - - - - - - - - - 8.5 f
2009 PPIP DH - - - - - - - - - 12.0 f
2009 PPIP NC - - - - - - - - - 26.6 f
2009 PPIP PT - - - - - - - - - 18.2 f
2009 PPIP RH - - - - - - - - - 15.5 f
2009 DHIS 12.8 15.2 12.1 11.8 10.3 8.8 19.0 13.9 14.8 12.3 g
2010 DHIS 12.6 14.5 13.0 12.0 10.0 9.8 20.0 14.5 16.0 12.7 g
2011 DHIS 12.3 13.1 15.8 11.9 10.1 12.3 18.5 13.3 15.5 13.2 g

Health and Related Indicators 17
SAHR 2012/13 245
EC FS GP KZN LP MP NC NW WC SA RefNeonatal death rate (NNDR) (deaths <28 days old per 1 000 live births)2009 DHIS 13.5 13.9 10.2 10.4 11.8 11.2 12.9 11.3 6.1 10.9 h
2009 Inter-agency group (2012) - - - - - - - - - 20.1 b
2009 PPIP CHC - - - - - - - - - 2.1 i
2009 PPIP DH - - - - - - - - - 12.3 i
2009 PPIP NC - - - - - - - - - 18.1 i
2009 PPIP PT - - - - - - - - - 16.5 i
2009 PPIP RH - - - - - - - - - 13.5 i
2009 Private hospitals - - - - - - - - - 4.0 j
2009 RMS 2011 - - - - - - - - - 13.6 k
2010 DHIS 15.1 16.0 11.4 10.4 12.0 10.1 13.5 15.4 5.5 11.6 h
2010 Inter-agency group (2012) - - - - - - - - - 19.6 b
2010 RMS 2011 - - - - - - - - - 13.4 k
2011 DHIS 16.7 15.5 13.4 10.7 12.3 10.6 14.6 13.1 5.9 12.3 h
2011 Inter-agency group (2012) - - - - - - - - - 19.2 b
2011 RMS 2011 - - - - - - - - - 13.9 k
Number of under-5 deaths2006 StatsSA - - - - - - - - - 64 346 l
2007 StatsSA - - - - - - - - - 61 708 l
2008 StatsSA - - - - - - - - - 61 062 l
2009 StatsSA - - - - - - - - - 50 471 l
Perinatal care index (perinatal MR / LBWR)2009 PPIP CHC - - - - - - - - - 1.15 f
2009 PPIP DH - - - - - - - - - 2.54 f
2009 PPIP NC - - - - - - - - - 2.39 f
2009 PPIP PT - - - - - - - - - 2.37 f
2009 PPIP RH - - - - - - - - - 2.43 f
Perinatal mortality rate (deaths <8 days old per 1 000 total births)2009 PPIP =>500g - - - - - - - - - 35.3 m
2009 PPIP CHC - - - - - - - - - 10.4 m
2009 PPIP DH - - - - - - - - - 33.3 m
2009 PPIP NC - - - - - - - - - 71.4 m
2009 PPIP PT - - - - - - - - - 48.0 m
2009 PPIP RH - - - - - - - - - 41.7 m
2009 DHIS 33.0 39.8 29.8 32.9 32.1 35.1 32.4 34.6 27.9 32.3 g
2010 DHIS 35.3 42.8 29.7 31.6 32.3 33.3 39.0 37.6 25.6 32.4 g
2011 DHIS 36.5 40.4 30.7 32.4 32.0 33.7 37.7 35.5 24.1 32.5 g
2011 PPIP CHC 9.6 n
2011 PPIP DH 33.4 n
2011 PPIP NC 63.3 n
2011 PPIP PT 56.2 n
2011 PPIP RH 39.5 n
Stillbirth rate (per 1 000 total births)2009 PPIP CHC - - - - - - - - - 8.3 f
2009 PPIP DH - - - - - - - - - 21.3 f
2009 PPIP NC - - - - - - - - - 54.3 f
2009 PPIP PT - - - - - - - - - 32.1 f
2009 PPIP RH - - - - - - - - - 28.5 f
2009 Private hospitals - - - - - - - - - 7.5 j
2009 DHIS 21.6 29.3 21.1 24.1 21.7 24.8 22.0 24.7 22.9 23.0 g
2010 DHIS 22.4 30.9 20.3 22.8 21.9 24.3 27.3 25.2 20.8 22.7 g
2011 DHIS 22.3 29.1 21.2 23.4 21.3 24.1 25.0 24.6 19.1 22.5 g
Under 5 mortality rate (deaths under 5 years per 1 000 live births)2006 ASSA2008 86.2 79.0 49.1 85.6 54.3 78.9 40.9 61.0 32.1 65.4 a
2006 IHME (2010) - - - - - - - - - 57.4 o
2006 Inter-agency group (2012) - - - - - - - - - 75.8 b
2006 RMS 2011 - - - - - - - - - 68.9 c
2006 StatsSA - - - - - - - - - 72.2 d
2006 VR adjusted - - - - - - - - - 75.0 e
2007 ASSA2008 82.1 74.8 48.4 81.6 50.2 75.0 41.2 54.1 30.0 61.9 a
2007 IHME (2010) - - - - - - - - - 57.1 o

246 SAHR 2012/13
EC FS GP KZN LP MP NC NW WC SA Ref2007 Inter-agency group (2012) - - - - - - - - - 71.1 b
2007 RMS 2011 - - - - - - - - - 67.2 c
2007 StatsSA - - - - - - - - - 67.8 d
2007 VR adjusted - - - - - - - - - 71.8 e
2008 ASSA2008 76.7 69.4 41.9 73.8 43.4 68.7 39.4 48.3 28.4 55.7 a
2008 IHME (2010) - - - - - - - - - 56.0 o
2008 Inter-agency group (2012) - - - - - - - - - 66.6 b
2008 RMS 2011 - - - - - - - - - 66.9 c
2008 StatsSA - - - - - - - - - 63.1 d
2009 ASSA2008 71.1 63.4 37.9 66.8 40.3 61.9 38.7 45.5 27.7 50.9 a
2009 IHME (2010) - - - - - - - - - 53.4 o
2009 Inter-agency group (2012) - - - - - - - - - 61.3 b
2009 RMS 2011 - - - - - - - - - 56.5 c
2009 StatsSA - - - - - - - - - 59.3 d
2010 ASSA2008 67.7 60.2 38.0 64.5 40.6 57.7 38.2 45.9 27.4 49.9 a
2010 GBD 2010 female - - - - - - - - - 50.2 p
2010 GBD 2010 male - - - - - - - - - 50.2 p
2010 IHME (2010) - - - - - - - - - 50.9 o
2010 Inter-agency group (2012) - - - - - - - - - 52.6 b
2010 RMS 2011 - - - - - - - - - 53.1 c
2010 StatsSA - - - - - - - - - 56.6 d
2011 ASSA2008 65.3 58.0 37.1 62.7 39.9 54.7 36.8 44.9 26.5 48.8 a
2011 IHME (2011) - - - - - - - - - 50.7 q
2011 Inter-agency group (2012) - - - - - - - - - 46.7 b
2011 RMS 2011 - - - - - - - - - 42.2 c
2011 StatsSA - - - - - - - - - 54.3 d
2012 ASSA2008 63.4 56.5 36.2 61.3 39.1 52.7 35.4 43.7 25.6 47.7 a
2013 ASSA2008 62.0 55.4 35.3 60.0 38.2 51.4 34.1 42.6 24.7 46.7 a
2014 ASSA2008 60.8 54.4 34.4 58.9 37.3 50.4 33.1 41.6 23.9 45.7 a
2015 ASSA2008 59.6 53.5 33.7 57.8 36.6 49.6 32.2 40.9 23.1 44.8 a
Reference notes (indicator definitions from page 310 and references from page 315):
a ASSA2008.62
b Child Mortality 2012 IGME.164
c RMS 2011.59 The U5MR and IMR in the RMS reports are calculated from VR for the period up to 2009 and from the RMS for the period 2010-2011, once the data have been adjusted for under-registration.
d StatsSA Mid-year estimates.34 2011 mid-year estimates. IMR/U5MR assumption used in population projections.
e U5MR 2012.163 Calculated by applying the completeness adjustment implied by Darikwa to vital registration data. Darikwa TB. Estimating the level and trends of child mortality in South Africa, 1996-2006. Thesis submitted in partial fulfilment of the Degree of Master of Philosophy in the Faculty of Commerce University of Cape Town; 2009.
f Saving Babies 2008-9.165 Community Health Centres (CHC), District Hospitals (DH), National Central Hospitals (NCH), Provincial Tertiary Hospitals (PT), Regional Hospitals (RH).
g DHIS. Data extracted June 2012. Data for financial year from April of the year to March of the following year (not calendar year).
h DHIS. Facility-based deaths. Data extracted June 2012. Data for financial year from April of the year to March of the following year (not calendar year).
i Saving Babies 2008-9.165 NNDR for births => 500g. Community Health Centres (CHC), District Hospitals (DH), National Central Hospitals (NCH), Provincial Tertiary Hospitals (PT), Regional Hospitals (RH).
j NaPeMMCo 2008-2010.142 Year of data not specified. Presumed to be an average of several years’ data around 2009. The three large hospital groups provided data from a total of 117 hospitals with delivery numbers for the individual hospitals ranging between around 4000 and less than 50 per year.
k RMS 2011.59 The NMR is estimated from the registered deaths (adjusted for under-registration) for the period 2006-2009 and the DHIS (adjusted for under-coverage, relative to the registered deaths and the incompleteness of the vital registration) for the period 2010-2011.
l StatsSA U5 Mortality 2006-10.57 Based on Stats SA Causes of Death data sets. Not adjusted for under-reporting. Estimated completeness of death registration for children under five years is around 87%.
m Saving Babies 2008-9.165 PNMR for births => 500g. The PNMR is an extrapolation of PPIP data. This is only an estimate and trends should not be assumed as there were about a third more births and deaths registered on PPIP in 2008-9 compared with 2006-7. Community Health Centres (CHC), District Hospitals (DH), National Central Hospitals (NCH), Provincial Tertiary Hospitals (PT), Regional Hospitals (RH).
n NaPeMMCo 2010-2011.166 PNMR for births => 500g. The PNMR is an extrapolation of PPIP data. Community Health Centres (CHC), District Hospitals (DH), National Central Hospitals (NCH), Provincial Tertiary Hospitals (PT), Regional Hospitals (RH).
o IHME Maternal and Child Mortality.167
p Global Burden of Disease 2010.61
q Lozano et al. 2011.144
Health and Related Indicators 17
SAHR 2012/13 247
Child health status and services
Since 2005, the South African Child Gauge has provided a unique summary of the determinants of child health, as well as of data on access to healthcare services.168 A particularly important section covers the “Children Count – Abantwana Babalulekile” initiative, which provides “child-centred data to monitor progress and track the realisation of children’s socio-economic rights”. More detailed data can be accessed at the project’s web site: www.childrencount.ci.org.za. The report explains: “’Child-centred’ data does not only mean the use of data about children specifically. It also means using national population or household data, but analysing it at the level of the child. This is important, because the numbers can differ enormously depending on the unit of analysis. For example, national statistics describe the unemployment rate, but only a child-centred analysis can tell how many children live in households where no adult is employed. National statistics show what proportion of households is without adequate sanitation, but when a child-centred analysis is used, the proportion is significantly higher”. One of the reports included shows the dramatic changes in access to Child Support Grants that have occurred since 2005, as eligibility criteria have shifted. From 2005 to 2008, the grant was restricted to those aged 0-13 years. In 2009 it was extended to under 15s, in 2010 to under 16s, in 2011 to under 17s,and in 2012 those aged 17 years became eligible. The number of child beneficiaries of this type of grant has increased from 5 913 719 in 2005 to 11 227 832 in 2012. However, these data also emphasise the modest quantum of such grants, which have increased from R180 per month in 2005 to R280 per month in 2012. Data are also presented on access to Foster Child Grants and Care Dependency Grants. Two of the specific indicators tracked in terms of child health are number and proportion of children living far from their health facility (‘far’ being defined as requiring more than 30 minutes to reach the facility, irrespective of the mode of transport) and the number and proportion of children living in households where there is reported child hunger. No change in the first indicator has been detected between 2002 (36.4% of children) and 2010 (36.7%), based on data from the StatsSA General Household Surveys, but a marked socio-economic gradient was demonstrated (with twice as many children in the poorest quintile having to travel far compared with those in the richest quintile). While significant progress has been achieved in relation to child hunger, in 2010, three million African children, equivalent to almost 20% of the total African child population, were estimated as living in households that reported child hunger. By contrast, only 13% of Coloured children, 5% of Asian children and no White children lived in such households.

248 SAHR 2012/13
Table 17: Child health indicators by province
EC FS GP KZN LP MP NC NW WC SA RefChildren under 5 years weighing rate2009 DHIS 84.2 85.0 89.6 76.0 79.5 90.9 86.1 89.1 70.5 82.0 a
2010 DHIS 85.9 87.1 88.4 77.5 77.4 87.4 82.0 87.5 71.8 81.9 a
2011 DHIS 85.4 86.6 88.5 89.0 77.9 85.6 80.5 90.4 74.5 84.8 a
Diarrhoea incidence under 5 years (per 1 000)2009 DHIS 110.9 70.3 63.7 197.8 185.5 78.1 144.3 112.2 123.5 127.4 a
2010 DHIS 104.2 64.6 64.5 159.2 180.7 71.4 142.9 102.8 93.9 112.4 a
2011 DHIS 89.1 57.4 55.4 139.1 164.9 40.0 97.0 71.9 94.7 95.9 a
Not gaining weight under 5 years rate (%)2009 DHIS 0.7 2.4 0.5 1.3 0.9 1.0 2.2 1.1 2.9 1.2 a
2010 DHIS 0.7 2.0 0.5 1.1 0.6 1.0 1.9 1.2 2.2 1.0 a
2011 DHIS 0.6 1.7 0.4 1.0 0.5 0.6 2.1 1.2 2.4 0.9 a
Number of orphans2009 maternal/double (GHS) 306 000 124 000 168 000 512 000 129 000 142 000 29 000 127 000 51 000 1 588 000 b
2009 maternal/double ASSA2008 242 149 109 106 299 204 472 462 138 716 152 111 19 237 129 691 86 128 1 606 598 c
2010 maternal/double (GHS) 286 000 118 000 167 000 507 000 118 000 147 000 31 000 116 000 52 000 1 543 000 d
2010 maternal/double ASSA2008 246 962 112 775 317 132 486 793 139 820 158 836 20 105 134 158 88 492 1 668 901 c
2011 maternal/double ASSA2008 249 595 114 801 330 393 495 545 141 975 163 174 20 986 136 964 91 301 1 712 677 c
2012 maternal/double ASSA2008 250 750 115 485 339 861 499 933 144 639 165 717 21 853 138 276 94 271 1 742 924 c
2013 maternal/double ASSA2008 250 916 115 171 346 199 500 999 147 493 167 038 22 680 138 459 97 170 1 763 010 c
2014 maternal/double ASSA2008 250 321 114 185 349 785 499 334 150 322 167 418 23 450 137 851 99 821 1 774 794 c
2015 maternal/double ASSA2008 249 084 112 728 350 770 495 337 152 965 167 040 24 124 136 669 101 947 1 779 248 c
Orphanhood (%)2009 maternal/double (GHS) 11.1 11.6 5.2 12.0 5.5 9.7 6.6 10.0 2.9 8.5 b
2010 maternal/double (GHS) 10.7 11.0 5.0 11.9 5.2 10.1 7.3 9.1 2.9 8.4 d
Pneumonia incidence rate under 5 years (per 1 000)2009 DHIS 66.8 110.0 58.3 178.8 60.9 56.4 114.7 109.3 83.3 97.4 a
2010 DHIS 61.6 96.1 59.3 147.8 54.6 43.7 104.3 82.8 68.7 83.6 a
2011 DHIS 58.2 89.3 56.6 145.5 53.9 38.6 92.2 70.0 72.1 80.3 a
Severe malnutrition under 5 years incidence (per 1 000)2009 DHIS 5.0 5.8 2.9 8.0 4.0 5.5 5.6 7.2 5.9 5.5 a
2010 DHIS 4.9 4.9 3.7 7.1 4.1 3.8 5.1 6.7 2.7 4.9 a
2011 DHIS 3.8 4.1 2.8 6.8 4.4 2.8 4.4 5.3 3.2 4.3 a
Reference notes (indicator definitions from page 310 and references from page 315):
a DHIS. Data extracted June 2012. Data for financial year from April of the year to March of the following year (not calendar year).
b SA Child Gauge 2010/2011.169 Based on GHS 2009; StatsSA. Orphan definitions used here are mutually exclusive and additive. This suggests 8% of all children are maternal/double orphans. Children are defined as people aged 0 - 17 years. Population numbers are rounded off to the nearest thousand.
c ASSA2008.62
d Children Count web site. Based on GHS 2010; StatsSA. Children are defined as people aged 0 - 17 years. Population numbers are rounded off to the nearest thousand.

Health and Related Indicators 17
SAHR 2012/13 249
Immunisation
Estimates of vaccination coverage from both survey and routine data sources have long been bedevilled by data quality issues, as well as by questions about the appropriateness of the population denominators used. The questions raised about the reliability of the Census 2011 results are of particular concern in this regard, as the increase in the number of children under one may reduce routine data coverage by more than 10 percentage points. A stakeholder meeting in December 2012 debated the challenges of existing data and documented requirements for an immunisation coverage survey to obtain an accurate, current estimate of coverage. An assessment of the view of vaccination programme managers was reported in 2012, combined with a systematic review of the available evidence for the interventions proposed by these managers.171 As expected,
there was support for improved training, supervision, audit and feedback, all of which depend on access to reliable data.
Globally, there have been assessments of the impact of rotavirus vaccine introduction,172 and of progress in relation to measles control.173,174 Projections have also been made of the potential health and economic consequences of expanding access to rotavirus vaccine in the future.175 Extensive estimates of coverage at a national level are also produced annually by UNICEF/WHO.176 The methods used to obtain these estimates have previously been reported,177 and have recently been updated to incorporate computational logic methods.178,179
Table 18: Immunisation indicators by province
EC FS GP KZN LP MP NC NW WC SA RefBCG coverage (%)2009 DHIS 70.8 92.7 122.2 76.1 108.5 90.1 88.9 89.2 88.4 91.9 a
2010 DHIS 80.7 93.6 119.2 83.7 110.3 79.9 95.9 85.1 79.5 93.3 a
2011 DHIS 92.6 96.9 117.3 91.7 122.5 97.4 94.0 91.1 62.4 98.0 a
2011 UNICEF/WHO - - - - - - - - - 78.0 b
DTP3 coverage (%)2009 DHIS 86.2 77.8 115.5 95.1 119.0 108.7 97.1 82.6 94.9 99.4 a
2010 DHIS 52.0 84.8 109.2 92.2 94.1 78.6 97.6 90.2 89.8 88.2 a
2011 DHIS 85.7 99.6 105.0 105.2 109.0 90.9 100.2 93.5 93.6 99.3 a
2011 UNICEF/WHO - - - - - - - - - 72.0 b
Immunisation coverage of children <1 year (%)2009 DHIS 90.6 87.0 113.7 84.6 99.6 92.8 92.4 86.4 102.2 95.3 a
2010 DHIS 78.5 83.8 111.3 85.4 93.7 69.8 91.9 77.3 90.8 89.2 a
2011 DHIS 84.2 91.9 114.6 98.6 96.7 73.9 95.1 82.9 89.5 95.2 a
Measles 1st dose coverage (%)2009 DHIS 94.0 88.4 118.4 87.0 103.6 97.7 91.5 89.2 105.1 98.6 a
2010 DHIS 87.9 87.6 110.9 88.4 100.1 88.6 92.0 86.8 94.2 94.5 a
2011 DHIS 95.2 94.7 113.9 100.6 109.7 89.4 98.1 92.3 92.6 100.9 a
OPV 1 coverage (%)2009 DHIS 91.4 97.4 128.3 99.6 124.1 112.7 85.2 96.0 111.3 107.8 a
2010 DHIS 84.7 95.1 114.9 101.5 115.0 99.8 88.6 92.3 97.1 101.3 a
2011 DHIS 92.9 99.6 108.8 110.1 128.1 101.3 105.2 88.8 95.2 105.1 a
PCV7 3rd dose coverage (%)2009 DHIS 13.0 10.0 30.1 25.4 33.2 23.5 25.8 24.5 16.2 23.3 a
2010 DHIS 42.2 70.2 94.5 80.3 80.8 53.8 80.4 62.0 71.0 72.8 a
2011 DHIS 80.9 90.8 102.8 97.5 105.6 91.4 92.6 86.2 84.5 94.1 a
2011 UNICEF/WHO - - - - - - - - - 72.0 b
RV 2nd dose coverage (%)2009 DHIS 24.3 12.2 46.6 40.6 42.8 39.3 33.2 29.7 19.7 34.7 a
2010 DHIS 40.9 77.1 94.1 81.2 74.1 60.6 83.8 61.8 63.4 72.3 a
2011 DHIS 77.6 97.6 111.8 105.2 109.4 91.6 101.1 87.9 83.6 98.2 a
2011 UNICEF/WHO - - - - - - - - - 72.0 b
Reference notes (indicator definitions from page 310 and references from page 315):
a DHIS. Data extracted June 2012. Data for financial year from April of the year to March of the following year (not calendar year).
b Immunisation 2011.176 Estimates derived by review of available data (including routine service delivery data and surveys), informed and constrained by a set of heuristics.

250 SAHR 2012/13
Nutrition
Context The increasing global focus on non-communicable diseases has raised the profile of poor nutrition as a risk factor. Some interventions have been included in the Strategic Plan for Maternal, Newborn, Child and Women’s Health (MNCWH) and Nutrition in South Africa 2012-2016.
New data sources Nationally, new data have been reported in the:
• National Income Dynamics Study (NiDS) Wave 1 and Wave 2
• District Health Information System (DHIS)
Internationally, reports of interest include:
• Progress towards MDG1, as reported by the Nutrition Impact Model Study Group (Child Growth)
Key issues and trends Much is expected from the planned South African National Health and Nutrition Examination Survey (SANHANES), but some data have been forthcoming from the two completed waves of the National Income Dynamics Study (NiDS).
Growth monitoring and promotion, with early identification and management of growth failure, is an integral part of child health services, as is supplementation with vitamin A. Together with regular deworming and correct implementation of the Integrated Management of Childhood Illnesses (IMCI) package (including advice on infant feeding), these are among the nutrition-related interventions included in the Strategic Plan for Maternal, Newborn, Child and Women’s Health (MNCWH) and Nutrition in South Africa 2012-2016.136
Some early data on nutritional status has been reported from the two completed waves of the National Income Dynamics Study (NiDS).180 However, these have been issued with the caveat that the analyses are “descriptive, preliminary and very much intended to illustrate the potential of the NIDS panel”. In the first wave of NiDS, 33% of women and 11% of men aged 15 and older were classified as obese on the basis of their body mass index. In the first wave of NiDS, 17% of children aged 6 months to 14 years were classified as stunted (height-for-age z-score two or more standard deviations below the WHO reference population). Although about 9% of children were classified as stunted in both waves, about 12% of children changed classification from not stunted to stunted between waves, and half the children who were classified as stunted in Wave 1, no longer being classified as stunted in Wave 2.
Considerable new data are expected to be generated from the first South African National Health and Nutrition Examination Survey (SANHANES-1) and from subsequent collection in the longitudinal component of the study. Critically, in contrast to the self-reported data relied on for the General Household Survey, SANHANES will obtain questionnaire-based data as well as health measurements though clinical examination and the collection of blood specimens using mobile clinics.
Data from surveys that have used the Community Childhood Hunger Identification Project (CCHIP) index to measure food security has shown persistently high levels of food insecurity in South Africa between 1999 and 2008.181 A nationally-representative cross-sectional survey also documented extensive reliance on ‘street foods’ (foods and beverages provided by the informal sector, which include snacks and soft drinks) and fast foods.182 Poor eating habits were also demonstrated in a longitudinal study of adolescents living in Soweto and Johannesburg, in all three environments examined (in the home, at school and in the community).183 The policy implications of unhealthy eating in South Africa have been explored by Igumbor et al., who have called for urgent action,
including education, support for healthy foods and the regulation of ‘Big Food’ (defined as the large commercial entities that dominate the food and beverage environment).184 While breastfeeding policies have largely occurred in the context of HIV policy, data from a cluster randomised trial of exclusive breastfeeding promotion showed how difficult it was for mothers, and working mothers in particular, to maintain breastfeeding.185
Internationally, the Nutrition Impact Model Study Group (Child Growth) has reported on trends in mild, moderate, and severe stunting in 141 developing countries.186 The MDG 1 target is the halving the prevalence of weight-for-age z-scores below -2 between 1990 and 2015 or reaching a prevalence of 2.3% or lower. Based on available national data, anthropometric status “worsened in sub-Saharan Africa until the late 1990s and improved thereafter”. The Group called for increased “investment in pro-poor food and primary care programmes”.
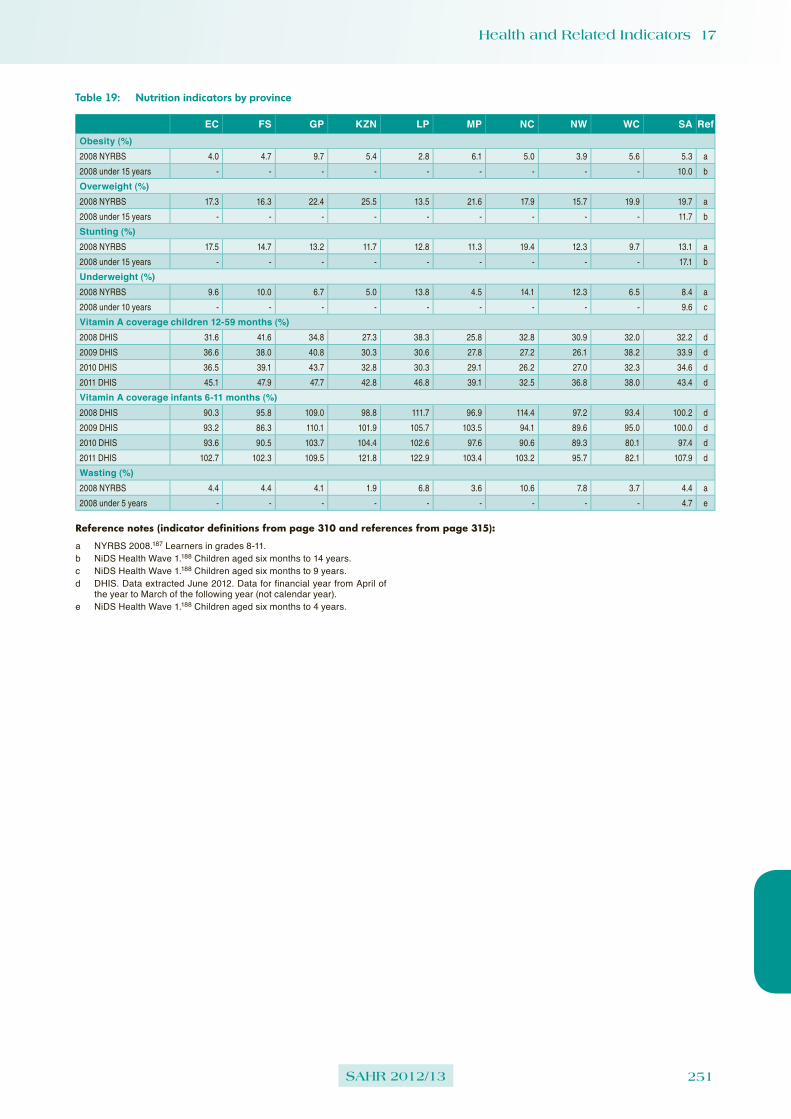
Health and Related Indicators 17
SAHR 2012/13 251
Table 19: Nutrition indicators by province
EC FS GP KZN LP MP NC NW WC SA RefObesity (%)2008 NYRBS 4.0 4.7 9.7 5.4 2.8 6.1 5.0 3.9 5.6 5.3 a
2008 under 15 years - - - - - - - - - 10.0 b
Overweight (%)2008 NYRBS 17.3 16.3 22.4 25.5 13.5 21.6 17.9 15.7 19.9 19.7 a
2008 under 15 years - - - - - - - - - 11.7 b
Stunting (%)2008 NYRBS 17.5 14.7 13.2 11.7 12.8 11.3 19.4 12.3 9.7 13.1 a
2008 under 15 years - - - - - - - - - 17.1 b
Underweight (%)2008 NYRBS 9.6 10.0 6.7 5.0 13.8 4.5 14.1 12.3 6.5 8.4 a
2008 under 10 years - - - - - - - - - 9.6 c
Vitamin A coverage children 12-59 months (%)2008 DHIS 31.6 41.6 34.8 27.3 38.3 25.8 32.8 30.9 32.0 32.2 d
2009 DHIS 36.6 38.0 40.8 30.3 30.6 27.8 27.2 26.1 38.2 33.9 d
2010 DHIS 36.5 39.1 43.7 32.8 30.3 29.1 26.2 27.0 32.3 34.6 d
2011 DHIS 45.1 47.9 47.7 42.8 46.8 39.1 32.5 36.8 38.0 43.4 d
Vitamin A coverage infants 6-11 months (%)2008 DHIS 90.3 95.8 109.0 98.8 111.7 96.9 114.4 97.2 93.4 100.2 d
2009 DHIS 93.2 86.3 110.1 101.9 105.7 103.5 94.1 89.6 95.0 100.0 d
2010 DHIS 93.6 90.5 103.7 104.4 102.6 97.6 90.6 89.3 80.1 97.4 d
2011 DHIS 102.7 102.3 109.5 121.8 122.9 103.4 103.2 95.7 82.1 107.9 d
Wasting (%)2008 NYRBS 4.4 4.4 4.1 1.9 6.8 3.6 10.6 7.8 3.7 4.4 a
2008 under 5 years - - - - - - - - - 4.7 e
Reference notes (indicator definitions from page 310 and references from page 315):
a NYRBS 2008.187 Learners in grades 8-11.b NiDS Health Wave 1.188 Children aged six months to 14 years.c NiDS Health Wave 1.188 Children aged six months to 9 years.d DHIS. Data extracted June 2012. Data for financial year from April of
the year to March of the following year (not calendar year).e NiDS Health Wave 1.188 Children aged six months to 4 years.

252 SAHR 2012/13
Non-communicable diseases
Context Non-communicable diseases are now recognised as a major health challenge of the 21st century. Globally, a comprehensive monitoring framework, including indicators and voluntary targets for the prevention and control of non-communicable diseases are being developed and are expected to serve before the 66th World Health Assembly in May 2013.
New data sources Nationally, new data have been reported in the:
• National Income Dynamics Study (NiDS) Wave 1 and Wave 2
• SAGE Wave 1
• StatsSA General Household Survey (GHS) 2011
• District Health Information System (DHIS)
Internationally, reports of interest include:
• World Health Statistics 2012
• World Heart Federation. Urbanization and cardiovascular disease: Raising heart-healthy children in today’s cities (2012)
• Women Deliver. Delivering Cervical Cancer Prevention in the Developing World (2011)
• The Lancet Non-communicable diseases series (February 2013)
Key issues and trends Current routine collection and periodic survey data sources do not provide high quality data about the prevalence of NCDs. However, much is expected from the longitudinal study components of the NiDS, as well as from SANHANES. Steps have been taken to revitalise the South African National Cancer Registry.
The World Health Statistics 2012 included global estimates of the burden of non-communicable diseases (NCDs).189 It was stated that, of the estimated 57 million global deaths in 2008, 36 million (63%) were due to NCDs. Where before these had been regarded as diseases of affluence, in 2008 about 80% of all NCD deaths occurred in low- and middle-income countries. A higher proportion (48%) of these deaths occurred in people under the age of 70 in low- and middle-income countries than in high-income countries (26%). The probability of dying prematurely (between the ages of 30 and 70 years) from an NCD was estimated to be highest in sub-Saharan Africa, Eastern Europe and parts of Asia.
In preparation for the United Nations high-level meeting on NCDs in September 2011, the National Department of Health held a two-day national NCD Summit, which proposed the following ten targets:
➢ reduce the relative premature mortality (under 60 years of age) from non-communicable diseases by at least 25% by 2020;
➢ reduce tobacco use by 20% by 2020;
➢ reduce the relative per capita consumption of alcohol by 20% by 2020;
➢ reduce mean population intake of salt to <5 grams per day by 2020;
➢ reduce the percentage of people who are obese and/or overweight by 10% by 2020;
➢ reduce the prevalence of people with raised blood pressure by 20% by 2020 (through lifestyle and medication);
➢ screen all women at least every 5 years for cervical cancer by 2020;
➢ screen all men above 40 years of age for prostate cancer by 2020;
➢ increase the percentage of people controlled for hypertension, diabetes and asthma by 30% by 2020; and
➢ increase the number of people screened and treated for mental health by 30% by 2030.
Significant progress has been achieved in a developing a comprehensive monitoring framework, including indicators and voluntary targets for the prevention and control of non-communicable diseases.190,191 The final document is expected to serve before the 66th World Health Assembly in May 2013. The current draft lists 25 indicators and nine voluntary targets. In October 2012, Beaglehole and colleagues published a commentary on this process in the Lancet.192 They argued that, among the key criteria for choosing such targets should be that baseline data and robust methods for assessing progress were available. They therefore proposed that a single overarching NCD goal be set, and suggested the catchphrase ‘25 by 25’, based on the goal of a 25% reduction in the probability of dying from the four main NCDs for people aged 30-70 years by 2025. They then suggested five initial targets:
➢ a 40% relative reduction in prevalence of tobacco use, including smokeless tobacco, by 2025;
➢ achieving the WHO target of 5g of salt intake per adult per day, by 2025;
➢ increase coverage of multidrug therapy, preferably fixed dose combination therapy, to at least 50% for people older than 50 years whose risk of a heart attack or stroke in the next 10 years is 30% or more, or for anyone who has already had a heart attack or stroke;
➢ a 10% relative reduction in per capita adult alcohol consumption by 2025; and
➢ a 10% relative reduction in adult inactivity levels by 2025.
Locally, much of the data to track progress in relation to NCDs will need to come from routine sources (such as DHIS), and from specific cross-sectional surveys and longitudinal studies. As there are no plans to repeat the South Africa Demographic and Health Survey, data will be obtained from the South African National HIV,
Health and Related Indicators 17
SAHR 2012/13 253
Behaviour and Health Survey 2012 (SABSSM4), the South African National Health and Nutrition Examination Survey (SANHANES), the National Income Dynamics Study (NiDS), the Study on Global AGEing and Adult Health (SAGE),193 as well as from the annual StatsSA General Household Surveys (GHS). Data from NiDS have already been used to prepare discussion documents, for instance exploring the interaction between mental health and socio-economic status.194 NiDS Wave 1 data on the prevalence of obesity and hypertension have also been issued.188 While difficult to extrapolate to the national level, data from local cohorts and demographic surveillance sites will also illuminate this area. Recent examples have included data on the cardiovascular risk profile of a Bellville South cohort,195 and the prevalence of hypertension and obesity in the Hlabisa Demographic Surveillance Site (DSS).196
Internationally, the Lancet has continued to publish series of articles on NCDs, including on hypertension in developing countries,197 epilepsy in poor regions of the world198 and self-harm and suicide in adolescents.199 Although based on dated information, taken from the World Health Survey 2002 to 2004, a review of data from 41 countries underpinned the view that NCDs are not merely disease of the wealthy.200 Setting priorities at a global and a national level will not be simple.201 One potential approach is to identify ‘best-buys’ in terms of the comparative value for money, in the form of cost per disability life year gained.202 However, this group added a final warning that is worth considering: “A final point is that efficiency represents but one of many criteria that need to be taken into account when allocating resources or determining priorities. In particular, efficient allocation of resources may not be fair. For example, treatment of schizophrenia may not be one of the most cost-effective options, but withholding effective care for this severe, debilitating condition is likely to be considered highly unjust. This speaks to the need for careful and inclusive deliberation about how to develop health systems in a way that ensures not only good value for money but also equal access and financial protection for those in need (including poor and vulnerable people)”.
In February 2013, this series was extended,c with calls for embedding NCDs in the post-2015 development agenda,203 a stepwise approach to country actions, with continual monitoring of progress,204 and careful attention to particularly vulnerable groups which might not have equitable access to interventions.205 Two of the papers encapsulated the debate about how best to set targets and indicators of progress. Beaglehole et al.206 noted that the lessons from the MDGs, and particularly the women’s and children’s health communities should be heeded, and that “a small group of indicators is more helpful than a long and inclusive list”. In contrast, Hogerzeil and colleagues drew attention to the challenges that had been experienced in relation to tracking progress with MDG 8, dealing with access to medicines.207 They noted that, at a November 2012 meeting, WHO member states agreed on a set of indicators for medicines and technologies for NCDs, including “(1) drug treatment to prevent heart attacks and strokes (including for glycaemic control); (2) the availability of generic essential NCD medicines and basic technologies in public and private facilities; (3) access to palliative care; and (4) vaccination against human papillomavirus and hepatitis B virus as infectious causes of cancer”. However, in addition, they called for routine facility-based monitoring of medicine prices, quality and efficiency of use, as
c http://www.thelancet.com/series/non-communicable-diseases
well as for attention to the extent of out-of-pocket expenditure for NCD medicines. Further, they argued that such questions should be added to routine household surveys.
Although based on 2008 data, the systematic analysis of global cancer burden, expressed in DALY terms, has provided important insights.208 In 2008, an estimated 169.3 million healthy life-years were lost because of cancer in 2008, with 65% to the total burden due to lung, liver, breast, stomach, colorectal, cervical, and oesophageal cancers, and leukaemia. It has also been shown that societal and economic transitions are associated with shifts in the relative burden of different types of cancer.209 As reductions in the burden of infection-related cancers are seen, increases in cancers associated with reproductive, dietary and hormonal factors are experienced. In South Africa, increased access to ART was shown to reduce both the incidence and progression of cervical lesions among women living with HIV.210 Access to human papilloma virus vaccines will be a major determinant of cervical cancer rates in developing countries, but access to quality screening, diagnostic and care systems are also vital.211
Steps are being taken to revitalise the South African National Cancer Registry. While welcoming this development, staff involved in the South African Paediatric Tumour Registry have argued that this repository be maintained, in parallel, with a specific focus on paediatric data.212 In January 2013, a Ministerial Advisory Committee on the Prevention and Control of Cancer was appointed.
Although NCDs such as cardiovascular disease have traditionally been depicted as due to ‘lifestyle’ choices, it has also been recognised that urban life poses many challenges which limit the options open to those who live in such settings. In its report entitled “Urbanization and cardiovascular disease: Raising heart-healthy children in today’s cities”, the World Heart Federation has called for a life-course approach, from conception through the end of life, to address urban health risks.213

254 SAHR 2012/13
Table 20: Chronic disease indicators by province
EC FS GP KZN LP MP NC NW WC SA RefCervical cancer screening coverage2008 DHIS 30.1 38.9 46.1 51.1 52.5 40.9 30.1 51.7 52.9 45.6 a
2009 DHIS 34.0 40.3 45.6 47.0 63.9 52.2 35.1 47.0 57.9 47.6 a
2010 DHIS 36.2 38.1 51.4 58.2 55.9 60.2 37.9 48.4 65.8 52.2 a
2011 DHIS 37.8 44.2 44.9 77.1 60.1 59.3 32.4 48.8 64.4 55.0 a
Hypertension prevalence (per 1 000)2008 NiDS female 15+ - - - - - - - - - 358 b
2008 NiDS female 15-24 - - - - - - - - - 106 b
2008 NiDS female 25+ - - - - - - - - - 453 b
2008 NiDS female 25-34 - - - - - - - - - 189 b
2008 NiDS female 35-44 - - - - - - - - - 416 b
2008 NiDS female 45-54 - - - - - - - - - 604 b
2008 NiDS female 55-64 - - - - - - - - - 694 b
2008 NiDS female 65+ - - - - - - - - - 789 b
2008 NiDS male 15+ - - - - - - - - - 339 b
2008 NiDS male 15-24 - - - - - - - - - 130 b
2008 NiDS male 25+ - - - - - - - - - 408 b
2008 NiDS male 25-34 - - - - - - - - - 237 b
2008 NiDS male 35-44 - - - - - - - - - 340 b
2008 NiDS male 45-54 - - - - - - - - - 524 b
2008 NiDS male 55-64 - - - - - - - - - 647 b
2008 NiDS male 65+ - - - - - - - - - 717 b
2008 NiDS total 25+ - - - - - - - - - 434 b
2010 NiDS female 15+ - - - - - - - - - 336 c
2010 NiDS female 15-24 - - - - - - - - - 93 c
2010 NiDS female 25+ - - - - - - - - - 426 c
2010 NiDS female 25-34 - - - - - - - - - 189 c
2010 NiDS female 35-44 - - - - - - - - - 350 c
2010 NiDS female 45-54 - - - - - - - - - 545 c
2010 NiDS female 55-64 - - - - - - - - - 708 c
2010 NiDS female 65+ - - - - - - - - - 775 c
2010 NiDS male 15+ - - - - - - - - - 321 c
2010 NiDS male 15-24 - - - - - - - - - 136 c
2010 NiDS male 25+ - - - - - - - - - 381 c
2010 NiDS male 25-34 - - - - - - - - - 239 c
2010 NiDS male 35-44 - - - - - - - - - 331 c
2010 NiDS male 45-54 - - - - - - - - - 441 c
2010 NiDS male 55-64 - - - - - - - - - 591 c
2010 NiDS male 65+ - - - - - - - - - 710 c
2010 NiDS total 25+ - - - - - - - - - 406 c
Reference notes (indicator definitions from page 310 and references from page 315):a DHIS. Data extracted June 2012. Data for financial year from April of
the year to March of the following year (not calendar year).b AHS 2012.67 Calculated from the NiDS Wave 1 dataset.214 The
measured prevalence of hypertension was defined as those with BP equal or above 140/90 mmHg and/or taking anti-hypertensive medication. Figures converted from % to per 1 000.
c AHS 2012.67 Calculated from the NiDS Wave 2 dataset.215 The measured prevalence of hypertension was defined as those with BP equal or above 140/90 mmHg and/or taking anti-hypertensive medication. Figures converted from % to per 1 000.

Health and Related Indicators 17
SAHR 2012/13 255
Behaviour and awareness
Context There is intense interest in behaviours that are correlated with non-communicable disease risk, such as smoking and alcohol use.
New data sources Nationally, new data have been reported in the:
• SACENDU – South African Community Epidemiology Network on Drug Use
Internationally, reports of interest include:
• WHO Global Information System on Alcohol and Health (GISAH)
• WHO Mortality Attributable to Tobacco (2012)
• WHO Atlas of Substance Abuse Disorders (Country profile: South Africa)
Key issues and trends While South Africa has made significant progress in reducing tobacco use, it has had less success in curbing high-risk use of alcohol. Systems to track substance abuse remain poorly developed.
There are extensive data on a range of alcohol-related health indicators maintained by the WHO Global Information System on Alcohol and Health (GISAH).d These data cover levels and patterns of consumption, harms and consequences, data on economic aspects, alcohol control policies, and prevention and research resources. Although the current South African data appear to be from surveys already captured in previous editions of the Review, this will be an interesting resource to watch in future. Locally, a review of available data, dating from 1998 to 2008, from the South Africa Demographic and Health Survey and the Youth Risk Behaviour Survey was published in 2012.216 It identified early age of initiation of alcohol consumption and binge drinking, particularly among females, as problematic. A survey among 1 600 high school adolescents in Limpopo sought to identify the factors that accounted for consumption of home-brewed alcohol.217 It found that adolescents’ perceptions of high levels of adult anti-social behaviour and crime and violence in the community were significant risks for early alcohol initiation.
The first wave of the Global Adult Tobacco Survey was reported in 2012.218 The data to date cover 16 low- and middle-income countries, but not South Africa. An analysis of socio-economic inequalities in smoking did include South African data, but from the World Health Survey 2002-2004.219 Understanding the particular consumption pattern in a country could help to target control efforts. A recent WHO publication on mortality attributable to tobacco use points out that tobacco kills more than tuberculosis, HIV, and malaria combined.220 The attributable death toll from tobacco is about 5 million people per year, with an additional 600 000 from second-hand smoke. The data presented for South Africa were based on the smoking impact ratio (SIR) method, which uses the number of lung cancer deaths by sex and age as the starting point to estimate tobacco-attributable deaths for a particular year. Okeke et al. argued that although the smoking rate in healthcare workers in three KwaZulu-Natal hospitals was lower than the national average, this nonetheless undermined their role in assisting patients to stop smoking, tends to be correlated with alcohol use problems, and exposes others to second-hand smoke.221
As indicated in the section on non-communicable diseases, one of the potential global targets is a reduction in adult inactivity levels. A series of articles in the Lancet has drawn attention to available data on global physical activity levels,222 correlates of physical activit y,223 the estimated impact of physical inactivity on the burden of major NCDs,224 the potential implications of trends in information
d http://apps.who.int/ghodata/?theme=GISAH
and communications technology (ICT) and transportation on levels of physical activity,225 and the need for global action.226 The accompanying editorial points out that the estimates of mortality due to inactivity (5.3 million of the 57 million deaths that occurred worldwide in 2008) rank this contributory cause on the same level as tobacco.227
As in previous years, data on the extent of substance abuse is limited to that produced by the South African Epidemiology Network on Drug Abuse (SACENDU).228,229 A summary of the available data from July 1996 to December 2011 was published in mid-2012.230 Data from this alcohol and other drug sentinel surveillance system are gathered from specialist treatment programmes in all nine provinces, but are reported provincially for the Western Cape, KwaZulu-Natal, Eastern Cape and Gauteng, and then for what is termed the Northern Region (combining data from Mpumalanga and Limpopo) and the Central Region (Free State, Northern Cape and North West). Data are reported every six months. However, the number of sentinel sites in each area may be very limited. In the most recent reporting period (July to December 2011), data were contributed by a total of 8 291 admissions to 59 centres/programmes across all provinces. Alcohol was the most common primary substance of abuse in most of these sites, and cannabis the most common illicit drug used. A decline in admissions for methamphetamine was noted in the Western Cape, but heroin use was increasing, across all sites. Cocaine use was stable across most sites, but notably higher in Gauteng. Methcathinone use was also increasing in Gauteng. Prescription or over-the-counter medicines were still commonly reported as secondary substances of abuse.

256 SAHR 2012/13
Table 21: Behaviour and awareness indicators by province
EC FS GP KZN LP MP NC NW WC SA RefAlcohol dependence (%)2010 HCWs - - - 22.4 - - - - - - a
Ever smoked cigarettes (%)2010 HCWs - - - 18.1 - - - - - - b
2010 HCWs female - - - 6.9 - - - - - - b
2010 HCWs male - - - 43.1 - - - - - - b
Number of admissions for alcohol and other drug abuse2009 Jul-Dec 648 - 2 646 1 138 - - - - 2 642 8 217 c
2010 Jul-Dec 707 - 2 884 669 - - - - 2 933 8 407 d
2011 Jul-Dec 721 - 2 786 610 - - - - 2 733 8 291 e
Prevalence of smoking (%)2010 Allied HCWs - - - 16.0 - - - - - - f
2010 Doctors - - - 11.7 - - - - - - b
2010 HCWs female - - - 2.4 - - - - - - b
2010 HCWs male - - - 30.3 - - - - - - b
2010 HCWs total - - - 11.1 - - - - - - b
2010 Nurses - - - 8.0 - - - - - - b
2010 Other - - - 27.3 - - - - - - g
2010 Student nurses - - - 7.5 - - - - - - b
Primary drug of abuse as % of all drugs of abuse2009 alcohol 50.0 - 47.0 47.0 - - - - 29.0 - h
2009 cannabis 16.0 - 28.0 28.0 - - - - 17.0 - h
2009 cocaine 7.0 - 5.0 6.0 - - - - 2.0 - h
2009 heroin 4.0 - 12.0 17.0 - - - - 12.0 - h
2009 mandrax 6.0 - 2.0 1.0 - - - - 3.0 - h
2009 methamphetamine 7.0 - 1.0 0.1 - - - - 36.0 - h
2010 alcohol 44.0 - 41.0 55.0 - - - - 28.0 - i
2010 cannabis 18.0 - 28.0 26.0 - - - - 18.0 - i
2010 cocaine 7.0 - 6.0 6.0 - - - - 2.0 - i
2010 heroin 5.0 - 12.0 9.0 - - - - 12.0 - j
2010 mandrax 6.0 - 2.0 2.0 - - - - 3.0 - i
2010 methamphetamine 9.0 - 1.0 1.0 - - - - 35.0 - i
2011 alcohol 40.4 - 35.9 67.0 - - - - 23.7 - k
2011 cannabis 16.1 - 27.6 16.2 - - - - 14.5 - k
2011 cocaine 4.0 - 6.2 5.4 - - - - 2.2 - k
2011 heroin 2.6 - 12.7 6.1 - - - - 17.0 - k
2011 mandrax 5.0 - 1.7 2.5 - - - - 2.4 - k
2011 methamphetamine 18.4 - 1.4 0.5 - - - - 38.8 - k
Reference notes (indicator definitions from page 310 and references from page 315):
a Okeke et al. 2012.221 Presence of alcohol use problems assessed using CAGE questionnaire - ‘yes’ answer to two or more CAGE questions. The study was conducted among health care workers (HCWs) in three public hospitals in a health district in KwaZulu-Natal.
b Okeke et al. 2012.221 The study was conducted among health care workers (HCWs) in three public hospitals in a health district in KwaZulu-Natal.
c SACENDU. Update June 2010.231 Data for Jul-Dec 2009. The total figure includes patients from MP and LP (Northern Region) and from FS, NW and NC combined (Central Region).
d SACENDU. Update June 2011.232 Data for Jul - Dec 2010 (Phase 29). The total figure includes patients from MP and LP (Northern Region) and from FS, NW and NC combined (Central Region).
e SACENDU. Update June 2012.228 Data for Jul - Dec 2011 (Phase 31). The total figure includes patients from MP and LP (Northern Region) and from FS, NW and NC combined (Central Region).
f Okeke et al. 2012.221 Included: paramedics, lay counsellors, clinical orderlies, pharmacists, pharmacy assistants, laboratory technologists, laboratory technicians, radiographers, and social workers.
g Okeke et al. 2012.221 Clerks and data capturers.h SACENDU. Update June 2010.231 Data for Jul-Dec 2009.i SACENDU. Update June 2011.232 Data for Jul - Dec 2010 (Phase 29).j The decline in KZN since 2nd half of 2009 was mainly due to data
not being included from a centre which primarily deals with the use of ‘Sugars’ (a low-quality heroin and cocaine mix) among young, Indian males in South Durban; and in this period no data were supplied by this centre.
k SACENDU. Update June 2012.228 Data for Jul - Dec 2011 (Phase 31). Note grouped results for MP and LP (Northern Region) and from FS, NW and NC combined (Central Region).
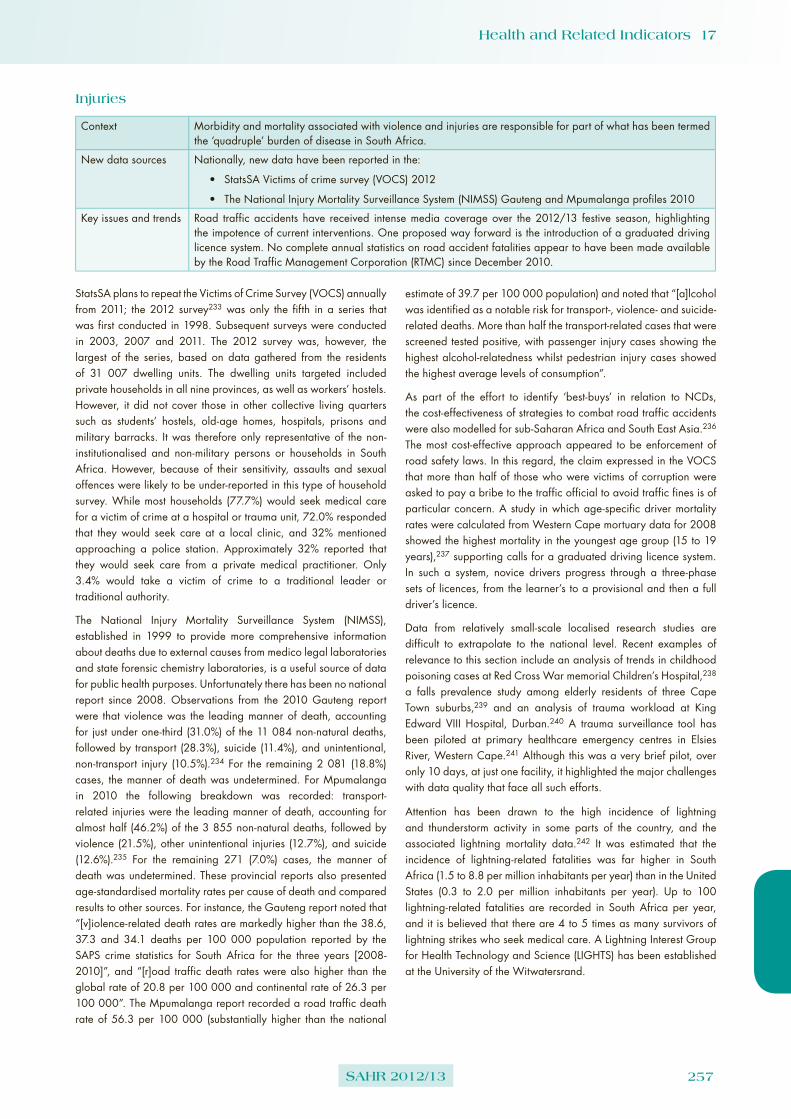
Health and Related Indicators 17
SAHR 2012/13 257
Injuries
Context Morbidity and mortality associated with violence and injuries are responsible for part of what has been termed the ‘quadruple’ burden of disease in South Africa.
New data sources Nationally, new data have been reported in the:
• StatsSA Victims of crime survey (VOCS) 2012
• The National Injury Mortality Surveillance System (NIMSS) Gauteng and Mpumalanga profiles 2010
Key issues and trends Road traffic accidents have received intense media coverage over the 2012/13 festive season, highlighting the impotence of current interventions. One proposed way forward is the introduction of a graduated driving licence system. No complete annual statistics on road accident fatalities appear to have been made available by the Road Traffic Management Corporation (RTMC) since December 2010.
StatsSA plans to repeat the Victims of Crime Survey (VOCS) annually from 2011; the 2012 survey233 was only the fifth in a series that was first conducted in 1998. Subsequent surveys were conducted in 2003, 2007 and 2011. The 2012 survey was, however, the largest of the series, based on data gathered from the residents of 31 007 dwelling units. The dwelling units targeted included private households in all nine provinces, as well as workers’ hostels. However, it did not cover those in other collective living quarters such as students’ hostels, old-age homes, hospitals, prisons and military barracks. It was therefore only representative of the non-institutionalised and non-military persons or households in South Africa. However, because of their sensitivity, assaults and sexual offences were likely to be under-reported in this type of household survey. While most households (77.7%) would seek medical care for a victim of crime at a hospital or trauma unit, 72.0% responded that they would seek care at a local clinic, and 32% mentioned approaching a police station. Approximately 32% reported that they would seek care from a private medical practitioner. Only 3.4% would take a victim of crime to a traditional leader or traditional authority.
The National Injury Mortality Surveillance System (NIMSS), established in 1999 to provide more comprehensive information about deaths due to external causes from medico legal laboratories and state forensic chemistry laboratories, is a useful source of data for public health purposes. Unfortunately there has been no national report since 2008. Observations from the 2010 Gauteng report were that violence was the leading manner of death, accounting for just under one-third (31.0%) of the 11 084 non-natural deaths, followed by transport (28.3%), suicide (11.4%), and unintentional, non-transport injury (10.5%).234 For the remaining 2 081 (18.8%) cases, the manner of death was undetermined. For Mpumalanga in 2010 the following breakdown was recorded: transport-related injuries were the leading manner of death, accounting for almost half (46.2%) of the 3 855 non-natural deaths, followed by violence (21.5%), other unintentional injuries (12.7%), and suicide (12.6%).235 For the remaining 271 (7.0%) cases, the manner of death was undetermined. These provincial reports also presented age-standardised mortality rates per cause of death and compared results to other sources. For instance, the Gauteng report noted that “[v]iolence-related death rates are markedly higher than the 38.6, 37.3 and 34.1 deaths per 100 000 population reported by the SAPS crime statistics for South Africa for the three years [2008-2010]”, and “[r]oad traffic death rates were also higher than the global rate of 20.8 per 100 000 and continental rate of 26.3 per 100 000”. The Mpumalanga report recorded a road traffic death rate of 56.3 per 100 000 (substantially higher than the national
estimate of 39.7 per 100 000 population) and noted that “[a]lcohol was identified as a notable risk for transport-, violence- and suicide-related deaths. More than half the transport-related cases that were screened tested positive, with passenger injury cases showing the highest alcohol-relatedness whilst pedestrian injury cases showed the highest average levels of consumption”.
As part of the effort to identify ‘best-buys’ in relation to NCDs, the cost-effectiveness of strategies to combat road traffic accidents were also modelled for sub-Saharan Africa and South East Asia.236 The most cost-effective approach appeared to be enforcement of road safety laws. In this regard, the claim expressed in the VOCS that more than half of those who were victims of corruption were asked to pay a bribe to the traffic official to avoid traffic fines is of particular concern. A study in which age-specific driver mortality rates were calculated from Western Cape mortuary data for 2008 showed the highest mortality in the youngest age group (15 to 19 years),237 supporting calls for a graduated driving licence system. In such a system, novice drivers progress through a three-phase sets of licences, from the learner’s to a provisional and then a full driver’s licence.
Data from relatively small-scale localised research studies are difficult to extrapolate to the national level. Recent examples of relevance to this section include an analysis of trends in childhood poisoning cases at Red Cross War memorial Children’s Hospital,238 a falls prevalence study among elderly residents of three Cape Town suburbs,239 and an analysis of trauma workload at King Edward VIII Hospital, Durban.240 A trauma surveillance tool has been piloted at primary healthcare emergency centres in Elsies River, Western Cape.241 Although this was a very brief pilot, over only 10 days, at just one facility, it highlighted the major challenges with data quality that face all such efforts.
Attention has been drawn to the high incidence of lightning and thunderstorm activity in some parts of the country, and the associated lightning mortality data.242 It was estimated that the incidence of lightning-related fatalities was far higher in South Africa (1.5 to 8.8 per million inhabitants per year) than in the United States (0.3 to 2.0 per million inhabitants per year). Up to 100 lightning-related fatalities are recorded in South Africa per year, and it is believed that there are 4 to 5 times as many survivors of lightning strikes who seek medical care. A Lightning Interest Group for Health Technology and Science (LIGHTS) has been established at the University of the Witwatersrand.

258 SAHR 2012/13
Table 22: Injury indicators by province
EC FS GP KZN LP MP NC NW WC SA RefRoad accident fatalities per 100 000 population2008 22.2 31.4 24.2 25.3 25.8 52.1 31.2 37.0 30.2 28.4 a
2009 22.9 34.4 22.6 27.1 27.8 46.7 30.7 35.6 25.0 27.8 a
2010 26.5 41.4 19.5 26.2 28.1 44.0 40.1 36.2 25.3 27.9 b
Reference notes (indicator definitions from page 310 and references from page 315):a Road Accidents 2009.243 Ratios updated in 2010 using new StatsSA
mid-year population time series estimates.b Road Accidents 2010.244

Health and Related Indicators 17
SAHR 2012/13 259
Health services indicators
Health facilities
Context There is continued pressure on the public sector to upgrade health facilities in order to be able to eventually compete with the private sector for contracts from the National Health Insurance system. In this regard, the results of the national audit of all fixed public sector facilities have not yet been released. The Bill which provides for the establishment of an independent Office of Health Standards Compliance is still under consideration by Parliament.
New data sources Nationally, new data have been reported in the:
• Hospitals Direct Database of private hospitals
• StatsSA General Household Survey 2011
• District Health Information System (DHIS)
Key issues and trends Estimated health service utilisation rates have been provided in a publication by Alaba and McIntyre, based on the South African Consortium for Benefit Incidence Analysis (SACBIA) survey in 2008. However, the authors have pointed out that these data were based on a sample of only 4 800 households and that highly disaggregated data may not be stable.
Each year the StatsSA General Household Survey (GHS) includes questions about health service utilisation.37 The 2011 survey reported that, when members of the household fall ill or have accidents, 70.7% would seek care from a public sector clinic or hospital, while 24.3% would consult a private medical practitioner. As in recent years, the least favoured options were private sector pharmacies (0.3%) and traditional healers (0.1%). Almost all (89.8% of all households) reported that they would use the nearest facility of its kind. Reasons for not doing so included that the waiting period at the nearest facility was too long (16.0%), medicines that were needed were not available (11.1%) and the staff were rude/uncaring or turned the patient away (3.5%). Levels of satisfaction with the health facilities used were also reported. The Health Economics Unit at the University of Cape Town has also explored community preferences for improving public sector health services, by conducting discrete choice experiments with approximately 500 households in each of two provinces (four districts in the Eastern Cape and three in the Western Cape).245 This study showed that communities tolerated poor quality characteristics such as long waiting times, poor staff attitudes and a lack of direct access to medical practitioners, provided they received a thorough examination, a clear explanation of their diagnosis and treatment and the medicines they needed.
Health service utilisation rates are a critical input variable for health systems planning. In this regard, an important analysis of the data from the StatsSA GHS and the South African Consortium for Benefit Incidence Analysis (SACBIA) survey has pointed to the need to improve the design of the routine household survey, in order to allow for more accurate estimation of utilisation rates.246 Questions which have as their starting point whether or not a member of the household was ill in the month prior to the survey can be misleading. Comparing the GHS 2008 data with the SACBIA results (also collected in 2008), Alaba and McIntyre showed that whereas similar percentages reported an illness (14% and 18% respectively), 38% of those who reported using a health service in the SACBIA survey did not report being ill in that month. The SACBIA survey also captured multiple visits in the same month. The difference in utilisation rates based on the two surveys is striking – 1.36 outpatient visits per person per year based on the GHS data, compared with 4.24 based on the SACBIA data. Using the SACBIA dataset, the authors presented age-sex standardised
utilisation of outpatient services (expressed as the average number of visits per person per year) and inpatient services (expressed as the average number of admissions per 1 000 population per year), by province, by type of area (formal urban, informal urban and rural), by ethnic group, by socio-economic group, and by medical scheme membership status, in public and private facilities. Data for the public sector were presented for clinics, district hospitals, and provincial/central hospitals. In the private sector, utilisation rates were presented for private hospitals, general practitioners, pharmacists, specialists and dentists. However, noting the relatively small sample size (4 800 households), the authors warned that the highly disaggregated data might not be as stable as that at more aggregated levels (such as for the public versus private sectors as a whole). The authors noted that the SACBIA survey was ‘a once-off initiative’ and that it was “unlikely to be feasible to undertake such a survey on a regular basis”. Accordingly, the authors emphasised that “[w]ith relatively few changes and little additional data collection effort, the GHS could allow for routine monitoring of progress with the NHI reforms from a service utilisation perspective”.

260 SAHR 2012/13
Table 23: Percentage distribution of utilisation of public and private providers, GHS and SACBIA surveys, 2008
GHS 2008 SACBIAPublic Private Public Private
Socio-economic status Quintile 1 (poorest) Quintile 2 Quintile 3 Quintile 4 Quintile 5 (richest)
8174694329
1926315771
8783786528
1317223572
Ethnic group African Coloured Asian White
68584016
32426084
77673720
23336380
Medical scheme membership Not a medical scheme member Medical scheme member
7412
2688
8111
1989
Province Eastern Cape Free State Gauteng KwaZulu-Natal Limpopo Mpumalanga North West Northern Cape Western Cape
675450737360636752
334650272740373348
806657728473788861
203443281627221239
Source: Alaba and McIntyre, 2012.246 Based on data from the StatsSA General Household Survey (GHS) 2008 and the South Africa Consortium for Benefit Incidence Analysis survey (SACBIA) 2008.
Note: While the GHS 2008 survey indicated that 61% of those who had used an outpatient service due to illness in the previous month had used a public provider, the SACBIA survey indicated that 71% of health service visits in the past month had been to a public provider. To calculate these estimates, the denominator used for the GHS was the total number reporting service use (as only one visit was recorded per person). In the case of the SACBIA study, as multiple visits by the same person were recorded, the denominator is the total number of visits reported.

Health and Related Indicators 17
SAHR 2012/13 261
Non-member
Scheme member
Quintile 1
Quintile 2
Quintile 3
Quintile 4
Quintile 5
African
Coloured
Asian
White
Eastern Cape
Free State
Gauteng
KwaZulu-Natal
Limpopo
Mpumlanga
North West
Northern Cape
Western Cape
Rural
Informal urban
Formal urban
Public Providers
Private Providers
0.71
0.23
1.4
0.71
0.89
1.65
2.59
1.78
2.5
3.89
3.17
2.37
3.69
3.42
0.56
1.08
1.75
1.41
0.71
0.76
2.26
0.53
2.48
2.51
2.82
4.13
4.32
2.36
0.68
4.73
0.73
0.59
0.8
1.25
2.97
0.9
1.16
3.41
0.75
3.81
3.73
3.2
2.59
1.48
3.37
2.7
0 1 2 3 4 5 6 7Average number of outpatient visits per person per year
Area
type
Prov
ince
Ethn
ic g
roup
Soci
o-ec
onom
ic g
roup
Med
ical
sc
hem
eFigure 3: Age-sex standardised utilisation of outpatient services by type of area, province, ethnic group, socio-economic group
and medical scheme membership status, SACBIA, 2008
Source: Alaba and McIntyre, 2012.246 Based on data from the StatsSA General Household Survey (GHS) 2008 and the South Africa Consortium for Benefit Incidence Analysis survey (SACBIA) 2008.
Note: Data were age-sex standardised and adjusted for seasonality.
Table 24: Health services indicators by province
EC FS GP KZN LP MP NC NW WC SA RefPercentage of users of private health services highly satisfied with the service received2009 GHS 95.1 92.4 91.2 94.7 92.2 87.8 95.6 94.2 92.5 92.5 a
2010 GHS 95.1 91.0 91.2 88.5 96.1 91.3 90.8 92.7 94.9 92.1 a
2011 GHS 98.6 95.3 92.4 85.9 97.2 94.8 89.9 89.9 92.0 92.9 a
Percentage of users of public health services highly satisfied with the service received2009 GHS 56.0 41.8 52.9 53.7 67.4 46.8 65.8 44.8 58.1 54.5 a
2010 GHS 52.7 55.8 52.4 48.9 75.4 57.4 64.1 50.5 60.4 55.9 a
2011 GHS 67.0 68.4 57.6 51.5 78.1 62.2 54.5 52.0 65.6 61.9 a
Reference notes (indicator definitions from page 310 and references from page 315):
a StatsSA GHS 2011.37 Reporting results from the GHS 2009, 2010 and 2011.

262 SAHR 2012/13
Table 25: Health facilities indicators by province
EC FS GP KZN LP MP NC NW WC SA RefAverage length of stay (ALOS)2009 DHIS 6.7 4.9 5.2 6.9 5.7 4.7 3.4 5.4 4.6 5.6 a
2010 DHIS 6.7 4.9 5.1 6.9 5.5 4.7 3.3 5.7 5.3 5.7 a
2011 DHIS 6.7 4.9 4.9 6.7 5.7 4.5 3.2 5.5 5.3 5.6 a
Number of beds2010 Private sector 1 723 2 337 14 278 4 514 600 1 252 293 1 685 4 385 31 067 b
2011 District Hospitals 6 214 1 539 2 424 8 522 4 057 2 719 528 1 528 2 477 30 007 c
2011 National Central Hospitals 0 616 6 170 834 0 0 0 0 2 541 10 160 c
2011 Provincial Tertiary 3 770 0 0 493 952 630 638 0 0 6 484 c
2011 Regional Hospitals 585 1 813 6 346 7 291 1 581 877 145 1 881 1 355 21 873 c
Number of health facilities2010 Private hosp total 15 16 84 33 8 9 3 14 34 216 b
2011 District Hospitals 65 25 12 39 31 23 16 16 32 259 d
2011 National Central Hospitals - 1 4 1 - - - - 3 9 d
2011 Provincial Tertiary 7 - - 1 2 2 - - - 12 d
2011 Public hosp total 91 33 37 76 42 33 20 23 55 410 d
2011 Regional Hospitals 2 5 11 14 5 3 1 4 8 53 d
2011 Specialised Hospitals 17 2 10 21 4 5 3 3 12 77 d
2012 CHC/CDC 33 6 31 16 23 47 26 49 51 282 e
2012 District Hospitals 65 25 10 39 30 22 14 15 34 254 e
2012 National Central Hospitals 0 0 3 1 0 0 0 0 2 6 e
2012 Provincial Tertiary 2 1 1 1 2 2 - 1 - 10 e
2012 Public clinics 719 214 321 556 436 233 128 256 212 3 075 e
2012 Regional Hospitals 6 5 12 13 5 3 2 4 5 55 e
2012 Specialised Hospitals 18 1 6 18 4 5 1 2 13 68 e
Useable bed utilisation (occupancy) rate (BUR)2009 DHIS 71 71 76 68 69 64 52 68 81 71 a
2010 DHIS 71 69 73 65 68 66 59 70 80 70 a
2011 DHIS 71 72 74 70 72 70 59 71 82 73 a
Useable beds per 1 000 population2009 District Hospitals 1.0 0.6 0.3 0.9 0.8 0.9 0.8 0.4 0.5 0.7 f
2009 Public sector 2.5 2.1 2.2 2.5 1.6 1.7 2.0 1.5 2.5 2.2 g
2009 Regional Hospitals 0.1 0.7 0.8 0.8 0.3 0.3 0.7 0.6 0.6 0.6 h
2009 Total population - - - - - - - - - 2.5 i
2010 Private sector 2.1 4.9 4.8 2.7 1.3 2.4 2.0 3.6 3.4 3.5 j
2011 District Hospitals 1.1 0.6 0.3 1.0 0.8 0.9 0.8 0.5 0.5 0.7 f
2011 Public sector 2.3 2.0 2.1 2.7 1.6 1.5 1.5 1.5 2.2 2.1 g
2011 Regional Hospitals 0.1 0.7 0.8 1.0 0.3 0.3 0.6 0.6 0.6 0.6 h
2011 Total population 2.3 2.4 2.8 2.4 1.6 1.5 1.4 1.9 2.4 2.3 k
Utilisation rate PHC2009 DHIS 2.8 2.3 1.7 2.5 2.9 2.2 2.9 2.5 2.9 2.4 a
2010 DHIS 2.7 2.3 1.8 2.5 2.7 2.2 3.0 2.4 2.9 2.4 a
2011 DHIS 2.7 2.5 2.0 2.8 2.8 2.4 2.9 2.3 2.8 2.5 a
Utilisation rate PHC <5 years2009 DHIS 4.6 3.7 3.9 4.5 6.3 4.8 4.5 4.7 4.9 4.6 a
2010 DHIS 4.3 3.5 3.9 4.4 5.9 4.8 4.7 4.5 4.7 4.5 a
2011 DHIS 4.6 3.7 4.1 4.6 6.2 4.8 4.6 4.4 4.7 4.7 a
Reference notes (indicator definitions from page 310 and references from page 315):
a DHIS. All facility types. Data extracted June 2012. Data for financial year from April of the year to March of the following year (not calendar year).
b Hospitals Direct Database.247
c DHIS. Extracted June 2012. Average number of beds for 2011/12 financial year.
d DHIS. Extracted June 2011. Total includes District, Regional, Provincial Tertiary, National Central and Specialised Hospitals.
e AHS 2012.67 Based on National Facilities Audit. Note that a number of facilities received updated classifications compared to their current OrgUnitType in DHIS, therefore the numbers may vary, but this is not necessary due to a real change in the number of physical facilities on the ground. DHIS also has some units within facilities as separate orgunits.

Health and Related Indicators 17
SAHR 2012/13 263
f DHIS. Calculated from DHIS useable beds for district hospitals, per 1 000 uninsured population (calculated from StatsSA GHS medical schemes coverage and mid-year population estimates).
g DHIS. Calculated from DHIS useable beds for all types of public sector hospitals, per 1 000 uninsured population (calculated from StatsSA GHS medical schemes coverage and mid-year population estimates).
h DHIS. Calculated from DHIS useable beds for regional hospitals, per 1 000 uninsured population (calculated from StatsSA GHS medical schemes coverage and mid-year population estimates).
i Econex Health Reform Note 4.248
j Hospitals Direct Database.247 Calculated from Wilbury & Claymore data on beds, per 1 000 population with medical scheme cover from StatsSA GHS.
k AHS 2012.67 Calculated from Wilbury & Claymore data on private hospitals (2010/11) and DHIS data on main public hospital types (district, regional, provincial, central, specialised psychiatric and TB hospitals) per total population (DHIS population estimates).
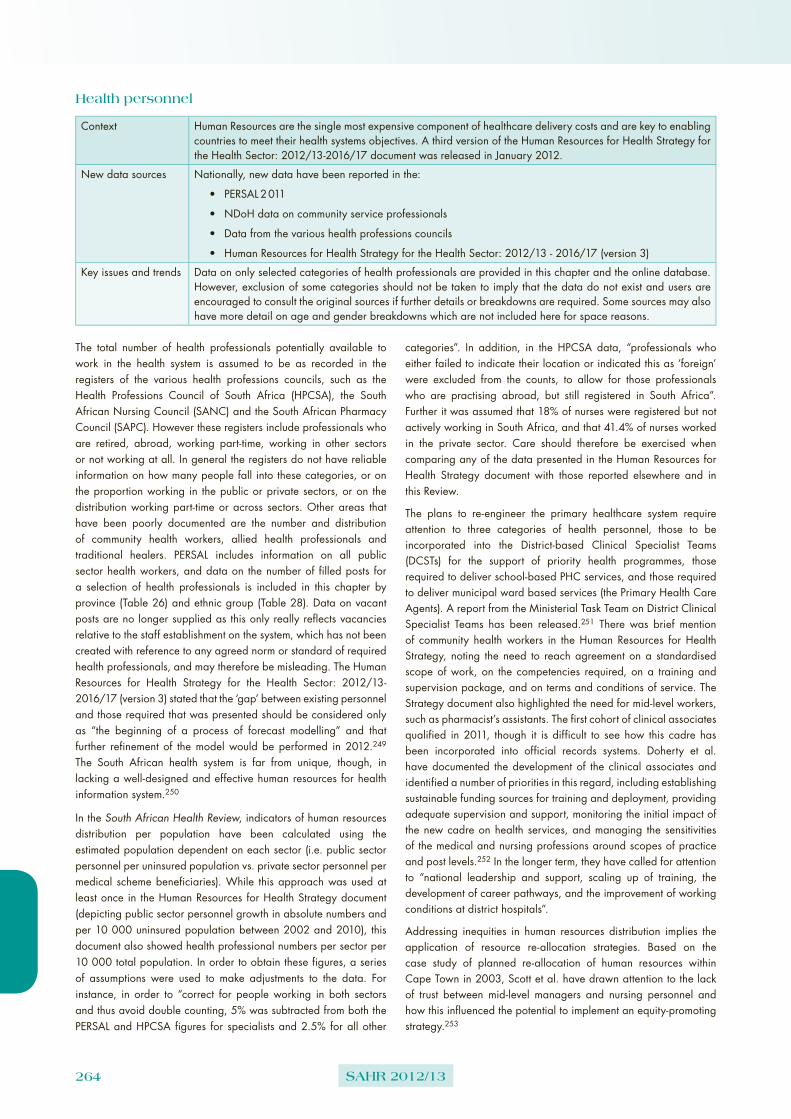
264 SAHR 2012/13
Health personnel
Context Human Resources are the single most expensive component of healthcare delivery costs and are key to enabling countries to meet their health systems objectives. A third version of the Human Resources for Health Strategy for the Health Sector: 2012/13-2016/17 document was released in January 2012.
New data sources Nationally, new data have been reported in the:
• PERSAL 2011
• NDoH data on community service professionals
• Data from the various health professions councils
• Human Resources for Health Strategy for the Health Sector: 2012/13 - 2016/17 (version 3)
Key issues and trends Data on only selected categories of health professionals are provided in this chapter and the online database. However, exclusion of some categories should not be taken to imply that the data do not exist and users are encouraged to consult the original sources if further details or breakdowns are required. Some sources may also have more detail on age and gender breakdowns which are not included here for space reasons.
The total number of health professionals potentially available to work in the health system is assumed to be as recorded in the registers of the various health professions councils, such as the Health Professions Council of South Africa (HPCSA), the South African Nursing Council (SANC) and the South African Pharmacy Council (SAPC). However these registers include professionals who are retired, abroad, working part-time, working in other sectors or not working at all. In general the registers do not have reliable information on how many people fall into these categories, or on the proportion working in the public or private sectors, or on the distribution working part-time or across sectors. Other areas that have been poorly documented are the number and distribution of community health workers, allied health professionals and traditional healers. PERSAL includes information on all public sector health workers, and data on the number of filled posts for a selection of health professionals is included in this chapter by province (Table 26) and ethnic group (Table 28). Data on vacant posts are no longer supplied as this only really reflects vacancies relative to the staff establishment on the system, which has not been created with reference to any agreed norm or standard of required health professionals, and may therefore be misleading. The Human Resources for Health Strategy for the Health Sector: 2012/13-2016/17 (version 3) stated that the ‘gap’ between existing personnel and those required that was presented should be considered only as “the beginning of a process of forecast modelling” and that further refinement of the model would be performed in 2012.249 The South African health system is far from unique, though, in lacking a well-designed and effective human resources for health information system.250
In the South African Health Review, indicators of human resources distribution per population have been calculated using the estimated population dependent on each sector (i.e. public sector personnel per uninsured population vs. private sector personnel per medical scheme beneficiaries). While this approach was used at least once in the Human Resources for Health Strategy document (depicting public sector personnel growth in absolute numbers and per 10 000 uninsured population between 2002 and 2010), this document also showed health professional numbers per sector per 10 000 total population. In order to obtain these figures, a series of assumptions were used to make adjustments to the data. For instance, in order to “correct for people working in both sectors and thus avoid double counting, 5% was subtracted from both the PERSAL and HPCSA figures for specialists and 2.5% for all other
categories”. In addition, in the HPCSA data, “professionals who either failed to indicate their location or indicated this as ‘foreign’ were excluded from the counts, to allow for those professionals who are practising abroad, but still registered in South Africa”. Further it was assumed that 18% of nurses were registered but not actively working in South Africa, and that 41.4% of nurses worked in the private sector. Care should therefore be exercised when comparing any of the data presented in the Human Resources for Health Strategy document with those reported elsewhere and in this Review.
The plans to re-engineer the primary healthcare system require attention to three categories of health personnel, those to be incorporated into the District-based Clinical Specialist Teams (DCSTs) for the support of priority health programmes, those required to deliver school-based PHC services, and those required to deliver municipal ward based services (the Primary Health Care Agents). A report from the Ministerial Task Team on District Clinical Specialist Teams has been released.251 There was brief mention of community health workers in the Human Resources for Health Strategy, noting the need to reach agreement on a standardised scope of work, on the competencies required, on a training and supervision package, and on terms and conditions of service. The Strategy document also highlighted the need for mid-level workers, such as pharmacist’s assistants. The first cohort of clinical associates qualified in 2011, though it is difficult to see how this cadre has been incorporated into official records systems. Doherty et al. have documented the development of the clinical associates and identified a number of priorities in this regard, including establishing sustainable funding sources for training and deployment, providing adequate supervision and support, monitoring the initial impact of the new cadre on health services, and managing the sensitivities of the medical and nursing professions around scopes of practice and post levels.252 In the longer term, they have called for attention to “national leadership and support, scaling up of training, the development of career pathways, and the improvement of working conditions at district hospitals”.
Addressing inequities in human resources distribution implies the application of resource re-allocation strategies. Based on the case study of planned re-allocation of human resources within Cape Town in 2003, Scott et al. have drawn attention to the lack of trust between mid-level managers and nursing personnel and how this influenced the potential to implement an equity-promoting strategy.253
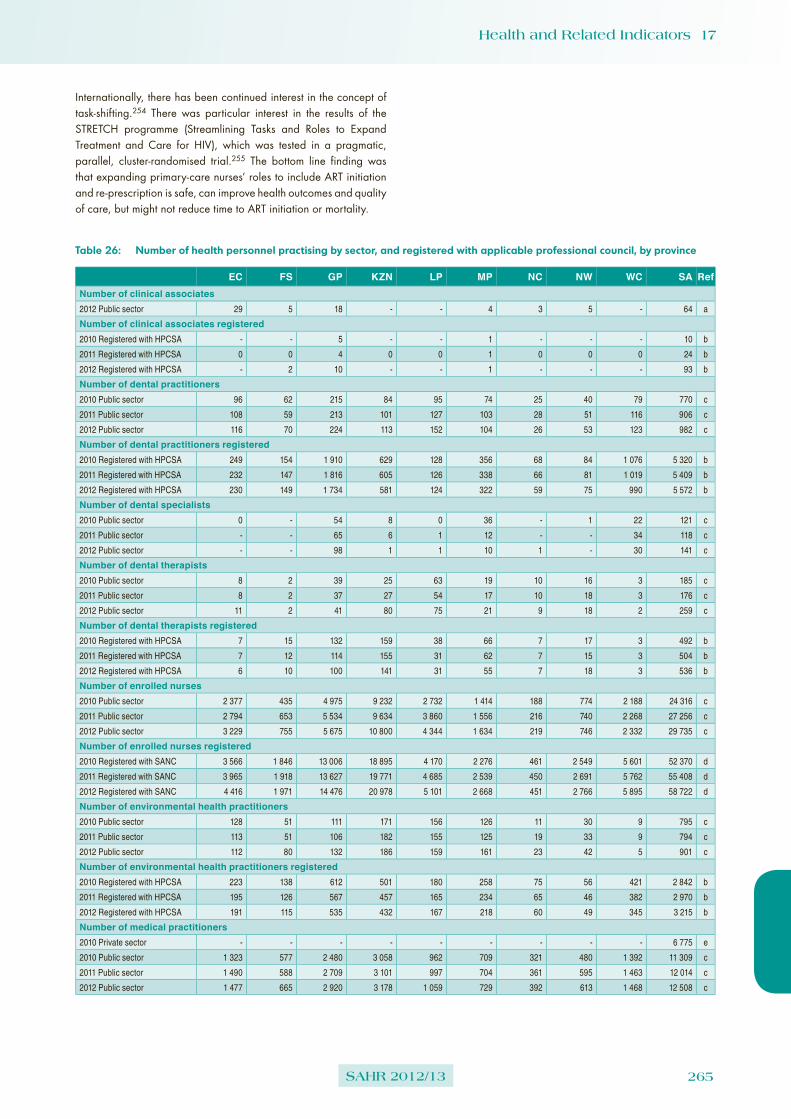
Health and Related Indicators 17
SAHR 2012/13 265
Internationally, there has been continued interest in the concept of task-shifting.254 There was particular interest in the results of the STRETCH programme (Streamlining Tasks and Roles to Expand Treatment and Care for HIV), which was tested in a pragmatic, parallel, cluster-randomised trial.255 The bottom line finding was that expanding primary-care nurses’ roles to include ART initiation and re-prescription is safe, can improve health outcomes and quality of care, but might not reduce time to ART initiation or mortality.
Table 26: Number of health personnel practising by sector, and registered with applicable professional council, by province
EC FS GP KZN LP MP NC NW WC SA RefNumber of clinical associates2012 Public sector 29 5 18 - - 4 3 5 - 64 a
Number of clinical associates registered2010 Registered with HPCSA - - 5 - - 1 - - - 10 b
2011 Registered with HPCSA 0 0 4 0 0 1 0 0 0 24 b
2012 Registered with HPCSA - 2 10 - - 1 - - - 93 b
Number of dental practitioners2010 Public sector 96 62 215 84 95 74 25 40 79 770 c
2011 Public sector 108 59 213 101 127 103 28 51 116 906 c
2012 Public sector 116 70 224 113 152 104 26 53 123 982 c
Number of dental practitioners registered2010 Registered with HPCSA 249 154 1 910 629 128 356 68 84 1 076 5 320 b
2011 Registered with HPCSA 232 147 1 816 605 126 338 66 81 1 019 5 409 b
2012 Registered with HPCSA 230 149 1 734 581 124 322 59 75 990 5 572 b
Number of dental specialists2010 Public sector 0 - 54 8 0 36 - 1 22 121 c
2011 Public sector - - 65 6 1 12 - - 34 118 c
2012 Public sector - - 98 1 1 10 1 - 30 141 c
Number of dental therapists2010 Public sector 8 2 39 25 63 19 10 16 3 185 c
2011 Public sector 8 2 37 27 54 17 10 18 3 176 c
2012 Public sector 11 2 41 80 75 21 9 18 2 259 c
Number of dental therapists registered2010 Registered with HPCSA 7 15 132 159 38 66 7 17 3 492 b
2011 Registered with HPCSA 7 12 114 155 31 62 7 15 3 504 b
2012 Registered with HPCSA 6 10 100 141 31 55 7 18 3 536 b
Number of enrolled nurses2010 Public sector 2 377 435 4 975 9 232 2 732 1 414 188 774 2 188 24 316 c
2011 Public sector 2 794 653 5 534 9 634 3 860 1 556 216 740 2 268 27 256 c
2012 Public sector 3 229 755 5 675 10 800 4 344 1 634 219 746 2 332 29 735 c
Number of enrolled nurses registered2010 Registered with SANC 3 566 1 846 13 006 18 895 4 170 2 276 461 2 549 5 601 52 370 d
2011 Registered with SANC 3 965 1 918 13 627 19 771 4 685 2 539 450 2 691 5 762 55 408 d
2012 Registered with SANC 4 416 1 971 14 476 20 978 5 101 2 668 451 2 766 5 895 58 722 d
Number of environmental health practitioners2010 Public sector 128 51 111 171 156 126 11 30 9 795 c
2011 Public sector 113 51 106 182 155 125 19 33 9 794 c
2012 Public sector 112 80 132 186 159 161 23 42 5 901 c
Number of environmental health practitioners registered2010 Registered with HPCSA 223 138 612 501 180 258 75 56 421 2 842 b
2011 Registered with HPCSA 195 126 567 457 165 234 65 46 382 2 970 b
2012 Registered with HPCSA 191 115 535 432 167 218 60 49 345 3 215 b
Number of medical practitioners2010 Private sector - - - - - - - - - 6 775 e
2010 Public sector 1 323 577 2 480 3 058 962 709 321 480 1 392 11 309 c
2011 Public sector 1 490 588 2 709 3 101 997 704 361 595 1 463 12 014 c
2012 Public sector 1 477 665 2 920 3 178 1 059 729 392 613 1 468 12 508 c

266 SAHR 2012/13
EC FS GP KZN LP MP NC NW WC SA RefNumber of medical practitioners (including specialists) registered2010 Registered with HPCSA 2 149 1 559 11 524 5 670 937 1 819 403 631 7 086 36 912 b
2011 HPCSA General MPs 1 534 931 6 757 3 647 760 1 443 298 476 4 026 25 898 b
2011 HPCSA Specialist MPs 493 497 4 095 1 598 126 274 64 127 2 542 11 685 b
2011 Registered with HPCSA 2 027 1 428 10 852 5 245 886 1 717 362 603 6 568 37 583 b
2012 HPCSA General MPs 1 327 791 5 996 3 208 687 1 276 256 423 3 513 25 053 b
2012 HPCSA Specialist MPs 556 530 4 249 1 708 149 336 86 151 2 670 13 391 b
2012 Registered with HPCSA 1 883 1 321 10 245 4 916 836 1 612 342 574 6 183 38 444 b
Number of medical researchers2010 Public sector - 9 18 12 4 1 1 - 28 107 c
2011 Public sector - 6 18 11 3 1 1 1 38 109 c
2012 Public sector - 6 19 15 7 1 1 - 32 109 c
Number of medical specialists2010 Private sector - - - - - - - - - 5 410 e
2010 Public sector 240 370 1 721 588 107 62 20 49 1 279 4 442 c
2011 Public sector 231 348 1 760 641 98 66 16 83 1 371 4 620 c
2012 Public sector 223 364 1 782 739 78 66 19 96 1 405 4 776 c
Number of nursing assistants2010 Public sector 5 369 2 230 6 877 6 123 4 524 2 103 759 2 730 4 143 34 858 c
2011 Public sector 5 644 2 077 7 053 6 143 5 733 1 981 903 2 744 4 037 36 315 c
2012 Public sector 5 968 2 053 6 829 6 440 5 846 1 874 925 2 721 4 114 36 770 c
Number of nursing assistants registered2010 Registered with SANC 6 124 2 951 16 667 11 489 8 331 3 732 1 311 4 732 8 135 63 472 d
2011 Registered with SANC 6 330 3 071 16 532 11 565 8 699 3 963 1 287 4 831 8 248 64 526 d
2012 Registered with SANC 6 428 3 249 16 914 11 987 8 785 4 059 1 259 4 913 8 375 65 969 d
Number of occupational therapists2010 Public sector 80 71 171 119 113 55 40 38 151 838 c
2011 Public sector 92 63 201 133 156 62 39 38 156 940 c
2012 Public sector 123 76 239 140 179 73 40 34 134 1 038 c
Number of occupational therapists registered2010 Registered with HPCSA 141 232 1 085 347 86 221 49 49 829 3 508 b
2011 Registered with HPCSA 123 205 992 323 83 195 43 43 751 3 629 b
2012 Registered with HPCSA 113 180 919 301 82 182 39 43 690 3 805 b
Number of pharmacists2010 Public sector 252 112 751 401 297 266 89 130 660 2 966 c
2011 Public sector 333 194 842 513 348 314 112 158 724 3 550 c
2012 Public sector 368 261 994 600 389 200 120 175 779 3 902 c
Number of pharmacists registered2010 Registered with SAPC 775 381 2 917 1 502 344 455 137 443 1 479 12 218 f
2011 Registered with SAPC 1 179 473 4 536 1 743 409 517 164 605 1 992 12 460 f
2012 Registered with SAPC 854 402 4 274 1 540 400 451 139 538 1 852 13 003 f
Number of physiotherapists2010 Public sector 110 75 199 231 115 60 56 34 129 1 009 c
2011 Public sector 120 69 212 233 120 68 59 44 132 1 057 c
2012 Public sector 134 83 219 238 141 65 49 63 140 1 132 c
Number of physiotherapists registered2010 Registered with HPCSA 240 267 1 831 732 137 311 72 85 1 355 5 777 b
2011 Registered with HPCSA 217 245 1 698 665 122 290 65 75 1 249 5 937 b
2012 Registered with HPCSA 209 225 1 589 640 118 272 62 70 1 178 6 150 b
Number of professional nurses2010 Public sector 8 287 1 868 9 393 12 463 7 243 3 732 1 258 3 321 4 399 51 966 c
2011 Public sector 8 980 1 981 10 359 13 377 7 863 4 095 1 333 3 479 4 606 56 075 c
2012 Public sector 9 495 2 227 11 167 14 531 8 435 4 170 1 316 3 713 4 833 59 890 c
Number of professional nurses registered2010 Registered with SANC 13 985 7 550 30 063 24 360 9 025 5 714 2 146 7 775 14 626 115 244 d
2011 Registered with SANC 14 118 7 623 30 770 25 440 9 404 5 927 2 202 7 978 14 800 118 262 d
2012 Registered with SANC 14 608 7 788 32 106 27 041 10 080 6 331 2 242 8 394 15 455 124 045 d
Number of psychologists2010 Public sector 56 32 176 68 50 18 9 15 74 498 c
2011 Public sector 66 29 183 71 69 19 8 25 75 545 c
2012 Public sector 75 33 186 84 90 19 8 28 85 608 c

Health and Related Indicators 17
SAHR 2012/13 267
EC FS GP KZN LP MP NC NW WC SA RefNumber of psychologists registered2010 Registered with HPCSA 362 238 3 136 709 102 234 40 152 1 388 7 037 b
2011 Registered with HPCSA 332 219 2 953 651 96 221 37 144 1 270 7 160 b
2012 Registered with HPCSA 305 216 2 823 617 91 208 36 139 1 204 7 370 b
Number of pupil auxiliary nurses registered2010 Registered with SANC 590 224 3 190 1 336 281 247 113 194 536 6 711 d
2011 Registered with SANC 240 137 2 920 1 280 212 168 113 147 527 5 744 d
2012 Registered with SANC 624 171 2 611 1 371 178 142 113 170 530 5 910 d
Number of pupil nurses registered2010 Registered with SANC 1 336 332 6 548 6 354 672 401 0 28 1 165 16 836 d
2011 Registered with SANC 1 081 327 6 550 6 364 584 355 0 2 1 165 16 428 d
2012 Registered with SANC 1 114 366 6 535 6 465 431 372 0 45 1 096 16 424 d
Number of radiographers2010 Public sector 359 167 560 455 144 91 57 66 401 2 301 c
2011 Public sector 382 184 601 486 153 89 71 79 408 2 454 c
2012 Public sector 361 198 660 534 154 93 84 96 429 2 611 c
Number of radiographers registered2010 Registered with HPCSA 447 380 1 866 1 013 110 324 87 107 1 076 6 215 b
2011 Registered with HPCSA 404 321 1 682 935 104 283 79 92 980 6 431 b
2012 Registered with HPCSA 373 312 1 565 869 96 255 79 83 895 6 748 b
Number of student nurses2010 Public sector 1 273 2 4 916 2 272 789 689 4 961 - 10 906 c
2011 Public sector 1 425 - 5 155 2 237 665 643 - 851 - 10 976 c
2012 Public sector 1 044 - 5 299 2 159 630 953 - 664 - 10 749 c
Number of student nurses registered2010 Registered with SANC 3 761 1 079 4 839 3 318 1 778 704 168 1 577 2 554 19 778 d
2011 Registered with SANC 3 637 1 205 5 076 3 288 1 865 794 108 1 732 2 876 20 581 d
2012 Registered with SANC 3 758 1 354 5 151 3 009 1 840 911 218 1 729 2 950 20 920 d
Total number of health professional posts2010 Public sector (filled) 19 958 6 063 32 656 35 310 17 394 9 455 2 848 8 685 14 957 147 387 c
2011 Public sector (filled) 21 786 6 304 35 048 36 896 20 402 9 855 3 176 8 939 15 440 157 905 c
2012 Public sector (filled) 22 736 6 873 36 484 39 838 21 739 10 173 3 232 9 062 15 911 166 111 c
Reference notes (indicator definitions from page 310 and references from page 315):
a PERSAL.256 Note that in PERSAL Clinical Associates are a ‘Rank’ under Medical Practitioners and therefore these numbers are included within the number of MPs.
b HPCSA.257 Total for South Africa includes those with REGION indicated as Foreign or Unknown. The number on the register includes those professionals who are retired, overseas, working part-time, working in other sectors or not working at all.
c PERSAL.256 Note that this total includes only the posts that are filled at time of data extraction. The South African total includes the sum of the provinces plus posts within the National Department of Health. Data for Environmental Health Practitioners only include those employed by provincial government. Note that for provinces such as GP and WC a substantial number of EHPs may be employed by local government.
d SANC.258 The number on the register includes those professionals who are retired, overseas, working part-time, working in other sectors or not working at all.
e Econex Health Reform Note 7.259 Based on medical scheme industry estimates of doctors visited by members and subsequently reimbursed by schemes. Source also provides adjusted estimates of public and private sector doctors to account for doctors working across both sectors.
f SAPC.260 The total for South Africa includes large numbers of pharmacists for whom province was unknown and thus the provincial breakdown should be interpreted with caution. The number on the register also includes those professionals who are retired, overseas, working part-time, working in other sectors or not working at all.

268 SAHR 2012/13
Table 27: Public and private sector health personnel per 100 000 sector population
EC FS GP KZN LP MP NC NW WC SA RefDental practitioners per 100 000 population2010 Public sector 1.63 2.59 2.73 0.91 1.98 2.35 2.56 1.33 1.94 1.86 a
2011 Public sector 1.85 2.42 2.65 1.13 2.64 3.29 2.80 1.71 2.76 2.19 a
2012 Public sector 1.96 2.87 2.65 1.20 3.10 3.29 2.57 1.74 2.91 2.31 a
Dental specialists per 100 000 population2010 Public sector 0.00 - 0.69 0.09 0.00 1.14 - 0.03 0.54 0.29 a
2011 Public sector 0.00 0.00 0.81 0.07 0.02 0.38 0.00 0.00 0.81 0.28 a
2012 Public sector - - 1.16 0.01 0.02 0.32 0.10 - 0.71 0.33 a
Dental therapists per 100 000 population2010 Public sector 0.14 0.08 0.50 0.27 1.31 0.60 1.02 0.53 0.07 0.45 a
2011 Public sector 0.14 0.08 0.46 0.30 1.12 0.54 1.00 0.60 0.07 0.42 a
2012 Public sector 0.19 0.08 0.49 0.85 1.53 0.66 0.89 0.59 0.05 0.61 a
Enrolled nurses per 100 000 population2010 Public sector 40.3 18.2 63.2 100.1 57.0 44.9 19.3 25.8 53.8 58.8 a
2011 Public sector 47.8 26.8 68.9 107.6 80.3 49.8 21.6 24.8 54.0 65.8 a
2012 Public sector 54.4 30.9 67.2 115.0 88.6 51.7 21.7 24.5 55.2 69.9 a
Environmental health practitioners per 100 000 population2010 Public sector 2.17 2.13 1.41 1.85 3.26 4.00 1.13 1.00 0.22 1.92 a
2011 Public sector 1.93 2.09 1.32 2.03 3.22 4.00 1.90 1.11 0.21 1.92 a
2012 Public sector 1.89 3.28 1.56 1.98 3.24 5.10 2.27 1.38 0.12 2.12 a
Medical practitioners per 100 000 population2010 Private sector - - - - - - - - - 37.0 b
2010 Public sector adjusted - - - - - - - - - 35.0 b
2010 Public sector 22.4 24.1 31.5 33.2 20.1 22.5 32.9 16.0 34.2 27.3 a
2011 Public sector 25.5 24.1 33.7 34.6 20.7 22.5 36.1 19.9 34.8 29.0 a
2012 Public sector 24.9 27.2 34.6 33.9 21.6 23.1 38.8 20.2 34.7 29.4 a
Medical researchers per 100 000 population2010 Public sector - 0.38 0.23 0.13 0.08 0.03 0.10 - 0.69 0.26 a
2011 Public sector 0.00 0.25 0.22 0.12 0.06 0.03 0.10 0.03 0.91 0.26 a
2012 Public sector - 0.25 0.23 0.16 0.14 0.03 0.10 - 0.76 0.26 a
Medical specialists per 100 000 population2010 Private sector - - - - - - - - - 57.0 c
2010 Public sector adjusted - - - - - - - - - 10.0 c
2010 Public sector 4.1 15.5 21.9 6.4 2.2 2.0 2.1 1.6 31.5 10.7 a
2011 Public sector 3.9 14.3 21.9 7.2 2.0 2.1 1.6 2.8 32.7 11.2 a
2012 Public sector 3.8 14.9 21.1 7.9 1.6 2.1 1.9 3.2 33.2 11.2 a
Nursing assistants per 100 000 population2010 Public sector 91.0 93.2 87.3 66.4 94.4 66.8 77.8 91.1 101.9 84.2 a
2011 Public sector 96.5 85.2 87.8 68.6 119.2 63.3 90.2 92.0 96.1 87.7 a
2012 Public sector 100.6 84.1 80.9 68.6 119.3 59.3 91.5 89.5 97.4 86.4 a
Occupational therapists per 100 000 population2010 Public sector 1.4 3.0 2.2 1.3 2.4 1.7 4.1 1.3 3.7 2.0 a
2011 Public sector 1.6 2.6 2.5 1.5 3.2 2.0 3.9 1.3 3.7 2.3 a
2012 Public sector 2.1 3.1 2.8 1.5 3.7 2.3 4.0 1.1 3.2 2.4 a
Pharmacists per 100 000 population2010 Public sector 4.3 4.7 9.5 4.3 6.2 8.4 9.1 4.3 16.2 7.2 a
2011 Public sector 5.7 8.0 10.5 5.7 7.2 10.0 11.2 5.3 17.2 8.6 a
2012 Public sector 6.2 10.7 11.8 6.4 7.9 6.3 11.9 5.8 18.4 9.2 a
Physiotherapists per 100 000 population2010 Public sector 1.86 3.13 2.53 2.50 2.40 1.90 5.74 1.13 3.17 2.44 a
2011 Public sector 2.05 2.83 2.64 2.60 2.50 2.17 5.90 1.47 3.14 2.55 a
2012 Public sector 2.26 3.40 2.59 2.54 2.88 2.06 4.84 2.07 3.31 2.66 a
Professional nurses per 100 000 population2010 Public sector 140.5 78.1 119.3 135.1 151.1 118.5 129.0 110.8 108.2 125.6 a
2011 Public sector 153.5 81.3 129.0 149.4 163.5 130.9 133.2 116.6 109.7 135.4 a
2012 Public sector 160.1 91.2 132.3 154.8 172.1 132.0 130.1 122.1 114.4 140.8 a
Psychologists per 100 000 population2010 Public sector 0.95 1.34 2.23 0.74 1.04 0.57 0.92 0.50 1.82 1.20 a
2011 Public sector 0.00 1.19 2.28 0.79 1.43 0.61 0.80 0.84 1.79 1.32 a
2012 Public sector 1.26 1.35 2.20 0.89 1.84 0.60 0.79 0.92 2.01 1.43 a

Health and Related Indicators 17
SAHR 2012/13 269
EC FS GP KZN LP MP NC NW WC SA RefRadiographers per 100 000 population2010 Public sector 6.1 7.0 7.1 4.9 3.0 2.9 5.8 2.2 9.9 5.6 a
2011 Public sector 6.5 7.5 7.5 5.4 3.2 2.8 7.1 2.6 9.7 5.9 a
2012 Public sector 6.1 8.1 7.8 5.7 3.1 2.9 8.3 3.2 10.2 6.1 a
Student nurses per 100 000 population2010 Public sector 21.6 0.1 62.4 24.6 16.5 21.9 0.4 32.1 - 26.4 a
2011 Public sector 24.4 0.0 64.2 25.0 13.8 20.6 0.0 28.5 0.0 26.5 a
2012 Public sector 17.6 - 62.8 23.0 12.9 30.2 - 21.8 - 25.3 a
Reference notes (indicator definitions from page 310 and references from page 315):
a PERSAL.256 Note that this value was calculated using only the posts that are filled at time of data extraction. Population estimates for the applicable year and medical scheme coverage from StatsSA GHS were used to estimate the public sector dependent population denominator.
b Econex Health Reform Note 7.259 Based on evidence that at least 36.9% of population utilise private medical services for PHC, and thus the population served by the private sector doctors is greater than the number of medical scheme beneficiaries.
c Econex Health Reform Note 7.259 Based on evidence that about 15% of patients seeing private specialists are not medical scheme beneficiaries.
Table 28: Number of health personnel by ethnic group
African Coloured Indian White Other All RefNumber of clinical associates2012 Public sector 61 1 2 - - 64 a
Number of clinical associates registered2012 Registered with HPCSA 85 1 2 4 1 93 b
Number of dental practitioners2012 Public sector 481 98 188 215 - 982 c
Number of dental practitioners registered2012 Registered with HPCSA 748 204 897 2 004 1 719 5 572 b
Number of dental specialists2012 Public sector 37 8 33 63 - 141 c
Number of dental therapists2012 Public sector 222 3 30 4 - 259 c
Number of dental therapists registered2012 Registered with HPCSA 293 3 107 30 103 536 b
Number of enrolled nurses2012 Public sector 26 530 2 398 343 464 - 29 735 c
Number of environmental health practitioners2012 Public sector 842 22 11 26 - 901 c
Number of environmental health practitioners registered2012 Registered with HPCSA 1 804 174 73 389 775 3 215 b
Number of medical practitioners2012 Public sector 6 316 640 1 944 3 608 - 12 508 c
Number of medical practitioners (including specialists) registered2012 HPCSA General MPs 6 779 762 3 621 10 021 3 870 25 053 b
2012 HPCSA Specialist MPs 1 575 165 1 693 6 915 3 043 13 391 b
2012 Registered with HPCSA 8 354 927 5 314 16 936 6 913 38 444 b
Number of medical researchers2012 Public sector 55 21 9 24 - 109 c
Number of medical specialists2012 Public sector 1 289 244 929 2 314 - 4 776 c
Number of nursing assistants2012 Public sector 31 868 3 845 230 827 - 36 770 c
Number of occupational therapists2012 Public sector 393 102 93 450 - 1 038 c
Number of occupational therapists registered2012 Registered with HPCSA 479 205 264 2 398 459 3 805 b
Number of pharmacists2012 Public sector 2 105 504 517 776 - 3 902 c

270 SAHR 2012/13
African Coloured Indian White Other All RefNumber of pharmacists registered2012 Registered with SAPC 2 047 443 2 472 7 947 96 13 003 d
Number of physiotherapists2012 Public sector 476 174 165 317 - 1 132 c
Number of physiotherapists registered2012 Registered with HPCSA 817 435 542 3 247 1 109 6 150 b
Number of professional nurses2012 Public sector 50 676 5 483 1 409 2 322 - 59 890 c
Number of psychologists2012 Public sector 258 35 41 274 - 608 c
Number of psychologists registered2012 Registered with HPCSA 723 256 430 4 214 1 747 7 370 b
Number of radiographers2012 Public sector 1 388 468 291 464 - 2 611 c
Number of radiographers registered2012 Registered with HPCSA 1 568 568 594 2 163 1 855 6 748 b
Number of student nurses2012 Public sector 10 014 269 269 197 - 10 749 c
Total number of health professional posts2012 Public sector (filled) 132 950 14 314 6 502 12 345 - 166 111 c
Reference notes (indicator definitions from page 310 and references from page 315):
a PERSAL.256 Note that in PERSAL Clinical Associates are a ‘Rank’ under Medical Practitioners and therefore these numbers are included within the number of MPs.
b HPCSA.257 Total for South Africa includes those with unknown ethnic group. The number on the register includes those professionals who are retired, overseas, working part-time, working in other sectors or not working at all.
c PERSAL.256 Note that this total includes only the posts that are filled at time of data extraction. The South African total includes the sum of the plus those of unknown group. Data for Environmental Health Practitioners only include those employed by provincial government.
d SAPC.260 The total for South Africa includes pharmacists for whom ethnic group was unknown. The number on the register also includes those professionals who are retired, overseas, working part-time, working in other sectors or not working at all.

Health and Related Indicators 17
SAHR 2012/13 271
Table 29: Number of community service professionals
EC FS GP KZN LP MP NC NW WC SA RefNumber of CS clinical psychologists2010 11 6 58 18 6 2 3 5 10 126 a
2011 12 1 47 12 7 2 1 0 12 111 a
2012 14 3 43 11 6 2 1 4 13 108 a
Number of CS dentists2010 20 25 19 35 24 47 10 16 15 233 a
2011 16 22 9 26 21 46 13 15 15 206 a
2012 13 23 8 22 22 32 13 10 14 178 a
Number of CS dieticians2010 15 15 36 31 30 18 9 4 10 175 a
2011 16 10 42 32 37 5 11 16 10 183 a
2012 21 10 50 27 32 24 13 11 12 207 a
Number of CS doctors2010 160 47 215 214 98 91 65 105 155 1 197 a
2011 172 51 208 194 96 97 83 93 160 1 215 a
2012 136 44 134 146 110 106 87 88 131 1 027 a
Number of CS environmental health practitioners2010 17 25 25 54 28 26 8 17 5 220 a
2011 21 23 34 55 22 23 7 9 5 213 a
2012 17 22 31 34 37 30 11 12 5 211 a
Number of CS nurses2010 478 167 741 255 201 217 70 210 265 2 655 a
2011 429 209 644 339 221 143 66 250 320 2 624 a
2012 567 127 680 368 313 5 - 165 342 2 571 a
Number of CS occupational therapists2010 26 27 59 48 31 19 18 9 18 262 a
2011 28 18 68 44 14 15 13 8 15 227 a
2012 31 26 70 32 25 23 17 9 14 248 a
Number of CS pharmacists2010 28 23 45 43 52 29 18 30 45 344 a
2011 32 29 51 39 50 34 28 25 34 358 a
2012 38 31 38 36 0 33 25 28 32 311 a
Number of CS physiotherapists2010 39 24 71 62 34 26 23 12 23 323 a
2011 46 19 79 55 21 22 17 12 20 299 a
2012 46 24 90 41 31 26 18 17 21 319 a
Number of CS radiographers2010 24 16 104 50 19 13 20 8 45 303 a
2011 29 23 102 49 19 9 22 17 49 323 a
2012 38 25 109 57 25 17 16 18 47 357 a
Number of CS speech therapists2010 8 8 52 32 12 15 12 6 8 156 a
2011 14 8 44 31 6 13 4 7 7 137 a
2012 15 7 55 30 10 16 10 4 6 154 a
Reference notes (indicator definitions from page 310 and references from page 315):
a DoH Community Service.261 The national figure also includes CSPs allocated to SA Military Health Services - SAMHS and Department of Correctional Services - DCS and is therefore greater than the sum of provincial figures.

272 SAHR 2012/13
Health financing
Context Globally, the aim to ensure Universal Health Coverage (UHC) has galvanised many sets of actors, including policy researchers. Locally, that debate is framed in terms of the National Health Insurance reforms, for which the potential financing mechanisms are still being investigated.
New data sources Nationally, new data have been reported in the:
• Medical Schemes Annual Report 2011-12
• NHI Policy Brief 21: Myths about Medical Schemes
• Mediscor Medicines Review 2012
• National Treasury databases
Internationally, reports of interest include:
• Institute for Health Metrics and Evaluation. Financing Global Health 2011 and 2012:
Key issues and trends Although the Green Paper on National Health Insurance was issued in 2011, the final version of this policy (the White Paper) has not yet been produced. A key step is expected to be a discussion paper on financing options, expected to be issued by the Treasury in 2013.
The Lancet published a themed issue on Universal Health Coverage (UHC) in September 2012. In an introductory comment, Frenk and De Ferranti explained that “[t]he paradox of health care is that it is one of the most powerful ways of fighting poverty, yet can itself become an impoverishing factor for families when societies do not ensure effective coverage with financial protection for all”.262 Tracking progress towards UHC is complicated by the lack of “common, comparable indicators”.263
A series of reports on global health financing have been issued by the Institute for Health Metrics and Evaluation (IHME). The 2011 version focused on development assistance for health (DAH) and government expenditure.264 The 2012 report noted that despite global macroeconomic stress, DAH has been sustained at a high level.265 This edition has also incorporated information from the Global Burden of Disease study, allowing the authors to relate DAH to burden of disease. The same group have also provided a comprehensive time series (1950 to 2015) of gross domestic product per capita data for 2010 countries.266
In terms of the South African reform trajectory, this continues to be a fertile case study for research and commentary.267-269 Advocacy work in this regard continues to be produced by or on behalf of a variety of actors.270-273
Private sector financing
The major source of accessible data about the private healthcare sector remains the annual report of the Council for Medical Schemes (CMS).36 Consolidation in the medical scheme environment has continued, with the total number of registered schemes dropping from 99 to 95 in 2012. However, a large number of benefit options was still available (169 open scheme options and 142 closed scheme options). There were 16 third-party administrators and eight self-administered medical schemes at the end of the reporting period, as well as 40 registered managed care organisations. Against a total of R107.4 billion collected in contributions in 2011, medical schemes spent R93.2 billion on healthcare benefits. In terms of the major expenditure categories, an increase in the amounts spent on private hospitals and on specialists was again noted. In real terms, medical schemes spent 15.2% more on medicines in 2011 (R15.2 billion) than in 2000 (R13.2 billion). As in previous years, the only
accessible detailed report on medicines expenditure and trends is that provided by the administrator Mediscor.274
The received wisdom in relation to medical scheme coverage is that it has remained relatively stagnant over time, and has continued to reflect an entrenched racially-defined system. This perception has been challenged in a recent policy brief in the series issued by Innovative Medicines South Africa (IMSA).273 Based on the reported number of medical scheme beneficiaries and the ASSA2008 population denominators, medical scheme coverage has fluctuated between 14.5% and 17.1% of the population between 1985 and 2010. However, by drawing on data from multiple sources, McLeod has shown that marked changes in the ethnicity of these beneficiaries have occurred. The IMSA policy brief therefore points out that “[i]n 1980 only 7.9% of those covered by medical schemes were African/Black. This proportion grew steadily to 30.9% by 1994 and to 46.3% by 2010.” (Figure 5 in appendix). Despite this growth, by 2011, only 8.9% of Africans were beneficiaries of a medical scheme, according to the General Household Survey (Table 33).37 Govender et al. investigated whether lessons could be learned from the introduction of the GEMS medical scheme for civil servants in terms of aligning financing strategies with the global imperative of UHC.275 They found that a considerable portion of socio-economically vulnerable groups (such as the lowest salaried civil servants) remained uninsured, citing barriers such as a lack of information, the unaffordability of payments and perceived administrative complexity.
Public sector financing
Expenditure on services in the public health sector consists primarily of provincial health expenditure, which is sourced through the provincial equitable share,e conditional grantsf and provincial own revenue. A very small proportion of expenditure on health is from development partners or donor agencies, and is the main source for health research. Provincial health expenditure is recorded in the Basic Accounting System (BAS) and is classified under eight budget programmes (Table 30). Table 31 shows expenditure by
e The equitable share formula is used to divide funding from national government between provinces. Provincial governments then determine what proportion is used for health relative to other services.
f These funds are allocated to the provincial health departments by national government for specific (ring-fenced) areas of spending, such as tertiary hospitals, HIV programmes, hospital revitalisation, forensic pathology, training and health infrastructure.

Health and Related Indicators 17
SAHR 2012/13 273
sub-programme within District Health Services. Local government (LG) also provides some primary health care (PHC) services, and thus net LG expenditureg is included in the per capita expenditure on non-hospital PHC indicator (Table 32).
Overall, public sector expenditure on health has increased strongly in real terms, with an average annual growth of 8.5% from 2007/08 to 2011/12.54
g Local government ‘own’ expenditure on PHC less transfers from provincial governments to municipalities for provision of these services. Data collected by National Treasury.
Table 30: Provincial health expenditure by programme (Rand million), 2011/12
Programme EC FS GP KZN LP MP NC NW WC SA1. Administration 596 273 443 388 262 403 108 275 410 3 158
2. District Health Services 7 290 2 656 7 239 10 834 6 428 4 025 1 324 3 232 4 879 47 908
3. Emergency Health Services 645 434 697 1 106 503 242 185 208 637 4 656
4. Provincial Hospital Services 3 864 1 631 5 928 7 136 1 439 856 817 1 578 2 150 25 399
5. Central Hospital Services 627 1 113 7 132 2 513 1 029 701 - 194 4 011 17 320
6. Health Sciences and Training 606 150 723 906 376 249 69 227 231 3 537
7. Health Care Support Services 79 97 174 14 535 117 28 127 301 1 472
8. Health Facilities Management 1 245 473 1 317 1 895 800 632 490 539 799 8 191
Other - - 3 - - - - - - 3
Total 14 951 6 826 23 656 24 791 11 372 7 225 3 020 6 380 13 419 111 642
Source: National Treasury (BAS). These are preliminary outcome figures and may be adjusted once audited, or differ from figures published in other sources if extracted on a different date.
Table 31: Provincial health expenditure on district health services (Rand million), 2011/12
Sub-programme EC FS GP KZN LP MP NC NW WC SA2.1 District Management 606 76 435 167 484 260 104 221 252 2 605
2.2 Community Health Clinics 1 399 674 1 439 2 341 1 607 737 309 652 953 10 112
2.3 Community Health Centres 731 63 1 066 773 285 467 174 594 1 061 5 214
2.4 Community-based Services 399 346 824 26 116 108 0 14 147 1 979
2.5 Other Community Services 117 0 0 648 170 0 54 142 0 1 131
2.6 HIV/AIDS 895 518 1 728 1 914 578 420 238 611 661 7 563
2.7 Nutrition 57 10 32 65 17 21 3 9 24 238
2.8 Coroner Services 85 39 130 137 0 0 27 28 0 445
2.9 District Hospitals 3 001 930 1 586 4 763 3 172 2 012 415 959 1 674 18 512
2. Other* 0 0 0 0 0 0 0 0 108 108
Total 7 290 2 656 7 239 10 834 6 428 4 025 1 324 3 232 4 879 47 908
Source: National Treasury (BAS). These are preliminary outcome figures and may be adjusted once audited, or differ from figures published in other sources if extracted on a different date.

274 SAHR 2012/13
Table 32: Health financing indicators by province
EC FS GP KZN LP MP NC NW WC SA RefClaims ratio (%)2009 - - - - - - - - - 89.3 a
2010 - - - - - - - - - 87.3 b
2011 - - - - - - - - - 86.5 c
Medical scheme beneficiaries2009 690 619 379 930 2 909 955 1 233 940 379 429 553 501 168 711 440 911 1 294 986 8 068 505 d
2010 708 097 388 514 3 010 299 1 287 219 407 410 576 026 175 318 461 521 1 294 088 8 315 718 e
2011 714 768 396 912 3 088 425 1 309 211 436 391 582 639 181 683 501 489 1 306 453 8 526 409 f
Medical scheme coverage (%)2009 GHS 11.4 18.0 26.6 12.5 8.7 13.3 15.4 13.7 25.5 16.9 g
2009 med schemes 10.4 13.1 27.6 11.8 7.3 15.3 14.7 12.8 24.2 16.4 a
2010 GHS 12.1 16.8 26.5 15.7 8.6 14.6 13.6 14.7 24.4 17.6 h
2010 med schemes 10.5 13.8 26.9 12.1 7.5 15.9 15.9 14.4 24.8 16.6 b
2011 GHS 11.1 17.0 23.9 12.3 7.2 14.4 13.0 13.6 25.1 16.1 i
2011 med schemes 10.5 14.4 27.3 12.1 7.9 15.9 16.6 15.4 24.7 16.9 c
Pensioner ratio (%)2009 - - - - - - - - - 6.5 a
2010 - - - - - - - - - 6.5 b
2011 - - - - - - - - - 6.6 c
Per capita expenditure (non-hospital PHC)2009 real 2011/12 prices 500 539 618 584 516 436 596 627 670 569 j
2010 real 2011/12 prices 650 623 718 600 553 539 760 706 765 649 j
2011 real 2011/12 prices 646 668 760 658 589 572 824 715 798 684 j
Per capita health expenditure2011 Private (med schemes) - - - - - - - - - 11 084 k
2011 Public (provincial) 2 536 2 820 2 882 2 668 2 367 2 277 3 083 2 166 3 241 2 667 l
Reference notes (indicator definitions from page 310 and references from page 315):
a Medical Schemes 2009-10.276
b Medical Schemes 2010-11.277
c Medical Schemes 2011-12.36
d Medical Schemes 2009-10.276 SA total includes 16 523 beneficiaries outside SA. Provincial numbers are calculated primarily on the basis of the location of principal members.
e Medical Schemes 2010-11.277 SA total includes 7 226 beneficiaries outside SA. Provincial numbers are calculated primarily on the basis of the location of principal members.
f Medical Schemes 2011-12.36 SA total includes 8 438 beneficiaries outside SA. Provincial numbers are calculated primarily on the basis of the location of principal members.
g StatsSA GHS 2009.68 Data revised and reweighted according to Dec 2006 provincial boundaries and updated population estimates.
h StatsSA GHS 2010.69
i StatsSA GHS 2011.37
j DHB 2011/12.54 Data extracted June 2012. Data for financial year from April of the year to March of the following year (not calendar year).
k Medical Schemes 2011-12.36 Calculated from average benefits paid per beneficiary per month R923.70 x 12.
l National Treasury. Calculated from provincial expenditure (National Treasury) per uninsured population. For 2011/12 financial year in nominal prices.
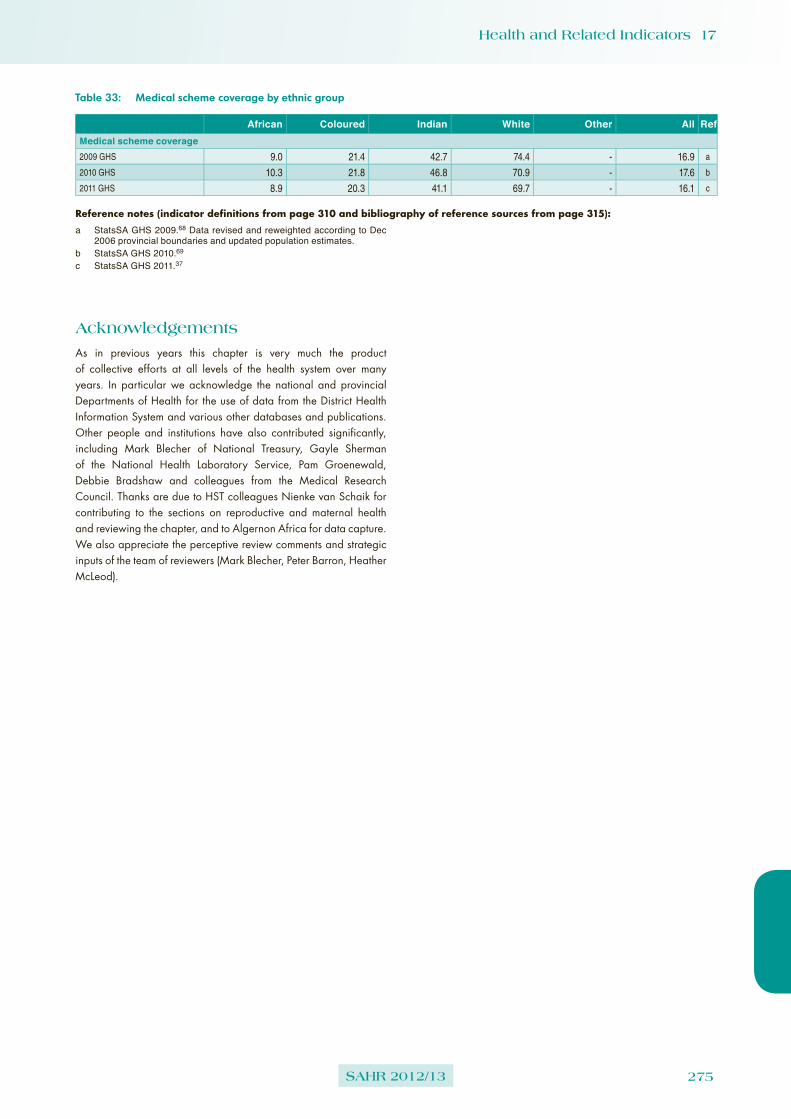
Health and Related Indicators 17
SAHR 2012/13 275
Table 33: Medical scheme coverage by ethnic group
African Coloured Indian White Other All RefMedical scheme coverage2009 GHS 9.0 21.4 42.7 74.4 - 16.9 a
2010 GHS 10.3 21.8 46.8 70.9 - 17.6 b
2011 GHS 8.9 20.3 41.1 69.7 - 16.1 c
Reference notes (indicator definitions from page 310 and bibliography of reference sources from page 315):
a StatsSA GHS 2009.68 Data revised and reweighted according to Dec 2006 provincial boundaries and updated population estimates.
b StatsSA GHS 2010.69
c StatsSA GHS 2011.37
Acknowledgements
As in previous years this chapter is very much the product of collective efforts at all levels of the health system over many years. In particular we acknowledge the national and provincial Departments of Health for the use of data from the District Health Information System and various other databases and publications. Other people and institutions have also contributed significantly, including Mark Blecher of National Treasury, Gayle Sherman of the National Health Laboratory Service, Pam Groenewald, Debbie Bradshaw and colleagues from the Medical Research Council. Thanks are due to HST colleagues Nienke van Schaik for contributing to the sections on reproductive and maternal health and reviewing the chapter, and to Algernon Africa for data capture. We also appreciate the perceptive review comments and strategic inputs of the team of reviewers (Mark Blecher, Peter Barron, Heather McLeod).

276 SAHR 2012/13
Appendices
Provincial maps
The maps show the district and sub-district boundaries according to the new demarcation which came into effect with the local government elections in May 2011. The boundaries of wards and districts are determined by the Municipal Demarcation Board (MDB). As at September 2010, the MDB demarcated 4 277 wards in 231 local municipalities within eight metropolitan councils and 45 districts. Wards are voting areas, as used by the Independent Electoral Commission and have been identified as the level of service delivery for PHC outreach teams by the PHC Re-engineering Strategy.
The main changes made to district boundaries in 2011 included the following:
➢ the removal of all district managed areas (DMAs) and the incorporation of these areas within district municipalities (DMs);
➢ the creation of two new metropolitan municipalities (Buffalo City and Mangaung);
➢ the removal of the Motheo district in the Free State, with the outlying areas re-allocated to the Xhariep and Thabo Mofutsanyane district municipalities and the Bloemfontein urban area becoming the Mangaung metropolitan municipality;
➢ the absorption of Metsweding district municipality into the City of Tshwane metropolitan municipality;
➢ the re-allocation of the local municipalities of Mbizana (EC151) and Ntabankulu (EC152) from the OR Tambo district municipality to the Alfred Nzo district municipality, becoming EC443 and EC444 respectively;
➢ the merger of Kagisano (NW391) and Molopo (NW395) into one local municipality, Kagisano/Molopo (NW397); and
➢ the renaming of several districts and municipalities.

Health and Related Indicators 17
SAHR 2012/13 277
DC
10C
acad
u
DC
13C
hris
Han
i
DC
14Jo
e Q
adi
DC
12A
mat
hole
DC
15O
R T
ambo
DC
44A
lfred
Nzo
EC
101
EC
107
EC
131
EC
102
EC
144
EC
142
EC
106
EC
132
EC
141
EC
124
EC
103
EC
104
EC
143
EC
441
BU
F
EC
134
EC
109
EC
127
EC
133
EC
136
EC
122
EC
121
EC
157
EC
156
NM
A
EC
128
EC
108
EC
135
EC
442
EC
137
EC
155
EC
153
EC
443
EC
138
EC
126
EC
105
EC
123
EC
444 E
C15
4
Lege
nd Loca
l Mun
icip
ality
Met
ropo
litan
Mun
icip
ality
Dis
trict
s
Pro
vinc
e
Map 1: Districts and municipalities of the Eastern Cape, 2011 boundaries

278 SAHR 2012/13
DC
16Xh
arie
p
DC
18Le
jwel
eput
swa
DC
20Fe
zile
Dab
i
DC
19Th
abo
Mof
utsa
nyan
e
FS16
2
FS16
1FS18
2
FS16
3
MA
N
FS19
5FS
201FS
203
FS18
1
FS18
3
FS19
1
FS19
3
FS18
4
FS19
2FS
194
FS19
6
FS18
5
FS20
5
FS16
4
FS20
4
Lege
nd Loca
l Mun
icip
ality
Met
ropo
litan
Mun
icip
ality
Dis
trict
s
Pro
vinc
e
Map 2: Districts and municipalities of the Free State, 2011 boundaries

Health and Related Indicators 17
SAHR 2012/13 279
TSH
EK
UJH
B
GT4
22
GT4
84
GT4
23
GT4
81
GT4
21
GT4
83
GT4
82
Lege
nd Loca
l Mun
icip
ality
Met
ropo
litan
Mun
icip
ality
Dis
trict
s
Pro
vinc
e
Map 3: Districts and municipalities of Gauteng, 2011 boundaries
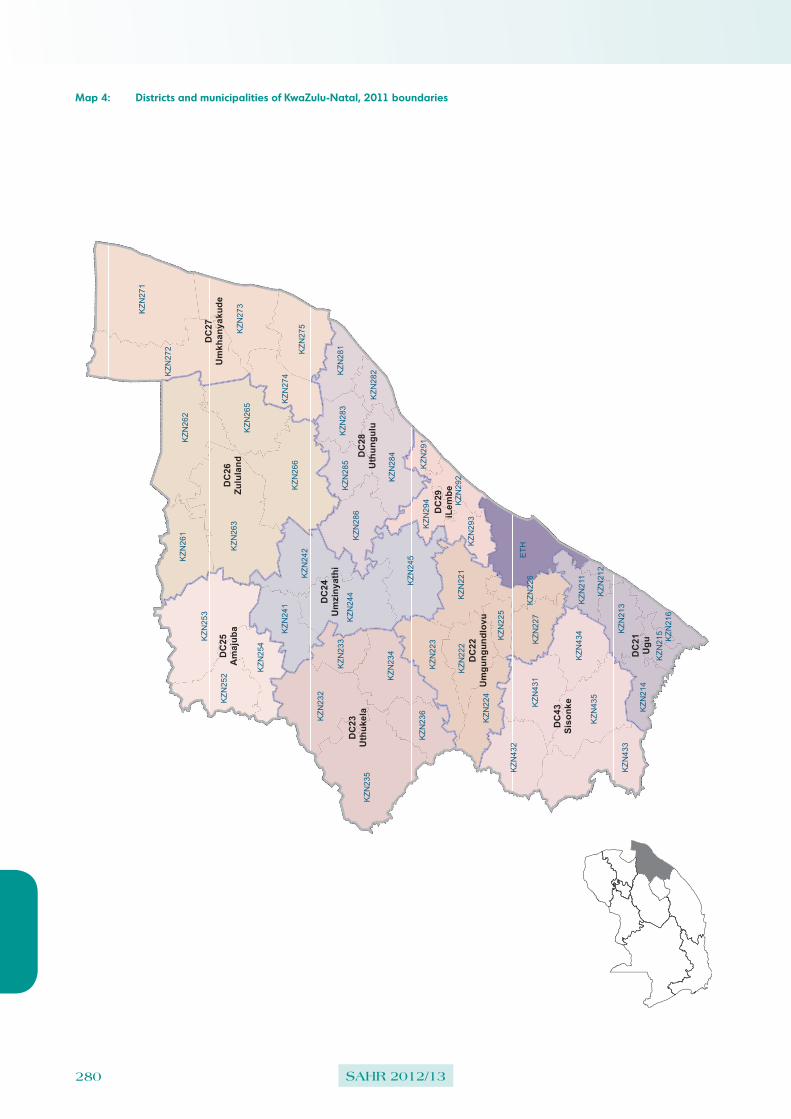
280 SAHR 2012/13
DC
26Zu
lula
nd
DC
43Si
sonk
e
DC
23U
thuk
ela
DC
21U
gu
DC
27U
mkh
anya
kude
DC
28U
thun
gulu
DC
25A
maj
uba
DC
24U
mzi
nyat
hi
DC
22U
mgu
ngun
dlov
u
DC
29iL
embe
KZN
271
ETHK
ZN26
3
KZN
235
KZN
253
KZN
272
KZN
266
KZN
262
KZN
232
KZN
433
KZN
245
KZN
244
KZN
435
KZN
273
KZN
284
KZN
265
KZN
431K
ZN23
4
KZN
242
KZN
275
KZN
261
KZN
432
KZN
252
KZN
221
KZN
223
KZN
286
KZN
434K
ZN24
1
KZN
222
KZN
274
KZN
224
KZN
254
KZN
236
KZN
213
KZN
227
KZN
281
KZN
214
KZN
293
KZN
283
KZN
285
KZN
211
KZN
233
KZN
294
KZN
282
KZN
215KZN
225
KZN
291
KZN
226
KZN
216
KZN
292
KZN
212
Lege
nd Loca
l Mun
icip
ality
Met
ropo
litan
Mun
icip
ality
Dis
trict
s
Pro
vinc
e
Map 4: Districts and municipalities of KwaZulu-Natal, 2011 boundaries

Health and Related Indicators 17
SAHR 2012/13 281
LIM
362
LIM
361
LIM
351
LIM
344
LIM
341
LIM
334
LIM
367
LIM
343
LIM
364
LIM
365
LIM
475
LIM
331
LIM
342
LIM
354
LIM
472
LIM
355
LIM
366
LIM
353
LIM
335
LIM
333
LIM
473
LIM
471
LIM
352
LIM
332
LIM
474
DC
36W
ater
berg
DC
34Vh
embe
DC
33M
opan
i
DC
35C
apric
orn
DC
47G
r Sek
hukh
une
Lege
nd Loca
l Mun
icip
ality
Met
ropo
litan
Mun
icip
ality
Dis
trict
s
Pro
vinc
e
Map 5: Districts and municipalities of Limpopo, 2011 boundaries

282 SAHR 2012/13
MP
325
MP
302
MP
321
MP
301
MP
322
MP
304
MP
303
MP
324
MP
314
MP
305
MP
313
MP
307
MP
312
MP
306
MP
315
MP
323
MP
311
MP
316
DC
32Eh
lanz
eni
DC
30G
ert S
iban
de
DC
31N
kang
ala
Lege
nd Loca
l Mun
icip
ality
Met
ropo
litan
Mun
icip
ality
Dis
trict
s
Pro
vinc
e
Map 6: Districts and municipalities of Mpumalanga, 2011 boundaries
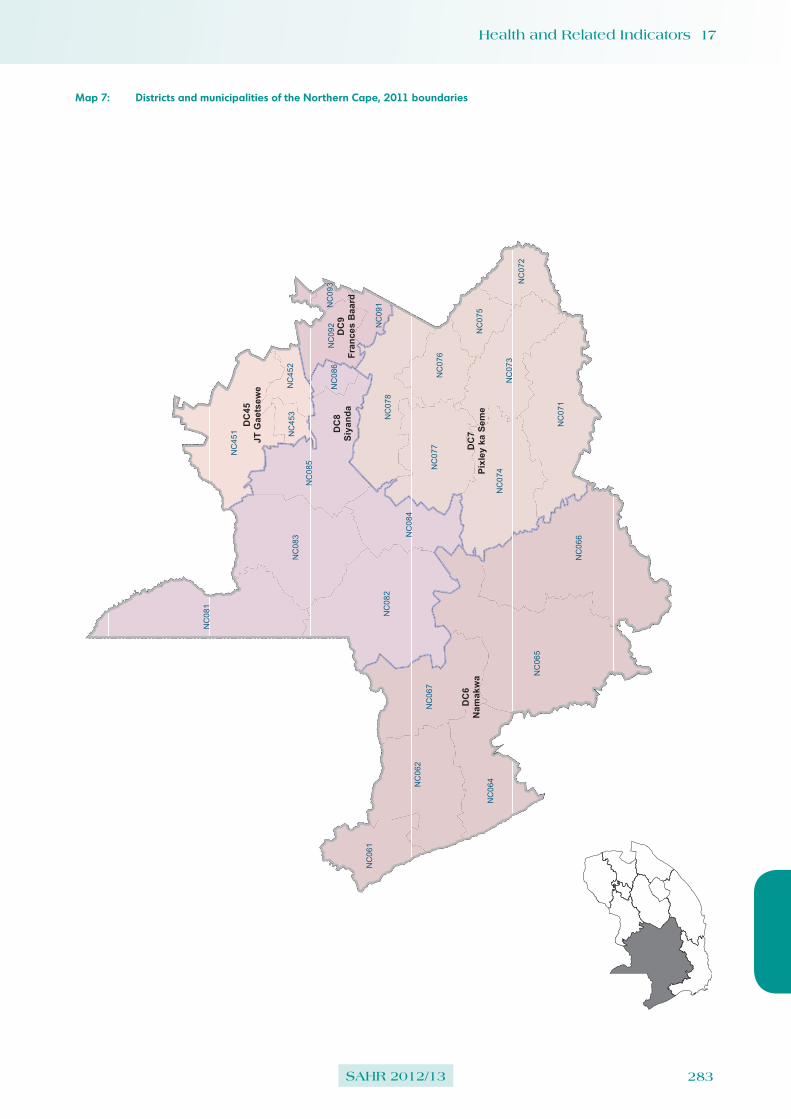
Health and Related Indicators 17
SAHR 2012/13 283
NC
065
NC
066
NC
082
NC
081
NC
083
NC
071
NC
451
NC
085
NC
062
NC
074
NC
078
NC
067
NC
077
NC
064
NC
073
NC
084
NC
061
NC
076
NC
092
NC
072
NC
075
NC
452
NC
091
NC
453
NC
086
NC
093
DC
6N
amak
wa
DC
8Si
yand
a
DC
7Pi
xley
ka
Sem
e
DC
45JT
Gae
tsew
e
DC
9Fr
ance
s B
aard
Lege
nd Loca
l Mun
icip
ality
Met
ropo
litan
Mun
icip
ality
Dis
trict
s
Pro
vinc
e
Map 7: Districts and municipalities of the Northern Cape, 2011 boundaries

284 SAHR 2012/13
DC
39D
r RS
Mom
pati
DC
38N
M M
olem
a
DC
37B
ojan
ala
DC
40D
r Ken
neth
Kau
nda
NW
397
NW
385
NW
392
NW
384
NW
382
NW
394
NW
375
NW
381
NW
404
NW
374
NW
372
NW
401
NW
396
NW
383
NW
393
NW
403
NW
373
NW
402
NW
371
Lege
nd Loca
l Mun
icip
ality
Met
ropo
litan
Mun
icip
ality
Dis
trict
s
Pro
vinc
e
Map 8: Districts and municipalities of the North West, 2011 boundaries

Health and Related Indicators 17
SAHR 2012/13 285
WC
053
WC
011
WC
022
WC
051
WC
052
WC
012
WC
042
WC
044
WC
041
WC
026
WC
013
CP
T
WC
034
WC
025
WC
015
WC
045
WC
033
WC
031
WC
043
WC
014
WC
032
WC
023
WC
048
WC
047
WC
024
DC
4Ed
enDC
5C
entr
al K
aroo
DC
1W
est C
oast
DC
3O
verb
erg
DC
2C
ape
Win
elan
ds
Lege
nd Loca
l Mun
icip
ality
Met
ropo
litan
Mun
icip
ality
Dis
trict
s
Pro
vinc
e
Map 9: Districts and municipalities of the Western Cape, 2011 boundaries

286 SAHR 2012/13
Table 34: Census 2011 Population by municipality according to the new (2011) demarcation
Province District Municipality Male Female TotalEastern Cape DC10: Cacadu EC101: Camdeboo 24 835 26 158 50 993
EC102: Blue Crane Route 17 680 18 322 36 002
EC103: Ikwezi 5 055 5 482 10 537
EC104: Makana 38 175 42 215 80 390
EC105: Ndlambe 29 035 32 141 61 176
EC106: Sundays River Valley 27 761 26 743 54 504
EC107: Baviaans 8 709 9 052 17 761
EC108: Kouga 48 591 49 967 98 558
EC109: Kou-Kamma 20 405 20 258 40 663
DC12: Amathole EC121: Mbhashe 117 230 137 679 254 909
EC122: Mnquma 117 873 134 517 252 390
EC123: Great Kei 18 703 20 287 38 990
EC124: Amahlathi 58 647 64 131 122 778
EC126: Ngqushwa 33 984 38 206 72 190
EC127: Nkonkobe 61 133 65 982 127 115
EC128: Nxuba 11 677 12 587 24 264
DC13: Chris Hani EC131: Inxuba Yethemba 31 670 33 889 65 559
EC132: Tsolwana 15 656 17 625 33 281
EC133: Inkwanca 10 676 11 295 21 971
EC134: Lukanji 90 620 100 103 190 723
EC135: Intsika Yethu 68 797 76 575 145 372
EC136: Emalahleni 56 620 62 839 119 459
EC137: Engcobo 71 953 83 560 155 513
EC138: Sakhisizwe 30 646 32 936 63 582
DC14: Joe Gqabi EC141: Elundini 65 482 72 658 138 140
EC142: Senqu 62 805 71 346 134 151
EC143: Maletswai 20 735 23 065 43 800
EC144: Gariep 16 420 17 256 33 676
DC15: OR Tambo EC153: Ngquza Hill 128 974 149 507 278 481
EC154: Port St Johns 71 482 84 654 156 136
EC155: Nyandeni 134 241 156 149 290 390
EC156: Mhlontlo 87 440 100 786 188 226
EC157: King Sabata Dalindyebo 207 951 243 760 451 711
DC44: Alfred Nzo EC441: Matatiele 93 675 110 168 203 843
EC442: Umzimvubu 87 946 103 674 191 620
EC443: Mbizana 128 332 153 573 281 905
EC444: Ntabankulu 56 534 67 442 123 976
BUF: Buffalo City BUF: Buffalo City 358 557 396 643 755 200
NMA: Nelson Mandela Bay NMA: Nelson Mandela Bay 552 994 599 121 1 152 115
Free State DC16: Xhariep FS161: Letsemeng 19 852 18 777 38 629
FS162: Kopanong 24 083 25 087 49 170
FS163: Mohokare 16 314 17 831 34 145
FS164: Naledi 11 409 12 905 24 314
DC18: Lejweleputswa FS181: Masilonyana 31 961 31 374 63 335
FS182: Tokologo 14 410 14 576 28 986
FS183: Tswelopele 22 864 24 761 47 625
FS184: Matjhabeng 201 509 204 952 406 461
FS185: Nala 38 867 42 353 81 220
DC19: Thabo Mofutsanyane FS191: Setsoto 52 633 59 964 112 597
FS192: Dihlabeng 61 153 67 551 128 704
FS193: Nketoana 28 611 31 713 60 324
FS194: Maluti a Phofung 153 209 182 575 335 784
FS195: Phumelela 23 162 24 611 47 773
FS196: Mantsopa 24 402 26 654 51 056
DC20: Fezile Dabi FS201: Moqhaka 79 477 81 055 160 532
FS203: Ngwathe 57 424 63 096 120 520
FS204: Metsimaholo 77 636 71 472 149 108
FS205: Mafube 27 805 30 071 57 876
MAN: Mangaung MAN: Mangaung 362 186 385 245 747 431

Health and Related Indicators 17
SAHR 2012/13 287
Province District Municipality Male Female TotalGauteng DC42: Sedibeng GT421: Emfuleni 354 862 366 800 721 662
GT422: Midvaal 49 178 46 123 95 301
GT423: Lesedi 51 317 48 203 99 520
DC48: West Rand GT481: Mogale City 184 981 177 441 362 422
GT482: Randfontein 74 885 74 400 149 285
GT483: Westonaria 61 152 50 615 111 767
GT484: Merafong City 107 157 90 363 197 520
EKU: Ekurhuleni EKU: Ekurhuleni 1 627 724 1 550 747 3 178 471
JHB: City of Johannesburg JHB: City of Johannesburg 2 225 137 2 209 690 4 434 827
TSH: City of Tshwane TSH: City of Tshwane 1 453 483 1 468 005 2 921 488
KwaZulu-Natal DC21: Ugu KZN211: Vulamehlo 36 062 41 341 77 403
KZN212: Umdoni 38 294 40 581 78 875
KZN213: Umzumbe 74 819 86 156 160 975
KZN214: UMuziwabantu 44 754 51 802 96 556
KZN215: Ezingoleni 24 101 28 439 52 540
KZN216: Hibiscus Coast 121 131 135 004 256 135
DC22: UMgungundlovu KZN221: uMshwathi 50 484 55 890 106 374
KZN222: uMngeni 44 849 47 861 92 710
KZN223: Mpofana 18 487 19 617 38 104
KZN224: Impendle 15 493 17 612 33 105
KZN225: The Msunduzi 294 454 324 082 618 536
KZN226: Mkhambathini 30 270 32 872 63 142
KZN227: Richmond 31 883 33 910 65 793
DC23: Uthukela KZN232: Emnambithi/Ladysmith 111 617 125 820 237 437
KZN233: Indaka 46 509 56 607 103 116
KZN234: Umtshezi 38 615 44 538 83 153
KZN235: Okhahlamba 61 624 70 443 132 067
KZN236: Imbabazane 52 817 60 256 113 073
DC24: Umzinyathi KZN241: Endumeni 31 637 33 225 64 862
KZN242: Nqutu 75 194 90 113 165 307
KZN244: Msinga 77 143 100 433 177 576
KZN245: Umvoti 45 601 57 491 103 092
DC25: Amajuba KZN252: Newcastle 172 846 190 390 363 236
KZN253: Emadlangeni 17 486 16 956 34 442
KZN254: Dannhauser 48 380 53 781 102 161
DC26: Zululand KZN261: eDumbe 38 447 43 605 82 052
KZN262: UPhongolo 59 728 67 510 127 238
KZN263: Abaqulusi 100 474 110 586 211 060
KZN265: Nongoma 88 490 106 418 194 908
KZN266: Ulundi 85 061 103 255 188 316
DC27: Umkhanyakude KZN271: Umhlabuyalingana 71 769 84 967 156 736
KZN272: Jozini 86 116 100 386 186 502
KZN273: The Big 5 False Bay 16 505 18 753 35 258
KZN274: Hlabisa 32 942 38 983 71 925
KZN275: Mtubatuba 81 314 94 111 175 425
DC28: Utungulu KZN281: Mfolozi 59 020 63 869 122 889
KZN282: uMhlathuze 162 942 171 517 334 459
KZN283: Ntambanana 34 280 40 057 74 337
KZN284: uMlalazi 98 407 115 194 213 601
KZN285: Mthonjaneni 22 102 25 716 47 818
KZN286: Nkandla 50 647 63 770 114 417
DC29: ILembe KZN291: Mandeni 65 332 72 746 138 078
KZN292: KwaDukuza 114 160 117 028 231 188
KZN293: Ndwedwe 66 296 74 524 140 820
KZN294: Maphumulo 43 221 53 503 96 724
DC43: Sisonke KZN431: Ingwe 46 752 53 795 100 547
KZN432: Kwa Sani 6 688 6 210 12 898
KZN433: Greater Kokstad 32 032 33 950 65 982
KZN434: Ubuhlebezwe 47 246 54 445 101 691
KZN435: Umzimkhulu 81 749 98 553 180 302
ETH: Ethekwini ETH: Ethekwini 1 682 406 1 759 955 3 442 361

288 SAHR 2012/13
Province District Municipality Male Female TotalLimpopo DC33: Mopani LIM331: Greater Giyani 108 124 136 094 244 218
LIM332: Greater Letaba 95 305 117 396 212 701
LIM333: Greater Tzaneen 181 558 208 536 390 094
LIM334: Ba-Phalaborwa 73 017 77 620 150 637
LIM335: Maruleng 43 577 51 280 94 857
DC34: Vhembe LIM341: Musina 34 506 33 853 68 359
LIM342: Mutale 41 546 50 324 91 870
LIM343: Thulamela 278 650 339 812 618 462
LIM344: Makhado 236 795 279 236 516 031
DC35: Capricorn LIM351: Blouberg 74 152 88 476 162 628
LIM352: Aganang 59 171 71 992 131 163
LIM353: Molemole 49 881 58 440 108 321
LIM354: Polokwane 302 233 326 766 628 999
LIM355: Lepele-Nkumpi 104 805 125 545 230 350
DC36: Waterberg LIM361: Thabazimbi 49 877 35 357 85 234
LIM362: Lephalale 62 819 52 948 115 767
LIM364: Mookgopong 18 329 17 310 35 639
LIM365: Modimolle 34 686 33 827 68 513
LIM366: Bela-Bela 33 754 32 746 66 500
LIM367: Mogalakwena 143 702 163 980 307 682
DC47: Greater Sekhukhune LIM471: Ephraim Mogale 58 207 65 442 123 649
LIM472: Elias Motsoaledi 115 503 133 860 249 363
LIM473: Makhuduthamaga 121 282 153 075 274 357
LIM474: Fetakgomo 42 258 51 536 93 794
LIM475: Greater Tubatse 160 398 175 278 335 676
Mpumalanga DC30: Gert Sibande MP301: Albert Luthuli 87 188 98 822 186 010
MP302: Msukaligwa 74 113 75 264 149 377
MP303: Mkhondo 82 263 89 719 171 982
MP304: Pixley Ka Seme 39 520 43 715 83 235
MP305: Lekwa 57 647 58 014 115 661
MP306: Dipaleseng 21 462 20 928 42 390
MP307: Govan Mbeki 152 211 142 326 294 537
DC31: Nkangala MP311: Victor Khanye 38 816 36 636 75 452
MP312: Emalahleni 208 751 186 715 395 466
MP313: Steve Tshwete 119 411 110 421 229 832
MP314: Emakhazeni 24 099 23 117 47 216
MP315: Thembisile 147 676 162 783 310 459
MP316: Dr JS Moroka 117 494 132 211 249 705
DC32: Ehlanzeni MP321: Thaba Chweu 50 415 47 972 98 387
MP322: Mbombela 285 750 303 044 588 794
MP323: Umjindi 36 407 33 170 69 577
MP324: Nkomazi 184 808 205 802 390 610
MP325: Bushbuckridge 246 023 295 224 541 247

Health and Related Indicators 17
SAHR 2012/13 289
Province District Municipality Male Female TotalNorthern Cape DC6: Namakwa NC061: Richtersveld 6 300 5 682 11 982
NC062: Nama Khoi 23 215 23 826 47 041
NC064: Kamiesberg 5 136 5 051 10 187
NC065: Hantam 10 809 10 769 21 578
NC066: Karoo Hoogland 6 253 6 335 12 588
NC067: Khâi-Ma 6 560 5 905 12 465
DC7: Pixley ka Seme NC071: Ubuntu 9 225 9 376 18 601
NC072: Umsobomvu 13 689 14 687 28 376
NC073: Emthanjeni 20 722 21 634 42 356
NC074: Kareeberg 5 755 5 918 11 673
NC075: Renosterberg 5 371 5 607 10 978
NC076: Thembelihle 7 976 7 724 15 700
NC077: Siyathemba 10 759 10 832 21 591
NC078: Siyancuma 18 570 18 505 37 075
DC8: Siyanda NC081: Mier 3 599 3 404 7 003
NC082: Kai !Garib 34 278 31 591 65 869
NC083: //Khara Hais 46 047 47 447 93 494
NC084: !Kheis 8 408 8 229 16 637
NC085: Tsantsabane 18 363 16 730 35 093
NC086: Kgatelopele 9 472 9 215 18 687
DC9: Frances Baard NC091: Sol Plaatjie 120 212 127 829 248 041
NC092: Dikgatlong 23 062 23 778 46 840
NC093: Magareng 11 732 12 473 24 205
NC094: Phokwane 30 491 32 509 63 000
DC45: John Taolo Gaetsewe NC451: Joe Morolong 41 262 48 268 89 530
NC452: Ga-Segonyana 44 994 48 658 93 652
NC453: Gamagara 22 710 18 907 41 617
North West DC37: Bojanala NW371: Moretele 91 193 95 755 186 948
NW372: Madibeng 253 991 223 390 477 381
NW373: Rustenburg 301 796 247 779 549 575
NW374: Kgetlengrivier 27 034 24 015 51 049
NW375: Moses Kotane 120 515 122 038 242 553
DC38: Ngaka Modiri Molema NW381: Ratlou 51 310 56 029 107 339
NW382: Tswaing 61 931 62 287 124 218
NW383: Mafikeng 141 642 149 885 291 527
NW384: Ditsobotla 85 297 83 605 168 902
NW385: Ramotshere Moiloa 73 220 77 494 150 714
DC39: Dr Ruth Segomotsi Mompati NW392: Naledi 33 502 33 279 66 781
NW393: Mamusa 29 941 30 414 60 355
NW394: Greater Taung 83 756 93 886 177 642
NW396: Lekwa-Teemane 26 600 26 648 53 248
NW397: Kagisano/Molopo 50 918 54 870 105 788
DC40: Dr Kenneth Kaunda NW401: Ventersdorp 29 246 27 456 56 702
NW402: Tlokwe City Council 79 967 82 794 162 761
NW403: City of Matlosana 199 364 199 311 398 675
NW404: Maquassi Hills 38 680 39 114 77 794

290 SAHR 2012/13
Province District Municipality Male Female TotalWestern Cape DC1: West Coast WC011: Matzikama 33 624 33 523 67 147
WC012: Cederberg 24 994 24 774 49 768
WC013: Bergrivier 30 060 31 837 61 897
WC014: Saldanha Bay 49 389 49 804 99 193
WC015: Swartland 56 472 57 290 113 762
DC2: Cape Winelands WC022: Witzenberg 59 554 56 392 115 946
WC023: Drakenstein 123 525 127 737 251 262
WC024: Stellenbosch 76 176 79 557 155 733
WC025: Breede Valley 81 067 85 758 166 825
WC026: Langeberg 47 891 49 834 97 725
DC3: Overberg WC031: Theewaterskloof 55 463 53 327 108 790
WC032: Overstrand 39 786 40 646 80 432
WC033: Cape Agulhas 16 229 16 808 33 037
WC034: Swellendam 17 891 18 025 35 916
DC4: Eden WC041: Kannaland 11 995 12 772 24 767
WC042: Hessequa 25 525 27 117 52 642
WC043: Mossel Bay 43 751 45 679 89 430
WC044: George 95 310 98 362 193 672
WC045: Oudtshoorn 45 913 50 021 95 934
WC047: Bitou 24 468 24 694 49 162
WC048: Knysna 33 957 34 702 68 659
DC5: Central Karoo WC051: Laingsburg 4 134 4 155 8 289
WC052: Prince Albert 6 496 6 640 13 136
WC053: Beaufort West 24 137 25 449 49 586
CPT: City of Cape Town CPT: City of Cape Town 1 830 699 1 909 327 3 740 026
South Africa 25 188 786 26 581 767 51 770 553
Source: Census 2011.

Health and Related Indicators 17
SAHR 2012/13 291
NC065
NC066
NC082
NC081
NW397
NC083
WC053
NC071
NC451
NC085
NC062
NC074
NC078
NC067
FS162
NC077
NC064
NC073
EC101
WC011
EC107
LIM362
EC131
EC102
NC084
WC022
FS161
LIM361
FS182
MP325
NC061
TSH
FS163
EC144
MAN
WC051
FS195FS201
LIM351
NC076
WC052
WC012
EC142
LIM344
FS203
NC092
FS181
NC072
FS183
LIM341
LIM334
NW385
EC106
EC132
NW392NW392
FS191
NW384
FS193
MP302
WC042
NC075
LIM367
NW382
MP321
FS184
MP301
EC141
NW394
LIM343
NW375
MP322
LIM364
FS192
EC124
WC044
MP304
EC103
MP303
EC104
WC041
MP324
FS194
FS196
EC143
MP314
EC441
NW381
WC026
NC452
MP305
FS185
WC013
NW404
LIM365LIM475
FS205
BUF
EC134
EC109
EC127
EC133
LIM331
KZN271
WC015
NW374
EC136
ETH
KZN263
WC045
EC122
WC033
NW401
LIM342
NW396
KZN235
LIM354
LIM472
EC121
NW393
NW403
WC031
EC157
NC091
LIM353
KZN253
LIM335
EKU
LIM333
NMA
EC128
EC135
MP307
KZN266
KZN262
EC137
NC453
MP306
EC443
NW402
MP323
TSH
EKUJHB
GT422
GT484
GT423
GT481
GT421
GT483
GT482
Gauteng
LegendProvince
District
LM_BlueDrop2012
0 - 33.0
33.1 - 50.0
50.1 - 75.0
75.1 - 90.0
90.1 - 100
Map 10: National Blue Drop performance certification results for water service authorities, 2012
Source: Adapted from district and sub-district data included in Blue Drop 2012.45
Note: Blue Drop Certification is an indication that a water supply authority has complied with stringent procedural, chemical, biological and other requirements. A score of 100% (green) represents ‘Exceptional Drinking Water Quality Management (DWQM)’ and implies that the water service institutions comply 100% with all Blue Drop certification criteria. A score of <33.3% (red) represents ‘Significant improvement required in DWQM’ and is an indication that urgent intervention is required to ensure drastic improvement in DWQM.
Colour graphs and maps
The following graphs and maps show provincial/district variation for some key indicators of the National Service Delivery Agreement (NSDA) or national priorities:
➢ Socio-economic
• Map 10: National Blue Drop performance certification results for water service authorities, 2012
➢ Child mortality
• Figure 4: Model estimates of under-5 mortality rate in South Africa compared with the SA MDG target
➢ Financing: Medical scheme coverage
• Figure 5: Ethnicity of people belong to medical schemes, 1980-2010

292 SAHR 2012/13
0
20
40
60
80
100
120
1980 1985 1990 1995 2000 2005 2010 2015
Dea
ths p
er 1
000
live
-bir
ths
Garenne & Gakusi IGME ASSA2008 ASSA2003 UNPD IHME USCB
MDG target = 20
0
1 000 000
2 000 000
3 000 000
4 000 000
5 000 000
6 000 000
7 000 000
8 000 000
9 000 000
1980
1981
1982
1983
1984
1985
1986
1987
1988
1989
1990
1991
1992
1993
1994
1995
1996
1997
1998
1999
2000
2001
2002
2003
2004
2005
2006
2007
2008
2009
2010
Nu
mb
er o
f P
eop
le
Year
Medical Schemes African/Black
Indian/Asian
Coloured
White
Council forMedical Schemes
OctoberHousehold Surveys
GeneralHousehold Surveys
Figure 4: Model estimates of under-5 mortality rate in South Africa compared with the SA MDG target
Source: U5MR 2012.163
Figure 5: Ethnicity of people belong to medical schemes, 1980-2010
Source: NHI Policy Brief 21.273

Health and Related Indicators 17
SAHR 2012/13 293
National Indicator Data Set (NIDS) indicators from April 2013
Overview:
Core Health Facility - MonthlyChild Health 11Chronic 12EPI 15HIV 8Management Inpatients 5Management PHC 8Maternal & Women's Health 27Nutrition 4Oral 3Quality 2TB 6TOTAL 101
Non-Facility Health Services - MonthlyEnvironmental Health Services (EHS) 14Emergency Medical Services (EMS) 8Integrated School Health Program (ISHP) 15Ward Based Outreach Team (WBOT) 15Total 52
NOTE: 1 While all school health elements and indicators are essential
for monitoring school health services at all levels, only four indicators will be extracted from the DHIS ISHP database at National Level for overall monitoring and reporting purposes.
2 While all ward based PHC outreach team (WBOT) elements and indicators are essential for monitoring outreach services at all level, only seven indicators will be extracted from the DHIS WBOT database at National Level for overall monitoring and reporting purposes.
Core Health Facility - QuarterlyART Baseline 22ART 3 months - repeated at durations 8ART 6 months - repeated at durations 4Quality 1TB 13Total 48
Count Indicators (listed under Data Elements)
ART 6HIV 1TOTAL 7

294 SAHR 2012/13
Ind
icato
rs
Indi
cato
r Nam
eN
umer
ator
Den
omin
ator
Def
initi
onU
se a
nd c
onte
xtTy
peFr
eqLe
vel
Key
repo
rts
Management PHC
PHC
util
isat
ion
rate
und
er 5
yea
rs
(ann
ualis
ed)
PHC
hea
dcou
nt
unde
r 5Po
pula
tion
unde
r 5
year
sAv
erag
e nu
mbe
r of P
HC
vis
its p
er y
ear p
er p
erso
n un
der 5
yea
rs o
f age
in th
e po
pula
tion
Mon
itors
PH
C a
cces
s an
d ut
ilisa
tion
by c
hild
ren
unde
r 5 y
ears
of a
geN
oM
onth
lyO
utpu
tAP
P; D
HP
PHC
util
isat
ion
rate
(a
nnua
lised
)PH
C h
eadc
ount
tota
lPo
pula
tion
tota
lAv
erag
e nu
mbe
r of P
HC
vis
its p
er p
erso
n pe
r yea
r in
the
popu
latio
nM
onito
rs P
HC
acc
ess
and
utili
satio
nN
oM
onth
lyO
utpu
tAP
P; D
HP
PHC
uni
nsur
ed
popu
latio
n ut
ilisa
tion
rate
(ann
ualis
ed)
PHC
tota
l hea
dcou
ntPo
pula
tion
unin
sure
d to
tal
Aver
age
num
ber o
f PH
C v
isits
per
per
son
per y
ear
in th
e un
insu
red
popu
latio
nM
onito
rs P
HC
acc
ess
and
utili
satio
n by
the
unin
sure
d po
pula
tion
No
Mon
thly
Out
put
APP;
DH
P
PHC
pro
fess
iona
l nur
se
clin
ical
wor
k lo
adPH
C c
lient
s se
en b
y pr
ofes
sion
al n
urse
PHC
pro
fess
iona
l nu
rse
clin
ical
wor
k da
ys
Aver
age
num
ber o
f clie
nts
seen
per
pro
fess
iona
l nu
rse
clin
ical
wor
k da
yM
onito
rs s
taff
allo
catio
n/m
anag
emen
t and
pro
vide
indi
rect
indi
catio
n of
qua
lity
of p
atie
nt c
are.
Low
wor
k lo
ad m
ay b
e du
e to
inef
ficie
nt s
taff
utili
satio
n, a
nd v
ery
high
wor
kloa
d in
dica
tes
too
little
tim
e sp
ent p
er p
atie
nt.
Do
not i
nclu
de d
eliv
ery
serv
ice
time
in n
umer
ator
or d
enom
inat
or
No
Mon
thly
Inpu
tAP
P; D
HP
PHC
doc
tor c
linic
al
wor
k lo
adPH
C c
lient
s se
en b
y do
ctor
PHC
doc
tor c
linic
al
wor
k da
ysAv
erag
e nu
mbe
r of c
lient
s se
en p
er d
octo
r per
cl
inic
al w
ork
day
Mon
itors
sta
ff al
loca
tion/
man
agem
ent a
nd p
rovi
de in
dire
ct in
dica
tion
of
qual
ity o
f clie
nt c
are.
Low
wor
k lo
ad m
ay b
e du
e to
inef
ficie
nt s
taff
utili
satio
n,
and
very
hig
h w
orkl
oad
indi
cate
s to
o lit
tle ti
me
spen
t per
clie
nt. D
o no
t in
clud
e de
liver
y se
rvic
e tim
e in
num
erat
or o
r den
omin
ator
No
Mon
thly
Inpu
tAP
P; D
HP
PHC
doc
tor c
ase
load
PHC
clie
nts
seen
by
doct
orPH
C to
tal h
eadc
ount
Prop
ortio
n of
tota
l PH
C c
lient
s co
nsul
ted
by d
octo
rsM
onito
rs a
cces
s to
doc
tors
as
wel
l as
effe
ctiv
enes
s of
PH
C p
olic
y im
plem
enta
tion
and
refe
rral
sys
tem
. Rep
lace
s in
dica
tors
for f
ixed
clin
ics
supp
orte
d by
doc
tor a
t lea
st o
nce
a w
eek
and
CH
Cs/
CD
Cs
with
resi
dent
do
ctor
rate
from
1 A
pril
2013
%M
onth
lyIn
put
NSD
A; N
SP;
WH
O
PHC
sup
ervi
sor v
isit
rate
(fi
xed
clin
ic/C
HC
/CD
C)
PHC
sup
ervi
sor v
isit
(fixe
d cl
inic
/CH
C/
CD
C)
Fixe
d cl
inic
s pl
us
fixed
CH
Cs/
CD
Cs
Prop
ortio
n fix
ed c
linic
s, C
HC
s an
d C
DC
s vi
site
d by
a d
edic
ated
sup
ervi
sor a
ccor
ding
to th
e PH
C
Supe
rvis
ion
Man
ual
Mon
itors
sup
ervi
sion
acc
ordi
ng to
the
PHC
Sup
ervi
sion
man
ual (
once
a
mon
th) i
n cl
inic
s, C
HC
s an
d C
DC
s%
Mon
thly
Proc
ess/
Activ
ityAP
P; D
HP
Trac
er it
ems
stoc
k-ou
t ra
te (f
ixed
clin
ic/C
HC
/C
DC
)
Any
trace
r ite
m d
rug
stoc
k-ou
tFi
xed
clin
ics
plus
fix
ed C
HC
s/C
DC
sTh
e pr
opor
tion
of a
ll fix
ed c
linic
s, C
HC
s an
d C
DC
s th
at h
ad s
tock
-out
of A
NY
trace
r ite
m fo
r any
per
iod
Mon
itors
effe
ctiv
enes
s of
dru
g m
anag
emen
t%
Mon
thly
Proc
ess/
Activ
ity
Management Inpatients
OPD
new
clie
nt n
ot
refe
rred
rate
OPD
hea
dcou
nt n
ot
refe
rred
new
OPD
new
clie
nts
- tot
alPr
opor
tion
of n
ew O
PD c
lient
s w
ithou
t a re
ferr
al
lette
rM
onito
rs u
tilis
atio
n tre
nds
of c
lient
s by
-pas
sing
PH
C fa
cilit
ies
and
the
effe
ct
of P
HC
re-e
ngin
eerin
g on
OPD
util
isat
ion.
Do
not i
nclu
de O
PD fo
llow
-up
and
emer
genc
y cl
ient
s in
the
deno
min
ator
%M
onth
lyO
utpu
tN
SDA
Expe
nditu
re p
er P
DE
Expe
nditu
re to
tal
Patie
nt d
ay
equi
vale
ntAv
erag
e co
st p
er p
atie
nt d
ay e
quiv
alen
t (PD
E).
PDE
is th
e In
patie
nt d
ays
tota
l + D
ay P
atie
nts
* 0.5
+
(Em
erge
ncy
head
coun
t + O
PD h
eadc
ount
tota
l) *
0.33
3333
33
Mon
itors
effe
ctiv
e an
d ef
ficie
nt m
anag
emen
t of i
npat
ient
faci
litie
s. N
ote
that
m
ultip
lied
by 0
.5 is
the
sam
e as
div
isio
n by
2, a
nd m
ultip
lied
by 0
.333
3333
3 is
the
sam
e as
div
isio
n by
3
No
Mon
thly
Out
com
e
Aver
age
leng
th o
f sta
y - t
otal
Inpa
tient
day
s +
1/2
Day
clie
nts
Inpa
tient
sep
arat
ions
The
aver
age
num
ber o
f clie
nt d
ays
an a
dmitt
ed
clie
nt s
pend
s in
hos
pita
l bef
ore
sepa
ratio
n. In
patie
nt
sepa
ratio
n is
the
tota
l of d
ay c
lient
s, In
patie
nt
disc
harg
es, I
npat
ient
dea
ths
and
Inpa
tient
tran
sfer
ou
ts
Mon
itors
effe
ctiv
enes
s an
d ef
ficie
ncy
of In
patie
nt m
anag
emen
t. Pr
oxy
indi
cato
r bec
ause
idea
lly it
sho
uld
only
incl
ude
Inpa
tient
day
s fo
r tho
se
clie
nts
sepa
rate
d du
ring
the
repo
rting
mon
th. U
se in
all
hosp
itals
ad
CH
Cs
with
Inpa
tient
bed
s
Day
sM
onth
lyO
utco
me
APP;
DH
P
Inpa
tient
bed
util
isat
ion
rate
- to
tal
Inpa
tient
day
s +
1/2
Day
clie
nts
Inpa
tient
bed
day
s av
aila
ble
Inpa
tient
bed
day
s us
ed a
s pr
opor
tion
of m
axim
um
Inpa
tient
bed
day
s av
aila
ble.
(Num
ber o
f Inp
atie
nt
beds
X d
ays
in p
erio
d)
Mon
itors
effe
ctiv
enes
s an
d ef
ficie
ncy
of In
patie
nt m
anag
emen
t. Ba
selin
es
for 2
011/
12 w
ere
DH
: 67.1
, RH
: 76.
9, T
H:7
3.6,
CH
: 75.
3%
Mon
thly
Out
com
eAP
P; D
HP
Inpa
tient
cru
de d
eath
ra
teIn
patie
nt d
eath
s - t
otal
Inpa
tient
sep
arat
ions
Prop
ortio
n of
adm
itted
clie
nts/
sepa
ratio
ns w
ho d
ied
durin
g ho
spita
l sta
y. In
patie
nt s
epar
atio
ns is
the
tota
l of d
ay c
lient
s, In
patie
nt d
isch
arge
s, In
patie
nt
deat
hs a
nd In
patie
nt tr
ansf
er o
uts
Mon
itors
tren
ds in
Inpa
tient
dea
ths.
Pro
vide
s an
indi
catio
n of
the
qual
ity o
f In
patie
nt c
are
%M
onth
lyO
utco
me

Health and Related Indicators 17
SAHR 2012/13 295
Indi
cato
r Nam
eN
umer
ator
Den
omin
ator
Def
initi
onU
se a
nd c
onte
xtTy
peFr
eqLe
vel
Key
repo
rts
QualityC
ompl
aint
reso
lutio
n w
ithin
25
wor
king
day
s ra
te
Com
plai
nt re
solv
ed
with
in 2
5 w
orki
ng
days
Com
plai
nt re
solv
edPr
opor
tion
of c
ompl
aint
s re
solv
ed w
ithin
25
wor
king
da
ys o
ut o
f all
com
plai
nts
reso
lved
Mon
itors
pub
lic h
ealth
sys
tem
resp
onse
to c
usto
mer
con
cern
s%
Mon
thly
Out
put
APP;
DH
P
Mor
talit
y an
d M
orbi
dity
re
view
rate
Mor
talit
y an
d m
orbi
dity
revi
ew
cond
ucte
d
Plan
ned
mor
talit
y an
d m
orbi
dity
re
view
s m
ultip
lied
by
num
ber o
f dis
cipl
ines
w
ithin
the
faci
lity
Freq
uenc
y of
hol
ding
mor
talit
y an
d m
orbi
dity
re
view
s th
at s
houl
d in
clud
e, b
ut n
ot li
mite
d to
, (a)
m
ater
nal d
eath
s, (b
) neo
nata
l dea
ths,
(c) w
rong
site
su
rger
y an
d (d
) ana
esth
etic
dea
th
Dem
onst
rate
s fa
cilit
y's
aim
of e
nsur
ing
qual
ity h
ealth
care
ser
vice
pro
visi
on.
Gui
delin
e to
be
deve
lope
d to
incl
ude
amon
g ot
her t
hing
s m
easu
res
such
as
c/s
infe
ctio
n ra
te, a
naes
thet
ic d
eath
rate
, mat
erna
l and
pae
diat
ric d
eath
s an
d w
rong
site
sur
gery
%Q
uarte
rlyPr
oces
s/Ac
tivity
APP;
DH
P
Com
plai
nt re
solu
tion
rate
Com
plai
nt re
solv
edC
ompl
aint
rece
ived
Prop
ortio
n of
all
com
plai
nts
reso
lved
out
of a
ll co
mpl
aint
s re
ceiv
edM
onito
rs p
ublic
hea
lth s
yste
m re
spon
se to
cus
tom
er c
once
rns
%M
onth
lyO
utpu
t
Chronic
Cat
arac
t sur
gery
rate
(a
nnua
lised
)C
atar
act s
urge
ry to
tal
Popu
latio
n un
insu
red
tota
lC
lient
s w
ho h
ad c
atar
act s
urge
ry p
er 1
mill
ion
popu
latio
nM
onito
rs a
cces
s to
cat
arac
t sur
gery
. A c
lient
with
sur
gery
on
both
eye
s w
ithin
a s
hort
time
perio
d sh
ould
be
coun
ted
as o
ne c
ase
per1
mill
Mon
thly
Out
put
APP
Dia
bete
s ne
w c
lient
un
der 1
8 ye
ars
dete
ctio
n ra
te (a
nnua
lised
)
Dia
bete
s cl
ient
und
er
18 y
ears
new
Popu
latio
n un
der 1
8 ye
ars
New
ly d
iagn
osed
dia
bete
s cl
ient
s (p
ut o
n tre
atm
ent)
unde
r 18
year
s as
a p
ropo
rtion
of t
he p
opul
atio
n un
der 1
8 ye
ars
Mon
itorin
g pr
ogra
mm
e pe
rform
ance
, as
wel
l as
trend
s, w
hich
will
info
rm
prev
enta
tive
stra
tegi
es. T
o de
term
ine
the
num
ber o
f clie
nts
<18
year
s, n
ewly
di
agno
sed
with
Dia
bete
s, a
nd p
ut o
n tre
atm
ent
per1
KM
onth
lyPr
oces
s/Ac
tivity
Dia
bete
s ne
w c
lient
18
yea
rs a
nd o
lder
de
tect
ion
rate
(a
nnua
lised
)
Dia
bete
s cl
ient
18
year
s an
d ol
der n
ewPo
pula
tion
18 y
ears
an
d ol
der
New
ly d
iagn
osed
dia
bete
s cl
ient
s (p
ut o
n tre
atm
ent)
18 y
ears
and
old
er a
s a
prop
ortio
n of
the
popu
latio
n 18
yea
rs a
nd o
lder
Mon
itorin
g pr
ogra
mm
e pe
rform
ance
, as
wel
l as
trend
s, w
hich
will
info
rm
prev
enta
tive
stra
tegi
es. T
o de
term
ine
the
num
ber o
f clie
nts
18 y
ears
and
ol
der,
new
ly d
iagn
osed
with
Dia
bete
s, a
nd p
ut o
n tre
atm
ent
per1
KM
onth
lyPr
oces
s/Ac
tivity
Hyp
erte
nsio
n ca
se lo
adH
yper
tens
ion
visi
tPH
C h
eadc
ount
5
year
s an
d ol
der
clie
nts
who
vis
ited
heal
th fa
cilit
ies
for h
yper
tens
ion
care
as
prop
ortio
n of
tota
l PH
C c
lient
s (h
eadc
ount
)M
onito
rs th
e nu
mbe
r of c
lient
s w
ho v
isite
d th
e cl
inic
to a
cces
s tre
atm
ent f
or
hype
rtens
ion
%M
onth
lyO
utpu
tN
SDA
; NSP
; W
HO
Hyp
erte
nsio
n in
cide
nce
(ann
ualis
ed)
Hyp
erte
nsio
n cl
ient
tre
atm
ent n
ewPo
pula
tion
40 y
ears
an
d ol
der
New
ly d
iagn
osed
hyp
erte
nsio
n cl
ient
s in
itiat
ed o
n tre
atm
ent p
er 1
,000
pop
ulat
ion
40 y
ears
and
old
erM
onito
rs p
rogr
amm
e pe
rform
ance
and
tren
ds to
info
rm p
reve
ntat
ive
stra
tegi
espe
r1K
Mon
thly
Out
com
e
Dia
bete
s in
cide
nce
(ann
ualis
ed)
Dia
bete
s cl
ient
tre
atm
ent n
ewPo
pula
tion
40 y
ears
an
d ol
der
New
ly d
iagn
osed
dia
bete
s cl
ient
s in
itiat
ed o
n tre
atm
ent p
er 1
,000
pop
ulat
ion
40 y
ears
and
old
erM
onito
rs p
rogr
amm
e pe
rform
ance
and
tren
ds to
info
rm p
reve
ntat
ive
stra
tegi
espe
r1K
Mon
thly
Out
com
e
Whe
elch
air i
ssue
d ra
teW
heel
chai
r iss
ued
- new
Whe
elch
air
appl
icat
ions
Whe
elch
airs
issu
ed a
s pr
opor
tion
of a
pplic
atio
ns
rece
ived
and
clie
nts
adde
d on
regi
ster
for r
equi
ring
whe
elch
airs
Mon
itors
acc
ess
to w
heel
chai
rs. O
nly
colle
ct a
t fac
ilitie
s w
here
whe
elch
airs
ar
e pr
ovid
ed%
Mon
thly
Out
put
Men
tal h
ealth
cas
e lo
adM
enta
l hea
lth c
lient
s to
tal
PHC
hea
dcou
nt to
tal
Men
tal h
ealth
car
e cl
ient
s as
pro
porti
on o
f tot
al P
HC
he
adco
unt
Mon
itors
acc
ess
to a
nd u
tilis
atio
n of
men
tal h
ealth
ser
vice
s%
Mon
thly
Proc
ess/
Activ
ityN
SDA
; NSP
; W
HO
Men
tal h
ealth
vis
it 18
ye
ars
and
olde
r rat
eM
enta
l hea
lth c
lient
18
yea
rs a
nd o
lder
Men
tal h
ealth
clie
nts
tota
lM
enta
l hea
lth c
are
clie
nt 1
8 ye
ars
and
olde
r as
prop
ortio
n of
tota
l men
tal h
ealth
car
e cl
ient
sM
onito
rs tr
ends
in m
enta
l hea
lth c
are
need
s an
d se
rvic
e ut
ilisa
tion
of c
lient
s 18
yea
rs a
nd o
lder
%M
onth
lyPr
oces
s/Ac
tivity
Men
tal h
ealth
adm
issi
on
rate
Men
tal h
ealth
ad
mis
sion
s to
tal
Inpa
tient
sep
arat
ions
to
tal
Prop
ortio
n of
clie
nts
adm
itted
/sep
arat
ed fo
r men
tal
heal
th p
robl
ems.
Inpa
tient
sep
arat
ions
is th
e to
tal o
f da
y cl
ient
s, in
patie
nt d
isch
arge
s, in
patie
nt d
eath
s an
d in
patie
nt tr
ansf
er o
uts
Mon
itors
tren
ds in
men
tal h
ealth
adm
issi
ons
in n
on-m
enta
l hea
lth
inst
itutio
ns. T
he d
ata
elem
ent i
npat
ient
sep
arat
ions
is u
sed
as a
pro
xy fo
r ad
mis
sion
s. M
onito
r in
gene
ral h
ospi
tals
onl
y an
d N
OT
in m
enta
l hea
lth
inst
itutio
ns
%M
onth
lyO
utpu
t
Men
tal h
ealth
adm
issi
on
18 y
ears
and
old
er ra
teM
enta
l hea
lth
adm
issi
on 1
8 ye
ars
and
olde
r
Men
tal h
ealth
ad
mis
sion
s to
tal
Clie
nt 1
8 ye
ars
and
olde
r adm
itted
for m
enta
l hea
lth
prob
lem
s as
pro
porti
on o
f tot
al m
enta
l hea
lth c
lient
s ad
mitt
ed
Mon
itors
tren
ds in
men
tal h
ealth
adm
issi
ons
unde
r 18
year
s of
age
. Use
in
gene
ral h
ospi
tals
and
men
tal h
ealth
inst
itutio
ns%
Mon
thly
Out
put
Men
tal h
ealth
in
volu
ntar
y ad
mis
sion
ra
te
Men
tal h
ealth
ad
mis
sion
in
volu
ntar
y
Men
tal h
ealth
ad
mis
sion
s to
tal
Invo
lunt
ary
adm
issi
ons
as p
ropo
rtion
of a
ll m
enta
l he
alth
adm
issi
ons
Mon
itors
adm
issi
ons
in te
rms
of s
ectio
n 39
of t
he R
egul
atio
ns to
the
Men
tal
Hea
lth C
are
Act N
o 17
of 2
002.
The
dat
a el
emen
ts s
houl
d be
col
lect
ed a
t al
l hos
pita
ls w
ith d
esig
nate
d ps
ychi
atric
bed
s or
war
ds. B
ecau
se o
f lon
g st
ay, t
he d
ata
elem
ent i
npat
ient
sep
arat
ions
can
not s
erve
as
a pr
oxy
for
adm
issi
ons
in m
enta
l hea
lth in
stitu
tions
%M
onth
lyO
utpu
t

296 SAHR 2012/13
Indi
cato
r Nam
eN
umer
ator
Den
omin
ator
Def
initi
onU
se a
nd c
onte
xtTy
peFr
eqLe
vel
Key
repo
rts
Child HealthC
hild
und
er 5
yea
rs
diar
rhoe
a w
ith
dehy
drat
ion
inci
denc
e (a
nnua
lised
)
Chi
ld u
nder
5 y
ears
di
arrh
oea
with
de
hydr
atio
n ne
w
Popu
latio
n un
der 5
ye
ars
Chi
ldre
n un
der 5
yea
rs n
ewly
dia
gnos
ed w
ith
diar
rhoe
a w
ith d
ehyd
ratio
n pe
r 1,0
00 c
hild
ren
unde
r 5
year
s in
the
popu
latio
n
Mon
itors
pre
vent
ion
of d
iarr
hoea
with
deh
ydra
tion
(IMC
I cla
ssifi
catio
n) in
ch
ildre
n un
der 5
yea
rs. C
ount
onl
y on
ce w
hen
diag
nose
d. F
ollo
w-u
p vi
sits
fo
r the
sam
e ep
isod
e of
dia
rrho
ea s
houl
d no
t be
coun
ted
here
per1
KM
onth
lyO
utco
me
Chi
ld u
nder
5 y
ears
pn
eum
onia
inci
denc
e (a
nnua
lised
)
Chi
ld u
nder
5 y
ears
w
ith p
neum
onia
new
Popu
latio
n un
der 5
ye
ars
Chi
ldre
n un
der 5
yea
rs n
ewly
dia
gnos
ed w
ith
pneu
mon
ia p
er 1
,000
chi
ldre
n un
der 5
yea
rs in
the
popu
latio
n
Mon
itors
pre
vent
ion
and
diag
nosi
s of
pne
umon
ia (I
MC
I def
initi
on) i
n ch
ildre
n un
der 5
yea
rs. C
ount
onl
y on
ce w
hen
diag
nose
d. F
ollo
w-u
p vi
sits
for t
he
sam
e ep
isod
e of
pne
umon
ia s
houl
d no
t be
coun
ted
here
per1
KM
onth
lyO
utco
me
NSD
A
Chi
ld u
nder
5
year
s se
vere
acu
te
mal
nutri
tion
inci
denc
e (a
nnua
lised
)
Chi
ld u
nder
5 y
ears
w
ith s
ever
e ac
ute
mal
nutri
tion
new
Popu
latio
n un
der 5
ye
ars
Chi
ldre
n un
der 5
yea
rs n
ewly
dia
gnos
ed w
ith s
ever
e ac
ute
mal
nutri
tion
per 1
,000
chi
ldre
n un
der 5
yea
rs
in th
e po
pula
tion
Mon
itors
pre
vent
ion
and
diag
nosi
s of
sev
ere
acut
e m
alnu
tritio
n in
chi
ldre
n un
der 5
yea
rs. C
ount
onl
y on
ce w
hen
diag
nose
d. F
ollo
w-u
p vi
sits
for t
he
sam
e ep
isod
e of
mal
nutri
tion
shou
ld n
ot b
e co
unte
d he
re
per1
KM
onth
lyO
utco
me
NSD
A
Chi
ld u
nder
5 y
ears
di
arrh
oea
case
fata
lity
rate
Chi
ld u
nder
5 y
ears
w
ith d
iarr
hoea
dea
thC
hild
und
er 5
yea
rs
with
dia
rrho
ea
adm
itted
Prop
ortio
n of
chi
ldre
n un
der 5
yea
rs a
dmitt
ed w
ith
diar
rhoe
a w
ho d
ied
Mon
itors
trea
tmen
t out
com
e fo
r chi
ldre
n un
der 5
yea
rs w
ho w
ere
adm
itted
w
ith d
iarr
hoea
. Inc
lude
und
er 1
yea
r dia
rrho
ea d
eath
s%
Mon
thly
Impa
ct
Chi
ld u
nder
5 y
ears
pn
eum
onia
cas
e fa
talit
y ra
te
Chi
ld u
nder
5 y
ears
pn
eum
onia
dea
thC
hild
und
er 5
yea
rs
pneu
mon
ia a
dmitt
edPr
opor
tion
of c
hild
ren
unde
r 5 y
ears
adm
itted
with
pn
eum
onia
who
die
dM
onito
rs tr
eatm
ent o
utco
me
for c
hild
ren
unde
r 5 y
ears
who
wer
e ad
mitt
ed
with
pne
umon
ia. I
nclu
des
all c
hild
ren
unde
r 5 y
ears
who
die
d of
pne
umon
ia%
Mon
thly
Impa
ct
Chi
ld u
nder
5
year
s se
vere
acu
te
mal
nutri
tion
case
fata
lity
rate
Chi
ld u
nder
5
year
s se
vere
acu
te
mal
nutri
tion
deat
h
Chi
ld u
nder
5
year
s se
vere
acu
te
mal
nutri
tion
adm
itted
Prop
ortio
n of
chi
ldre
n un
der 5
yea
rs a
dmitt
ed w
ith
seve
re a
cute
mal
nutri
tion
who
die
dM
onito
rs tr
eatm
ent o
utco
me
for c
hild
ren
unde
r 5 y
ears
who
wer
e ad
mitt
ed
with
sev
ere
acut
e m
alnu
tritio
n. In
clud
es u
nder
1 y
ear s
ever
e ac
ute
mal
nutri
tion
deat
hs a
s de
fined
in th
e IM
CI g
uide
lines
%M
onth
lyIm
pact
Chi
ld u
nder
1 y
ear
mor
talit
y in
faci
lity
rate
(a
nnua
lised
)
Inpa
tient
dea
th u
nder
1
year
Popu
latio
n es
timat
ed
live
birth
sAd
mitt
ed c
hild
ren
unde
r 1 y
ear o
f age
who
die
d pe
r es
timat
ed 1
,000
live
birt
hs. E
stim
ated
live
birt
hs in
po
pula
tion
is c
alcu
late
d by
mul
tiply
ing
estim
ated
po
pula
tion
unde
r 1 y
ear b
y 1.
03 to
com
pens
ate
for
infa
nt m
orta
lity
Incl
udes
neo
nata
l dea
ths.
Est
imat
ed li
ve b
irths
in p
opul
atio
n is
cal
cula
ted
by m
ultip
lyin
g es
timat
ed p
opul
atio
n un
der 1
yea
r by
1.03
to c
ompe
nsat
e fo
r in
fant
mor
talit
y. T
his
indi
cato
r will
be u
sefu
l at n
atio
nal,
prov
inci
al a
nd d
istri
ct
leve
ls
per1
KM
onth
lyIm
pact
MD
G; N
SDA
Chi
ld u
nder
5 y
ears
m
orta
lity
in fa
cilit
y ra
te
(ann
ualis
ed)
Inpa
tient
dea
th u
nder
5
year
sPo
pula
tion
estim
ated
liv
e bi
rths
Adm
itted
chi
ldre
n un
der 5
yea
rs w
ho d
ied
per
estim
ated
1,0
00 li
ve b
irths
. Est
imat
ed li
ve b
irths
in
popu
latio
n is
cal
cula
ted
by m
ultip
lyin
g es
timat
ed
popu
latio
n un
der 1
yea
r by
1.03
to c
ompe
nsat
e fo
r in
fant
mor
talit
y
Incl
udes
und
er 1
yea
r dea
ths.
Est
imat
ed li
ve b
irths
in p
opul
atio
n is
ca
lcul
ated
by
mul
tiply
ing
estim
ated
pop
ulat
ion
unde
r 1 y
ear b
y 1.
03 to
co
mpe
nsat
e fo
r inf
ant m
orta
lity.
Thi
s in
dica
tor w
ill be
use
ful a
t nat
iona
l, pr
ovin
cial
and
dis
trict
leve
ls
per1
KM
onth
lyIm
pact
MD
G; N
SDA
Dew
orm
ing
12-5
9 m
onth
s co
vera
ge
(ann
ualis
ed)
Chi
ld 1
2-59
mon
ths
dew
orm
edPo
pula
tion
12-5
9 m
onth
s (m
ultip
lied
by 2
)
Prop
ortio
n of
chi
ldre
n 12
-59
mon
ths
who
rece
ived
de
wor
min
g m
edic
atio
n ev
ery
six
mon
ths
Mon
itors
dew
orm
ing
in c
hild
ren
aged
12-
59 m
onth
s%
Mon
thly
Out
put
Inpa
tient
dea
th u
nder
1
year
rate
Inpa
tient
dea
th u
nder
1
year
Inpa
tient
sep
arat
ions
un
der 1
yea
rPr
opor
tion
of c
hild
ren
unde
r 1 y
ear a
dmitt
ed/
sepa
rate
d w
ho d
ied
durin
g th
eir s
tay
in th
e fa
cilit
y.
Inpa
tient
sep
arat
ions
und
er 1
yea
r is
the
tota
l of
inpa
tient
dis
char
ges,
inpa
tient
dea
ths
and
inpa
tient
tra
nsfe
r out
s
Mon
itors
trea
tmen
t out
com
e fo
r adm
itted
chi
ldre
n un
der 1
yea
r. In
clud
es
neon
atal
dea
ths
%M
onth
lyIm
pact
Inpa
tient
dea
th u
nder
5
year
rate
Inpa
tient
dea
th u
nder
5
year
sIn
patie
nt s
epar
atio
ns
unde
r 5 y
ears
Prop
ortio
n of
chi
ldre
n un
der 5
yea
rs a
dmitt
ed/
sepa
rate
d w
ho d
ied
durin
g th
eir s
tay
in th
e fa
cilit
y.
Inpa
tient
sep
arat
ions
und
er 5
yea
rs is
the
tota
l of
inpa
tient
dis
char
ges,
inpa
tient
dea
ths
and
inpa
tient
tra
nsfe
r out
s
Mon
itors
trea
tmen
t out
com
e fo
r adm
itted
chi
ldre
n un
der 5
yea
rs. I
nclu
des
unde
r 1 y
ear d
eath
s%
Mon
thly
Impa
ct

Health and Related Indicators 17
SAHR 2012/13 297
Indi
cato
r Nam
eN
umer
ator
Den
omin
ator
Def
initi
onU
se a
nd c
onte
xtTy
peFr
eqLe
vel
Key
repo
rts
EPIBC
G d
ose
cove
rage
(a
nnua
lised
)BC
G d
ose
Popu
latio
n un
der
1 ye
arPr
opor
tion
child
ren
unde
r 1 y
ear w
ho re
ceiv
ed B
CG
, no
rmal
ly g
iven
just
afte
r birt
hM
onito
rs B
CG
vac
cina
tion
to p
rote
ct c
hild
ren
agai
nst m
iliar
y TB
and
TB
men
ingi
tis. V
acci
nes
give
n as
par
t of m
ass
vacc
inat
ion
cam
paig
ns s
houl
d no
t be
coun
ted
here
%M
onth
lyO
utpu
tW
HO
OPV
1st
dos
e co
vera
ge
(ann
ualis
ed)
OPV
1st
dos
ePo
pula
tion
unde
r 1
year
Prop
ortio
n ch
ildre
n un
der 1
yea
r who
rece
ived
OPV
1s
t dos
e, n
orm
ally
at 6
wee
ksM
onito
rs p
rote
ctio
n of
chi
ldre
n ag
ains
t pol
io. V
acci
nes
give
n as
par
t of m
ass
vacc
inat
ion
cam
paig
ns s
houl
d no
t be
coun
ted
here
%M
onth
lyO
utpu
tW
HO
DTa
P-IP
V/H
ib 1
st d
ose
cove
rage
(ann
ualis
ed)
DTa
P-IP
V/H
ib 1
st
dose
Popu
latio
n un
der
1 ye
arPr
opor
tion
child
ren
unde
r 1 y
ear w
ho re
ceiv
ed
DTa
P-IP
V/H
ib (P
enta
xim
) 1st
dos
e, n
orm
ally
at 6
w
eeks
Mon
itors
pro
tect
ion
of c
hild
ren
agai
nst d
ipht
heria
, tet
anus
, a-c
ellu
lar
pertu
ssis
, pol
io a
nd H
aem
ophi
lus
influ
enza
e. V
acci
nes
give
n as
par
t of m
ass
vacc
inat
ion
cam
paig
ns s
houl
d no
t be
coun
ted
here
%M
onth
lyO
utpu
tW
HO
DTa
P-IP
V/H
ib 3
rd d
ose
cove
rage
(ann
ualis
ed)
DTa
P-IP
V/H
ib 3
rd
dose
Popu
latio
n un
der
1 ye
arPr
opor
tion
child
ren
unde
r 1 y
ear w
ho re
ceiv
ed
DTa
P-IP
V/H
ib (P
enta
xim
) 3rd
dos
e, n
orm
ally
at 1
4 w
eeks
Mon
itors
pro
tect
ion
of c
hild
ren
agai
nst d
ipht
heria
, tet
anus
, a-c
ellu
lar
pertu
ssis
, pol
io a
nd H
aem
ophi
lus
influ
enza
e. V
acci
nes
give
n as
par
t of m
ass
vacc
inat
ion
cam
paig
ns s
houl
d no
t be
coun
ted
here
%M
onth
lyO
utpu
tW
HO
; HAD
ACC
PCV
3rd
dose
cov
erag
e (a
nnua
lised
)PC
V 3r
d do
sePo
pula
tion
unde
r 1
year
Prop
ortio
n ch
ildre
n un
der 1
yea
r who
rece
ived
PC
V 3r
d do
se, n
orm
ally
at 9
mon
ths
Mon
itors
pro
tect
ion
of c
hild
ren
agai
nst p
neum
ococ
cal d
isea
se. V
acci
nes
give
n as
par
t of m
ass
vacc
inat
ion
cam
paig
ns s
houl
d no
t be
coun
ted
here
%M
onth
lyO
utpu
tW
HO
RV
2nd
dose
cov
erag
e (a
nnua
lised
)R
V 2n
d do
sePo
pula
tion
unde
r 1
year
Prop
ortio
n ch
ildre
n un
der 1
yea
r who
rece
ived
RV
2nd
dose
, nor
mal
ly a
t 14
wee
ks b
ut N
OT
late
r tha
n 24
wee
ks
Mon
itors
pro
tect
ion
of c
hild
ren
agai
nst r
ota
viru
s. V
acci
nes
give
n as
par
t of
mas
s va
ccin
atio
n ca
mpa
igns
sho
uld
not b
e co
unte
d he
re%
Mon
thly
Out
put
WH
O; H
ADAC
C
DTa
P-IP
V/H
ib 4
th d
ose
cove
rage
(ann
ualis
ed)
DTa
P-IP
V/H
ib 4
th
dose
Popu
latio
n 1
year
Prop
ortio
n ch
ildre
n ag
ed 1
yea
r who
rece
ived
DTa
P-IP
V/H
ib (P
enta
xim
) 4th
dos
e, n
orm
ally
at 1
8 m
onth
sM
onito
rs p
rote
ctio
n of
chi
ldre
n ag
ains
t dip
hthe
ria, t
etan
us, a
-cel
lula
r pe
rtuss
is, p
olio
and
Hae
mop
hilu
s in
fluen
zae.
Vac
cine
s gi
ven
as p
art o
f mas
s va
ccin
atio
n ca
mpa
igns
sho
uld
not b
e co
unte
d he
re
%M
onth
lyO
utpu
tW
HO
Hep
B 3r
d do
se c
over
age
(ann
ualis
ed)
Hep
B 3r
d do
sePo
pula
tion
unde
r 1
year
Prop
ortio
n ch
ildre
n un
der 1
yea
r who
rece
ived
Hep
B 3r
d do
se, n
orm
ally
at 1
4 w
eeks
Mon
itors
pro
tect
ion
of c
hild
ren
agai
nst H
epat
itis
B. V
acci
nes
give
n as
par
t of
mas
s va
ccin
atio
n ca
mpa
igns
sho
uld
not b
e co
unte
d he
re%
Mon
thly
Out
put
WH
O
Mea
sles
1st
dos
e un
der 1
yea
r cov
erag
e (a
nnua
lised
)
Mea
sles
1st
dos
e un
der 1
yea
rPo
pula
tion
unde
r 1
year
Prop
ortio
n ch
ildre
n un
der 1
yea
r who
rece
ived
m
easl
es 1
st d
ose,
nor
mal
ly a
t 9 m
onth
sM
onito
rs p
rote
ctio
n of
chi
ldre
n un
der 1
yea
r of a
ge a
gain
st m
easl
es.
Vacc
ines
giv
en a
s pa
rt of
mas
s va
ccin
atio
n ca
mpa
igns
sho
uld
not b
e co
unte
d he
re
%M
onth
lyO
utpu
tM
DG
Imm
unis
atio
n co
vera
ge u
nder
1 y
ear
(ann
ualis
ed)
Imm
unis
ed fu
lly
unde
r 1 y
ear n
ewPo
pula
tion
unde
r 1
year
Prop
ortio
n ch
ildre
n un
der 1
yea
r who
com
plet
ed
thei
r prim
ary
cour
se o
f im
mun
isat
ion
The
child
sho
uld
only
be
coun
ted
ON
CE
as fu
lly im
mun
ised
whe
n re
ceiv
ing
the
last
vac
cine
in th
e co
urse
(usu
ally
the
1st m
easl
es a
nd P
CV3
vac
cine
s)
AND
if th
ere
is d
ocum
ente
d pr
oof o
f all
requ
ired
vacc
ines
(BC
G, O
PV1,
D
TaP-
IPV/
Hib
1, 2
, 3, H
epB
1, 2
, 3, P
CV
1,2,
3, R
V 1,
2 an
d m
easl
es 1
) on
the
Roa
d to
Hea
lth C
ard/
Book
let A
ND
the
child
is u
nder
1 y
ear o
ld
%M
onth
lyO
utpu
tAP
P
DTa
P-IP
V/H
ib 3
- M
easl
es 1
st d
ose
drop
-out
rate
DTa
P-IP
V/ H
ib3
to
Mea
sles
1st d
ose
drop
-out
DTa
P-IP
V/ H
ib 3
rd
dose
Prop
ortio
n ch
ildre
n w
ho d
ropp
ed o
ut o
f the
im
mun
isat
ion
sche
dule
bet
wee
n D
TaP-
IPV/
IPV
Hib
3r
d do
se, n
orm
ally
at 1
4 w
eeks
and
mea
sles
1st
do
se, n
orm
ally
at 9
mon
ths
Mon
itors
chi
ldre
n w
ho d
rops
out
of t
he v
acci
natio
n pr
ogra
m a
fter 1
4 w
eek
vacc
inat
ion.
Vac
cine
s gi
ven
as p
art o
f mas
s va
ccin
atio
n ca
mpa
igns
sho
uld
not b
e co
unte
d he
re
%M
onth
lyO
utco
me
Mea
sles
2nd
dos
e co
vera
ge (a
nnua
lised
)M
easl
es 2
nd d
ose
Popu
latio
n 1
year
Prop
ortio
n of
chi
ldre
n 1
year
(12-
23 m
onth
s) w
ho
rece
ived
mea
sles
2nd
dos
e, n
orm
ally
at 1
8 m
onth
sM
onito
rs p
rote
ctio
n of
chi
ldre
n ag
ains
t mea
sles
. Bec
ause
the
1st m
easl
es
dose
is o
nly
arou
nd 8
5% e
ffect
ive
the
2nd
dose
is im
porta
nt a
s a
boos
ter.
Vacc
ines
giv
en a
s pa
rt of
mas
s va
ccin
atio
n ca
mpa
igns
sho
uld
not b
e co
unte
d he
re
%M
onth
lyO
utpu
tAP
P
Imm
unis
atio
n at
6 w
eeks
co
nsis
tenc
y ra
tioIm
mun
isat
ion
at 6
w
eeks
with
iden
tical
O
PV1
and
DTa
P-IP
V/H
ib1
valu
es
Cou
nt o
f fac
ilitie
s gi
ving
6 w
eeks
im
mun
isat
ions
Imm
unis
atio
n at
6 w
eeks
dat
a w
ith id
entic
al v
alue
s fo
r OPV
1 an
d D
TaP-
IPV/
Hib
1 as
a p
ropo
rtion
of
all f
acili
ties
repo
rting
one
or b
oth
vacc
ines
giv
en.
NO
TE: T
he n
umer
ator
form
ula
is to
be
expa
nded
w
ith a
n IIF
func
tion
that
retu
rns
1 w
hen
the
two
data
el
emen
t val
ues
are
cons
iste
nt a
nd a
0 o
ther
wis
e
Mon
itors
to w
hat d
egre
e ch
ildre
n ar
e ge
tting
all
requ
ired
dose
s si
mul
tane
ousl
y as
per
the
prim
ary
cour
se o
f im
mun
isat
ion
prot
ocol
%M
onth
lyD
ata
Qua
lity
Imm
unis
atio
n at
9 m
onth
co
nsis
tenc
y ra
tioIm
mun
isat
ion
at 9
m
onth
with
iden
tical
m
easl
es1
and
PCV3
va
lues
Cou
nt o
f fac
ilitie
s gi
ving
9 m
onth
s im
mun
isat
ions
Imm
unis
atio
n at
9 m
onth
s da
ta w
ith id
entic
al
valu
es fo
r mea
sles
1 a
nd P
CV3
as
a pr
opor
tion
of
all f
acili
ties
repo
rting
one
or b
oth
vacc
ines
giv
en.
NO
TE: T
he n
umer
ator
form
ula
is to
be
expa
nded
w
ith a
n IIF
func
tion
that
retu
rns
1 w
hen
the
two
data
el
emen
t val
ues
are
cons
iste
nt a
nd a
0 o
ther
wis
e
Mon
itors
to w
hat d
egre
e ch
ildre
n ar
e ge
tting
all
requ
ired
dose
s si
mul
tane
ousl
y as
per
the
prim
ary
cour
se o
f im
mun
isat
ion
prot
ocol
%M
onth
lyD
ata
Qua
lity
Td d
ose
cove
rage
at 6
ye
ars
(ann
ualis
ed)
Td d
ose
at 6
yea
rsPo
pula
tion
6 ye
ars
Prop
ortio
n ch
ildre
n 6
year
s of
age
who
rece
ived
Td
boos
ter d
ose
Mon
itors
pro
tect
ion
of c
hild
ren
agai
nst t
etan
us a
nd d
ipht
heria
, inc
ludi
ng
vacc
inat
ions
don
e at
sch
ools
. Vac
cine
s gi
ven
as p
art o
f mas
s va
ccin
atio
n ca
mpa
igns
sho
uld
not b
e co
unte
d he
re
%M
onth
lyO
utpu
t

298 SAHR 2012/13
Indi
cato
r Nam
eN
umer
ator
Den
omin
ator
Def
initi
onU
se a
nd c
onte
xtTy
peFr
eqLe
vel
Key
repo
rts
NutritionVi
tam
in A
12-
59 m
onth
s co
vera
ge (a
nnua
lised
)Vi
tam
in A
12-
59
mon
ths
Popu
latio
n 12
-59
mon
ths
(mul
tiplie
d by
2)
Prop
ortio
n of
chi
ldre
n 12
-59
mon
ths
who
rece
ived
vi
tam
in A
200
,000
uni
ts e
very
six
mon
ths
Mon
itors
vita
min
A s
uppl
emen
tatio
n to
chi
ldre
n ag
ed 1
2-59
mon
ths.
Th
e de
nom
inat
or is
mul
tiplie
d by
2 b
ecau
se e
ach
child
sho
uld
rece
ive
supp
lem
enta
tion
twic
e a
year
%M
onth
lyO
utpu
tAP
P
Chi
ld u
nder
2 y
ears
un
derw
eigh
t for
age
in
cide
nce
(ann
ualis
ed)
Chi
ld u
nder
2 y
ears
un
derw
eigh
t - n
ew
(wei
ght b
etw
een
-2
SD a
nd -3
SD
new
)
Popu
latio
n un
der 2
ye
ars
Chi
ldre
n un
der 2
yea
rs n
ewly
dia
gnos
ed a
s un
derw
eigh
t (w
eigh
t bet
wee
n -2
and
-3 S
tand
ard
Dev
iatio
ns) p
er 1
,000
chi
ldre
n un
der 2
yea
rs in
the
popu
latio
n
Mon
itors
pre
vent
ion
of m
alnu
tritio
n du
ring
1,00
0 da
ys b
etw
een
star
t of
preg
nanc
y an
d se
cond
birt
hday
. Cou
nt o
nly
once
whe
n di
agno
sed.
Fol
low
-up
vis
its fo
r the
sam
e ep
isod
e of
und
erw
eigh
t sho
uld
not b
e co
unte
d
per1
KM
onth
lyO
utco
me
NSD
A
Chi
ld u
nder
5 y
ears
fo
od s
uppl
emen
tatio
n co
vera
ge (a
nnua
lised
)
Chi
ld u
nder
5
year
s on
food
su
pple
men
tatio
n ne
w
Popu
latio
n un
der 5
ye
ars
Chi
ldre
n un
der 5
new
ly s
tarte
d on
food
su
pple
men
tatio
n as
pro
porti
on o
f pop
ulat
ion
unde
r 5
year
s
Mon
itors
acc
ess
to a
nd e
ffici
ent u
se o
f foo
d su
pple
men
tatio
n in
chi
ldre
n un
der 5
yea
rs o
f age
. Aro
und
2% o
f chi
ldre
n un
der 5
are
und
erw
eigh
t and
ne
ed fo
od s
uppl
emen
tatio
n
%M
onth
lyIn
put
Infa
nt e
xclu
sive
ly
brea
stfe
d at
Hep
B 3r
d do
se ra
te
Infa
nt e
xclu
sive
ly
brea
stfe
d at
Hep
B 3r
d do
se
Hep
B 3r
d do
sePr
opor
tion
infa
nts
repo
rted
excl
usiv
ely
brea
stfe
d at
14
wee
ks H
epat
itis
B 3r
d do
se v
acci
natio
nM
onito
rs in
fant
feed
ing
prac
tices
at 1
4 w
eeks
to id
entif
y w
here
com
mun
ity
inte
rven
tions
nee
d to
be
stre
ngth
ened
%M
onth
lyO
utco
me
Maternal and Women’s Health
Ante
nata
l 1st
vis
it be
fore
20
wee
ks ra
teAn
tena
tal 1
st v
isit
befo
re 2
0 w
eeks
Ante
nata
l 1st
vis
it to
tal
Wom
en w
ho h
ave
a bo
okin
g vi
sit (
first
vis
it) b
efor
e th
ey a
re 2
0 w
eeks
(abo
ut h
alf w
ay) i
nto
thei
r pr
egna
ncy
as p
ropo
rtion
of a
ll an
tena
tal 1
st v
isits
Mon
itors
ear
ly u
tilis
atio
n of
ant
enat
al s
ervi
ces
%M
onth
lyPr
oces
s/Ac
tivity
APP
Ante
nata
l 1st
vis
it co
vera
ge (a
nnua
lised
)An
tena
tal 1
st v
isit
tota
lPo
pula
tion
estim
ated
pr
egna
nt w
omen
(at
~10
wee
ks)
The
prop
ortio
n of
pot
entia
l ant
enat
al c
lient
s co
min
g fo
r at l
east
one
(boo
king
) ant
enat
al v
isit.
The
cen
sus
num
ber o
f chi
ldre
n un
der o
ne y
ear f
acto
rised
by
1.15
is u
sed
as a
pro
xy d
enom
inat
or -
the
extra
0.
15 (1
5%) i
s a
roug
h es
timat
e to
cat
er fo
r lat
e m
isca
rria
ges
(~10
to 2
6 w
), st
ill bi
rths
(afte
r 26
wee
ks g
esta
tion)
and
infa
nt m
orta
lity.
Pre
gnan
t w
omen
are
rega
rded
as
pote
ntia
l ant
enat
al c
lient
s fro
m a
roun
d 10
wee
ks g
esta
tion,
i.e.
spo
ntan
eous
ab
ortio
ns b
efor
e th
at a
s w
ell a
s TO
P ca
ses
are
excl
uded
Mon
itors
acc
ess
to a
nd u
tilis
atio
n of
ant
enat
al s
ervi
ces
%M
onth
lyPr
oces
s/Ac
tivity
APP
Ante
nata
l clie
nt H
IV 1
st
test
pos
itive
rate
Ante
nata
l clie
nt H
IV
1st t
est p
ositi
veAn
tena
tal c
lient
HIV
1s
t tes
tAn
tena
tal c
lient
s te
sted
HIV
pos
itive
as
prop
ortio
n of
an
tena
tal c
lient
s H
IV te
sted
for t
he fi
rst t
ime
durin
g cu
rrent
pre
gnan
cy
Mon
itors
tren
ds in
HIV
test
pos
itivi
ty o
f ant
enat
al c
lient
s%
Mon
thly
Out
com
eD
OR
A; N
SP;
GAR
; UA
Ante
nata
l clie
nt H
IV
re-te
st a
t 32
wee
ks o
r la
ter r
ate
Ante
nata
l clie
nt H
IV
re-te
st a
t 32
wee
ks
or la
ter
Ante
nata
l clie
nt H
IV
1st t
est n
egat
ive
Ante
nata
l clie
nts
re-te
sted
for H
IV a
t 32
wee
ks
gest
atio
n (o
r lat
er) a
s pr
opor
tion
of a
nten
atal
clie
nts
test
ed n
egat
ive
for 1
st H
IV te
sts
done
dur
ing
curre
nt
preg
nanc
y
Mon
itors
impl
emen
tatio
n of
PM
TCT
guid
elin
es in
term
s of
HIV
re-te
stin
g at
32
wee
ks g
esta
tion.
Use
d as
a p
roxy
indi
cato
r as
it is
not
cos
t effe
ctiv
e to
m
onito
r coh
orts
with
pap
er-b
ased
sys
tem
s
%M
onth
lyPr
oces
s/Ac
tivity
DO
RA
; NSP
; G
AR; U
A;
HAD
ACC
:36
Ante
nata
l clie
nt H
IV re
-te
st p
ositi
ve a
t 32
wee
ks
or la
ter r
ate
Ante
nata
l clie
nt H
IV
re-te
st p
ositi
ve a
t 32
wee
ks o
r lat
er
Ante
nata
l clie
nt H
IV
re-te
st a
t 32
wee
ks
or la
ter
Ante
nata
l clie
nts
re-te
sted
pos
itive
for H
IV a
t 32
wee
ks g
esta
tion
(or l
ater
) as
prop
ortio
n of
ant
enat
al
clie
nts
re-te
sted
for H
IV a
t 32
wee
ks (o
r lat
er)
Mon
itors
HIV
infe
ctio
n du
ring
preg
nanc
y%
Mon
thly
Out
com
eD
OR
A; N
SP;
GAR
; UA
Ante
nata
l clie
nt C
D4
1st
test
rate
Ante
nata
l clie
nt C
D4
1st t
est
Ante
nata
l clie
nt
elig
ible
for C
D4
1st t
est
HIV
pos
itive
ant
enat
al c
lient
s C
D4
test
ed fo
r the
fir
st ti
me
durin
g cu
rrent
pre
gnan
cy a
s pr
opor
tion
of
ante
nata
l clie
nts
elig
ible
for f
irst C
D4
test
s
Mon
itors
impl
emen
tatio
n of
PM
TCT
guid
elin
es in
term
s of
CD
4 1s
t tes
ting
%M
onth
lyO
utpu
tD
OR
A; N
SP;
GAR
; UA
Ante
nata
l clie
nt in
itiat
ed
on A
ZT d
urin
g an
tena
tal
care
rate
Ante
nata
l clie
nt
INIT
IATE
D o
n A
ZTAn
tena
tal c
lient
el
igib
le fo
r AZT
HIV
pos
itive
ant
enat
al c
lient
s in
itiat
ed o
n A
ZT d
urin
g an
tena
tal c
are
as p
ropo
rtion
of a
nten
atal
clie
nts
elig
ible
for A
ZT
Mon
itors
impl
emen
tatio
n of
PM
TCT
guid
elin
es in
term
s of
AZT
initi
atio
n an
d ac
cess
to A
ZT%
Mon
thly
Out
put
DO
RA
; NSP
; G
AR; U
A
Ante
nata
l clie
nt P
MTC
T ra
teAn
tena
tal c
lient
on
PMTC
TAn
tena
tal c
lient
HIV
po
sitiv
e to
tal
Ante
nata
l clie
nts
on P
MTC
T as
a p
ropo
rtion
of
the
tota
l num
ber o
f ant
enat
al c
lient
s w
ho a
re H
IV
posi
tive
Mon
itors
acc
ess
and
effe
ctiv
enes
s of
PM
TCT
serv
ices
. Ant
enat
al c
lient
s on
PM
TCT
incl
ude
thos
e in
itiat
ed o
n A
ZT, t
hose
initi
ated
on
ART
and
thos
e w
ho
wer
e on
AR
T at
ant
enat
al 1
st v
isits
%M
onth
lyPr
oces
s/Ac
tivity
HAD
ACC
:36
Ante
nata
l clie
nt in
itiat
ed
on A
RT
rate
Ante
nata
l clie
nt
initi
ated
on
ART
Ante
nata
l clie
nt
elig
ible
for A
RT
HIV
pos
itive
ant
enat
al c
lient
s in
itiat
ed o
n AR
T as
pr
opor
tion
of H
IV p
ositi
ve a
nten
atal
clie
nts
with
CD
4 co
unts
und
er th
e sp
ecifi
ed th
resh
old
and/
or W
HO
st
agin
g of
4
Mon
itors
impl
emen
tatio
n of
PM
TCT
guid
elin
es in
term
s of
AR
T in
itiat
ion
%M
onth
lyPr
oces
s/Ac
tivity
DO
RA
; NSP
; G
AR; U
A

Health and Related Indicators 17
SAHR 2012/13 299
Indi
cato
r Nam
eN
umer
ator
Den
omin
ator
Def
initi
onU
se a
nd c
onte
xtTy
peFr
eqLe
vel
Key
repo
rts
Ante
nata
l clie
nt
deliv
erin
g on
AR
T ra
tioAn
tena
tal c
lient
on
ART
at d
eliv
ery
Live
birt
h to
HIV
po
sitiv
e w
oman
HIV
pos
itive
ant
enat
al c
lient
s on
AR
T fo
r any
per
iod
befo
re la
bour
as
prop
ortio
n of
live
birt
hs to
HIV
po
sitiv
e w
omen
Mon
itors
pro
porti
on n
ew-b
orn
Infa
nts
prot
ecte
d ag
ains
t HIV
by
ART
durin
g pr
egna
ncy.
Thi
s da
ta is
col
lect
ed a
t poi
nt o
f del
iver
y on
ly a
nd N
OT
durin
g an
tena
tal c
are
%M
onth
lyO
utpu
tD
OR
A; N
SP;
GAR
; UA
Infa
nt g
iven
NVP
with
in
72 h
ours
afte
r birt
h up
take
rate
Infa
nt g
iven
NVP
w
ithin
72
hour
s af
ter
birth
Live
birt
h to
HIV
po
sitiv
e w
oman
Babi
es g
iven
NVP
with
in 7
2 ho
urs
of b
irth
as
prop
ortio
n of
live
birt
hs to
HIV
pos
itive
wom
enM
onito
rs im
plem
enta
tion
of th
e PM
TCT
guid
elin
es in
term
s of
NVP
for H
IV
expo
sed
babi
es%
Mon
thly
Out
put
DO
RA
; NSP
; G
AR; U
A
Born
aliv
e be
fore
arr
ival
at
faci
lity
rate
Born
aliv
e be
fore
ar
rival
at f
acili
tyTo
tal b
irths
in fa
cilit
yIn
fant
s bo
rn a
live
befo
re a
rriv
al a
t hea
lth fa
cilit
ies
with
no
supe
rvis
ion
as a
pro
porti
on o
f tot
al b
irths
Mon
itors
tren
ds in
poo
r acc
ess
to d
eliv
ery
faci
litie
s m
ainl
y ca
used
by
inad
equa
te tr
ansp
ort a
nd/o
r poo
r inf
rast
ruct
ure
per1
KM
onth
lyO
utco
me
Cer
vica
l can
cer
scre
enin
g co
vera
ge
(ann
ualis
ed)
Cer
vica
l can
cer
scre
enin
g in
wom
an
30 y
ears
and
old
er
Popu
latio
n 30
yea
rs
and
olde
r fem
ale
/ 10
Cer
vica
l sm
ears
in w
omen
30
year
s an
d ol
der a
s a
prop
ortio
n of
10%
of t
he fe
mal
e po
pula
tion
30 y
ears
an
d ol
der
Mon
itors
impl
emen
tatio
n of
pol
icy
on c
ervi
cal s
cree
ning
%M
onth
lyPr
oces
s/Ac
tivity
Cou
ple
year
pro
tect
ion
rate
(ann
ualis
ed)
Con
trace
ptiv
e ye
ars
disp
ense
dPo
pula
tion
15-4
4 ye
ars
fem
ale
Wom
en p
rote
cted
aga
inst
pre
gnan
cy b
y us
ing
mod
ern
cont
race
ptiv
e m
etho
ds, i
nclu
ding
st
erili
satio
ns, a
s pr
opor
tion
of fe
mal
e po
pula
tion
15-
44 y
ear.
Con
trace
ptiv
e ye
ars
are
the
tota
l of (
Ora
l pi
ll cy
cles
/ 13
) + (M
edro
xypr
oges
tero
ne in
ject
ion
/ 4) +
(Nor
ethi
ster
one
enan
that
e in
ject
ion
/ 6) +
(IU
CD
x 4
) + )M
ale
cond
oms
dist
ribut
ed /
200)
+
(Mal
e st
erili
satio
n x
20) +
(Fem
ale
ster
ilisa
tion
x 10
)
Mon
itors
acc
ess
to a
nd u
tilis
atio
n of
mod
ern
cont
race
ptiv
es to
pre
vent
un
plan
ned
preg
nanc
ies.
Ser
ves
as p
roxy
for t
he in
dica
tor c
ontra
cept
ive
prev
alen
ce ra
te b
y m
onito
ring
trend
s be
twee
n of
ficia
l sur
veys
%M
onth
lyO
utco
me
Del
iver
y by
cae
sare
an
sect
ion
rate
Del
iver
y by
ca
esar
ean
sect
ion
Del
iver
y in
faci
lity
tota
lD
eliv
ery
by c
aesa
rean
sec
tion
as p
ropo
rtion
of t
otal
de
liver
ies
in h
ealth
faci
litie
sM
onito
rs a
cces
s to
cae
sare
an s
ectio
n (a
nd o
ther
sur
gery
) as
wel
l as
use
of re
sour
ces
at d
eliv
ery
faci
litie
s. D
iffer
s be
twee
n ty
pes
of h
ospi
tals
, for
ex
ampl
e 20
11/1
2 va
lues
for D
H:1
5 %
RH
:25
% T
H: 3
0% C
H: 5
0 %
.
%M
onth
lyO
utpu
t
Del
iver
y in
faci
lity
rate
(a
nnua
lised
)D
eliv
ery
in fa
cilit
y to
tal
Popu
latio
n es
timat
ed
deliv
erie
sD
eliv
erie
s in
hea
lth fa
cilit
ies
as p
ropo
rtion
of
expe
cted
uni
nsur
ed d
eliv
erie
s in
the
popu
latio
n.
Expe
cted
del
iver
ies
are
estim
ated
as
popu
latio
n un
der 1
yea
r mul
tiplie
d by
1.0
25 to
com
pens
ate
for
still
birth
s an
d in
fant
mor
talit
y
Mon
itors
acc
essi
bilit
y of
mat
erni
ty a
nd o
bste
tric
serv
ices
. Bor
n Be
fore
Ar
rival
s (B
BAs)
are
not
incl
uded
her
e%
Mon
thly
Out
com
eAP
P
Del
iver
y in
faci
lity
unde
r 18
yea
rs ra
teD
eliv
ery
in fa
cilit
y to
wom
an u
nder
18
year
s
Del
iver
y in
faci
lity
tota
lD
eliv
erie
s to
wom
en u
nder
the
age
of 1
8 ye
ars
as
prop
ortio
n of
tota
l del
iver
ies
in h
ealth
faci
litie
sM
onito
rs s
ucce
ss in
pre
vent
ion
of te
enag
e pr
egna
ncie
s%
Mon
thly
Out
com
eM
DG
; NSD
A
Infa
nt in
itiat
ed o
n C
PT
with
in 2
mon
ths
upta
ke
rate
Infa
nt in
itiat
ed o
n C
PT w
ithin
2 m
onth
sLi
ve b
irth
to H
IV
posi
tive
wom
anIn
fant
s in
itiat
ed o
n C
PT w
ithin
2 m
onth
s af
ter b
irth
(to p
reve
nt o
ppor
tuni
stic
infe
ctio
ns) a
s pr
opor
tion
of
live
birth
s to
HIV
pos
itive
wom
en
Mon
itors
impl
emen
tatio
n of
the
PMTC
T gu
idel
ines
in te
rms
of C
o-Tr
imox
azol
e pr
ophy
laxi
s (C
PT) f
or H
IV e
xpos
ed In
fant
s%
Mon
thly
Out
put
DO
RA
; NSP
; G
AR; U
A
Infa
nt 1
st P
CR
test
w
ithin
2 m
onth
s up
take
ra
te
Infa
nt 1
st P
CR
test
w
ithin
2 m
onth
sLi
ve b
irth
to H
IV
posi
tive
wom
anIn
fant
s PC
R te
sted
for t
he fi
rst t
ime
with
in 2
mon
ths
afte
r birt
h as
pro
porti
on o
f liv
e bi
rths
to H
IV p
ositi
ve
wom
en
Mon
itors
impl
emen
tatio
n of
PM
TCT
guid
elin
es in
term
s of
PC
R te
stin
g of
H
IV e
xpos
ed In
fant
s w
ithin
2 m
onth
s. B
abie
s PC
R te
sted
for t
he fi
rst t
ime
betw
een
4 an
d 8
wee
ks m
ust b
e in
clud
ed. D
o N
OT
incl
ude
repe
at te
sts.
U
sed
as a
pro
xy in
dica
tor a
s it
is n
ot c
ost e
ffect
ive
to m
onito
r coh
orts
with
pa
per-b
ased
sys
tem
s
%M
onth
lyO
utpu
tD
OR
A; N
SP;
GAR
; UA
Infa
nt 1
st P
CR
test
po
sitiv
e w
ithin
2 m
onth
s ra
te
Infa
nt 1
st P
CR
test
po
sitiv
e w
ithin
2
mon
ths
Infa
nt 1
st P
CR
test
w
ithin
2 m
onth
sIn
fant
s te
sted
PC
R p
ositi
ve fo
r the
firs
t tim
e w
ithin
2
mon
ths
afte
r birt
h as
pro
porti
on o
f Inf
ants
PC
R
test
ed w
ithin
2 m
onth
s
Mon
itors
pos
itivi
ty in
HIV
exp
osed
Infa
nts
with
in 2
mon
ths
%M
onth
lyO
utco
me
DO
RA
; NSP
; G
AR; U
A; A
PP
Live
birt
h un
der 2
500g
in
faci
lity
rate
Live
birt
h un
der
2500
g in
faci
lity
Live
birt
h in
faci
lity
Infa
nts
born
aliv
e w
eigh
ing
less
than
250
0g a
s pr
opor
tion
of to
tal I
nfan
ts b
orn
aliv
e in
hea
lth
faci
litie
s (L
ow b
irth
wei
ght)
Mon
itors
tren
ds in
low
birt
h w
eigh
t%
Mon
thly
Out
com
e
Still
birth
in fa
cilit
y ra
teSt
ill bi
rth in
faci
lity
Tota
l birt
hs in
faci
lity
Infa
nts
born
stil
l as
prop
ortio
n of
tota
l inf
ants
bor
n in
he
alth
faci
litie
sM
onito
rs s
till b
irth
trend
s%
Mon
thly
Impa
ct
Inpa
tient
ear
ly n
eona
tal
deat
h ra
teIn
patie
nt d
eath
ear
ly
neon
atal
Live
birt
h in
faci
lity
Early
neo
nata
l dea
ths
as p
ropo
rtion
of I
nfan
ts w
ho
wer
e bo
rn a
live
in h
ealth
faci
litie
sM
onito
rs tr
ends
in e
arly
neo
nata
l dea
ths
in h
ealth
faci
litie
s. In
dica
tion
of
heal
th s
yste
m re
sults
in te
rms
of a
nten
atal
, del
iver
y an
d ea
rly n
eona
tal c
are
%M
onth
lyIm
pact
MD
G; N
SDA
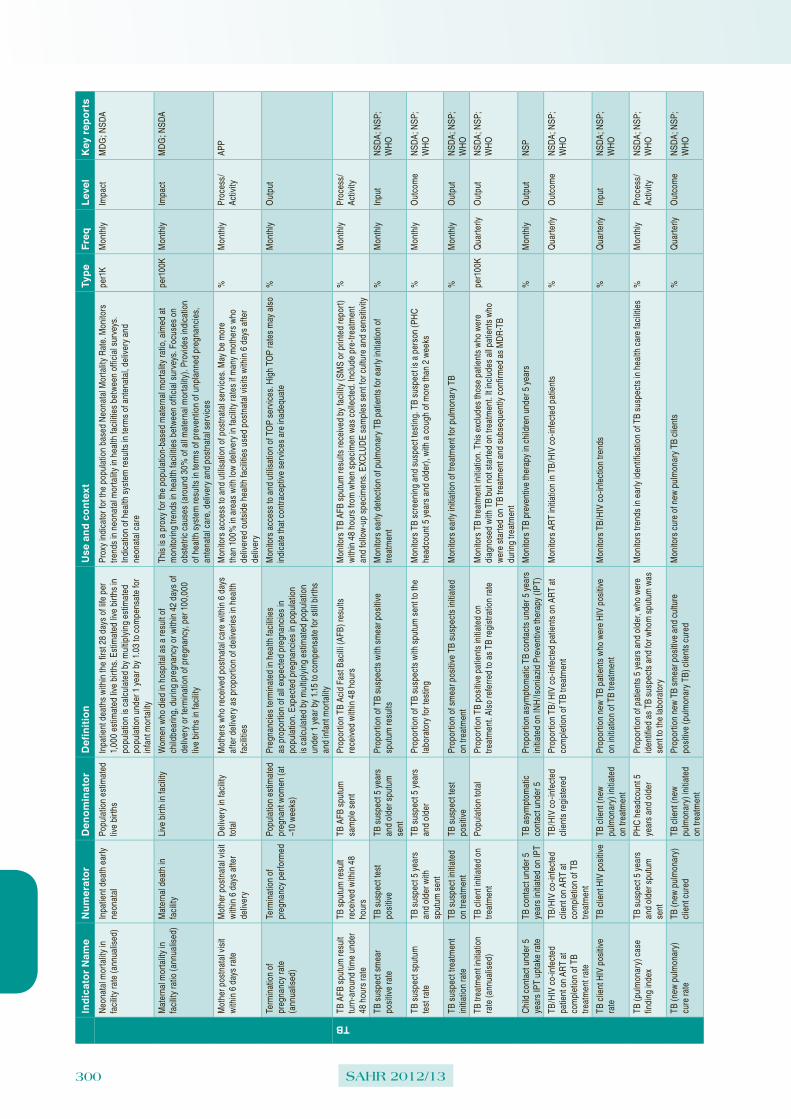
300 SAHR 2012/13
Indi
cato
r Nam
eN
umer
ator
Den
omin
ator
Def
initi
onU
se a
nd c
onte
xtTy
peFr
eqLe
vel
Key
repo
rts
Neo
nata
l mor
talit
y in
fa
cilit
y ra
te (a
nnua
lised
)In
patie
nt d
eath
ear
ly
neon
atal
Popu
latio
n es
timat
ed
live
birth
sIn
patie
nt d
eath
s w
ithin
the
first
28
days
of l
ife p
er
1,00
0 es
timat
ed li
ve b
irths
. Est
imat
ed li
ve b
irths
in
popu
latio
n is
cal
cula
ted
by m
ultip
lyin
g es
timat
ed
popu
latio
n un
der 1
yea
r by
1.03
to c
ompe
nsat
e fo
r in
fant
mor
talit
y
Prox
y in
dica
tor f
or th
e po
pula
tion
base
d N
eona
tal M
orta
lity
Rat
e. M
onito
rs
trend
s in
neo
nata
l mor
talit
y in
hea
lth fa
cilit
ies
betw
een
offic
ial s
urve
ys.
Indi
catio
n of
hea
lth s
yste
m re
sults
in te
rms
of a
nten
atal
, del
iver
y an
d ne
onat
al c
are
per1
KM
onth
lyIm
pact
MD
G; N
SDA
Mat
erna
l mor
talit
y in
fa
cilit
y ra
tio (a
nnua
lised
)M
ater
nal d
eath
in
faci
lity
Live
birt
h in
faci
lity
Wom
en w
ho d
ied
in h
ospi
tal a
s a
resu
lt of
ch
ildbe
arin
g, d
urin
g pr
egna
ncy
or w
ithin
42
days
of
deliv
ery
or te
rmin
atio
n of
pre
gnan
cy, p
er 1
00,0
00
live
birth
s in
faci
lity
This
is a
pro
xy fo
r the
pop
ulat
ion-
base
d m
ater
nal m
orta
lity
ratio
, aim
ed a
t m
onito
ring
trend
s in
hea
lth fa
cilit
ies
betw
een
offic
ial s
urve
ys. F
ocus
es o
n ob
stet
ric c
ause
s (a
roun
d 30
% o
f all
mat
erna
l mor
talit
y). P
rovi
des
indi
catio
n of
hea
lth s
yste
m re
sults
in te
rms
of p
reve
ntio
n of
unp
lann
ed p
regn
anci
es,
ante
nata
l car
e, d
eliv
ery
and
post
nata
l ser
vice
s
per1
00K
Mon
thly
Impa
ctM
DG
; NSD
A
Mot
her p
ostn
atal
vis
it w
ithin
6 d
ays
rate
Mot
her p
ostn
atal
vis
it w
ithin
6 d
ays
afte
r de
liver
y
Del
iver
y in
faci
lity
tota
lM
othe
rs w
ho re
ceiv
ed p
ostn
atal
car
e w
ithin
6 d
ays
afte
r del
iver
y as
pro
porti
on o
f del
iver
ies
in h
ealth
fa
cilit
ies
Mon
itors
acc
ess
to a
nd u
tilis
atio
n of
pos
tnat
al s
ervi
ces.
May
be
mor
e th
an 1
00%
in a
reas
with
low
del
iver
y in
faci
lity
rate
s if
man
y m
othe
rs w
ho
deliv
ered
out
side
hea
lth fa
cilit
ies
used
pos
tnat
al v
isits
with
in 6
day
s af
ter
deliv
ery
%M
onth
lyPr
oces
s/Ac
tivity
APP
Term
inat
ion
of
preg
nanc
y ra
te
(ann
ualis
ed)
Term
inat
ion
of
preg
nanc
y pe
rform
edPo
pula
tion
estim
ated
pr
egna
nt w
omen
(at
~10
wee
ks)
Preg
nanc
ies
term
inat
ed in
hea
lth fa
cilit
ies
as p
ropo
rtion
of a
ll ex
pect
ed p
regn
anci
es in
po
pula
tion.
Exp
ecte
d pr
egna
ncie
s in
pop
ulat
ion
is c
alcu
late
d by
mul
tiply
ing
estim
ated
pop
ulat
ion
unde
r 1 y
ear b
y 1.
15 to
com
pens
ate
for s
till b
irths
an
d in
fant
mor
talit
y
Mon
itors
acc
ess
to a
nd u
tilis
atio
n of
TO
P se
rvic
es. H
igh
TOP
rate
s m
ay a
lso
indi
cate
that
con
trace
ptiv
e se
rvic
es a
re in
adeq
uate
%M
onth
lyO
utpu
t
TB
TB A
FB s
putu
m re
sult
turn
-aro
und
time
unde
r 48
hou
rs ra
te
TB s
putu
m re
sult
rece
ived
with
in 4
8 ho
urs
TB A
FB s
putu
m
sam
ple
sent
Prop
ortio
n TB
Aci
d Fa
st B
acill
i (AF
B) r
esul
ts
rece
ived
with
in 4
8 ho
urs
Mon
itors
TB
AFB
sput
um re
sults
rece
ived
by
faci
lity
(SM
S or
prin
ted
repo
rt)
with
in 4
8 ho
urs
from
whe
n sp
ecim
en w
as c
olle
cted
. Inc
lude
pre
-trea
tmen
t an
d fo
llow
-up
spec
imen
s. E
XCLU
DE
sam
ples
sen
t for
cul
ture
and
sen
sitiv
ity
%M
onth
lyPr
oces
s/Ac
tivity
TB s
uspe
ct s
mea
r po
sitiv
e ra
teTB
sus
pect
test
po
sitiv
eTB
sus
pect
5 y
ears
an
d ol
der s
putu
m
sent
Prop
ortio
n of
TB
susp
ects
with
sm
ear p
ositi
ve
sput
um re
sults
Mon
itors
ear
ly d
etec
tion
of p
ulm
onar
y TB
pat
ient
s fo
r ear
ly in
itiat
ion
of
treat
men
t%
Mon
thly
Inpu
tN
SDA
; NSP
; W
HO
TB s
uspe
ct s
putu
m
test
rate
TB s
uspe
ct 5
yea
rs
and
olde
r with
sp
utum
sen
t
TB s
uspe
ct 5
yea
rs
and
olde
rPr
opor
tion
of T
B su
spec
ts w
ith s
putu
m s
ent t
o th
e la
bora
tory
for t
estin
gM
onito
rs T
B sc
reen
ing
and
susp
ect t
estin
g. T
B su
spec
t is
a pe
rson
(PH
C
head
coun
t 5 y
ears
and
old
er),
with
a c
ough
of m
ore
than
2 w
eeks
%M
onth
lyO
utco
me
NSD
A; N
SP;
WH
O
TB s
uspe
ct tr
eatm
ent
initi
atio
n ra
teTB
sus
pect
initi
ated
on
trea
tmen
tTB
sus
pect
test
po
sitiv
ePr
opor
tion
of s
mea
r pos
itive
TB
susp
ects
initi
ated
on
trea
tmen
tM
onito
rs e
arly
initi
atio
n of
trea
tmen
t for
pul
mon
ary
TB%
Mon
thly
Out
put
NSD
A; N
SP;
WH
O
TB tr
eatm
ent i
nitia
tion
rate
(ann
ualis
ed)
TB c
lient
initi
ated
on
treat
men
tPo
pula
tion
tota
lPr
opor
tion
TB p
ositi
ve p
atie
nts
initi
ated
on
treat
men
t. Al
so re
ferre
d to
as
TB re
gist
ratio
n ra
teM
onito
rs T
B tre
atm
ent i
nitia
tion.
Thi
s ex
clud
es th
ose
patie
nts
who
wer
e di
agno
sed
with
TB
but n
ot s
tarte
d on
trea
tmen
t. It
incl
udes
all
patie
nts
who
w
ere
star
ted
on T
B tre
atm
ent a
nd s
ubse
quen
tly c
onfir
med
as
MD
R-T
B du
ring
treat
men
t
per1
00K
Qua
rterly
Out
put
NSD
A; N
SP;
WH
O
Chi
ld c
onta
ct u
nder
5
year
s IP
T up
take
rate
TB c
onta
ct u
nder
5
year
s in
itiat
ed o
n IP
TTB
asy
mpt
omat
ic
cont
act u
nder
5Pr
opor
tion
asym
ptom
atic
TB
cont
acts
und
er 5
yea
rs
initi
ated
on
INH
/Ison
iazi
d Pr
even
tive
ther
apy
(IPT)
Mon
itors
TB
prev
entiv
e th
erap
y in
chi
ldre
n un
der 5
yea
rs%
Mon
thly
Out
put
NSP
TB/H
IV c
o-in
fect
ed
patie
nt o
n AR
T at
co
mpl
etio
n of
TB
treat
men
t rat
e
TB/H
IV c
o-in
fect
ed
clie
nt o
n AR
T at
co
mpl
etio
n of
TB
treat
men
t
TB/H
IV c
o-in
fect
ed
clie
nts
regi
ster
edPr
opor
tion
TB/ H
IV c
o-in
fect
ed p
atie
nts
on A
RT
at
com
plet
ion
of T
B tre
atm
ent
Mon
itors
AR
T in
itiat
ion
in T
B/H
IV c
o-in
fect
ed p
atie
nts
%Q
uarte
rlyO
utco
me
NSD
A; N
SP;
WH
O
TB c
lient
HIV
pos
itive
ra
teTB
clie
nt H
IV p
ositi
veTB
clie
nt (n
ew
pulm
onar
y) in
itiat
ed
on tr
eatm
ent
Prop
ortio
n ne
w T
B pa
tient
s w
ho w
ere
HIV
pos
itive
on
initi
atio
n of
TB
treat
men
tM
onito
rs T
B/H
IV c
o-in
fect
ion
trend
s%
Qua
rterly
Inpu
tN
SDA
; NSP
; W
HO
TB (p
ulm
onar
y) c
ase
findi
ng in
dex
TB s
uspe
ct 5
yea
rs
and
olde
r spu
tum
se
nt
PHC
hea
dcou
nt 5
ye
ars
and
olde
rPr
opor
tion
of p
atie
nts
5 ye
ars
and
olde
r, w
ho w
ere
iden
tifie
d as
TB
susp
ects
and
for w
hom
spu
tum
was
se
nt to
the
labo
rato
ry
Mon
itors
tren
ds in
ear
ly id
entif
icat
ion
of T
B su
spec
ts in
hea
lth c
are
faci
litie
s%
Mon
thly
Proc
ess/
Activ
ityN
SDA
; NSP
; W
HO
TB (n
ew p
ulm
onar
y)
cure
rate
TB (n
ew p
ulm
onar
y)
clie
nt c
ured
TB c
lient
(new
pu
lmon
ary)
initi
ated
on
trea
tmen
t
Prop
ortio
n ne
w T
B sm
ear p
ositi
ve a
nd c
ultu
re
posi
tive
(pul
mon
ary
TB) c
lient
s cu
red
Mon
itors
cur
e of
new
pul
mon
ary
TB c
lient
s%
Qua
rterly
Out
com
eN
SDA
; NSP
; W
HO

Health and Related Indicators 17
SAHR 2012/13 301
Indi
cato
r Nam
eN
umer
ator
Den
omin
ator
Def
initi
onU
se a
nd c
onte
xtTy
peFr
eqLe
vel
Key
repo
rts
TB (n
ew p
ulm
onar
y)
defa
ulte
r rat
eTB
(new
pul
mon
ary)
tre
atm
ent d
efau
lter
TB c
lient
(new
pu
lmon
ary)
initi
ated
on
trea
tmen
t
Prop
ortio
n ne
w s
mea
r pos
itive
(pul
mon
ary)
TB
clie
nts
who
def
aulte
d tre
atm
ent
Mon
itors
TB
clie
nts
who
do
not t
ake
thei
r tre
atm
ent a
s pr
escr
ibed
%Q
uarte
rlyO
utco
me
NSD
A; N
SP;
WH
O
TB M
DR
con
firm
ed
treat
men
t ini
tiatio
n ra
teTB
MD
R c
onfir
med
cl
ient
initi
ated
on
treat
men
t
TB M
DR
con
firm
ed
new
clie
ntPr
opor
tion
conf
irmed
new
MD
R-T
B pa
tient
s in
itiat
ed
on tr
eatm
ent
Mon
itors
trea
tmen
t of M
DR
TB
patie
nts
%Q
uarte
rlyO
utpu
tN
SDA
; NSP
; W
HO
TB M
DR
dea
th ra
teTB
MD
R c
lient
dea
th
durin
g tre
atm
ent
TB M
DR
con
firm
ed
clie
nt in
itiat
ed o
n tre
atm
ent
Prop
ortio
n M
DR
-TB
patie
nts
who
die
d du
ring
treat
men
t per
iod
Mon
itors
dea
th d
urin
g M
DR
TB
treat
men
t per
iod.
The
cau
se o
f dea
th m
ay
not n
eces
saril
y be
due
to T
B%
Qua
rterly
Impa
ctN
SDA
; NSP
; W
HO
TB M
DR
trea
tmen
t su
cces
s ra
teTB
MD
R c
lient
su
cces
sful
ly tr
eate
dTB
MD
R c
onfir
med
cl
ient
initi
ated
on
treat
men
t
Prop
ortio
n M
DR
-TB
patie
nts
succ
essf
ully
trea
ted
(cur
ed a
nd c
ompl
eted
trea
tmen
t)M
onito
rs s
ucce
ss o
f MD
R T
B tre
atm
ent
%Q
uarte
rlyO
utco
me
NSD
A; N
SP;
WH
O
TB X
DR
con
firm
ed
treat
men
t ini
tiatio
n ra
teTB
XD
R c
onfir
med
cl
ient
initi
ated
on
treat
men
t
TB X
DR
con
firm
ed
new
clie
ntPr
opor
tion
conf
irmed
new
XD
R-T
B pa
tient
s in
itiat
ed
on tr
eatm
ent
Mon
itors
trea
tmen
t of X
DR
TB
patie
nts
%Q
uarte
rlyO
utpu
tN
SDA
; NSP
; W
HO
TB X
DR
dea
th ra
teTB
XD
R c
lient
dea
th
durin
g tre
atm
ent
TB X
DR
con
firm
ed
clie
nt in
itiat
ed o
n tre
atm
ent
Prop
ortio
n XD
R-T
B pa
tient
s w
ho d
ied
durin
g tre
atm
ent p
erio
dM
onito
rs d
eath
dur
ing
XDR
TB
treat
men
t per
iod.
The
cau
se o
f dea
th m
ay n
ot
nece
ssar
ily b
e du
e to
TB
%Q
uarte
rlyIm
pact
NSD
A; N
SP;
WH
O
TB X
DR
trea
tmen
t su
cces
s ra
teTB
XD
R c
lient
su
cces
sful
ly tr
eate
dTB
XD
R c
onfir
med
cl
ient
initi
ated
on
treat
men
t
Prop
ortio
n XD
R-T
B pa
tient
s su
cces
sful
ly tr
eate
d (c
ured
and
com
plet
ed tr
eatm
ent)
Mon
itors
suc
cess
of X
DR
TB
treat
men
t%
Qua
rterly
Out
com
eN
SDA
; NSP
; W
HO
TB n
ew c
lient
trea
tmen
t su
cces
s ra
teTB
clie
nt c
ured
and
co
mpl
eted
trea
tmen
tTB
clie
nt (n
ew
pulm
onar
y) in
itiat
ed
on tr
eatm
ent
Prop
ortio
n TB
pat
ient
s (A
LL ty
pes
of T
B) c
ured
plu
s th
ose
who
com
plet
ed tr
eatm
ent
Mon
itors
suc
cess
of T
B tre
atm
ent f
or A
LL ty
pes
of T
B%
Qua
rterly
Out
com
eN
SDA
; NSP
; W
HO
TB d
eath
rate
TB c
lient
dea
th
durin
g tre
atm
ent
TB c
lient
(new
pu
lmon
ary)
initi
ated
on
trea
tmen
t
Prop
ortio
n TB
pat
ient
s w
ho d
ied
durin
g tre
atm
ent
perio
dM
onito
rs d
eath
dur
ing
TB tr
eatm
ent p
erio
d. T
he c
ause
of d
eath
may
not
ne
cess
arily
be
due
to T
B. N
SP:5
2 ta
rget
is 5
0% re
duct
ion
from
7.1
%%
Qua
rterly
Impa
ctN
SDA
; NSP
; W
HO
Oral Health
Den
tal u
tilis
atio
n ra
te
(ann
ualis
ed)
Den
tal h
eadc
ount
to
tal
Popu
latio
n un
insu
red
tota
lD
enta
l vis
its p
er 1
,000
uni
nsur
ed p
opul
atio
nM
onito
rs a
cces
s to
den
tal/o
ral h
ealth
ser
vice
s. E
ach
pers
on s
houl
d vi
sit a
de
ntis
t at l
east
onc
e a
year
per1
KM
onth
lyO
utpu
t
Den
tal e
xtra
ctio
n to
re
stor
atio
n ra
tioTo
oth
extra
ctio
nTo
oth
rest
orat
ion
The
ratio
bet
wee
n th
e nu
mbe
r of t
eeth
ext
ract
ed a
nd
the
num
ber o
f tee
th re
stor
edM
onito
rs o
vera
ll qu
ality
of d
enta
l ser
vice
s. P
oor q
ualit
y de
ntal
ser
vice
s if
man
y ex
tract
ions
and
few
rest
orat
ions
No
Mon
thly
Out
put
Den
tal -
toot
h fis
sure
se
alan
t rat
e (c
hild
)To
oth
fissu
re s
eala
nt
1st o
r 2nd
per
man
ent
mol
ar (c
hild
)
Toot
h er
uptio
n 1s
t an
d 2n
d m
olar
(chi
ld)
Prop
ortio
n of
chi
ldre
n w
ith 1
st o
r 2nd
eru
ptin
g pe
rman
ent m
olar
s se
aled
by
an O
ral H
ealth
wor
ker
as p
ropo
rtion
of c
hild
ren
with
1st
and
2nd
mol
ar
erup
tions
Mon
itors
pre
vent
ive
inte
rven
tions
by
oral
hea
lth w
orke
rs. 1
st a
nd 2
nd m
olar
s us
ually
eru
pt a
t age
6 a
nd 1
2 re
spec
tivel
y. C
ount
eac
h ch
ild a
nd n
ot th
e nu
mbe
r of t
eeth
sea
led
%M
onth
lyO
utpu
t
HIV
Fem
ale
cond
om
dist
ribut
ion
rate
(a
nnua
lised
)
Fem
ale
cond
oms
dist
ribut
edPo
pula
tion
15 y
ears
an
d ol
der f
emal
eTh
e nu
mbe
r of f
emal
e co
ndom
s di
strib
uted
per
fe
mal
e 15
yea
rs a
nd o
lder
via
the
faci
lity
or v
ia
fact
orie
s, o
ffice
s, re
stau
rant
s, N
GO
s or
oth
er o
utle
ts
Mon
itors
dis
tribu
tion
of fe
mal
e co
ndom
s fo
r pre
vent
ion
of H
IV a
nd o
ther
ST
Is, a
nd fo
r con
trace
ptiv
e pu
rpos
esN
oM
onth
lyO
utpu
tN
SP
Mal
e co
ndom
di
strib
utio
n ra
te
(ann
ualis
ed)
Mal
e co
ndom
s di
strib
uted
Popu
latio
n 15
yea
rs
and
olde
r mal
eN
umbe
r of m
ale
cond
oms
dist
ribut
ed to
clie
nts
via
the
faci
lity
or v
ia fa
ctor
ies,
offi
ces,
rest
aura
nts,
N
GO
s or
oth
er o
utle
ts -
per m
ale
15 y
ears
and
old
er
Mon
itors
dis
tribu
tion
of m
ale
cond
oms
for p
reve
ntio
n of
HIV
and
oth
er S
TIs,
an
d fo
r con
trace
ptiv
e pu
rpos
es. N
ote
that
rese
arch
indi
cate
s on
ly a
roun
d 60
% o
f dis
tribu
ted
cond
oms
are
used
for t
he in
tend
ed p
urpo
se
No
Mon
thly
Out
put
NSP
HIV
pos
itive
new
clie
nt
initi
ated
on
IPT
rate
HIV
pos
itive
clie
nt
initi
ated
on
IPT
HIV
pos
itive
clie
nt
elig
ible
for I
PTPr
opor
tion
of e
ligib
le c
lient
s in
itiat
ed o
n IP
TM
onito
rs in
itiat
ion
of Is
onia
zid
prev
entiv
e th
erap
y (IP
T) to
pre
vent
TB
%M
onth
lyPr
oces
s/Ac
tivity
APP;
NSP
HIV
test
ing
cove
rage
(a
nnua
lised
)H
IV te
st c
lient
15-
49
year
sPo
pula
tion
15-4
9 ye
ars
Clie
nts
HIV
test
ed a
s pr
opor
tion
of p
opul
atio
n 15
-49
year
sM
onito
rs a
nnua
l tes
ting
of p
erso
ns 1
5-49
yea
rs w
ho a
re n
ot k
now
n H
IV
posi
tive
%M
onth
lyPr
oces
s/Ac
tivity
NSP
; APP
TB/H
IV c
o-in
fect
ed
clie
nt in
itiat
ed o
n AR
T ra
te
HIV
/TB
co-in
fect
ed
clie
nt s
tarte
d on
AR
TH
IV/T
B co
-infe
cted
cl
ient
tota
lPr
opor
tion
of T
B/H
IV c
o-in
fect
ed c
lient
s in
itiat
ed
on A
RT
Mon
itors
TB
/HIV
co-
infe
ctio
n at
poi
nt o
f AR
T in
itiat
ion
%M
onth
lyPr
oces
s/Ac
tivity
APP

302 SAHR 2012/13
Indi
cato
r Nam
eN
umer
ator
Den
omin
ator
Def
initi
onU
se a
nd c
onte
xtTy
peFr
eqLe
vel
Key
repo
rts
HIV
/TB
co-in
fect
ed
clie
nt in
itiat
ed o
n C
PT
rate
HIV
/TB
co-in
fect
ed
clie
nt s
tarte
d on
CPT
HIV
/TB
co-in
fect
ed
clie
nt to
tal
Prop
ortio
n of
TB
/HIV
co-
infe
cted
clie
nts
initi
ated
on
co-tr
imox
azol
e pr
ophy
laxi
s th
erap
y (C
PT)
Mon
itors
CPT
initi
atio
n fo
r TB
/HIV
co-
infe
cted
clie
nts
to p
reve
nt
oppo
rtuni
stic
infe
ctio
ns%
Mon
thly
Proc
ess/
Activ
ityAP
P
Sexu
al a
ssau
lt pr
ophy
laxi
s ra
teSe
xual
ass
ault
prop
hyla
xis
new
Sexu
al a
ssau
lt ca
ses
new
Prop
ortio
n of
sex
ual a
ssau
lt ca
ses
who
rece
ived
po
st-e
xpos
ure
prop
hyla
xis
Mon
itors
HIV
pro
phyl
axis
acc
ess
for p
eopl
e w
ho w
ere
sexu
ally
ass
aulte
d (r
ape
surv
ivor
s)%
Mon
thly
Out
put
STI t
reat
ed n
ew e
piso
de
inci
denc
e (a
nnua
lised
)ST
I tre
ated
new
ep
isod
ePo
pula
tion
15 y
ears
an
d ol
der
Prop
ortio
n of
peo
ple
15 y
ears
and
old
er tr
eate
d fo
r a
new
epi
sode
of S
TI (a
nnua
lised
)M
onito
rs tr
eatm
ent o
f STI
s, w
hich
incl
ude
HIV
and
mor
e th
an 2
0 di
seas
e-ca
usin
g or
gani
sms
and
synd
rom
es, o
f whi
ch s
ome
also
can
cau
se c
ance
r (N
SP 2
012/
2016
:7)
per1
KM
onth
lyO
utpu
t
School Health
Scho
ol IS
HP
cove
rage
(a
nnua
lised
)Sc
hool
s w
ith a
ny
lear
ner s
cree
ned
Scho
ols
- tot
alPr
opor
tion
of s
choo
ls in
whi
ch th
e IS
HP
serv
ice
pack
age
was
pro
vide
dM
onito
rs im
plem
enta
tion
of th
e In
tegr
ated
Sch
ool H
ealth
Pro
gram
(ISH
P)%
Mon
thly
Proc
ess/
Activ
ityAP
P; N
SDA
Scho
ol le
arne
r sc
reen
ing
cove
rage
(a
nnua
lised
)
Scho
ol le
arne
rs
scre
ened
Scho
ol le
arne
rs
- tot
alPr
opor
tion
of a
ll le
arne
rs s
cree
ned
by a
nur
se in
line
w
ith th
e IS
HP
serv
ice
pack
age
Mon
itors
impl
emen
tatio
n of
the
Inte
grat
ed S
choo
l Hea
lth P
rogr
am (I
SHP)
%M
onth
lyPr
oces
s/Ac
tivity
APP
Scho
ol G
rade
1
scre
enin
g co
vera
ge
(ann
ualis
ed)
Scho
ol G
rade
1
lear
ners
scr
eene
dSc
hool
Gra
de 1
le
arne
rs -
tota
lPr
opor
tion
of G
rade
1 le
arne
rs s
cree
ned
by a
nur
se
in li
ne w
ith th
e IS
HP
serv
ice
pack
age
Mon
itors
impl
emen
tatio
n of
the
Inte
grat
ed S
choo
l Hea
lth P
rogr
am (I
SHP)
%M
onth
lyPr
oces
s/Ac
tivity
APP
Scho
ol G
rade
4
scre
enin
g co
vera
ge
(ann
ualis
ed)
Scho
ol G
rade
4
lear
ners
scr
eene
dSc
hool
Gra
de 4
le
arne
rs -
tota
lPr
opor
tion
of G
rade
4 le
arne
rs s
cree
ned
by a
nur
se
in li
ne w
ith th
e IS
HP
serv
ice
pack
age
Mon
itors
impl
emen
tatio
n of
the
Inte
grat
ed S
choo
l Hea
lth P
rogr
am (I
SHP)
%M
onth
lyPr
oces
s/Ac
tivity
Scho
ol G
rade
8
scre
enin
g co
vera
ge
(ann
ualis
ed)
Scho
ol G
rade
8
lear
ners
scr
eene
dSc
hool
Gra
de 8
le
arne
rs -
tota
lPr
opor
tion
of G
rade
8 le
arne
rs s
cree
ned
by a
nur
se
in li
ne w
ith th
e IS
HP
serv
ice
pack
age
Mon
itors
impl
emen
tatio
n of
the
Inte
grat
ed S
choo
l Hea
lth P
rogr
am (I
SHP)
%M
onth
lyPr
oces
s/Ac
tivity
APP
Scho
ol G
rade
10
scre
enin
g co
vera
ge
(ann
ualis
ed)
Scho
ol G
rade
10
lear
ners
scr
eene
dSc
hool
Gra
de 1
0 le
arne
rs -
tota
lPr
opor
tion
of G
rade
10
lear
ners
scr
eene
d by
a
nurs
e in
line
with
the
ISH
P se
rvic
e pa
ckag
eM
onito
rs im
plem
enta
tion
of th
e In
tegr
ated
Sch
ool H
ealth
Pro
gram
(ISH
P)%
Mon
thly
Proc
ess/
Activ
ity
Scho
ol le
arne
r un
derw
eigh
t rat
eSc
hool
lear
ners
un
derw
eigh
tSc
hool
lear
ners
sc
reen
ed -
tota
lPr
opor
tion
of le
arne
rs s
cree
ned
by a
nur
se in
lin
e w
ith th
e IS
HP
serv
ice
pack
age
diag
nose
d as
un
derw
eigh
t (be
low
-2SD
but
abo
ve -3
SD)
Mon
itors
impl
emen
tatio
n of
the
Inte
grat
ed S
choo
l Hea
lth P
rogr
am (I
SHP)
%M
onth
lyPr
oces
s/Ac
tivity
Scho
ol le
arne
r ov
erw
eigh
t rat
eSc
hool
lear
ners
ov
erw
eigh
tSc
hool
lear
ners
sc
reen
ed -
tota
lPr
opor
tion
of le
arne
rs s
cree
ned
by a
nur
se in
lin
e w
ith th
e IS
HP
serv
ice
pack
age
diag
nose
d as
ov
erw
eigh
t (ab
ove
+2SD
)
Mon
itors
impl
emen
tatio
n of
the
Inte
grat
ed S
choo
l Hea
lth P
rogr
am (I
SHP)
%M
onth
lyPr
oces
s/Ac
tivity
Scho
ol le
arne
r ref
erre
d fo
r Ora
l Hea
lth ra
teSc
hool
lear
ner
refe
rred
for O
ral
Hea
lth
Scho
ol le
arne
rs
scre
ened
- to
tal
Prop
ortio
n of
lear
ners
scr
eene
d by
a n
urse
in li
ne
with
the
ISH
P se
rvic
e pa
ckag
e an
d re
ferre
d fo
r Ora
l H
ealth
Mon
itors
impl
emen
tatio
n of
the
Inte
grat
ed S
choo
l Hea
lth P
rogr
am (I
SHP)
%M
onth
lyPr
oces
s/Ac
tivity
Scho
ol le
arne
r ref
erre
d fo
r Eye
Car
e ra
teSc
hool
lear
ner
refe
rred
for E
ye C
are
Scho
ol le
arne
rs
scre
ened
- to
tal
Prop
ortio
n of
lear
ners
scr
eene
d by
a n
urse
in li
ne
with
the
ISH
P se
rvic
e pa
ckag
e an
d re
ferre
d fo
r Ey
e C
are
Mon
itors
impl
emen
tatio
n of
the
Inte
grat
ed S
choo
l Hea
lth P
rogr
am (I
SHP)
%M
onth
lyPr
oces
s/Ac
tivity
Scho
ol le
arne
r ref
erre
d fo
r Hea
ring
prob
lem
s ra
te
Scho
ol le
arne
r re
ferre
d fo
r Hea
ring
prob
lem
s
Scho
ol le
arne
rs
scre
ened
- to
tal
Prop
ortio
n of
lear
ners
scr
eene
d by
a n
urse
in li
ne
with
the
ISH
P se
rvic
e pa
ckag
e an
d re
ferre
d fo
r H
earin
g pr
oble
ms
Mon
itors
impl
emen
tatio
n of
the
Inte
grat
ed S
choo
l Hea
lth P
rogr
am (I
SHP)
%M
onth
lyPr
oces
s/Ac
tivity
Scho
ol le
arne
r ref
erre
d fo
r Spe
ech
prob
lem
s ra
te
Scho
ol le
arne
r re
ferre
d fo
r Spe
ech
prob
lem
s
Scho
ol le
arne
rs
scre
ened
- to
tal
Prop
ortio
n of
lear
ners
scr
eene
d by
a n
urse
in li
ne
with
the
ISH
P se
rvic
e pa
ckag
e an
d re
ferre
d fo
r Sp
eech
pro
blem
s
Mon
itors
impl
emen
tatio
n of
the
Inte
grat
ed S
choo
l Hea
lth P
rogr
am (I
SHP)
%M
onth
lyPr
oces
s/Ac
tivity
Scho
ol le
arne
r ref
erre
d fo
r Sus
pect
ed T
B ra
teSc
hool
lear
ner
refe
rred
for
Susp
ecte
d TB
Scho
ol le
arne
rs
scre
ened
- to
tal
Prop
ortio
n of
lear
ners
scr
eene
d by
a n
urse
in li
ne
with
the
ISH
P se
rvic
e pa
ckag
e an
d re
ferre
d fo
r Su
spec
ted
TB
Mon
itors
impl
emen
tatio
n of
the
Inte
grat
ed S
choo
l Hea
lth P
rogr
am (I
SHP)
%M
onth
lyPr
oces
s/Ac
tivity
Scho
ol le
arne
r im
mun
ised
rate
Scho
ol le
arne
r im
mun
ised
Scho
ol le
arne
rs
scre
ened
- to
tal
Prop
ortio
n of
lear
ners
scr
eene
d by
a n
urse
in
line
with
the
ISH
P se
rvic
e pa
ckag
e an
d gi
ven
imm
unis
atio
n
Mon
itors
impl
emen
tatio
n of
the
Inte
grat
ed S
choo
l Hea
lth P
rogr
am (I
SHP)
%M
onth
lyPr
oces
s/Ac
tivity

Health and Related Indicators 17
SAHR 2012/13 303
Indi
cato
r Nam
eN
umer
ator
Den
omin
ator
Def
initi
onU
se a
nd c
onte
xtTy
peFr
eqLe
vel
Key
repo
rts
Scho
ol le
arne
r de
wor
min
g ra
teSc
hool
lear
ner
dew
orm
edSc
hool
lear
ners
sc
reen
ed -
tota
lPr
opor
tion
of le
arne
rs s
cree
ned
by a
nur
se in
lin
e w
ith th
e IS
HP
serv
ice
pack
age
and
give
n de
wor
min
g ta
blet
s
Mon
itors
impl
emen
tatio
n of
the
Inte
grat
ed S
choo
l Hea
lth P
rogr
am (I
SHP)
%M
onth
lyPr
oces
s/Ac
tivity
EMS
EMS
call
trans
port
rate
EMS
call
clie
nt
trans
porte
dEM
S ca
lls to
tal
Prop
ortio
n EM
S ca
lls w
hich
resu
lted
in c
lient
s be
ing
trans
porte
dM
onito
rs th
e pr
opor
tion
of c
alls
whi
ch re
sulte
d in
clie
nts
actu
ally
bei
ng
trans
porte
d to
hea
lth fa
cilit
ies
in re
latio
n to
the
tota
l num
ber o
f cal
ls
disp
atch
ed b
y th
e C
omm
unic
atio
ns C
entre
%M
onth
lyO
utpu
t
EMS
inte
r-fac
ility
tra
nsfe
r rat
eEM
S in
ter-f
acili
ty
trans
fer
EMS
clie
nts
tota
lIn
ter-f
acili
ty (f
rom
one
inpa
tient
faci
lity
to a
noth
er
inpa
tient
faci
lity)
tran
sfer
s as
pro
porti
on o
f tot
al
EMS
clie
nts
trans
porte
d
Mon
itors
use
of a
mbu
lanc
es fo
r int
er-fa
cilit
y tra
nsfe
rs a
s op
pose
d to
em
erge
ncy
resp
onse
s%
Mon
thly
Out
put
EMS
obst
etric
clie
nt
trans
port
rate
EMS
obst
etric
clie
ntEM
S cl
ient
s to
tal
Obs
tetri
c cl
ient
s as
pro
porti
on o
f tot
al E
MS
clie
nts
trans
porte
dM
onito
rs n
eed
for a
nd u
se o
f am
bula
nces
for o
bste
tric
clie
nts.
Incl
udes
ob
stet
ric c
lient
s tra
nspo
rted
in o
bste
tric
and
othe
r ope
ratio
nal a
mbu
lanc
es%
Mon
thly
Out
put
EMS
oper
atio
nal
ambu
lanc
e co
vera
ge
(ann
ualis
ed)
EMS
oper
atio
nal
ambu
lanc
esPo
pula
tion
tota
lN
umbe
r of o
pera
tiona
l am
bula
nces
per
10
000
popu
latio
nM
onito
rs c
ompl
ianc
e w
ith th
e no
rm fo
r ope
ratio
nal a
mbu
lanc
es to
mee
t po
pula
tion
need
s. T
his
incl
udes
obs
tetri
c am
bula
nces
per1
0KM
onth
lyIn
put
EMS
oper
atio
nal
Obs
tetri
c Em
erge
ncy
Uni
t cov
erag
e
EMS
oper
atio
nal
Obs
tetri
c Em
erge
ncy
Uni
ts
Popu
latio
n to
tal
The
num
ber o
f ope
ratio
nal o
bste
tric
units
ava
ilabl
e fo
r tra
nspo
rting
obs
tetri
c ca
ses
per 1
0,00
0 po
pula
tion
Cou
nt o
nly
oper
atio
nal o
bste
tric
units
. Exc
lude
nor
mal
ope
ratio
nal
ambu
lanc
es%
Mon
thly
Inpu
t
EMS
P1 c
all r
espo
nse
unde
r 60
min
utes
rate
EMS
P1 re
spon
se
unde
r 60
min
utes
EMS
P1 c
alls
tota
lPr
opor
tion
of a
ll P1
cal
ls w
ith re
spon
se ti
mes
und
er
60 m
inut
esM
onito
rs c
ompl
ianc
e w
ith th
e no
rm fo
r all
criti
cally
ill o
r inj
ured
clie
nts
to
rece
ive
EMS
with
in 6
0 m
inut
es. T
his
incl
udes
P1
urba
n re
spon
ses
unde
r 15
min
utes
and
P1
rura
l cal
ls u
nder
40
min
utes
. Low
rate
s in
dica
te in
adeq
uate
re
sour
ces
%M
onth
lyO
utpu
t
EMS
P1 ru
ral r
espo
nse
unde
r 40
min
utes
rate
EMS
P1 ru
ral
resp
onse
und
er 4
0 m
inut
es
EMS
P1 ru
ral c
alls
Prop
ortio
n P1
cal
ls in
rura
l loc
atio
ns w
ith re
spon
se
times
und
er 4
0 m
inut
esM
onito
rs c
ompl
ianc
e w
ith th
e no
rm fo
r crit
ical
ly il
l or i
njur
ed c
lient
s to
rece
ive
EMS
with
in 4
0 m
inut
es in
rura
l are
as%
Mon
thly
Out
put
EMS
P1 u
rban
resp
onse
un
der 1
5 m
inut
es ra
teEM
S P1
urb
an
resp
onse
und
er 1
5 m
inut
es
EMS
P1 u
rban
cal
lsPr
opor
tion
P1 c
alls
in u
rban
loca
tions
with
resp
onse
tim
es u
nder
15
min
utes
Mon
itors
com
plia
nce
with
the
norm
for c
ritic
ally
ill o
r inj
ured
clie
nts
to re
ceiv
e EM
S w
ithin
15
min
utes
in u
rban
are
as%
Mon
thly
Out
put
PHC WBOT
OH
H re
gist
ratio
n vi
sit
cove
rage
(ann
ualis
ed)
OH
H re
gist
ratio
n vi
sit
OH
H in
pop
ulat
ion
Prop
ortio
n of
hou
seho
lds
in th
e ta
rget
war
ds
cove
red
by W
ard
Base
d O
utre
ach
Team
sM
onito
rs im
plem
enta
tion
of th
e PH
C re
-eng
inee
ring
stra
tegy
%M
onth
lyO
utpu
t
OH
H fo
llow
-up
visi
t rat
eO
HH
follo
w-u
p vi
sit
OH
H v
isits
tota
lO
utre
ach
hous
ehol
d fo
llow
-up
visi
ts a
s pr
opor
tion
of a
ll ho
useh
olds
vis
its b
y W
ard
Base
d O
utre
ach
Team
s
Mon
itors
follo
w-u
p vi
sits
to re
gist
ered
hou
seho
lds.
Com
mun
ity h
ealth
w
orke
rs a
re e
xpec
ted
to v
isit
each
hou
seho
ld fo
r fol
low
up
supp
ort m
onth
ly.
At ri
sk h
ouse
hold
s ne
ed to
be
visi
ted
mor
e fre
quen
tly
%M
onth
lyPr
oces
s/Ac
tivity
OH
H s
uper
vise
d vi
sit
rate
OH
H s
uper
vise
d vi
sit
OH
H v
isits
tota
lO
utre
ach
hous
ehol
d (O
HH
) vis
its a
ccom
pani
ed b
y a
supe
rvis
or a
s pr
opor
tion
of a
ll ho
useh
old
visi
ts b
y W
ard
Base
d O
utre
ach
Team
s
Mon
itors
sup
ervi
sion
of w
ard
base
d co
mm
unity
Hea
lth w
orke
rs%
Mon
thly
Proc
ess/
Activ
ity
OH
H w
ith p
regn
ancy
ca
re ra
teO
HH
with
pre
gnan
cy
care
OH
H v
isits
tota
lO
utre
ach
hous
ehol
ds (O
HH
) vis
its d
urin
g w
hich
an
tena
tal c
are
was
pro
vide
d to
pre
gnan
t wom
en a
s pr
opor
tion
of h
ouse
hold
s vi
site
d by
the
War
d Ba
sed
Out
reac
h Te
am
Mon
itors
hou
seho
lds
whe
re c
are
was
pro
vide
d to
pre
gnan
t wom
en,
irres
pect
ive
of th
e nu
mbe
r of p
regn
ant w
omen
car
ed fo
r%
Mon
thly
Out
put
OH
H w
ith p
ostn
atal
ca
re ra
teO
HH
with
pos
tnat
al
care
OH
H v
isits
tota
lO
utre
ach
hous
ehol
ds (O
HH
) with
pos
tnat
al c
are
prov
ided
to a
mot
her a
nd/o
r neo
nate
with
in 6
day
s af
ter d
eliv
ery
as p
ropo
rtion
of h
ouse
hold
s vi
site
d by
th
e W
ard
Base
d O
utre
ach
Team
Mon
itors
hou
seho
lds
whe
re c
are
was
pro
vide
d to
pos
tnat
al w
omen
, irr
espe
ctiv
e of
the
num
ber o
f pos
tnat
al w
omen
car
ed fo
r%
Mon
thly
Out
put

304 SAHR 2012/13
Indi
cato
r Nam
eN
umer
ator
Den
omin
ator
Def
initi
onU
se a
nd c
onte
xtTy
peFr
eqLe
vel
Key
repo
rts
OH
H w
ith c
hild
und
er 5
ye
ars
care
rate
OH
H w
ith c
hild
und
er
5 ca
reO
HH
vis
its to
tal
Out
reac
h ho
useh
olds
(OH
H) w
ith b
asic
hea
lth c
are
prov
ided
to c
hild
ren
unde
r 5 y
ears
as
prop
ortio
n of
ho
useh
olds
vis
ited
by th
e W
ard
Base
d O
utre
ach
Team
Mon
itors
hou
seho
lds
whe
re c
are
was
pro
vide
d to
chi
ldre
n un
der 5
, irr
espe
ctiv
e of
the
num
ber o
f chi
ldre
n un
der 5
car
ed fo
r%
Mon
thly
Out
put
OH
H w
ith a
dher
ence
su
ppor
t rat
eO
HH
with
adh
eren
ce
supp
ort
OH
H v
isits
tota
lO
utre
ach
hous
ehol
ds (O
HH
) with
adh
eren
ce
supp
ort p
rovi
ded
as p
ropo
rtion
of h
ouse
hold
s vi
site
d by
the
War
d Ba
sed
Out
reac
h Te
am
Mon
itors
hou
seho
lds
whe
re a
dher
ance
sup
port
was
pro
vide
d, ir
resp
ectiv
e of
th
e nu
mbe
r of c
lient
s w
ho re
ceiv
ed s
uppo
rt%
Mon
thly
Out
put
OH
H w
ith h
ome
base
d ca
re ra
teO
HH
with
hom
e ba
sed
care
OH
H v
isits
tota
lO
utre
ach
hous
ehol
ds (O
HH
) with
hom
e ba
sed
supp
ort p
rovi
ded
as p
ropo
rtion
of h
ouse
hold
s vi
site
d by
the
War
d Ba
sed
Out
reac
h Te
am
Mon
itors
hou
seho
lds
whe
re h
omeb
ased
car
e w
as p
rovi
ded,
irre
spec
tive
of
the
num
ber o
f clie
nts
who
rece
ived
hom
ebas
ed c
are
%M
onth
lyO
utpu
t
OH
H b
ack-
refe
rral
fo
rms
rate
OH
H c
lient
with
bac
k-re
ferr
al fo
rmO
HH
clie
nt re
ferre
d to
faci
lity
Out
reac
h ho
useh
olds
(OH
H) b
ack
refe
rral
form
s re
ceiv
ed fr
om P
HC
faci
litie
s as
pro
porti
on o
f all
hous
ehol
ds w
ith re
ferr
als
to P
HC
faci
lity
done
by
the
War
d Ba
sed
Out
reac
h Te
am
Mon
itors
bac
k-re
ferr
als
fron
PHC
faci
litie
s. E
ach
back
-ref
erra
l for
m is
co
unte
d%
Mon
thly
Proc
ess/
Activ
ity
OH
H c
lient
refe
rred
to
faci
lity
rate
OH
H c
lient
refe
r fa
cilit
yO
HH
hea
dcou
nt to
tal
Prop
ortio
n of
out
reac
h ho
useh
old
clie
nts
refe
rred
to
heal
th fa
cilit
ies
Mon
itors
refe
rral
by
Com
mun
ity H
ealth
Wor
kers
(CH
W) t
o he
alth
faci
litie
s.
Indi
vidu
al c
lient
s re
ferre
d ar
e co
unte
d%
Mon
thly
Proc
ess/
Activ
ityN
SDA
; NSP
; W
HO
OH
H c
lient
refe
rred
to
soci
al s
ervi
ces
rate
OH
H c
lient
refe
rred
to s
ocia
l ser
vice
sO
HH
hea
dcou
nt to
tal
Out
reac
h ho
useh
olds
(OH
H) c
lient
s re
ferre
d to
so
cial
ser
vice
s as
pro
porti
on o
f the
tota
l num
ber o
f cl
ient
s su
ppor
ted
(tota
l hea
dcou
nt) d
urin
g ou
treac
h te
am v
isits
Mon
itors
refe
rral
by
Com
mun
ity H
ealth
Wor
kers
(CH
W) t
o so
cial
ser
vice
s.
Indi
vidu
al c
lient
s re
ferre
d ar
e co
unte
d%
Mon
thly
Proc
ess/
Activ
ityN
SDA
; NSP
; W
HO
OH
H c
lient
refe
rred
to
hom
e ba
sed
care
rate
OH
H c
lient
refe
rred
to h
ome
base
d ca
reO
HH
hea
dcou
nt to
tal
Out
reac
h ho
useh
olds
(OH
H) c
lient
s re
ferre
d to
ho
me
base
d ca
re a
s pr
opor
tion
of th
e to
tal n
umbe
r of
clie
nts
supp
orte
d (to
tal h
eadc
ount
) dur
ing
outre
ach
team
vis
its
Mon
itors
refe
rral
by
Com
mun
ity H
ealth
Wor
kers
(CH
W) t
o ho
me
nase
d ca
re.
Indi
vidu
al c
lient
s re
ferre
d ar
e co
unte
d%
Mon
thly
Proc
ess/
Activ
ityN
SDA
; NSP
; W
HO
OH
H re
gist
ratio
n vi
sit
rate
OH
H re
gist
ratio
n vi
sit
OH
H a
lloca
ted
to
team
Out
reac
h ho
useh
old
(OH
H) r
egis
tratio
n vi
sits
as
prop
ortio
n ho
useh
olds
allo
cate
d to
War
d Ba
sed
Out
reac
h Te
ams
Mon
itors
hou
seho
ld re
gist
ratio
n. E
ach
hous
ehol
d al
loca
ted
to a
com
mun
ity
heal
th w
orke
r mus
t be
regi
ster
ed d
urin
g th
e fir
st o
utre
ach
hous
ehol
d vi
sit,
usin
g th
e st
anda
rdis
ed H
ouse
hold
Reg
istra
tion
form
%M
onth
lyO
utpu
t
OH
H h
eadc
ount
und
er
5 ye
ars
cove
rage
(a
nnua
lised
)
OH
H h
eadc
ount
un
der 5
yea
rsPo
pula
tion
unde
r 5
year
sPr
opor
tion
of c
hild
ren
unde
r 5 y
ears
in p
opul
atio
n w
ho re
ceiv
ed c
are
durin
g W
ard
Base
d O
utre
ach
Team
vis
its
Mon
itors
pro
porti
on o
f pop
ulat
ion
unde
r 5 y
ears
atte
nded
to d
urin
g ho
useh
old
visi
ts%
Mon
thly
Out
put
OH
H h
eadc
ount
5 y
ears
an
d ol
der c
over
age
(ann
ualis
ed)
OH
H h
eadc
ount
5
year
s an
d ol
der
Popu
latio
n 5
year
s an
d ol
der
Prop
ortio
n of
peo
ple
5 ye
ars
and
olde
r in
the
popu
latio
n w
ho re
ceiv
ed c
are
durin
g W
ard
Base
d O
utre
ach
Team
vis
its
Mon
itors
pro
porti
on o
f pop
ulat
ion
5 ye
ars
and
olde
r atte
nded
to d
urin
g ho
useh
old
visi
ts%
Mon
thly
Out
put
Environmental Health
EH D
omes
tic w
ater
sa
mpl
e co
mpl
ianc
e ra
teEH
Dom
estic
wat
er
sam
ples
com
plia
ntEH
Dom
estic
wat
er
sam
ples
col
lect
edPr
opor
tion
of ro
utin
e do
mes
tic w
ater
sam
ples
take
n fo
r a W
ater
Ser
vice
s Au
thor
ity a
nd N
on W
ater
Se
rvic
es A
utho
rity
that
con
form
s to
the
stan
dard
s se
t out
in S
ANS
241
Mon
itors
dom
estic
wat
er s
afet
y%
Mon
thly
Proc
ess/
Activ
ity
EH F
lour
mill
s co
mpl
ianc
e ra
teEH
Mill
ing
esta
blis
hmen
t co
mpl
iant
EH M
illin
g es
tabl
ishm
ents
in
spec
ted
Prop
ortio
n of
ope
ratio
nal f
lour
mill
ing
esta
blis
hmen
ts th
at w
ere
com
plia
nt w
ith re
gula
tions
Mon
itors
flou
r mill
ing
esta
blis
hmen
t com
plia
nce
%M
onth
lyPr
oces
s/Ac
tivity
EH F
ood
sam
ple
bact
erio
logi
cal
com
plia
nce
rate
EH F
ood
sam
ple
bact
erio
logi
cally
co
mpl
iant
EH F
ood
sam
ple
bact
erio
logi
cal
anal
ysis
Prop
ortio
n fo
od s
ampl
es b
acte
riolo
gica
lly te
sted
th
at c
ompl
ied
to th
e Fo
odst
uffs
, Cos
met
ics
and
Dis
infe
ctan
ts A
ct, A
ct 5
4 0f
197
2
Mon
itors
food
saf
ety.
Incl
udes
impo
rted
food
stu
ffs%
Mon
thly
Proc
ess/
Activ
ity
EH F
ood
sam
ple
chem
ical
com
plia
nce
rate
EH F
ood
sam
ples
ch
emic
ally
com
plia
ntEH
Foo
d sa
mpl
es
chem
ical
ana
lysi
sPr
opor
tion
food
sam
ples
che
mic
ally
test
ed th
at
com
plie
d to
the
Food
stuf
fs, C
osm
etic
s an
d D
isin
fect
ants
Act
, Act
54
0f 1
972
Mon
itors
food
saf
ety.
Incl
udes
impo
rted
food
stu
ffs%
Mon
thly
Proc
ess/
Activ
ity
EH H
azar
dous
su
bsta
nce
deal
ers
com
plia
nce
rate
EH H
azar
dous
su
bsta
nce
deal
er
com
plia
nt
EH H
azar
dous
su
bsta
nce
deal
er
insp
ecte
d
Prop
ortio
n H
azar
dous
Sub
stan
ces
deal
ers
that
co
mpl
ied
with
the
regu
latio
ns fo
r haz
ardo
us
subs
tanc
es
Mon
itors
haz
ardo
us s
ubst
ance
dea
ler c
ompl
ianc
e%
Mon
thly
Proc
ess/
Activ
ity

Health and Related Indicators 17
SAHR 2012/13 305
Indi
cato
r Nam
eN
umer
ator
Den
omin
ator
Def
initi
onU
se a
nd c
onte
xtTy
peFr
eqLe
vel
Key
repo
rts
EH H
ealth
car
e w
aste
ge
nera
tor c
ompl
ianc
e ra
te
EH H
ealth
car
e w
aste
ge
nera
tor c
ompl
iant
EH H
ealth
car
e w
aste
ge
nera
tors
insp
ecte
dPr
opor
tion
insp
ecte
d he
alth
car
e w
aste
gen
erat
ors
that
com
plie
d w
ith m
inim
um s
tand
ards
acc
ordi
ng to
SA
NS
1024
8
Mon
itors
hea
lth c
are
was
te g
ener
ator
com
plia
nce
%M
onth
lyPr
oces
s/Ac
tivity
EH In
tern
atio
nal
conv
eyan
ce in
spec
tion
rate
EH In
tern
atio
nal
conv
eyan
ce
insp
ecte
d at
firs
t po
int o
f ent
ry
EH In
tern
atio
nal
conv
eyan
ce a
rriv
als
at fi
rst p
oint
of e
ntry
Prop
ortio
n in
tern
atio
nal c
onve
yanc
e at
arr
ival
in
spec
ted
for c
ompl
ianc
e to
Inte
rnat
iona
l Hea
lth
stan
dard
s
Mon
itors
inte
rnat
iona
l con
veya
nce
insp
ectio
n%
Mon
thly
Proc
ess/
Activ
ity
EH In
tern
atio
nal
impo
rted
cons
ignm
ent
com
plia
nce
rate
EH In
tern
atio
nal
impo
rted
cons
ignm
ent
insp
ecte
d
EH In
tern
atio
nal
impo
rted
cons
ignm
ent a
rriv
als
at fi
rst p
oint
of e
ntry
Prop
ortio
n in
tern
atio
nal i
mpo
rted
cons
ignm
ents
th
at c
ompl
ied
to In
tern
atio
nal H
ealth
sta
ndar
ds,
com
plia
nt in
term
s of
the
Nat
iona
l Por
t Hea
lth
Stan
dard
Ope
ratin
g Pr
oced
ures
(rev
ised
SO
Ps) a
nd
Inte
rnat
iona
l Hea
lth R
egul
atio
ns (I
HR
, 200
5)
Mon
itors
inte
rnat
iona
l im
porte
d co
nsig
nmen
t ins
pect
ion
%M
onth
lyPr
oces
s/Ac
tivity
EH N
otifi
able
dis
ease
in
vest
igat
ion
rate
EH N
otifi
able
m
edic
al c
ondi
tions
in
vest
igat
ed n
ew
EH N
otifi
able
med
ical
co
nditi
ons
repo
rted
to D
istri
ct H
ealth
O
ffice
Prop
ortio
n N
otifi
able
med
ical
con
ditio
ns re
porte
d to
th
e D
istri
ct H
ealth
Offi
ce th
at w
ere
inve
stig
ated
by
EHP
offic
ers
Mon
itors
Not
ifiab
le m
edic
al c
ondi
tion
insp
ectio
ns b
y EH
P of
ficer
s%
Mon
thly
Proc
ess/
Activ
ity
EH P
rem
ises
toba
cco
com
plia
nce
rate
EH P
rem
ises
toba
cco
legi
slat
ion
com
plia
ntEH
Pre
mis
es to
bacc
o le
gisl
atio
n in
spec
ted
Prop
ortio
n in
spec
ted
prem
ises
that
wer
e co
mpl
iant
w
ith T
obac
co A
ctM
onito
rs p
rem
ises
com
plia
nt w
ith T
obac
co A
ct%
Mon
thly
Proc
ess/
Activ
ity
EH R
epor
ted
Food
po
ison
ing
inci
denc
e (a
nnua
lised
)
EH F
ood
pois
onin
g re
porte
d ne
wPo
pula
tion
tota
lN
ew c
ases
of f
ood
pois
onin
g re
porte
d to
EH
S pe
r 10
0 00
0 po
pula
tion
Mon
itors
food
poi
soni
ng tr
ends
per1
00K
Mon
thly
Out
com
e
EH R
epor
ted
lead
po
ison
ing
inci
denc
e (a
nnua
lised
)
EH L
ead
pois
onin
g re
porte
d ne
wPo
pula
tion
tota
lN
ew c
ases
of l
ead
pois
onin
g re
porte
d pe
r 100
000
po
pula
tion
Mon
itors
che
mic
al p
oiso
ning
tren
dspe
r100
KM
onth
lyO
utco
me
EH R
epor
ted
mer
cury
po
ison
ing
inci
denc
e (a
nnua
lised
)
EH M
ercu
ry
pois
onin
g re
porte
d ne
w
Popu
latio
n to
tal
New
cas
es o
f mer
cury
poi
soni
ng re
porte
d pe
r 100
00
0 po
pula
tion
Mon
itors
che
mic
al p
oiso
ning
tren
dspe
r100
KM
onth
lyO
utco
me
EH R
epor
ted
pest
icid
e po
ison
ing
inci
denc
e (a
nnua
lised
)
EH P
estic
ide
pois
onin
g re
porte
d ne
w
Popu
latio
n to
tal
New
cas
es o
f pes
ticid
e po
ison
ing
repo
rted
per 1
00
000
popu
latio
nM
onito
rs c
hem
ical
poi
soni
ng tr
ends
per1
00K
Mon
thly
Out
com
e
ART baseline
Adul
t mal
e st
art A
RT
rate
Adul
t mal
e st
arte
d AR
TAd
ult s
tarte
d on
AR
TPr
opor
tion
of a
dult
mal
es w
ho s
tarte
d AR
T.
Trea
tmen
t exp
erie
nced
clie
nts
are
excl
uded
This
indi
cato
r onl
y re
fers
to A
RT
naïv
e pa
tient
s st
arte
d in
this
faci
lity
and
does
not
trac
k Tr
ansf
ers
in o
r Tre
atm
ent e
xper
ienc
ed p
atie
nts
%Q
uarte
rlyO
utpu
tD
OR
A; N
SP;
GAR
; UA
; MD
G
Chi
ld u
nder
1 y
ear s
tart
ART
rate
Chi
ld u
nder
1 y
ear
star
ted
ART
Chi
ld u
nder
15
year
s st
arte
d AR
TPr
opor
tion
of c
hild
ren
unde
r 1 y
ear w
ho s
tarte
d AR
T. T
reat
men
t exp
erie
nced
clie
nts
are
excl
uded
This
indi
cato
r onl
y re
fers
to A
RT
naïv
e pa
tient
s st
arte
d in
this
faci
lity
and
does
not
trac
k Tr
ansf
ers
in o
r Tre
atm
ent e
xper
ienc
ed p
atie
nts
%Q
uarte
rlyO
utpu
tD
OR
A; N
SP;
GAR
; UA
Chi
ld 1
to u
nder
5 y
ears
st
art A
RT
rate
Chi
ld 1
-<5
year
s st
arte
d AR
TC
hild
und
er 1
5 ye
ars
star
ted
ART
Prop
ortio
n of
chi
ldre
n 1-
5 ye
ars
who
sta
rted
ART.
Tr
eatm
ent e
xper
ienc
ed c
lient
s ar
e ex
clud
edTh
is in
dica
tor o
nly
refe
rs to
AR
T na
ïve
patie
nts
star
ted
in th
is fa
cilit
y an
d do
es n
ot tr
ack
Tran
sfer
s in
or T
reat
men
t exp
erie
nced
pat
ient
s%
Qua
rterly
Out
put
DO
RA
; NSP
; G
AR; U
A
Chi
ld 5
to u
nder
15
year
s st
art A
RT
rate
Chi
ld 5
-<15
yea
rs
star
ted
ART
Chi
ld u
nder
15
year
s st
arte
d AR
TPr
opor
tion
of c
hild
ren
1-5
year
s w
ho s
tarte
d AR
T.
Trea
tmen
t exp
erie
nced
clie
nts
are
excl
uded
This
indi
cato
r onl
y re
fers
to A
RT
naïv
e pa
tient
s st
arte
d in
this
faci
lity
and
does
not
trac
k Tr
ansf
ers
in o
r Tre
atm
ent e
xper
ienc
ed p
atie
nts
%Q
uarte
rlyO
utpu
tD
OR
A; N
SP;
GAR
; UA
Adul
t scr
eene
d fo
r TB
at
ART
star
t rat
eAd
ult n
ot o
n TB
tre
atm
ent s
cree
ned
for T
B at
sta
rt of
AR
T
Adul
t sta
rted
on A
RT
min
us a
dults
on
TB
treat
men
t at s
tart
of A
RT
Prop
ortio
n of
adu
lts n
ot o
n Tu
berc
ulos
is (T
B)
treat
men
t who
wer
e sc
reen
ed fo
r Tub
ercu
losi
s at
st
art o
f AR
T
This
indi
cato
r onl
y re
fers
to A
RT
naïv
e pa
tient
s st
arte
d in
this
faci
lity
and
does
not
trac
k Tr
ansf
ers
in o
r Tre
atm
ent e
xper
ienc
ed p
atie
nts
%Q
uarte
rlyO
utpu
tD
OR
A; N
SP;
GAR
; UA
Chi
ld u
nder
15
year
s sc
reen
ed fo
r TB
at A
RT
star
t rat
e
Chi
ld u
nder
15
year
s no
t on
TB tr
eatm
ent
scre
ened
for T
B at
st
art o
f AR
T
Chi
ld u
nder
15
year
s st
arte
d on
AR
T m
inus
chi
ldre
n on
TB
trea
tmen
t at s
tart
of A
RT
Prop
ortio
n of
chi
ldre
n un
der 1
5 ye
ars
not o
n Tu
berc
ulos
is (T
B) t
reat
men
t who
wer
e sc
reen
ed fo
r Tu
berc
ulos
is a
t sta
rt of
AR
T
This
indi
cato
r onl
y re
fers
to A
RT
naïv
e pa
tient
s st
arte
d in
this
faci
lity
and
does
not
trac
k Tr
ansf
ers
in o
r Tre
atm
ent e
xper
ienc
ed p
atie
nts
%Q
uarte
rlyO
utpu
tD
OR
A; N
SP;
GAR
; UA
Adul
t on
TB tr
eatm
ent a
t AR
T st
art r
ate
Adul
t on
TB
treat
men
t at s
tart
of A
RT
Adul
t sta
rted
ART
Prop
ortio
n of
adu
lts w
ho w
ere
on T
uber
culo
sis
(TB
) tre
atm
ent a
t sta
rt of
AR
TTh
is in
dica
tor o
nly
refe
rs to
AR
T na
ïve
patie
nts
star
ted
in th
is fa
cilit
y an
d do
es n
ot tr
ack
Tran
sfer
s in
or T
reat
men
t exp
erie
nced
pat
ient
s%
Qua
rterly
Out
put
DO
RA
; NSP
; G
AR; U
A

306 SAHR 2012/13
Indi
cato
r Nam
eN
umer
ator
Den
omin
ator
Def
initi
onU
se a
nd c
onte
xtTy
peFr
eqLe
vel
Key
repo
rts
Chi
ld o
n TB
trea
tmen
t at
ART
star
t rat
eC
hild
und
er 1
5 ye
ars
on T
B tre
atm
ent a
t st
art o
f AR
T
Chi
ld u
nder
15
year
s st
arte
d AR
TPr
opor
tion
of c
hild
ren
who
wer
e on
TB
treat
men
t at
star
t of A
RT
This
indi
cato
r onl
y re
fers
to A
RT
naïv
e pa
tient
s st
arte
d in
this
faci
lity
and
does
not
trac
k Tr
ansf
ers
in o
r Tre
atm
ent e
xper
ienc
ed p
atie
nts
%Q
uarte
rlyO
utpu
tD
OR
A; N
SP;
GAR
; UA
Adul
t on
IPT
at A
RT
star
t rat
eAd
ult o
n IN
H
prev
entio
n th
erap
y (IP
T) a
t sta
rt of
AR
T
Adul
t sta
rted
ART
Prop
ortio
n of
adu
lts w
ho w
ere
on IN
H p
reve
ntio
n th
erap
y at
sta
rt of
AR
TTh
is in
dica
tor o
nly
refe
rs to
AR
T na
ïve
patie
nts
star
ted
in th
is fa
cilit
y an
d do
es n
ot tr
ack
Tran
sfer
s in
or T
reat
men
t exp
erie
nced
pat
ient
s%
Qua
rterly
Out
put
DO
RA
; NSP
; G
AR; U
A
Chi
ld o
n IP
T at
AR
T st
art r
ate
Chi
ld u
nder
15
year
s on
INH
pre
vent
ion
ther
apy
(IPT)
at s
tart
of A
RT
Chi
ld u
nder
15
year
s st
arte
d AR
TPr
opor
tion
of c
hild
ren
who
wer
e on
INH
pre
vent
ion
ther
apy
at s
tart
of A
RT
This
indi
cato
r onl
y re
fers
to A
RT
naïv
e pa
tient
s st
arte
d in
this
faci
lity
and
does
not
trac
k Tr
ansf
ers
in o
r Tre
atm
ent e
xper
ienc
ed p
atie
nts
%Q
uarte
rlyO
utpu
tD
OR
A; N
SP;
GAR
; UA
Adul
t on
CPT
at A
RT
star
t rat
eAd
ult o
n C
o-tri
mox
azol
e pr
even
tion
ther
apy
(CPT
) at s
tart
of A
RT
Adul
t sta
rted
ART
Prop
ortio
n of
adu
lts w
ho w
ere
on C
o-tri
mox
azol
e pr
even
tion
ther
apy
at s
tart
of A
RT
This
indi
cato
r onl
y re
fers
to A
RT
naïv
e pa
tient
s st
arte
d in
this
faci
lity
and
does
not
trac
k Tr
ansf
ers
in o
r Tre
atm
ent e
xper
ienc
ed p
atie
nts
%Q
uarte
rlyO
utpu
tD
OR
A; N
SP;
GAR
; UA
Chi
ld u
nder
15
year
s on
C
PT a
t AR
T st
art r
ate
Chi
ld u
nder
15
year
s on
Co-
trim
oxaz
ole
prev
entio
n th
erap
y (C
PT) a
t sta
rt of
AR
T
Chi
ld u
nder
15
year
s st
arte
d AR
TPr
opor
tion
of c
hild
ren
who
wer
e on
Co-
trim
oxaz
ole
prev
entio
n th
erap
y at
sta
rt of
AR
TTh
is in
dica
tor o
nly
refe
rs to
AR
T na
ïve
patie
nts
star
ted
in th
is fa
cilit
y an
d do
es n
ot tr
ack
Tran
sfer
s in
or T
reat
men
t exp
erie
nced
pat
ient
s%
Qua
rterly
Out
put
DO
RA
; NSP
; G
AR; U
A
Preg
nant
fem
ale
at A
RT
star
t rat
ePr
egna
nt fe
mal
e at
st
art o
f AR
TAd
ult f
emal
e st
arte
d AR
TPr
opor
tion
of a
dult
fem
ales
who
wer
e pr
egna
nt a
t st
art o
f AR
TTh
is in
dica
tor o
nly
refe
rs to
AR
T na
ïve
patie
nts
star
ted
in th
is fa
cilit
y an
d do
es n
ot tr
ack
Tran
sfer
s in
or T
reat
men
t exp
erie
nced
pat
ient
s%
Qua
rterly
Out
put
DO
RA
; NSP
; G
AR; U
A
Adul
t CD
4 do
ne a
t AR
T st
art r
ate
Adul
t CD
4 do
ne a
t st
art o
f AR
TAd
ult n
aïve
sta
rted
ART
Prop
ortio
n of
adu
lts w
ho h
ad a
bas
elin
e C
D4
coun
t (B
CD
D) d
one
befo
re th
ey s
tarte
d on
AR
TTh
is in
dica
tor o
nly
refe
rs to
AR
T na
ïve
patie
nts
star
ted
in th
is fa
cilit
y an
d do
es n
ot tr
ack
Tran
sfer
s in
or T
reat
men
t exp
erie
nced
pat
ient
s%
Qua
rterly
Out
put
DO
RA
; NSP
; G
AR; U
A
Chi
ld u
nder
15
year
s C
D4
done
at A
RT
star
t ra
te
Chi
ld u
nder
15
year
s C
D4
done
at s
tart
of A
RT
Chi
ld u
nder
15
year
s C
D4
done
at s
tart
of A
RT
Prop
ortio
n of
chi
ldre
n un
der 1
5 ye
ars
who
had
a
base
line
CD
4 co
unt (
BCD
D) d
one
befo
re th
ey
star
ted
on A
RT
This
indi
cato
r onl
y re
fers
to A
RT
naïv
e pa
tient
s st
arte
d in
this
faci
lity
and
does
not
trac
k Tr
ansf
ers
in o
r Tre
atm
ent e
xper
ienc
ed p
atie
nts
%Q
uarte
rlyO
utpu
tD
OR
A; N
SP;
GAR
; UA
Adul
t CD
4 be
low
100
cl
s/µl
at A
RT
star
t rat
eAd
ult C
D4
belo
w 1
00
cls/
µl a
t sta
rt of
AR
TAd
ult C
D4
done
at
star
t of A
RT
Prop
ortio
n of
adu
lts w
ith C
D4
coun
t bel
ow 1
00
cells
/µl a
t bas
elin
e. S
how
s th
e pr
opor
tion
of c
lient
s st
artin
g AR
T w
ho a
re s
ever
ely
imm
unol
ogic
ally
co
mpr
omis
ed. I
f the
val
ue c
hang
es o
ver t
ime
the
prog
ram
me
will
be a
ble
to a
sses
s th
e im
pact
of t
he
inte
rven
tion
This
indi
cato
r onl
y re
fers
to A
RT
naïv
e pa
tient
s st
arte
d in
this
faci
lity
and
does
not
trac
k Tr
ansf
ers
in o
r Tre
atm
ent e
xper
ienc
ed p
atie
nts
%Q
uarte
rlyO
utpu
tD
OR
A; N
SP;
GAR
; UA
Chi
ld u
nder
15
year
s C
D4
TLC
bel
ow 1
5pc
or 1
00 c
ls/µ
l at A
RT
star
t rat
e
Chi
ld u
nder
15
year
s C
D4
TLC
bel
ow 1
5pc
or 1
00 c
ls/µ
l at s
tart
of A
RT
Chi
ld u
nder
15
year
s C
D4
done
at s
tart
of A
RT
Prop
ortio
n of
chi
ldre
n un
der 5
yea
rs w
ith a
CD
4 To
tal L
ymph
ocyt
e C
ount
(TLC
) bel
ow 1
5 pe
rcen
t (p
c) a
nd c
hild
ren
5 to
15
year
s w
ith a
CD
4 co
unt o
f le
ss th
an 1
00 c
ells
/µl a
t the
tim
e of
sta
rting
AR
T.
This
sho
ws
the
prop
ortio
n of
clie
nts
star
ting
ART
who
are
sev
erel
y im
mun
olog
ical
ly c
ompr
omis
ed. I
f th
e va
lue
chan
ges
over
tim
e th
e pr
ogra
mm
e w
ill be
ab
le to
ass
ess
the
impa
ct o
f the
inte
rven
tion
This
indi
cato
r onl
y re
fers
to A
RT
naïv
e pa
tient
s st
arte
d in
this
faci
lity
and
does
not
trac
k Tr
ansf
ers
in o
r Tre
atm
ent e
xper
ienc
ed p
atie
nts
%Q
uarte
rlyO
utpu
tD
OR
A; N
SP;
GAR
; UA
Adul
t CD
4 10
0 to
199
cl
s/µl
at A
RT
star
t rat
eAd
ult C
D4
100
to 1
99
cls/
µl a
t sta
rt of
AR
TAd
ult C
D4
done
at
star
t of A
RT
Prop
ortio
n of
adu
lts w
ith C
D4
betw
een
100-
199
cells
/µl a
t bas
elin
eTh
is in
dica
tor o
nly
refe
rs to
AR
T na
ïve
patie
nts
star
ted
in th
is fa
cilit
y an
d do
es n
ot tr
ack
Tran
sfer
s in
or T
reat
men
t exp
erie
nced
pat
ient
s%
Qua
rterly
Out
put
DO
RA
; NSP
; G
AR; U
A
Chi
ld u
nder
15
year
s C
D4
TLC
15-
19pc
or
100-
199
cls/
µl a
t AR
T st
art r
ate
Chi
ld u
nder
15
year
s C
D4
TLC
15-
19pc
or
100-
199
cls/
µl a
t sta
rt of
AR
T
Chi
ld u
nder
15
year
s C
D4
done
at s
tart
of A
RT
Prop
ortio
n of
chi
ldre
n un
der 5
yea
rs w
ith a
CD
4 To
tal L
ymph
ocyt
e C
ount
(TLC
) bet
wee
n 15
and
19
perc
ent (
pc) a
nd c
hild
ren
5 to
15
year
s w
ith a
CD
4 co
unt b
etw
een
100
and
199
cells
/µl a
t the
tim
e of
st
artin
g AR
T. T
his
show
s th
e pr
opor
tion
of c
lient
s st
artin
g AR
T w
ho a
re s
ever
ely
imm
unol
ogic
ally
co
mpr
omis
ed. I
f the
val
ue c
hang
es o
ver t
ime
the
prog
ram
me
will
be a
ble
to a
sses
s th
e im
pact
of t
he
inte
rven
tion
This
indi
cato
r onl
y re
fers
to A
RT
naïv
e pa
tient
s st
arte
d in
this
faci
lity
and
does
not
trac
k Tr
ansf
ers
in o
r Tre
atm
ent e
xper
ienc
ed p
atie
nts
%Q
uarte
rlyO
utpu
tD
OR
A; N
SP;
GAR
; UA
Adul
t CD
4 20
0 to
350
cl
s/µl
at A
RT
star
t rat
eAd
ult C
D4
200
to 3
50
cls/
µl a
t sta
rt of
AR
TAd
ult C
D4
done
at
star
t of A
RT
Prop
ortio
n of
adu
lts w
ith C
D4
betw
een
200-
350
cells
/µl a
t bas
elin
eTh
is in
dica
tor o
nly
refe
rs to
AR
T na
ïve
patie
nts
star
ted
in th
is fa
cilit
y an
d do
es n
ot tr
ack
Tran
sfer
s in
or T
reat
men
t exp
erie
nced
pat
ient
s%
Qua
rterly
Out
put
DO
RA
; NSP
; G
AR; U
A

Health and Related Indicators 17
SAHR 2012/13 307
Indi
cato
r Nam
eN
umer
ator
Den
omin
ator
Def
initi
onU
se a
nd c
onte
xtTy
peFr
eqLe
vel
Key
repo
rts
Chi
ld u
nder
15
year
s C
D4
TLC
20-
25pc
or
100-
199
cls/
µl a
t AR
T st
art r
ate
Chi
ld u
nder
15
year
s C
D4
TLC
20-
25pc
or
200
-350
cls
/µl a
t st
art o
f AR
T
Chi
ld u
nder
15
year
s C
D4
done
at s
tart
of A
RT
Prop
ortio
n of
chi
ldre
n un
der 5
yea
rs w
ith a
CD
4 To
tal L
ymph
ocyt
e C
ount
(TLC
) bet
wee
n 20
and
25
perc
ent (
pc) a
nd c
hild
ren
5 to
15
year
s w
ith a
CD
4 co
unt b
etw
een
100
and
199
cells
/µl a
t the
tim
e of
st
artin
g AR
T. T
his
show
s th
e pr
opor
tion
of c
lient
s st
artin
g AR
T w
ho a
re s
ever
ely
imm
unol
ogic
ally
co
mpr
omis
ed. I
f the
val
ue c
hang
es o
ver t
ime
the
prog
ram
me
will
be a
ble
to a
sses
s th
e im
pact
of t
he
inte
rven
tion
This
indi
cato
r onl
y re
fers
to A
RT
naïv
e pa
tient
s st
arte
d in
this
faci
lity
and
does
not
trac
k Tr
ansf
ers
in o
r Tre
atm
ent e
xper
ienc
ed p
atie
nts
%Q
uarte
rlyO
utpu
tD
OR
A; N
SP;
GAR
; UA
ART
expe
rienc
ed a
t AR
T st
art r
ate
ART
expe
rienc
ed
(adu
lt +
child
)Ad
ult a
nd C
hild
und
er
15 y
ears
sta
rted
on A
RT
Prop
ortio
n of
clie
nts
with
trea
tmen
t exp
erie
nce
at
ART
star
t%
Qua
rterly
Out
put
DO
RA
; NSP
; G
AR; U
A
ART at 3 months
Adul
t on
seco
nd li
ne
regi
men
(SLR
) at 3
m
onth
s ra
te
Adul
t on
seco
nd-li
ne
regi
men
(SLR
) at x
x m
onth
s
Adul
t Firs
t lin
e re
gim
en +
Sec
ond
line
regi
men
+
Stop
ped
at in
terv
als
Prop
ortio
n of
adu
lts o
n se
cond
line
regi
men
afte
r a
perio
d of
tim
e. T
his
show
s re
tent
ion
in c
are
and
if th
is p
erce
ntag
e in
crea
se o
ver t
ime
it sh
ows
that
cl
ient
s m
ay b
e bu
ildin
g m
ore
resi
stan
ce to
firs
t lin
e dr
ug re
gim
ens
This
indi
cato
r onl
y re
fers
to A
RT
naïv
e pa
tient
s st
arte
d in
this
faci
lity
and
does
not
trac
k Tr
ansf
ers
in o
r Tre
atm
ent e
xper
ienc
ed p
atie
nts
%Q
uarte
rlyO
utco
me
DO
RA
; NSP
; G
AR; U
A
Chi
ld o
n se
cond
line
re
gim
en (S
LR) a
t 3
mon
ths
rate
Chi
ld u
nder
15
year
s on
sec
ond-
line
regi
men
(SLR
) at 3
m
onth
s
Chi
ld F
irst l
ine
regi
men
+ S
econ
d lin
e re
gim
en +
St
oppe
d at
inte
rval
s
Prop
ortio
n of
chi
ldre
n on
sec
ond
line
regi
men
afte
r a
perio
d of
tim
e. T
his
show
s re
tent
ion
in c
are
and
if th
is p
erce
ntag
e in
crea
se o
ver t
ime
it sh
ows
that
cl
ient
s m
ay b
e bu
ildin
g m
ore
resi
stan
ce to
firs
t lin
e dr
ug re
gim
ens
This
indi
cato
r onl
y re
fers
to A
RT
naïv
e pa
tient
s st
arte
d in
this
faci
lity
and
does
not
trac
k Tr
ansf
ers
in o
r Tre
atm
ent e
xper
ienc
ed p
atie
nts
%Q
uarte
rlyO
utco
me
DO
RA
; NSP
; G
AR; U
A
Adul
t per
cent
age
on
ART
afte
r 3 m
onth
sAd
ult T
OT
min
us
cum
ulat
ive
LTF
min
us c
umul
ativ
e R
IP m
inus
cu
mul
ativ
e TF
O
Adul
t cum
ulat
ive
star
ted
ART
min
us
cum
ulat
ive
TFO
Cum
ulat
ive
Prop
ortio
n of
adu
lts o
n tre
atm
ent a
fter
inte
rval
. Thi
s va
lue
will
enab
le th
e pr
ogra
mm
e to
as
sess
rete
ntio
n on
trea
tmen
t ove
r tim
e. *
Not
e th
at
the
TFO
, LTF
and
RIP
use
d in
the
form
ula
are
the
cum
ulat
ive
tota
ls o
f all
clie
nts
who
left
care
to th
at
poin
t, as
opp
osed
to th
e to
tal i
n th
e m
ost r
ecen
t in
terv
al
This
indi
cato
r onl
y re
fers
to A
RT
naïv
e pa
tient
s st
arte
d in
this
faci
lity
and
does
not
trac
k Tr
ansf
ers
in o
r Tre
atm
ent e
xper
ienc
ed p
atie
nts
%Q
uarte
rlyO
utco
me
DO
RA
; NSP
; G
AR; U
A
Chi
ld u
nder
15
year
s pe
rcen
tage
on
ART
afte
r 3
mon
ths
Chi
ld T
OT
min
us
cum
ulat
ive
LTF
min
us c
umul
ativ
e R
IP m
inus
cu
mul
ativ
e TF
O
Chi
ld u
nder
15
year
s st
arte
d AR
T m
inus
cu
mul
ativ
e TF
O
Cum
ulat
ive
Prop
ortio
n of
chi
ldre
n on
trea
tmen
t afte
r in
terv
al. T
his
valu
e w
ill en
able
the
prog
ram
me
to
asse
ss re
tent
ion
on tr
eatm
ent o
ver t
ime.
* N
ote
that
th
e TF
O, L
TF a
nd R
IP u
sed
in th
e fo
rmul
a ar
e th
e cu
mul
ativ
e to
tals
of a
ll cl
ient
s w
ho le
ft ca
re to
that
po
int,
as o
ppos
ed to
the
tota
l in
the
mos
t rec
ent
inte
rval
This
indi
cato
r onl
y re
fers
to A
RT
naïv
e pa
tient
s st
arte
d in
this
faci
lity
and
does
not
trac
k Tr
ansf
ers
in o
r Tre
atm
ent e
xper
ienc
ed p
atie
nts
%Q
uarte
rlyO
utco
me
DO
RA
; NSP
; G
AR; U
A
Adul
t per
cent
age
died
af
ter 3
mon
ths
ART
Adul
t cum
ulat
ive
RIP
Adul
t cum
ulat
ive
star
ted
ART
min
us
cum
ulat
ive
TFO
Cum
ulat
ive
Prop
ortio
n of
adu
lts w
ho d
ied
afte
r in
terv
al. A
t diff
eren
t tim
e in
terv
als
the
cum
ulat
ive
deat
hs c
an b
e an
alys
ed. *
Not
e th
at th
e TF
O, L
TF
and
RIP
use
d in
the
form
ula
are
the
cum
ulat
ive
tota
ls o
f all
clie
nts
who
left
care
to th
at p
oint
, as
oppo
sed
to th
e to
tal i
n th
e m
ost r
ecen
t int
erva
l
This
indi
cato
r onl
y re
fers
to A
RT
naïv
e pa
tient
s st
arte
d in
this
faci
lity
and
does
not
trac
k Tr
ansf
ers
in o
r Tre
atm
ent e
xper
ienc
ed p
atie
nts
%Q
uarte
rlyO
utco
me
DO
RA
; NSP
; G
AR; U
A
Chi
ld u
nder
15
year
s pe
rcen
tage
die
d af
ter 3
m
onth
s AR
T
Chi
ld c
umul
ativ
e R
IPC
hild
und
er 1
5 ye
ars
star
ted
ART
min
us
cum
ulat
ive
TFO
Cum
ulat
ive
Prop
ortio
n of
chi
ldre
n w
ho d
ied
afte
r in
terv
al. A
t diff
eren
t tim
e in
terv
als
the
cum
ulat
ive
deat
hs c
an b
e an
alys
ed. *
Not
e th
at th
e TF
O, L
TF
and
RIP
use
d in
the
form
ula
are
the
cum
ulat
ive
tota
ls o
f all
clie
nts
who
left
care
to th
at p
oint
, as
oppo
sed
to th
e to
tal i
n th
e m
ost r
ecen
t int
erva
l
This
indi
cato
r onl
y re
fers
to A
RT
naïv
e pa
tient
s st
arte
d in
this
faci
lity
and
does
not
trac
k Tr
ansf
ers
in o
r Tre
atm
ent e
xper
ienc
ed p
atie
nts
%Q
uarte
rlyO
utco
me
DO
RA
; NSP
; G
AR; U
A
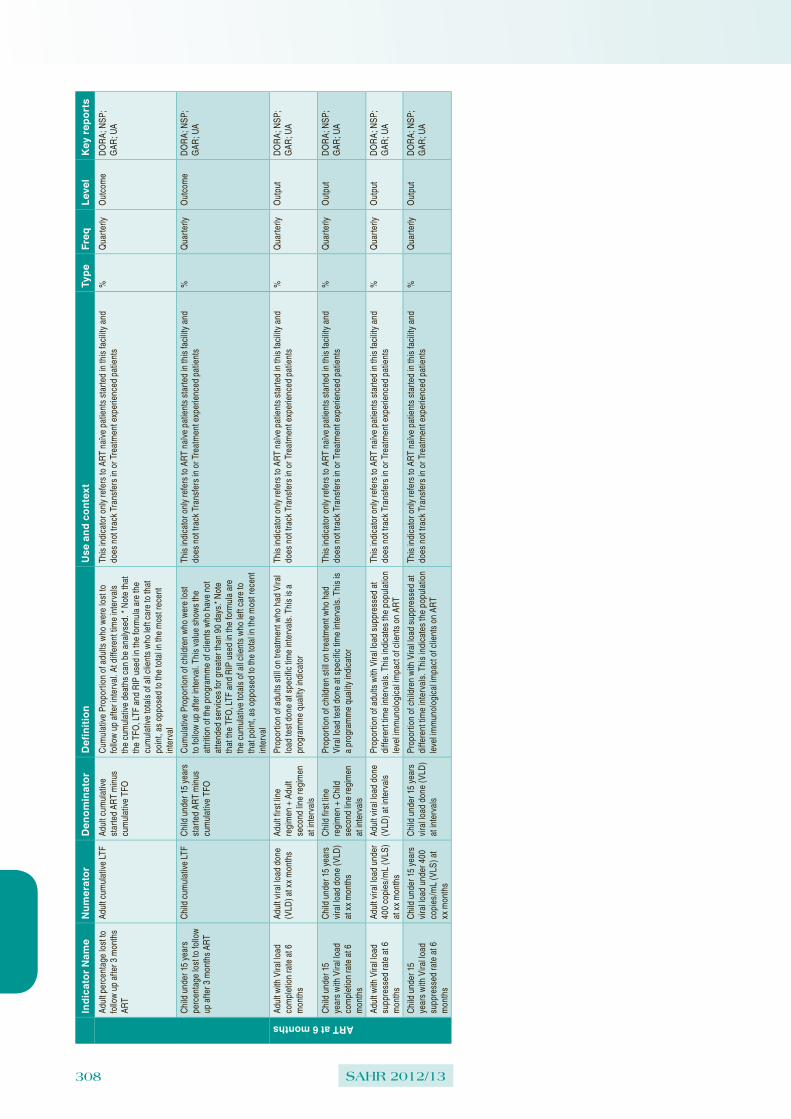
308 SAHR 2012/13
Indi
cato
r Nam
eN
umer
ator
Den
omin
ator
Def
initi
onU
se a
nd c
onte
xtTy
peFr
eqLe
vel
Key
repo
rts
Adul
t per
cent
age
lost
to
follo
w u
p af
ter 3
mon
ths
ART
Adul
t cum
ulat
ive
LTF
Adul
t cum
ulat
ive
star
ted
ART
min
us
cum
ulat
ive
TFO
Cum
ulat
ive
Prop
ortio
n of
adu
lts w
ho w
ere
lost
to
follo
w u
p af
ter i
nter
val.
At d
iffer
ent t
ime
inte
rval
s th
e cu
mul
ativ
e de
aths
can
be
anal
ysed
. * N
ote
that
th
e TF
O, L
TF a
nd R
IP u
sed
in th
e fo
rmul
a ar
e th
e cu
mul
ativ
e to
tals
of a
ll cl
ient
s w
ho le
ft ca
re to
that
po
int,
as o
ppos
ed to
the
tota
l in
the
mos
t rec
ent
inte
rval
This
indi
cato
r onl
y re
fers
to A
RT
naïv
e pa
tient
s st
arte
d in
this
faci
lity
and
does
not
trac
k Tr
ansf
ers
in o
r Tre
atm
ent e
xper
ienc
ed p
atie
nts
%Q
uarte
rlyO
utco
me
DO
RA
; NSP
; G
AR; U
A
Chi
ld u
nder
15
year
s pe
rcen
tage
lost
to fo
llow
up
afte
r 3 m
onth
s AR
T
Chi
ld c
umul
ativ
e LT
FC
hild
und
er 1
5 ye
ars
star
ted
ART
min
us
cum
ulat
ive
TFO
Cum
ulat
ive
Prop
ortio
n of
chi
ldre
n w
ho w
ere
lost
to
follo
w u
p af
ter i
nter
val.
This
val
ue s
how
s th
e at
tritio
n of
the
prog
ram
me
of c
lient
s w
ho h
ave
not
atte
nded
ser
vice
s fo
r gre
ater
than
90
days
.* N
ote
that
the
TFO
, LTF
and
RIP
use
d in
the
form
ula
are
the
cum
ulat
ive
tota
ls o
f all
clie
nts
who
left
care
to
that
poi
nt, a
s op
pose
d to
the
tota
l in
the
mos
t rec
ent
inte
rval
This
indi
cato
r onl
y re
fers
to A
RT
naïv
e pa
tient
s st
arte
d in
this
faci
lity
and
does
not
trac
k Tr
ansf
ers
in o
r Tre
atm
ent e
xper
ienc
ed p
atie
nts
%Q
uarte
rlyO
utco
me
DO
RA
; NSP
; G
AR; U
A
ART at 6 months
Adul
t with
Vira
l loa
d co
mpl
etio
n ra
te a
t 6
mon
ths
Adul
t vira
l loa
d do
ne
(VLD
) at x
x m
onth
sAd
ult f
irst l
ine
regi
men
+ A
dult
seco
nd li
ne re
gim
en
at in
terv
als
Prop
ortio
n of
adu
lts s
till o
n tre
atm
ent w
ho h
ad V
iral
load
test
don
e at
spe
cific
tim
e in
terv
als.
Thi
s is
a
prog
ram
me
qual
ity in
dica
tor
This
indi
cato
r onl
y re
fers
to A
RT
naïv
e pa
tient
s st
arte
d in
this
faci
lity
and
does
not
trac
k Tr
ansf
ers
in o
r Tre
atm
ent e
xper
ienc
ed p
atie
nts
%Q
uarte
rlyO
utpu
tD
OR
A; N
SP;
GAR
; UA
Chi
ld u
nder
15
year
s w
ith V
iral l
oad
com
plet
ion
rate
at 6
m
onth
s
Chi
ld u
nder
15
year
s vi
ral l
oad
done
(VLD
) at
xx
mon
ths
Chi
ld fi
rst l
ine
regi
men
+ C
hild
se
cond
line
regi
men
at
inte
rval
s
Prop
ortio
n of
chi
ldre
n st
ill on
trea
tmen
t who
had
Vi
ral l
oad
test
don
e at
spe
cific
tim
e in
terv
als.
Thi
s is
a
prog
ram
me
qual
ity in
dica
tor
This
indi
cato
r onl
y re
fers
to A
RT
naïv
e pa
tient
s st
arte
d in
this
faci
lity
and
does
not
trac
k Tr
ansf
ers
in o
r Tre
atm
ent e
xper
ienc
ed p
atie
nts
%Q
uarte
rlyO
utpu
tD
OR
A; N
SP;
GAR
; UA
Adul
t with
Vira
l loa
d su
ppre
ssed
rate
at 6
m
onth
s
Adul
t vira
l loa
d un
der
400
copi
es/m
L (V
LS)
at x
x m
onth
s
Adul
t vira
l loa
d do
ne
(VLD
) at i
nter
vals
Prop
ortio
n of
adu
lts w
ith V
iral l
oad
supp
ress
ed a
t di
ffere
nt ti
me
inte
rval
s. T
his
indi
cate
s th
e po
pula
tion
leve
l im
mun
olog
ical
impa
ct o
f clie
nts
on A
RT
This
indi
cato
r onl
y re
fers
to A
RT
naïv
e pa
tient
s st
arte
d in
this
faci
lity
and
does
not
trac
k Tr
ansf
ers
in o
r Tre
atm
ent e
xper
ienc
ed p
atie
nts
%Q
uarte
rlyO
utpu
tD
OR
A; N
SP;
GAR
; UA
Chi
ld u
nder
15
year
s w
ith V
iral l
oad
supp
ress
ed ra
te a
t 6
mon
ths
Chi
ld u
nder
15
year
s vi
ral l
oad
unde
r 400
co
pies
/mL
(VLS
) at
xx m
onth
s
Chi
ld u
nder
15
year
s vi
ral l
oad
done
(VLD
) at
inte
rval
s
Prop
ortio
n of
chi
ldre
n w
ith V
iral l
oad
supp
ress
ed a
t di
ffere
nt ti
me
inte
rval
s. T
his
indi
cate
s th
e po
pula
tion
leve
l im
mun
olog
ical
impa
ct o
f clie
nts
on A
RT
This
indi
cato
r onl
y re
fers
to A
RT
naïv
e pa
tient
s st
arte
d in
this
faci
lity
and
does
not
trac
k Tr
ansf
ers
in o
r Tre
atm
ent e
xper
ienc
ed p
atie
nts
%Q
uarte
rlyO
utpu
tD
OR
A; N
SP;
GAR
; UA

Health and Related Indicators 17
SAHR 2012/13 309
Data
ele
ments
(co
unt
ind
icato
rs):
Dat
a El
emen
t N
ame
Shor
t N
ame
Def
initi
onU
se a
nd c
onte
xtFr
eque
ncy
Col
lect
ed
By
Col
lect
ion
Poin
tsTo
ols
ART Monthly
Adul
t sta
rted
on A
RT
durin
g th
is m
onth
- na
ïve
Adul
t AR
T st
art
naïv
eN
aïve
adu
lts w
ho s
tarte
d AR
T ar
e th
e su
m o
f the
follo
win
g:
- Clie
nts
neve
r bee
n ex
pose
d to
AR
T fo
r mor
e th
an 3
0 da
ys in
tota
l - C
lient
s fro
m th
e PE
P pr
ogra
mm
e - C
lient
s fro
m th
e du
al P
MTC
T pr
ogra
mm
e
The
follo
win
g ad
ults
are
exc
lude
d:
- New
trea
tmen
t exp
erie
nced
- T
rans
ferre
d in
Mon
thly
Clin
icia
n; D
ata
capt
urer
ART
Site
ART
Reg
iste
r
Adul
t rem
aini
ng o
n AR
T at
end
of t
he m
onth
- to
tal
Adul
t rem
ain
on
ART
tot
Tota
l adu
lts re
mai
ning
on
ART
(Adu
lt TR
OA)
at t
he e
nd o
f the
repo
rting
mon
th a
re th
e su
m
of th
e fo
llow
ing:
- A
ny a
dult
that
has
a c
urre
nt re
gim
en in
the
colu
mn
desi
gnat
ing
the
mon
th y
ou a
re
repo
rting
on.
- A
ny a
dult
clie
nt th
at h
as a
sta
r with
out a
circ
le (s
omeo
ne w
ho is
not
yet
con
side
red
lost
to
follo
w-u
p (L
TF) i
n th
e co
lum
n de
sign
atin
g th
e m
onth
you
are
repo
rting
on.
C
lient
s re
mai
ning
on
ART
equa
ls [N
aive
(inc
ludi
ng P
EP a
nd P
MTC
T) +
Exp
erie
nced
(Exp
) +
Tran
sfer
in (T
FI) +
Res
tart]
min
us [D
ied
(RIP
) + L
ost t
o fo
llow
-up
(LTF
) + T
rans
fer o
ut
(TFO
)]
NO
TE th
at c
lient
s w
ho h
ave
an o
utco
me
in th
e sp
ecifi
ed m
onth
or m
onth
s pr
evio
us s
houl
d no
t be
cou
nted
in th
is to
tal
Mon
thly
Clin
icia
n; D
ata
capt
urer
ART
Site
ART
Reg
iste
r
Chi
ld u
nder
15
year
s st
arte
d on
AR
T du
ring
this
mon
th -
naïv
e
Chi
ld <
15 s
tart
ART
naïv
eN
aïve
chi
ldre
n un
der 1
5 ye
ars
who
sta
rted
ART
are
the
sum
of t
he fo
llow
ing:
- C
lient
s ne
ver b
een
expo
sed
to A
RT
for m
ore
than
30
days
in to
tal
- Clie
nts
from
the
PEP
prog
ram
me
- Clie
nts
from
the
dual
PM
TCT
prog
ram
me
The
follo
win
g ch
ildre
n ar
e ex
clud
ed:
- New
trea
tmen
t exp
erie
nced
- T
rans
ferre
d in
Mon
thly
Clin
icia
n; D
ata
capt
urer
ART
Site
ART
Reg
iste
r
Chi
ld u
nder
15
year
s re
mai
ning
on
ART
at e
nd
of th
e m
onth
- to
tal
Chi
ld <
15
rem
ain
ART
tot
Tota
l chi
ldre
n un
der 1
5 ye
ars
rem
aini
ng o
n AR
T (C
hild
TR
OA)
at t
he e
nd o
f the
repo
rting
m
onth
are
the
sum
of t
he fo
llow
ing:
- A
ny c
hild
und
er 1
5 ye
ars
that
has
a c
urre
nt re
gim
en in
the
colu
mn
desi
gnat
ing
the
mon
th
you
are
repo
rting
on.
- A
ny c
hild
und
er 1
5 ye
ars
that
has
a s
tar w
ithou
t a c
ircle
(som
eone
who
is n
ot y
et
cons
ider
ed lo
st to
follo
w-u
p (L
TF) i
n th
e co
lum
n de
sign
atin
g th
e m
onth
you
are
repo
rting
on
. C
lient
s re
mai
ning
on
ART
equa
ls [N
aive
(inc
ludi
ng P
EP a
nd P
MTC
T) +
Exp
erie
nced
(Exp
) +
Tran
sfer
in (T
FI) +
Res
tart]
min
us [D
ied
(RIP
) + L
ost t
o fo
llow
-up
(LTF
) + T
rans
fer o
ut
(TFO
)]
NO
TE th
at c
lient
s w
ho h
ave
an o
utco
me
in th
e sp
ecifi
ed m
onth
or m
onth
s pr
evio
us s
houl
d no
t be
cou
nted
in th
is to
tal
Mon
thly
Clin
icia
n; D
ata
capt
urer
ART
Site
ART
Reg
iste
r
Tota
l clie
nts
star
ted
on
ART
durin
g th
is m
onth
- n
aïve
Tota
l sta
rt AR
T na
ïve
Tota
l naï
ve c
lient
s w
ho s
tarte
d AR
T ar
e th
e su
m o
f the
follo
win
g:
- Clie
nts
neve
r bee
n ex
pose
d to
AR
T fo
r mor
e th
an 3
0 da
ys in
tota
l - C
lient
s fro
m th
e PE
P pr
ogra
mm
e - C
lient
s fro
m th
e du
al P
MTC
T pr
ogra
mm
e
The
follo
win
g cl
ient
s ar
e ex
clud
ed:
- New
trea
tmen
t exp
erie
nced
- T
rans
ferre
d in
Mon
thly
N/A
N/A
DH
IS c
alcu
late
Tota
l clie
nts
rem
aini
ng o
n AR
T at
end
of t
he m
onth
Tota
l rem
ain
on
ART
Tota
l clie
nts
rem
aini
ng o
n AR
T (T
RO
A) a
re th
e su
m o
f the
follo
win
g:
- Any
clie
nt th
at h
as a
cur
rent
regi
men
in th
e co
lum
n de
sign
atin
g th
e m
onth
you
are
re
porti
ng o
n.
- Any
clie
nt th
at h
as a
sta
r with
out a
circ
le (s
omeo
ne w
ho is
not
yet
con
side
red
lost
to
follo
w-u
p (L
TF) i
n th
e co
lum
n de
sign
atin
g th
e m
onth
you
are
repo
rting
on.
C
lient
s re
mai
ning
on
ART
equa
ls [N
aive
(inc
ludi
ng P
EP a
nd P
MTC
T) +
Exp
erie
nced
(Exp
) +
Tran
sfer
in (T
FI) +
Res
tart]
min
us [D
ied
(RIP
) + L
ost t
o fo
llow
-up
(LTF
) + T
rans
fer o
ut
(TFO
)]
NO
TE th
at c
lient
s w
ho h
ave
an o
utco
me
in th
e sp
ecifi
ed m
onth
or m
onth
s pr
evio
us s
houl
d no
t be
cou
nted
in th
is to
tal
Mon
thly
N/A
N/A
DH
IS c
alcu
late
HIV
Med
ical
mal
e ci
rcum
cisi
on p
erfo
rmed
MM
C p
erfo
rmed
Num
ber o
f MM
C p
erfo
rmed
All m
ales
who
are
med
ical
ly c
ircum
cise
d ne
ed
to b
e re
cord
edM
onth
lyM
anag
erIn
patie
nt
Faci
lity
Thea
tre R
egis
ter

310 SAHR 2012/13
Indicator definitions
Type Indicator Definition
Dem
ogra
phic Age dependency ratio The ratio of the combined child population (0-14 years) and the aged population (65 years and over) - persons in the dependent
ages - to every 100 people of the intermediate age population (15-65 years) - economically active ages. Where more detailed data are lacking, the age-dependency ratio is often used as an indicator of the economic burden the productive portion of a population must carry - even though some persons defined as dependent are producers and some persons in the productive ages are economically dependent.
Ageing index Ratio of the number of people 65+ to the number under 15 years. i.e. a value of 16 means there are 16 people aged 65 and over for every 100 people under 15 years of age. Calculated as ((65+ / 0-14)*100)
Crude death rate (deaths per 1 000 population)
Number of deaths in a year per 1 000 population.
Total fertility rate The average number of children that a woman gives birth to in her lifetime, assuming that the prevailing rates remain unchanged.
Annual population growth rate The rate at which the population is increasing or decreasing in a given year expressed as a percentage of the base population size. It takes into consideration all the components of population growth, namely births, deaths and migration.
Average household size Average number of people living in each household where household is defined as a person, or a group of persons, who occupy a common dwelling (or part of it) for at least four days a week and who provide themselves jointly with food and other essentials for living. In other words, they live together as a unit. People who occupy the same dwelling, but who do not share food or other essentials, are enumerated as separate households.
Population Total number of people.
Population % by province Proportion of South African population in each province (calculated from population per province and population for whole of South Africa).
Population % by ethnic group Proportion of South African population in each ethnic group (calculated from population per ethnic group and population for whole of South Africa).
Public sector dependent population This is an adjustment of the total population to the number assumed to be dependent on services in the public health sector based on medical scheme (health insurance) coverage. It is calculated by subtracting the number of people with medical scheme cover (determined from medical scheme membership reports, or surveys indicating percentage of population on medical schemes) from the total population.
Area (square km) Land area covered by geographic entity.
Area as a % of total area of South Africa Area of province divided by total area of country (South Africa).
Population density (people per km2) Number of people per square kilometre.
Soci
o-ec
onom
ic Education level: percentage of population 20 years and older with no schooling
Percentage of people in a given age group who have received a particular level of education. Data are presented for the percentage of population aged 20 years and above with no schooling.
Unemployment rate (official definition) The official definition of the unemployed is that they are those people within the economically active population (aged 15-65) who (a) did not have a job or business during the 7 days prior to the interview, (b) want to work and are available to work within two weeks of the interview, and (c) have taken active steps to look for work or to start some form of self-employment in the 4 weeks prior to the interview.
Drinking Water System (Blue Drop) Performance Rating
Composite score measuring compliance of water suppliers with water quality management requirements. Includes microbiological, chemical and physical compliance criteria.
Percentage of households by type of housing
Percentage of households that are categorised as formal, informal, traditional or other.
Percentage of households using electricity for cooking
Percentage of households using electricity as their main energy source for cooking.
Percentage of households with access to piped water
Includes households with piped water in dwelling, piped water inside yard or piped water on a community stand (< 200m away or further).
Percentage of households with no toilet / bucket toilet
Percentage of households that have no toilet facility of any kind or were using a bucket toilet.
Percentage of households with telephone (telephone in dwelling or cell phone)
Percentage of households with a telephone in the dwelling or a cellular telephone.
Mor
talit
y Adult mortality (45q15 - probability of dying between 15-64 years of age)
The probability of dying between the ages of 15 and 60 years of age (percentage of 15 year olds who die before 60th birthday).
Life expectancy at birth The average number of additional years a person could expect to live if current mortality trends were to continue for the rest of that person's life. (Most commonly cited as life expectancy at birth.)
Chi
ld m
orta
lity
and
rela
ted Infant mortality rate (deaths under 1 year
per 1 000 live births)The number of children less than one year old who die in a year per 1 000 live births during that year.
Low birth weight rate (% live births <2500g)
Percentage of live births under 2 500g.
Neonatal death rate (NNDR) (deaths <28 days old per 1 000 live births)
Number of deaths within the first 28 days of life in a year per 1 000 live births during that year. Also called Neonatal Mortality Rate (NNMR).
Number of under-5 deaths The estimated number of deaths in children younger than 5 years.
Perinatal care index (perinatal MR / LBWR)
Perinatal mortality rate divided by the low birth weight rate.
The Perinatal Care Index is a quality of care index that has been validated as a true measure of the quality of care; the higher the index the poorer the care. The values should be below 1 for CHCs and below 2 for all hospitals.
Perinatal mortality rate (deaths <8 days old per 1 000 total births)
The number of perinatal deaths per 1 000 births. The perinatal period starts as the beginning of foetal viability (28 weeks gestation or 1 000g) and ends at the end of the 7th day after delivery. Perinatal deaths are the sum of stillbirths plus early neonatal deaths. These are divided by total births (live births plus stillbirths).
Stillbirth rate (per 1 000 total births) Number of stillbirths per 1 000 total births.
Under 5 mortality rate (deaths under 5 years per 1 000 live births)
The number of children under 5 years who die in a year per 1 000 live births during the year. It is a combination of the infant mortality rate plus the age 1-4 mortality rate.
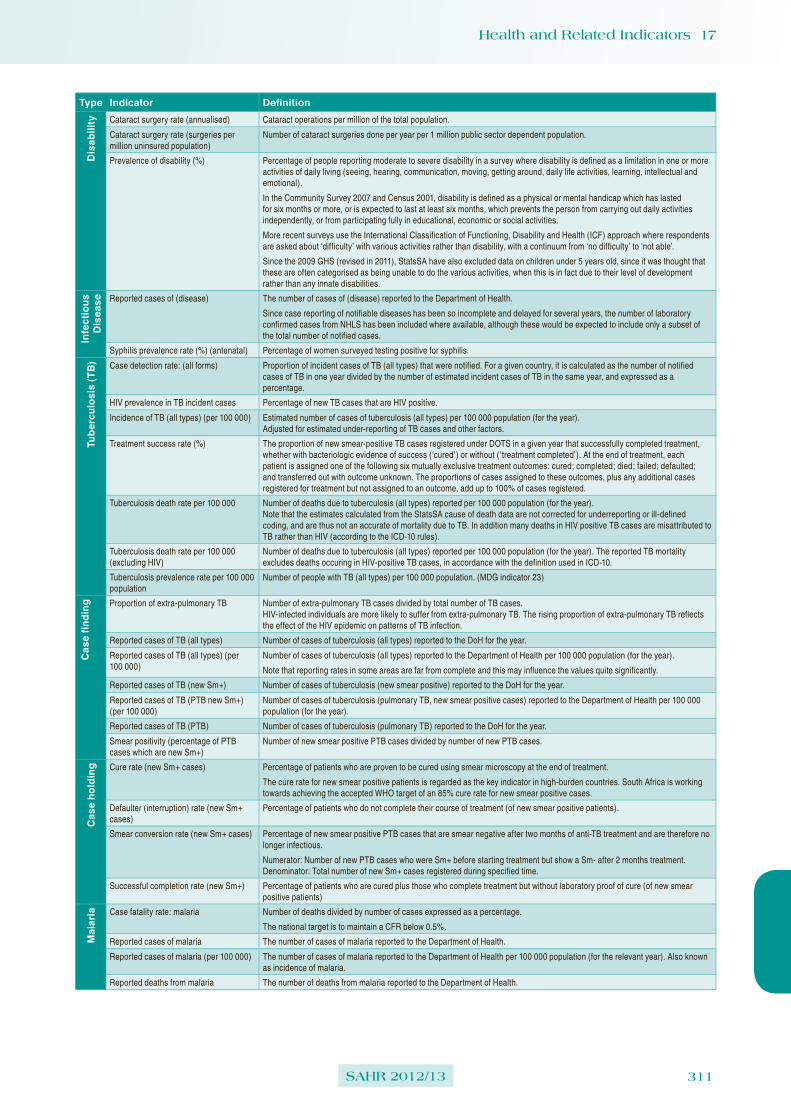
Health and Related Indicators 17
SAHR 2012/13 311
Type Indicator DefinitionD
isab
ility Cataract surgery rate (annualised) Cataract operations per million of the total population.
Cataract surgery rate (surgeries per million uninsured population)
Number of cataract surgeries done per year per 1 million public sector dependent population.
Prevalence of disability (%) Percentage of people reporting moderate to severe disability in a survey where disability is defined as a limitation in one or more activities of daily living (seeing, hearing, communication, moving, getting around, daily life activities, learning, intellectual and emotional).
In the Community Survey 2007 and Census 2001, disability is defined as a physical or mental handicap which has lasted for six months or more, or is expected to last at least six months, which prevents the person from carrying out daily activities independently, or from participating fully in educational, economic or social activities.
More recent surveys use the International Classification of Functioning, Disability and Health (ICF) approach where respondents are asked about ‘difficulty’ with various activities rather than disability, with a continuum from ‘no difficulty’ to ‘not able’.
Since the 2009 GHS (revised in 2011), StatsSA have also excluded data on children under 5 years old, since it was thought that these are often categorised as being unable to do the various activities, when this is in fact due to their level of development rather than any innate disabilities.
Infe
ctio
us
Dis
ease Reported cases of (disease) The number of cases of (disease) reported to the Department of Health.
Since case reporting of notifiable diseases has been so incomplete and delayed for several years, the number of laboratory confirmed cases from NHLS has been included where available, although these would be expected to include only a subset of the total number of notified cases.
Syphilis prevalence rate (%) (antenatal) Percentage of women surveyed testing positive for syphilis.
Tube
rcul
osis
(TB) Case detection rate: (all forms) Proportion of incident cases of TB (all types) that were notified. For a given country, it is calculated as the number of notified
cases of TB in one year divided by the number of estimated incident cases of TB in the same year, and expressed as a percentage.
HIV prevalence in TB incident cases Percentage of new TB cases that are HIV positive.
Incidence of TB (all types) (per 100 000) Estimated number of cases of tuberculosis (all types) per 100 000 population (for the year). Adjusted for estimated under-reporting of TB cases and other factors.
Treatment success rate (%) The proportion of new smear-positive TB cases registered under DOTS in a given year that successfully completed treatment, whether with bacteriologic evidence of success (‘cured’) or without (‘treatment completed’). At the end of treatment, each patient is assigned one of the following six mutually exclusive treatment outcomes: cured; completed; died; failed; defaulted; and transferred out with outcome unknown. The proportions of cases assigned to these outcomes, plus any additional cases registered for treatment but not assigned to an outcome, add up to 100% of cases registered.
Tuberculosis death rate per 100 000 Number of deaths due to tuberculosis (all types) reported per 100 000 population (for the year). Note that the estimates calculated from the StatsSA cause of death data are not corrected for underreporting or ill-defined coding, and are thus not an accurate of mortality due to TB. In addition many deaths in HIV positive TB cases are misattributed to TB rather than HIV (according to the ICD-10 rules).
Tuberculosis death rate per 100 000 (excluding HIV)
Number of deaths due to tuberculosis (all types) reported per 100 000 population (for the year). The reported TB mortality excludes deaths occuring in HIV-positive TB cases, in accordance with the definition used in ICD-10.
Tuberculosis prevalence rate per 100 000 population
Number of people with TB (all types) per 100 000 population. (MDG indicator 23)
Cas
e fin
ding Proportion of extra-pulmonary TB Number of extra-pulmonary TB cases divided by total number of TB cases.
HIV-infected individuals are more likely to suffer from extra-pulmonary TB. The rising proportion of extra-pulmonary TB reflects the effect of the HIV epidemic on patterns of TB infection.
Reported cases of TB (all types) Number of cases of tuberculosis (all types) reported to the DoH for the year.
Reported cases of TB (all types) (per 100 000)
Number of cases of tuberculosis (all types) reported to the Department of Health per 100 000 population (for the year).
Note that reporting rates in some areas are far from complete and this may influence the values quite significantly.
Reported cases of TB (new Sm+) Number of cases of tuberculosis (new smear positive) reported to the DoH for the year.
Reported cases of TB (PTB new Sm+) (per 100 000)
Number of cases of tuberculosis (pulmonary TB, new smear positive cases) reported to the Department of Health per 100 000 population (for the year).
Reported cases of TB (PTB) Number of cases of tuberculosis (pulmonary TB) reported to the DoH for the year.
Smear positivity (percentage of PTB cases which are new Sm+)
Number of new smear positive PTB cases divided by number of new PTB cases.
Cas
e ho
ldin
g Cure rate (new Sm+ cases) Percentage of patients who are proven to be cured using smear microscopy at the end of treatment.
The cure rate for new smear positive patients is regarded as the key indicator in high-burden countries. South Africa is working towards achieving the accepted WHO target of an 85% cure rate for new smear positive cases.
Defaulter (interruption) rate (new Sm+ cases)
Percentage of patients who do not complete their course of treatment (of new smear positive patients).
Smear conversion rate (new Sm+ cases) Percentage of new smear positive PTB cases that are smear negative after two months of anti-TB treatment and are therefore no longer infectious.
Numerator: Number of new PTB cases who were Sm+ before starting treatment but show a Sm- after 2 months treatment. Denominator: Total number of new Sm+ cases registered during specified time.
Successful completion rate (new Sm+) Percentage of patients who are cured plus those who complete treatment but without laboratory proof of cure (of new smear positive patients)
Mal
aria Case fatality rate: malaria Number of deaths divided by number of cases expressed as a percentage.
The national target is to maintain a CFR below 0.5%.
Reported cases of malaria The number of cases of malaria reported to the Department of Health.
Reported cases of malaria (per 100 000) The number of cases of malaria reported to the Department of Health per 100 000 population (for the relevant year). Also known as incidence of malaria.
Reported deaths from malaria The number of deaths from malaria reported to the Department of Health.

312 SAHR 2012/13
Type Indicator DefinitionH
IV a
nd A
IDS AIDS orphans (maternal orphans Number of children under 18 years who have lost either a mother (maternal orphan), a father (paternal orphan) or both parents (a
double orphan) due to HIV/AIDS.
AIDS sick (number of people with AIDS-defining conditions)
Number of people estimated to be living with AIDS defining conditions.
Antenatal client HIV 1st test positive rate Antenatal clients tested HIV positive as a proportion of antenatal clients tested for HIV for the first time during the current pregnancy.
Similar to HIV prevalence (antenatal), except that as more people may already know their status over time it does not necessarily provide a representative value for all antenatal clients.
Antiretroviral coverage The number of patients receiving ART, divided by the number needing treatment.
Early infant diagnosis coverage The numerator is the number of PCR tests performed by the National Laboratory Service for infants 2 months old or less, as a proxy for the first PCR test. The estimated number of HIV-exposed infants (denominator) is calculated by multiplying antenatal maternal HIV prevalence rates by the number of live births.
HIV incidence The HIV incidence rate is the percentage of people who are uninfected at the beginning of the period who will become infected over the twelve months.
It refers to the annual diagnosis rate, or the number of new cases of HIV diagnosed each year. (The term 'prevalence' refers to the estimated population of people who have HIV at any given time.)
HIV prevalence (%) (age 15-49) Percentage of population (age 15-49) estimated to be HIV positive.
HIV prevalence (%) (antenatal) Percentage of women surveyed testing positive for HIV.
HIV prevalence (%) (total population) Percentage of population estimated to be HIV positive.
Mother-to-child transmission rate of HIV <2 months of age
This indicator measures the proportion of HIV-exposed infants who received a PCR test under two months of age who tested positive.
Number of patients receiving ART Number of patients receiving ART.
People living with HIV The number of people who are HIV+.
Percentage of deaths due to AIDS Percentage of total deaths attributed to AIDS related causes.
Proportion of ANC clients tested for HIV Proportion of women coming for their first antenatal visit who are tested for HIV.
STIs Incidence of STI treated The percentage of people 15 years and older that have been treated for a new episode of an STI (annualised).
STI partner treatment rate (%) Number of STI partners treated new divided by number of STI treated new episode, expressed as a percentage.
Con
trac
eptio
n an
d se
xual
beh
avio
ur Age of first sex under 14 years (% having first had sex at age 14 or younger)
Percentage of people surveyed (of various age groups) who report having first had sexual intercourse at age 14 years or younger.
Condom use at last sex (%) Percentage of those (who reported ever having had sex) who used a condom the last time they had sex. Note that the precise definition of this indicator varies between surveys.
Couple year protection rate The rate at which couples (specifically women) are protected against pregnancy using modern contraceptive methods INCLUDING sterilisations. (previously Women year protection rate).
Numerator: Contraceptive years equivalent
Denominator: Target population 15-44 years (couples using females as proxy)
Ever had sex (%) Percentage of people who report that they have ever had sexual intercourse.
HIV knowledge: people who know that a person can protect him / herself from HIV infection by condom
HIV knowledge: people aged 15-24 who know that a person can protect him / herself from HIV infection by consistent use of a condom.
Male circumcision (% of men who are circumcised)
The percentage of men (15-59 years, unless otherwise specified) who have been circumcised.
Male condom distribution rate The number of male condoms distributed (to patients at the facility or through other channels) per male 15 years and older.
Male condoms distributed (thousands) Number of male condoms distributed.
Teenage pregnancy Percentage of women aged 15-19 who are mothers or who have ever been pregnant. The percentage of women who are mothers at the time of the survey is a more restrictive definition.
Note that some of the surveys report this indicator as the percentage who have ever been pregnant of those WHO HAVE EVER HAD SEX. This is a different denominator to that used by the Demographic and Health Surveys, and the data can therefore not be directly compared.
Mat
erna
l hea
lth ANC coverage Proportion of pregnant women receiving some antenatal care. DHIS data source: Estimated from the number of first ANC visits divided by the expected number of pregnant women. HSRC data source: Percentage of women surveyed who reported receiving some antenatal care from a nurse, midwife or doctor.
ANC visits per client The total number of antenatal visits over the number of first antenatal visits (equivalent to number of antenatal clients).
Caesarean section rate Percentage of births that are by caesarean section.
Delivery rate in facility The percentage of deliveries taking place in health facilities under supervision of trained personnel. (The number of children under one year, factorised by 1.07 due to infant mortality, is used as an estimated proxy denominator for expected deliveries.)
Maternal mortality ratio (MMR) The number of women who die as a result of childbearing, during the pregnancy or within 42 days of delivery or termination of pregnancy in one year, per 100 000 live births during that year.
Number of maternal deaths The number of women who die as a result of childbearing, during the pregnancy or within 42 days of delivery or termination of pregnancy in one year.
In the International Statistical Classification of Diseases and Related Health Problems, Tenth Revision, 1992 (ICD-10), WHO defines maternal death as: The death of a woman while pregnant or within 42 days of termination of pregnancy, irrespective of the duration and site of the pregnancy, from any cause related to or aggravated by the pregnancy or its management but not from accidental or incidental causes. For countries using ICD-10 coding for registered deaths, all deaths coded to the maternal chapter (O codes) and A34 (maternal tetanus) were counted as maternal deaths. Note that the system of Confidential Enquiries into maternal deaths (NCCEMD) only captures INSTITUTIONAL deaths, and thus is known to miss deaths occurring at home.
PMDF (proportion maternal among deaths of females of reproductive age)
An alternative measure of maternal mortality, the proportion of deaths among females of reproductive age (PMDF) that are due to maternal causes, is calculated as the number of maternal deaths divided by the total deaths among females aged 15-49 years.

Health and Related Indicators 17
SAHR 2012/13 313
Type Indicator Definition
Term
inat
ion
of
Preg
nanc
y TOP facilities functioning (%) Percentage of functioning TOP facilities.
Numerator: Number of designated facilities providing termination of pregnancy services.
Denominator: Total number of designated TOP facilities.
ToP rate (%) Percentage of pregnant women who have had an abortion.
DHIS definition: Termination of Pregnancies performed in a health facility as the proportion of all expected pregnancies in the catchment population.
TOPs (Terminations of Pregnancy) The number of terminations of pregnancy.
Nut
ritio
n Obesity (%) Percentage of people with a body mass index (BMI) (body mass in kg divided by the square of the height in m) equal to or more than 30kg/m2.
Overweight (%) Children: Proportion of children with weight for height over 2 standard deviations from the norm (reference population median).
Adults: Percentage of people with body mass index (BMI) of 25-29.9 kg/m2.
Stunting (%) Proportion of children with height for age under 2 standard deviations from the norm (reference population median).
Underweight (%) Children: Proportion of children with weight for age under 2 standard deviations from the norm (reference population median).
Adults: Percentage of people with body mass index (BMI) <18.5 kg/m2.
Vitamin A coverage children 12-59 months
Proportion of children 12-60 months receiving vitamin A 200 000 units twice a year. The denominator is thus the target population 1-4 years multiplied by 2.
Vitamin A coverage infants 6-11 months Percentage of infants 6-11 months receiving vitamin A 100 000 units.
Wasting (%) Proportion of children with weight for height under 2 standard deviations from the norm (reference population median).
Chi
ld H
ealth Children under 5 years weighing rate The proportion of PHC headcount under 5 years that were weighed. Monitoring whether the policy of weighing all children seen
at least once a month is being adhered to.
Diarrhoea incidence under 5 years (per 1 000)
The number of children under 5 years with diarrhoea per 1 000 population under 5 years per year. Diarrhoea is formally defined as 3 or more watery stools in 24 hours, but any episode diagnosed and/or treated as diarrhoea after an interview with the adult accompanying the child should be counted.
Not gaining weight under 5 years rate (%) The proportion of children weighed who had an episode of growth faltering/failure during the period. Note that WC uses a 'tighter' definition of not gaining weight.
Number of orphans Number of children under 18 years whose biological mother, biological father or both parents have died. Different kinds of orphans are defined as: maternal orphans - a child whose mother has died, or whose living status is not known, but whose father is alive. paternal orphans - a child whose father has died, or whose living status is not known, but whose mother is alive. double/dual orphan - a child whose mother and father have both died, or whereabouts are unknown.
Orphanhood (%) Proportion of children under 18 years whose biological mother, biological father or both parents have died.
Pneumonia incidence rate under 5 years The number of children under 5 years diagnosed with pneumonia, per 1 000 children in the catchment population. This indicator was called Lower Respiratory Tract Infection (LRTI) incidence rate, due to incorrect interpretation of LRTI.
Severe malnutrition under 5 years incidence (per 1 000)
The number of children who weigh below 60% expected weight for age (new cases that month) per 1 000 children in the target population.
Imm
unis
atio
n BCG coverage The proportion of expected live born babies that received BCG under 1 year of age (note: usually given right after birth)
DTP3 coverage The proportion of children who received their third DTP-Hib doses (normally at 14 weeks)
From approximately 2009 when the immunisation schedule changed, this is defined as: The proportion of children under 1 year who received their DTaP-IPV/Hib (Pentaxim) 3rd dose, normally at 14 weeks - annualised.
Immunisation coverage of children <1 year
Proportion of children under 1 year who are fully immunised. Calculated from the number of children fully immunised (defined as first visit where all required vaccinations are completed) divided by the population <1 year. A primary course includes BCG, OPV 1,2 & 3, DTP-Hib 1,2 & 3, HepB 1,2 & 3, and 1st measles (usually at 9 months).
Measles 1st dose coverage (%) The proportion of children who received their 1st measles dose (normally at 9 months) - annualised. Numerator: Measles 1st dose under 1 year
Denominator: Target population under 1 year
OPV 1 coverage The proportion of children under 1 immunised with OPV dose 1.
PCV7 3rd dose coverage (annualised) The proportion of children who received their third PCV7 dose (around 9 months) - annualised.
RV 2nd dose coverage (annualised) The proportion of children who received their second RV dose (around 14 weeks) - annualised.
Chr
onic
D
isea
ses Cervical cancer screening coverage Women 30 years and older with a cervical (pap) smear done for screening purposes according to the national policy of screening
all women in this age category every 10 years, as the proportion of all women 30 years and older in the target population.
Denominator is 10% of the female target population 30 years and older.
Hypertension prevalence (per 1 000) Number of people with hypertension per 1 000 people in the target population. The prevalence of hypertension is classified as follows: Blood pressure equal to or above 140/90 mmHg or taking hypertension medication. Data have been converted from a percentage to the rate per 1 000 population.
Beh
avio
ur &
Aw
aren
ess Alcohol dependence (%) Proportion of people who show signs of alcohol dependence. Alcohol dependence is identified using four screening questions
that indirectly inquire about alcohol use (CAGE questionnaire). An affirmative answer to two or more questions is classified as alcohol dependence. CAGE questions are: C - Has anyone ever felt you should Cut down on your drinking? A - Have people Annoyed you by criticizing your drinking? G - Have you ever felt Guilty about your drinking? E - Have you ever had a drink first thing in the morning (Eye-opener) to steady your nerves or to get rid of a hangover?
Ever smoked cigarettes (%) Proportion of people who have ever smoked a cigarette, even one or two puffs.
Number of admissions for alcohol and other drug abuse
Number of patients admitted for treatment by treatment centres who are part of the SACENDU Project sentinel surveillance system.
Prevalence of smoking (%) Proportion of population who currently smoke. This indicator is also known as 'Current smokers (%)' Note that the indicator may be given just for cigarettes or for other tobacco products.
Primary drug of abuse as % of all drugs of abuse
Percentage breakdown of the primary drug of abuse reported by patients admitted to treatment centres that are part of the SACENDU sentinel surveillance system. Note that poly-substance abuse is high.

314 SAHR 2012/13
Type Indicator DefinitionIn
jurie
s Road accident fatalities per 100 000 population
Number of fatalities due to road accidents per 100 000 population.
Hea
lth F
acili
ties Percentage of users of private health
services highly satisfied with the service received
Percentage of users of private health services highly satisfied with the service received.
Percentage of users of public health services highly satisfied with the service received
Percentage of users of public health services highly satisfied with the service received.
Average length of stay (ALOS) Average duration of patient stay in health facility.
Numerator: Inpatient days + 1/2 Day patients
Denominator: Discharges + Deaths + Transfers out + Day patients.
Useable bed utilisation (occupancy) rate (BUR)
Measure of the occupancy of the beds available for use.
Numerator: (Inpatient days + 1/2 Day patients) x 100
Denominator: Useable beds x days in period.
Useable beds per 1 000 population The number of useable beds divided by the population x 1 000. Where this is calculated for public health sector beds, the population used is the public sector dependent (uninsured) population.
Utilisation rate PHC Number of visits per person to PHC health facilities per year. Calculated from PHC headcount divided by total population.
Utilisation rate PHC <5 years Number of visits per person <5 years to PHC health facilities per year. Calculated from PHC headcount <5 years divided by population <5 years.
Hea
lth P
erso
nnel Number of (health professionals)
registeredNumber of this category of health professional registered with the relevant professional council. This number includes those working in the public or private sector as well as those registered but not working or overseas.
Description of selected categories:
An enrolled nurse (EN) or sometimes called a staff nurse is an individual who has completed a two year programme usually at a nursing college or exited after completing two years of the university four year programme. This person is educated and competent to practice basic nursing.
An enrolled nursing auxiliary (ENA) or sometimes called an assistant nurse (AN) which is an individual who has completed a year programme or a similar course at college or exited after completing the first year of the university four year programme. This person is educated and competent to practice elementary nursing.
A professional nurse (PN) or registered nurse (RN) (and sometimes called a sister), is an individual who has completed a four year programme at university or a nursing College. This person is educated and competent to practice comprehensive nursing and midwifery.
A pupil auxiliary is an individual on one year or similar nursing course at a public or private nursing institution.
A pupil nurse is an individual on a two year nursing programme at a public or private nursing institution.
A student nurse is a person who is in the process of training either on a four year nursing programme at Nursing College or University.
Number of (health professionals) Number of this category of health professional working in the specified sector.
Total number of health professional posts Total number of health sector posts (health professional categories) including dental, medical, nursing, pharmacy, occupational therapy, physiotherapy, radiography and psychology professions. Data from 2002 also includes environmental health professionals, and from 2009 clinical associates were added. Note that older data from PERSAL also included some vacant posts for each profession. Newer data has most of the vacant posts identified, and therefore the number of posts primarily reflects filled posts.
Number of CS (health professionals) Number of community service (health professionals). For each cadre.
(Health professionals) per 100 000 population
Ratio of the number of personnel to the population (per 100 000).
Note that the measure of the number of personnel may differ for the public and private sectors and also that the population may be adjusted to be the population assumed to be dependent on that sector.
Hea
lth F
inan
cing Claims ratio Percentage of member contributions that has been utilised for the payment of benefits claimed by members of medical schemes,
as opposed to allocation of contributions for non-health benefits and the building of reserves.
Medical scheme beneficiaries Number of medical scheme (scheme) beneficiaries, as reported by the Medical Schemes Council.
Medical scheme coverage Percentage of population covered by medical schemes.
Pensioner ratio Percentage of members of medical schemes who are 65 years or older, in registered medical schemes.
Per capita expenditure (non-hospital PHC)
Amount spent on non-hospital PHC services by the public sector per person without medical aid coverage (in Rands).
Includes provincial expenditure from sub-programmes 2.1-2.5 (District management, Community health clinics, Community health centres, Community-based services and Other community services) under District Health Services, plus net Local government expenditure on health services. Expenditure is divided by the population without medical scheme coverage.
Per capita health expenditure Amount spent on health per person (in Rands)
For the public sector this is calculated for the population without medical scheme coverage (public sector dependent population). For the private sector this is usually calculated for the number of medical schemes beneficiaries.

Health and Related Indicators 17
SAHR 2012/13 315
References1 Day C, Gray A, Budgell E. Health and Related Indicators. In:
Padarath A, English R, editors. South African Health Review 2011. Durban: Health Systems Trust; 2011.
2 Health Data Advisory and Co-ordination Committee (HDACC) Report. Pretoria: National Department of Health; 2012.
3 Annual Performance Plan 2012/13-2014/15. Pretoria: National Department of Health; 2012.
4 National Development Plan: Vision for 2030. South Africa: National Planning Commission; 2011. Available from: http://www.npconline.co.za.
5 Davis KE, Kingsbury B, Merry SE. Indicators as a Technology of Global Governance. Law & Society Review. 2012;46(1):71-104.
6 Olafsdottir AE, Reidpath DD, Pokhrel S, Allotey P. Health systems performance in sub-Saharan Africa: governance, outcome and equity. BMC public health. 2011;11:237. Epub 2011/04/19.
7 Sachs JD. From millennium development goals to sustainable development goals. Lancet. 2012;379(9832):2206-11.
8 Positioning Health in the Post-2015 Development Agenda. Geneva: World Health Organization; 2012. Available from: http://www.who.int/topics/millennium_development_goals/post2015/WHOdiscussionpaper_October2012.pdf.
9 Moreno-Serra R, Smith PC. Towards and index of health coverage. Discussion paper 2012/11. London: Imperial College Business School; 2012.
10 Mayosi BM, Lawn JE, van Niekerk A, Bradshaw D, Abdool Karim SS, Coovadia HM. Health in South Africa: changes and challenges since 2009. Lancet. 2012;380(9858):2029-43. Epub 2012/12/04.
11 South African Declaration on the Prevention and Control of Non-communicable Diseases. Pretoria: National Department of Health; 2011. Available from: http://www.doh.gov.za/docs/dcl/2011/draft_declaration_sa.pdf.
12 Motsoaledi A. Progress and changes in the South African health sector. Lancet. 2012;380(9858):1969-70. Epub 2012/12/04.
13 National Strategic Plan on HIV, STIs and TB 2012-2016. South Africa: South African National AIDS Council (SANAC); 2011. Available from: http://www.sanac.org.za.
14 Short Fabic M, Choi Y, Bird S. A systematic review of Demographic and Health Surveys: data availability and utilization for research. Bull World Health Organ. 2012;90(8):604-12.
15 Department of Health, Medical Research Council, OrcMacro. South Africa Demographic and Health Survey 2003. Pretoria: National Department of Health; 2007.
16 The South African National Health and Nutrition Examination Survey, 2011/2012 (SANHANES-1): Executive Summary. Available from: http://www.hsrc.ac.za/Document-4377.phtml.
17 Leibbrandt M, Woolard I, de Villiers L. Methodology: Report on NIDS Wave 1. Technical Paper no 1. Cape Town: Southern African Labour and Development Research Unit (SALDRU); 2009.
18 Leibbrandt M, Woolard I. National Income Dynamics Study 2012 Wave 2 Overview. Cape Town: Southern Africa Labour and Development Research Unit (SALDRU); 2012.
19 Mphatswe W, Mate KS, Bennett B, Ngidi H, Reddy J, Barker PM, et al. Improving public health information: a data quality intervention in. Bull World Health Organ. 2012;90(3):176-82. Epub 2012/03/31.
20 Census 2011. Census in Brief. Report No 03-01-41. Pretoria: Statistics South Africa; 2012.
21 Kollodge R, editor. State of World Population 2012. New York: United Nations Population Fund; 2012.
22 de Wet P. Is Census 2011 accurate: Still depends on who you ask. Mail & Guardian. 2012 01 Nov 2012.
23 Recorded live births 2011. Statistical release P0305. Pretoria: Statistics South Africa; 2012.
24 Rossouw L, Burger R, Burger R. The fertility transition in South Africa: A retrospective panel data analysis. Stellenbosch: Department of Economics and Bureau for Economic Research, Stellenbosch University; 2012.
25 2012 World Population Data Sheet. Washington DC: Population Reference Bureau; 2012. Available from: http://www.prb.org.
26 Shetty P. Grey matter: ageing in developing countries. Lancet. 2012;379(9823):1285 -7.
27 SAGE: WHO Study on global AGEing and adult health (SAGE). Geneva: World Health Organization; [cited 2012 Apr 06]; Available from: www.who.int/healthinfo/systems/sage/en/.
28 Phaswana-Mafuya N. Ageing and Health: The SAGE survey. PHASA newsletter. South Africa: Public Health Association of South Africa (PHASA); 2012.
29 Gómez-Olivé X. The health and well-being of older people in rural South Africa. PHASA newsletter. South Africa: Public Health Association of South Africa (PHASA); 2012.
30 Xavier Gomez-Olive F, Thorogood M, Clark BD, Kahn K, Tollman SM. Assessing health and well-being among older people in rural South Africa. Glob Health Action. 2010;3. Epub 2010/10/22.
31 Gomez-Olive FX, Thorogood M, Clark B, Kahn K, Tollman S. Self-reported health and health care use in an ageing population in the Agincourt sub-district of rural South Africa. Glob Health Action. 2013;6:1-12.
32 Census in Brief. The people of South Africa population census 1996. Pretoria: Statistics South Africa; 1998.
33 Census 2001. Census in Brief. Pretoria: Statistics South Africa; 2003.
34 Mid-year population estimates. Statistical release P0302. Pretoria: Statistics South Africa; time series.
35 Community Survey 2007 [dataset]. Pretoria: Statistics South Africa.
36 Council for Medical Schemes Annual Report 2011~2012. Pretoria: Council for Medical Schemes; 2012.
37 General Household Survey 2011. Statistical release P0318. Pretoria: Statistics South Africa; 2012.
38 Bradshaw D, Masiteng K, Nannan N. Health Status and Determinants. In: Ntuli A, Crisp N, Clarke E, Barron P, editors. South African Health Review 2000. Durban: Health Systems Trust; 2001.
39 Department of Health, Medical Research Council, and Macro International. South African Demographic and Health Survey 1998. Full report. Pretoria: National Department of Health; 2002.

316 SAHR 2012/13
40 Moultrie T, Dorrington R. Estimation of fertility from the 2001 South Africa Census data. Cape Town: Centre for Actuarial Research; 2004. Available from: http://www.commerce.uct.ac.za/care/.
41 Estimation of fertility from the 2007 Community Survey of South Africa. Pretoria: Statistics South Africa; 2010.
42 Moultrie T, Dorrington R. Demography: Analysis of the NIDS Wave 1 Dataset. Discussion Paper No 9. Cape Town: Southern Africa Labour and Development Research Unit (SALDRU); 2009.
43 Social profile of vulnerable groups in South Africa: 2002-2011. Report No 03-19-00. Pretoria: Statistics South Africa; 2012.
44 Ataguba JE, Akazili J, McIntyre D. Socioeconomic-related health inequality in South Africa: evidence from General Household Surveys. Int J Equity Health. 2011;10(1):48.
45 2012 Blue Drop Report. South Africa: Department of Water Affairs; 2012.
46 2012 Green Drop Progress Report. South Africa: Department of Water Affairs; 2012.
47 Wright JA, Yang H, Rivett U, Gundry SW. Public perception of drinking water safety in South Africa 2002-2009: a repeated cross-sectional study. BMC public health. 2012;12:556.
48 World Health Organization and United Nations Children’s Fund Joint Monitoring Programme for Water Supply and Sanitation. Progress on Drinking Water and Sanitation: 2012 Update. New York: UNICEF and WHO; 2012.
49 2011 Blue Drop Report. South Africa: Department of Water Affairs; 2011.
50 Quarterly Labour Force Survey. Statistical release P0211. Pretoria: Statistics South Africa; time series.
51 Das P, Samarasekera U. The story of GBD 2010: a “super-human” effort. Lancet. 2012;380(9859):2067-70.
52 Murray CJ, Rosenfeld LC, Lim SS, Andrews KG, Foreman KJ, Haring D, et al. Global malaria mortality between 1980 and 2010: a systematic analysis. Lancet. 2012;379(9814):413-31. Epub 2012/02/07.
53 Mortality and causes of death in South Africa, 2009: Findings from death notification. Statistical release P03093. Pretoria: Statistics South Africa; 2011.
54 Massyn N, Day C, Haynes R, Barron P, English R, Padarath A. District Health Barometer 2011/12. Durban: Health Systems Trust; 2012.
55 Bor J, Herbst A, J, Newell M-L, Bärnighausen T. Increases in Adult Life Expectancy in Rural South Africa: Valuing the Scale-Up of HIV Treatment. Science. 2013;339:961-4.
56 Sartorius B. Modelling determinants, impact, and space-time risk of age-specific mortality in rural South Africa: integrating methods to enhance policy relevance. Glob Health Action. 2013;6:1-11.
57 Levels and trends of morbidity and mortality among children aged under-five years in South Africa, 2006-2010. Report No 03-09-10 (2006-2010). Pretoria: Statistics South Africa; 2012.
58 Living Conditions of Households in SA 2008/2009. Statistical Release P0310. Pretoria: Statistics South Africa; 2011.
59 Bradshaw D, Dorrington R, Laubscher R. Rapid mortality surveillance report 2011. Cape Town: South African Medical Research Council; 2012.
60 Joubert J, Rao C, Bradshaw D, Dorrington RE, Vos T, Lopez AD. Characteristics, availability and uses of vital registration and other mortality data sources in post-democracy South Africa. Glob Health Action. 2012;5:19263.
61 Global Burden of Disease Study 2010. Global Burden of Disease Study 2010 Mortality Results 1970-2010. Seattle: Institute for Health Metrics and Evaluation (IHME); 2012; Available from: http://www.healthmetricsandevaluation.org/ghdx/gbd-2010-data-downloads.
62 ASSA2008 Model: ProvOutput. AIDS and Demographic Model. South Africa: AIDS Committee of Actuarial Society of South Africa; 2011; Available from: http://aids.actuarialsociety.org.za/ASSA2008-Model-3480.htm.
63 Vos T, Flaxman AD, Naghavi M, Lozano R, Michaud C, Ezzati M, et al. Years lived with disability (YLDs) for 1160 sequelae of 289 diseases and injuries 1990-2010: a systematic analysis for the Global Burden of Disease Study 2010. Lancet. 2012;380(9859):2163-96.
64 Murray CJL, Vos T, Lozano R, Naghavi M, Flaxman AD, Michaud C, et al. Disability-adjusted life years (DALYs) for 291 diseases and injuries in 21 regions, 1990-2010: a systematic analysis for the Global Burden of Disease Study 2010. Lancet. 2012;380(9859):2197-223.
65 Baltussen R, Smith A. Cost effectiveness of strategies to combat vision and hearing loss in sub-Saharan Africa and South East Asia: mathematical modelling study. BMJ. 2012;344:e615. Epub 2012/03/06.
66 Cockburn N, Steven D, Lecuona K, Joubert F, Rogers G, Cook C, et al. Prevalence, causes and socio-economic determinants of vision loss in Cape Town. PloS one. 2012;7(2):e30718. Epub 2012/03/01.
67 Annual Health Statistics 2012. Pretoria: National Department of Health; 2013.
68 General Household Survey 2009. Statistical release P0318 (Revised version). Pretoria: Statistics South Africa; 2010.
69 General Household Survey 2010. Statistical release P0318 (Revised version). Pretoria: Statistics South Africa; 2011.
70 Public Health Surveillance System. Volume 1. Number 2: April-June 2011. Epidemiological comments. Pretoria: National Department of Health; 2011.
71 Communicable Diseases Surveillance Bulletin. Volume 10, No 1, April 2012. Johannesburg: National Institute for Communicable Diseases (NICD); 2012.
72 The National Antenatal Sentinel HIV and Syphilis Prevalence Survey, South Africa, 2011. Pretoria: National Department of Health; 2012.
73 Simons E, Ferrari M, Fricks J, Wannemuehler K, Anand A, Burton A, et al. Assessment of the 2010 global measles mortality reduction goal: results from a model of surveillance data. Lancet. 2012;379(9832):2173-8. Epub 2012/04/27.
74 Crompton DW, editor. Sustaining the drive to overcome the global impact of neglected tropical diseases: second WHO report on neglected diseases. Geneva: World Health Organization; 2013.
75 Communicable Diseases Surveillance Bulletin. Volume 9, No 1, March 2011. Johannesburg: National Institute for Communicable Diseases (NICD); 2011.
76 Communicable Diseases Surveillance Bulletin. Volume 10, No 4, November 2012. Johannesburg: National Institute for Communicable Diseases (NICD); 2012.

Health and Related Indicators 17
SAHR 2012/13 317
77 The 2010 National Antenatal Sentinel HIV & Syphilis prevalence survey in South Africa. Pretoria: National Department of Health; 2011.
78 World Malaria Report 2012. Geneva: World Health Organization; 2012.
79 Moonasar D, Asomugha C, Baker L, Blumberg L, Barnes KI, Maharaj R, et al. Preventing disease and saving lives: the malaria season is upon us. S Afr Med J. 2011;101(12):865-7. Epub 2012/01/26.
80 Ngomane L, de Jager C. Changes in malaria morbidity and mortality in Mpumalanga Province, South Africa (2001-2009): a retrospective study. Malar J. 2012;11:19.
81 World Malaria Report 2011. Geneva: World Health Organization; 2011.
82 New estimates of malaria deaths: concern and opportunity. Lancet. 2012;379(9814):385.
83 Mortality and causes of death in South Africa, 2007: Findings from death notification. Statistical release P03093. Pretoria: Statistics South Africa; 2009.
84 Mortality and causes of death in South Africa, 2008: Findings from death notification. Statistical release P03093. Pretoria: Statistics South Africa; 2010.
85 Global Tuberculosis Report 2012. Geneva: World Health Organization; 2012.
86 Meyer-Rath G, Schnippel K, Long L, MacLeod W, Sanne I, Stevens W, et al. The impact and cost of scaling up GeneXpert MTB/RIF in South Africa. PloS one. 2012;7(5):e36966. Epub 2012/06/14.
87 Zignol M, van Gemert W, Falzon D, Sismanidis C, Glaziou P, Floyd K, et al. Surveillance of anti-tuberculosis drug resistance in the world: an updated analysis, 2007-2010. Bull World Health Organ. 2012;90(2):111-9D. Epub 2012/03/17.
88 du Cros P, Nyang’wa BT, Gale M, Venis S, Ford N. Counting children: comparing reporting for paediatric HIV and tuberculosis. Bull World Health Organ. 2011;89(12):855.
89 Corbett EL, Marston B, Churchyard GJ, De Cock KM. Tuberculosis in sub-Saharan Africa: opportunities, challenges, and change in the. Lancet. 2006;367(9514):926-37. Epub 2006/03/21.
90 Auld S, Kim L, Webb E, Podewils L, Uys M. Completeness and concordance of TB and HIV surveillance systems for TB-HIV co-infected patients in South Africa. Int J Tuberc Lung Dis. 2013;17(2):186-91.
91 Global Tuberculosis Report 2011. Geneva: World Health Organization; 2011.
92 Pillay Y, White C, McCormick N. How times have changed: HIV and AIDS in South Africa in 2011. S Afr Med J. 2012;102(2):77-8. Epub 2012/02/09.
93 Kawonga M, Blaauw D, Fonn S. Aligning vertical interventions to health systems: a case study of the HIV monitoring and evaluation system in South Africa. Health Research Policy and Systems. 2012;10(1):2.
94 Gomez-Olive FX, Angotti N, Houle B, Klipstein-Grobusch K, Kabudula C, Menken J, et al. Prevalence of HIV among those 15 and older in rural South Africa. AIDS care. 2013. Epub 2013/01/15.
95 Barron P, Pillay Y, Doherty T, Sherman G, Jackson D, Bhardwaj S, et al. Eliminating mother-to-child HIV transmission in South Africa. Bull World Health Organ. 2013;91(1):70-4.
96 Goga A, Dinh T, Jackson D, for the SAPMTCTE study group. Evaluation of the Effectiveness of the National Prevention of Mother-to-Child Transmission (PMTCT) Programme Measured at Six Weeks Postpartum in South Africa, 2010.: South African Medical Research Council, National Department of Health of South Africa and PEPFAR/US Centers for Disease Control and Prevention; 2012.
97 SAPMTCTE study group. Effectiveness of the National Prevention of Mother-to-Child Transmission (PMTCT) Programme in South Africa: 2010 and Preliminary 2011 National SAPMTCT Survey Results. South Africa: South African Medical Research Council, National Department of Health of South Africa and PEPFAR/US Centers for Disease Control and Prevention; 2012.
98 Grimwood A, Fatti G, Mothibi E, Eley B, Jackson D. Progress of preventing mother-to-child transmission of HIV at primary healthcare facilities and district hospitals in three South African provinces. S Afr Med J. 2012;102(2):81-3. Epub 2012/02/09.
99 Horwood C, Vermaak K, Butler L, Haskins L, Phakathi S, Rollins N. Elimination of paediatric HIV in KwaZulu-Natal, South Africa: large-scale. Bull World Health Organ. 2012;90(3):168-75. Epub 2012/03/31.
100 Ekouevi DK, Stringer E, Coetzee D, Tih P, Creek T, Stinson K, et al. Health facility characteristics and their relationship to coverage of PMTCT of HIV services across four African countries: the PEARL study. PloS one. 2012;7(1):e29823.
101 Goga AE, Doherty T, Jackson DJ, Sanders D, Colvin M, Chopra M, et al. Infant feeding practices at routine PMTCT sites, South Africa: results of a prospective observational study amongst HIV exposed and unexposed infants - birth to 9 months. International Breastfeeding Journal. 2012;7(1):4.
102 Meyers T, Dramowski A, Schneider H, Gardiner N, Kuhn L, Moore D. Changes in pediatric HIV-related hospital admissions and mortality in Soweto, South Africa 1996-2011: light at the end of the tunnel? J Acquir Immune Defic Syndr. 2012;60(5):503-10. Epub 2012/04/11.
103 Key Findings of the Third South African National HIV Communication Survey, 2012. Third South African National HIV Communication Survey. South Africa: Johns Hopkins Health and Education in South Africa (JHHESA); 2012.
104 South African National HIV, Behaviour Health Survey 2012: Fact Sheet 1. Human Sciences Research Council (HSRC); 2012; Available from: http://www.hsrc.ac.za/Document-4331.phtml.
105 Ford N, Calmy A, Mills EJ. The first decade of antiretroviral therapy in Africa. Global Health. 2011;7:33.
106 Speed up Scale-up: Strategies, tools and policies to get the best HIV treatment to more people, sooner. Geneva: Médecins Sans Frontières; 2012.
107 Johnson LF. Access to antiretroviral treatment in South Africa, 2004 - 2011. South Afr J HIV Med. 2012;13(1):22-7.
108 Patel SD, Larson E, Mbengashe T, O’Bra H, Brown JW, Golman TM, et al. Increases in pediatric antiretroviral treatment, South Africa 2005-2010. PloS one. 2012;7(9):e44914.
109 Johnson LF, White PJ. A review of mathematical models of HIV/AIDS interventions and their implications for policy. Sex Transm Infect. 2011;87(7):629-34.
110 Johnson LF, Hallett TB, Rehle TM, Dorrington RE. The effect of changes in condom usage and antiretroviral treatment coverage on human immunodeficiency virus incidence in South Africa: a model-based analysis. J R Soc Interface. 2012;9(72):1544-54.

318 SAHR 2012/13
111 Johnson LF, Davies MA, Moultrie H, Sherman GG, Bland RM, Rehle TM, et al. The Effect of Early Initiation of Antiretroviral Treatment in Infants Receiving. Pediatr Infect Dis J. 2011. Epub 2011/12/23.
112 Johnson LF, Stinson K, Newell ML, Bland RM, Moultrie H, Davies MA, et al. The contribution of maternal HIV seroconversion during late pregnancy and breastfeeding to mother-to-child transmission of HIV. J Acquir Immune Defic Syndr. 2012;59(4):417-25. Epub 2011/12/24.
113 Hontelez JA, de Vlas SJ, Baltussen R, Newell ML, Bakker R, Tanser F, et al. The impact of antiretroviral treatment on the age composition of the HIV epidemic. AIDS. 2012;26 Suppl 1:S19-30. Epub 2012/09/26.
114 Tanser F, Bärnighausen T, Grapsa E, Zaidi J, Newell M-L. High Coverage of ART Associated with Decline in Risk of HIV Acquisition in Rural KwaZulu-Natal, South Africa. Science. 2013;339:966-71.
115 Global report: UNAIDS report on the global AIDS epidemic 2012. Geneva: UNAIDS; 2012.
116 Towards Universal Access: Scaling up priority HIV/AIDS interventions in the health sector. Progress Report 2010. Geneva: WHO, UNAIDS, UNICEF; 2010.
117 Global HIV/AIDS response: Epidemic update and health sector progress towards Universal Access: Progress Report 2011. Geneva: World Health Organization; 2011.
118 National Antenatal Sentinel HIV and Syphilis Prevalence Survey in South Africa, 2009. Pretoria: National Department of Health; 2010.
119 Chandran TM, Berkvens D, Chikobvu P, Nostlinger C, Colebunders R, Williams BG, et al. Predictors of condom use and refusal among the population of Free State province in South Africa. BMC public health. 2012;12(1):381. Epub 2012/05/30.
120 Schwartz SR, Rees H, Mehta S, Venter WD, Taha TE, Black V. High incidence of unplanned pregnancy after antiretroviral therapy initiation. PloS one. 2012;7(4):e36039. Epub 2012/05/05.
121 Beksinska ME, Smit JA, Mantell JE. Progress and challenges to male and female condom use in South Africa. Sex Health. 2012;9(1):51-8.
122 Lewis DA, Chirwa TF, Msimang VM, Radebe FM, Kamb ML, Firnhaber CS. Urethritis/cervicitis pathogen prevalence and associated risk factors among asymptomatic HIV-infected patients in South Africa. Sex Transm Dis. 2012;39(7):531-6.
123 Young Africa Live (YAL) Sex Survey 2012. Preakelt Foundation; 2012; Available from: http://www.praekeltfoundation.org/docs/YALSexSurvey2012_PollsResults.pdf.
124 Mark D, Middelkoop K, Black S, Roux S, Fleurs L, Wood R, et al. Low acceptability of medical male circumcision as an HIV/AIDS prevention intervention within a South African community that practises traditional circumcision. S Afr Med J. 2012;102(6):571-3. Epub 2012/06/07.
125 van Loggerenberg F, Dieter AA, Sobieszczyk ME, Werner L, Grobler A, Mlisana K. HIV prevention in high-risk women in South Africa: condom use and the need for change. PloS one. 2012;7(2):e30669.
126 Rawe K. Every Woman’s Right: How family planning saves children’s lives. London: Save the Children, 2012.
127 Singh S, Darroch JE. Adding It Up: Costs and Benefits of Contraceptive Services. Estimates for 2012. New York: Guttmacher Institute and United Nations Population Fund (UNFPA), 2012.
128 Karra M, Lee M. Human capital consequences of teenage childbearing in South Africa. Research Brief March 2012. Washington: Population Reference Bureau; 2012.
129 Orner PJ, de Bruyn M, Barbosa RM, Boonstra H, Gatsi-Mallet J, Cooper DD. Access to safe abortion: building choices for women living with HIV and AIDS. J Int AIDS Soc. 2011;14:54. Epub 2011/11/15.
130 Sedgh G, Singh S, Shah IH, Ahman E, Henshaw SK, Bankole A. Induced abortion: incidence and trends worldwide from 1995 to 2008. Lancet. 2012;379(9816):625-32.
131 Devjee J, Khedun SM, Moodley J, Devjee J, Khedun SM, Moodley J. An audit of surgical termination of pregnancy at a level 1 health facility in South Africa. South African Family Practice. 2011;54(1):72-6.
132 Johnson S, Kincaid L, Laurence S, Chikwave F, Delate R, Mahlasela L. Second National HIV Communication Survey 2009. Pretoria: Johns Hopkins Health and Education in South Africa (JHHESA); 2010.
133 Annual Report 2009/10. Pretoria: National Department of Health; 2010.
134 Annual Report 2010/11. Pretoria: National Department of Health; 2011.
135 Annual Report 2011-2012. Pretoria: National Department of Health; 2012.
136 Strategic Plan for Maternal, Newborn, Child and Women’s Health (MNCWH) and Nutrition in South Africa: 2012-2012. Pretoria: National Department of Health; 2012. Available from: http://www.doh.gov.za/docs/stratdocs/2012/MNCWHstratplan.pdf.
137 South Africa’s National Strategic Plan for a Campaign on Accelerated Reduction of Maternal and Child Mortality in Africa (CARMMA). Pretoria: National Department of Health; 2012. Available from: http://www.doh.gov.za/docs/stratdocs/2012/carmma.pdf.
138 The Partnership for Maternal Newborn & Child Health. Essential interventions, commodities and guidelines for reproductive, maternal, newborn and child health. Geneva: PMNCH; 2011.
139 Pattinson R, Fawcus S, Moodley J, for the National Committee for Confidential Enquiries into Maternal Deaths. Ninth interim report on the Confidential Enquiries into Maternal Deaths in South Africa. Pretoria: National Department of Health; 2012.
140 Masuku M, Mampe T, Matse M, Jassat W. Community Dialogues: North West Province. Durban: Health Systems Trust; 2012.
141 The Maternal Mortality Estimation Inter-Agency Group (MMEIG). Trends in maternal mortality: 1990 to 2010: WHO, UNICEF, UNFPA and the World Bank estimates. Geneva: World Health Organization; 2012.
142 National Perinatal Mortality and Morbidity Committee (NaPeMMCo) Triennial Report (2008-2010). Pretoria: National Department of Health; 2011. Available from: http://doh.gov.za/docs/reports/2011/perireport.pdf.
143 National Committee for Confidential Enquiries into Maternal Deaths. Saving Mothers 2008-2010: Fifth report on Confidential Enquiries into Maternal Deaths in South Africa (summary). Pretoria: National Department of Health; 2012. Available from: http://www.doh.gov.za/docs/reports/2012/savingmothersshort.pdf.
144 Lozano R, Wang H, Foreman KJ, Rajaratnam JK, Naghavi M, Marcus JR, et al. Progress towards Millennium Development Goals 4 and 5 on maternal and child mortality: an updated systematic analysis. Lancet. 2011;378(9797):1139-65.

Health and Related Indicators 17
SAHR 2012/13 319
145 School Health Policy and Implementation Guidelines June 2011. Pretoria: National Department of Health; 2011.
146 Integrated School Health Policy. Pretoria: National Department of Health and National Department of Basic Education; 2012.
147 The State of the World’s Children 2012. New York: United National Children’s Fund (UNICEF); 2012.
148 Cobham A, Molina N, Garde M. The Child Development Index 2012: Progress, challenges and inequality. London: Save the Children; 2012.
149 1st Triennial Report of the Committe on Morbidity and Mortality in Children under 5 Years (CoMMiC). Pretoria: National Department of Health; 2011. Available from: http://doh.gov.za/docs/reports/2011/morbreport.pdf.
150 Sartorius BK, Sartorius K, Chirwa TF, Fonn S. Infant mortality in South Africa--distribution, associations and policy implications, 2007: an ecological spatial analysis. Int J Health Geogr. 2011;10:61.
151 Velaphi S, Rhoda N. Reducing neonatal deaths in South Africa – are we there yet, and what can be done? SA Journal of Child Health. 2012;6(3):67-71.
152 Howson C, Kinney M, Lawn J, editors. Born too soon: The Global Action Report on Preterm Birth. Geneva: World Health Organization; 2012.
153 Pneumonia and diarrhoea: Tackling the deadliest diseases for the world’s poorest children. New York: United Nations Children’s Fund (UNICEF); 2012.
154 Blencowe H, Cousens S, Oestergaard MZ, Chou D, Moller AB, Narwal R, et al. National, regional, and worldwide estimates of preterm birth rates in the year. Lancet. 2012;379(9832):2162-72. Epub 2012/06/12.
155 Liu L, Johnson HL, Cousens S, Perin J, Scott S, Lawn JE, et al. Global, regional, and national causes of child mortality: an updated systematic analysis for 2010 with time trends since 2000. Lancet. 2012;379(9832):2151-61.
156 Hill K, You D, Inoue M, Oestergaard MZ. Child mortality estimation: accelerated progress in reducing global child mortality, 1990-2010. PLoS Med. 2012;9(8):e1001303.
157 Anthony D, Mullerbeck E, editors. Committing to Child Survival: A Promise Renewed. Progress Report 2012. New York: United Nations Children’s Fund (UNICEF); 2012.
158 Barros AJ, Ronsmans C, Axelson H, Loaiza E, Bertoldi AD, Franca GV, et al. Equity in maternal, newborn, and child health interventions in Countdown to 2015: a retrospective review of survey data from 54 countries. Lancet. 2012;379(9822):1225-33.
159 Requejo J, Bryce J, Victora C. Building a Future for Women and Children: The 2012 Report. Countdown to 2015: Maternal, Newborn & Child Survival. Washington DC: WHO and UNICEF; 2012.
160 Muldoon KA, Galway LP, Nakajima M, Kanters S, Hogg RS, Bendavid E, et al. Health system determinants of infant, child and maternal mortality: A cross-sectional study of UN member countries. Global Health. 2011;7:42.
161 Cresswell JA, Campbell OM, De Silva MJ, Filippi V. Effect of maternal obesity on neonatal death in sub-Saharan Africa: multivariable analysis of 27 national datasets. Lancet. 2012;380(9850):1325-30. Epub 2012/08/14.
162 Alkema L, You D. Child mortality estimation: a comparison of UN IGME and IHME estimates of levels and trends in under-five mortality rates and deaths. PLoS Med. 2012;9(8):e1001288.
163 Nannan N, Dorrington R, Laubscher R, Zinyakatira N, Prinsloo M, Darikwa T, et al. Under-5 mortality statistics in South Africa: shedding some light on the trends and causes 1997-2007. Cape Town: South African Medical Research Council; 2012.
164 You D, New JR, Wardlaw T. Levels and Trends in Child Mortality: Report 2012. New York: UNICEF; 2012.
165 Pattinson R, editor. Saving babies 2008-2009: Seventh report on perinatal care in South Africa. Pretoria: Tshepesa Press; 2011.
166 National Perinatal Mortality and Morbidity Committee (NaPeMMCo) Interim Report 2012 (2010-2011 data). Pretoria: National Department of Health; 2012. Available from: http://doh.gov.za/docs/reports/2011/perireport.pdf.
167 Hogan M, Lopez A, Lozano R, Murray C, Naghavi M, Rajaratnam J. Building Momentum: Global Progress toward reducing maternal and child mortality. Seattle: Institute for Health Metrics and Evaluation; 2010.
168 Hall K, Woolard I, Lake L, Smith C. South African Child Gauge 2012. Cape Town: Children’s Institute, University of Cape Town; 2012.
169 Jamieson L, Bray R, Viviers A, Lake L, Pendlebury S, Smith C, et al. South African Child Gauge 2010/2011. Cape Town: Children’s Institute, University of Cape Town; 2011.
170 Children Count - Abantwana Babalulekile site. Children’s Institute; Available from: http://www.childrencount.ci.org.za/
171 Wiysonge CS, Ngcobo NJ, Jeena PM, Madhi SA, Schoub BD, Hawkridge A, et al. Advances in childhood immunisation in South Africa: where to now? Programme managers’ views and evidence from systematic reviews. BMC public health. 2012;12:578.
172 Tate JE, Burton AH, Boschi-Pinto C, Steele AD, Duque J, Parashar UD. 2008 estimate of worldwide rotavirus-associated mortality in children younger than 5 years before the introduction of universal rotavirus vaccination programmes: a systematic review and meta-analysis. Lancet Infect Dis. 2012;12(2):136-41. Epub 2011/10/28.
173 Progress in global measles control, 2000-2010. MMWR Morb Mortal Wkly Rep. 2012;61(4):73-8.
174 Global control and regional elimination of measles, 2000-2011. MMWR Morb Mortal Wkly Rep. 2013;62:27-31.
175 Atherly DE, Lewis KD, Tate J, Parashar UD, Rheingans RD. Projected health and economic impact of rotavirus vaccination in GAVI-eligible countries: 2011-2030. Vaccine. 2012;30 Suppl 1:A7-14.
176 Immunization Summary: A statistical reference containing data through 2011. New York: UNICEF and WHO; 2012. Available from: http://www.childinfo.org/immunization.html.
177 Burton A, Monasch R, Lautenbach B, Gacic-Dobo M, Neill M, Karimov R, et al. WHO and UNICEF estimates of national infant immunization coverage: methods and processes. Bull World Health Organ. 2009;87(7):535-41. Epub 2009/08/04.
178 Burton A, Kowalski R, Gacic-Dobo M, Karimov R, Brown D. A Formal Representation of the WHO and UNICEF Estimates of National Immunization. PloS one. 2012;7(10):e47806. Epub 2012/11/08.
179 Kowalski R, Burton A. WUENIC – A Case Study in Rule-Based Knowledge Representation and Reasoning. In: Okumura M, Bekki D, Satoh K, editors. New Frontiers in Artificial Intelligence: Springer Berlin Heidelberg; 2012. p. 112-25.

320 SAHR 2012/13
180 Ardington C, Gasealahwe B. Health: Analysis of the NIDS Wave 1 and 2 Datasets. SALDRU Working Paper Number 80 / NIDS Discussion Paper 2012/3. Cape Town: Southern African Labour and Development Research Unit (SALDRU); 2012.
181 Labadarios D, McHiza ZJ, Steyn NP, Gericke G, Maunder EM, Davids YD, et al. Food security in South Africa: a review of national surveys. Bull World Health Organ. 2011;89(12):891-9.
182 Steyn NP, Labadarios D, Nel JH. Factors which influence the consumption of street foods and fast foods in South Africa--a national survey. Nutr J. 2011;10:104.
183 Feeley A, Musenge E, Pettifor JM, Norris SA. Changes in dietary habits and eating practices in adolescents living in urban South Africa: the birth to twenty cohort. Nutrition. 2012;28(7-8):e1-6.
184 Igumbor EU, Sanders D, Puoane TR, Tsolekile L, Schwarz C, Purdy C, et al. ‘Big food,’ the consumer food environment, health, and the policy response in South Africa. PLoS Med. 2012;9(7):e1001253.
185 Doherty T, Sanders D, Jackson D, Swanevelder S, Lombard C, Zembe W, et al. Early cessation of breastfeeding amongst women in South Africa: an area needing urgent attention to improve child health. BMC Pediatrics. 2012;12(1):105.
186 Stevens GA, Finucane MM, Paciorek CJ, Flaxman SR, White RA, Donner AJ, et al. Trends in mild, moderate, and severe stunting and underweight, and progress towards MDG 1 in 141 developing countries: a systematic analysis of population representative data. Lancet. 2012;380(9844):824-34.
187 Reddy S, James S, Sewpaul R, Koopman F, Funani N, Sifunda S, et al. Umthente Uhlaba Usamila - The South African Youth Risk Behaviour Survey 2008. Cape Town: South African Medical Research Council; 2010.
188 Ardington C, Case A. Health: Analysis of the NIDS Wave 1 Dataset. Discussion Paper No 2. Cape Town: Southern Africa Labour and Development Research Unit (SALDRU); 2009.
189 World Health Statistics 2012. Geneva: World Health Organization; 2012.
190 A comprehensive global monitoring framework, including indicators, and a set of voluntary global targets for the prevention and control of noncommunicable diseases (v3) [Revised WHO Discussion Paper (version dated 2012 July 25)]. Geneva: World Health Organization; 2012. Available from: http://www.who.int/nmh/events/2012/ncd_discussion_paper/en/index.html.
191 Report of the Formal Meeting of Member States to conclude the work on the comprehensive global monitoring framework, including indicators and a set of voluntary global targets for the prevention and control of noncommunicable diseases. Geneva: World Health Organization; 2012. Available from: http://apps.who.int/gb/NCDs/.
192 Beaglehole R, Bonita R, Horton R, Ezzati M, Bhala N, Amuyunzu-Nyamongo M, et al. Measuring progress on NCDs: one goal and five targets. Lancet. 2012;380(9850):1283-5.
193 Kowal P, Chatterji S, Naidoo N, Biritwum R, Fan W, Lopez Ridaura R, et al. Data resource profile: the World Health Organization Study on global AGEing and adult health (SAGE). Int J Epidemiol. 2012;41(6):1639-49.
194 Ardington C, Case A. Interactions between Mental Health and Socioeconomic Status in the South African National Income Dynamics Study. Tydskr Stud Ekon Ekon. 2010;34(3):69-85. Epub 2010/01/01.
195 Matsha TE, Hassan MS, Kidd M, Erasmus RT. The 30-year cardiovascular risk profile of South Africans with diagnosed diabetes, undiagnosed diabetes, pre-diabetes or normoglycaemia: the Belville, South Africa pilot study. Cardiovasc J Afr. 2012;23(1):5-11.
196 Malaza A, Mossong J, Barnighausen T, Newell ML. Hypertension and obesity in adults living in a high HIV prevalence rural area in South Africa. PloS one. 2012;7(10):e47761.
197 Ibrahim MM, Damasceno A. Hypertension in developing countries. Lancet. 2012;380(9841):611-9.
198 Newton CR, Garcia HH. Epilepsy in poor regions of the world. Lancet. 2012;380(9848):1193-201. Epub 2012/10/02.
199 Hawton K, Saunders KE, O’Connor RC. Self-harm and suicide in adolescents. Lancet. 2012;379(9834):2373-82.
200 Hosseinpoor AR, Bergen N, Mendis S, Harper S, Verdes E, Kunst A, et al. Socioeconomic inequality in the prevalence of noncommunicable diseases in low- and middle-income countries: results from the World Health Survey. BMC public health. 2012;12:474.
201 Maher D, Ford N, Unwin N. Priorities for developing countries in the global response to non-communicable diseases. Global Health. 2012;8:14.
202 Chisholm D, Baltussen R, Evans DB, Ginsberg G, Lauer JA, Lim S, et al. What are the priorities for prevention and control of non-communicable diseases and injuries in sub-Saharan Africa and South East Asia? BMJ. 2012;344:e586. Epub 2012/03/06.
203 Alleyne G, Binagwaho A, Haines A, Jahan S, Nugent R, Rojhani A, et al. Embedding non-communicable diseases in the post-2015 development agenda. Lancet. 2013. Epub 2013/02/16.
204 Bonita R, Magnusson R, Bovet P, Zhao D, Malta DC, Geneau R, et al. Country actions to meet UN commitments on non-communicable diseases: a stepwise approach. Lancet. 2013. Epub 2013/02/16.
205 Di Cesare M, Khang YH, Asaria P, Blakely T, Cowan MJ, Farzadfar F, et al. Inequalities in non-communicable diseases and effective responses. Lancet. 2013. Epub 2013/02/16.
206 Beaglehole R, Bonita R, Horton R. Independent global accountability for NCDs. Lancet. 2013. Epub 2013/02/16.
207 Hogerzeil HV, Liberman J, Wirtz VJ, Kishore SP, Selvaraj S, Kiddell-Monroe R, et al. Promotion of access to essential medicines for non-communicable diseases: practical implications of the UN political declaration. Lancet. 2013. Epub 2013/02/16.
208 Soerjomataram I, Lortet-Tieulent J, Parkin DM, Ferlay J, Mathers C, Forman D, et al. Global burden of cancer in 2008: a systematic analysis of disability-adjusted life-years in 12 world regions. Lancet. 2012;380(9856):1840-50. Epub 2012/10/20.
209 Bray F, Jemal A, Grey N, Ferlay J, Forman D. Global cancer transitions according to the Human Development Index (2008-2030): a population-based study. Lancet Oncol. 2012;13(8):790-801.
210 Firnhaber C, Westreich D, Schulze D, Williams S, Siminya M, Michelow P, et al. Highly active antiretroviral therapy and cervical dysplasia in HIV-positive women in South Africa. J Int AIDS Soc. 2012;15(2):1-6.
211 Goltz S, Kenny A, Rosella K. Delivering cervical cancer prevention in the developing world. New York: Women Deliver; 2011. Available from: http://www.womendeliver.org.

Health and Related Indicators 17
SAHR 2012/13 321
212 Stefan DC, Stones DK. The South African Paediatric Tumour Registry - 25 years of activity. S Afr Med J. 2012;102(7):605-6. Epub 2012/07/04.
213 Smith S, Ralston J, Taubert K. Urbanization and cardiovascular disease: Raising heart-healthy children in today’s cities. Geneva: The World Heart Federation; 2012. Available from: http://www.worldheart.org/urbanization.
214 Southern Africa Labour and Development Research Unit. National Income Dynamics Study 2008, Wave 1 [dataset]. In: Southern Africa Labour and Development Research Unit (SALDRU), editor. Version 4.1 ed. Cape Town: DataFirst; 2012.
215 Southern Africa Labour and Development Research Unit. National Income Dynamics Study 2010-11, Wave 2 [dataset]. In: Southern Africa Labour and Development Research Unit (SALDRU), editor. Version 1 ed. Cape Town: DataFirst; 2012.
216 Ramsoomar L, Morojele NK. Trends in alcohol prevalence, age of initiation and association with alcohol-related harm among South African youth: Implications for policy. S Afr Med J. 2012;102(7):609-12.
217 Onya H, Tessera A, Myers B, Flisher A. Community influences on adolescents’ use of home-brewed alcohol in rural South Africa. BMC public health. 2012;12:642.
218 Giovino GA, Mirza SA, Samet JM, Gupta PC, Jarvis MJ, Bhala N, et al. Tobacco use in 3 billion individuals from 16 countries: an analysis of nationally representative cross-sectional household surveys. Lancet. 2012;380(9842):668-79.
219 Hosseinpoor AR, Parker LA, Tursan d’Espaignet E, Chatterji S. Socioeconomic inequality in smoking in low-income and middle-income countries: results from the World Health Survey. PloS one. 2012;7(8):e42843.
220 WHO Global Report: Mortality attributable to tobacco. Geneva: World Health Organization; 2012.
221 Okeke P, Ross A, Esterhuizen T, van Wyk J. Tobacco and alcohol use among healthcare workers in three public hospitals in KwaZulu-Natal, South Africa. S Afr Fam Pract. 2012;54(1):61-7.
222 Hallal PC, Andersen LB, Bull FC, Guthold R, Haskell W, Ekelund U. Global physical activity levels: surveillance progress, pitfalls, and prospects. Lancet. 2012;380(9838):247-57.
223 Bauman AE, Reis RS, Sallis JF, Wells JC, Loos RJF, Martin BW. Correlates of physical activity: why are some people physically active and others not? Lancet. 2012;380(9838):258-71.
224 Lee IM, Shiroma EJ, Lobelo F, Puska P, Blair SN, Katzmarzyk PT. Effect of physical inactivity on major non-communicable diseases worldwide: an analysis of burden of disease and life expectancy. Lancet. 2012;380(9838):219-29.
225 Pratt M, Sarmiento OL, Montes F, Ogilvie D, Marcus BH, Perez LG, et al. The implications of megatrends in information and communication technology and transportation for changes in global physical activity. Lancet. 2012;380(9838):282-93.
226 Kohl HW, Craig CL, Lambert EV, Inoue S, Alkandari JR, Leetongin G, et al. The pandemic of physical inactivity: global action for public health. Lancet. 2012;380(9838):294-305.
227 Das P, Horton R. Rethinking our approach to physical activity. Lancet. 2012;380(9838):190-1.
228 Dada S, Plüddemann A, Parry C, Bhana A, Vawda M, Fourie D. Alcohol and Drug Abuse Trends: July - December 2011 (Phase 31). Update (June 2012). Cape Town: South African Community Epidemiology Network on Drug Use (SACENDU); 2012.
229 Dada S, Plüddemann A, Williams Y, Parry C, Bhana A, Vawda M, et al. Monitoring Alcohol and Drug Abuse Treatment Admissions in South Africa. August 2012 Phase 31. Cape Town: South African Community Epidemiology Network on Drug Use (SACENDU); 2012.
230 Dada S, Plüddemann A, Parry C, Bhana A, Vawda M, Perreira T, et al. Monitoring Alcohol & Drug Abuse Trends in South Africa (July 1996 - December 2011). SACENDU Research Brief Vol 15(1). Cape Town: South African Community Epidemiology Network on Drug Use (SACENDU); 2012.
231 Plüddemann A, Parry C, Bhana A, Dada S, Fourie D. Alcohol and Drug Abuse Trends: July - December 2009 (Phase 27). Update (June 2010). Cape Town: South African Community Epidemiology Network on Drug Use (SACENDU); 2010.
232 Dada S, Parry C, Plüddemann A, Bhana A, Bachoo S, Fourie D. Alcohol and Drug Abuse Trends: July - December 2010 (Phase 29). Update (June 2011). Cape Town: South African Community Epidemiology Network on Drug Use (SACENDU); 2011.
233 Victims of crime survey 2012. Statistical release P0341. Pretoria: Statistics South Africa; 2012.
234 MRC-UNISA Safety & Peace Promotion Research Unit (SAPPRU). A Profile of Fatal Injuries in Gauteng 2010. Cape Town: Medical Research Council; 2012. Available from: http://www.mrc.ac.za/crime/nimms.htm.
235 MRC-UNISA Safety & Peace Promotion Research Unit (SAPPRU). A Profile of Fatal Injuries in Mpumalanga 2010. Cape Town: Medical Research Council; 2012. Available from: http://www.mrc.ac.za/crime/nimms.htm.
236 Chisholm D, Naci H, Hyder AA, Tran NT, Peden M. Cost effectiveness of strategies to combat road traffic injuries in sub-Saharan Africa and South East Asia: mathematical modelling study. BMJ. 2012;344(mar02 1):e612-e.
237 Chokotho LC, Matzopoulos R, Myers JE. Drivers’ risk profile indicates the need for a graduated driving licence in South Africa. S Afr Med J. 2012;102(9):749-51. Epub 2012/09/11.
238 Balme KH, Roberts JC, Glasstone M, Curling L, Mann MD. The changing trends of childhood poisoning at a tertiary children’s hospital in South Africa. S Afr Med J. 2012;102(3 Pt 1):142-6. Epub 2012/03/03.
239 Kalula SZ. Prevalence and the problem of falls in older persons. PHASA newsletter. South Africa: Public Health Association of South Africa; 2012.
240 Pillay KK, Ross A, Van der Linde S. Trauma unit workload at King Edward VIII Hospital, Durban, KwaZulu-Natal. S Afr Med J. 2012;102(5):307-8. Epub 2012/05/05.
241 Govender I, Matzopoulos R, Makanga P, Corrigall J. Piloting a trauma surveillance tool for primary healthcare emergency centres. S Afr Med J. 2012;102(5):303-6. Epub 2012/05/05.
242 Blumenthal R, Trengrove E, Jandrell IR, Saayman G. Lightning medicine in South Africa. S Afr Med J. 2012;102(7):625-6. Epub 2012/07/04.
243 RTMC. Road Traffic Report for the Calendar Year 2009. Pretoria: Road Traffic Management Corporation; 2010. Available from: http://www.rtmc.co.za.

322 SAHR 2012/13
244 RTMC. Road Traffic Report 31 December 2010. Pretoria: Road Traffic Management Corporation; 2011. Available from: http://www.rtmc.co.za.
245 Honda A, McIntyre D. Community preferences for improving public sector health services in South Africa: What aspects of public sector health service quality improvements should be prioritised? HEU Policy Brief. Cape Town: Health Economics Unit; 2012.
246 Alaba OA, McIntyre D. What do we know about health service utilisation in South Africa? Development Southern Africa. 2012;25(5):704-24.
247 Wilbury & Claymore. Hospitals Direct Database. Version 2-2 ed. Sandton: Media 24; 2010.
248 Integration of the public and private sectors under a National Health Insurance (NHI) system in SA. Health Reform Note 4. Stellenbosch: Econex; 2010.
249 Human Resources for Health South Africa: HRH Strategy for the Health Sector: 2012/13-2016/17. Pretoria: National Department of Health, 2012.
250 Riley PL, Zuber A, Vindigni SM, Gupta N, Verani A, Sunderland NL, et al. Information systems on human resources for health: a global review. Hum Resour Health. 2012;10(1):7. Epub 2012/05/02.
251 District Clinical Specialist Teams in South Africa: Ministerial Task Team Report to the Honourable Minister of Health, Dr Aaron Motsoaledi. Pretoria: National Department of Health; 2012.
252 Doherty J, Couper I, Fonn S. Will clinical associates be effective for South Africa? S Afr Med J. 2012;102(11 Pt 1):833-5. Epub 2012/11/03.
253 Scott V, Mathews V, Gilson L. Constraints to implementing an equity-promoting staff allocation policy: understanding mid-level managers’ and nurses’ perspectives affecting implementation in South Africa. Health Policy Plan. 2012;27(2):138-46.
254 All the Talents: How new roles and better teamwork can release potential and improve health services. London: All-Party Parliamentary Group on Global Health; 2012. Available from: http://www.appg-globalhealth.org.uk.
255 Fairall L, Bachmann MO, Lombard C, Timmerman V, Uebel K, Zwarenstein M, et al. Task shifting of antiretroviral treatment from doctors to primary-care nurses in South Africa (STRETCH): a pragmatic, parallel, cluster-randomised trial. Lancet. 2012;380(9845):889-98.
256 Personnel Administration System (PERSAL). Pretoria: National Treasury - Vulindlela; time series.
257 HPCSA Statistics. South Africa: Health Professions Council of South Africa (HPCSA); time series; Available from: http://www.hpcsa.co.za/statistics.php.
258 Statistics of South African Nursing Council. South Africa: South African Nursing Council (SANC); time series; Available from: http://www.sanc.co.za/stats.htm.
259 Updated GP and Specialist Numbers for SA. Health Reform Note 7 October 2010. Stellenbosch: Econex; 2010.
260 Statistics for registered persons and organisations. Pretoria: South African Pharmacy Council (SAPC); time series; Available from: http://sapc.za.org/B_Statistics.asp.
261 Community Service Professionals data. Pretoria: National Department of Health; time series.
262 Frenk J, de Ferranti D. Universal health coverage: good health, good economics. Lancet. 2012;380(9845):862-4.
263 Lagomarsino G, Garabrant A, Adyas A, Muga R, Otoo N. Moving towards universal health coverage: health insurance reforms in nine developing countries in Africa and Asia. Lancet. 2012;380(9845):933-43.
264 Institute for Health Metrics and Evaluation. Financing Global Health 2011: Continued Growth as MDG Deadline Approaches. Seattle: IHME; 2011.
265 Institute for Health Metrics and Evaluation. Financing Global Health 2012: The end of the Golden Age? Seattle: IHME; 2012.
266 James SL, Gubbins P, Murray CJ, Gakidou E. Developing a comprehensive time series of GDP per capita for 210 countries from 1950 to 2015. Population Health Metrics. 2012;10(1):12.
267 McIntyre D. What progress has been made towards the equitable allocation of health care resources in South Africa;. Equinet Discussion Paper 91. Harare: Equinet; 2012.
268 Mills A, Ataguba JE, Akazili J, Borghi J, Garshong B, Makawia S, et al. Equity in financing and use of health care in Ghana, South Africa, and Tanzania: implications for paths to universal coverage. Lancet. 2012;380(9837):126-33. Epub 2012/05/18.
269 van den Heever AM. The role of insurance in the achievement of universal coverage within a developing country context: South Africa as a case study. BMC public health. 2012;12(Suppl 1):S5.
270 The Contribution of HASA Member Hospitals to the South African Economy. Research Note 25. Stellenbosch: Econex; 2012.
271 Public vs. Private Health Sector Rationing Mechanisms: Theoretical and Practical Considerations. Research Note 27. Stellenbosch: Econex; 2012.
272 Medical Scheme Expenditure on Private Hospitals. Occasional Note August 2012. Stellenbosch: Econex; 2012.
273 McLeod H. Myths about Medical Schemes. National Health Insurance Policy Brief 21. South Africa: Innovative Medicines South Africa; 2012.
274 Mediscor Medicines Review 2011. Centurion: Mediscore PBM (Pty) Ltd; 2012.
275 Govender V, Chersich MF, Harris B, Alaba O, Ataguba JE, Nxumalo N, et al. Moving towards universal coverage in South Africa? Lessons from a voluntary government insurance scheme. Glob Health Action. 2013;6:1-10.
276 Council for Medical Schemes Annual Report 2009-2010. Pretoria: Council for Medical Schemes; 2010.
277 Council for Medical Schemes Annual Report 2010-2011. Pretoria: Council for Medical Schemes; 2011.

SAHR 2012/13 323
AACE Inhibitors Angiotensin Converting Enzyme InhibitorsActNow BC ActNow British ColumbiaACTS Advise, Consent, Test Support ADEC Australian Drug Evaluation CommitteeAIDS Acquired Immune Deficiency SyndromeANC African National CongressANC Antenatal CareANC Antenatal ClientAPI Active Pharmaceutical IngredientsAPP Annual Performance PlanART Antiretroviral Treatment ART Antiretroviral TherapyARV AntiretroviralARV APIs Antiretroviral Active Pharmaceutical IngredientsASSA Actuarial Society of South AfricaASSAf Academy of Science of South AfricaAU African UnionAZT AzidothymidineBBANC Basic Antenatal CareBAS Basic Accounting System BMD Bipolar Mood DisordersBoD Burden of DiseaseBRICS Brazil, Russia, India, China and South Africa CCXR Chest X-RayCVS Concurrent Versions SystemCVD Cardiovascular DiseaseCToP Choice on Termination of PregnancyCSIR Council for Scientific and Industrial Research CSDH Commission on Social Determinants of HealthCPD Continuing Professional DevelopmentCPAP Continuous Positive Airway PressureCOPD Chronic Obstructive Pulmonary DiseaseCOMMiC Committee on Morbidity and Mortality in Children Under 5 YearsComed Coordinating Committee for the Provisioning of Medical SuppliesCOIDA Compensation for Occupational Injuries and Diseases ActCoCT City of Cape TownCMD Central Medicine DepotCI Confidence Interval CHW Community Health WorkerCHP Centre for Health Policy Child PIP Child Healthcare Problem Identification ProgrammeCHEPSAA Consortium on Health Policy and Systems Analysis in AfricaCHC Community Health CentreCHAI Clinton Health Access Initiative CFAI Community Food Action InitiativesCEO Chief Executive OfficerCEDAC Canadian Expert Drugs Advisory CommitteeCDR Common Drug ReviewCDL Chronic Disease ListCDC Centers for Disease ControlCCOD Commissioner for Occupational DiseaseCCMT Comprehensive Care Management and Treatment CCHIP Community Childhood Hunger Identification Project CC Climate ChangeCARMMA Campaign for Accelerated Reduction in Maternal and Child Mortality in Africa
Abbreviations

324 SAHR 2012/13
CAPA Climate Adaptation Plan of ActionCANSA Cancer Association of South AfricaCADTH Canadian Agency for Drugs and Technology in HealthDDALYs Disability Adjusted Life YearsDAM Directorate Affordable MedicinesDCSTs District-based Clinical Specialist Teams DDT Dichlorodiphenyltrichloroethane DEDAT Departments of Economic Development and Tourism DEX District ExecutiveDFID Department for International Development (United Kingdom)DHA Department of Home Affairs DHB District Health Barometer DHER District Health Expenditure Review DHIS District Health Information SystemDHMIS District Health Management Information SystemDHMT District Health Management Team DHS Demographic Health SurveyDHS District Health SystemDMA District Managed Areas DMs District Municipalities DoH Department of HealthDoL Department of LabourDSS Demographic and Surveillance Sites DTI Department of Trade and IndustryDTP3 Diptheria-Tetanus-Pertussis VaccineDWQM Drinking Water Quality Management EECD Early Child DevelopmentECTA Electronic Communications and Transactions ActEDL Paediatric Essential Drugs List PaediatricEDL Primary Care Essential Drugs List Primary CareEDL Secondary Care Essential Drugs List Secondary CareEDL Tertiary and Quarternary Essential Drugs List Tertiary and QuarternaryEFV Efavirenz, SustivaEH Environmental HealthEHR Electronic Health RecordEHS Environmental Health Services EML Essential Medicines ListEMR Electronic Medical RecordEMS Emergency Medical Services EOST Emergency Obstetric Simulation TrainingEPI Expanded Programmme on ImmunisationESMOE Essential Steps in Management of Obstetric EmergenciesETR Electronic Turberculosis Register FFAMSA Family and Marriage Association of South AfricaFET Further Education and TrainingFRATT Facilities Risk Assessment Tool for TuberculosisFS Free State ProvinceFTE Full-Time EquivalentGGBD Global Burden of Disease GDP Gross Domestic ProductGene Xpert MTB/RIF Test to Identify Mycobacterium Tuberculosis and Resistance to RifampicinGERD Gross Domestic Expenditure on Research and Experimental DevelopmentGFATM Global Fund to Fight AIDS, Tuberculosis and MalariaGHS General Household SurveyGISAH Global Information Systems on Alcohol and Health GPS Geographic Positioning System GSK GlaxoSmithKline
Abbreviations
SAHR 2012/13 325
HHAART Highly Active Antiretroviral TherapyHAST HIV/AIDS, STIs and TBHCT HIV Counselling and TestingHCT Health Care TransformationHCW Healthcare workers HCWH Health Care Without HarmHDACC Health Data Advisory and Co-ordination CommitteeHDI Human Development Index HEARD Health Economics and HIV/AIDS Research Division HELPP Hemolysis, Elevated Liver Enzymes, Low PlateletsHEU Health Economics UnitHIS Health Information SystemHIV Human Immunodeficiency VirusHMT Health Management TeamHOD Head of DepartmentHP01-2011TB Tuberculosis Agents HP022011AI Anti-infective AgentsHP04-2012NC Oncology and Immunological AgentsHP06-2012VP Small Volume Parenterals and Insulin DevicesHP07-2012DAI Drops, Aerosols, Inhalers and InhalantsHP08-2012SSD Semi-solid Dosage FormsHP09-2012SD Solid Dosage Forms (tablets)HPCSA Health Professions Council of South Africa HPSP Health Policy and Systems ProgrammeHPSR Health Policy and Systems ResearchHPTN 052 HIV Prevention Trials Network 052HR Human ResourcesHRH Human Resources for HealthHRM Human Resource ManagementHSDSS Health and Socio-Demographic Surveillance SystemHSF Heart and Stroke FoundationHSRC Human Sciences Research CouncilHSSR Health Systems and Services ResearchHST Health Systems TrustHSV2 Herpes Simplex Type 2HTA Health Technology AssessmentHTC Haemophilia Treatment CentersIICIDH International Classification of Impairments Disabilities and Handicaps ICT Information and Communication TechnologyIDP Integrated Development PlanningIHME Institute of Health Metrics and Evaluation IJTLD International Journal of Tuberculosis and Lung DiseaseILO International Labour OrganizationIMC Inter Ministerial CommitteeIMCI Integrated Management of Childhood IllnessiMMR Institutional Maternal Mortality RatioIMR Infant Mortality RateIMSA Innovative Medicines South AfricaINDEPTH International Network for the Demographic Evaluation of Populations and Their HealthINH IsoniazidINN International Nonproprietary NamesIOM Institute of MedicineIP Intellectual PropertyIPC Infection Prevention Control IPT Isoniazid Prevention TreatmentISDMT Integrated Sub-District Management TeamISHP Integrated School Health ProgrammeIT Information TechnologyIVD In Vitro Diagnostics

326 SAHR 2012/13
JJSI/ESI John Snow Inc.’s Enhancing Strategic InformationJUDASA Junior Doctors Association of South AfricaKKCPP Katine Community Partnership ProjectKMC Kangaroo Mother CareKZN KwaZulu-Natal ProvinceLLBW Low Birth WeightLEP Low English Proficiency LIGHTS Lightning Interest Group for Health Technology and Science LMICs Low and Middle Income CountriesLTBI Latent Tuberculosis InfectionMM&E Monitoring and EvaluationMBFI Mother and Baby Friendly Health InitiativeMBOD Medical Bureau for Occupational DiseasesMCC Medicines Control CouncilMDB Municipal Demarcation Board MDGs Millennium Development GoalsMDHS Metro District Health System MDR Multidrug Resistant MEC Member of Executive CouncilMHSA Mine Health and Safety ActMIC Mineworkers Investment Company / Multiple Indicator Cluster SurveyMMR Maternal Mortality RatioMNCWH Maternal, Newborn, Child and Women’s HealthMOC Maintenance of CertificationMoH Ministry of HealthMoHSW Ministry of Health and Social WelfareMP Mitchell’s PlainMP Mpumalanga Province MPH Masters of Public HealthMRC Medical Research CouncilMSAT Multi-Sectoral Action TeamsMSH Management Sciences for HealthMSM Men who have Sex with MenMTB Mycobacteria TuberculosisMTCT Mother-To-Child TransmissionMTSF Medium Term Strategic FrameworkNNaPeMMCo National Perinatal Mortality and Morbidity Committee NCCEMD National Committee for Confidential Enquiries into Maternal Deaths NCDs Non-Communicable DiseasesNDoH National Department of HealthNDP National Drug PolicyNEMLC National Essential Medicines List Committee NGO Non-Governmental OrganisationNHC National Health CouncilNHI National Health InsuranceNHIRD National Health Information Repository and Database NHISSA National Health Information System of South AfricaNHLS National Health Laboratory ServicesNHMIS National Health Management Information SystemNHS National Health ServiceNICD National Institute for Communicable DiseasesNICE The National Institute for Health and Clinical ExcellenceNIDS National Indicator Data SetNIMSS National Mortality Surveillance SystemNPO Non-Profit OrganisationNPR National Population Register NRF National Research Foundation

Abbreviations
SAHR 2012/13 327
NSDA Negotiated Service Delivery AgreementNSP National Strategic Plan NT National TreasuryNVP Nevirapine, ViramuneNW North West ProvinceOODMWA Occupational Diseases in Mines and Works ActODMWA Occupational Diseases in Mines and Works ActOHS Occupational Health and SafetyOHSC Office of Health Standards ComplianceOPD Outpatient DepartmentPPALSA Practical Approach to Lung Health in South AfricaPALSA PLUS programme Practical Approach to Lung Health and HIV/AIDSPBAC Pharmaceutical Benefits Advisory CommitteePBPA Pharmaceutical Benefits Pricing AuthorityPBS Pharmaceutical Benefits SchemePCMA Pharmaceutical Care Management Association of South AfricaPCR Polymerase Chain ReactionPDR Physicians' Desk ReferencePEPFAR President's Emergency Plan for AIDS ReliefPFMA Public Finance Management ActPHARMAC Pharmaceutical Management Agency PHASA Public Health Association of South AfricaPHC Primary Health CarePIMSS Provincial Mortality Surveillance SystemPIP Problem Identification ProgrammePMB Prescribed Minimum Benefits PMDF Proportion Maternal Among Deaths of Females of Reproductive AgePMI Patient Master Index PMTCT Prevention of Mother-to-Child TransmissionPPE Personal Protective EquipmentPPIP Perinatal Problem Identification Programme PPP Private-Public PartnershipPQIC Provincial Quality Improvement CommitteePRICELESS SA Priority Cost Effective Lessons for Systems Strengthening – South AfricaProPeMMCo Provincial Perinatal Morbidity and Mortality Committees PTC Pharmaceutical and Therapeutics CommitteesPTMS Provincial Transversal Management SystemPTSD Post-Traumatic Stress DisorderPURE Prospective Urban Rural EpidemiologicalRR&D Research and DevelopmentRAF Road Accident Fund RESYST Responsive and Resilient Health SystemsRMS Rapid Mortality SystemRPM Plus Rational Pharmaceutical Management PlusRPR Rapid Plasma Reagin RSH Reproductive and Sexual HealthRTMC Road Traffic Management Corporation SSA South AfricaSACBIA South African Consortium for Benefits Incidences Analysis SACENDU South African Epidemiology Network on Drug Abuse SADAP South African Drug Action ProgrammeSADC Southern African Development CommunitySADHS South Africa Demographic and Health SurveySAELPH South African Executive Leadership Programme in Health SAGE Study on Global AGEing and Adult HealthSALDRU Southern African Labour and Development Research UnitSAMA South African Medical AssociationSAMJ South African Medical Journal

328 SAHR 2012/13
SANAC South African National AIDS CouncilSANC South African Nursing CouncilSANHANES South African National Health and Nutrition Examination Survey SAPC South African Pharmacy CouncilSARChi South African Research Chairs InitiativeSASH South African Stress and Health SurveySCA Supreme Court of AppealSD Sub-District SDGs Sustainable Development GoalsSDH Social Determinants of HealthSEP Standards-Essential PatentSES Socio-Economic Status SIR Smoking Impact Ratio SITA State Information Technology AgencySLA Service Level Agreement SOP Standard Operating ProceduresSOPH & FM School of Public Health and Family Medicine of the University of Cape TownSOPH UWC University of the Western Cape School of Public HealthSRHR Sexual and Reproduction Health and Rights SS Sub StructureStats SA Statistics South AfricaSTG Standard Treatment GuidelinesSTIs Sexually Transmitted InfectionsSTRETCH Streamlining Tasks and Roles to Expand Treatment and Care for HIVTTAC Treatment Action CampaignTAC Technology Appraisal CommitteeTasP Treatment as Prevention TB TuberculosisTBIC TB Infection Control TEBA The Employment Bureau of South AfricaTFR Total Fertility Rate TGA Therapeutic Good AdministrationThaiHealth Thai Health Promotion FoundationTRIPS Trade Related Intellectual PropertyUU5MR Under-5 Mortality RateUCT University of Cape TownUFH University of Fort HareUHC Universal Health Coverage UK United KingdomUN United NationsUN IGME United Nations Inter-agency Group for Child Mortality EstimationUNAIDS Joint United Nation Programme on HIV/AIDSUNGASS UN General Assembly Special Session UNICEF United Nations Children’s FundUP University of Pretoria UPFS Uniform Patient Fee ScheduleUS United StatesUSA United States of AmericaUSAID United States Agency for International DevelopmentUWC University of the Western CapeVVAT Value Added TaxVCT Voluntary Counselling and TestingVOCS Victims of Crime SurveyVPUU Violence Prevention through Urban UpgradingWWAN Wide Area NetworkWBOT Ward Based Outreach Team WCO World Customs OrganizationWG Washington Group

Abbreviations
SAHR 2012/13 329
WHA World Health AssemblyWHO World Health OrganizationWHO AFRO World Health Organization Regional Office for AfricaWHO FCTC World Health Organization Framework Convention on Tobacco ControlWIPO World Intellectual Property OrganizationWISN Workload Indicators of Staffing Needs Wits University of the WitwatersrandWRHI Wits Reproductive Health and HIV InstituteWTO World Trade OrganizationYYRBS Youth Risk Behavior SurveillanceYLDs Years Lived With Disability YLLs Years of Life LostXXDR Extensively Drug-ResistantXDR-TB Extensively Drug-Resistant Tuberculosis