Sources and temporal patterns of polychlorinated biphenyls around a large South American...
10
Sources and Temporal Patterns of Polychlorinated Biphenyls Around a Large South American Grain-Shipping Port (Paranagua ´ Estuarine System, Brazil) Tatiane Combi • Satie Taniguchi • Paulo Alves de Lima Ferreira • Andressa Vianna Mansur • Rubens Cesar Lopes Figueira • Michel Michaelovitch de Mahiques • Rosalinda Carmela Montone • Ce ´sar C. Martins Received: 24 August 2012 / Accepted: 30 December 2012 Ó Springer Science+Business Media New York 2013 Abstract The Paranagua ´ Estuarine System (PES) is an important estuarine environment on the Brazilian coast. The economic importance of the PES is mainly related to industries, fuel terminals, and the main South American grain-shipping port. The aim of this work was to determine the vertical distribution of polychlorinated biphenyls (PCBs) in three sediment cores from the PES. The methods included Soxhlet extraction, clean-up, and quantification by gas chromatography with electron capture detection. The con- centrations of total PCBs ranged from lower than the detection limit to 6.65 ng g -1 . Low PCB concentrations were detected in P1 and P3, which were collected far away from direct human activities. In P2, the compositional pat- tern of PCB congeners showed greater concentrations of tetra- and penta-chlorinated congeners associated with urban and port activities near Paranagua ´ city. The differences in concentrations between the three sediment cores were attributed to the distance of the sampling points in relation to the possible sources of pollution, which are mostly related to Paranagua ´ city. The vertical distribution of PCBs in the sediment core P2 was related to historical anthropogenic activities. The highest PCB input was from 1970 to the early 1990s, which coincides with a period of greater use of PCBs in Brazil as well as their greater worldwide production. Polychlorinated biphenyls (PCBs) are highly persistent in the environment due to their high resistance to degradation processes and chemical stability (Borja et al. 2005). These compounds are hydrophobic, lipophilic, and bioaccumula- tive, and they are listed as one of the 12 persistent organic pollutants (POPs) restricted or banned globally under the Stockholm Convention on POPs (UNEP 2001). PCBs were widely used as dielectric fluids in trans- formers and capacitors, heat-exchange liquids, hydraulic fluids, flame retardants, lubricants, waxes, and carbonless copy paper (Fiedler 1997; Breivik et al. 2004; Erickson and Kaley 2011) because of their high dielectric constants and thermal stability. The use and production of PCBs has been controlled in Brazil since 1981, but equipment containing PCBs can be used until the end of its useful life (Penteado and Vaz 2001). Some present sources of environmental contamination by PCBs are leakage from irregular deposits or contaminated soils, industrial and domestic effluents, and volatilisation (Harrad et al. 1994; Breivik et al. 2002). The fate of PCBs in the environment is the estuaries, where sediments act as a sink for most pollutants (Sahu et al. 2009; Ruiz-Ferna ´ndez et al. 2012). Because of their high octanol–water partition coefficient, PCBs tend to adsorb on suspended particulate matter reaching the coastal sediments and accumulating mainly in fine-grained (silt and clay) fractions (Fiedler 1997). This behaviour, com- bined with characteristics, such as chemical stability and persistence in the environment, allows the study of the concentration of PCBs in marine sediment samples, even T. Combi (&) A. V. Mansur C. C. Martins (&) Centro de Estudos do Mar da Universidade Federal do Parana ´, Caixa Postal 61, 83255-976 Pontal do Parana ´, PR, Brazil e-mail: [email protected] C. C. Martins e-mail: [email protected] T. Combi Programa de Po ´s-Graduac ¸a ˜o em Sistemas Costeiros e Ocea ˆnicos (PGSISCO) da Universidade Federal do Parana ´, Caixa Postal 61, 83255-976 Pontal do Parana ´, PR, Brazil S. Taniguchi P. A. de Lima Ferreira R. C. L. Figueira M. M. de Mahiques R. C. Montone Instituto Oceanogra ´fico da Universidade de Sa ˜o Paulo, Prac ¸a do Oceanogra ´fico, 191, 05508-900 Sa ˜o Paulo, SP, Brazil 123 Arch Environ Contam Toxicol DOI 10.1007/s00244-012-9872-2
-
Upload
independent -
Category
Documents
-
view
4 -
download
0
Transcript of Sources and temporal patterns of polychlorinated biphenyls around a large South American...
Sources and Temporal Patterns of Polychlorinated BiphenylsAround a Large South American Grain-Shipping Port(Paranagua Estuarine System, Brazil)
Tatiane Combi • Satie Taniguchi • Paulo Alves de Lima Ferreira •
Andressa Vianna Mansur • Rubens Cesar Lopes Figueira •
Michel Michaelovitch de Mahiques • Rosalinda Carmela Montone •
Cesar C. Martins
Received: 24 August 2012 / Accepted: 30 December 2012
� Springer Science+Business Media New York 2013
Abstract The Paranagua Estuarine System (PES) is an
important estuarine environment on the Brazilian coast. The
economic importance of the PES is mainly related to
industries, fuel terminals, and the main South American
grain-shipping port. The aim of this work was to determine
the vertical distribution of polychlorinated biphenyls (PCBs)
in three sediment cores from the PES. The methods included
Soxhlet extraction, clean-up, and quantification by gas
chromatography with electron capture detection. The con-
centrations of total PCBs ranged from lower than the
detection limit to 6.65 ng g-1. Low PCB concentrations
were detected in P1 and P3, which were collected far away
from direct human activities. In P2, the compositional pat-
tern of PCB congeners showed greater concentrations of
tetra- and penta-chlorinated congeners associated with urban
and port activities near Paranagua city. The differences in
concentrations between the three sediment cores were
attributed to the distance of the sampling points in relation to
the possible sources of pollution, which are mostly related to
Paranagua city. The vertical distribution of PCBs in the
sediment core P2 was related to historical anthropogenic
activities. The highest PCB input was from 1970 to the early
1990s, which coincides with a period of greater use of PCBs
in Brazil as well as their greater worldwide production.
Polychlorinated biphenyls (PCBs) are highly persistent in
the environment due to their high resistance to degradation
processes and chemical stability (Borja et al. 2005). These
compounds are hydrophobic, lipophilic, and bioaccumula-
tive, and they are listed as one of the 12 persistent organic
pollutants (POPs) restricted or banned globally under the
Stockholm Convention on POPs (UNEP 2001).
PCBs were widely used as dielectric fluids in trans-
formers and capacitors, heat-exchange liquids, hydraulic
fluids, flame retardants, lubricants, waxes, and carbonless
copy paper (Fiedler 1997; Breivik et al. 2004; Erickson and
Kaley 2011) because of their high dielectric constants and
thermal stability. The use and production of PCBs has been
controlled in Brazil since 1981, but equipment containing
PCBs can be used until the end of its useful life (Penteado
and Vaz 2001). Some present sources of environmental
contamination by PCBs are leakage from irregular deposits
or contaminated soils, industrial and domestic effluents,
and volatilisation (Harrad et al. 1994; Breivik et al. 2002).
The fate of PCBs in the environment is the estuaries,
where sediments act as a sink for most pollutants (Sahu
et al. 2009; Ruiz-Fernandez et al. 2012). Because of their
high octanol–water partition coefficient, PCBs tend to
adsorb on suspended particulate matter reaching the coastal
sediments and accumulating mainly in fine-grained (silt
and clay) fractions (Fiedler 1997). This behaviour, com-
bined with characteristics, such as chemical stability and
persistence in the environment, allows the study of the
concentration of PCBs in marine sediment samples, even
T. Combi (&) � A. V. Mansur � C. C. Martins (&)
Centro de Estudos do Mar da Universidade Federal do Parana,
Caixa Postal 61, 83255-976 Pontal do Parana, PR, Brazil
e-mail: [email protected]
C. C. Martins
e-mail: [email protected]
T. Combi
Programa de Pos-Graduacao em Sistemas Costeiros e Oceanicos
(PGSISCO) da Universidade Federal do Parana, Caixa Postal 61,
83255-976 Pontal do Parana, PR, Brazil
S. Taniguchi � P. A. de Lima Ferreira � R.
C. L. Figueira � M. M. de Mahiques � R. C. Montone
Instituto Oceanografico da Universidade de Sao Paulo, Praca do
Oceanografico, 191, 05508-900 Sao Paulo, SP, Brazil
123
Arch Environ Contam Toxicol
DOI 10.1007/s00244-012-9872-2
those deposited decades ago. Thus, sediment cores repre-
sent an important tool for the development of management
strategies and for the reconstruction of historical inputs of
contaminants (Valette-Silver 1993; Santschi et al. 2001).
The historical record of pollution levels is also needed to
evaluate the environmental contamination, and under-
standing pollution trends is helpful to predict future pat-
terns of pollution (Martins et al. 2010a).
The aim of this work was to study the vertical distri-
bution of PCBs in sediment cores from the Paranagua
Estuarine System (PES) in Brazil in an effort to trace the
historic evolution of human activities in this economically
important area of Latin America, as well as to associate
PCB concentration variations with major historical events
of human occupation and the use and disposal of these
compounds in this environment.
Experimental Methods
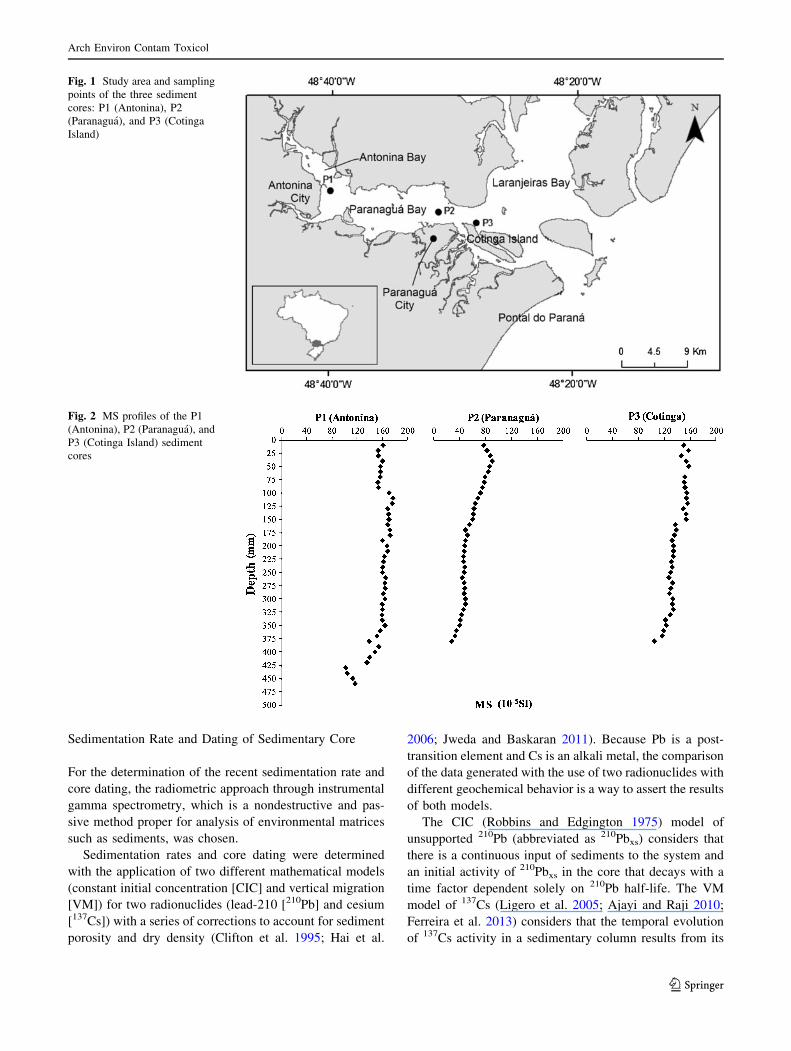
Study Area
The PES is located on the northern coast of Parana state,
Brazil, between 25�160S and 48�170W (Fig. 1). Cities, such
as Antonina, Morretes, Paranagua, and Pontal do Parana,
are located at the margins of the PES, creating an area of
continuous occupation with a total population of approxi-
mately 191,700 inhabitants, most of whom (133,600
inhabitants) live in Paranagua city (Instituto Brasileiro de
Geografia e Estatıstica 2009). This estuary is formed by
two main systems: Laranjeiras Bay on the north–south axis
and Paranagua and Antonina Bays on the east–west axis.
The latter system has an area of approximately 258 km2
and an aqueous volume of 1.4 9 109 m3. The tidal regime
in the region is semidiurnal, reaching B2 m in spring tide
(Lana et al. 2001).
The PES has been influenced by anthropogenic inputs
from different sources, including domestic discharges and
sewage from the port and industries (Martins et al. 2011a).
Human settlement of the area occurred relatively rapidly
and in a disorderly manner. Occupation of the region was
intensified by the construction of the Paranagua port, which
is currently the largest grain exporter in Latin America
(Martins et al. 2010b). Antonina port, despite its smaller
capacity, contributes significantly to the transport of iron,
timber, fertiliser, and frozen products. Although industrial
activities are less developed compared with the rest of the
Brazilian coast (Lana et al. 2001), the region has a con-
siderable number of industries, especially fertiliser
manufacturing.
The ports and industries, as well as the activities related
to them, represent potential sources of contamination by
persistent pollutants, such as PCBs (Breivik et al. 2007).
These compounds can be found in paints and lubricants for
ships and large electrical equipment used in port and
industrial sectors (Breivik et al. 2007; Santos et al. 2009).
Other potential sources of PES contamination include the
inappropriate disposal of solid waste and improper
domestic sewage treatment (Kolm et al. 2002; Khairy et al.
2012). In Paranagua city, waste production was intensified
by the increase in population in recent decades, whereas
until 1996 all of the waste produced in the region was
disposed of in irregular landfills (Cordura 1998). However,
even with the recent creation of a sanitary landfill, much of
the solid waste produced in the region is still disposed of in
inappropriate places or incinerated.
Sampling
Three sediment cores were collected along the PES in
August and October of 2008 (P1, P2, and P3). The P1 core
was collected close to the city of Antonina in the innermost
part of the estuary and close to the mouths of the rivers; the
P2 core was collected near the urban and port area of
Paranagua; and the P3 core was collected near Cotinga
Island, which has no relevant human occupation or indus-
trial activities.
The sediment cores (diameter = 70 mm; length B48 cm)
were collected by scuba divers. Two polyvinyl chloride
(PVC) cores were used for magnetic susceptibility (MS)
measurements, and two aluminium cores were used for
organic compound analyses at each sample point. The alu-
minium sediment cores were sectioned at 2-cm intervals, and
the sediment samples were placed in precleaned aluminium
pots and stored at -20 �C. The sediments were freeze-dried
and stored in glass bottles until laboratory analyses.
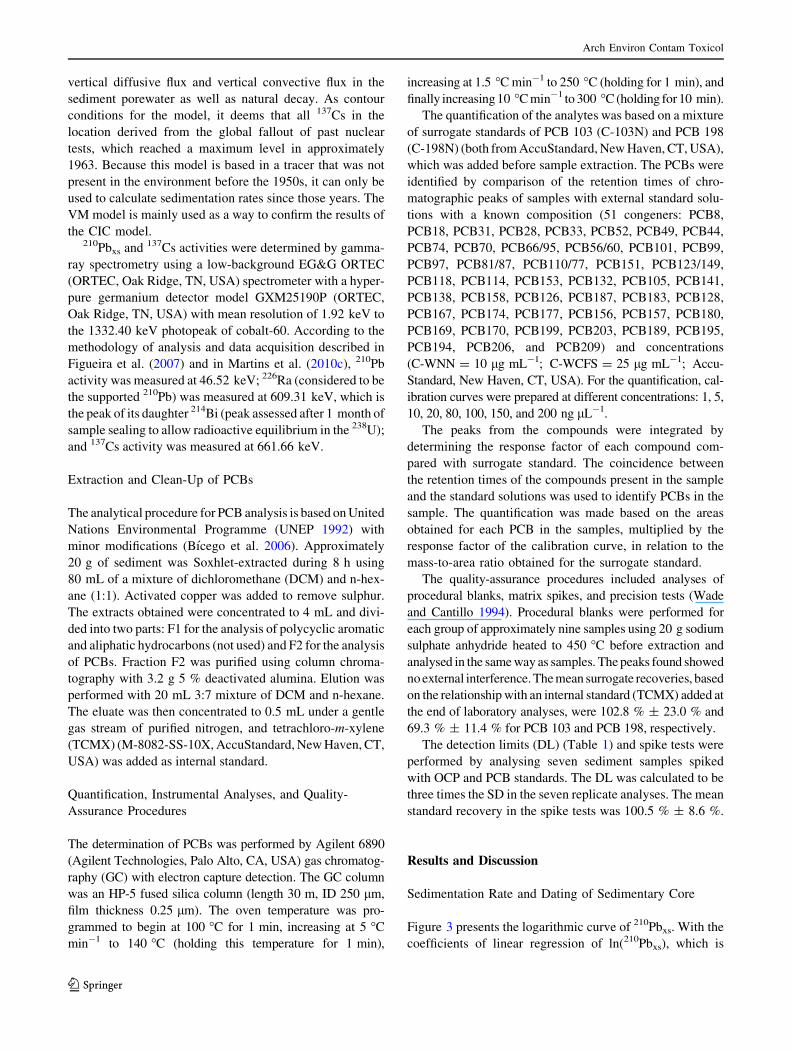
MS
MS measurements were performed using a Bartington MS-
2C MS (Bartington, Oxford, UK) meter equipped with a
90-mm diameter sensor on the whole and unopened PVC
cores of all sampled points. The measurements were taken
at 2.5-cm intervals, between 10 and 60 cm, with a reso-
lution of 10-5 SI units. The raw data were corrected to
account for different sample diameters from the sensor
dimensions, and background values were taken to correct
for instrumental drift (Martins et al. 2007).
The three sediment cores used showed small variations
in MS (Fig. 2). The absence of large variations in MS
values may indicate a lack of mixing between the sediment
layers (Hanesch and Scholger 2002; Venkatachalapathy
et al. 2011) and, consequently, the maintenance of a his-
torical record of PCB input.
Arch Environ Contam Toxicol
123
Sedimentation Rate and Dating of Sedimentary Core
For the determination of the recent sedimentation rate and
core dating, the radiometric approach through instrumental
gamma spectrometry, which is a nondestructive and pas-
sive method proper for analysis of environmental matrices
such as sediments, was chosen.
Sedimentation rates and core dating were determined
with the application of two different mathematical models
(constant initial concentration [CIC] and vertical migration
[VM]) for two radionuclides (lead-210 [210Pb] and cesium
[137Cs]) with a series of corrections to account for sediment
porosity and dry density (Clifton et al. 1995; Hai et al.
2006; Jweda and Baskaran 2011). Because Pb is a post-
transition element and Cs is an alkali metal, the comparison
of the data generated with the use of two radionuclides with
different geochemical behavior is a way to assert the results
of both models.
The CIC (Robbins and Edgington 1975) model of
unsupported 210Pb (abbreviated as 210Pbxs) considers that
there is a continuous input of sediments to the system and
an initial activity of 210Pbxs in the core that decays with a
time factor dependent solely on 210Pb half-life. The VM
model of 137Cs (Ligero et al. 2005; Ajayi and Raji 2010;
Ferreira et al. 2013) considers that the temporal evolution
of 137Cs activity in a sedimentary column results from its
Fig. 1 Study area and sampling
points of the three sediment
cores: P1 (Antonina), P2
(Paranagua), and P3 (Cotinga
Island)
Fig. 2 MS profiles of the P1
(Antonina), P2 (Paranagua), and
P3 (Cotinga Island) sediment
cores
Arch Environ Contam Toxicol
123
vertical diffusive flux and vertical convective flux in the
sediment porewater as well as natural decay. As contour
conditions for the model, it deems that all 137Cs in the
location derived from the global fallout of past nuclear
tests, which reached a maximum level in approximately
1963. Because this model is based in a tracer that was not
present in the environment before the 1950s, it can only be
used to calculate sedimentation rates since those years. The
VM model is mainly used as a way to confirm the results of
the CIC model.210Pbxs and 137Cs activities were determined by gamma-
ray spectrometry using a low-background EG&G ORTEC
(ORTEC, Oak Ridge, TN, USA) spectrometer with a hyper-
pure germanium detector model GXM25190P (ORTEC,
Oak Ridge, TN, USA) with mean resolution of 1.92 keV to
the 1332.40 keV photopeak of cobalt-60. According to the
methodology of analysis and data acquisition described in
Figueira et al. (2007) and in Martins et al. (2010c), 210Pb
activity was measured at 46.52 keV; 226Ra (considered to be
the supported 210Pb) was measured at 609.31 keV, which is
the peak of its daughter 214Bi (peak assessed after 1 month of
sample sealing to allow radioactive equilibrium in the 238U);
and 137Cs activity was measured at 661.66 keV.
Extraction and Clean-Up of PCBs
The analytical procedure for PCB analysis is based on United
Nations Environmental Programme (UNEP 1992) with
minor modifications (Bıcego et al. 2006). Approximately
20 g of sediment was Soxhlet-extracted during 8 h using
80 mL of a mixture of dichloromethane (DCM) and n-hex-
ane (1:1). Activated copper was added to remove sulphur.
The extracts obtained were concentrated to 4 mL and divi-
ded into two parts: F1 for the analysis of polycyclic aromatic
and aliphatic hydrocarbons (not used) and F2 for the analysis
of PCBs. Fraction F2 was purified using column chroma-
tography with 3.2 g 5 % deactivated alumina. Elution was
performed with 20 mL 3:7 mixture of DCM and n-hexane.
The eluate was then concentrated to 0.5 mL under a gentle
gas stream of purified nitrogen, and tetrachloro-m-xylene
(TCMX) (M-8082-SS-10X, AccuStandard, New Haven, CT,
USA) was added as internal standard.
Quantification, Instrumental Analyses, and Quality-
Assurance Procedures
The determination of PCBs was performed by Agilent 6890
(Agilent Technologies, Palo Alto, CA, USA) gas chromatog-
raphy (GC) with electron capture detection. The GC column
was an HP-5 fused silica column (length 30 m, ID 250 lm,
film thickness 0.25 lm). The oven temperature was pro-
grammed to begin at 100 �C for 1 min, increasing at 5 �C
min-1 to 140 �C (holding this temperature for 1 min),
increasing at 1.5 �C min-1 to 250 �C (holding for 1 min), and
finally increasing 10 �C min-1 to 300 �C (holding for 10 min).
The quantification of the analytes was based on a mixture
of surrogate standards of PCB 103 (C-103N) and PCB 198
(C-198N) (both from AccuStandard, New Haven, CT, USA),
which was added before sample extraction. The PCBs were
identified by comparison of the retention times of chro-
matographic peaks of samples with external standard solu-
tions with a known composition (51 congeners: PCB8,
PCB18, PCB31, PCB28, PCB33, PCB52, PCB49, PCB44,
PCB74, PCB70, PCB66/95, PCB56/60, PCB101, PCB99,
PCB97, PCB81/87, PCB110/77, PCB151, PCB123/149,
PCB118, PCB114, PCB153, PCB132, PCB105, PCB141,
PCB138, PCB158, PCB126, PCB187, PCB183, PCB128,
PCB167, PCB174, PCB177, PCB156, PCB157, PCB180,
PCB169, PCB170, PCB199, PCB203, PCB189, PCB195,
PCB194, PCB206, and PCB209) and concentrations
(C-WNN = 10 lg mL-1; C-WCFS = 25 lg mL-1; Accu-
Standard, New Haven, CT, USA). For the quantification, cal-
ibration curves were prepared at different concentrations: 1, 5,
10, 20, 80, 100, 150, and 200 ng lL-1.
The peaks from the compounds were integrated by
determining the response factor of each compound com-
pared with surrogate standard. The coincidence between
the retention times of the compounds present in the sample
and the standard solutions was used to identify PCBs in the
sample. The quantification was made based on the areas
obtained for each PCB in the samples, multiplied by the
response factor of the calibration curve, in relation to the
mass-to-area ratio obtained for the surrogate standard.
The quality-assurance procedures included analyses of
procedural blanks, matrix spikes, and precision tests (Wade
and Cantillo 1994). Procedural blanks were performed for
each group of approximately nine samples using 20 g sodium
sulphate anhydride heated to 450 �C before extraction and
analysed in the same way as samples. The peaks found showed
no external interference. The mean surrogate recoveries, based
on the relationship with an internal standard (TCMX) added at
the end of laboratory analyses, were 102.8 % ± 23.0 % and
69.3 % ± 11.4 % for PCB 103 and PCB 198, respectively.
The detection limits (DL) (Table 1) and spike tests were
performed by analysing seven sediment samples spiked
with OCP and PCB standards. The DL was calculated to be
three times the SD in the seven replicate analyses. The mean
standard recovery in the spike tests was 100.5 % ± 8.6 %.
Results and Discussion
Sedimentation Rate and Dating of Sedimentary Core
Figure 3 presents the logarithmic curve of 210Pbxs. With the
coefficients of linear regression of ln(210Pbxs), which is
Arch Environ Contam Toxicol
123
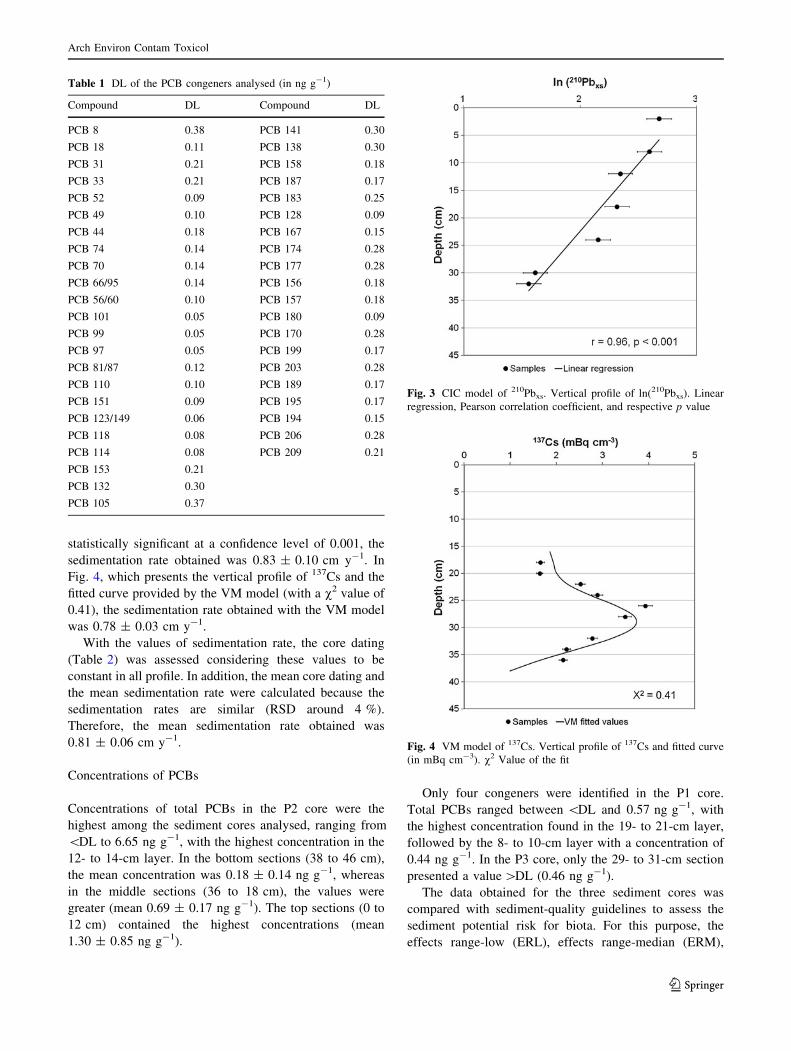
statistically significant at a confidence level of 0.001, the
sedimentation rate obtained was 0.83 ± 0.10 cm y-1. In
Fig. 4, which presents the vertical profile of 137Cs and the
fitted curve provided by the VM model (with a v2 value of
0.41), the sedimentation rate obtained with the VM model
was 0.78 ± 0.03 cm y-1.
With the values of sedimentation rate, the core dating
(Table 2) was assessed considering these values to be
constant in all profile. In addition, the mean core dating and
the mean sedimentation rate were calculated because the
sedimentation rates are similar (RSD around 4 %).
Therefore, the mean sedimentation rate obtained was
0.81 ± 0.06 cm y-1.
Concentrations of PCBs
Concentrations of total PCBs in the P2 core were the
highest among the sediment cores analysed, ranging from
\DL to 6.65 ng g-1, with the highest concentration in the
12- to 14-cm layer. In the bottom sections (38 to 46 cm),
the mean concentration was 0.18 ± 0.14 ng g-1, whereas
in the middle sections (36 to 18 cm), the values were
greater (mean 0.69 ± 0.17 ng g-1). The top sections (0 to
12 cm) contained the highest concentrations (mean
1.30 ± 0.85 ng g-1).
Only four congeners were identified in the P1 core.
Total PCBs ranged between \DL and 0.57 ng g-1, with
the highest concentration found in the 19- to 21-cm layer,
followed by the 8- to 10-cm layer with a concentration of
0.44 ng g-1. In the P3 core, only the 29- to 31-cm section
presented a value [DL (0.46 ng g-1).
The data obtained for the three sediment cores was
compared with sediment-quality guidelines to assess the
sediment potential risk for biota. For this purpose, the
effects range-low (ERL), effects range-median (ERM),
Table 1 DL of the PCB congeners analysed (in ng g-1)
Compound DL Compound DL
PCB 8 0.38 PCB 141 0.30
PCB 18 0.11 PCB 138 0.30
PCB 31 0.21 PCB 158 0.18
PCB 33 0.21 PCB 187 0.17
PCB 52 0.09 PCB 183 0.25
PCB 49 0.10 PCB 128 0.09
PCB 44 0.18 PCB 167 0.15
PCB 74 0.14 PCB 174 0.28
PCB 70 0.14 PCB 177 0.28
PCB 66/95 0.14 PCB 156 0.18
PCB 56/60 0.10 PCB 157 0.18
PCB 101 0.05 PCB 180 0.09
PCB 99 0.05 PCB 170 0.28
PCB 97 0.05 PCB 199 0.17
PCB 81/87 0.12 PCB 203 0.28
PCB 110 0.10 PCB 189 0.17
PCB 151 0.09 PCB 195 0.17
PCB 123/149 0.06 PCB 194 0.15
PCB 118 0.08 PCB 206 0.28
PCB 114 0.08 PCB 209 0.21
PCB 153 0.21
PCB 132 0.30
PCB 105 0.37
Fig. 3 CIC model of 210Pbxs. Vertical profile of ln(210Pbxs). Linear
regression, Pearson correlation coefficient, and respective p value
Fig. 4 VM model of 137Cs. Vertical profile of 137Cs and fitted curve
(in mBq cm-3). v2 Value of the fit
Arch Environ Contam Toxicol
123
threshold-effects level (TEL), and probable-effects level
(PEL) values were adopted. The ERL corresponds to the
value below which the probability of adverse effects is
rare; the ERM is the value above which biological effects
on biota may occur. Above the TEL, adverse effects can be
frequent, and above the PEL, adverse effects on biota are
expected (Long et al. 1995; MacDonald et al. 1996).
These levels consist of the sum of seven PCB congeners:
PCBs 28, 52, 101, 118, 138, 153, and 180. The concen-
trations in sediment cores did not exceed, at any layer, the
levels mentioned (Table 3). Samples from all sections of
the P2 core, which had the highest concentrations among
the samples, had PCB concentrations lower than the TEL,
which is the threshold value above which the concentration
may represent a risk to marine organisms.
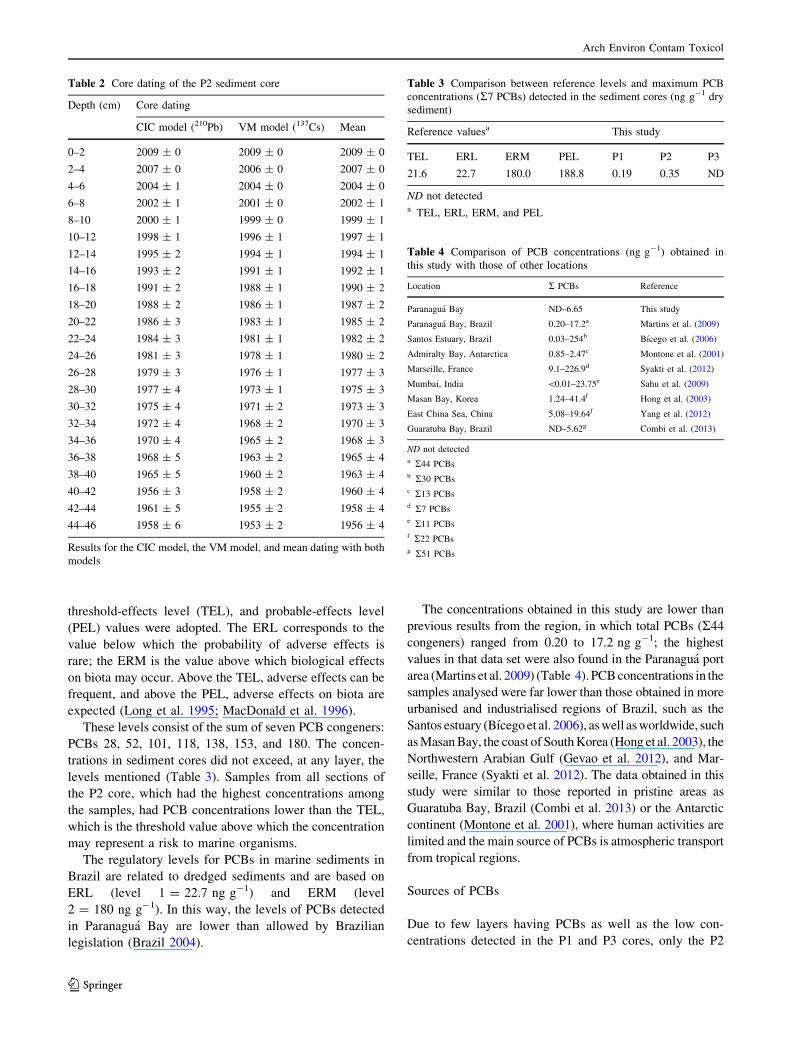
The regulatory levels for PCBs in marine sediments in
Brazil are related to dredged sediments and are based on
ERL (level 1 = 22.7 ng g-1) and ERM (level
2 = 180 ng g-1). In this way, the levels of PCBs detected
in Paranagua Bay are lower than allowed by Brazilian
legislation (Brazil 2004).
The concentrations obtained in this study are lower than
previous results from the region, in which total PCBs (R44
congeners) ranged from 0.20 to 17.2 ng g-1; the highest
values in that data set were also found in the Paranagua port
area (Martins et al. 2009) (Table 4). PCB concentrations in the
samples analysed were far lower than those obtained in more
urbanised and industrialised regions of Brazil, such as the
Santos estuary (Bıcego et al. 2006), as well as worldwide, such
as Masan Bay, the coast of South Korea (Hong et al. 2003), the
Northwestern Arabian Gulf (Gevao et al. 2012), and Mar-
seille, France (Syakti et al. 2012). The data obtained in this
study were similar to those reported in pristine areas as
Guaratuba Bay, Brazil (Combi et al. 2013) or the Antarctic
continent (Montone et al. 2001), where human activities are
limited and the main source of PCBs is atmospheric transport
from tropical regions.
Sources of PCBs
Due to few layers having PCBs as well as the low con-
centrations detected in the P1 and P3 cores, only the P2
Table 2 Core dating of the P2 sediment core
Depth (cm) Core dating
CIC model (210Pb) VM model (137Cs) Mean
0–2 2009 ± 0 2009 ± 0 2009 ± 0
2–4 2007 ± 0 2006 ± 0 2007 ± 0
4–6 2004 ± 1 2004 ± 0 2004 ± 0
6–8 2002 ± 1 2001 ± 0 2002 ± 1
8–10 2000 ± 1 1999 ± 0 1999 ± 1
10–12 1998 ± 1 1996 ± 1 1997 ± 1
12–14 1995 ± 2 1994 ± 1 1994 ± 1
14–16 1993 ± 2 1991 ± 1 1992 ± 1
16–18 1991 ± 2 1988 ± 1 1990 ± 2
18–20 1988 ± 2 1986 ± 1 1987 ± 2
20–22 1986 ± 3 1983 ± 1 1985 ± 2
22–24 1984 ± 3 1981 ± 1 1982 ± 2
24–26 1981 ± 3 1978 ± 1 1980 ± 2
26–28 1979 ± 3 1976 ± 1 1977 ± 3
28–30 1977 ± 4 1973 ± 1 1975 ± 3
30–32 1975 ± 4 1971 ± 2 1973 ± 3
32–34 1972 ± 4 1968 ± 2 1970 ± 3
34–36 1970 ± 4 1965 ± 2 1968 ± 3
36–38 1968 ± 5 1963 ± 2 1965 ± 4
38–40 1965 ± 5 1960 ± 2 1963 ± 4
40–42 1956 ± 3 1958 ± 2 1960 ± 4
42–44 1961 ± 5 1955 ± 2 1958 ± 4
44–46 1958 ± 6 1953 ± 2 1956 ± 4
Results for the CIC model, the VM model, and mean dating with both
models
Table 3 Comparison between reference levels and maximum PCB
concentrations (R7 PCBs) detected in the sediment cores (ng g-1 dry
sediment)
Reference valuesa This study
TEL ERL ERM PEL P1 P2 P3
21.6 22.7 180.0 188.8 0.19 0.35 ND
ND not detecteda TEL, ERL, ERM, and PEL
Table 4 Comparison of PCB concentrations (ng g-1) obtained in
this study with those of other locations
Location R PCBs Reference
Paranagua Bay ND–6.65 This study
Paranagua Bay, Brazil 0.20–17.2a Martins et al. (2009)
Santos Estuary, Brazil 0.03–254b Bıcego et al. (2006)
Admiralty Bay, Antarctica 0.85–2.47c Montone et al. (2001)
Marseille, France 9.1–226.9d Syakti et al. (2012)
Mumbai, India \0.01–23.75e Sahu et al. (2009)
Masan Bay, Korea 1.24–41.4f Hong et al. (2003)
East China Sea, China 5.08–19.64f Yang et al. (2012)
Guaratuba Bay, Brazil ND–5.62g Combi et al. (2013)
ND not detecteda R44 PCBsb R30 PCBsc R13 PCBsd R7 PCBse R11 PCBsf R22 PCBsg R51 PCBs
Arch Environ Contam Toxicol
123
core will be discussed hereafter. The distance of the
sources of PCBs can be determined by the molecular
weight of the congeners analysed, which is directly related
to the number of chlorine atoms in the molecules (Fiedler
1997). The low-chlorinated PCBs (fewer than four chlorine
atoms) are more soluble in water, are more volatile, and are
therefore more mobile in the environment. As a result, we
can generally say that they originate from distant sources
and may occur in places where they have never used
before, e.g., polar regions (Montone et al. 2001). In con-
trast, congeners with a high degree of chlorination (more
than eight chlorine atoms) tend to accumulate closer to the
sites where they were generated (Tolosa et al. 1995; Jin
et al. 2012). The congeners between these two groups can
be considered mid-chlorinated PCBs (Hong et al. 2003).
The mid-chlorinated congeners registered the largest
PCB contribution in the P2 core (mean contribution 89.2 %
of total PCBs). The predominant congeners in the sediment
samples were PCB 66/95 [ PCB 110 [ PCB 101 [ PCB
18 [ PCB 132. This congener composition, with greater
contribution of penta-chlorinated congeners, suggests a
contribution from the commercial mixture Aroclor 1254
(Frame et al. 1996).
The most likely source of PCBs in this environment is
Paranagua city, the urban and industrial activities of which
have resulted in the dumping of effluents and the disposal of
solid waste in addition to the activities related to Paranagua
port. The nondetection of high-chlorinated PCBs in the P2
core may indicate that these congeners are deposited closer
to the margins or at specific points and do not reach the
sampled location. However, the low-chlorinated congeners
detected may indicate distant sources of PCBs, which would
come to the region through marine currents or atmospheric
deposition (Iwata et al. 1993; Barra et al. 2006).
Historical Record of Human Occupation in Paranagua
Bay
The integrated analysis of the vertical profile from the P2
core and sedimentation rates determined for the study area
can help in the evaluation of the historic contribution of
PCBs in Paranagua Bay by showing the record and the
variations of PCB use over time. Because 210Pb- and 137Cs-
derived sedimentation rates were similar, the temporal
pattern of PCB was estimated using the mean sedimenta-
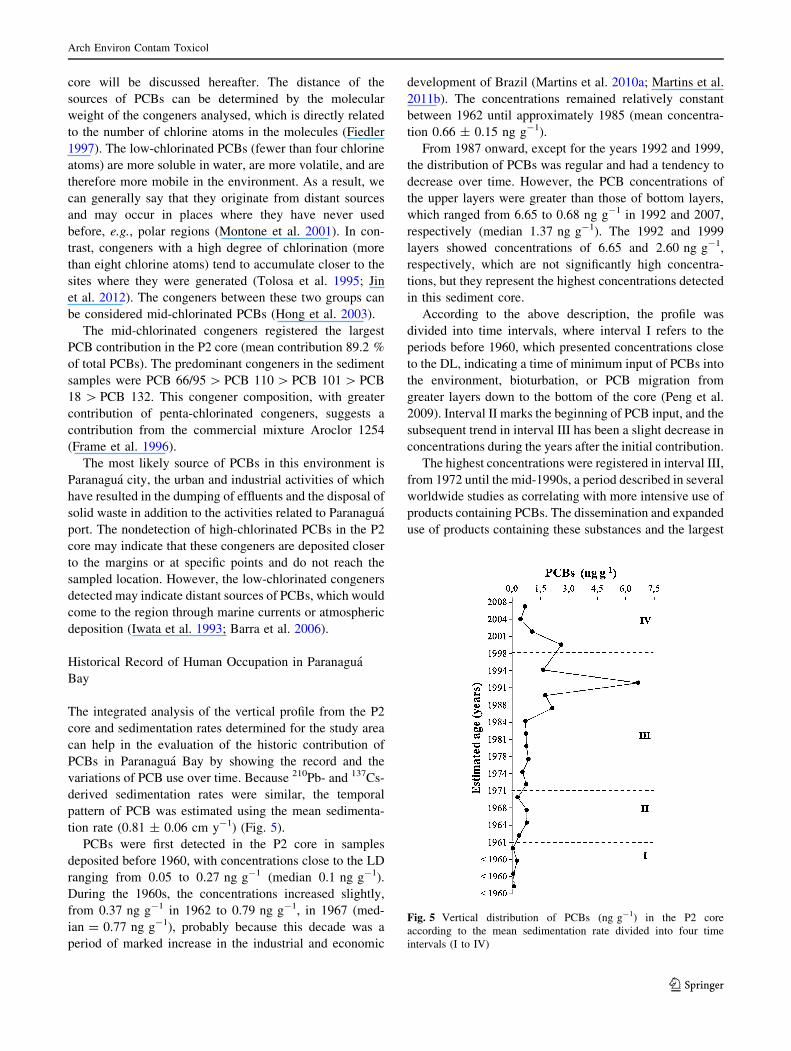
tion rate (0.81 ± 0.06 cm y-1) (Fig. 5).
PCBs were first detected in the P2 core in samples
deposited before 1960, with concentrations close to the LD
ranging from 0.05 to 0.27 ng g-1 (median 0.1 ng g-1).
During the 1960s, the concentrations increased slightly,
from 0.37 ng g-1 in 1962 to 0.79 ng g-1, in 1967 (med-
ian = 0.77 ng g-1), probably because this decade was a
period of marked increase in the industrial and economic
development of Brazil (Martins et al. 2010a; Martins et al.
2011b). The concentrations remained relatively constant
between 1962 until approximately 1985 (mean concentra-
tion 0.66 ± 0.15 ng g-1).
From 1987 onward, except for the years 1992 and 1999,
the distribution of PCBs was regular and had a tendency to
decrease over time. However, the PCB concentrations of
the upper layers were greater than those of bottom layers,
which ranged from 6.65 to 0.68 ng g-1 in 1992 and 2007,
respectively (median 1.37 ng g-1). The 1992 and 1999
layers showed concentrations of 6.65 and 2.60 ng g-1,
respectively, which are not significantly high concentra-
tions, but they represent the highest concentrations detected
in this sediment core.
According to the above description, the profile was
divided into time intervals, where interval I refers to the
periods before 1960, which presented concentrations close
to the DL, indicating a time of minimum input of PCBs into
the environment, bioturbation, or PCB migration from
greater layers down to the bottom of the core (Peng et al.
2009). Interval II marks the beginning of PCB input, and the
subsequent trend in interval III has been a slight decrease in
concentrations during the years after the initial contribution.
The highest concentrations were registered in interval III,
from 1972 until the mid-1990s, a period described in several
worldwide studies as correlating with more intensive use of
products containing PCBs. The dissemination and expanded
use of products containing these substances and the largest
Fig. 5 Vertical distribution of PCBs (ng g-1) in the P2 core
according to the mean sedimentation rate divided into four time
intervals (I to IV)
Arch Environ Contam Toxicol
123
area of urban development being in Paranagua Bay, mainly
near the city and port, may explain these variations. The
values coincide with the period of maximum production of
PCBs in the United States (50,000 tons produced in 1970
(Breivik et al. 2002). The highest value was registered in
1992 (6.65 ng g-1). During this period, an irregular expan-
sion in human occupation in Paranagua city has been
recorded (Costa et al. 1999) that resulted in a greater pro-
duction of solid wastes and effluents, an effect that was
compounded by the lack of sanitary landfills at that time.
Interval IV ranges from 1999 until 2007 and showed a
decrease in the concentrations analysed. This decrease is
characterised by the prohibition of the use of PCBs in 1981,
when new products containing PCB mixtures were not
produced or imported into Brazil. The levels obtained even
after the ban reflects the use of remaining equipment
containing PCBs as has been documented in previous
studies (Breivik et al. 2002).
Conclusion
The concentrations found in the PES seem to reflect rela-
tively low local environmental pressures compared with
other coastal regions of the world. However, the detection
of synthetic compounds, such as PCBs, indicates that the
region is subject to the effects of human activities.
The differences in concentrations between the three
sediment cores can be mainly attributed to the distance of
the sampling sites in relation to possible sources of pollu-
tion, which are mostly located near Paranagua city. The
distribution of PCBs in the P2 core (close to Paranagua city
and port) records the beginning of the input of these con-
taminants into the PES as well as the increasing and
decreasing of concentrations related to their high use and
subsequent prohibition, respectively. In addition, the
maximum concentrations may be related to periods of
urban and industrial expansion in the area, and those time
periods are coincident with the maximum use and pro-
duction of PCBs reported for different regions of the world.
The results obtained indicate that PCBs in sediment
cores associated with sediment dating can be used as a
marker of human activities in the construction of the his-
toric occupation and contaminant inputs into estuarine
environments and can contribute information to a global
inventory of PCBs.
Acknowledgments This study was funded by Brazilian Council for
Scientific and Technological Development (CNPq) (Grant No.
564316/2008-3). T. Combi is grateful for the MSc scholarship (CNPq
144563/2010-0), and C.C. Martins is grateful for the PQ-2 grant
(Grant No. CNPq 307110/2008-7). The authors also acknowledge
CAPES (Edital Pro-Equipamentos 02/2008) and Fundacao Araucaria
(229/07-10826) for their financial support.
References
Ajayi IR, Raji AT (2010) Evaluation of the 137Cs activity-depth
profiles by the diffusion-convection model. Intern J Phys Sci
5(2):154–157
Barra R, Colombo JC, Eguren G et al (2006) Persistent organic
pollutants (POPs) in eastern and western South American
countries. Rev Environ Contam Technol 185:1–33
Bıcego MC, Taniguchi S, Yogui GT, Montone RC, Moreira da Silva
DA, Lourenco RA et al (2006) Assessment of contamination by
polychlorinated biphenyls and aliphatic and aromatic hydrocar-
bons in sediments of the Santos and Sao Vicente Estuary System,
Sao Paulo, Brazil. Mar Pollut Bull 52:1804–1816
Borja J, Taleon DM, Auresenia J, Gallardo S (2005) Polychlorinated
biphenyls and their biodegradation. Process Biochem 40:1999–2013
Brazil (2004) Resolucao CONAMA n� 344 de 25 de Marco de 2004
[in Portugese]. Ministerio do Meio Ambiente
Breivik K, Sweetman A, Pacyna JM, Jones KC (2002) Towards a
global historical emission inventory for selected PCB congen-
ers—a mass balance approach. 1. Global production and
consumption. Sci Total Environ 290:181–198
Breivik K, Alcock R, Li YF, Bailey RE, Fiedler H, Pacyna JM (2004)
Primary sources of selected POPs: regional and global scale
emission inventories. Environ Pollut 128:3–16
Breivik K, Sweetman A, Pacyna JM, Jones KC (2007) Towards a
global historical emission inventory for selected PCB congen-
ers—a mass balance approach. 3. An update. Sci Total Environ
377:199–224
Clifton RJ, Watson PG, Davey JT, Frickers PE (1995) A study of
processes affecting the uptake of contaminants by intertidal
sediments, using the radioactive tracers: 7Be, 137Cs and unsup-
ported 210Pb. Estuar Coast Shelf Sci 41:459–474
Combi T, Taniguchi S, Figueira RCL, Mahiques MMM, Martins CC
(2013) Spatial distribution and historical input of polychlorinated
biphenyls (PCBs) and organochlorine pesticides (OCPs) in
sediments from a subtropical estuary (Guaratuba Bay, SW
Atlantic). Mar Pollut Bull (accepted)
Cordura PCR (1998) A problematica dos resıduos solidos na cidade
de Paranagua. In: Lima RE, Nigrelle RRB (eds) Meio Ambiente
e Desenvolvimento no litoral do Parana: Diagnostico. Curitiba,
Parana, Brazil, pp 145–153
Costa LJM, Godoy AMG, Carneiro SMM, Al E (1999) Diagnostico
socioambiental da cidade de Paranagua:1995. Curitiba, Parana,
Brazil
Erickson MD, Kaley RG (2011) Applications of polychlorinated
biphenyls. Environ Sci Pollut Res 18:135–151
Ferreira PAL, Ribeiro AP, Nascimento MG, Martins CC, Mahiques
MM, Montone RC et al (2013) 137Cs in marine sediments of
Admiralty Bay, King George Island. Antarctica. Sci Tot Environ
443:505–510
Fiedler H (1997) Polychlorinated biphenyls (PCBs): Uses and
environmental releases. St. Petersburg, Russian Federation,
pp 81–103
Figueira RCL, Tessler MG, Mahiques MM, Fukumoto MM (2007) Is
there a technique for the determination of sedimentation rates
based on calcium carbonate content? A comparative study on the
Southeastern Brazilian shelf. Soil Found 47:649–656
Frame GM, Wagner RE, Carnahan JC, Brown JF Jr, May RJ, Smullen
LA et al (1996) Comprehensive, quantitative, congener-specific
analyses of eight Aroclors and complete PCB congener assign-
ments on DB-1 capillary GC columns. Chemosphere 33:603–623
Gevao B, Aba AA, Al-Ghadban AN, Uddin S (2012) Depositional
history of polychlorinated biphenyls in a dated sediment core
from the northwestern Arabian Gulf. Arch Environ Contam
Toxicol 62:549–556
Arch Environ Contam Toxicol
123
Hai X, Li A, Liancheng T, Zhisheng A (2006) Geochronology of a
surface core in the northern basin of Lake Qinghai: evidence
from 210Pb and 137Cs radionuclides. Chin J Geochem 25(4):
301–306
Hanesch M, Scholger R (2002) Mapping of heavy metal loadings in
soils by means of magnetic susceptibility measurements. Envi-
ron Geology 42:857–870
Harrad SJ, Sewart AP, Alcock R, Boumphrey R, Burnett V, Duarte-
Davidson R et al (1994) Polychlorinated biphenyls (PCBs) in the
British environment: sinks, sources and temporal trends. Environ
Pollut 85:131–146
Hong SH, Yim UH, Shim WJ, Oh JR, Lee IS (2003) Horizontal and
vertical distribution of PCBs and chlorinated pesticides in
sediments from Masan Bay, Korea. Mar Pollut Bull 46:244–253
Instituto Brasileiro de Geografia e Estatıstica (2009) Instituto
Brasileiro de Geografia e Estatıstica. Available at: http://www.
ibge.gov.br. Accessed: November 15, 2011
Iwata H, Tanabe S, Sakal N, Tatsukawa R (1993) Distribution of
persistent organochlorines in the oceanic air and surface
seawater and the role of ocean on their global transport and
fate. Environ Sci Technol 27:1080–1098
Jin R, Park SU, Park JE, Kim JG (2012) Polychlorinated biphenyl
congeners in river sediments: distribution and source identifica-
tion using multivariate factor analysis. Arch Environ Contam
Toxicol 62:411–423
Jweda J, Baskaran M (2011) Interconnected riverine-lacustrine
systems as sedimentary repositories: case study in southeast
Michigan using 210Pb and 137Cs-based sediment accumulation
and mixing models. J Great Lakes Res 37:432–446
Khairy MAE-H, Kolb M, Mostafa AR, El-Fiky A, Bahadir M (2012)
Risk posed by chlorinated organic compounds in Abu Qir Bay,
East Alexandria. Egypt. Environ Sci Pollut R 19:794–811
Kolm HE, Schoenenberger MF, Piemonte MDR, Souza PSA, Schnell
e Scuhli G, Mucciatto MB et al (2002) Spatial variation of
bacteria in surface waters of Paranagua and Antonina Bays,
Parana, Brazil. Bras Arch Biol Technol 45:27–34
Lana PC, Marone E, Lopes RM, Machado EC (2001) The subtropical
estuarine complex Paranagua Bay. Bras Ecol Stud 144:131–145
Ligero RA, Barrera M, Casas-Ruiz M (2005) Levels of 137Cs in
muddy sediments on the seabed in the Bay of Cadiz (Spain). Part
II. Model of vertical migration of 137Cs. J Environ Radioactiv
80:87–103
Long ER, MacDonald DD, Smith SL, Calder FD (1995) Incidence of
adverse biological effects within ranges of chemical concentra-
tions in marine and estuarine sediments. Environ Manage 19:
81–97
MacDonald DD, Carr RS, Calder FD, Long ER, Ingersoll CG (1996)
Development and evaluation of sediment quality guidelines for
Florida coastal waters. Ecotoxicology 5:253–278
Martins CC, Mahiques MM, Bıcego MC, Fukumoto MM, Montone
RC (2007) Comparison between anthropogenic hydrocarbons
and magnetic susceptibility in sediment cores from the Santos
Estuary, Brazil. Mar Pollut Bull 54:240–246
Martins CC, Machado EC, Sa F, Lamour MR, Fillmann G (2009)
Using sediment quality guidelines for dredge material manage-
ment in commercial ports of Paranagua Bay, Brazil. Abstract
Book of SETAC Europe Conference, Gotemborg, Sweden
Martins CC, Bıcego MC, Mahiques MM, Figueira RC, Tessler MG,
Montone RC (2010a) Depositional history of sedimentary linear
alkylbenzenes (LABs) in a large South American industrial
coastal area (Santos Estuary, Southeastern Brazil). Environ
Pollut 158:3355–3364
Martins CC, Braun JAF, Seyffert BH, Machado EC, Fillmann G
(2010b) Anthropogenic organic matter inputs indicated by
sedimentary fecal steroids in a large South American tropical
estuary (Paranagua estuarine system, Brazil). Mar Pollut Bull
60:2137–2143
Martins CC, Bıcego MC, Rose NL, Taniguchi S, Lourenco RA,
Figueira RCL et al (2010c) Historical record of polycyclic
aromatic hydrocarbons (PAHs) and spheroidal carbonaceous
particles (SCPs) in marine sediment cores from Admiralty Bay,
King George Island, Antarctica. Environ Pollut 158:192–200
Martins CC, Seyffert BH, Braun JAF, Fillmann G (2011a) Input of
organic matter in a large South American tropical estuary
(Paranagua Estuarine System, Brazil) indicated by sedimentary
sterols and multivariate statistical approach. J Bras Chem Soc
22:1585–1594
Martins CC, Bıcego MC, Mahiques MM, Figueira RCL, Tessler MG,
Montone RC (2011b) Polycyclic aromatic hydrocarbons (PAHs)
in a large South American industrial coastal area (Santos
Estuary, Southeastern Brazil): sources and depositional history.
Mar Pollut Bull 63:452–458
Montone RC, Taniguchi S, Weber RR (2001) Polychlorinated
biphenyls in marine sediments of Admiralty Bay, King George
Island, Antarctica. Mar Pollut Bull 42:611–614
Penteado JCP, Vaz JM (2001) The legacy of the polychlorinated
biphenyls (PCBs). Quim Nova 24:390–398
Robbins JA, Edgington DN (1975) Determination of recent sedimen-
tation rates in Lake Michigan using Pb-210 and Cs-137.
Geochim Cosmochim Acta 39:285–304
Ruiz-Fernandez AC, Sprovieri M, Piazza R, Frignani M, Sanchez-
Cabeza JA, Feo ML et al (2012) 210Pb-derived history of PAH
and PCB accumulation in sediments of a tropical inner lagoon
(Las Matas, Gulf of Mexico) near a major oil refinery. Geochim
Cosmochim Acta 82:136–153
Sahu SK, Ajmal PY, Pandit GG, Puranik VD (2009) Vertical
distribution of polychlorinated biphenyl congeners in sediment
core from Thane Creek area of Mumbai, India. J Hazard Mater
164:1573–1579
Santos DM, Araujo IP, Machado EC, Carvalho-Filho MA, Fernandez
MA, Marchi MR et al (2009) Organotin compounds in the
Paranagua Estuarine Complex, Parana, Brazil: evaluation of
biological effects, surface sediment, and suspended particulate
matter. Mar Pollut Bull 58:1926–1931
Santschi PH, Presley BJ, Wade TL, Garcia-Romero B, Baskaran M
(2001) Historical contamination of PAHs, PCBs, DDTs, and
heavy metals in Mississippi River Delta, Galveston Bay and
Tampa Bay sediment cores. Mar Environ Res 52:51–79
Syakti AD, Asia L, Kanzari F, Umasangadji H, Malleret L, Ternois Y
et al (2012) Distribution of organochlorine pesticides (OCs) and
polychlorinated biphenyls (PCBs) in marine sediments directly
exposed to wastewater from Cortiou. Marseille. Environ Sci
Pollut R. 19:1524–1535
Tolosa I, Bayona JM, Albaiges J (1995) Spatial and temporal
distribution, fluxes and budgets of organochlorinated compounds
in northwest Mediterranean sediments. Environ Sci Technol 29:
2519–2527
United Nations Environment Programme (1992) Determinations of
petroleum hydrocarbons in sediments. In: Reference methods for
marine pollution studies, 2075
United Nations Environment Programme (2001) World development
report 2001: Making new technologies work for human
development
Valette-Silver NJ (1993) The use of sediment cores to reconstruct
historical trends in contamination of estuarine and coastal
sediments. Estuaries 16:577–588
Venkatachalapathy R, Veerasingam S, Basavaiah N, Ramkumar T,
Deenadavalan K (2011) Environmental magnetic and petroleum
hydrocarbons records in sediment cores from the north east coast
of Tamilnadu, Bay of Bengal, India. Mar Pollut Bull 62:681–690
Arch Environ Contam Toxicol
123
Wade TL, Cantillo AY (1994) Use of standards and reference
materials in the measurement of chlorinated hydrocarbon
residues. Chemistry Workbook NOAA Technical Memorandum
NOS ORCA 77:59
Yang H, Zhuo S, Xue B, Zhang C, Liu W (2012) Distribution,
historical trends and inventories of polychlorinated biphenyls in
sediments from Yangtze River Estuary and adjacent East China
Sea. Environ Pollut 169:20–26
Zhang P, Song J, Fang J, Liu Z, Li X, Yuan H (2009) One century
record of contamination by polycyclic aromatic hydrocarbons
and polychlorinated biphenyls in core sediments from the
southern Yellow Sea. J Environ Sci 21:1080–1088
Arch Environ Contam Toxicol
123