Determinants of Prenatal Exposure to Polychlorinated Biphenyls (PCBs) and Polybrominated Diphenyl...
35
National Institutes of Health U.S. Department of Health and Human Services ENVIRONMENTAL HEALTH PERSPECTIVES ENVIRONMENTAL HEALTH PERSPECTIVES ehponline.org Determinants of Prenatal Exposure to Polychlorinated Biphenyls (PCBs) and Polybrominated Diphenyl Ethers (PBDEs) in an Urban Population Julie B. Herbstman, Andreas Sjödin, Benjamin J. Apelberg, Frank R. Witter, Donald G. Patterson, Jr., Rolf U. Halden, Richard S. Jones, Annie Park, Yalin Zhang, Jochen Heidler, Larry L. Needham, and Lynn R. Goldman doi:10.1289/ehp.10333 (available at http://dx.doi.org/) Online 27 September 2007
Transcript of Determinants of Prenatal Exposure to Polychlorinated Biphenyls (PCBs) and Polybrominated Diphenyl...

National Institutes of HealthU.S. Department of Health and Human Services
ENVIRONMENTALHEALTHPERSPECTIVES
ENVIRONMENTALHEALTHPERSPECTIVES
ehponline.org
Determinants of Prenatal Exposure toPolychlorinated Biphenyls (PCBs) and
Polybrominated Diphenyl Ethers (PBDEs) in an Urban Population
Julie B. Herbstman, Andreas Sjödin, Benjamin J. Apelberg,Frank R. Witter, Donald G. Patterson, Jr., Rolf U. Halden,
Richard S. Jones, Annie Park, Yalin Zhang, Jochen Heidler,Larry L. Needham, and Lynn R. Goldman
doi:10.1289/ehp.10333 (available at http://dx.doi.org/)Online 27 September 2007

Title: Determinants of Prenatal Exposure to Polychlorinated Biphenyls (PCBs) and Polybrominated Diphenyl Ethers (PBDEs) in an Urban Population Authors: Julie B. Herbstman 1, Andreas Sjödin 2, Benjamin J. Apelberg 3, Frank R. Witter 4, Donald G. Patterson, Jr.2, Rolf U. Halden 5, Richard S. Jones 2, Annie Park 2, Yalin Zhang 2, Jochen Heidler 5, Larry L. Needham 2, and Lynn R. Goldman 5*
Affiliations: 1 Columbia Children’s Center for Environmental Health Columbia Mailman School of Public Health 100 Haven Avenue, Tower III New York, NY 10032 2 Division of Laboratory Sciences National Center for Environmental Health Centers for Disease Control and Prevention 4770 Buford Hwy NE Atlanta, GA 30341 3 Department of Epidemiology Johns Hopkins Bloomberg School of Public Health 615 N. Wolfe Street Baltimore, MD 21205 4 Department of Gynecology and Obstetrics Johns Hopkins School of Medicine 600 N. Wolfe Street Baltimore, MD 21205 5 Department of Environmental Health Sciences Johns Hopkins Bloomberg School of Public Health 615 N. Wolfe Street Baltimore, MD 21205 * Corresponding Author: Lynn Goldman Johns Hopkins Bloomberg School of Public Health 615 N. Wolfe Street, Room E6636 Baltimore, MD 21205 Phone: (410) 614-9301 Fax: (410) 287-7075 Email: [email protected]
1

Running title: Determinants of Fetal Exposure to PCBs and PBDEs
Key Words:
Dichlorodiphenyldichloroethylene
Dichlorodiphenyltrichloroethane
Environmental exposure
Epidemiology
Fetal exposure
Polychlorinated biphenyls
Polybrominated diphenyl ethers
Prenatal
Urban
Acknowledgements:
We thank the following people whose contributions have been essential to the completion of this
work: Thomas Burke, Jonathan Samet, Aidan McDermott, Frank Curriero, Ellen Wells, Clayton
Sann, Tom Bernert, Wayman Turner, Ruth Quinn, Carol Resnick, and the nursing staff in the
Labor and Delivery Unit of the Johns Hopkins Hospital. We also thank our funders: the Johns
Hopkins University (JHU) Bloomberg School of Public Health Maryland Mothers and Babies
Study, the Maryland Cigarette Restitution Program Research Grant given to the Johns Hopkins
Medical Institutions, the JHU Center in Urban Environmental Health (P30ES03819), the JHU
Center for a Livable Future, the JHU Department of Epidemiology, the JHU Center for
Excellence in Environmental Public Health Tracking, and the Heinz Family Foundation. The
authors have no competing financial interests to disclose.
2

Abbreviations:
BDE Brominated Diphenyl Ether
BMI Body Mass Index
C Celsius
CB Chlorinated Biphenyl
CDC Centers for Disease Control and Prevention
DDE Dichlorodiphenyldichloroethylene
DDT Dichlorodiphenyltrichloroethane
FR Flame Retardants
GC-ID_HRMS Gas Chromatography Isotope Dilution High Resolution Mass Spectrometry
HIPAA Health Insurance Portability and Accountability Act
IQR Interquartile Range
IRB Institutional Review Board
JHU Johns Hopkins University
LOD Limit of Detection
MD Maryland
PCB Polychlorinated Biphenyls
PBDE Polybrominated Diphenyl Ethers
POP Persistent Organic Pollutant
SPE Solid Phase Extraction
3

Outline of Section Headers:
Abstract
Introduction
Materials and Methods
Study Design and Population
Data Collection
Data Analyses
Results
Discussion
References
Tables
Figure Legends
Figures
4

Abstract:
Background: Recent studies have reported blood levels of polybrominated diphenyl ethers
(PBDEs) in the US population. Information about neonatal levels, and the relationship to \
polychlorinated biphenyls (PCBs) exposures, is limited.
Objectives: The objective was to characterize levels and determinants of fetal exposure to
PBDEs and PCBs among newborns from Baltimore, MD.
Methods: We analyzed umbilical cord blood for eight PBDEs and 35 PCBs from infants
delivered at the Johns Hopkins Hospital. Maternal and infant characteristics were abstracted
from medical records.
Results: Ninety-four percent of cord serum samples had quantifiable levels of at least one PBDE
congener, and over 99% had at least one detectable PCB congener. PBDE concentrations in cord
blood were similar to those reported in other studies from North America. Strong correlations
were observed within but not across PCB and PBDE classes. Multivariate models showed that
many factors independently predicted exposure to BDE-47, BDE-100 and BDE-153 and CB-
118, CB-138/158, CB-153 and CB-180. Generally, infants of Asian mothers had lower PBDE
and PCB levels and infants of smokers had higher levels. Increased maternal BMI was
associated with lower levels of PCBs but not PBDEs. Levels of PCBs but not PBDEs were
lower in births from married and multiparous mothers. Increased maternal age was associated
with higher PCB levels but lower PBDE levels.
Conclusions: While many of the factors we investigated were independent predictors of both
PBDE and PCB levels, in some cases the direction of associations was different. More research
is needed to better understand the sources and pathways of PBDE exposure.
5

Introduction
Use of polybrominated diphenyl ethers (PBDEs) as flame retardants (FRs) in plastics,
including electronic enclosures and polyurethane used in upholstery cushioning and carpet pads,
has increased steadily in the past 30 years (Alaee et al. 2003; de Wit 2002; Hardy 2002b).
PBDEs used as additive FRs are more likely to leach over time than reactive FRs, which are
chemically bonded to the plastic polymer (Alaee and Wenning 2002; Eriksson et al. 2001; Sjodin
et al. 2001a). PBDEs are similar to polychlorinated biphenyls (PCBs) in structure, lipophilicity,
persistence and ability to bioaccumulate (Hardy 2002a; McDonald 2002). Since the 1970s,
environmental concentrations of PCBs and other POPs have fallen while levels of PBDEs have
increased exponentially (Alaee and Wenning 2002; Eriksson et al. 2001; Meironyte et al. 1999;
Sjodin et al. 2001b). Currently, human PBDE levels are of a magnitude similar to PCB
concentrations in some regions (Hites 2004; Petreas et al. 2004). Human levels of PBDEs are
higher in North America than in Europe and within a given population, a small fraction (5–10%)
of individuals have concentrations far exceeding average levels (Betts 2003; Hites 2004;
Schecter et al. 2005; Sjodin et al. 2003; Wilford et al. 2005). While there have been no studies
investigating the health effects associated with PBDEs in humans, there are reports of human
exposure levels that may be on par with levels eliciting harmful effects in laboratory animals
(McDonald 2005). Animal studies have shown evidence of the disruption of normal endocrine
function and neurodevelopmental, hepatic, and reproductive toxicity (Betts 2004; Betts 2005;
Johnson-Restrepo et al. 2005).
Currently, there is an incomplete understanding of how humans are exposed to PBDEs.
It is reasonable to posit that among those with high concentrations, occupational exposures may
be involved in some cases (Sjodin et al. 1999; Thuresson et al. 2005). In the general population,
6

several potential routes of PBDE exposure have been identified: (1) direct contact with treated
products; (2) dietary, as these lipophilic compounds are stored in the fat of meats, fish, and dairy
products (Harrad et al. 2004; Schecter et al. 2004; Schecter et al. 2006; Wilford et al. 2005); and
(3) ingestion and to a lesser degree inhalation of PBDE-containing house dust (Jones-Otazo et al.
2005; Stapleton et al. 2005; Wilford et al. 2005; Wu et al. 2007) Only a few studies have been
able to explore individual determinants of PBDE body burdens in much detail (Morland et al.
2005; Wu et al. 2007).
Levels of PBDEs (as well as PCBs and organochlorine pesticides) measured in adipose
tissue, blood, or milk can be used to assess exposures (Sjodin et al. 2003). Infants and fetuses
are sensitive sub-populations to consider, as these stages of development may be especially
susceptible to effects of chemical exposures (Howdeshell 2002). Toxicological models have
indicated that immature animals have slower metabolism and excretion of PBDEs;
approximately 50% of the administered 2,2’,4,4’-tetraBDE (BDE-47) dose is excreted in the first
24 hours in adult animals as compared to 31% and 41% in animals dosed at 10 and 22 days after
birth (Staskal et al. 2006). Measuring PBDEs in cord blood serum is non-invasive, utilizing a
blood sample that is otherwise usually discarded, and is a direct measure of prenatal exposure.
The estimated half lives of these compounds in humans are long enough -- BDE-47 1.8 to 3.0
years, 2,2’,4,4’,5-pentaBDE (BDE-99) 2.9 to 5.4 years, and 2,2’,4,4’,5,5’-hexaBDE (BDE-153)
6.5 to 11.7 years (Geyer et al. 2004) -- that cord blood concentrations reflect exposure through
the course of pregnancy. Such levels also provide a reasonable estimate of maternal serum
concentrations (Mazdai et al. 2003).
The principal objective of this investigation was to characterize fetal exposure to PBDEs
and selected PCBs among newborns from Baltimore, MD, via the assessment of concentrations
7
in umbilical cord serum. Demographic characteristics and attributes were explored to identify
determinants and to explain variations in exposure levels and patterns within this largely urban
and African American population.
Materials and Methods
Study Design and Population
We conducted a cross-sectional study of newborn deliveries at the Johns Hopkins
Hospital in Baltimore, MD. This study will examine the associations between exposures to a
number of toxic chemicals, thyroid hormone levels and birth outcomes; determinants of PCB and
PBDE exposure are presented here. We collected umbilical cord blood from a sample of women
presenting at the Johns Hopkins Hospital for delivery of singleton births from November 26,
2004 to March 16, 2005. Samples were excluded if the family wished to archive cord blood or if
samples yielded less than 5.2 ml of serum. During the study period, of 597 singleton births
delivered, 341 cord bloods were collected, of which 300 had sufficient serum volume for
laboratory analyses. A brief survey of hospital personnel revealed that specimens were missed
mainly due to: complications during delivery, premature birth and/or small size of the infant
resulting in small cord blood volume, and logistical factors such as understaffing. This study
had the approval of the Maternal and Fetal Research Committee in the Department of
Gynecology and Obstetrics and the Institutional Review Board (IRB) at the Johns Hopkins
University (JHU) School of Medicine, and a Health Insurance Portability and Accountability
(HIPAA) waiver. The requirement for informed consent was waived by the IRB because
drawing blood from the placenta involves no more than minimal risk to the subjects and
biosamples collected would otherwise have been discarded. Strict safeguards preserving patient
confidentiality were established. Members of a community advisory committee, who were
8

selected for their specific knowledge and expertise on important child health concerns in
Maryland had the opportunity to learn about and comment on this study.
Data Collection
Nurses or physicians who routinely collect cord blood specimens for clinical purposes
obtained umbilical vein blood using a syringe immediately after newborn delivery but prior to
the delivery of the placenta (Witter et al. 2001). The cord blood was transferred from the
syringes to silicon-coated (PBDE-free) vacutainers that were stored for a maximum of 3 hours at
4 degrees C. The vacutainers were centrifuged at 2400 x g for 15 minutes, and serum was
pipetted into pre-screened amber glass vials with Teflon-lined screw caps, which were
immediately stored at minus 80 degrees C (Sjodin et al. 2004b). Frozen specimens were
transferred on dry ice to the Centers for Disease Control and Prevention (CDC) for laboratory
analyses.
Details regarding the analysis of the serum samples for PBDEs and PCBs are described
elsewhere (Sjodin et al. 2004b). Briefly, the samples were fortified with 13C-labelled internal
standards and formic acid and water for denaturation and dilution using a Gilson 215 liquid
automated handler (Gilson Inc.; Middleton, WI). The samples were extracted using the Rapid
Trace (Caliper Life Sciences; Hopkinton, MA) modular solid phase extraction (SPE) system.
Lipids were co-extracted using the SPE system and were removed on a silica:silica/sulfuric acid
column. The final analytic determinations were performed using a gas chromatography isotope
dilution high resolution mass spectrometry (GC/ID-HRMS) employing a MAT95XP
(ThermoFinnigan MAT, Bremen, Germany) instrument. The serum lipid concentration was
determined by use of commercially available test kits from Roche Diagnostics Corp.
(Indianapolis, IN) for the quantitative determination of total triglycerides (Product No.
9

011002803-0600) and total cholesterol (Product No. 011573303-0600). Final determinations
were made on a Hitachi 912 Chemistry Analyzer (Hitachi; Tokyo, Japan).
A total of 297 of the 300 cord serum samples were successfully analyzed. The limits of
detection (LOD) were defined both in relation to the method blanks and the instrumental
detection limit (Sjodin et al. 2004b). The serum samples were analyzed for the following PBDE
congeners (by International Union of Pure and Applied Chemistry numbers): 2,4,4’-
tribromodiphenyl ether (BDE-28), 2,2’,4,4’-tetraBDE (BDE-47), 2,2’,3,4,4’-pentaBDE (BDE-
85), 2,2’,4,4’,5-pentaBDE (BDE-99), 2,2’,4,4’,6-pentaBDE (BDE-100), 2,2’,4,4’,5,5’-hexaBDE
(BDE-153), 2,2’,4,4’,5,6’-hexaBDE (BDE-154), and 2,2’,3,4,4’,5’,6-heptaBDE (BDE-183). We
analyzed 21 samples for decaBDE (BDE-209; all of these specimens had a concentration below
the limit of detection LOD. Due to this observation, the concentration of BDE-209 was not
determined in remaining specimens. The median LOD for BDE-209 was 3.0 ng/g lipid and the
range was 2.0-3.7. The samples were also analyzed for 35 PCB congeners (the full list is
available in Supplemental Material, Table 1); the results of the following four congeners are
presented here: 2,3’,4,4’,5-pentaCB (CB-118), 2,2’,3,4,4’,5’-hexaCB / 2,3,3’,4,4’,6-hexaCB
(CB-138/158, co-elution), 2,2’,4,4’,5,5’-hexaCB (CB-153), and 2,2’,3,4,4’,5,5’-heptaCB (CB-
180). The specimens were also analyzed for 9 persistent pesticides of which only 2,2-bis(4-
chlorophenyl)-1,1-dichloroethene (p,p’-DDE), the primary degradation product of p,p’-DDT, is
reported in this publication. Cotinine concentrations were measured in cord blood by use of
liquid chromatography in conjunction with atmospheric pressure ionization tandem mass
spectrometry (Bernert, Jr. et al. 1997).
Demographic information and biological measures were abstracted from the maternal
medical records by two study personnel, and a 10% random sample was re-reviewed by study
10

clinicians. Additional information was obtained from forms completed by the nursing staff at the
time of delivery. Age, education, marital status, and parity were based on self-report. Self-
reported maternal race was also recorded as it appeared in the medical records as one of three
categories: African American, Caucasian, and Asian. No further information was available
regarding length of residency in the U.S. or a further ethnic breakdown within these three race
categories. Smoking status was defined using a combination of the maternal medical record and
cord serum cotinine concentrations; levels above 10 ng/mL were categorized as maternal active
smoking (Centers for Disease Control and Prevention 2005). If the clinical record indicated that
the mother reported smoking at any time during pregnancy, she was considered an active
smoker, regardless of the cotinine concentration. Maternal street addresses were geocoded by
GeoLytics Inc. (East Brunswick, NJ), who also provided census information at the block-group
level. Once data collection was completed, medical record numbers and addresses were deleted
from study databases and files. Geographical locations were maintained at the block-group
level.
Data Analyses
PBDE distributions were log-normally distributed; medians and interquartile ranges
(IQR) are presented, and concentrations were log-transformed for regression analyses. To
confirm that the distributions conformed to the assumptions of normality, (P-P) plots were used.
For analytes below the LOD, the value imputed is the LOD divided by the square-root of two.
PCB and PBDE concentrations were expressed as ng/g lipid.
Spearman correlation coefficients were used to explore bivariate relationships between
various PBDEs and organohalogen compounds. PCB-118, 138/158 (co-eluting congeners), 153,
and 180 were selected for further analysis on the basis of their proportional contribution to the
11
ΣPCB concentration and having a large proportion of the samples with detectable levels. Only
PBDEs with ≥60% detectable (BDE-47, 100, and 153) were evaluated further. Univariate and
multivariate linear regression models were developed for these congeners. To avoid excluding
observations in multivariate analyses, the median was substituted for missing values (4 median
substitutions for maternal education, 7 for timing of first prenatal visit, 9 for weight gain during
pregnancy, 4 for median household income, and 11 for body mass index (BMI)). Also, “high”
exposure groups were defined as individuals in the highest 10% of the exposure distribution for
BDE-47, BDE-153, CB-153, and CB-180 concentrations, respectively; this endpoint was
modeled using multivariate logistic regression models. Statistical differences by exposure group
were evaluated by use of the Student’s t-test and Fisher’s exact tests. All statistical analyses
were conducted using STATA, version 8.0 (College Station, TX).
Results
Of the 300 samples sent for PCB and PBDE analyses, 297 successfully underwent sample
preparation and quantification. The 41 infants with insufficient serum quantity were more likely
to be the first born (61% vs. 42%), preterm (24% vs. 13%), and/or low birth weight (22% vs.
11%). Concentrations (ng/g lipid) of analyzed PBDE and selected PCB congeners are given in
Table 1, with the percentage of results above the LOD. Ninety-four percent of the cord samples
contained at least one detectable BDE congener, and over 99% had at least one detectable PCB
congener. Among the eight BDE congeners monitored, the tetrabrominated BDE-47 was the
dominant congener by weight, accounting, on average, for 51.2% of the ΣPBDE concentration.
In order of decreasing abundance, BDE-47 was followed by BDE-99 (12.0%), BDE-153 (8.2%),
and BDE-100 (8.1%), with BDE-28, 85, 154, and 183 each accounting for less than 4% of the
ΣPBDE concentration. Spearman correlations were calculated between pairs of selected PCB
12

and PBDE congeners and DDE. In general, the correlations were the highest within each
compound class, while PCB and PBDE congeners were not highly correlated with each other.
PCBs but not PBDEs were correlated with serum DDE levels (see Supplemental Material, Table
2).
In this population, the mean maternal age was 25.9 years (standard deviation 6.6 years).
The majority (70%) were African American, with 21% Caucasian and 8% Asian. Most (66%) of
the mothers were unmarried and a large proportion (29%) had less than a high school education.
Use of standardized categories of BMI showed that almost half of the mothers were overweight
or obese prior to pregnancy (National Institutes of Health 1998). On the basis of self-reported
smoking status, 15% of women smoked tobacco during the pregnancy. However, after
validating self-reported tobacco use with cord serum cotinine levels, 19% were classified as
active smokers during pregnancy. Nearly 70% resided within the Baltimore city limits.
Median and interquartile ranges of lipid-adjusted PBDE and PCB concentrations are
shown in Figures 1 and 2, stratified by demographic variables. These univariate analyses show
general exposure patterns for the two sets of compounds. The relationships between the
covariates presented in Figures 1 and 2 and cord serum concentrations were evaluated by use of
multivariate linear regression models (Tables 2 and 3). The adjusted regression coefficients were
compared to unadjusted regression coefficients to evaluate confounding.
In a multivariate model of cord BDE-47, younger maternal age, less pregnancy weight
gain, having more than 5+ years of college education, and being classified as obese pre-
pregnancy were independently associated with increased cord blood levels (Table 2). For BDE-
100, only maternal smoking during pregnancy was predictive of higher cord blood levels in a
multivariate model. For BDE-153, the multivariate model indicated that younger maternal age,
13
less weight gain during pregnancy, and smoking during pregnancy were associated with higher
cord blood levels. Asian infants had lower mean cord levels of BDE-47 and BDE-153. The
multivariate models indicate that the univariate relationships between some of the independent
variables and PBDE exposure were confounded. For example, for PBDE-47, a number of
variables – maternal race, median household income in the neighborhood, marital status, and
residence in or outside of the Baltimore city limits – were no longer associated with cord serum
levels after controlling for maternal age, weight gain during pregnancy, education, and BMI.
In the case of PCB serum levels (Table 3), both univariate and multivariate linear
regression models for PCB-118, CB-138/158, CB-153, and CB-180 indicated that maternal age
was positively associated with umbilical cord PCB levels. For PCB-118, in addition to maternal
age, the multivariate model indicated that infants of unmarried mothers and mothers having 5+
years of college education had increased exposure. In the case of CB-138/158, infants of older
mothers, unmarried mothers, and mothers who smoked during pregnancy had higher mean
exposure levels. Infants of Asian and obese mothers had lower mean cord levels of CB-138/158.
For both CB-153 and CB-180, the multivariate models indicated that in addition to increasing
maternal age, lower birth order (parity), being unmarried, and maternal smoking during
pregnancy were independently associated with higher cord levels. Infants of Asian and obese
mothers had lower mean cord serum level of CB-153 and CB-180. Similar to PBDEs, the PCB
multivariate models suggest that some of the univariate relationships were confounded.
Within our population, subgroups of high exposure were identified as described above.
There were 10 individuals who were in the highest decile of both BDE-47 and BDE-153, and 23
individuals were in the highest of both CB-153 and CB-180. Only 1 individual was in the highest
decile of all four congeners considered in this analysis. The odds of being in the highest decile
14

of exposure were examined for these four congeners using multivariate logistic regression and
the same independent variables as presented in Tables 2 and 3. Although the 95% CI are wide,
infants of mothers who smoked during pregnancy (OR: 4.10, 95% CI: 1.51 to 11.10) and those
whose mothers had completed more than 5 years of post-high school education (OR: 11.51, 95%
CI: 1.36 to 97.66) were significantly more likely to be in the high BDE-47 exposure group.
There were no covariates significantly associated with being in the high BDE-153 exposure
group. Infants of older mothers (OR: 1.42, 95% CI: 1.26 to 1.61; OR: 1.44, 95% CI: 1.26 to
1.64) and mothers with a prior childbirth (OR: 6.06, 95% CI: 1.57 to 23.45; OR: 6.76, 95% CI:
1.68 to 27.16) were more likely to be in the high CB-153 and CB-180 exposure groupings,
respectively.
Discussion
PBDE and PCB concentrations were measured in cord serum of 297 neonates born at an
inner city referral hospital. To date there is little data with regards to exposures in inner city,
largely African American populations. While concentrations of individual PBDEs and PCB
congeners were correlated within classes, they were not well correlated across classes. Some
studies have reported positive correlations between these two classes of compounds in humans
(Kalantzi et al. 2004) and in fish (Hale et al. 2001; Hayward et al. 2004);. Others, including
ours, report no such association (Bradman et al. 2007; Johnson-Restrepo et al. 2005; Thomas et
al. 2005). While PBDEs are found in a variety of household and consumer products, PCBs no
longer are manufactured for use and most existing uses have been phased out. This is consistent
with the finding that PCBs, but not PBDEs, are correlated with p,p’-DDE levels. p,p’-DDE is the
degradation product of p,p’-DDT, which has not been actively used in the United States for
decades. Differences in PCB and PBDE toxicokinetics may also play a role (Johnson-Restrepo
15

et al. 2005). Generally, as well as in our study, the distribution of PBDEs in humans is log-
normally distributed such that approximately 5% of the sample has PBDE levels that are 3–5
times higher than the median (Jones-Otazo et al. 2005; She et al. 2004; Wilford et al. 2005; Wu
et al. 2007). Of these, very few were also highly exposed to PCBs, an observation that may
indicate that differing routes of exposure or temporal differences in patterns of use are
responsible for the highest levels.
To date, there are two other published studies that have reported PBDE levels in cord
blood: one in Sweden and one in Indiana (USA), both in 2001 (Guvenius et al. 2003; Mazdai et
al. 2003). Although these studies are much smaller than ours, the Indiana study reports similar
concentrations of PBDEs in cord blood (median ΣPBDE: 39 ng/g serum lipid, range: 14–460)
(Mazdai et al. 2003). Our concentrations were over an order of magnitude higher than the
Swedish levels (median ΣPBDE: 1.7 ng/g serum lipid, range: 0.5–4.3) (Guvenius et al. 2003).
An additional study that evaluated the concentration of PBDEs in human fetal livers (n=11)
reported lower concentrations (median ΣPBDE: 15.2 ng/g lipid, range: 4.0-98.5) than those
measured in this study (Schecter et al. 2007). Levels of PBDEs in cord blood are roughly
equivalent to those found in maternal blood on a lipid-adjusted basis (Mazdai et al. 2003) and
PBDEs measured on a per-lipid basis may be compared across matrices. PBDE levels in human
milk in two U.S. studies are similar to what was measured in this population on a lipid weight
basis (Schecter et al. 2003; Wu et al. 2007). From these comparisons, albeit limited because
different sets of congeners contributing to the total exposure (Σ measurement) in each study, we
conclude that the levels found in this study are consistent with U.S. levels reported elsewhere
and are much higher than levels in Sweden (Bradman et al. 2007; Hites 2004; Wu et al. 2007).
16

In most human samples, BDE-47 has been identified as the dominant congener in terms
of concentration (Hites 2004; Schecter et al. 2007; Sjodin et al. 2001b). However, there are
some populations (mainly in Europe) and a small proportion of individuals within U.S.
populations in which BDE-153 is instead the dominant PBDE congener in humans (Covaci et al.
2002; Naert et al. 2006; She et al. 2004; Thomas et al. 2005; Wu et al. 2007). This second
pattern is present among 5% of our population. This difference may reflect variable exposure
pathways or toxicokinetics or, alternatively, differences in diet among individuals from countries
or ethnic groups where BDE-47 is not the dominant congener in foods (Covaci et al. 2002).
A number of factors independently predicted exposures to PCBs and PBDEs in
multivariate models. The direction of a number of these associations was surprisingly different
between these two compound classes. PBDEs tended to decrease with older maternal age, while
PCBs consistently increased. Women who were obese prior to pregnancy had higher BDE-47
levels. However, for CB-138/158, CB-153, and CB-180, pre-pregnancy obesity was associated
with lower exposure levels. Asians generally had lower PCB and PBDE levels than Caucasians.
In addition to differences in exposure routes and pathways, immigration patterns (including the
number of years since immigrating to the U.S.) may, in part, explain these differences.
However, this data was not available for analysis in this study.
The observed positive association between maternal age with PCB levels was expected.
In contrast, maternal age was independently negatively associated with each and all PBDE
congeners. The levels of PBDEs are still increasing or have been increasing until recently in the
general US population, making the influence of accumulation with age less important (Sjodin et
al. 2004a). In this way, if most of the exposure to high levels of PBDEs has occurred more
recently in time, a person’s length of time with high exposure may be independent of age.
17

Another possible explanation is that PBDEs have shorter half-lives as compared to PCBs (Ogura
2004). Other studies have not observed a relationship between age and PBDE concentrations,
independent of parity (Schecter et al. 2003; Sjodin et al. 2003; Sjodin et al. 1999). However, the
study by Schecter et al., which included men and a broader age range, reported a “suggested”
inverse association between PBDE levels and age (Schecter et al. 2005). Among our population,
the inverse association with maternal age and PBDEs corresponds to a 12 ng/g lipid decrease in
predicted average BDE-47 concentrations over the entire age range in the study (14–43 years).
Although the maternal age range in this study is over only one generation, there is the possibility
of a behavioral cohort effect, such that younger women may have more contact with consumer
products containing PBDEs or have higher consumption of PBDE-containing foods. An
association with diet is also suggested by the higher levels among women with obese pre-
pregnancy BMI although this may reflect lifestyle differences as well.
As expected, multivariate models indicate that body burden of PCBs (CB-153 and CB-
180) decreased with increased maternal parity. That is consistent with the notion that pregnancy
is one of the major routes of elimination for PCBs as well as other lipophilic POPs (Barr et al.
2005). However, we found no evidence for a decrease in PBDE levels with increased numbers
of pregnancy in our study. Lactation is another mechanism for the excretion of PCBs and
PBDEs. In this study, information about previous lactation history was unavailable.
Dilution of organohalogen levels via weight gain is another mechanism that could explain
lower levels in subjects with a higher BMI. In our population, consistent with other studies,
women with very high (obese) pre-pregnancy BMIs consistently had lower lipid-adjusted PCB
levels, and very underweight women tended to have higher PCB levels compared to women with
normal pre-pregnancy weight (Glynn et al. 2007). However, such a “fat dilution” phenomenon
18

was not observed for PBDEs; if anything, obese women had higher exposure levels (in the case
of BDE-47 and BDE-100). Conversely, reduced weight gain during pregnancy tended to be
associated with higher levels of exposure to PBDEs. A study examining the effect of the
commercially available DE-71 mixture (consisting of primarily tetra and penta PBDE congeners)
in rats did not find an association between weight gain during pregnancy and exposure (Zhou et
al. 2002). In this cross-sectional study, it is not possible to determine whether reduced weight
gain during pregnancy is a predictor or the consequence of high concentrations of PBDEs.
Smoking during pregnancy was associated with higher cord blood levels of both PCBs
and PBDEs. Smokers have increased hand-to-mouth behavior that can increase oral ingestion of
contaminated dust in the environment among smokers or altered mucociliary clearance processes
in the upper airways of smokers, potentially leading to ingestion of mucus-containing inhaled
PBDE particles (Phillips et al. 2003). However, particle ingestion would not explain why
smokers also have elevated levels of PCBs, which are not typically found in dust. Smoking may
also be associated with other lifestyle factors (including diet) which we were not able to evaluate
in this study. Alternatively, smoking alters PCB and PBDE exposure levels via alteration in
either maternal or fetal hepatic enzymes (or both). Certainly, smoking induces Cyp1A2, which
has been shown to be involved in metabolism of mono-ortho PCBs (Ayotte et al. 2005), such as
CB-118, which is the one PCB that was not associated with smoking in our study. This,
however, would not explain why levels of the di-ortho PCBs such as CB-153 and CB-180 as
well as PBDE levels were higher among smokers. Though not readily explained, these
associations were consistent and need further study.
In this study, we examined individual and spatial determinants of PBDE exposure that
might explain the wide distribution of blood levels evident in this population. While many of
19

these factors were significant predictors of exposure, overall, the majority of the variation was
unexplained, implying that there are other unmeasured factors that account for this variation.
These factors may be related to differential exposure (i.e., dietary differences or differences in
microenvironments), which we were unable to collect in this population. It is also possible that
the wide variation detected in cord blood serum levels might be related to inter-individual
genetic differences that impact the ability to absorb, metabolize, or excrete these compounds.
20

References
Alaee M, Arias P, Sjodin A, Bergman A. 2003. An overview of commercially used brominated
flame retardants, their applications, their use patterns in different countries/regions and possible
modes of release. Environment International 29:683-689.
Alaee M, Wenning RJ. 2002. The significance of brominated flame retardants in the
environment: current understanding, issues and challenges. Chemosphere 46:579-582.
Ayotte P, Dewailly E, Lambert GH, Perkins SL, Poon R, Feeley M, et al. 2005. Biomarker
measurements in a coastal fish-eating population environmentally exposed to organochlorines.
Environ Health Perspect 113:1318-1324.
Barr D, Wang RY, Needham LL. 2005. Biologic monitoring of exposure to environmental
chemicals throughout the life stages: requirements and issues for consideration for the National
Children's Study. Environmental Health Perspectives 113:1083-1091.
Bernert JT, Jr., Turner WE, Pirkle JL, Sosnoff CS, Akins JR, Waldrep MK, et al. 1997.
Development and validation of sensitive method for determination of serum cotinine in smokers
and nonsmokers by liquid chromatography/atmospheric pressure ionization tandem mass
spectrometry. Clin Chem 43:2281-2291.
Betts K. 2003. Why do PBDE levels vary widely? Environ Sci Technol 37:164A-165A.
----- 2004. PBDEs and the environmental intervention time lag. Environ Sci Technol 38:386A-
387A.
Betts KS. 2005. A new record for PBDEs in people. Environ Sci Technol 39:296A.
21

Bradman A, Fenster L, Sjodin A, Jones R, Patterson DG, Jr., Eskenazi B. 2007. Polybrominated
Diphenyl Ether Levels in the Blood of Pregnant Women Living in an Agricultrual Community in
California. Environ Health Perspect 115:71-74.
Centers for Disease Control and Prevention. 2005. Third National Report on Human Exposure
to Environmental Chemicals. NCEH Pub. No. 05-0570. Atlanta, GA, Department of Health and
Human Services, Centers for Disease Control and Prevention, National Center for Environmental
Health, Division of Laboratory Sciences.
Covaci A, de BJ, Ryan JJ, Voorspoels S, Schepens P. 2002. Distribution of organobrominated
and organochlorinated contaminants in Belgian human adipose tissue. Environ Res 88:210-218.
de Wit CA. 2002. An overview of brominated flame retardants in the environment.
Chemosphere 46:583-624.
Eriksson P, Jakobsson E, Fredriksson A. 2001. Brominated Flame Retardants: A Novel Class of
Developmental Neurotoxicants in Our Environment? Environmental Health Perspectives
109:903-908.
Geyer H, Schramm K, Darnerud PO, Aune M, Feicht E, Fried F, et al. 2004. Teminal
elimination half-lives of the brominated flame retardant TBBPA, HBCD, and lower brominated
PBDEs in humans. Organohalogen Compounds 66:3867-3872.
Glynn A, Aune M, Darnerud PO, Cnattingius S, Bjerselius R, Becker W, et al. 2007.
Determinants of serum concentrations of organochlorine compounds in Swedish pregnant
women: a cross-sectional study. Environmental Health 6.
22

Guvenius DM, Aronsson A, Ekman-Ordeberg G, Bergman A, Noren K. 2003. Human prenatal
and postnatal exposure to polybrominated diphenyl ethers, polychlorinated biphenyls,
polychlorobiphenylols, and pentachlorophenol. Environ Health Perspect 111:1235-1241.
Hale RC, La Guardia MJ, Harvey EP, Mainor TM, Duff WH, Gaylor MO. 2001.
Polybrominated diphenyl ether flame retardants in Virginia freshwater fishes (USA). Environ Sci
Technol 35:4585-4591.
Hardy ML. 2002a. A comparison of the properties of the major commercial PBDPO/PBDE
product to those of major PBB and PCB products. Chemosphere 46:717-728.
----- 2002b. The toxicology of the three commercial polybrominated diphenyl oxide (ether)
flame retardants. Chemosphere 46:757-777.
Harrad S, Wijesekera R, Hunter S, Halliwell C, Baker R. 2004. Preliminary assessment of U.K.
human dietary and inhalation exposure to polybrominated diphenyl ethers. Environ Sci Technol
38:2345-2350.
Hayward D, Wong J, Krynitsky AJ. 2004. PBDE and PCB levels correlated in wild and farm-
raised fish fillets in the USA. Organohalogen Compounds 66:3994-3998.
Hites RA. 2004. Polybrominated diphenyl ethers in the environment and in people: a meta-
analysis of concentrations. Environ Sci Technol 38:945-956.
Howdeshell KL. 2002. A model of the development of the brain as a construct of the thyroid
system. Environ Health Perspect 110 Suppl 3:337-348.
23

Johnson-Restrepo B, Kannan K, Rapaport DP, Rodan BD. 2005. Polybrominated diphenyl
ethers and polychlorinated biphenyls in human adipose tissue from New York. Environ Sci
Technol 39:5177-5182.
Jones-Otazo HA, Clarke JP, Diamond ML, Archbold JA, Ferguson G, Harner T, et al. 2005. Is
house dust the missing exposure pathway for PBDEs? An analysis of the urban fate and human
exposure to PBDEs. Environ Sci Technol 39:5121-5130.
Kalantzi OI, Martin FL, Thomas GO, Alcock RE, Tang HR, Drury SC, et al. 2004. Different
levels of polybrominated diphenyl ethers (PBDEs) and chlorinated compounds in breast milk
from two U.K. Regions. Environ Health Perspect 112:1085-1091.
Mazdai A, Dodder NG, Abernathy MP, Hites RA, Bigsby RM. 2003. Polybrominated diphenyl
ethers in maternal and fetal blood samples. Environ Health Perspect 111:1249-1252.
McDonald TA. 2002. A perspective on the potential health risks of PBDEs. Chemosphere
46:745-755.
----- 2005. Polybrominated diphenylether levels among United States residents: daily intake and
risk of harm to the developing brain and reproductive organs. Integr Environ Assess Manag
1:343-354.
Meironyte D, Noren K, Bergman A. 1999. Analysis of polybrominated diphenyl ethers in
Swedish human milk. A time-related trend study, 1972-1997. J Toxicol Environ Health A
58:329-341.
24

Morland K, Landrigan P, Sjodin A, Gobeille A, Jones RS, McGahee EE, III, et al. 2005. Body
burdens of polybrominated diphenyl ethers among urban anglers. Environmental Health
Perspectives 113:1689-1692.
Naert C, Piette M, Bruneel N, Van PC. 2006. Occurrence of Polychlorinated Biphenyls and
Polybrominated Diphenyl Ethers in Belgian Human Adipose Tissue Samples. Arch Environ
Contam Toxicol.
National Institutes of Health. 1998. Clinical guidelines on the identification, evaluation, and
treatment of overweight and obesity in adults: The evidence report. Obes Res. 1998:51S-209S.
Ogura I. 2004. Half-life of each dioxin and PCB congener in the human body. Organohalogen
Compounds 66:3376-3380.
Petreas M, Smith D, Hurley S, Jeffrey SS, Gilliss D, Reynolds P. 2004. Distribution of
persistent, lipid-soluble chemicals in breast and abdominal adipose tissues: lessons learned from
a breast cancer study. Cancer Epidemiol Biomarkers Prev 13:416-424.
Phillips DE, Hill L, Weller P, Willett M, Bakewell R. 2003. Tobacco smoke and the upper
airway. Clinical Otolaryngology 28:492-496.
Schecter A, Johnson-Welch S, Tung KC, Harris TR, Papke O, Rosen R. 2007. Polybrominated
Diphenyl Ether (PBDE) Levels in Livers of U.S. Human Fetuses and Newborns. J Toxicol
Environ Health A 70:1-6.
25

Schecter A, Paepke O, Harris T, Tung K, Musumba A, Olson J, et al. 2006. Polybrominated
Diphenyl Ether (PBDE) Levels in an Expanded Market Basket Survey of U.S. Food and
Estimated PBDE Dietary INtake by Age and Sex. Environ Health Perspect 114:1515-1520.
Schecter A, Papke O, Ryan JJ, Rosen R, Tung KC, Pavuk M, et al. 2004. PBDEs in U.S. milk,
blood, and food, and temporal trends for PBDEs, PCDDs, and PCBs in US blood.
Organohalogen Compounds 66:2834-2840.
Schecter A, Papke O, Tung KC, Joseph J, Harris TR, Dahlgren J. 2005. Polybrominated
diphenyl ether flame retardants in the U.S. population: current levels, temporal trends, and
comparison with dioxins, dibenzofurans, and polychlorinated biphenyls. J Occup Environ Med
47:199-211.
Schecter A, Pavuk M, Papke O, Ryan JJ, Birnbaum L, Rosen R. 2003. Polybrominated diphenyl
ethers (PBDEs) in U.S. mothers' milk. Environ Health Perspect 111:1723-1729.
She J, Holden A, Sharp M, Tanner M, Williams-Derry C, Hooper K. 2004. Unusual pattern of
polybrominated diphenyl ethers (PBDEs) in US breast milk. Organohalogen Compounds
66:3945-3950.
Sjodin A, Carlsson H, Thuresson K, Sjolin S, Bergman A, Ostman C. 2001a. Flame retardants in
indoor air at an electronics recycling plant and at other work environments. Environ Sci Technol
35:448-454.
Sjodin A, Hagmar L, Klasson-Wehler E, Kronholm-Diab K, Jakobsson E, Bergman A. 1999.
Flame retardant exposure: polybrominated diphenyl ethers in blood from Swedish workers.
Environ Health Perspect 107:643-648.
26
Sjodin A, Jones RS, Focant JF, Lapeza C, Wang RY, McGahee EE, III, et.al. 2004a.
Retrospective time-trend study of polybrominated diphenyl ether and polybrominated and
polychlorinated biphenyl levels in human serum from the United States. Environ Health Perspect
112:654-658.
Sjodin A, Jones RS, Lapeza CR, Focant JF, McGahee EE, III, Patterson DG, Jr. 2004b.
Semiautomated high-throughput extraction and cleanup method for the measurement of
polybrominated diphenyl ethers, polybrominated biphenyls, and polychlorinated biphenyls in
human serum. Anal Chem 76:1921-1927.
Sjodin A, Patterson DG, Jr., Bergman A. 2003. A review on human exposure to brominated
flame retardants--particularly polybrominated diphenyl ethers. Environ Int 29:829-839.
----- 2001b. Brominated flame retardants in serum from U.S. blood donors. Environ Sci Technol
35:3830-3833.
Stapleton HM, Dodder NG, Offenberg JH, Schantz MM, Wise SA. 2005. Polybrominated
diphenyl ethers in house dust and clothes dryer lint. Environ Sci Technol 39:925-931.
Staskal D, Diliberto J, Birnbaum L. 2006. Disposition of BDE 47 in developing mice. Toxicol
Sci 90:309-316.
Thomas GO, Wilkinson M, Hodson S, Jones KC. 2005. Organohalogen chemicals in human
blood from the United Kingdom. Environ Pollut 141:30-41.
27

Thuresson K, Bergman A, Jakobsson K. 2005. Occupational exposure to commercial
decabromodiphenyl ether in workers manufacturing or handling flame-retarded rubber. Environ
Sci Technol 39:1980-1986.
Wilford BH, Shoeib M, Harner T, Zhu J, Jones KC. 2005. Polybrominated diphenyl ethers in
indoor dust in Ottawa, Canada: implications for sources and exposure. Environ Sci Technol
39:7027-7035.
Witter FR, Ten BJ, Fox HE. 2001. A new device for safer collection of postpartum cord blood.
Int J Gynaecol Obstet 72:259-260.
Wu N, Herrmann T, Paepke O, Tickner J, Hale R, Harvey E, et al. 2007. Human Exposure to
PBDEs: Associations of PBDE Body Burdens with Food Consumption and House Dust
Concentrations. Environ Sci Technol 41:1584-1589.
Zhou T, Taylor MM, Devito MJ, Crofton KM. 2002. Developmental exposure to brominated
diphenyl ethers results in thyroid hormone disruption. Toxicol Sci 66:105-116.
28

29
Table 1. Lipid-adjusted concentrations and congener distributions of PBDEs, selective PCBs (and DDE for comparison) in umbilical cord blood serum (n=297). * indicate dioxin-like PCBs. Congener %>LOD Median LOD Median Range Congener Distribution a (ng/g serum lipid) (ng/g serum lipid) (ng/g serum lipid) (median %) BDE-28 29.6 1.1 0.9 ND – 9.8 3.0 BDE-47 90.2 1.3 13.6 ND – 311.2 51.2 BDE-85 15.8 1.3 1.1 ND – 12.9 3.9 BDE-99 46.5 2.1 4.3 ND – 83.4 12.0 BDE-100 64.5 1.2 2.3 ND – 77.0 8.1 BDE-153 60.3 1.3 2.6 ND – 154.3 8.2 BDE-154 6.1 1.1 0.9 ND – 10.1 3.0 BDE-183 7.1 1.1 0.9 ND – 13.2 3.3 CB-118* 95.6 1.1 3.0 ND – 97.5 6.3 CB-138/158 98.0 1.1 4.9 ND – 60.2 10.9 CB-153 99.7 1.1 6.4 ND – 72.4 13.9 CB-180 89.6 1.1 2.6 ND – 68.8 5.8 DDE 100.0 1.1 53.5 3.9 – 7,710 NA Notes: LOD: Limit of Detection ND: Not Detected a PBDE congener distribution based on the proportional contribution of 8 congeners; PCB congener distribution based on the proportional contribution of 35 congeners
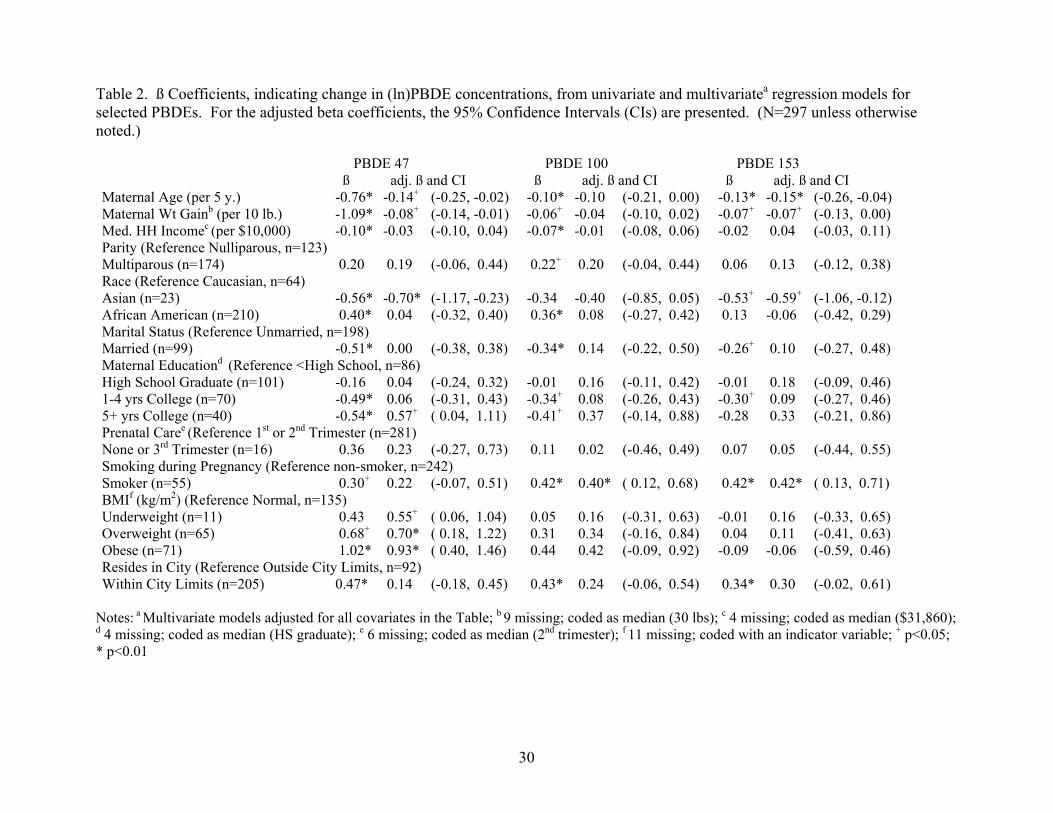
Table 2. ß Coefficients, indicating change in (ln)PBDE concentrations, from univariate and multivariatea regression models for selected PBDEs. For the adjusted beta coefficients, the 95% Confidence Intervals (CIs) are presented. (N=297 unless otherwise noted.) PBDE 47 PBDE 100 PBDE 153 ß adj. ß and CI ß adj. ß and CI ß adj. ß and CI Maternal Age (per 5 y.) -0.76* -0.14+ (-0.25, -0.02) -0.10* -0.10 (-0.21, 0.00) -0.13* -0.15* (-0.26, -0.04) Maternal Wt Gainb (per 10 lb.) -1.09* -0.08+ (-0.14, -0.01) -0.06+ -0.04 (-0.10, 0.02) -0.07+ -0.07+ (-0.13, 0.00) Med. HH Incomec (per $10,000) -0.10* -0.03 (-0.10, 0.04) -0.07* -0.01 (-0.08, 0.06) -0.02 0.04 (-0.03, 0.11) Parity (Reference Nulliparous, n=123) Multiparous (n=174) 0.20 0.19 (-0.06, 0.44) 0.22+ 0.20 (-0.04, 0.44) 0.06 0.13 (-0.12, 0.38) Race (Reference Caucasian, n=64) Asian (n=23) -0.56* -0.70* (-1.17, -0.23) -0.34 -0.40 (-0.85, 0.05) -0.53+ -0.59+ (-1.06, -0.12) African American (n=210) 0.40* 0.04 (-0.32, 0.40) 0.36* 0.08 (-0.27, 0.42) 0.13 -0.06 (-0.42, 0.29) Marital Status (Reference Unmarried, n=198) Married (n=99) -0.51* 0.00 (-0.38, 0.38) -0.34* 0.14 (-0.22, 0.50) -0.26+ 0.10 (-0.27, 0.48) Maternal Educationd (Reference <High School, n=86) High School Graduate (n=101) -0.16 0.04 (-0.24, 0.32) -0.01 0.16 (-0.11, 0.42) -0.01 0.18 (-0.09, 0.46) 1-4 yrs College (n=70) -0.49* 0.06 (-0.31, 0.43) -0.34+ 0.08 (-0.26, 0.43) -0.30+ 0.09 (-0.27, 0.46) 5+ yrs College (n=40) -0.54* 0.57+ ( 0.04, 1.11) -0.41+ 0.37 (-0.14, 0.88) -0.28 0.33 (-0.21, 0.86) Prenatal Caree (Reference 1st or 2nd Trimester (n=281) None or 3rd Trimester (n=16) 0.36 0.23 (-0.27, 0.73) 0.11 0.02 (-0.46, 0.49) 0.07 0.05 (-0.44, 0.55) Smoking during Pregnancy (Reference non-smoker, n=242) Smoker (n=55) 0.30+ 0.22 (-0.07, 0.51) 0.42* 0.40* ( 0.12, 0.68) 0.42* 0.42* ( 0.13, 0.71) BMIf (kg/m2) (Reference Normal, n=135) Underweight (n=11) 0.43 0.55+ ( 0.06, 1.04) 0.05 0.16 (-0.31, 0.63) -0.01 0.16 (-0.33, 0.65) Overweight (n=65) 0.68+ 0.70* ( 0.18, 1.22) 0.31 0.34 (-0.16, 0.84) 0.04 0.11 (-0.41, 0.63) Obese (n=71) 1.02* 0.93* ( 0.40, 1.46) 0.44 0.42 (-0.09, 0.92) -0.09 -0.06 (-0.59, 0.46) Resides in City (Reference Outside City Limits, n=92) Within City Limits (n=205) 0.47* 0.14 (-0.18, 0.45) 0.43* 0.24 (-0.06, 0.54) 0.34* 0.30 (-0.02, 0.61)
Notes: a Multivariate models adjusted for all covariates in the Table; b 9 missing; coded as median (30 lbs); c 4 missing; coded as median ($31,860); d 4 missing; coded as median (HS graduate); e 6 missing; coded as median (2nd trimester); f 11 missing; coded with an indicator variable; + p<0.05; * p<0.01
30

31
Table 3. ß Coefficients, indicating change in (ln)PCB concentrations, from univariate and multivariatea regression models for selected PCBs. For the adjusted beta coefficients, the 95% Confidence Intervals (CIs) are presented. (N=297 unless otherwise noted.) PCB 118 PCB 138_158 PCB 153 PCB 180 ß adj. ß and CI ß adj. ß and CI ß adj. ß and CI ß adj. ß and CI Maternal Age (per 5 y.) 0.17* 0.22* ( 0.15, 0.30) 0.31* 0.39* ( 0.31, 0.46) 0.36* 0.44* ( 0.37, 0.51) 0.48* 0.55* ( 0.40, 0.62) Maternal Wt Gainb (per 10 lb.) -0.01 -0.01 (-0.05, 0.03) 0.01 -0.01 (-0.05, 0.03) 0.01 -0.02 (-0.06, 0.02) 0.02 -0.02 (-0.06, 0.02) Med. HH Incomec (per $10k) 0.04 0.01 (-0.04, 0.06) 0.06* 0.00 (-0.05, 0.05) 0.08* 0.01 (-0.03, 0.05) 0.13* 0.02 (-0.02, 0.07) Parity (Reference Nulliparous, n=123) Multiparous (n=174) 0.02 -0.15 (-0.32, 0.03) 0.18+ -0.13 (-0.30, 0.03) 0.18+ -0.17+ (-0.32, -0.02) 0.26+ -0.16+ (-0.32, 0.00) Race (Reference Caucasian, n=64) Asian (n=23) 0.03 -0.11 (-0.43, 0.21) -0.11 -0.33+ (-0.64, -0.02) -0.04 -0.31+ (-0.59, -0.02) -0.19 -0.52* (-0.81, -0.22) African American (n=210) -0.11 0.03 (-0.22, 0.28) -0.26+ 0.10 (-0.14, 0.34) -0.33* 0.15 (-0.07, 0.37) -0.57* 0.09 (-0.13, 0.31) Marital Status (Reference Unmarried, n=198) Married (n=99) 0.12 -0.34* (-0.60, -0.08) 0.28* -0.34* (-0.58, -0.09) 0.40* -0.28+ (-0.51, -0.05) 0.61* -0.26 (-0.50, -0.03) Maternal Educationd (Reference <High School, n=86) High School Graduate (n=101) 0.03 0.05 (-0.14, 0.24) -0.02 -0.02 (-0.21, 0.16) 0.01 -0.03 (-0.20, 0.14) 0.00 -0.07 (-0.24, 0.10) 1-4 yrs College (n=70) 0.09 0.15 (-0.10, 0.41) 0.16 0.09 (-0.15, 0.33) 0.19 0.01 (-0.22, 0.23) 0.31+ -0.02 (-0.25, 0.21) 5+ yrs College (n=40) 0.42* 0.41 ( 0.04, 0.78) 0.54* 0.32 (-0.03, 0.67) 0.70* 0.24 (-0.09, 0.57) 0.92* 0.22 (-0.11, 0.56) Prenatal Caree (Reference 1st or 2nd Trimester, n=281) None or 3rd Trimester (n=16) 0.04 -0.02 (-0.36, 0.33) -0.02 -0.10 (-0.43, 0.23) 0.04 -0.05 (-0.35, 0.26) 0.10 0.03 (-0.28, 0.34) Smoking during Pregnancy (Reference Non-smoker, n=242) Smoker (n=55) 0.09 0.10 (-0.10, 0.30) 0.34* 0.30* ( 0.11, 0.49) 0.27+ 0.21+ ( 0.04, 0.39) 0.30+ 0.24* ( 0.06, 0.42) BMIf (kg/m2) (Reference Normal, n=135) Underweight (n=11) -0.25 -0.24 (-0.58, 0.10) -0.23 -0.23 (-0.56, 0.09) -0.27 -0.25 (-0.56, 0.05) -0.22 -0.19 (-0.49, 0.12) Overweight (n=65) -0.13 -0.07 (-0.43, 0.29) -0.29 -0.25 (-0.59, 0.09) -0.41 -0.35+ (-0.67, -0.03) -0.50+ -0.39+ (-0.72, -0.07) Obese (n=71) -0.24 -0.20 (-0.57, 0.16) -0.49+ -0.48* (-0.83, -0.14) -0.64* -0.62* (-0.94, -0.30) -0.74* -0.67* (-1.00, -0.34) Resides in City (Reference Outside City Limits, n=92) Within City Limits (n=205) -0.04 0.12 (-0.10, 0.34) -0.17 0.06 (-0.15, 0.27) -0.22+ 0.09 (-0.10, 0.29) -0.39* 0.09 (-0.11, 0.28)
Notes: a Multivariate models adjusted for all covariates in the Table; b 9 missing; coded as median (30 lbs); c 4 missing; coded as median ($31,860); d 4 missing; coded as median (HS graduate); e 6 missing; coded as median (2nd trimester); f 11 missing; coded with an indicator variable; + p<0.05; *p<0.01

32
Figure Legends Figure 1. Univariate (unadjusted) relationships between lipid adjusted PBDE levels in cord blood serum and sample characteristics. The median
and interquartile range (IQR) are represented by error bars; the red line is the overall median for this population.
Figure 2. Univariate (unadjusted) relationships between lipid adjusted PCB levels in cord blood serum and sample characteristics. The median
and interquartile range (IQR) are represented by error bars; the red line is the overall median for this population.

Figure 1
33 33

Figure 2.
34