Soundscapes in Change - from 1975 to 2000
29
224 Järviluoma, Uimonen, Vikman & Kytö Acoustic Environments in Change 225 Helmi Järviluoma, Heikki Uimonen, Noora Vikman & Meri Kytö Soundscapes in Change – from 1975 to 2000 The idea that truth is concealed and even perverted by the processes that are meant to establish it makes excellent sense. Paul Feyerabend The early methods of the World Soundscape Project (WSP) were both quantitative and qualitative, but the book Five Village Soundscapes (FVS) includes mostly ‘hard’ data and quantitative test results. 1 As one can clearly see from the eleven articles included into collection preceding this concluding section, the methodology of Acoustic En- vironments in Change (AEC) has clearly had a qualitative focus. 2 This is something we have been struggling with continuously during the project. One thing has been self- evident: we did not want to build a high wall between quantification and qualification. Right from the start we borrowed some more or less quantitative methods from the WSP. There is no need to throw out the baby with the bathwater: it is instructive to use those elements of the earlier methodology which remain effective, and not to dis- card the whole methodology just because more fashionable trends have entered the paradigm. However, the ways in which we used those methods were not the same as in 1975, for the simple reason that “intellectual situations are never exactly the same” (Feyerabend 1993: 10). We need historically informed, but flexible methodology. Jean-Francois Augoyard (1999: 116) has used a very apt metaphor in describing the research into environmental ambiences – the cricket effect: ‘With the return of springtime, the countryside re-echoes with an abundance of sharp rustles. If you ap- proach to see the musician insect it doesn’t seem to be there and yet it is again nearer, louder or slightly out of its place.’ The reason for this is that these insects, crickets, can emit very long-distance high-pitched sounds but only in one direction. In order to cover more territory they rotate themselves like a radar dish and in so doing sweep an extensive area. The lonely cricket researcher, the sound researcher, also sends out strong messages but only in one direction because she or he doesn’t even know how to rotate. The theory behind many scientific and technical studies on sound is almost always based on traditional behaviorism (ibid.). So, Augoyard is asking: how to be an efficient cricket? How to study not only the mechanics of insulation techniques and mastering reverberation but also the qualitative properties of sound, social and cultural listening values, or intelligent organisation of sonic life in different places? Ann Oakley (2000) has expressed serious reservations about the validity of the schematic distinction between qualitative and quantitative methods. One of the early advocates of qualitative methods, she is now however rehabilitating experimental and quantitative methodology, and relating this to gender problematic: ‘What we have here are two contrasting accounts of how it is that people ‘know’. While re- searchers in one camp think they are studying the real world, which consists of things it is feasible to try to find out about, those in the other dispute the idea that there is a single reality to be known, and regard the pursuit of ‘hard data’ as impracti- cal and unachievable’ (Oakley 2000: 25). When reading the books in which the basic results of the FVS project were pre- sented, one is struck by how imaginative the methods were. When we AEC research- ers worked in the field it became clear that they had been well chosen, particularly taking into consideration the fact that in many of the villages, the FVS researchers did not speak the local language or dialect 3 , and that the period spent in each vil- lage was short (Schafer 1977b: 2). The methods, which we borrowed from the earlier research included, for example: 1) A sound preference test. We again enlisted the co-operation of the village schools, conducting a similar ‘sound preference test’ as in 1975, in which young people were asked to list the sounds they found pleasant and unpleasant. We also talked with the children and conducted sound exercises with them. 4 2) A traffic count. This is a method that relates to one of the basic ideas of the earlier project, namely observing the rhythms of sounds in relation to the rhythms of the social and economic life of the village. Counting traffic might sound some- what tedious and perhaps slightly superficial at first glance, but in fact one learns an amazing amount about village life by simply standing at a central spot count- ing, listening and observing what people are up to and what vehicles they use when moving around, or what the gender and age balance is at different times of the day. Many of the theoretians of the observation method have claimed that the routine practices of everyday life are far more important to an observational study than the more exciting and singular events in life (Silverman 2000). We conducted this exercise as far as possible in a manner similar to that used in 1975. However, since none of us took a deeper interest in the method and the kind of rhythm analysis that was present in FVS, the results are presented differently here.
Transcript of Soundscapes in Change - from 1975 to 2000
224 Järviluoma, Uimonen, Vikman & Kytö Acoustic Environments in Change 225
Helmi Järviluoma, Heikki Uimonen,
Noora Vikman & Meri Kytö
Soundscapes in Change – from 1975 to 2000
The idea that truth is concealed and even perverted by the processes that are meant to establish it makes excellent sense.
Paul Feyerabend
The early methods of the World Soundscape Project (WSP) were both quantitative and qualitative, but the book Five Village Soundscapes (FVS) includes mostly ‘hard’ data and quantitative test results.1 As one can clearly see from the eleven articles included into collection preceding this concluding section, the methodology of Acoustic En-vironments in Change (AEC) has clearly had a qualitative focus.2 This is something we have been struggling with continuously during the project. One thing has been self-evident: we did not want to build a high wall between quantification and qualification. Right from the start we borrowed some more or less quantitative methods from the WSP. There is no need to throw out the baby with the bathwater: it is instructive to use those elements of the earlier methodology which remain effective, and not to dis-card the whole methodology just because more fashionable trends have entered the paradigm. However, the ways in which we used those methods were not the same as in 1975, for the simple reason that “intellectual situations are never exactly the same” (Feyerabend 1993: 10). We need historically informed, but flexible methodology.
Jean-Francois Augoyard (1999: 116) has used a very apt metaphor in describing the research into environmental ambiences – the cricket effect: ‘With the return of springtime, the countryside re-echoes with an abundance of sharp rustles. If you ap-proach to see the musician insect it doesn’t seem to be there and yet it is again nearer, louder or slightly out of its place.’ The reason for this is that these insects, crickets, can emit very long-distance high-pitched sounds but only in one direction. In order
to cover more territory they rotate themselves like a radar dish and in so doing sweep an extensive area. The lonely cricket researcher, the sound researcher, also sends out strong messages but only in one direction because she or he doesn’t even know how to rotate. The theory behind many scientific and technical studies on sound is almost always based on traditional behaviorism (ibid.). So, Augoyard is asking: how to be an efficient cricket? How to study not only the mechanics of insulation techniques and mastering reverberation but also the qualitative properties of sound, social and cultural listening values, or intelligent organisation of sonic life in different places?
Ann Oakley (2000) has expressed serious reservations about the validity of the schematic distinction between qualitative and quantitative methods. One of the early advocates of qualitative methods, she is now however rehabilitating experimental and quantitative methodology, and relating this to gender problematic: ‘What we have here are two contrasting accounts of how it is that people ‘know’. While re-searchers in one camp think they are studying the real world, which consists of things it is feasible to try to find out about, those in the other dispute the idea that there is a single reality to be known, and regard the pursuit of ‘hard data’ as impracti-cal and unachievable’ (Oakley 2000: 25).
When reading the books in which the basic results of the FVS project were pre-sented, one is struck by how imaginative the methods were. When we AEC research-ers worked in the field it became clear that they had been well chosen, particularly taking into consideration the fact that in many of the villages, the FVS researchers did not speak the local language or dialect3, and that the period spent in each vil-lage was short (Schafer 1977b: 2). The methods, which we borrowed from the earlier research included, for example:
1) A sound preference test. We again enlisted the co-operation of the village schools, conducting a similar ‘sound preference test’ as in 1975, in which young people were asked to list the sounds they found pleasant and unpleasant. We also talked with the children and conducted sound exercises with them.4
2) A traffic count. This is a method that relates to one of the basic ideas of the earlier project, namely observing the rhythms of sounds in relation to the rhythms of the social and economic life of the village. Counting traffic might sound some-what tedious and perhaps slightly superficial at first glance, but in fact one learns an amazing amount about village life by simply standing at a central spot count-ing, listening and observing what people are up to and what vehicles they use when moving around, or what the gender and age balance is at different times of the day. Many of the theoretians of the observation method have claimed that the routine practices of everyday life are far more important to an observational study than the more exciting and singular events in life (Silverman 2000). We conducted this exercise as far as possible in a manner similar to that used in 1975. However, since none of us took a deeper interest in the method and the kind of rhythm analysis that was present in FVS, the results are presented differently here.
226 Järviluoma, Uimonen, Vikman & Kytö Acoustic Environments in Change 227
3) A day of listening walks. The residential areas of the village were divided into five parts. Each area had its own listener, a researcher who took five half hour walks in this area at certain times of the day. In the earlier research, this exercise was re-ported mainly in the form of quantitative inventories.
This final chapter of our book is dedicated to the results of the study of the relation-ship between the soundscapes in 1975 and in 2000 in the villages studied, using these three methods: sound preference tests, traffic counts, and listening walks. The section concludes with reflections on the question of what it actually means that we have been studying acoustic environments and people’s environmental relationships in change.
The sound preference tests in 1975 and in 2000
Methodological remarks
In the ’sound preference test’ children or youngsters were asked to list (1) five sounds they found pleasant, and (2) five sounds they found unpleasant in their own environ-ment (see Schafer 1977b, chapter ’Community sound attitudes’). Making this kind of test in a school environment with pre-teens and other young people raises many interesting methodological questions. These are compounded even further when we compare the new test results with those of 1975.
Let us start by thinking about some of the main problems. First, in most cases these kinds of data cannot be analyzed statistically for the simple reason that the samples are too small. The ‘quantitative’ material thus has to be interpreted quali-tatively. However, we have come to the conclusion that it is much easier to compare the results if they are presented in the form of tables and percentages – but when reading the tables, one must bear in mind, that the percentages are not meant for statistical analysis, but to arrange the figures more clearly.
The next important question is that we noticed the decisive importance of how the testers in the school present the project.5 We were acutely aware of this question, one reason being that the head of the AEC project is an ethnomethodologist, and as such, followed the basic methodological principle of attending closely to the ways in which people collectively construct the nature of each situation at hand using everyday methods. This is related to a kind of moral order that underpins the re-sponses to questions – the children consider some answers more ‘right’ than others. The more ‘disciplined’ the children are, the more they probably try to construct what they think is an acceptable list of sonic preferences. This is a question that has been discussed in, for example, media studies, when people are asked to list the kinds of programs they most often watch on television or listen to on the radio. Strangely enough, a great many people seemed to watch nature documentaries instead of soap operas, and this is associated with our basic tendency to try to construct ourselves as morally good people (cf. Alasuutari 1992). It is not a question of lying – the answers
are situated accounts, as the ethnomethodologists would term it. When the media researchers then look at the media diaries in which people provide more detailed lists of the programs they watch, the results are very different. It is clear that in sonic preference tests, like the ones at hand, we have to take into consideration the situated character of the answers to our questions.
This ‘situatedness’ is of course determined by more factors than just the moral imperative of ‘right’ answers. These include the importance of emotional states and levels of frustration in the positive or negative perception of sounds.6 It is thus pos-sible, and even likely, that sounds generating ambivalent responses (for instance rain or wind) were more often omitted out from rather rigidly categorized lists.
In quite a few schools we had crucial help from the people, who knew the lan-guage. They came from different professions and had different ways of articulat-ing the project. In Cembra, for example, a dedicated soundscape person and music teacher Claudio Lagomarsini from Milano was present in the testing situation (a description of which is provided in example 1, hear also CD 3, track 24). In Lesconil we had help from the CRESSON architecture and at that time doctoral student Nicolas Tixier, who helped with the translation in the testing situation. In addition, after the test he presented the 1975 sound preference test results to the children. In Dol-lar we were unable to get permission in May 2000 to visit the famous school, Dollar Academy.7 A few weeks later the Scottish member of AEC crew, Gregg Wagstaff, visited the Strathdevon Primary School in Dollar, and was able to administer the test effectively. The testing situations were recorded.
Example 1. Sound preference test at the secondary school in Cembra.
1. Claudio Lagomarsini explaining the both the FVS and AEC projects.2. Noise and negotiations in English between the researchers.3. Helmi introducing the researchers Noora, Heikki and Anssi, and Finland and Turku. Noise. Shh... Claudio translating literally, then explaining the term soundscape in different languages and talking about sounds that disturb the environment. Claudio lists the villages studied.4. Helmi advertising the internet page http://www.6villages.tpu.fi, where field news is posted daily. Claudio translates.5. Noora introduces the test: “We want to ask questions, how do you hear Cembra? Maybe the same questions that your parents have answered 25 years ago… Write on the paper five pleasant and five unpleasant sounds that you can hear in Cembra.”6. Claudio explains that the same test was done 25 years ago: ”[in Italian] This is a very simple test. What are your ways of hearing sounds in Cembra. How do you experience them? What sounds are pleasant, what unpleasant? You need imagination, concentration but not co-operation.” 7. Claudio quietly asking advice from Noora. Children murmuring and talking together.8. Claudio proscribing co-operation again. He explains that because of statistics it is important to work alone and mention five sounds per person. He promises that after the test the pupils will hear the test results from 25 years ago, and says that the students have still three minutes left for finishing their writing. Helmi whispers that three minutes is not enough, they have just begun. Claudio: OK, five minutes left to finish their writing. Youngsters still chat continuously together.
228 Järviluoma, Uimonen, Vikman & Kytö Acoustic Environments in Change 229
9. Claudio: ”Allora, time is up.” Asks a student to collect the papers. Noise 10. Reads the results of 1975 test from the book.11. Noora asks if it was difficult to answer. Were the sounds heard 25 years ago the same [as now]? Pupils reply that they were similar. Noora checks in Italian if it was difficult to think about sounds. Pupils: No.12. Noora introduces the diario dei suoni., sound diaries. ”You can fill this in tomorrow and on Monday, bring it back on Tuesday.” Papers delivered.13. Claudio explains the same in Italian. ”Ecco, perche due ladi?” Claudio lists examples of sounds. Some children ask if it matters that they are not from Cembra. No, as long as they write in the sound journal where the sounds come from. Noise.14. Claudio: ”Allora.” Gives information about sounds and listening. The rest of the class is spent doing different kinds of sound exercises under the direction of Claudio.
As can be heard from the recording, and seen from the description of the record-ing in example 1 (7–8) the Italian youngsters never stopped talking to each other dur-ing the test. At some points what is received is a ‘group opinion’.8 By contrast, Lesconil pupils were well-behaved, and one can only hear a few occasional whispers.
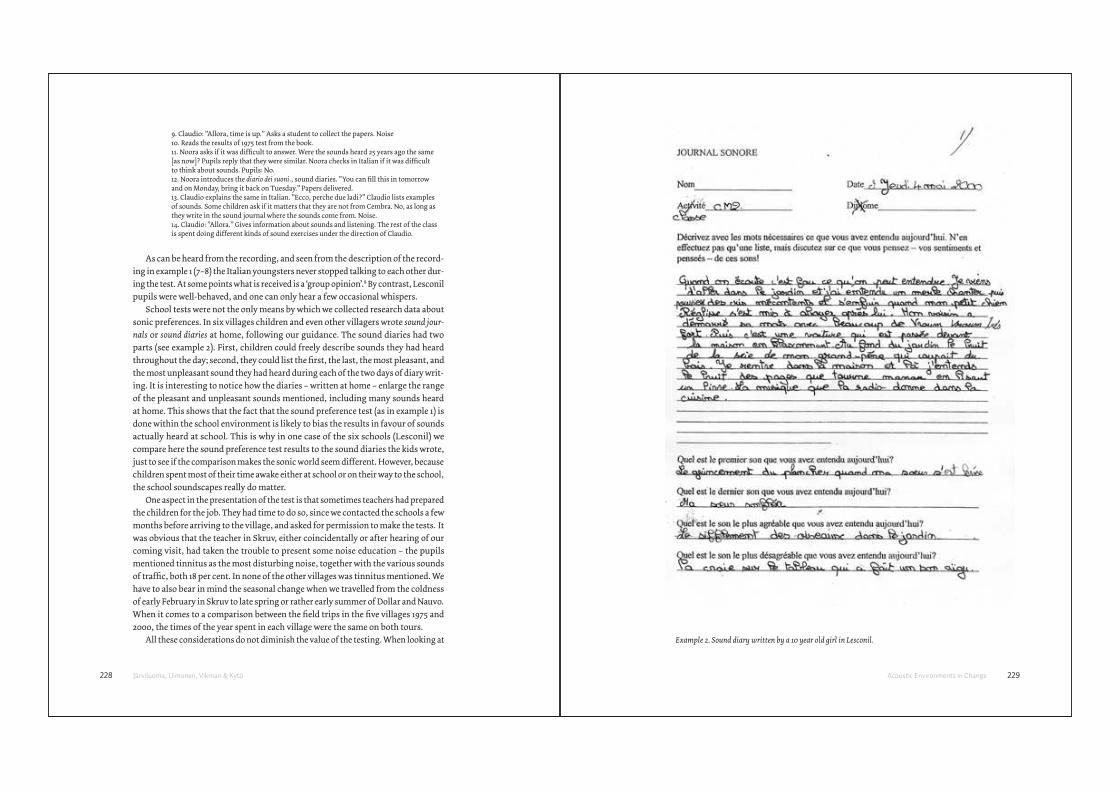
School tests were not the only means by which we collected research data about sonic preferences. In six villages children and even other villagers wrote sound jour-nals or sound diaries at home, following our guidance. The sound diaries had two parts (see example 2). First, children could freely describe sounds they had heard throughout the day; second, they could list the first, the last, the most pleasant, and the most unpleasant sound they had heard during each of the two days of diary writ-ing. It is interesting to notice how the diaries – written at home – enlarge the range of the pleasant and unpleasant sounds mentioned, including many sounds heard at home. This shows that the fact that the sound preference test (as in example 1) is done within the school environment is likely to bias the results in favour of sounds actually heard at school. This is why in one case of the six schools (Lesconil) we compare here the sound preference test results to the sound diaries the kids wrote, just to see if the comparison makes the sonic world seem different. However, because children spent most of their time awake either at school or on their way to the school, the school soundscapes really do matter.
One aspect in the presentation of the test is that sometimes teachers had prepared the children for the job. They had time to do so, since we contacted the schools a few months before arriving to the village, and asked for permission to make the tests. It was obvious that the teacher in Skruv, either coincidentally or after hearing of our coming visit, had taken the trouble to present some noise education – the pupils mentioned tinnitus as the most disturbing noise, together with the various sounds of traffic, both 18 per cent. In none of the other villages was tinnitus mentioned. We have to also bear in mind the seasonal change when we travelled from the coldness of early February in Skruv to late spring or rather early summer of Dollar and Nauvo. When it comes to a comparison between the field trips in the five villages 1975 and 2000, the times of the year spent in each village were the same on both tours.
All these considerations do not diminish the value of the testing. When looking at Example 2. Sound diary written by a 10 year old girl in Lesconil.
230 Järviluoma, Uimonen, Vikman & Kytö Acoustic Environments in Change 231
the results one cannot but be grateful that in spite of reservations and difficulties, we did after all visit the schools. The situation is suggestive of the question about the reli-ability of interviewing. Even the most critical discourse analysts (including ourselves) examining the joint construction of knowledge by the interviewer and interviewee in the interview situations, concede that people in general talk about matters that are sig-nificant. They might switch from one discourse to another, but they do not construct their talk out of nothing. The same applies to the results of the sound preference tests. Certainly, these are as hazardous as any semi-quantitative method, but it does tell us about some major trends in the sonic likes and dislikes of young people in European villages. The comparison also provides interesting extrapolations. For example, one can identify certain changes in the societies and soundscapes when reading the results. The results provide interesting food for thought for anyone seriously interested in acoustemology (Feld 1996), acoustic ways of knowing the world.
Lesconil
“Je viens d’aller dans le jardin et j’ai entendu un merle chanter (...)”9 Girl, 10 years old, Journal Sonore May 200010
The following discusses both the sound preference test at the École Dr Fleming, and the sound journals written over two days (32 journals in all) by the children in the same school. For this reason the discussion on Lesconil differs from and is perhaps more multi-faceted than those of the other villages.
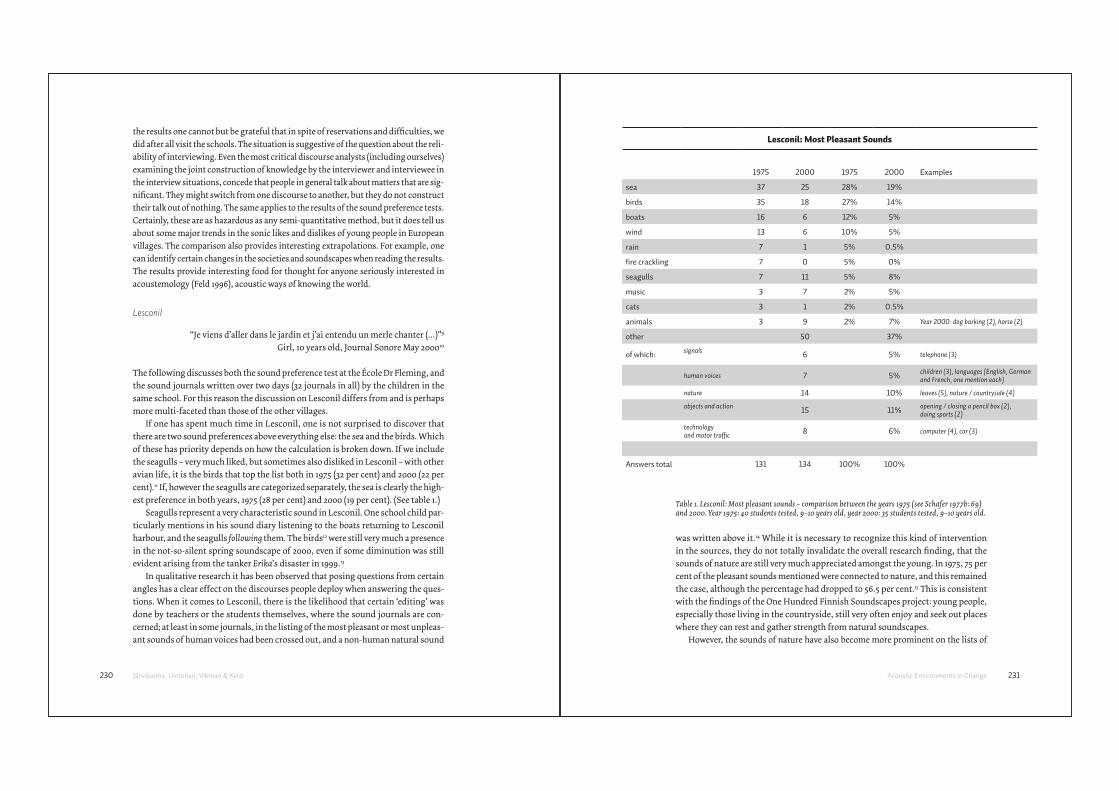
If one has spent much time in Lesconil, one is not surprised to discover that there are two sound preferences above everything else: the sea and the birds. Which of these has priority depends on how the calculation is broken down. If we include the seagulls – very much liked, but sometimes also disliked in Lesconil – with other avian life, it is the birds that top the list both in 1975 (32 per cent) and 2000 (22 per cent).11 If, however the seagulls are categorized separately, the sea is clearly the high-est preference in both years, 1975 (28 per cent) and 2000 (19 per cent). (See table 1.)
Seagulls represent a very characteristic sound in Lesconil. One school child par-ticularly mentions in his sound diary listening to the boats returning to Lesconil harbour, and the seagulls following them. The birds12 were still very much a presence in the not-so-silent spring soundscape of 2000, even if some diminution was still evident arising from the tanker Erika’s disaster in 1999.13
In qualitative research it has been observed that posing questions from certain angles has a clear effect on the discourses people deploy when answering the ques-tions. When it comes to Lesconil, there is the likelihood that certain ‘editing’ was done by teachers or the students themselves, where the sound journals are con-cerned; at least in some journals, in the listing of the most pleasant or most unpleas-ant sounds of human voices had been crossed out, and a non-human natural sound
Lesconil: Most Pleasant Sounds
1975 2000 1975 2000 Examples
sea 37 25 28% 19%
birds 35 18 27% 14%
boats 16 6 12% 5%
wind 13 6 10% 5%
rain 7 1 5% 0.5%
re crackling 7 0 5% 0%
seagulls 7 11 5% 8%
music 3 7 2% 5%
cats 3 1 2% 0.5%
animals 3 9 2% 7% Year 2000: dog barking (2), horse (2)
other 50 37%
of which:signals
6 5% telephone (3)
human voices 7 5%children (3), languages (English, German and French, one mention each)
nature 14 10% leaves (5), nature / countryside (4)
objects and action 15 11%
opening / closing a pencil box (2), doing sports (2)
technology and motor traffi c 8 6% computer (4), car (3)
Answers total 131 134 100% 100%
Table 1. Lesconil: Most pleasant sounds – comparison between the years 1975 (see Schafer 1977b: 69) and 2000. Year 1975: 40 students tested, 9–10 years old, year 2000: 35 students tested, 9–10 years old.
was written above it.14 While it is necessary to recognize this kind of intervention in the sources, they do not totally invalidate the overall research finding, that the sounds of nature are still very much appreciated amongst the young. In 1975, 75 per cent of the pleasant sounds mentioned were connected to nature, and this remained the case, although the percentage had dropped to 56.5 per cent.15 This is consistent with the findings of the One Hundred Finnish Soundscapes project: young people, especially those living in the countryside, still very often enjoy and seek out places where they can rest and gather strength from natural soundscapes.
However, the sounds of nature have also become more prominent on the lists of
232 Järviluoma, Uimonen, Vikman & Kytö Acoustic Environments in Change 233
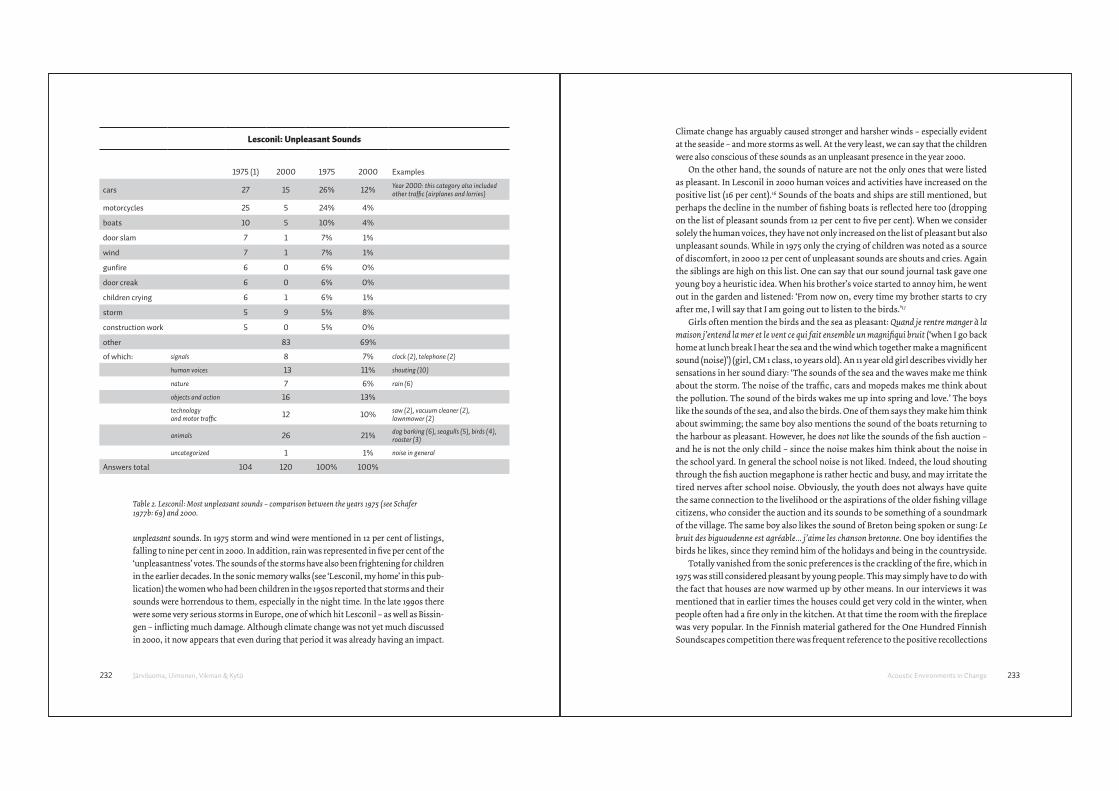
Climate change has arguably caused stronger and harsher winds – especially evident at the seaside – and more storms as well. At the very least, we can say that the children were also conscious of these sounds as an unpleasant presence in the year 2000.
On the other hand, the sounds of nature are not the only ones that were listed as pleasant. In Lesconil in 2000 human voices and activities have increased on the positive list (16 per cent).16 Sounds of the boats and ships are still mentioned, but perhaps the decline in the number of fishing boats is reflected here too (dropping on the list of pleasant sounds from 12 per cent to five per cent). When we consider solely the human voices, they have not only increased on the list of pleasant but also unpleasant sounds. While in 1975 only the crying of children was noted as a source of discomfort, in 2000 12 per cent of unpleasant sounds are shouts and cries. Again the siblings are high on this list. One can say that our sound journal task gave one young boy a heuristic idea. When his brother’s voice started to annoy him, he went out in the garden and listened: ‘From now on, every time my brother starts to cry after me, I will say that I am going out to listen to the birds.’17
Girls often mention the birds and the sea as pleasant: Quand je rentre manger à la maison j’entend la mer et le vent ce qui fait ensemble un magnifiqui bruit (‘when I go back home at lunch break I hear the sea and the wind which together make a magnificent sound (noise)’) (girl, CM 1 class, 10 years old). An 11 year old girl describes vividly her sensations in her sound diary: ‘The sounds of the sea and the waves make me think about the storm. The noise of the traffic, cars and mopeds makes me think about the pollution. The sound of the birds wakes me up into spring and love.’ The boys like the sounds of the sea, and also the birds. One of them says they make him think about swimming; the same boy also mentions the sound of the boats returning to the harbour as pleasant. However, he does not like the sounds of the fish auction – and he is not the only child – since the noise makes him think about the noise in the school yard. In general the school noise is not liked. Indeed, the loud shouting through the fish auction megaphone is rather hectic and busy, and may irritate the tired nerves after school noise. Obviously, the youth does not always have quite the same connection to the livelihood or the aspirations of the older fishing village citizens, who consider the auction and its sounds to be something of a soundmark of the village. The same boy also likes the sound of Breton being spoken or sung: Le bruit des biguoudenne est agréable... j’aime les chanson bretonne. One boy identifies the birds he likes, since they remind him of the holidays and being in the countryside.
Totally vanished from the sonic preferences is the crackling of the fire, which in 1975 was still considered pleasant by young people. This may simply have to do with the fact that houses are now warmed up by other means. In our interviews it was mentioned that in earlier times the houses could get very cold in the winter, when people often had a fire only in the kitchen. At that time the room with the fireplace was very popular. In the Finnish material gathered for the One Hundred Finnish Soundscapes competition there was frequent reference to the positive recollections
Lesconil: Unpleasant Sounds
1975 (1) 2000 1975 2000 Examples
cars 27 15 26% 12%Year 2000: this category also included other traffi c (airplanes and lorries)
motorcycles 25 5 24% 4%
boats 10 5 10% 4%
door slam 7 1 7% 1%
wind 7 1 7% 1%
gun re 6 0 6% 0%
door creak 6 0 6% 0%
children crying 6 1 6% 1%
storm 5 9 5% 8%
construction work 5 0 5% 0%
other 83 69%
of which: signals 8 7% clock (2), telephone (2)
human voices 13 11% shouting (10)
nature 7 6% rain (6)
objects and action 16 13%
technology and motor traffi c 12 10%
saw (2), vacuum cleaner (2), lawnmower (2)
animals 26 21%dog barking (6), seagulls (5), birds (4), rooster (3)
uncategorized 1 1% noise in general
Answers total 104 120 100% 100%
clinking coins
Table 2. Lesconil: Most unpleasant sounds – comparison between the years 1975 (see Schafer 1977b: 69) and 2000.
unpleasant sounds. In 1975 storm and wind were mentioned in 12 per cent of listings, falling to nine per cent in 2000. In addition, rain was represented in five per cent of the ‘unpleasantness’ votes. The sounds of the storms have also been frightening for children in the earlier decades. In the sonic memory walks (see ‘Lesconil, my home’ in this pub-lication) the women who had been children in the 1950s reported that storms and their sounds were horrendous to them, especially in the night time. In the late 1990s there were some very serious storms in Europe, one of which hit Lesconil – as well as Bissin-gen – inflicting much damage. Although climate change was not yet much discussed in 2000, it now appears that even during that period it was already having an impact.
234 Järviluoma, Uimonen, Vikman & Kytö Acoustic Environments in Change 235
other traffi c (airplanes and lorries)
gun re
door creak
construction work
and motor traffi c
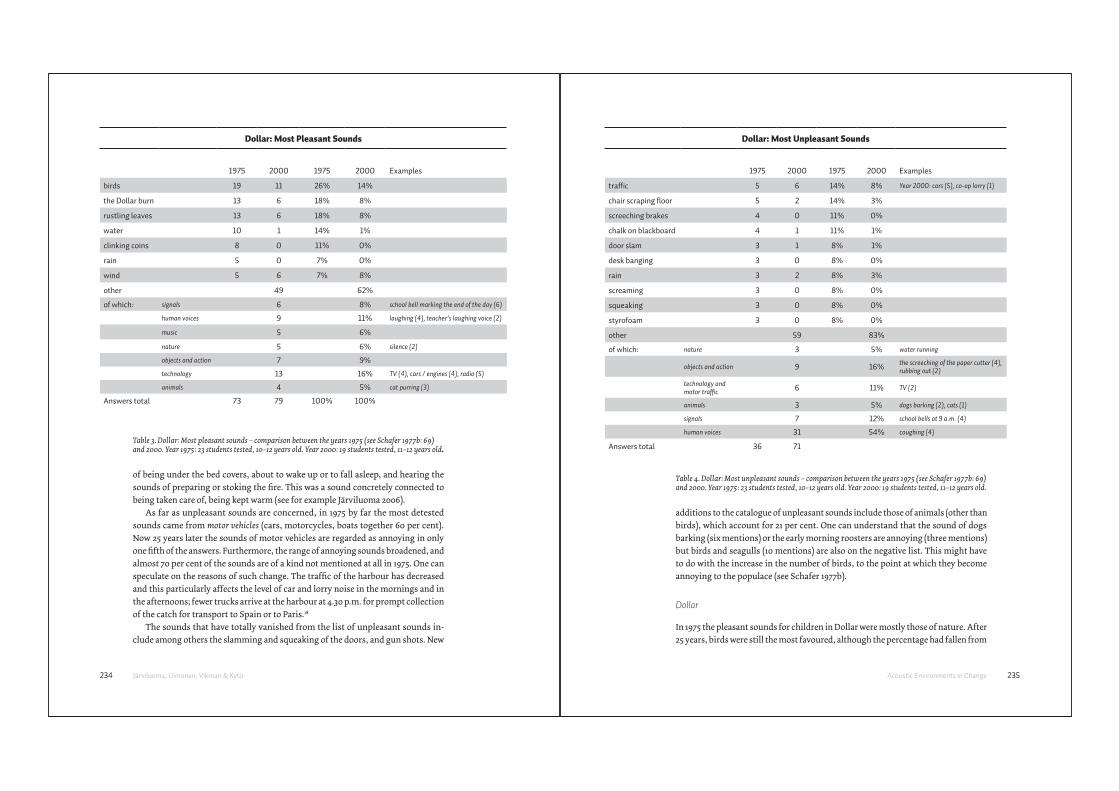
Dollar: Most Pleasant Sounds
1975 2000 1975 2000 Examples
birds 19 11 26% 14%
the Dollar burn 13 6 18% 8%
rustling leaves 13 6 18% 8%
water 10 1 14% 1%
clinking coins 8 0 11% 0%
rain 5 0 7% 0%
wind 5 6 7% 8%
other 49 62%
of which: signals 6 8% school bell marking the end of the day (6)
human voices 9 11% laughing (4), teacher’s laughing voice (2)
music 5 6%
nature 5 6% silence (2)
objects and action 7 9%
technology 13 16% TV (4), cars / engines (4), radio (5)
animals 4 5% cat purring (3)
Answers total 73 79 100% 100%
Dollar: Most Unpleasant Sounds
1975 2000 1975 2000 Examples
traf c 5 6 14% 8% Year 2000: cars (5), co-op lorry (1)
chair scraping oor 5 2 14% 3%
screeching brakes 4 0 11% 0%
chalk on blackboard 4 1 11% 1%
door slam 3 1 8% 1%
desk banging 3 0 8% 0%
rain 3 2 8% 3%
screaming 3 0 8% 0%
squeaking 3 0 8% 0%
styrofoam 3 0 8% 0%
other 59 83%
of which: nature 3 5% water running
objects and action 9 16%the screeching of the paper cutter (4), rubbing out (2)
technology and motor traffi c 6 11% TV (2)
animals 3 5% dogs barking (2), cats (1)
signals 7 12% school bells at 9 a.m. (4)
human voices 31 54% coughing (4)
Answers total 36 71
mentioned once: fi recrackers,
Table 3. Dollar: Most pleasant sounds – comparison between the years 1975 (see Schafer 1977b: 69) and 2000. Year 1975: 23 students tested, 10–12 years old. Year 2000: 19 students tested, 11–12 years old.
of being under the bed covers, about to wake up or to fall asleep, and hearing the sounds of preparing or stoking the fire. This was a sound concretely connected to being taken care of, being kept warm (see for example Järviluoma 2006).
As far as unpleasant sounds are concerned, in 1975 by far the most detested sounds came from motor vehicles (cars, motorcycles, boats together 60 per cent). Now 25 years later the sounds of motor vehicles are regarded as annoying in only one fifth of the answers. Furthermore, the range of annoying sounds broadened, and almost 70 per cent of the sounds are of a kind not mentioned at all in 1975. One can speculate on the reasons of such change. The traffic of the harbour has decreased and this particularly affects the level of car and lorry noise in the mornings and in the afternoons; fewer trucks arrive at the harbour at 4.30 p.m. for prompt collection of the catch for transport to Spain or to Paris.18
The sounds that have totally vanished from the list of unpleasant sounds in-clude among others the slamming and squeaking of the doors, and gun shots. New
Table 4. Dollar: Most unpleasant sounds – comparison between the years 1975 (see Schafer 1977b: 69) and 2000. Year 1975: 23 students tested, 10–12 years old. Year 2000: 19 students tested, 11–12 years old.
additions to the catalogue of unpleasant sounds include those of animals (other than birds), which account for 21 per cent. One can understand that the sound of dogs barking (six mentions) or the early morning roosters are annoying (three mentions) but birds and seagulls (10 mentions) are also on the negative list. This might have to do with the increase in the number of birds, to the point at which they become annoying to the populace (see Schafer 1977b).
Dollar
In 1975 the pleasant sounds for children in Dollar were mostly those of nature. After 25 years, birds were still the most favoured, although the percentage had fallen from
236 Järviluoma, Uimonen, Vikman & Kytö Acoustic Environments in Change 237
26 per cent to 14 per cent).19 In the 1970s the small river Dollar burn and rustling leaves were second, and the sounds of water were also appealing, for example in the form of the rain (five mentions).20 In 2000 the rain had appeared on the list solely as an unpleasant sound, while in 1975 it was mentioned as both unpleasant and pleasant. This could be associated with a change we noticed in all the other villages as well: the children no longer played outside as much as they used to.21
The sound of wind has maintained its popularity in Dollar. Silence is a new-comer, with two mentions in 2000. In the 1975 test technological sounds were not mentioned at all in the list of pleasant sounds; in the year 2000 however TV, cars, other motors and computer keyboards were on the list. These sounds belong clearly to the cases eliciting the more ambivalent responses; they are on the list of pleasant sounds eight times, while 12 mentions categorize them as unpleasant. In 1975 Dol-lar sounds of brakes were not liked. They were not included in the category traffic sounds, but, if they were added to the other traffic-related sounds the percentage on the list of unpleasant sounds in 1975 adds up to 25 per cent. Although the traffic has not diminished in Dollar, for some reason the sounds of cars are not mentioned so often as unpleasant in 2000 (eight per cent). It is useful to speculate as to why this is so. Are the children accustomed to these sounds; is it a keynote that goes un-noticed in the background? In addition, children themselves are more often inside the car than they used to be – they are more frequently brought to the school by car. In some cases the time together in the car is the longest period during the day that the parents spend with their youngsters. This might have an effect on the way car sounds are experienced; that is, heard from inside the car, perhaps accompanied with music and an opportunity to chat (or argue) with a parent.
In 2000 62 per cent of the pleasant sounds differ from those listed in 1975. How-ever, it is hard to believe that the children were not listening to music 30 years ago; perhaps they just did not consider it as a sound that would belong on a list of sonic preferences. In the year 2000, on the other hand, radio and music were included on the list of pleasant sounds.
The broader spectrum of replies is also evident in the inclusion of human sounds, ranging from the voice or laughing of the teacher, to the barracking at a football field. New objects or practices are also mentioned, the latter often relating to something that is also otherwise pleasing to the child, like drinking or eating (candies), or jumping on a trampoline.
It is worth noting that in 2000 54 per cent of the unpleasant sounds mentioned are human voices, while in 1975 it was only screaming that received eight per cent of the mentions (coughing is also disliked). By 2000, children disliked human sounds including neighbours, mother’s voice or singing, a shouting teacher, and snoring. The sounds of the family – swearing, yelling and weeping – seem to annoy youngsters. In 1975 the WSP researchers concluded that the high presence of human voices both on list of pleasant and unpleasant sounds in Cembra meant that the soundscape of the
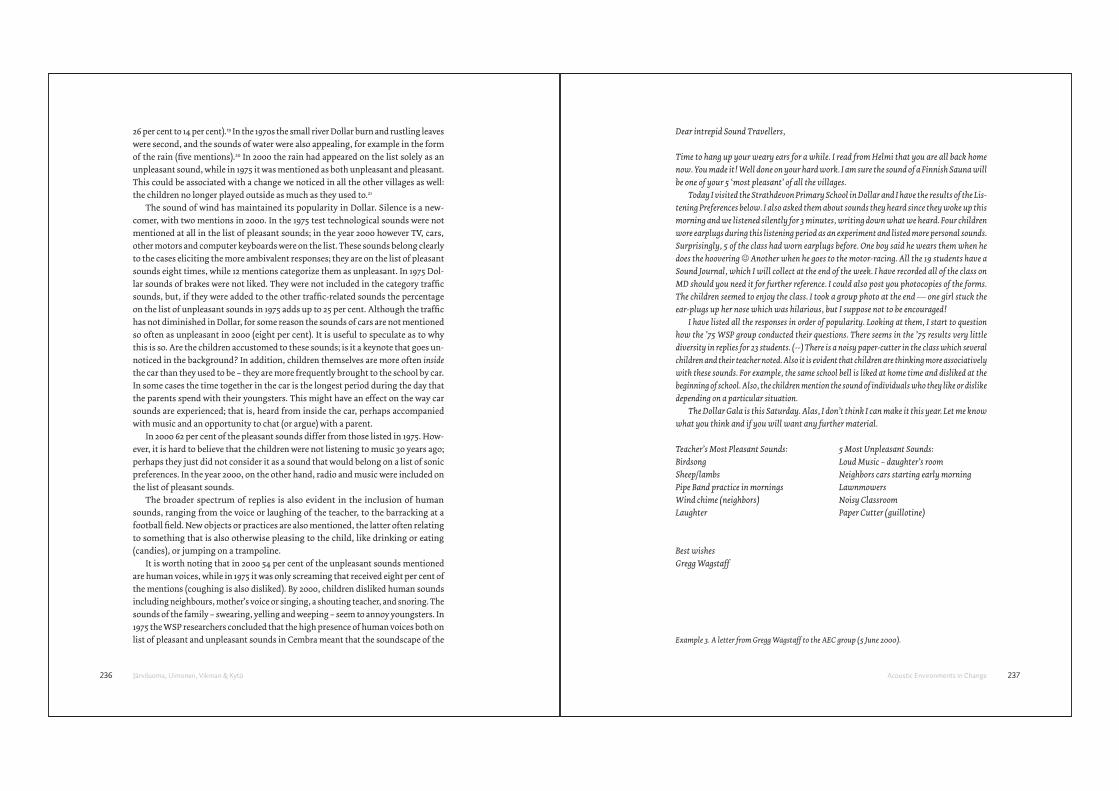
Dear intrepid Sound Travellers,
Time to hang up your weary ears for a while. I read from Helmi that you are all back home now. You made it! Well done on your hard work. I am sure the sound of a Finnish Sauna will be one of your 5 ‘most pleasant’ of all the villages.
Today I visited the Strathdevon Primary School in Dollar and I have the results of the Lis-tening Preferences below. I also asked them about sounds they heard since they woke up this morning and we listened silently for 3 minutes, writing down what we heard. Four children wore earplugs during this listening period as an experiment and listed more personal sounds. Surprisingly, 5 of the class had worn earplugs before. One boy said he wears them when he does the hoovering ☺ Another when he goes to the motor-racing. All the 19 students have a Sound Journal, which I will collect at the end of the week. I have recorded all of the class on MD should you need it for further reference. I could also post you photocopies of the forms. The children seemed to enjoy the class. I took a group photo at the end — one girl stuck the ear-plugs up her nose which was hilarious, but I suppose not to be encouraged!
I have listed all the responses in order of popularity. Looking at them, I start to question how the ’75 WSP group conducted their questions. There seems in the ’75 results very little diversity in replies for 23 students. (--) There is a noisy paper-cutter in the class which several children and their teacher noted. Also it is evident that children are thinking more associatively with these sounds. For example, the same school bell is liked at home time and disliked at the beginning of school. Also, the children mention the sound of individuals who they like or dislike depending on a particular situation.
The Dollar Gala is this Saturday. Alas, I don’t think I can make it this year. Let me know what you think and if you will want any further material.
Teacher’s Most Pleasant Sounds: 5 Most Unpleasant Sounds:Birdsong Loud Music – daughter’s roomSheep/lambs Neighbors cars starting early morningPipe Band practice in mornings LawnmowersWind chime (neighbors) Noisy ClassroomLaughter Paper Cutter (guillotine)
Best wishes Gregg Wagstaff
Example 3. A letter from Gregg Wagstaff to the AEC group (5 June 2000).
238 Järviluoma, Uimonen, Vikman & Kytö Acoustic Environments in Change 239
village is very humanized. Can we form the same conclusion about Dollar in the year 2000? If we consider the situation in the very humanized archipelago soundscape of Finnish Nauvo however, we notice that children do not detest human sounds on such a large scale as in Dollar. It is hard to distinguish between cause and effect in Dollar and Cembra: it is possible that the raised level of stress in school children makes them feel irritated by human noise, but it is also well-known that noise causes stress.
The school bell signalling the end of the school day is mentioned six or seven times (depending how one counts). In this case the agreeable feelings about the beginning of free time generated by the bell places it high on the list of pleasant sounds. This is a typical example of a sound that is located on the list according to the situation and time of its hearing: at nine o’clock in the morning the school bell is referred to as unpleasant (four times).
It is paradoxical that the well-known sensitivity of young people to high-pitched sounds is used against them, while little appears to be done to make their lives acoustically more agreeable, at least when one looks at the lists of unpleasant ex-periences children still have in schools all over Europe.22 Perhaps, however, the dis-appearance of class-room chalk throughout Europe is a move in this direction – the classic screeching of the chalk on the blackboard has radically diminished! There is still some scraping of chairs in Dollar. The nasty noises and bangs of desks have vanished, but a new acoustic nuisance has entered the classroom: the screeching paper cutter is mentioned both by many children and the teacher (see also example 3). Styrofoam has completely vanished from the unpleasant sounds in Dollar, as compared with eight per cent formerly.
One final detail: the flushing sound of a toilet was considered unpleasant by one child in Dollar. This might be interpreted as a symptom of a low threshold of embar-rassment; one of the results of the ‘civilising process’ (Elias 1978) has been the lowering of this threshold as compared to earlier times, when even kings could receive visitors while sitting in the privy. At the same time, it is difficult to make a distinction be-tween what is actually disliked in this case, and the reluctance to write it down.
Skruv
One particularly significant item has disappeared from the list of unpleasant sounds: the factory hooters are not mentioned in 2000, and for good reason: when they stopped hooting in the early 1980s, these children had not yet been born.23 Nor is the factory noise mentioned any longer, and indeed, when talking to the noise inspectors and factory owners during our visit to Skruv, we formed the impres-sion that the regulations have become much more strict, and the authorities were particularly intent on reducing nuisance noise coming out of the small factories that might disturb the life of the citizens.
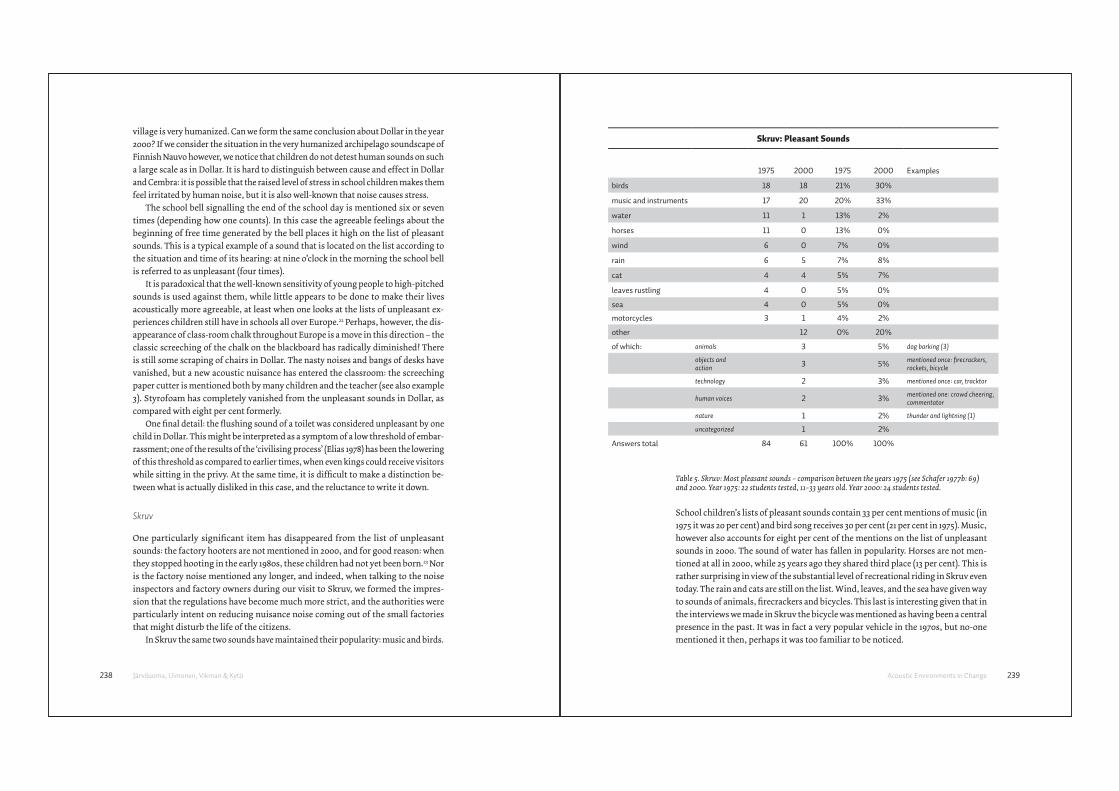
In Skruv the same two sounds have maintained their popularity: music and birds.
traf c
chair scraping oor
screeching brakes
chalk on blackboard
desk banging
squeaking
motor traffi c
Skruv: Pleasant Sounds
1975 2000 1975 2000 Examples
birds 18 18 21% 30%
music and instruments 17 20 20% 33%
water 11 1 13% 2%
horses 11 0 13% 0%
wind 6 0 7% 0%
rain 6 5 7% 8%
cat 4 4 5% 7%
leaves rustling 4 0 5% 0%
sea 4 0 5% 0%
motorcycles 3 1 4% 2%
other 12 0% 20%
of which: animals 3 5% dog barking (3)
objects and action
3 5%mentioned once: fi recrackers, rockets, bicycle
technology 2 3% mentioned once: car, tracktor
human voices 2 3%mentioned one: crowd cheering, commentator
nature 1 2% thunder and lightning (1)
uncategorized 1 2%
Answers total 84 61 100% 100%
Table 5. Skruv: Most pleasant sounds – comparison between the years 1975 (see Schafer 1977b: 69) and 2000. Year 1975: 22 students tested, 11–33 years old. Year 2000: 24 students tested.
School children’s lists of pleasant sounds contain 33 per cent mentions of music (in 1975 it was 20 per cent) and bird song receives 30 per cent (21 per cent in 1975). Music, however also accounts for eight per cent of the mentions on the list of unpleasant sounds in 2000. The sound of water has fallen in popularity. Horses are not men-tioned at all in 2000, while 25 years ago they shared third place (13 per cent). This is rather surprising in view of the substantial level of recreational riding in Skruv even today. The rain and cats are still on the list. Wind, leaves, and the sea have given way to sounds of animals, firecrackers and bicycles. This last is interesting given that in the interviews we made in Skruv the bicycle was mentioned as having been a central presence in the past. It was in fact a very popular vehicle in the 1970s, but no-one mentioned it then, perhaps it was too familiar to be noticed.
240 Järviluoma, Uimonen, Vikman & Kytö Acoustic Environments in Change 241
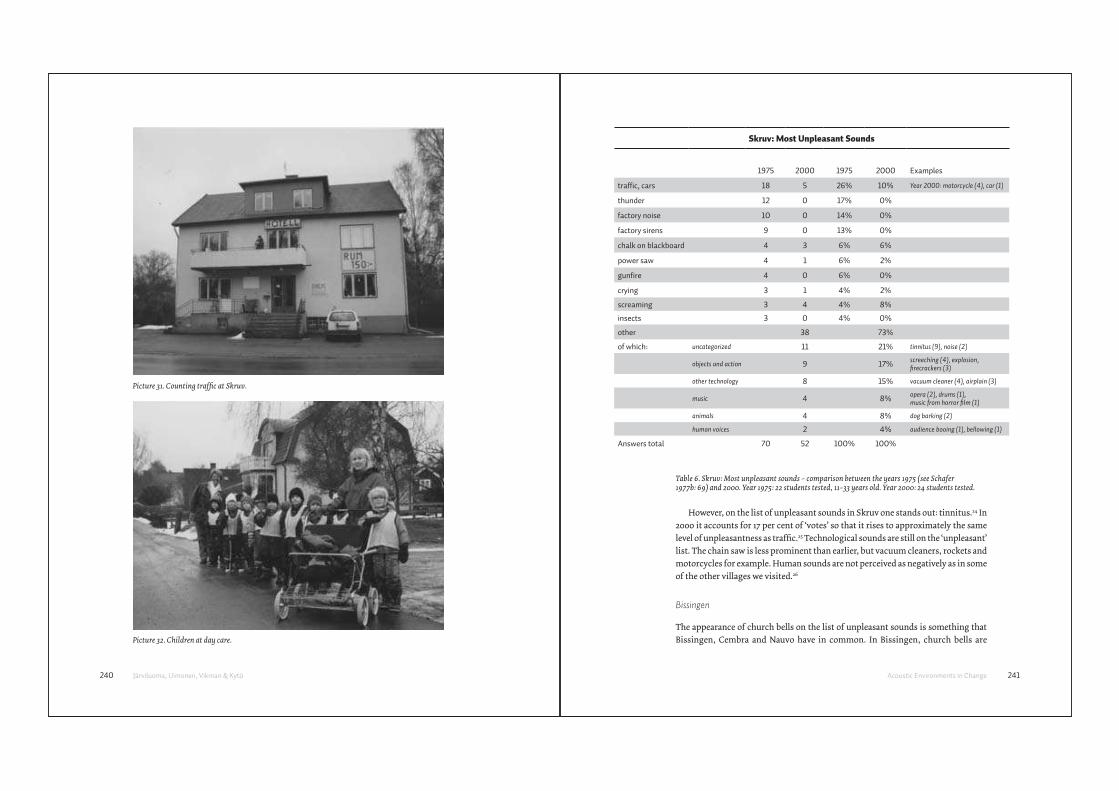
Picture 31. Counting traffic at Skruv.
Picture 32. Children at day care.
Skruv: Most Unpleasant Sounds
1975 2000 1975 2000 Examples
traf c, cars 18 5 26% 10% Year 2000: motorcycle (4), car (1)
thunder 12 0 17% 0%
factory noise 10 0 14% 0%
factory sirens 9 0 13% 0%
chalk on blackboard 4 3 6% 6%
power saw 4 1 6% 2%
gun re 4 0 6% 0%
crying 3 1 4% 2%
screaming 3 4 4% 8%
insects 3 0 4% 0%
other 38 73%
of which: uncategorized 11 21% tinnitus (9), noise (2)
objects and action 9 17%screeching (4), explosion, fi recrackers (3)
other technology 8 15% vacuum cleaner (4), airplain (3)
music 4 8%opera (2), drums (1), music from horror fi lm (1)
animals 4 8% dog barking (2)
human voices 2 4% audience booing (1), bellowing (1)
Answers total 70 52 100% 100%
kissing
technology and motor traffi c
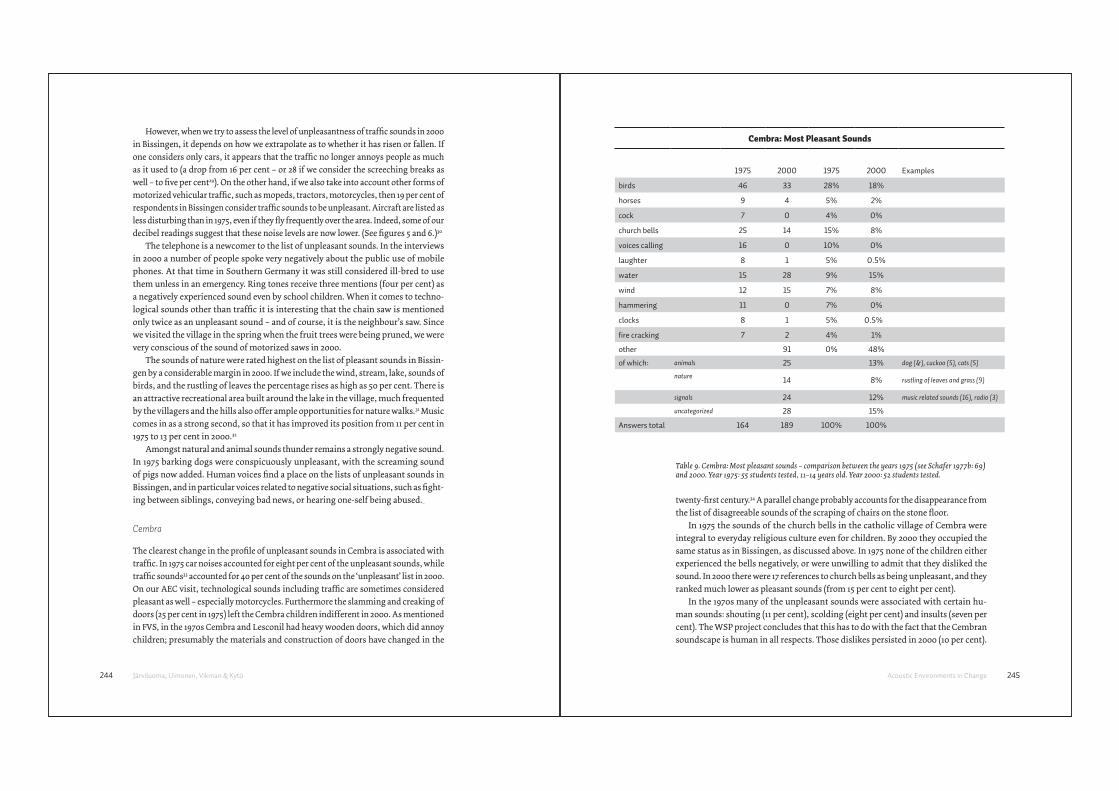
Table 6. Skruv: Most unpleasant sounds – comparison between the years 1975 (see Schafer 1977b: 69) and 2000. Year 1975: 22 students tested, 11–33 years old. Year 2000: 24 students tested.
However, on the list of unpleasant sounds in Skruv one stands out: tinnitus.24 In 2000 it accounts for 17 per cent of ‘votes’ so that it rises to approximately the same level of unpleasantness as traffic.25 Technological sounds are still on the ‘unpleasant’ list. The chain saw is less prominent than earlier, but vacuum cleaners, rockets and motorcycles for example. Human sounds are not perceived as negatively as in some of the other villages we visited.26
Bissingen
The appearance of church bells on the list of unpleasant sounds is something that Bissingen, Cembra and Nauvo have in common. In Bissingen, church bells are
242 Järviluoma, Uimonen, Vikman & Kytö Acoustic Environments in Change 243
traf c, cars
chalk on blackboard
gun re
fi recrackers (3)
music from horror fi lm (1)
Bissingen: Most Pleasant Sounds
1975 2000 1975 2000 Examples
church bells 9 1 13% 1%
motorcycle 8 1 11% 1%
voices 8 2 11% 3%
music 8 9 11% 13%
birds 8 13 11% 18%
cars 8 1 11% 1%
kissing 5 0 7% 0%
water 5 1 7% 1%
siren 4 0 6% 0%
leaves rustling 4 6 6% 8%
silence 3 0 4% 0%
other 37 52%
of which: nature 17 24%wind (7), stream / river rushing
other objects and action 3 4%
technology and motor traffi c 4 6% tractor (3), TV (1)
signals 9 13school bells (3), school bells at the end of the day (3)
human voices 4 6%
Answers total 70 71 100% 100%
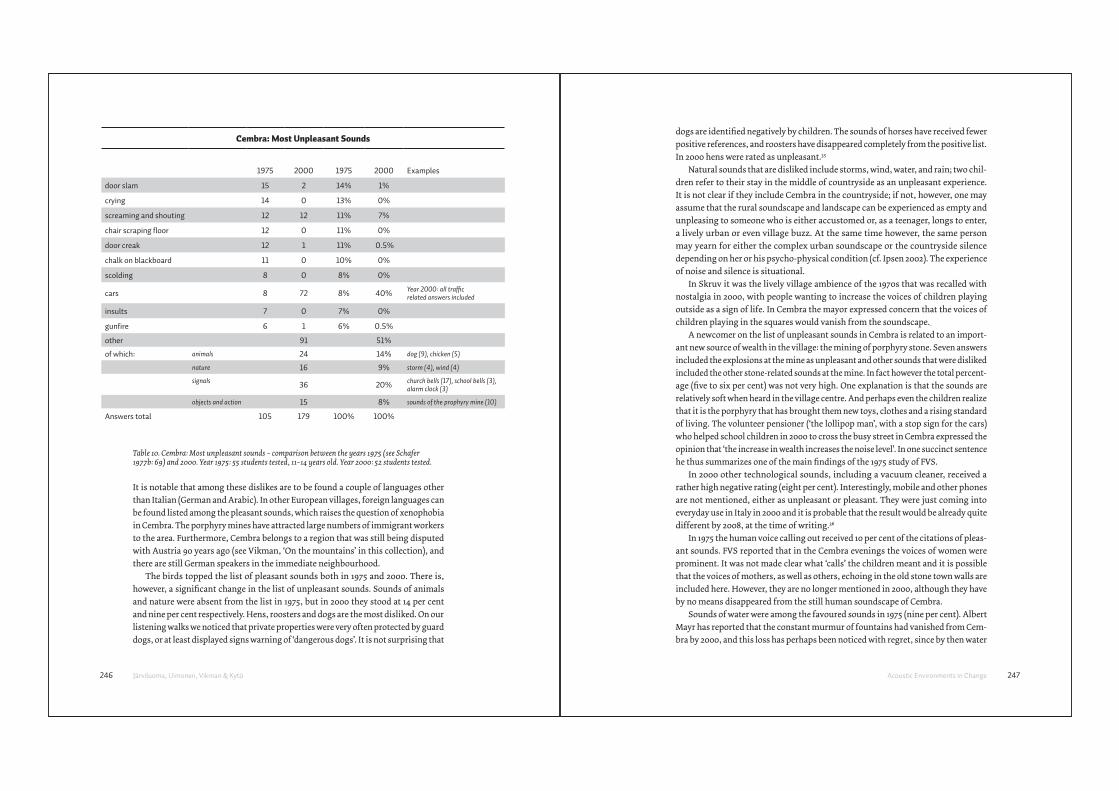
Table 7. Bissingen: Most pleasant sounds – comparison between the years 1975 (see Schafer 1977b: 69) and 2000. Year 1975: 26 students tested, age 14. Year 2000: 15 students tested, age 11.
mentioned six times (eight per cent) as unpleasant in 2000. Secularization is perhaps a reason, and it is notable that while in 1975 church bells were cited as the most pleasant sound in Bissingen (13 per cent), in 2000 they received only one such mention. In the FVS book there is reference to a businessman staying at Gasthaus Adler who reported to the WSP research group that the two reasons he visited Bissingen were the church bells and apple cider. Now, the owner of the very same guesthouse told us that some visitors complain about the bells since they would like to sleep longer in the mornings.
The development is interesting indeed, and invites speculation that the socio-acoustic order of ‘uncriticizable’ sounds (i.e. those that you simply are not sup-posed to criticize) has changed. In 1975 children seem to have genuinely liked the sound, and the ones who didn’t respected the socio-acoustic order proclaimed by
Bissingen: Most Unpleasant Sounds
1975 (1) 2000 1975 2000 Examples
cars 9 4 16% 5%
alarm clock 9 7 16% 9%
brakes screeching 7 0 12% 0%
airplanes 5 2 9% 3%
screaming 5 1 9% 1%
high pitched sounds 5 0 9% 0%
dogs barking 5 2 9% 3%
thunder 5 8 9% 10%
other 46 60%
of which:animals
2 3% pig squeaking (2)
nature 2 3% wind blowing (2)
objects and action 11 14% chalk on blackboard (5)
technology and motor traffi c 15 19% tractor (4)
signals 11 14% church bells (6), telephone (3)
human voices 5 6%
Answers total 57 77 100% 100%
cock
clocks
re cracking
Table 8. Bissingen: Most unpleasant sounds – comparison between the years 1975 (see Schafer 1977b: 69) and 2000. Year 1975: 26 students tested, age 14. Year 2000: 15 students tested, age 11.
church bells, either because of fear of authorities or divine punishment, and thus filtered the sound out of the list of what they disliked. However, by 2000 some of that respect for authorities has dissipated in a pluralistic milieu that allows even children to express a dislike for church bells.
Why were the sounds of motorcycles and cars so positively received (22 per cent of pleasant sounds) in 1975 in Bissingen? One possible clue is their connection with the idea of ‘modernity’.27 In 1975 Bissingen was still largely an agricultural village. It is not so long since much of the road traffic was horse- and even cow-driven, and so the motor vehicles sounded appealingly progressive to youthful ears. The residential precincts and the means of livelihood in Bissingen have changed considerably over 25 years, so that in 2000 there is a high level of motor vehicle noise in the centre of the village at peak traffic hours. (see also figure 3, Bissingen traffic count). When we look at the list of liked sounds in 2000, sounds of cars and motorcycles have fallen significantly (two per cent).28
244 Järviluoma, Uimonen, Vikman & Kytö Acoustic Environments in Change 245
However, when we try to assess the level of unpleasantness of traffic sounds in 2000 in Bissingen, it depends on how we extrapolate as to whether it has risen or fallen. If one considers only cars, it appears that the traffic no longer annoys people as much as it used to (a drop from 16 per cent – or 28 if we consider the screeching breaks as well – to five per cent29). On the other hand, if we also take into account other forms of motorized vehicular traffic, such as mopeds, tractors, motorcycles, then 19 per cent of respondents in Bissingen consider traffic sounds to be unpleasant. Aircraft are listed as less disturbing than in 1975, even if they fly frequently over the area. Indeed, some of our decibel readings suggest that these noise levels are now lower. (See figures 5 and 6.)30
The telephone is a newcomer to the list of unpleasant sounds. In the interviews in 2000 a number of people spoke very negatively about the public use of mobile phones. At that time in Southern Germany it was still considered ill-bred to use them unless in an emergency. Ring tones receive three mentions (four per cent) as a negatively experienced sound even by school children. When it comes to techno-logical sounds other than traffic it is interesting that the chain saw is mentioned only twice as an unpleasant sound – and of course, it is the neighbour’s saw. Since we visited the village in the spring when the fruit trees were being pruned, we were very conscious of the sound of motorized saws in 2000.
The sounds of nature were rated highest on the list of pleasant sounds in Bissin-gen by a considerable margin in 2000. If we include the wind, stream, lake, sounds of birds, and the rustling of leaves the percentage rises as high as 50 per cent. There is an attractive recreational area built around the lake in the village, much frequented by the villagers and the hills also offer ample opportunities for nature walks.31 Music comes in as a strong second, so that it has improved its position from 11 per cent in 1975 to 13 per cent in 2000.32
Amongst natural and animal sounds thunder remains a strongly negative sound. In 1975 barking dogs were conspicuously unpleasant, with the screaming sound of pigs now added. Human voices find a place on the lists of unpleasant sounds in Bissingen, and in particular voices related to negative social situations, such as fight-ing between siblings, conveying bad news, or hearing one-self being abused.
Cembra
The clearest change in the profile of unpleasant sounds in Cembra is associated with traffic. In 1975 car noises accounted for eight per cent of the unpleasant sounds, while traffic sounds33 accounted for 40 per cent of the sounds on the ‘unpleasant’ list in 2000. On our AEC visit, technological sounds including traffic are sometimes considered pleasant as well – especially motorcycles. Furthermore the slamming and creaking of doors (25 per cent in 1975) left the Cembra children indifferent in 2000. As mentioned in FVS, in the 1970s Cembra and Lesconil had heavy wooden doors, which did annoy children; presumably the materials and construction of doors have changed in the
alarm clock
brakes screeching
dogs barking
technology and motor traffi c
Cembra: Most Pleasant Sounds
1975 2000 1975 2000 Examples
birds 46 33 28% 18%
horses 9 4 5% 2%
cock 7 0 4% 0%
church bells 25 14 15% 8%
voices calling 16 0 10% 0%
laughter 8 1 5% 0.5%
water 15 28 9% 15%
wind 12 15 7% 8%
hammering 11 0 7% 0%
clocks 8 1 5% 0.5%
re cracking 7 2 4% 1%
other 91 0% 48%
of which: animals 25 13% dog (&), cuckoo (5), cats (5)
nature 14 8% rustling of leaves and grass (9)
signals 24 12% music related sounds (16), radio (3)
uncategorized 28 15%
Answers total 164 189 100% 100%
Table 9. Cembra: Most pleasant sounds – comparison between the years 1975 (see Schafer 1977b: 69) and 2000. Year 1975: 55 students tested, 11–14 years old. Year 2000: 52 students tested.
twenty-first century.34 A parallel change probably accounts for the disappearance from the list of disagreeable sounds of the scraping of chairs on the stone floor.
In 1975 the sounds of the church bells in the catholic village of Cembra were integral to everyday religious culture even for children. By 2000 they occupied the same status as in Bissingen, as discussed above. In 1975 none of the children either experienced the bells negatively, or were unwilling to admit that they disliked the sound. In 2000 there were 17 references to church bells as being unpleasant, and they ranked much lower as pleasant sounds (from 15 per cent to eight per cent).
In the 1970s many of the unpleasant sounds were associated with certain hu-man sounds: shouting (11 per cent), scolding (eight per cent) and insults (seven per cent). The WSP project concludes that this has to do with the fact that the Cembran soundscape is human in all respects. Those dislikes persisted in 2000 (10 per cent).
246 Järviluoma, Uimonen, Vikman & Kytö Acoustic Environments in Change 247
dogs are identified negatively by children. The sounds of horses have received fewer positive references, and roosters have disappeared completely from the positive list. In 2000 hens were rated as unpleasant.35
Natural sounds that are disliked include storms, wind, water, and rain; two chil-dren refer to their stay in the middle of countryside as an unpleasant experience. It is not clear if they include Cembra in the countryside; if not, however, one may assume that the rural soundscape and landscape can be experienced as empty and unpleasing to someone who is either accustomed or, as a teenager, longs to enter, a lively urban or even village buzz. At the same time however, the same person may yearn for either the complex urban soundscape or the countryside silence depending on her or his psycho-physical condition (cf. Ipsen 2002). The experience of noise and silence is situational.
In Skruv it was the lively village ambience of the 1970s that was recalled with nostalgia in 2000, with people wanting to increase the voices of children playing outside as a sign of life. In Cembra the mayor expressed concern that the voices of children playing in the squares would vanish from the soundscape.
A newcomer on the list of unpleasant sounds in Cembra is related to an import-ant new source of wealth in the village: the mining of porphyry stone. Seven answers included the explosions at the mine as unpleasant and other sounds that were disliked included the other stone-related sounds at the mine. In fact however the total percent-age (five to six per cent) was not very high. One explanation is that the sounds are relatively soft when heard in the village centre. And perhaps even the children realize that it is the porphyry that has brought them new toys, clothes and a rising standard of living. The volunteer pensioner (‘the lollipop man’, with a stop sign for the cars) who helped school children in 2000 to cross the busy street in Cembra expressed the opinion that ‘the increase in wealth increases the noise level’. In one succinct sentence he thus summarizes one of the main findings of the 1975 study of FVS.
In 2000 other technological sounds, including a vacuum cleaner, received a rather high negative rating (eight per cent). Interestingly, mobile and other phones are not mentioned, either as unpleasant or pleasant. They were just coming into everyday use in Italy in 2000 and it is probable that the result would be already quite different by 2008, at the time of writing.36
In 1975 the human voice calling out received 10 per cent of the citations of pleas-ant sounds. FVS reported that in the Cembra evenings the voices of women were prominent. It was not made clear what ‘calls’ the children meant and it is possible that the voices of mothers, as well as others, echoing in the old stone town walls are included here. However, they are no longer mentioned in 2000, although they have by no means disappeared from the still human soundscape of Cembra.
Sounds of water were among the favoured sounds in 1975 (nine per cent). Albert Mayr has reported that the constant murmur of fountains had vanished from Cem-bra by 2000, and this loss has perhaps been noticed with regret, since by then water
Cembra: Most Unpleasant Sounds
1975 2000 1975 2000 Examples
door slam 15 2 14% 1%
crying 14 0 13% 0%
screaming and shouting 12 12 11% 7%
chair scraping oor 12 0 11% 0%
door creak 12 1 11% 0.5%
chalk on blackboard 11 0 10% 0%
scolding 8 0 8% 0%
cars 8 72 8% 40%Year 2000: all traffi c related answers included
insults 7 0 7% 0%
gun re 6 1 6% 0.5%
other 91 51%
of which: animals 24 14% dog (9), chicken (5)
nature 16 9% storm (4), wind (4)
signals 36 20%
church bells (17), school bells (3), alarm clock (3)
objects and action 15 8% sounds of the prophyry mine (10)
Answers total 105 179 100% 100%
talking / human sounds
screaming, shouting
re, ambulance,
barking dogs
alarm clock
clock, ticking
Table 10. Cembra: Most unpleasant sounds – comparison between the years 1975 (see Schafer 1977b: 69) and 2000. Year 1975: 55 students tested, 11–14 years old. Year 2000: 52 students tested.
It is notable that among these dislikes are to be found a couple of languages other than Italian (German and Arabic). In other European villages, foreign languages can be found listed among the pleasant sounds, which raises the question of xenophobia in Cembra. The porphyry mines have attracted large numbers of immigrant workers to the area. Furthermore, Cembra belongs to a region that was still being disputed with Austria 90 years ago (see Vikman, ‘On the mountains’ in this collection), and there are still German speakers in the immediate neighbourhood.
The birds topped the list of pleasant sounds both in 1975 and 2000. There is, however, a significant change in the list of unpleasant sounds. Sounds of animals and nature were absent from the list in 1975, but in 2000 they stood at 14 per cent and nine per cent respectively. Hens, roosters and dogs are the most disliked. On our listening walks we noticed that private properties were very often protected by guard dogs, or at least displayed signs warning of ‘dangerous dogs’. It is not surprising that
248 Järviluoma, Uimonen, Vikman & Kytö Acoustic Environments in Change 249
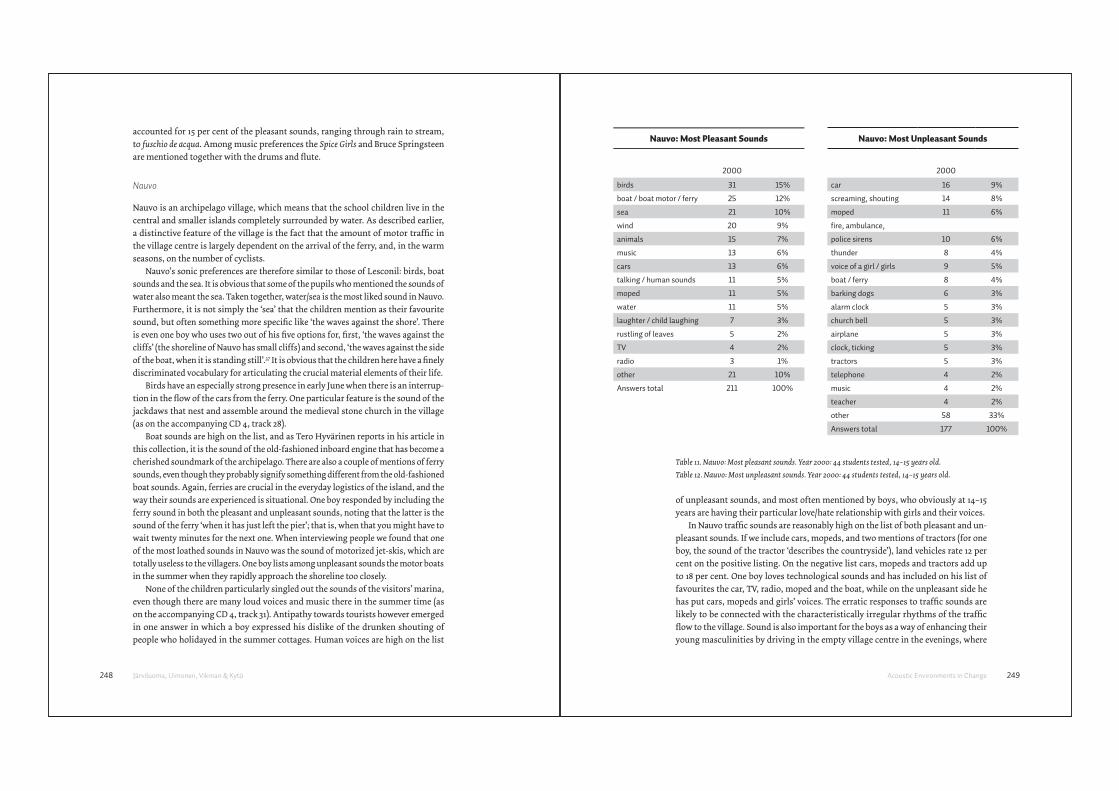
accounted for 15 per cent of the pleasant sounds, ranging through rain to stream, to fuschio de acqua. Among music preferences the Spice Girls and Bruce Springsteen are mentioned together with the drums and flute.
Nauvo
Nauvo is an archipelago village, which means that the school children live in the central and smaller islands completely surrounded by water. As described earlier, a distinctive feature of the village is the fact that the amount of motor traffic in the village centre is largely dependent on the arrival of the ferry, and, in the warm seasons, on the number of cyclists.
Nauvo’s sonic preferences are therefore similar to those of Lesconil: birds, boat sounds and the sea. It is obvious that some of the pupils who mentioned the sounds of water also meant the sea. Taken together, water/sea is the most liked sound in Nauvo. Furthermore, it is not simply the ‘sea’ that the children mention as their favourite sound, but often something more specific like ‘the waves against the shore’. There is even one boy who uses two out of his five options for, first, ‘the waves against the cliffs’ (the shoreline of Nauvo has small cliffs) and second, ‘the waves against the side of the boat, when it is standing still’.37 It is obvious that the children here have a finely discriminated vocabulary for articulating the crucial material elements of their life.
Birds have an especially strong presence in early June when there is an interrup-tion in the flow of the cars from the ferry. One particular feature is the sound of the jackdaws that nest and assemble around the medieval stone church in the village (as on the accompanying CD 4, track 28).
Boat sounds are high on the list, and as Tero Hyvärinen reports in his article in this collection, it is the sound of the old-fashioned inboard engine that has become a cherished soundmark of the archipelago. There are also a couple of mentions of ferry sounds, even though they probably signify something different from the old-fashioned boat sounds. Again, ferries are crucial in the everyday logistics of the island, and the way their sounds are experienced is situational. One boy responded by including the ferry sound in both the pleasant and unpleasant sounds, noting that the latter is the sound of the ferry ‘when it has just left the pier’; that is, when that you might have to wait twenty minutes for the next one. When interviewing people we found that one of the most loathed sounds in Nauvo was the sound of motorized jet-skis, which are totally useless to the villagers. One boy lists among unpleasant sounds the motor boats in the summer when they rapidly approach the shoreline too closely.
None of the children particularly singled out the sounds of the visitors’ marina, even though there are many loud voices and music there in the summer time (as on the accompanying CD 4, track 31). Antipathy towards tourists however emerged in one answer in which a boy expressed his dislike of the drunken shouting of people who holidayed in the summer cottages. Human voices are high on the list
chair scraping oor
door creak
chalk on blackboard
Year 2000: all traffi c
gun re
Nauvo: Most Pleasant Sounds
2000
birds 31 15%
boat / boat motor / ferry 25 12%
sea 21 10%
wind 20 9%
animals 15 7%
music 13 6%
cars 13 6%
talking / human sounds 11 5%
moped 11 5%
water 11 5%
laughter / child laughing 7 3%
rustling of leaves 5 2%
TV 4 2%
radio 3 1%
other 21 10%
Answers total 211 100%
screaming, shouting
re, ambulance,
barking dogs
alarm clock
clock, ticking
chair scraping oor
door creak
chalk on blackboard
Year 2000: all traffi c
gun re
talking / human sounds
Nauvo: Most Unpleasant Sounds
2000
car 16 9%
screaming, shouting 14 8%
moped 11 6%
re, ambulance,
police sirens 10 6%
thunder 8 4%
voice of a girl / girls 9 5%
boat / ferry 8 4%
barking dogs 6 3%
alarm clock 5 3%
church bell 5 3%
airplane 5 3%
clock, ticking 5 3%
tractors 5 3%
telephone 4 2%
music 4 2%
teacher 4 2%
other 58 33%
Answers total 177 100%
of unpleasant sounds, and most often mentioned by boys, who obviously at 14–15 years are having their particular love/hate relationship with girls and their voices.
In Nauvo traffic sounds are reasonably high on the list of both pleasant and un-pleasant sounds. If we include cars, mopeds, and two mentions of tractors (for one boy, the sound of the tractor ‘describes the countryside’), land vehicles rate 12 per cent on the positive listing. On the negative list cars, mopeds and tractors add up to 18 per cent. One boy loves technological sounds and has included on his list of favourites the car, TV, radio, moped and the boat, while on the unpleasant side he has put cars, mopeds and girls’ voices. The erratic responses to traffic sounds are likely to be connected with the characteristically irregular rhythms of the traffic flow to the village. Sound is also important for the boys as a way of enhancing their young masculinities by driving in the empty village centre in the evenings, where
Table 11. Nauvo: Most pleasant sounds. Year 2000: 44 students tested, 14–15 years old.
Table 12. Nauvo: Most unpleasant sounds. Year 2000: 44 students tested, 14–15 years old.
250 Järviluoma, Uimonen, Vikman & Kytö Acoustic Environments in Change 251
the piercing moped sound resounds in the high cliff walls near the centre. Again, the rating depends on the situation and whose moped it is that is heard; one boy mentions as positive ‘the sound of my moped when I start it’.
Traffic in six European villages
The AEC project adopted the traffic count methods from the FVS. The traffic was counted and categorized in the centre of each village, not just to find out how many different vehicles passed the observation site, but also to evaluate the overall char-acter of the soundscape together with the other research information. (For more detailed description of the method see Schafer 1977b).
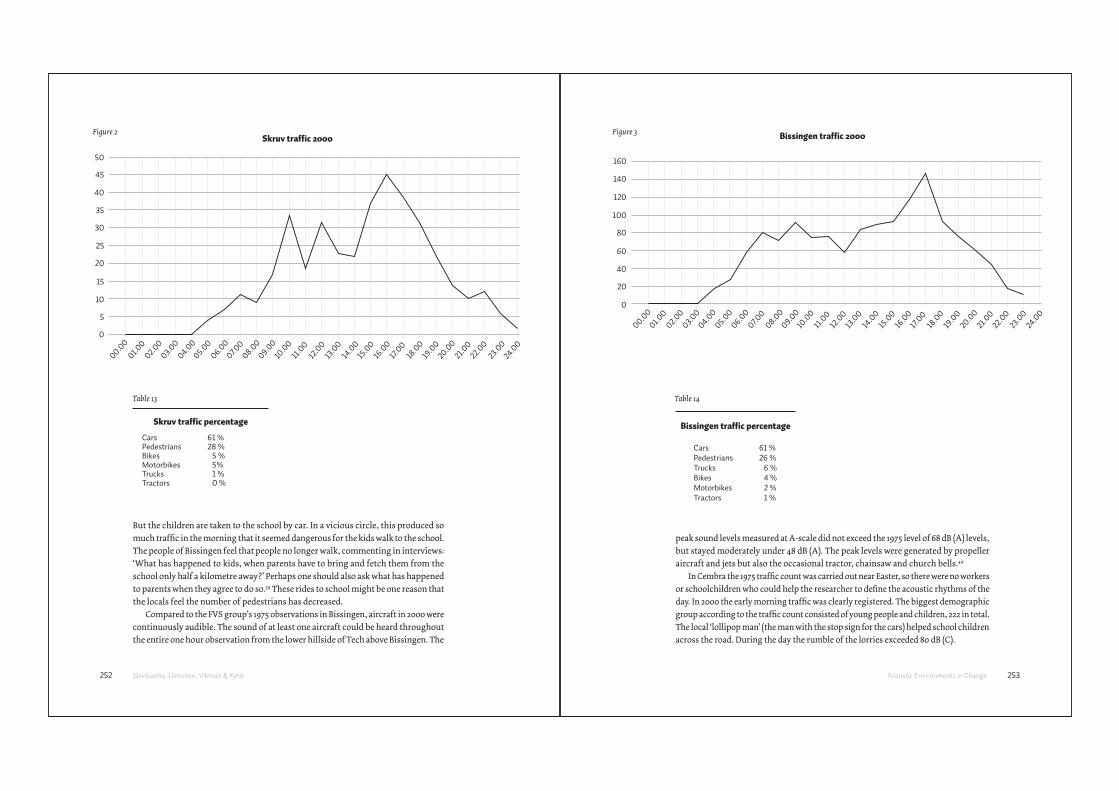
In Skruv the daily rhythm of the traffic is similar to that of 1975. The morning and evening hours are the most active because of commuting, and the evening reading
was probably also inflated by the fact that the traffic count was carried out on Fri-day. There is also likely to be some weekend-related activity such as shopping. The factory sirens no longer exist, so the traffic sounds are no longer related to them as had been the case 25 years earlier.
The amount of traffic has diminished notably, especially during the peak hours, as compared to the year 1975. However, the percentage of motorized traffic is slightly higher in 2000, rising from 50.4 per cent to 66 per cent of total traffic (see figure 2). The actual percentage of traffic sounds connected to the economic life of the village is probably even higher. Some of the commercial delivery vehicles were not included in the traffic count because not all of them passed the observation site. However, their sounds were clearly audible coming from the direction of the cardboard factory and Skruv’s trä timber factory. The percentage of cyclists has dropped significantly, from 19 per cent to five per cent of total traffic. This is surprising since in 2000 the weather was significantly warmer than when the measurements were carried out 25 years earlier, and the lack of snow made the road comfortable for cycling.
Rather than the harsh winter weather conditions of Scandinavia, one could seek the answer in the increase of pedestrian traffic and passenger cars. As suggested in 1975, the latter is a sign of a relatively high standard of living. The only means of transpor-tation for longer trips are buses and cars since the passenger train traffic was discon-tinued in Skruv in 1984. Furthermore the soundwalks, as opposed to the measurements from the stationary base, indicated that the sounds related to motor traffic exceeded all other sounds. The sounds of ignition and the slamming of the car doors are highly conspicuous in the stillness of February; the new sound connected with motor vehicles in Skruv, as well as in other villages, was the bass-booming car stereo.
The transphonic38 equipment has changed the soundscape of the German Schwa-bia too, since the car stereos were noticed in Bissingen traffic count. During the peak hour at 6 p.m. the level of traffic was significantly higher than in 1975. The number of pedestrians and vehicles in the 1970s was 80, 25 years later the number was 145.
The engines and tyres were quite audible because of the closely grouped build-ings of the village. The proportion of passenger cars and trucks has increased by ten and three percent respectively. The level of pedestrian traffic has remained the same but the number of bicycles has fallen to four percent. Presumably the more convenient passenger cars have replaced the weather dependent bicycles. In addi-tion, as mentioned in the introduction, 1700 out of the population 3000 in Bissingen earn their living from working in the larger cities in the area, and this has clearly had great impact on the traffic. In discussions with the villagers they complained that in order to reach the new residential area they were forced to drive through the old centre of the village.
It should be pointed out, however, that in Bissingen the means of transportation is also connected to the age group. The teenagers on their bikes were clearly audible in the evening when they were riding to the youth centre located on the main street.
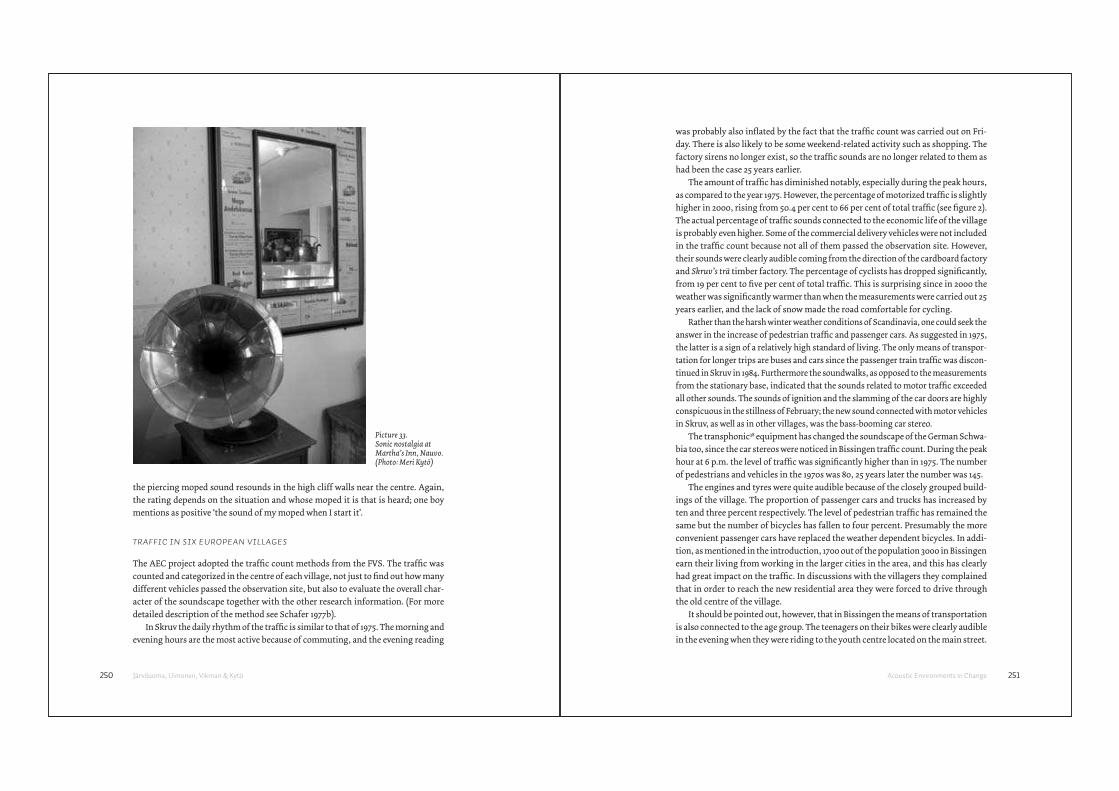
Picture 33. Sonic nostalgia at Martha’s Inn, Nauvo. (Photo: Meri Kytö)
252 Järviluoma, Uimonen, Vikman & Kytö Acoustic Environments in Change 253
Figure 3
Trucks 6 %Bikes 4 %Motorbikes 2 %
Bissingen traffi c percentage
Bissingen traffi c 2000
00.00
01.00
02.00
03.00
04.00
05.00
06.00
07.00
08.00
09.00
10.00
11.00
12.00
13.00
14.00
15.00
16.00
17.00
18.00
19.00
20.00
21.00
22.00
23.00
160
140
120
100
80
60
40
20
0
24.00
Bikes 5 %Motorbikes 5%Trucks 1 %
Skruv traffi c percentage
00.00
01.00
02.00
03.00
04.00
05.00
06.00
07.00
08.00
09.00
10.00
11.00
12.00
13.00
14.00
15.00
16.00
17.00
18.00
19.00
20.00
21.00
22.00
23.00
Skruv traffi c 2000
40
35
30
25
20
15
10
5
0
45
50
Figure 2
24.00
But the children are taken to the school by car. In a vicious circle, this produced so much traffic in the morning that it seemed dangerous for the kids walk to the school. The people of Bissingen feel that people no longer walk, commenting in interviews: ‘What has happened to kids, when parents have to bring and fetch them from the school only half a kilometre away?’ Perhaps one should also ask what has happened to parents when they agree to do so.39 These rides to school might be one reason that the locals feel the number of pedestrians has decreased.
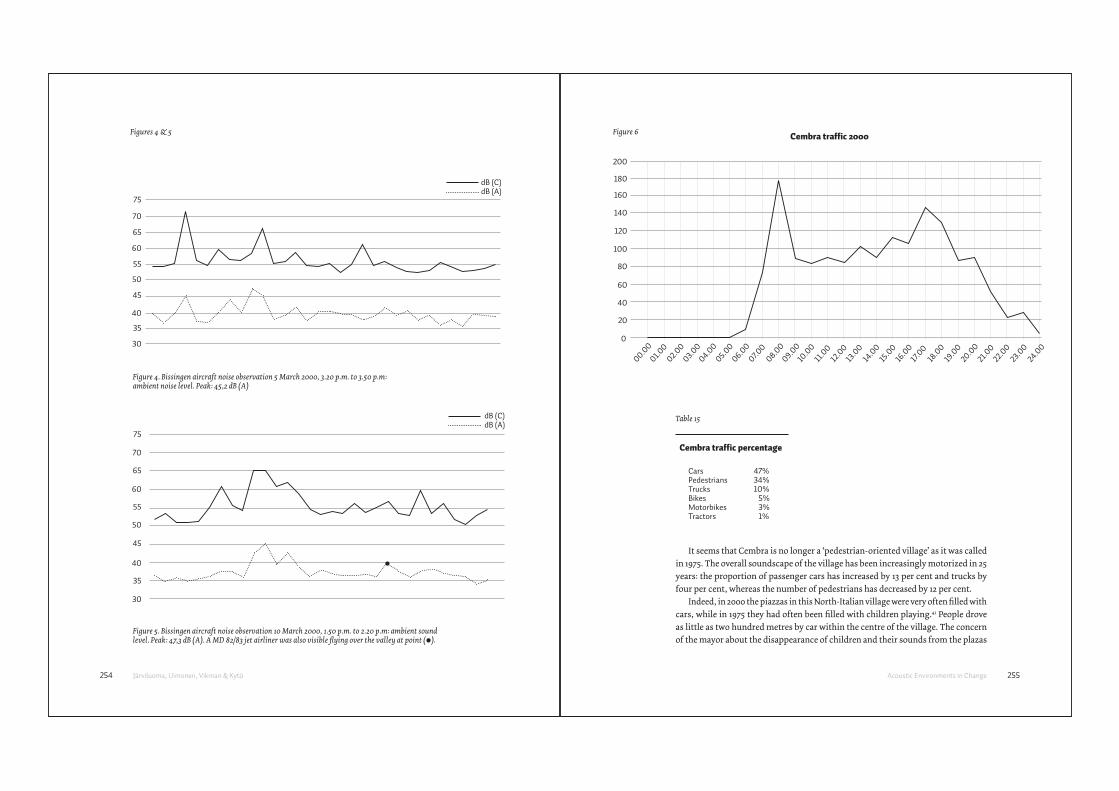
Compared to the FVS group’s 1975 observations in Bissingen, aircraft in 2000 were continuously audible. The sound of at least one aircraft could be heard throughout the entire one hour observation from the lower hillside of Tech above Bissingen. The
peak sound levels measured at A-scale did not exceed the 1975 level of 68 dB (A) levels, but stayed moderately under 48 dB (A). The peak levels were generated by propeller aircraft and jets but also the occasional tractor, chainsaw and church bells.40
In Cembra the 1975 traffic count was carried out near Easter, so there were no workers or schoolchildren who could help the researcher to define the acoustic rhythms of the day. In 2000 the early morning traffic was clearly registered. The biggest demographic group according to the traffic count consisted of young people and children, 222 in total. The local ‘lollipop man’ (the man with the stop sign for the cars) helped school children across the road. During the day the rumble of the lorries exceeded 80 dB (C).
Cars 61 %Pedestrians 28 %Bikes 5 %Motorbikes 5%Trucks 1 %Tractors 0 %
Skruv traffi c percentage
Table 13
Skruv traffi c 2000
Cars 61 %Pedestrians 26 %Trucks 6 %Bikes 4 %Motorbikes 2 %Tractors 1 %
Bissingen traffi c percentage
Table 14
Bissingen traffi c 2000
254 Järviluoma, Uimonen, Vikman & Kytö Acoustic Environments in Change 255
Figure 6
Trucks 10%Bikes 5%Motorbikes 3%
Cembra traffi c percentage
Trucks 8%Bikes 5%
Motorbikes 2%
Lesconil traffi c percentage
Cembra traffi c 2000
00.00
01.00
02.00
03.00
04.00
05.00
06.00
07.00
08.00
09.00
10.00
11.00
12.00
13.00
14.00
15.00
16.00
17.00
18.00
19.00
20.00
21.00
22.00
23.00
160
140
120
100
80
60
40
20
0
180
200
24.00
Lesconil traffi c 2000
75
70
65
60
55
50
45
40
35
30
dB (C)dB (A)
Figures 4 & 5
Trucks 6 %Bikes 4 %Motorbikes 2 %
Bissingen traffi c percentage
Bissingen traffi c 2000
24.00
Figure 5. Bissingen aircraft noise observation 10 March 2000, 1.50 p.m. to 2.20 p.m: ambient sound level. Peak: 47,3 dB (A). A MD 82/83 jet airliner was also visible flying over the valley at point ( ).
Figure 4. Bissingen aircraft noise observation 5 March 2000, 3.20 p.m. to 3.50 p.m: ambient noise level. Peak: 45,2 dB (A)
75
70
65
60
55
50
45
40
35
30
dB (C)dB (A)
Trucks 6 %Bikes 4 %Motorbikes 2 %
Bissingen traffi c percentage
Bissingen traffi c 2000
Cars 47%Pedestrians 34%Trucks 10%Bikes 5%Motorbikes 3%Tractors 1%
Cembra traffi c percentage
Table 15
Trucks 8%Bikes 5%
Motorbikes 2%
Lesconil traffi c percentage
Cembra traffi c 2000
Lesconil traffi c 2000
It seems that Cembra is no longer a ‘pedestrian-oriented village’ as it was called in 1975. The overall soundscape of the village has been increasingly motorized in 25 years: the proportion of passenger cars has increased by 13 per cent and trucks by four per cent, whereas the number of pedestrians has decreased by 12 per cent.
Indeed, in 2000 the piazzas in this North-Italian village were very often filled with cars, while in 1975 they had often been filled with children playing.41 People drove as little as two hundred metres by car within the centre of the village. The concern of the mayor about the disappearance of children and their sounds from the plazas
256 Järviluoma, Uimonen, Vikman & Kytö Acoustic Environments in Change 257
Trucks 10%Bikes 5%Motorbikes 3%
Cembra traffi c percentage
Trucks 8%Bikes 5%
Motorbikes 2%
Lesconil traffi c percentage
Figure 7
Cembra traffi c 2000
24.00
Lesconil traffi c 2000
00.00
01.00
02.00
03.00
04.00
05.00
06.00
07.00
08.00
09.00
10.00
11.00
12.00
13.00
14.00
15.00
16.00
17.00
18.00
19.00
20.00
21.00
22.00
23.00
160
140
120
100
80
60
40
20
0
24.00
in the year 2000 turned out to be fully justified.42
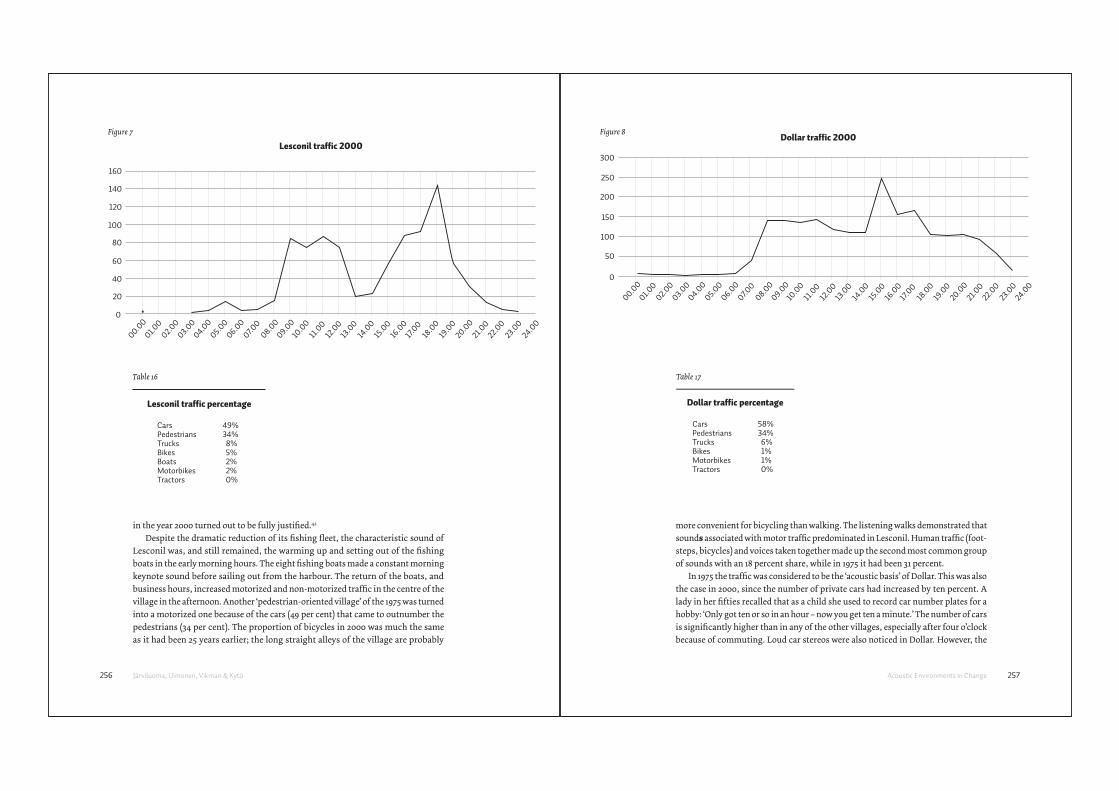
Despite the dramatic reduction of its fishing fleet, the characteristic sound of Lesconil was, and still remained, the warming up and setting out of the fishing boats in the early morning hours. The eight fishing boats made a constant morning keynote sound before sailing out from the harbour. The return of the boats, and business hours, increased motorized and non-motorized traffic in the centre of the village in the afternoon. Another ‘pedestrian-oriented village’ of the 1975 was turned into a motorized one because of the cars (49 per cent) that came to outnumber the pedestrians (34 per cent). The proportion of bicycles in 2000 was much the same as it had been 25 years earlier; the long straight alleys of the village are probably
143142139146120112114
Trucks 6%Bikes 1%Motorbikes 1%
Dollar traffi c percentage
Trucks 16%Bikes 6%Motorbikes 1%
Nauvo traffi c percentage
Dollar traffi c 2000Figure 8
00.00
01.00
02.00
03.00
04.00
05.00
06.00
07.00
08.00
09.00
10.00
11.00
12.00
13.00
14.00
15.00
16.00
17.00
18.00
19.00
20.00
21.00
22.00
23.00
300
250
200
150
100
50
0
24.00
Nauvo traffi c 2000
more convenient for bicycling than walking. The listening walks demonstrated that sounds associated with motor traffic predominated in Lesconil. Human traffic (foot-steps, bicycles) and voices taken together made up the second most common group of sounds with an 18 percent share, while in 1975 it had been 31 percent.
In 1975 the traffic was considered to be the ‘acoustic basis’ of Dollar. This was also the case in 2000, since the number of private cars had increased by ten percent. A lady in her fifties recalled that as a child she used to record car number plates for a hobby: ‘Only got ten or so in an hour – now you get ten a minute.’ The number of cars is significantly higher than in any of the other villages, especially after four o’clock because of commuting. Loud car stereos were also noticed in Dollar. However, the
106102103
Cars 58%Pedestrians 34%Trucks 6%Bikes 1%Motorbikes 1%Tractors 0%
Dollar traffi c percentage
Table 17
Trucks 16%Bikes 6%Motorbikes 1%
Nauvo traffi c percentage
Dollar traffi c 2000 Nauvo traffi c 2000
Trucks 10%Bikes 5%Motorbikes 3%
Cembra traffi c percentageCars 49%Pedestrians 34%Trucks 8%Bikes 5%Boats 2%Motorbikes 2%Tractors 0%
Lesconil traffi c percentage
Table 16
Cembra traffi c 2000
Lesconil traffi c 2000
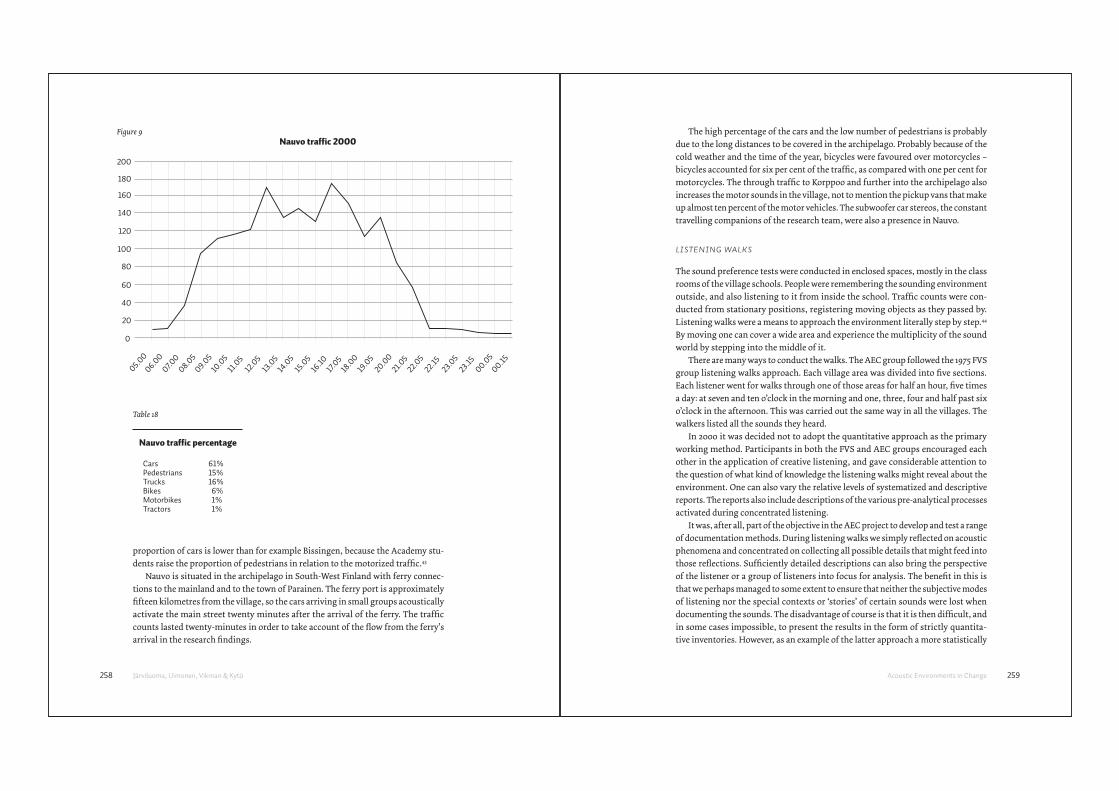
258 Järviluoma, Uimonen, Vikman & Kytö Acoustic Environments in Change 259
The high percentage of the cars and the low number of pedestrians is probably due to the long distances to be covered in the archipelago. Probably because of the cold weather and the time of the year, bicycles were favoured over motorcycles – bicycles accounted for six per cent of the traffic, as compared with one per cent for motorcycles. The through traffic to Korppoo and further into the archipelago also increases the motor sounds in the village, not to mention the pickup vans that make up almost ten percent of the motor vehicles. The subwoofer car stereos, the constant travelling companions of the research team, were also a presence in Nauvo.
Listening walks
The sound preference tests were conducted in enclosed spaces, mostly in the class rooms of the village schools. People were remembering the sounding environment outside, and also listening to it from inside the school. Traffic counts were con-ducted from stationary positions, registering moving objects as they passed by. Listening walks were a means to approach the environment literally step by step.44 By moving one can cover a wide area and experience the multiplicity of the sound world by stepping into the middle of it.
There are many ways to conduct the walks. The AEC group followed the 1975 FVS group listening walks approach. Each village area was divided into five sections. Each listener went for walks through one of those areas for half an hour, five times a day: at seven and ten o’clock in the morning and one, three, four and half past six o’clock in the afternoon. This was carried out the same way in all the villages. The walkers listed all the sounds they heard.
In 2000 it was decided not to adopt the quantitative approach as the primary working method. Participants in both the FVS and AEC groups encouraged each other in the application of creative listening, and gave considerable attention to the question of what kind of knowledge the listening walks might reveal about the environment. One can also vary the relative levels of systematized and descriptive reports. The reports also include descriptions of the various pre-analytical processes activated during concentrated listening.
It was, after all, part of the objective in the AEC project to develop and test a range of documentation methods. During listening walks we simply reflected on acoustic phenomena and concentrated on collecting all possible details that might feed into those reflections. Sufficiently detailed descriptions can also bring the perspective of the listener or a group of listeners into focus for analysis. The benefit in this is that we perhaps managed to some extent to ensure that neither the subjective modes of listening nor the special contexts or ‘stories’ of certain sounds were lost when documenting the sounds. The disadvantage of course is that it is then difficult, and in some cases impossible, to present the results in the form of strictly quantita-tive inventories. However, as an example of the latter approach a more statistically
Trucks 6%Bikes 1%Motorbikes 1%
Dollar traffi c percentage
Trucks 16%Bikes 6%Motorbikes 1%
Nauvo traffi c percentage
Dollar traffi c 2000 Nauvo traffi c 200005.0
0
160
140
120
100
80
60
40
20
0
180
200
06.00
07.00
08.05
09.05
10.05
11.05
12.05
13.05
14.05
15.05
16.10
17.05
18.00
19.05
20.00
21.05
22.05
22.15
23.05
23.15
00.05
00.15
Figure 9
Trucks 6%Bikes 1%Motorbikes 1%
Dollar traffi c percentage
Cars 61%Pedestrians 15%Trucks 16%Bikes 6%Motorbikes 1%Tractors 1%
Nauvo traffi c percentage
Table 18
Dollar traffi c 2000 Nauvo traffi c 2000
proportion of cars is lower than for example Bissingen, because the Academy stu-dents raise the proportion of pedestrians in relation to the motorized traffic.43
Nauvo is situated in the archipelago in South-West Finland with ferry connec-tions to the mainland and to the town of Parainen. The ferry port is approximately fifteen kilometres from the village, so the cars arriving in small groups acoustically activate the main street twenty minutes after the arrival of the ferry. The traffic counts lasted twenty-minutes in order to take account of the flow from the ferry’s arrival in the research findings.
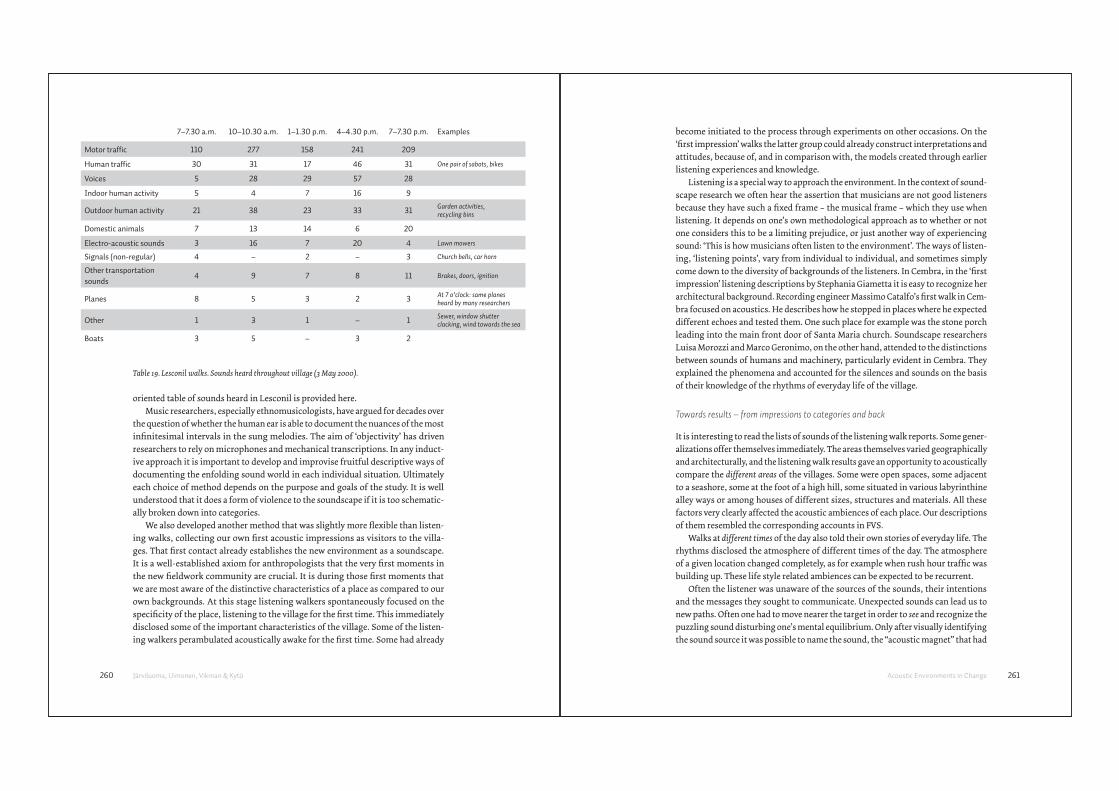
260 Järviluoma, Uimonen, Vikman & Kytö Acoustic Environments in Change 261
7–7.30 a.m. 10–10.30 a.m. 1–1.30 p.m. 4–4.30 p.m. 7–7.30 p.m. Examples
Motor traf c 110 277 158 241 209
Human traf c 30 31 17 46 31 One pair of sabots, bikes
Voices 5 28 29 57 28
Indoor human activity 5 4 7 16 9
Outdoor human activity 21 38 23 33 31Garden activities, recycling bins
Domestic animals 7 13 14 6 20
Electro-acoustic sounds 3 16 7 20 4 Lawn mowers
Signals (non-regular) 4 – 2 – 3 Church bells, car horn
Other transportation
sounds4 9 7 8 11 Brakes, doors, ignition
Planes 8 5 3 2 3At 7 o’clock: same planes heard by many researchers
Other 1 3 1 – 1Sewer, window shutter clacking, wind towards the sea
Boats 3 5 – 3 2
Table 19. Lesconil walks. Sounds heard throughout village (3 May 2000).
oriented table of sounds heard in Lesconil is provided here. Music researchers, especially ethnomusicologists, have argued for decades over
the question of whether the human ear is able to document the nuances of the most infinitesimal intervals in the sung melodies. The aim of ‘objectivity’ has driven researchers to rely on microphones and mechanical transcriptions. In any induct-ive approach it is important to develop and improvise fruitful descriptive ways of documenting the enfolding sound world in each individual situation. Ultimately each choice of method depends on the purpose and goals of the study. It is well understood that it does a form of violence to the soundscape if it is too schematic-ally broken down into categories.
We also developed another method that was slightly more flexible than listen-ing walks, collecting our own first acoustic impressions as visitors to the villa-ges. That first contact already establishes the new environment as a soundscape. It is a well-established axiom for anthropologists that the very first moments in the new fieldwork community are crucial. It is during those first moments that we are most aware of the distinctive characteristics of a place as compared to our own backgrounds. At this stage listening walkers spontaneously focused on the specificity of the place, listening to the village for the first time. This immediately disclosed some of the important characteristics of the village. Some of the listen-ing walkers perambulated acoustically awake for the first time. Some had already
become initiated to the process through experiments on other occasions. On the ‘first impression’ walks the latter group could already construct interpretations and attitudes, because of, and in comparison with, the models created through earlier listening experiences and knowledge.
Listening is a special way to approach the environment. In the context of sound-scape research we often hear the assertion that musicians are not good listeners because they have such a fixed frame – the musical frame – which they use when listening. It depends on one’s own methodological approach as to whether or not one considers this to be a limiting prejudice, or just another way of experiencing sound: ‘This is how musicians often listen to the environment’. The ways of listen-ing, ‘listening points’, vary from individual to individual, and sometimes simply come down to the diversity of backgrounds of the listeners. In Cembra, in the ‘first impression’ listening descriptions by Stephania Giametta it is easy to recognize her architectural background. Recording engineer Massimo Catalfo’s first walk in Cem-bra focused on acoustics. He describes how he stopped in places where he expected different echoes and tested them. One such place for example was the stone porch leading into the main front door of Santa Maria church. Soundscape researchers Luisa Morozzi and Marco Geronimo, on the other hand, attended to the distinctions between sounds of humans and machinery, particularly evident in Cembra. They explained the phenomena and accounted for the silences and sounds on the basis of their knowledge of the rhythms of everyday life of the village.
Towards results – from impressions to categories and back
It is interesting to read the lists of sounds of the listening walk reports. Some gener-alizations offer themselves immediately. The areas themselves varied geographically and architecturally, and the listening walk results gave an opportunity to acoustically compare the different areas of the villages. Some were open spaces, some adjacent to a seashore, some at the foot of a high hill, some situated in various labyrinthine alley ways or among houses of different sizes, structures and materials. All these factors very clearly affected the acoustic ambiences of each place. Our descriptions of them resembled the corresponding accounts in FVS.
Walks at different times of the day also told their own stories of everyday life. The rhythms disclosed the atmosphere of different times of the day. The atmosphere of a given location changed completely, as for example when rush hour traffic was building up. These life style related ambiences can be expected to be recurrent.
Often the listener was unaware of the sources of the sounds, their intentions and the messages they sought to communicate. Unexpected sounds can lead us to new paths. Often one had to move nearer the target in order to see and recognize the puzzling sound disturbing one’s mental equilibrium. Only after visually identifying the sound source it was possible to name the sound, the “acoustic magnet” that had
262 Järviluoma, Uimonen, Vikman & Kytö Acoustic Environments in Change 263
drawn us to the source. During the listening walks some sounds leaked out from private to public spaces (see further ‘Soundscape shutters’ in this publication). Many of the private sounds were beyond the visual horizon and therefore remained non-categorizable. The loud, high-pitched sounds of chairs scratching the stone floors and the tinkle of plates in the interiors of buildings were described as heard only from outside. The sound of the espresso machine – slightly exotic for a Finn – had particularly attracted the listeners’ attention.
These comments remind us of the importance of interplay among the senses – how the sense of sight for example plays an important role in making acoustic phenomena intelligible. In addition, points of listening and points of viewing differ from individual to individual. Approaching the environment through the gaze the observer is aware of being at a given distance from the object, and brings to bear a well-focused perspective. In many interpretations of soundscape thinking the listener without earlids is often understood as being immersed in the midst of her/his environment. Following this view the listener is also susceptible to the total field of sound. Listening is then sup-posedly an interesting and different way to focus on one sound and screen out others and – also supposedly – reveals things differently as compared to looking.
What do we make of a half hour walk in the village during which one person hears nine aircraft and the others only four or five? In what category would we put a complex soundscape heard from a distant schoolyard? The source and direction are easily recognized. The sounds of the children emerging from the schoolyard are described as omnipresent. But how many sounds can be heard? Faced with the flood of acoustic detail, the demands on the documenting listener can be frustrating. When quickly listing a torrent of sounds we often use a spontaneous shorthand. In one report the sound of the aeroplane, ‘roar’, was written in quotes when it had receded far enough. Another option was to invent a new word describing the sound as it was dimmed by distance. All the lists of the core AEC-group were written in Finnish, so there is then the problematic of translation. Answers like ‘car’ and ‘dog’ are more common than ‘smooth motor roar of the car’ or ‘howling of the dog’.
The fact is that we do not know if the categories mentioned in the FVS book were decided before, or created after the listening walks. That is to say we can only roughly estimate how far the categories of the earlier study might have determined our way of listening to the village environment. From the methodological point of view the ques-tion of whether the categories were formed beforehand or afterwards is crucial.
The taxonomy articulated in the FVS study was basically dualistic in that it divided the sounds into ‘human’ and ‘technological’, with ‘domestic animals’ as a separate category. It was interesting however how the AEC listening walkers ‘over-rode’ the categories. One listener put his comments about activities that can be seen but not heard into a category ‘other sounds’. Another used the same category for comments about sounds that simply did not fit into any of the others. The listening walk reports and their comments suggest that some have been actively listening to a range of hums
and categorizing them all as ‘electro-acoustic sounds’. Another has categorized various clatters and hums as ‘outdoor’ or ‘indoor’ human activities, since they were produced by people, even if mediated by forms of technology developed by people. For one of us the sound of a mail box was listed under ‘other transportation sound’. These details and interpretations disclose interesting things about the complex connections between the sounds and their sources, causes and effects. They revealed various ways of perceiv-ing and taxonomizing the environment. When proceeding towards an analysis it is fruitful to understand soundscape as a sum of dynamic activities rather than stable elements of a relatively static space or a text (cf. Cusick 1994: 14–15).
A listening walk report from Skruv included the words ‘the sound of the lawn mowers fill the space’. The space wasn’t empty before, but a dominating sound began to colour it and mask the rest of the soundscape. Obviously sound events become especially noticeable and meaningful in different ways when something happens to destabilize the pre-existing acoustic field.
In some reports the listener suddenly or gradually changed the reporting style. Sounds of wind, rain and birds, for example, were excluded from FVS categories. At some point however, a few of us AEC researchers began to find it fruitful to observe and separately document both the background and foreground of the soundscape. Noting separately what were clearly ambient and constant sounds made the listing much easier, for example by providing more space dedicated to describing the sound events in the foreground. In Cembra, the soundscape was flavoured with an ever-present echo. This was separately mentioned in only one comment however, when the reporter wanted to record the fact that the echo made it difficult to recognize the direction from which sounds emanated. As an example, sometimes the continuous hubbub of harvest time, or male choir singing (a typical winter sound in Cembra), could reasonably be identified simply as a ‘drone’.
In their small villages people mentioned that they felt they lived in a stable atmos-phere of ‘silence’. What is the anatomy of a silent atmosphere? Everyday acoustic dramas can’t be described solely with a decibel meter; nor can the microphone an-swer all the questions about perception. For a human ear the soundscape may sound like ‘the birds are trying to get their voices heard’, as one of us wrote to on a listen-ing walk in Cembra. The idea of a continuous competition for acoustic space adds something that technological calibration can not, and also reminds us that listening is not passive, but is also a process of imaginatively constructing the environment. It situates the birds as background, audible only when something louder in the foreground is not overwhelming it.
Making sense of listening – strategies for grasping the complex sound world
Surprises make the environment interesting. It is easier to listen to the foreground than background because the foreground is full of events. Often the events can
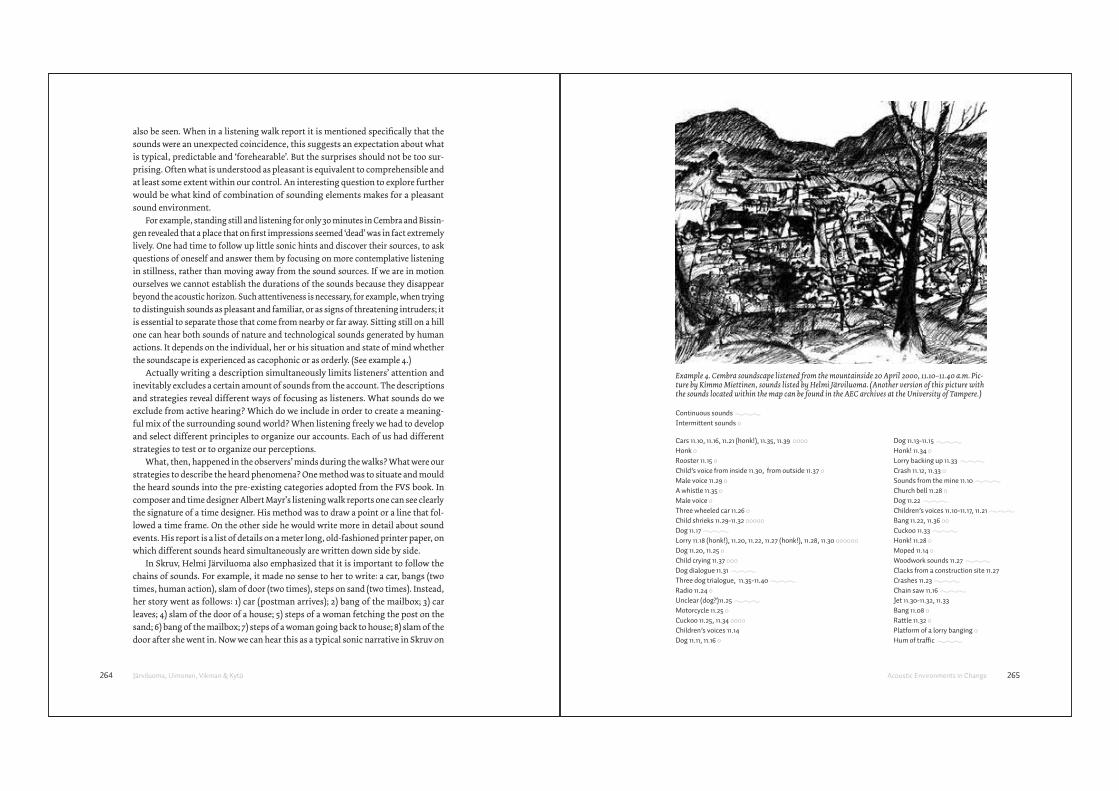
264 Järviluoma, Uimonen, Vikman & Kytö Acoustic Environments in Change 265
also be seen. When in a listening walk report it is mentioned specifically that the sounds were an unexpected coincidence, this suggests an expectation about what is typical, predictable and ‘forehearable’. But the surprises should not be too sur-prising. Often what is understood as pleasant is equivalent to comprehensible and at least some extent within our control. An interesting question to explore further would be what kind of combination of sounding elements makes for a pleasant sound environment.
For example, standing still and listening for only 30 minutes in Cembra and Bissin-gen revealed that a place that on first impressions seemed ‘dead’ was in fact extremely lively. One had time to follow up little sonic hints and discover their sources, to ask questions of oneself and answer them by focusing on more contemplative listening in stillness, rather than moving away from the sound sources. If we are in motion ourselves we cannot establish the durations of the sounds because they disappear beyond the acoustic horizon. Such attentiveness is necessary, for example, when trying to distinguish sounds as pleasant and familiar, or as signs of threatening intruders; it is essential to separate those that come from nearby or far away. Sitting still on a hill one can hear both sounds of nature and technological sounds generated by human actions. It depends on the individual, her or his situation and state of mind whether the soundscape is experienced as cacophonic or as orderly. (See example 4.)
Actually writing a description simultaneously limits listeners’ attention and inevitably excludes a certain amount of sounds from the account. The descriptions and strategies reveal different ways of focusing as listeners. What sounds do we exclude from active hearing? Which do we include in order to create a meaning-ful mix of the surrounding sound world? When listening freely we had to develop and select different principles to organize our accounts. Each of us had different strategies to test or to organize our perceptions.
What, then, happened in the observers’ minds during the walks? What were our strategies to describe the heard phenomena? One method was to situate and mould the heard sounds into the pre-existing categories adopted from the FVS book. In composer and time designer Albert Mayr’s listening walk reports one can see clearly the signature of a time designer. His method was to draw a point or a line that fol-lowed a time frame. On the other side he would write more in detail about sound events. His report is a list of details on a meter long, old-fashioned printer paper, on which different sounds heard simultaneously are written down side by side.
In Skruv, Helmi Järviluoma also emphasized that it is important to follow the chains of sounds. For example, it made no sense to her to write: a car, bangs (two times, human action), slam of door (two times), steps on sand (two times). Instead, her story went as follows: 1) car (postman arrives); 2) bang of the mailbox; 3) car leaves; 4) slam of the door of a house; 5) steps of a woman fetching the post on the sand; 6) bang of the mailbox; 7) steps of a woman going back to house; 8) slam of the door after she went in. Now we can hear this as a typical sonic narrative in Skruv on
Example 4. Cembra soundscape listened from the mountainside 20 April 2000, 11.10–11.40 a.m. Pic-ture by Kimmo Miettinen, sounds listed by Helmi Järviluoma. (Another version of this picture with the sounds located within the map can be found in the AEC archives at the University of Tampere.)
Cars 11.10, 11.16, 11.21 (honk!), 11.35, 11.39 oooo
Honk o
Rooster 11.15 o
Child’s voice from inside 11.30, from outside 11.37 o
Male voice 11.29 o
A whistle 11.35 o
Male voice o
Three wheeled car 11.26 o
Child shrieks 11.29-11.32 ooooo
Dog 11.17
Lorry 11.18 (honk!), 11.20, 11.22, 11.27 (honk!), 11.28, 11.30 oooooo
Dog 11.20, 11.25 o
Child crying 11.37 ooo
Dog dialogue 11.31
Three dog trialogue, 11.35-11.40
Radio 11.24 o
Unclear (dog?)11.25
Motorcycle 11.25 o
Cuckoo 11.25, 11.34 oooo
Children’s voices 11.14
Dog 11.11, 11.16 o
Dog 11.13-11.15
Honk! 11.34 o
Lorry backing up 11.33
Crash 11.12, 11.33 o
Sounds from the mine 11.10
Church bell 11.28 o
Dog 11.22
Children’s voices 11.10-11.17, 11.21
Bang 11.22, 11.36 oo
Cuckoo 11.33
Honk! 11.28 o
Moped 11.14 o
Woodwork sounds 11.27
Clacks from a construction site 11.27
Crashes 11.23
Chain saw 11.16
Jet 11.30-11.32, 11.33
Bang 11.08 o
Rattle 11.32 o
Platform of a lorry banging o
Hum of traffi c
Continuous sounds
Intermittent sounds o
266 Järviluoma, Uimonen, Vikman & Kytö Acoustic Environments in Change 267
a February morning at ten o’clock in the morning in the peaceful residential area. Thus, two of us have written our notes in numbered order during the walk, believ-ing that we would then be able to reconstruct the order in which they appeared; we continued this practice in the remaining villages that we visited.
One example of the interesting phenomena in everyday human life was related to the domestic animals. Their sounds were a revealing and interactive element of the soundscape. For many dogs it was impossible to ignore the presence of an olfac-tory and communicative entity – the walking human being. A further interesting supplement to the walks was that Albert Mayr was walking and listening with his own dog. In his report the points signifying dog barks had their own separate line. In Skruv the dogs were kept inside. According to our notes, in Skruv many dogs seem to have made noises after four o’clock. We could not necessarily see them through the fences, but we were acoustically informed of their presence. It seems that after the conclusion of their school and working day people let their dogs out. In Cembra dogs and cuckoos were mentioned much more often than elsewhere. It is doubtful whether this tells about the actual numbers of these animals, but simply that they clearly communicated in open spaces, reacting to each other’s voices. The provoca-tive barks and cuckoo calls caused a chain reaction, and in an open space the radius of sounds reaching the ear was much greater.
It was often the forces of nature that created impressions of a kind of randomness by making otherwise hidden objects audible. During a late evening listening walk in Cembra for example, the wind dominated the soundscape. It carried sounds from a particular direction, and also moved rubbish and leaves that none of us would other-wise have noticed. It created an unpredictable rhythm to the soundscape by forcing the listener to pay attention to elements and events that, during the earlier listening walks, had not moved and therefore had made no sounds. The weather changed the environment radically, and consequently affected the ways we translated perceptions into documents. In Dollar the listening day was stormy. It made the writing difficult and the telephone box became a haven from the weather. Noora Vikman’s half hour walk ended up in a red English telephone box where only at the end could she write down all the experiences, details and impressions into a listening walk report.
Albert Mayr had visited Cembra 25 years ago, and again in 1999 and 2000. What struck Mayr clearly in the soundscape of Cembra during the 1999 visit was the ab-sence of a steady drone produced by the many fountains in the village still in 1975. It is present also in the recording from 1975. In 2000 these fountains were dry. Because of the lack of running water important social outdoor activities like collective laundry washing in the old village fountains had disappeared.
Mayr’s first impressions after 25 years include the feeling that the old part of the village was no more the main agora of the city. Children no longer played informally outside. These points were also made by the mayor in his presentation when he listed ways to improve the soundscape of Cembra. Mayr also points out how certain
changes had affected the soundscape of the old part of the village. A completely new residential area, Campana rasa, had been built after the FVS visit, meaning the residential area of the village had doubled. This naturally affected the level of human sounds in the old quarter from whence the people had moved. (Mayr 2002: 147)
These are some of the ideas and impressions that Mayr articulated after his new listening walk experiences in 2000, comparing them to his memories from 1975.46 What we other researchers could not hear during our formal listening walks were people’s memories and impressions.47 Alas, we learned that the local people in present day Cembra still remembered with regret the same lost sounds. For example, in the interviews made in 2000 and later, people still remembered the fountains: the water drone was one nostalgic reminder of the times they worked together. One lost sound which touched the whole collective was the rustling as people filled the mattresses with dried corn leaves.
Layers of time and change
The successive historical periods live in layers in the villages. People’s interpretations of ‘things of the past’ change continuously. We concentrated on the idea of change that manifests itself more as states of mind than as concrete acoustic phenomena. In some areas of life the visual aspects can more easily be memorialized in fixed and concrete forms that encourage and remind people to respect their history. But people’s minds and memories do not have the fixed and stable form of a statue or a painting.
A contemplative attitude opened our ears to an indefinable complexity of sounds. Informed by the lists of sounds collected during listening walks, we were able to ask questions about everyday life. These sounds could also be the basis for further ques-tions about the acoustic environment. Persistent and manifold questioning by the curious researchers unveiled a lot of detailed information. We learned that different local people had spent time carefully listening to the forest sounds, porphyry mines, railway stations, birdsong and other soundscapes. This kind of local competence, developed over so much time, has inspired more prolonged reflection than the lis-tening walkers could ever sustain during their short interventions.
This also told us as researchers that people still do live with their ears open. When they describe their experiences, there is a glowing richness of meaning attached to their sonic environment. In spite of what we sometimes suspected, their enthusi-astic accounts had an intensity that suggested something much more than merely a politically correct way of expressing their sense of beauty.
The soundscape cannot easily be reduced to some unified discourse about how people listen. The long term changes in a sonic environment cannot meaningfully arrive at our ears without cultural knowledge. It is instructive to pay attention to variations in the way people perceive and describe their soundscape, since through these variations we can learn about how they live in and through their culture.
268 Järviluoma, Uimonen, Vikman & Kytö Acoustic Environments in Change 269
Acoustic environments and people’s environmental
relationships in change
In her book Mig äger ingen (‘Nobody owns me’) Åsa Linderborg (2007: 10) describes her childhood as the daughter of a dedicated metal worker at a factory in central Sweden in the 1970s. When the factory hooters signalled the end of the working day at four o’clock, the gates opened and a large group of factory workers rushed out on their bicycles, heading home first as a thick mass, then gradually separating in their various directions, only to meet up again next morning at seven o’clock. The book captures a moment remembered by many of the interviewees in the much smaller Swedish industrial community, Skruv, as they reminisced about life in the 1970s. By the year 2000, the sound of factory hooters had vanished in Skruv, and the number of bicycles heard in the village had radically diminished.
But what in fact does it mean to say that we have been studying acoustic environ-ments in change? It is easy to hear and see that during the last third of the twentieth century, the time that this book mainly deals with, Western Europe has changed. It can be said that now we live in a post-industrial society, and that all six of the localities studied now belong to the formation called the European Union. When we started our fieldwork in the six localities at the turn of the millennium, talk about climate change was practically non-existent. Now, in 2008, only the financial crisis sometimes drowns out the constant discussion about climate change as the ultimate question facing the entire world.
Mostly, we have studied the ways in which people describe and construct changing soundscapes as part of their everyday lives. This does not mean that we are not interested in ‘structures’ – we just do not think that is fruitful to hear changing soundscapes as direct reflections of change in societies. Following Truax, Järviluoma (2003: 349–50) has stressed the contextuality of acoustic experience: contexts are not something that affect phenomena like art and music in any direct way, neither do these phenomena directly reflect their contexts. For acoustic environments, we find it interesting to study how contexts are co-constructed through our sonic experi-ences. Our sensuous worlds become each other’s contexts.
As we said right at the beginning of our project, we have studied the soundscapes at the micro-level, with ‘an enthusiastic attitude’. However, as Heikki Uimonen has emphasized, the micro-, meso- and macro-levels operate in ceaseless interaction. If changes in the soundscape are read simply through the changes in societies, there is a danger of the explanations becoming macro-reductionist. Or – as Margaret Archer has claimed – actor, culture, and structure offer different perspectives on social reality. None of these three can be studied as being caused by any of the others. (Archer 1996; Saaristo & Jokinen 2004: 143–4; Uimonen 2005: 49–53; cf. DeWalt & Pelto 1985: 3; also Hall 1992.)
As Heikki Uimonen (2005) has pointed out, societal macro- and micro-levels
were also discussed in the earlier, FVS study. It has been argued that when commun-ities lose their independence to larger social organizations, they at the same time lose their unique soundmarks and sonic events (Schafer 1977: 49). This argument refers more generally to the fact that changes in western, industrialized society tend to diminish the degree of acoustic definition (Uimonen 2005: 51). However, Uimonen also points out that one needs to ask what are these structural and cultural aspects that change the soundscape, or the intertwined soundscapes of a particular place. We should think about the multi-layered ways in which economic and social factors, and changes in these, occur within the sonic environment, and on what conditions these changes take place.
The solutions adopted by the various AEC researchers both resemble and differ from each other. Noora Vikman (2007: 15) suggests that all the different, experiencing persons in the villages hear their physical environment in ways that differ greatly from each other. She has chosen to understand ‘the village in change’ in the following manner: she concentrates on studying how soundscape phenomena are made mean-ingful in relationship to beliefs about changes in culture in general. This is strongly dependent on the context local people themselves create to express their acoustic experiences. This view stresses that studying sounds in detail reveals aspects of the structures and current issues of social life on a larger scale. What is most important is that people’s attitudes construct them as possible agents for active change. She stud-ies actors: for her, as they mould their soundscape, the villagers are simultaneously producers and audience. In her articles she describes both the attitudes of the actors, and the challenges being posed on the locality of Cembra from outside.
Helmi Järviluoma argues that the modes in which people spoke in the six local-ities are ways of telling about how the changes and the past have meaning. Remem-brance brings out the reflective knowledge of the past, and, when that which has passed is contrasted with today, critical reflection follows (Misztal 2003: 10). Fol-lowing Andreas Huyssen she claims that productive remembering can challenge myths of cyber-capitalism and globalisation: the denial of time, place and space (ibid.). Memory extends our choices, because it deals with shared knowledge about the shaping of our own history and culture (Radstone 2000: 13).
One of the important aspects of memory work is that there is always a suspension between the subjective and objective (Radstone 2000: 12; cf. Misztal 2003: 10). It remains the task of memory research to analyse the links between the memories of individuals and groups, between history, culture and society. To Svetlana Boym, nostalgia medi-ates collective and individual memories. The starting point, however, is always in the local and the subjective – the specificity of memory. For instance, as interviewers we do not link our questions about sound with changes in society – the interviewees do it themselves, spontaneously. They were able to make use of their experiences, shared dis-courses and social memories. They speak of the presence of technology and its effects, for example upon the everyday lives of children. When discussing the Germans buying
270 Järviluoma, Uimonen, Vikman & Kytö Acoustic Environments in Change 271
houses in Skruv, they speak of a shrinking world and of globalisation. The secondary housing phenomenon divides opinions amongst the villagers. In the shrinking and quietening village, the sounds of children represent life, continuity and the future.
Transnationality can be heard in all villages studied. In Nauvo, Lesconil, Cembra, and to a lesser extent in Bissingen, tourism has become an important source of income, leading to different ways of developing an ‘experience economy’. Dollar advertises itself as a suitable base for hill trekking and mountain biking.48 Cembra has an influx of migrant workers from abroad, and sometimes the local inhabitants have a hard time coping with their different accents; Bissingen was a home for Kurdish refugees.49 In Lesconil, on the other hand, nothing like this is happening at the moment, and the school children did not express negative attitudes towards foreign languages.
When speaking of change, it is worth keeping in mind that the research group visiting the villages was not the same as in 1975 (except for Albert Mayr in Cembra). Even if it had been, the researchers would most probably have had some completely new approaches in their minds and hands as compared to 25 years earlier. In the preface, Justin Winkler’s apt comment is quoted about the impossibility of replica-tion, saying that we would even had to use Nagra or Uher equipment, which were the two makes of recording machine used by the FVS researchers, in order to do things in the same way. He was on the right track: already during the 10 years’ duration of AEC, we have moved through a range of recording techniques. As recently as 1998 and 1999, during the preliminary visits to the localities studied, we sometimes used Sony Walkman cassette recorders. In 2000, the ‘quality’ recordings were made on DAT, and the handy pocket-sized MiniDisc was used for interviews – even though we knew that it was a problematic machine in terms of the quality of sound.50
Gregg Wagstaff also drew our attention in 2000 to the Dollar Museum’s Millennium Project, in which all the houses in Dollar had been photographed. These pictures were then given future archival significance by putting them into a time-capsule in the at-tic of the Museum. A public debate then arose in the town about what other material should go into the time-capsule, and whether it should be kept shut for 50 or for 100 years. Wagstaff wondered whether Dollar sounds should be put into the capsule as well. But as he says, then we would have to put in a DAT and MiniDisc recorder as well, because in 50 years they will probably have altogether vanished from the globe.51 Probably not even he would have expected that already by 2008 both of these machines are giving way to more sophisticated recording technologies.
What about non-change?
It is also highly relevant to ask how it is possible that some things have not changed. How is it possible that the top sonic preferences amongst schoolchildren have stayed so amazingly similar for 25 years? Top preferences are also similar when compared between the villages. There is no simple answer for this, but as said earlier in this
chapter, even the most remorseless discourse analysts (including ourselves) looking at the joint construction of knowledge admit that people in general talk about important things. It is true that people, both young and old, have increasingly isolated themselves from being exposed to sensory experiences outdoors. For example, farmers work in their fields in their insulated tractor cabins, and children are driven to school by car. In spite of this, it is clear that children and young people still give a high priority to the sounds of nature, and look out for enjoyable natural soundscapes, where they can collect strength and rest. In Bissingen, the sounds of nature are very high on the list of pleasant sounds: if we add the wind, stream, lake, sounds of birds, and the rustling of leaves together the percentage rises to 50 per cent. In Lesconil there are two sound preferences above everything else: the sea and the birds. In 1975, pleasant sounds for children in Dollar were mostly sounds of nature. Twenty five years later, birds had retained their lead position, although the percentage had dropped (from 26 per cent to 14 per cent). In Skruv, the leading two sounds have kept their popularity: music, and birds. Birds were at the top of the list of pleasant sounds both in 1975 and in 2000.
There is also still a lot of silence experienced in the villages. Even in decibels, it is evident that airplane noise has diminished in Bissingen. Often silencing is also sad, as in Skruv, where the quietness means that community businesses have diminished radically. There is also a generational difference at play here. As Vikman has noted, older people tend to think about their future soundscapes through ‘loss’, sounds that vanish, while younger generations look to the future as something produced through the accumulation of different elements of the environment.
Changes in the lived space, tourism, and the commodification of silence
Noora Vikman has identified two major transitional processes that are present both in contemporary European societies in general, and specifically in Cembra: the culturalization of the economy, and the commodification of culture. In Cembra, en-vironmental experiences are being dressed up, staged, in order to be commodified. Indeed, changes in tourism and the commodification of silence is one of most intriguing themes that emerge from our research findings as a relevant question for further studies. Silence has become an increasingly valued element in the environment, even at the bureaucratic level. The EU noise directive (EC 2002) provides, for ex-ample, that member states must reserve silent areas for their citizens. Silence is also one of the trends in commodifying the immaterial in tourism (Vikman 2007; Veijola 2006; cf. Englund 2004; Laitinen 2005).
In spite of the traffic noise, the inhabitants of the AEC villages Cembra, Skruv, Lesconil and Nauvo all described their places of residence as ‘silent’. This was so pervasive as to puzzle the researcher searching for contrasts. In her article about silence in this publication, Vikman analyses the phenomenon from three ear-points:
272 Järviluoma, Uimonen, Vikman & Kytö Acoustic Environments in Change 273
the inhabitants who say they live in a silent village, the tourists searching for si-lence, and the advertisers and promoters who set out to project an image of the silent Trentino valley.
As mentioned above, Cembra, Nauvo and Lesconil can be classified as important tourist targets. In Nauvo, tourism produces a significant 20 million euros yearly income (Hyvärinen 2006). Nauvo is a municipality of summer cottages, and it is well-known that Finns seek peace and quietness from their cottages. What happens, therefore, when the local hotel entrepreneur establishes a water scooter rental business to enter-tain the tourists? How can the silence desired by cottage owners be maintained, when this small municipality has plans for over 600 new cottages in the near future?
Noora Vikman calls the discrepancies between ecological values and action ‘nature–culture’ paradoxes. At the same time they are the dynamic force in local everyday life. Surely it should not remain the task of researchers alone to raise ques-tions about people’s home villages being transformed into marketplaces.
On the other side of the coin, cars were overwhelming the pedestrians in Cembra, Dollar, Bissingen and Lesconil. The squares in the North Italian village of Cembra were filled with cars. In the medieval centre of the village, people would use the car to drive as little as two hundred meters. The concern of the mayor in 2000 about the disappearance of children and their sounds from the plazas was well justified (see Järviluoma 2002). The sounds and voices of children were also vanishing from the outdoor environments in Skruv. In Dollar and Bissingen children were often ‘car seat children’ (Kyttä 2003), and brought to school in cars, which caused so much traffic in the morning that, in a vicious circle, it was in fact dangerous to walk to the school. In Bissingen, the noise in the centre of the village from car engines and tires has increased very significantly.
It seems reasonable to assume that everybody is entitled to a place in the world, in which they can decide what sounds are to be heard. Sonic power and physical space are unevenly distributed in our societies, and this imbalance frequently matches gender (see for example Järviluoma, Moisala & Vilkko 2003) and age demarcations. We consider it important in the future to carefully analyse the spatial practices and sounds heard by young people and children, in order to enhance their multi-sensate dialogue with their own environments. Resisting the roar of traffic provides a way of challenging the hierarchies of authorship of space.
Towards the movement between now and future
It is absolutely clear that even during the past eight years, since the ‘grand tour’ of AEC in spring 2000, the world, the acoustic environments, and people’s relationships with their environments, have all changed radically. People talked to us about rising material prosperity, noticing, like the children’s traffic warden, that increased wealth – brought by for example by the porphyry mines in the village – had also increased
noise. People now had money to buy cars and other machinery. Now, in 2008, when it is no longer possible for anyone to close their ears to the news about climate change, it becomes more plausible that people in Skruv, Bissingen, and Dollar might wipe the dust off their bicycles and start to talk seriously about doing something to reduce pollution; and as a side-effect, this will also change the soundscape.
The quality of life had not increased to the same extent as material prosperity had risen: very noticeably in Skruv, but also in Lesconil and Cembra, middle-aged and elderly people remembered with reflective nostalgia the times when children were ‘free’ – when the traffic was not threatening, and the kids were able to play outside. Their sounds were missed in the plazas of Cembra and the streets, yards and fields of Lesconil and Skruv. This was certainly something people still hoped to hear in the future, wherever they might be living 25 years from now.
This book started by describing the initial planning meeting of the project that later was named ‘Acoustic Environments in Change’. It is also appropriate to finish by quoting from the minutes of the Bissingen 1998 discussion at the Stammtisch in the Gasthaus Adler. Karl has just served us coffee and a sweet apple dessert. As the group starts to ponder possible funding for the project, Helmi comments that she is not very confident about getting EU money – they are so very ‘practical’. Catharina replies: ‘We need concrete means to help local people; this project is close to action, and has do with identity and health issues.’ The idea of ‘action research’ catches the others’ attention: ‘Often findings just mean that we do a book, and nobody is putting the research into action. Would you like to do it? If yes, how far should this go?’ asks Justin. ‘I think the action research thing is a good angle,’ says Murray. It is only now, a decade later, that we are ready to move to the action research phase.52 We have now conducted the project of cultural analysis planned in 1998, and the research group has the foundations on which to construct the strategies for local action to improve sustainable qualities in acoustic environments across Europe.
For us, it is important to understand the tensions between active subjects and the societal structural frames. Environmental scholars and philosophers have argued that if researchers over-stress the structures, globality and relationships between states, the environmental questions become ‘too big for a human being’. In such a model, the possibility of even reflecting on sensible local solutions is lost (Lähde 2005: 152; see also Kinnunen 2006; Ingold 2000). When soundscape is heard only as such a massive, unwanted noise that the local communities and acting subjects cannot in any way affect it, people become indifferent. They don’t even try to act.
Thus, sustainability demands local solutions, as is evident from the arguments of the landscape architectural researcher Joan Nassauer (1997). In the context of manu-factured landscapes, she has discussed her notion of ‘cultural sustainability’, arguing that landscapes that attract human admiration may be more likely to survive than landscapes that do not. This may be achieved through aestheticians working in co-operation with, for example, nature conservationists, architects, ecologists, restorers,
274 Järviluoma, Uimonen, Vikman & Kytö Acoustic Environments in Change 275
builders, and foresters, so that their knowledge remains linked with practical skills (Sepänmaa 1993: 157; see also Saito 2005).53 We have to take into serious consideration the local meanings of soundscapes, both positive and negative. Knowing and becom-ing aware of local interpretations is the first step towards the possibility of sustainable soundscapes. In ‘Acoustic Environments in Change’, we have studied the soundscapes of European villages primarily from the 1970s to the year 2000. We concentrated on the past, the present and the movement between them. Our next point of audition will focus on the movement from present to future. But that will be another story.
Notes
1 Something about the scientific spirit of the 1970s is perhaps reflected in the fact that the more ‘subjective’ sound diaries of researchers from the WSP journey to Europe were made into a separate book, The European Sound Diary (Schafer 1977a).
2 AEC has earlier published the book Soundscapes Studies and Methods (Järviluoma & Wagstaff 2002) exploring the subject of methodology in greater depth.
3 In fact it may be the case that the Finnish research team was in a better position in this sense. Finland has two official national languages, Finnish and Swedish, which has meant that all we have a good knowledge of Swedish. Not only English is taught in the high schools, but also French and German. Italian was perhaps the language that Noora Vikman had to study most while working on her PhD on Cembra. However, we also had invaluable help from native speakers in all countries.
4 The materials from 2000 discussed in this chapter have been collected jointly by the writers and other members of AEC project. In reporting the results of the study here, the division of labour has been as follows: Helmi Järviluoma is responsible for the section on sound preference tests; Heikki Uimonen for writing up the traffic count findings and Noora Vikman has written about listening walks.
5 We do not know how the FVS project presented itself in the schools.
6 This has been aptly described by Detlev Ipsen (2002) among others.
7 During the visit of 2000 this was a bit difficult. The memory of the killing of young children in a school in nearby Dunblane was still very strong in Dollar, and the regulations about visiting schools were extremely restrictive. Perhaps of course this was used as an excuse to avoid spending the precious spring time for this test; Heikki Uimonen on his later visit to Dollar had no problems in visiting the Dollar Academy. One point also to bear in mind, however, is the fact that by then the idea soundscape study had perhaps become at more familiar to some Dollarites.
8 One possible example of this is the rather strange consensus on ‘tinkling coins’ in Dollar in 1975. One can of course speculate whether the spring had just brought along coins into yard games.
9 ”I go for a walk in the garden, and I’ve heard a nightingale singing.”
10 Her story as a whole vividly describes the peace of a Lesconil residential area.
11 That is, 32 per cent of respondents in this particular survey included birds on their list of pleasant sounds. All percentages cited in this chapter refer to the percentage of respondents in the equivalent survey either in 1975 or 2000 in each particular place.
12 In the year 1975 the WSP research group was so impressed by the birds of Lesconil that they published a 30 minute long bird concert on the cassette series on FVS.
13 Oil spots could be seen still on the shores, even though much effort had been put into cleaning the beaches.
14 For example, a child had at first mentioned that the most pleasant sound of the day was the voice of his friend; this had been crossed out and replaced by ‘birdsong’.
15 The new ones on the list of pleasant sounds are not only technological sounds (and silence), but also such natural sounds as ‘nature’, ‘leaves’, ‘water flowing’ etc.
16 Including categories ‘human voices’ and ‘objects and action’, for example sports sounds, human voices (including three mentions of foreign languages), ‘sharpening a pen’ and ‘pages of a book turning’.
17 In general children enjoyed the experiment of writing sound journals; one of them wrote in the middle of the diary: ‘So I was thinking that it’s magnificent to listen to the sounds.’
18 See further in the ‘Lesconil, my home’ in this publication. See also the webpage containing decibel meterings and other field material collated by Julien McOisans and Nicholas Tixier (24h of Lesconil 2000).
19 A difference between the old and new results is the fact that in 1975 the only ‘animals’ mentioned were birds, while in the year 2000 cats, dog and a sheep also enter the list, although as both pleasant and unpleasant sounds. Distant sheep sounds could sometimes be heard in the village from the slopes of the Ochil hills.
20 One interesting inclusion among the unpleasant sounds is running water, mentioned three times; it is not clear however whether the children were thinking of a river or, for example, the running of the bath water.
21 This could be pursued in greater detail if we had more space. Helmi Järviluoma has analysed the materials of the One Hundred Finnish Soundscapes project and noticed that one of the most favoured sounds in the data was the sound of the rain, especially if one is inside, hearing the rain pattering on different roof materials (Järviluoma 2006). Furthermore the building materials might have something to do with the fact that the sound of the rain tapping on roofs is not heard as being as pleasant as it used to be, although according to notes of Heikki Uimonen the building materials had not changed significantly over 25 years.
22 The unimpaired auditory acuity of children up into their teens of has been exploited in England through the use of high-pitched sounding devices, ‘ultrasonic teenage deterrents’, called Mosquitos to drive teenagers away from particular locations (Mosquito 2008). The unpleasant high frequency sounds are heard only by the young. Understandably, there is opposition to their use by many parents and children’s advocacy organizations. At the same time, however, teenagers have turned the device to their advantage, by using it as a mobile ring tone that their parents or teachers are unable to hear (Free Mosquito Ringtones 2008).
23 See Järviluoma 2002 for discussion on Skruv’s factory signals.
24 See the methodological discussion at the beginning of this chapter about the possible reasons for this result.
25 As far as traffic is concerned, whether it is much less unpleasant than 25 years ago depends on how we extrapolate. In 1975 traffic accounted for 26 per cent, in 2000 it was 10 per cent but if references aircraft and train are incorporated under ‘traffic’, it rises to 18 per cent.
26 However, crying, screaming, and burping are mentioned. Mosquitos (the insects) were on the list
276 Järviluoma, Uimonen, Vikman & Kytö Acoustic Environments in Change 277
of unpleasant sounds in 1975, which raises the question of why they are not mentioned 25 years later. Perhaps children simply do not stay outside as much as they used to (see further in ‘Soundscape and social memory in Skruv’ in this collection). Camping has also gone out of fashion.
27 Steven Feld has drawn attention to the relationships between cars, horns and ideas about modernity (discussion in December 2007).
28 However, it is interesting that tractor was mentioned as a pleasant sound three times. Since farming is losing its significance in the village, it is possible that now even the sound of the tractor is moving into the category of nostalgic sounds (see ‘Scythe-driven nostalgia’ in this collection).
29 Repeating a point made earlier, we emphasise that the percentages cannot be assigned too much statistical precision, if the total number from which they are calculated is under 100 mentions. The percentages simply indicate tendencies.
30 Sirens are distinctive to Bissingen and Nauvo, and scarcely mentioned any longer in the other places studied.
31 The castle on the top of the mountain Teck, for example, received a lot of hiker visitors, many of whom either stayed or dined at ‘our’ Gasthouse Adler.
32 School bells were also enjoyed in 2000 (eight per cent). Terms like water, kissing, sirens and silence have disappeared from the list, by contrast with 1975.
33 In 2000 the other motor vehicles were also included in this number. In 1975 other motor vehicles were not mentioned among unpleasant sounds.
34 Listen to the two CD recordings of the WSP 1975 trip to Cembra, for example towards the end of track 1, hear the squeaking doors of the village. Noora Vikman still observed almost nostalgically some very beautiful heavy old-fashioned doors in the old part of Cembra during her most recent visit in April 2008.
35 If we assume that children mix up hens and roosters, this finding may have to do with the same kind of discrepancy of timetables as we have noticed in Finland. Roosters crow considerably earlier than the school children are supposed to wake up. In Finland it is the summer visitors spending holidays in cottages who complain about early morning community signals like factory hooters at 6.30 a.m. (Järviluoma 2006), not the permanent inhabitants, for whom the signal is of utmost importance. It is notable that the range of pleasant animal sounds is very extensive in 2000: apes (presumably heard through the media), wolves, rabbits, goats, cats and dogs.
36 The computer and TV however are mentioned a few times as pleasant sounds.
37 The category ‘water’ here also includes two mentions of rain drops falling on roofs.
38 A term describing recorded, edited and playbacked sounds. Intended to replace the heavily connotated term of schizophonia. (see also Schafer 1977c: 90)
39 The Finnish community design researcher Marketta Kyttä (2003) has launched the term ‘car seat children’ for this phenomenon.
40 Tero Hyvärinen used TES 1352-A for sound level metering.
41 Listen to the first two tracks of accompanying CD number 2. It is important to bear in mind however that the 1975 recording was made over the Easter holidays. The sounds and voices of children were also disappearing from Skruv, to the great concern of its inhabitants.
42 See further regarding the mayor’s sonic concerns in Järviluoma 2002. The densely clustered stone architecture and narrow streets had not been intended to be experienced at 50 kilometres an hour.
43 A relative newcomer combining natural and transphonic sounds is the karaoke from the nearby Railway Tavern, which could also be heard at the site of the traffic count.
44 In general the term soundwalk (Westerkamp 1974) refers to more or less planned walks whereas listening walks refer to listening to the unplanned everyday life as it comes to our ears. (see also ‘Soundscape studies and auditory cognition’ in this publication). Schafer’s definition from 1974 is a guide: ‘A listening walk is simply a walk with a concentration on listening’ whereas ‘a soundwalk is an exploration of the soundscape of a given area using a score as a guide’ and ‘might also contain ear training exercises’. The former requires that ‘privacy for reflection is afforded’. The objective of collecting research material by walking demands systematic planning and conduct of the walks.
46 In 2000 the listening walks in Cembra were realized in 19 April. It was Easter time like in 1975.
47 However, this is possible in another type of a listening walk, ‘sensory/sonic memory walk’, see ‘Lesconil, my home’ in this collection.
48 In fact, Dollar was one of the targets of the first travel book written about Europe by a Chinese scholar, Wang Tao, who lived in the village in early the 1870s, invited by the future Professor of Chinese at Oxford University, James Legge.
49 In Bissingen, the Kurdish refugees were sometimes noticeably breaking the acoustic order. There were some children playing noisily outdoors on the quiet side roads, when a man living nearby came out shouting: Es ist Sonntag, ein Ruhetag! (“It is Sunday, a day for resting!”)
50 As often happens, the interesting recording situations often occur unexpectedly, and then the MiniDisc turns to be worth its weight in gold: everyone had one in their pocket, and many of the situations we can now listen to on the publication’s CDs would never have acquired the form of ‘a material memory’ without MiniDiscs.
51 Here we are dealing with the intriguing question of the externalisation of sound memories. In a way, when we made our DAT and MiniDisc recordings – and in this project we did indeed make a lot of them – we are already externalising memories. Fentress and Wickham, who have examined social memory, have pointed out that we may be quietly conferring on our subject a ‘thing-like character in the enthusiasm to collect ‘memory’, and to assemble archives of oral testimony’ (1992: 64; cf. Howes 2003: 5–6; Feld 1994: 282). On the other hand, externalised memories can also support social memories, since, for example, writings circulate amongst the villagers and support oral traditions.
52 The project ‘Soundscapes and Cultural Sustainability’, funded by the Academy of Finland, will start in 2009.
53 Compare De Caro 2008 on R. Murray Schafer’s the idea of connections between the Bauhaus and acoustic design.
References
Unpublished
AEC archive at Tampere University, Archive of Folk Tradition. – Sound preference tests – Traffic counts – Listening walks – Decibel meterings
278 Järviluoma, Uimonen, Vikman & Kytö Acoustic Environments in Change 279
Feld, Steven (2001) Discussion between Feld and Järviluoma in (December 2007).Hyvärinen, Tero (2006) Estetiikka, tiedonmuodostus ja Nauvon äänimaisema (‘Aesthetics, formation of knowledge, and Nauvo soundscape’), unpublished licentiate thesis, University of Joensuu, Department of Finnish Language and Cultural Research.Wagstaff, Gregg (2000) E-mail to the AEC group (July 5, 2000).
Literature
24h of Lesconil (2000). Soundscape recordings, meterings and panoramic images of Lesconil. Online. Available HTTP: <http://www.cresson.archi.fr/elements/LesconiLhtm/Lesco24h.htm> (accessed 21 October 2008).Alasuutari, Pertti (1992) “I’m Ashamed to Admit but I have Watched Dallas’; The Moral Hierarchy of TV Programmes’, Media, Culture & Society, 14/1992: 561–82.Archer, Margaret (1996) Culture and Agency, Cambridge: Cambridge University Press.Augoyard, Jean-Francois (1998) ‘The Cricket Effect. Which Tools for the Research on Sonic Urban Ambiences’, in H. Karlsson (ed.) Papers presented at the conference ‘Stockholm, Hey Listen!’ June 9–13, 1998, Stockholm: The Royal Swedish Academy of Music, 1–7. Cusick, Suzanne (1994) ‘Feminist theory, music theory, and the mind/body problem’, Perspectives on New Music, 32(1): 8–27.De Caro, Laura (2008) ‘Meetings with R. Murray Schafer: Composer, educator and founder of Soundscape Studies interviewed’, Soundscape – The Journal of Acoustic Ecology, Vol 8, Winter 2008.DeWalt, Billie R. & Pelto, Pertti J. (1985) ‘Microlevel/Macrolevel Linkages. An Introduction to the Issues and a Framework for Analysis’, in B. DeWalt & P. Pelto (eds) Micro and Macro Levels of Analysis in Anthropology. Issues in Theory and Research, Boulder and London: Westview Press, 1–21.EC (2002) The Directive on Environmental Noise 2002/49/EC. Online. Available HTTP: <http://eur-lex.europa.eu/LexUriServ/LexUriServ.do?uri=CELEX:32002L0 049:EN:HTML> (accessed 9 August 2008).Elias, Norbert (1978) Civilizing Process: The History of Manners, Oxford: Blackwell. Englund, Peter (2004) Hiljaisuuden historia (‘The history of silence’), Helsinki: WSOY.Feld, Steven (1994) “From Schizophonia to Schismogenesis: on the discourses and commodification practices of ‘world music’ and ‘world beat”, in S. Feld & C. Keil (eds) Music Grooves: essays and dialogues, Chicago: University of Chicago Press, 257–89.Feld, Steven (1996) ‘Waterfalls of Song. An Acoustemology of Place in Resounding in Bosawi, Papua New Guinea’, in S. Feld & K. Basso (eds) Senses of Place, Santa Fe: School of American Reseach Press, 91–135.
Feld, Steven & Brenneis, Donald (2004) ‘Doing Anthropology in Sound. Steven Feld in conversation with Don Brenneis, Santa Fe, New Mexico, December 17, 2003’, American Ethnologist, 31 (4): 461–74. Fentress, James & Wickham, Chris (1992) Social Memory, Oxford: Blackwell.Feyerabend, Paul (1993) Against Method, London: Verso.Free Mosquito Ringtones (2008) The ultrasonic ringtone that adults can’t hear. Online. Available HTTP: <http://www.freemosquitoringtones.org> (accessed 21 October 2008).Hall, Stuart (1992) Kulttuurin ja politiikan murroksia, J. Koivisto, M. Lehtonen, T. Uusitupa & L. Grossberg (eds), Tampere: Vastapaino.Horelli, Liisa (2002) ‘A Methodology of Participatory Planning’, in R. Bechtel & A. Churchman (eds) Handbook of Environmental Psychology, New York: John Wiley & Sons.Howes, David (2003) Sensual relations : engaging the senses in culture and social theory, Ann Arbor: University of Michigan Press. Ingold, Tim (2000) The Perception of the Environment. Essays on livelihood, dwelling and skill, London and New York: Routledge. Ingold, Tim (2002) ‘Introduction to Culture’, in T. Ingold (ed.) Companion Encyclopedia of Anthropology, London: Routledge, 329–49.Ipsen, Detlev (2002) ‘The urban nightingale – or some theoretical considerations about sound and noise’, in H. Järviluoma & G. Wagstaff (eds) Soundscape studies and methods, Helsinki: Finnish Society for Ethnomusicology.Järviluoma, Helmi (2002) ‘Memory and Acoustic Environments’, in E. Waterman Ellen (ed.) Sonic Geography Imagined and Remembered, Toronto: Penumbra Press.Järviluoma Helmi (2003) ‘Äänimaisematutkimus’ (Soundscape Studies), in Eerola, T. & al (ed.) Johdatus musiikintutkimukseen (Introduction to music research), Helsinki: Finnish Society for Musicology.Järviluoma, Helmi (2005) ‘Äänimuistojen lähteillä Euroopan kylissä eli traktorin estetiikasta ja etiikasta’ (Tracing sonic memories in European villages or the aesthetics and ethics of tractors), in Y. Sepänmaa & L. Heikkilä-Palo (eds) Pellossa perihopeat, Helsinki: Maahenki, 124–31.Järviluoma, Helmi (2006) ‘One Hundred Finnish Soundscapes – Exploring the Feelings of Safety, Soundscape and Lived Space in Sonic memories’, in T. Imada, K. Hiramatsu & K. Torigoe (eds) The West meets the East in Acoustic Ecology, Hirosaki: Hirosaki University, 70–82.Järviluoma, Helmi, Pirkko Moisala & Anni Vilkko (2003) Gender and Qualitative Methods, London: Sage.Järviluoma, Helmi & Wagstaff, Gregg (eds) (2002) Soundscape studies and methods, Helsinki: Finnish Society for Ethnomusicology.Kinnunen, Merja (2006) ‘Numerot, talous ja yhteiskunta’ (‘Numbers, economy and society’), in J. Herkman et al. (eds) Tutkimusten maailma. Suomalaista
280 Järviluoma, Uimonen, Vikman & Kytö Acoustic Environments in Change 281
kulttuurintutkimusta kartoittamassa, Jyväskylä: University of Jyväskylä, 44–57.Kyttä, Marketta (2003) Children in outdoor contexts: affordances and independent mobility in the assessment of environmental child friendliness, Espoo: Helsinki University of Technology, Centre for Urban and Regional Studies, A28.Laitinen, Maria (2005) ‘Tuotetun luonnonhiljaisuuden kulttuuriset merkitykset. Hiljaisuuden huone ja Air-taideteos tarkastelun kohteena’, Alue ja ympäristö (‘Region and Environment’) 34 (2): 58–67.Linderborg, Åsa (2008) Minua ei omista kukaan (‘Nobody owns me’), Helsinki: Like.Lähde, Ville (2005) ‘Ympäristökysymyksen globaali politiikka’ (‘Global politics of the environmental question’), Futura, 150–4.Mayr, Albert (2002) ‘Soundscapes in Cembra 1975–2000’, in Un mondo negoziato, un mondo guadagnato. Antropologia, storia locale e storia nelle Alpi, San Michele: SM Annali di San Michele 15. Rivista Annuale del Museo degli Usi e Costumi della Gente Trentina.Misztal, Barbara A. (2003) Theories of Social Remembering, Maidenhead, PA: Open University Press.Mosquito (2008) Ultra-sonic youth crowd deterrent dispersal system. Online. Available HTTP: <http://www.mosquito-ni.com> (accessed 21 October 2008).Nassauer, Joan (1997) ‘Cultural Sustainability: Aligning Aesthetics and Ecology’, in J. Nassauer (ed.) Placing Nature: Culture and Landscape Ecology, Washington, DC: Island Press.Oakley, Ann (2000) Experiments in knowing: gender and method in the social sciences, Cambridge, Polity.Radstone, Susannah (ed.) (2000) Memory and Methodology, Oxford & New York: Berg.Saaristo, Kimmo & Jokinen, Kimmo (2004) Sosiologia, Helsinki: WSOY.Saito, Yuriko (2005) ‘Environmental Aesthetics: Promises and Challenges’, in S. Knuuttila, E. Sevänen & R. Turunen (eds) Aesthetic culture. Essays in honour of Yrjö Sepänmaa on his sixtieth birthday, Helsinki: Maahenki.Schafer, R. Murray (ed.) (1977a) European Sound Diary, Vancover: A. R. C. Publications.Schafer R. Murray (ed.) (1977b) Five Village Soundscapes, The Music of the Environment Series, Vancouver: A.R.C. Publications. Schafer R. Murray (1977c) The Tuning of the World, Toronto: McCelland and Stewart Limited. Seidler, Vic (2003) ‘Diasporic sounds: Dis/Located Sounds’, in M. Bull & L. Back (eds) Auditory Culture Reader, Oxford: Berg, 397–407. Sepänmaa, Yrjö (1993) The Beauty of Environment: A General Model for Environmental Aesthetics, Denton: Environmental Ethics Books.Silverman, David (2000) Interpreting Qualitative Data, London: Sage.Uimonen, Heikki (2005) Ääntä kohti (‘Towards the sound’), Acta Universitatis Tamperensis 1110, Tampere: University of Tampere.
Vikman, Noora (2007) Eletty ääniympäristö. Pohjoisitalialaisen Cembran kylän kuulokulmat muutoksessa (‘The Lived Acoustic Environment: Cembra’s Changing Points of Ear’), Acta Universitatis Tamperensis 1271, Tampere, University of Tampere.Veijola, Soile (ed.) (2006) Hiljaisuuden tuotteistaminen Lapin matkailussa (‘Commodification of silence in Lapland tourism’), Rovaniemi: Lapland Centre of Expertise for the Experience Industry.Westerkamp, Hildegard (1974) ‘Soundwalking’, Sound Heritage, 3 (4): 18.