Sound Index: Music Charts By The People, For The People
7
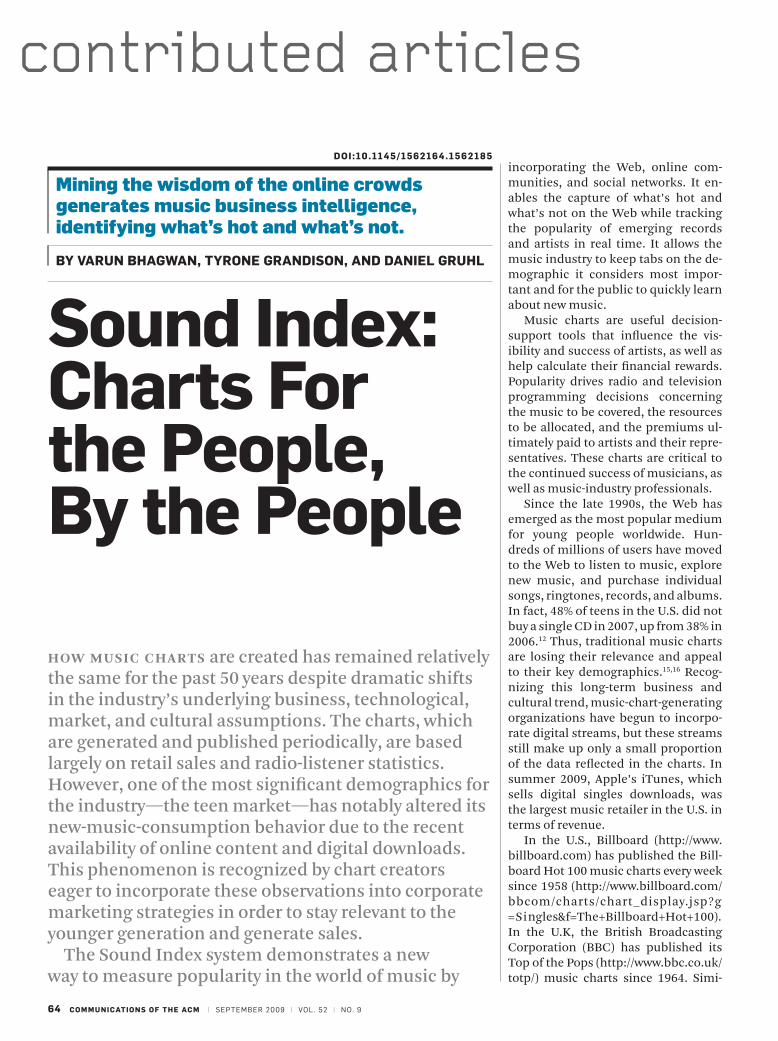
64 COMMUNICATIONS OF THE ACM | SEPTEMBER 2009 | VOL. 52 | NO. 9 contributed articles DOI:10.1145/1562164.1562185 Mining the wisdom of the online crowds generates music business intelligence, identifying what’s hot and what’s not. BY VARUN BHAGWAN, TYRONE GRANDISON, AND DANIEL GRUHL incorporating the Web, online com- munities, and social networks. It en- ables the capture of what’s hot and what’s not on the Web while tracking the popularity of emerging records and artists in real time. It allows the music industry to keep tabs on the de- mographic it considers most impor- tant and for the public to quickly learn about new music. Music charts are useful decision- support tools that influence the vis- ibility and success of artists, as well as help calculate their financial rewards. Popularity drives radio and television programming decisions concerning the music to be covered, the resources to be allocated, and the premiums ul- timately paid to artists and their repre- sentatives. These charts are critical to the continued success of musicians, as well as music-industry professionals. Since the late 1990s, the Web has emerged as the most popular medium for young people worldwide. Hun- dreds of millions of users have moved to the Web to listen to music, explore new music, and purchase individual songs, ringtones, records, and albums. In fact, 48% of teens in the U.S. did not buy a single CD in 2007, up from 38% in 2006. 12 Thus, traditional music charts are losing their relevance and appeal to their key demographics. 15,16 Recog- nizing this long-term business and cultural trend, music-chart-generating organizations have begun to incorpo- rate digital streams, but these streams still make up only a small proportion of the data reflected in the charts. In summer 2009, Apple’s iTunes, which sells digital singles downloads, was the largest music retailer in the U.S. in terms of revenue. In the U.S., Billboard (http://www. billboard.com) has published the Bill- board Hot 100 music charts every week since 1958 (http://www.billboard.com/ bbcom/charts/chart_display.jsp?g =Singles&f=The+Billboard+Hot+100). In the U.K, the British Broadcasting Corporation (BBC) has published its Top of the Pops (http://www.bbc.co.uk/ totp/) music charts since 1964. Simi- HOW MUSIC CHARTS are created has remained relatively the same for the past 50 years despite dramatic shifts in the industry’s underlying business, technological, market, and cultural assumptions. The charts, which are generated and published periodically, are based largely on retail sales and radio-listener statistics. However, one of the most significant demographics for the industry—the teen market—has notably altered its new-music-consumption behavior due to the recent availability of online content and digital downloads. This phenomenon is recognized by chart creators eager to incorporate these observations into corporate marketing strategies in order to stay relevant to the younger generation and generate sales. The Sound Index system demonstrates a new way to measure popularity in the world of music by Sound Index: Charts For the People, By the People
-
Upload
healthmetricsandevaluation -
Category
Documents
-
view
1 -
download
0
Transcript of Sound Index: Music Charts By The People, For The People
64 commuNicaTioNS of The acm | SePteMber 2009 | voL. 52 | No. 9
contributed articlesDoi:10.1145/1562164.1562185
Mining the wisdom of the online crowds generates music business intelligence, identifying what’s hot and what’s not.
BY VaRuN BhaGWaN, TYRoNe GRaNDiSoN, aND DaNieL GRuhL
incorporating the Web, online com-munities, and social networks. It en-ables the capture of what’s hot and what’s not on the Web while tracking the popularity of emerging records and artists in real time. It allows the music industry to keep tabs on the de-mographic it considers most impor-tant and for the public to quickly learn about new music.
Music charts are useful decision-support tools that influence the vis-ibility and success of artists, as well as help calculate their financial rewards. Popularity drives radio and television programming decisions concerning the music to be covered, the resources to be allocated, and the premiums ul-timately paid to artists and their repre-sentatives. These charts are critical to the continued success of musicians, as well as music-industry professionals.
Since the late 1990s, the Web has emerged as the most popular medium for young people worldwide. Hun-dreds of millions of users have moved to the Web to listen to music, explore new music, and purchase individual songs, ringtones, records, and albums. In fact, 48% of teens in the U.S. did not buy a single CD in 2007, up from 38% in 2006.12 Thus, traditional music charts are losing their relevance and appeal to their key demographics.15,16 Recog-nizing this long-term business and cultural trend, music-chart-generating organizations have begun to incorpo-rate digital streams, but these streams still make up only a small proportion of the data reflected in the charts. In summer 2009, Apple’s iTunes, which sells digital singles downloads, was the largest music retailer in the U.S. in terms of revenue.
In the U.S., Billboard (http://www.billboard.com) has published the Bill-board Hot 100 music charts every week since 1958 (http://www.billboard.com/bbcom/charts/chart_display.jsp?g=Singles&f=The+Billboard+Hot+100). In the U.K, the British Broadcasting Corporation (BBC) has published its Top of the Pops (http://www.bbc.co.uk/totp/) music charts since 1964. Simi-
How MUsiC CHarts are created has remained relatively the same for the past 50 years despite dramatic shifts in the industry’s underlying business, technological, market, and cultural assumptions. The charts, which are generated and published periodically, are based largely on retail sales and radio-listener statistics. However, one of the most significant demographics for the industry—the teen market—has notably altered its new-music-consumption behavior due to the recent availability of online content and digital downloads. This phenomenon is recognized by chart creators eager to incorporate these observations into corporate marketing strategies in order to stay relevant to the younger generation and generate sales.
The Sound Index system demonstrates a new way to measure popularity in the world of music by
Sound index: charts for the People, By the People

SePteMber 2009 | voL. 52 | No. 9 | commuNicaTioNS of The acm 65
lar charts are published in many other countries. As an examplar, and without loss of generality, we detail here how Billboard generates its charts, high-lighting the reasons for their diminish-ing relevance.
Traditional charts. Billboard captures data from multiple sources to pro-duce a composite ranking of individ-ual songs, aka singles. Its two primary sources are Nielsen Soundscan (http://www.soundscan.com/) and Broadcast Data Systems (http://www.bdsonline.com/). Soundscan tracks sales data in real time across the U.S. and Cana-da. Because not all retail stores have Soundscan-enabled cash registers, the data retrieved from these systems represents only a limited set of total sales. However, even this limited set is an improvement over the previous mechanism used by Billboard—mak-
ing thousands of individual telephone calls to stores across the U.S. to ask about sales.
Broadcast Data Systems collects Billboard radio-listener statistics gath-ered from companies contracted by Billboard to contribute to the chart of radio airplay. Thus, not all radio air-plays are captured. Once the data is captured from Soundscan and Broad-cast Data Systems, it is weighted by Ar-bitron statistics (http://www.arbitron.com/) and compiled by asking a ran-dom sample of the key demographic to maintain a written diary describ-ing each radio program listened to between the hours of 6 a.m. and mid-night over a period of a few months as set by Arbitron. Each diary is returned to Arbitron by postal mail; Arbitron publishes a complete set of its statis-tics four times per year.
In the past few years, Billboard has moved to incorporate data from digital downloads and the like, but it still con-stitutes only a small percentage (about 5%) of the chart’s total points.10
Concerns. The music industry’s de-sire to promote and sell new music and remove long-running singles from charts has led to the fact that the older singles that consumers are still inter-ested in are completely ignored in the charts. Music charts also lack a clear way to handle the rerelease of singles and gauge interest in music that gains popularity over a long period through word of mouth. Another issue with the historic chart-generation process is that there is no measure for the lead-up to the release of albums or singles. Though consumers may discuss an upcoming album release for days, the charts do not reflect this conversation.
aRT TK
IL
LU
sT
RA
TI
on
By
sT
UD
Io
To
nn
E

66 commuNicaTioNS of The acm | SePteMber 2009 | voL. 52 | No. 9
contributed articles
forms the data into a standard schema. The now-structured content is then stored in the system’s database. Final-ly, the system generates music charts by applying relevant ordering schemes.
Ingestion. In an ideal world, social networking data, comments, and click streams would all have a common format that sites publish, facilitating easy download and integration of in-formation. However, most sites lack functional application programming interfaces (APIs). As a result, screen scrapinga is the rule for data ingestion,2
problematic because screen scrapers are susceptible to (even fairly minor) changes in Web sites. Unfortunately, these changes are common, as sites strive to stay fashionable in an ever-changing cultural and business envi-ronment.
Screen scrapers also require a fair amount of monitoring and mainte-nance. They need to log into sites and download necessary content (such as comments and view counts), trans-forming it into a simple format, nor-mally just a collection of running text comments broken out (with markup removed) for further processing.
Some sites provide really simple syndication-typeb feeds that are espe-cially useful for ingesting aggregated data (such as total listens for a particu-lar song). Sound Index uses a combina-tion of screen scrapers, RSS feeds, and APIs to ingest content based on the quality and reliability of each ingestion method for a given site.
Providing a reliable stream of data, even from sites that are flaky and un-trustworthy, is critical to Sound Index success. As such we have developed a suite of tools and techniques to deal with common error conditions and quickly identify exotic ones and bring them to the operator’s attention. In ad-dition to the sanity-checking of values, the system monitors a number of bulk statistics on the streams themselves at each step in the processing. This monitoring allows the system to detect when, say, the quantity of documents entering the database from MySpace
a Screen scraping extracts data from machine- and display-friendly code.
b RSS is a family of Web-feed formats used to publish frequently updated works (such as blog entries, news headlines, audio, and video) in a standard format.
As a result, the all-time Billboard record for single-week upward movement has been broken five times since 2006.
Meanwhile, the possibility of a new payola scandal continues to haunt radio stations and record-company executives. This illegal marketing phenomenon involves record labels paying radio stations and/or disc jock-eys broadcasting, and more recently streaming, records as part of a normal day’s broadcast. U.S. federal law made the practice illegal in 1934, yet as of summer 2009, major record labels, in-cluding Clearchannel, CBS Radio, EMI, Sony BMG, Universal Music, and War-ner Music, have come under federal investigation and in some cases had to pay tens of millions of dollars in fines and settlements. As radio airplay is a major component of the music charts and perceived popularity, these inves-tigations in turn raise concerns about the validity of the traditional music charts themselves.
In order to address these issues and incorporate today’s increasingly popu-lar platform for music consumption, the Web, the music-charts industry must keep evolving or be left behind.
Solution The Sound Index system catalogs the hottest artists and tracks being talked about on the Web. Incorporating “lis-tens,” plays, downloads, sales, and comments from a multitude of online communities and social networks, it provides a current view of popular mu-sic content online; the associated fil-tering enables customized views of the data to learn about, say, new tracks in a particular genre of interest.
The system can be divided into four distinct parts (see Figure 1), leveraging technology called MONitoring Global Online Opinions via Semantic Extrac-tion, or MONGOOSE (http://www.al-maden.ibm.com/cs/projects/iis/mon-goose/). The first, ingestion, is the act of gathering relevant unstructured and structured content from various Web sites (such as Bebo, Google Groups, iTunes, LastFM, MySpace, and You-Tube). These sources were chosen because the BBC’s review team of mu-sic-domain experts identified them as relevant and important to identifying the tastes of its target demographic—teens. The system analyzes and trans-
Sound index relies on broken-english-text analytics technology, techniques for integrating information from different modalities, and ranking technologies.

contributed articles
SePteMber 2009 | voL. 52 | No. 9 | commuNicaTioNS of The acm 67
is, say, half of what it was yesterday. The system then spot-checks the crawler statistics; if it sees the number of docu-ments fetched per hour has decreased, some kind of format change is likely preventing the low-level parsers from correctly splitting the comments out of the discussion pages. While these bulk statistics don’t tell the operator or Sound Index itself why something is not working, they are quite effective at helping reveal when something is not working.
Sound Index automates simple cor-rective actions, including killing and restarting fetchers and flushing do-main name system cachesc to correctly identify changes in, say, the targeted servers being crawled. Developing and automating these solutions is criti-cal, as they reduce the need for early-morning service calls to system admin-istrators. Sound Index uses Nagiosd to monitor all aspects of the system’s per-formance, raising flags over problems (such as no data in the ingest feed and database-connection errors). Alba et al.2 detailed additional challenges af-fecting Sound Index data access.
Processing. All acquired data must be “cleaned” before it undergoes pro-cessing and analysis. For example, the cleaning of structured data gen-erally consists of a few sanity checks. For numeric data (such as total video views), which is expected to constantly increase, the system checks whether fewer total mentions were made today compared to yesterday. If they were, the implication is a negative number of views and something clearly in error.
Sound Index might report that there were zero views during this period rath-er than a clearly broken number for upstream processing, a scenario that is surprisingly frequent in the music domain. Also, some sources perform corrections that result in big jumps in structured numbers. As Sound Index re-ports data every six hours (some source numbers are updated every week), the system’s developers incorporated tech-niques for smoothing these numbers.
A major challenge in developing the
c DNS is the hierarchical naming system for Internet resources; its caches help route, re-solve, and link domains to IP addresses.
d Nagios (http://www.nagios.org/) is open source network-monitoring software.
appear with some frequency. A good example is the comment “U R 50 Bad.” Parsing it is a complex, multi-step pro-cess. First, common variants must be rewritten into their more common Eng-lish equivalents; for example, numbers as substitutions for letters must be re-versed and texting abbreviations ex-panded. This technique results in “You are so bad” as the comment. The next step employs a feed of common slang expressions from sources like Urban Dictionary (http://www.urbandiction-ary.com/) to rewrite slang. This gets the system to “You are very good.”
Sound Index must also identify am-biguous references. To do so it looks at all possible artists for “You.” If it ap-pears on a fan page for, say, Amy Wine-house, the system would conclude that she is the artist most likely being men-tioned. The final parsed comment be-comes “Amy Winehouse is very good,” a specific mention of an artist with a positive sentiment.
The system then examines the de-mographic data for the poster (if avail-able), perhaps determining that the poster is a 17-year-old female in the U.K. This data is tallied as a single men-tion, positive, for Amy Winehouse, by a user with said demographics. Each such data point serves as a dimension for aggregation in a subsequent step.
Resolving entity ambiguity is a ma-
system was figuring out how to elimi-nate “spam” from comment streams. Popular artists draw many visitors, a fact advertisers are quick to capitalize on. Up to 50% of a popular artist’s com-ments are what could be considered spam (ranging from the blatant “Check out my page <URL>” to the relatively subtle “If you like this artist you will love <URL>” to the simply off topic “I like ducks!”). As they are not music-re-lated expressions, Sound Index needs to be able to remove them from the tally; otherwise they could easily domi-nate (and distort) the results.
The Sound-Index topic-detection methodology accounts for whether a post is on- or off-topic, with the latter consisting of spam or nonsense posts. Employing a combination of template spotting for extremely common spam phrases and a domain dictionary, it identifies the presence or absence of music-related terminology. This ap-proach provides reasonable spam identification, down to where it has vir-tually no effect on relative counts. For on-topic posts, Sound Index extracts the relevant noun phrases, as well as the associated sentiment.
The issue of how to identify and re-move spam is even more challenging due to unstructured data. Especially in the music domain, slang and nontypi-cal spellings and linguistic constructs
figure 1. Sound index data flow.
transliteration
Spam Filter
Profanity Filter
Sentiment
…
Craw
lers
Sound Index
System data Flow
Source
Source
Source
…
database
Data ingestFetch data from Web sites, boards, blogs.
annotatorsProcess incoming content and add annotations.
Join and uploadPerform joins on the data and prepare for upload.
front-enddata presented based on the preferences of target demographics.

68 commuNicaTioNS of The acm | SePteMber 2009 | voL. 52 | No. 9
contributed articles
Data fusion for user interface genera-tion. All data that is cleaned and assem-bled (into a DB2 database) must still be coalesced to create a chart, a process that is difficult in practice, as well as in theory. How does one combine men-tions of an artist on a discussion board with listens from an online radio ser-vice and views of a parody of the artist’s recent video? The various methods for creating such combinations can all be viewed as a kind of “voting” of the results of different modalities and are thus amenable to examination via vot-ing theory. To do so, the system must first enumerate the desiderata of the data-combination system. In discus-sion with subject-matter experts we developed several criteria for combin-ing music-popularity data:
Artists or tracks with broad sup- ˲
port across the sources should do well in the ranking, reflecting “the wisdom of the crowds”;
Artists high on one source for a ˲
day and not on other sources should not be allowed to dominate the chart.
jor challenge in chart creation. Many song titles (such as those beginning with “The”) are difficult to spot without undergoing at least shallow parsing, a task complicated by the nontypical grammatical structures often seen in the music domain. Sound Index uses a combination of context clues, domain knowledge, and poster/venue history to track “activation” of concept nodes in a domain ontology, using these acti-vation levels to resolve the ambiguities to the greatest extent possible. This is an area of continuing research, as cur-rent implementations are simple and error-prone with more difficult resolu-tions, especially in cases where a band is implied by a band member with an interesting nickname (such as “The Edge” implies “U2”).
Ultimately, Sound Index converts each data element into a row of demo-graphic data about the poster, as well as the unique ID of any track, album, or artist mentioned, along with a notion of whether the comment is positive or negative.
This is a response to the common phenomenon whereby a group or-ganizes a “flash mob” to post on the same day, usually in support of a new album to drive the band up the charts of a particular site. This anti-flooding criterion involves gaming resistance, enabling the system to handle users trying to influence or skew the charts in a particular direction;
All sources must contribute to the ˲
final chart with no single source al-lowed to dominate. Thus, the dispar-ity between counts (particularly due to differences in population size) of, say, iTunes sales and YouTube views must be reconciled; and
The final results must be amena- ˲
ble to subsetting or customizable user-driven filtering; therefore, subcharts highlighting specific genera or demo-graphics must be constructable, mak-ing it possible to produce personalized music charts.
Voting theory provides two broad classes of ways to combine these re-sults. First is to tally the votes, per-haps through weighting; the artist or track with the most votes (plurality) is at the top of the charts. Naively count-ing votes is problematic, as various sources provide very different num-bers; for example, sales numbers are usually much lower than views. And determining the relative importance of various modalities (such as purchases, listens, views, and posts) is subjective. Approaches like normalizing sources so their top selection is number one and weighting and combining might be the best that can be done through this approach. As long as the weights are constantly considered for changes in source popularity and the “pulsed” nature of errors in some sources is ac-ceptable, the normalization approach reflects the important advantage of be-ing fairly transparent. As any chart is subject to scrutiny, transparency may thus be worth the high manual cost of tracking and tuning weights.
Second is merging ranked lists, whereby each source creates a ranked list of its top-n choices. These lists are then combined without consideration of the “votes” assigned to them. For ex-ample, in Borda Counts,4 each #1 vote is worth n points, #2 is worth n minus 1 points, and so on. However, it suffers when n is very large and the number
figure 2. Screenshot of the Sound index interface from the BBc Sound index Web site (may 7, 2008).

contributed articles
SePteMber 2009 | voL. 52 | No. 9 | commuNicaTioNS of The acm 69
of voters is small, the reverse of typi-cal elections but historically the case for music charts. In this approach, as n gets larger, the difference in effect between n and n minus 1 becomes rela-tively small. For this list, we found that the Nauru voting method3 (first place gets 1 point, second place 1/2 point, third place 1/3 point, and so on) is bet-ter at highlighting top picks. However, it is somewhat aggressive in that items ranking high on one list might also tend to dominate the overall chart. We thus introduced a variant, p, to give the system more control over this poten-tially skewed result. The score of an art-ist or track at position n thus becomes
score(n) = 1
p√n
As p varies up, that is, the system re-views entries lower on the list (such as songs at position 499 and 789) and the need for broad support becomes more pronounced. Empirical evidence sug-gests p ~ 2.5 is a good place to start.
These methods for combining data from multiple, music-related sources can be applied to full sets of data; alter-natively, the initial data can be subset-ted (such as to create a list of only, say, rap and hip-hop tracks) then “voted” on to create custom lists.
To evaluate this approach to com-bining list data, we applied, on the basis of the criteria set by the subject-matter experts, two social welfare functions:e precision optimal aggre-gation1 and Spearman Footrule dis-tance.5 The former measures the num-ber of artists from each source’s top-n list that made it to the overall top-n list; the latter emphasizes the preservation of an artist’s position in the ranking. We compared the performance of eight different methods, with performance defined as the efficacy of a given meth-od in maximizing the two SWFs. For a detailed study of the comparison, see A. Alba. et al.3
challenges Sound Index is the first industrial-strength implementation of the com-plex idea of combining “dirty” mul-
e SWFs map allocations of goods and rights among people to real numbers, enabling the modeling of subjectiveness and the capture of business goals in a semiheuristic way.
the value of traditional information integration and aggregation tech-niques,17 whereby systems compare and contrast items with identical modalities (such as sales numbers from multiple sources). Sound In-dex demonstrates how to integrate information from multiple different modalities (such as comments, pas-sive listens, sales, hits on Web sites, creation of new Web sites, and views on television), a solution required in many domains, including medical-patient preferences, drugs for certain medical conditions, cars, wine, finan-cial products like stocks and bonds, consumer goods, cameras, computers, and books.
Nielsen’s BuzzMetrics (http://www.nielsenbuzzmetrics.com/products) aims for a similar goal, at least at the abstract level. Its technology monitors and analyzes consumer-generated me-dia (such as blogs, message boards, fo-rums, Usenet newsgroups, discussions involving email portals like Yahoo!, AOL, and MSN, opinion and review sites, and feedback and complaint sites), then analyzes, customizes, and presents the data to marketers and business-intelligence professionals, depending on client requirements. However, as of summer 2009, no pub-licly available technical informa-tion is available on BuzzMetrics. We speculate that its technology relies on natural-language and sentiment pro-cessing, whereas Sound Index relies on broken-English-text analytics tech-nology, techniques for integrating in-formation from different modalities, and ranking technologies.
Alexa Internet (http://www.alexa.com/site/company/technology) is an-other technology that crawls Web sites to produce a ranked list of sites based on traffic statistics and incoming links. It aims to generate an ordered list of the sites with the greatest volume of (incoming) traffic normally filtered by geography or other criteria, an ap-proach that differs from the one used in Sound Index to combine data from multiple modalities into a balanced ordered list.
The effort over the past decade to address these challenges8,9 represents approaches to extracting and disam-biguating entities within unstructured text. Sound Index faces similar chal-
timodal data, (see Figure 2), using unstructured information manage-ment architecture (UIMA)f, 6 and data mining7 to solve a targeted business problem. Here, we focus on two related research challenges:
Noise effects vs. freshness. Tension between the desire for frequent up-dates reflects the cutting edge of what is hot and the desire to minimize the influence of noise in the charts due to short-term spikes. Sound Index weighs effects (such as weekends, nights, and holidays) against events (such as new album releases, celebrity gossip cov-erage, and award shows). The system must ultimately compromise between being too sensitive and not reactive enough; optimizing this balance is an area for future research. For now, Sound Index employs a 24-hour win-dow (four-to-six-hour cycle periods) to smooth out some of the effects men-tioned earlier. The development team is also exploring other approaches (such as multi-month decays). Ulti-mately, the system needs a ranking scheme that is at least somewhat re-sistant to “noise” while still being able to capture freshness so, for example, it is able to identify a rise in interest in diverse sources and ignore sudden spikes in a single source.
User interface. Still unclear is the op-timal way to present what is essentially an online analytical processingg cube to end users over the Web for mining business intelligence, especially when the target audience is teens. Exploring the right way to present trending and selection is key to allowing consumers of Sound Index to get the most from the system, but doing so in a way that is obvious and intuitive is a challenge. Sound Index does offer a limited set of dimensionality tools around demo-graphics and genres, allowing users to see charts reflecting the interests of, say, “40-something female electronica fans in the U.S.”14
Related Work A wealth of research focuses on busi-ness intelligence mining, showcasing
f UIMA is a component software architecture that helps develop, discover, compose, and deploy multimodal analytics for unstructured information.
g OLAP is an approach to answering multidi-mensional analytical queries.

70 commuNicaTioNS of The acm | SePteMber 2009 | voL. 52 | No. 9
contributed articles
lenges, with disambiguation being re-quired at the artist, band, track, and album levels.
Determining the entity being re-ferred to in a particular text is akin to a classification problem, whereby con-tent (“comment” in our case) must be assigned to a specific bucket, or cat-egory (artist, band, and/or track). Ellen Riloff13 highlighted domain-cognizant techniques for text classification; re-flecting the need to focus on local lin-guistic context for classification and retrieval.
In terms of engineering, the world of mashups mirrors the music data re-quirements of Sound Index—a robust, reliable, repeatable means of gather-ing data from multiple, diverse on-line sources. ScrAPIs (Screen-scraper + API) were proposed by John Musser in 2006 as a means of mitigating the problem of unreliable or unavailable APIs from multiple content provid-ers,11 though they, too, suffer from the issues facing traditional screen-scrap-ers (such as breaking down when site changes are made).
Pilot The BBC ran the Sound Index pilot from March to August 2008. Its mea-sures for success included feedback from its editorial team, Web-use sta-tistics, and general feedback from the online community. Despite a com-plete lack of marketing and promo-tion budget and effort, Sound Index went from a standing start as public beta in April 2008 to attract 43,469 vis-its from 37,900 unique users in June 2008 when it attracted 140,383 page views at an average of 3.67 per user, each spending an average of three minutes and 40 seconds on the site, or 53 seconds per page. In August 2008, it attracted more than 772,000 Web-page references.
The Sound Index team monitored the online feedback by setting up Google Alerts on all possible permu-tations of the project name, manually evaluating each link. There was a lot of positive comment from the Web and from the traditional business and technology press. It was named “Web 2.0 technology of the week” by the U.K. Observer (http://www.guardian.co.uk/music) for several consecutive weeks (during April to August 2008), as well
as “the hottest thing in music” (in March 2008) by the U.K.’s Guardian Music Monthly (http://www.guardian.co.uk/music). It also generated much debate in European music circles about what constitutes music popu-larity and what the results mean. The pilot closed August 2008, with the BBC planning for its future.
conclusion Called the “first definitive music chart for the Internet age,”14 Sound Index is a novel demonstration of research into processing, analyzing, collating, rank-ing, and presenting large quantities of unstructured and structured mul-timodal information in response to a change in the behavior of key demo-graphic groups and a pressing indus-try need to innovate or risk being irrel-evant. It is a model for demonstrating a new approach to service and prod-uct delivery, integrating (in real time) multiple, relevant online information with one’s own data to drive new and significant value for, reinvigorate con-nection to, and strengthen brand af-finity to one’s customer base.
Here, we’ve described the system’s technical underpinnings, highlighted some of the technical challenges al-ready addressed, and showcased the engineering and research themes that require further investigation. The un-derlying concepts and processes are also applicable to myriad other fields that depend on the capture of Internet buzz. We hope it inspires future soft-ware products and research projects to harness the wisdom of the crowds.
acknowledgmentsWe would like to thank the BBC, spe-cifically Geoff Goodwin, Head of BBC Switch, for its vision, support, and encouragement, as well as Alfredo Alba (IBM Almaden Research Center), Jan Pieper (IBM Almaden Research Center), Anna Liu (IBM Almaden Re-search Center), Bill J. Scott (formerly IBM Global Business Services), Aidan Toase (IBM Global Business Services), and IBM’s partners at NovaRising, who helped make the Sound Index system a reality.
References 1. Adali, s., Hill, B., and Magdon-Ismail, M. The impact
of ranker quality on rank-aggregation algorithms:
Information vs. robustness. In Proceedings of the 22nd International Conference on Data Engineering Workshops (Atlanta, GA, Apr. 3–7). IEEE Computer society, Washington D.C., 2006, 37.
2. Alba, A., Bhagwan, V., and Grandison, T. Accessing the deep Web: When good ideas go bad. In Proceedings of the ACM SIGPLAN International Conference on Object-Oriented Programming, Systems, Languages and Applications (OOPSLA) (nashville, Tn, oct. 25–29). ACM Press, new york, 2008, 815–818.
3. Alba, A., Bhagwan, V., Grace, j., Gruhl, D., Haas, K., nagarajan, M., Pieper, j., Robson, C., and sahoo, n. Applications of voting theory to information mashups. In Proceedings of the Second IEEE International Conference on Semantic Computing. (santa Clara, CA, Aug. 4–7). IEEE Press, 2008, 10–17.
4. de Borda, j.-C. Memoire sur les elections au scrutin. Histoire de l’Académie Royale des Sciences 1781; http://asklepios.chez.com/XIX/borda.htm.
5. Diaconis, P. and Graham, R spearman’s footrule as a measure of disarray. Journal of the Royal Statistics Society, Series B (Methodological) 39, 2 (1977), 262–268.
6. Ferrucci, D. and Lally, A. UIMA: An architectural approach to unstructured information processing in the corporate research environment. Journal of Natural Language Engineering 10, 3–4 (2004), 327–348.
7. Han, j. and Kambert, M. Data Mining: Concepts and Techniques. Morgan Kaufmann Publishers, Inc., san Francisco, 2001.
8. Hassell, j., Aleman-meza, B., and Arpinar, I.B. ontology-driven automatic entity disambiguation in unstructured text. In Proceedings of the International Semantic Web Conference LNCS 4273 (Athens, GA, nov. 5–9). springer, 2006, 44–57.
9. Lloyd, L., Bhagwan, V., Gruhl, D., and Tomkins, A. Disambiguation of References to Individuals. IBM Research Report Rj10364 (A0510-011). san jose, CA, oct. 28, 2005; http://domino.watson.ibm.com/library/cyberdig.nsf/papers/D8265335C0AD4CD5852570AB00514720/$File/rj10364.pdf.
10. Mayfield, G. Billboard Hot 100 to include digital streams. (july 31, 2007); http://www.billboard.com/bbcom/news/article_display.jsp?vnu_content_id=1003619084.
11. Musser, j. scrAPIs. (Mar. 21, 2006). http://blog.programmableweb.com/2006/03/21/scrapis/.
12. Quinn, M. and Chang, A. More teens dissing discs in favor of online tunes. Los Angeles Times (Feb. 27, 2008); http://www.latimes.com/news/nationworld/nation/la-fi-music-270208,1,2028285.story.
13. Riloff, E. Little words can make a big difference for text classification. In Proceedings of the 18th Annual ACM SIGIR Conference on Research and Development in Information Retrieval (seattle, WA, july 9–13). ACM Press, ny, 1995, 130–136.
14. salmon, C. Click to download. U.K. Guardian (Apr. 18, 2008); http://arts.guardian.co.uk/filmandmusic/story/0,,2274132,00.html.
15. styvén, M. Exploring the Online Music Market: Consumer Characteristics and Value Perceptions. Ph.D. Thesis. Department of Business Administration and social sciences, Luleå University of Technology, Luleå, sweden, 2007; http://epubl.ltu.se/14021544/2007/71/LTU-DT-0771-sE.pdf.
16. Walsh, G., Mitchell, V.-W., Frenzel, T., and Wiedmann, K.-P. Internet-induced changes in consumer music procurement behavior: A German perspective. Journal of Marketing Intelligence & Planning 21, 5 (2003), 305–317.
17. Zhu, H., siegel, M.D., and Madnick, s.E. Information aggregation: A value-added e-service. In Proceedings of the International Conference on Technology, Policy, and Innovation: Critical Infrastructures (The Hague, The netherlands, june 26–29, 2001).
Varun Bhagwan ([email protected]) is an advisory software engineer in the Computer science Department of IBM Almaden Research Center, san jose, CA.
Tyrone Grandison ([email protected]) is a manager in the Computer science Department of IBM Almaden Research Center, san jose, CA.
Daniel Gruhl ([email protected]) is a senior software engineer in the Computer science Department of IBM Almaden Research Center, san jose, CA.
© 2009 ACM 0001-0782/09/0900 $10.00