Some effects of reinforcer availability on the pigeon’s responding in 24-hour sessions
14
Animal Learning & Behavior 1981,9 (3), 4lJ.424 Some effects of reinforcer availability on the pigeon's responding in 24-hour sessions GARY A. LUCAS Indiana University, Bloomington, Indiana 47405 Restrictions on food availability produced by schedules of reinforcement were examined in three homing pigeons continuously housed in operant chambers. Total daily access to food was free to vary and depended on the subject's contact with the schedule in effect. Experiment 1 varied reinforcer duration within a continuous reinforcement schedule in order to provide a de- scription of the pigeon's feeding pattern under minimal constraints. In Experiments 2 and 3, access to food was contingent on responding in fixed-interval schedules, and limits on avail- ability of food were varied by changing the duration of reinforcement (Experiment 2) or the fre- quency of reinforcement (Experiment 3l. In all three experiments, a decline in the scheduled availability of food produced an increase in both the overall response rate and the local response rate. In addition, the distribution of responding across the day followed a diurnal rhythm typical of the pigeon's unconstrained pattern of food intake. These effects are consistent with previous studies showing an inverse relationship between instrumental response rate and reinforcer availability in the absence of fixed deprivation, and support the interpretation that this inverse relationship results from constraints imposed on preferred patterns of intake. The data on the localdistribution of responses were consistent with an extension of the response-deprivation hy- pothesis (Timberlake & Allison, 1974) to localresponse patterning. 411 A number of recent studies have shown that a sub- stantial amount of instrumental behavior can be maintained by a contingency between the instru- mental response and the reinforcer in the absence of a fixed deprivation regimen (for recent reviews, see Collier, Hirsch, & Kanarek, 1977; Dunham, 1977; Hursh, 1980; Timberlake, 1980). Common to many of these studies is the hypothesis that restrictions on preferred amounts of one behavior can increase the occurrence of another behavior. For example, Timberlake and Allison (1974) have shown that the amount of an instrumental behavior will increase if a response contingency is arranged so that baseline levels of an instrumental response would result in less than the preferred (baseline) amount of a contingent behavior. This condition is called "response depriva- tion" (see Allison & Timberlake, 1974, 1975). Hirsch and Collier (1974) also recognized that the reinforcement schedule produces certain restrictions on the pattern of reinforcer availability. For ex- ample, a schedule may restrict the frequency, dura- tion, or amount of food available in a given time pe- riod. And these constraints may be more or less com- patible with an organism's preferred pattern of ac- The experiments reported here were part of a doctoral disserta- tion submitted to the University of Missouri at Kansas City. Spe- cial thanks are due to James Allison, James Deich, and Bill Timberlake for helpful suggestions on earlier versions of this man- uscript. Requests for reprints should be sent to the author, Department of Psychology, Indiana University, Bloomington, Indiana 47405. Copyright 1981 Psychonomic Society, Inc. cess to that reinforcer. Hirsch and Collier proposed that "a major source of motivation in feeding be- havior arises from constraints placed on the normal pattern of feeding" (1974, p. 239). From this per- spective, Collier and his associates (Collier, Hirsch, & Hamlin, 1972; Collier et al., 1977; Hirsch & Collier, 1974; Kanarek, 1975) have used various schedules of food availability to model the environmental con- straints of feeding behaviors found in different eco- logical niches. The constraint argument essentially parallels the response-deprivation hypothesis when the "normal pattern" of intake is defined as the baseline pattern of the contingent behavior. Simply restated, the argument suggests that restricting a behavior below its baseline level of performance produces a change in motivation. I In this way, the response-deprivation hypothesis predicts that a reduction in availability of a contingent behavior should increase the amount of an associated instrumental response. A number of studies using ratio schedules support the response- deprivation prediction, reporting an inverse relation between instrumental response rate and reinforcer availability (see Allison, Miller, & Wozny, 1979; Collier et al., 1977; Timberlake, 1977). Recently, Allison (1980) and Hursh (1978) have shown that the inverse relation between response rate and reinforcer availability does not depend on a ratio contingency between instrumental responding and the reinforcer. The response-deprivation hypothesis can be ex- tended to the patterning of behavior as well. Here re- 0090-4996/81/030411-14$01.65/0
-
Upload
independent -
Category
Documents
-
view
0 -
download
0
Transcript of Some effects of reinforcer availability on the pigeon’s responding in 24-hour sessions

Animal Learning & Behavior1981,9 (3), 4lJ.424
Some effects of reinforcer availability on thepigeon's responding in 24-hour sessions
GARY A. LUCASIndiana University, Bloomington, Indiana 47405
Restrictions on food availability produced by schedules of reinforcement were examined inthree homing pigeons continuously housed in operant chambers. Total daily access to food wasfree to vary and depended on the subject's contact with the schedule in effect. Experiment 1varied reinforcer duration within a continuous reinforcement schedule in order to provide a description of the pigeon's feeding pattern under minimal constraints. In Experiments 2 and 3,access to food was contingent on responding in fixed-interval schedules, and limits on availability of food were varied by changing the duration of reinforcement (Experiment 2) or the frequency of reinforcement (Experiment 3l. In all three experiments, a decline in the scheduledavailability of food produced an increase in both the overall response rate and the local responserate. In addition, the distribution of responding across the day followed a diurnal rhythm typicalof the pigeon's unconstrained pattern of food intake. These effects are consistent with previousstudies showing an inverse relationship between instrumental response rate and reinforceravailability in the absence of fixed deprivation, and support the interpretation that this inverserelationship results from constraints imposed on preferred patterns of intake. The data on thelocaldistribution of responses were consistent with an extension of the response-deprivation hypothesis (Timberlake&Allison, 1974) to localresponse patterning.
411
A number of recent studies have shown that a substantial amount of instrumental behavior can bemaintained by a contingency between the instrumental response and the reinforcer in the absence ofa fixed deprivation regimen (for recent reviews, seeCollier, Hirsch, & Kanarek, 1977; Dunham, 1977;Hursh, 1980; Timberlake, 1980). Common to manyof these studies is the hypothesis that restrictions onpreferred amounts of one behavior can increase theoccurrence of another behavior. For example,Timberlake and Allison (1974) have shown that theamount of an instrumental behavior will increase ifa response contingency is arranged so that baselinelevelsof an instrumental response would result in lessthan the preferred (baseline) amount of a contingentbehavior. This condition is called "response deprivation" (see Allison & Timberlake, 1974, 1975).
Hirsch and Collier (1974) also recognized that thereinforcement schedule produces certain restrictionson the pattern of reinforcer availability. For example, a schedule may restrict the frequency, duration, or amount of food available in a given time period. And these constraints may be more or less compatible with an organism's preferred pattern of ac-
The experiments reported here were part of a doctoral dissertation submitted to the University of Missouri at Kansas City. Special thanks are due to James Allison, James Deich, and BillTimberlake for helpful suggestions on earlier versions of this manuscript. Requests for reprints should be sent to the author,Department of Psychology, Indiana University, Bloomington,Indiana 47405.
Copyright 1981 Psychonomic Society, Inc.
cess to that reinforcer. Hirsch and Collier proposedthat "a major source of motivation in feeding behavior arises from constraints placed on the normalpattern of feeding" (1974, p. 239). From this perspective, Collier and his associates (Collier, Hirsch,& Hamlin, 1972; Collier et al., 1977; Hirsch & Collier,1974; Kanarek, 1975) have used various schedules offood availability to model the environmental constraints of feeding behaviors found in different ecological niches.
The constraint argument essentially parallels theresponse-deprivation hypothesis when the "normalpattern" of intake is defined as the baseline patternof the contingent behavior. Simply restated, theargument suggests that restricting a behavior belowits baseline level of performance produces a changein motivation. I In this way, the response-deprivationhypothesis predicts that a reduction in availabilityof a contingent behavior should increase the amountof an associated instrumental response. A number ofstudies using ratio schedules support the responsedeprivation prediction, reporting an inverse relationbetween instrumental response rate and reinforceravailability (see Allison, Miller, & Wozny, 1979;Collier et al., 1977; Timberlake, 1977). Recently,Allison (1980) and Hursh (1978) have shown that theinverse relation between response rate and reinforceravailability does not depend on a ratio contingencybetween instrumental responding and the reinforcer.
The response-deprivation hypothesis can be extended to the patterning of behavior as well. Here re-
0090-4996/81/030411-14$01.65/0

412 LUCAS
sponse deprivation predicts that the baseline distribution of the contingent behavior should affect the distribution of instrumental activity in the contingencysession (Allison & Timberlake, 1975). For example,if most of the contingent behavior occurs in the lastthird of the session during the baseline condition,then, under a fixed rate of access to the contingentbehavior, the largest discrepancy between the baseline amount and the scheduled amount would occurin the last third of the contingency session. The largerthe difference between baseline and contingency periods, the greater the response-deprivation conditionbecomes and, therefore, the more instrumental activity to be expected. This extension of the responsedeprivation model to local response patterns will betermed the pattern-deprivation hypothesis.' Supportfor this hypothesis rests largely on Allison andTimberlake's (1975) demonstration that the latencyof an instrumental response in a contingency sessiondepends on the latency of the contingent behaviorduring baseline.
The following study considered the role of the reinforcement schedule as a constraint. In particular, thisdesign examined the effect of restricting availabilityof food on a pigeon's keypecking behavior. No requirement was placed on feeding aside from thelimits on availability and no specific deprivation regimen was maintained. Availability of food was manipulated by varying either the duration of reinforcement (Experiments 1 and 2) or the frequency of reinforcement (Experiment 3). A fixed interval (FI) contingency was used in Experiments 2 and 3 to minimize the relationship between local rates of responding and the availability of food. These procedurestherefore sought to extend Hursh's (1978) finding ofan inverse relation between food availability and instrumental response rates under interval schedules.
In the present study, the reinforcement schedulewas continuously available 24 h per day. A clear diurnal pattern for free-feeding behavior has been welldefined for the pigeon (Zeigler, 1976; Zeigler, Green,& Lehrer, 1971). This diurnal pattern provided a testof the pattern-deprivation prediction for the distribution of instrumental behavior. Given a fixed schedulerestriction on food availability, the pattern-deprivationhypothesis predicts that the distribution of instrumental responding should approach the same diurnalpattern that feeding behavior shows under unconstrained conditions.
GENERAL METHOD
SubjectsThree homing pigeons, approximately 18 months old at the be
ginning of the study, served. All subjects had had prior experiencewith 24-h food-reinforcement schedules and had been maintainedin individual operant chambers for 9 months.' Each subject received 30 days of free access to mixed grain from food cups within
each chamber prior to the present study. Ad-lib weights, based onmeans across the last 5 days in this period, were 610, 328, and361 g for Subjects H7401, H7402, and H7403, respectively. Thesevalues served as reference points for 100llJo body weight.
ApparatusA Lehigh Valley Model 1519 test chamber equipped with a
Model 1348 two-key test panel and two locally constructed chambers of similar dimensions were used. Only the right response keywas illuminated and operative. A minimum force of .12 N was required to operate the response key.
The experimental chambers were located in a closed, lightshielded room. Ambient temperature was maintained between 20°and 23°C. In addition to the noise of the exhaust fan, a low levelof white noise was continually presented through speakers in eachchamber. Scheduling and data collection were programmed viaconventional electromechanical relay equipment, counters, andcumulative recorders located in a separate room. Hourly responseoutputs were measured from the cumulative records.
A 12-h/12-h light-dark cycle was programmed by a single 7-Wnight-light bulb centrally located on the ceiling of the chamber.AGE 1819bulb operated at 28 V de in series with a 150-Qresistorcontinuously illuminated the right response key with a dim orangecolor. A second 1819 bulb, located within the food hopper, wasilluminated when the hopper was raised. This arrangement provided the pigeon with visual access to the key and food hopperduring both light and dark periods of the day.
Water and grit were available from small cups located to the leftof the food hopper. The pigeon'S food was a mixture of choppedcorn and other small grains of relatively uniform size averaging.02 g per piece.
ProcedureThe subjects remained in their experimental chambers contin
uously, except for approximately 5 min each day, during whichthe subjects were removed for weighing, cleaning the chamber,and replenishing food and water supplies. Cleaning occurred approximately 30 min prior to light onset.
To provide a measure of the time a subject spent in keypeckingbehavior, each keypeck was programmed to start, or restart, aIS-secclock. Each bout of keypecking started the clock, which ranuntil IS sec had elapsed without a response. Timing was suspendedduring reinforcement, but the clock restarted if the subject keypecked during food delivery. A running timemeter recorded thecumulative time each day that the IS-sec clock was active. Thismeasure of "cumulative time responding" provided the time baseused to compute local rates of responding and local reinforcementfrequencies.
Subjects gained all daily access to food by keypecking undervarious schedules of reinforcement. The amount of food obtainedper day varied freely according to the subject's performance. Foodintake was measured by the difference in weight between theoriginal grain supply each day and the weight remaining (plus anyspillage) on the following day. The reinforcement schedule operated during both light and dark periods of the day. To simplifytime references, daily session time was defined with respect to thesubject's light-dark cycle. The midpoint of the dark period wasdesignated as the change of day. In this time reference, the houselight went on at 0600 h and off at 1800 h.
The same three subjects served in each of the following studies.In order of running, the study reported as Experiment 2 actuallypreceded the study in Experiment I. The order of discussion hasbeen reversed as an aid to presentation.
EXPERIMENT 1
Zeigler et al. (1971) have provided a detailed description of the pigeon's free-feeding behavior. Ex-

REINFORCER AVAILABILITY IN 24-HOUR SESSIONS 413
Figure 1. The mean percentage of dally reinforcers obtained perbour across CRF Kbedules in Experiment 1. Ligbt onset occurredafter Hour 6 (0600), light offset after Hour 18 (1800).
Results and DiscussionAlthough the reinforcement schedule in each con
dition was operative 24 h a day, the pigeon's feedingactivity was not equally distributed across the day.Instead, the daily response pattern followed a markeddiurnal rhythm, with more than 98% of all responsesoccurring during the lighted period of the light-darkcycle (0600 to 1800 h). Figure 1 presents the temporal
distribution of reinforcers across hours of the day.Data are mean percentages of reinforcers for the last5 days in the condition averaged across subjects andare representative of individual response patterns aswell.
The distribution of responding within the light period was characterized by a bimodal pattern of activity with a primary peak of responding in the "afternoon" period of the day between 1400 and 1600 h.A secondary peak of responding occurred between0600 and 0800 h, following light onset. This "morning" response peak was generally smaller than theafternoon peak and was occasionally absent from individual daily records. Response rate during the"midday" period, 1000 to 1300 h, was characteristically low. Responding during the dark period of thelight-dark cycle was limited to an occasional feedingbout during those early morning hours just precedinglight onset. This pattern of responding is consistentwith the distribution of feeding activity reported byZeigler et al. (1971) as being typical of the pigeon'sdaily feeding pattern. Little variation in this patternwas evident across changes in reinforcer duration.
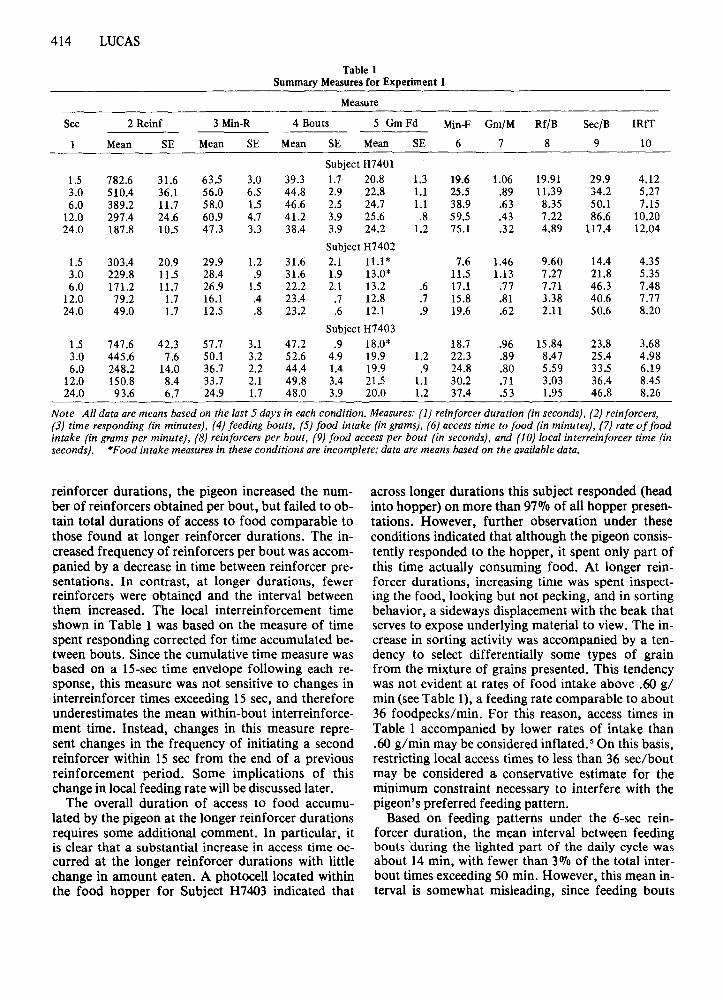
Summary measures for daily feeding activity arepresented in Table 1. Data are means across the last5 days in each condition, except as noted. All threesubjects readily adjusted their feeding activity tochanges in reinforcer duration. As duration increasedfrom a nominal value of 1.5 sec per reinforcer to24 sec per reinforcer, the total number of reinforcersobtained per day and measures of cumulative timespent keypecking (based on the IS-sec time envelopefollowing each keypeck) both decreased. Despite thechange in reinforcer duration, the mean number ofdistinct bouts of feeding activity remained relativelyconstant across conditions. Similarly, food intakewas relatively constant, although intake was clearlydepressed at the 1.5-sec reinforcer duration.
Also presented in Table 1 are measures of themean daily access time to food (number of reinforcers times nominal duration) and rate of food intake (grams eaten per minute of access to food).These measures suggest that much of the pigeon'sability to compensate for shorter reinforcer durationsresults from an increase in feeding rate. The interested reader may note that rate of food intake ingrams per minute provides a good estimate of foodpeck rates in pecks per second with the grain mixtureused in the present study. 4 The measures of "accesstime" and "rate of feeding" obtained with the present operant procedure compare with a mean daily access time of 51.9 min and a feeding rate of .58 g/rninbased on photocell-controlled feedometer measuresof feeding in adult White Carneaux pigeons (Zeigleret al., 1971).
The final three measures in Table 1 describe thewithin-bout pattern of feeding activity. At shorter
uwU1
zof<Cex
6 is
I.S
exwuexoLL
12 ~wex
HOUR OF DAY
____lli-rr-rJiIlb'---- _
MethodNominal hopper durations were selected from the doubling
series 1.5, 3, 6, 12, and 24 sec. In order to minimize error in theusable duration of the hopper, a constant A sec time was addedto each value in the above series. The A-sec allowance was judgedthe minimum transit time from the response key to the food hopper based on pilot observations of highly motivated pigeons trainedin the same chambers. The actual duration of each presentationwas therefore A sec longer than the nominal value. Reinforcerdurations were presented in ascending order, with each durationin effect for 7 days.
Keypecks during the reinforcer had no scheduled effect, but didrestart the 15-sec clock recording time spent responding. Eventrecords from individual subjects for keypecking were analyzed todetermine the extent of local periods of feeding activity. A boutof responding was defined as a period of pecking separated fromother response periods by a minimum of 2 min with no responding (cf. Zeigler et al., 1971).
periment 1 attempted to determine whether similarbehavior patterns would develop in the pigeon livingand feeding in an operant chamber. Previous studies(Duncan, Horne, Hughes, & Wood-Gush, 1970;Mcfarland, 1967) have suggested that the operantsituation can provide a good assessmentof free-feedingperformance in avians when minimal response requirements are used. To this end, the following studyused a continuous reinforcement schedule (CRF) inwhich each keypeck produced food delivery.
414 LUCAS
Table 1Summary Measures for Experiment 1
Measure
Sec 2 Reinf 3 Min-R 4 Bouts 5 GmFd Min-F Gm/M Rf/B Sec/B IRIT
Mean SE Mean SE Mean SE Mean SE 6 7 8 9 10
Subject H7401
1.5 782.6 31.6 63.5 3.0 39.3 1.7 20.8 1.3 19.6 1.06 19.91 29.9 4.123.0 510.4 36.1 56.0 6.5 44.8 2.9 22.8 1.1 25.5 .89 11.39 34.2 5.276.0 389.2 11.7 58.0 1.5 46.6 2.5 24.7 1.1 38.9 .63 8.35 50.1 7.15
12.0 297.4 24.6 60.9 4.7 41.2 3.9 25.6 .8 59.5 .43 7.22 86.6 10.2024.0 187.8 10.5 47.3 3.3 38.4 3.9 24.2 1.2 75.1 .32 4.89 117.4 12.04
Subject H7402
1.5 303.4 20.9 29.9 1.2 31.6 2.1 11.1* 7.6 1.46 9.60 14.4 4.353.0 229.8 11.5 28.4 .9 31.6 1.9 13.0* 11.5 1.13 7.27 21.8 5.356.0 171.2 11.7 26.9 1.5 22.2 2.1 13.2 .6 17.1 .77 7.71 46.3 7.48
12.0 79.2 1.7 16.1 .4 23.4 .7 12.8 .7 15.8 .81 3.38 40.6 7.7724.0 49.0 1.7 12.5 .8 23.2 .6 12.1 .9 19.6 .62 2.11 50.6 8.20
Subject H7403
1.5 747.6 42.3 57.7 3.1 47.2 .9 18.0* 18.7 .96 15.84 23.8 3.683.0 445.6 7.6 50.1 3.2 52.6 4.9 19.9 1.2 22.3 .89 8.47 25.4 4.986.0 248.2 14.0 36.7 2.2 44.4 1.4 19.9 .9 24.8 .80 5.59 33.5 6.19
12.0 150.8 8.4 33.7 2.1 49.8 3.4 21.5 1.1 30.2 .71 3.03 36.4 8.4524.0 93.6 6.7 24.9 1.7 48.0 3.9 20.0 1.2 37.4 .53 1.95 46.8 8.26
Note-All data are means based on the last 5 days in each condition. Measures: (1) reinforcer duration (in seconds), (2) reinforcers,(3) time responding (in minutes), (4) feeding bouts, (5) food intake (in grams), (6) access time to food (in minutes), (7) rate of foodintake (in grams per minute), (8) reinforcers per bout, (9) food access per bout (in seconds), and (10) local interreinforcer time (inseconds). "Food intake measures in these conditions are incomplete; data are means based on the available data.
reinforcer durations, the pigeon increased the number of reinforcers obtained per bout, but failed to obtain total durations of access to food comparable tothose found at longer reinforcer durations. The increased frequency of reinforcers per bout was accompanied by a decrease in time between reinforcer presentations. In contrast, at longer durations, fewerreinforcers were obtained and the interval betweenthem increased. The local interreinforcement timeshown in Table 1 was based on the measure of timespent responding corrected for time accumulated between bouts. Since the cumulative time measure wasbased on a IS-sec time envelope following each response, this measure was not sensitive to changes ininterreinforcer times exceeding 15 sec, and thereforeunderestimates the mean within-bout interreinforcement time. Instead, changes in this measure represent changes in the frequency of initiating a secondreinforcer within 15 sec from the end of a previousreinforcement period. Some implications of thischange in local feeding rate willbe discussed later.
The overall duration of access to food accumulated by the pigeon at the longer reinforcer durationsrequires some additional comment. In particular, itis clear that a substantial increase in access time occurred at the longer reinforcer durations with littlechange in amount eaten. A photocell located withinthe food hopper for Subject H7403 indicated that
across longer durations this subject responded (headinto hopper) on more than 9711/0 of all hopper presentations. However, further observation under theseconditions indicated that although the pigeon consistently responded to the hopper, it spent only part ofthis time actually consuming food. At longer reinforcer durations, increasing time was spent inspecting the food, looking but not pecking, and in sortingbehavior, a sideways displacement with the beak thatserves to expose underlying material to view. The increase in sorting activity was accompanied by a tendency to select differentially some types of grainfrom the mixture of grains presented. This tendencywas not evident at rates of food intake above .60 g/min (see Table 1), a feeding rate comparable to about36 foodpecks/min. For this reason, access times inTable 1 accompanied by lower rates of intake than.60 g/min may be considered inflated. 5 On this basis,restricting local access times to less than 36 sec/boutmay be considered a conservative estimate for theminimum constraint necessary to interfere with thepigeon's preferred feeding pattern.
Based on feeding patterns under the 6-sec reinforcer duration, the mean interval between feedingbouts during the lighted part of the daily cycle wasabout 14 min, with fewer than 3% of the total interbout times exceeding50 min. However, this mean interval is somewhat misleading, since feeding bouts

REINFORCER AVAILABILITY IN 24-HOUR SESSIONS 415
were more frequent during the high-activity feedingperiods of the afternoon than during other periodsof the day. The interbout interval during these moreactive periods was commonly 6 to 8 min, while interbout times during the low activity midday period frequently exceeded 30 min. A similar change in boutfrequency has been reported by Zeigler et al. (1971),who also report an increase in bout duration duringmore active feeding periods.
EXPERIMENT 2
Rather than eating a few distinct meals per day,the pigeon's free-feeding activity is characterized byfrequent small bouts of eating primarily limited tothe daylight hours (Zeigler et al., 1971; and Experiment 1). The frequency and duration of feedingbouts vary across the daylight hours to produce a bimodal pattern, with the bulk of the pigeon's intakeoccurring in the afternoon period. Detailed descriptions of the pigeon's feeding activity obtained in thelaboratory (Zeigler, 1976; Zeigler et al., 1971) aresupported by field observations for the pigeon andrelated species (e.g., Murton, 1965; Schmid, 1965)and laboratory studies of other avians (Duncan et al.,1970; VanHemel & Meyer, 1969), showing a diurnalpattern of frequent small feeding bouts. Similar patterns of responding emerged in the pigeon's keypecking activity in Experiment 1 when food was obtainedunder a simple CRF reinforcement schedule.
The following study extended the operant contingency to a moderate fixed-interval (FI) schedule. TheFI schedule differed from the CRF condition in thatit imposed a limit on the maximum local frequencyof access to food. Assuming that the duration of thereinforcement period was relatively long, such aschedule might place little restriction on the pigeon'sability to feed in frequent small bouts. However, atshorter reinforcer durations, the FI would preventthe pigeon from producing additional periods of access to food within a few seconds of the previousreinforcement period, as found at shorter reinforcerdurations in Experiment 1. Viewed either in responsedeprivation terms (Timberlake & Allison, 1974) or asa constraint on the usual feeding pattern (Hirsch &Collier, 1974), the restrictions imposed by the schedule were expected to increase the amount of associated food-directed behaviors. Since longer and morefrequent feeding bouts occurred in the early morningand afternoon periods, shorter reinforcer durationswould particularly conflict with the pigeon's typicalfeeding pattern during these periods. Thus, the largestamount of keypecking was expected during thesehours of the day.
MethodThe same three pigeons used in Experiment 1served as subjects.
The subjects were adjusted to an FI l-rnin schedule with a 6-sec
duration of access to food for 1 week prior to the present study.Each subject was then exposed to a series of reinforcer durationsvarying in an ascending and then a descending order, as shownin Table 2. As in Experiment 1, a constant .4-sec time allowancewas added to each nominal duration. In all conditions, the FII-min was timed from the offset of the previous reinforcementperiod. Except for the 1.5-sec duration, which ran for 12 days,each reinforcer duration was in effect for 10 consecutive days. Allother details of the apparatus and procedure were identical tothose used in Experiment I.
Results andDiscussionThe major results of Experiment 2 are summarized
in Figure 2. Additional measures are provided in Table 2. All data are means across the last 5 days ineach condition, except as noted. For each subject, thetotal number of keypecks made per day (the overallresponse rate) and the local rate of pecking (calculated with the cumulative time spent responding asthe time base) were both an inverse function of theduration of access to food per reinforcer. The number of responses emitted per reinforcer was also aninverse function of reinforcer duration, as was thenumber of reinforcers produced per day. While thenumber of reinforcers obtained per day increased asreinforcer duration was reduced, the local rate ofreinforcer delivery (based on the same time base aslocal response rate) decreased at shorter reinforcerdurations. These effects were consistent across subjects for both the ascending and descending series.
Since the cumulative time measure was based on aIS-sec time period following each keypeck, the localrate measure indicates a change in interresponsetimes shorter than 15 sec. Similarly, the change in thenumber of responses per reinforcer represents an increase in the number of responses initiated within1 min of a previous reinforcer under the PI I-minschedule. These measures illustrate that the recordedchange in local response rate was not simply an artifact of the subjects' production of more reinforcersat shorter hopper durations. The number of responses changed more rapidly than did the numberof reinforcers. In addition, the increase in local response rate occurred despite a substantial increase inthe overall duration of time spent responding per day(see Table 2), the time base for calculating localrates. The estimates of local response rate determinedwith this time base are necessarily biased by the methodof determining the measure of time spent responding.In particular, the rate measure was insensitive tolocal response rates below 4/min. However, the direction of change in local rate was consistent withestimates of local rate based on the examination ofcumulative records, based on the number of responsesper reinforcer, and based on measures of peak afternoon response rates. Thus, while the absolute response rate may differ, depending on the time baseused, the direction of change was consistent acrossmeasures.

416 LUCAS
2418126241812624•126
-~
H1401
~H1403
Rnp/Min
~..
R'inf/Mil'l ~Il • ....~
, • ~~
, I , I I .L I.1
100
50
.5
H1401
10000
lIOOO
~ 1000R.,p
ex: lIOOWQ.ex:W 100CD2
lIO:::JZ
10
5
H1402 H7403
SECONDS OF REINFORCEMENT
Figure 1. Top, local response rate (circles), local rate of reinforcement (squares). Bottom,total respOIUes per day (circles), total reinforcers per day (squares), and the mean number ofrespolUes per reinforcer (triangles). Data are from Experiment 1 and are plotted as a functionof the scheduled reinforcer duration. Solid figures are from the ascending series, open figuresare from the descending series.
In addition to the measure of time spent responding, Table 2 presents the mean daily access time tofood (number of reinforcers times nominal duration)and the mean percentage of body weight maintainedacross conditions. The reduction in reinforcer duration clearly resulted in a net decrease in the obtainedduration of access to food per day. Compared withthe data from Experiment 1 (see Table 1), the duration of access obtained under the FI l-min schedulewas systematically lower. The percentage of bodyweight maintained across conditions was lower atshorter reinforcer durations, especially for H7401,but was not consistently predictive of the level of responding. Subject H7403 maintained a body weightwithin 2.4010 (9 g) of its ad-lib weight across all conditions. Since daily access time to food decreased atshorter durations, the small change in body weightsuggests that the pigeon was able to compensate substantially for the reduced access time. Presumablythis was accomplished by increasing the rate of eat-
ing, as in Experiment 1. Unfortunately, measures offood intake were not obtained to confirm this hypothesis.
Figure 3 presents the distribution of keypeckingacross hours of the day. Data are mean percentagesaveraged across subjects and based on performanceduring the last 5 days in each condition. The conditions shown in Figure 3 were all based on performance across the descending series of reinforcer durations. As in Experiment 1, responding followed abimodal distribution with a primary peak of activityduring the afternoon portion of the day. Comparedwiththe CRF distributions(seeFigure 1), the afternoonpeak of activity appeared somewhat later. In addition, the proportion of total responding occurring inthe early morning peak was considerably smaller inExperiment 2, with a greater proportion of responding occurring, instead, during the afternoon. Usinghourly percentage distributions from the CRF data(averaged across all five conditions) as expected val-

REINFORCER AVAILABILITY IN 24-HOUR SESSIONS 417
HOUR OF DAY
Figure 3. The mean percentage of daily responses distributedacross bours of tbe day in Experiment 2. Light onset occurredafter Hour 6 (0600), Iigbt offset after Hour 18 (1800).
was the primary determinant of the "strength" ofreinforcement. Experiment 3 therefore examined theeffects of constraints on the availability of food imposed by varying the length of the fixed interval between reinforcers. This procedure specifically controlled the maximum frequency of reinforcementavailable, while the duration of access to food perreinforcer remained constant. As in the precedingstudies, the overall level of access to food per day depended on the subject's contact with the reinforcement schedule.
Results and DiscussionThe results are summarized in Figure 4 and Table
3. All data are means across the last 5 days in eachcondition except as noted. The data in Figure 4 areplotted across the maximum local frequency of reinforcement allowed by the FI schedule. The order ofrunning was actually from right to left.
Replicating Experiment 2, the total number of responses emitted per day (the overall response rate),the local rate of responding, and the total number ofresponses produced per reinforcer, all followed an in-
1.5(Jsn:::cr-n1Th~---
MethodThe same three pigeons used in Experiments I and 2 served as
subjects. Reinforcer duration in all the following conditions wasfixed at 6 sec (plus the A-sec transit time). The maximum availablefrequency of reinforcement was varied across conditions by increasing the length of the fixed-interval schedule in the followingseries: FI .25, .5. I, 2, 4, and 8 min. Note that increasing thelength of an FI schedule limited the maximum local rate of reinforcer availability, but did not necessarily ensure that fewer totalreinforcement periods would be obtained per day. Each subjectremained under the .25-, .5-, and l-min FI values for 10 days before advancing to the next condition. The 2-, 4-, and 8-min FI valueseach remained in effect for 14 days. The remaining details of theapparatus and procedure were identical to those described earlier.
Experiment 2 demonstrated an inverse relationshipbetween the response rate and reinforcer availabilitywhen food availability was constrained by limitingreinforcer duration. Similar effects occurred in Experiment 1 under CRF schedules. However, in boththe preceding studies, the higher response rate obtained at shorter reinforcer durations was accompanied by an increase in the number of reinforcersobtained per day. This increase in number of reinforcers was not sufficient to compensate for the reduction in daily duration of access to food. However,the higher frequency of reinforcement might havecontributed to changes in response rate obtained inthe preceding studies if frequency of reinforcement
ues, the daylight distributions shown in Figure 3 werefound to be significantly different from the CRF distribution at the 12-, 6-, and 3-sec reinforcer durations[x2s(1l) =49.0, 61.8, and 60.0, respectively, all ps <.01], but not at the 24-sec or the 1.5-sec durations[x2s(1l ) = 5.3 and 15.5, ps > .15].
EXPERIMENT 3
Table 2Summary Measures for Experiment 2
Access Time to Time Responding
ReinforcerFood (in Minutes) (in Minutes)
PercentageDuration* Mean SE Mean SE Weight
Subject H7401
3.0 13.7 .6 176.8 14.8 99.36.0 15.3 .6 71.8 4.4 99.2
12.0 20.5 .9 39.3 3.6 97.724.0 40.8 1.2 42.8 3.3 97.812.0 21.1 1.8 41.5 4.8 96.96.0 15.3 .7 73.7 3.7 95.93.0 11.5 .2 127.4 4.4 92.81.5 11.2 .3 282.6 10.1 85.8
Subject H7402
3.0 7.4 .5 70.3 8.5 99.66.0 9.7 .2 38.2 1.9 97.7
12.0 11.6 .7 16.1 1.1 97.324.0 16.4 1.0 11.4 .8 97.312.0 11.7 .6 16.3 .7 97.0
6.0 9.0 A 32.1 1.7 97.03.0 7.3 .2 58.4 2.2 95.71.5 9.6 .3 184.1 7.5 96.1
Subject H7403
3.0 12.8 .4 130.9 7.0 99.06.0 17.8 1.0 76.2 6.4 9804
12.0 22.4 .6 40.8 1.8 100.724.0 32.6 1.9 24.7 1.6 100.612.0 21.6 1.2 41.5 3.4 101.76.0 16.6 1.2 65.1 4.2 101.63.0 12.6 A 119.1 3.6 101.01.5 10.9 .6 245.1 5.5 97.6
Note-All dataaremeansbasedon the last5 days in each conditionexceptpercentage weight data, which areB-day means.*In seconds.

418 LUCAS
432432432
--~
H740Z H1403
R.'t>!W,n
~~- • •-
:~~r: •.(~--
I I I I ! I I I I I I I I I I I I I I I I
100
eo
wti 10a: !l...J()s
.5
.1
H7401 H140Z H10403
10000
5000
~
~ 1000
f5 500a.a:wCD 100::E~ 50Z
10
5
Z 3 4 Z 3
REINFORCERS PER MINUTE
Figure 4. Top, local response rate (circles), local rate of reinforcement (squares). Bottom, totalresponses per day (circles), total reinforcers per day (squares), and the mean number of responsesper reinforcer (triangles). Data are from Experiment 3 plotted as a function of the scheduledreinforcement frequency.
verse function of the availability of food. In contrastto the preceding studies, the overall number of reinforcers obtained per day and the local rate of reinforcement both decreased as the maximum frequencyof reinforcement decreased. The higher responserate, therefore, cannot be attributed to an increase ineither the overall rate of reinforcement or the localrate of reinforcement.
Included in Table 3 are measures of total accesstime to food (nominal duration times number of reinforcers) across each schedule condition. As in Experiment 2, the obtained duration of access to fooddecreased across schedule constraints to values wellbelow those obtained under the CRF conditions (seeTable 1). The total amount of food consumed perday and the mean weight of food obtained per 6-secreinforcer are shown in Figure 5 across the scheduledfrequencyof reinforcement. As the maximum availablefrequency of reinforcers decreased, the pigeon increased its rate of feeding during the 6-sec reinforcer.However, this increase was not sufficient to compensate for the reduced access to food at reinforcement
frequencies below l/min, as shown by the sharp decrease in total food obtained. Despite the decrease,changes in body weight (see Table 3) were relativelysmall and markedly lagged behind the changes infood intake. Also apparent from these measures isthe rather extreme degree of deprivation necessary toreduce the pigeon to an 80010 weight criterion. Forexample, after 6 weeks of food intake averaging lessthan 60010 of its ad-lib intake, Subject H7401 wasreduced to only 87010 of its free-feeding weight.Normative data provided by Zeigler, Green, andSiegel (1972)suggest that a challenge of 50010 of freefeeding intake requires from 8 to 10 weeks to reducethe pigeon to an 80010 weight criterion.
The efficiency with which each subject fed approximately doubled across the range of constraints stud.ied, as shown in Figure 5. These measures illustratethat equal reinforcer durations do not ensure thaisimilar amounts of food will be obtained per opportunity. Instead, as in Experiment 1 (and as suggestecin Experiment 2), it appears that changes in the pigeon's feeding rate parallel changes in its response

REINFORCER AVAILABILITY IN 24-HOUR SESSIONS 419
Table 3Summary Measures for Experiment 3
Access Time to Food Time Responding Food Intake
FI Schedule(in Minutes) (in Minutes)
Percentage(in Grams)
(in Minutes) Mean SE Mean SI-: Weight Mean SE
Subject H7401
.25 27.2 1.3 74.5 3.4 102.5 21.4 1.1
.50 23.0 1.9 80.2 7.6 102.2 20.7 .81.00 17.9 1.2 85.7 8.1 100.0 18.7 .92.00 12.7 .6 113.6 4.1 99.9 15.4 .74.00 10.7 .2 165.5 10.9 95.6 13.7 .78.00 5.9 .3 129.8 12.5 86.6 9.5 .7
Subject H7402
.25 8.3 .4 23.7 1.2 98.9 11.2 .7
.50 8.4 .5 25.0 2.4 95.9 13.0 .61.00 7.5 .2 27.1 .8 95.6 12.9 .72.00 5.6 .2 19.8 .6 96.4 10.2 .54.00 4.8 .1 18.2 .8 95.7 10.9 .78.00 4.9 .1 43.7 6.4 93.7 9.7 .4
Subject H7403
.25 22.6 2.0 58.7 5.4 100.6 19.6 1.2
.50 21.6 1.0 70.4 3.9 99.6 22.6 .81.00 18.7 1.0 79.8 3.0 99.4 21.1 .92.00 13.8 .5 89.9 2.3 99.0 18.7 .74.00 10.9 .4 159.1 17.7 96.3 18.3 .68.00 7.8 .1 311.0 7.7 93.0 14.4 .4
Note-All data are means based on the last 5 days in each condition except percentage weight data, which are I-day means.
Figure 5. Mean weight of food Intake per day (top) and perreinforcer (bottom) across the maximum scheduled frequency ofreinforcement In Experiment 3. Individual subjects are Identifiedby the circles (87401), squares (87402), and triangles (87403).
rate when total daily access to food is obtained on areinforcement schedule. It would be interesting to determine whether similar effects occur in operantschedules under fixed-deprivation procedures. Thephotocell measures of head-into-hopper for SubjectH7403 indicated that this subject responded to morethan 98010 of all reinforcer presentations. Observations of all three subjects support this estimate. Fromobservations, it appeared that the increase in feedingefficiency resulted from a decrease in the occurrenceof "nonessential" components of the feeding patternin favor of higher rates of food-pecking alone. These"nonessential" components included most pausingor inspecting before initiating pecking, any sortingbehaviors, and a reduction in momentary pauses between food pecks. These latter pauses typically include time spent handling (mandibu1ating) grain andswallowing (which frequently follows mandibulation). As a result, the pigeon frequently accumulateda number of pieces of grain in its beak before swallowing movements were apparent. Zeigler (1976) haspreviously reported this pattern in White Carneauxpigeons. Estimates of food-peck rates based on rateof intake suggest that, under the FI 8-min schedule,these subjects pecked at grain with rates in excess of100 pecks/min, approaching 140 pecks/min for Subject H7402.
Also apparent in these data is an obvious source of
432
REINFORCERS PER MINUTE
20
~ 15cII:I&J
10Z lL
W
~W 500e 0
u,0(/) .20~ II:
<l I&J0a:: II: .15t? 0LLZWII: .10II:I&JlL
.05
.00

420 LUCAS
individual difference. Throughout the present studies, most behavioral measures for Subject H7402were below the same measures obtained from theother subjects. However, the same scheduled limitson reinforcer availability should have imposed substantially less constraint on food intake for this subject. Not only did this pigeon require less food to maintain its ad-lib body weight, but it also obtained morefood within the same reinforcer duration.
The distribution of keypecking across hours of theday for each FI schedule is shown in Figure 6. Dataare mean percentages averaged across subjects fromresponse distributions for the last 5 days in each condition. Consistent with the previous studies, the response distribution followed a clear diurnal rhythm,with almost all responses occurring during the daylight hours. The morning peak of responding, seenprominently under the CRF schedules in Experiment 1, was less apparent under the present schedules. As in Experiment 2, a greater proportion of responding occurred during the afternoon portion ofthe feeding pattern as constraints on food availabilityincreased. Response distributions were significantlydifferent from the combined CRF distribution for allFI schedules except for the PI .25-min schedule. Theobtained values were X2s(ll) == 25.6,23.0,38.6,62.2,and 25.7 for comparisons across daylight hours forthe FI .5-, 1-, 2-, 4-, and 8-min schedules, respectively(all ps < .02). For the FI .25-min schedule, x2(11) ==9.9, p > .50. As in Experiment 2, the hour of peakresponding appeared about 1 h later in the day compared with the CRF distribution as access to foodwas restricted.
n
2 ..J«>0:
'""'f-Z
HOUR OF DAY
Figure 6. Tbe mean percentage of dally responses distributedacross bours of tbe day In Experiment 3. Llgbt onset occurredafter Hour 6 (0600), IIgbtoffset after Hour 18(1800).
Following completion of Experiment 3, the subjects were retested on some interval schedules whiledaily periods of free access to grain were also available. Subsequently, feeding cups were placed adjacent to the hopper aperture, the food hopper wasdisconnected, and baseline estimates were obtainedfor keypecking and food intake across a l-week period. Since these baseline measures may be importantto certain models of reinforcement, they are presented in Table 4. Relatively little keypecking occurred under baseline conditions. Food intake wascomparable to those amounts obtained under thelonger reinforcer durations in the CRF schedulesshown in Table 1. Standard errors for all comparisons overlapped, except for comparisons at the 1.5 secduration.
GENERAL DISCUSSION
Response to ConstraintThe current studies demonstrate an inverse relation
between the pigeon's response rate and food availability. This inverse relationship is consistent with theresults reported for a variety of species when totaldaily access to a given reinforcer was obtained undera schedule contingency (e.g., Allison, 1980; Allison,Miller, & Wonzy, 1979; Collier et al., 1972; Collieret al., 1977; Duncan, Horne, Hughes, & Woodgush,1970; Hirsch & Collier, 1974; Hursh, 1978; Kanarek,1975). The results obtained here under FI scheduleswere remarkedly similar whether food was restrictedby varying the duration of reinforcement or the timebetween reinforcers, and whether the rate of reinforcement increased or decreased. The changes infood availability produced large changes in responding even when deprivation, as measured by amountof intake or body weight, was small or inconsistentwith the direction of change. In addition, the inverserelationship between keypeck rates and food availability was obtained both for the overall amount ofresponding per day and for local measures of response rate.
While some dependency between response rate andreinforcer availability may still remain under intervalschedules (see Hursh, 1978), the present data clearlysupport both Allison (1980) and Hursh (1978) inshowing that the inverse relation between instrumental rate and reinforcer availability does not requirea ratio contingency between responding and reinforcer availability. Indeed, this inverse relationshipappeared as robust under the present interval schedules as those previously reported under ratio schedules (e.g., Collier et al., 1977) despite the reduceddependency. The data also support Hursh's (1978)observation that the increase in instrumental rate canoccur in the absence of any consistent change in bodyweight, lending support to the view that these behavioral changes antecede any physiological deficits (seeCollier et al., 1972; Hirsch & Collier, 1974).

REINFORCER AVAILABILITY IN 24·HOUR SESSIONS 421
Table 4Baseline Measures Obtained After Some Delay
Following Experiment 3
TimeResponding Food Intake
Sub-Responses (in Minutes) (in Grams)
Percentageject Mean SE Mean SE Weight Mean SE
H7401 13.4 3.7 2.0 .6 98.3 23.7 1.0H7402 2.2 .7 .3 .I 98.8 13.2 .8H7403 12.4 4.4 2.3 .7 100.4 21.2 1.0
Note-Data are 5·day means.
What, then, supports the inverse relationship between instrumental rate and reinforcer availability?The present results suggest that restrictions on foodavailability can motivate behavior, even if these restrictions do not reduce food intake. Timberlake andAllison (1974; see also Allison & Timberlake, 1974,1975) have shown that restrictions on the availabilityof a given behavior produce a condition of responsedeprivation, a condition that appears both necessaryand sufficient for the behavior to serve as an effectivereinforcer in a response contingency. The concept ofresponse deprivation makes it possible to view nonconsumatory behaviors as commodities that, whendeprived, can serve as reinforcers. Presumably, thebehaviors comprising the feeding activity itself aresuch commodities. From this perspective, Hirsch andCollier (1974) have suggested that constraint on asubject's preferred pattern of intake is sufficient tomotivate related instrumental behaviors.
In the present study, the pigeon's free-feeding pattern of behavior is the commodity being restricted.The presence of grain promotes a variety of behaviors in the pigeon, only some of which result in immediate ingestion. In addition to grasping and swallowing, inspecting and sorting were common nonintake behaviors (cf. Zeigler, 1976). Indeed, caretakers of free-feeding pigeons often complain thatsorting, not swallowing, is the pigeon's dominant response to a fresh supply of grain. Under the longerreinforcement durations of the CRF schedules (Experiment 1), the pigeon clearly produced more accesstime to food than it "needed" if intake was the onlydeterminer. Similarly, Collier et al. (1977) reportedthat rats produced more access periods to food onCRF schedules than were required for eating. Undoubtedly, all of this time was not spent attending tofood. However, photocell measures and direct observations revealed that a substantial amount of the pigeon's time was spent in food-related activities.
As periods of food availability were restricted, thepigeon obtained less total access time to food. However, some food-directed behaviors were less resistantto constraint than were others. For example, preferential grain intake was observed only under CRF
schedules, and then only at relatively long reinforcerdurations. Similarly, the sorting behavior itself wasrarely observed at shorter reinforcer durations. Theeconomic term elasticity has been used to describethe rate of change in consumption of a commodity(here, performing a contingent behavior) with respectto changes in its price or availability (for discussionsof the application of economic principles in behavioralanalysis, see Allison, 1979; Hursh, 1980; Lea, 1978).In this case, sorting may be considered a relativelyelastic behavior, changing readily in response tosmall changes in constraint. In contrast, food-peckingwas relatively inelastic, changing only slightly acrosslarge changes in constraint. Of particular interest isthe observation that different components of thefeeding activity varied in elasticity, so that some components of the feeding pattern were constrained morethan others by the limited availability of food. Suchdifferences in elasticity help to describe how the pigeon compensates for restricted access. In addition,they point up possible sources of confusion in measuring the amount of constraint imposed by a givenschedule.
Local Patterns of RespondingDespite changes in the frequency and duration of
reinforcement, the pattern of responding in the present study was strongly linked to the pigeon's bimodalfeeding pattern (Zeigler et al., 1971). This rhythmpersisted across schedules, although, in many conditions, a more even distribution of instrumental responding would have produced a substantial increasein daily food intake. In the same way, the pigeonnever learned to conserve effort by reducing the intensity of afternoon response periods. A relativelyhigh ratio of responses per reinforcer was always obtained during the afternoon period, although the pigeon frequently obtained food at low response ratesduring the midday portion of the daily cycle.
The predominance of responding during the lightphase of the light-dark cycle cannot be attributedsimply to the pigeon's inability to obtain food duringthe dark condition. During one of the transition daysfor Subject H7403, the houselight failed and this subject received one 12-h "light" period without illumination. The resulting daily record showed no grossdifferences from those of preceding days, althoughthe total amount of responding appeared somewhatreduced. More remarkable, however, was a distincttermination of the afternoon response pattern within30 min of the scheduled offset time for the houselight. In addition, it was not usual for a pigeon torespond with one or two small bouts of activity during the last few hours of darkness before light onseteach morning.
Although the pigeon's responding followed the bimodal pattern typical of free-feeding behavior, there

422 LUCAS
was some suggestion that the response distributionchanged somewhat across constraints. This effectwas best seen in Experiment 3, in which the responsedistribution across longer FI schedules displayed alower proportion of responding in the early morningperiod and a greater proportion in the late afternoonperiod as compared with the CRF distribution. Thereasons for this change are not apparent. The effectis not predicted by the pattern-deprivation model,and does not appear to have been previously reportedin the feeding literature. However, on the basis ofthe present observations, it appears to be a consistentfinding under moderate schedule restrictions.
In addition to maintaining a diurnal feeding rhythmacross constraints, the pigeon also increased its localresponse rate, as measured by an increase in responding within 15 sec of a previous response. In the CRFschedules, similar measures revealed that the pigeonincreased the number of reinforcers obtained perbout, and decreased the time between reinforcerswithin bouts, when the duration of reinforcementdecreased. Zeigler et al. (1971) have reported that thepigeon's diurnal rhythm of feeding is achieved byvarying both the frequency and the duration of feeding bouts across time of day. However, the pigeonreacts to food deprivation (i.e., a loss of body weight)by increasing bout duration rather than the numberof bouts. In Experiment 1, the pigeon responded tofeeding restrictions on duration of access, as it wouldto weight-loss deprivation, by increasing bout sizerather than frequency. Such changes in performanceare in the direction to be expected if the pigeon defended a distinct meal size, in terms of amount orduration of access, within each local period of intake. However, it should be noted that the pigeongenerally undercompensated for the shorter reinforcer durations (cf. Allison, 1980).
The pigeon's tendency to distribute local responserates across a diurnal feeding pattern is not readilyexplainable by models emphasizing molar equilibriumstates (e.g., Premack, 1965; Timberlake, 1980). Thepeak afternoon response rates clearly violate the lawof least effort and appear incompatible with a simplematching interpretation (Herrnstein, 1970; Mazur,1975). These data also seem inconsistent with a tendency to optimize response allocations (Staddon,1979). The response pattern appears most consonantwith the hypothesis that constraints on preferred patterns of access to food increase the underlying motivation for food-related behaviors (Hirsch & Collier,1974). This pattern-deprivation hypothesis followsfrom the more general response-deprivation condition defined with respect to the local pattern of contingent behavior (Allison & Timberlake, 1975).
An additional prediction appears to follow fromthe pattern-deprivation hypothesis. Note that, undera constant contingency, the constraint imposed by
the schedule on the contingent behavior will varydirectly, across time, with the baseline pattern ofcontingent behavior. In this way, the schedules usedin the present study, although held constant acrossthe day, imposed more of a restriction on the pigeon'spreferred feeding pattern during the afternoon periods when unconstrained feeding was typically morefrequent. Consistent with the pattern-deprivation hypothesis, these periods also supported the most instrumental responding. It follows, from these arguments, that if the baseline pattern of the contingentbehavior were changed, then the amount of constraint would change in a corresponding manner,producing a shift in the distribution of instrumentalbehavior. That is, if the baseline pattern of the contingent behavior changes, then the pattern of instrumental responding should reflect the contingent behavior's shift in baseline pattern.
The local response patterns found in Experiment 2support this prediction. As noted above, the pigeonresponds to restrictions on access to food primarilyby increasing bout length (Zeigler et al., 1971). Acrossthe restrictions on reinforcer duration in Experiment 2, the time spent keypecking increased by afactor of 7 to 10 times that for keypecking underthe longest reinforcer duration. However, an examination of individual records indicates that thefrequency of response bouts remained relatively constant under these same conditions. Instead, instrumental performance was characterized by longerbouts of responding, a pattern consistent with the expected change in feeding pattern following restrictedintake. This Observation, together with the diurnalpattern of keypecking, suggests that the local distribution of keypecking may be best characterized as apattern of responding that tracked local changes inthe preferred pattern of feeding behavior.
Dunham (1977) has discussed some of the difficulties in defining momentary measures of responseprobability (see, also, Timberlake, 1980; Timberlake& Allison, 1974). Instead, Dunham suggests measuring preferred "burst durations" and "interburstintervals." In practice, this optimal-duration modelappears to be highly similar to the pattern-deprivationhypothesis proposed here. However, Dunham (1977)emphasizes that no molar change in contingent accessis required by the optimal-duration model. The present data suggest that, required or not, molar changesin the contingent response frequency occur whenconstraints are applied to the local pattern of access(cf. Premack, 1965, pp. 172-173). Furthermore, theobservation that different components of the feedingpattern varied in their elasticity in response to schedule restrictions underscores the difficulty in ensuringthat no molar changes have occurred in the contingent behavior. Thus, the difference here may be moreone of emphasis than substance.

REINFORCER AVAILABILITY IN 24-HOUR SESSIONS 423
The description of local baseline patterns remainsan empirical problem. In many cases, molar estimates of baseline responding may be adequate to predict the effects of a response contingency. However,local measures appear necessary to predict the patterns in instrumental performance produced by constraints applied at local levels on reinforcer availability. For the pigeon's bimodal feeding pattern,rates based on frequent (e.g., hourly) time samplesappear to be adequate (cf. Terhune, 1978). However,measures within feeding bouts revealed that some responding changed within a time frame of 15 sec orless. It seems unlikely that the pigeon would defendits diurnal pattern with such accuracy. But, once afeeding bout was initiated, the pigeon clearly appeared to defend some local measure of bout duration, as Dunham's (1977) model would predict. Presumably, these molecular patterns reflect the operation of underlying physiological mechanisms. In thisregard, Zeigler's (1976) conclusion that oral stimuliplaya tonic role in "motivating" the pigeon's feeding activity seems particularly relevant.
REFERENCES
ALLISON, J. Demand economics and experimental psychology.Behavioral Science, 1979,24,403-415.
ALLISON, J. Conservation, matching, and the variable-intervalschedule. Animal Learning & Behavior, 1980,8, 185-192.
ALLISON, J., MILLER, M., &WOZNY, M. Conservation in behavior.Journal ofExperimental Psychology: General, 1979, 108.4-34.
ALLISON, J., & TIMBERLAKE, W. Instrumental and contingentsaccharin-licking in rats: Response deprivation and reinforcement. Learning and Motivation, 1974, 5, 231-247..
ALLISON, J., & TIMBERLAKE, W. Response deprivation and instrumental performance in the controlled-amount paradigm.Learning and Motivation, 1975,6, 122-142.
COLLIER, G., HIRSCH, E., & HAMLIN, P. The ecological determinants of reinforcement in the rat. Physiology & Behavior,1972, 9, 705-716.
COLLIER, G., HIRSCH, E., & KANAREK, R. The operant revisited.In W. K. Honig & J. E. R. Staddon (Eds.), Handbook of operantbehavior. Englewood Cliffs, N.J: Prentice-Hall, 1977.
DUNCAN, I. J. W., HORNE, A. R., HUGHES, B. 0., & WOODGUSH, D. G. M. The pattern of food intake in female brownleghorn fowls as recorded in a Skinner box. Animal Behaviour,1970, 18, 245-255.
DUNHAM, P. The nature of reinforcing stimuli. In W. K. Honig& J. E. R. Staddon (Eds.), Handbook of operant behavior.Englewood Cliffs, N.J: Prentice-Hall, 1977.
HERRNSTEIN, R. On the law of effect. Journal of the ExperimentalAnalysis ofBehavior, 1970,8,399-412.
HIRSCH, E., & COLLIER, G. The ecological determinants of reinforcement in the guinea pig. Physiology & Behavior, 1974, 12,239-249.
HURSH, S. R. The economics of daily consumption controllingfood- and water-reinforced responding. Journal of the Experimental Analysis ofBehavior, 1978, 29,475-491.
HURSH, S. R. Economic concepts for the analysis of behavior.Journal of the Experimental Analysis of Behavior, 1980, 34,219-238.
KANAREK, R. B. Availability and caloric density of the diet asdeterminants of meal patterns in cats. Physiology & Behavior,1975,15,611-618.
LEA, S. E. G. Psychology and economics of demand. PsychologicalBulletin, 1978, 8S, 441-446.
MAZUR, J. E. The matching law and quantifications related toPremack's principle. Journal of Experimental Psychology:Animal Behavior Processes, 1975, I, 374-386.
McFARLAND, D. J. Phase relationships between feeding anddrinking in the Barbary dove. Journal of Comparative andPhysiological Psychology, 1967,63,208-213.
MURTON, R. K. The wood pigeon. London: Collins, 1965.PREMACK, D. Reinforcement theory. In D. Levine (Ed.), Nebraska
Symposium on Motivation (Vol. 13). Lincoln: University ofNebraska Press, 1965.
SCHMID, W. D. Energy intake of the mourning dove Zenaiduramacroura marginella. Science, 1965,150,1171-1172.
STADDON, J. E. R. Operant behavior as adaptation to constraint.Journal ofExperimental Psychology: General, 1979,108,48-67.
TERHUNE, J. G. The relationship between momentary responseprobabilities and momentary reinforcement effects. AnimalLearning & Behavior, 1978,6, 187-192.
TIMBERLAKE, W. The application of the matching law to simpleratio schedules. Journal of the Experimental Analysis of Behavior, 1977,27,215-217.
TIMBERLAKE, W. A molar equilibrium theory of learned performance. In G. H. Bower (Ed.), Psychology of learning andmotivation (Vol. 14). New York: Academic Press, 1980.
TIMBERLAKE, W., & ALLISON. J. Response deprivation: Anempirical approach to instrumental performance. PsychologicalReview, 1974,81,146-164.
VAN HEMEL. S. B., & MEYER, J. S. Feeding patterns and responses to caloric dilution in the Japanese quail. Physiology& Behavior, 1969,4,339-344.
ZEIGLER, H. P. Feeding behavior of the pigeon. In J. S. Rosenblatt,R. A. Hinde, E. Shaw, & C. Beer (Eds.), Advances in the studyofbehavior (Vol. 7). New York: Academic Press, 1976.
ZEIGLER, H. P., & FELDSTEIN, R. A feedometer for the pigeon.Journal of the Experimental Analysis of Behavior, 1971, 16,181-187.
ZEIGLER, H. P., GREEN, H. L., & LEHRER, R. Patterns of feedingbehavior in the pigeon. Journal of Comparative and Physiological Psychology, 1971,76,468-477.
ZEIGLER, H. P., GREEN, H. L., & SIEGEL, J. Food and waterintake and weight regulation in the pigeon. Physiology & Behavior, 1972,8, 127-134.
ZEIGLER, H. P., MILLER, M., & LEVINE, R. R. Trigeminal nerveand eating in the pigeon (Columba livia): Neurosensory controlof the consummatory response. Journal of Comparative andPhysiological Psychology, 1975,89,845-858.
NOTES
I. Proponents of response deprivation generally do not invokemotivation as an intervening variable (e.g., Timberlake & Allison,1974). However, it is clear that the response-deprivation conditiondescribes a state of the organism in which a change in behavior ispredicted. This is the sense in which the term is used here.
2. I am indebted to Bill Timberlake for suggesting this term.3. None of the subjects had had any experience on fixed
deprivation schedules. Feeder and keypeck training were previously accomplished without specific deprivation by removingavailable food sources and initiating an autoshaping procedure(Brown & Jenkins, 1968). The shaping procedure used a 30-seckeylight CS, a 6-sec grain delivery, and a fixed 6OO-sec intertrialinterval. Two of the three subjects acquired keypecking in the"afternoon" of the first day, the third subject on the "morning"of the following day.
4. With a mean weight of .02 g per piece of grain, the "grams perminute" measure converts directly to "pecks per second," assuming a peck-to-consumption ratio of 1.2. The mean peck-to-

424 LUCAS
consumption ratio for other pigeons with freestanding food wasabout 1.4 ±.2 pecks per grain, based on observations with thesame grain mixture. Normative data for the White Carneauxpigeon using another grain mixture supports this estimate (Zeigler,Miller, & Levine, 1975).
S. Zeigler (1976) reports that more than 90% of all feeding responses in the pigeon occur at rates above .60 pecks/sec. Based onthe type of feedometer used (Zeigler & Feldstein, 1971), these rates
would not appear to include most time spent inspecting food, sincethe operation of the photocell required a beak position close to contacting (within .S in. of) the grain. This measure did include sorting, although Zeigler and Feldstein took precautions to minimizesorting.
(Manuscript received December 12,1980;revision accepted for publication May I, 1981.)