Solid Waste Management Practices: A Socioeconomic perspective(Book).
121
-
Upload
independent -
Category
Documents
-
view
2 -
download
0
Transcript of Solid Waste Management Practices: A Socioeconomic perspective(Book).

DEDICATION
This work is especially dedicated to my wife Pamellah, and my daughter,
Bethel Baraka Manyah, for their encouragement and contributions towards my
professional growth.
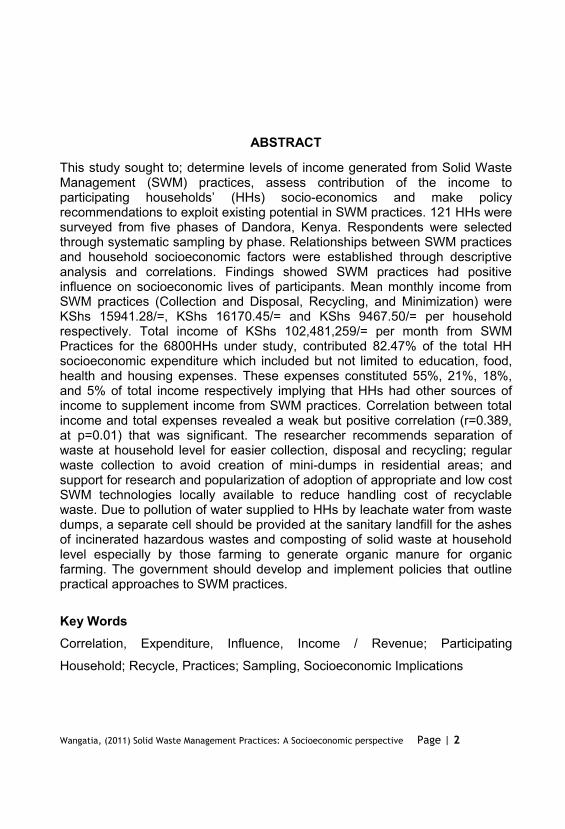
ABSTRACT
This study sought to; determine levels of income generated from Solid WasteManagement (SWM) practices, assess contribution of the income to
(HHs) socio-economics and make policyrecommendations to exploit existing potential in SWM practices. 121 HHs weresurveyed from five phases of Dandora, Kenya. Respondents were selectedthrough systematic sampling by phase. Relationships between SWM practicesand household socioeconomic factors were established through descriptiveanalysis and correlations. Findings showed SWM practices had positiveinfluence on socioeconomic lives of participants. Mean monthly income fromSWM practices (Collection and Disposal, Recycling, and Minimization) wereKShs 15941.28/=, KShs 16170.45/= and KShs 9467.50/= per householdrespectively. Total income of KShs 102,481,259/= per month from SWMPractices for the 6800HHs under study, contributed 82.47% of the total HHsocioeconomic expenditure which included but not limited to education, food,health and housing expenses. These expenses constituted 55%, 21%, 18%,and 5% of total income respectively implying that HHs had other sources ofincome to supplement income from SWM practices. Correlation between totalincome and total expenses revealed a weak but positive correlation (r=0.389, at p=0.01) that was significant. The researcher recommends separation ofwaste at household level for easier collection, disposal and recycling; regularwaste collection to avoid creation of mini-dumps in residential areas; andsupport for research and popularization of adoption of appropriate and low cost SWM technologies locally available to reduce handling cost of recyclablewaste. Due to pollution of water supplied to HHs by leachate water from wastedumps, a separate cell should be provided at the sanitary landfill for the ashesof incinerated hazardous wastes and composting of solid waste at householdlevel especially by those farming to generate organic manure for organicfarming. The government should develop and implement policies that outlinepractical approaches to SWM practices.
Key WordsCorrelation, Expenditure, Influence, Income / Revenue; Participating
Household; Recycle, Practices; Sampling, Socioeconomic Implications
TABLE OF CONTENTS
DEDICATION .................................................................................................. 1
ABSTRACT ..................................................................................................... 2
TABLE OF CONTENTS................................................................................... 3
LIST OF FIGURES .......................................................................................... 6
LIST OF TABLES ............................................................................................ 7
ABBREVIATIONS AND ACRONYMS.............................................................. 9
CHAPTER ONE:............................................................................................ 11
INTRODUCTION ........................................................................................... 111.1 Background to the Study............................................................................................ 11
1.2 Statement of the Problem .......................................................................................... 16
1.3 Purpose of the Study ................................................................................................. 17
1.4 Objectives .................................................................................................................. 17
1.5 Research Questions .................................................................................................. 18
1.6 Significance of the Study ........................................................................................... 18
1.7 Delimitation of the Study............................................................................................ 19
1.8 Limitations of the Study.............................................................................................. 19
1.9 Assumptions of the Study .......................................................................................... 20
1.10 Definitions of Significant Terms ............................................................................... 20
CHAPTER TWO: ........................................................................................... 22
LITERATURE REVIEW ................................................................................. 222.1 Introduction ................................................................................................................ 22
2.2 Theoretical Literature................................................................................................. 22
2.3 Empirical Literature.................................................................................................... 28
2.3.1 Solid Waste Collection & Disposal .......................................................................... 28
2.3.2 Solid Waste Recycling ............................................................................................ 34
2.3.3 Solid Waste minimization........................................................................................ 37
2.4 Conceptual framework ............................................................................................... 41
2.5 Summary ................................................................................................................... 42
CHAPTER THREE: ....................................................................................... 43
RESEARCH METHODOLOGY...................................................................... 433.1 Introduction ................................................................................................................ 43
3.2 Research Design ....................................................................................................... 43
3.3 Target Population ...................................................................................................... 43
3.4 Sampling procedure................................................................................................... 44
3.6 Methods of Data Collection........................................................................................ 46
3.7 Validity and reliability ................................................................................................. 47
3.8 Methods of Data Analysis .......................................................................................... 48
3.9 Operational definition of variables.............................................................................. 49
3.10 Summary ................................................................................................................. 50
CHAPTER FOUR: ......................................................................................... 51
DATA ANALYSIS, PRESENTATION AND INTERPRETATION..................... 514.1 Introduction ................................................................................................................ 51
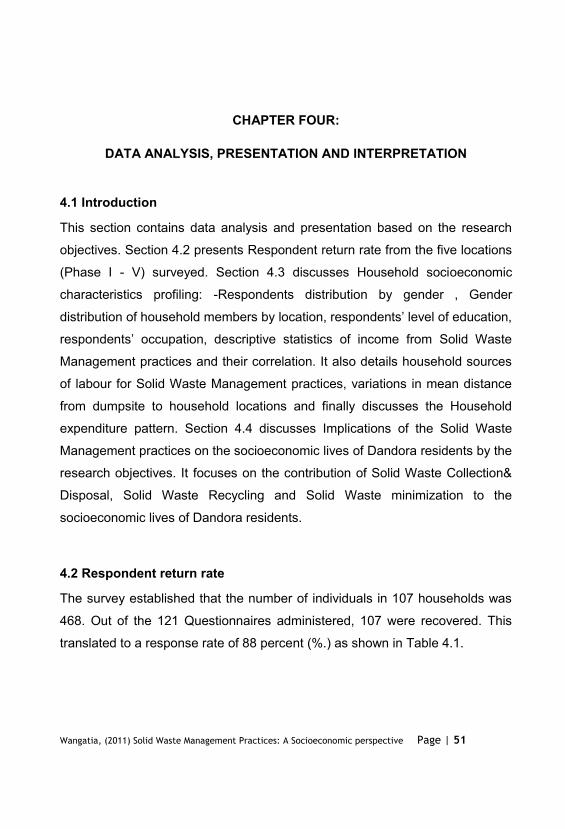
4.2 Respondent return rate .............................................................................................. 51
4.3 Household socioeconomic characteristics (Profile of Respondents).......................... 52
4.3.1 Respondents distribution by gender .................................................................... 52
...................................... 53
..................................................................................... 54
.......................................................................... 54
4.3.3 Occupation of respondents.................................................................................. 56
4.3.4 Descriptive Statistics of income from Solid Waste Management practices ......... 57
4.3.6 Household sources of labour for Solid Waste Management practices ................ 58
4.3.7 Solid Waste Management charges and transportation........................................ 60
4.3.8 Location (Distance in metres) and income from Solid Waste Management
practices....................................................................................................................... 61
4.3.9 Respondents total income and expenditure pattern ............................................ 64
4.4 Implications of Solid Waste Management practices on socioeconomic lives of
Dandora residents ........................................................................................................... 67
4.4.1 The Influence of Solid Waste Collection and Disposal on socioeconomic lives of
Dandora residents ........................................................................................................ 68
4.4.2 The Influence of Solid Waste Recycling on socioeconomic lives of Dandora
residents....................................................................................................................... 73
4.4.3 The Influence of Solid Waste minimization on socioeconomic lives of Dandora
residents....................................................................................................................... 77
4.4.4 Correlations for combined Solid Waste Management Income against total
expenditure .................................................................................................................. 81
4.4.5 Patterns of household pooled Income and Expenditure statistics ....................... 84
CHAPTER FIVE: ........................................................................................... 87
SUMMARY OF FINDINGS, DISCUSSIONS, CONCLUSIONS AND
RECOMMENDATIONS ................................................................................. 875.1 Introduction ................................................................................................................ 87
5.2 Summary ................................................................................................................... 87
5.3 Discussions................................................................................................................ 88
5.4 Conclusions ............................................................................................................... 92
5.5 Recommendations..................................................................................................... 96
5.5 Suggestions for future research................................................................................. 98
REFERENCES.............................................................................................. 99
APPENDICES ............................................................................................. 105Appendix A: Waste disposal methods for various major companies in Nairobi ............. 105
Appendix B: Questionnaire for Households in Dandora................................................. 107
LIST OF FIGURES
Figure 1: Human Ecosystems
Figure 2: Conceptual Framework o 42
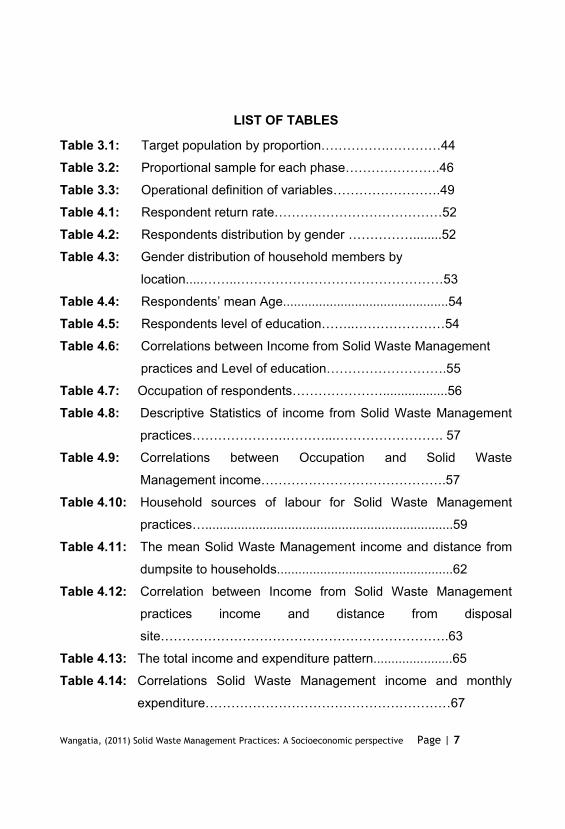
LIST OF TABLES
Table 3.1: Target population by proportion 44
Table 3.2: Proportional sample for each phase 46
Table 3.3: Operational definition of variables 49
Table 4.1: Respondent return rate
Table 4.2: Respondents distribution by gender .....52
Table 4.3: Gender distribution of household members by
location 3
Table 4.4: ..............................................54
Table 4.5: Respo
Table 4.6: Correlations between Income from Solid Waste Management
practices and Level
Table 4.7: Occupation of respondents ..................56
Table 4.8: Descriptive Statistics of income from Solid Waste Management
pr . 57
Table 4.9: Correlations between Occupation and Solid Waste
Management income .57
Table 4.10: Household sources of labour for Solid Waste Management
practices .....................................................................59
Table 4.11: The mean Solid Waste Management income and distance from
dumpsite to households.................................................62
Table 4.12: Correlation between Income from Solid Waste Management
practices income and distance from disposal
site
Table 4.13: The total income and expenditure pattern......................65
Table 4.14: Correlations Solid Waste Management income and monthly
expenditure 7
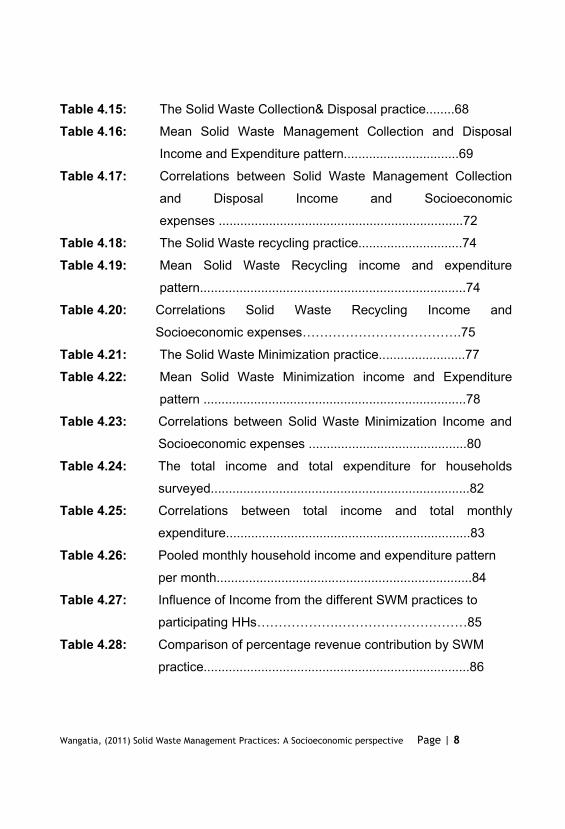
Table 4.15: The Solid Waste Collection& Disposal practice........68
Table 4.16: Mean Solid Waste Management Collection and Disposal
Income and Expenditure pattern................................69
Table 4.17: Correlations between Solid Waste Management Collection
and Disposal Income and Socioeconomic
expenses ....................................................................72
Table 4.18: The Solid Waste recycling practice.............................74
Table 4.19: Mean Solid Waste Recycling income and expenditure
pattern..........................................................................74
Table 4.20: Correlations Solid Waste Recycling Income and
Socioeconomic expenses .75
Table 4.21: The Solid Waste Minimization practice........................77
Table 4.22: Mean Solid Waste Minimization income and Expenditure
pattern .........................................................................78
Table 4.23: Correlations between Solid Waste Minimization Income and
Socioeconomic expenses ............................................80
Table 4.24: The total income and total expenditure for households
surveyed........................................................................82
Table 4.25: Correlations between total income and total monthly
expenditure....................................................................83
Table 4.26: Pooled monthly household income and expenditure pattern
per month.......................................................................84
Table 4.27: Influence of Income from the different SWM practices to
participating HHs
Table 4.28: Comparison of percentage revenue contribution by SWM
practice..........................................................................86
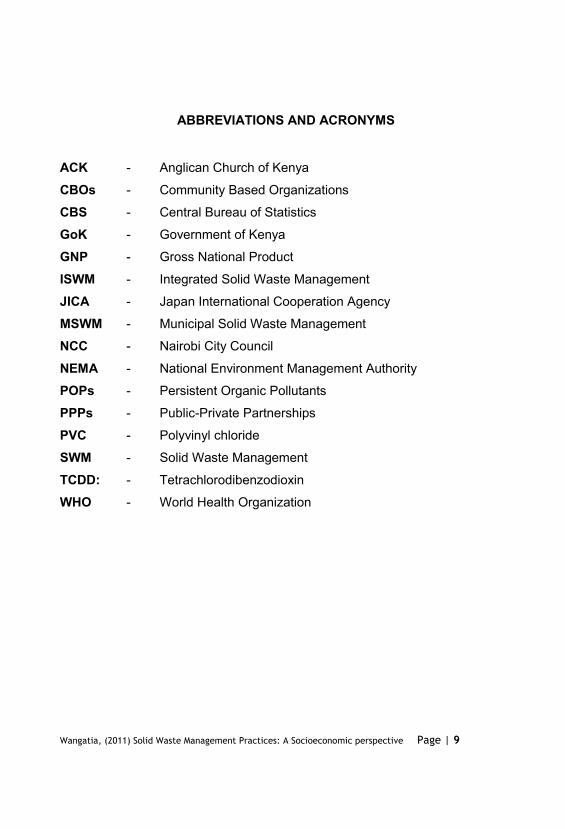
ABBREVIATIONS AND ACRONYMS
ACK - Anglican Church of Kenya
CBOs - Community Based Organizations
CBS - Central Bureau of Statistics
GoK - Government of Kenya
GNP - Gross National Product
ISWM - Integrated Solid Waste Management
JICA - Japan International Cooperation Agency
MSWM - Municipal Solid Waste Management
NCC - Nairobi City Council
NEMA - National Environment Management Authority
POPs - Persistent Organic Pollutants
PPPs - Public-Private Partnerships
PVC - Polyvinyl chloride
SWM - Solid Waste Management
TCDD: - Tetrachlorodibenzodioxin
WHO - World Health Organization
CHAPTER ONE:
INTRODUCTION
1.1 Background to the Study
Effective and sustainable Solid Waste Management is becoming a burgeoning
problem for national and local governments due to rapid increase in volume
and types of Solid and hazardous waste as a result of continuous economic
growth, urbanization and industrialization (Dulo, 2010). The United Nations
Environmental program (UNEP) Integrated Solid Waste Management plan
(UNEP, 2009) estimated that the total amount of municipal solid waste (MSW)
generated globally in 2006 reached 2.02 billion tonnes, representing a seven
(7) percent annual increase since 2003. In addition, it projected that the global
generation of MSW will rise by 37.3 percent, equivalent to approximately eight
(8) percent increase per year between 2007 and 2011. According to UNEP
(2009) 0.5kg to 3kg healthcare waste per person was estimated by the world
Health Organization (WHO) in most low-income countries but no industrial
waste generation estimates were provided. Agricultural waste for twenty five
(25) European Union (EU) member countries was estimated at 700 million
tonnes.
Regionally, the expenditure for developing countries in municipal councils on
solid waste management was estimated at 20 50 percent of their annual
budgets even though 30- 60 percent of all urban solid wastes remains
uncollected with almost 50 percent of the population not served (World Bank,
2008). In comparison, low-income countries spend 80-90 percent, middle-
income countries 50-80 percent while high-income countries spend less that
10 percent of their Municipal Solid Waste Management (MSWM) budget on
collection alone.
According to Scheinberg (2001), developing countries face challenges in
proper management of waste with most effort made to reduce the final
volumes and generate sufficient funds for waste management. He argues that
if most waste could be diverted for material; and resources recovery, then a
substantial reduction in final volumes of waste could be achieved while the
recovered material and resources could be utilized to generate revenue to fund
waste management. Based on the 3Rs (Reduce, Reuse, and Recycle) this
forms the premise of Integrated Solid Waste Management (ISWM) system
principle. With an appropriate segregation and recycling system, a significant
quantity of wastes can be diverted from landfills and converted into a useful
resource.
Scheinberg (2001) documents that developing and implementing ISWM
requires comprehensive data on present anticipated waste situations,
supportive policy frameworks, knowledge and capacity to develop plans or
systems, proper use of environmentally sound technologies and appropriate
financial instruments to support its implementation.
In the East Africa region, the city of Kampala, Uganda with a population of
approximately 1.5 million people is riddled with numerous problems associated
with solid waste management (JICA, 1998). Waste management is the sole
responsibility of the Kampala City Council (KCC) through the city Environment
Department. Here, waste management constitutes garbage collection and
disposal from households, market areas, hospitals, industries, and the city
center. Efforts to manage garbage in the city are continuously overwhelmed
and frustrated with the ever-increasing population of city residents and levels
of economic activity. As result, incompetence and low service coverage
characterize KCC. Often times the service are not on schedule and only
provides them in crucial areas such as market places, residential areas, as
well as politically sensitive areas (JICA, 1998).
The economic and demographic growth of cities in Uganda like other countries
in the developing world is posing serious challenges to the urban local
authorities. With rapidly swelling urban population, the requirement for
infrastructure and services increase manifold. Solid waste management is one
such service that needs to be adequately provided to ensure an urban
environment conducive to the well-being and productivity of the residents.
Some communities in Kampala receive little (in some cases no) solid waste
collection services because local governments have no resources to cover all
households. Thus in the absence of collection services, households use forms
of disposal most of which are heavily polluting. There is also lack of information
on household solid waste generation and how much households value solid
waste management.
population of 3.3 million people (GoK, 2010). The poor economic growth of 1.1
percent in 1993 and less than 2 percent in 2001 resulted in an increase in the
level of poverty that stood at 56 percent in 2001 (Rotich, 2005). Rural-urban
migrations resulted in unplanned settlements in the peri-urban areas
accommodating about 60 percent of the urban population on only 5 percent
urban land area. Consequently, urban centres have experienced comparatively
high growth rates with little infrastructure expansion to match it. This
urbanization and accompanying industrialization in a state of overstretched
infrastructure is one of the major challenges facing the Kenyan government.
The benefits of urbanization in Kenya have therefore been accompanied by
social, economic and environmental problems, some in overwhelming
proportions. These include lack of access to clean drinking water, illegal waste
dumping and improper disposal of solid and hazardous wastes.
Dandora dumpsite located about eight kilometers (five miles) east of Nairobi
city in Embakasi area is the main dumping site for most of the solid waste
generated by the people living in Nairobi (Wambugu, 2010). The Dandora
dump
conditions to which the poor living next to the dump are exposed. This is
because the waste from Dandora Dumpsite has led to poor sanitation for the
people residing in Dandora settlement (slum) which is a low-income residential
area.
Dandora has a high population and has served as a dumping site in Nairobi for
a number of years. The Central Bureau of Statistics (CBS) approximates the
population to be about 30,000 inhabitants. Majority of whom are low and
middle income earners working in the city centre. Others include people living
in Kariobangi, Babadogo, Lakisama and Umoja estates. Some run their small
business for example retail shops, food kiosks, and hair boutiques among
others which produce a lot of wastes to be disposed. The Dandora dumping
site covers a large area of about 30 acres. The area used to be a quarry then it
became a dumping site. Initially, it was an old quarry to be refilled but has now
given rise to an enormous mountain of garbage (Kituo cha Sheria, 2010). The
Dandora dumpsite is run by the City Council of Nairobi which collects levies
from the trucks that dump at the site daily. The private sector has also been
involved in the search for waste management solutions and they are the major
contributors of waste at the dumping sites. Appendix 1 shows a number of
major companies in Nairobi that dump their mixed waste in Dandora dumpsite.
Wambugu
that Health experts have warned residents of the hazards of working in and
living near the dump site. For years now, the community, Civil Society
Organizations, and Faith Based Organizations have asked the Government to
do something about it yet, little has been done. Dumping at the site is
unrestricted leaving industrial, agricultural, domestic and medical wastes
(including used syringes) scattered all over the site. Plastics, rubber, lead paint
treated wood, and poisonous chemicals are just some of the hazardous items
on the dumpsite.
Waste can be categorized into solid and liquid waste. Liquid waste is
sometimes referred to as human waste or excreta. This paper looks primarily
at solid waste. In Nairobi, Polythene bags and plastics, including PVC items,
make up approximately 225 tonnes out of the 2000 tonnes of solid waste
generated daily (KAM, 2003). This represents about 11% of total waste
generated daily, while 75% comprises biodegradable waste that can be
composted. The remaining percentage is made up of other recyclable
materials such as textiles, metal and glass making up 2.7%, 2.6% and 2.3%
respectively. Open burning of municipal waste is widely used by the residents
of Nairobi, as a means of disposing solid waste.
According to Kituo cha Sheria (2010), there are those who relied on the
dumping site for their livelihood and also other animals such as dogs and birds
which scavenge for food in the dumping site. It is worth noting that these
benefits are not yet quantified and neither are they documented.
1.2 Statement of the Problem
Solid waste management is one of the major urban development challenges in
major urban areas. World over, open dumpsites are still the primary means of
managing solid waste (Dulo, 2010). They are found in minor streets across the
cities and in open fields, especially in middle and low-income residential areas
like Dandora, Nairobi. Due to inefficiency in the waste collection system, most
of the wastes from domestic and commercial activities are dumped in these
sites posing a threat to human life and the environment.
According to JICA (1998), until the mid 1970s the Nairobi City Council (NCC)
singly collected over 90 per cent of the waste. In the late seventies, the Council
owned 118 waste collection trucks which still had great difficulties collecting
800 tons of waste generated daily then. Currently, the council has less than 20
trucks which are expected to collect 2600 tons generated daily though
collection has been partly outsourced to the private sector. Nairobi City Council
(2002) admitted that the Council was unable to manage waste effectively in the
city and of particular concern was the proliferation of informal medical facilities,
some of which are located within residential areas.
UNEP (2005), on solid waste management in Kenya shows that in Nairobi,
with about 3.3 million people, only about 25% of the estimated 2,600 tonnes of
solid waste generated daily gets collected but is dumped in the open at the
only disposal site in Dandora whose capacity has been exceeded. Of this, 68%
is municipal waste generated from households. The problem has been
compounded by the high population density settlements that have emerged in
Dandora some of which are less than the recommended one kilometer (1km)
buffer between the waste and the settlements posing serious social,
environmental and economic problems to the residents and indeed the entire
City of Nairobi (NCC, 2010).
The available literature highlights the low capacity of collection and
transportation of solid waste by major players citing evidence of quantities
generated. Little is known on the contribution of the SWM practices on the
social and economic lifestyles of residents. This study sought to assess the
influence of Solid Waste management practices on the socioeconomic lives of
residents of Dandora, Nairobi.
1.3 Purpose of the Study
The purpose of this study was to assess the influence of Solid Waste
Management practices on the socioeconomic lives of residents of Dandora,
Nairobi.
This study hypothesized that: Solid Waste Management Practices have no
influence on socioeconomic lives of participating households.
1.4 Objectives
The specific objectives of this study were to:
i. To evaluate the influence of Solid Waste Collection and Disposal as a
management practice on the socioeconomic lives of residents of Dandora,
Nairobi.
ii. To assess the influence of Solid Waste Recycling as a management
practice on the socioeconomic lives of residents of Dandora, Nairobi.
iii. To assess the influence of Solid Waste minimization as a management
practice on the socioeconomic lives of residents of Dandora, Nairobi.
1.5 Research Questions
i. What is the influence of Solid Waste Collection and Disposal as a
management practice on the socioeconomic lives of residents of Dandora,
Nairobi?
ii. What is the influence of Solid Waste Recycling as a management practice
on the socioeconomic lives of residents of Dandora, Nairobi?
iii. What is the influence of Solid Waste Minimization as a management
practice on the socioeconomic lives of residents of Dandora, Nairobi?
1.6 Significance of the Study
The Kenya Vision 2030 aims to achieve a nation that has a clean, secure and
sustainable environment by 2030. Emphasized by the Millennium
development goals, the specific strategies for realising these aims include:
Improving pollution and waste management through the application of the right
economic incentives, Promoting environmental conservation to better support
-private partnerships
(PPPs) for improved efficiency in water and sanitation and enhancing disaster
preparedness in all disaster-prone areas as well as improving the capacity for
adaptation to global climatic change.
The findings of the study will provide useful information to the policy makers in
the Ministries of Environment and Mineral Resources as well as Public health
in pursuing the aims of Vision 2030 on sustainable development.
By assessing extent to which residents participate in solid waste management
activities the study will reveal socioeconomic relevance of the dumpsite to
residents and recommend possible best SWM practices to improve their
welfare and optimized participation with maximum benefits.
Nairobi City Council will find the results of this study useful for application as a
basis for decision making on administrative policies based on highlighted
household opinion on the dumpsite relocation debate.
It is also hoped that the findings of this study will help raise awareness on
issues pertaining SWM at the NCC, community and National levels to help
build initiatives to reduce the SWM problem.
Finally, this study contributes to literature on Solid Waste Management
practices for reference by other researchers.
1.7 Delimitation of the Study
The study was limited to Dandora dumpsite, Nairobi which lies on Latitude -
1.25° , Longitude 36.9° covering well over 30 acres and which acted as a
representative of other dumping sites countrywide. The study focused on the
influence of Solid waste management practices (Solid Waste Collection and
Disposal, Solid Waste Recycling and Solid Waste minimization) on the
socioeconomic lives of residents of Dandora, Nairobi considering the high
population and the high rate of unemployment that have forced the area
residents to find alternative sources of income at the Dandora dumpsite.
1.8 Limitations of the Study
The researcher experienced the following limitations: -
i. Uncooperative RespondentsAll respondents were given assurance of confidentiality for information
collected in the survey.
ii. Suspicion
The researcher explained to the respondents that their responses are meant
solely for the purpose of the study and will not be used against them. Writing of
iii. Delays in processing the research permitThe researcher factored in time for processing the research permit though it
took longer that the set time. The researcher employed research assistants in
data collection to ensure the research was done within specified time.
1.9 Assumptions of the Study
The study had the following basic assumptions, that: -
i. The residents of Dandora participated in Solid Waste Management
practices
ii. The Solid Waste Management Practices influence the socioeconomic lives
of residents of Dandora, Nairobi
1.10 Definitions of Significant Terms
This section gives definition of the significant terms as used in this study.
Government policies: - a plan of action adopted or pursued by the
government of Kenya on waste management.
The rules and regulations set defining proper
waste management procedures to enhance
sustainable development
Household participation: - refers to gender roles in the solid waste
management practices
Influence: - affect, to shape, to change or contribute towards
Socio-economic lives: - the social (health) and economic (income
derived from SWM activities) lives of Dandora
residents
Solid waste: - is defined as Solid or semi-solid, non-soluble
material such as agricultural refuse, demolition
waste, industrial waste, mining residues,
municipal garbage and sewage sludge.
Solid waste Collection & Disposal: - refers to the process of picking of
waste from households, transportation and
dumping at designated points
Solid waste management: - Is the Systematic control of generation,
collection, storage, transport, source separation,
processing, treatment, recovery, and disposal of
solid waste.
Solid Waste minimization: - Refers to burning of solid waste which includes
the application of open air burning and use of
industrial incinerators.
Solid Waste Recycling: - refers to resource recovery activities such as
recovering or diverting wastes from the waste
stream to reuse, sell, giving away or compost in
the case of food wastes at the household level.
This could include repair, re-manufacture and
conversion of materials, parts and products
CHAPTER TWO:
LITERATURE REVIEW
2.1 Introduction
This chapter presents a review of theoretical and empirical literature on Solid
waste management. The concept of solid waste management and related
practices is discussed with its possible social, economic and environmental
implications on mankind. The concept will be used to assess the implications
of solid waste management practices on the residents of Dandora, Nairobi.
2.2 Theoretical Literature
Just as the generation of waste involves a complex interplay of social, cultural,
economic and technological processes, the proper management of waste
cannot be divorced from the same processes. Though necessary, for
conceptual purposes, to view waste management as a clear and distinct
category of activity in society, in practice any successful waste management
strategy has to address diverse issues such as patterns of consumption,
incentive systems -the economics of waste management, waste handling
technology and legal frameworks. Largely, the issue of waste management
searches for sustainable development strategies (ENVILEAD, 2005).
a product or material that does not have a value anymore for the first user and
waste could have value to another person in a different circumstance or even
in a different culture. There are many large industries that operate primarily or
exclusively using waste materials like paper and metals as their industrial feed
stocks (Scheinberg, 2001).
This study is based on the theory of human ecology which recognizes that
natural systems have evolved over time and are being threatened by
technological development initiated by industrial revolution and the resultant
population explosion (Jarry and Jarry, 1995). According to Ali (2009),
Environmental problems result from the interaction between the human society
and ecological systems. The human system destroys the ecological system
through increased feed growing population requiring water, energy, food and
developmental space. All these anthropogenic activities lead to waste
generation for resources that are not properly utilized. The important indices
here include environmental degradation (pollution of land and water that upset
the balance of many smaller systems). The studies on human ecology centre
on application of ecological principles to understand spatial distribution of
social groups and their relationships. Urban ecology on the other hand focuses
neighbourhoods.
Urban ecosystems are complex environmental, social, economic, cultural and
political environments. Their wellbeing can be measured in a variety of ways,
including the health status of the human population, the health of the biotic
community, the quality of the built and natural environments, the health of their
contained biotic community, their impact on regional and global ecosystems
and the effectiveness with which they function in social, economic and political
terms.
The urban physical environment is both built and natural, and is contained
within a wider regional system and global biosphere. Threats to human health
stemming from the physical environment result from our failure to create livable
built environments, our pollution of air, water, soil and food chains within the
urban area, and adverse changes in regional ecosystems and at the global
level stemming at least in part from the way we design and operate urban
settlements.
Human health is ultimately dependent on the health of the planet and of the
natural ecosystems within which we live. However, since man spends most of
their time in human-created ecosystems (cities and towns) which have both
physical and social dimensions, our health is also significantly dependent upon
the health of those urban ecosystems. Man needs to learn how to manage
urban settlements as ecosystems in ways that will enhance both human health
and the health of natural ecosystems.
In assessing the socioeconomic implications of Dandora Dumpsite on area
residents, this study applies the Human Ecosystems Model (HEM) developed
by Machlis, Force and Burch (2005) with emphasis on the role of solid waste
management practices. The model combines the benefits of the ecosystems
models that incorporate human energy consumption and transformation with
social processes that influence energy use (Luzadis et. al., 2002). The Model
provides a basis for using a systems approach by describing the internal
behaviour of a system and the interactions with external systems. It provides a
basis for examining different types of system changes by clarifying
relationships between social and biophysical patterns and processes (Luzadis
et. al., 2002).
According to Machlis et al. (2005), the human ecosystem is defined as a
coherent system of biophysical and social factors capable of adaptation and
sustainability over time. Human ecosystems rest upon a foundation of biotic
and abiotic factors taken as base conditions: a solar-driven energy system
obeying thermodynamic properties, biogeochemical cycles of high constancy,
landforms and geological variation of great complexity, the full genetic
structure of life including biophysical properties of homosapiens. The base
conditions limit, constrain, influence and occasionally direct many human
ecosystem processes. Boundaries can be spatially identified through
ecological transition zones, administrative and political boundaries, or more
fine-scaled analysis of sharp perturbations in system flows.
Within any particular human ecosystem, a set of critical resources is required
in order to provide the system with necessary supplies. These include
biophysical, socioeconomic, and cultural resources. The flow and use of these
critical resources are regulated by the social system, the set of general social
structures (including institutions, patterns and processes) that guide much of
human behavior.
The social system is composed of three subsystems (Figure 1). The first
subsystem is a set of social institutions, defined as collective solutions to
universal challenges, wants and needs. The second subsystem is a series of
social cycles referring to temporal patterns for allocating human activity while
the third subsystem is the social order, which is a set of cultural patterns for
organizing interaction among people and groups, and people and nature.
Combined, these three subsystems constitute the social system. Joined with
the flow of resources, this creates the human ecosystem.
Within this structure, key flows transfer individuals of varying species,
information from genetic to cultural, energy, materials - here including natural
resources such as water, and man-made materials, nutrients and money.
These flows within and between human ecosystems vary by rate, intensity,
duration, frequency, and distribution. Flows between structural components of
human ecosystems designate most biophysical and socio-cultural processes.
The human ecosystems are multi-scaled and hierarchically nested. The model
is primarily useful for predicting and evaluating spilling and non-linear first-,
second-, and third-order effects and is capable of synthesizing a large range of
theory, method, and evidence.
The model includes key elements like critical resources particularly
socioeconomic resources (income, and capital), cultural resources
(organizational capacity and practices) plus social institutions herein
represented by the residents of Dandora focusing on their role in solid Waste
management. It also looks at the social cycles associated with the two and the
social order resulting from income differentials, attitudes, perceptions and
practices in the specific neighbourhoods.
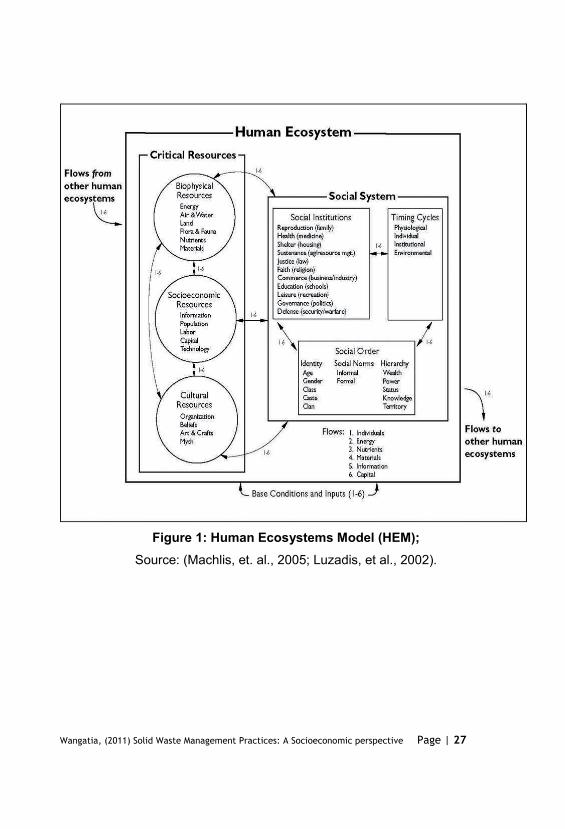
Figure 1: Human Ecosystems Model (HEM); Source: (Machlis, et. al., 2005; Luzadis, et al., 2002).
2.3 Empirical Literature
This section presents a review of empirical literature on Solid waste
management practices. The concept of solid waste management practices is
discussed with their social, economic and environmental implications human
lives.
2.3.1 Solid Waste Collection & Disposal
Waste collection is one of the most visible urban services. Agunwamba, (1998)
studying Solid Waste Management in Nigeria: Problems and issues were
mainly interested in two indicators: waste collection coverage and availability of
vehicles and equipment. Although these two indicators are correlated, they
found it important to enquire about both of them, as the former reflects the
interests of system users, while the later is primarily important for service
providers. Coverage represents the percentage of total households served,
reported separately for slum, low-, middle-, high-income city areas and total
city.
Agunwamba, (1998) documents that despite the formulation and
implementation of the Federal Environmental Protection Agency (FEPA) as
well as a national environmental policy, the environment has not been
adequately protected. Interests have been mainly on aesthetics which are
rarely achieved. Waste collection is therefore irregular and restricted to the
major cities. Improperly cited open dumpsites deface several cities, thus
endangering public health by encouraging the spread of odours and diseases,
uncontrolled recycling of contaminated goods and pollution of water sources.
According to World Bank (1999), Cities in both developed and developing
countries generally do not spend more than 0.5 per cent of their per capita
gross national product (GNP) on urban waste services, which covers only
about one-third of overall cost. The responsibility over solid waste collection
and disposal is thus well beyond the capacity of municipal governments. More
than 80 per cent of the total waste management costs in low-income countries
are collection costs (World Bank, 1999).
In Latin America the cost of waste collection was about 46 per cent of the total
municipal solid waste management cost (World Bank, 1999). Cost recovery in
SWM service is difficult because, even though there is some willingness to pay
for waste collection service, there is little such willingness for waste disposal.
Municipal authorities have consequently financed the services traditionally
through general revenues or attempted to charge for the service through
inefficient property tax. Due to the existence of willingness to pay, however,
private provision of waste collection has potential. In addition, limited
economies of scale and ease of entry and exit in waste collection imply that
competition can keep the price of the private service competitive.
The effect is that an increasing proportion of urban dwellers in developing
countries, particularly the urban poor, will lack access to municipal solid waste
management services hence suffer from pollution-related environmental and
health problems. Fortunately, there are ways of dealing with or minimizing this
problem. One of which is the use of well-designed economic instruments to
create the requisite incentives (UNEP, 2005).
Vasanthi, Kaliappan and Srinivasaraghavan (2007) in their study on Impact of
poor solid waste management on ground water investigated the quality of
ground water around a municipal solid waste disposal site in Chennai, India.
Chemical analyses carried out on water samples collected at various radial
distances from the boundary of the dumping yard, at intervals of 3 months and
for a period of 3 years revealed that the ground water quality does not conform
to the drinking water quality standards as per Bureau of Indian Standards. The
effects of dumping activity on ground water appeared most clearly as high
concentrations of total dissolved solids, electrical conductivity, total hardness,
chlorides, chemical oxygen demand, nitrates and sulphates. Leachate
collected from the site showed presence of heavy metals. The study revealed
that the contaminant concentrations tend to decrease, during the post
monsoon season and increase, during the pre monsoon season in most of the
samples. The study indicated that landfills in densely populated cities should
have the ground water monitored on regular basis and that ground water in
and around the landfill sites should not be used for drinking purposes unless it
meets specific standards. The study recommended that indiscriminate
dumping of wastes in developed areas without proper solid waste
management practices should be stopped(Vasanthi, Kaliappan and
Srinivasaraghavan, 2007).
UNEP, (2005) on Selection, design and implementation of economic
instruments (in solid waste management, Nairobi.) reports that the magnitude
and nuisance of the solid waste management problem in Nairobi motivated
was
situation, is largely characterized by low coverage of solid waste management
services, pollution from uncontrolled dumping of waste, inefficient public
services, chaotic or unregulated private sector participation, and lack of key
solid waste management infrastructure. In Nairobi with about 3.3 million people,
only about 25 per cent of the estimated 2,000 tonnes of solid waste generated
daily gets collected and dumped at Dandora dumpsite. Yet, until the mid 1970s
the Nairobi City Council (NCC) singly collected over 90 per cent of the waste
(JICA, 1998).
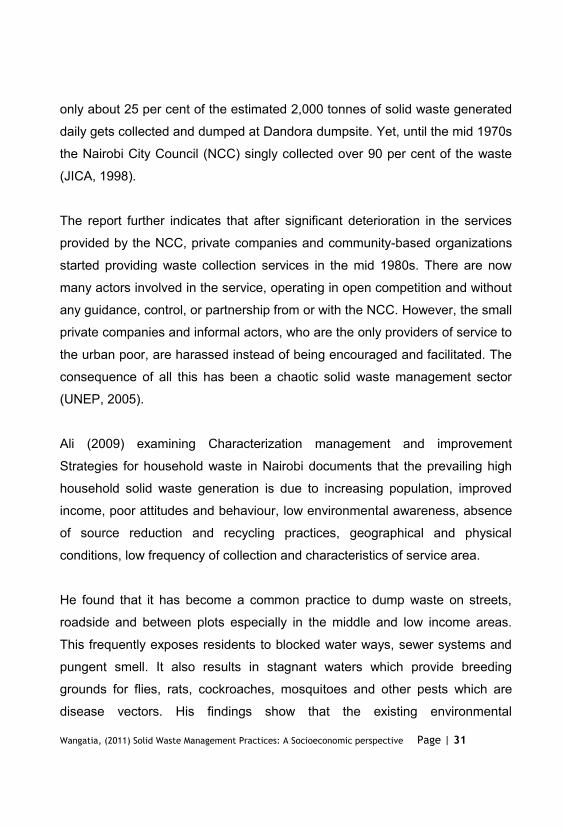
The report further indicates that after significant deterioration in the services
provided by the NCC, private companies and community-based organizations
started providing waste collection services in the mid 1980s. There are now
many actors involved in the service, operating in open competition and without
any guidance, control, or partnership from or with the NCC. However, the small
private companies and informal actors, who are the only providers of service to
the urban poor, are harassed instead of being encouraged and facilitated. The
consequence of all this has been a chaotic solid waste management sector
(UNEP, 2005).
Ali (2009) examining Characterization management and improvement
Strategies for household waste in Nairobi documents that the prevailing high
household solid waste generation is due to increasing population, improved
income, poor attitudes and behaviour, low environmental awareness, absence
of source reduction and recycling practices, geographical and physical
conditions, low frequency of collection and characteristics of service area.
He found that it has become a common practice to dump waste on streets,
roadside and between plots especially in the middle and low income areas.
This frequently exposes residents to blocked water ways, sewer systems and
pungent smell. It also results in stagnant waters which provide breeding
grounds for flies, rats, cockroaches, mosquitoes and other pests which are
disease vectors. His findings show that the existing environmental
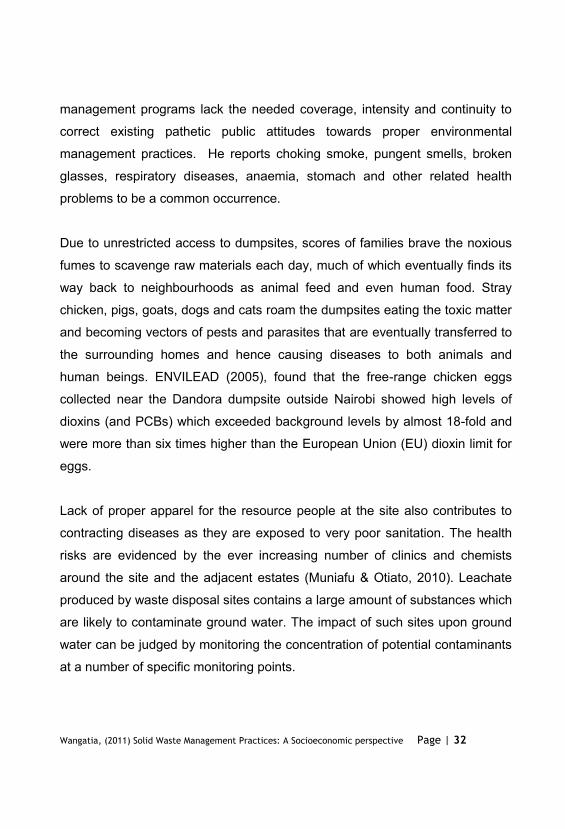
management programs lack the needed coverage, intensity and continuity to
correct existing pathetic public attitudes towards proper environmental
management practices. He reports choking smoke, pungent smells, broken
glasses, respiratory diseases, anaemia, stomach and other related health
problems to be a common occurrence.
Due to unrestricted access to dumpsites, scores of families brave the noxious
fumes to scavenge raw materials each day, much of which eventually finds its
way back to neighbourhoods as animal feed and even human food. Stray
chicken, pigs, goats, dogs and cats roam the dumpsites eating the toxic matter
and becoming vectors of pests and parasites that are eventually transferred to
the surrounding homes and hence causing diseases to both animals and
human beings. ENVILEAD (2005), found that the free-range chicken eggs
collected near the Dandora dumpsite outside Nairobi showed high levels of
dioxins (and PCBs) which exceeded background levels by almost 18-fold and
were more than six times higher than the European Union (EU) dioxin limit for
eggs.
Lack of proper apparel for the resource people at the site also contributes to
contracting diseases as they are exposed to very poor sanitation. The health
risks are evidenced by the ever increasing number of clinics and chemists
around the site and the adjacent estates (Muniafu & Otiato, 2010). Leachate
produced by waste disposal sites contains a large amount of substances which
are likely to contaminate ground water. The impact of such sites upon ground
water can be judged by monitoring the concentration of potential contaminants
at a number of specific monitoring points.
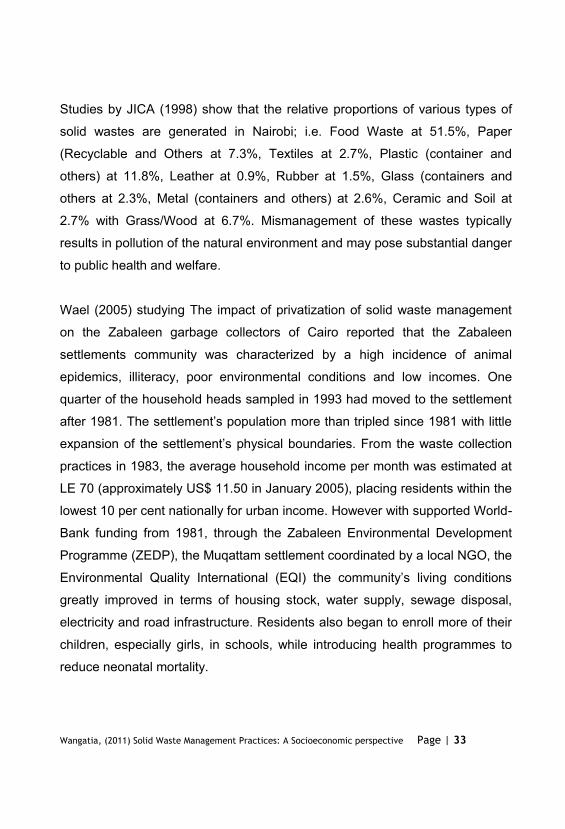
Studies by JICA (1998) show that the relative proportions of various types of
solid wastes are generated in Nairobi; i.e. Food Waste at 51.5%, Paper
(Recyclable and Others at 7.3%, Textiles at 2.7%, Plastic (container and
others) at 11.8%, Leather at 0.9%, Rubber at 1.5%, Glass (containers and
others at 2.3%, Metal (containers and others) at 2.6%, Ceramic and Soil at
2.7% with Grass/Wood at 6.7%. Mismanagement of these wastes typically
results in pollution of the natural environment and may pose substantial danger
to public health and welfare.
Wael (2005) studying The impact of privatization of solid waste management
on the Zabaleen garbage collectors of Cairo reported that the Zabaleen
settlements community was characterized by a high incidence of animal
epidemics, illiteracy, poor environmental conditions and low incomes. One
quarter of the household heads sampled in 1993 had moved to the settlement
m the waste collection
practices in 1983, the average household income per month was estimated at
LE 70 (approximately US$ 11.50 in January 2005), placing residents within the
lowest 10 per cent nationally for urban income. However with supported World-
Bank funding from 1981, through the Zabaleen Environmental Development
Programme (ZEDP), the Muqattam settlement coordinated by a local NGO, the
greatly improved in terms of housing stock, water supply, sewage disposal,
electricity and road infrastructure. Residents also began to enroll more of their
children, especially girls, in schools, while introducing health programmes to
reduce neonatal mortality.
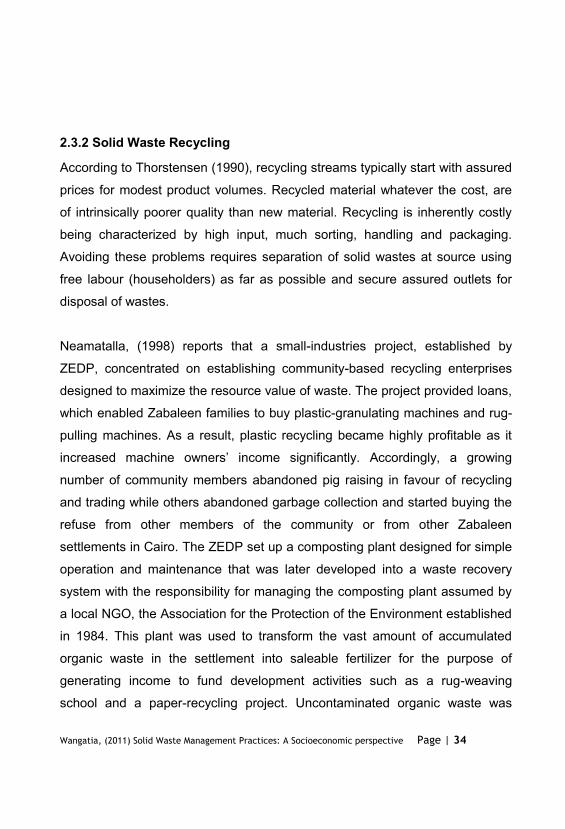
2.3.2 Solid Waste Recycling
According to Thorstensen (1990), recycling streams typically start with assured
prices for modest product volumes. Recycled material whatever the cost, are
of intrinsically poorer quality than new material. Recycling is inherently costly
being characterized by high input, much sorting, handling and packaging.
Avoiding these problems requires separation of solid wastes at source using
free labour (householders) as far as possible and secure assured outlets for
disposal of wastes.
Neamatalla, (1998) reports that a small-industries project, established by
ZEDP, concentrated on establishing community-based recycling enterprises
designed to maximize the resource value of waste. The project provided loans,
which enabled Zabaleen families to buy plastic-granulating machines and rug-
pulling machines. As a result, plastic recycling became highly profitable as it
number of community members abandoned pig raising in favour of recycling
and trading while others abandoned garbage collection and started buying the
refuse from other members of the community or from other Zabaleen
settlements in Cairo. The ZEDP set up a composting plant designed for simple
operation and maintenance that was later developed into a waste recovery
system with the responsibility for managing the composting plant assumed by
a local NGO, the Association for the Protection of the Environment established
in 1984. This plant was used to transform the vast amount of accumulated
organic waste in the settlement into saleable fertilizer for the purpose of
generating income to fund development activities such as a rug-weaving
school and a paper-recycling project. Uncontaminated organic waste was
sorted for the production of higher-grade compost, with retrieval of up to 80 per
cent of the materials and with the remaining 20 per cent being dumped on the
outskirts of the city. This recycling system prevented the need for unsanitary
landfills, as well as protecting the environment from the uncontrolled disposal
of organic waste.
Despite the physical improvements within the Muqattam settlement, poor Solid
Waste Management and leadership skills led to a state of dependency on
Environmental Quality International (EQI) instead of full community
participation. Representation relied to a certain extent on the board of
programme directors, most of whom, being outsiders, failed to reflect the
needs of the whole community. The gap between rich and poor grew wider,
thus strengthening existing power positions and exacerbating previous sources
of conflict and tension. The situation was aggravated by the absence of
which was dominated by community leaders who did not represent the
interests of the poorest in the settlement.
-based waste
established in the mid-
leaders were instrumental in transforming it from a charity organization into a
community-based development association that managed the credit
programme which financed the micro-enterprise recycling industries,
encouraged income-generating activities connected to garbage processing,
system.
Recycling of products such as papers, tyres, plastics, used clothes, and metals,
is becoming increasingly popular. A kilogram of old newspapers sells for
between Kshs.15 to Kshs.27 while old tyres go for Kshs.50-3000 depending on
the degree of tear and wear, and size. Organic wastes are also increasingly
being recycled to produce compost products. For example, community-based
organizations (CBOs) managed by women are recycling market waste from
Korogocho Market near Dandora to produce organic manure for sale thus
raising income for household use. The self-help activities of the Mukuru project
earned KShs 1.55 million in 1996 from the recovery of 1,018 tons of materials
and for financing investments required to improve efficiency (JICA, 1998).
These resource recovery programs save energy, causes minimal pollution and
land disruption, cuts waste disposal costs, and extends the life of landfills by
preventing waste from residing there.
Maina (2005) studying community involvement in domestic solid waste
management documents that organics are not scavenged by waste pickers but
are important to street children who often pick through bins to find the next
meal. Some of larger restaurants and hotels also sell their wastes to farmers
as pig feed while others do compositing, use as livestock feed including goats,
chicken and cows.
Results form the study by Maina (2005) testing the relationship between the
length of stay of residents in Kayole-Soweto and waste recycling as a solid
waste management practice indicate that there was no significant relationship
between the two variables with r2 = 0.003 approximately 0.3%.
2.3.3 Solid Waste minimization
Most local governments and urban agencies have often identified solid waste
as a major problem that has reached proportions requiring drastic measures.
Three key trends have been observed with respect to solid waste - increase in
sheer volume of waste generated by urban residents; change in the quality or
make-up of waste generated; and the disposal method of waste collected, by
land-fill and incineration (Srinivas, 2008).
According to Tangri (2003), Municipal solid waste (MSW) incineration plants
tend to be among the most expensive solid waste management options, and
they require highly skilled personnel and careful maintenance. For these
reasons, incineration tends to be a good choice only when other, simpler, and
less expensive choices are not available. Because MSW plants are capital-
intensive and require high maintenance costs and comparatively higher
technically trained operators, they are commonly adopted by developed
countries. However, high capital and maintenance costs may make MSW
incineration beyond the reach of many of the lesser developing countries.
Ali (2009) findings therefore report that the bulk of solid waste is subjected to
open burning in plastics producing carcinogenic vinyl chloride monomers and
dioxins. Polychlorinated dibenzo-p-dioxins (PCDD) and Polychlorinated
dibenzofurans (PCDF), Hexachlorobenzene (HCB) and Polychlorinated
Biphenyls (PCBs) are unintentional persistent organic pollutants (U-POPs),
formed and released from thermal processes involving organic matter and
chlorine as a result of incomplete combustion or chemical reactions. These U-
POPs are commonly known as dioxins because of their similar structure and
health effects.
These U-POPs are both of natural and anthropogenic origin. They resist
photolytic, biological and chemical degradation. They are bio-accumulative,
widespread geographically and are toxic to life. The concentration of U-POPs
of anthropogenic origin has greatly increased over the years. Toxics Link
Report (2000) identifies several potential sources of these U-POPs, among
them being medical waste incineration and open burning of domestic waste.
According to USEPA estimates, municipal solid waste incineration and medical
waste incineration are among the top sources of dioxins released into the air.
They make up for 1,100gm TEQ/year and 477gm TEQ/year respectively
(USEPA, 1998). Of all source categories, combustion sources account for
nearly 80% of air emissions that contribute to choky smoke, water pollution,
pungent smells, broken objects, respiratory diseases and other related health
problems.
Tangri, (2003), notes that despite intensive scrutiny over many years, much
remains unknown about the releases of pollutants from waste-burning activities.
Waste burning produces hundreds of distinct hazardous by-products yet only a
handful of them have been studied thoroughly while hundreds remain
unidentified. Connett (1998) identifies some of the toxic emissions of
incineration including: hydrogen chloride, nitric oxide, heavy metals, dioxins,
furans and other U-POPs, fly ash, bottom ash, stack gas, fugitive emissions
plus other residues.
Due to the persistent and bio-accumulative nature of dioxins and furans, these
chemicals exist throughout the environment. Their health effects depend on a
variety of factors, including the level of exposure, duration of exposure and
stage of life during exposure. Some of the probable health effects of dioxins
and furans include the development of cancer, immune system suppression,
reproductive and developmental complications, endocrine disruption (Connett,
1998; Luscombe and Costner, 2003). The International Agency for Research
on Cancer (IARC) identified TCDD as the most toxic of all dioxin compounds.
The accumulation of dioxins and furans in the environment resulting from
waste incineration activities can reach levels that render resources unfit for
human consumption. Connett (2003), documents an incident in Netherlands
where 16 dairy farmers downwind of a huge incinerator in Rotterdam could not
sell their milk because it contained three times higher dioxin levels than
anywhere else in Netherlands. According to Patandin (1999), even low doses
of dioxins are very toxic. He reports that prenatal exposure to typical daily
intake of dioxins and PCBs has effects on neurodevelopment and thyroid
hormones from studies he conducted in Netherlands. Deficits of up to four
points in IQ and increased susceptibility to infections in 42 month old children
exposed to typical daily intakes of dioxins/PCBs were observed.
In Kenya, a study on egg-sampling by ENVILEAD and ARNIKA (2005) under
the Dioxin, PCBs and Waste Working Group of IPEN found eggs collected
around the Dandora dumpsite in Nairobi, Kenya, to have dioxin levels over 6
times higher than the EU dioxins limits for eggs. The sampled eggs also
exceeded the proposed WHO limits for PCBs by more than 4-fold. It is
estimated that the Dandora open dumpsite handles 803,000 tons of waste per
year (National inventory of POPs, 2004). The study was not able to carry out a
comprehensive investigation into the health consequences of the incinerators
and open air burning sites visited. It however reports complaints about chest
complications and serious smoke irritation for those living downwind from the
Kenyatta National Hospital incinerator. These were due to Inhalation of the
pollutants-infested smoke and fly ash carried across by the wind; Consumption
of animal products such as meat, milk and eggs from animals feeding within
and around the sites.
Incineration produces residues that require treatment and disposal, most often
in a landfill. Incinerator ash- either as bottom ash or fly ash is highly toxic.
Tangri (2003) observed that handling of this ash raises serious concerns
because workers are often exposed to the ash, sometimes with little or no
protective gear. In addition to dioxins, polychlorinated biphenyls (PCBs) and
Hexachlorobenzene (HCB), incinerators are sources of other halogenated
organic compounds, toxic metals and greenhouse gases. Toxic metals
released from incineration activities include: Mercury, Lead, Cadmium, Arsenic,
Chromium, Beryllium, Antimony, and Manganese.
Spadaro, et. al., (2005), Studying the methodology for evaluating the impacts
and damage costs (`external costs') due to pollution from waste treatment
compared the damage costs of landfill and incineration of municipal solid
waste with due account for energy and materials recovery, as well as possible
differences in transport distance. Though the total damage costs of leachates
because of the complexity of the environmental pathways and of the long time
horizon of some persistent pollutants were not quantified, an extreme scenario
was considered to show that they are not worth worrying about in the sense
that reducing the pollutants in leachates beyond current regulations would
bring negligible benefit in comparison with the decline of other sources of the
same pollutants.
The study found that the damage costs due to the construction of the waste
treatment facility were negligible. The damage costs of waste transport
illustrated by an arbitrary choice of a 100 km round trip by a 16 tonne truck
were also negligible. The benefits of materials recovery made a small
contribution to the total damage cost. However, direct emissions of the landfill
or incinerator and the avoided emissions had significant contributions due to
energy recovery from an incinerator. The study reports damage costs for
incineration ranging from about 4 to 21 tonnes and that they were extremely
dependent on the assumed scenario for energy recovery. The cost for landfill
ranges from about 10 to 13 tonnes. It was found to be dominated by
greenhouse gas emissions because only a fraction of the CH4 can be captured
and was assumed to be 70 %. Amenity costs (odour, visual impact, noise)
were highly site-specific with results from a literature survey indicating that
such costs could make a significant contribution estimated to the order of 1
tonne.
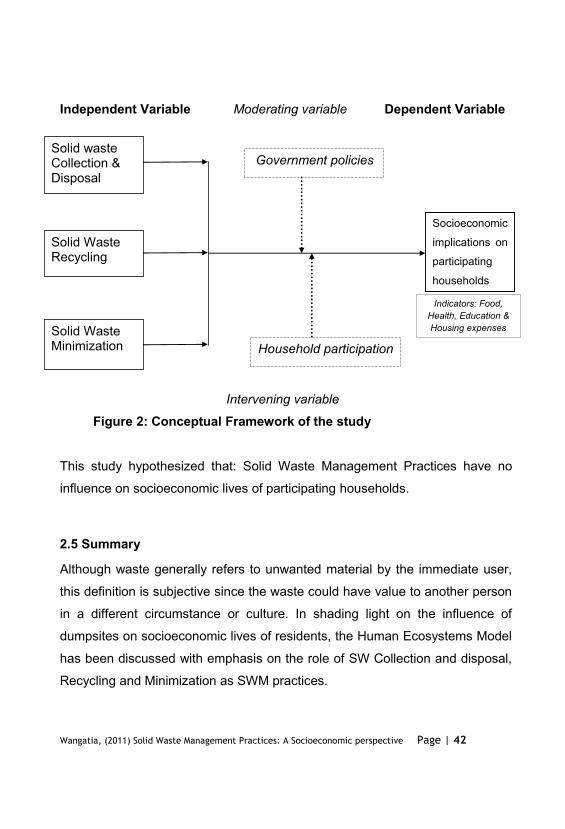
2.4 Conceptual framework
The conceptual framework of this study shows the relationship Solid waste
Collection & Disposal, Solid Waste Recycling and Solid Waste minimization as
Independent variables and their Socio-economic implications on lives of
residents of Dandora, Nairobi (Income, Health) as the Dependent variable.
Government policies are considered as the moderating variable while
Household participation is used as the Intervening variable in this study.
Independent Variable Moderating variable Dependent Variable
Intervening variable
Figure 2: Conceptual Framework of the study
This study hypothesized that: Solid Waste Management Practices have no
influence on socioeconomic lives of participating households.
2.5 Summary
Although waste generally refers to unwanted material by the immediate user,
this definition is subjective since the waste could have value to another person
in a different circumstance or culture. In shading light on the influence of
dumpsites on socioeconomic lives of residents, the Human Ecosystems Model
has been discussed with emphasis on the role of SW Collection and disposal,
Recycling and Minimization as SWM practices.
Government policies
Socioeconomic
implications on
participating
households
Household participation
Solid WasteRecycling
Solid WasteMinimization
Solid wasteCollection &Disposal
Indicators: Food,Health, Education &Housing expenses
CHAPTER THREE:
RESEARCH METHODOLOGY
3.1 Introduction
This section describes the research methodology under the subtopics:
research approach, research design, target population, sampling procedures
and design, data collection, validity and reliability of research instruments,
methods of data analysis, Operational definition of variables and a summary of
the chapter
3.2 Research Design
A survey design was modeled to enable assessment of the socio-economic
implications of solid waste management practices on households around
Dandora dumpsite, Nairobi. This study sought to describe and explain
socioeconomic characteristics of Dandora residents (existing reality) by
collecting numerical data on observable behaviors of the sample by subjecting
these data to statistical tests.
3.3 Target Population
This study covered a target population of about 30,000 residents from
approximately 6800 households based on the administrative records at the
Table 3.1 by proportion.
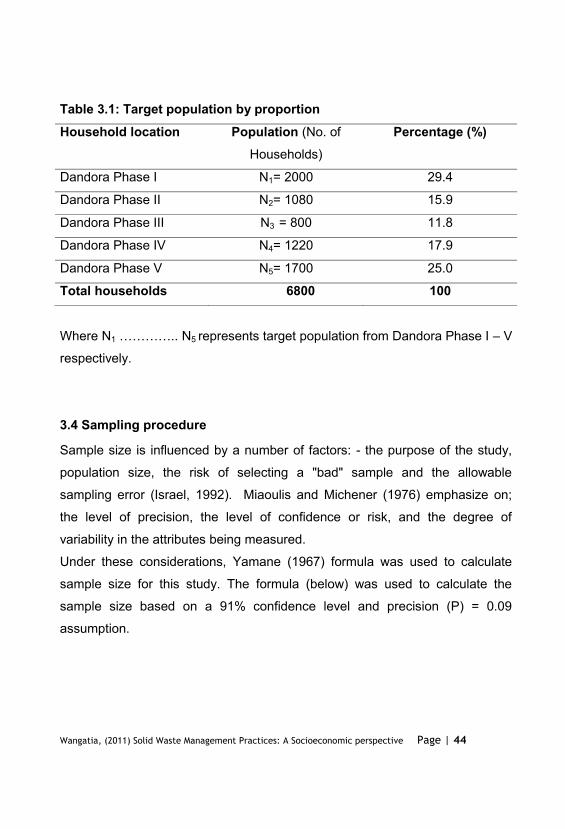
Table 3.1: Target population by proportionHousehold location Population (No. of
Households)
Percentage (%)
Dandora Phase I N1= 2000 29.4
Dandora Phase II N2= 1080 15.9
Dandora Phase III N3 = 800 11.8
Dandora Phase IV N4= 1220 17.9
Dandora Phase V N5= 1700 25.0
Total households 6800 100
Where N1 5 represents target population from Dandora Phase I V
respectively.
3.4 Sampling procedure
Sample size is influenced by a number of factors: - the purpose of the study,
population size, the risk of selecting a "bad" sample and the allowable
sampling error (Israel, 1992). Miaoulis and Michener (1976) emphasize on;
the level of precision, the level of confidence or risk, and the degree of
variability in the attributes being measured.
Under these considerations, Yamane (1967) formula was used to calculate
sample size for this study. The formula (below) was used to calculate the
sample size based on a 91% confidence level and precision (P) = 0.09
assumption.
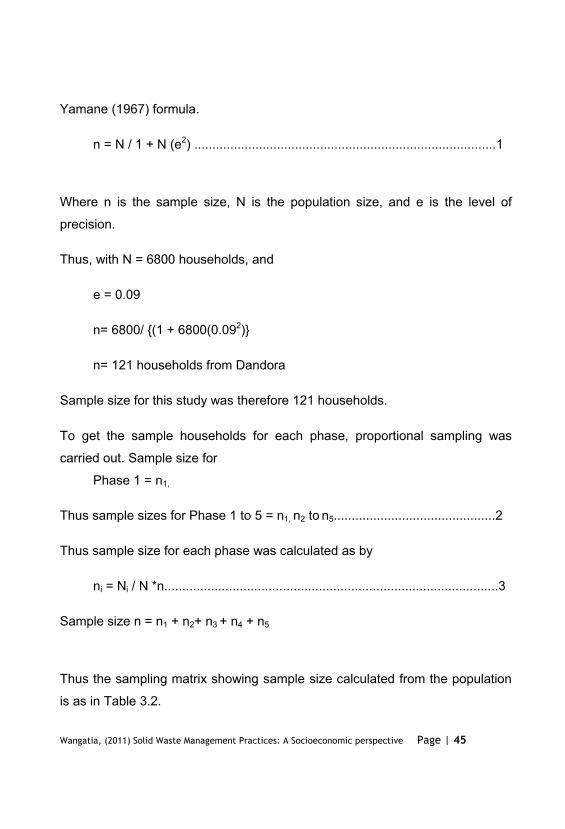
Yamane (1967) formula.
n = N / 1 + N (e2) ....................................................................................1
Where n is the sample size, N is the population size, and e is the level of
precision.
Thus, with N = 6800 households, and
e = 0.09
n= 6800/ {(1 + 6800(0.092)}
n= 121 households from Dandora
Sample size for this study was therefore 121 households.
To get the sample households for each phase, proportional sampling was
carried out. Sample size for
Phase 1 = n1,
Thus sample sizes for Phase 1 to 5 = n1, n2 to n5.............................................2
Thus sample size for each phase was calculated as by
ni = Ni / N *n.............................................................................................3
Sample size n = n1 + n2+ n3 + n4 + n5
Thus the sampling matrix showing sample size calculated from the population
is as in Table 3.2.
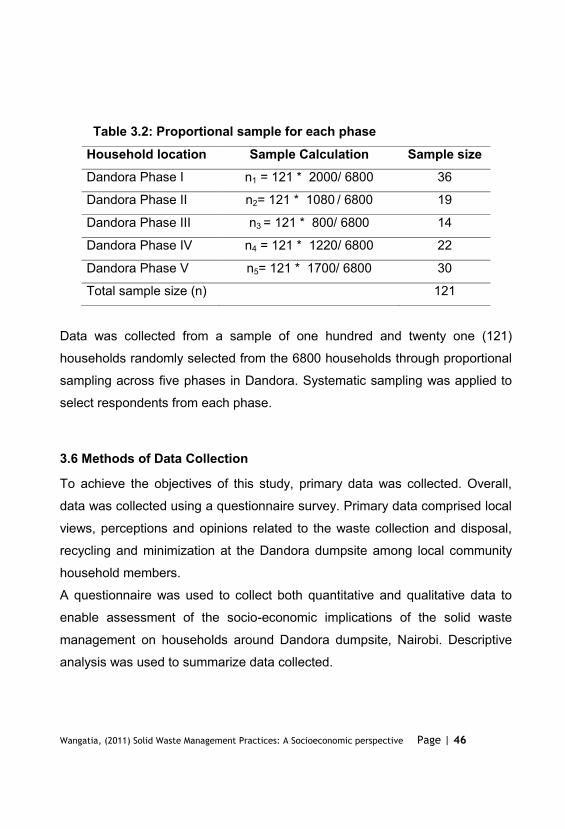
Table 3.2: Proportional sample for each phaseHousehold location Sample Calculation Sample sizeDandora Phase I n1 = 121 * 2000/ 6800 36
Dandora Phase II n2= 121 * 1080 / 6800 19
Dandora Phase III n3 = 121 * 800/ 6800 14
Dandora Phase IV n4 = 121 * 1220/ 6800 22
Dandora Phase V n5= 121 * 1700/ 6800 30
Total sample size (n) 121
Data was collected from a sample of one hundred and twenty one (121)
households randomly selected from the 6800 households through proportional
sampling across five phases in Dandora. Systematic sampling was applied to
select respondents from each phase.
3.6 Methods of Data Collection
To achieve the objectives of this study, primary data was collected. Overall,
data was collected using a questionnaire survey. Primary data comprised local
views, perceptions and opinions related to the waste collection and disposal,
recycling and minimization at the Dandora dumpsite among local community
household members.
A questionnaire was used to collect both quantitative and qualitative data to
enable assessment of the socio-economic implications of the solid waste
management on households around Dandora dumpsite, Nairobi. Descriptive
analysis was used to summarize data collected.
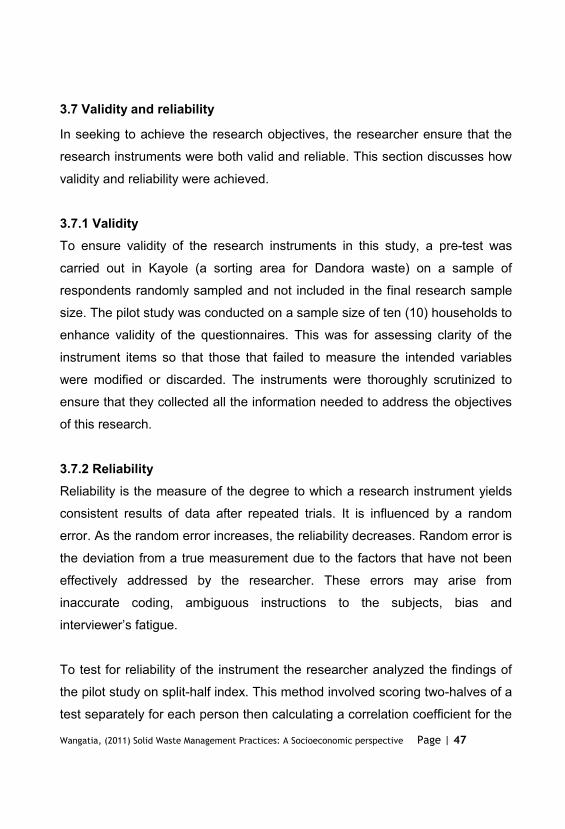
3.7 Validity and reliability
In seeking to achieve the research objectives, the researcher ensure that the
research instruments were both valid and reliable. This section discusses how
validity and reliability were achieved.
3.7.1 ValidityTo ensure validity of the research instruments in this study, a pre-test was
carried out in Kayole (a sorting area for Dandora waste) on a sample of
respondents randomly sampled and not included in the final research sample
size. The pilot study was conducted on a sample size of ten (10) households to
enhance validity of the questionnaires. This was for assessing clarity of the
instrument items so that those that failed to measure the intended variables
were modified or discarded. The instruments were thoroughly scrutinized to
ensure that they collected all the information needed to address the objectives
of this research.
3.7.2 ReliabilityReliability is the measure of the degree to which a research instrument yields
consistent results of data after repeated trials. It is influenced by a random
error. As the random error increases, the reliability decreases. Random error is
the deviation from a true measurement due to the factors that have not been
effectively addressed by the researcher. These errors may arise from
inaccurate coding, ambiguous instructions to the subjects, bias and
To test for reliability of the instrument the researcher analyzed the findings of
the pilot study on split-half index. This method involved scoring two-halves of a
test separately for each person then calculating a correlation coefficient for the
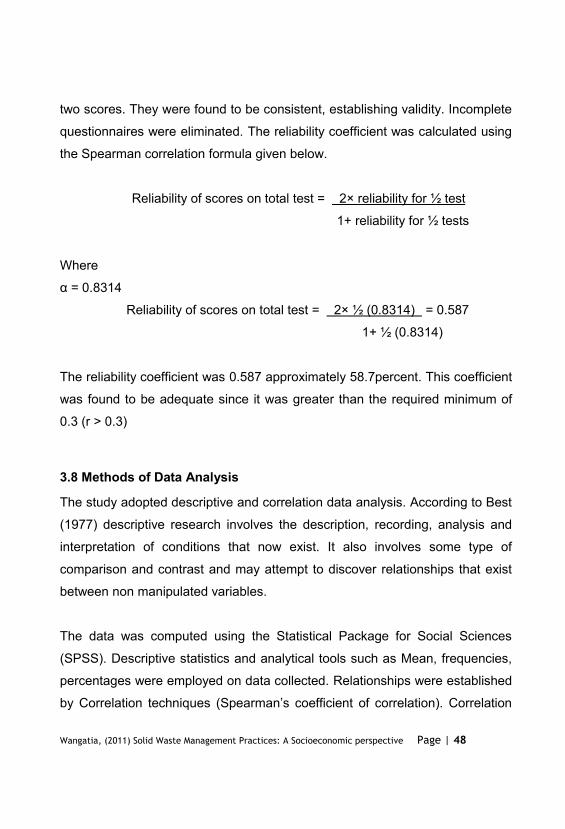
two scores. They were found to be consistent, establishing validity. Incomplete
questionnaires were eliminated. The reliability coefficient was calculated using
the Spearman correlation formula given below.
Reliability of scores on total test = 2× reliability for ½ test
1+ reliability for ½ tests
Where
8314
Reliability of scores on total test = 2× ½ (0.8314) = 0.587
1+ ½ (0.8314)
The reliability coefficient was 0.587 approximately 58.7percent. This coefficient
was found to be adequate since it was greater than the required minimum of
0.3 (r > 0.3)
3.8 Methods of Data Analysis
The study adopted descriptive and correlation data analysis. According to Best
(1977) descriptive research involves the description, recording, analysis and
interpretation of conditions that now exist. It also involves some type of
comparison and contrast and may attempt to discover relationships that exist
between non manipulated variables.
The data was computed using the Statistical Package for Social Sciences
(SPSS). Descriptive statistics and analytical tools such as Mean, frequencies,
percentages were employed on data collected. Relationships were established
by Correlation techniques (Spearma
analysis focusing simple correlations were done to establish existing
relationships between household socio-economic factors (Income, Health,
occupation, education and location) and the effects SWM practices.
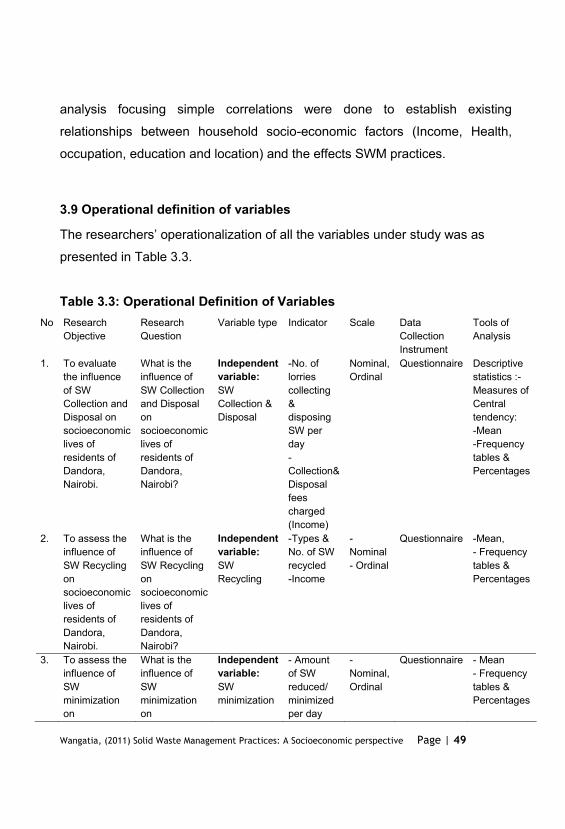
3.9 Operational definition of variables
presented in Table 3.3.
Table 3.3: Operational Definition of Variables No Research
ObjectiveResearchQuestion
Variable type Indicator Scale DataCollectionInstrument
Tools of Analysis
1. To evaluatethe influenceof SWCollection and Disposal onsocioeconomiclives of residents of Dandora,Nairobi.
What is theinfluence of SW Collectionand Disposalonsocioeconomiclives of residents of Dandora,Nairobi?
Independentvariable:SWCollection & Disposal
-No. of lorriescollecting&disposingSW perday-Collection&Disposalfeescharged(Income)
Nominal, Ordinal
Questionnaire Descriptivestatistics :-Measures of Centraltendency: -Mean-Frequencytables & Percentages
2. To assess theinfluence of SW Recyclingonsocioeconomiclives of residents of Dandora,Nairobi.
What is theinfluence of SW Recyclingonsocioeconomiclives of residents of Dandora,Nairobi?
Independentvariable:SWRecycling
-Types &No. of SWrecycled-Income
-Nominal- Ordinal
Questionnaire -Mean,- Frequencytables & Percentages
3. To assess theinfluence of SWminimizationon
What is theinfluence of SWminimizationon
Independentvariable:SWminimization
- Amountof SWreduced/minimizedper day
-Nominal, Ordinal
Questionnaire - Mean- Frequencytables & Percentages
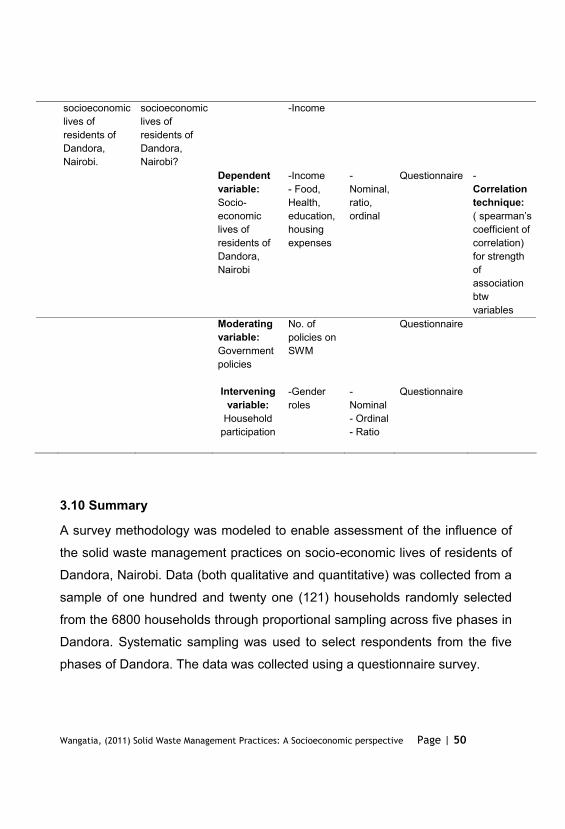
socioeconomiclives of residents of Dandora,Nairobi.
socioeconomiclives of residents of Dandora,Nairobi?
-Income
Dependentvariable:Socio-economiclives of residents of Dandora,Nairobi
-Income- Food, Health,education, housingexpenses
-Nominal, ratio, ordinal
Questionnaire -Correlationtechnique:
coefficient of correlation)for strengthof associationbtwvariables
Moderatingvariable:Government policies
No. of policies on SWM
Questionnaire
Interveningvariable:
Householdparticipation
-Genderroles
-Nominal- Ordinal- Ratio
Questionnaire
3.10 Summary
A survey methodology was modeled to enable assessment of the influence of
the solid waste management practices on socio-economic lives of residents of
Dandora, Nairobi. Data (both qualitative and quantitative) was collected from a
sample of one hundred and twenty one (121) households randomly selected
from the 6800 households through proportional sampling across five phases in
Dandora. Systematic sampling was used to select respondents from the five
phases of Dandora. The data was collected using a questionnaire survey.
CHAPTER FOUR:
DATA ANALYSIS, PRESENTATION AND INTERPRETATION
4.1 Introduction
This section contains data analysis and presentation based on the research
objectives. Section 4.2 presents Respondent return rate from the five locations
(Phase I - V) surveyed. Section 4.3 discusses Household socioeconomic
characteristics profiling: -Respondents distribution by gender , Gender
distribution of household members by
Management practices and their correlation. It also details household sources
of labour for Solid Waste Management practices, variations in mean distance
from dumpsite to household locations and finally discusses the Household
expenditure pattern. Section 4.4 discusses Implications of the Solid Waste
Management practices on the socioeconomic lives of Dandora residents by the
research objectives. It focuses on the contribution of Solid Waste Collection&
Disposal, Solid Waste Recycling and Solid Waste minimization to the
socioeconomic lives of Dandora residents.
4.2 Respondent return rate
The survey established that the number of individuals in 107 households was
468. Out of the 121 Questionnaires administered, 107 were recovered. This
translated to a response rate of 88 percent (%.) as shown in Table 4.1.
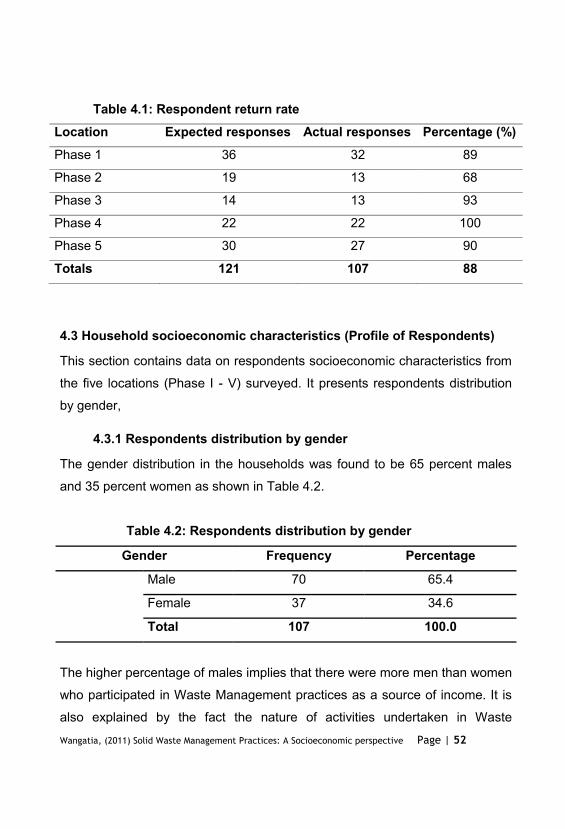
Table 4.1: Respondent return rateLocation Expected responses Actual responses Percentage (%)Phase 1 36 32 89
Phase 2 19 13 68
Phase 3 14 13 93
Phase 4 22 22 100
Phase 5 30 27 90
Totals 121 107 88
4.3 Household socioeconomic characteristics (Profile of Respondents)
This section contains data on respondents socioeconomic characteristics from
the five locations (Phase I - V) surveyed. It presents respondents distribution
by gender,
4.3.1 Respondents distribution by gender
The gender distribution in the households was found to be 65 percent males
and 35 percent women as shown in Table 4.2.
Table 4.2: Respondents distribution by gender
Gender Frequency Percentage
Male 70 65.4
Female 37 34.6
Total 107 100.0
The higher percentage of males implies that there were more men than women
who participated in Waste Management practices as a source of income. It is
also explained by the fact the nature of activities undertaken in Waste
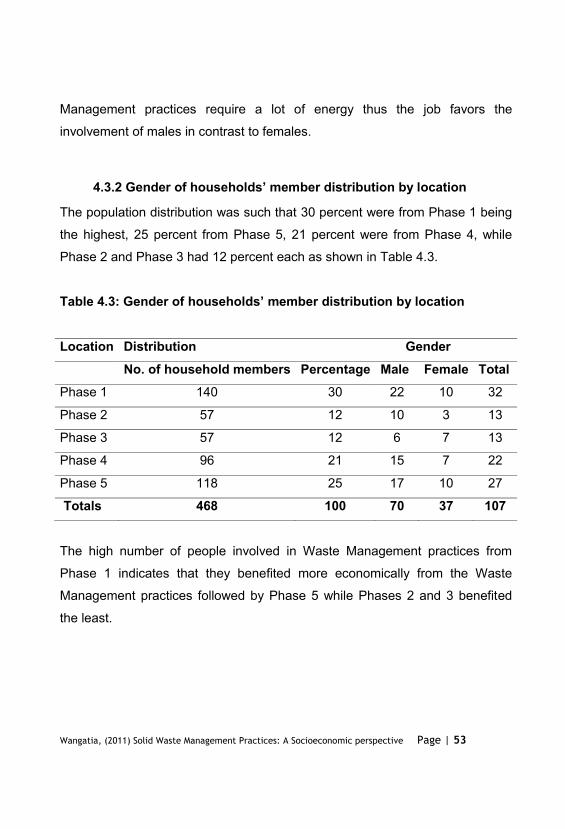
Management practices require a lot of energy thus the job favors the
involvement of males in contrast to females.
The population distribution was such that 30 percent were from Phase 1 being
the highest, 25 percent from Phase 5, 21 percent were from Phase 4, while
Phase 2 and Phase 3 had 12 percent each as shown in Table 4.3.
Table 4.3: Gender of member distribution by location
Location Distribution Gender No. of household members Percentage Male Female TotalPhase 1 140 30 22 10 32
Phase 2 57 12 10 3 13
Phase 3 57 12 6 7 13
Phase 4 96 21 15 7 22
Phase 5 118 25 17 10 27
Totals 468 100 70 37 107
The high number of people involved in Waste Management practices from
Phase 1 indicates that they benefited more economically from the Waste
Management practices followed by Phase 5 while Phases 2 and 3 benefited
the least.
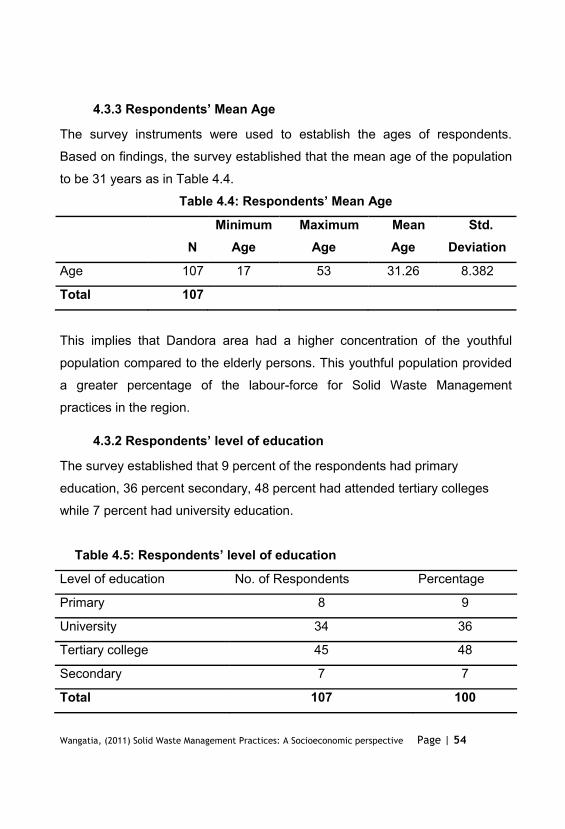
The survey instruments were used to establish the ages of respondents.
Based on findings, the survey established that the mean age of the population
to be 31 years as in Table 4.4.
Table 4.4:
NMinimum
Age Maximum
Age Mean
AgeStd.
Deviation
Age 107 17 53 31.26 8.382
Total 107
This implies that Dandora area had a higher concentration of the youthful
population compared to the elderly persons. This youthful population provided
a greater percentage of the labour-force for Solid Waste Management
practices in the region.
The survey established that 9 percent of the respondents had primary
education, 36 percent secondary, 48 percent had attended tertiary colleges
while 7 percent had university education.
Table 4.5: level of education
Level of education No. of Respondents Percentage
Primary 8 9
University 34 36
Tertiary college 45 48
Secondary 7 7
Total 107 100
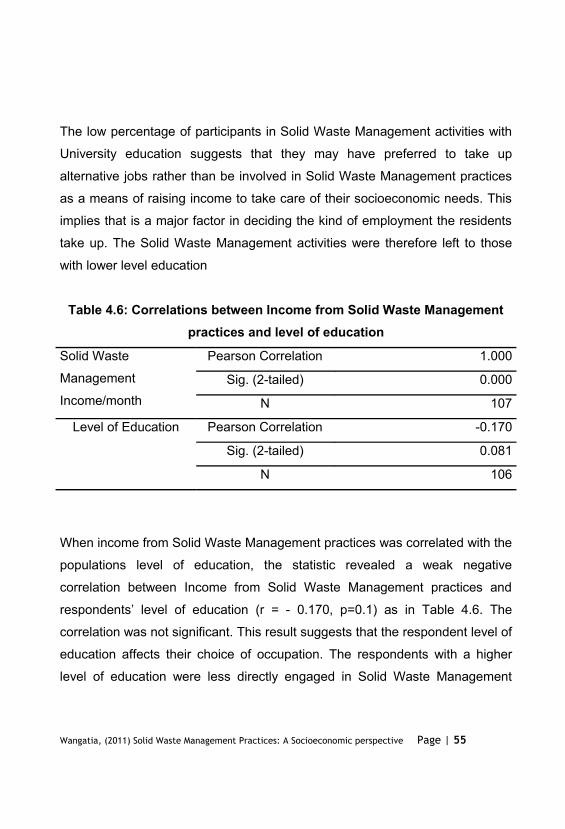
The low percentage of participants in Solid Waste Management activities with
University education suggests that they may have preferred to take up
alternative jobs rather than be involved in Solid Waste Management practices
as a means of raising income to take care of their socioeconomic needs. This
implies that is a major factor in deciding the kind of employment the residents
take up. The Solid Waste Management activities were therefore left to those
with lower level education
Table 4.6: Correlations between Income from Solid Waste Managementpractices and level of education
Solid Waste
Management
Income/month
Pearson Correlation 1.000
Sig. (2-tailed) 0.000
N 107
Level of Education Pearson Correlation -0.170
Sig. (2-tailed) 0.081
N 106
When income from Solid Waste Management practices was correlated with the
populations level of education, the statistic revealed a weak negative
correlation between Income from Solid Waste Management practices and
(r = - 0.170, p=0.1) as in Table 4.6. The
correlation was not significant. This result suggests that the respondent level of
education affects their choice of occupation. The respondents with a higher
level of education were less directly engaged in Solid Waste Management
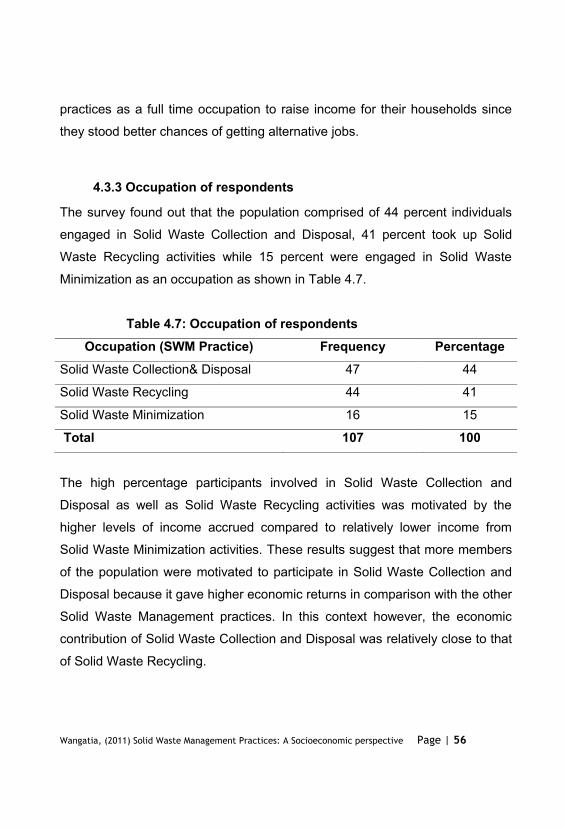
practices as a full time occupation to raise income for their households since
they stood better chances of getting alternative jobs.
4.3.3 Occupation of respondents
The survey found out that the population comprised of 44 percent individuals
engaged in Solid Waste Collection and Disposal, 41 percent took up Solid
Waste Recycling activities while 15 percent were engaged in Solid Waste
Minimization as an occupation as shown in Table 4.7.
Table 4.7: Occupation of respondentsOccupation (SWM Practice) Frequency Percentage
Solid Waste Collection& Disposal 47 44
Solid Waste Recycling 44 41
Solid Waste Minimization 16 15
Total 107 100 The high percentage participants involved in Solid Waste Collection and
Disposal as well as Solid Waste Recycling activities was motivated by the
higher levels of income accrued compared to relatively lower income from
Solid Waste Minimization activities. These results suggest that more members
of the population were motivated to participate in Solid Waste Collection and
Disposal because it gave higher economic returns in comparison with the other
Solid Waste Management practices. In this context however, the economic
contribution of Solid Waste Collection and Disposal was relatively close to that
of Solid Waste Recycling.
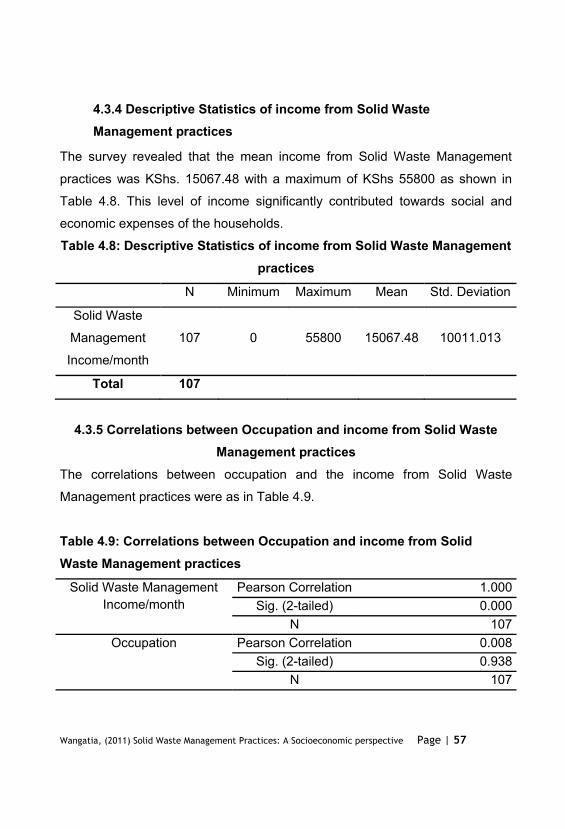
4.3.4 Descriptive Statistics of income from Solid WasteManagement practices
The survey revealed that the mean income from Solid Waste Management
practices was KShs. 15067.48 with a maximum of KShs 55800 as shown in
Table 4.8. This level of income significantly contributed towards social and
economic expenses of the households.
Table 4.8: Descriptive Statistics of income from Solid Waste Managementpractices
N Minimum Maximum Mean Std. Deviation
Solid Waste
Management
Income/month
107 0 55800 15067.48 10011.013
Total 107
4.3.5 Correlations between Occupation and income from Solid WasteManagement practices
The correlations between occupation and the income from Solid Waste
Management practices were as in Table 4.9.
Table 4.9: Correlations between Occupation and income from SolidWaste Management practices
Solid Waste ManagementIncome/month
Pearson Correlation 1.000Sig. (2-tailed) 0.000
N 107Occupation Pearson Correlation 0.008
Sig. (2-tailed) 0.938N 107
The relationship between occupation and the income from Solid Waste
Management practices revealed a positive but weak correlation (r= 0.08,
p=0.1). However, the relationship was not significant. This statistic implies that
the people involved in Solid Waste Management practices were motivated by
the level of income they earned from the practices. This means that when a
higher income is raised the Solid Waste Management practices, a higher
percentage of the population will engage in the Solid Waste Management
practices as an occupation due to the motivation to earn more money to take
care of their socioeconomic needs and vise versa. It also implies that the
households relied on the Solid Waste Management practices as a key source
of their income because of its significant contribution towards improvement of
their social and economic lifestyles. When the returns are very low, the
participants find other alternative sources of income to supplement it.
4.3.6 Household sources of labour for Solid Waste Managementpractices
The study found out that the households either employ laborers to help in Solid
Waste Management activities or source for labour from their own family
members. The variations in the sources of labour as established by this survey
for Solid Waste Management practices were as in Table 4.10.
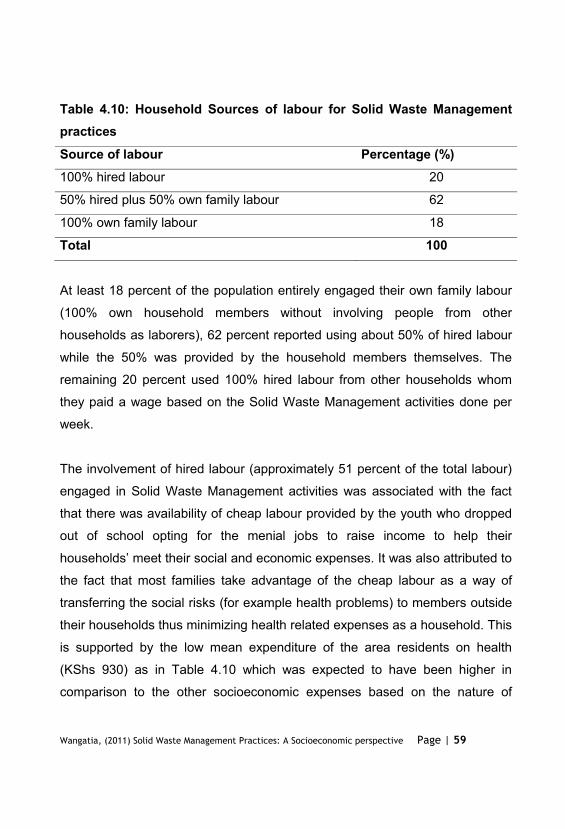
Table 4.10: Household Sources of labour for Solid Waste ManagementpracticesSource of labour Percentage (%)100% hired labour 20
50% hired plus 50% own family labour 62
100% own family labour 18
Total 100
At least 18 percent of the population entirely engaged their own family labour
(100% own household members without involving people from other
households as laborers), 62 percent reported using about 50% of hired labour
while the 50% was provided by the household members themselves. The
remaining 20 percent used 100% hired labour from other households whom
they paid a wage based on the Solid Waste Management activities done per
week.
The involvement of hired labour (approximately 51 percent of the total labour)
engaged in Solid Waste Management activities was associated with the fact
that there was availability of cheap labour provided by the youth who dropped
out of school opting for the menial jobs to raise income to help their
the fact that most families take advantage of the cheap labour as a way of
transferring the social risks (for example health problems) to members outside
their households thus minimizing health related expenses as a household. This
is supported by the low mean expenditure of the area residents on health
(KShs 930) as in Table 4.10 which was expected to have been higher in
comparison to the other socioeconomic expenses based on the nature of
activities undertaken in Solid Waste Management exposing participants to
frequent health risks.
4.3.7 Solid Waste Management charges and transportation
The types of Solid Waste Collected from the household and disposed at
Dandora dumpsite were found to be mainly domestic. This survey established
that an average of three (3) kilograms (Kgs) in quantity is generated per
household per day. Relative proportions of various types of solid wastes were
generated from households surveyed; i.e. Food Waste, Recyclable Paper,
Textiles, Plastic containers, Leather, Rubber, Glass containers, Metal
containers, Ceramic and Soil.
Waste from the households was picked and transported mainly by use of
lorries and handcarts depending on location of household from the dumpsite.
This was especially true for households from Phases 1, 2 and 5 who stay
farthest from the Dandora dumping site. About 11 percent of the waste is
illegally dumped by the waste generators themselves. This was because of the
low willingness to pay for the Solid Waste Collection and Disposal on the basis
that they were close to the dumpsite and therefore did not need to incur
expenses on Solid Waste Management practices but eventually ended up
creating mini-dumping sites within the estates.
The survey established that the general affordability to pay for Solid Waste
The mean percentage willingness to
pay (WTP) for Solid Waste Management practices was 61 percent with values
as low as of zero (0) percent and a high of 100 percent. The mean fee charged
is KShs 109/= charged per month with a minimum of KShs 40/= and a
maximum of KShs 200/= per month while some do not pay for the Solid Waste
Management services at all. Those who were not willing to pay indicated that
the dumpsite was so close to them that they chose to dump the waste by
themselves.
The waste charge system of the households was based on the location /
distance of the client's premises from the dumping site and not the quantity of
waste to be collected. The timing of payment for the waste charges was mostly
on a monthly basis. Additionally, the survey found that waste collection and
disposal was done once a week (Saturday only) which was not regular enough
thus led to creation of mini-dumping sites in the residential areas.
4.3.8 Location (Distance in metres) and income from Solid WasteManagement practices
The survey established that in terms of distance from the households to the
disposal area, the mean distance from households to the dumpsite was 1060
metres (approximately 1 kilometer). Phase 2 was the furthest at approximately
2 kilometers (1958 metres) while Phase 4 had a mean of 361 metres only with
some households as close as 50 metres away from the dumpsite. The mean
distance from households surveyed to the dumpsite was established to be
1060 metres (approximately 1 kilometer) with variations in the five locations as
in Table 4.11
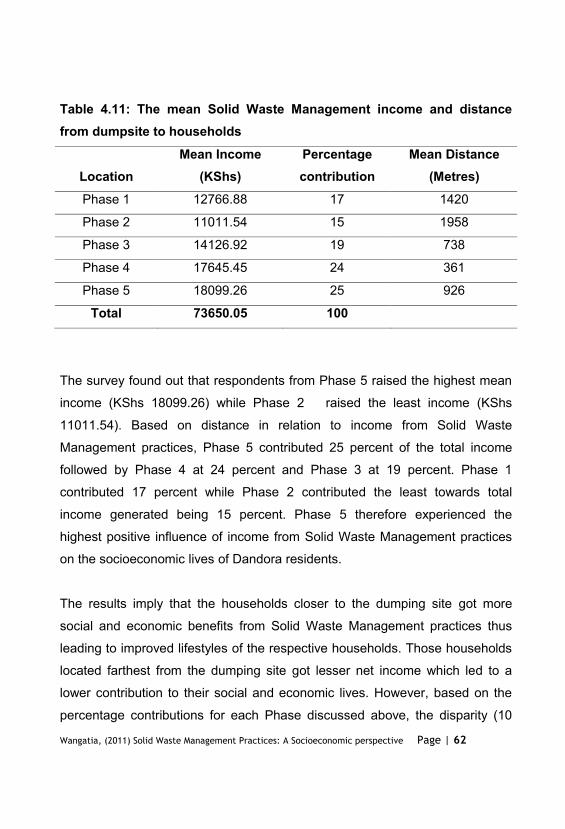
Table 4.11: The mean Solid Waste Management income and distancefrom dumpsite to households
LocationMean Income
(KShs)Percentagecontribution
Mean Distance(Metres)
Phase 1 12766.88 17 1420
Phase 2 11011.54 15 1958
Phase 3 14126.92 19 738
Phase 4 17645.45 24 361
Phase 5 18099.26 25 926
Total 73650.05 100
The survey found out that respondents from Phase 5 raised the highest mean
income (KShs 18099.26) while Phase 2 raised the least income (KShs
11011.54). Based on distance in relation to income from Solid Waste
Management practices, Phase 5 contributed 25 percent of the total income
followed by Phase 4 at 24 percent and Phase 3 at 19 percent. Phase 1
contributed 17 percent while Phase 2 contributed the least towards total
income generated being 15 percent. Phase 5 therefore experienced the
highest positive influence of income from Solid Waste Management practices
on the socioeconomic lives of Dandora residents.
The results imply that the households closer to the dumping site got more
social and economic benefits from Solid Waste Management practices thus
leading to improved lifestyles of the respective households. Those households
located farthest from the dumping site got lesser net income which led to a
lower contribution to their social and economic lives. However, based on the
percentage contributions for each Phase discussed above, the disparity (10
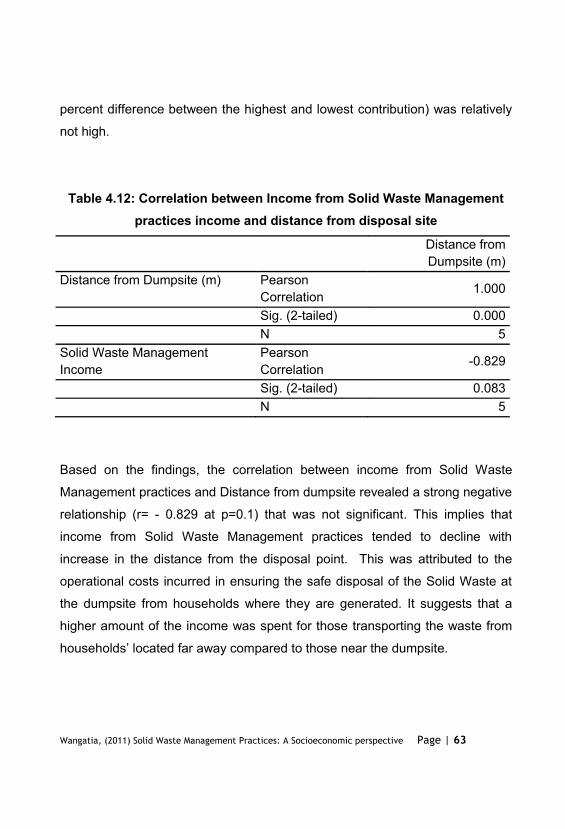
percent difference between the highest and lowest contribution) was relatively
not high.
Table 4.12: Correlation between Income from Solid Waste Managementpractices income and distance from disposal site
Distance fromDumpsite (m)
Distance from Dumpsite (m) PearsonCorrelation 1.000
Sig. (2-tailed) 0.000 N 5Solid Waste ManagementIncome
PearsonCorrelation -0.829
Sig. (2-tailed) 0.083 N 5
Based on the findings, the correlation between income from Solid Waste
Management practices and Distance from dumpsite revealed a strong negative
relationship (r= - 0.829 at p=0.1) that was not significant. This implies that
income from Solid Waste Management practices tended to decline with
increase in the distance from the disposal point. This was attributed to the
operational costs incurred in ensuring the safe disposal of the Solid Waste at
the dumpsite from households where they are generated. It suggests that a
higher amount of the income was spent for those transporting the waste from
The operational costs include: - payments for the hired labour to facilitate the
Solid Waste Management activities - collection and Disposal, Recycling and
Minimization- transportation costs, provision of waste collection containers
mainly large polythene bags, hiring of transportation equipment such as lorries
and handcarts, acquisition of operational licenses form the City Council of
Nairobi, repairs of transportation equipment due to wear and tear, payment of
disposal fees at the dumping site as well as money lost to cartels controlling
the dumping activities at the dump site.
Conclusively, these findings showed that the households found nearest to the
dumpsite benefited more socioeconomically compared to their counterparts
living farther from the dumpsite. This meant that they had more disposable
income thus were able to comfortably take better care of their expenses
related to food, housing, health and investment in education leading to better
lifestyles in comparison to those households found at longer distances from the
landfill.
4.3.9 Respondents total income and expenditure pattern
To evaluate the influence of combined Solid Waste Management practices on
socioeconomic lives of residents, the total income was compared to the total
household expenses. The results were as in Table 4.13.
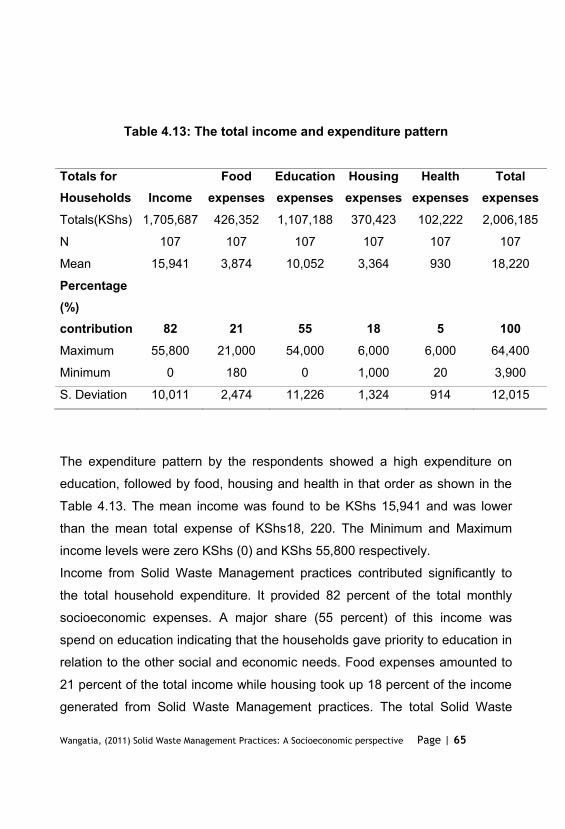
Table 4.13: The total income and expenditure pattern
Totals forHouseholds Income
Foodexpenses
Educationexpenses
Housingexpenses
Healthexpenses
Totalexpenses
Totals(KShs) 1,705,687 426,352 1,107,188 370,423 102,222 2,006,185
N 107 107 107 107 107 107
Mean 15,941 3,874 10,052 3,364 930 18,220
Percentage(%)contribution 82 21 55 18 5 100Maximum 55,800 21,000 54,000 6,000 6,000 64,400
Minimum 0 180 0 1,000 20 3,900
S. Deviation 10,011 2,474 11,226 1,324 914 12,015
The expenditure pattern by the respondents showed a high expenditure on
education, followed by food, housing and health in that order as shown in the
Table 4.13. The mean income was found to be KShs 15,941 and was lower
than the mean total expense of KShs18, 220. The Minimum and Maximum
income levels were zero KShs (0) and KShs 55,800 respectively.
Income from Solid Waste Management practices contributed significantly to
the total household expenditure. It provided 82 percent of the total monthly
socioeconomic expenses. A major share (55 percent) of this income was
spend on education indicating that the households gave priority to education in
relation to the other social and economic needs. Food expenses amounted to
21 percent of the total income while housing took up 18 percent of the income
generated from Solid Waste Management practices. The total Solid Waste
Management Income contribution of 82 percent to the total household
socioeconomic expenditure left a deficit of 17 percent only to be covered by
other sources of income. This implies that Solid Waste Management practices
had a positive influence on socioeconomic lives of Dandora residents and
shows that it contributed a significantly to their socioeconomic expenditure
leading to improved standards of living among Dandora residents.
Health expenses made up a mere 5 percent though it would have been
expected to be higher based on the risks in the nature of activities undertaken
in Solid Waste Management which pose health threats to participants. This
was explained by the fact that there was availability of cheap labour provided
by the youth who drop out of school opting for the menial jobs to raise income
es thus most
families took advantage of the cheap labour as a way of transferring the social
risks (mostly health related) to members outside their households thus
minimizing health related expenses at household level. This was supported by
the low mean expenditure of the area residents on health (KShs 930/=) as in
Table 4.10 which was expected to have been higher in comparison to the other
socioeconomic expenses based on the nature of activities undertaken in Solid
Waste Management exposing participants to frequent health risks. The fact
that total expenditure was higher than income implies that the households had
other sources of income they relied on to supplement income from Solid Waste
Management practices.
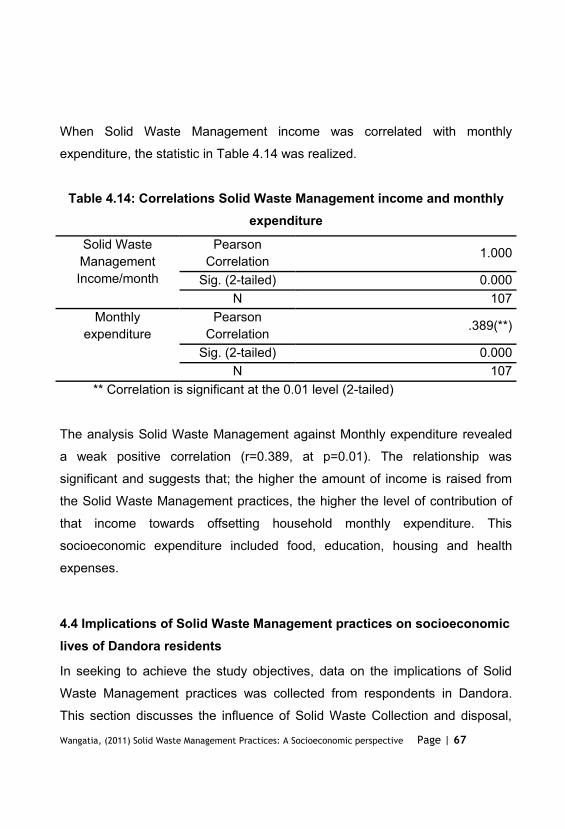
When Solid Waste Management income was correlated with monthly
expenditure, the statistic in Table 4.14 was realized.
Table 4.14: Correlations Solid Waste Management income and monthlyexpenditure
Solid WasteManagementIncome/month
PearsonCorrelation 1.000
Sig. (2-tailed) 0.000N 107
Monthlyexpenditure
PearsonCorrelation .389(**)
Sig. (2-tailed) 0.000N 107
** Correlation is significant at the 0.01 level (2-tailed)
The analysis Solid Waste Management against Monthly expenditure revealed
a weak positive correlation (r=0.389, at p=0.01). The relationship was
significant and suggests that; the higher the amount of income is raised from
the Solid Waste Management practices, the higher the level of contribution of
that income towards offsetting household monthly expenditure. This
socioeconomic expenditure included food, education, housing and health
expenses.
4.4 Implications of Solid Waste Management practices on socioeconomiclives of Dandora residents
In seeking to achieve the study objectives, data on the implications of Solid
Waste Management practices was collected from respondents in Dandora.
This section discusses the influence of Solid Waste Collection and disposal,
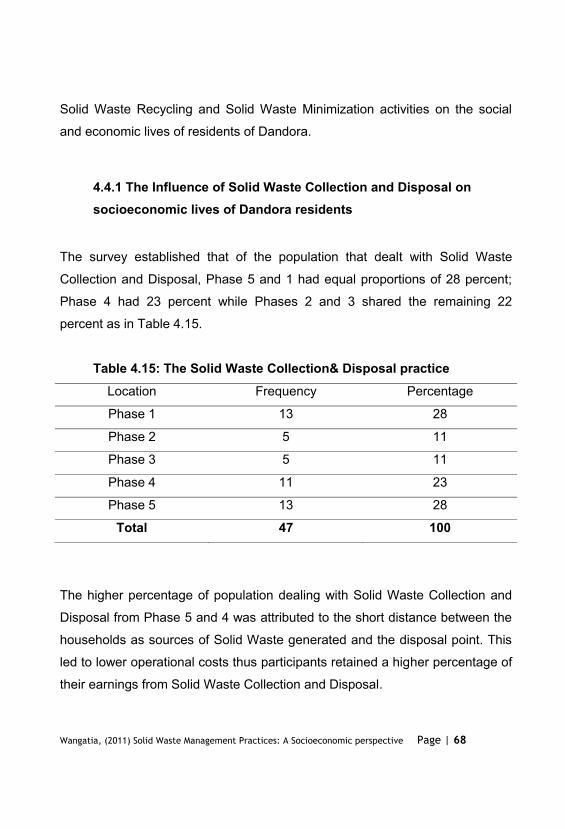
Solid Waste Recycling and Solid Waste Minimization activities on the social
and economic lives of residents of Dandora.
4.4.1 The Influence of Solid Waste Collection and Disposal onsocioeconomic lives of Dandora residents
The survey established that of the population that dealt with Solid Waste
Collection and Disposal, Phase 5 and 1 had equal proportions of 28 percent;
Phase 4 had 23 percent while Phases 2 and 3 shared the remaining 22
percent as in Table 4.15.
Table 4.15: The Solid Waste Collection& Disposal practiceLocation Frequency Percentage
Phase 1 13 28
Phase 2 5 11
Phase 3 5 11
Phase 4 11 23
Phase 5 13 28
Total 47 100
The higher percentage of population dealing with Solid Waste Collection and
Disposal from Phase 5 and 4 was attributed to the short distance between the
households as sources of Solid Waste generated and the disposal point. This
led to lower operational costs thus participants retained a higher percentage of
their earnings from Solid Waste Collection and Disposal.
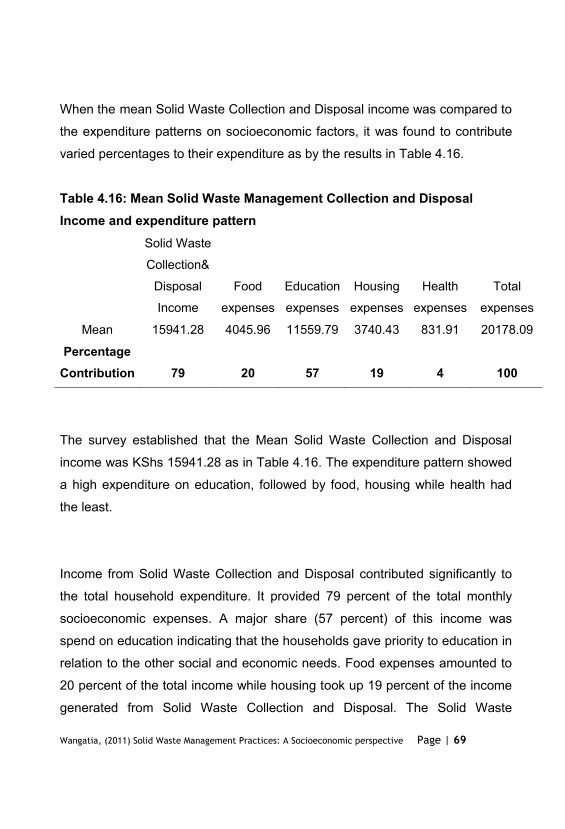
When the mean Solid Waste Collection and Disposal income was compared to
the expenditure patterns on socioeconomic factors, it was found to contribute
varied percentages to their expenditure as by the results in Table 4.16.
Table 4.16: Mean Solid Waste Management Collection and DisposalIncome and expenditure pattern
Solid Waste
Collection&
Disposal
Income
Food
expenses
Education
expenses
Housing
expenses
Health
expenses
Total
expenses
Mean 15941.28 4045.96 11559.79 3740.43 831.91 20178.09
PercentageContribution 79 20 57 19 4 100
The survey established that the Mean Solid Waste Collection and Disposal
income was KShs 15941.28 as in Table 4.16. The expenditure pattern showed
a high expenditure on education, followed by food, housing while health had
the least.
Income from Solid Waste Collection and Disposal contributed significantly to
the total household expenditure. It provided 79 percent of the total monthly
socioeconomic expenses. A major share (57 percent) of this income was
spend on education indicating that the households gave priority to education in
relation to the other social and economic needs. Food expenses amounted to
20 percent of the total income while housing took up 19 percent of the income
generated from Solid Waste Collection and Disposal. The Solid Waste
Collection and Disposal Income contribution of 79 percent to the household
socioeconomic expenditure left a deficit of 21 percent to be covered by other
sources of income. This implies that Solid Waste Collection and Disposal
activities had a positive influence on socioeconomic lives of Dandora residents
and shows that it contributed significantly to their socioeconomic expenditure
leading to improved standards of living among Dandora residents.
Health expenses make up 4 percent though it would have been expected to be
higher based on the nature of activities undertaken in Solid Waste Collection
and Disposal which pose health risks to participants. This is explained by the
fact that there was availability of cheap labour provided by the youth who drop
out of school opting for the menial jobs to raise income to help their
advantage of the cheap labour as a way of transferring the social risks (mostly
health related) to members outside their households thus minimizing health
related expenses as a household.
This is supported by the low mean expenditure of the area residents on health
(KShs 831.91) as in Table 4.13 which was expected to have been higher in
comparison to the other socioeconomic expenses based on the nature of
activities undertaken in Solid Waste Collection and Disposal exposing
participants to frequent health risks. The total expenditure of KShs 20178.09
was found to be higher than the total income that was raised from Solid Waste
Collection and Disposal. This implies that respondents had other sources of
income that they relied on to supplement their income from Solid Waste
Collection and Disposal activities.
Those who directly participated in Solid Waste Collection and Disposal
pursued it as a form of employment or to maintain clean environment
(environmental conservation). Those who did not argued that the solid waste
are smelly and the collectors did not have safety gear for handling the waste
thus made it a health risk. Some indicated that they had left the work to street
children who collected the waste for cheaper costs thus received low returns
from direct participation or that they had alternative source of income thus had
no time for involvement in solid waste management. Others felt that it resulted
into social stigma because those involved in Solid Waste Management were
despised by community. Cases of children dropping out of schools while opting
to make quick money from the landfill and engage in drug abuse were also
reported. This had also led to child employment (the exploitation of desperate
children dropping out of school), which is a bridge of the global community
labour laws on Child rights.
The SWM Collection and Disposal resulted into social, environmental and
economic effects. The health effects included occurrence of: Colds, coughs,
malaria due to bites from mosquitoes that breed in the Solid Waste due to
delayed collection, bronchitis/ URTIS, throat infections, respiratory infections,
Skin diseases, Tetanus due pricks from sharp objects in the Solid waste
collected and presence of rodents due to mini-dumping site within the estates.
Environmental effects included water pollution due to blocked sewage systems
and accumulation of waste in drainage systems; air pollution, bad smells, noise
pollution and land degradation.
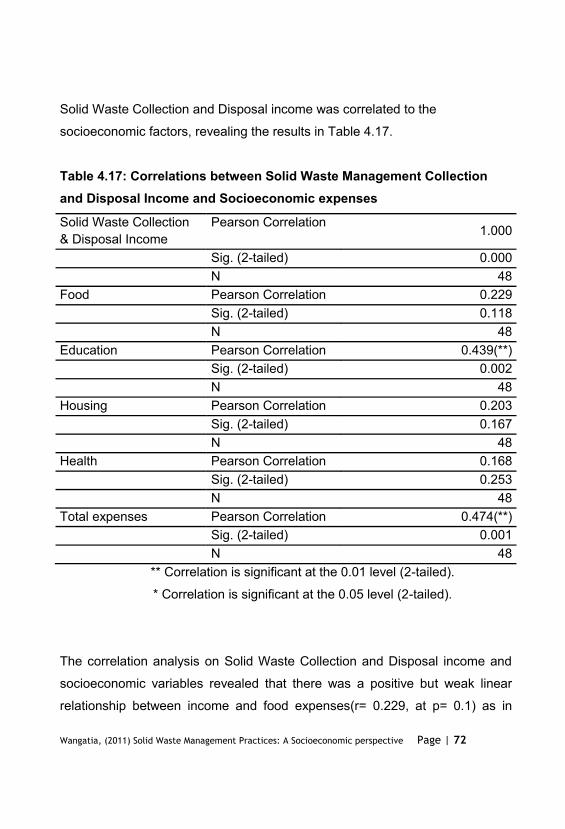
Solid Waste Collection and Disposal income was correlated to the
socioeconomic factors, revealing the results in Table 4.17.
Table 4.17: Correlations between Solid Waste Management Collectionand Disposal Income and Socioeconomic expenses
Solid Waste Collection& Disposal Income
Pearson Correlation 1.000
Sig. (2-tailed) 0.000 N 48Food Pearson Correlation 0.229 Sig. (2-tailed) 0.118 N 48Education Pearson Correlation 0.439(**) Sig. (2-tailed) 0.002 N 48Housing Pearson Correlation 0.203 Sig. (2-tailed) 0.167 N 48Health Pearson Correlation 0.168 Sig. (2-tailed) 0.253 N 48Total expenses Pearson Correlation 0.474(**) Sig. (2-tailed) 0.001 N 48
** Correlation is significant at the 0.01 level (2-tailed).
* Correlation is significant at the 0.05 level (2-tailed).
The correlation analysis on Solid Waste Collection and Disposal income and
socioeconomic variables revealed that there was a positive but weak linear
relationship between income and food expenses(r= 0.229, at p= 0.1) as in
Table 4.17. The correlation was significant. This implies that the higher the
amount of income is generated Solid Waste Collection and Disposal the more
the amount of money will be contributed towards settling socioeconomic
expenses of households.
Income and education expenses revealed a positive near moderate correlation
which was significant (r=0.439, at p=0.01). This implies that education took up
a major percentage of this income. The statistic also revealed a weak but
positive linear relationship between Income and housing expenses (r=0.203 at
p=0.1) which was not significant. Income and health analyses showed a weak
positive correlation (r=0.168, at p=0.1) which was not significant.
The Solid Waste Collection and Disposal income against total socioeconomic
expenses revealed a positive near moderate correlation (r=0.474) which was
significant at p=0.01. This shows that the income derived from Solid Waste
Collection and Disposal contributed to a greater extent in settling household
socioeconomic expenses especially education compared to the other sources
of income.
4.4.2 The Influence of Solid Waste Recycling on socioeconomiclives of Dandora residents
The survey established that the highest percentage of the population dealing
with Solid Waste Recycling came from phase 1 at 34 percent followed by
Phase 5 at 25 percent while Phase 3 had the least at 9 percent as in Table
4.18.
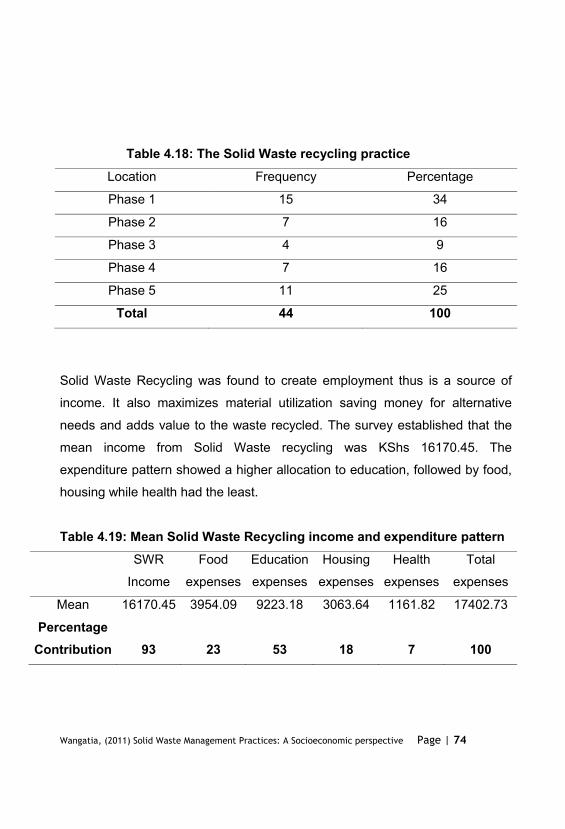
Table 4.18: The Solid Waste recycling practiceLocation Frequency Percentage
Phase 1 15 34
Phase 2 7 16
Phase 3 4 9
Phase 4 7 16
Phase 5 11 25
Total 44 100
Solid Waste Recycling was found to create employment thus is a source of
income. It also maximizes material utilization saving money for alternative
needs and adds value to the waste recycled. The survey established that the
mean income from Solid Waste recycling was KShs 16170.45. The
expenditure pattern showed a higher allocation to education, followed by food,
housing while health had the least.
Table 4.19: Mean Solid Waste Recycling income and expenditure patternSWR
Income
Food
expenses
Education
expenses
Housing
expenses
Health
expenses
Total
expenses
Mean 16170.45 3954.09 9223.18 3063.64 1161.82 17402.73
PercentageContribution 93 23 53 18 7 100
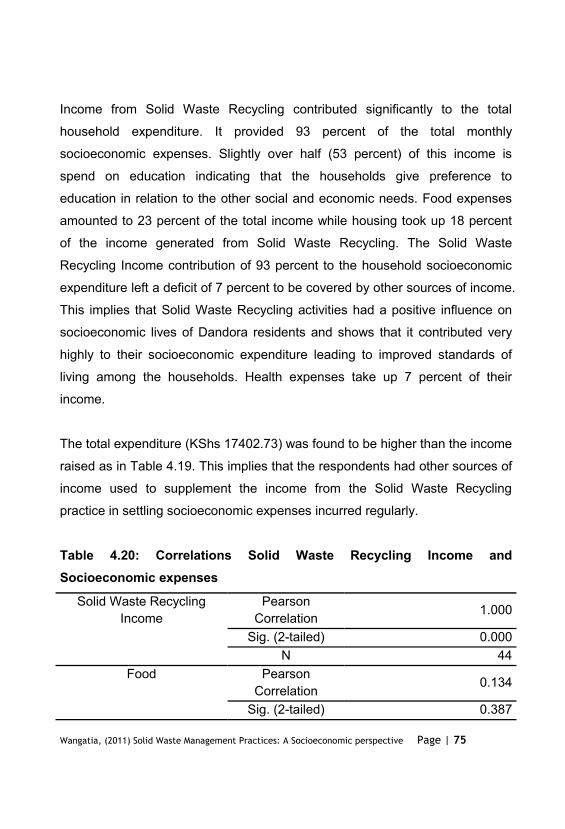
Income from Solid Waste Recycling contributed significantly to the total
household expenditure. It provided 93 percent of the total monthly
socioeconomic expenses. Slightly over half (53 percent) of this income is
spend on education indicating that the households give preference to
education in relation to the other social and economic needs. Food expenses
amounted to 23 percent of the total income while housing took up 18 percent
of the income generated from Solid Waste Recycling. The Solid Waste
Recycling Income contribution of 93 percent to the household socioeconomic
expenditure left a deficit of 7 percent to be covered by other sources of income.
This implies that Solid Waste Recycling activities had a positive influence on
socioeconomic lives of Dandora residents and shows that it contributed very
highly to their socioeconomic expenditure leading to improved standards of
living among the households. Health expenses take up 7 percent of their
income.
The total expenditure (KShs 17402.73) was found to be higher than the income
raised as in Table 4.19. This implies that the respondents had other sources of
income used to supplement the income from the Solid Waste Recycling
practice in settling socioeconomic expenses incurred regularly.
Table 4.20: Correlations Solid Waste Recycling Income andSocioeconomic expenses
Solid Waste RecyclingIncome
PearsonCorrelation 1.000
Sig. (2-tailed) 0.000N 44
Food PearsonCorrelation
0.134
Sig. (2-tailed) 0.387
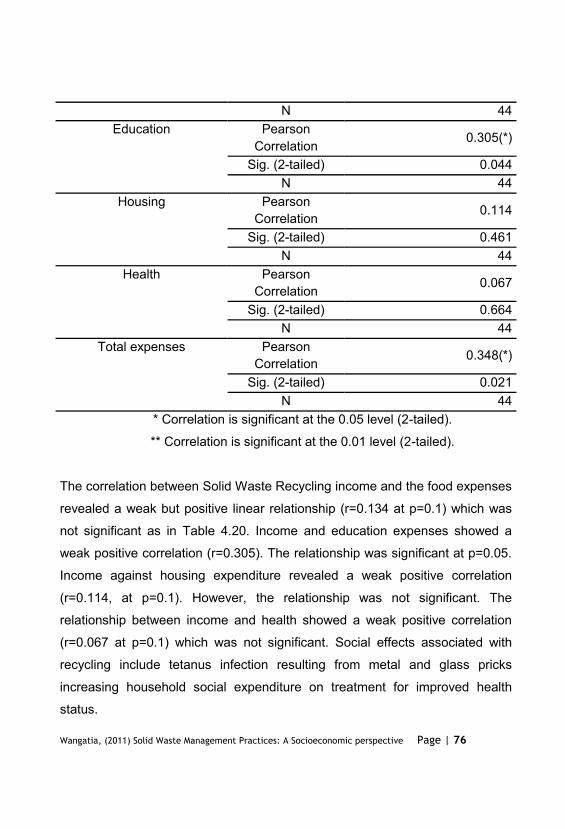
N 44Education Pearson
Correlation0.305(*)
Sig. (2-tailed) 0.044N 44
Housing PearsonCorrelation 0.114
Sig. (2-tailed) 0.461N 44
Health PearsonCorrelation 0.067
Sig. (2-tailed) 0.664N 44
Total expenses PearsonCorrelation 0.348(*)
Sig. (2-tailed) 0.021N 44
* Correlation is significant at the 0.05 level (2-tailed).
** Correlation is significant at the 0.01 level (2-tailed).
The correlation between Solid Waste Recycling income and the food expenses
revealed a weak but positive linear relationship (r=0.134 at p=0.1) which was
not significant as in Table 4.20. Income and education expenses showed a
weak positive correlation (r=0.305). The relationship was significant at p=0.05.
Income against housing expenditure revealed a weak positive correlation
(r=0.114, at p=0.1). However, the relationship was not significant. The
relationship between income and health showed a weak positive correlation
(r=0.067 at p=0.1) which was not significant. Social effects associated with
recycling include tetanus infection resulting from metal and glass pricks
increasing household social expenditure on treatment for improved health
status.
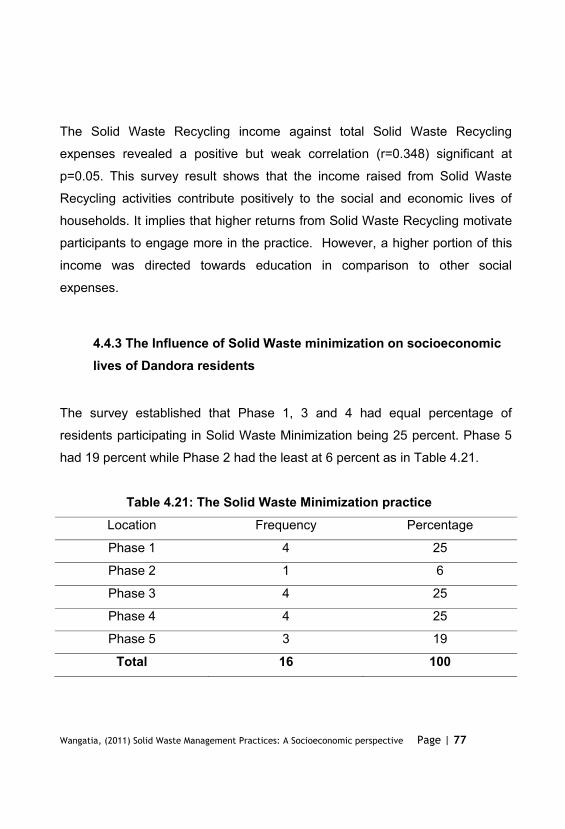
The Solid Waste Recycling income against total Solid Waste Recycling
expenses revealed a positive but weak correlation (r=0.348) significant at
p=0.05. This survey result shows that the income raised from Solid Waste
Recycling activities contribute positively to the social and economic lives of
households. It implies that higher returns from Solid Waste Recycling motivate
participants to engage more in the practice. However, a higher portion of this
income was directed towards education in comparison to other social
expenses.
4.4.3 The Influence of Solid Waste minimization on socioeconomiclives of Dandora residents
The survey established that Phase 1, 3 and 4 had equal percentage of
residents participating in Solid Waste Minimization being 25 percent. Phase 5
had 19 percent while Phase 2 had the least at 6 percent as in Table 4.21.
Table 4.21: The Solid Waste Minimization practiceLocation Frequency Percentage
Phase 1 4 25
Phase 2 1 6
Phase 3 4 25
Phase 4 4 25
Phase 5 3 19
Total 16 100
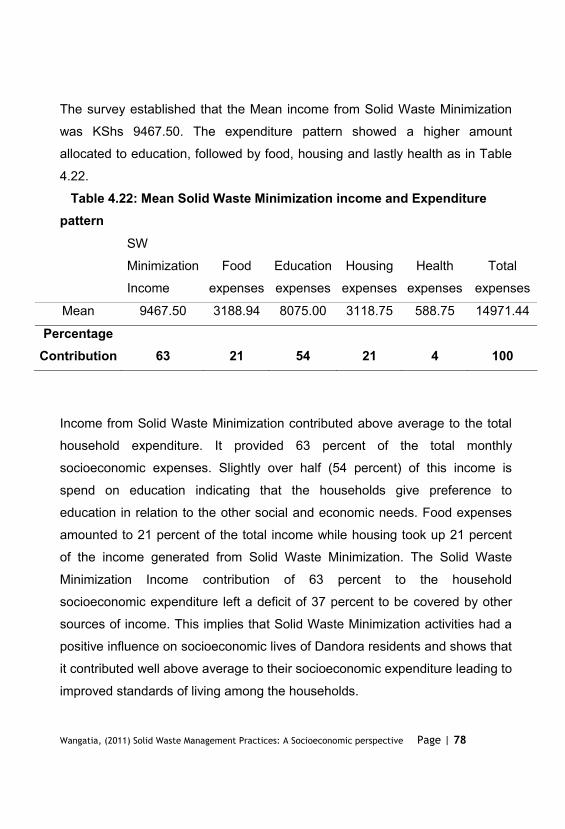
The survey established that the Mean income from Solid Waste Minimization
was KShs 9467.50. The expenditure pattern showed a higher amount
allocated to education, followed by food, housing and lastly health as in Table
4.22.
Table 4.22: Mean Solid Waste Minimization income and Expenditurepattern
SW
Minimization
Income
Food
expenses
Education
expenses
Housing
expenses
Health
expenses
Total
expenses
Mean 9467.50 3188.94 8075.00 3118.75 588.75 14971.44
PercentageContribution 63 21 54 21 4 100
Income from Solid Waste Minimization contributed above average to the total
household expenditure. It provided 63 percent of the total monthly
socioeconomic expenses. Slightly over half (54 percent) of this income is
spend on education indicating that the households give preference to
education in relation to the other social and economic needs. Food expenses
amounted to 21 percent of the total income while housing took up 21 percent
of the income generated from Solid Waste Minimization. The Solid Waste
Minimization Income contribution of 63 percent to the household
socioeconomic expenditure left a deficit of 37 percent to be covered by other
sources of income. This implies that Solid Waste Minimization activities had a
positive influence on socioeconomic lives of Dandora residents and shows that
it contributed well above average to their socioeconomic expenditure leading to
improved standards of living among the households.
Health expenses make up 4 percent though it would have been expected to be
higher based on the nature of activities undertaken in Solid Waste Minimization
which pose health risks to participants. This is explained by the fact that there
was availability of cheap labour provided by the youth who provide cheap
labour away from household mostly carried out at the dumping site.
Those who directly participated in Solid Waste burning indicated that they do
so because it reduces bad smell of the wastes and reduces the amount of
wastes collected and disposed. The street children light fires at the dumpsite
every night to keep themselves warm minimizing the wastes although this also
affects the residents as the wind blows the smoke into the densely populated
residential area surrounding it. 91 % of respondents avoid burning solid waste
at household level for fear of fire break ups in the congested residential area.
Burning of Solid Waste was socially linked to skin infections, environmental
effects like air pollution due to smoke and burnt waste particles, bad smell and
water pollution. Little economic value was attached to this practice thus the
level of income generated from this practice was relatively low in comparison
to the other Solid Waste Management practices.
The total expenditure (KShs 14971.44) was found to be higher than the income
raised. This implies that the respondents had other sources of income used in
supplementing the income raised from Solid Waste Minimization in meeting
their household expenditures.
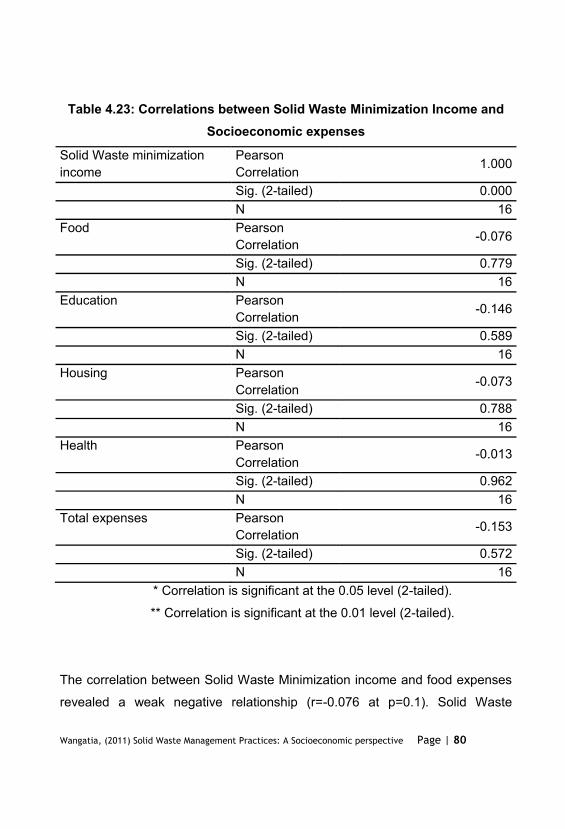
Table 4.23: Correlations between Solid Waste Minimization Income andSocioeconomic expenses
Solid Waste minimizationincome
PearsonCorrelation 1.000
Sig. (2-tailed) 0.000 N 16Food Pearson
Correlation -0.076
Sig. (2-tailed) 0.779 N 16Education Pearson
Correlation -0.146
Sig. (2-tailed) 0.589 N 16Housing Pearson
Correlation -0.073
Sig. (2-tailed) 0.788 N 16Health Pearson
Correlation -0.013
Sig. (2-tailed) 0.962 N 16Total expenses Pearson
Correlation -0.153
Sig. (2-tailed) 0.572 N 16
* Correlation is significant at the 0.05 level (2-tailed).
** Correlation is significant at the 0.01 level (2-tailed).
The correlation between Solid Waste Minimization income and food expenses
revealed a weak negative relationship (r=-0.076 at p=0.1). Solid Waste
Minimization income and education expenses also revealed a weak negative
correlation (r= -0.146 at p=0.1). The relationships above were not significant.
Solid Waste Minimization income and housing expenses revealed a weak
negative relationship (r= -0.073 at p=0.1). The correlation between Solid Waste
Minimization income and health expenses revealed a weak negative
relationship (r= -0.013 at p=0.1). Both relationships above were not significant.
The correlation between Solid Waste Minimization income and total Solid
Waste Minimization expenses revealed a weak negative correlation (r= -0.153
at p=0.1). This shows that the Income raised from Solid Waste Minimization
contributed to lesser extent to the overall household expenditure compared to
other sources of income spent on the socioeconomic aspects of households in
Dandora.
4.4.4 Correlations for combined Solid Waste Management Incomeagainst total expenditure
In general, Solid Waste Management was intended to create a clean
environment which reduces the occurrence of the social, environmental and
economic effects. Majority of the population engaged in Solid Waste
Management practices were motivated by the income generated from the
practices.
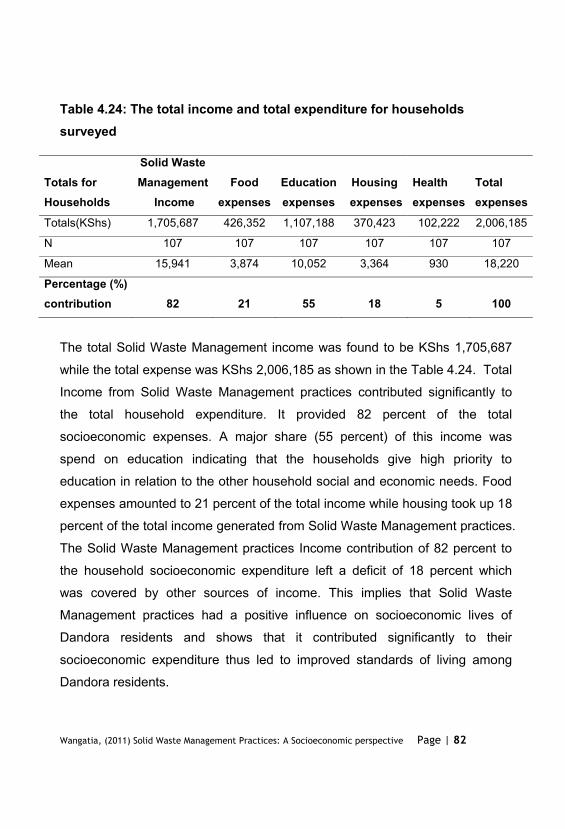
Table 4.24: The total income and total expenditure for householdssurveyed
Totals for Households
Solid WasteManagement
IncomeFood
expensesEducation expenses
Housingexpenses
Health expenses
Totalexpenses
Totals(KShs) 1,705,687 426,352 1,107,188 370,423 102,222 2,006,185
N 107 107 107 107 107 107
Mean 15,941 3,874 10,052 3,364 930 18,220
Percentage (%) contribution 82 21 55 18 5 100
The total Solid Waste Management income was found to be KShs 1,705,687
while the total expense was KShs 2,006,185 as shown in the Table 4.24. Total
Income from Solid Waste Management practices contributed significantly to
the total household expenditure. It provided 82 percent of the total
socioeconomic expenses. A major share (55 percent) of this income was
spend on education indicating that the households give high priority to
education in relation to the other household social and economic needs. Food
expenses amounted to 21 percent of the total income while housing took up 18
percent of the total income generated from Solid Waste Management practices.
The Solid Waste Management practices Income contribution of 82 percent to
the household socioeconomic expenditure left a deficit of 18 percent which
was covered by other sources of income. This implies that Solid Waste
Management practices had a positive influence on socioeconomic lives of
Dandora residents and shows that it contributed significantly to their
socioeconomic expenditure thus led to improved standards of living among
Dandora residents.
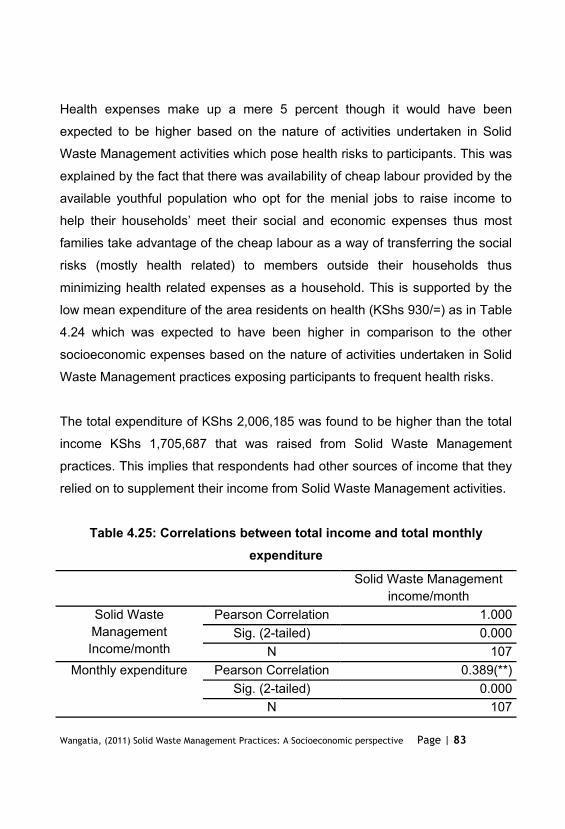
Health expenses make up a mere 5 percent though it would have been
expected to be higher based on the nature of activities undertaken in Solid
Waste Management activities which pose health risks to participants. This was
explained by the fact that there was availability of cheap labour provided by the
available youthful population who opt for the menial jobs to raise income to
families take advantage of the cheap labour as a way of transferring the social
risks (mostly health related) to members outside their households thus
minimizing health related expenses as a household. This is supported by the
low mean expenditure of the area residents on health (KShs 930/=) as in Table
4.24 which was expected to have been higher in comparison to the other
socioeconomic expenses based on the nature of activities undertaken in Solid
Waste Management practices exposing participants to frequent health risks.
The total expenditure of KShs 2,006,185 was found to be higher than the total
income KShs 1,705,687 that was raised from Solid Waste Management
practices. This implies that respondents had other sources of income that they
relied on to supplement their income from Solid Waste Management activities.
Table 4.25: Correlations between total income and total monthlyexpenditure
Solid Waste Management income/month
Solid WasteManagementIncome/month
Pearson Correlation 1.000Sig. (2-tailed) 0.000
N 107Monthly expenditure Pearson Correlation 0.389(**)
Sig. (2-tailed) 0.000N 107
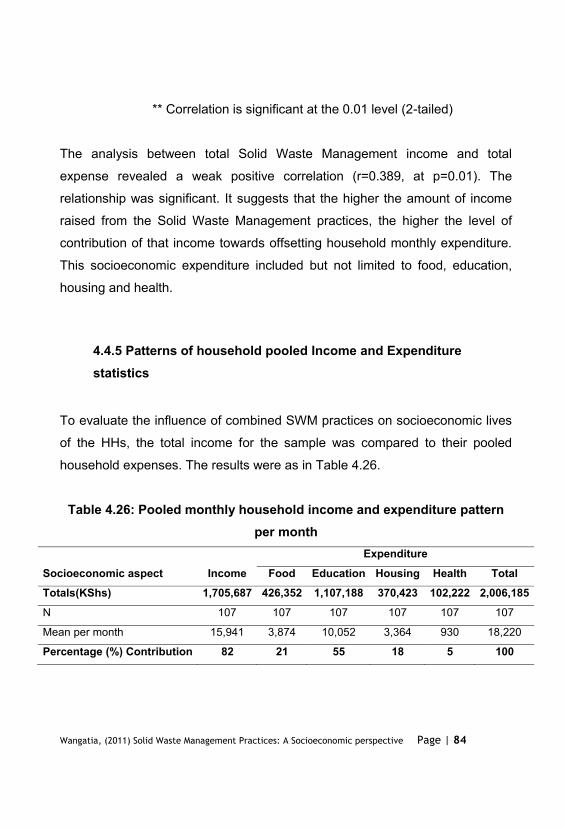
** Correlation is significant at the 0.01 level (2-tailed)
The analysis between total Solid Waste Management income and total
expense revealed a weak positive correlation (r=0.389, at p=0.01). The
relationship was significant. It suggests that the higher the amount of income
raised from the Solid Waste Management practices, the higher the level of
contribution of that income towards offsetting household monthly expenditure.
This socioeconomic expenditure included but not limited to food, education,
housing and health.
4.4.5 Patterns of household pooled Income and Expenditurestatistics
To evaluate the influence of combined SWM practices on socioeconomic lives
of the HHs, the total income for the sample was compared to their pooled
household expenses. The results were as in Table 4.26.
Table 4.26: Pooled monthly household income and expenditure patternper month
Socioeconomic aspect IncomeExpenditure
Food Education Housing Health Total Totals(KShs) 1,705,687 426,352 1,107,188 370,423 102,222 2,006,185N 107 107 107 107 107 107
Mean per month 15,941 3,874 10,052 3,364 930 18,220
Percentage (%) Contribution 82 21 55 18 5 100
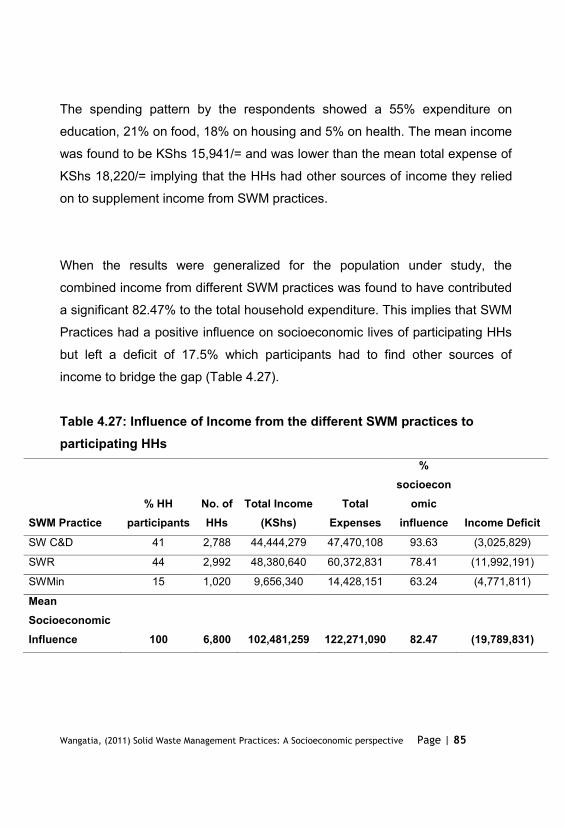
The spending pattern by the respondents showed a 55% expenditure on
education, 21% on food, 18% on housing and 5% on health. The mean income
was found to be KShs 15,941/= and was lower than the mean total expense of
KShs 18,220/= implying that the HHs had other sources of income they relied
on to supplement income from SWM practices.
When the results were generalized for the population under study, the
combined income from different SWM practices was found to have contributed
a significant 82.47% to the total household expenditure. This implies that SWM
Practices had a positive influence on socioeconomic lives of participating HHs
but left a deficit of 17.5% which participants had to find other sources of
income to bridge the gap (Table 4.27).
Table 4.27: Influence of Income from the different SWM practices toparticipating HHs
SWM Practice% HH
participantsNo. ofHHs
Total Income(KShs)
TotalExpenses
%socioecon
omicinfluence Income Deficit
SW C&D 41 2,788 44,444,279 47,470,108 93.63 (3,025,829)
SWR 44 2,992 48,380,640 60,372,831 78.41 (11,992,191)
SWMin 15 1,020 9,656,340 14,428,151 63.24 (4,771,811)
MeanSocioeconomicInfluence 100 6,800 102,481,259 122,271,090 82.47 (19,789,831)
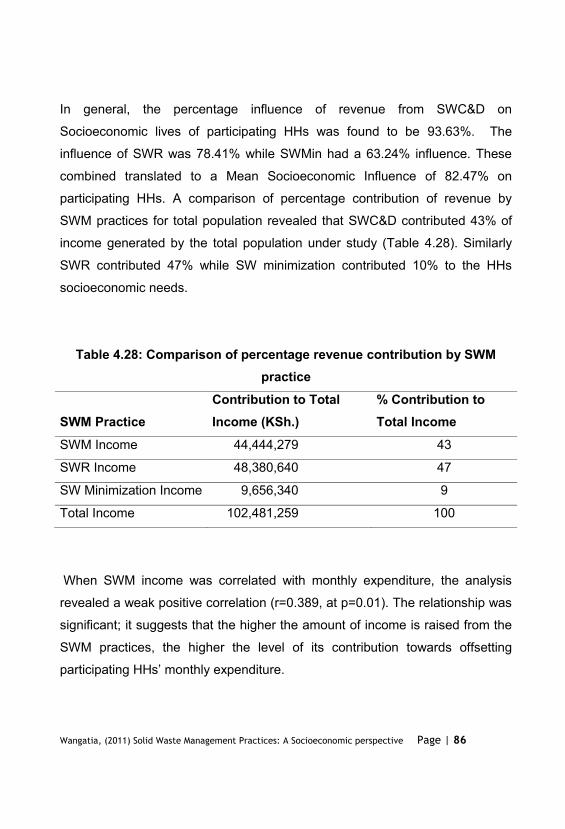
In general, the percentage influence of revenue from SWC&D on
Socioeconomic lives of participating HHs was found to be 93.63%. The
influence of SWR was 78.41% while SWMin had a 63.24% influence. These
combined translated to a Mean Socioeconomic Influence of 82.47% on
participating HHs. A comparison of percentage contribution of revenue by
SWM practices for total population revealed that SWC&D contributed 43% of
income generated by the total population under study (Table 4.28). Similarly
SWR contributed 47% while SW minimization contributed 10% to the HHs
socioeconomic needs.
Table 4.28: Comparison of percentage revenue contribution by SWMpractice
SWM PracticeContribution to TotalIncome (KSh.)
% Contribution toTotal Income
SWM Income 44,444,279 43
SWR Income 48,380,640 47
SW Minimization Income 9,656,340 9
Total Income 102,481,259 100
When SWM income was correlated with monthly expenditure, the analysis
revealed a weak positive correlation (r=0.389, at p=0.01). The relationship was
significant; it suggests that the higher the amount of income is raised from the
SWM practices, the higher the level of its contribution towards offsetting
CHAPTER FIVE:
SUMMARY OF FINDINGS, DISCUSSIONS, CONCLUSIONS ANDRECOMMENDATIONS
5.1 Introduction
This chapter consists of a summary of the findings of the research, conclusions
relating to the research objectives, Discussions in relation to literature
reviewed and recommendations on the Solid waste Management practices.
Areas that need further research have also been highlighted.
5.2 Summary
Solid Waste Management practices had a positive influence on socioeconomic
lives of Dandora residents. The total Solid Waste Management Income
contributed 82.88 percent of the total household socioeconomic expenditure
leaving a deficit of 17.12 percent only to be covered by other sources of
income.
The Solid Waste Collection and Disposal income against total socioeconomic
expenses revealed a positive moderate correlation (r=0.474) which was
significant at p=0.01 showing that Solid Waste Collection and Disposal income
contributed to a greater extent in settling household socioeconomic expenses.
Solid Waste Recycling income against total Solid Waste Recycling expenses
revealed a positive but weak correlation (r=0.348) significant at p=0.05
showing that income raised from Solid Waste Recycling activities contribute
positively to the social and economic lives of households. The correlation
between Solid Waste Minimization income and total Solid Waste Minimization
expenses revealed a weak negative correlation (r=-0.153 at p=0.1) showing
that the Income raised from Solid Waste Minimization contributed to lesser
extent to the overall household expenditure compared to other sources of
income spent on the socioeconomic aspects of households in Dandora.
In general, the correlation between total Solid Waste Management income and
total expense revealed a weak positive correlation (r=0.389, at p=0.01)
showing a significant relationship between the two variables. It suggests that
the higher the amount of income raised from the Solid Waste Management
practices, the higher the level of contribution of that income towards offsetting
household monthly expenditure. This socioeconomic expenditure included
expenses on food, education, housing and health. This is because the Solid
Waste Management practices contribute to a greater extent to the availability
5.3 Discussions
The mean distance from households to the dumpsite was 1060 metres
(approximately 1 kilometer). Phase 2 was the furthest at 1958 metres while
Phase 4 had a mean of 361 metres with some households as close as 50
metres away from the dumpsite. These findings agree with NCC, (2010) which
showed that there are high population density settlements that have emerged
in Dandora some of which are less than the recommended 1km buffer between
the dumpsite and the settlements posing serious health problems to the
residents.
The Solid Waste Recycling Income contribution of 93 percent to the household
socioeconomic expenditure left a deficit of 7 percent to be covered by other
sources of income. This implies that Solid Waste Recycling activities had a
positive influence on socioeconomic lives of Dandora residents and shows that
it contributed very highly to their socioeconomic expenditure leading to
improved standards of living among the households. Health expenses take up
7 percent of their income. The Solid Waste Minimization Income contribution of
63 percent to the household socioeconomic expenditure left a deficit of 37
percent to be covered by other sources of income. This implies that Solid
Waste Minimization activities had a positive influence on socioeconomic lives
of Dandora residents and shows that it contributed well above average to their
socioeconomic expenditure leading to improved standards of living among the
households.
These results agree with Scheinberg (2001), who argued that developing
countries face challenges in proper management of waste with most effort
made to reduce the final volumes and generate sufficient funds for waste
management. He argues that if most waste could be diverted for material; and
resources recovery, then a substantial reduction in final volumes of waste
could be achieved while the recovered material and resources could be utilized
to generate revenue to fund waste management. Based on the 3Rs (Reduce,
Reuse, and Recycle) this forms the premise of Integrated Solid Waste
Management (ISWM) system principle. He adds that with an appropriate
segregation and recycling system, a significant quantity of wastes can be
diverted from landfills and converted into a useful resource.
The mean income raised from the Solid Waste Management practices was
found to be KShs 15,941/= per month while mean expenditure was KShs
18,220/= per month. The higher expenditure implies that households must
raise additional income from other sources to supplement the income from
Solid Waste Management practices in meeting their needs.
These finding agrees with JICA (1998), that Recycling of products such as
papers, tyres, plastics, used clothes, and metals, is becoming increasingly
popular. This is especially true for the example given on community-based
organizations (CBOs) managed by women recycling market waste from
Korogocho Market near Dandora to produce organic manure for sale thus
raising income for household use. The report revealed that the self-help
activities of the Mukuru project earned KShs 1.55 million in 1996 from the
recovery of 1,018 tons of materials per year. This income was however not
ers and for financing investments required
to improve efficiency agreeing with the above results in Dandora where the
mean income raised from the Solid Waste Management practices was found to
be KShs 15,941/= per month lower than the mean expenditure of KShs
18,220/= per month thus not enough to take care of all the household
socioeconomic needs.
The survey found that waste collection and disposal was done once a week
(Saturday only) which was not regular enough thus led to creation of mini-
dumping sites in the residential areas. Due to mini-dumping, it was noted
during the survey in most of the solid waste collection points and disposal sites
that there was presence of offensive odour, smoke and disease vectors such
as cockroaches, rats, flies and mosquitoes that have negative impacts on
public health. This led to environmental pollution the increased chances of
disease infections thus having a negative effect on the socioeconomic lives of
residents. Respondents in this study mentioned cases of throat infections,
respiratory infections, Skin diseases, Tetanus due pricks from sharp objects
from the dumping sites among children and adults in the within residential
areas.
These results agree with JICA (2010) that wastes are not collected regularly at
many collection points. They reported that delays in waste collection for a long
time generate the smell of a black liquid called leachate which is considered as
a high polluter when it reaches watercourses due to its high concentration in
Bio-chemical Oxygen Demand (BOD), Chemical Oxygen Demand (COD) and
chemicals. It was noted that the leachates generated in these collection points
and in the illegal disposal sites pollute the household water systems and rivers
of Nairobi. They also observed that solid wastes are dumped intentionally
along the roads or river banks by the residents. This brings as a consequence
the transfer of uncollected wastes to rivers, drains, streams and lowland areas
when Nairobi experiences intensive rains causing high level water and soil
pollution which in turn affects the health of residents consuming the water.
The mean percentage willingness to pay (WTP) for Solid Waste Management
practices was 61 percent with values as low as of zero (0) percent and a high
of 100 percent. The mean fee charged is KShs 109/= charged per month with
a minimum of KShs 40/= and a maximum of KShs 200/= per month while some
do not pay for the Solid Waste Management services at all. The waste charge
system of the households is based on the location/distance of the client's
premises and not the quantity of waste to be collected. The timing of payment
for the waste charges is mostly on a monthly basis.
These findings strongly agree with JICA (2010) preparatory survey for
integrated Solid Waste Management in Nairobi city that revealed a WTP =
KShs 118.60/=. The survey reported that the level of waste charge in low
income areas like Dandora had been set up on the basis the fixed pricing
system which is referred to the willingness to pay (WTP) and the average
affordability to pay (ATP). The public awareness survey conducted by JICA
revealed an average WTP and an average ATP of the low income areas as
KShs 32/= per month and KShs 153/= per month respectively. The actual
waste charge was therefore set up between the WTP and the ATP.
The fact that those who are not willing to pay choose to dump the waste by
themselves agrees with earlier studies by Ali (2009) examining
Characterization management and improvement Strategies for household
waste in Nairobi. He found out that it has become a common practice to dump
waste on streets, roadside and between plots especially in the middle and low
income areas. He also documented that the prevailing high household solid
waste generation is due to increasing population, improved income, poor
attitudes and behaviour, low environmental awareness, absence of source
reduction and recycling practices, geographical and physical conditions, low
frequency of collection and characteristics of service area.
5.4 Conclusions
Income from Solid Waste Collection and Disposal contributed significantly to
the total household expenditure. It provided 79 percent of the total monthly
socioeconomic expenses. A major share of this income is spend on education
indicating that the households give priority to education in relation to the other
social and economic needs. Food and housing expenses took up lower
percentages of the income generated from Solid Waste Collection and
Disposal. This implies that Solid Waste Collection and Disposal activities had a
positive influence on socioeconomic lives of Dandora residents and shows that
it contributed significantly to their socioeconomic expenditure leading to
improved standards of living among Dandora residents. Health expenses
make up the least percentage though it was have been expected to be higher
based on the nature of activities undertaken in Solid Waste Collection and
Disposal which pose health risks to participants. This is explained by the fact
that there was availability of cheap labour provided by the youthful population
social and economic expenses thus most families take advantage of the cheap
labour as a way of transferring the social risks (mostly health related) to
members outside their households thus minimizing health related expenses as
a household.
Income from Solid Waste Recycling contributed significantly to the total
household expenditure. It provided 93 percent of the total monthly
socioeconomic expenses. Slightly over half of this income is spend on
education indicating that the households give preference to education in
relation to the other social and economic needs. Food, housing amounted to
less than half of the income generated from Solid Waste Recycling. This
implies that Solid Waste Recycling activities had a positive influence on
socioeconomic lives of Dandora residents and shows that it contributed very
highly to their socioeconomic expenditure leading to improved standards of
living among the households. Health expenses were lower than expected due
to health risk transference to hired labour from outside the households.
Income from Solid Waste Minimization contributed above average to the total
household expenditure. It provided 63 percent of the total monthly
socioeconomic expenses. Slightly over half of this income is spend on
education indicating that the households give preference to education in
relation to the other social and economic needs. Food and housing expenses
amounted to less than half of the total income generated from Solid Waste
Minimization. This implies that Solid Waste Minimization activities had a
positive influence on socioeconomic lives of Dandora residents and shows that
it contributed well above average to their socioeconomic expenditure leading to
improved standards of living among the households. Health expenses were
low. This is explained by the fact that there was availability of cheap labour
provided by the youth who provide cheap labour away from household mostly
carried out at the dumping site.
The mean monthly income generated from SWM practices (Collection and
Disposal, Recycling and Minimization) were KShs 15941.28/=, KShs
16170.45/=, and KShs 9467.50/= contributing 79%, 93% and 63% income
levels to participating HHs socioeconomic expenditure respectively. Majority of
the population participating in SWM practices were motivated by the income
generated from the practice.
Solid Waste Management practices contributed positively to the
socioeconomic lives of residents of Dandora. Despite the low affordability and
willingness to pay for the Solid Waste Management services and with the
requirement to offset the general operational costs, the participants still
manage to raise income used to settle their household socioeconomic
expenses from the Solid Waste Management practices. These socioeconomic
expenses includes but not limited to food, education, housing and health
expenses. A larger portion of the household income is spent on education
enhancing social and personal development that could yield additional income
to the households in the long run.
The total Income from combined Solid Waste Management practices
contributed significantly to the total household expenditure. It provided 82
percent of the total socioeconomic expenses. A major share of this income is
spend on education indicating that the households give high priority to
education in relation to the other household social and economic needs. This
implies that Solid Waste Management practices had a positive influence on
socioeconomic lives of Dandora residents and shows that it contributed
significantly to their socioeconomic expenditure thus led to improved standards
of living among Dandora residents.
The household socioeconomic expenditure items of the total SWM Practices
monthly income for the 6800 HHs under study, KShs 102,481,259/=, included
but were not limited to Education, food, health, and housing expenses. A major
share of the income was spent on education indicating that the HHs gave high
priority to education in relation to the other household social and economic
needs. Based on the findings, SWM is a viable venture option that investors
can target for revenue generation in improving livelihoods and for poverty
eradication. The percentage influence of revenue from SWC&D on
Socioeconomic lives of participating HHs was 93.63%, 78.41% for SWR and
63.24% for SWMin. These combined translated to a positive Meansocioeconomic influence of 82.47% on participating HHs leaving a deficitof 17.5% only to be covered by other sources of income thus reject theHypothesis that: Solid Waste Management Practices have no influenceon socioeconomic lives of participating households.
toward appropriate waste separation and discharge, low affordability of waste
generators to pay garbage fees charged, low frequency of waste collection and
transportation, lack of containers to accept discharged waste, lack of collection
staffs and collection vehicles thus a low capability of waste collectors, weak
legal enforcement inform of weak penalty clause provisions in law and lack of
Waste Management programs were found to constrain the successful
implementation of Solid Waste Management practices in Dandora.
5.5 Recommendations
Based on the findings and discussion on the influence of Solid Waste
Management Practices on Socioeconomic lives of residents of Dandora above,
the researcher recommends the following: -
1. Characterization (separation) of waste at household level to facilitate
easier collection, disposal and recycling of Solid Waste to ensure that
participants accrue maximum benefits from the practices.
2. The survey found that waste collection and disposal was done once a
week (Saturday only) which was not regular enough thus led to creation
of mini-dumping sites in the residential areas. The researcher
recommends that regular waste collection and disposal (twice or three
times per week) should be done to avoid creation of mini-dumping sites
in the residential areas.
3. The survey found that most recyclers lack knowledge and equipment to
facilitate the recycling processes. The researcher recommends that the
Government of Kenya should encourage and support research and
popularize the use of appropriate solid waste management methods that
are locally available and low cost technologies to reduce the cost of
handling waste especially recyclable waste.
4. From the findings, the leachate water from the dumping sites is
estimated to be one of the causes of water pollution of the water supplied
to households through broken pipes. This affects health of residents
leading to occurrences of diseases as well as water and soil pollution
due to toxic substance from the waste generated. To improve and
develop of the hazardous waste management system, the researcher
recommends provision of a separate cell at the sanitary landfill for the
ashes of incinerated hazardous wastes. Though composting of municipal
waste is not popular method for treatment of municipal waste,
composting of biodegradable waste is more environment-friendly system.
Considering the impacts on the environment, the also recommends
digging of compost sites for households especially by those farming to
generate organic manure for organic farming.
5. The survey found out that the lack of awareness of existing Solid Waste
Management policies by the respondents was a great challenge to the
Solid Waste Management process. Majority respondents did not have
any knowledge of existing policies that govern Solid Waste Management
practices in Kenya. Those who were aware of these policies rated the
level of success of policy implementation as very low. The researcher
recommends creation of awareness and trainings to households by
government line ministries (Ministries of Local Government, Environment
and Mineral Resources, and Public Health & Sanitation) and relevant
stakeholders/ partners on waste management and existing policies
through education extension services to inform the public on Solid Waste
Management policy requirement to ensure they support the Solid Waste
Management practices on a knowledge basis.
5.5 Suggestions for future research
The survey found that waste collection and disposal was done once a week
which was not regular enough thus led to creation of mini-dumping sites in the
residential areas. This result to leachate water causing water pollution of the
water supplied to households through broken pipes. This affects health of
residents leading to occurrences of diseases as well as water and soil pollution
due to toxic substance from the waste generated. Research should be
conducted to establish the levels of toxicity and associated health risks so as
to inform proper Solid Waste Management practices among households
through appropriate campaigns
REFERENCES
Agunwamba, J. C. (1998). Solid Waste Management in Nigeria: Problems and
issues. Environmental Management Vol. 22, No. 6, pp849-856
Ali, A. (2009). Characterization management and improvement Strategies for
household waste in Nairobi, Thesis (PhD) University of Nairobi
Census, (2010). 2009 Population & Housing Census Results, Ministry of State
for Planning, National Development and Vision 2030
Connett, P. (1998). ation: A poor solution for the 21st
Energy: Nov 24 -25, 1998, Amsterdam.
Dulo, S. O. (2010). Impact of Solid Waste Management in Kenya on ground
water. Thesis (PhD) University of Nairobi
ENVILEAD, ARNIKA and IPEN. (2005). Contamination of Eggs from the
ENVILEAD, (2005). Fostering Active and Effective Civil Society Participation in
Preparations for Implementation of the Stockholm Convention: A Study
on Waste Incineration Activities in Nairobi that Release Dioxin and Furan
into the Environment. The International POPs Elimination Project (IPEP)-
Environmental Liaison, Education and Action for Development
(ENVILEAD) Kenya, 2005
Glossary of Environment Statistics, Studies in Methods. (2001). Series F, No.
67, United Nations, New York.
Ikiara, M. et. al. (2004).
d, I. J. Post and Furedy C.(eds), solid Waste
management and Recycling: Actors, Partnerships and Policies in
Hyderabad, India and Nairobi, Kenya, Chapter4, Kluwer Academic
Publishers, Dordrecht, The Netherlands
try Urban Poor to Solid Waste
Management (SWM) services: Role and Potential of Public Private
-
infrastructure project: Infrastructure Service Entitlements and Urban
poverty in Kenya.
IPEP, (2005). International POPs Elimination Project: Fostering Active and
Effective Civil Society Participation in Preparations for Implementation of
the Stockholm Convention. A Study on Waste Incineration Activities in
Nairobi that Release Dioxin and Furan into the Environment
Environmental Liaison, Education and Action for Development
(ENVILEAD) Kenya
Israel, G. D. (1992). Sampling The Evidence OF Extension Program Impact.
Program Evaluation and Organizational Development, IFAS, University
of Florida
Jarry, D. and J. Jarry, (1995). Collins Dictionary of Sociology. Glasgow.
HarperCollins Publishers
JICA, (2010). Preparatory Survey for Integrated Solid Waste Management in
Nairobi city in the republic of Kenya, Draft final report volume 3:
Supporting report section H, Financial and Economic aspect.
JICA, (1998).
KAM, (2003). Position Paper to NEMA - Plastic Sector
Kamel, L. (2003). mmunity-based waste management into
-es-Salaam,
Tanzania, March.
Kenya National Inventory of Persistent Organic Pollutants under the Stockholm
Convention, (2004) final report (Unpublished).
Kituo cha Sheria, (2010). Report on The Dandora Dumping Site Visit Carried
out on 5th March 2010 (Legal Aid & Education Department)
Kothari, C. R. (2005). 2nd ed. Research Methodology: Methods and
Technology, New Age International Publishers. Pp 401
Luscombe, D. and Costner, P. (2003). Technical Criteria for the Destruction of
Stockpiled Persistent Organic Pollutants; Greenpeace International
Science Unit.
Luzadis, et al. (2002). Towards a More integrated Ecosystems Model Society
and Natural Resources 15: 89- 94
Machlis, et. al. (2005). The Structure of Human Ecosystems, V.05.2,
Maina, A. W. (2005). community involvement in Domestic Solid Waste
Management: A case study of Kayole environmental management
Association
Mann, S. Prem. (2005). 5th ed. Introductory statistics, Von Hoffman.
Miaoulis, G. and Michener, R. D. (1976). An Introduction to Sampling.
Dubuque, Iowa: Kendall/Hunt Publishing Company.
Muniafu, M. and Otiato, E. (2010). Solid Waste Management in Nairobi, Kenya:
A case for emerging economies. Journal of Language, Technology &
Entrepreneurship in Africa: Vol. 2. No.1. 2010, ISSN 1998-1279 346
Nairobi City Council, (2002). A Survey on medical Waste in Nairobi
(unpublished report)
Nairobi City Council, (2002). A Survey on medical Waste in Nairobi
(unpublished report)
Nairobi City Council, (2010). Draft policy framework on Solid Waste
Management in Kenya
National Assembly Official Report, (2009). (A) Question No.180 De-
Commissioning of Dandora Dumpsite
NCC- UNEP, (2010). Integrated Solid Waste Management Plan for the City of
Nairobi, Kenya: Situation Analysis & Detailed Action Plan (City Council of
Nairobi - United Nations Environment Programme: 2010)
Neamatalla, M. (1998).
-Cities Programme, publication
MCP-0 I 8D, accessible at
http://www.megacitiesproject.org/publications/pdf/mcp018d.pdf
Otieno, J. O. (2006). Household preferences for improved solid waste
management: A case study of Nairobi City
Patandin, S. (1999). Effects of environmental exposure to polychlorinated
biphenyls and dioxins on growth and development in young children, A
prospective follow-up study of breast-fed infants from birth until 42
months of age. Thesis, Erasmus University, Rotterdam.
Rotich, K. H. Yongsheng, Z. and Dong, J. (2005). Municipal solid waste
management challenges in developing countries- Kenyan Case Study.
Waste Management - Volume 26, Issue 1, 2006, pg92-100
Scheinberg, A. (2001). Integrated Sustainable Solid Waste Management- The
Concepts, Tools for Decision-makers. Experiences from Urban Waste
Expertise Programme (1995- 2001)
SIDI, (1993). Metropolitan Colombia Solid Waste Management Study,
Secretariat for Infrastructure Development and Investment, Colombia, Sri
Lanka
Spadaro, et. al. (2005). Environmental impacts and costs of solid waste: a
comparison of landfill and incineration. St.-Michel, 75272 Paris 06,
France
Srinivas, H. (2008). Solid Waste Management: A policy and programme matrix.
http://gdrc.org/uem/waste/swm-matrix.html. last accessed February,
2011.
Syagga, P. (1992). Problems of Solid Waste Management in Urban Residential
Areas in Kenya: in: The Proceedings of African Research Network for
Urban Management (ARNUM) Workshop: Urban Management in Kenya,
Joyce Malombe (ed.). University of Nairobi, 1992.
Syagga, P. (1993). Background Paper on Waste Management in Central and
Eastern African Region. Unpublished research paper. Nairobi: University
of Nairobi, Department of Land Development.
Tangri, N. (2003). Waste Incineration: A Dying Technology: Essential Action
for GAIA: www.no-burn.org
Tom, et. al., (2010) Municipal Solid Waste Composting: Strategies for
Separating Contaminants, Boyce Thompson Institute for Plant Research
Cornell University
Toxics Link, (2000). Trojan Horses: Persistent organic Pollutants in India.
Delhi: Toxics Link.
UNEP, (2005): Plastic bag ban in Kenya proposed as part of the New waste
UNEP, (2005). Selection, design and implementation of economic instruments
in: Solid Waste Management, Nairobi.
UNES, (2004). University of Nairobi Enterprises and Services Limited: National
Inventory of Persistent Organic Pollutants (POPs) under Stockholm
Convention.
UNEP, (2009). Developing Integrated Solid Waste Management Plan- Training
Manuals Volume1: Waste Characterization and quantification with
Projections for future.
UNEP, (2009). Developing Integrated Solid Waste Management Plan- Training
Manuals Volume2: Assessment of Current Waste Management System
and Gaps therein.
UNEP, (2009). Developing Integrated Solid Waste Management Plan- Training
Manuals Volume3: Targets and issues of Concern for ISWM.
UNEP, (2009). Developing Integrated Solid Waste Management Plan- Training
Manuals Volume4: ISWM Plan.
USEPA, (2000). Exposure and Human Health Reassessment of 2,3,7,8-
Tetrachlorodibenzo-p-Dioxin (TCDD) and Related Compounds, Part I:
Estimating Exposure to Dioxin Like Compounds, Volume 2: Sources of
Dioxin Like compounds in the United States, Draft Final Report
EPA/600/P-00/001Bb, (http://www.epa.gov/ncea ).
USEPA, (1998). The Inventory of Sources of Dioxins in the United States,
USEPA, Office of Research and Development, External Review Draft,
EPA/600/P-98/002Aa. April.
Vasanthi, P., Kaliappan S. and Srinivasaraghavan, R. (2007). Impact of poor
solid waste management on ground water Environmental Monitoring and
Assessment Volume 143, No.s 1-3, 227-238.
Wambugu, C. (2010). Aftermath of the Dandora Dumpsite.
http://hakijamii.wordpress.com/2010/09/22/the-aftermath-of-the-dandora-
dumpsite/. Last accessed 12th February, 2011
Wael, S. F. (2005). The impact of privatization of solid waste management on
the Zabaleen garbage collectors of Cairo in the Journal for Environment
& Urbanization Vol 17 No 2, 2005
World Bank, (2008). improving Municipal Solid Waste Management in India- A
sourcebook for Policy Makers and Practitioners
Yamane, T. (1967). Statistics: An Introductory Analysis. 2nd Ed., New York:
Harper Row
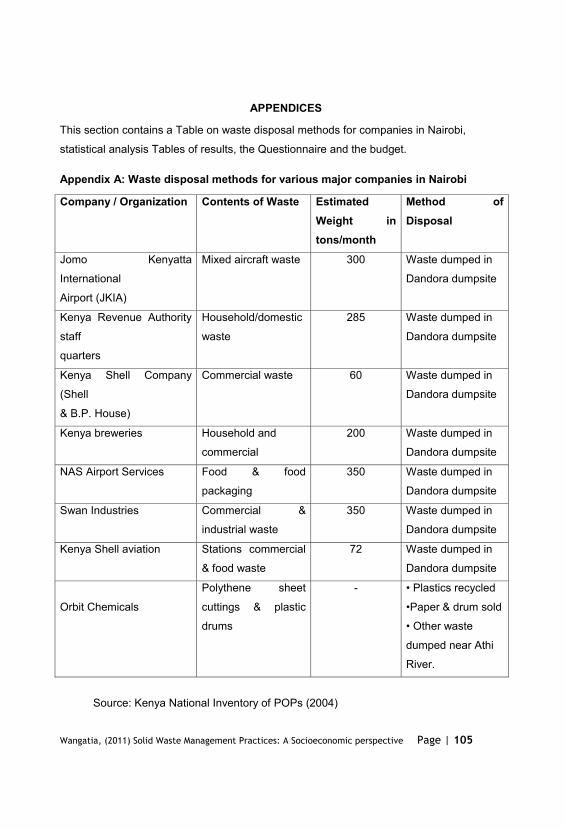
APPENDICES
This section contains a Table on waste disposal methods for companies in Nairobi,
statistical analysis Tables of results, the Questionnaire and the budget.
Appendix A: Waste disposal methods for various major companies in Nairobi
Company / Organization Contents of Waste EstimatedWeight intons/month
Method ofDisposal
Jomo Kenyatta
International
Airport (JKIA)
Mixed aircraft waste 300 Waste dumped in
Dandora dumpsite
Kenya Revenue Authority
staff
quarters
Household/domestic
waste
285 Waste dumped in
Dandora dumpsite
Kenya Shell Company
(Shell
& B.P. House)
Commercial waste 60 Waste dumped in
Dandora dumpsite
Kenya breweries Household and
commercial
200 Waste dumped in
Dandora dumpsite
NAS Airport Services Food & food
packaging
350 Waste dumped in
Dandora dumpsite
Swan Industries Commercial &
industrial waste
350 Waste dumped in
Dandora dumpsite
Kenya Shell aviation Stations commercial
& food waste
72 Waste dumped in
Dandora dumpsite
Orbit Chemicals
Polythene sheet
cuttings & plastic
drums
-
Paper & drum sold
dumped near Athi
River.
Source: Kenya National Inventory of POPs (2004)
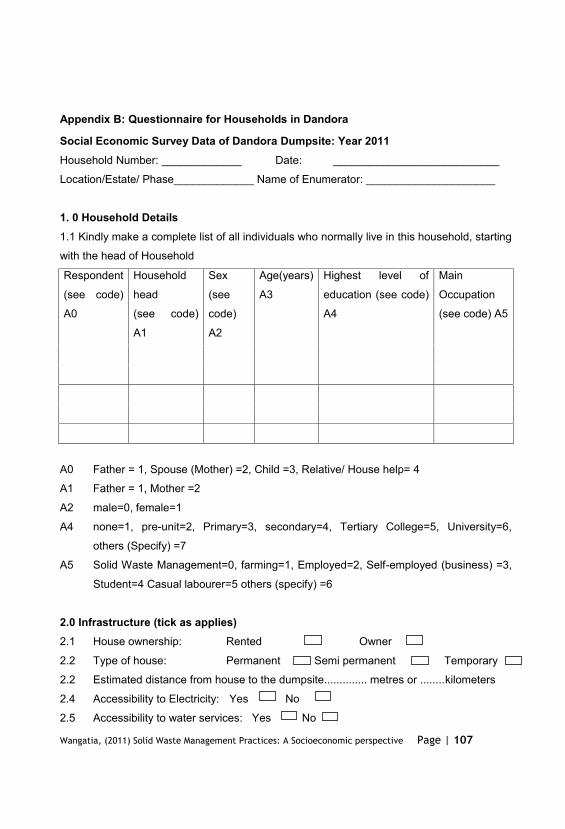
Appendix B: Questionnaire for Households in Dandora
Social Economic Survey Data of Dandora Dumpsite: Year 2011Household Number: _____________ Date: ___________________________
Location/Estate/ Phase_____________ Name of Enumerator: _____________________
1. 0 Household Details1.1 Kindly make a complete list of all individuals who normally live in this household, starting
with the head of Household
Respondent
(see code)
A0
Household
head
(see code)
A1
Sex
(see
code)
A2
Age(years)
A3
Highest level of
education (see code)
A4
Main
Occupation
(see code) A5
A0 Father = 1, Spouse (Mother) =2, Child =3, Relative/ House help= 4
A1 Father = 1, Mother =2
A2 male=0, female=1
A4 none=1, pre-unit=2, Primary=3, secondary=4, Tertiary College=5, University=6,
others (Specify) =7
A5 Solid Waste Management=0, farming=1, Employed=2, Self-employed (business) =3,
Student=4 Casual labourer=5 others (specify) =6
2.0 Infrastructure (tick as applies)2.1 House ownership: Rented Owner
2.2 Type of house: Permanent Semi permanent Temporary
2.2 Estimated distance from house to the dumpsite.............. metres or ........kilometers
2.4 Accessibility to Electricity: Yes No
2.5 Accessibility to water services: Yes No
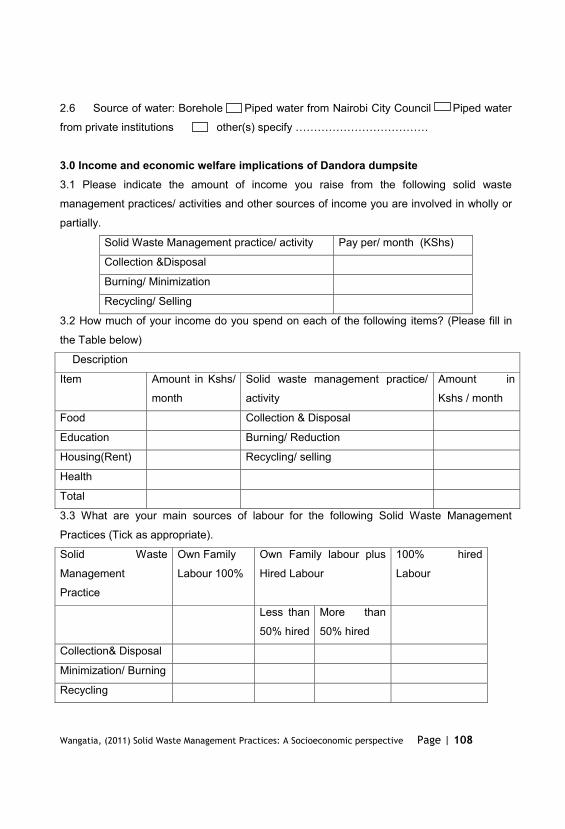
2.6 Source of water: Borehole Piped water from Nairobi City Council Piped water
from priv
3.0 Income and economic welfare implications of Dandora dumpsite3.1 Please indicate the amount of income you raise from the following solid waste
management practices/ activities and other sources of income you are involved in wholly or
partially.
Solid Waste Management practice/ activity Pay per/ month (KShs)
Collection &Disposal
Burning/ Minimization
Recycling/ Selling
3.2 How much of your income do you spend on each of the following items? (Please fill in
the Table below)
Description
Item Amount in Kshs/
month
Solid waste management practice/
activity
Amount in
Kshs / month
Food Collection & Disposal
Education Burning/ Reduction
Housing(Rent) Recycling/ selling
Health
Total
3.3 What are your main sources of labour for the following Solid Waste Management
Practices (Tick as appropriate).
Solid Waste
Management
Practice
Own Family
Labour 100%
Own Family labour plus
Hired Labour
100% hired
Labour
Less than
50% hired
More than
50% hired
Collection& Disposal
Minimization/ Burning
Recycling
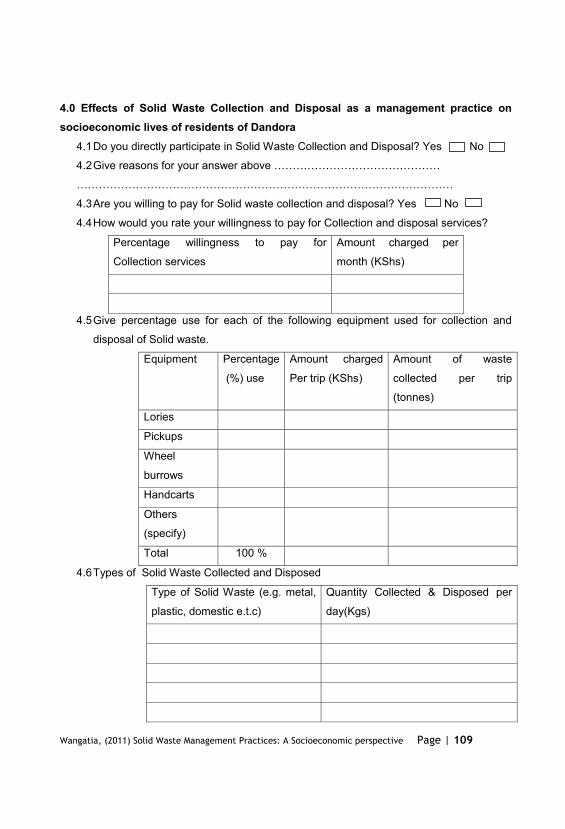
4.0 Effects of Solid Waste Collection and Disposal as a management practice onsocioeconomic lives of residents of Dandora
4.1Do you directly participate in Solid Waste Collection and Disposal? Yes No
4.2
4.3Are you willing to pay for Solid waste collection and disposal? Yes No
4.4How would you rate your willingness to pay for Collection and disposal services?
Percentage willingness to pay for
Collection services
Amount charged per
month (KShs)
4.5Give percentage use for each of the following equipment used for collection and
disposal of Solid waste.
Equipment Percentage
(%) use
Amount charged
Per trip (KShs)
Amount of waste
collected per trip
(tonnes)
Lories
Pickups
Wheel
burrows
Handcarts
Others
(specify)
Total 100 %
4.6Types of Solid Waste Collected and Disposed
Type of Solid Waste (e.g. metal,
plastic, domestic e.t.c)
Quantity Collected & Disposed per
day(Kgs)
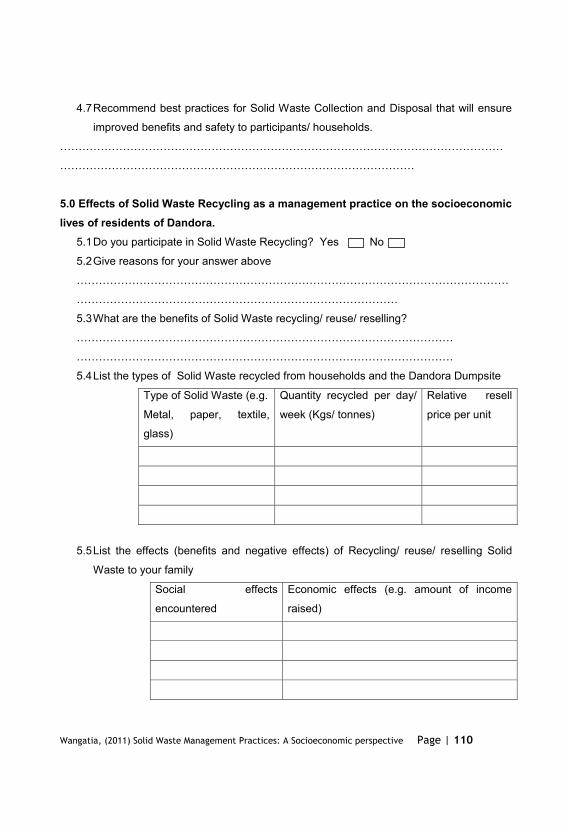
4.7Recommend best practices for Solid Waste Collection and Disposal that will ensure
improved benefits and safety to participants/ households.
5.0 Effects of Solid Waste Recycling as a management practice on the socioeconomiclives of residents of Dandora.
5.1Do you participate in Solid Waste Recycling? Yes No
5.2Give reasons for your answer above
5.3What are the benefits of Solid Waste recycling/ reuse/ reselling?
5.4List the types of Solid Waste recycled from households and the Dandora Dumpsite
Type of Solid Waste (e.g.
Metal, paper, textile,
glass)
Quantity recycled per day/
week (Kgs/ tonnes)
Relative resell
price per unit
5.5List the effects (benefits and negative effects) of Recycling/ reuse/ reselling Solid
Waste to your family
Social effects
encountered
Economic effects (e.g. amount of income
raised)
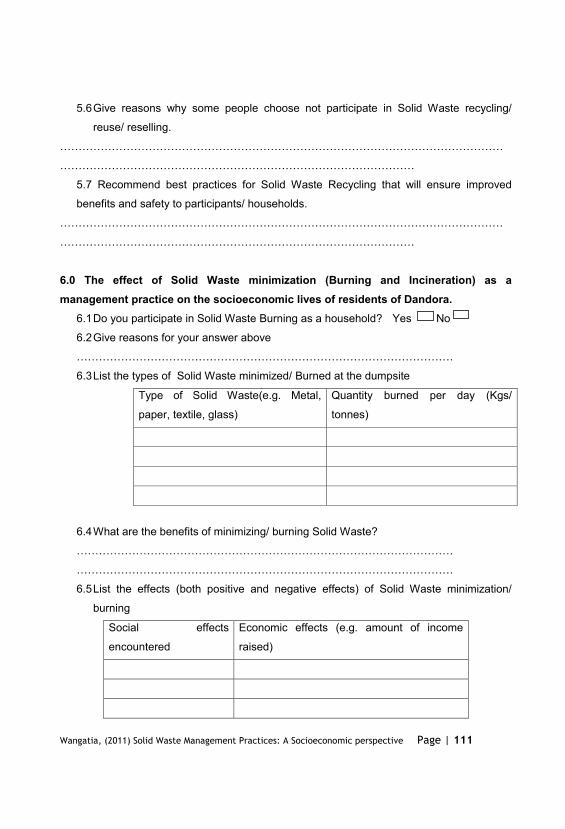
5.6Give reasons why some people choose not participate in Solid Waste recycling/
reuse/ reselling.
5.7 Recommend best practices for Solid Waste Recycling that will ensure improved
benefits and safety to participants/ households.
6.0 The effect of Solid Waste minimization (Burning and Incineration) as amanagement practice on the socioeconomic lives of residents of Dandora.
6.1Do you participate in Solid Waste Burning as a household? Yes No
6.2Give reasons for your answer above
6.3List the types of Solid Waste minimized/ Burned at the dumpsite
Type of Solid Waste(e.g. Metal,
paper, textile, glass)
Quantity burned per day (Kgs/
tonnes)
6.4What are the benefits of minimizing/ burning Solid Waste?
6.5List the effects (both positive and negative effects) of Solid Waste minimization/
burning
Social effects
encountered
Economic effects (e.g. amount of income
raised)
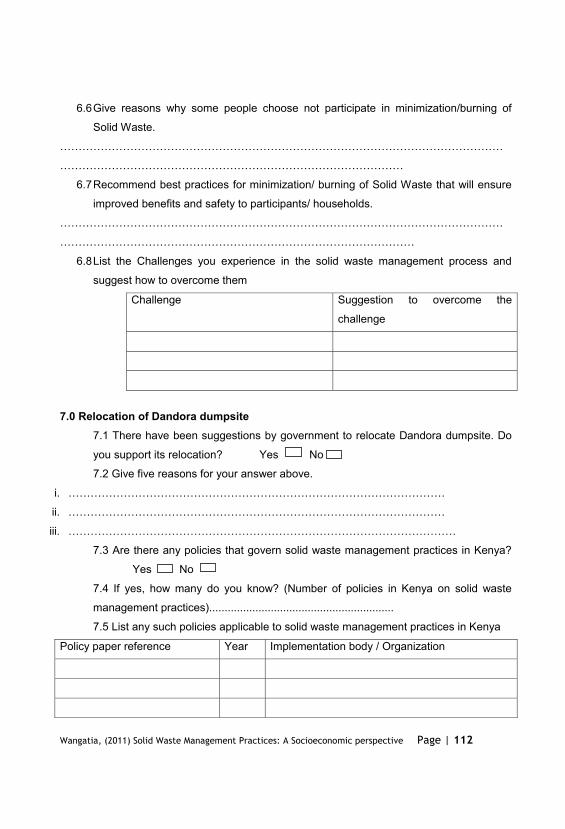
6.6Give reasons why some people choose not participate in minimization/burning of
Solid Waste.
6.7Recommend best practices for minimization/ burning of Solid Waste that will ensure
improved benefits and safety to participants/ households.
6.8List the Challenges you experience in the solid waste management process and
suggest how to overcome them
Challenge Suggestion to overcome the
challenge
7.0 Relocation of Dandora dumpsite7.1 There have been suggestions by government to relocate Dandora dumpsite. Do
you support its relocation? Yes No
7.2 Give five reasons for your answer above.
i.
ii.
iii.
7.3 Are there any policies that govern solid waste management practices in Kenya?
Yes No
7.4 If yes, how many do you know? (Number of policies in Kenya on solid waste
management practices)............................................................
7.5 List any such policies applicable to solid waste management practices in Kenya
Policy paper reference Year Implementation body / Organization
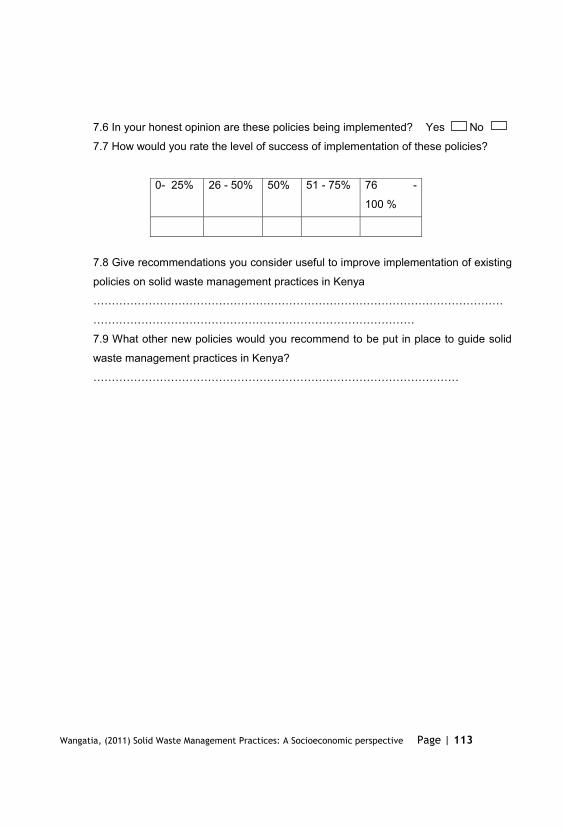
7.6 In your honest opinion are these policies being implemented? Yes No
7.7 How would you rate the level of success of implementation of these policies?
0- 25% 26 - 50% 50% 51 - 75% 76 -
100 %
7.8 Give recommendations you consider useful to improve implementation of existing
policies on solid waste management practices in Kenya
7.9 What other new policies would you recommend to be put in place to guide solid
waste management practices in Kenya?