Exam rept 50-266/OL-93-02 administered during wk of 930927 ...
Upload
khangminh22Category
view
3download
0
555225-L-sub01-os-Kufaifi555225-L-sub01-os-Kufaifi555225-L-sub01-os-Kufaifi555225-L-sub01-os-Kufaifi
SOLA
R PH
OTO
VO
LTAIC
SYSTEM
S IN IN
DO
NESIA’S G
RID
Kunaifi

555225-L-sub01-bw-Kunaifi555225-L-sub01-bw-Kunaifi555225-L-sub01-bw-Kunaifi555225-L-sub01-bw-KunaifiProcessed on: 8-2-2021Processed on: 8-2-2021Processed on: 8-2-2021Processed on: 8-2-2021 PDF page: 1PDF page: 1PDF page: 1PDF page: 1
i
SOLAR PHOTOVOLTAIC SYSTEMS IN INDONESIA’S GRID
EXPERIENCES OF END-USERS AND EVALUATIONS OF PHOTOVOLTAIC SYSTEMS PERFORMANCE
Kunaifi

555225-L-sub01-bw-Kunaifi555225-L-sub01-bw-Kunaifi555225-L-sub01-bw-Kunaifi555225-L-sub01-bw-KunaifiProcessed on: 8-2-2021Processed on: 8-2-2021Processed on: 8-2-2021Processed on: 8-2-2021 PDF page: 2PDF page: 2PDF page: 2PDF page: 2
ii
555225-L-sub01-bw-Kunaifi555225-L-sub01-bw-Kunaifi555225-L-sub01-bw-Kunaifi555225-L-sub01-bw-KunaifiProcessed on: 8-2-2021Processed on: 8-2-2021Processed on: 8-2-2021Processed on: 8-2-2021 PDF page: 3PDF page: 3PDF page: 3PDF page: 3
iii
SOLAR PHOTOVOLTAIC SYSTEMS IN INDONESIA’S GRID
EXPERIENCES OF END-USERS AND EVALUATIONS OF PHOTOVOLTAIC SYSTEMS PERFORMANCE
DISSERTATION
to obtain the degree of doctor at the Universiteit Twente,
on the authority of the rector magnificus, prof. dr. ir. A. Veldkamp,
on account of the decision of the Doctorate Board to be publicly defended
on Thursday 25 February 2021 at 12.45 hours
by
Kunaifi
born on the 24th of July, 1976 in Pulau Godang Kari, Riau, Indonesia
555225-L-sub01-bw-Kunaifi555225-L-sub01-bw-Kunaifi555225-L-sub01-bw-Kunaifi555225-L-sub01-bw-KunaifiProcessed on: 8-2-2021Processed on: 8-2-2021Processed on: 8-2-2021Processed on: 8-2-2021 PDF page: 4PDF page: 4PDF page: 4PDF page: 4
iv
This dissertation has been approved by:
Supervisor prof. dr. A.H.M.E. Reinders
Cover design: Dr. Petir Papilo, ST., M.Sc. Printed by: Ipskamp Printing, Enschede ISBN: 978-90-365-5137-3 DOI: 10.3990/1.9789036551373 URL: https://doi.org/10.3990/1.9789036551373 Images used at the first page of each chapter were obtained from the following authors/sources: CNBC Indonesia/Gustidha Budiartie (Chapter 1, 2), Siar.com (Chapter 3), Sumatera News (Chapter 4), Kabar Selebes (Chapter 5), PT. PJB (Chapter 6), Detik.com (Chapter 7), and Indonesia Berinovasi (Chapter 8).
© 2021 Kunaifi Kunaifi, The Netherlands. All rights reserved. No parts of this thesis may be reproduced, stored in a retrieval system or transmitted in any form or by any means without permission of the author. Alle rechten voorbehouden. Niets uit deze uitgave mag worden vermenigvuldigd, in enige vorm of op enige wijze, zonder voorafgaande schriftelijke toestemming van de auteur.
555225-L-sub01-bw-Kunaifi555225-L-sub01-bw-Kunaifi555225-L-sub01-bw-Kunaifi555225-L-sub01-bw-KunaifiProcessed on: 8-2-2021Processed on: 8-2-2021Processed on: 8-2-2021Processed on: 8-2-2021 PDF page: 5PDF page: 5PDF page: 5PDF page: 5
v
GGraduation Committee: Chair / secretary prof.dr.ir. H.F.J.M. Koopman University of Twente Supervisor prof.dr.A.H.M.E. Reinders University of Twente and
Eindhoven University of Technology
Committee Members prof. dr. ir. L.A.M. van Dongen University of Twente prof. dr. ir. J.I.M. Halman University of Twente prof. dr. ir. Th. H. van der Meer University of Twente prof. dr. ir. M. Ashari Sepuluh Nopember Institute of
Technology prof. dr. A.W. Weeber Delft University of Technology prof. dr. M. Creatore Eindhoven University of
Technology dr. ir. A. J. Veldhuis Alliander N.V. The research presented in this thesis has been conducted with the major financial support of Lembaga Pengelola Dana Pendidikan (LPDP), an Indonesia endowment fund for education under the Ministry of Finance of the Republic of Indonesia. Also, this publication is based upon work from COST Action CA16235 PEARL PV supported by COST (European Cooperation in Science and Technology). Some travel grants were financed by the Department of Design Production & Management at the Faculty of Engineering Technology of the University of Twente. These supports are gratefully acknowledged.

555225-L-sub01-bw-Kunaifi555225-L-sub01-bw-Kunaifi555225-L-sub01-bw-Kunaifi555225-L-sub01-bw-KunaifiProcessed on: 8-2-2021Processed on: 8-2-2021Processed on: 8-2-2021Processed on: 8-2-2021 PDF page: 6PDF page: 6PDF page: 6PDF page: 6
vi

555225-L-sub01-bw-Kunaifi555225-L-sub01-bw-Kunaifi555225-L-sub01-bw-Kunaifi555225-L-sub01-bw-KunaifiProcessed on: 8-2-2021Processed on: 8-2-2021Processed on: 8-2-2021Processed on: 8-2-2021 PDF page: 7PDF page: 7PDF page: 7PDF page: 7
vii
Dedicated to my parents
Mina Asiah &
Ali Soe’id

555225-L-sub01-bw-Kunaifi555225-L-sub01-bw-Kunaifi555225-L-sub01-bw-Kunaifi555225-L-sub01-bw-KunaifiProcessed on: 8-2-2021Processed on: 8-2-2021Processed on: 8-2-2021Processed on: 8-2-2021 PDF page: 8PDF page: 8PDF page: 8PDF page: 8
viii

555225-L-sub01-bw-Kunaifi555225-L-sub01-bw-Kunaifi555225-L-sub01-bw-Kunaifi555225-L-sub01-bw-KunaifiProcessed on: 8-2-2021Processed on: 8-2-2021Processed on: 8-2-2021Processed on: 8-2-2021 PDF page: 9PDF page: 9PDF page: 9PDF page: 9
ix
SSummary
Being the largest renewable source in Indonesia, the potential for solar electricity
in this tropical country is enormous. However, the growth of installed photovoltaic (PV)
systems in Indonesia is lagging behind the expected potential of solar energy
conversions. Moreover, evidence regarding the suitability of PV systems in Indonesia,
by research on their performance is lacking.
In this thesis, PV systems in Indonesia have been evaluated from a societal and
technical perspective aiming at answering the following main research question: What
are the experiences and attitudes of Indonesian end-users towards the electricity grid,
as well as solar energy, and would a transition towards solar photovoltaic systems be
feasible considering the performance of PV systems operating under Indonesia’s tropical
climate conditions? This main question can be broken down into five sub-questions:
1. What are the main factors that influence the energy situation in Indonesia?
2. What are the challenges in providing proper electrical power supply to the whole
population in Indonesia?
3. What are the experiences of end-users with the electricity grid in Indonesia?
4. What are the attitudes of the grid’s end-users toward solar photovoltaic systems?
5. How well do PV systems in Indonesia function, and how are their performances as
compared to PV systems which are installed in other climates?
In order to answer these questions, the research design was divided into three
parts: (I) an evaluation of the present situation in Indonesia regarding energy and power
supply, (II) an assessment of the preferences and attitudes of end-users of the electricity
grid, and (III) an evaluation of the performance of PV systems in Indonesia as compared
to other climates. The general methods applied to address each part are briefly
summarized below.
The evaluation of the present situation regarding energy and power supply has been
conducted through a deep analysis of available literature and statistics from available
data.
The assessment of the preferences and attitudes of end-users of the electricity grid
has been executed using a combination of a desk study, user survey, and measurement
of the power quality of the low voltage distribution networks of the state-owned utility,
PLN.
The evaluation of the performance of PV systems is aimed at calculating the
performance ratio (PR) and degradation. The PR was estimated using IEC standards.
555225-L-sub01-bw-Kunaifi555225-L-sub01-bw-Kunaifi555225-L-sub01-bw-Kunaifi555225-L-sub01-bw-KunaifiProcessed on: 8-2-2021Processed on: 8-2-2021Processed on: 8-2-2021Processed on: 8-2-2021 PDF page: 10PDF page: 10PDF page: 10PDF page: 10
Summary
x
The degradation calculations use two different methods: a year-on-year approach from
NREL/RdTools and seasonal and trend decomposition by applying locally weighted
scatterplot smoothing by STL decomposition.
After having conducted the above research activities, we have drawn conclusions
that are grouped according to the corresponding sub-research question as follows.
Indonesia has many isolated power systems of different sizes which are distributed
across big islands. On small islands, diesel generators have been a popular option for
decades. The energy demand is high and increasing which can be explained by
Indonesia’s population size and economic conditions. Amid fossil fuel reserves that are
facing depletion, Indonesia needs a new approach in developing its power system to
ensure energy security and sustainability. Given its unique geography, the available
renewable energy sources, and the high level of CO2 emissions, renewable energy is
considered a feasible option for Indonesia.
Indonesia has been facing three types of challenges in providing a proper electric
power supply to the whole population. The first challenge is due to significant variations
between regions regarding access to electricity, power sales, price of electrical energy,
and the reliability of electricity services by the grid. Second, electricity consumption per
capita in Indonesia is relatively low compared to many other countries. In 2017,
electricity consumption per capita was only 1 megawatt-hour (MWh), which was low
compared to that in Vietnam at 1.6 MWh/capita, Thailand at 2.7 MWh/capita, Singapore
at 8.7 MWh/capita, and the Netherlands at 6.7 MWh/capita. Third, power infrastructure
development and climate change mitigation in Indonesia seems to be conflicting with
each other, where the majority of generation come from coal-powered plants while the
progress with implementing renewable power systems has been slow.
Based on our survey in 2017, an average end-user of the electricity grid perceived
4-fold to 14-fold more frequent outages as compared to the reliability metrics reported
by PLN. Also, end-user perceived 8-times to 12-times longer duration of outages as
compared to the official statistics. To improve the reliability of electricity supply at home,
respondents were willing to pay an additional 10% to 30% to their monthly electricity
bill. Our survey was conducted in Pekanbaru in the Province of Riau, Kupang in the
Province of East Nusa Tenggara (ENT), and Jayapura in the Province of Papua,
Indonesia, and as such represents well the actual situation in urban environment on
islands outside Java and Bali.
Using the same survey described above, it was found that the majority of the grid’s
users were knowledgeable about renewable energy and climate change. They believed
that renewable energy is important for Indonesia and knew that electricity generated by

555225-L-sub01-bw-Kunaifi555225-L-sub01-bw-Kunaifi555225-L-sub01-bw-Kunaifi555225-L-sub01-bw-KunaifiProcessed on: 8-2-2021Processed on: 8-2-2021Processed on: 8-2-2021Processed on: 8-2-2021 PDF page: 11PDF page: 11PDF page: 11PDF page: 11
Summary
xi
PV systems is more sustainable than the electricity from the grid. Most of the households
indicated that they liked to have PV systems on their houses’ rooftops.
From the study above, it can be concluded that the reliability of electricity supply
by the low-voltage grid in Indonesia is low, while on the other hand, the public in
Indonesia favors renewable energy, especially solar PV systems. Therefore rather than
adding more fossil-fueled power plants to the central grid, it could be worthwhile to
consider the use of solar PV systems for local electricity generation to the low-voltage
grid in order to locally solve electricity supply issues in a sustainable manner. One
important question remains, are solar PV systems technically suitable for Indonesia?
This question will be answered below.
The performance and degradation rate of a 1 MWp copper, indium and selenium
(CIS) PV system were determined and compared with those of a 5 kWp poly-crystalline
silicon (p-Si) PV system operating in Cirata, West Java. By considering the technical
performance indicators, it can be concluded that CIS technology performs better than
p-Si in Indonesia’s tropical climate. This is explained by the final yield (Yf), daily-averaged
performance ratio (PR), a.c. power (Pac), and the degradation rate (Rd). However, there
may be some uncertainty concerning the calculation of the Rd. Moreover, the
performance evolution of fifteen photovoltaic (PV) systems of six different PV module
technologies was evaluated in three different climates. Changes in PV systems’
performance have been determined using the performance ratio (PR) and the
performance loss rate (PLR). PV technologies applied in these evaluated PV plants are
amorphous silicon (a-Si) solar cells (one system), heterojunction with intrinsic thin layer
(HIT) hybrid silicon (one system), copper indium gallium selenide (CIGS, one system),
monocrystalline silicon (mono-Si, three systems), cadmium telluride (CdTe, three
systems), and polycrystalline silicon (p-Si, six systems). The PV systems are located in
four locations with three different climates, namely: (1) Alice Springs, Australia (arid,
desert, hot, climate code BWh), (2) Cirata and (3) Pekanbaru, Indonesia (tropical,
rainforest, climate code Af), and (4) Bolzano, Italy (temperate, dry summer, hot summer,
climate code Cfb). We analyzed monitoring data from the PV systems from 2008 to 2019,
ranging from two to nine years. The general conclusions of this work are: (1) The CIGS
system performed best with an annual-averaged temperature-corrected performance
ratio, PRann, value of 0.88 ± 0.04. The least performing technology was a-Si, with an
average PRann value of 0.78 ± 0.05. The p-Si PV systems in climate Cfb of Italy had a
higher average PRann of 0.84 than those operating in climates BWh of Australia and Af
of Indonesia, with an identical value of 0.81. (2) The p-Si PV systems show the lowest
performance loss rate (PLR) among the technologies with an average PLR value of -
0.6%/year. The strongest performance loss was experienced by a-Si modules at -
1.58%/year.

555225-L-sub01-bw-Kunaifi555225-L-sub01-bw-Kunaifi555225-L-sub01-bw-Kunaifi555225-L-sub01-bw-KunaifiProcessed on: 8-2-2021Processed on: 8-2-2021Processed on: 8-2-2021Processed on: 8-2-2021 PDF page: 12PDF page: 12PDF page: 12PDF page: 12
Summary
xii
Based on the findings above, we can answer the main research question as follows.
A transition towards the widespread use of solar PV systems is feasible for Indonesia.
The very good performance of PV systems in Indonesia with a PR of 78 to 90% is
comparably as high as in other sunny climates. An advantage for Indonesia is that a high
solar irradiance is available the whole year through. Autonomous solar PV systems are
a proven option for the electrification of rural areas and remote islands so that it can be
continued with an improved sustainability aspect. The greatest application for the energy
future of Indonesia is grid-connected PV systems. PV systems would be a sustainable
option along with other renewable power generation technologies, amid fossil fuel
reserves that are facing depletion. However, to achieve this goal, all potential and
current stakeholders should become involved by a correct strategy that is beneficial to
all. The central government holds important roles in initiating and maintaining these
change processes, for example by decentralizing the energy sector to local entities and
creating supporting and consistent policies.
This thesis provides two main scientific contributions. The first contribution is an
introduction to the users’ opinions regarding the reliability of electricity service they
receive from the grid. We believe that this information can help to provide a balance
between what the service provider reports and what the service recipients get. The
second scientific contribution of this thesis considers the performance of grid-connected
PV systems in Indonesia. Before this study started, available literature on the technical
performance of the PV systems in Indonesia was based on only one unique location in
the remote easternmost part of Indonesia. In this thesis, we analyzed PV systems in the
western region of Indonesia to fill the spatial gap of PV system performance studies in
Indonesia. We also presented performance loss rates which we believe has become the
first study that includes PV systems in Indonesia.
In the context of a future outlook for research, we offer the following
recommendations. First, further studies on assessing the experience of the grid users
should involve higher statistics than those presented in this thesis. Second, further
research on the performance of PV systems should also include a higher number of PV
systems in Indonesia from each module technology and region. Third, other types of
research are required to develop more knowledge about PV systems in Indonesia such
as nowcasting and forecasting solar PV performance as well as geographic mapping of
PV systems’ technical and financial potential and PV system performance.
555225-L-sub01-bw-Kunaifi555225-L-sub01-bw-Kunaifi555225-L-sub01-bw-Kunaifi555225-L-sub01-bw-KunaifiProcessed on: 8-2-2021Processed on: 8-2-2021Processed on: 8-2-2021Processed on: 8-2-2021 PDF page: 13PDF page: 13PDF page: 13PDF page: 13
xiii
SSamenvatting
Als de grootste hernieuwbare energiebron is het potentieel voor zonne-energie in
Indonesië enorm. De groei van geïnstalleerde fotovoltaïsche (PV) systemen in Indonesië
blijft echter achter bij het verwachte potentieel van zonne-energie. Bovendien bestaat
er weinig bewijs voor de geschiktheid van PV-systemen in Indonesië door een gebrek
aan onderzoek naar hun energetische prestaties.
In dit proefschrift worden PV-systemen in Indonesië geëvalueerd vanuit een zowel
maatschappelijk als technisch perspectief om daarmee de volgende hoofdvraag te
kunnen beantwoorden: “Wat zijn de ervaringen en attitudes van Indonesische
eindgebruikers ten opzichte van het elektriciteitsnet en zonne-energie, en is een transitie
naar fotovoltaïsche systemen haalbaar is gezien de energetische prestaties van deze
systemen onder de tropische klimaatomstandigheden in Indonesië?” Deze hoofdvraag
kan worden onderverdeeld in vijf deelvragen:
1. Wat zijn de belangrijkste factoren die de energiesituatie in Indonesië beïnvloeden? 2. Wat zijn de uitdagingen om een goede elektrische stroomvoorziening te realiseren
voor de hele bevolking in Indonesië? 3. Wat zijn de ervaringen van eindgebruikers met het elektriciteitsnet in Indonesië? 4. Wat is de houding van de eindgebruikers van het elektriciteitsnet ten opzichte van
fotovoltaïsche systemen? 5. Hoe goed functioneren PV-systemen in Indonesië en hoe presteren ze in vergelijking
met PV-systemen die in andere klimaten zijn geïnstalleerd?
Om deze vragen te kunnen beantwoorden, werd het onderzoek opgedeeld in drie
delen: (I) een evaluatie van de huidige situatie in Indonesië met betrekking tot energie
en stroomvoorziening, (II) een evaluatie van de voorkeuren en attitudes van
eindgebruikers van het elektriciteitsnet, en (III) een evaluatie van de prestaties van PV-
systemen in Indonesië in vergelijking met andere klimaten. De methoden die zijn
toegepast om elk onderdeel te onderzoeken, worden hieronder kort samengevat.
De evaluatie van de huidige situatie met betrekking tot energie en
stroomvoorziening is uitgevoerd door middel van een grondige analyse van beschikbare
literatuur en statistieken op basis van beschikbare gegevens.
De beoordeling van de voorkeuren en attitudes van eindgebruikers van het
elektriciteitsnet is uitgevoerd met behulp van een combinatie van een desk study,
gebruikersonderzoek en metingen van de stroomkwaliteit op de
laagspanningsdistributienetten van het staatsbedrijf PLN.
555225-L-sub01-bw-Kunaifi555225-L-sub01-bw-Kunaifi555225-L-sub01-bw-Kunaifi555225-L-sub01-bw-KunaifiProcessed on: 8-2-2021Processed on: 8-2-2021Processed on: 8-2-2021Processed on: 8-2-2021 PDF page: 14PDF page: 14PDF page: 14PDF page: 14
Samenvatting
xiv
De evaluatie van de prestaties van PV-systemen is uitgevoerd door de zogenaamde
performance ratio (PR) en degradatie te bepalen. De PR werd bepaald met behulp van
IEC-normen. De degradatieberekeningen omvatten twee verschillende methoden: een
jaar-op-jaar benadering van NREL/RdTools en seizoens- en trendontleding door lokaal
gewogen scatterplot-afvlakking toe te passen middels STL-decompositie.
Na de uitvoering van de bovenstaande onderzoeksactiviteiten zijn de volgende
conclusies getrokken die gegroepeerd zijn naar de bijbehorende deelonderzoeksvraag.
Indonesië heeft veel geïsoleerde energiesystemen van verschillende grootte die
over verschillende eilanden zijn verspreid. Op kleine eilanden zijn dieselgeneratoren al
decennia lang een populaire optie voor energievoorziening. De vraag naar energie is
hoog en neemt toe, wat kan worden verklaard door de omvang van de bevolking en de
economische omstandigheden in Indonesië. Om energiezekerheid en duurzaamheid te
waarborgen, heeft Indonesië een nieuwe aanpak nodig bij de ontwikkeling van zijn
elektriciteitssysteem. Gezien de unieke ligging, de beschikbare hernieuwbare
energiebronnen en de hoge CO2-uitstoot, wordt hernieuwbare energie als een haalbare
optie beschouwd in Indonesië.
Indonesië staat voor drie soorten uitdagingen om voor de hele bevolking een goede
stroomvoorziening te verzorgen. De eerste uitdaging is gebaseerd op aanzienlijke
verschillen tussen regio's met betrekking tot toegang tot het elektriciteitsnet, de prijs
van elektriciteit en de betrouwbaarheid van elektriciteitsdiensten van het net. Ten
tweede is het elektriciteitsverbruik per hoofd van de bevolking in Indonesië relatief laag
in vergelijking met veel andere landen. In 2017 bedroeg het elektriciteitsverbruik per
hoofd van de bevolking slechts 1 megawattuur (MWh), wat laag was in vergelijking met
dat in Vietnam met 1,6 MWh/hoofd van de bevolking, Thailand met 2,7 MWh/hoofd van
de bevolking, Singapore met 8,7 MWh/hoofd van de bevolking en Nederland met 6,7
MWh/hoofd van de bevolking. Ten derde lijken de ontwikkeling van
elektriciteitsinfrastructuur en de maatregelen tegen klimaatverandering in Indonesië met
elkaar in strijd te zijn, waar het merendeel van de opwekking afkomstig is van
steenkoolcentrales, terwijl tegelijkertijd de voortgang van de implementatie van
hernieuwbare energiesystemen traag is.
Op basis van onze enquête in 2017 heeft een gemiddelde eindgebruiker van het
elektriciteitsnet vier tot veertien keer meer uitval waargenomen in vergelijking met de
betrouwbaarheidsstatistieken gerapporteerd door PLN. Ook ervoer de eindgebruiker 8
keer tot 12 keer langere uitvalduur in vergelijking met de officiële statistieken. Om de
betrouwbaarheid van de residentiele elektriciteitsvoorziening te verbeteren, bleken de
respondenten bereid om 10% tot 30% extra te betalen op hun maandelijkse
elektriciteitsrekening. Ons onderzoek werd uitgevoerd in Pekanbaru in de provincie
Riau, Kupang in de provincie Oost-Nusa Tenggara (ENT) en Jayapura in de provincie
555225-L-sub01-bw-Kunaifi555225-L-sub01-bw-Kunaifi555225-L-sub01-bw-Kunaifi555225-L-sub01-bw-KunaifiProcessed on: 8-2-2021Processed on: 8-2-2021Processed on: 8-2-2021Processed on: 8-2-2021 PDF page: 15PDF page: 15PDF page: 15PDF page: 15
Samenvatting
xv
Papoea, Indonesië, en geeft als zodanig goed de feitelijke situatie weer in de stedelijke
omgeving op eilanden buiten Java en Bali.
Met behulp van hetzelfde onderzoek als hierboven beschreven, werd vastgesteld
dat een meerderheid van de gebruikers van het elektriciteitsnet kennis had van
hernieuwbare energie en klimaatverandering. Ze waren van mening dat hernieuwbare
energie belangrijk is voor Indonesië en wisten dat elektriciteit die wordt opgewekt door
PV-systemen duurzamer is dan elektriciteit uit het net. De meeste huishoudens gaven
aan graag PV-systemen op de daken van hun huis te hebben.
Uit bovenstaand onderzoek kan worden geconcludeerd dat de betrouwbaarheid
van de elektriciteitsvoorziening vanuit het laagspanningsnet in Indonesië laag is, terwijl
het publiek in Indonesië juist de voorkeur geeft aan duurzame energie, met name zonne-
energie systemen. In plaats van meer fossiele energiecentrales aan het centrale net toe
te voegen, zou het daarom de moeite waard kunnen zijn om PV-systemen in te zetten
voor lokale stroomopwekking gekoppeld aan het laagspanningsnet om lokale
elektriciteitsproblemen op een duurzame manier op te lossen. Een belangrijke vraag
blijft: zijn PV-systemen technisch geschikt voor Indonesië? Deze vraag wordt hieronder
beantwoord.
Ook werden de energetische prestaties en de degradatie van een 1 MWp koper,
indium en selenium (CIS) PV-systeem bepaald en vergeleken met die van een 5 kWp
polykristallijn silicium (p-Si) PV-systeem in Cirata, West-Java. Door verschillende
technische prestatie-indicatoren te evaluerenm, kan worden geconcludeerd dat CIS-
technologie beter presteert dan p-Si PV-systemen in het tropische klimaat van
Indonesië. Dit wordt verklaard door de uiteindelijke opbrengst (Yf), de dagelijkse
gemiddelde performance ratio (PR), AC vermogen (Pac) en de degradatiesnelheid (Rd).
Er kan echter enige onzekerheid bestaan over de berekening van de Rd. Bovendien werd
de prestatie van vijftien fotovoltaïsche (PV) systemen van zes verschillende PV-
moduletechnologieën geëvalueerd in drie verschillende klimaten. Veranderingen in de
prestaties van PV-systemen zijn bepaald met behulp van de performance ratio (PR) en
het prestatieverliespercentage (PLR). PV-technologieën die in deze geëvalueerde PV-
installaties worden toegepast zijn amorf silicium (a-Si, één systeem), heterojunctie
silicium met een intrinsieke dunne laag (HIT, één systeem), koperindium galliumselenide
(CIGS, één systeem), monokristallijn silicium (mono-Si, drie systemen),
cadmiumtelluride (CdTe, drie systemen) en polykristallijn silicium (p-Si, zes systemen).
De PV-systemen bevinden zich op vier locaties met drie verschillende klimaten, namelijk:
(1) Alice Springs, Australië (dor, woestijn, heet, klimaatcode BWh), (2) Cirata, Indonesië
(tropisch, regenwoud, klimaatcode Af) en (3) Pekanbaru, Indonesië (tropisch,
regenwoud, klimaatcode Af), en (4) Bolzano, Italië (gematigde, droge zomer, hete
zomer, klimaatcode Cfb). We analyseerden monitoringgegevens van de PV-systemen
555225-L-sub01-bw-Kunaifi555225-L-sub01-bw-Kunaifi555225-L-sub01-bw-Kunaifi555225-L-sub01-bw-KunaifiProcessed on: 8-2-2021Processed on: 8-2-2021Processed on: 8-2-2021Processed on: 8-2-2021 PDF page: 16PDF page: 16PDF page: 16PDF page: 16
Samenvatting
xvi
van 2008 tot 2019, variërend van twee tot negen jaar. De algemene conclusies van dit
werk zijn: (1) Het CIGS-systeem presteerde het beste met een jaargemiddelde
temperatuur-gecorrigeerde performance ratio, PRann, met een waarde van 0,88 ± 0,04.
De minst presterende technologie was a-Si, met een gemiddelde PRann-waarde van 0,78
± 0,05. De p-Si PV-systemen in klimaat Cfb van Italië hadden een hogere gemiddelde
PRann van 0,84 dan die in klimaten BWh van Australië en Af van Indonesië, met een
identieke waarde van 0,81. (2) De p-Si PV-systemen vertonen het laagste
prestatieverliespercentage (PLR) van de technologieën met een gemiddelde PLR-
waarde van -0,6%/jaar. Het grootste prestatieverlies werd waargenomen bij a-Si-
modules met -1,58%/jaar.
Op basis van bovenstaande bevindingen kunnen we de hoofdonderzoeksvraag als
volgt beantwoorden. Een transitie naar het wijdverbreide gebruik van zon-PV-systemen
is haalbaar voor Indonesië. De zeer goede prestatie van PV-systemen in Indonesië met
een PR van 78 tot 90% is vergelijkbaar hoog als de PR in andere zonnige klimaten. Een
voordeel voor Indonesië is dat er het hele jaar door een hoge zonnestraling beschikbaar
is. Autonome PV-systemen zijn een bewezen optie voor de elektrificatie van landelijke
gebieden en afgelegen eilanden. Echter de grootste toepassing voor de
energietoekomst van Indonesië zijn netgekoppelde PV-systemen. PV-systemen zouden
een duurzame optie zijn, samen met andere energietechnologieën voor het opwekken
van hernieuwbare energie, terwijl de reserves aan fossiele brandstoffen opraken. Om dit
doel te bereiken, moeten alle potentiële en huidige belanghebbenden echter worden
betrokken door een correcte strategie die voor iedereen gunstig is. De rijksoverheid
vervult een belangrijke rol bij het initiëren van deze veranderingsprocessen, bijvoorbeeld
door de energiesector te decentraliseren naar lokale entiteiten en door ondersteunend
en consistent beleid te creëren.
Dit proefschrift levert twee belangrijke wetenschappelijke bijdragen. De eerste
bijdrage bestaat uit nieuwe informatie over gebruikers van het net met betrekking tot de
betrouwbaarheid van de elektriciteitsdiensten die ze van het net ontvangen. Wij zijn van
mening dat deze informatie kan helpen om een evenwicht te vinden tussen wat de
serviceprovider rapporteert en wat de ontvangers van de service in de praktijk krijgen.
De tweede wetenschappelijke bijdrage van dit proefschrift betreft de energetische
prestaties van netgekoppelde PV-systemen in Indonesië. Voordat deze studie startte,
was de beschikbare literatuur over de technische prestaties van netgekoppelde PV-
systemen in Indonesië gebaseerd op slechts één PV-systeem op één unieke locatie in
het meest afgelegen oostelijke deel van Indonesië. In dit proefschrift hebben we PV-
systemen in de westelijke regio van Indonesië geanalyseerd om de bestaande leemte
van systeemprestatiestudies naar PV-systemen in Indonesië te dichten. We
presenteerden ook prestatieverliespercentages waarvan we denken dat dit de eerste
studie is geweest die netgekoppelde PV-systemen in Indonesië omvat.
555225-L-sub01-bw-Kunaifi555225-L-sub01-bw-Kunaifi555225-L-sub01-bw-Kunaifi555225-L-sub01-bw-KunaifiProcessed on: 8-2-2021Processed on: 8-2-2021Processed on: 8-2-2021Processed on: 8-2-2021 PDF page: 17PDF page: 17PDF page: 17PDF page: 17
Samenvatting
xvii
In het kader van toekomstig uit te voeren onderzoek doen we de volgende
aanbevelingen. Ten eerste zouden toekomstige studies over de ervaringen van de
netgebruikers hogere statistieken moeten omvatten dan die gepresenteerd zijn in dit
proefschrift. Ten tweede zou verder onderzoek uitgevoerd kunnen worden naar de
prestaties van PV-systemen in Indonesië waarbij een groter aantal PV-systemen met
elke moduletechnologie die geïnstalleerd zijn in verschillende regios geëvalueerd
zouden worden. Ten derde zijn er andere soorten onderzoek nodig om meer kennis over
PV-systemen in Indonesië te ontwikkelen, zoals onderzoek naar de ontwikkeling van
methoden voor de voorspelling van de presenties van deze systemen, evenals
geografische kaarten voor het technische en financiële potentieel van PV-systemen en
hun energetische presentaties.

555225-L-sub01-bw-Kunaifi555225-L-sub01-bw-Kunaifi555225-L-sub01-bw-Kunaifi555225-L-sub01-bw-KunaifiProcessed on: 8-2-2021Processed on: 8-2-2021Processed on: 8-2-2021Processed on: 8-2-2021 PDF page: 18PDF page: 18PDF page: 18PDF page: 18
xviii
RRingkasan
Sebagai sumber energi terbarukan paling besar di Indonesia, potensi pembangkit
listrik tenaga surya (PLTS) di negara tropis ini sangat besar. Namun, pertumbuhan
kapasitas terpasang sistem PLTS di Indonesia masih tertinggal jauh dibanding potensi
konversi energi surya yang diharapkan. Selain itu, bukti-bukti terkait kesesuaian
penerapan sistem PLTS di Indonesia berdasarkan penelitian tentang kinerjanya, masih
kurang.
Pada disertasi ini, sistem PLTS di Indonesia telah dievaluasi dari sudut pandang
sosial dan teknis dengan tujuan menjawab pertanyaan penelitian utama berikut:
Bagaimana pengalaman dan sikap pengguna listrik di Indonesia terhadap jaringan listrik
serta energi surya, dan apakah transisi menuju sistem PLTS layak dilakukan
mempertimbangkan kinerja sistem PLTS yang beroperasi pada kondisi iklim tropis
Indonesia? Pertanyaan utama ini dibagi menjadi lima sub-pertanyaan:
1. Apa faktor-faktor utama yang mempengaruhi situasi energi di Indonesia?
2. Apa tantangan-tantangan dalam menyediakan tenaga listrik yang layak untuk seluruh
penduduk Indonesia?
3. Apa pengalaman pengguna jaringan listrik di Indonesia?
4. Apa sikap pengguna jaringan listrik terhadap sistem PLTS?
5. Seberapa baik sistem PLTS di Indonesia berfungsi, dan bagaimana kinerjanya
dibandingkan dengan sistem PLTS yang dipasang di iklim lain?
Untuk menjawab pertanyaan-pertanyaan tersebut, rancangan penelitian dibagi
menjadi tiga: (I) mengamati situasi terkini di Indonesia terkait energi dan pasokan listrik,
(II) menganalisis pilihan-pilihan dan sikap para pengguna jaringan listrik, dan (III) menilai
kinerja sistem PLTS di Indonesia dan membandingkannya dengan PLTS di iklim lain.
Metode umum yang diterapkan pada setiap bagian dijelaskan secara singkat di bawah
ini.
Pengamatan situasi terkini di Indonesia terkait energi dan suplai listrik telah
dilakukan melalui analisis mendalam terhadap literatur dan data dari statistik yang
tersedia.
Analisis atas pilihan-pilihan dan sikap pengguna jaringan listrik telah dilakukan
melalui gabungan studi pustaka, survei pengguna jaringan listrik, dan pengukuran
kualitas daya jaringan distribusi tegangan rendah PLN.
Penilaian kinerja sistem PLTS bertujuan menghitung rasio kinerja (PR) dan
degradasi sistem PLTS yang diamati. PR dihitung menggunakan standar IEC.
555225-L-sub01-bw-Kunaifi555225-L-sub01-bw-Kunaifi555225-L-sub01-bw-Kunaifi555225-L-sub01-bw-KunaifiProcessed on: 8-2-2021Processed on: 8-2-2021Processed on: 8-2-2021Processed on: 8-2-2021 PDF page: 19PDF page: 19PDF page: 19PDF page: 19
Ringkasan
xix
Perhitungan degradasi dilakukan dengan dua metode: pendekatan tahun-ke-tahun
(YoY) menggunakan RdTools dari NREL serta dekomposisi musiman dan tren dengan
menerapkan locally weighted scatterplot smoothing dengan STL decomposition
Setelah melakukan kegiatan-kegiatan penelitian di atas, kami mengambil
kesimpulan yang dikelompokkan sesuai dengan sub-pertanyaan penelitian terkait
sebagai berikut.
Indonesia memiliki banyak sistem tenaga listrik dalam ukuran berbeda yang saling
terpisah, dan tersebar di pulau-pulau besar. Di pulau-pulau kecil, generator diesel telah
menjadi pilihan populer selama beberapa dekade. Jumlah penduduk Indonesia yang
besar dan pertumbuhan ekonomi, menyebabkan permintaan energi yang tinggi dan
terus meningkat. Untuk memastikan ketahanan dan keberlanjutan energi di tengah
cadangan bahan bakar fosil yang semakin sedikit, Indonesia membutuhkan pendekatan
baru dalam mengembangkan sistem kelistrikannya. Mengingat geografinya yang unik,
sumber energi terbarukan yang tersedia, dan tingkat emisi CO2 yang tinggi saat ini,
energi terbarukan dianggap sebagai pilihan yang layak untuk Indonesia.
Indonesia menghadapi tiga tantangan dalam menyediakan pasokan tenaga listrik
yang layak untuk seluruh penduduk. Tantangan pertama adalah ketimpangan antar
wilayah terkait akses listrik, penjualan energi listrik, harga energi listrik, dan keandalan
layanan listrik dari jaringan. Kedua, konsumsi listrik per kapita di Indonesia relatif rendah
dibandingkan dengan banyak negara lain. Pada tahun 2017, konsumsi listrik per kapita
hanya 1 megawatt-hour (MWh), lebih rendah dibanding Vietnam sebesar 1,6
MWh/kapita, Thailand 2,7 MWh/kapita, Singapura 8,7 MWh/kapita, dan Belanda 6,7
MWh/kapita, per tahun. Ketiga, pembangunan infrastruktur ketenagalistrikan dan
mitigasi perubahan iklim di Indonesia tampaknya saling bertentangan karena sebagian
besar pembangkit menggunakan batu bara sebagai bahan bakar, sementara penerapan
sistem energi terbarukan berjalan lambat.
Berdasarkan survei yang kami lakukan pada 2017, rata-rata pengguna jaringan
listrik merasakan pemadaman 4 kali lipat hingga 14 kali lipat lebih sering dibandingkan
dengan parameter-parameter keandalan suplai listrik yang dilaporkan oleh PLN. Selain
itu, pengguna akhir merasakan durasi pemadaman 8 kali hingga 12 kali lipat lebih lama
dibandingkan dengan statistik resmi. Untuk meningkatkan keandalan pasokan listrik di
rumah, responden bersedia membayar biaya tambahan 10% hingga 30% pada tagihan
listrik bulanan mereka. Survei dilakukan di Pekanbaru di Provinsi Riau, Kupang di
Provinsi Nusa Tenggara Timur (NTT), dan Jayapura di Provinsi Papua, Indonesia.
Dengan demikian lokasi survei mewakili situasi aktual lingkungan perkotaan di luar pulau
Jawa dan Bali.
555225-L-sub01-bw-Kunaifi555225-L-sub01-bw-Kunaifi555225-L-sub01-bw-Kunaifi555225-L-sub01-bw-KunaifiProcessed on: 8-2-2021Processed on: 8-2-2021Processed on: 8-2-2021Processed on: 8-2-2021 PDF page: 20PDF page: 20PDF page: 20PDF page: 20
Ringkasan
xx
Menggunakan survei yang sama dengan yang dijelaskan di atas, ditemukan bahwa
sebagian besar pengguna jaringan listrik memiliki pengetahuan dasar tentang energi
terbarukan dan perubahan iklim. Mereka percaya bahwa energi terbarukan penting bagi
Indonesia dan mengetahui bahwa listrik yang dihasilkan oleh sistem PLTS lebih
berkelanjutan dibandingkan listrik yang berasal dari jaringan. Sebagian besar rumah
tangga menyatakan bahwa mereka akan suka jika sebuah sistem PLTS dipasang di atap
rumah mereka.
Dari studi di atas dapat disimpulkan bahwa keandalan pasokan listrik pada jaringan
distribusi di Indonesia tergolong rendah, sedangkan masyarakat Indonesia menyukai
energi terbarukan, khususnya sistem PLTS. Oleh karena itu, daripada menambahkan
lebih banyak pembangkit listrik berbahan bakar fosil ke jaringan listrik utama, lebih baik
mempertimbangkan penggunaan sistem PLTS untuk pembangkit listrik lokal disambung
dengan jaringan tegangan rendah dengan maksud menyelesaikan masalah pasokan
listrik secara lokal dan berkelanjutan. Namun satu pertanyaan penting tersisa, apakah
sistem PLTS secara teknis cocok diterapkan di Indonesia? Pertanyaan tersebut akan
dijawab di bawah ini.
Kinerja dan laju degradasi sistem PLTS dari jenis copper, indium and selenium (CIS)
1 MWp telah dihitung dan dibandingkan dengan sistem PLTS 5 kWp dari jenis poly-
crystalline (p-Si) yang beroperasi di Cirata, Jawa Barat. Dengan mempertimbangkan
indikator kinerja teknis, dapat disimpulkan bahwa teknologi CIS bekerja lebih baik
daripada teknologi p-Si di iklim tropis Indonesia. Hal ini dijelaskan dengan hasil energi
akhir (Yf), rasio kinerja (performance ratio/PR) rata-rata harian, daya a.c. (Pac), dan laju
degradasi (degradation rate/Rd). Namun, mungkin terdapat beberapa ketidakpastian
terkait penghitungan Rd. Selain itu, evolusi kinerja lima belas sistem PLTS dari enam
teknologi modul PLTS telah dievaluasi di tiga iklim yang berbeda. Perubahan kinerja
sistem PLTS ditentukan dengan menggunakan PR dan tingkat kerugian kinerja
(performance loss rate/PLR). Teknologi PLTS yang dievaluasi ini adalah dari sel surya
amorphous silicon (a-Si) (satu sistem), heterojunction with intrinsic thin layer (HIT)
hybrid silicon (satu sistem), copper indium gallium selenide (CIGS, satu sistem),
monocrystalline silicon (mono-Si, tiga sistem), cadmium telluride (CdTe, tiga sistem),
dan polycrystalline silicon (p-Si, enam sistem). Sistem PLTS yang diamati terletak di
empat lokasi dengan tiga iklim berbeda, yaitu: (1) Alice Springs, Australia (gersang,
gurun, panas, kode iklim BWh), (2) Cirata dan (3) Pekanbaru, Indonesia (tropis, hutan
hujan, kode iklim Af), dan (4) Bolzano, Italia (sedang, musim panas yang kering dan
panas, kode iklim Cfb). Kami menganalisis data pemantauan langsung dari sistem PLTS
sejak 2008 hingga 2019, berkisar dua hingga sembilan tahun, tergantung data yang
tersedia. Kesimpulan umum dari pekerjaan ini adalah: (1) Sistem CIGS menunjukkan
kinerja terbaik dengan PR terkoreksi suhu rata-rata tahunan, PRann, bernilai 0,88 ± 0,04.
Teknologi yang berkinerja paling rendah adalah a-Si, dengan nilai PRann rata-rata 0,78 ±

555225-L-sub01-bw-Kunaifi555225-L-sub01-bw-Kunaifi555225-L-sub01-bw-Kunaifi555225-L-sub01-bw-KunaifiProcessed on: 8-2-2021Processed on: 8-2-2021Processed on: 8-2-2021Processed on: 8-2-2021 PDF page: 21PDF page: 21PDF page: 21PDF page: 21
Ringkasan
xxi
0,05. Sistem p-Si di iklim Cfb Italia memiliki PRann rata-rata lebih tinggi dengan nilai 0,84
dibangding sistem yang beroperasi di iklim BWh Australia dan Af di Indonesia yang
memiliki nilai sama 0,81. (2) Sistem p-Si menunjukkan PLR terendah dengan nilai PLR
rata-rata -0,6%/tahun. PLR dialami oleh sistem a-Si sebesar -1,58%/tahun.
Berdasarkan temuan di atas, kami menjawab pertanyaan utama penelitian sebagai
berikut. Transisi menuju penggunaan sistem PLTS surya secara luas adalah layak
dilakukan oleh Indonesia. Kinerja sistem PLTS di Indonesia sangat baik dengan PR 78%
hingga 90%, setara dengan nilai PR di iklim cerah lainnya. Keunggulan khusus Indonesia
adalah bahwa radiasi matahari yang tinggi tersedia sepanjang tahun. Sistem PLTS
otonom adalah pilihan yang telah terbukti efektif untuk elektrifikasi daerah pedesaan dan
pulau-pulau terpencil, sehingga dapat dilanjutkan dengan syarat aspek
keberlanjutannya ditingkatkan. Aplikasi terbesar sistem PLTS untuk masa depan di
Indonesia adalah sistem PLTS yang terhubung jaringan listrik. Di tengah cadangan
bahan bakar fosil yang semakin sedikit, sistem PLTS akan menjadi pilihan berkelanjutan
bersama dengan teknologi pembangkit listrik terbarukan lainnya. Namun, untuk
mencapai tujuan ini, semua pemangku kepentingan harus dilibatkan melalui strategi
tepat yang bermanfaat bagi semua. Pemerintah pusat memegang peran penting dalam
memulai dan menjaga proses perubahan ini, misalnya dengan melakukan desentralisasi
sektor energi kepada entitas lokal dan membuat kebijakan yang mendukung PLTS dan
konsisten.
Disertasi ini memberikan dua kontribusi ilmiah utama. Kontribusi pertama adalah
memperkenalkan pendapat pengguna jaringan tentang keandalan layanan listrik yang
mereka terima dari jaringan. Kami percaya bahwa informasi ini dapat membantu
memberikan keseimbangan antara apa yang dilaporkan oleh penyedia layanan dan apa
yang diterima oleh konsumen. Kontribusi ilmiah kedua dari disertasi ini adalah terkait
kinerja sistem PLTS yang tersambung jaringan listrik di Indonesia. Sebelum penelitian
ini dimulai, literatur yang tersedia tentang kinerja teknis sistem PLTS di Indonesia hanya
didasarkan pada satu lokasi di bagian paling timur Indonesia. Dalam tesis ini, kami
menganalisis sistem PLTS di wilayah barat Indonesia untuk mengisi kesenjangan spasial
terkait studi kinerja sistem PLTS di Indonesia. Pada penelitian ini, kami juga menghitung
tingkat kerugian kinerja (PLR) yang kami yakini merupakan studi pertama di Indonesia.
Dalam konteks pandangan masa depan penelitian, kami menawarkan rekomendasi
berikut. Pertama, studi lebih lanjut tentang penilaian pengalaman pengguna jaringan
harus melibatkan respinden yang lebih banyak dibanding jumlah responden yang
berpartisipasi pada penelitian ini. Kedua, penelitian lebih lanjut tentang kinerja sistem
PLTS juga harus melibatkan lebih banyak sistem PLTS di Indonesia dari setiap teknologi
modul PLTS dan setiap wilayah. Ketiga, perlu dilakukan penelitian lain untuk
mengembangkan pengetahuan tentang sistem PLTS di Indonesia seperti nowcasting
555225-L-sub01-bw-Kunaifi555225-L-sub01-bw-Kunaifi555225-L-sub01-bw-Kunaifi555225-L-sub01-bw-KunaifiProcessed on: 8-2-2021Processed on: 8-2-2021Processed on: 8-2-2021Processed on: 8-2-2021 PDF page: 22PDF page: 22PDF page: 22PDF page: 22
Ringkasan
xxii
dan peramalan kinerja PLTS serta pemetaan geografis potensi teknis dan finansial
sistem PLTS dan kinerja sistem PLTS.
555225-L-sub01-bw-Kunaifi555225-L-sub01-bw-Kunaifi555225-L-sub01-bw-Kunaifi555225-L-sub01-bw-KunaifiProcessed on: 8-2-2021Processed on: 8-2-2021Processed on: 8-2-2021Processed on: 8-2-2021 PDF page: 23PDF page: 23PDF page: 23PDF page: 23
xxiii
TTable of Contents
Summary .......................................................................................................... ix
Samenvatting ................................................................................................... xiii
Ringkasan ..................................................................................................... xviii
Table of Contents ........................................................................................... xxiii
List of Figures ................................................................................................ xxvi
List of Tables ................................................................................................ xxviii
List of Abbreviations and Acronyms .................................................................. xxix
List of Variables and Units .............................................................................. xxxiii
Chapter 1. Introduction ....................................................................................... 3
1.1. Background ............................................................................................... 3
1.2. Research Design and Methods ................................................................. 11
1.3. Outline of the Thesis ................................................................................ 14
Chapter 2. Energy in Indonesia: The Main Factors ................................................ 21
2.1. Introduction ............................................................................................. 21
2.2. An Archipelago with a Unique Power Supply System .................................. 21
2.3. A Growing Economy that Brings Optimism ................................................. 25
2.4. Big Population with a Significant Demand for Energy .................................. 27
2.5. A Challenging Climate with Excellent Solar Energy Potential ....................... 28
2.6. Stakeholders’ Interest in Regulations ......................................................... 34
2.7. Conclusions ............................................................................................ 38
Chapter 3. Challenges of Electricity Supply.......................................................... 43
3.1. Introduction ............................................................................................. 43
3.2. Status of Energy Supply and Fossil Fuel Resources .................................... 43
3.3. Challenges in Electricity Supply ................................................................ 44
3.3.1. Regional Differences ...................................................................... 46
3.3.2. Low Electricity Consumption ........................................................... 47
3.3.3. The Price Disparity Between Urban and Rural Areas ......................... 48
3.3.4. Imbalance in Power Sale ................................................................ 48
3.3.5. Variations in Reliability .................................................................... 49
3.3.6. Power Infrastructure Development .................................................. 49
3.3.7. Electrification Versus Climate Change Mitigation .............................. 50
3.4. Indonesia’s Electric Power System ............................................................ 50
3.4.1. PLN’s State Monopoly .................................................................... 50
3.4.2. Electric Power Infrastructure ........................................................... 51
3.4.3. Electricity Business Models ............................................................. 52
3.4.4. Customer Groups .......................................................................... 53

555225-L-sub01-bw-Kunaifi555225-L-sub01-bw-Kunaifi555225-L-sub01-bw-Kunaifi555225-L-sub01-bw-KunaifiProcessed on: 8-2-2021Processed on: 8-2-2021Processed on: 8-2-2021Processed on: 8-2-2021 PDF page: 24PDF page: 24PDF page: 24PDF page: 24
Table of Contents
xxiv
3.5. Renewable Energy ................................................................................... 53
3.5.1. The Low Share of Renewable Energy ............................................... 53
3.5.2. Challenges to PV Systems .............................................................. 55
3.5.3. Role of PV Systems ........................................................................ 57
3.5.4. Regulations that Support Renewable Energy .................................... 57
3.6. Conclusions ............................................................................................ 58
CChapter 4. Reliability of the Electricity Supply ...................................................... 61
4.1. Introduction ............................................................................................. 61
4.2. Literature Review ..................................................................................... 62
4.2.1. Energy Demand and Electricity Supply in Indonesia .......................... 62
4.2.2. Reliability of Electric Power ............................................................. 63
4.2.3. User Perception to Evaluate the Reliability of Electricity Supply ......... 66
4.3. Research Questions and Methods ............................................................. 67
4.3.1. Research Questions ....................................................................... 67
4.3.2. Methods ........................................................................................ 68
4.3.2.1. Desk Study ............................................................................ 68
4.3.2.2. Experimental Set up of Field Research ..................................... 68
4.4. Results .................................................................................................... 72
4.4.1. SAIDI and SAIFI ............................................................................. 72
4.4.2. Household Experiences .................................................................. 75
4.4.2.1. The Perceived Importance of Reliable Electricity Supply and Stable Voltage .............................................................................................. 76
4.4.2.2. Blackout Events ..................................................................... 79
4.4.2.3. P-SAIFI and P-SAIDI ............................................................... 81
4.4.3. Results from Measurements at the Distribution Grid ........................... 82
4.5. Discussion and Conclusions ..................................................................... 87
4.5.1. Desk Study, User Study, and Grid Measurements............................. 87
4.5.2. Methods ........................................................................................ 90
4.5.3. Limitations of the Study .................................................................. 91
Chapter 5. The Attitudes of End-Users of the Electricity Grid ................................. 95
5.1. Preface ................................................................................................... 95
5.2. The survey .............................................................................................. 95
5.3. Awareness of End-users about Renewable Energy and Climate Change ....... 96
5.4. Attitudes of the End-users of the Electricity Grid towards PV Systems .......... 96
5.5. Conclusions .......................................................................................... 101
Chapter 6. Performance of PV Systems in Indonesia ........................................... 105
6.1. Introduction ........................................................................................... 105
6.2. The PV Systems and Datasets ................................................................ 107
6.2.1. 1 MWp Thin-Film CIS PV System ................................................... 107
6.2.2. 5 kWp Crystalline PV System ........................................................ 108
6.3. Methods ................................................................................................ 109
6.3.1. Performance Calculations ............................................................. 109
6.3.2. Degradation Calculations.............................................................. 111

555225-L-sub01-bw-Kunaifi555225-L-sub01-bw-Kunaifi555225-L-sub01-bw-Kunaifi555225-L-sub01-bw-KunaifiProcessed on: 8-2-2021Processed on: 8-2-2021Processed on: 8-2-2021Processed on: 8-2-2021 PDF page: 25PDF page: 25PDF page: 25PDF page: 25
Table of Contents
xxv
6.4. Results .................................................................................................. 112
6.4.1. System Performances .................................................................. 112
6.4.2. Degradation Rates ....................................................................... 114
6.5. Conclusion ............................................................................................ 116
CChapter 7. Performance and Degradation of PV Systems in Three Climates ........... 119
7.1. Introduction ........................................................................................... 119
7.2. Experimental Set-Up .............................................................................. 124
7.3. Methods ................................................................................................ 130
7.3.1. Data Preparation.......................................................................... 130
7.3.2. Calculation of the Performance Ratio ............................................. 131
7.3.3. Calculation of the Performance Loss Rate Using Linear Regression and STL ...................................................................................................... 131
7.3.4. Calculation of the Performance Loss Rate Using the YoY Approach . 132
7.4. Results and Discussion .......................................................................... 133
7.4.1. Performance Ratio ....................................................................... 133
7.4.2. Performance Loss Rate Calculation Using LR and STL .................... 136
7.4.3. Comparison of PLR Values Using STL and YoY .............................. 138
7.5. Conclusions .......................................................................................... 140
Chapter 8. Conclusions, Discussion, and Recommendations ............................... 145
8.1. Conclusions .......................................................................................... 145
8.2. Discussion ............................................................................................ 152
8.2.1. Scientific Contribution .................................................................. 152
8.2.2. Practical Contribution ................................................................... 153
8.2.3. Limitations ................................................................................... 153
8.3. Recommendations ................................................................................. 156
Acknowledgements ........................................................................................ 159
References .................................................................................................... 165
Appendices ................................................................................................... 183
Appendix 4.A ................................................................................................ 183
Appendix 4.B ................................................................................................ 184
Appendix 4.C ................................................................................................ 186
Appendix 7.A ................................................................................................ 188
About the Author ............................................................................................ 189
Publications ................................................................................................... 190

555225-L-sub01-bw-Kunaifi555225-L-sub01-bw-Kunaifi555225-L-sub01-bw-Kunaifi555225-L-sub01-bw-KunaifiProcessed on: 8-2-2021Processed on: 8-2-2021Processed on: 8-2-2021Processed on: 8-2-2021 PDF page: 26PDF page: 26PDF page: 26PDF page: 26
xxvi
LList of Figures
Figure 1.1 Map of Indonesia .................................................................................................. 3
Figure 1.2 Residents of a village on the island of Kalimantan work together carrying electric poles as part of a village electrification project ...................................................... 4
Figure 1.3 The primary energy supply mix in Indonesia in 2025 and the energy transformation plan to meet its CO2 emission reduction targets by 2050 ..................................... 6
Figure 1.4 A global map of solar irradiation showing that Indonesia receives plenty of solar energy on a yearly basis ....................................................................................... 7
Figure 1.5 Typical PV system installations ............................................................................. 8
Figure 1.6 Visualization of the elements and methods forming the multidisciplinary perspective for assessing the feasibility of the transition towards solar PV power generation in Indonesia. ........................................................................................................... 12
Figure 1.7 Outline of the chapters and sub-research questions aiming at answering the main research question. .............................................................................................. 15
Figure 2.1 The position of Indonesia in the world map ......................................................... 22
Figure 2.2 Correlation of per capita energy consumption and per capita GDP, PPP (current international $) .................................................................................................... 26
Figure 2.3 Environmental Kuznets Curve (EKC) .................................................................. 27
Figure 2.4 Map of the total population by province .............................................................. 29
Figure 2.5 World map of Köppen-Geiger climate classification system................................ 32
Figure 2.6 The most recent condition of Indonesia's climate available on Google Earth for 2017 ................................................................................................................... 33
Figure 2.7 Photovoltaic power potential in Indonesia ........................................................... 36
Figure 2.8 Map of energy stakeholders in Indonesia based on the example of PESTLE stakeholders map in renewable energy in Indonesia and the example of task distribution among the government institutions in the energy sector according to RUEN .................................................................................................................. 37
Figure 3.1 Map of Indonesia showing ERs for 34 provinces in 2019.................................... 45
Figure 3.2 Electricity consumption per capita in South-East Asia ........................................ 47
Figure 3.3 Comparison between the increase in the average electricity consumption and an increase in GDP in 2015 .................................................................... 48
Figure 3.4 Sales of PLN electrical energy to customer groups in Java and outside Java in GWh in 2019................................................................................................................ 49
Figure 3.5 Illustration of the electric power system .............................................................. 51
Figure 3.6 Models in power sector business ........................................................................ 53
Figure 3.7 The historical renewable energy growth in Indonesia compared to the 2025 renewable energy targets ................................................................................... 54
Figure 3.8 PV system installed capacity in Indonesia, 2005–2018 (in kWp) ........................ 55
Figure 3.9 Cost of a PV system installation (in kWp) in Indonesia, 2013–2018 ................... 57
555225-L-sub01-bw-Kunaifi555225-L-sub01-bw-Kunaifi555225-L-sub01-bw-Kunaifi555225-L-sub01-bw-KunaifiProcessed on: 8-2-2021Processed on: 8-2-2021Processed on: 8-2-2021Processed on: 8-2-2021 PDF page: 27PDF page: 27PDF page: 27PDF page: 27
List of Figures
xxvii
Figure 4.1 Map of Indonesia showing ERs for 34 provinces in 2015.................................... 65
Figure 4.2 Hioki 3169-21 Clamp-On Power HiTester measuring power quality (PQ). ......... 72
Figure 4.3 SAIDI in hours of outage per customer per year and SAIFI in a number of outage events per customer per year for various locations in Indonesia for 2010 to 2015 ................ 74
Figure 4.4 The distribution of respondents by city address in the study locations. .............. 76
Figure 4.5 The proportion of respondents’ answers to survey questions in percentages .... 78
Figure 4.6 The proportion of respondents’ answers to the following questions: (a) On average, how often do you experience blackouts in a month? (b) On average, how long is the duration of the blackouts that you experience? (c) At what time of day would a blackout event incur the most losses for you? (d) On average, how long is the duration of a blackout that would incur any losses for you? ................................ 80
Figure 4.7 SAIDI vs. P-SAIDI and SAIFI vs. P-SAIFI for the three locations.......................... 81
Figure 4.8 The voltage level on the grid during the measurement period ............................ 84
Figure 4.9 Blackout events during the measurement period ............................................... 86
Figure 4.10 Correlations between SAIDI and SAIFI, the electrification ratio, and SAIFI and electrification ratio. .............................................................................................. 88
Figure 4.11 Correlations between P-SAIDI and P-SAIFI, the income of households, and WTP .... 90
Figure 5.1 Respondents’ answers to survey questions in percentages: (a) Have you heard of “renewable energy”? (b) Is renewable energy important for Indonesia? (c) Have you heard of “climate change”? (d) Are you worried about climate change? ..... 97
Figure 5.2 Respondents’ answers to survey questions in percentages: (a) Have you heard of “PV systems”? (b) Which one of the following two electricity sources do you believe is cheaper? (c) Which one of the following two electricity sources do you believe is better for the environment? (d) Which one of the following two electricity sources do you believe is more stable? ............................................................................ 99
Figure 5.3 Respondents’ answers to survey questions in percentages: (a) Which one of the following two electricity sources would you choose to provide power supply to your home? (b) Would you like to have a PV system installed on your house's rooftop? . 100
Figure 6.1 Aerial view of the 1 MWp PV plant in Cirata, West Java, Indonesia .................. 106
Figure 6.2 Meteorological variables in Cirata ..................................................................... 113
Figure 6.3 Performance ratios of the PV systems in Cirata ................................................ 114
Figure 6.4 The annual degradation rate of the PV systems in Cirata ................................. 116
Figure 7.1 The geographical distribution of the photovoltaic (PV) systems, climate locations, and annual global irradiation on a horizontal surface (kWh/m2/year) ................ 125
Figure 7.2 Thirty climatic subclasses according to Köppen–Geiger .................................. 128
Figure 7.3 The period of data availability for each PV system ............................................ 129
Figure 7.4 Examples of the degradation rate of a copper indium gallium selenide (CIGS) PV system from Site 27 in Alice Springs. ................................................................ 133
Figure 7.5 Daily performance ratio of a p-Si system in Cirata in 2017. .............................. 134
Figure 7.6 Box plots of the performance ratio of each PV system ..................................... 135
Figure 7.7 Performance ratio by technology. ..................................................................... 136
Figure 7.8 Annual-averaged monthly temperature-corrected performance ratios, PRann., of the PV systems, their linear fit, and trend components over the monitoring period .... 137
Figure 7.9 Performance loss rate of the PV systems using STL ......................................... 138
Figure 7.10 Performance loss rate of the PV systems using YoY......................................... 139

555225-L-sub01-bw-Kunaifi555225-L-sub01-bw-Kunaifi555225-L-sub01-bw-Kunaifi555225-L-sub01-bw-KunaifiProcessed on: 8-2-2021Processed on: 8-2-2021Processed on: 8-2-2021Processed on: 8-2-2021 PDF page: 28PDF page: 28PDF page: 28PDF page: 28
xxviii
LList of Tables
Table 3.1 Indonesia’s fossil fuel reserves and scenarios for the time remaining for mining. .. 44
Table 4.1. Study locations and reasons for selection. .............................................. 68
Table 4.2. SAIDI and SAIFI in Riau, ENT and Papua, 2010–2015. ............................ 73
Table 4.3. Perceived and reported SAIDI and SAIFI. ............................................... 82
Table 6.1. Specifications of the PV modules in Cirata. ........................................... 108
Table 6.2. Performance indicators of PV systems in Cirata. ................................... 114
Table 7.1. General information about the photovoltaic (PV) systems studied........... 120
Table 7.2. Performance ratio of p-Si systems and their standard deviation by climate. ...................................................................................................................... 136
555225-L-sub01-bw-Kunaifi555225-L-sub01-bw-Kunaifi555225-L-sub01-bw-Kunaifi555225-L-sub01-bw-KunaifiProcessed on: 8-2-2021Processed on: 8-2-2021Processed on: 8-2-2021Processed on: 8-2-2021 PDF page: 29PDF page: 29PDF page: 29PDF page: 29
xxix
LList of Abbreviations and Acronyms
Abbreviations Meaning
a.c. Alternating current
Af Tropical, rainforest climate class
AFOLU Agriculture, forestry, and other land use
ASEAN Association of South-East Asian Nations
a-Si Amorphous silicon
BMKG Indonesia’s Bureau of meteorology, climatology, and geophysics
BOOT Build-Own-Operate-Transfer
BOS Balance of system
BWh Arid, desert, hot climate class
CdTe Cadmium Telluride
Cfb Temperate, no dry season, warm summer climate class
Cfc Oceanic sub-arctic climate class
CIGS Copper Indium Gallium Selenide
CIS Copper Indium Selenide
CO2 Carbon dioxide
d.c. Direct current
DEN National Energy Council of Indonesia
DF Diffuse fraction of horizontal irradiance
DG Distributed Generation
DN Distribution Network
DPR The House of Representatives of the Republic of Indonesia
EESL Energy-efficient solar lamp
EKC Environmental Kuznets Curve
EL Electrification level
ENT East Nusa Tenggara
ESI Energy supply index
EU European Union
GaAs Gallium arsenide
555225-L-sub01-bw-Kunaifi555225-L-sub01-bw-Kunaifi555225-L-sub01-bw-Kunaifi555225-L-sub01-bw-KunaifiProcessed on: 8-2-2021Processed on: 8-2-2021Processed on: 8-2-2021Processed on: 8-2-2021 PDF page: 30PDF page: 30PDF page: 30PDF page: 30
List of Abbreviations and Acronyms
xxx
AAbbreviations MMeaning
GDP Gross domestic product
GHG Greenhouse gasses
GW Gigawatt
GWp Gigawatt-peak
HIT-HySi Heterojunction with intrinsic thin layer hybrid silicon
ICT Information and communication technology
IDR Indonesia’s Rupiah
IEA International Energy Agency
IEC International Electrotechnical Commission
IESR Institute for Essential Services Reform
IIEE Indonesian Institute for Energy Economics
Inpres Presidential instructions
IPP Independent power producers
IPPU Industrial processes and product use
IRENA International Renewable Energy Agency
KEN National Energy Policy
Kepbup Decree of Regents
Kepgub Decree of Governor
Kepmen Decree of Minister
Kepres Decree of Presidential
Kepwako Decrees of mayors
kg Kilogram
kW Kilowatt
kWh Kilowatt-hour
kWp Kilowatt-peak
LR Linear regression
MEMR Ministry of Energy and Mineral Resources
MFD Mean of the frequency distribution
mono-Si Monocrystalline silicon
Mt Megatonnes
Mtoe Million tonnes of oil equivalent
MVA Megavolt-ampere
MW Megawatt
MWp Megawatt-peak
NRE New and renewable energy

555225-L-sub01-bw-Kunaifi555225-L-sub01-bw-Kunaifi555225-L-sub01-bw-Kunaifi555225-L-sub01-bw-KunaifiProcessed on: 8-2-2021Processed on: 8-2-2021Processed on: 8-2-2021Processed on: 8-2-2021 PDF page: 31PDF page: 31PDF page: 31PDF page: 31
List of Abbreviations and Acronyms
xxxi
AAbbreviations MMeaning
NREL National Renewable Energy Laboratory
Perbup Regulations of regents
Perda Regional regulations
Pergub Governor regulations
Permen Ministerial regulations
Perpres Presidential regulations
Perwako Regulations of mayors
PESTLE Political, economic, social, technological, legal, and environmental
PJB PT. Pembangkitan Jawa-Bali
PLN Pembangkit Listrik Negara, Indonesia’s state utility company
PP Government regulations
PPLSA Association of Rooftop PV System Users
PPP Purchasing power parity
PQ Power quality
P-SAIDI Perceived SAIDI
P-SAIFI Perceived SAIFI
p-Si Poly-crystalline silicon
PV Photovoltaic
PVPMC Sandia’s PV Performance Modelling Collaborative
PWP Papua and West Papua region
R/P Reserve/Production
RUEDP Regional-Provincial General Energy Plan
RUEN General Plan for National Energy
RUPTL General Plan of Electricity Supply
SAIDI System Average Interruption Duration Index
SAIFI System Average Interruption Frequency Index
SHS Solar home system
SLS Solar lamp system
STC Standard test conditions
std Standard deviation
STL Seasonal-Trend decomposition using LOESS
TSCF Trillion cubic feet
TWh Terawatt-hour
U.S. United States
US$ U.S. Dollar

555225-L-sub01-bw-Kunaifi555225-L-sub01-bw-Kunaifi555225-L-sub01-bw-Kunaifi555225-L-sub01-bw-KunaifiProcessed on: 8-2-2021Processed on: 8-2-2021Processed on: 8-2-2021Processed on: 8-2-2021 PDF page: 32PDF page: 32PDF page: 32PDF page: 32
List of Abbreviations and Acronyms
xxxii
AAbbreviations MMeaning
UU Indonesia’s law
W Watt
WNT West Nusa Tenggara
WTP Willingness to pay
555225-L-sub01-bw-Kunaifi555225-L-sub01-bw-Kunaifi555225-L-sub01-bw-Kunaifi555225-L-sub01-bw-KunaifiProcessed on: 8-2-2021Processed on: 8-2-2021Processed on: 8-2-2021Processed on: 8-2-2021 PDF page: 33PDF page: 33PDF page: 33PDF page: 33
xxxiii
LList of Variables and Units
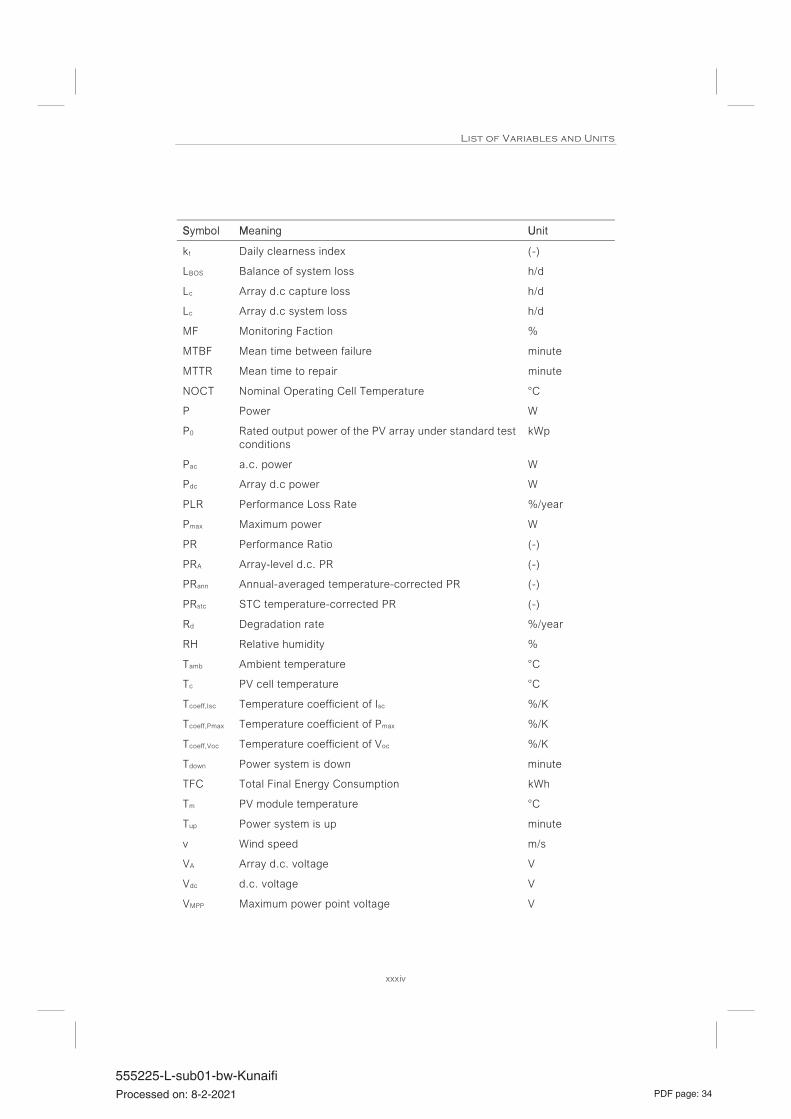
Symbol Meaning Unit
Aa Total active area of PV arrays m2
CF Capacity Factor %
DHI Diffuse Horizontal Irradiance W/m2
DNI Direct Normal Irradiance W/m2
Eac a.c. energy output Wh
Edc d.c. energy produced by the array Wh
Eg Ground-reflected irradiance on a horizontal surface W/m2
Eout Cumulative energy production kWh
EPC Energy Production Cost US$/kWh
ER Electrification Rate %
Gb Beam or direct normal irradiance on a horizontal surface W/m2
GbPOA In-plane beam irradiance W/m2
Gd Diffuse irradiance on a horizontal surface W/m2
GdPOA In-plane diffuse irradiance W/m2
GHI Global Horizontal Irradiance W/m2
GPOA In-plane global irradiance W/m2
Gr Ground-reflected irradiance on a horizontal surface W/m2
Gref Reference irradiance 1,000 W/m2
GrPOA In-plane ground-reflected irradiance W/m2
Hh Global irradiation on a horizontal surface Wh/m2
Hi Global irradiation on the plane of array Wh/m2
Iac a.c. current A
Ib Beam irradiance on the plane of array W/m2
Id Diffuse irradiance on the plane of array W/m2
Idc Array d.c current A
IMPP Maximum Power Point Current A
Ir Ground-reflected irradiance on the plane of array W/m2
ISC Short-circuit current A
kms Kilometer-lines km
555225-L-sub01-bw-Kunaifi555225-L-sub01-bw-Kunaifi555225-L-sub01-bw-Kunaifi555225-L-sub01-bw-KunaifiProcessed on: 8-2-2021Processed on: 8-2-2021Processed on: 8-2-2021Processed on: 8-2-2021 PDF page: 34PDF page: 34PDF page: 34PDF page: 34
List of Variables and Units
xxxiv
SSymbol MMeaning UUnit
kt Daily clearness index (-)
LBOS Balance of system loss h/d
Lc Array d.c capture loss h/d
Lc Array d.c system loss h/d
MF Monitoring Faction %
MTBF Mean time between failure minute
MTTR Mean time to repair minute
NOCT Nominal Operating Cell Temperature °C
P Power W
P0 Rated output power of the PV array under standard test conditions
kWp
Pac a.c. power W
Pdc Array d.c power W
PLR Performance Loss Rate %/year
Pmax Maximum power W
PR Performance Ratio (-)
PRA Array-level d.c. PR (-)
PRann Annual-averaged temperature-corrected PR (-)
PRstc STC temperature-corrected PR (-)
Rd Degradation rate %/year
RH Relative humidity %
Tamb Ambient temperature °C
Tc PV cell temperature °C
Tcoeff,Isc Temperature coefficient of Isc %/K
Tcoeff,Pmax Temperature coefficient of Pmax %/K
Tcoeff,Voc Temperature coefficient of Voc %/K
Tdown Power system is down minute
TFC Total Final Energy Consumption kWh
Tm PV module temperature °C
Tup Power system is up minute
v Wind speed m/s
VA Array d.c. voltage V
Vdc d.c. voltage V
VMPP Maximum power point voltage V
555225-L-sub01-bw-Kunaifi555225-L-sub01-bw-Kunaifi555225-L-sub01-bw-Kunaifi555225-L-sub01-bw-KunaifiProcessed on: 8-2-2021Processed on: 8-2-2021Processed on: 8-2-2021Processed on: 8-2-2021 PDF page: 35PDF page: 35PDF page: 35PDF page: 35
List of Variables and Units
xxxv
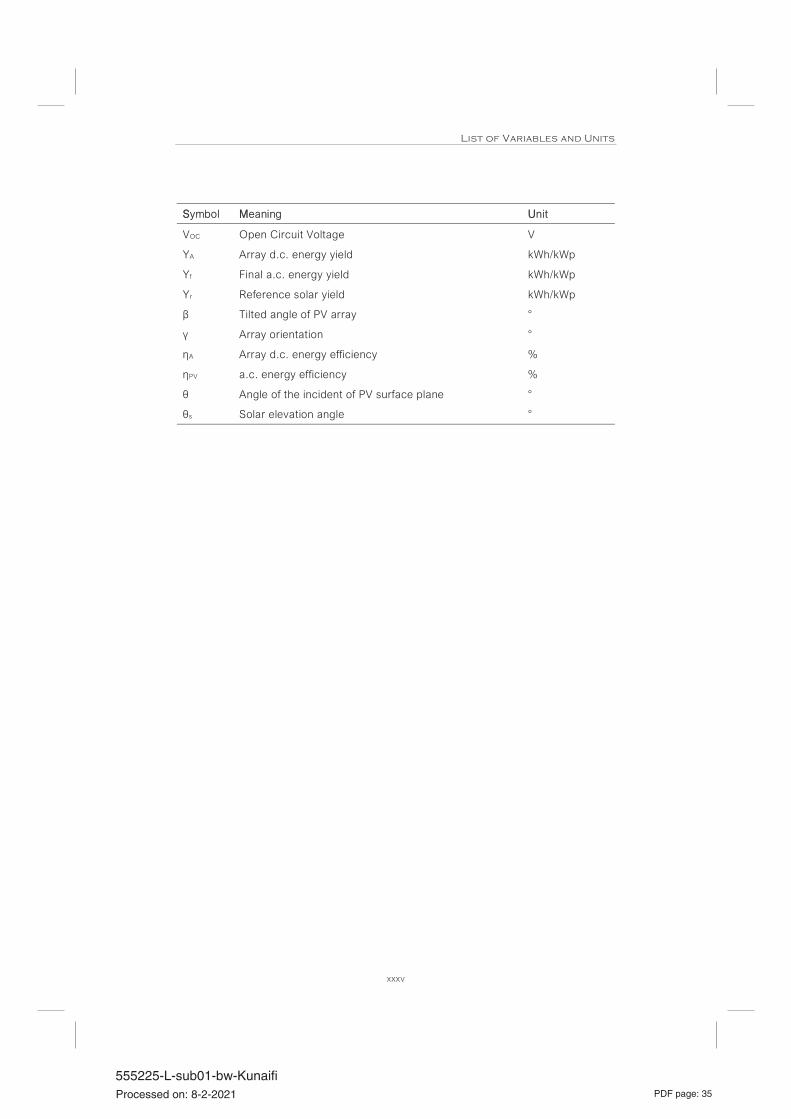
SSymbol MMeaning UUnit
VOC Open Circuit Voltage V
YA Array d.c. energy yield kWh/kWp
Yf Final a.c. energy yield kWh/kWp
Yr Reference solar yield kWh/kWp
β Tilted angle of PV array °
γ Array orientation °
ηA Array d.c. energy efficiency %
ηPV a.c. energy efficiency %
θ Angle of the incident of PV surface plane °
θs Solar elevation angle °

555225-L-sub01-bw-Kunaifi555225-L-sub01-bw-Kunaifi555225-L-sub01-bw-Kunaifi555225-L-sub01-bw-KunaifiProcessed on: 8-2-2021Processed on: 8-2-2021Processed on: 8-2-2021Processed on: 8-2-2021 PDF page: 36PDF page: 36PDF page: 36PDF page: 36
List of Variables and Units
xxxvi
555225-L-sub01-bw-Kunaifi555225-L-sub01-bw-Kunaifi555225-L-sub01-bw-Kunaifi555225-L-sub01-bw-KunaifiProcessed on: 8-2-2021Processed on: 8-2-2021Processed on: 8-2-2021Processed on: 8-2-2021 PDF page: 37PDF page: 37PDF page: 37PDF page: 37
List of Variables and Units
1
YoY Year on Year
Introduction

555225-L-sub01-bw-Kunaifi555225-L-sub01-bw-Kunaifi555225-L-sub01-bw-Kunaifi555225-L-sub01-bw-KunaifiProcessed on: 8-2-2021Processed on: 8-2-2021Processed on: 8-2-2021Processed on: 8-2-2021 PDF page: 38PDF page: 38PDF page: 38PDF page: 38
List of Variables and Units
2

555225-L-sub01-bw-Kunaifi555225-L-sub01-bw-Kunaifi555225-L-sub01-bw-Kunaifi555225-L-sub01-bw-KunaifiProcessed on: 8-2-2021Processed on: 8-2-2021Processed on: 8-2-2021Processed on: 8-2-2021 PDF page: 39PDF page: 39PDF page: 39PDF page: 39
3
CChapter 1. Introduction
1.1. Background
Electricity is a critical commodity for people and hence the economy. Nowadays, a
high-quality sustainable electricity supply is demanded by society, everywhere in the
world. In Indonesia, the largest economy in South-East Asia, the demand for electricity
is enormous and the growth of this demand is high. During the next thirty years, the
annual average electricity demand in Indonesia is projected to grow by 7%, with a total
consumption of around 2,214 TWh in 2050 [1]. However, in this country, at least three
main issues exist related to power supply that will require attention in the next decades.
These are a lack of access to electricity in some remote parts of the country, unreliable
electricity supply, and increasing greenhouse gas (GHG) emissions due to power
production. Below, each issue will be briefly discussed and the potential role of
renewable energy in tackling them will be presented.
The first issue is the lack of access to electricity. Good quality electricity service is
a prerequisite for alleviating poverty and advancing the prosperity of the people [2].
Thus, a lack of access to electricity could affect the quality of critical services such as
health and education. It also influences food security, gender equality, poverty
reduction, and climate change. In 2019, nearly 3 million residents of Indonesia did not
have access to electricity from the grid [3]. This can be explained by Indonesia’s
geography: it is an archipelago country consisting of more than 17,000 islands (Figure
1.1). The distributed islands in Indonesia have been one of the main factors causing
difficulties with providing electricity to all its citizens.
Figure 1.1 Map of Indonesia. Source: Knowledgia 2020 [4]

555225-L-sub01-bw-Kunaifi555225-L-sub01-bw-Kunaifi555225-L-sub01-bw-Kunaifi555225-L-sub01-bw-KunaifiProcessed on: 8-2-2021Processed on: 8-2-2021Processed on: 8-2-2021Processed on: 8-2-2021 PDF page: 40PDF page: 40PDF page: 40PDF page: 40
1 Introduction
4
Centralized power systems rely on physical networks called the grid. A lack of
electrical service mostly occurs in rural areas and small remote islands (Figure 1.2).
These are mostly located in the Eastern part of Indonesia; however, lack of services also
occurs to a lesser extent in other parts of the country that are well covered by the
electricity grid.
Figure 1.2 Residents of a village on the island of Kalimantan work together carrying electric poles
as part of a village electrification project (photo: ecuator.co.id, 2019).
Unlike centralized power systems, renewable power systems can be implemented
in nearly all locations where sufficient energy sources are available as inputs to generate
electricity. They could therefore be installed in remote areas and isolated islands. For
that reason, renewable energy is a promising solution to tackle issues of electricity
access in a unique geography like Indonesia [5][6][7].
The second issue is unreliable, irregular electricity supply by the grid. For this
reason, in many parts of Indonesia where the electrical grid is available, brownouts and
blackouts are a daily experience for many people [8,9].
Given the critical role of electricity in society, a weak supply affects the quality of
life and could also be detrimental to the economy [2]. On average, a 1.3% increase in
electricity use per capita across a developing country is associated with a 1% increase
in GDP per capita [10]. Vast amounts of electricity are used in various aspects of life.
Information and communication technology (ICT) uses electricity such as for watching
television, listening to the radio, using mobile phones, computers, and communication
networks. Electricity also promotes safety and security by providing lighting in the streets
and homes, among others. It also improves education by providing access to the
internet, lighting to read books, and operating pedagogical aids at schools. Local
businesses use electricity to operate equipment and appliances to increase productivity.
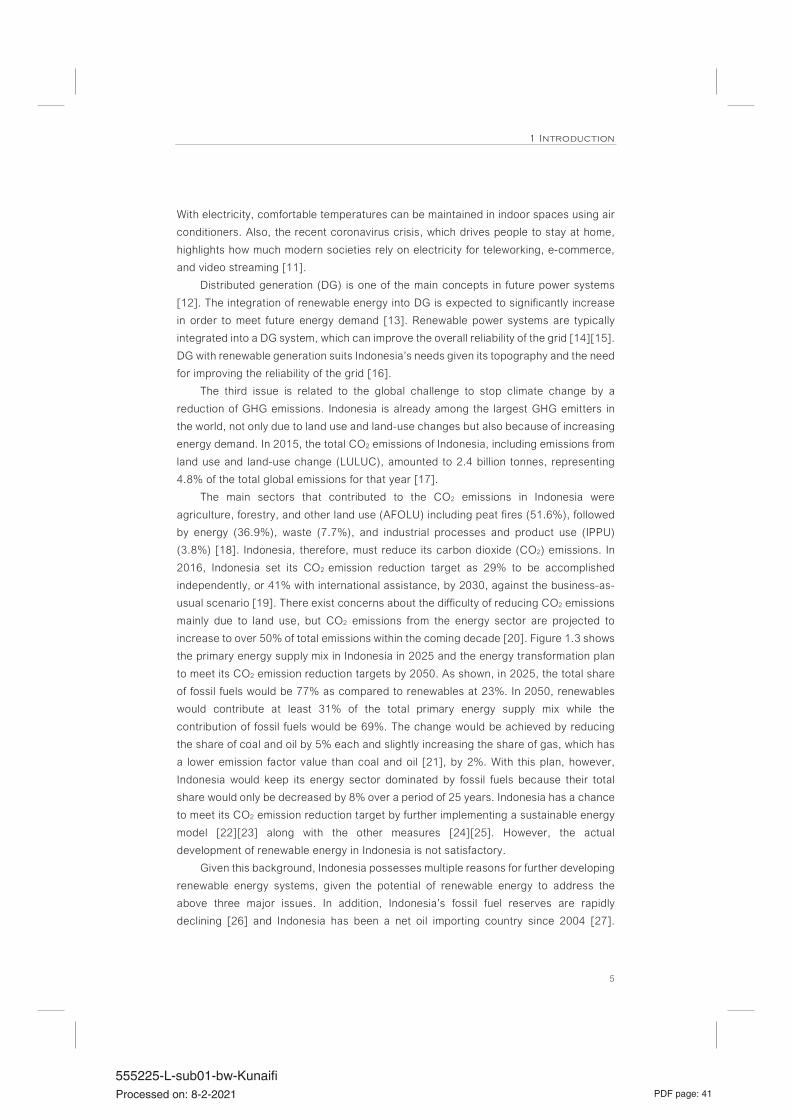
555225-L-sub01-bw-Kunaifi555225-L-sub01-bw-Kunaifi555225-L-sub01-bw-Kunaifi555225-L-sub01-bw-KunaifiProcessed on: 8-2-2021Processed on: 8-2-2021Processed on: 8-2-2021Processed on: 8-2-2021 PDF page: 41PDF page: 41PDF page: 41PDF page: 41
1 Introduction
5
With electricity, comfortable temperatures can be maintained in indoor spaces using air
conditioners. Also, the recent coronavirus crisis, which drives people to stay at home,
highlights how much modern societies rely on electricity for teleworking, e-commerce,
and video streaming [11].
Distributed generation (DG) is one of the main concepts in future power systems
[12]. The integration of renewable energy into DG is expected to significantly increase
in order to meet future energy demand [13]. Renewable power systems are typically
integrated into a DG system, which can improve the overall reliability of the grid [14][15].
DG with renewable generation suits Indonesia’s needs given its topography and the need
for improving the reliability of the grid [16].
The third issue is related to the global challenge to stop climate change by a
reduction of GHG emissions. Indonesia is already among the largest GHG emitters in
the world, not only due to land use and land-use changes but also because of increasing
energy demand. In 2015, the total CO2 emissions of Indonesia, including emissions from
land use and land-use change (LULUC), amounted to 2.4 billion tonnes, representing
4.8% of the total global emissions for that year [17].
The main sectors that contributed to the CO2 emissions in Indonesia were
agriculture, forestry, and other land use (AFOLU) including peat fires (51.6%), followed
by energy (36.9%), waste (7.7%), and industrial processes and product use (IPPU)
(3.8%) [18]. Indonesia, therefore, must reduce its carbon dioxide (CO2) emissions. In
2016, Indonesia set its CO2 emission reduction target as 29% to be accomplished
independently, or 41% with international assistance, by 2030, against the business-as-
usual scenario [19]. There exist concerns about the difficulty of reducing CO2 emissions
mainly due to land use, but CO2 emissions from the energy sector are projected to
increase to over 50% of total emissions within the coming decade [20]. Figure 1.3 shows
the primary energy supply mix in Indonesia in 2025 and the energy transformation plan
to meet its CO2 emission reduction targets by 2050. As shown, in 2025, the total share
of fossil fuels would be 77% as compared to renewables at 23%. In 2050, renewables
would contribute at least 31% of the total primary energy supply mix while the
contribution of fossil fuels would be 69%. The change would be achieved by reducing
the share of coal and oil by 5% each and slightly increasing the share of gas, which has
a lower emission factor value than coal and oil [21], by 2%. With this plan, however,
Indonesia would keep its energy sector dominated by fossil fuels because their total
share would only be decreased by 8% over a period of 25 years. Indonesia has a chance
to meet its CO2 emission reduction target by further implementing a sustainable energy
model [22][23] along with the other measures [24][25]. However, the actual
development of renewable energy in Indonesia is not satisfactory.
Given this background, Indonesia possesses multiple reasons for further developing
renewable energy systems, given the potential of renewable energy to address the
above three major issues. In addition, Indonesia’s fossil fuel reserves are rapidly
declining [26] and Indonesia has been a net oil importing country since 2004 [27].
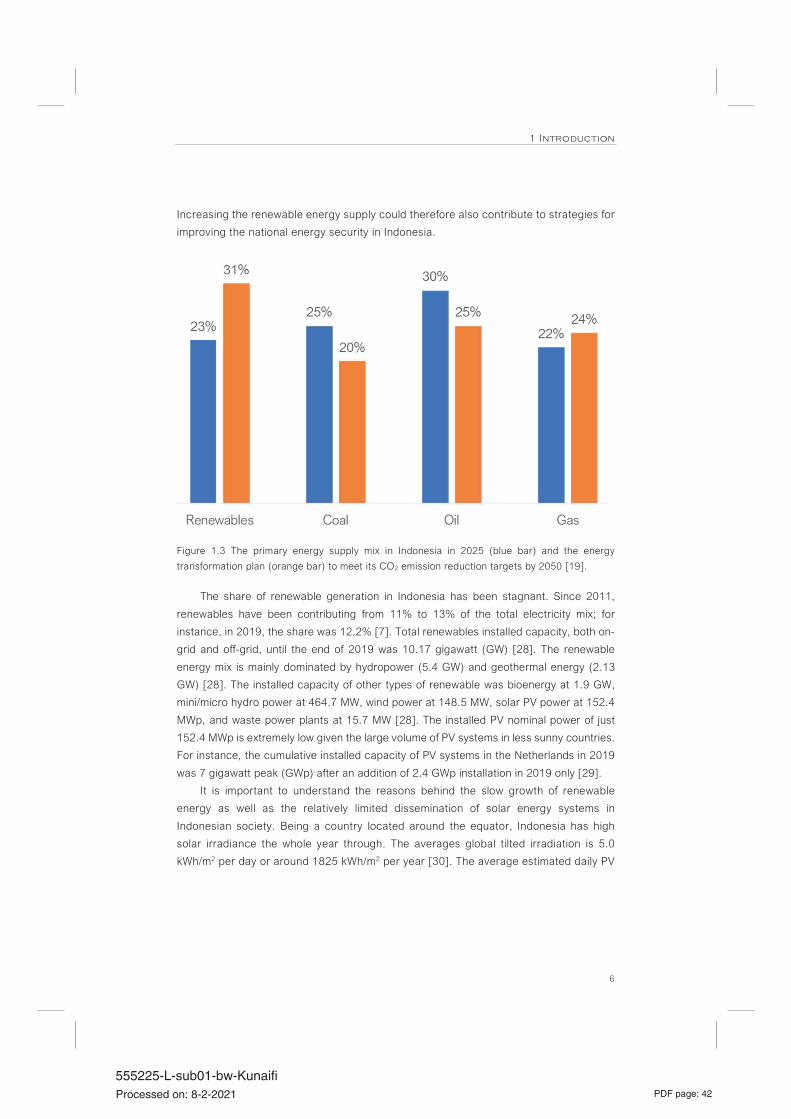
555225-L-sub01-bw-Kunaifi555225-L-sub01-bw-Kunaifi555225-L-sub01-bw-Kunaifi555225-L-sub01-bw-KunaifiProcessed on: 8-2-2021Processed on: 8-2-2021Processed on: 8-2-2021Processed on: 8-2-2021 PDF page: 42PDF page: 42PDF page: 42PDF page: 42
1 Introduction
6
Increasing the renewable energy supply could therefore also contribute to strategies for
improving the national energy security in Indonesia.
Figure 1.3 The primary energy supply mix in Indonesia in 2025 (blue bar) and the energy
transformation plan (orange bar) to meet its CO2 emission reduction targets by 2050 [19].
The share of renewable generation in Indonesia has been stagnant. Since 2011,
renewables have been contributing from 11% to 13% of the total electricity mix; for
instance, in 2019, the share was 12.2% [7]. Total renewables installed capacity, both on-
grid and off-grid, until the end of 2019 was 10.17 gigawatt (GW) [28]. The renewable
energy mix is mainly dominated by hydropower (5.4 GW) and geothermal energy (2.13
GW) [28]. The installed capacity of other types of renewable was bioenergy at 1.9 GW,
mini/micro hydro power at 464.7 MW, wind power at 148.5 MW, solar PV power at 152.4
MWp, and waste power plants at 15.7 MW [28]. The installed PV nominal power of just
152.4 MWp is extremely low given the large volume of PV systems in less sunny countries.
For instance, the cumulative installed capacity of PV systems in the Netherlands in 2019
was 7 gigawatt peak (GWp) after an addition of 2.4 GWp installation in 2019 only [29].
It is important to understand the reasons behind the slow growth of renewable
energy as well as the relatively limited dissemination of solar energy systems in
Indonesian society. Being a country located around the equator, Indonesia has high
solar irradiance the whole year through. The averages global tilted irradiation is 5.0
kWh/m2 per day or around 1825 kWh/m2 per year [30]. The average estimated daily PV
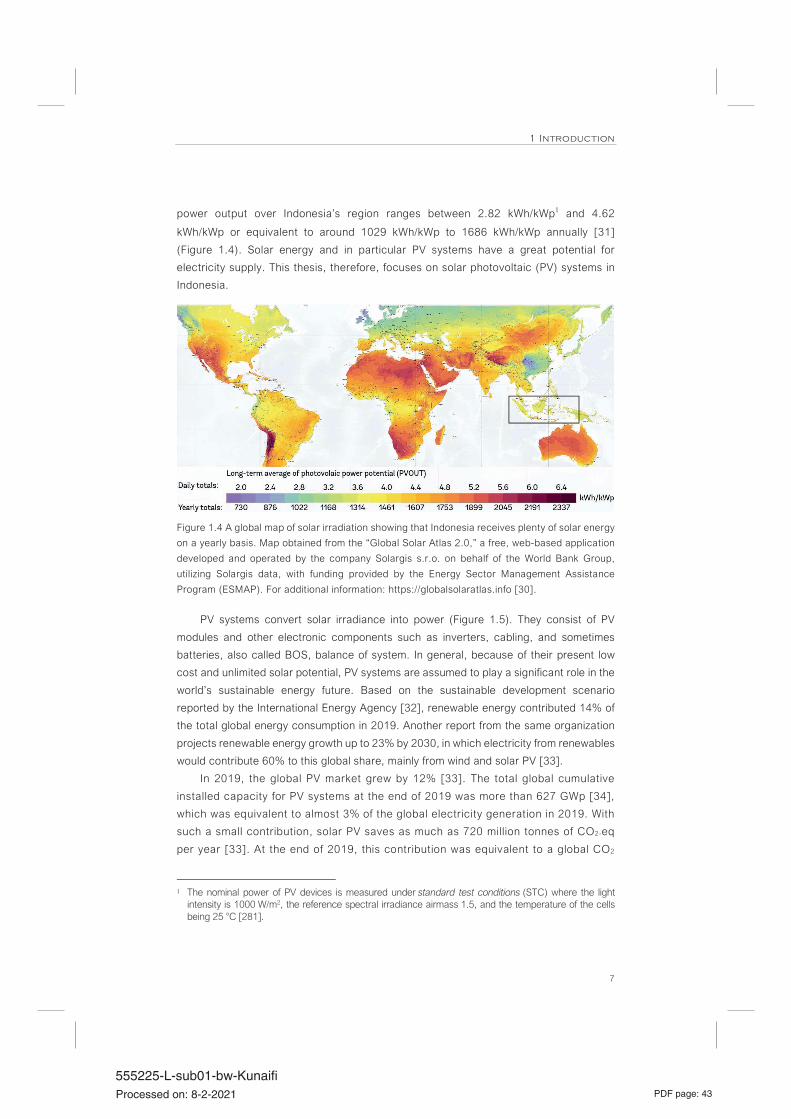
555225-L-sub01-bw-Kunaifi555225-L-sub01-bw-Kunaifi555225-L-sub01-bw-Kunaifi555225-L-sub01-bw-KunaifiProcessed on: 8-2-2021Processed on: 8-2-2021Processed on: 8-2-2021Processed on: 8-2-2021 PDF page: 43PDF page: 43PDF page: 43PDF page: 43
1 Introduction
7
power output over Indonesia’s region ranges between 2.82 kWh/kWp1 and 4.62
kWh/kWp or equivalent to around 1029 kWh/kWp to 1686 kWh/kWp annually [31]
(Figure 1.4). Solar energy and in particular PV systems have a great potential for
electricity supply. This thesis, therefore, focuses on solar photovoltaic (PV) systems in
Indonesia.
Figure 1.4 A global map of solar irradiation showing that Indonesia receives plenty of solar energy
on a yearly basis. Map obtained from the “Global Solar Atlas 2.0,” a free, web-based application
developed and operated by the company Solargis s.r.o. on behalf of the World Bank Group,
utilizing Solargis data, with funding provided by the Energy Sector Management Assistance
Program (ESMAP). For additional information: https://globalsolaratlas.info [30].
PV systems convert solar irradiance into power (Figure 1.5). They consist of PV
modules and other electronic components such as inverters, cabling, and sometimes
batteries, also called BOS, balance of system. In general, because of their present low
cost and unlimited solar potential, PV systems are assumed to play a significant role in the
world’s sustainable energy future. Based on the sustainable development scenario
reported by the International Energy Agency [32], renewable energy contributed 14% of
the total global energy consumption in 2019. Another report from the same organization
projects renewable energy growth up to 23% by 2030, in which electricity from renewables
would contribute 60% to this global share, mainly from wind and solar PV [33].
In 2019, the global PV market grew by 12% [33]. The total global cumulative
installed capacity for PV systems at the end of 2019 was more than 627 GWp [34],
which was equivalent to almost 3% of the global electricity generation in 2019. With
such a small contribution, solar PV saves as much as 720 million tonnes of CO2-eq
per year [33]. At the end of 2019, this contribution was equivalent to a global CO2
1 The nominal power of PV devices is measured under standard test conditions (STC) where the light
intensity is 1000 W/m2, the reference spectral irradiance airmass 1.5, and the temperature of the cells being 25 °C [281].
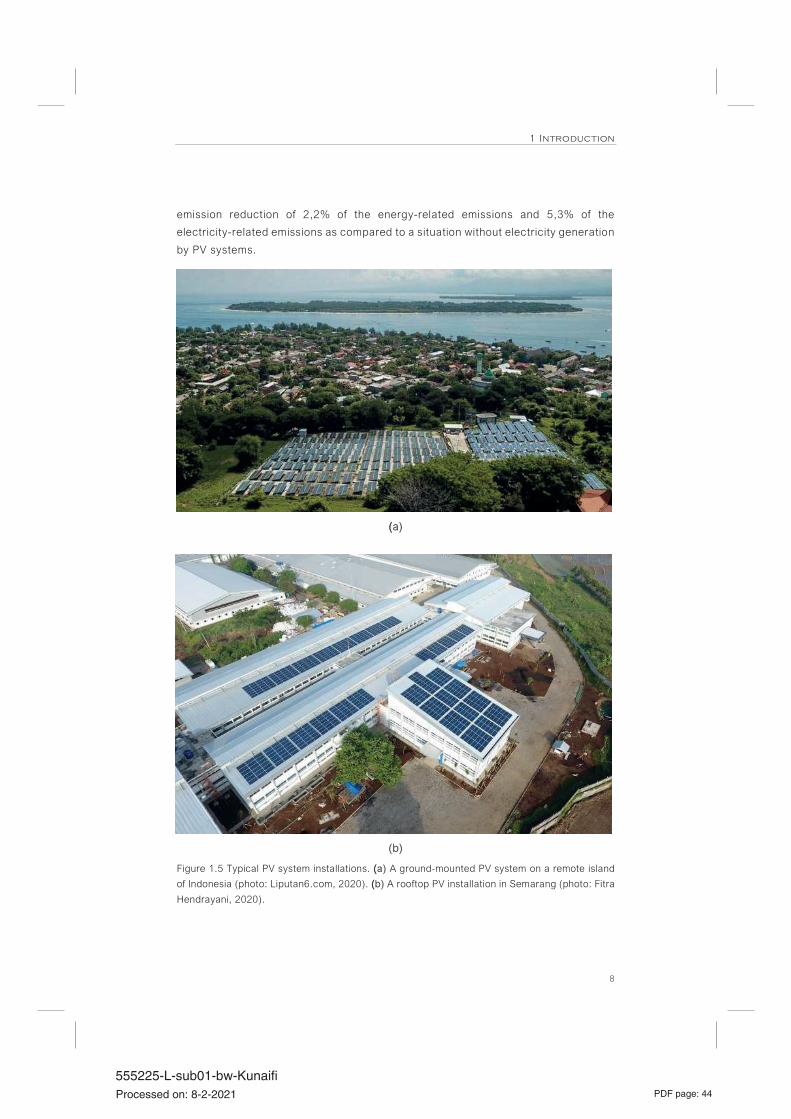
555225-L-sub01-bw-Kunaifi555225-L-sub01-bw-Kunaifi555225-L-sub01-bw-Kunaifi555225-L-sub01-bw-KunaifiProcessed on: 8-2-2021Processed on: 8-2-2021Processed on: 8-2-2021Processed on: 8-2-2021 PDF page: 44PDF page: 44PDF page: 44PDF page: 44
1 Introduction
8
emission reduction of 2,2% of the energy-related emissions and 5,3% of the
electricity-related emissions as compared to a situation without electricity generation
by PV systems.
((a)
(b)
Figure 1.5 Typical PV system installations. ((a) A ground-mounted PV system on a remote island
of Indonesia (photo: Liputan6.com, 2020). ((b) A rooftop PV installation in Semarang (photo: Fitra
Hendrayani, 2020).
555225-L-sub01-bw-Kunaifi555225-L-sub01-bw-Kunaifi555225-L-sub01-bw-Kunaifi555225-L-sub01-bw-KunaifiProcessed on: 8-2-2021Processed on: 8-2-2021Processed on: 8-2-2021Processed on: 8-2-2021 PDF page: 45PDF page: 45PDF page: 45PDF page: 45
1 Introduction
9
The costs of solar PV systems and PV modules as well as BOS are continuously
declining. By 2024, the generation costs of solar PV systems are projected to fall by
15% for utility-scale and 35% for distributed installations. Therefore, at present in
many countries around the world, the levelized cost of electricity generation by utility-
scale solar PV systems is comparable with or lower than the generation cost of new
fossil fuel power plants. In many countries and market segments, solar PV systems are
already the cheapest form of electricity generation. As shown in the European market
in 2019, the levelized cost of electricity (LCOE) ranges from US$24/MWh in Malaga,
Spain to US$42/MWh in Helsinki, Finland. This is impressive because the average day-
ahead market price of electricity in 2018 in Finland was US$47/MWh and in Spain
US$57/MWh. By 2030, it is estimated that PV LCOE will range from US$14/MWh in
Malaga to US$24/MWh in Helsinki. By 2050, this range will be US$9/MWh to
US$15/MWh [35].
In 2019, Asia maintains the lead in the PV market, representing around 57% of the
global PV market [33]. Regarding the total installed capacity, China has been the largest
PV market in the world with almost one-third of the global PV installed capacity [33].
Significant progress took place in countries that have been major markets in Asia, such
as Korea, Taiwan, and Malaysia. In other countries, such as Thailand, Singapore, the
Philippines, and in particular, Indonesia, the PV markets have been slow or fluctuating
over the years.
Developments in Indonesia’s solar PV sector have not been carefully followed or
monitored by authorities or business associations in the past decades [36]. For instance,
national data on installed PV capacity are lacking. When available, the sources of the
data or information regarding the collection methods are often also unavailable. If data
have been regionally collected, then access to organizations that possess these data
appears to be difficult. This situation is typical in Indonesia. For this reason, estimates
of the installed nominal PV power in Indonesia can vary considerably. For example,
according to Hamdi (2020) [36], the total installed capacity of PV systems in Indonesia
in 2019 was estimated at around 80 MWp, which is much different from the previous
figure of 152.4 MWp. The differences in numbers of installed nominal PV power in
Indonesia may occur because the completeness of the data used in the separate studies
varies.
The total capacity of rooftop solar PV systems was estimated at 16.6 MWp (11%).
Differently, other data put the total capacity of solar rooftops at around 8.9 MWp, with
2.1 MWp for residential use and the remainder either commercial or industrial units [37].
When this study started in 2016, the largest utility-scale solar power plant in Indonesia
had an installed capacity of only 5 MWp and was located on an isolated island grid in

555225-L-sub01-bw-Kunaifi555225-L-sub01-bw-Kunaifi555225-L-sub01-bw-Kunaifi555225-L-sub01-bw-KunaifiProcessed on: 8-2-2021Processed on: 8-2-2021Processed on: 8-2-2021Processed on: 8-2-2021 PDF page: 46PDF page: 46PDF page: 46PDF page: 46
1 Introduction
10
Kupang, East Nusa Tenggara2. The same report mentions that off-grid PV systems were
mostly financed with subsidies or grants from the government or donor agencies and
have a limited capacity of not more than 1 MWp. However, in 2019 the outlook on future
installations was optimistic, with around 48 MWp of PV systems under construction, and
an estimated 326 MWp in the pipeline.
Despite the favorable outlook of solar PV in Indonesia as presented previously, the
solar PV market in Indonesia is expected to experience a small growth in the coming
decades, mainly to meet the official CO2 emission targets. With regulatory
improvements, growth in the solar PV market can be expected [36]. Studies on
stakeholders and end-users’ perception of solar PV systems could be supportive to the
development of a market for PV systems in Indonesia. However, when this Ph.D.
research started in 2016, only a few publications were available about the societal and
technical aspects of PV systems in Indonesia.
Many studies on the topic of public perception in Indonesia focus on health [38],
environment [39][40][41], tourism [42], transportation [43][44], and trade [45][46], all
published between 2016 and 2017. These studies concluded that people are willing to
pay extra costs to support various types of activities that would improve health, provide
more tourism options, improve urban transport or reduce traffic accidents, and offer
better packaging and information for traded products.
Only two studies cover the topic of public perception in the energy sector in the
Indonesian context, namely observations about the willingness to pay (WTP) for solar
lamps [47], and an evaluation of the WTP for geothermal energy [48]. The first study
was published in 2017 and used the Becker–DeGroot–Marschak mechanism as a
research method. It was found that the WTP for a solar lamp was higher if the households
were assured that by using a solar lamp they would spend less time on lighting and
charging. The second study, which was published in 2015, evaluated the WTP for
geothermal energy of grid users in West Java using a user survey. The result showed
that the participants had a positive image of geothermal power plants and were willing
to pay extra money to avoid a blackout.
Among the studies about the user perception of renewable energy, solar PV
systems in various conditions and settings were weakly represented. Therefore a major
question is, whether PV systems are feasible and technically suitable for Indonesia?
It was difficult to answer this question when this study started. A limited number of
studies assess the performance of PV systems in Indonesia on the basis of an evaluation
of monitoring data. A few studies published around twenty years ago evaluated the
performance of off-grid solar home system (SHS) programs in developing countries,
including Indonesia [49,50]. These studies were conducted in 1998 and 2001. They
2 By 2019, the largest PV system in Indonesia was Likupang PV system with an installed capacity
of 21 MWp. Likupang PV system is located in North Minahasa, the northernmost part of the island of Sulawesi.

555225-L-sub01-bw-Kunaifi555225-L-sub01-bw-Kunaifi555225-L-sub01-bw-Kunaifi555225-L-sub01-bw-KunaifiProcessed on: 8-2-2021Processed on: 8-2-2021Processed on: 8-2-2021Processed on: 8-2-2021 PDF page: 47PDF page: 47PDF page: 47PDF page: 47
1 Introduction
11
assessed the effectiveness of SHS programs funded by foreign donors from economic,
institutional, and social perspectives based on either a field survey or literature review.
These studies showed that SHS programs in the studied areas were relatively
successful. The reason for the success was because SHS offered a better alternative to
kerosene lanterns for lighting. However, several challenges must be carefully addressed
to ensure the effectiveness and suitability of SHS programs. They include the availability
of initial capital costs, technical quality, responsive and sustainable infrastructures, user
engagement, and capacity development.
Another study in 1999 specifically evaluated an SHS program and street lighting
system (SLS) in a remote village in Indonesia based on system measurements and
interviews [51]. This study also concluded that from the technical point of view, the SHS
in the study location performed well, as long as the users did not make changes to the
systems. However, different from the previous two studies, this study found that the
failure rate of such programs was high despite the positive opinion of the villagers about
these systems.
The performance of grid-connected PV systems in Indonesia was reported in
several scientific publications [52–55]. These studies evaluated the performance ratio
(PR) of a 34 kWp grid-connected PV system in Jayapura. They found that, after two
years of operation, the PV system performed well, with a PR ranging from 54% to 91%
depending on the configuration of sub-arrays. PR values were in line with other PV
systems in Europe. These studies also confirmed that PV systems could be an
appropriate solution for electrification in both urban, rural, and remote areas in
Indonesia. These results were valuable because they presented the first scientific facts
of the actual performance of a PV system in Indonesia. Unfortunately, this information
was based on only one system located in Indonesia, namely in Jayapura, the province
of Papua, so that they represent only a small region of Indonesia. Also, due to the
relatively short period of data collection, the degradation rate of this PV system was not
evaluated.
Given this context of prior studies, the research results presented in this thesis can
be considered to be new, because so far little knowledge has been acquired about the
preference of the end-users of the grid, their perception of PV systems, and the
performance of installed PV systems in Indonesia.
11.2. Research Design and Methods
Reflecting on the described problems in Section 1.1, this research is guided by the
main research question formulated as follows:
What are the experiences and attitudes of Indonesian end-users towards the electricity
grid, as well as solar energy, and would a transition towards solar photovoltaic systems
be feasible considering the performance of PV systems operating under Indonesia’s
tropical climate conditions?

555225-L-sub01-bw-Kunaifi555225-L-sub01-bw-Kunaifi555225-L-sub01-bw-Kunaifi555225-L-sub01-bw-KunaifiProcessed on: 8-2-2021Processed on: 8-2-2021Processed on: 8-2-2021Processed on: 8-2-2021 PDF page: 48PDF page: 48PDF page: 48PDF page: 48
1 Introduction
12
The term end-users used in the research question is defined as households living
in the premises connected to a low-voltage distribution electricity grid.
Figure 1.6 shows a visualization of the research design that is derived from the
actual situation described in Section 1.1. As shown, we identify three major aspects to
be considered to assess the feasibility of Indonesia transitioning toward a higher share
of solar PV system in the total energy mix: the present situation, the voice of the end-
users of the electricity grid, and the performance of PV systems.
Figure 1.6 Visualization of the elements and methods forming the multidisciplinary perspective for
assessing the feasibility of the transition towards solar PV power generation in Indonesia.
Each major aspect carries sub-topics that are formulated in sub-questions. This
research is intended to fill the gap in existing literature regarding five sub-topics as
follows.
First, what are the main factors that influence the energy situation in Indonesia?
This question deals with the first aspect of the present situation. We will identify the
factors using the population size, economic situation, development of renewable energy
systems, and governmental regulations.
Second, what are the challenges in providing proper electrical power supply to the
whole population in Indonesia? The question regarding the second aspect of the present
situation will be addressed by evaluating the gaps or disparities in power services from
one region to another in Indonesia based on the available literature. We will also look at
the level of electricity consumption, and the possible impact of the current power
development strategy on climate change. Then, we will study the existing power supply
Challenges
Main influencing
factors In Indonesia
as compared to other climates
Present situation
Voice of end-users
Performance of PV systems
Attitudes toward solar PV
Experiences with the grid
Would a transition towards solar photovoltaic systems be feasible?
Literature research User survey and
grid measurement Data analysis

555225-L-sub01-bw-Kunaifi555225-L-sub01-bw-Kunaifi555225-L-sub01-bw-Kunaifi555225-L-sub01-bw-KunaifiProcessed on: 8-2-2021Processed on: 8-2-2021Processed on: 8-2-2021Processed on: 8-2-2021 PDF page: 49PDF page: 49PDF page: 49PDF page: 49
1 Introduction
13
systems and businesses in Indonesia and observe the role of PLN, the national utility
company.
The following third and fourth sub-questions belong to the voice of end-users major
aspect.
Third, what are the experiences of end-users with the electricity grid in Indonesia?
This question will be addressed through a series of user surveys and fieldwork regarding
the measurement of the electricity grid. In 2018, nearly 70 million households in
Indonesia were connected to the national power grid. Accordingly, we believe that their
‘voice’ are important to maintain democratic and participatory values in the planning of
electricity services. These voices should be taken into account by the utility company
and other policymakers. However, what is actually the voice of electricity users in
Indonesia? Also, what can we learn from it when looking at the fitness of the electricity
supply in Indonesia in the context of costs, reliability, and environmental aspects? What
are their experiences and preferences regarding their electricity supply, how they coped
with blackouts, and what impacts power interruptions had on their daily lives?
Fourth, what are the attitudes of the grid’s end-users toward solar photovoltaic
systems? Based on data from user surveys, the attitudes of the grid’s end-users will be
captured. This includes the awareness of the households regarding renewable energy
and climate change and their attitudes towards solar photovoltaics.
In the last major aspect, the performance of PV systems will be approached using
one sub-question organized in two separate studies of their technical performance in
Indonesia and other countries.
Fifth, how well do PV systems in Indonesia function, and how are their performances
as compared to PV systems which are installed in other climates? This technical question
will be addressed by analyzing measurement data from PV systems using different
technologies operating in Indonesia and other countries in different climates. The
performance of PV systems will be calculated using performance metrics such as
performance ratio (PR) and performance loss rate (PLR).
To find answers to the main research question, the research will be divided into
three parts: (I) evaluation of the present situation regarding energy and power supply,
(II) observation of the preference and attitudes of the end-users of the electricity grid,
and (III) assessment of the performance of PV systems in Indonesia and other climates.
Below, the general methods applied to address each part are briefly explained as shown
between the dashed lines in Figure 1.6.
Part I: Evaluation of the present situation
The evaluation of the present situation will be conducted through a deep analysis
of the available literature. We will be mainly referring to publications and statistics from
2017 to 2019 in combination with older data.
555225-L-sub01-bw-Kunaifi555225-L-sub01-bw-Kunaifi555225-L-sub01-bw-Kunaifi555225-L-sub01-bw-KunaifiProcessed on: 8-2-2021Processed on: 8-2-2021Processed on: 8-2-2021Processed on: 8-2-2021 PDF page: 50PDF page: 50PDF page: 50PDF page: 50
1 Introduction
14
Part II: Observation of the preference and attitudes of the end-users of the electricity
grid
The observation of the preference and attitudes of the end-users of the electricity
grid will be tackled using a combination of a desk study, user survey, and measurement
of the power quality of the PLN distribution networks. The desk study includes an
analysis of PLN’s annual reports containing SAIDI (System Average Interruption Duration
Index) and SAIFI (System Average Interruption Frequency Index) values for each
province in Indonesia. The user survey will be executed in three locations in Indonesia,
including the cities of Pekanbaru in the province of Riau, Kupang in the province of ENT,
and Jayapura in the province of Papua. Households will be asked nine and ten questions
respectively to capture their experience with the grid and their attitudes toward several
aspects of electricity and sustainability. Measurements of the power quality of the PLN
distribution networks will be conducted in the same locations as above.
Part III: Assessment of the performance of PV systems
The assessment of the performance of PV systems is aimed at calculating the
performance ratio (PR) and degradation. The PR will be estimated using IEC standards.
The degradation calculations use two different methods: the year-on-year approach from
NREL/RdTools and seasonal and trend decomposition, applying locally weighted
scatterplot smoothing by STL decomposition.
11.3. Outline of the Thesis
The chapters in this thesis are related to the above-presented sub-research
questions. In Figure 1.7, the corresponding chapter of each sub-question is shown. The
contents of the individual chapters are concisely described below.
Chapter 2 introduces the main factors that influence the development of the energy
sector in Indonesia, which include physical, economic, social, and regulatory aspects.
The discussion will start with the unique geographical nature of Indonesia’s archipelago
that poses challenges in developing power supply systems. Namely, the distribution of
more than 17,000 islands of different dimensions and different population size require
isolated and locally-designed power supply systems. These challenges are related to the
present and future outlook on the macro-economic features of Indonesia. In the next
part, the energy demand will be approached from the viewpoint of population size, the
shaping factor of the energy demand. In the next part, the climatic nature of Indonesia
will be presented along with the potential of solar energy in this tropical country. Lastly,
before the conclusions, the stakeholders’ interest in regulations that support renewable
energy will be discussed.
Chapter 3 concerns the status and challenges of energy supply. A brief discussion
about fossil fuel resources will start the chapter. We present the status of the fossil fuel
market and the estimation of the duration of economical availability. Later, a detailed
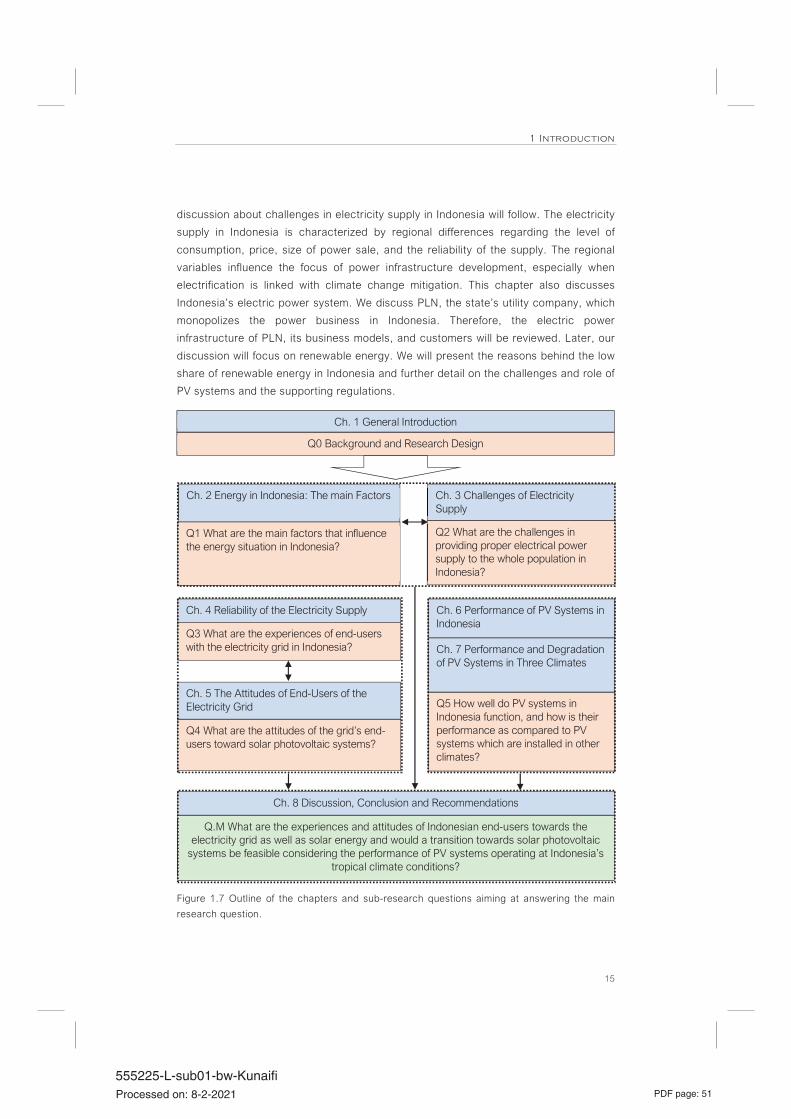
555225-L-sub01-bw-Kunaifi555225-L-sub01-bw-Kunaifi555225-L-sub01-bw-Kunaifi555225-L-sub01-bw-KunaifiProcessed on: 8-2-2021Processed on: 8-2-2021Processed on: 8-2-2021Processed on: 8-2-2021 PDF page: 51PDF page: 51PDF page: 51PDF page: 51
1 Introduction
15
discussion about challenges in electricity supply in Indonesia will follow. The electricity
supply in Indonesia is characterized by regional differences regarding the level of
consumption, price, size of power sale, and the reliability of the supply. The regional
variables influence the focus of power infrastructure development, especially when
electrification is linked with climate change mitigation. This chapter also discusses
Indonesia’s electric power system. We discuss PLN, the state’s utility company, which
monopolizes the power business in Indonesia. Therefore, the electric power
infrastructure of PLN, its business models, and customers will be reviewed. Later, our
discussion will focus on renewable energy. We will present the reasons behind the low
share of renewable energy in Indonesia and further detail on the challenges and role of
PV systems and the supporting regulations.
Figure 1.7 Outline of the chapters and sub-research questions aiming at answering the main
research question.
Q.M What are the experiences and attitudes of Indonesian end-users towards the electricity grid as well as solar energy and would a transition towards solar photovoltaic
systems be feasible considering the performance of PV systems operating at Indonesia’s tropical climate conditions?
Ch. 8 Discussion, Conclusion and Recommendations
Ch. 1 General Introduction
Q0 Background and Research Design
Ch. 2 Energy in Indonesia: The main Factors
Q1 What are the main factors that influence the energy situation in Indonesia?
Ch. 3 Challenges of Electricity Supply
Q2 What are the challenges in providing proper electrical power supply to the whole population in Indonesia?
Ch. 4 Reliability of the Electricity Supply
Q3 What are the experiences of end-users with the electricity grid in Indonesia?
Ch. 5 The Attitudes of End-Users of the Electricity Grid
Q4 What are the attitudes of the grid’s end-users toward solar photovoltaic systems?
Ch. 6 Performance of PV Systems in Indonesia
Q5 How well do PV systems in Indonesia function, and how is their performance as compared to PV systems which are installed in other climates?
Ch. 7 Performance and Degradation of PV Systems in Three Climates
555225-L-sub01-bw-Kunaifi555225-L-sub01-bw-Kunaifi555225-L-sub01-bw-Kunaifi555225-L-sub01-bw-KunaifiProcessed on: 8-2-2021Processed on: 8-2-2021Processed on: 8-2-2021Processed on: 8-2-2021 PDF page: 52PDF page: 52PDF page: 52PDF page: 52
1 Introduction
16
Chapter 4 deals with the reliability of the electricity supply based on user surveys
and measurements on the grid conducted at three urban locations in Indonesia. Here,
we compare the user perception and the official reports of PLN. We will briefly show how
user perception has been used widely as the basis for decision making, particularly in
the electricity sector. We compare the reported indices of power reliability (SAIFI which
is System Average Interruption Frequency Index and SAIDI which is System Average
Interruption Duration Index) and experimental results from user surveys and power
measurements. From grid measurements, we also capture voltage fluctuations and
blackout events.
Chapter 5 evaluates the attitudes of the grid’s end-users toward solar photovoltaics
based on the same surveys presented in Chapter 4. The discussion is focused on
findings regarding the awareness of the households about renewable energy and climate
change and their attitudes towards solar photovoltaics. Respondents were asked
questions about which electricity sources they believed to be cheaper, cleaner, more
stable; the grid, or a PV system? They were also asked questions about their preference
for the electricity sources at home and whether they would like to have a PV system
installed on their house's rooftop?
Chapter 6 is the first chapter that evaluates specifically PV systems’ technical
performance in Indonesia because despite being a tropical country with great potential
for solar power, knowledge about the actual performance of PV systems in Indonesia
remains limited. In this chapter, using 5-minute resolution data from 2016 to 2018
obtained from a 1 MWp Copper Indium Selenide (CIS) and a 5 kWp crystalline silicon (c-
Si) PV plant in West Java, we aim to answer the question of how a CIS PV plant performs
and degrades in Indonesia’s tropical climate and how it compares to a PV system that
contains c-Si technology. The methodological approach used includes performance
analyses of these PV systems according to IEC standard 61724 and an investigation of
the degradation rate using NREL/RdTools.
Chapter 7, like Chapter 6, also looks at PV systems’ technical performance. Unlike
Chapter 6 which analyzed PV systems in Indonesia, Chapter 7 is based on data from
three different climates. In this chapter, we compare the performance of PV systems in
Indonesia with PV systems in Australia (arid, desert, hot) and Italy (temperate, dry
summer, hot summer). Fifteen PV systems of six technologies were analyzed. The
performance of the PV systems is presented using their performance ratio (PR) and
performance loss rate (PLR). PR was calculated using IEC standard 61724, and PLR
was calculated using seasonal and trend decomposition, applying locally weighted
scatterplot smoothing (STL decomposition), and the year-on-year approach from
NREL/RdTools.
Chapter 8 is the final chapter of this thesis and presents the conclusions,
discussion, and recommendations. The conclusions provide an answer to the research
questions. After the conclusions, the contributions and limitations of the research are
discussed. In the final section, several recommendations are provided that could help
555225-L-sub01-bw-Kunaifi555225-L-sub01-bw-Kunaifi555225-L-sub01-bw-Kunaifi555225-L-sub01-bw-KunaifiProcessed on: 8-2-2021Processed on: 8-2-2021Processed on: 8-2-2021Processed on: 8-2-2021 PDF page: 53PDF page: 53PDF page: 53PDF page: 53
1 Introduction
17
governmental parties, PV business, academic, and general communities to improve their
approaches towards the implementation of PV systems and related research.

555225-L-sub01-bw-Kunaifi555225-L-sub01-bw-Kunaifi555225-L-sub01-bw-Kunaifi555225-L-sub01-bw-KunaifiProcessed on: 8-2-2021Processed on: 8-2-2021Processed on: 8-2-2021Processed on: 8-2-2021 PDF page: 54PDF page: 54PDF page: 54PDF page: 54
1 Introduction
18

555225-L-sub01-bw-Kunaifi555225-L-sub01-bw-Kunaifi555225-L-sub01-bw-Kunaifi555225-L-sub01-bw-KunaifiProcessed on: 8-2-2021Processed on: 8-2-2021Processed on: 8-2-2021Processed on: 8-2-2021 PDF page: 55PDF page: 55PDF page: 55PDF page: 55
19
Energy in
Indonesia: The Main
Factors
This Chapter is based on “Kunaifi, K.; Veldhuis, A.J.; Reinders, A.H.M.E. The Electricity Grid in Indonesia: The Experiences of End-users and Their Attitudes Toward Solar Photovoltaics; Springer: Cham, Switzerland, 2020; Chapter 1: Energy in Indonesia: The Main Factors. Springer, pp. 1-20, ISBN 978-3-030-38341-1.”

555225-L-sub01-bw-Kunaifi555225-L-sub01-bw-Kunaifi555225-L-sub01-bw-Kunaifi555225-L-sub01-bw-KunaifiProcessed on: 8-2-2021Processed on: 8-2-2021Processed on: 8-2-2021Processed on: 8-2-2021 PDF page: 56PDF page: 56PDF page: 56PDF page: 56
1 Introduction
20
555225-L-sub01-bw-Kunaifi555225-L-sub01-bw-Kunaifi555225-L-sub01-bw-Kunaifi555225-L-sub01-bw-KunaifiProcessed on: 8-2-2021Processed on: 8-2-2021Processed on: 8-2-2021Processed on: 8-2-2021 PDF page: 57PDF page: 57PDF page: 57PDF page: 57
21
CChapter 2. Energy in Indonesia:
The Main Factors
2.1. Introduction
This chapter will introduce the energy situation in Indonesia as well as the main
factors that influence it. Being one of the world’s largest archipelagos, Indonesia has a
unique and highly distributed power supply system. The population size is the main factor
which causes a significant demand for energy. The growing economy of Indonesia brings
optimism, including on the subject of renewable energy development. Across
Indonesia’s area, high levels of solar energy are available the whole year through.
However, the present role of the central government in energy development is still very
big, which causes inefficiency. This demands a more significant role of local entities,
especially provincial and district governments and the private sector. In our discussions,
we mainly refer to statistics from 2017 to 2019 in combination with older data. Therefore,
we also present the status of the general energy supply and demand in Indonesia
followed by that of the electricity sector specifically. Various challenges in providing
proper electrical power supply to the whole population will be discussed. For this
purpose, we evaluate the gaps or disparities in power services from one region to
another, the level of electricity consumption, and the possible impact of the current
power development strategy on climate change. Then, we present power supply
systems and businesses in Indonesia and show the dominant role of PLN, the national
utility company. Further, the status of renewable implementation will be discussed with
particular attention to PV systems. Along with this, we argue that government regulations
influence the rise and fall of renewable energy in Indonesia. Finally, we briefly present
some possible scenarios for the future of the power system in Indonesia.
2.2. An Archipelago with a Unique Power Supply System
Indonesia is one of the world’s largest archipelagos. The country has a total area of
8.3 million km2, comprising 77% water surface and 17,504 islands [56]. Around 111 of
its outer islands share borders with neighboring countries. As shown in Figure 2.1,
Indonesia stretches over 5,000 km from the East to the West, across South-East Asia
and Oceania and two oceans, the Indian Ocean, and the Pacific. Most of the citizens
live on five major islands, namely Sumatra, Java, Kalimantan, Sulawesi, and Papua. Yet,
around 6,000 other islands were inhabited in 2014 [57].

555225-L-sub01-bw-Kunaifi555225-L-sub01-bw-Kunaifi555225-L-sub01-bw-Kunaifi555225-L-sub01-bw-KunaifiProcessed on: 8-2-2021Processed on: 8-2-2021Processed on: 8-2-2021Processed on: 8-2-2021 PDF page: 58PDF page: 58PDF page: 58PDF page: 58
2 E
ne
rg
y in
In
do
ne
sia
: T
he
M
ain
F
ac
to
rs
22
Fig
ure
2.1
The
pos
itio
n o
f In
do
nes
ia in
the
wo
rld
ma
p a
s sh
ow
n in
the
re
d b
ox [
58
].
Sum
atra
Ja
va
Kal
iman
tan
Sul
awes
i P
apua

555225-L-sub01-bw-Kunaifi555225-L-sub01-bw-Kunaifi555225-L-sub01-bw-Kunaifi555225-L-sub01-bw-KunaifiProcessed on: 8-2-2021Processed on: 8-2-2021Processed on: 8-2-2021Processed on: 8-2-2021 PDF page: 59PDF page: 59PDF page: 59PDF page: 59
2 Energy in Indonesia: The Main Factors
23
The total area of Indonesia covers 42% of the entire land of South-East Asia,3 with
dimensions that are larger than the total area of the European Union (EU) member
nations.
Two of Indonesia’s islands, Kalimantan and Sumatra, are among the top ten largest
islands on Earth. Kalimantan or Borneo is the fourth largest island in the world, with a
size of 539.460 km2. Sumatra is the seventh-largest island, with a size of 473.606 km2.
Indonesia’s territory on the island of New Guinea, the second-largest island in the world,
is roughly equal to half of the island’s total area. With so many large islands, the length
of the coastline of Indonesia is 108,000 km [56].
Geologically, the Indonesian archipelago has a complex structure [59]. On the
island of Sulawesi in the center of Indonesia, the meeting point of three large tectonic
plates is located, namely Eurasia, the Pacific, and Australia. Accordingly, the majority of
Indonesia is also part of the Pacific Ring of Fire, a volcanic path along the Pacific Ocean.
Such a geological attribute gives Indonesia a great potential for geothermal energy.
From around 312 sites in Java, Sumatra, Bali, Nusa Tenggara, and Sulawesi, Indonesia
has approximately 28.9 GW of geothermal energy potential [60].
In line with its geographical nature, Indonesia is quite familiar with many disasters,
both natural and anthropogenic. The main types of disasters are floods, droughts,
earthquakes, volcanic eruptions, tsunamis, and forest fires [61]. Seventy-six active
volcanoes, mostly on Java and Sumatra, contribute to frequent volcanic eruptions and
earthquakes. As a very active seismic zone, Indonesia is not only the country with the
most earthquakes events in the world but also with the highest number of earthquakes
per unit area, after Tonga and Fiji [62].
Most of Indonesia’s topography consists of lowland and coastal areas, as well as
mountains on the large islands [61]. Around 5,700 rivers flow across the country, which
contributes to about 12% of its land being suitable for farming [63]. Fertile soil, mainly
originating from volcanic ashes, is mostly located on the islands of Java, Sumatra,
Sulawesi, and Nusa Tenggara. Half of Indonesia’s land is currently covered by rainforest,
mainly located in Sumatra, Kalimantan, Papua, and Sulawesi. However, around 30% of
the natural forest has been converted to other uses, such as agriculture, mining,
infrastructure, and urbanization [64]. Some locations, such as the eastern coast of
Sumatra, the southern coast of Kalimantan, and the northern coast of Java, are
dominated by swamps and mangrove forests.
Given the characteristics described above, especially due to its geography as an
archipelagic country and the size of the area itself, Indonesia faces unique challenges
as well as opportunities concerning electricity services. The most common challenge is
due to the existence of islands, which causes difficulty in providing evenly distributed
3 South-East Asia consists of eleven countries, namely Brunei, Cambodia, Timor-Leste,
Indonesia, Laos, Malaysia, Myanmar, Philippines, Singapore, Thailand, and Vietnam.

555225-L-sub01-bw-Kunaifi555225-L-sub01-bw-Kunaifi555225-L-sub01-bw-Kunaifi555225-L-sub01-bw-KunaifiProcessed on: 8-2-2021Processed on: 8-2-2021Processed on: 8-2-2021Processed on: 8-2-2021 PDF page: 60PDF page: 60PDF page: 60PDF page: 60
2 Energy in Indonesia: The Main Factors
24
electricity service to all the regions of Indonesia. This also brings a unique opportunity
to expand the potential of its renewable resources for power generation.
The distribution of access to electricity4 service in Indonesia is not balanced
between regions. On islands with high industrial intensity, such as western Java [65],
the quality of electricity access is very good. Also, in the capital city of Jakarta, the
electrification ratio, ER, is almost 100%. However, in other areas, particularly in the
eastern part of Indonesia, access to electricity is relatively low. The ER in the East Nusa
Tenggara, for example, was only 60% in 2017 [66] and 85% in 2019 [3].
People who live on smaller islands far away from the main islands, where the main
grid exists, cannot conventionally obtain access to electricity from the main utility
networks. Either from a technical or economic perspective, it is often not feasible to
extend the transmission networks to remote islands [67].
Constructing power plants on remote islands requires great cost and high levels of
complication [68]. Therefore, for decades, diesel generators have been very popular on
islands in Indonesia due to their simple installation and low initial costs. A 200 kilowatt
(kW) diesel generator, for example, requires an initial investment of around US$200,000.
However, in reality, diesel power generators are not favorable because of their
critical weaknesses such as noise pollution, soil and water pollution, insecure diesel fuel
supply, skyrocketing diesel fuel prices, and greenhouse gas (GHG) emissions from
burning diesel fuel. In the long run, the use of diesel generators on islands will not be
sustainable. Therefore, the use of locally available renewable energy resources for
power generation is the future of power systems on Indonesia’s islands. Solar
photovoltaic (PV) systems, in particular, are a rational option for the development of the
electricity sector in Indonesia’s archipelago.
Photovoltaic systems are among the most promising energy technologies of the
twenty-first century. Three obvious reasons support this assertion [69]. First, PV systems
are a clean way to generate electrical energy because their operation does not involve
any GHG emission nor pollutants that can cause global warming and acid rain. Secondly,
PV systems convert solar irradiance, which is always available, into electricity. Finally,
solar energy is available in abundance: the amount of solar irradiation that reaches the
Earth in 1 h is equivalent to the world’s total energy consumption in one year.
4 Access to electricity can be represented by the electrification ratio (ER) or electrification level
(EL), which is defined as the percentage of population or households with electricity. The World Bank, IEA, UNmetadata, and other international organizations, however, use the term ‘electrification rate’ instead [282] [283]. In this thesis, we use the term electrification ratio to quantify access to electricity. Electrification ratio in Indonesia comprises three types, i.e. PLN’s ER, Non-PLN’s ER, and EESL’s ER. The PLN’s ER is calculated based on the number of households connected to the PLN’s grid. Non-PLN’s ER is calculated using the number of households getting electicity access from sources other than PLN such as villages electrification programs initiated by local governments or communities. EESL’s ER is calculated based on the number of households participated in an energy-efficient solar lamp (EESL) project by the central government. The total ER is a combination of PLN’s ER, Non-PLN’s ER, and EESL’s ER.

555225-L-sub01-bw-Kunaifi555225-L-sub01-bw-Kunaifi555225-L-sub01-bw-Kunaifi555225-L-sub01-bw-KunaifiProcessed on: 8-2-2021Processed on: 8-2-2021Processed on: 8-2-2021Processed on: 8-2-2021 PDF page: 61PDF page: 61PDF page: 61PDF page: 61
2 Energy in Indonesia: The Main Factors
25
Indonesia has high levels of solar irradiance in the range of 5.0 kWh/m2 per day or
around 1825 kWh/m2 per year [30] that are available the whole year through. However,
it is important to ask: Is Indonesia ready to adopt solar electricity or not? By
understanding Indonesia’s overall characteristics such as geography, population,
economy, climate, and stakeholders in the energy sector, we have provided an overview
of how solar electricity fits with Indonesia. This can create insight into the opportunity
and drawbacks of solar electricity in Indonesia.
22.3. A Growing Economy that Brings Optimism
At present, the Indonesian government is working hard to spur social development
and economic growth by improving the economy, eradicating corruption, cutting
domestic fuel subsidies, and boosting investments in infrastructure [63]. In 2019,
Indonesia’s economy grew by 5.02% [70]. Although this figure was high compared to
the average economic growth of the world of around 2.5% [71], Indonesia’s government
targets a growth rate of 7% by stimulating foreign investment [63]. In South-East Asia,
Indonesia surpassed Malaysia and Thailand in terms of economic growth but was below
the Philippines and Vietnam. Higher economic growth rates are common in emerging
economies, given the examples of India, Bangladesh, and Ghana, with greater economic
growth in the range of 7–8%. In contrast, developed countries like the United States
(US), Singapore, and Australia stayed in the range of 2% growth.
Regarding the gross domestic product (GDP) based on purchasing power parity
(PPP), Indonesia is predicted to become one of the world’s economic leaders in the
coming decades [72]. In 2019, Indonesia’s GDP (PPP) was US$3.3 billion, which was
ranked seventh in the world and shared about 2.5% of the total global GDP (PPP) [73].
However, due to its large population, the GDP (PPP) per capita was low (around
US$12,308) or in the 125th place globally. To compare, the GDP (PPP) per capita of
Malaysia, the US, and Singapore were US$29,526, US$65,118, and US$ 101,376,
respectively [73].
There exist a strong correlation between the GDP of a country and its energy
consumption [74], [75]. Figure 2.2 shows the per capita energy consumption (in kg oil
equivalent) versus per capita GDP, PPP (current international $). The size of the bubbles
denotes the total population per country. Due to data availability, all values, however,
refer to the year 2014, when the population of Indonesia was 255 million people [76],
GDP per capita (PPP) was US$10,570 [73], and energy consumption per capita was
884 kg oil equivalent [77]. As shown by the blue fitting line, countries with a higher GDP
per capita used more energy than those with lower GDP per capita. In terms of GDP
(PPP) per capita, Indonesia was among the countries with upper-middle-income. Also,
energy use per capita in Indonesia was less than half of the world’s average. The
economic size and the current level of energy use per capita indicate that a sharp
increase in energy use can be expected in the coming years.
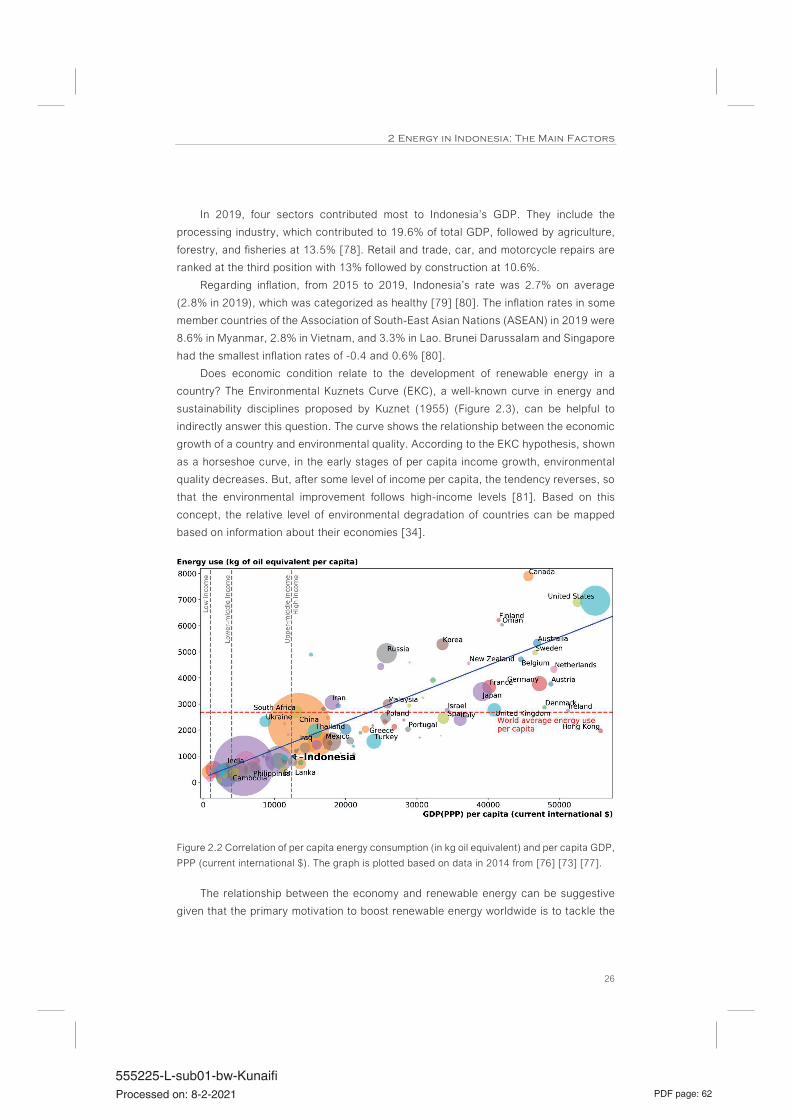
555225-L-sub01-bw-Kunaifi555225-L-sub01-bw-Kunaifi555225-L-sub01-bw-Kunaifi555225-L-sub01-bw-KunaifiProcessed on: 8-2-2021Processed on: 8-2-2021Processed on: 8-2-2021Processed on: 8-2-2021 PDF page: 62PDF page: 62PDF page: 62PDF page: 62
2 Energy in Indonesia: The Main Factors
26
In 2019, four sectors contributed most to Indonesia’s GDP. They include the
processing industry, which contributed to 19.6% of total GDP, followed by agriculture,
forestry, and fisheries at 13.5% [78]. Retail and trade, car, and motorcycle repairs are
ranked at the third position with 13% followed by construction at 10.6%.
Regarding inflation, from 2015 to 2019, Indonesia’s rate was 2.7% on average
(2.8% in 2019), which was categorized as healthy [79] [80]. The inflation rates in some
member countries of the Association of South-East Asian Nations (ASEAN) in 2019 were
8.6% in Myanmar, 2.8% in Vietnam, and 3.3% in Lao. Brunei Darussalam and Singapore
had the smallest inflation rates of -0.4 and 0.6% [80].
Does economic condition relate to the development of renewable energy in a
country? The Environmental Kuznets Curve (EKC), a well-known curve in energy and
sustainability disciplines proposed by Kuznet (1955) (Figure 2.3), can be helpful to
indirectly answer this question. The curve shows the relationship between the economic
growth of a country and environmental quality. According to the EKC hypothesis, shown
as a horseshoe curve, in the early stages of per capita income growth, environmental
quality decreases. But, after some level of income per capita, the tendency reverses, so
that the environmental improvement follows high-income levels [81]. Based on this
concept, the relative level of environmental degradation of countries can be mapped
based on information about their economies [34].
Figure 2.2 Correlation of per capita energy consumption (in kg oil equivalent) and per capita GDP,
PPP (current international $). The graph is plotted based on data in 2014 from [76] [73] [77].
The relationship between the economy and renewable energy can be suggestive
given that the primary motivation to boost renewable energy worldwide is to tackle the

555225-L-sub01-bw-Kunaifi555225-L-sub01-bw-Kunaifi555225-L-sub01-bw-Kunaifi555225-L-sub01-bw-KunaifiProcessed on: 8-2-2021Processed on: 8-2-2021Processed on: 8-2-2021Processed on: 8-2-2021 PDF page: 63PDF page: 63PDF page: 63PDF page: 63
2 Energy in Indonesia: The Main Factors
27
apparent degradation in the global environment, particularly the issues of global
warming and climate change. The alarming climate condition of planet Earth due to the
exploitation of natural resources for energy generation can be considered as already
reaching the top of the curve, and therefore attempts to reduce it globally can be
referred to as the turning point of the curve [82]. After that, the use of renewable energy
should be kept stable or increased [75] along with stable growth in the economy.
The growth in renewable energy, especially solar and wind power, is an essential
factor in ensuring sustainable economic growth, contributing significantly to improving
the socio-economic condition of a country [83]. Economic opportunities exist at each
phase of the energy business chain. Starting from project planning, manufacturing
processes, installation, network construction, maintenance processes, to the end of the
project, all have positive economic and employment impacts.
Figure 2.3 Environmental Kuznets Curve (EKC) [84].
The economic strength of a country illustrates its ability to develop new sectors
such as renewable energy. However, economic power is not the sole success factor for
renewable energy development. GDP per capita is also important for renewable energy
technologies because it determines the purchasing power of individuals. Finally, the
state policy is also very decisive, whether it is positive, contradictory, or neutral in the
war against environmental damage, especially climate change.
22.4. Big Population with a Significant Demand for Energy
Indonesia is currently the fourth most populated country in the world after the US,
India, and China [85]. The total population in 2019 was 268 million [86]. Representing
40% of the total population of South-East Asian countries [87], Indonesia has a vital role
in shaping the population distribution of the ASEAN. The population distribution,
however, varies widely from one island to the other. Around 56% of the population
inhabits the island of Java alone, totaling 151 million people, while 21, 7, and 6% live on
Env
ironm
enta
l de
grad
atio
n
Per capita income
Turning point
Environment worsens
Environment improves

555225-L-sub01-bw-Kunaifi555225-L-sub01-bw-Kunaifi555225-L-sub01-bw-Kunaifi555225-L-sub01-bw-KunaifiProcessed on: 8-2-2021Processed on: 8-2-2021Processed on: 8-2-2021Processed on: 8-2-2021 PDF page: 64PDF page: 64PDF page: 64PDF page: 64
2 Energy in Indonesia: The Main Factors
28
the islands of Sumatra, Sulawesi, and Kalimantan, respectively. Ten percent of the
population lives in the rest of Indonesia, with a total area of 2,300,000 km2. As such,
Indonesia has large differences in population density.
In the province of West Java alone, around 49 million people live, which exceeds
the total population of the islands of Kalimantan, Sulawesi, Papua, Maluku Islands, and
ENT combined (about 49 million people). East Java follows as the second-most populous
province with 40 million, and Central Java thereafter with 35 million people. Jones [88]
predicted that by 2035, Indonesia would have an additional 67 million inhabitants
compared to the population in 2010, of which Java would contribute 30 million.
Although most of the population occupies the five major islands, a significant
number of people live on smaller islands that are mainly located in the eastern part of
Indonesia. In 2018, more than 13,000 (16%) of 82,030 villages in Indonesia were
categorized as undeveloped [89] because they were rural villages or settlements on
isolated islands with a lack of access to electricity [90]. Figure 2.4 shows the population
per province in millions of people.
Although the projected increase in the population looks massive, the rate of
population growth in the period 2010–2035 is estimated to decrease [88]. From 2010
to 2019, the national rate of population growth is 1.4%. By 2035, the population growth
would be around 0.6%, which is far less than the current level. Also, in line with the lower
level of population growth in Java and migration between regions, Java is projected to
experience a 2% population decline in 2035.
The province of Jakarta has a very dense population compared to other provinces,
with 15,900 people per km2, while West Java has 1,304 people per km2 [86]. However,
when compared with the most populated cities in the world, the population density in
Jakarta is far below Manila with 41,515 people per km2, and Mumbai with 28,508 people
per km2 [91]. The provinces of West Papua and North Kalimantan had the lowest
population density in Indonesia, with only 9 and 10 people per km2, respectively. The
national average population density in 2019 was 140 people per km2. To compare, Brazil,
the fifth most populous country, has a population density of only 25 people per km2 [92].
22.5. A Challenging Climate with Excellent Solar Energy Potential
Solar PV systems are part of a rapidly growing renewable energy technology which
is increasingly playing an important role in reducing dependence on conventional fossil
fuels for electricity generation. A PV system converts sunlight into direct current (d.c.)
electricity by using semiconductor solar cells wired to each other in PV modules. Multiple
modules can be connected to form a panel and combination of panels form an array,
which can be scaled up or down to produce the desired amount of power. Nowadays,
commercial PV modules such as silicon modules can convert up to 22.6% of the
incoming solar irradiance [93] and can last for 25 years, producing sustainable
electricity across the globe.
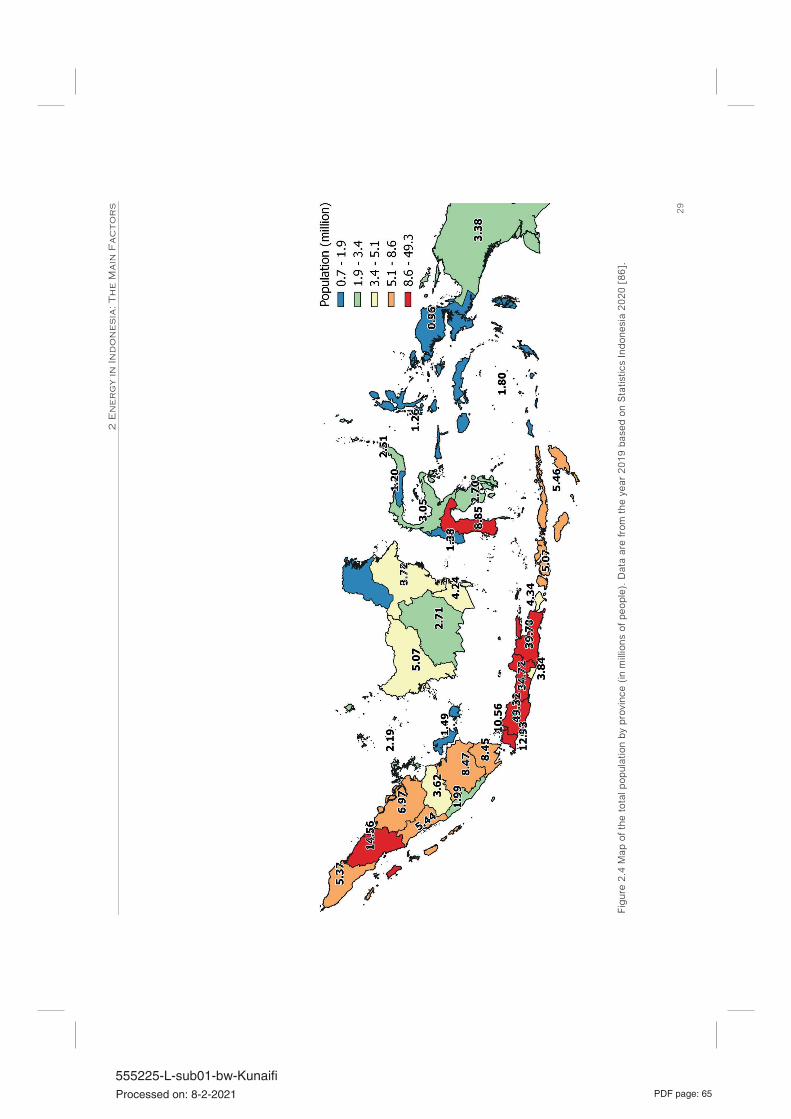
555225-L-sub01-bw-Kunaifi555225-L-sub01-bw-Kunaifi555225-L-sub01-bw-Kunaifi555225-L-sub01-bw-KunaifiProcessed on: 8-2-2021Processed on: 8-2-2021Processed on: 8-2-2021Processed on: 8-2-2021 PDF page: 65PDF page: 65PDF page: 65PDF page: 65
2 E
ne
rg
y in
In
do
ne
sia
: T
he
M
ain
F
ac
to
rs
29
Fig
ure
2.4
Ma
p o
f th
e to
tal p
opu
lati
on b
y p
rovi
nce
(in
mill
ion
s o
f p
eo
ple
). D
ata
are
fro
m t
he
year
20
19
bas
ed
on
Sta
tistic
s In
do
nesi
a 2
02
0 [
86
].
555225-L-sub01-bw-Kunaifi555225-L-sub01-bw-Kunaifi555225-L-sub01-bw-Kunaifi555225-L-sub01-bw-KunaifiProcessed on: 8-2-2021Processed on: 8-2-2021Processed on: 8-2-2021Processed on: 8-2-2021 PDF page: 66PDF page: 66PDF page: 66PDF page: 66
2 Energy in Indonesia: The Main Factors
30
The total global installed capacity of PV systems by the end of 2019 was around
635 GWp; 95% was crystalline silicon, with around 585 Terawatt-hour (TWh) electricity
production in 2018 [34]. Although the most commonly used materials today are from
the silicon family, other materials are being tested and used. These include gallium
arsenide (GaAs), hybrids, chalcogenides (e.g., cadmium telluride/CdTe, and copper
indium gallium selenide/CIGS), and other emerging photovoltaics (e.g., organic and
perovskite).
A typical PV system comprises an array made of solar panels, an inverter, and other
electrical hardware also called BOS. The two principal classifications of PV systems are
stand-alone and grid-connected systems. A stand-alone PV system independently
operates of a public grid and is generally sized and designed to meet certain a.c. or d.c.
loads.
The simplest form of a stand-alone PV system is a direct-coupled system, where
the d.c. output of a PV array is directly connected to a d.c. load. This type of system
may be combined with other generation technologies such as wind, engine-generator,
or utility power as an auxiliary power source to form a PV-hybrid system. Such flexibility
makes stand-alone PV systems suitable for powering houses and facilities in rural areas
or remote islands. For a country like Indonesia with many people living on remote islands,
stand-alone PV systems can play a role in increasing people’s access to electricity.
However, most people live in areas that are connected to a public grid. Therefore,
grid-connected PV systems are a more common application. A grid-connected PV
system operates in parallel and interconnected with the electric utility grid. It comprises
an inverter that converts the d.c. power from the PV array into a.c. power synchronized
with the voltage and power quality requirements of the utility grid. Grid-connected PV
systems automatically stop supplying power to the grid when the utility grid is not
energized for safety reasons.
Photovoltaic system performance is defined by the performance ratio (PR).
Specifically, the performance ratio is the ratio of the actual and theoretically possible
energy outputs of PV systems. Before 2000 a typical PR was about 70%, while today it
is in the range of 80–90% [94]. In a country like Indonesia where the grid can be weak
in some areas, and which is characterized by frequent outages and fluctuating voltage,
grid-connected PV systems could increase the reliability of electricity supply.
Solar irradiance is the main factor that determines the amount of electrical energy
that could be potentially produced by PV systems. As such, climatic conditions
determine the annual and seasonal performance of PV systems. These conditions are
location dependent. Although Indonesia has a rainy tropical climate in general, the
climate and weather across Indonesia are not uniform. The topography, orientation, and
structure of the islands are among the influencing factors that affect Indonesia’s climate
[95]. Its location around the equator and oceans that surround it means that the Asian
and Australian monsoons also influence Indonesia.
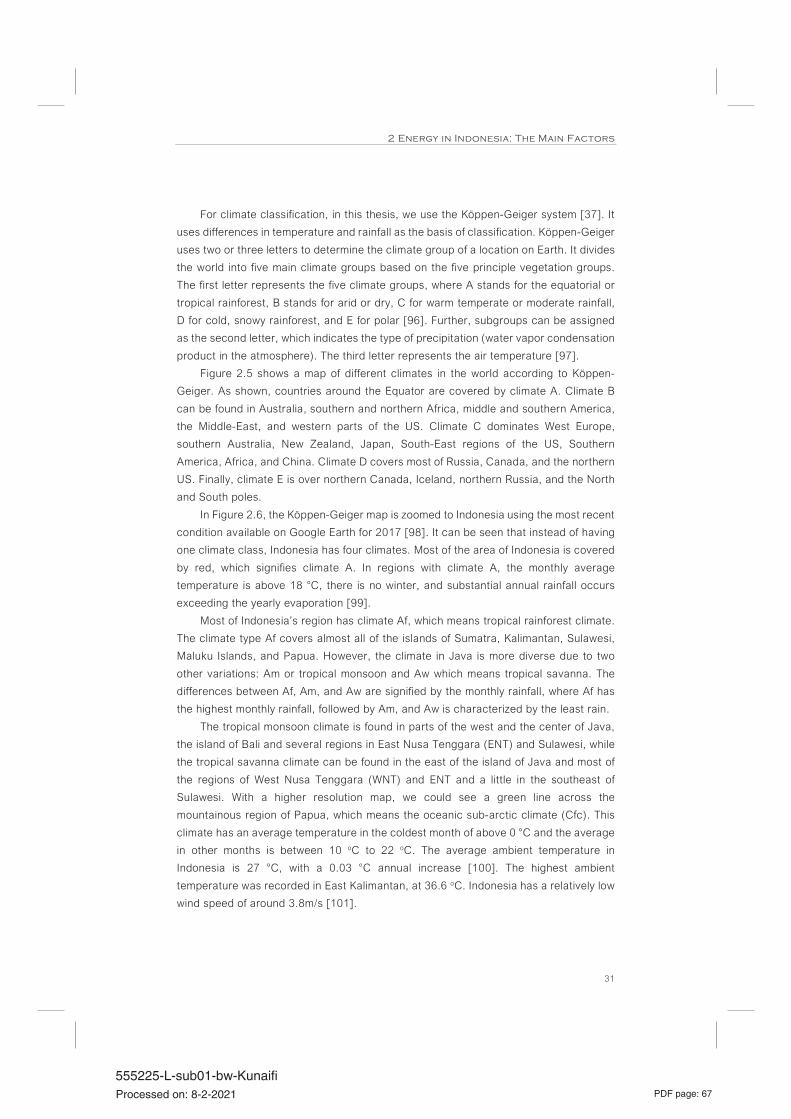
555225-L-sub01-bw-Kunaifi555225-L-sub01-bw-Kunaifi555225-L-sub01-bw-Kunaifi555225-L-sub01-bw-KunaifiProcessed on: 8-2-2021Processed on: 8-2-2021Processed on: 8-2-2021Processed on: 8-2-2021 PDF page: 67PDF page: 67PDF page: 67PDF page: 67
2 Energy in Indonesia: The Main Factors
31
For climate classification, in this thesis, we use the Köppen-Geiger system [37]. It
uses differences in temperature and rainfall as the basis of classification. Köppen-Geiger
uses two or three letters to determine the climate group of a location on Earth. It divides
the world into five main climate groups based on the five principle vegetation groups.
The first letter represents the five climate groups, where A stands for the equatorial or
tropical rainforest, B stands for arid or dry, C for warm temperate or moderate rainfall,
D for cold, snowy rainforest, and E for polar [96]. Further, subgroups can be assigned
as the second letter, which indicates the type of precipitation (water vapor condensation
product in the atmosphere). The third letter represents the air temperature [97].
Figure 2.5 shows a map of different climates in the world according to Köppen-
Geiger. As shown, countries around the Equator are covered by climate A. Climate B
can be found in Australia, southern and northern Africa, middle and southern America,
the Middle-East, and western parts of the US. Climate C dominates West Europe,
southern Australia, New Zealand, Japan, South-East regions of the US, Southern
America, Africa, and China. Climate D covers most of Russia, Canada, and the northern
US. Finally, climate E is over northern Canada, Iceland, northern Russia, and the North
and South poles.
In Figure 2.6, the Köppen-Geiger map is zoomed to Indonesia using the most recent
condition available on Google Earth for 2017 [98]. It can be seen that instead of having
one climate class, Indonesia has four climates. Most of the area of Indonesia is covered
by red, which signifies climate A. In regions with climate A, the monthly average
temperature is above 18 °C, there is no winter, and substantial annual rainfall occurs
exceeding the yearly evaporation [99].
Most of Indonesia’s region has climate Af, which means tropical rainforest climate.
The climate type Af covers almost all of the islands of Sumatra, Kalimantan, Sulawesi,
Maluku Islands, and Papua. However, the climate in Java is more diverse due to two
other variations: Am or tropical monsoon and Aw which means tropical savanna. The
differences between Af, Am, and Aw are signified by the monthly rainfall, where Af has
the highest monthly rainfall, followed by Am, and Aw is characterized by the least rain.
The tropical monsoon climate is found in parts of the west and the center of Java,
the island of Bali and several regions in East Nusa Tenggara (ENT) and Sulawesi, while
the tropical savanna climate can be found in the east of the island of Java and most of
the regions of West Nusa Tenggara (WNT) and ENT and a little in the southeast of
Sulawesi. With a higher resolution map, we could see a green line across the
mountainous region of Papua, which means the oceanic sub-arctic climate (Cfc). This
climate has an average temperature in the coldest month of above 0 °C and the average
in other months is between 10 oC to 22 oC. The average ambient temperature in
Indonesia is 27 °C, with a 0.03 °C annual increase [100]. The highest ambient
temperature was recorded in East Kalimantan, at 36.6 oC. Indonesia has a relatively low
wind speed of around 3.8m/s [101].

555225-L-sub01-bw-Kunaifi555225-L-sub01-bw-Kunaifi555225-L-sub01-bw-Kunaifi555225-L-sub01-bw-KunaifiProcessed on: 8-2-2021Processed on: 8-2-2021Processed on: 8-2-2021Processed on: 8-2-2021 PDF page: 68PDF page: 68PDF page: 68PDF page: 68
2 E
ne
rg
y in
In
do
ne
sia
: T
he
M
ain
F
ac
to
rs
32
Fig
ure
2.5
Wo
rld
ma
p o
f K
öpp
en-
Gei
ge
r cl
ima
te c
lass
ifica
tion
syst
em
[1
02
].
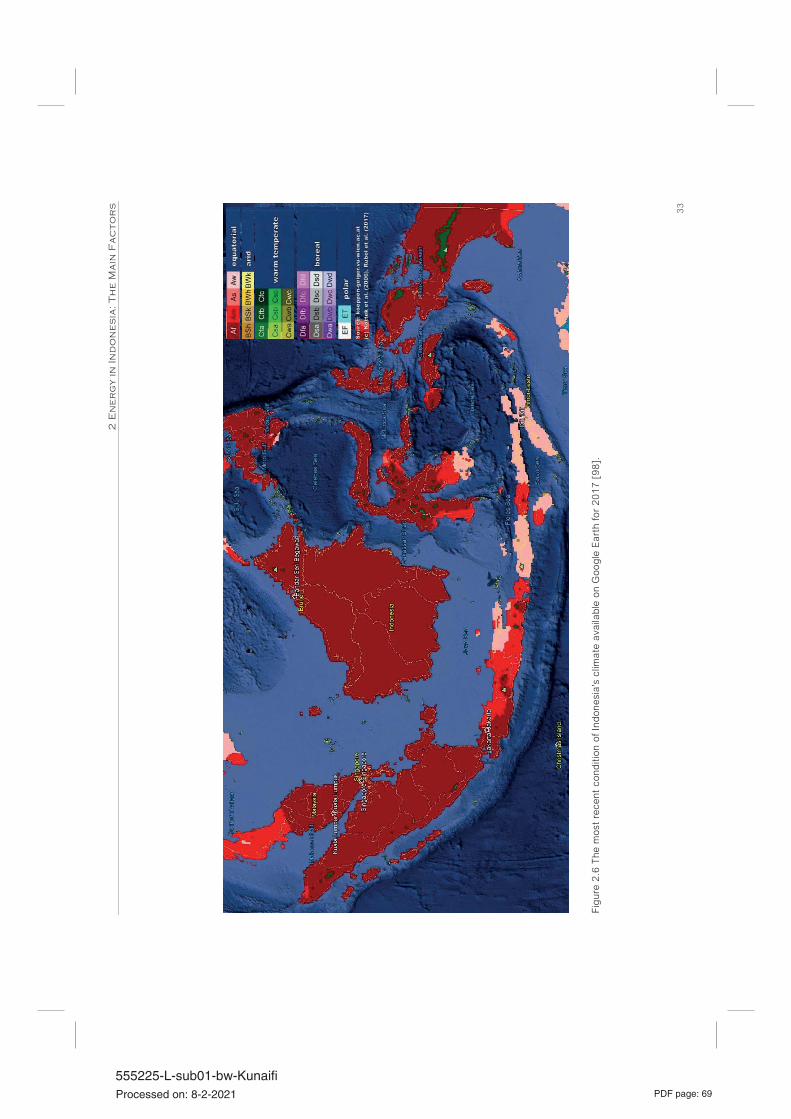
555225-L-sub01-bw-Kunaifi555225-L-sub01-bw-Kunaifi555225-L-sub01-bw-Kunaifi555225-L-sub01-bw-KunaifiProcessed on: 8-2-2021Processed on: 8-2-2021Processed on: 8-2-2021Processed on: 8-2-2021 PDF page: 69PDF page: 69PDF page: 69PDF page: 69
2 E
ne
rg
y in
In
do
ne
sia
: T
he
M
ain
F
ac
to
rs
33
Fig
ure
2.6
The
mos
t re
cent
co
nditi
on
of
Ind
ones
ia's
clim
ate
ava
ilab
le o
n G
oo
gle
Ea
rth
for
20
17
[9
8].
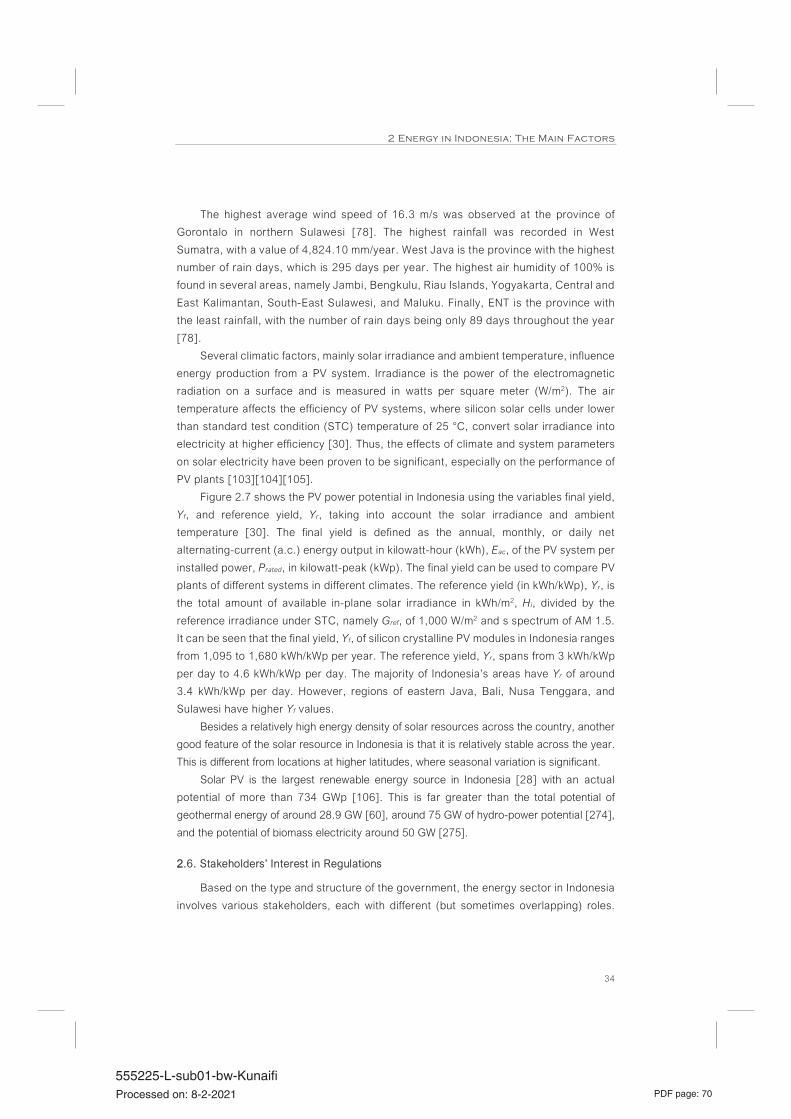
555225-L-sub01-bw-Kunaifi555225-L-sub01-bw-Kunaifi555225-L-sub01-bw-Kunaifi555225-L-sub01-bw-KunaifiProcessed on: 8-2-2021Processed on: 8-2-2021Processed on: 8-2-2021Processed on: 8-2-2021 PDF page: 70PDF page: 70PDF page: 70PDF page: 70
2 Energy in Indonesia: The Main Factors
34
The highest average wind speed of 16.3 m/s was observed at the province of
Gorontalo in northern Sulawesi [78]. The highest rainfall was recorded in West
Sumatra, with a value of 4,824.10 mm/year. West Java is the province with the highest
number of rain days, which is 295 days per year. The highest air humidity of 100% is
found in several areas, namely Jambi, Bengkulu, Riau Islands, Yogyakarta, Central and
East Kalimantan, South-East Sulawesi, and Maluku. Finally, ENT is the province with
the least rainfall, with the number of rain days being only 89 days throughout the year
[78].
Several climatic factors, mainly solar irradiance and ambient temperature, influence
energy production from a PV system. Irradiance is the power of the electromagnetic
radiation on a surface and is measured in watts per square meter (W/m2). The air
temperature affects the efficiency of PV systems, where silicon solar cells under lower
than standard test condition (STC) temperature of 25 °C, convert solar irradiance into
electricity at higher efficiency [30]. Thus, the effects of climate and system parameters
on solar electricity have been proven to be significant, especially on the performance of
PV plants [103][104][105].
Figure 2.7 shows the PV power potential in Indonesia using the variables final yield,
Yf, and reference yield, Yr, taking into account the solar irradiance and ambient
temperature [30]. The final yield is defined as the annual, monthly, or daily net
alternating-current (a.c.) energy output in kilowatt-hour (kWh), Eac, of the PV system per
installed power, Prated, in kilowatt-peak (kWp). The final yield can be used to compare PV
plants of different systems in different climates. The reference yield (in kWh/kWp), Yr, is
the total amount of available in-plane solar irradiance in kWh/m2, Hi, divided by the
reference irradiance under STC, namely Gref, of 1,000 W/m2 and s spectrum of AM 1.5.
It can be seen that the final yield, Yf, of silicon crystalline PV modules in Indonesia ranges
from 1,095 to 1,680 kWh/kWp per year. The reference yield, Yr, spans from 3 kWh/kWp
per day to 4.6 kWh/kWp per day. The majority of Indonesia’s areas have Yr of around
3.4 kWh/kWp per day. However, regions of eastern Java, Bali, Nusa Tenggara, and
Sulawesi have higher Yf values.
Besides a relatively high energy density of solar resources across the country, another
good feature of the solar resource in Indonesia is that it is relatively stable across the year.
This is different from locations at higher latitudes, where seasonal variation is significant.
Solar PV is the largest renewable energy source in Indonesia [28] with an actual
potential of more than 734 GWp [106]. This is far greater than the total potential of
geothermal energy of around 28.9 GW [60], around 75 GW of hydro-power potential [274],
and the potential of biomass electricity around 50 GW [275].
22.6. Stakeholders’ Interest in Regulations
Based on the type and structure of the government, the energy sector in Indonesia
involves various stakeholders, each with different (but sometimes overlapping) roles.

555225-L-sub01-bw-Kunaifi555225-L-sub01-bw-Kunaifi555225-L-sub01-bw-Kunaifi555225-L-sub01-bw-KunaifiProcessed on: 8-2-2021Processed on: 8-2-2021Processed on: 8-2-2021Processed on: 8-2-2021 PDF page: 71PDF page: 71PDF page: 71PDF page: 71
2 Energy in Indonesia: The Main Factors
35
Figure 2.8 maps the energy stakeholders in Indonesia according to their core, direct,
and indirect involvement using a PESTLE stakeholders’ mapping on renewable energy
[107] and an example of task distribution among the government institutions in energy
sector according to the General Plan for National Energy (RUEN) [107]. PESTLE is an
abbreviation, and it accounts for political, economic, social, technological, legal, and
environmental aspects.
As shown, the central government and national level institutions play the core role
in energy developments in Indonesia. Their roles include enacting policy, laws, and
regulations, and appointing institutions to implement the energy projects. Similarly, the
other central government institutions are directly involved with financial responsibility or
providing resources for the project implementation, such as land. In the implementation
stage, the private electricity company and local government are usually directly involved
in energy projects. Finally, indirect involvement is exercised by some other ministries,
the Indonesian Chamber of Commerce and Industry, non-profit organizations, and the
Corruption Eradication Commission. Depending on the type of project, the public is often
indirectly involved, although their direct involvement could also be seen in the
community-based energy projects.
The central government makes regulations that nationally apply, while local
governments can make regulations at the local level as long as they are not in
contradiction with national regulations. Legal products made by the central government
may include laws (UU), government regulations (PP), presidential regulations (Perpres),
presidential instructions (Inpres), presidential decrees (Kepres), ministerial regulations
(Permen), and ministerial decrees (Kepmen).
At the provincial level, legal products can take the form of regional regulations (Perda),
governor regulations (Pergub), and governor decrees (Kepgub). While at the district/city
level, regional regulations (Perda), regulations of regents/mayors (Perbup/Perwako), and
decrees of regents/mayors (Kepbup/Kepwako) can also be produced.
This leads to a lot of intertwined laws and regulations in Indonesian society. In the
following, we will focus on the specific situation of energy laws and regulations.
Law No. 30/2007 concerning energy serves as an umbrella for the energy sector in
Indonesia [107]. It contains the main aspects of regulating and managing energy and
energy sources. This law also mandates the formation of the National Energy Council
(DEN), which is assigned to formulate the National Energy Policy (KEN). At present,
KEN, along with other derivative regulations, will release a strategic plan for realizing the
national energy resilience and independence, which is named the General Plan for
National Energy (RUEN). The KEN is legalized by the government regulation number
79/2014 while RUEN is regulated in the presidential regulation number 22/2017. RUEN
is the foundation and central direction for the government in deciding existing policies,
including determining the roles of existing stakeholders.
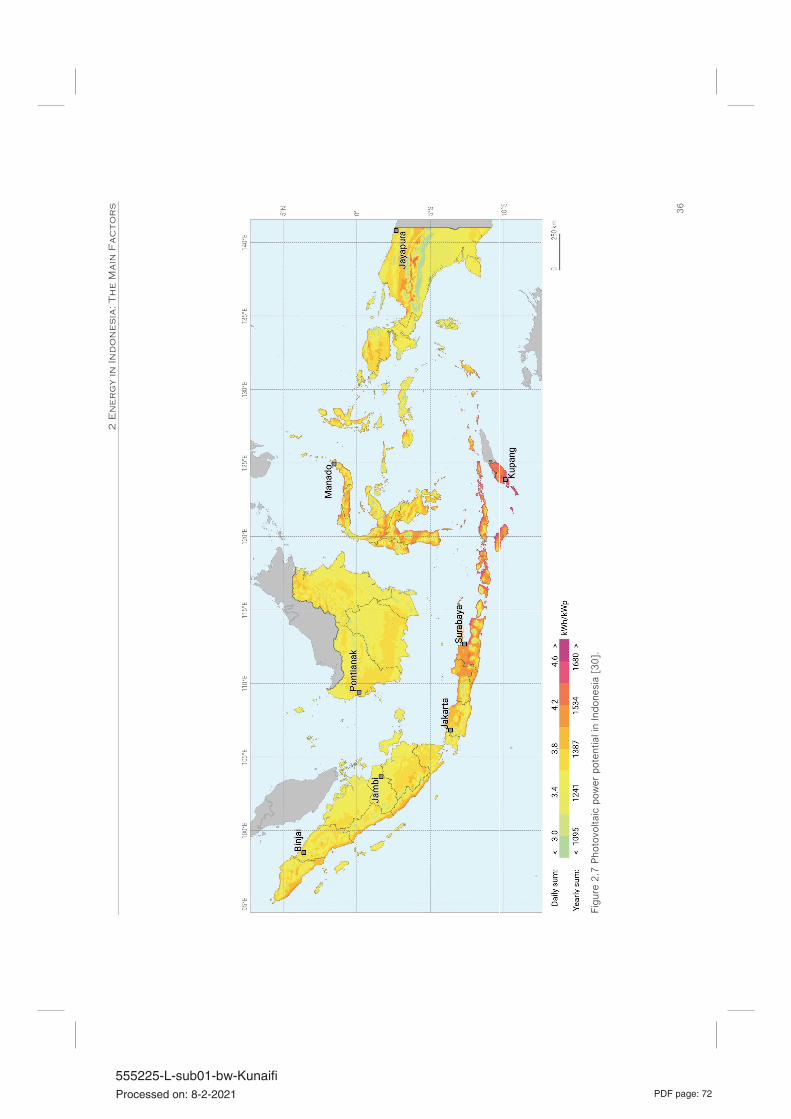
555225-L-sub01-bw-Kunaifi555225-L-sub01-bw-Kunaifi555225-L-sub01-bw-Kunaifi555225-L-sub01-bw-KunaifiProcessed on: 8-2-2021Processed on: 8-2-2021Processed on: 8-2-2021Processed on: 8-2-2021 PDF page: 72PDF page: 72PDF page: 72PDF page: 72
2 E
ne
rg
y in
In
do
ne
sia
: T
he
M
ain
F
ac
to
rs
36
Fig
ure
2.7
Ph
otov
olta
ic p
ower
pot
ent
ial i
n In
do
nesi
a [3
0].

555225-L-sub01-bw-Kunaifi555225-L-sub01-bw-Kunaifi555225-L-sub01-bw-Kunaifi555225-L-sub01-bw-KunaifiProcessed on: 8-2-2021Processed on: 8-2-2021Processed on: 8-2-2021Processed on: 8-2-2021 PDF page: 73PDF page: 73PDF page: 73PDF page: 73
2 Energy in Indonesia: The Main Factors
37
Figure 2.8 Map of energy stakeholders in Indonesia based on the example of PESTLE
stakeholders map in renewable energy in Indonesia [107] and the example of task distribution among
the government institutions in the energy sector according to RUEN [107].
According to RUEN, stakeholders in the energy sector comprise multiple parties.
First, the state’s ministry/non-ministerial institutions, who must take RUEN as a guide in
strategic planning. Secondly, the provincial governments formalize the derivative of
RUEN, namely the Regional-Provincial General Energy Plan (RUEDP). Finally, apart from
government institutions, there are important stakeholders in the energy sector, such as
academic and research institutions, industries, and non-profit organizations.
The National Energy Policy (KEN), which was made in 2014, has four main policies
and six supporting policies. The main policies include energy availability for the national
needs, priority for energy development, utilization of national energy resources, and
domestic energy reserves. The six supporting policies include the following:
1. Energy conservation, energy resource conservation, and energy diversification;
2. Environment and safety;
3. Prices, subsidies, and energy incentives;
4. Infrastructure and access for the community and industry to energy;
5. Research, development, and application of energy technologies; and
6. Institutions and funding.
CCORE
President, DPR
Commission VII, Ministry of ESDM, DEN, Ministry of Finance, Ministry of
State-Owned Enterprises, PLN
IINDIRECT
DIRECT

555225-L-sub01-bw-Kunaifi555225-L-sub01-bw-Kunaifi555225-L-sub01-bw-Kunaifi555225-L-sub01-bw-KunaifiProcessed on: 8-2-2021Processed on: 8-2-2021Processed on: 8-2-2021Processed on: 8-2-2021 PDF page: 74PDF page: 74PDF page: 74PDF page: 74
2 Energy in Indonesia: The Main Factors
38
The Ministry of Energy and Mineral Resources (MEMR) is the leading institution that
oversees the energy sector. It coordinates the current strategies, programs, and
activities to produce related instruments. For example, MEMR is responsible for
prioritizing energy development by putting more focus on local energy resources to
increase the use of new and renewable energy (NRE). Therefore, MEMR can be very
influential in renewable energy development, as will be discussed in Chapter 3. Other
ministries are also involved in energy development, either directly or indirectly.
In addition to the above list of stakeholders, there are many other parties, such as
technical consultants, service providers, associations, goods procurement services, and
financial institutions which play a role in the Indonesian energy sector.
From the research domain, academics, non-profit institutions, and industry become
indispensable stakeholders in the energy sector. At present, various national and
international research institutions continue to provide and publish consultancies,
guidelines, and suggestions. Big names like the International Renewable Energy Agency
(IRENA), the Institute for Essential Services Reform (IESR), the World Bank, and the
Indonesian Institute for Energy Economics (IIEE) continue to provide their perspectives
and research outcomes to improve Indonesia’s performance in the energy sector.
Academic publications from various universities in Indonesia and abroad are also critical
in the research domain.
Some regulations regarding renewable energy tariffs and subsidies were introduced
during recent years. The latest regulation is the Ministry of MEMR Regulation No.
49/2018, which allows customers of PLN, the national utility company, to install and
operate a rooftop PV system for their own use and ‘sell’ excess energy to PLN under a
net metering scheme. However, a 35% discount on the total exported energy is applied.
For rooftop PV systems that belong to industrial entities, a parallel operation charge
must be paid to PLN consisting of a connection charge, energy charge, and a capacity
charge. The charges are based on a minimum monthly take or pay obligation of 40 h.
The Association of Rooftop PV System Users (PPLSA) complained about this regulation
which, according to them, hampers the development of rooftop PV in Indonesia [108].
22.7. Conclusions
Indonesia is a large country with significant variations in climate, population, and
economy. These factors introduce challenges in power supply systems in Indonesia as
well as open great opportunities for renewable energy development in general and solar
energy in particular. Most people in Indonesia live on the five big islands, but a significant
population can also be found on the thousands of other smaller islands. Owing to
remoteness, it is often difficult and expensive to provide electricity for them by
connection to the main grids. Given the size of Indonesia, which covers three time zones,
the distribution of wealth and electricity infrastructure is uneven. The western and
central regions are relatively more advanced than the eastern region.
555225-L-sub01-bw-Kunaifi555225-L-sub01-bw-Kunaifi555225-L-sub01-bw-Kunaifi555225-L-sub01-bw-KunaifiProcessed on: 8-2-2021Processed on: 8-2-2021Processed on: 8-2-2021Processed on: 8-2-2021 PDF page: 75PDF page: 75PDF page: 75PDF page: 75
2 Energy in Indonesia: The Main Factors
39
A growing economy and large population can be translated into a big market for
renewable energy technologies. A good solar energy resource, when combined with the
right approach, could open a great opportunity for large-scale or even domestic scale
PV system businesses. The government is on the right track with a plan towards a higher
fraction of renewable energy in its energy mix policy. Some regulations already exist as
a basis for further improvements. However, the role of the central government in the
development of the energy sector is too big, which is not favorable for building local and
sectoral capacity beyond the central government.
Work remains to be done at the implementation level. Indonesia needs to include
all potential and current stakeholders in a correct strategy that is beneficial to all. The
central government holds important roles in initiating the changes, for example by
decentralizing the energy sector to local entities.

555225-L-sub01-bw-Kunaifi555225-L-sub01-bw-Kunaifi555225-L-sub01-bw-Kunaifi555225-L-sub01-bw-KunaifiProcessed on: 8-2-2021Processed on: 8-2-2021Processed on: 8-2-2021Processed on: 8-2-2021 PDF page: 76PDF page: 76PDF page: 76PDF page: 76
2 Energy in Indonesia: The Main Factors
40

555225-L-sub01-bw-Kunaifi555225-L-sub01-bw-Kunaifi555225-L-sub01-bw-Kunaifi555225-L-sub01-bw-KunaifiProcessed on: 8-2-2021Processed on: 8-2-2021Processed on: 8-2-2021Processed on: 8-2-2021 PDF page: 77PDF page: 77PDF page: 77PDF page: 77
2 Energy in Indonesia: The Main Factors
41
Challenges of
Electricity Supply
This Chapter is based on “Kunaifi, K.; Veldhuis, A.J.; Reinders, A.H.M.E. The Electricity Grid in Indonesia: The Experiences of End-users and Their Attitudes Toward Solar Photovoltaics; Springer: Cham, Switzerland, 2020; Chapter 2: Status and Challenges of Electricity Supply. Springer, pp. 21-36, ISBN 978-3-030-38341-1.”

555225-L-sub01-bw-Kunaifi555225-L-sub01-bw-Kunaifi555225-L-sub01-bw-Kunaifi555225-L-sub01-bw-KunaifiProcessed on: 8-2-2021Processed on: 8-2-2021Processed on: 8-2-2021Processed on: 8-2-2021 PDF page: 78PDF page: 78PDF page: 78PDF page: 78
2 Energy in Indonesia: The Main Factors
42
555225-L-sub01-bw-Kunaifi555225-L-sub01-bw-Kunaifi555225-L-sub01-bw-Kunaifi555225-L-sub01-bw-KunaifiProcessed on: 8-2-2021Processed on: 8-2-2021Processed on: 8-2-2021Processed on: 8-2-2021 PDF page: 79PDF page: 79PDF page: 79PDF page: 79
43
CChapter 3. Challenges of
Electricity Supply
3.1. Introduction
In this chapter, we will first present the general status of the energy supply and
demand in Indonesia followed by that of the electricity sector specifically. Next, we will
discuss various challenges in providing proper electrical power supply to the whole
population. For this purpose, we evaluate the gaps or disparities in power services from
one region to another, the level of electricity consumption, and the possible impact of
the current power development strategy on climate change. Then, we present power
supply systems and businesses in Indonesia and discuss the role of PLN, the national
utility company. Finally, the status of renewable implementation will be discussed with
particular attention to PV systems. Along with this, we argue that government regulations
influence the rise and fall of renewables in Indonesia. This chapter will close with
conclusions.
3.2. Status of Energy Supply and Fossil Fuel Resources
The total final energy consumption (TFC) in Indonesia has increased by 41%, from
104 million tonnes of oil equivalent (Mtoe) in 2009 to 147 Mtoe in 2019 [109]. To give a
context to the size of Indonesia’s TFC for 2019, it was equivalent to around 11% of the
TFC of the 27 European Union member countries in 2018 [110]. The calculation of
Indonesia’s TFC, however, does not include heat, biofuel, waste, and non-hydro
renewables, while the TFC of the EU countries includes almost all types of energy
resources.
From 2009 to 2019, the primary energy supply for Indonesia was dominated by fossil
fuels [109]. The supply of oil increased from 70 Mtoe in 2009 to 80 Mtoe in 2019, with an
annual growth rate of 1.9%. In 2009, coal contributed 35 Mtoe, which increased by 85
Mtoe in 2019. Similarly, the share of natural gas grew 1.5% per year during the same
period. In 2019, the proven reserves of fossil fuels were high. They covered 37.6 billion
tonnes of coal, 2.5 billion barrels of oil, and 50 Trillion cubic feet (TSCF) of natural gas.
Therefore, Indonesia strongly exploits fossil fuels and is a net exporter of coal and natural
gas. Indonesia’s coal production increased from 256 million tonnes in 2009 to 616 million
tonnes in 2019, most of which was exported. In contrast, oil production during the same
period decreased from 346 million barrels in 2009 to 272 million barrels in 2019. Similarly,
natural gas production decreased from 2.125 TSCF in 2009 to 1.962 TSCF in 2019.

555225-L-sub01-bw-Kunaifi555225-L-sub01-bw-Kunaifi555225-L-sub01-bw-Kunaifi555225-L-sub01-bw-KunaifiProcessed on: 8-2-2021Processed on: 8-2-2021Processed on: 8-2-2021Processed on: 8-2-2021 PDF page: 80PDF page: 80PDF page: 80PDF page: 80
3 Challenges of Electricity Supply
44
If there are no discoveries of new reserves of fossil fuels in the forthcoming period,
we can estimate how long fossil fuel mining will last in Indonesia (Table 3.1). Assuming
that coal mining would experience an annual production growth of 9.66% from 2020
onward, which is the average growth rate for the past ten years (Scenario A), its reserve
would last for 20 years. However, if the present Reserve/Production (R/P) ratio is used
(Scenario B), coal reserves would be depleted within 61 years. Using the same
approach, natural gas would be completely depleted in 19 years assuming an annual
production growth of -0.75% from 2020 onwards, or 17 years assuming the present R/P
ratio. The oil reserve depletion rate can only be calculated using the present R/P ratio,
which shows that Indonesia would already be running out of oil in 9 years’ time, that is
to say before 2030.
Table 3.1 Indonesia’s fossil fuel reserves and scenarios for the time remaining for mining.
FFuel 2019
reserve*
Average
production
growth in the
past 10 years (%)
2019
production*
No. of years until
completely depleted
Scenario
A
Scenario
B
Coal 37,604 9.66 616 20 61
Oil 2,480 -2.339 272 - 9
Natural gas 50 -0.750 2.8 19 17
*Coal reserve is shown in millions of tonnes, oil in millions of barrels, and natural gas in millions of TSCF.
3.3. Challenges in Electricity Supply
Electricity consumption is an important factor in a country’s national development
and economic growth [111]. Moreover, it is an essential element for transforming
economic structures and improving people’s welfare [112]. Therefore, according to
existing patterns, electricity consumption in Indonesia is rapidly increasing in line with
economic growth [111] and population growth [113]. At present, Indonesia is still
facing challenges in providing a proper electrical power supply to the whole
population. The annual growth of electricity demand in Indonesia is 6% per year. The
total electricity demand in 2017 was 223 TWh, and is projected to reach 1,767 TWh
by 2050, [114] or around 40.7% of the projected electricity consumption in all EU
countries in 2050 [115].
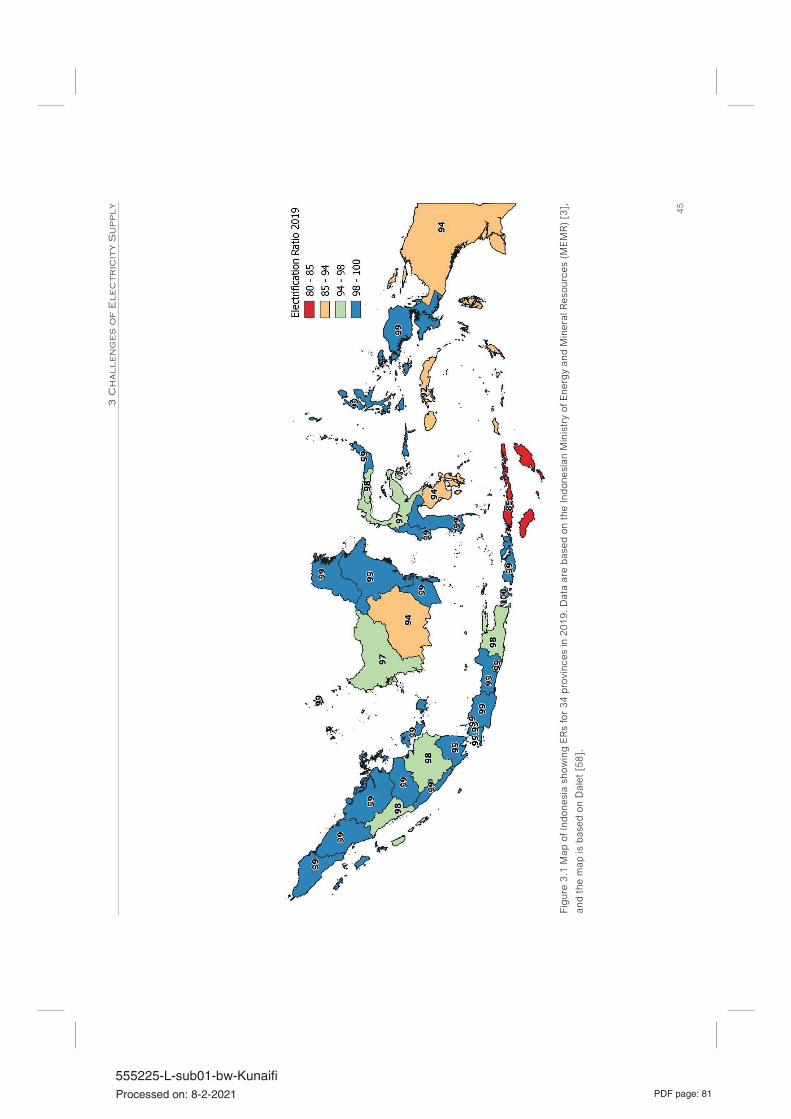
555225-L-sub01-bw-Kunaifi555225-L-sub01-bw-Kunaifi555225-L-sub01-bw-Kunaifi555225-L-sub01-bw-KunaifiProcessed on: 8-2-2021Processed on: 8-2-2021Processed on: 8-2-2021Processed on: 8-2-2021 PDF page: 81PDF page: 81PDF page: 81PDF page: 81
3 C
ha
ll
en
ge
s o
f E
le
ct
ric
it
y S
up
pl
y
45
Fig
ure
3.1
Ma
p o
f In
do
nesi
a sh
ow
ing
ER
s fo
r 3
4 p
rovi
nces
in 2
01
9.
Dat
a ar
e b
ase
d o
n th
e In
don
esi
an M
inis
try
of E
nerg
y a
nd
Min
era
l Re
sou
rces
(M
EM
R)
[3],
an
d t
he m
ap
is b
ase
d o
n D
ale
t [5
8].
555225-L-sub01-bw-Kunaifi555225-L-sub01-bw-Kunaifi555225-L-sub01-bw-Kunaifi555225-L-sub01-bw-KunaifiProcessed on: 8-2-2021Processed on: 8-2-2021Processed on: 8-2-2021Processed on: 8-2-2021 PDF page: 82PDF page: 82PDF page: 82PDF page: 82
3 Challenges of Electricity Supply
46
33.3.1. Regional Differences
Still, in 2019, 1.11% of the Indonesian population remained without electricity
services [3]. The electrification ratio, ER, is the number of households with access to
electricity divided by the total number of households in the study area, such as a
province or a country. The number of people without electricity supply in Indonesia was
equal to approximately 3 million people5, which is more than half of the total population
of Singapore in 2019 [116].
In 2019, the electrification ratio of the provinces ranged from 85% to 99% which
was more uniform compared to that in 2017. In 2017, the differences in ER among the
provinces were enormous. By the end of 2017, the overall ER in Indonesia was 95.4%,
which ranged from the lowest value of 59.9% in ENT, the average value of around
90.7%, to the highest value of 99.9% in some provinces in Java and Sumatra (Figure
3.1). Even, in a large city like Jakarta, some households in the islands and slums lack
access to electricity due to poverty.
The method used by the Indonesian Government for the calculation of the ER,
however, can be made more accurate by redefining the term ‘household with electricity.’
Now, as long as a house has an electricity supply, no matter if it is only enough to turn
on a small lamp, it is classified as a household with electricity. This is the case in Papua
and West Papua. In these provinces, a significant number of households participated in
an energy-efficient solar lamp (EESL) project in 2018. This project increased the ER of
West Papua by 2.6% from 95.7% in 2017 to 99% in 2019, while the ER of Papua
increased by 25.6% from 61.4% in 2017 to 90% in 2018 [66][117]. The sustainability of
the EESL project has not been evaluated yet. Once a household received an EESL, it
was registered as a household with electricity, irrespective of whether the lamps remain
working or not at the present time. It would therefore be useful to redefine the criteria
for households with electricity. For instance, a home is considered to have electricity if
it meets an annual lower limit of electrical energy consumption, a minimum power need,
or involvement in grid connectivity or diesel gensets.
A big gap in supply distribution characterizes access to electricity across Indonesia.
Java and Bali are the most densely populated islands in Indonesia, as well as the centers
for industry and critical economic activities. In 2019, 58% of Indonesia’s population lived
in Java and Bali, and around 65% of the national generation capacity of 62.8 GW (i.e.
41 GW) supplied Java’s and Bali’s demands only. On the contrary, Sumatra’s generation
capacity was 12.6 GW out of the total 62.8 GW, and the remaining 15% of the national
generation capacity was located in the other two-thirds of Indonesia’s area. Similarly, of
the electricity produced in 2019, approximately 73% was sold in Java and Bali, 14% in
5 For this estimation, we assume that the percentage of households without access to electricity
corresponds linearly to the percentage of the population without electricity.
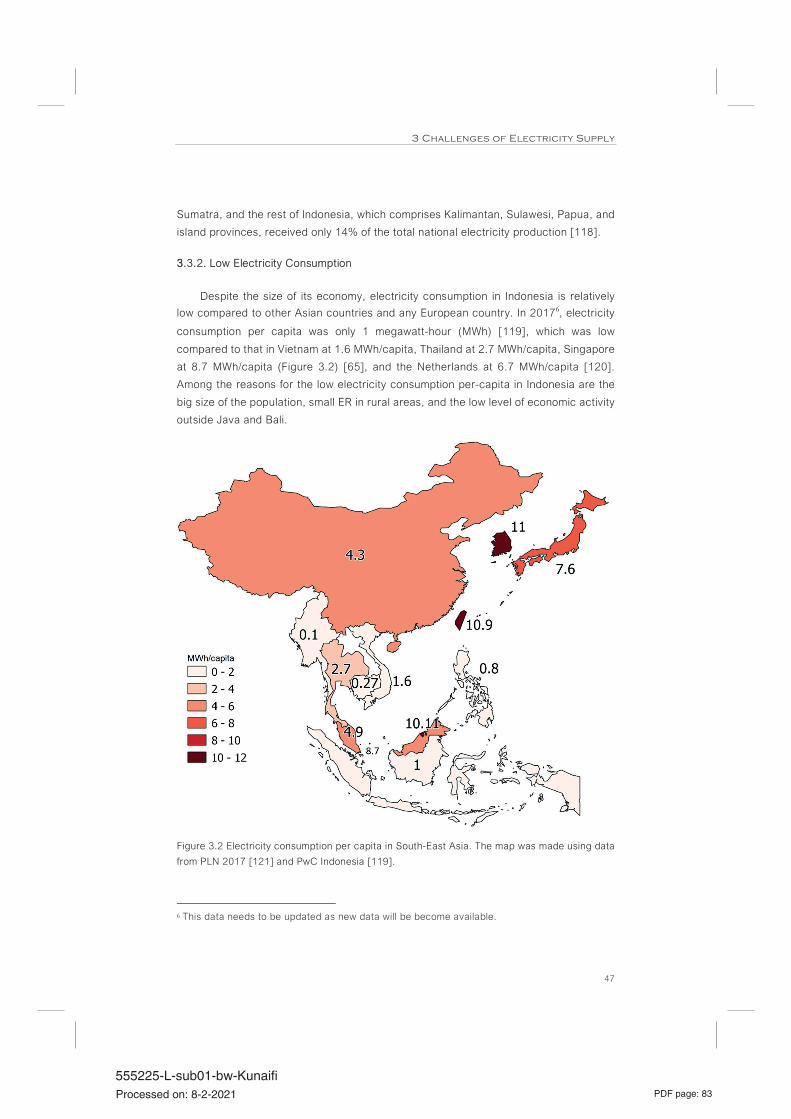
555225-L-sub01-bw-Kunaifi555225-L-sub01-bw-Kunaifi555225-L-sub01-bw-Kunaifi555225-L-sub01-bw-KunaifiProcessed on: 8-2-2021Processed on: 8-2-2021Processed on: 8-2-2021Processed on: 8-2-2021 PDF page: 83PDF page: 83PDF page: 83PDF page: 83
3 Challenges of Electricity Supply
47
Sumatra, and the rest of Indonesia, which comprises Kalimantan, Sulawesi, Papua, and
island provinces, received only 14% of the total national electricity production [118].
33.3.2. Low Electricity Consumption
Despite the size of its economy, electricity consumption in Indonesia is relatively
low compared to other Asian countries and any European country. In 20176, electricity
consumption per capita was only 1 megawatt-hour (MWh) [119], which was low
compared to that in Vietnam at 1.6 MWh/capita, Thailand at 2.7 MWh/capita, Singapore
at 8.7 MWh/capita (Figure 3.2) [65], and the Netherlands at 6.7 MWh/capita [120].
Among the reasons for the low electricity consumption per-capita in Indonesia are the
big size of the population, small ER in rural areas, and the low level of economic activity
outside Java and Bali.
Figure 3.2 Electricity consumption per capita in South-East Asia. The map was made using data
from PLN 2017 [121] and PwC Indonesia [119].
6 This data needs to be updated as new data will be become available.

555225-L-sub01-bw-Kunaifi555225-L-sub01-bw-Kunaifi555225-L-sub01-bw-Kunaifi555225-L-sub01-bw-KunaifiProcessed on: 8-2-2021Processed on: 8-2-2021Processed on: 8-2-2021Processed on: 8-2-2021 PDF page: 84PDF page: 84PDF page: 84PDF page: 84
3 Challenges of Electricity Supply
48
An increase in the business and industry consumers leads to the projected growth
of electricity demand of around 5.8% per year [118]. The emerging economies need
electricity to build their industrial and business infrastructures, while the developed
countries will have better opportunities to apply new energy-efficient technologies in
their industries [122]. Therefore, as shown in Figure 3.3, Indonesia and Vietnam for
example, as emerging economies, have high electricity and GDP growth compared to
Singapore and Australia, as developed countries. Australia even showed negative
growth in electricity demand in 2015, although its GDP grew.
33.3.3. The Price Disparity Between Urban and Rural Areas
The price of electrical energy in Indonesia’s main islands significantly differs from
those in smaller islands. Since the end of 2017, the household electricity tariff provided
by PLN, the national state utility company, is IDR1,352/kWh (≈ US$9 cent/kWh) [123].
Despite an official flat electricity price, electricity generated by diesel generators on
smaller islands cost IDR2,730/kWh (≈US$39 cent/kWh in 2018) [124]. These are typical
values for diesel generators that normally run less than 12 h per day [125], mainly due
to fuel combustion. Thus, the electricity supply outside Indonesia’s main islands remains
expensive.
Figure 3.3 Comparison between the increase in the average electricity consumption (left) and an
increase in GDP in 2015 (right). Graphics are based on IEA 2017 [120], OECD Development
Centre 2015 [126], and The World Bank 2017 [71].
3.3.4. Imbalance in Power Sale
Most of the electricity sales take place in Java, with a figure of 2.6 times higher than
for all other regions outside Java combined [118]. By customer group, households form
the largest category, using 42% of the total generated electricity, followed by industry
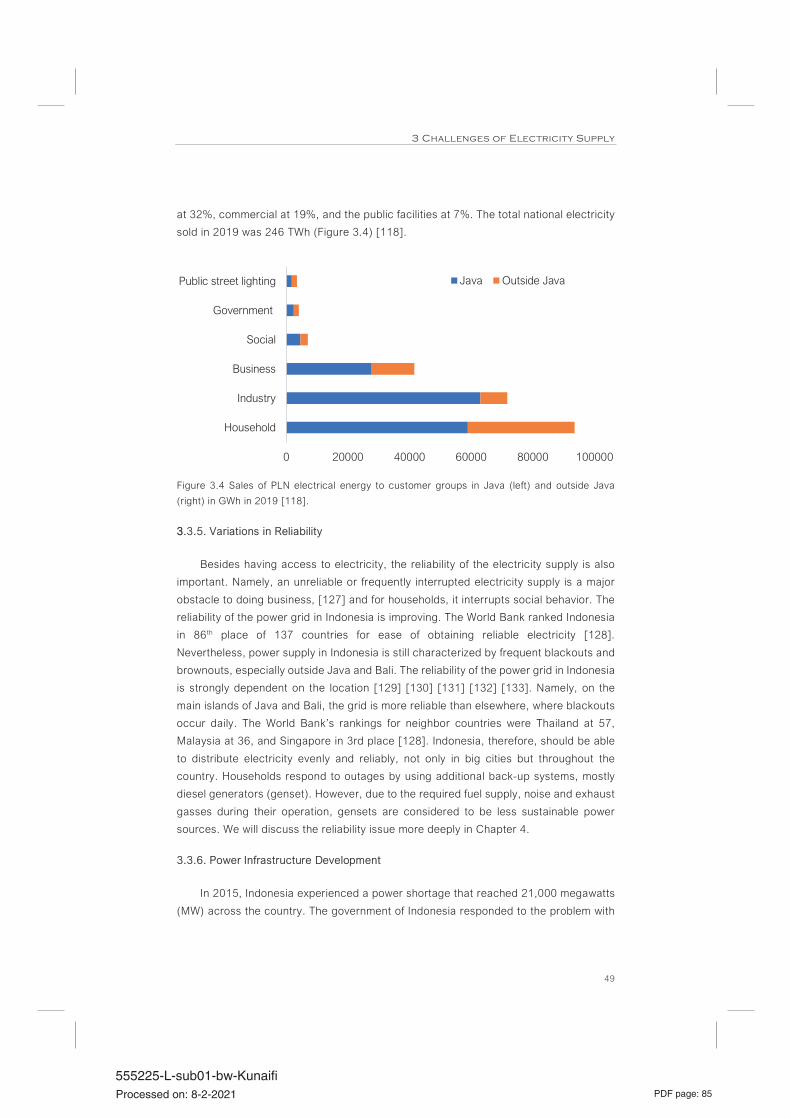
555225-L-sub01-bw-Kunaifi555225-L-sub01-bw-Kunaifi555225-L-sub01-bw-Kunaifi555225-L-sub01-bw-KunaifiProcessed on: 8-2-2021Processed on: 8-2-2021Processed on: 8-2-2021Processed on: 8-2-2021 PDF page: 85PDF page: 85PDF page: 85PDF page: 85
3 Challenges of Electricity Supply
49
at 32%, commercial at 19%, and the public facilities at 7%. The total national electricity
sold in 2019 was 246 TWh (Figure 3.4) [118].
Figure 3.4 Sales of PLN electrical energy to customer groups in Java (left) and outside Java
(right) in GWh in 2019 [118].
33.3.5. Variations in Reliability
Besides having access to electricity, the reliability of the electricity supply is also
important. Namely, an unreliable or frequently interrupted electricity supply is a major
obstacle to doing business, [127] and for households, it interrupts social behavior. The
reliability of the power grid in Indonesia is improving. The World Bank ranked Indonesia
in 86th place of 137 countries for ease of obtaining reliable electricity [128].
Nevertheless, power supply in Indonesia is still characterized by frequent blackouts and
brownouts, especially outside Java and Bali. The reliability of the power grid in Indonesia
is strongly dependent on the location [129] [130] [131] [132] [133]. Namely, on the
main islands of Java and Bali, the grid is more reliable than elsewhere, where blackouts
occur daily. The World Bank’s rankings for neighbor countries were Thailand at 57,
Malaysia at 36, and Singapore in 3rd place [128]. Indonesia, therefore, should be able
to distribute electricity evenly and reliably, not only in big cities but throughout the
country. Households respond to outages by using additional back-up systems, mostly
diesel generators (genset). However, due to the required fuel supply, noise and exhaust
gasses during their operation, gensets are considered to be less sustainable power
sources. We will discuss the reliability issue more deeply in Chapter 4.
3.3.6. Power Infrastructure Development
In 2015, Indonesia experienced a power shortage that reached 21,000 megawatts
(MW) across the country. The government of Indonesia responded to the problem with
0 20000 40000 60000 80000 100000
Household
Industry
Business
Social
Government
Public street lighting Java Outside Java
555225-L-sub01-bw-Kunaifi555225-L-sub01-bw-Kunaifi555225-L-sub01-bw-Kunaifi555225-L-sub01-bw-KunaifiProcessed on: 8-2-2021Processed on: 8-2-2021Processed on: 8-2-2021Processed on: 8-2-2021 PDF page: 86PDF page: 86PDF page: 86PDF page: 86
3 Challenges of Electricity Supply
50
the “35,000 MW Power Plant Development Program”. The program consists of the
construction of 109 new power plants totaling 35,627 MW, 48,000 network kilometer
(kms) transmission lines, and 114,000 megavolt ampere (MVA) sub-stations [134]. Fifty-
nine projects would be constructed on Sumatra, 34 projects on Java, 49 projects on
Sulawesi, 34 projects on Kalimantan, and 34 projects in Eastern Indonesia. After the
successful completion of the 35 GW program, the power shortage problem in Indonesia
should be completely solved. The duration of the program was set at five years starting
from 2015.
33.3.7. Electrification Versus Climate Change Mitigation
Like many other countries, fossil-fueled power generation has dominated the
electricity system in Indonesia. Until 2040, Indonesia is expected to remain to be a
coal-dependent country [135,136]. While the GHG emissions were supposed to be
reduced in Indonesia, carbon dioxide (CO2) emissions from fuel combustion have
increased by 34% from 340 Megatonnes (Mt) in 2006 to 455 Mt in 2016, with average
annual growth of 3% [137]. The 35 GW program consists of around 20 GW [138] of
coal-powered plants that are predicted to emit more than 10 Megatonnes CO2-
equivalents each year or a cumulative amount of 1.4 Gigatonnes CO2-equivalents until
2035 [139].
The completion of 35 GW program which was originally targeted in 2019 has been
delayed. As of September 2020, only 8,400 MW of new power plants has gone online
which is around 24% of the total targeted generation capacity [140]. Therefore, the
government has set a new target date of completion, either 2029 or the ultimate deadline
of 2049 [141].
3.4. Indonesia’s Electric Power System
3.4.1. PLN’s State Monopoly
Perusahaan Listrik Negara or PLN owns and operates most of Indonesia’s public
power infrastructure. PLN is a state-owned enterprise. As the dominant player in
Indonesia’s power sector, PLN occupies almost all electricity business chains from
electricity generation, transmission, distribution, to retail sales. The only link in the chain
that the private sector can contribute is the generation sector. However, the share of
the private sector is very small compared to PLN’s generation capacity.
By the end of December 2019, the value of PLN’s assets was around US$122 billion
[142]. The total installed capacity of PLN’s power generation was 43.9 GW from 5,987
power plants. Around 69.2% of power plants were located in Java. Adding to its power
plants, PLN rented a total capacity of 1.8 GW. The share of private electricity companies
or independent power producers (IPP) was 30% of the total national generation capacity
of 63 GW. Two of the largest IPP are subsidiaries of PLN itself, i.e. Indonesia Power with

555225-L-sub01-bw-Kunaifi555225-L-sub01-bw-Kunaifi555225-L-sub01-bw-Kunaifi555225-L-sub01-bw-KunaifiProcessed on: 8-2-2021Processed on: 8-2-2021Processed on: 8-2-2021Processed on: 8-2-2021 PDF page: 87PDF page: 87PDF page: 87PDF page: 87
3 Challenges of Electricity Supply
51
a total installed capacity of 15.6 GW [143] and PJB with a total installed capacity of 8
GW in 2019 [144].
In 2019, PLN owns a total transmission network of nearly 59,000 kilometer-lines
(kms) and distribution network (DN) of more than 1 million kms. The installed capacity
of transmission substation transformers was 114,000 MVA in 2,123 substations. The
installed capacity of distribution transformer substations was nearly 60,000 MVA in
508,049 units [118].
In 2019, the total operating income of PLN was US$22 billion of which the electricity
sales contribution was 96.65%, connection fees were 2.43% and other operating
revenues 0.93%. PLN’s coal-intensive growth plan exposes it to long-term financial risks
that can be solved only by higher tariffs or long-term, and large, subsidies from the
Indonesian government [145]. The government-subsidized PLN by around US$4 billion
in 2019.
The number of PLN employees by 2017 was 54,129 people. Employee productivity
in 2019 was 4,536 MWh/employee and 1,399 customers/employee.
As a company that monopolizes the power sector in Indonesia amid the global
change in the power sector, PLN faces some critical challenges. PLN needs to answer
the following questions [145]. First, can PLN reduce its reliance on government
subsidies? Second, can PLN adopt a more credible planning process? Third, how can
PLN lower the risk of its Capex program and manage the major technology and market
changes? Finally, does PLN recognize that long-term investors place a value on
environmental performance?
33.4.2. Electric Power Infrastructure
In general, electricity system infrastructure consists of three main components,
namely power generation, transmission network, and DN (Figure 3.5).
Figure 3.5 Illustration of the electric power system [127].
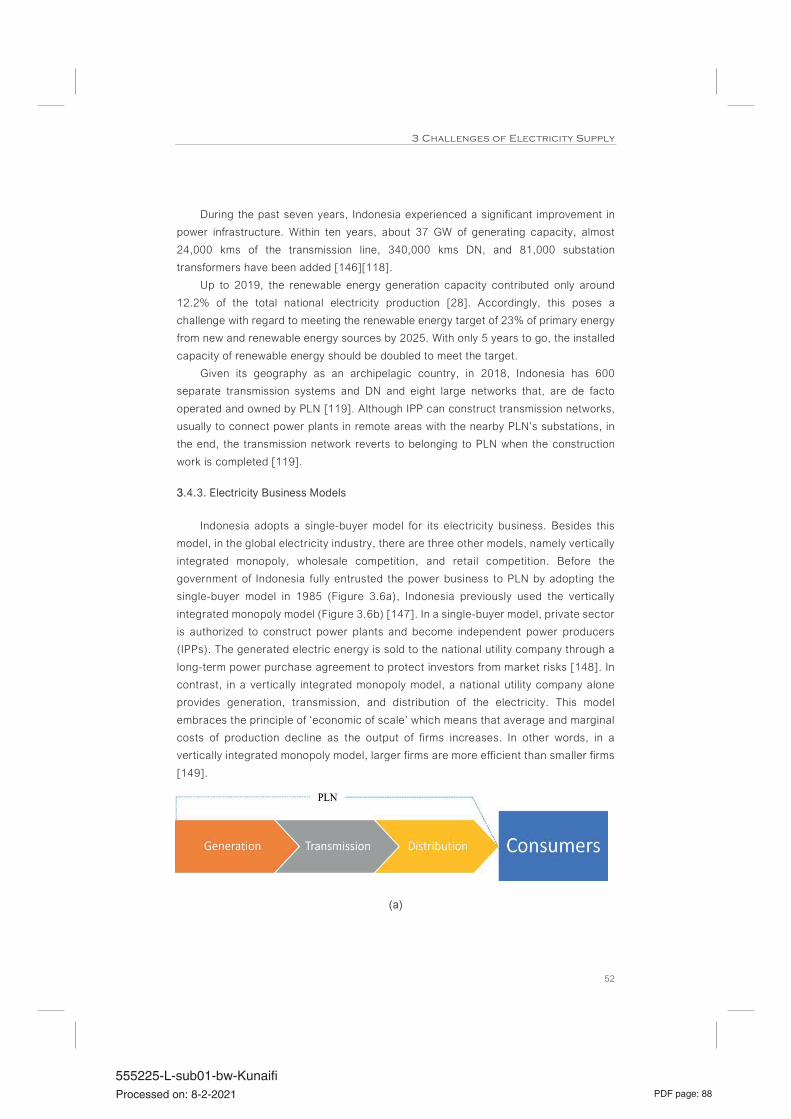
555225-L-sub01-bw-Kunaifi555225-L-sub01-bw-Kunaifi555225-L-sub01-bw-Kunaifi555225-L-sub01-bw-KunaifiProcessed on: 8-2-2021Processed on: 8-2-2021Processed on: 8-2-2021Processed on: 8-2-2021 PDF page: 88PDF page: 88PDF page: 88PDF page: 88
3 Challenges of Electricity Supply
52
During the past seven years, Indonesia experienced a significant improvement in
power infrastructure. Within ten years, about 37 GW of generating capacity, almost
24,000 kms of the transmission line, 340,000 kms DN, and 81,000 substation
transformers have been added [146][118].
Up to 2019, the renewable energy generation capacity contributed only around
12.2% of the total national electricity production [28]. Accordingly, this poses a
challenge with regard to meeting the renewable energy target of 23% of primary energy
from new and renewable energy sources by 2025. With only 5 years to go, the installed
capacity of renewable energy should be doubled to meet the target.
Given its geography as an archipelagic country, in 2018, Indonesia has 600
separate transmission systems and DN and eight large networks that, are de facto
operated and owned by PLN [119]. Although IPP can construct transmission networks,
usually to connect power plants in remote areas with the nearby PLN’s substations, in
the end, the transmission network reverts to belonging to PLN when the construction
work is completed [119].
33.4.3. Electricity Business Models
Indonesia adopts a single-buyer model for its electricity business. Besides this
model, in the global electricity industry, there are three other models, namely vertically
integrated monopoly, wholesale competition, and retail competition. Before the
government of Indonesia fully entrusted the power business to PLN by adopting the
single-buyer model in 1985 (Figure 3.6a), Indonesia previously used the vertically
integrated monopoly model (Figure 3.6b) [147]. In a single-buyer model, private sector
is authorized to construct power plants and become independent power producers
(IPPs). The generated electric energy is sold to the national utility company through a
long-term power purchase agreement to protect investors from market risks [148]. In
contrast, in a vertically integrated monopoly model, a national utility company alone
provides generation, transmission, and distribution of the electricity. This model
embraces the principle of ‘economic of scale’ which means that average and marginal
costs of production decline as the output of firms increases. In other words, in a
vertically integrated monopoly model, larger firms are more efficient than smaller firms
[149].
(a)

555225-L-sub01-bw-Kunaifi555225-L-sub01-bw-Kunaifi555225-L-sub01-bw-Kunaifi555225-L-sub01-bw-KunaifiProcessed on: 8-2-2021Processed on: 8-2-2021Processed on: 8-2-2021Processed on: 8-2-2021 PDF page: 89PDF page: 89PDF page: 89PDF page: 89
3 Challenges of Electricity Supply
53
FFig. 3.6. Cont.
(b)
Figure 3.6 Models in power sector business. ((a) vertically integrated monopoly model, ((b) Single-
buyer model [147].
3.4.4. Customer Groups
PLN divides its customers into six tariff groups, namely household, business,
industrial, social, government office buildings, and public street lighting. More
specifically, each tariff group is further divided based on the type of voltage, namely low,
medium, and high voltage tariffs [150]. In 2018, PLN had 71.9 million customers,
predominantly households (66 million). The number of commercial/business customers
was 3.8 million. The number of general customers and industry were respectively 2
million and 88 thousand. Since 2012–2018, the total number of customers has increased
by 3–4 million per year [151].
3.5. Renewable Energy
3.5.1. The Low Share of Renewable Energy
The share of renewable energy technology in the ambitious 35,000 MW program,
unfortunately, is not significant. It also has not shown a growth rate as fast as it should.
Renewable energy will not be able to meet the energy mix target of Indonesia, assuming
a linear growth rate [152] (Figure 3.7). From 2008 to 2019, the share of renewable
energy had increased from 4.37% to only 9.15% of the total energy supply with an
average annual growth of 9.2%. Assuming the same annual growth from 2020 to 2025,
the share of RE in 2025 would be 15.5%. To achieve the RE target of 23% in 2025, the
share of RE should increase by at least 16.6% annually started in 2020.
By September 2019, renewable energy investment in Indonesia was only US$1.17
billion, which was equivalent to 65% of the 2019 renewable energy investment target of
US$1.8 billion [28].

555225-L-sub01-bw-Kunaifi555225-L-sub01-bw-Kunaifi555225-L-sub01-bw-Kunaifi555225-L-sub01-bw-KunaifiProcessed on: 8-2-2021Processed on: 8-2-2021Processed on: 8-2-2021Processed on: 8-2-2021 PDF page: 90PDF page: 90PDF page: 90PDF page: 90
3 Challenges of Electricity Supply
54
Figure 3.7 The historical renewable energy growth in Indonesia compared to the 2025 renewable
energy targets [152].
On the tariff side, the government sets maximum tariff limits of 85% of local
electrical energy production cost (EPC) for energy generated by PV systems. For
example, if the local EPC was US$8 cents, the energy tariff for PV systems would be
US$6.8 cents. Our interviews with PV systems project developers and investors in
Indonesia indicate that such a tariff limit is a serious barrier to the development of
renewable energy, which was also confirmed in (Bridle et al., 2018). In the regions with
a high EPC, the renewable tariff is higher, so certain projects could be financially
feasible. However, such regions usually lack infrastructure and strong networks that
discourage the integration of PV systems. On the islands of Java and Bali, a tariff below
85% of EPC is considered inappropriate by the renewable energy developers [153].
Rooftop PV systems form a big market in Indonesia. However, the Decree of the Minister
of Energy and Mineral Resources No. 49/2018 discourages rooftop PV systems. In this
Regulation, PLN only compensates 65% of the electricity it receives from rooftop PV
systems. Under this scheme, the payback period would become too long to be
interesting for investors, namely 11–12 years [154].
Another burden for PV system development in Indonesia is a greater allocation of
risk that must also be borne by PV system investors. The Regulation of the Minister of
Energy and Mineral Resources No. 10/2018 demises the governmental force majeure,
which introduces a more considerable uncertainty for the IPPs.
The last regulation that slows down the growth of renewable energy in Indonesia is
the BOOT (Build-Own-Operate-Transfer) scheme. Under the BOOT scheme, the
renewable developers, especially small-scale IPPs, find it is difficult to obtain funding
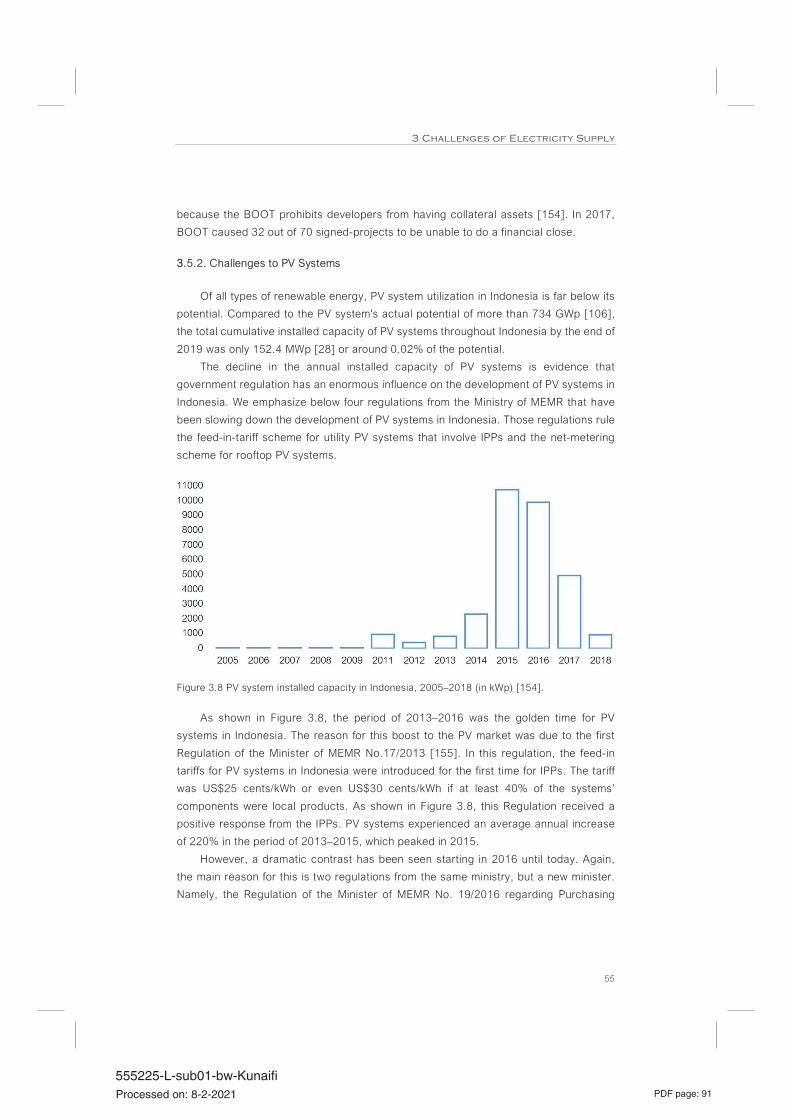
555225-L-sub01-bw-Kunaifi555225-L-sub01-bw-Kunaifi555225-L-sub01-bw-Kunaifi555225-L-sub01-bw-KunaifiProcessed on: 8-2-2021Processed on: 8-2-2021Processed on: 8-2-2021Processed on: 8-2-2021 PDF page: 91PDF page: 91PDF page: 91PDF page: 91
3 Challenges of Electricity Supply
55
because the BOOT prohibits developers from having collateral assets [154]. In 2017,
BOOT caused 32 out of 70 signed-projects to be unable to do a financial close.
33.5.2. Challenges to PV Systems
Of all types of renewable energy, PV system utilization in Indonesia is far below its
potential. Compared to the PV system's actual potential of more than 734 GWp [106],
the total cumulative installed capacity of PV systems throughout Indonesia by the end of
2019 was only 152.4 MWp [28] or around 0.02% of the potential.
The decline in the annual installed capacity of PV systems is evidence that
government regulation has an enormous influence on the development of PV systems in
Indonesia. We emphasize below four regulations from the Ministry of MEMR that have
been slowing down the development of PV systems in Indonesia. Those regulations rule
the feed-in-tariff scheme for utility PV systems that involve IPPs and the net-metering
scheme for rooftop PV systems.
Figure 3.8 PV system installed capacity in Indonesia, 2005–2018 (in kWp) [154].
As shown in Figure 3.8, the period of 2013–2016 was the golden time for PV
systems in Indonesia. The reason for this boost to the PV market was due to the first
Regulation of the Minister of MEMR No.17/2013 [155]. In this regulation, the feed-in
tariffs for PV systems in Indonesia were introduced for the first time for IPPs. The tariff
was US$25 cents/kWh or even US$30 cents/kWh if at least 40% of the systems’
components were local products. As shown in Figure 3.8, this Regulation received a
positive response from the IPPs. PV systems experienced an average annual increase
of 220% in the period of 2013–2015, which peaked in 2015.
However, a dramatic contrast has been seen starting in 2016 until today. Again,
the main reason for this is two regulations from the same ministry, but a new minister.
Namely, the Regulation of the Minister of MEMR No. 19/2016 regarding Purchasing
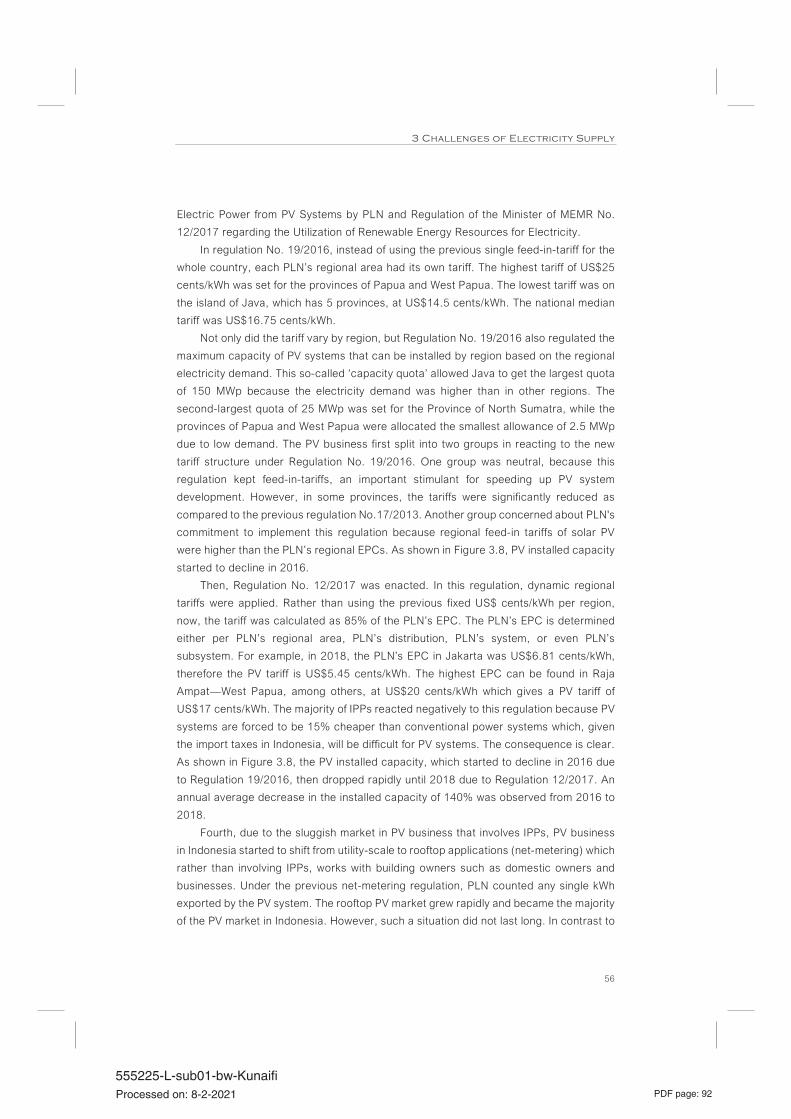
555225-L-sub01-bw-Kunaifi555225-L-sub01-bw-Kunaifi555225-L-sub01-bw-Kunaifi555225-L-sub01-bw-KunaifiProcessed on: 8-2-2021Processed on: 8-2-2021Processed on: 8-2-2021Processed on: 8-2-2021 PDF page: 92PDF page: 92PDF page: 92PDF page: 92
3 Challenges of Electricity Supply
56
Electric Power from PV Systems by PLN and Regulation of the Minister of MEMR No.
12/2017 regarding the Utilization of Renewable Energy Resources for Electricity.
In regulation No. 19/2016, instead of using the previous single feed-in-tariff for the
whole country, each PLN’s regional area had its own tariff. The highest tariff of US$25
cents/kWh was set for the provinces of Papua and West Papua. The lowest tariff was on
the island of Java, which has 5 provinces, at US$14.5 cents/kWh. The national median
tariff was US$16.75 cents/kWh.
Not only did the tariff vary by region, but Regulation No. 19/2016 also regulated the
maximum capacity of PV systems that can be installed by region based on the regional
electricity demand. This so-called ‘capacity quota’ allowed Java to get the largest quota
of 150 MWp because the electricity demand was higher than in other regions. The
second-largest quota of 25 MWp was set for the Province of North Sumatra, while the
provinces of Papua and West Papua were allocated the smallest allowance of 2.5 MWp
due to low demand. The PV business first split into two groups in reacting to the new
tariff structure under Regulation No. 19/2016. One group was neutral, because this
regulation kept feed-in-tariffs, an important stimulant for speeding up PV system
development. However, in some provinces, the tariffs were significantly reduced as
compared to the previous regulation No.17/2013. Another group concerned about PLN's
commitment to implement this regulation because regional feed-in tariffs of solar PV
were higher than the PLN’s regional EPCs. As shown in Figure 3.8, PV installed capacity
started to decline in 2016.
Then, Regulation No. 12/2017 was enacted. In this regulation, dynamic regional
tariffs were applied. Rather than using the previous fixed US$ cents/kWh per region,
now, the tariff was calculated as 85% of the PLN’s EPC. The PLN’s EPC is determined
either per PLN’s regional area, PLN’s distribution, PLN’s system, or even PLN’s
subsystem. For example, in 2018, the PLN’s EPC in Jakarta was US$6.81 cents/kWh,
therefore the PV tariff is US$5.45 cents/kWh. The highest EPC can be found in Raja
Ampat—West Papua, among others, at US$20 cents/kWh which gives a PV tariff of
US$17 cents/kWh. The majority of IPPs reacted negatively to this regulation because PV
systems are forced to be 15% cheaper than conventional power systems which, given
the import taxes in Indonesia, will be difficult for PV systems. The consequence is clear.
As shown in Figure 3.8, the PV installed capacity, which started to decline in 2016 due
to Regulation 19/2016, then dropped rapidly until 2018 due to Regulation 12/2017. An
annual average decrease in the installed capacity of 140% was observed from 2016 to
2018.
Fourth, due to the sluggish market in PV business that involves IPPs, PV business
in Indonesia started to shift from utility-scale to rooftop applications (net-metering) which
rather than involving IPPs, works with building owners such as domestic owners and
businesses. Under the previous net-metering regulation, PLN counted any single kWh
exported by the PV system. The rooftop PV market grew rapidly and became the majority
of the PV market in Indonesia. However, such a situation did not last long. In contrast to
555225-L-sub01-bw-Kunaifi555225-L-sub01-bw-Kunaifi555225-L-sub01-bw-Kunaifi555225-L-sub01-bw-KunaifiProcessed on: 8-2-2021Processed on: 8-2-2021Processed on: 8-2-2021Processed on: 8-2-2021 PDF page: 93PDF page: 93PDF page: 93PDF page: 93
3 Challenges of Electricity Supply
57
the Government 1 GWp rooftop PV systems target in the period of 2018–2021, the PV
rooftop target was ‘attacked’ by the Regulation of the Minister of MEMR No. 49/2018. In
this new regulation, of the total energy exported by a rooftop PV to the grid as recorded
by the kWh meter, PLN counts only 65% rather than all energy. This changed the
previous regulation that applied a 1:1 ratio between energy exported by rooftop PV
systems and energy calculated by PLN. Naturally, this changing situation can be
considered hostile for PV system installers and owners.
33.5.3. Role of PV Systems
PV systems should contribute more to Indonesia’s energy mix. But, with a
continuous decline in PV installation costs [154], particularly for off-grid remote
applications, increasing PV capacity in Indonesia is worth considering, starting with
village electricity and housing applications. As shown in Figure 3.9, from 2013 to 2017,
the cost of a PV system installation in remote areas of Indonesia has declined from
US$14.3 thousand per kWp to US$6 thousand per kWp. From 2016 to 2018, the cost of
a PV system installation for residential buildings in urban locations was relatively
constant at US$1.33 thousand per kWp [154]. These indicate that the applications of
PV systems both for rural and urban applications are promising in Indonesia.
Figure 3.9 Cost of a PV system installation (in kWp) in Indonesia, 2013–2018 [154].
3.5.4. Regulations that Support Renewable Energy
Apart from various burdensome regulations, there is also regulation that promotes
renewable energy. Namely, Regulation of the Minister of MEMR Number 39
555225-L-sub01-bw-Kunaifi555225-L-sub01-bw-Kunaifi555225-L-sub01-bw-Kunaifi555225-L-sub01-bw-KunaifiProcessed on: 8-2-2021Processed on: 8-2-2021Processed on: 8-2-2021Processed on: 8-2-2021 PDF page: 94PDF page: 94PDF page: 94PDF page: 94
3 Challenges of Electricity Supply
58
K/20/MEM/2019 [134] stimulates the acceleration of renewable energy by allowing
renewable energy projects although they are not listed in the PLN’s General Plan of
Electricity Supply (RUPTL). Previously, no PV system could be constructed before being
listed in the RUPTL. This regulation is expected to raise interest by PV system
businesses to develop renewable energy projects in Indonesia [156].
33.6. Conclusions
Several challenges characterize the electricity supply in Indonesia. The regional
difference between one province and another is the foremost problem. Java and Bali
have the most reliable and sufficient electricity service, while Eastern Indonesia
continues to have low ER and a low-reliability power supply. This also causes electrical
energy price disparity between urban and rural areas. Despite its economic size and
growth rate, the electricity consumption per capita in Indonesia is low compared to some
other ASEAN and European countries.
Those challenges have been responded to by accelerating the development of
power infrastructure across the country, such as the 35,000 MW program. Electricity
consumption could be increased along with economic development and larger
generation capacity. But, fossil fuel reserves are facing depletion and therefore
renewable power generation is a favorable option. Although renewable energy is not a
priority at the moment, it could play a crucial role in the future to combat climate change
and ensure energy security. Existing regulations, however, seem to be less favorable to
PV system installations because of a lack of financial feasibility and contradicting as well
as rapidly changing regulations.
The government and PLN, with their dominant power and authority, are expected
to facilitate a fair ‘playing field’ for renewable power generation, which does not happen
at present. Therefore, new supporting regulations are highly needed.
555225-L-sub01-bw-Kunaifi555225-L-sub01-bw-Kunaifi555225-L-sub01-bw-Kunaifi555225-L-sub01-bw-KunaifiProcessed on: 8-2-2021Processed on: 8-2-2021Processed on: 8-2-2021Processed on: 8-2-2021 PDF page: 95PDF page: 95PDF page: 95PDF page: 95
3 Challenges of Electricity Supply
59
Reliability of the
Electricity Supply
This Chapter is based on “Kunaifi,K, Reinders, A.H.M.E. Perceived and Reported Reliability of the Electricity Supply at Three Urban Locations in Indonesia. Energies. 2018, 11(1), pp. 140.”

555225-L-sub01-bw-Kunaifi555225-L-sub01-bw-Kunaifi555225-L-sub01-bw-Kunaifi555225-L-sub01-bw-KunaifiProcessed on: 8-2-2021Processed on: 8-2-2021Processed on: 8-2-2021Processed on: 8-2-2021 PDF page: 96PDF page: 96PDF page: 96PDF page: 96
3 Challenges of Electricity Supply
60

555225-L-sub01-bw-Kunaifi555225-L-sub01-bw-Kunaifi555225-L-sub01-bw-Kunaifi555225-L-sub01-bw-KunaifiProcessed on: 8-2-2021Processed on: 8-2-2021Processed on: 8-2-2021Processed on: 8-2-2021 PDF page: 97PDF page: 97PDF page: 97PDF page: 97
61
CChapter 4. Reliability of the
Electricity Supply
4.1. Introduction
This chapter explores the reliability of electricity supply in Indonesia. On the basis
of a series of user surveys at three different locations in Indonesia, namely in the islands
of Sumatra, Timor, and Papua, we compare the reported indices of power reliability
(SAIFI and SAIDI) and experimental results from user surveys and power measurements.
These users experienced higher unavailability of power delivered by the grid than
expressed by the utility-reported SAIFI and SAIDI. Therefore, for this study, new indices
are introduced, namely the Perceived (P) SAIFI and P-SAIDI, which are based on the
frequency and duration of blackouts experienced by the users. Since this chapter was
prepared in 2017, we mainly refer to statistics available for 2016.
Access to electricity is a basic need for people. However, in some countries, not all
people have access to reliable electricity from the grid. According to the International
Energy Agency (IEA), around 1.2 billion people, 16% of the global population, were still
without access to electricity in 2015 (IEA 2016 [157]). In Indonesia, nearly 3 million
people remained without electricity in 2019 [3][86], which is more than half of the total
population of Singapore, it's neighbor country, for the same year. Further, reliability
problems, which are the focus of this study, exist in areas with access to the grid
[158][159], as also occur in Indonesia [160].
Due to various economic, technical, and political problems, the low quality of
electricity supplied by the grid can be expected in some developing countries [158][159].
This issue can be characterized by the intermittent and unreliable supply of electricity to
the end-users commonly through regular grid interruptions, either planned or unplanned.
A low reliability of electricity supply affects individuals and family life as well as being
interrelated with the development and economic condition of a country. A low gross
domestic product (GDP) results from a weak power grid in a country or vice versa. For
instance, according to Murphy et al. (2014) [161], a reduction in the number of outages
from 100 days per year to 10 days per year corresponds to more than a two-fold increase
in GDP per person.
The reliability of electricity services can be quantified by their availability [161]. To
give a preliminary impression of the reliability of the electricity supply in Indonesia as a
whole, we present a calculation of the actual availability of the utility grid and the “mean
time between failure (MTBF)”.

555225-L-sub01-bw-Kunaifi555225-L-sub01-bw-Kunaifi555225-L-sub01-bw-Kunaifi555225-L-sub01-bw-KunaifiProcessed on: 8-2-2021Processed on: 8-2-2021Processed on: 8-2-2021Processed on: 8-2-2021 PDF page: 98PDF page: 98PDF page: 98PDF page: 98
4 Reliability of the Electricity Supply
62
Availability, A, is the percentage of time that a system is functional, or the time the
system is up (Tup), divided by the total time at risk (Ttotal = Tup + Tdown) (Propst 1995, in
[161]). The calculations follow the procedure suggested by Murphy et al. [161]. Data
from the World Bank [162] are used, where the monthly average number of outages in
Indonesia in 2015 is 0.5, and the mean time to repair (MTTR), or the average duration
of a typical outage, is 5.7 h.
For the average month lasting 730 h, Indonesia’s 0.5 outages per month averaging
5.7 h in duration gives a Tdown = (0.5 × 5.7) or 2.85 h on average for the grid in Indonesia.
Thus, A can be calculated, resulting in 99.6%. Also, MTBF can also be calculated,
since A = MTBF / (MTBF + MTTR) [161] [163] [164], to be 58.1 h. These calculations
show very high reliability of electricity supply in Indonesia, while narratives of end-users
indicate that the reliability might be unsatisfactory.
The reliability of electricity services is also often quantified with indices such as the
System Average Interruption Duration Index (SAIDI) and System Average Interruption
Frequency Index (SAIFI) [165], which are normally documented by utility companies.
However, self-reported reliability indices do not always represent the actual situation
accurately [161]. In this sense, knowledge about the experience of the grid users can
be useful to evaluate the reality of the reliability indices of electricity service.
How reliable is the electric power supply through the distribution networks (DN) in
urban areas of Indonesia from the perspective of users, and how does this compare to
official data? This interesting question guides this research. Currently, information is
lacking about this important topic affecting the lives of millions of people in Indonesia.
To the best of our knowledge, this thesis presents the first independent study for
Indonesia with an evaluation of household perception regarding the reliability of the
electricity supply through the distribution grid, and how the user experiences compare
to the reported data from the utility.
The remainder of this chapter is organized as follows: Section 4.2.1 introduces
energy demand and electricity supply in Indonesia followed by Section 4.2.2, which
presents various topics that are related to the reliability and resilience of electricity grids
in the country. The detailed research questions and related experiments are presented
in Section 4.3. In Section 4.4, the results of the research are shown and, finally,
in Section 4.5, conclusions are drawn and discussed within their context.
44.2. Literature Review
4.2.1. Energy Demand and Electricity Supply in Indonesia
Given its large and growing population of 255 million people and strong economic
growth, Indonesia’s demand for electricity is rapidly increasing. The electricity
consumption in 2015 was 201 TWh and is projected to reach 2008 TWh by 2050 [166].
However, due to the geographical distribution of the archipelago of Indonesia, the
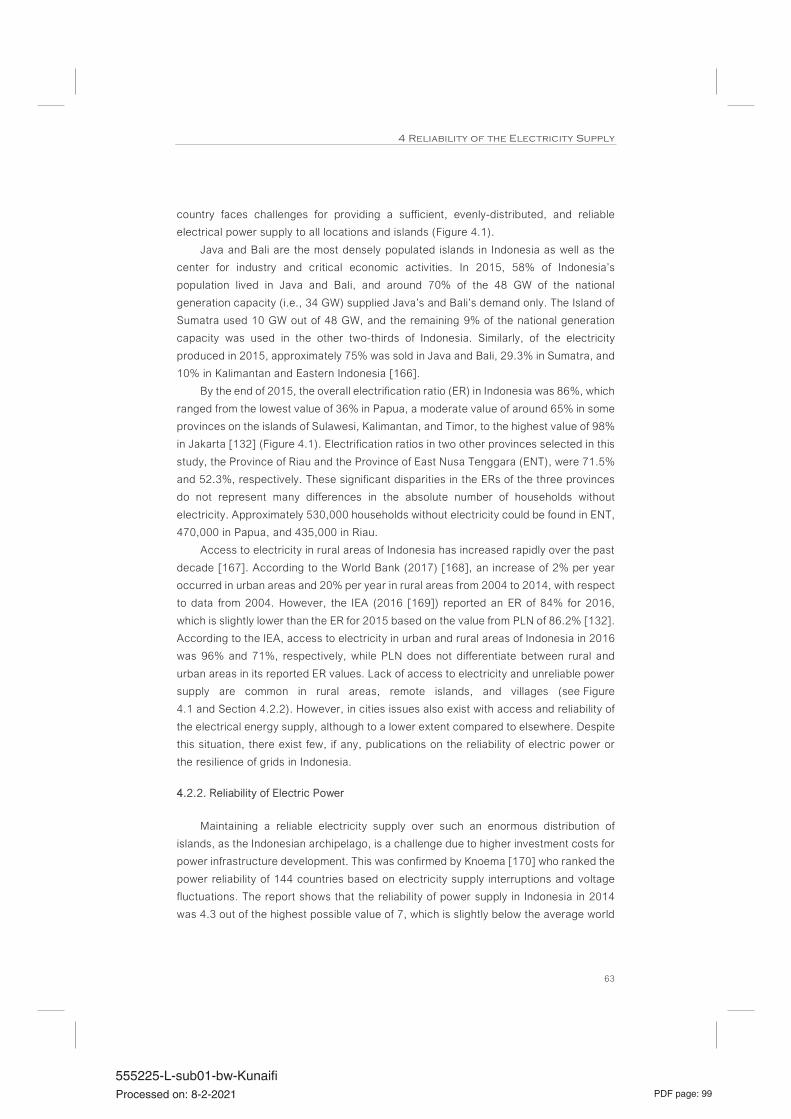
555225-L-sub01-bw-Kunaifi555225-L-sub01-bw-Kunaifi555225-L-sub01-bw-Kunaifi555225-L-sub01-bw-KunaifiProcessed on: 8-2-2021Processed on: 8-2-2021Processed on: 8-2-2021Processed on: 8-2-2021 PDF page: 99PDF page: 99PDF page: 99PDF page: 99
4 Reliability of the Electricity Supply
63
country faces challenges for providing a sufficient, evenly-distributed, and reliable
electrical power supply to all locations and islands (Figure 4.1).
Java and Bali are the most densely populated islands in Indonesia as well as the
center for industry and critical economic activities. In 2015, 58% of Indonesia’s
population lived in Java and Bali, and around 70% of the 48 GW of the national
generation capacity (i.e., 34 GW) supplied Java’s and Bali’s demand only. The Island of
Sumatra used 10 GW out of 48 GW, and the remaining 9% of the national generation
capacity was used in the other two-thirds of Indonesia. Similarly, of the electricity
produced in 2015, approximately 75% was sold in Java and Bali, 29.3% in Sumatra, and
10% in Kalimantan and Eastern Indonesia [166].
By the end of 2015, the overall electrification ratio (ER) in Indonesia was 86%, which
ranged from the lowest value of 36% in Papua, a moderate value of around 65% in some
provinces on the islands of Sulawesi, Kalimantan, and Timor, to the highest value of 98%
in Jakarta [132] (Figure 4.1). Electrification ratios in two other provinces selected in this
study, the Province of Riau and the Province of East Nusa Tenggara (ENT), were 71.5%
and 52.3%, respectively. These significant disparities in the ERs of the three provinces
do not represent many differences in the absolute number of households without
electricity. Approximately 530,000 households without electricity could be found in ENT,
470,000 in Papua, and 435,000 in Riau.
Access to electricity in rural areas of Indonesia has increased rapidly over the past
decade [167]. According to the World Bank (2017) [168], an increase of 2% per year
occurred in urban areas and 20% per year in rural areas from 2004 to 2014, with respect
to data from 2004. However, the IEA (2016 [169]) reported an ER of 84% for 2016,
which is slightly lower than the ER for 2015 based on the value from PLN of 86.2% [132].
According to the IEA, access to electricity in urban and rural areas of Indonesia in 2016
was 96% and 71%, respectively, while PLN does not differentiate between rural and
urban areas in its reported ER values. Lack of access to electricity and unreliable power
supply are common in rural areas, remote islands, and villages (see Figure
4.1 and Section 4.2.2). However, in cities issues also exist with access and reliability of
the electrical energy supply, although to a lower extent compared to elsewhere. Despite
this situation, there exist few, if any, publications on the reliability of electric power or
the resilience of grids in Indonesia.
44.2.2. Reliability of Electric Power
Maintaining a reliable electricity supply over such an enormous distribution of
islands, as the Indonesian archipelago, is a challenge due to higher investment costs for
power infrastructure development. This was confirmed by Knoema [170] who ranked the
power reliability of 144 countries based on electricity supply interruptions and voltage
fluctuations. The report shows that the reliability of power supply in Indonesia in 2014
was 4.3 out of the highest possible value of 7, which is slightly below the average world
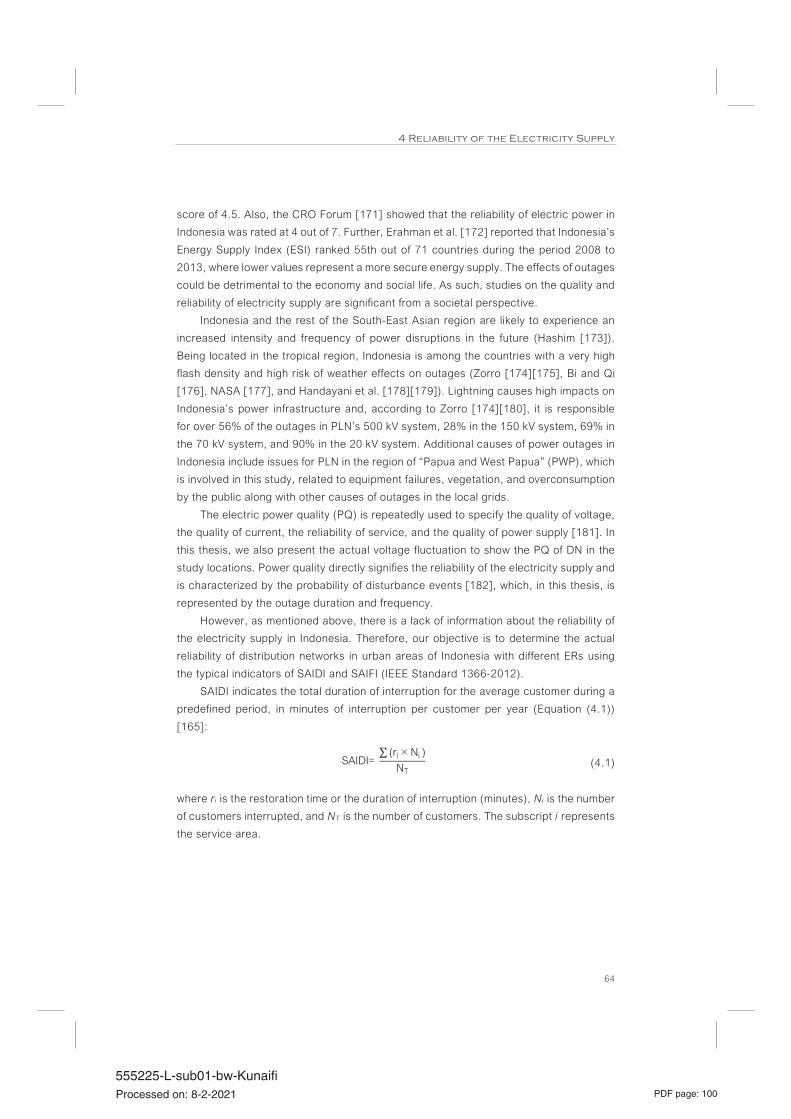
555225-L-sub01-bw-Kunaifi555225-L-sub01-bw-Kunaifi555225-L-sub01-bw-Kunaifi555225-L-sub01-bw-KunaifiProcessed on: 8-2-2021Processed on: 8-2-2021Processed on: 8-2-2021Processed on: 8-2-2021 PDF page: 100PDF page: 100PDF page: 100PDF page: 100
4 Reliability of the Electricity Supply
64
score of 4.5. Also, the CRO Forum [171] showed that the reliability of electric power in
Indonesia was rated at 4 out of 7. Further, Erahman et al. [172] reported that Indonesia’s
Energy Supply Index (ESI) ranked 55th out of 71 countries during the period 2008 to
2013, where lower values represent a more secure energy supply. The effects of outages
could be detrimental to the economy and social life. As such, studies on the quality and
reliability of electricity supply are significant from a societal perspective.
Indonesia and the rest of the South-East Asian region are likely to experience an
increased intensity and frequency of power disruptions in the future (Hashim [173]).
Being located in the tropical region, Indonesia is among the countries with a very high
flash density and high risk of weather effects on outages (Zorro [174][175], Bi and Qi
[176], NASA [177], and Handayani et al. [178][179]). Lightning causes high impacts on
Indonesia’s power infrastructure and, according to Zorro [174][180], it is responsible
for over 56% of the outages in PLN’s 500 kV system, 28% in the 150 kV system, 69% in
the 70 kV system, and 90% in the 20 kV system. Additional causes of power outages in
Indonesia include issues for PLN in the region of “Papua and West Papua” (PWP), which
is involved in this study, related to equipment failures, vegetation, and overconsumption
by the public along with other causes of outages in the local grids.
The electric power quality (PQ) is repeatedly used to specify the quality of voltage,
the quality of current, the reliability of service, and the quality of power supply [181]. In
this thesis, we also present the actual voltage fluctuation to show the PQ of DN in the
study locations. Power quality directly signifies the reliability of the electricity supply and
is characterized by the probability of disturbance events [182], which, in this thesis, is
represented by the outage duration and frequency.
However, as mentioned above, there is a lack of information about the reliability of
the electricity supply in Indonesia. Therefore, our objective is to determine the actual
reliability of distribution networks in urban areas of Indonesia with different ERs using
the typical indicators of SAIDI and SAIFI (IEEE Standard 1366-2012).
SAIDI indicates the total duration of interruption for the average customer during a
predefined period, in minutes of interruption per customer per year (Equation (4.1))
[165]:
SAIDI= � (ri × Ni )
NT (4.1)
where ri is the restoration time or the duration of interruption (minutes), Ni is the number
of customers interrupted, and NT is the number of customers. The subscript i represents
the service area.

555225-L-sub01-bw-Kunaifi555225-L-sub01-bw-Kunaifi555225-L-sub01-bw-Kunaifi555225-L-sub01-bw-KunaifiProcessed on: 8-2-2021Processed on: 8-2-2021Processed on: 8-2-2021Processed on: 8-2-2021 PDF page: 101PDF page: 101PDF page: 101PDF page: 101
4 R
el
ia
bil
it
y o
f t
he
E
le
ct
ric
it
y S
up
pl
y
65
Fig
ure
4.1
Ma
p o
f In
don
esia
sh
ow
ing
ER
s fo
r 3
4 p
rovi
nce
s in
20
15
. D
ata
are
ba
sed
on
Pe
rusa
haa
n Li
stri
k N
eg
ara
(PLN
) (2
01
6)
[13
2],
an
d t
he m
ap
is b
ase
d
on
Dal
et
(20
07
) [5
8].
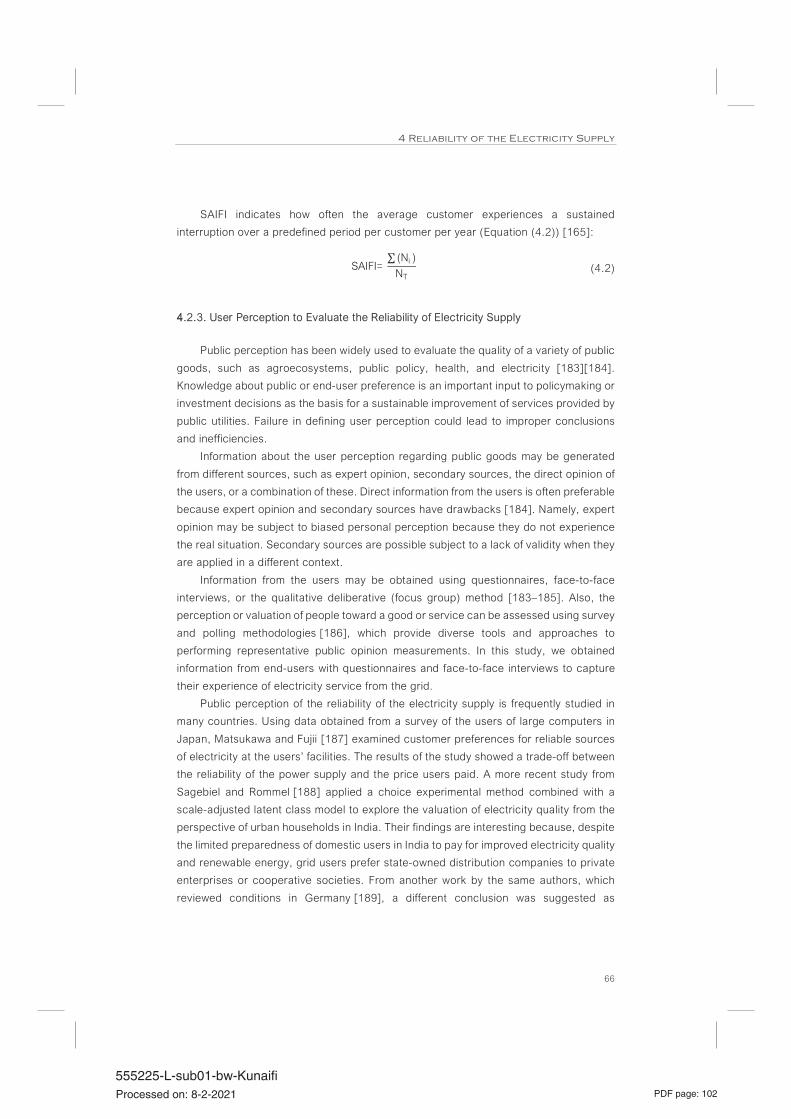
555225-L-sub01-bw-Kunaifi555225-L-sub01-bw-Kunaifi555225-L-sub01-bw-Kunaifi555225-L-sub01-bw-KunaifiProcessed on: 8-2-2021Processed on: 8-2-2021Processed on: 8-2-2021Processed on: 8-2-2021 PDF page: 102PDF page: 102PDF page: 102PDF page: 102
4 Reliability of the Electricity Supply
66
SAIFI indicates how often the average customer experiences a sustained
interruption over a predefined period per customer per year (Equation (4.2)) [165]:
SAIFI= � (Ni )
NT (4.2)
44.2.3. User Perception to Evaluate the Reliability of Electricity Supply
Public perception has been widely used to evaluate the quality of a variety of public
goods, such as agroecosystems, public policy, health, and electricity [183][184].
Knowledge about public or end-user preference is an important input to policymaking or
investment decisions as the basis for a sustainable improvement of services provided by
public utilities. Failure in defining user perception could lead to improper conclusions
and inefficiencies.
Information about the user perception regarding public goods may be generated
from different sources, such as expert opinion, secondary sources, the direct opinion of
the users, or a combination of these. Direct information from the users is often preferable
because expert opinion and secondary sources have drawbacks [184]. Namely, expert
opinion may be subject to biased personal perception because they do not experience
the real situation. Secondary sources are possible subject to a lack of validity when they
are applied in a different context.
Information from the users may be obtained using questionnaires, face-to-face
interviews, or the qualitative deliberative (focus group) method [183–185]. Also, the
perception or valuation of people toward a good or service can be assessed using survey
and polling methodologies [186], which provide diverse tools and approaches to
performing representative public opinion measurements. In this study, we obtained
information from end-users with questionnaires and face-to-face interviews to capture
their experience of electricity service from the grid.
Public perception of the reliability of the electricity supply is frequently studied in
many countries. Using data obtained from a survey of the users of large computers in
Japan, Matsukawa and Fujii [187] examined customer preferences for reliable sources
of electricity at the users’ facilities. The results of the study showed a trade-off between
the reliability of the power supply and the price users paid. A more recent study from
Sagebiel and Rommel [188] applied a choice experimental method combined with a
scale-adjusted latent class model to explore the valuation of electricity quality from the
perspective of urban households in India. Their findings are interesting because, despite
the limited preparedness of domestic users in India to pay for improved electricity quality
and renewable energy, grid users prefer state-owned distribution companies to private
enterprises or cooperative societies. From another work by the same authors, which
reviewed conditions in Germany [189], a different conclusion was suggested as

555225-L-sub01-bw-Kunaifi555225-L-sub01-bw-Kunaifi555225-L-sub01-bw-Kunaifi555225-L-sub01-bw-KunaifiProcessed on: 8-2-2021Processed on: 8-2-2021Processed on: 8-2-2021Processed on: 8-2-2021 PDF page: 103PDF page: 103PDF page: 103PDF page: 103
4 Reliability of the Electricity Supply
67
respondents in Germany have a particularly high willingness to pay (WTP) for renewable
energy.
Another study from Ozbafli and Jenkins [184] estimated households’ WTP for
improved electricity service in North Cyprus. They found that to avoid the cost of
outages, households were willing to incur 3.6% and 13.9% increases in their monthly
electricity bill for summer and winter, respectively. Other recent studies regarding user
preference concerning public goods and services include Kalkbrennera, Yonezawa, and
Roosena [190], Bartczak et al. [191], Sagebiel [192], and Shina and Hwang [193]. From
a review of these studies, public perception observed in a certain local setting could be
different from the perception of people in other situations.
However, there are comparatively few examples of public perception used for
energy research in Indonesia. Many studies which utilized public perception focus on
health (Harapan et al. [38]), environment (Vollmer et al. [39], Suparman, Folmer and
Oud [40], Ghozali and Kaneko [194], Soo [41]), tourism (Anna [42]), transportation
(Hendratmoko, Guritnaningsih, and Tjahjono [43], Ambarwati [44]), and trade (Kojima
[45] and Miller et al. [46]). Only two studies present public perception in the energy area
in the Indonesian context, namely Lensink, Raster and Timmer [47] with observations
about the WTP for solar lamps, and Kumashiro et al. [48], which evaluated geothermal
energy. However, both studies are not suitable for this work.
44.3. Research Questions and Methods
4.3.1. Research Questions
The main question presented in this chapter is: “How reliable is the electric power
supply by distribution networks (DN) in Indonesia from the perspective of users, and how
does this compare to official data?” In this context, the following sub-questions are
explored:
1. What is the officially-reported reliability of the power supply in Indonesia?
This question is answered through a desk study by analysis of PLN’s annual reports
containing SAIDI and SAIFI values for each province in Indonesia. The results of the
analysis are presented in Section 4.4.1.
2. How do users in urban areas of Indonesia experience their power supply in
practice?
This question aims to discover the actual experiences of PLN customers in urban
areas regarding the reliability of the electricity supply. To answer this question, a
user study on households’ experiences was executed in three locations in
Indonesia, including the cities of Pekanbaru in the Province of Riau, Kupang in the
Province of ENT, and Jayapura in the Province of Papua. The results are reviewed
in Section 4.4.2.

555225-L-sub01-bw-Kunaifi555225-L-sub01-bw-Kunaifi555225-L-sub01-bw-Kunaifi555225-L-sub01-bw-KunaifiProcessed on: 8-2-2021Processed on: 8-2-2021Processed on: 8-2-2021Processed on: 8-2-2021 PDF page: 104PDF page: 104PDF page: 104PDF page: 104
4 Reliability of the Electricity Supply
68
3. What is the actual power quality in distribution grids in Indonesia?
This question is for providing evidence on the existence of outages and voltage
fluctuation at the three study locations by conducting short-term measurements of
power quality of the PLN distribution networks. The results are outlined in Section
4.4.3.
44.3.2. Methods
4.3.2.1. Desk Study
Annual reports from PLN from 2010 to 2015 [129–132,195,196] were analyzed
through a desk study to examine sub-question 1 of the research questions. PLN’s annual
reports contain statistics about the company’s annual performance and data on
distribution grid operation. These reports were published in the Indonesian language,
and, therefore, it is useful to evaluate the data they contain for a broader global
audience. The official data on SAIDI and SAIFI in different provinces of Indonesia were
analyzed, and the trends in the reliability of the electricity supply in Indonesia were
observed. The result from the desk study became input to select three appropriate
locations for this study with the lowest, medium, and highest values of reliability indices,
as is explained in the next section and shown in Table 4.1.
Table 4.1. Study locations and reasons for selection.
City PProvince Regional
Location
in
Indonesia
Electrification
Ratios of the
City’s Provinces
in 2015 *
Assumption
About the
Level of DN
Reliability
Period
of the
Field
Survey
Pekanbaru Riau West 71 Best 27/03–
14/04
Kupang ENT Central 52 Moderate 24/04–
29/04
Jayapura Papua East 36 Worst 02/05–
09/05 * PLN [132].
4.3.2.2. Experimental Set up of Field Research
For the exploration of sub-questions 2 and 3 of the research questions, a field
research study was established from 27 March 2017 to 9 May 2017. The field research
consisted of end-user studies with questionnaires and measurements of power on the
grid that were subsequently performed at the three study cities (see Figure 4.1).

555225-L-sub01-bw-Kunaifi555225-L-sub01-bw-Kunaifi555225-L-sub01-bw-Kunaifi555225-L-sub01-bw-KunaifiProcessed on: 8-2-2021Processed on: 8-2-2021Processed on: 8-2-2021Processed on: 8-2-2021 PDF page: 105PDF page: 105PDF page: 105PDF page: 105
4 Reliability of the Electricity Supply
69
The selection of the study locations was based on three criteria. First, the study
locations should give a regional representation of the country. Therefore, Riau was
selected among the provinces in the west, ENT in the central, and Papua in the eastern
part of Indonesia. Second, the reliability of the power supply in the locations should
range from the level of worst to moderate, to best. The ERs were used as inputs to make
initial assumptions about the level of supply reliability. With an ER of 71%, it was
assumed that Riau had the best reliability of power supply. Similarly, with ERs of 52%
and 36%, ENT and Papua were assumed to have a moderate and the worst reliability for
power supply, respectively. Table 4.1 shows the quantified data and the periods in which
the field research occurred for each location.
End-User Survey
To obtain the stated perceptions of respondents, data were collected through a
structured questionnaire utilizing open-ended and closed-ended questions in
combination with “face-to-face” semi-structured interviews [197]. The stated-perception
data extracted from the questionnaires express the respondents’ hypothetical responses
about their experience regarding electricity services and willingness to pay (WTP) extra
cost for improved reliability of power supply. The questionnaire contained 62 questions
covering various topics regarding household experience living with and without
electricity, the level of satisfaction about the electricity supply, WTP a higher electricity
bill, willingness to accept PV systems, and an energy use profile at home. Also, aspects
such as income, gender, and profession were recorded. For this thesis, nine questions
from the questionnaire were presented as shown below (see Appendix 4.B).
1. Would you accept an increase in your electricity bill for better electricity service?
2. How much increase in your electricity bill would you find acceptable?
3. Do you have a backup generator at home?
4. Do you experience a stable electricity voltage at home? (in this thesis, the “stable
electricity voltage” is used as a general phrase in the questionnaires, which refers to
a minimum level of voltage fluctuation. See also Section 4.2.1.)
5. Have you ever experienced a blackout at home?
6. On average, how often in a month do you experience blackouts?
7. On average, how long is the duration of the blackouts you experience?
8. At what time of day would a blackout event incur the most losses for you?
9. On average, what is the duration of a blackout that would incur economic losses for
you?
According to the Theory of Value (Lancaster, in Bernués et al. [185]), the attributes
or characteristics of a good or service determine its value for the individual who obtained
it. To capture insight into end-user perception, respondents were asked to identify and

555225-L-sub01-bw-Kunaifi555225-L-sub01-bw-Kunaifi555225-L-sub01-bw-Kunaifi555225-L-sub01-bw-KunaifiProcessed on: 8-2-2021Processed on: 8-2-2021Processed on: 8-2-2021Processed on: 8-2-2021 PDF page: 106PDF page: 106PDF page: 106PDF page: 106
4 Reliability of the Electricity Supply
70
rank each characteristic of the power supply they experienced. These rankings were
translated into scores, rescaled, and averaged as presented in Section 4.4.1. The
responses were used to estimate the P-SAIFI and P-SAIDI, the two new indices we
defined in this thesis, to estimate the reliability of the power supply based on the user
experiences. P-SAIFI is the average frequency of interruption experienced by the
respondents in a number of outage events per customer per year, where the initial letter
stands for “perceived”. P-SAIDI represents the user experience of the average duration
of each interruption in hours per customer per year.
The P-SAIFI and the P-SAIDI are calculated by applying the mean of the frequency
distribution (MFD) statistical method using the results of the user survey. The P-SAIFI is
calculated based on the respondents’ answers to the question “on average, how often do
you experience blackouts in a month?” The P-SAIDI is calculated based on the users’
responses to the question “on average, how long is the duration of the blackouts that you
experience?” Standard deviations of the estimated P-SAIFI and P-SAIDI are also calculated.
Honest answers can be expected from the respondents if they believe their
response could affect outcomes and if questions are associated with public goods [198],
which is relevant to this study. However, users might still overstate their perception
towards the questions compared to their real behavior or situation [198]. Therefore, we
applied a correction factor, C, to produce more accurate values of P-SAIFI and P-SAIDI.
The correction factor is based on an empirical finding by List and Gallet [199], who
addressed the “hypothetical bias” of people in preference-related studies using the
meta-analysis statistical method. They examined data from 29 experimental studies and
suggested: “on average, subjects overstate their preferences by a factor of about 3 in
hypothetical settings”. As such, the formulas applied to determine the P-SAIFI and P-
SAIDI consider a 30% correction factor (see Equation (4.3)).
The calculation of the P-SAIFI starts with classifying the monthly interruption
frequencies experienced by the respondents, fFi, into four groups of fF1: less than 3
times, fF2: 3 to 5 times, fF3: 6 to 10 times, and fF4: more than 10 times. Then, the mid-
values, xFi, of each group of interruption frequency, fFi, are found as xF1: 1.5 times, xF2: 4
times, and xF3: 8 times. Because there is no mid-value for fF4, we use an interruption
frequency of 11 times to represent xF4. Next, each mid-value is multiplied by the number
of users, N_fFi who responded in the corresponding category, fFi, to find the frequency
distribution of the data. The next step is to calculate the MFD using Equation (4.3) [200].
MFDP-SAIFI= � (xFi× N_fFi)
4i=1
N (4.3)
where N is the number of respondents at each location. The values of the MFD are based
on answers to the question “on average, how often do you experience blackouts in a
month?” Therefore, they represent the number of perceived interruption events per
month for each city. The final step is to multiply the MFDs by the number of months in
the year. The correction factor, C, is applied to find the average annual P-SAIFI.
555225-L-sub01-bw-Kunaifi555225-L-sub01-bw-Kunaifi555225-L-sub01-bw-Kunaifi555225-L-sub01-bw-KunaifiProcessed on: 8-2-2021Processed on: 8-2-2021Processed on: 8-2-2021Processed on: 8-2-2021 PDF page: 107PDF page: 107PDF page: 107PDF page: 107
4 Reliability of the Electricity Supply
71
Equation (4.4) is built from the above steps and is used for calculating the P-SAIFI:
P-SAIFI=C×�� (xFi× N_fFi)
4i=1 �×12
N (4.4)
where the constant, C, is the correction factor and i represents the outage frequency
groups.
Similarly, the calculation of the average annual P-SAIDI for each customer is based
on answers to the question “on average, how long is the duration of the blackouts that
you experience?” It starts with categorizing the monthly outage duration experienced by
the respondents, fDi, into five groups of fD1: less than 5 min, fD2: 5 to 15 min, fD3: 15 to 60
min, fD4: 1 to 2 h, and fD5: longer than 2 h. Then, the mid-values of each group of
interruption durations, xDi, are calculated as xD1: 2.5 min, xD2: 10 min, xD3: 37.5 min,
and xD4: 90 min. Because there is no mid-value for fD5, an outage duration of 125 min is
used to represent xD5. Next, each mid-value is multiplied by the number of users, N_fDi,
who responded in the corresponding category, fDi, to find the frequency distribution of
the data. The next step is to calculate the MFD using Equation (4.5):
MFDP-SAIDI= � (xDi× N_fDi)
5i=1
N (4.5)
The final step is to calculate P-SAIDIs by multiplying the MFDs by the above P-
SAIFI, and the results are divided by 60 to obtain the number of hours of interruption per
customer.
Equation (4.6) is used for calculating the P-SAIDI:
P-SAIDI=� (xDi× N_fDi)
5i=1 ×P-SAIFI
N�× 60 (4.6)
Also, the standard deviations, s, are presented using Equation (4.7) [201]:
s= ��� N_fi×x25i=1 �- �� N_fi×x5
i=1 �2
N (4.7)
Power Quality Measurements
For power measurements, a 3169-21 Clamp-On Power HiTester (Hioki, Nagano,
Japan) was installed on three-phase main distribution panels at office buildings in urban
areas of the three locations. The Hioki device measured many power quality parameters,
including the voltage level, with a recording interval of 1 min. The accuracy of the voltage
level measurement is ±2%.
In Pekanbaru, measurements were performed for 15 days at the office building of
the Faculty of Science and Technology of UIN Suska Riau University [202]. In Kupang
and Jayapura, the local Bureau of Meteorology offices hosted the measurements for five

555225-L-sub01-bw-Kunaifi555225-L-sub01-bw-Kunaifi555225-L-sub01-bw-Kunaifi555225-L-sub01-bw-KunaifiProcessed on: 8-2-2021Processed on: 8-2-2021Processed on: 8-2-2021Processed on: 8-2-2021 PDF page: 108PDF page: 108PDF page: 108PDF page: 108
4 Reliability of the Electricity Supply
72
and seven days, respectively. Measurements in Kupang covered workdays only, while
in Pekanbaru and Jayapura both weekdays and weekends were included. During
measurements, each office ran with their usual routine from 7:30 a.m. to 4:30 p.m. After
working hours, only some lamps and measurement equipment were in operation. Figure
4.2 shows the measuring instruments used and the connection points.
44.4. Results
4.4.1. SAIDI and SAIFI
Table 4.2 and Figure 4.3 show the SAIDI and SAIFI at various locations in Indonesia
based on averaged historical data from 2010 to 2015 in the Statistic PLN [129–
132,195,196]. Regarding SAIDI, as shown in Table 4.2, each customer in Riau
experienced 11.8 h of outage per year or around 59 min per month. In Papua and ENT,
each customer experienced shorter outage durations of 38 and 17 min/month,
respectively, during the same period. Regarding the SAIFI, customers in Riau and Papua
experienced outages more often (7.9 events per year) compared to those in ENT (6.1
events per year).
Figure 4.2 Hioki 3169-21 Clamp-On Power HiTester measuring power quality (PQ).
Using the below SAIDI and SAIFI values, it can be concluded that among the three
provinces, Riau has the worst reliability of electricity supply, followed by Papua in the
middle with customers in ENT having the highest reliability level. This contradicts the
initial assumption by the authors, as shown in Table 4.1, that Riau would have the best
reliability of power supply among the three provinces. Also, it is somewhat surprising
that the reported SAIDI for Papua in 2015 was only 1.4 h per year, which contradicts
the narratives of end-users. Therefore, we conclude that these official figures could be
questionable.
For further illustration, in Figure 4.3, the SAIDI and SAIFI are shown in small graphs
for the eight regions of Sumatra, WNT, Kalimantan, Sulawesi and Maluku, Java and Bali,
ENT, Papua, and the “Riau and Riau Islands”. As shown, from 2010 to 2015, the SAIDI
slightly decreased in Sumatra and Kalimantan, whereas in Papua, they decreased rapidly.
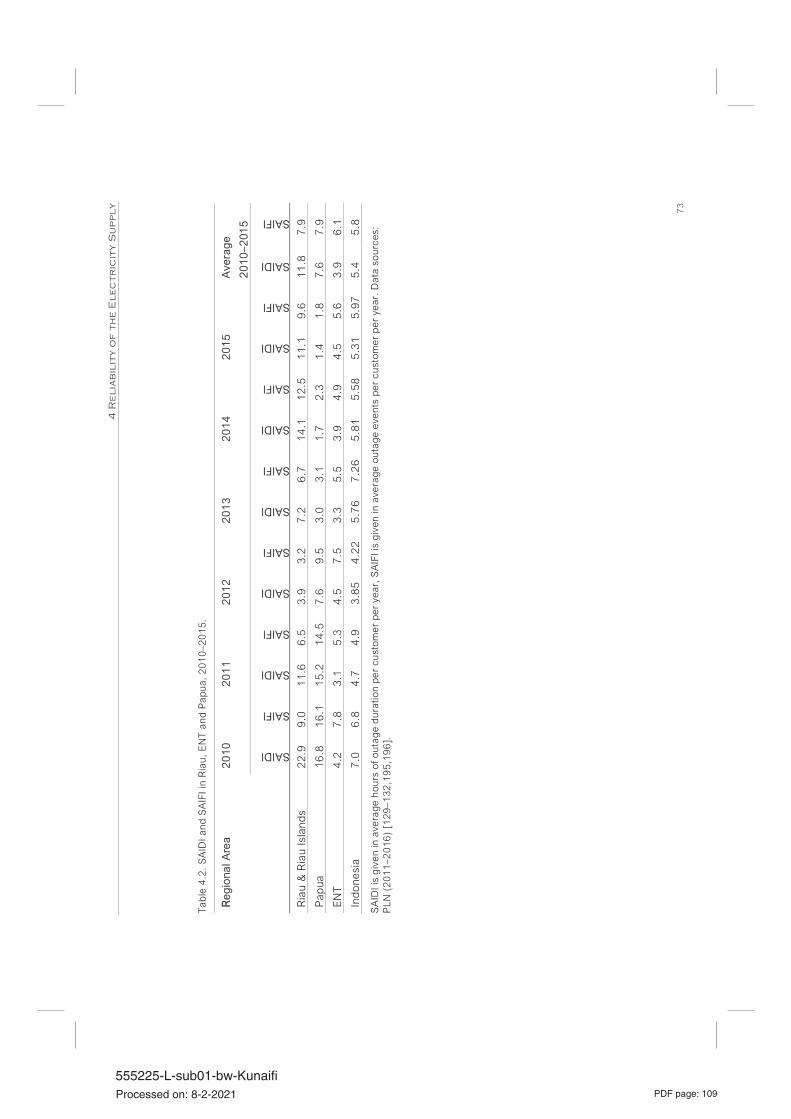
555225-L-sub01-bw-Kunaifi555225-L-sub01-bw-Kunaifi555225-L-sub01-bw-Kunaifi555225-L-sub01-bw-KunaifiProcessed on: 8-2-2021Processed on: 8-2-2021Processed on: 8-2-2021Processed on: 8-2-2021 PDF page: 109PDF page: 109PDF page: 109PDF page: 109
4 R
el
ia
bil
it
y o
f t
he
E
le
ct
ric
it
y S
up
pl
y
73
Ta
ble
4.2
. S
AID
I an
d S
AIF
I in
Ria
u,
EN
T a
nd
Pa
pua
, 2
01
0–2
01
5.
RReg
iona
l Are
a 2
01
0
20
11
2
01
2
20
13
2
01
4
20
15
A
vera
ge
20
10
–201
5
SAIDI
SAIFI
SAIDI
SAIFI
SAIDI
SAIFI
SAIDI
SAIFI
SAIDI
SAIFI
SAIDI
SAIFI
SAIDI
SAIFI
Ria
u &
Ria
u Is
lan
ds
22
.9
9.0
1
1.6
6
.5
3.9
3
.2
7.2
6
.7
14
.1
12
.5
11
.1
9.6
1
1.8
7
.9
Pap
ua
16
.8
16
.1
15
.2
14
.5
7.6
9
.5
3.0
3
.1
1.7
2
.3
1.4
1
.8
7.6
7
.9
EN
T
4.2
7
.8
3.1
5
.3
4.5
7
.5
3.3
5
.5
3.9
4
.9
4.5
5
.6
3.9
6
.1
Ind
on
esia
7
.0
6.8
4
.7
4.9
3
.85
4
.22
5
.76
7
.26
5
.81
5
.58
5
.31
5
.97
5
.4
5.8
SA
IDI i
s g
ive
n in
ave
rag
e h
ours
of o
uta
ge
du
ratio
n p
er
cust
om
er
pe
r ye
ar,
SA
IFI i
s g
iven
in a
vera
ge
out
ag
e ev
ent
s p
er
cust
ome
r p
er
year
. D
ata
so
urc
es:
PLN
(2
01
1–2
01
6)
[12
9–1
32
,19
5,1
96
].

555225-L-sub01-bw-Kunaifi555225-L-sub01-bw-Kunaifi555225-L-sub01-bw-Kunaifi555225-L-sub01-bw-KunaifiProcessed on: 8-2-2021Processed on: 8-2-2021Processed on: 8-2-2021Processed on: 8-2-2021 PDF page: 110PDF page: 110PDF page: 110PDF page: 110
4 R
el
ia
bil
it
y o
f t
he
E
le
ct
ric
it
y S
up
pl
y
74
Fig
ure
4.3
SA
IDI
in h
ou
rs o
f o
uta
ge
pe
r cu
stom
er
pe
r ye
ar a
nd
SA
IFI
in a
num
be
r o
f ou
tag
e e
vent
s p
er c
ust
ome
r p
er y
ear
for
vari
ous
loca
tion
s in
In
do
nesi
a
for
20
10
to
20
15
. D
ata
so
urc
es:
PL
N (
20
11
–20
16
) [1
29
–13
2,1
95
,19
6].
555225-L-sub01-bw-Kunaifi555225-L-sub01-bw-Kunaifi555225-L-sub01-bw-Kunaifi555225-L-sub01-bw-KunaifiProcessed on: 8-2-2021Processed on: 8-2-2021Processed on: 8-2-2021Processed on: 8-2-2021 PDF page: 111PDF page: 111PDF page: 111PDF page: 111
4 Reliability of the Electricity Supply
75
Conversely, the SAIDI in Java and Bali as well as for the whole of Indonesia only
changed slightly during this period, whereas in Sulawesi and Maluku a significant
increase of SAIDI took place in 2015. It can be concluded that outside the islands of
Java and Bali, the SAIDI and SAIFI can vary strongly depending on the location and the
year of reporting because in Indonesia the majority of the power production capacity is
located on Java and Bali (see Section 4.2.1).
44.4.2. Household Experiences
For the user survey, 300 questionnaires were distributed in the cities of Pekanbaru
(Riau Province), Kupang (ENT Province), and Jayapura (Papua Province) with an
average response rate of 68%. The target households were selected randomly, but the
respondents were required to be household members who are responsible for the
electricity service at home, such as contracting and payment. In Pekanbaru, 114
questionnaires were filled out in 19 days, in Kupang 65 questionnaires in 6 days, and in
Jayapura 26 questionnaires in 8 days.
The statistics of the respondents could be improved by increasing the quantity and
having a more equal distribution over the three cities and other demographic variables
to minimize bias. However, at the remote location of Jayapura, it was challenging to
involve end-users due to transportation constraints and low population density. Since
the number of respondents in Jayapura is significantly lower than those in Pekanbaru
and Kupang, information from Jayapura appears to be less significant in this study,
although it remains valuable as complementary information. Thus, the results of the user
study for Jayapura are presented differently and shown in italic fonts in the tables and
with slightly transparent color in the figures.
The demographics of the respondents are outlined in Appendix 4.A (Table 4.A1),
and the distribution of respondents by city address is shown in Figure 4.4. Most of the
respondents in Pekanbaru and Jayapura were upper-middle-income households, but in
Kupang, they originated from lower-middle-income groups.
A significant number of high-income households also participated in Pekanbaru
(respondents are classified into four groups of income based on the World Bank criteria
(2016); for 2016, low-income economies are defined as those with gross national
income (GNI) per capita of US$85 or less in 2015, lower-middle-income between US$86
and US$335, upper-middle-income between US$336 and US$1040, and high-income
economies are those with a GNI per capita of > US$1040 or more).
Also, in the three cities, most respondents (54% to 63%) were aged 30 to 49 years
followed by the age group of 50 to 64 years. In Jayapura, a significant number of younger
respondents with an age of 18 to 29 years participated. Regarding the level of education,
most of the respondents were well-educated, which means they attended high school or
higher education. However, in Jayapura, 85% of respondents were postgraduate degree
holders because the questionnaires were delivered at a university. Finally, the
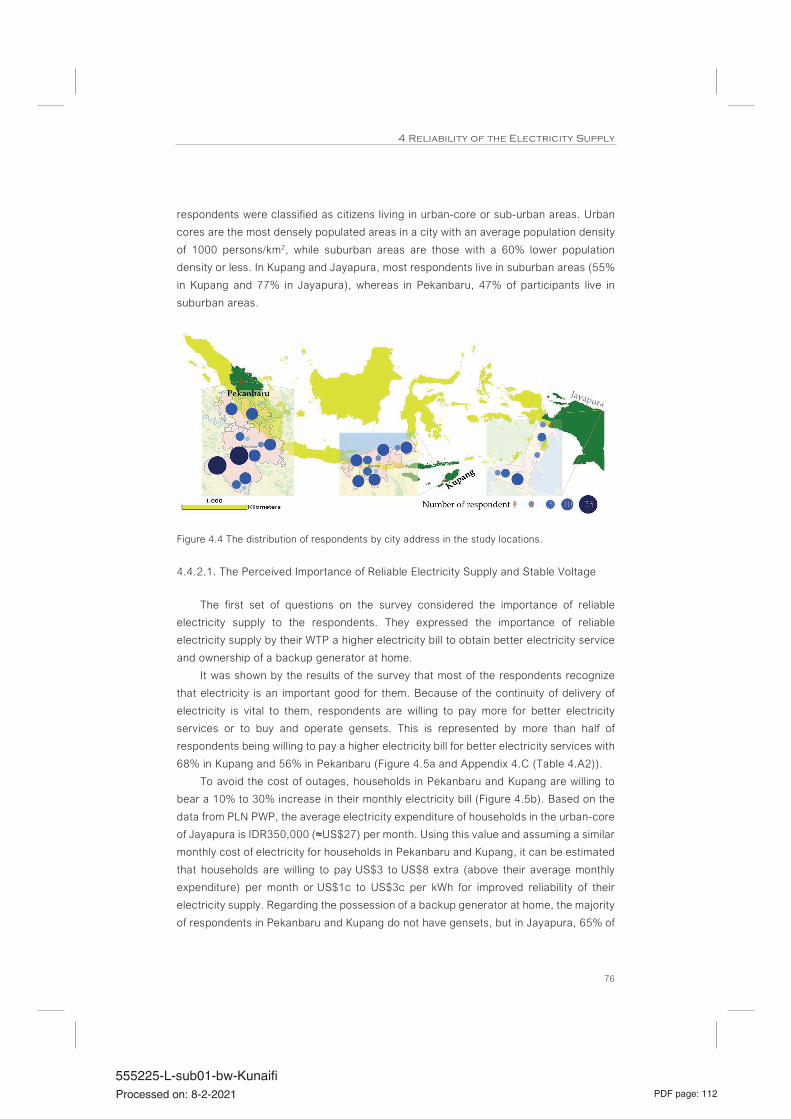
555225-L-sub01-bw-Kunaifi555225-L-sub01-bw-Kunaifi555225-L-sub01-bw-Kunaifi555225-L-sub01-bw-KunaifiProcessed on: 8-2-2021Processed on: 8-2-2021Processed on: 8-2-2021Processed on: 8-2-2021 PDF page: 112PDF page: 112PDF page: 112PDF page: 112
4 Reliability of the Electricity Supply
76
respondents were classified as citizens living in urban-core or sub-urban areas. Urban
cores are the most densely populated areas in a city with an average population density
of 1000 persons/km2, while suburban areas are those with a 60% lower population
density or less. In Kupang and Jayapura, most respondents live in suburban areas (55%
in Kupang and 77% in Jayapura), whereas in Pekanbaru, 47% of participants live in
suburban areas.
Figure 4.4 The distribution of respondents by city address in the study locations.
4.4.2.1. The Perceived Importance of Reliable Electricity Supply and Stable Voltage
The first set of questions on the survey considered the importance of reliable
electricity supply to the respondents. They expressed the importance of reliable
electricity supply by their WTP a higher electricity bill to obtain better electricity service
and ownership of a backup generator at home.
It was shown by the results of the survey that most of the respondents recognize
that electricity is an important good for them. Because of the continuity of delivery of
electricity is vital to them, respondents are willing to pay more for better electricity
services or to buy and operate gensets. This is represented by more than half of
respondents being willing to pay a higher electricity bill for better electricity services with
68% in Kupang and 56% in Pekanbaru (Figure 4.5a and Appendix 4.C (Table 4.A2)).
To avoid the cost of outages, households in Pekanbaru and Kupang are willing to
bear a 10% to 30% increase in their monthly electricity bill (Figure 4.5b). Based on the
data from PLN PWP, the average electricity expenditure of households in the urban-core
of Jayapura is IDR350,000 (≈US$27) per month. Using this value and assuming a similar
monthly cost of electricity for households in Pekanbaru and Kupang, it can be estimated
that households are willing to pay US$3 to US$8 extra (above their average monthly
expenditure) per month or US$1c to US$3c per kWh for improved reliability of their
electricity supply. Regarding the possession of a backup generator at home, the majority
of respondents in Pekanbaru and Kupang do not have gensets, but in Jayapura, 65% of
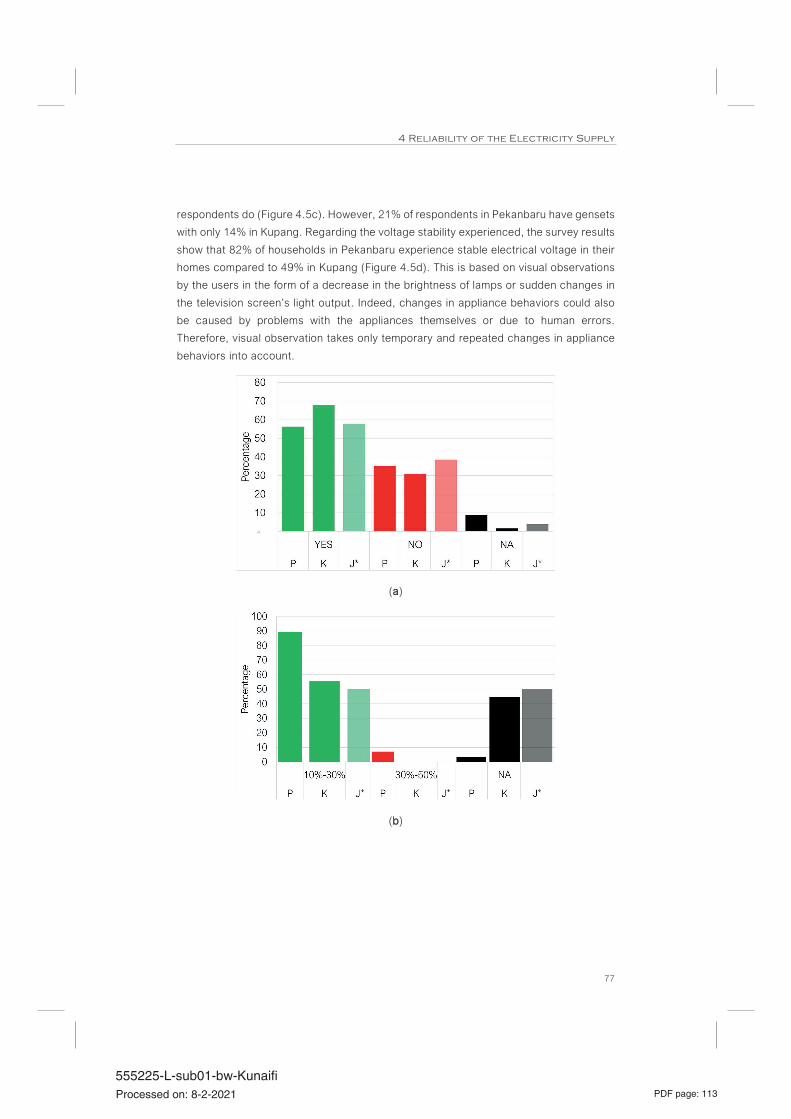
555225-L-sub01-bw-Kunaifi555225-L-sub01-bw-Kunaifi555225-L-sub01-bw-Kunaifi555225-L-sub01-bw-KunaifiProcessed on: 8-2-2021Processed on: 8-2-2021Processed on: 8-2-2021Processed on: 8-2-2021 PDF page: 113PDF page: 113PDF page: 113PDF page: 113
4 Reliability of the Electricity Supply
77
respondents do (Figure 4.5c). However, 21% of respondents in Pekanbaru have gensets
with only 14% in Kupang. Regarding the voltage stability experienced, the survey results
show that 82% of households in Pekanbaru experience stable electrical voltage in their
homes compared to 49% in Kupang (Figure 4.5d). This is based on visual observations
by the users in the form of a decrease in the brightness of lamps or sudden changes in
the television screen’s light output. Indeed, changes in appliance behaviors could also
be caused by problems with the appliances themselves or due to human errors.
Therefore, visual observation takes only temporary and repeated changes in appliance
behaviors into account.
(aa)
(bb)
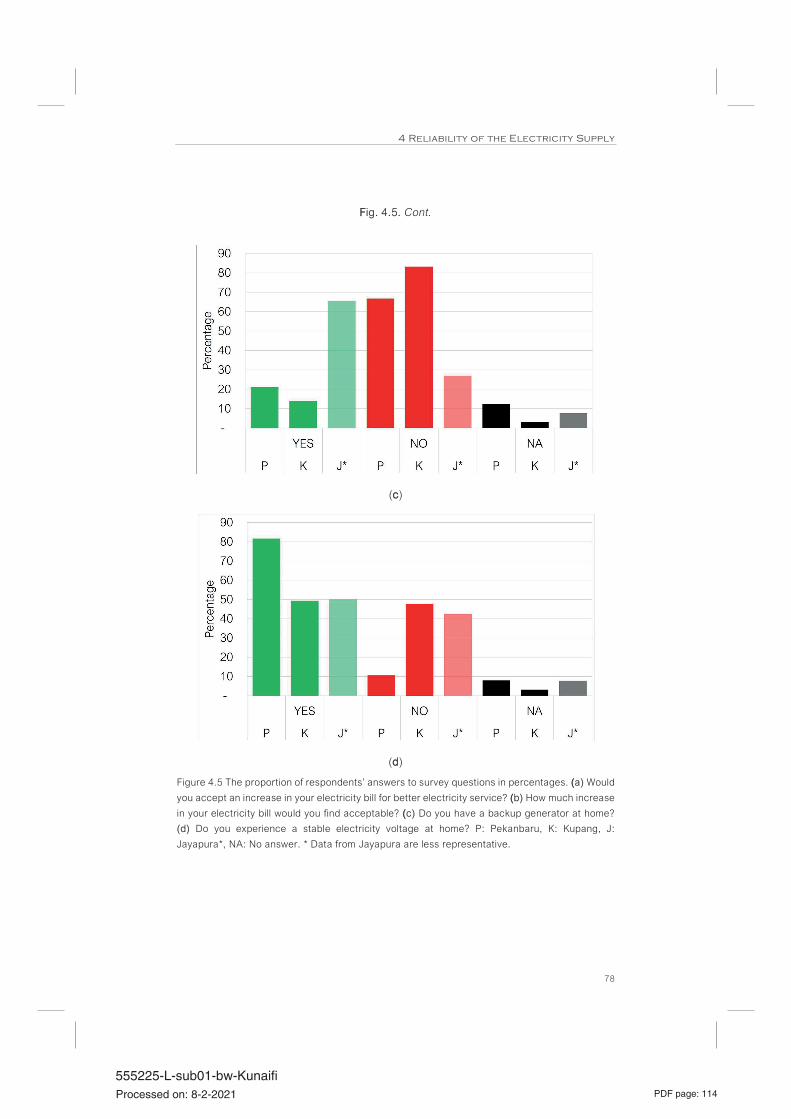
555225-L-sub01-bw-Kunaifi555225-L-sub01-bw-Kunaifi555225-L-sub01-bw-Kunaifi555225-L-sub01-bw-KunaifiProcessed on: 8-2-2021Processed on: 8-2-2021Processed on: 8-2-2021Processed on: 8-2-2021 PDF page: 114PDF page: 114PDF page: 114PDF page: 114
4 Reliability of the Electricity Supply
78
FFig. 4.5. Cont.
(cc)
(dd)
Figure 4.5 The proportion of respondents’ answers to survey questions in percentages. ((a) Would
you accept an increase in your electricity bill for better electricity service? ((b) How much increase
in your electricity bill would you find acceptable? ((c) Do you have a backup generator at home?
(d) Do you experience a stable electricity voltage at home? P: Pekanbaru, K: Kupang, J:
Jayapura*, NA: No answer. * Data from Jayapura are less representative.
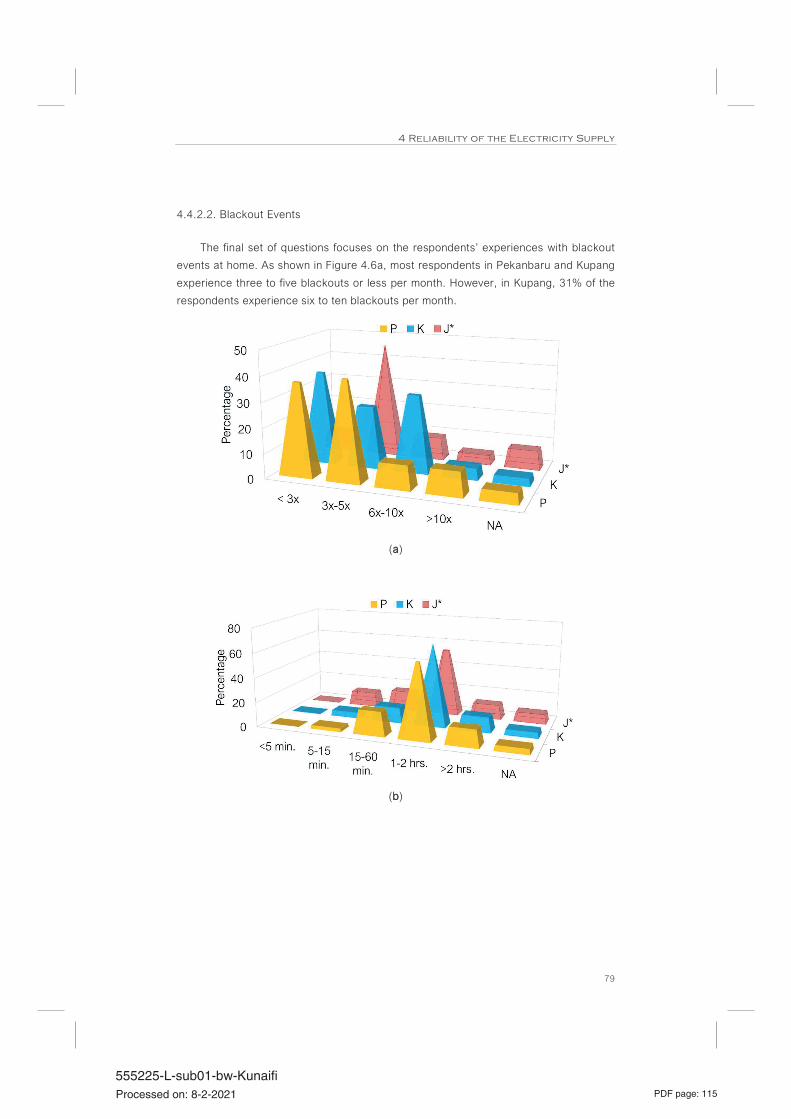
555225-L-sub01-bw-Kunaifi555225-L-sub01-bw-Kunaifi555225-L-sub01-bw-Kunaifi555225-L-sub01-bw-KunaifiProcessed on: 8-2-2021Processed on: 8-2-2021Processed on: 8-2-2021Processed on: 8-2-2021 PDF page: 115PDF page: 115PDF page: 115PDF page: 115
4 Reliability of the Electricity Supply
79
4.4.2.2. Blackout Events
The final set of questions focuses on the respondents’ experiences with blackout
events at home. As shown in Figure 4.6a, most respondents in Pekanbaru and Kupang
experience three to five blackouts or less per month. However, in Kupang, 31% of the
respondents experience six to ten blackouts per month.
(aa)
(bb)

555225-L-sub01-bw-Kunaifi555225-L-sub01-bw-Kunaifi555225-L-sub01-bw-Kunaifi555225-L-sub01-bw-KunaifiProcessed on: 8-2-2021Processed on: 8-2-2021Processed on: 8-2-2021Processed on: 8-2-2021 PDF page: 116PDF page: 116PDF page: 116PDF page: 116
4 Reliability of the Electricity Supply
80
FFig. 4.6. Cont.
(cc)
(dd)
Figure 4.6 The proportion of respondents’ answers to the following questions, in percentages: (a)
On average, how often do you experience blackouts in a month? ((b) On average, how long is the
duration of the blackouts that you experience? ((c) At what time of day would a blackout event
incur the most losses for you? ((d) On average, how long is the duration of a blackout that would
incur any losses for you? P: Pekanbaru, K: Kupang, J: Jayapura *, NA: No answer. * Data from
Jayapura are less representative.
Only two households of all the respondents in the three cities stated that they never
encountered any outage. The average duration of each blackout event typically is one
to two hours for more than half of the respondents in each city (Figure 4.6b). Around
12% to 15% of respondents experienced an outage with a duration of more than two
hours each. None of the respondents experienced a blackout of fewer than five minutes.
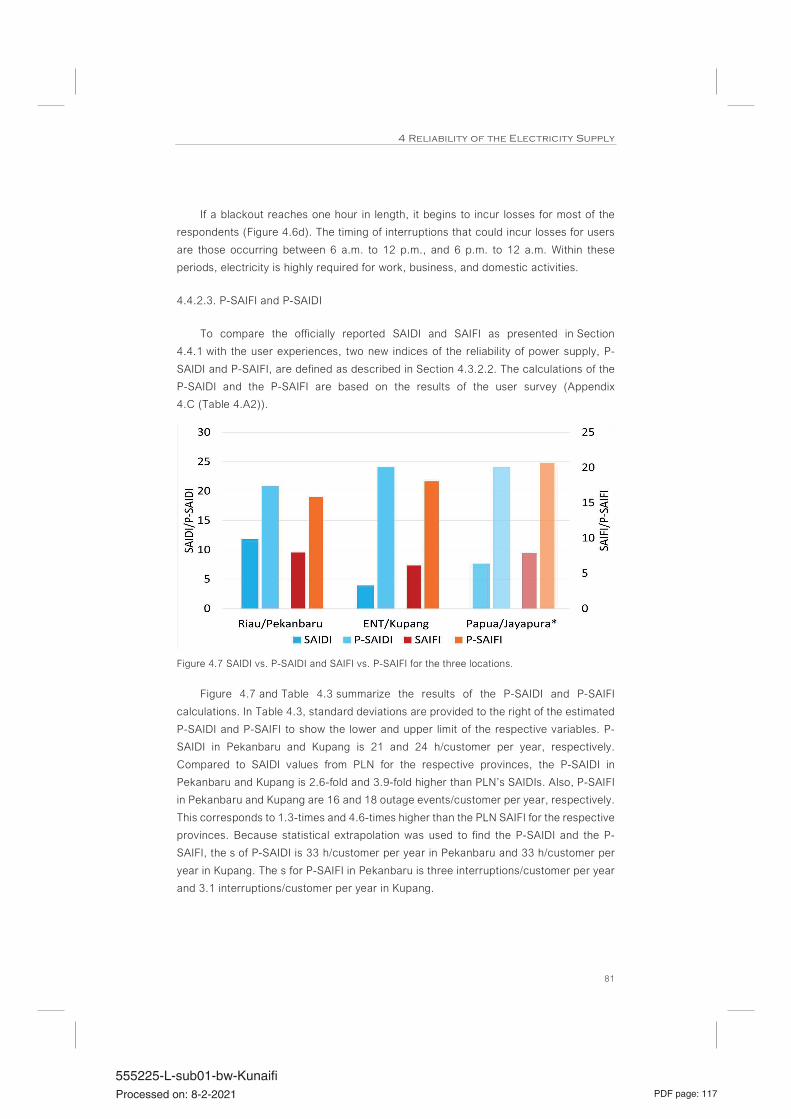
555225-L-sub01-bw-Kunaifi555225-L-sub01-bw-Kunaifi555225-L-sub01-bw-Kunaifi555225-L-sub01-bw-KunaifiProcessed on: 8-2-2021Processed on: 8-2-2021Processed on: 8-2-2021Processed on: 8-2-2021 PDF page: 117PDF page: 117PDF page: 117PDF page: 117
4 Reliability of the Electricity Supply
81
If a blackout reaches one hour in length, it begins to incur losses for most of the
respondents (Figure 4.6d). The timing of interruptions that could incur losses for users
are those occurring between 6 a.m. to 12 p.m., and 6 p.m. to 12 a.m. Within these
periods, electricity is highly required for work, business, and domestic activities.
4.4.2.3. P-SAIFI and P-SAIDI
To compare the officially reported SAIDI and SAIFI as presented in Section
4.4.1 with the user experiences, two new indices of the reliability of power supply, P-
SAIDI and P-SAIFI, are defined as described in Section 4.3.2.2. The calculations of the
P-SAIDI and the P-SAIFI are based on the results of the user survey (Appendix
4.C (Table 4.A2)).
Figure 4.7 SAIDI vs. P-SAIDI and SAIFI vs. P-SAIFI for the three locations.
Figure 4.7 and Table 4.3 summarize the results of the P-SAIDI and P-SAIFI
calculations. In Table 4.3, standard deviations are provided to the right of the estimated
P-SAIDI and P-SAIFI to show the lower and upper limit of the respective variables. P-
SAIDI in Pekanbaru and Kupang is 21 and 24 h/customer per year, respectively.
Compared to SAIDI values from PLN for the respective provinces, the P-SAIDI in
Pekanbaru and Kupang is 2.6-fold and 3.9-fold higher than PLN’s SAIDIs. Also, P-SAIFI
in Pekanbaru and Kupang are 16 and 18 outage events/customer per year, respectively.
This corresponds to 1.3-times and 4.6-times higher than the PLN SAIFI for the respective
provinces. Because statistical extrapolation was used to find the P-SAIDI and the P-
SAIFI, the s of P-SAIDI is 33 h/customer per year in Pekanbaru and 33 h/customer per
year in Kupang. The s for P-SAIFI in Pekanbaru is three interruptions/customer per year
and 3.1 interruptions/customer per year in Kupang.

555225-L-sub01-bw-Kunaifi555225-L-sub01-bw-Kunaifi555225-L-sub01-bw-Kunaifi555225-L-sub01-bw-KunaifiProcessed on: 8-2-2021Processed on: 8-2-2021Processed on: 8-2-2021Processed on: 8-2-2021 PDF page: 118PDF page: 118PDF page: 118PDF page: 118
4 Reliability of the Electricity Supply
82
Table 4.3. Perceived and reported SAIDI and SAIFI.
PParameter Unit P K J *
SAIDI hours/customer per year 7.9 6.1 7.9
SAIFI number of interruption/customer per year 11.8 3.9 7.6
P-SAIDI hours/customer per year 21±33 24±33 24±39
P-SAIFI number of interruption/customer per year 16±3 18±3 21±3
* Data from Jayapura are less representative.
4.4.3. Results from Measurements at the Distribution Grid
As described in Section 4.3.2.2, the voltage at the distribution grid was recorded
at 1 min intervals for 15 days in Pekanbaru, 5 days in Kupang, and 7 days in
Jayapura. Figure 4.8 shows the time series of voltage measurements at the three
locations. As shown, based on the Ministry of Energy and Mineral Resources guideline
[203], the average nominal voltage is 220 V, the highest allowable voltage limit is 242
V, and the lowest allowable limit is 198 V. The voltage level at the measurement point in
Pekanbaru tends to be lower than the average nominal voltage (Figure 4.8a). During 15
days of measurement in Pekanbaru, there were 10 days when the voltage dropped below
the lowest allowable voltage limit. Unlike in Pekanbaru, during the 5-day and 7-day
measurement in Kupang (Figure 4.8b) and Jayapura (Figure 4.8c), voltages were always
within the allowable limits, although they tended to be higher than the nominal voltage,
except for two days where the voltage in Jayapura was lower than the average nominal
voltage. Figure 4.9 presents blackout events in the three locations at which power was
measured at the distribution grid. Several blackout events with different durations
occurred in each city during the relatively short measurement period.
It is shown in Figure 4.9a that two blackouts were recorded in Pekanbaru during
the 15 days of measurement. Outage events in Pekanbaru lasted 33 min or longer.
Further, in Kupang (Figure 4.8b), within a shorter period of measurement of 5 days, two
blackout events were observed. Outage events in Kupang lasted longer than those in
Pekanbaru (more than 153 min). Also, in Jayapura, three blackouts were captured within
7 days of measurement, ranging from 10 to 40 min. By combining the daily-averaged
outage durations from measurements in the three cities, it can be concluded that the
outage duration in Kupang was worst, with 74.2 min of outage per day on average,
whereas in Jayapura only 10 min of outage per day was measured and only 5.8 min per
day in Pekanbaru. It must be said here that these outage duration values are very high
compared to many other places in the world and Indonesia. Also, it is useful that the
findings from Figure 4.9 were confirmed by the results of the user survey (see Section
4.2.3).

555225-L-sub01-bw-Kunaifi555225-L-sub01-bw-Kunaifi555225-L-sub01-bw-Kunaifi555225-L-sub01-bw-KunaifiProcessed on: 8-2-2021Processed on: 8-2-2021Processed on: 8-2-2021Processed on: 8-2-2021 PDF page: 119PDF page: 119PDF page: 119PDF page: 119
4 R
el
ia
bil
it
y o
f t
he
E
le
ct
ric
it
y S
up
pl
y
83
(aa)
(bb)
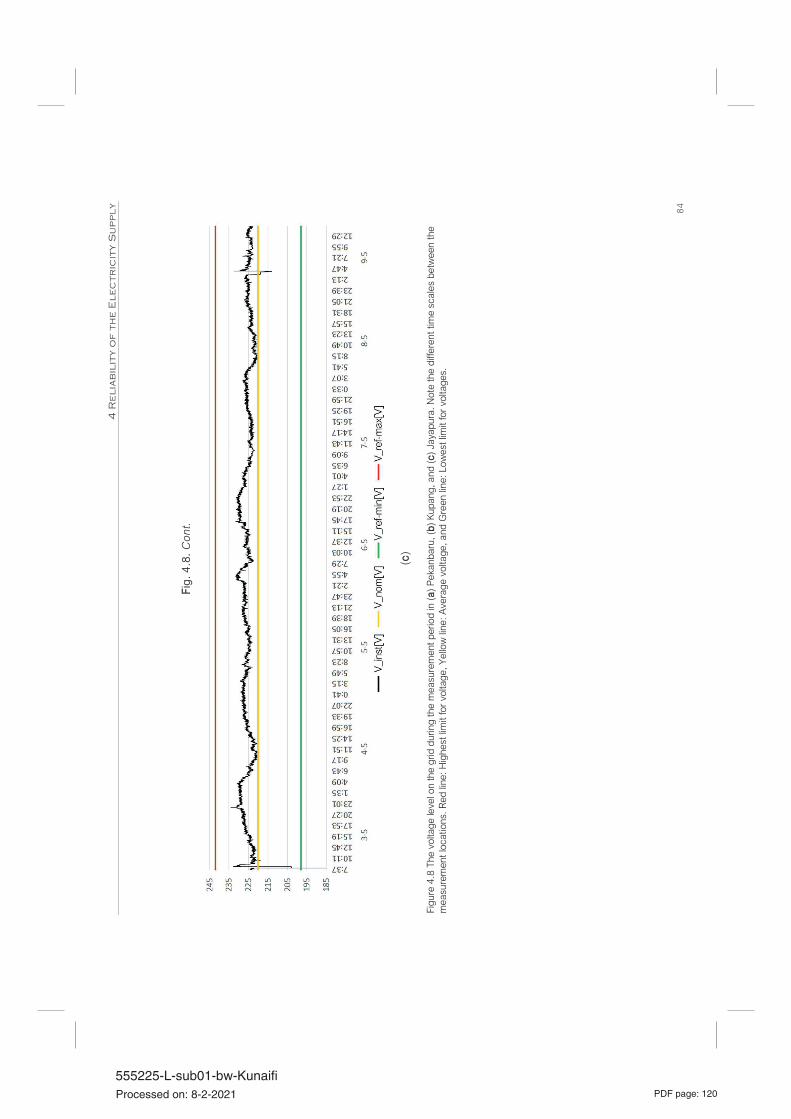
555225-L-sub01-bw-Kunaifi555225-L-sub01-bw-Kunaifi555225-L-sub01-bw-Kunaifi555225-L-sub01-bw-KunaifiProcessed on: 8-2-2021Processed on: 8-2-2021Processed on: 8-2-2021Processed on: 8-2-2021 PDF page: 120PDF page: 120PDF page: 120PDF page: 120
4 R
el
ia
bil
it
y o
f t
he
E
le
ct
ric
it
y S
up
pl
y
84
FFig
. 4
.8.
Co
nt.
(cc)
Figu
re 4
.8 T
he v
olta
ge le
vel o
n th
e gr
id d
urin
g th
e m
easu
rem
ent p
erio
d in
(aa)
Pek
anba
ru, (
bb) K
upan
g, a
nd (
cc) J
ayap
ura.
Not
e th
e di
ffere
nt ti
me
scal
es b
etw
een
the
mea
sure
men
t loc
atio
ns. R
ed li
ne: H
ighe
st li
mit
for
volta
ge, Y
ello
w li
ne: A
vera
ge v
olta
ge, a
nd G
reen
line
: Low
est l
imit
for
volta
ges.
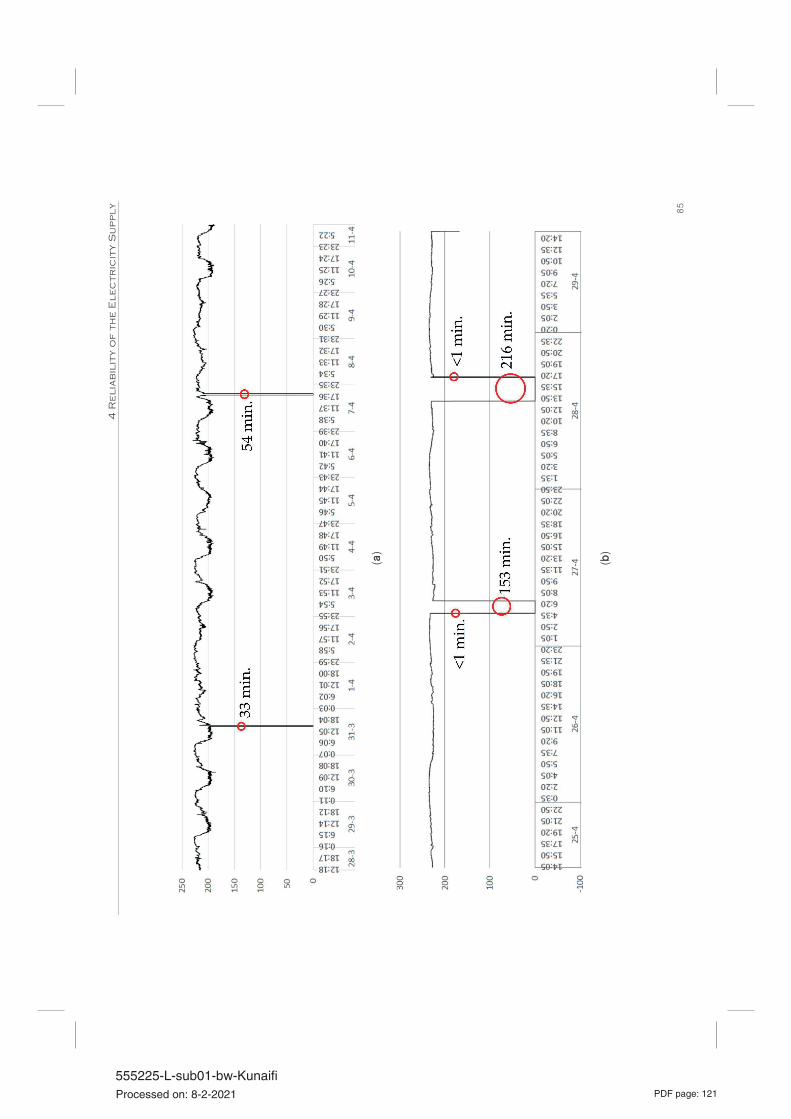
555225-L-sub01-bw-Kunaifi555225-L-sub01-bw-Kunaifi555225-L-sub01-bw-Kunaifi555225-L-sub01-bw-KunaifiProcessed on: 8-2-2021Processed on: 8-2-2021Processed on: 8-2-2021Processed on: 8-2-2021 PDF page: 121PDF page: 121PDF page: 121PDF page: 121
4 R
el
ia
bil
it
y o
f t
he
E
le
ct
ric
it
y S
up
pl
y
85
(aa)
(bb)

555225-L-sub01-bw-Kunaifi555225-L-sub01-bw-Kunaifi555225-L-sub01-bw-Kunaifi555225-L-sub01-bw-KunaifiProcessed on: 8-2-2021Processed on: 8-2-2021Processed on: 8-2-2021Processed on: 8-2-2021 PDF page: 122PDF page: 122PDF page: 122PDF page: 122
4 R
el
ia
bil
it
y o
f t
he
E
le
ct
ric
it
y S
up
pl
y
86
FFig
. 4
.9.
Co
nt.
(cc)
Fig
ure
4.9
Bla
ckou
t ev
ent
s d
uri
ng
the
mea
sure
me
nt p
erio
d i
n (
aa)
Pek
an
ba
ru,
(bb)
Ku
pan
g,
an
d (
cc) J
aya
pu
ra.
No
te t
he
diff
ere
nt
time
scal
es
bet
wee
n th
e
mea
sure
me
nt lo
catio
ns.
Re
d c
ircl
es in
dic
ate
bla
cko
ut e
vent
s a
nd
the
ir d
ura
tion
in m
inut
es.

555225-L-sub01-bw-Kunaifi555225-L-sub01-bw-Kunaifi555225-L-sub01-bw-Kunaifi555225-L-sub01-bw-KunaifiProcessed on: 8-2-2021Processed on: 8-2-2021Processed on: 8-2-2021Processed on: 8-2-2021 PDF page: 123PDF page: 123PDF page: 123PDF page: 123
4 Reliability of the Electricity Supply
87
44.5. Discussion and Conclusions
This chapter explores end-user experiences regarding the reliability of electricity
supply in their homes and compares the reliability indices reported by the national utility
company for the cities of Pekanbaru in the Province of Riau, Kupang in the Province of
ENT, and Jayapura in the Province of Papua, Indonesia. The research was conducted
using a desk study and a user survey.
4.5.1. Desk Study, User Study, and Grid Measurements
The results of the desk study can be seen in Section 4.4.1, which reviews SAIDI,
SAIFI, and ER. Using regression analysis, it was shown that there is a significant positive
relationship between SAIDI and SAIFI, r(5) = 0.85, p < 0.0015 (Figure 4.10) (the “r” is
the correlation coefficient of two variables for which values range from −1.0 to +1.0; the
closer r is to +1.0 or −1.0, the closer the two variables are related; there is no evidence
of correlation if r is close to 0. A positive linear correlation exists if r is positive, and a
negative linear correlation exists if r is negative. The “p” value is used to check whether
the calculated “r” is significant. If the p < 0.05, then the result is statistically significant,
and if p > 0.05, then the result is nonsignificant). However, SAIDI and ER and SAIFI and
ER show less significant negative correlations, respectively, with r(5) = −0.1, p < 0.8
and r(5) = −0.3, p < 0.5. Therefore, the ER values of a province cannot be used as an
indicator of the level of reliability of the power supply.
In Section 4.4.2, the results from the user study were presented with a comparison
of the reported and perceived SAIDI and SAIFI. Also presented are the WTP, households’
incomes, and genset possession. The results from the user study show there are
significant gaps between the official and perceived reliability indices. The implication of
these gaps is clear: the reported reliability indices do not always demonstrate the
experience of the grid users. It is obvious that both reliability indices, those reported by
PLN and those introduced in this study, have advantages and drawbacks. On the one
hand, the PLN SAIFI and SAIDI data are likely generated based on careful
documentation of actual outages, which could offer more reliable information. However,
because they are based on large provincial areas ranging from 664 km2 to 154,000 km2,
they do not distinguish between urban and rural areas. On the other hand, the perceived
reliability indices introduced in this study are based at the city level with smaller
resolution areas of 180 km2 to 936 km2, which could result in better accuracy.

555225-L-sub01-bw-Kunaifi555225-L-sub01-bw-Kunaifi555225-L-sub01-bw-Kunaifi555225-L-sub01-bw-KunaifiProcessed on: 8-2-2021Processed on: 8-2-2021Processed on: 8-2-2021Processed on: 8-2-2021 PDF page: 124PDF page: 124PDF page: 124PDF page: 124
4 Reliability of the Electricity Supply
88
Figure 4.10 Correlations between SAIDI (blue bar) and SAIFI (orange bar), the electrification ratio
(grey line), and SAIFI and electrification ratio.
However, our indices are based on the user’s perspective, which could be biased,
but it can be enhanced using a correction factor as presented above. Further, it is
interesting to observe the relations between different variables, such as P-SAIDI, P-
SAIFI, households’ income, and WTP (Figure 4.11). Relations are shown in the scatter
graphs (Figure 4.11), which were generated using the “randbetween” function in
Microsoft Excel based on ranges of corresponding data originated from the
questionnaires (because the monthly incomes of some respondents can reach
above US$1500, whereas the values of other variables are much lower, the household
incomes in Figure 4.11 are shown in multiples of 10 to allow for the same scaling on
other variables.). This approach was also used by DeCaria et al. [204], Sterbova et al.
[205], and Stout and Tawney [206]. As shown, there are strong positive correlations
between P-SAIDI and P-SAIFI in Pekanbaru and Kupang with the R2 values of 0.8 and
0.6, respectively, as is also valid for the correlation between the reported SAIDI and
SAIFI (Figure 4.10).
As shown in Figure 4.11, P-SAIDI have weak negative correlations to household
income in Pekanbaru and Kupang, with R2 values of −0.06 and −0.01, respectively. Our
analysis found that high-middle income and high-income households experience a
slightly higher P-SAIDI than those from low-middle and low-income households. In
Kupang, higher P-SAIDI are experienced by low-income households, which are followed
by high-middle income households, but low-middle income and high-income households
experience fewer outages than the other income groups.
A weak positive correlation can be found between P-SAIDI and WTP in Pekanbaru
with an R2 value of 0.14. However, in Kupang, a weaker correlation between the two
variables exists with the R2 value of −0.002. This finding is somewhat similar to the
results of a study by Sagebiel and Rommel (2014) in India [188]. An interesting finding
0
10
20
30
40
50
60
70
80
90
0
2
4
6
8
10
12
Java & Bali Sumatera Kalimantan Sulawesi Maluku Papua NusaTenggara
ER (%
)
SAID
I (ho
urs/
cust
omer
per
yea
r)SA
IFI (
even
t/cu
stom
er p
er y
ear)
SAIDI SAIFI ER

555225-L-sub01-bw-Kunaifi555225-L-sub01-bw-Kunaifi555225-L-sub01-bw-Kunaifi555225-L-sub01-bw-KunaifiProcessed on: 8-2-2021Processed on: 8-2-2021Processed on: 8-2-2021Processed on: 8-2-2021 PDF page: 125PDF page: 125PDF page: 125PDF page: 125
4 Reliability of the Electricity Supply
89
of our analysis shows that in Pekanbaru and Kupang more low-medium income
households are willing to pay extra for improved power reliability, although this income
group experiences fewer outages. The WTP among high-income households is rather
low. Even in Kupang, low-income households have higher WTP than high-income
households. This is because high-income households often own gensets, which incur an
extra cost of operation and maintenance, and this makes them rather reluctant to spend
even more for improved electricity service. The increase in the monthly electricity bill for
improved electricity service in the cities in Indonesia of 10% to 30% is somewhat higher
than those in other countries. However, the values in dollars, a US$3 to US$8 increase
for a comparable outage duration, can also be found in other countries, such as
Cyprus [184] and Sweden [207]. Therefore, it can be concluded that the WTP is a factor
of the outage duration [207] as well as the factor of genset ownership. The latter is due
to the assumption among respondents that “improved reliability” does not imply a
complete escape from outages, which means an expenditure for gensets and other costs
may still be needed. This conclusion agrees with Murphy et al. [161] that users
demanding more reliable electricity can expect an increased, and “justifiable”, cost of
energy. This is because to achieve the desired level of reliability, additional costs to add
other equipment to the existing systems are needed. However, financial incentives,
which are usually provided for renewable electricity, could help customers deal with
additional costs to achieve a reliable electricity supply [208].
(aa)
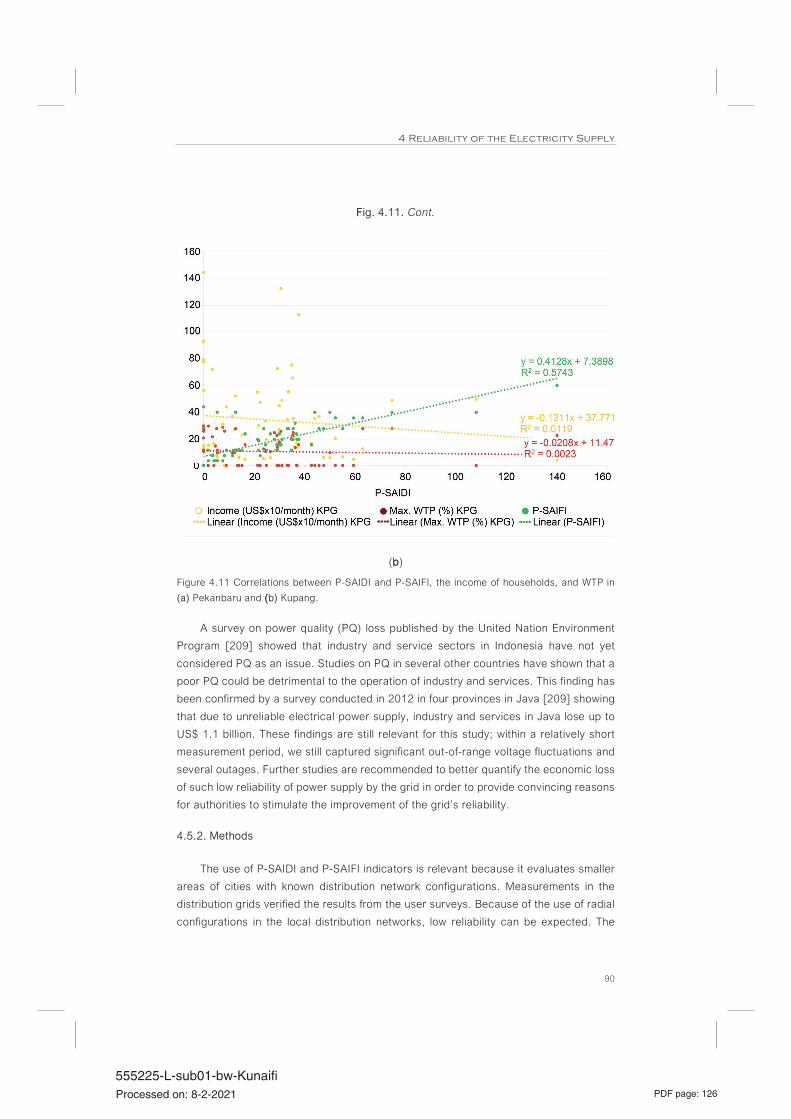
555225-L-sub01-bw-Kunaifi555225-L-sub01-bw-Kunaifi555225-L-sub01-bw-Kunaifi555225-L-sub01-bw-KunaifiProcessed on: 8-2-2021Processed on: 8-2-2021Processed on: 8-2-2021Processed on: 8-2-2021 PDF page: 126PDF page: 126PDF page: 126PDF page: 126
4 Reliability of the Electricity Supply
90
FFig. 4.11. Cont.
(bb)
Figure 4.11 Correlations between P-SAIDI and P-SAIFI, the income of households, and WTP in
(a) Pekanbaru and ((b) Kupang.
A survey on power quality (PQ) loss published by the United Nation Environment
Program [209] showed that industry and service sectors in Indonesia have not yet
considered PQ as an issue. Studies on PQ in several other countries have shown that a
poor PQ could be detrimental to the operation of industry and services. This finding has
been confirmed by a survey conducted in 2012 in four provinces in Java [209] showing
that due to unreliable electrical power supply, industry and services in Java lose up to
US$ 1.1 billion. These findings are still relevant for this study; within a relatively short
measurement period, we still captured significant out-of-range voltage fluctuations and
several outages. Further studies are recommended to better quantify the economic loss
of such low reliability of power supply by the grid in order to provide convincing reasons
for authorities to stimulate the improvement of the grid’s reliability.
4.5.2. Methods
The use of P-SAIDI and P-SAIFI indicators is relevant because it evaluates smaller
areas of cities with known distribution network configurations. Measurements in the
distribution grids verified the results from the user surveys. Because of the use of radial
configurations in the local distribution networks, low reliability can be expected. The
555225-L-sub01-bw-Kunaifi555225-L-sub01-bw-Kunaifi555225-L-sub01-bw-Kunaifi555225-L-sub01-bw-KunaifiProcessed on: 8-2-2021Processed on: 8-2-2021Processed on: 8-2-2021Processed on: 8-2-2021 PDF page: 127PDF page: 127PDF page: 127PDF page: 127
4 Reliability of the Electricity Supply
91
radial configuration offers a simple topology and is cost-effective, but has lower reliability
[210]. The local nature of this study, therefore, could represent the situation in a larger
area because depending on the point where an interruption occurs in the radial network,
it could affect a larger area along the network lines. However, a more detailed study
concerning factors that contribute to the low reliability of the distribution networks in the
Indonesia supply would be valuable.
The method applied in calculating SAIDI and SAIFI and the approach to estimate P-
SAIDI and P-SAIFI are relatively similar. SAIDI and SAIFI are calculated by dividing the
total minutes of outages and the total frequency of outages, respectively, in the study
area by the number of customers served by the grid (see Equations (4.1) and (4.2)). The
final results of the calculations are outage duration per customer per year, for SAIDI,
and outage frequency per customer per year, for SAIFI. Therefore, it is not surprising
that the unit of SAIDI is the same as the unit of P-SAIDI, as also applies to the units of
SAIFI and P-SAIFI. The main difference between the two types of indices is the source
of data input for the calculations. The SAIDI and SAIFI calculations use data collected
by the utility, whereas the calculations of P-SAIDI and P-SAIFI are based on the end-
user experiences.
44.5.3. Limitations of the Study
Like all studies involving field research, our research also includes limitations due
to the availability of time and person-hours for the execution of the research at three
locations geographically located far from each other. This situation and a few other
factors that could affect the results are explained as follows:
1) While the values for SAIDI and SAIFI are provincial, our study occurred at specific
locations, namely in the capital cities of the three provinces. However, it is still
surprising that the officially reported values of reliability indices are lower than those
recorded by measurements on the grid and reported by end-users. In fact, higher
values can be expected for the officially reported SAIDI and SAIFI because they cover
the whole province, which contains urban areas, with a relatively high-quality supply
of electricity, and rural areas, which tend to have a lower power quality. It would,
therefore, be valuable to expand this study to other locations in these provinces and
other provinces to produce more evidence. This study offers a good start, which
might be continued by other researchers.
2) The 26 respondents in Jayapura are not a representative sample for this study.
Therefore, given the importance of the opinions from the end-users regarding the
reliability of the electricity supply, the number of respondents in a future follow-up
study should be increased to improve the statistics. Then, the statistic of respondents
could also be more equally distributed over the three locations, levels of income, and

555225-L-sub01-bw-Kunaifi555225-L-sub01-bw-Kunaifi555225-L-sub01-bw-Kunaifi555225-L-sub01-bw-KunaifiProcessed on: 8-2-2021Processed on: 8-2-2021Processed on: 8-2-2021Processed on: 8-2-2021 PDF page: 128PDF page: 128PDF page: 128PDF page: 128
4 Reliability of the Electricity Supply
92
other demographic variables to minimize any bias. Similarly, the duration of the
measurements of the electricity grid could be increased.
3) In our study, income-bias of the respondents were not accounted for. As a result, this
study mostly represents high and upper-middle-income classes.
However, apart from these potential points of improvement, this study is unique and
fills a void in existing real-life data on experienced power quality, and it confirms our
initial hypothesis that the reported indices of the reliability of the power supply from PLN
are lower than the user experience. Using the Perceived- (P) SAIDI and P-SAIFI we
introduced for the Provinces of Riau, ENT, and Papua, end-users experience more
frequent and longer duration outages compared to the reported SAIDI and SAIFI. Users
experience a larger number of outages and longer duration for each interruption than
those that are reported by the authority. P-SAIFIs are 4-fold to 14-fold higher than the
PLN’s SAIFIs. Also, P-SAIDIs are 8-times to 12-times the PLN’s SAIDIs for the
corresponding provinces. As far as we know, this is the first independent study in
Indonesia to evaluate the user experiences on the reliability of the power supply by the
distribution grid and how the user experiences compare to the reported data from the
utility. It can be concluded that the reliability of the power supply in these three cities in
Indonesia could be improved considerably.
555225-L-sub01-bw-Kunaifi555225-L-sub01-bw-Kunaifi555225-L-sub01-bw-Kunaifi555225-L-sub01-bw-KunaifiProcessed on: 8-2-2021Processed on: 8-2-2021Processed on: 8-2-2021Processed on: 8-2-2021 PDF page: 129PDF page: 129PDF page: 129PDF page: 129
93
The Attitudes of
End-Users of the
Electricity Grid
This Chapter is based on “Kunaifi, K.; Veldhuis, A.J.; Reinders, A.H.M.E. The Electricity Grid in Indonesia: The Experiences of End-users and Their Attitudes Toward Solar Photovoltaics; Springer: Cham, Switzerland, 2020; Chapter 4: The Attitudes of End-Users Toward Solar Photovoltaics. Springer, pp. 67-73, ISBN 978-3-030-38341-1.”

555225-L-sub01-bw-Kunaifi555225-L-sub01-bw-Kunaifi555225-L-sub01-bw-Kunaifi555225-L-sub01-bw-KunaifiProcessed on: 8-2-2021Processed on: 8-2-2021Processed on: 8-2-2021Processed on: 8-2-2021 PDF page: 130PDF page: 130PDF page: 130PDF page: 130
4 Reliability of the Electricity Supply
94

555225-L-sub01-bw-Kunaifi555225-L-sub01-bw-Kunaifi555225-L-sub01-bw-Kunaifi555225-L-sub01-bw-KunaifiProcessed on: 8-2-2021Processed on: 8-2-2021Processed on: 8-2-2021Processed on: 8-2-2021 PDF page: 131PDF page: 131PDF page: 131PDF page: 131
95
CChapter 5. The Attitudes of End-
Users of the Electricity Grid
5.1. Preface
In Chapter 4, we presented the results from a series of surveys at three different
locations in Indonesia, namely in the islands of Sumatra, Timor, and Papua. The
discussion focused on the experiences of end-users of the electricity grid regarding the
reliability of the electricity supply. In this chapter, using data from the same survey, we
will present additional findings regarding the awareness of the households about
renewable energy and climate change and their attitudes towards solar photovoltaics.
The methods used in data collection and data analysis remain the same as the method
used in Chapter 4 [211]. As such, for an explanation of the research set-up, refer to
Section 4.3.
5.2. The survey
Data were collected through a structured questionnaire utilizing closed-ended
questions in combination with “face-to-face” semi-structured interviews. To capture the
opinions and attitudes of end-users, the questionnaire contained ten questions covering
various topics regarding renewable energy, climate change, and PV systems
(see Appendix 4.A.3).
1. Have you heard of “renewable energy”?
2. Is renewable energy important for Indonesia?
3. Have you heard of “climate change”?
4. Are you worried about climate change?
5. Have you heard of “PV systems”?
6. Which one of the following two electricity sources do you believe is cheaper; the
grid or a PV system?
7. Which one of the following two electricity sources do you believe is better for the
environment; the grid or a PV system?
8. Which one of the following two electricity sources do you believe is more stable;
the grid or a PV system?
9. Which one of the following two electricity sources would you choose to provide
power supply to your home; the grid or a PV system?
10. Would you like to have a PV system installed on your house's rooftop?

555225-L-sub01-bw-Kunaifi555225-L-sub01-bw-Kunaifi555225-L-sub01-bw-Kunaifi555225-L-sub01-bw-KunaifiProcessed on: 8-2-2021Processed on: 8-2-2021Processed on: 8-2-2021Processed on: 8-2-2021 PDF page: 132PDF page: 132PDF page: 132PDF page: 132
5 The Attitudes of End-Users of the Electricity Grid
96
55.3. Awareness of End-users about Renewable Energy and Climate Change
The first set of questions on the survey considered the awareness of the participants
about renewable energy. The participants were using power from the grid at the time of
the surveys. They expressed their knowledge on renewable energy and climate change
and their opinion about the importance of renewable energy. They also showed whether
or not they were worried about climate change.
It could be concluded that most of the participants were knowledgeable about
renewable energy. This is represented by more than half of the participants in Pekanbaru
(55%), who acknowledged that they knew something about renewable energy, and even
higher fractions in Kupang and Jayapura, with values of 60% and 77%, respectively
(Figure 5.1a and Appendix 4.A.3 (Table 4.A3)). Based on this response, it can be
expected that most of the participants acknowledged the importance of renewable
energy. As shown in Figure 5.1b and Appendix 4.A.3 (Table 4.A3), 51%, 57%, and 81%
of the participants in Pekanbaru, Kupang, and Jayapura, respectively, believe that
renewable energy is important for Indonesia. Figure 5.1a and Figure 5.1b show that the
level of knowledge of the participants on renewable energy influences their belief about
the importance of renewable energy. The more they know about renewable energy, the
more important they perceived renewable energy to be.
The results from the survey also showed that most of the participants were
knowledgeable about climate change. Sixty-nine percent of the participants in
Pekanbaru responded positively, while in Kupang and Jayapura, 58% and 92% of the
participants confirmed this as well (Figure 5.1c and Appendix 4.A.3 (Table 4.A3)). Their
knowledge about climate change seemed to influence their attitude towards climate
change. As shown in Figure 5.1d and Appendix 4.A.3 (Table 4.A3), the majority of
participants were worried about climate change; 60% in Pekanbaru, 51% in Kupang,
and 85% in Jayapura. As such, it can be concluded that awareness and concerns about
climate change are closely related.
5.4. Attitudes of the End-users of the Electricity Grid towards PV Systems
The second set of questions on the survey considered the awareness and attitudes
of the participants with regards to PV systems. First, they expressed their knowledge
about PV systems in terms of the cost, sustainability and reliability of PV systems
compared to the electricity from the grid. For this purpose, the participants answered
questions 5 to 8 (see Section 5.2). Next, they showed their attitude towards PV systems
by responding to questions 9 to 10 (see Section 5.2) about their preference for the
electricity sources at home, either the grid or PV systems and their willingness to have
a PV array installed on their house's rooftop.
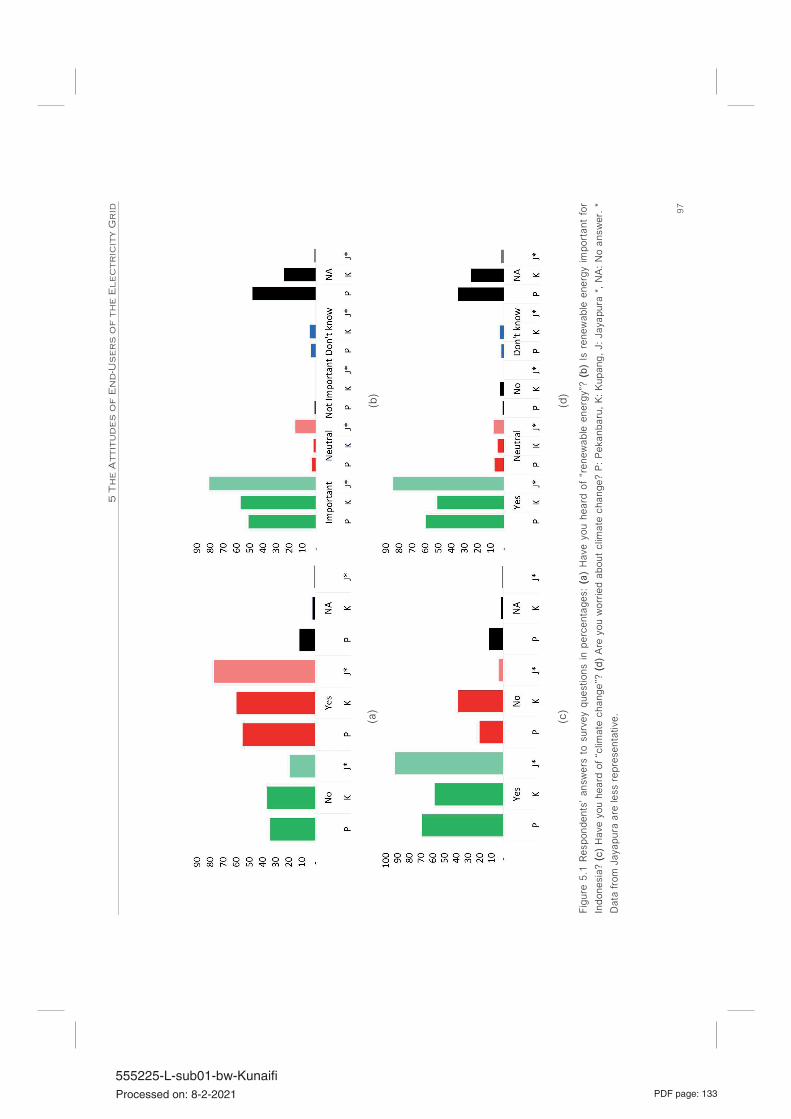
555225-L-sub01-bw-Kunaifi555225-L-sub01-bw-Kunaifi555225-L-sub01-bw-Kunaifi555225-L-sub01-bw-KunaifiProcessed on: 8-2-2021Processed on: 8-2-2021Processed on: 8-2-2021Processed on: 8-2-2021 PDF page: 133PDF page: 133PDF page: 133PDF page: 133
5 T
he
A
tt
it
ud
es
o
f E
nd
-Us
er
s o
f t
he
E
le
ct
ric
it
y G
rid
97
(a)
(b)
(c)
(d)
Fig
ure
5.1
Re
spon
de
nts’
an
swe
rs t
o s
urv
ey
que
stio
ns i
n p
erc
ent
ag
es:
((a
) H
ave
yo
u he
ard
of
“ren
ewa
ble
en
erg
y”?
((b)
Is r
ene
wa
ble
ene
rgy
imp
ort
ant
fo
r
Ind
ones
ia?
((c)
Hav
e yo
u he
ard
of
“clim
ate
chan
ge
”? ((
d)
Are
you
wo
rrie
d a
bo
ut c
limat
e ch
an
ge?
P:
Pek
an
ba
ru,
K:
Kup
ang
, J:
Ja
yap
ura
*,
NA
: N
o a
nsw
er.
*
Dat
a fr
om J
aya
pu
ra a
re le
ss r
ep
rese
ntat
ive.
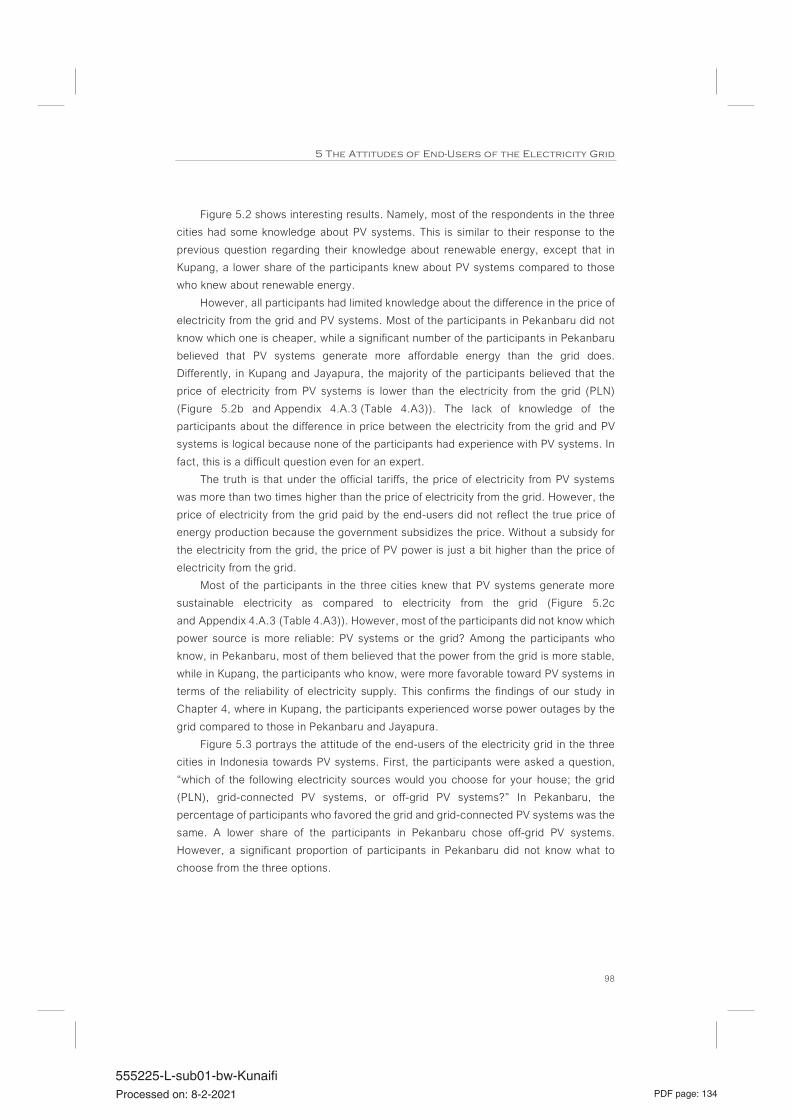
555225-L-sub01-bw-Kunaifi555225-L-sub01-bw-Kunaifi555225-L-sub01-bw-Kunaifi555225-L-sub01-bw-KunaifiProcessed on: 8-2-2021Processed on: 8-2-2021Processed on: 8-2-2021Processed on: 8-2-2021 PDF page: 134PDF page: 134PDF page: 134PDF page: 134
5 The Attitudes of End-Users of the Electricity Grid
98
Figure 5.2 shows interesting results. Namely, most of the respondents in the three
cities had some knowledge about PV systems. This is similar to their response to the
previous question regarding their knowledge about renewable energy, except that in
Kupang, a lower share of the participants knew about PV systems compared to those
who knew about renewable energy.
However, all participants had limited knowledge about the difference in the price of
electricity from the grid and PV systems. Most of the participants in Pekanbaru did not
know which one is cheaper, while a significant number of the participants in Pekanbaru
believed that PV systems generate more affordable energy than the grid does.
Differently, in Kupang and Jayapura, the majority of the participants believed that the
price of electricity from PV systems is lower than the electricity from the grid (PLN)
(Figure 5.2b and Appendix 4.A.3 (Table 4.A3)). The lack of knowledge of the
participants about the difference in price between the electricity from the grid and PV
systems is logical because none of the participants had experience with PV systems. In
fact, this is a difficult question even for an expert.
The truth is that under the official tariffs, the price of electricity from PV systems
was more than two times higher than the price of electricity from the grid. However, the
price of electricity from the grid paid by the end-users did not reflect the true price of
energy production because the government subsidizes the price. Without a subsidy for
the electricity from the grid, the price of PV power is just a bit higher than the price of
electricity from the grid.
Most of the participants in the three cities knew that PV systems generate more
sustainable electricity as compared to electricity from the grid (Figure 5.2c
and Appendix 4.A.3 (Table 4.A3)). However, most of the participants did not know which
power source is more reliable: PV systems or the grid? Among the participants who
know, in Pekanbaru, most of them believed that the power from the grid is more stable,
while in Kupang, the participants who know, were more favorable toward PV systems in
terms of the reliability of electricity supply. This confirms the findings of our study in
Chapter 4, where in Kupang, the participants experienced worse power outages by the
grid compared to those in Pekanbaru and Jayapura.
Figure 5.3 portrays the attitude of the end-users of the electricity grid in the three
cities in Indonesia towards PV systems. First, the participants were asked a question,
“which of the following electricity sources would you choose for your house; the grid
(PLN), grid-connected PV systems, or off-grid PV systems?” In Pekanbaru, the
percentage of participants who favored the grid and grid-connected PV systems was the
same. A lower share of the participants in Pekanbaru chose off-grid PV systems.
However, a significant proportion of participants in Pekanbaru did not know what to
choose from the three options.

555225-L-sub01-bw-Kunaifi555225-L-sub01-bw-Kunaifi555225-L-sub01-bw-Kunaifi555225-L-sub01-bw-KunaifiProcessed on: 8-2-2021Processed on: 8-2-2021Processed on: 8-2-2021Processed on: 8-2-2021 PDF page: 135PDF page: 135PDF page: 135PDF page: 135
5 T
he
A
tt
it
ud
es
o
f E
nd
-Us
er
s o
f t
he
E
le
ct
ric
it
y G
rid
99
(a
)
(b
)
(c)
(d)
Fig
ure
5.2
Re
spo
nd
ents
’ a
nsw
ers
to
su
rve
y q
uest
ion
s in
pe
rce
nta
ge
s: ((
a)
Hav
e y
ou
hea
rd o
f “P
V s
yste
ms”
? ((b
) W
hic
h o
ne o
f th
e fo
llow
ing
tw
o el
ect
rici
ty
sou
rce
s d
o y
ou
bel
ieve
is c
hea
pe
r? ((
c) W
hic
h o
ne o
f th
e fo
llow
ing
tw
o e
lect
rici
ty s
ourc
es d
o yo
u b
elie
ve is
be
tte
r fo
r th
e e
nvir
onm
ent
? ((d
) W
hich
on
e o
f th
e
follo
win
g t
wo
ele
ctri
city
sou
rces
do
yo
u b
elie
ve i
s m
ore
sta
ble
? P
: P
eka
nb
aru,
K:
Ku
pa
ng,
J: J
aya
pu
ra *
, N
A:
No
ans
wer
. *
Da
ta f
rom
Ja
yap
ura
are
le
ss
rep
rese
nta
tive
.
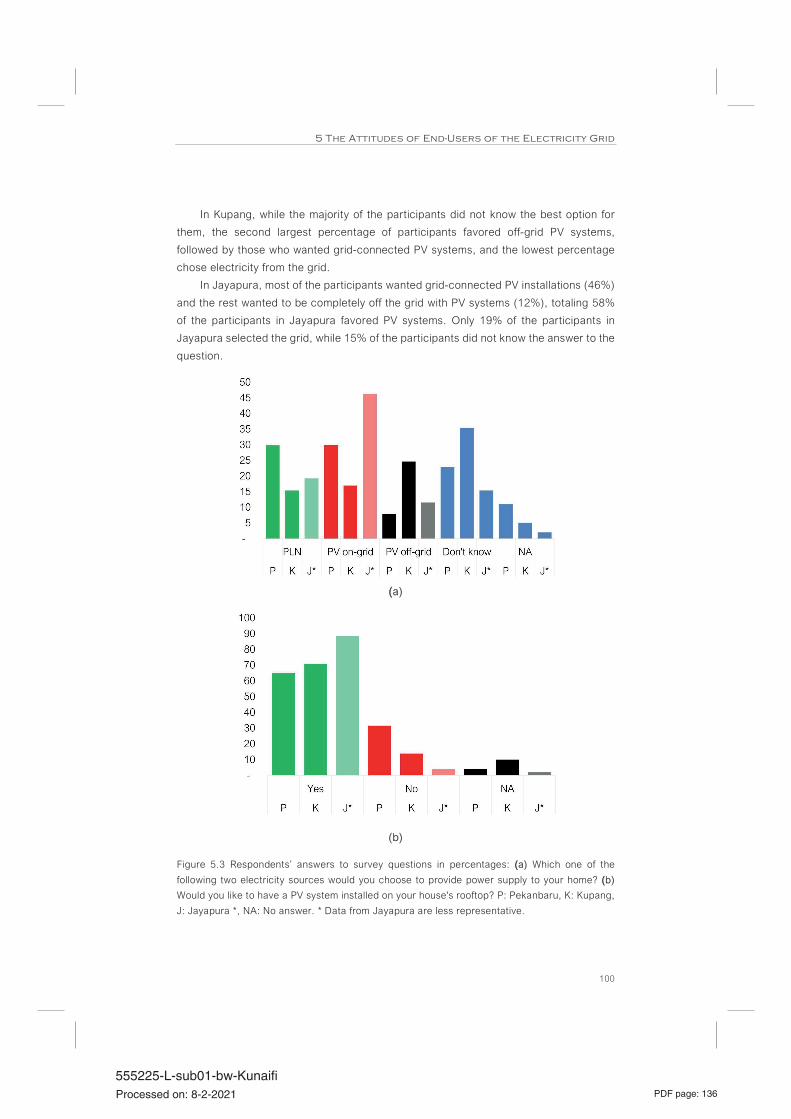
555225-L-sub01-bw-Kunaifi555225-L-sub01-bw-Kunaifi555225-L-sub01-bw-Kunaifi555225-L-sub01-bw-KunaifiProcessed on: 8-2-2021Processed on: 8-2-2021Processed on: 8-2-2021Processed on: 8-2-2021 PDF page: 136PDF page: 136PDF page: 136PDF page: 136
5 The Attitudes of End-Users of the Electricity Grid
100
In Kupang, while the majority of the participants did not know the best option for
them, the second largest percentage of participants favored off-grid PV systems,
followed by those who wanted grid-connected PV systems, and the lowest percentage
chose electricity from the grid.
In Jayapura, most of the participants wanted grid-connected PV installations (46%)
and the rest wanted to be completely off the grid with PV systems (12%), totaling 58%
of the participants in Jayapura favored PV systems. Only 19% of the participants in
Jayapura selected the grid, while 15% of the participants did not know the answer to the
question.
((a)
(b)
Figure 5.3 Respondents’ answers to survey questions in percentages: ((a) Which one of the
following two electricity sources would you choose to provide power supply to your home? ((b)
Would you like to have a PV system installed on your house's rooftop? P: Pekanbaru, K: Kupang,
J: Jayapura *, NA: No answer. * Data from Jayapura are less representative.
555225-L-sub01-bw-Kunaifi555225-L-sub01-bw-Kunaifi555225-L-sub01-bw-Kunaifi555225-L-sub01-bw-KunaifiProcessed on: 8-2-2021Processed on: 8-2-2021Processed on: 8-2-2021Processed on: 8-2-2021 PDF page: 137PDF page: 137PDF page: 137PDF page: 137
5 The Attitudes of End-Users of the Electricity Grid
101
Finally, the participants were asked, “do you want a PV array to be installed on your
house's rooftop?” Most of the participants in the three cities favored PV systems on their
house’s rooftops; 65% in Pekanbaru, 71% in Kupang, and 88% in Jayapura. The majority
of the participants who refused to have rooftop PV systems were concerned about the
strength of their houses’ roofs for accommodating PV system components and
structures.
55.5. Conclusions
The number of participants in Pekanbaru and Kupang was higher than in Jayapura.
Therefore, for this study, data from Jayapura are less representative, although they are
still beneficial given the difficulties of getting data from Jayapura. Also, regarding the
level of education, participants in Pekanbaru and Kupang were more varied, while in
Jayapura, the participants who participated in this survey were much more educated
than average.
The responses and preferences from the participants in this study were strongly
influenced by their levels of education and experience. Participants in Jayapura, who
had a higher education than those in Pekanbaru and Kupang, knew and supported
renewable energy more. Most of them knew about climate change, and they worried
about that. They had a positive attitude towards PV systems regarding energy price,
sustainability, and reliability. Finally, they chose PV systems and wanted to have one at
home.
The participants from Pekanbaru and Kupang were more diverse in terms of
education and economic condition compared to participants in Jayapura. Therefore, the
responses from participants in Pekanbaru and Kupang were highly influenced by their
experience with the grid. Participants in Kupang experienced less reliable electricity
supply compared to those in Pekanbaru. Thus, they favored PV systems more than
participants in Pekanbaru. Even participants in Kupang wanted to have off-grid PV
systems, which means to become independent from the grid (PLN).
Despite the variety in responses to the questions in the questionnaires from the
participants, many households in Indonesia wanted to have PV systems on their houses’
rooftops, either to increase the reliability of electricity supply as the user of the grid or
to become separated from the grid.

555225-L-sub01-bw-Kunaifi555225-L-sub01-bw-Kunaifi555225-L-sub01-bw-Kunaifi555225-L-sub01-bw-KunaifiProcessed on: 8-2-2021Processed on: 8-2-2021Processed on: 8-2-2021Processed on: 8-2-2021 PDF page: 138PDF page: 138PDF page: 138PDF page: 138
5 The Attitudes of End-Users of the Electricity Grid
102

555225-L-sub01-bw-Kunaifi555225-L-sub01-bw-Kunaifi555225-L-sub01-bw-Kunaifi555225-L-sub01-bw-KunaifiProcessed on: 8-2-2021Processed on: 8-2-2021Processed on: 8-2-2021Processed on: 8-2-2021 PDF page: 139PDF page: 139PDF page: 139PDF page: 139
5 The Attitudes of End-Users of the Electricity Grid
103
Performance of
PV Systems in
Indonesia
This Chapter is based on “Kunaifi, K., Reinders, A.H.M.E., Kaharudin, D., Harmanto, A., Mudiarto, K., A Comparative Performance Analysis of A 1 MW CIS PV System and a 5 kW Crystalline-Si PV System under the Tropical Climate of Indonesia. International Journal of Technology. 2019, 10 (6), pp. 1082-1092.”

555225-L-sub01-bw-Kunaifi555225-L-sub01-bw-Kunaifi555225-L-sub01-bw-Kunaifi555225-L-sub01-bw-KunaifiProcessed on: 8-2-2021Processed on: 8-2-2021Processed on: 8-2-2021Processed on: 8-2-2021 PDF page: 140PDF page: 140PDF page: 140PDF page: 140
5 The Attitudes of End-Users of the Electricity Grid
104

555225-L-sub01-bw-Kunaifi555225-L-sub01-bw-Kunaifi555225-L-sub01-bw-Kunaifi555225-L-sub01-bw-KunaifiProcessed on: 8-2-2021Processed on: 8-2-2021Processed on: 8-2-2021Processed on: 8-2-2021 PDF page: 141PDF page: 141PDF page: 141PDF page: 141
105
CChapter 6. Performance of PV
Systems in Indonesia
6.1. Introduction
Indonesia has many rural areas and remote islands that are suitable for distributed
renewable power generation such as solar photovoltaic (PV) systems. PV systems are
reliable power systems and play an essential role in climate change mitigation [212].
The market for PV systems is beginning to grow rapidly worldwide owing to, among other
factors, their increased efficiency, the increased lifespans of the components, and a
rapid reduction in their cost [94].
The first PV system applications in Indonesia can be traced back to 1978 and the
installation of a 5 kWp solar water pumping system [6]. Various other projects then
followed, such as a solar home systems (SHS) pilot project [51], desalination plants,
basic medical applications, remote televisions, and water pumping systems [106]. A
large SHS demonstration project with a total capacity of 50 MWp was launched in 1994
[106], and the first urban PV system was introduced in 2003 [213].
Since then, many other PV systems have been constructed and created
employment [214]. However, it is only relatively recently that Indonesia has gained
experience in the performance of PV systems [215], and it continues to be in the
research and demonstration phase [106]. To date, Indonesia has 12 utility-scale PV
plants in operation, mainly for off-grid or industrial applications. The dominant PV
technology applied is typically crystalline silicon (c-Si) technology.
The PV market in Indonesia is emerging and is expected to grow over the coming years
across the vast expanse of Indonesia’s archipelago. The factors driving its growth include
Indonesia’s unique geography, comprising six large and more than 17,000 smaller islands.
This type of geographical factor presents a challenge in terms of extending the conventional
power grid to reach the whole of the country’s population of more than 260 million. The other
motivations for solar electrification in Indonesia include, among others, the increasing
demand for electricity (around 5.5% annual growth) and economic growth of around 5% per
year [70]. PV systems are suitable for use on the large islands (urban areas), particularly
with respect to increasing the quality of the power supply [16] as Indonesia is characterized
by the relatively low reliability of its electricity supply [215]. Meanwhile, on the smaller islands
and in more remote areas, PV systems could play a significant role in providing electricity to
local people who have not had it before, replacing fossil-fuel-generated electricity with
renewables, and increasing the electrification ratio [150].

555225-L-sub01-bw-Kunaifi555225-L-sub01-bw-Kunaifi555225-L-sub01-bw-Kunaifi555225-L-sub01-bw-KunaifiProcessed on: 8-2-2021Processed on: 8-2-2021Processed on: 8-2-2021Processed on: 8-2-2021 PDF page: 142PDF page: 142PDF page: 142PDF page: 142
6 Performance of PV Systems in Indonesia
106
It is essential to monitor the operation of a PV system in order to identify
performance trends. Monitoring data are also crucial for the localization of potential
faults and to enable a comparison of PV system performance against design
expectations and guarantees and between the different configurations and locations
[216]. However, most PV systems in Indonesia are not monitored, with only a few
equipped with basic monitoring systems. Accordingly, we have limited knowledge about
the actual performance of PV systems operating under real environmental conditions in
Indonesia. The two PV systems presented in this chapter are among the few that are
monitored.
Figure 6.1 Aerial view of the 1 MWp PV plant in Cirata, West Java, Indonesia (Photo: PJB Cirata).
In September 2015, PT. Pembangkitan Jawa-Bali (PJB), a subsidiary of PLN,
Indonesia’s state-owned utility company, commenced its entry into the PV business. PJB
is a power generation company that operates mainly in Java and Bali, which are the
islands with the largest and densest electrical power systems in Indonesia. PJB
constructed and now operates and maintains nine power plants with a total capacity of
more than 7 GW [144]. Among those in operation by PJB is a 1 MWp PV system located
in the province of West Java, which at the time of its construction was the largest PV
system on the island of Java (Figure 6.1). At the same location, PJB also installed other,
smaller PV systems. After three years of operation, we can now, for the first time, analyze
the monitoring data from the PV systems in West Java.

555225-L-sub01-bw-Kunaifi555225-L-sub01-bw-Kunaifi555225-L-sub01-bw-Kunaifi555225-L-sub01-bw-KunaifiProcessed on: 8-2-2021Processed on: 8-2-2021Processed on: 8-2-2021Processed on: 8-2-2021 PDF page: 143PDF page: 143PDF page: 143PDF page: 143
6 Performance of PV Systems in Indonesia
107
In this study, we therefore seek to answer the following questions:
� How is PJB’s 1 MWp CIS-based thin-film plant performing, and how has it degraded
in Indonesia’s tropical climate?
� How do its performance and degradation compare to that of a 5 kWp poly-crystalline
silicon (p-Si) plant at the same location?
The motivation for analyzing the performance and degradation of PV systems lies in
the fact that the long-term performance and stability of PV plants have a significant
impact on the economics of such projects.
Besides performance, degradation is one of the most critical characteristics to
consider in the solar PV business. Degradation describes the rate at which a PV
module experiences a decline in output. The degradation rate, Rd, is therefore the rate
at which the PV performance of a module decreases per year. Rd is an important
measure for comparing the actual performance of PV systems against the PV
performance warranty issued by the module manufacturer with respect to nominal
power.
PV cells degrade [217]; however, the rate of degradation differs from one PV plant
to another. Over the course of a 25-year operating life, a 20% decline is considered a
failure. Assuming linear degradation, an Rd greater than 0.8% per year can be regarded
as a problem [218]. Nevertheless, there is no consensus on the definition of failure
[219]. Using data from outdoor field testing, the long-term behavior and lifetime of PV
modules, including their degradation, can be quantified.
66.2. The PV Systems and Datasets
The PV systems presented in this chapter are located in the Village of Cadas Sari
(6º674 'S, 107º355 'E), Cirata, the province of West Java. They comprise a 1 MWp and
a 5 kWp system. The 1 MWp plant is ground-mounted over an area of 0.9 ha, while the
5 kWp plant is a rooftop PV installation. Both systems sit in open spaces that are free of
shading throughout the year. The measurement equipment is not cleaned and
calibrated. Therefore, rather than using the most recent data, we instead use two years
of usable data with a starting date close to the system’s commencement of operation,
based on the assumption that the sensors performed better during their earlier
operational period than more recently.
6.2.1. 1 MWp Thin-Film CIS PV System
The 1 MWp PV plant has 170 Wp Japanese Solar Frontier thin-film PV modules
made of Copper Indium Selenide (CIS) technology with a nominal module efficiency,
ηmod, of 13.8%. This efficiency is derived from the module’s specification sheet. It has
two clusters. One cluster has a capacity of 530.4 kWp and comprises 26 arrays, each
with 120 modules. This cluster has an SMA 550 kWp central inverter that delivers a.c.
power to the grid through a transformer. The other cluster, with a total capacity of 510
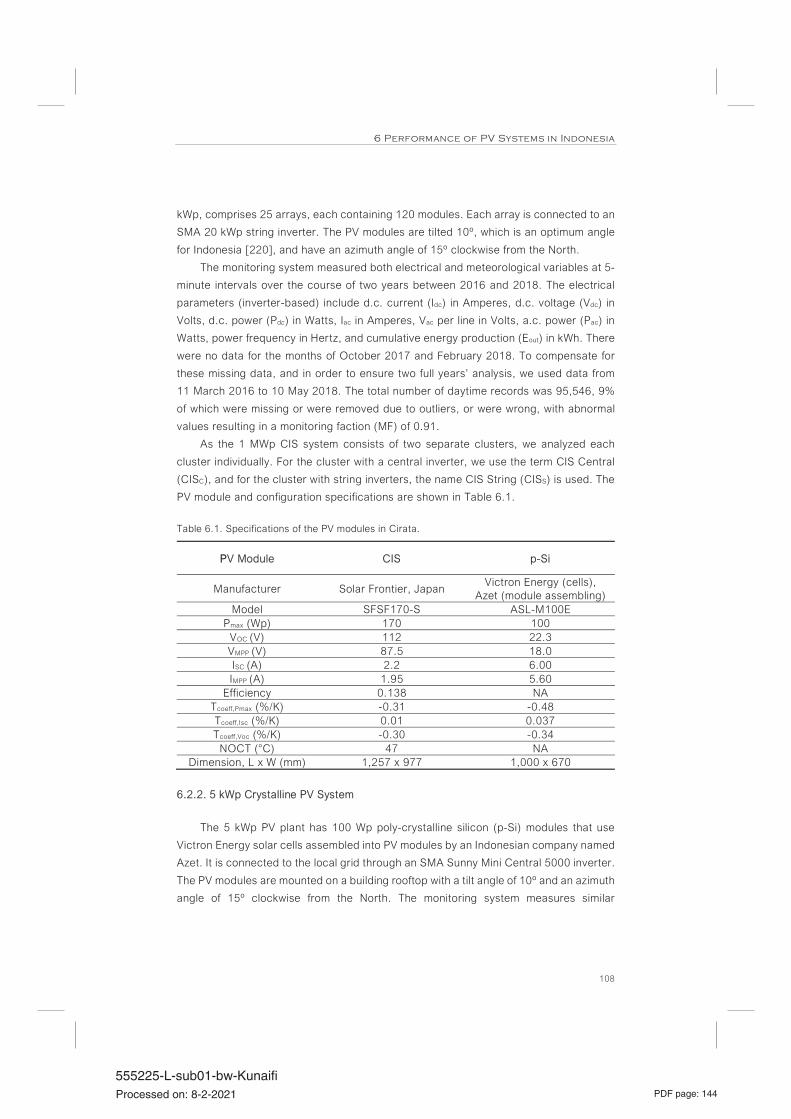
555225-L-sub01-bw-Kunaifi555225-L-sub01-bw-Kunaifi555225-L-sub01-bw-Kunaifi555225-L-sub01-bw-KunaifiProcessed on: 8-2-2021Processed on: 8-2-2021Processed on: 8-2-2021Processed on: 8-2-2021 PDF page: 144PDF page: 144PDF page: 144PDF page: 144
6 Performance of PV Systems in Indonesia
108
kWp, comprises 25 arrays, each containing 120 modules. Each array is connected to an
SMA 20 kWp string inverter. The PV modules are tilted 10º, which is an optimum angle
for Indonesia [220], and have an azimuth angle of 15º clockwise from the North.
The monitoring system measured both electrical and meteorological variables at 5-
minute intervals over the course of two years between 2016 and 2018. The electrical
parameters (inverter-based) include d.c. current (Idc) in Amperes, d.c. voltage (Vdc) in
Volts, d.c. power (Pdc) in Watts, Iac in Amperes, Vac per line in Volts, a.c. power (Pac) in
Watts, power frequency in Hertz, and cumulative energy production (Eout) in kWh. There
were no data for the months of October 2017 and February 2018. To compensate for
these missing data, and in order to ensure two full years’ analysis, we used data from
11 March 2016 to 10 May 2018. The total number of daytime records was 95,546, 9%
of which were missing or were removed due to outliers, or were wrong, with abnormal
values resulting in a monitoring faction (MF) of 0.91.
As the 1 MWp CIS system consists of two separate clusters, we analyzed each
cluster individually. For the cluster with a central inverter, we use the term CIS Central
(CISC), and for the cluster with string inverters, the name CIS String (CISS) is used. The
PV module and configuration specifications are shown in Table 6.1.
Table 6.1. Specifications of the PV modules in Cirata.
PPV Module CIS p-Si
Manufacturer Solar Frontier, Japan Victron Energy (cells),
Azet (module assembling) Model SFSF170-S ASL-M100E
Pmax (Wp) 170 100 VOC (V) 112 22.3 VMPP (V) 87.5 18.0 ISC (A) 2.2 6.00 IMPP (A) 1.95 5.60
Efficiency 0.138 NA Tcoeff,Pmax (%/K) -0.31 -0.48 Tcoeff,Isc (%/K) 0.01 0.037 Tcoeff,Voc (%/K) -0.30 -0.34
NOCT (°C) 47 NA Dimension, L x W (mm) 1,257 x 977 1,000 x 670
6.2.2. 5 kWp Crystalline PV System
The 5 kWp PV plant has 100 Wp poly-crystalline silicon (p-Si) modules that use
Victron Energy solar cells assembled into PV modules by an Indonesian company named
Azet. It is connected to the local grid through an SMA Sunny Mini Central 5000 inverter.
The PV modules are mounted on a building rooftop with a tilt angle of 10º and an azimuth
angle of 15º clockwise from the North. The monitoring system measures similar

555225-L-sub01-bw-Kunaifi555225-L-sub01-bw-Kunaifi555225-L-sub01-bw-Kunaifi555225-L-sub01-bw-KunaifiProcessed on: 8-2-2021Processed on: 8-2-2021Processed on: 8-2-2021Processed on: 8-2-2021 PDF page: 145PDF page: 145PDF page: 145PDF page: 145
6 Performance of PV Systems in Indonesia
109
parameters to those of the CIS PV system and features the same recording interval of 5
minutes.
For both the CIS and p-Si systems, critical meteorological variables were measured.
They include relative humidity (RH) as a percentage, ambient temperature (Tamb) in ºC,
module temperature (Tm) in ºC, global horizontal irradiance (GHI) in Watt/m2, global in-
plane irradiance (GPOA) in Watt/m2, and wind speed (v) at a 1-metre height in m/s.
66.3. Methods
All of the monitoring data were checked for consistency and gaps to identify
anomalies according to the following method. The daytime data were selected by
eliminating irradiance values below 200 W/m2 and above 1,500 W/m2. For the ambient
temperature, Tamb, only values between -40 and 60 ºC were used. For the module
temperature, Tm, values between the ambient temperature and ambient temperature
plus 40 ºC were included. As such, any Tm values lower than Tamb that might occur in the
early morning due to irradiation to the sky were excluded from the analysis. For the
electrical data, the array voltage between 0 and 1.3 x Voc,stc was used. Also, the array
current values outside 0 and 1.5 x Isc,stc were excluded from the analysis. Abnormal data,
such as large negative values and dead values that stuck for more than one hour, were
also removed. Any records missing from the 5-minute data for a period of up to one hour
were linearly interpolated.
6.3.1. Performance Calculations
The monitoring standard IEC 61724 was applied to the analysis of the PV systems’
performance [216]. The performance indicators presented include final yield (Yf) in
kWh/kWp; array yield (YA) in kWh/kWp; reference yield (Yr) in kWh/kWp; capture losses
(LC) in kWh/kWp; system losses (LS) in kWh/kWp; performance ratio (PR) as a percentage
or a decimal between 0 and 1; efficiencies (η) as a percentage or a decimal between 0
and 1; and capacity factor (CF), also given as a percentage.
Yield refers to the ratio of an energy quantity to the array power rating, P0, of the
installed PV array at standard test conditions (STC) of 1,000 W/m2 solar irradiance and
25 °C cell temperature. Thus, yields indicate the actual operation of the array relative to
its rated capacity. The unit of yield is kWh/kW. The ratio of the unit is equivalent to hours,
and the yield ratio indicates the equivalent amount of time for which the array would be
required to operate at P0 to provide the particular energy quantity measured during the
reporting period.
The final yield, Yf, is defined as the annual, monthly, or daily net a.c. energy output
in kWh, Eac, of the PV system per installed rated power, P0, and is given by Equation
(6.1). The final yield can be used to compare PV plants with different systems operating
in different climates.
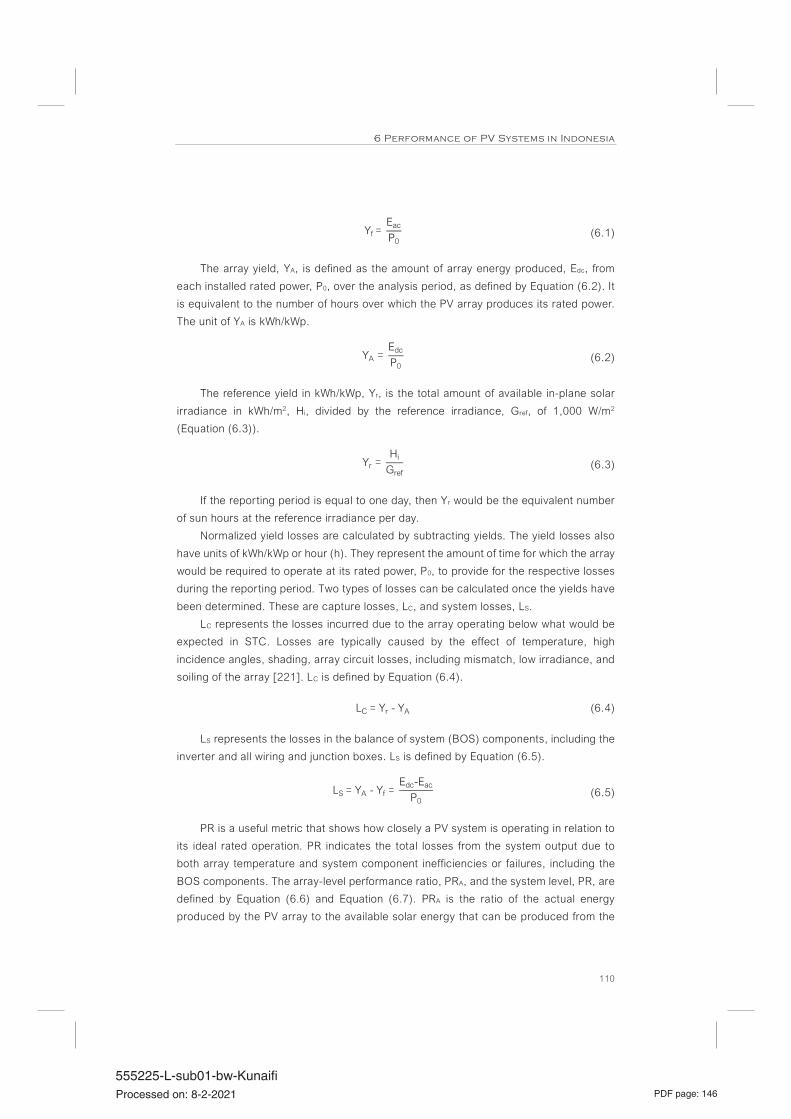
555225-L-sub01-bw-Kunaifi555225-L-sub01-bw-Kunaifi555225-L-sub01-bw-Kunaifi555225-L-sub01-bw-KunaifiProcessed on: 8-2-2021Processed on: 8-2-2021Processed on: 8-2-2021Processed on: 8-2-2021 PDF page: 146PDF page: 146PDF page: 146PDF page: 146
6 Performance of PV Systems in Indonesia
110
Yf = Eac
P0 (6.1)
The array yield, YA, is defined as the amount of array energy produced, Edc, from
each installed rated power, P0, over the analysis period, as defined by Equation (6.2). It
is equivalent to the number of hours over which the PV array produces its rated power.
The unit of YA is kWh/kWp.
YA = Edc
P0 (6.2)
The reference yield in kWh/kWp, Yr, is the total amount of available in-plane solar
irradiance in kWh/m2, Hi, divided by the reference irradiance, Gref, of 1,000 W/m2
(Equation (6.3)).
Yr = Hi
Gref (6.3)
If the reporting period is equal to one day, then Yr would be the equivalent number
of sun hours at the reference irradiance per day.
Normalized yield losses are calculated by subtracting yields. The yield losses also
have units of kWh/kWp or hour (h). They represent the amount of time for which the array
would be required to operate at its rated power, P0, to provide for the respective losses
during the reporting period. Two types of losses can be calculated once the yields have
been determined. These are capture losses, LC, and system losses, LS.
LC represents the losses incurred due to the array operating below what would be
expected in STC. Losses are typically caused by the effect of temperature, high
incidence angles, shading, array circuit losses, including mismatch, low irradiance, and
soiling of the array [221]. LC is defined by Equation (6.4).
LC = Yr - YA (6.4)
LS represents the losses in the balance of system (BOS) components, including the
inverter and all wiring and junction boxes. LS is defined by Equation (6.5).
LS = YA - Yf = Edc-Eac
P0 (6.5)
PR is a useful metric that shows how closely a PV system is operating in relation to
its ideal rated operation. PR indicates the total losses from the system output due to
both array temperature and system component inefficiencies or failures, including the
BOS components. The array-level performance ratio, PRA, and the system level, PR, are
defined by Equation (6.6) and Equation (6.7). PRA is the ratio of the actual energy
produced by the PV array to the available solar energy that can be produced from the

555225-L-sub01-bw-Kunaifi555225-L-sub01-bw-Kunaifi555225-L-sub01-bw-Kunaifi555225-L-sub01-bw-KunaifiProcessed on: 8-2-2021Processed on: 8-2-2021Processed on: 8-2-2021Processed on: 8-2-2021 PDF page: 147PDF page: 147PDF page: 147PDF page: 147
6 Performance of PV Systems in Indonesia
111
PV array at STC efficiency. PR is the ratio of actual energy output to the available solar
energy that can be produced from the PV array at STC efficiency. The PR is either
unitless or it can be represented as a percentage.
PRA = YA
Yr (6.6)
PR=Yf
Yr� (6.7)
The efficiency, η, of a PV system can be calculated as rated array efficiency, ηA,rated,
mean actual array efficiency, ηA, mean system efficiency, ηf, and inverter efficiency, ηinv,
using Equation (6.8) to Equation (6.11).
ηA,rated = P0
Gi,ref x A (6.8)
ηA = Edc
Hi x A� (6.9)
ηf = Eac
Hi x A� (6.10)
ηinv = Eac
Edc (6.11)
where A is the effective PV module area in m2.
Finally, CF is defined as the ratio of the actual annual energy output, Eac, to the
amount of energy the PV system would generate if it operated at full P0 for 24 h per day
for a year. CF is calculated using Equation (6.12).
CF =
Eaca.crating
24 x days (6.12)
where a.crating, in kWp, is calculated from the sum of the inverter ratings, and the term
days is typically 365 or 366 for one year of analysis.
66.3.2. Degradation Calculations
For the Rd calculation, NREL/RdTools [222,223] was implemented using Python.
RdTools is a set of algorithms for calculating the Rd of PV systems based on year-on-
year (YoY) analysis using a minimum of two years’ time-series data [222]. RdTools
was developed according to the method initially proposed by Hasselbrink et al. [224]
based on a review of 3 million module-years of live site data. Using RdTools, PV
system production data are evaluated over several years to obtain rates of
performance degradation over time. RdTools features an improvement in
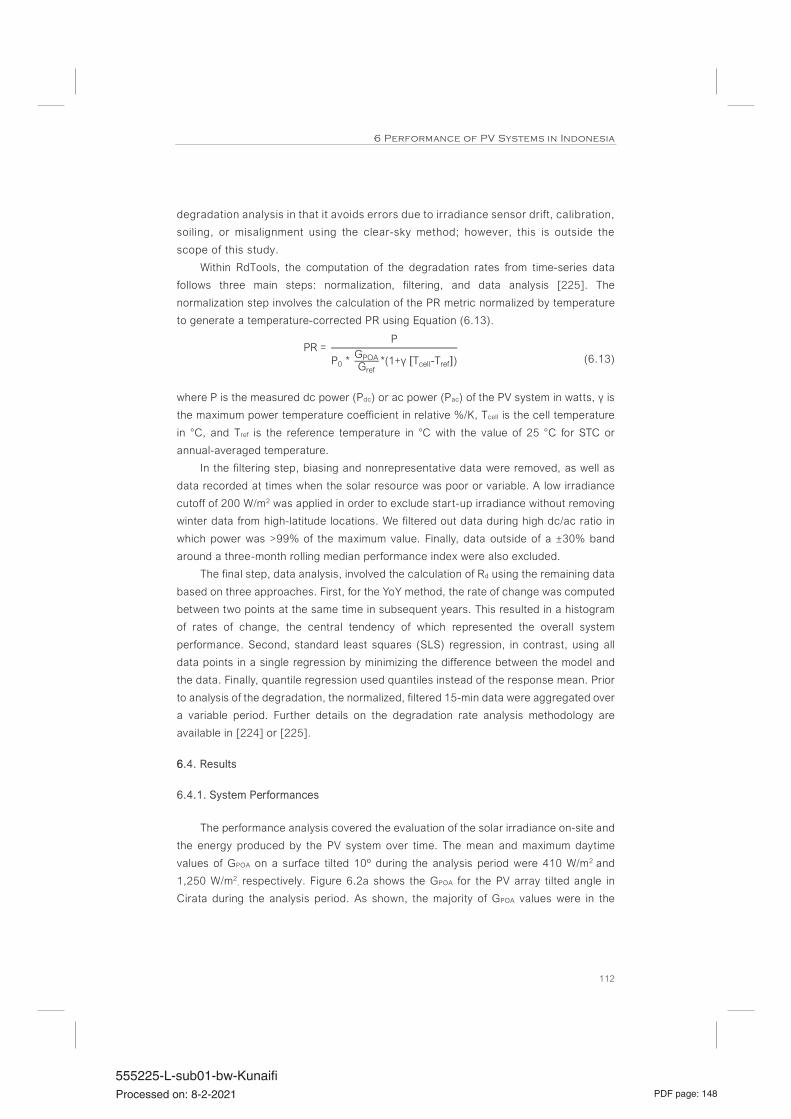
555225-L-sub01-bw-Kunaifi555225-L-sub01-bw-Kunaifi555225-L-sub01-bw-Kunaifi555225-L-sub01-bw-KunaifiProcessed on: 8-2-2021Processed on: 8-2-2021Processed on: 8-2-2021Processed on: 8-2-2021 PDF page: 148PDF page: 148PDF page: 148PDF page: 148
6 Performance of PV Systems in Indonesia
112
degradation analysis in that it avoids errors due to irradiance sensor drift, calibration,
soiling, or misalignment using the clear-sky method; however, this is outside the
scope of this study.
Within RdTools, the computation of the degradation rates from time-series data
follows three main steps: normalization, filtering, and data analysis [225]. The
normalization step involves the calculation of the PR metric normalized by temperature
to generate a temperature-corrected PR using Equation (6.13).
PR = P
P0 * GPOAGref
*(1+γ Tcell-Tref�) (6.13)
where P is the measured dc power (Pdc) or ac power (Pac) of the PV system in watts, γ is
the maximum power temperature coefficient in relative %/K, Tcell is the cell temperature
in °C, and Tref is the reference temperature in °C with the value of 25 °C for STC or
annual-averaged temperature.
In the filtering step, biasing and nonrepresentative data were removed, as well as
data recorded at times when the solar resource was poor or variable. A low irradiance
cutoff of 200 W/m2 was applied in order to exclude start-up irradiance without removing
winter data from high-latitude locations. We filtered out data during high dc/ac ratio in
which power was >99% of the maximum value. Finally, data outside of a ±30% band
around a three-month rolling median performance index were also excluded.
The final step, data analysis, involved the calculation of Rd using the remaining data
based on three approaches. First, for the YoY method, the rate of change was computed
between two points at the same time in subsequent years. This resulted in a histogram
of rates of change, the central tendency of which represented the overall system
performance. Second, standard least squares (SLS) regression, in contrast, using all
data points in a single regression by minimizing the difference between the model and
the data. Finally, quantile regression used quantiles instead of the response mean. Prior
to analysis of the degradation, the normalized, filtered 15-min data were aggregated over
a variable period. Further details on the degradation rate analysis methodology are
available in [224] or [225].
66.4. Results
6.4.1. System Performances
The performance analysis covered the evaluation of the solar irradiance on-site and
the energy produced by the PV system over time. The mean and maximum daytime
values of GPOA on a surface tilted 10º during the analysis period were 410 W/m2 and
1,250 W/m2, respectively. Figure 6.2a shows the GPOA for the PV array tilted angle in
Cirata during the analysis period. As shown, the majority of GPOA values were in the
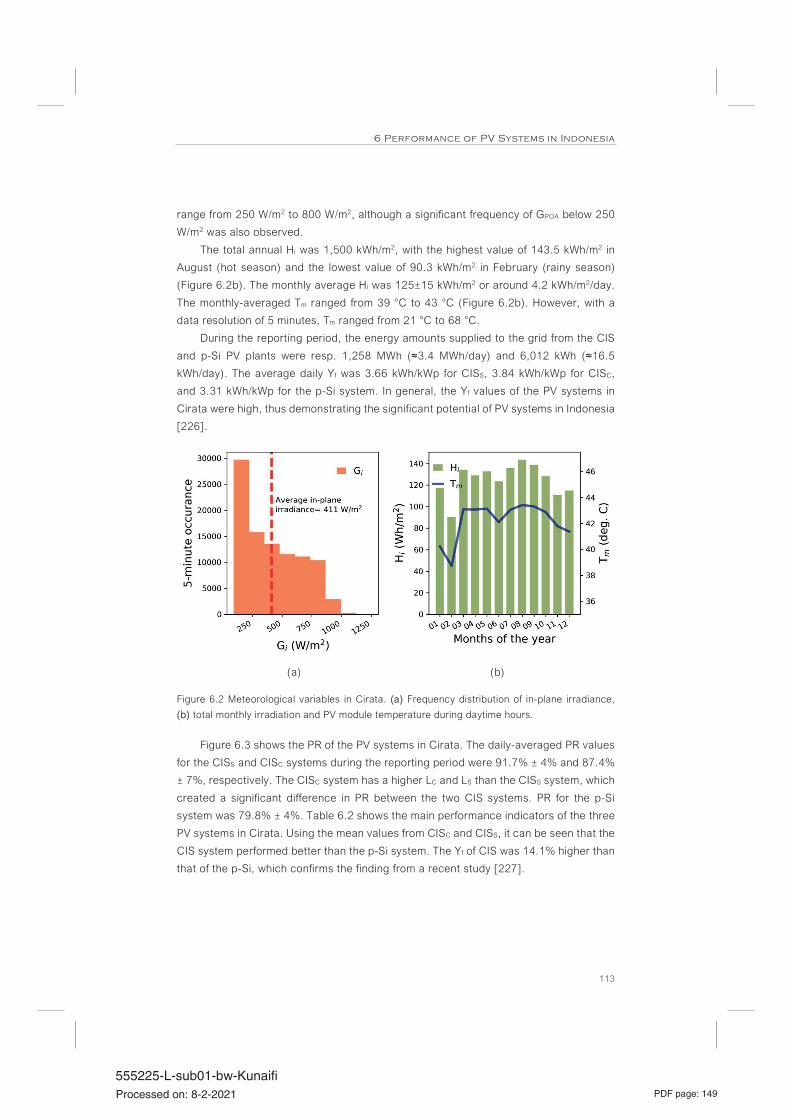
555225-L-sub01-bw-Kunaifi555225-L-sub01-bw-Kunaifi555225-L-sub01-bw-Kunaifi555225-L-sub01-bw-KunaifiProcessed on: 8-2-2021Processed on: 8-2-2021Processed on: 8-2-2021Processed on: 8-2-2021 PDF page: 149PDF page: 149PDF page: 149PDF page: 149
6 Performance of PV Systems in Indonesia
113
range from 250 W/m2 to 800 W/m2, although a significant frequency of GPOA below 250
W/m2 was also observed.
The total annual Hi was 1,500 kWh/m2, with the highest value of 143.5 kWh/m2 in
August (hot season) and the lowest value of 90.3 kWh/m2 in February (rainy season)
(Figure 6.2b). The monthly average Hi was 125±15 kWh/m2 or around 4.2 kWh/m2/day.
The monthly-averaged Tm ranged from 39 °C to 43 °C (Figure 6.2b). However, with a
data resolution of 5 minutes, Tm ranged from 21 °C to 68 °C.
During the reporting period, the energy amounts supplied to the grid from the CIS
and p-Si PV plants were resp. 1,258 MWh (≈3.4 MWh/day) and 6,012 kWh (≈16.5
kWh/day). The average daily Yf was 3.66 kWh/kWp for CISS, 3.84 kWh/kWp for CISC,
and 3.31 kWh/kWp for the p-Si system. In general, the Yf values of the PV systems in
Cirata were high, thus demonstrating the significant potential of PV systems in Indonesia
[226].
(a) (b)
Figure 6.2 Meteorological variables in Cirata. (a) Frequency distribution of in-plane irradiance,
(b) total monthly irradiation and PV module temperature during daytime hours.
Figure 6.3 shows the PR of the PV systems in Cirata. The daily-averaged PR values
for the CISS and CISC systems during the reporting period were 91.7% ± 4% and 87.4%
± 7%, respectively. The CISC system has a higher LC and LS than the CISS system, which
created a significant difference in PR between the two CIS systems. PR for the p-Si
system was 79.8% ± 4%. Table 6.2 shows the main performance indicators of the three
PV systems in Cirata. Using the mean values from CISC and CISS, it can be seen that the
CIS system performed better than the p-Si system. The Yf of CIS was 14.1% higher than
that of the p-Si, which confirms the finding from a recent study [227].
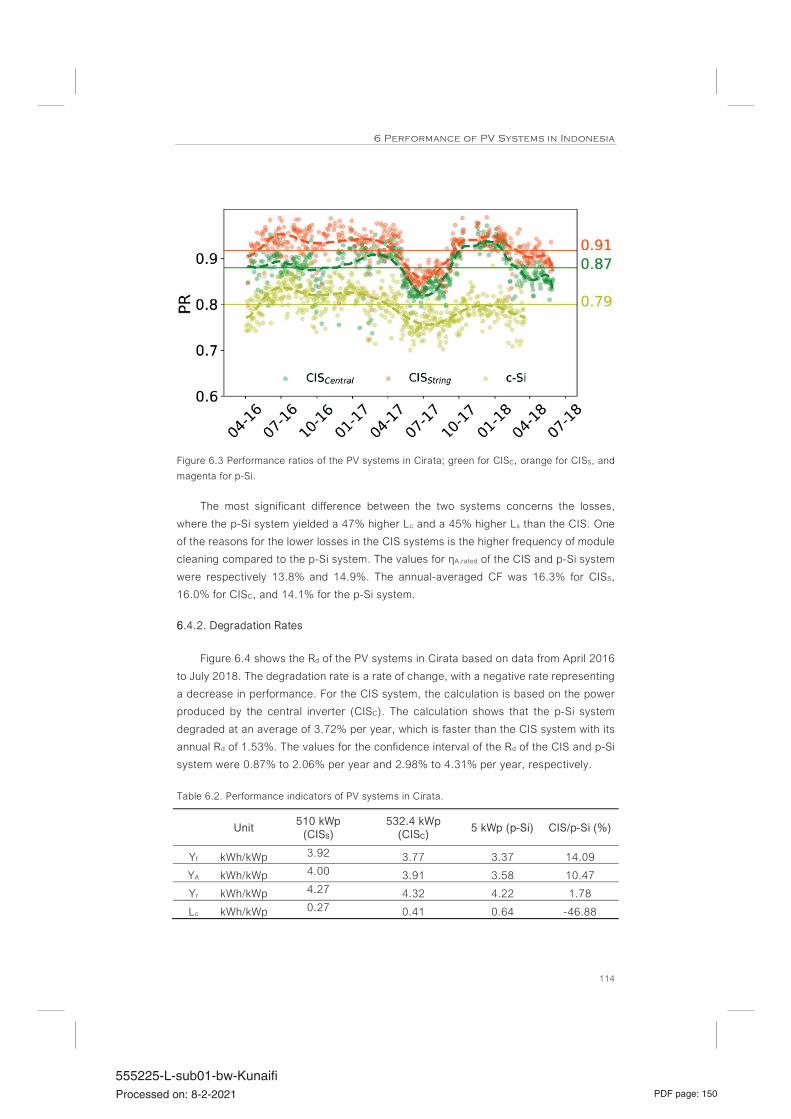
555225-L-sub01-bw-Kunaifi555225-L-sub01-bw-Kunaifi555225-L-sub01-bw-Kunaifi555225-L-sub01-bw-KunaifiProcessed on: 8-2-2021Processed on: 8-2-2021Processed on: 8-2-2021Processed on: 8-2-2021 PDF page: 150PDF page: 150PDF page: 150PDF page: 150
6 Performance of PV Systems in Indonesia
114
Figure 6.3 Performance ratios of the PV systems in Cirata; green for CISC, orange for CISS, and
magenta for p-Si.
The most significant difference between the two systems concerns the losses,
where the p-Si system yielded a 47% higher Lc and a 45% higher Ls than the CIS. One
of the reasons for the lower losses in the CIS systems is the higher frequency of module
cleaning compared to the p-Si system. The values for ηA,rated of the CIS and p-Si system
were respectively 13.8% and 14.9%. The annual-averaged CF was 16.3% for CISS,
16.0% for CISC, and 14.1% for the p-Si system.
66.4.2. Degradation Rates
Figure 6.4 shows the Rd of the PV systems in Cirata based on data from April 2016
to July 2018. The degradation rate is a rate of change, with a negative rate representing
a decrease in performance. For the CIS system, the calculation is based on the power
produced by the central inverter (CISC). The calculation shows that the p-Si system
degraded at an average of 3.72% per year, which is faster than the CIS system with its
annual Rd of 1.53%. The values for the confidence interval of the Rd of the CIS and p-Si
system were 0.87% to 2.06% per year and 2.98% to 4.31% per year, respectively.
Table 6.2. Performance indicators of PV systems in Cirata.
Unit 510 kWp
(CISS) 532.4 kWp
(CISC) 5 kWp (p-Si) CIS/p-Si (%)
Yf kWh/kWp 3.92 3.77 3.37 14.09
YA kWh/kWp 4.00 3.91 3.58 10.47
Yr kWh/kWp 4.27 4.32 4.22 1.78
Lc kWh/kWp 0.27 0.41 0.64 -46.88
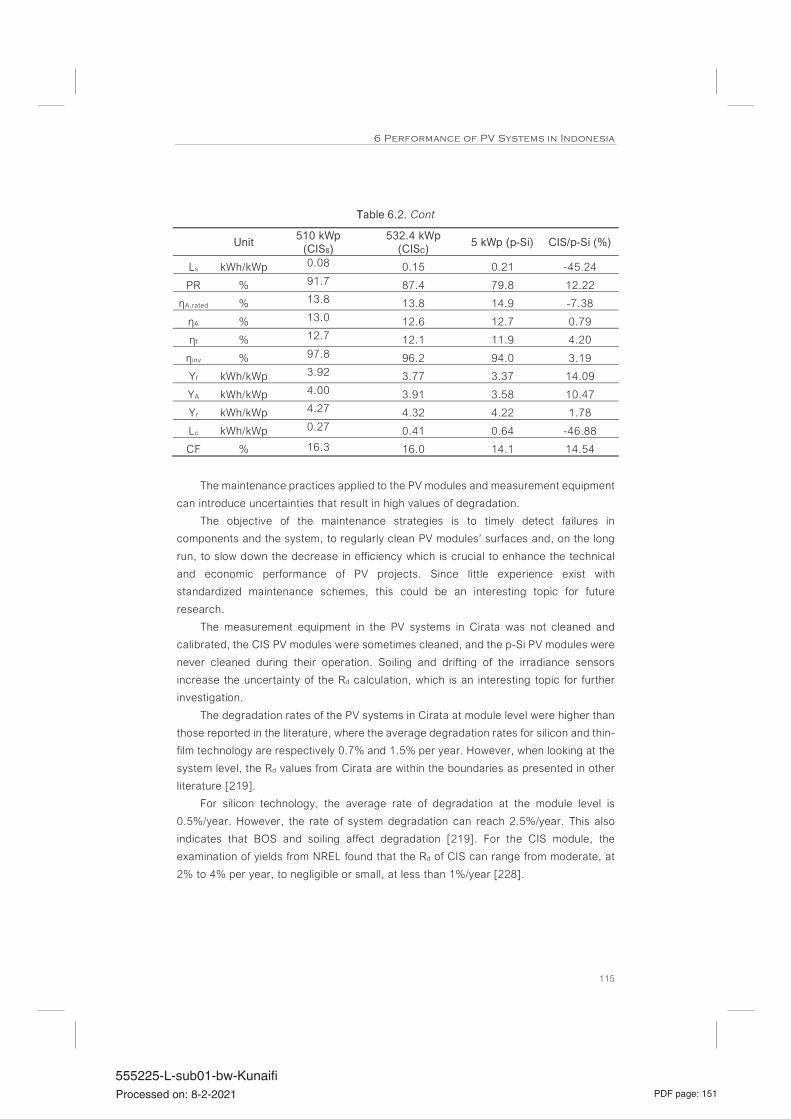
555225-L-sub01-bw-Kunaifi555225-L-sub01-bw-Kunaifi555225-L-sub01-bw-Kunaifi555225-L-sub01-bw-KunaifiProcessed on: 8-2-2021Processed on: 8-2-2021Processed on: 8-2-2021Processed on: 8-2-2021 PDF page: 151PDF page: 151PDF page: 151PDF page: 151
6 Performance of PV Systems in Indonesia
115
TTable 6.2. Cont
Unit 510 kWp
(CISS) 532.4 kWp
(CISC) 5 kWp (p-Si) CIS/p-Si (%)
Ls kWh/kWp 0.08 0.15 0.21 -45.24
PR % 91.7 87.4 79.8 12.22
ηA,rated % 13.8 13.8 14.9 -7.38
ηA % 13.0 12.6 12.7 0.79
ηf % 12.7 12.1 11.9 4.20
ηinv % 97.8 96.2 94.0 3.19
Yf kWh/kWp 3.92 3.77 3.37 14.09
YA kWh/kWp 4.00 3.91 3.58 10.47
Yr kWh/kWp 4.27 4.32 4.22 1.78
Lc kWh/kWp 0.27 0.41 0.64 -46.88
CF % 16.3 16.0 14.1 14.54
The maintenance practices applied to the PV modules and measurement equipment
can introduce uncertainties that result in high values of degradation. The objective of the maintenance strategies is to timely detect failures in
components and the system, to regularly clean PV modules’ surfaces and, on the long
run, to slow down the decrease in efficiency which is crucial to enhance the technical
and economic performance of PV projects. Since little experience exist with
standardized maintenance schemes, this could be an interesting topic for future
research.
The measurement equipment in the PV systems in Cirata was not cleaned and
calibrated, the CIS PV modules were sometimes cleaned, and the p-Si PV modules were
never cleaned during their operation. Soiling and drifting of the irradiance sensors
increase the uncertainty of the Rd calculation, which is an interesting topic for further
investigation.
The degradation rates of the PV systems in Cirata at module level were higher than
those reported in the literature, where the average degradation rates for silicon and thin-
film technology are respectively 0.7% and 1.5% per year. However, when looking at the
system level, the Rd values from Cirata are within the boundaries as presented in other
literature [219].
For silicon technology, the average rate of degradation at the module level is
0.5%/year. However, the rate of system degradation can reach 2.5%/year. This also
indicates that BOS and soiling affect degradation [219]. For the CIS module, the
examination of yields from NREL found that the Rd of CIS can range from moderate, at
2% to 4% per year, to negligible or small, at less than 1%/year [228].
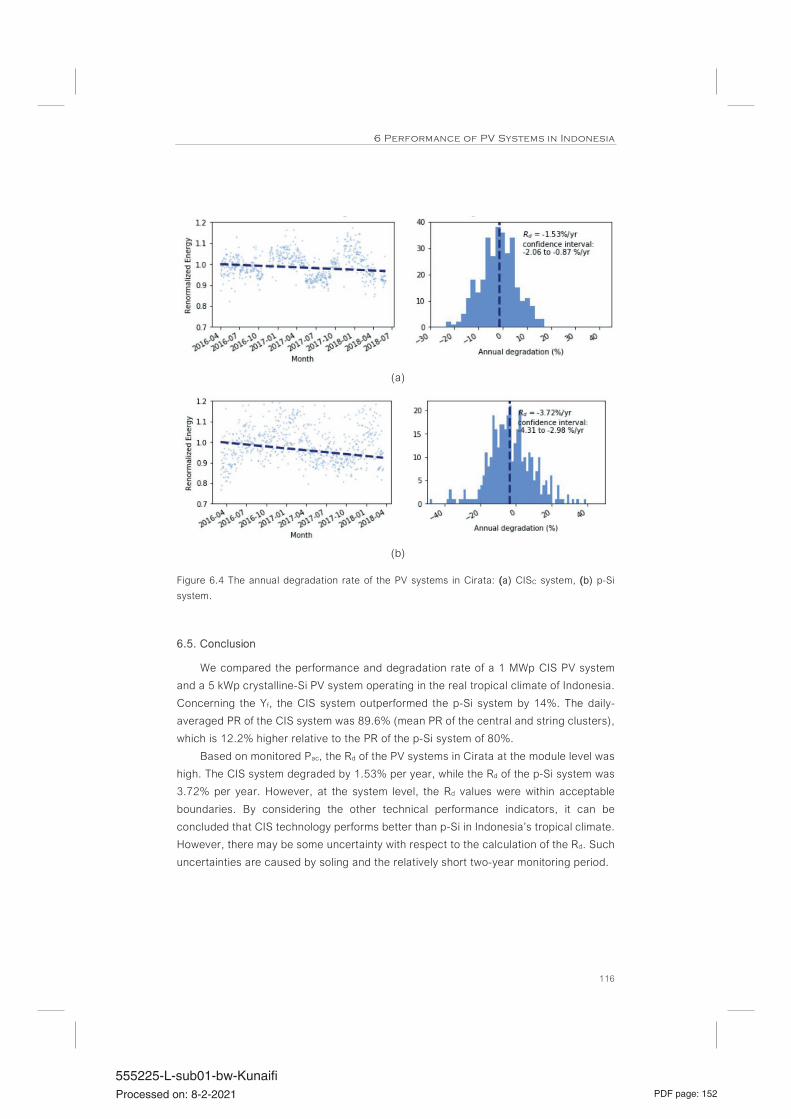
555225-L-sub01-bw-Kunaifi555225-L-sub01-bw-Kunaifi555225-L-sub01-bw-Kunaifi555225-L-sub01-bw-KunaifiProcessed on: 8-2-2021Processed on: 8-2-2021Processed on: 8-2-2021Processed on: 8-2-2021 PDF page: 152PDF page: 152PDF page: 152PDF page: 152
6 Performance of PV Systems in Indonesia
116
(a)
(b)
Figure 6.4 The annual degradation rate of the PV systems in Cirata: ((a) CISC system, ((b) p-Si
system.
6.5. Conclusion
We compared the performance and degradation rate of a 1 MWp CIS PV system
and a 5 kWp crystalline-Si PV system operating in the real tropical climate of Indonesia.
Concerning the Yf, the CIS system outperformed the p-Si system by 14%. The daily-
averaged PR of the CIS system was 89.6% (mean PR of the central and string clusters),
which is 12.2% higher relative to the PR of the p-Si system of 80%.
Based on monitored Pac, the Rd of the PV systems in Cirata at the module level was
high. The CIS system degraded by 1.53% per year, while the Rd of the p-Si system was
3.72% per year. However, at the system level, the Rd values were within acceptable
boundaries. By considering the other technical performance indicators, it can be
concluded that CIS technology performs better than p-Si in Indonesia’s tropical climate.
However, there may be some uncertainty with respect to the calculation of the Rd. Such
uncertainties are caused by soling and the relatively short two-year monitoring period.

555225-L-sub01-bw-Kunaifi555225-L-sub01-bw-Kunaifi555225-L-sub01-bw-Kunaifi555225-L-sub01-bw-KunaifiProcessed on: 8-2-2021Processed on: 8-2-2021Processed on: 8-2-2021Processed on: 8-2-2021 PDF page: 153PDF page: 153PDF page: 153PDF page: 153
6 Performance of PV Systems in Indonesia
117
Performance and
Degradation of PV
Systems in Three
Climates
This Chapter is based on “Kunaifi, K.; Reinders, A.; Lindig, S.; Jaeger, M.; Moser, D. Operational Performance and Degradation of PV Systems Consisting of Six Technologies in Three Climates. Appl. Sci. 2020, 10, 5412.”

555225-L-sub01-bw-Kunaifi555225-L-sub01-bw-Kunaifi555225-L-sub01-bw-Kunaifi555225-L-sub01-bw-KunaifiProcessed on: 8-2-2021Processed on: 8-2-2021Processed on: 8-2-2021Processed on: 8-2-2021 PDF page: 154PDF page: 154PDF page: 154PDF page: 154
6 Performance of PV Systems in Indonesia
118

555225-L-sub01-bw-Kunaifi555225-L-sub01-bw-Kunaifi555225-L-sub01-bw-Kunaifi555225-L-sub01-bw-KunaifiProcessed on: 8-2-2021Processed on: 8-2-2021Processed on: 8-2-2021Processed on: 8-2-2021 PDF page: 155PDF page: 155PDF page: 155PDF page: 155
119
CChapter 7. Performance and
Degradation of PV Systems in Three
Climates
7.1. Introduction
In Indonesia, the solar photovoltaic (PV) market is rapidly growing. However,
studies on the outdoor performance of PV systems in this tropical rainforest country is
lacking. In this work, we compare the performance of PV systems in Indonesia with PV
systems in Australia (arid, desert, hot) and Italy (temperate, dry summer, hot summer).
Monitoring data from 2008 to 2019, ranging from two to nine years, from fifteen PV
systems of six technologies were analyzed. The performance of the PV systems was
presented using their performance ratio (PR) and performance loss rate (PLR). PR was
calculated using IEC standard 61724, and PLR was calculated using seasonal and trend
decomposition, applying locally weighted scatterplot smoothing (STL decomposition)
and the year-on-year approach from NREL/RdTools.
Photovoltaic (PV) energy generation will dominate the future energy mix [229].
Thus, quantitative information about the long term performance of photovoltaic (PV)
systems is important for many stakeholders, including researchers, companies,
integrators, regulators, and investors. The performance of PV systems is influenced by
many factors, such as local climatological circumstances, system components,
installation, cost, and other miscellaneous factors [230]. In this work, we present the
performance evolution of fifteen photovoltaic (PV) systems of six different PV module
technologies in three different climates. Changes in performance are presented using
the performance ratio (PR) and the performance loss rate (PLR).
PV technologies applied in these PV plants are amorphous silicon (a-Si) solar cells
(one system), heterojunction with intrinsic thin layer (HIT) hybrid silicon (one system),
copper indium gallium selenide (CIGS, one system), monocrystalline silicon (mono-Si,
three systems), cadmium telluride (CdTe, three systems), and polycrystalline silicon (p-
Si, six systems).
The PV systems are located in three different climates, namely, Alice Springs,
Australia (arid, desert, hot), Cirata and Pekanbaru, Indonesia (tropical, rainforest), and
Bolzano, Italy (temperate, dry summer, hot summer). Data from all PV systems were
obtained directly from their monitoring systems. Table 7.1 shows the systems’ features,
including their PV technologies and locations.
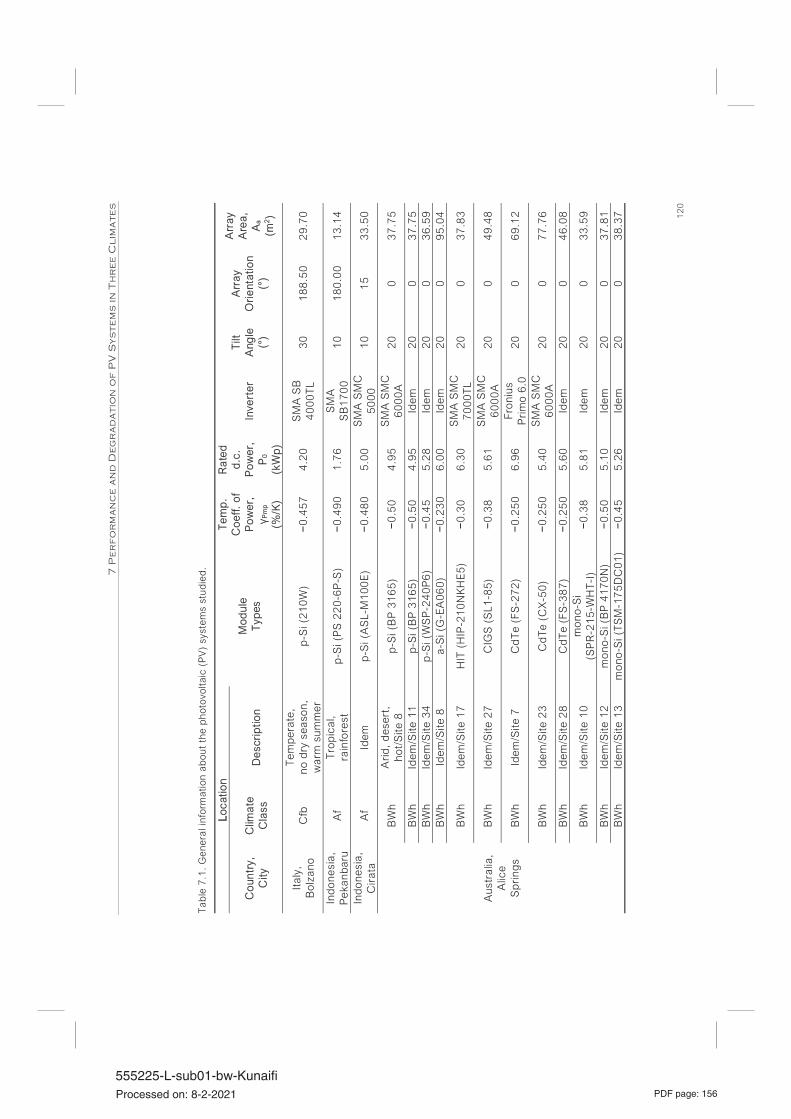
555225-L-sub01-bw-Kunaifi555225-L-sub01-bw-Kunaifi555225-L-sub01-bw-Kunaifi555225-L-sub01-bw-KunaifiProcessed on: 8-2-2021Processed on: 8-2-2021Processed on: 8-2-2021Processed on: 8-2-2021 PDF page: 156PDF page: 156PDF page: 156PDF page: 156
7 P
er
fo
rm
an
ce
a
nd
D
eg
ra
da
tio
n o
f P
V S
ys
te
ms
in
T
hr
ee
C
lim
at
es
12
0
Ta
ble
7.1
. G
ene
ral i
nfo
rmat
ion
ab
out
the
ph
otov
olta
ic (
PV
) sy
stem
s st
ud
ied
.
LLo
catio
n
Mo
du
le
Typ
es
Te
mp
. C
oef
f. o
f P
ow
er,
γ Pm
p
(%/K
)
Ra
ted
d
.c.
Po
wer
, P
0
(kW
p)
Inve
rter
T
ilt
Ang
le
(°)
Arr
ay
Ori
ent
atio
n (°
)
Arr
ay
Are
a,
Aa
(m2)
Co
untr
y,
City
C
lima
te
Cla
ss
De
scri
ptio
n
Ita
ly,
Bo
lza
no
Cfb
T
em
per
ate,
n
o d
ry s
easo
n,
wa
rm s
um
mer
p
-Si (
21
0W
) −0
.45
7
4.2
0
SM
A S
B
40
00
TL
30
1
88
.50
2
9.7
0
Ind
on
esia
, P
eka
nb
aru
Af
Tro
pic
al,
rain
fore
st
p-S
i (P
S 2
20
-6P
-S)
−0.4
90
1
.76
S
MA
S
B1
70
0
10
1
80
.00
1
3.1
4
Ind
on
esia
, C
ira
ta
Af
Idem
p
-Si (
AS
L-M
10
0E
) −0
.48
0
5.0
0
SM
A S
MC
5
00
0
10
1
5
33
.50
Aus
tral
ia,
Alic
e S
pri
ng
s
BW
h A
rid
, d
eser
t,
ho
t/S
ite 8
p
-Si (
BP
31
65
) −0
.50
4
.95
S
MA
SM
C
60
00
A
20
0
3
7.7
5
BW
h Id
em/S
ite 1
1
p-S
i (B
P 3
16
5)
−0.5
0
4.9
5
Idem
2
0
0
37
.75
B
Wh
Idem
/Site
34
p
-Si (
WS
P-2
40
P6
) −0
.45
5
.28
Id
em
20
0
3
6.5
9
BW
h Id
em/S
ite 8
a
-Si (
G-E
A0
60
) −0
.23
0
6.0
0
Idem
2
0
0
95
.04
BW
h Id
em
/Site
17
H
IT (
HIP
-21
0N
KH
E5
) −0
.30
6
.30
S
MA
SM
C
70
00
TL
20
0
3
7.8
3
BW
h Id
em
/Site
27
C
IGS
(S
L1-8
5)
−0.3
8
5.6
1
SM
A S
MC
6
00
0A
2
0
0
49
.48
BW
h Id
em/S
ite 7
C
dT
e (F
S-2
72
) −0
.25
0
6.9
6
Fro
niu
s P
rim
o 6
.0
20
0
6
9.1
2
BW
h Id
em
/Site
23
C
dT
e (C
X-5
0)
−0.2
50
5
.40
S
MA
SM
C
60
00
A
20
0
7
7.7
6
BW
h Id
em/S
ite 2
8
Cd
Te
(FS
-38
7)
−0.2
50
5
.60
Id
em
20
0
4
6.0
8
BW
h Id
em
/Site
10
m
on
o-S
i (S
PR
-21
5-W
HT
-I)
−0.3
8
5.8
1
Ide
m
20
0
3
3.5
9
BW
h Id
em
/Site
12
m
on
o-S
i (B
P 4
17
0N
) −0
.50
5
.10
Id
em
2
0
0
37
.81
B
Wh
Ide
m/S
ite 1
3
mo
no-S
i (T
SM
-17
5D
C0
1)
−0.4
5
5.2
6
Ide
m
20
0
3
8.3
7

555225-L-sub01-bw-Kunaifi555225-L-sub01-bw-Kunaifi555225-L-sub01-bw-Kunaifi555225-L-sub01-bw-KunaifiProcessed on: 8-2-2021Processed on: 8-2-2021Processed on: 8-2-2021Processed on: 8-2-2021 PDF page: 157PDF page: 157PDF page: 157PDF page: 157
7 Performance and Degradation of PV Systems in Three Climates
121
The performance of PV systems can change during their operation. As such, the
assessment of the time-series of their monitoring data can be useful to get an insight
into their long-term energy yield, reliability, and hence, financial feasibility.
Performance ratio, PR, has been widely used as a performance indicator of PV
systems for more than 25 years. Using PR, one can quantify and compare the quality of
different PV systems or module technologies operating at various climate conditions
[231]. Performance ratio is the ratio of the actual and theoretically possible energy
outputs. PR measures how effectively the plant converts the sunlight collected by the
PV panels into a.c. energy delivered to the off-taker, relative to what would be expected
from the panel nameplate rating. The calculation of PR, therefore, quantifies the overall
effect of losses due to inverter inefficiency, wiring, cell mismatch, elevated PV module
temperature, reflection from the module front surface, soiling, system downtime,
shading, and component failures. Several PV systems installed in different climates can
be relatively compared using their PR values because PR is independent of location, the
orientation of a PV array, and the incident solar irradiance. The result of the PR
calculation is a percentage or decimal value. The present range of typical PR values of
different PV technologies is 80–90% [94].
However, rather than being constant, the power of PV systems usually follows a
negative trend over time due to a decline in module and system performance. To capture
this trend, the performance loss rate (PLR) is calculated. Understanding system
performance losses over time is crucial to minimize investment risk because a higher
PLR translates directly into a lower amount of energy generation and, therefore, reduces
future cash flows [219]. Despite the differences in the assessment methods, the rate of
performance loss is influenced by location, design, and operation [232]. The accuracy
of the estimations of these indicators depends on data availability, accuracy, and
resolution, as well as the methods used in the calculation.
The PLR, sometimes also erroneously called degradation rate, is a measure used
in the PV industry to quantify a rate of change, with a negative rate representing a
decrease in performance [222]. The term PLR is more accurate as it combines actual
degradation mechanisms with reversible and irreversible performance loss factors both
on module and system level. Module degradation refers to appearing degradation modes
such as cell cracks, delamination, or hot spots. System degradation instead affects
larger parts of the plant and can be triggered through shading, soiling, etc. Therefore,
an analysis of PLR can be useful to understand the long-term financial performance of a
PV system with respect to anticipating energy production over the project lifetime.
Different types of PV modules degrade at a different rate. A meta-analysis of 11,000 PV
systems concluded that the median PLR was -0.5% to -0.6% per year and
the mean average PLR was -0.8% to -0.9% per year [233]. Although the PLR was found
to be lower, it still exceeded 1%/year in the first year of operation and then was stable
between the second and the third year [219].
555225-L-sub01-bw-Kunaifi555225-L-sub01-bw-Kunaifi555225-L-sub01-bw-Kunaifi555225-L-sub01-bw-KunaifiProcessed on: 8-2-2021Processed on: 8-2-2021Processed on: 8-2-2021Processed on: 8-2-2021 PDF page: 158PDF page: 158PDF page: 158PDF page: 158
7 Performance and Degradation of PV Systems in Three Climates
122
Another study found that the average and median values of PLR for mono-Si
installed before 2000 were, respectively, −0.7% per year and −0.5% per year, whereas
the values for thin-film technologies installed after 2000 were higher at −1.5% per year
and −1% per year, respectively [232]. Although the PLR is often used to quantify the
performance change at the module level based on laboratory or outdoor test conditions
[234], the indicator can also be applied on the PV system level [235–237].
PLR is calculated using the following general steps:
- Reading in available input data;
- Data filtering;
- Selection of performance metric;
- Possible correction and data aggregation;
- Application of the statistical method to calculate the final PLR.
In this work, two different raw data irradiance sources, namely measured irradiance
and clear sky modeled irradiance [222], are tested and two different methodologies were
used to calculate PLR.
A study in Cyprus [234] found that the annual PLR of mono-Si was −0.64%/year,
with −0.62%/year for mono-Si, and −1.78%/year for thin-film systems. Although the
study uses quite a small sample size, it could indicate that the PLR value of thin-film is
nearly three-fold of the PLR value of c-Si PV systems in warm climates.
Unlike the calculation of PR, which is basically straightforward, the calculation of
PLR does not follow a pre-determined procedure. To estimate the PLR of a PV system,
a performance metric must be selected and calculated first. After possible correction
and aggregation steps, a statistical method is applied to extract the performance trend.
Many methods decompose the metric time-series into their components. Using additive
decomposition, the sum of the components at each point of time is the same as the value
of the data at that specific time as represented by Equation (7.1) [238].
yt = St + Tt + �t (7.1)
where yt is the data, St is the seasonal component, Tt is the trend-cycle component, and
εt is the remainder, all at period t. The “seasonality” component is a repeated pattern
observed between regular intervals due to seasonal factors such as the time of the day
or the month of the year. Seasonality in weather data related to PV systems shows the
regular variation in the environmental conditions such as the irradiance, the spectral
content, the angle of incidence (θ), the ambient temperature (Tamb), and wind speed (ν)
[239]. Seasonality affects both c-Si and thin-film technologies, although c-Si
technologies are more dependent on temperature changes and spectral effects [240].
The “trend” component shows the overall increasing or decreasing slope of the metric
over time. The “remainder” component is the activity that is not explained by the trend
555225-L-sub01-bw-Kunaifi555225-L-sub01-bw-Kunaifi555225-L-sub01-bw-Kunaifi555225-L-sub01-bw-KunaifiProcessed on: 8-2-2021Processed on: 8-2-2021Processed on: 8-2-2021Processed on: 8-2-2021 PDF page: 159PDF page: 159PDF page: 159PDF page: 159
7 Performance and Degradation of PV Systems in Three Climates
123
or the seasonal value. The remainder is also expressed as the “error”, “residual”, or
“irregular” component.
The time-series are a sequence of observations recorded at regular time intervals.
They contain information about the inherent nature of the measured phenomenon, such
as the physical world, which displays interesting movements over longer periods.
Understanding time-series can also be used as a basis for forecasting the future
characteristics of the measured phenomenon. Time-series can contain features such as
autocorrelation and periodic movements, stationarity and nonstationarity, volatility,
seasonality, trends, and other common features [241]. In this work, we will focus on the
seasonality and trend features of the time-series.
Various statistical models are used to extract the components of time-series. The
most commonly used methods are moving averages (either moving average smoothing
or weighted moving averages), X11 method, SEATS decomposition, or Seasonal and
Trend decomposition using Locally weighted scatterplot smoothing (STL decomposition)
[238]. Other methods include Simple Linear Regression (SLR), Classical Seasonal
Decomposition (CSD), Holt-Winters exponential smoothing (HW) [242], as well as X12
ARIMA [240]. All of the extraction methods give better or worse estimates of the ‘trend’
between them. However, SLR was found to be the least accurate method for c-Si and
thin-film because it is sensitive to seasonality and outliers in the time-series, especially
when long-term data are not available [242].
In this work, we use STL decomposition as a statistical method for computing PLR.
STL uses locally weighted regression and thereby provides robust estimates of the trend
and seasonal components that are not distorted by outliers and missing values
compared to other methods [243,244]. STL handles any type of seasonality, not only
monthly or quarterly data. The seasonal component is allowed to change over time. The
user can control the rate of change and the smoothness of the trend-cycle. However,
STL does not handle trading day or calendar variation automatically, and it only provides
facilities for additive decompositions. A complete description of STL procedure is given
in [243].
In this work, we also evaluate the calculation of PLR using the year-on-year (YoY)
approach which follows a different concept. The idea behind the YoY approach is
explained in Section 7.3.4.
The performance of PV systems has been extensively evaluated worldwide
[245,246], mainly in Europe [219] and the US. In particular, among the comprehensive
study of the performance of PV systems in China, Japan, the US, Europe, and Australia
have been reported in respectively [247–249], and [250]. In South-East Asia, PR of PV
system operations has been reported such as in [251,252], and [54].
Recent studies about the PLR are available among others in
[229][219][232][222,233–235][239][241][251][54,253–261]. However, only two
studies were based on PV systems in South-East Asia, and no study was found in
Indonesia. Therefore, in this work, we include PV systems in Indonesia to fill the gap of
555225-L-sub01-bw-Kunaifi555225-L-sub01-bw-Kunaifi555225-L-sub01-bw-Kunaifi555225-L-sub01-bw-KunaifiProcessed on: 8-2-2021Processed on: 8-2-2021Processed on: 8-2-2021Processed on: 8-2-2021 PDF page: 160PDF page: 160PDF page: 160PDF page: 160
7 Performance and Degradation of PV Systems in Three Climates
124
PLR study of PV systems located in the tropical rainforest climate in South-East Asia.
We present the performance of fifteen grid-connected PV systems using six different
module types operating under the real outdoor conditions in three climates in Europe,
Australia, and Indonesia. The quality of the PV systems will be evaluated using the
performance indicators previously discussed: PR and PLR. The available time-series
gathered by outdoor PV system monitoring and meteorological data used in this work
ranged from two to nine years depending on the PV systems.
77.2. Experimental Set-Up
Figure 7.1 shows the geographical distribution of fifteen PV systems used in this
work. For each system, we provide the location, coordinates, climate, and annual global
horizontal irradiation in kWh/m2 per year. The PV systems are located in Bolzano, Italy
(EURAC), Pekanbaru, Indonesia (OTH Amberg-Weiden, maintained by UIN Suska Riau
University), Cirata, Indonesia (PJB), and Alice Springs, Australia (Desert Knowledge
Australia Solar Center (DKASC), maintained by Ekistica). The PV systems are located
at the Southern hemisphere, with the highest irradiation of around 2245 kWh/m2/year,
near the equator (around 1700 kWh/m2/year), and the Northern hemisphere, with the
lowest irradiation (1400 kWh/m2/year).
Basic information about each system is given. The information includes rated
power, module technical specification, mounting, tilt angle, and basic configuration. The
PR calculation was possible with several months of data, but a minimum of 24 months
of recording period is required for the calculation of PLR.
Solar irradiance on a horizontal surface in W/m2 is represented by several terms.
They are beam or direct normal irradiance (DNI), diffuse horizontal irradiance (DHI), and
ground-reflected irradiance on a horizontal surface (Eg). The sum of all irradiances is
represented as global horizontal irradiance (GHI). On the plane of array (POA), also in
the unit of W/m2, we use the in-plane terms, namely, in-plane global irradiance (GPOA),
in-plane beam irradiance (GbPOA), in-plane diffuse irradiance (GdPOA
), and in-plane
ground-reflected irradiance (GrPOA). The terms used for irradiation in Watt-hours/m2 are
horizontal irradiation (Hh) and POA irradiation (Hi), which are the irradiance aggregated.
Other important variables include Tamb in °C, module temperature (Tm) in °C, and wind
speed (ν) in m/s.
Global irradiance on the plane of array, GPOA, is mandatory for PR calculation. If
GPOA was not available, it could be estimated from the global horizontal irradiance, GHI,
using available decomposition and transposition models. Various empirical
decomposition models that are commonly used have been tested by [262]. In general,
they are used to estimate the diffuse horizontal irradiance, DHI, from measured GHI.
Thereby, both parameters have the following relation.
kd = DHI
GHI� (7.2)
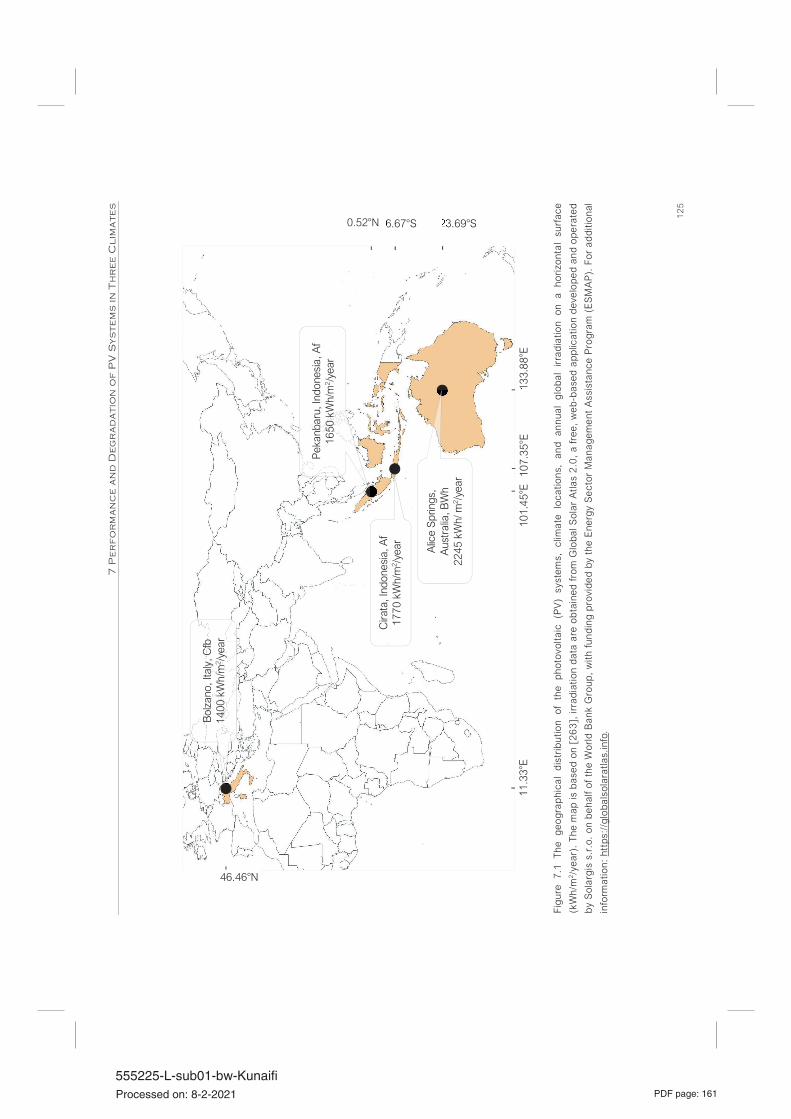
555225-L-sub01-bw-Kunaifi555225-L-sub01-bw-Kunaifi555225-L-sub01-bw-Kunaifi555225-L-sub01-bw-KunaifiProcessed on: 8-2-2021Processed on: 8-2-2021Processed on: 8-2-2021Processed on: 8-2-2021 PDF page: 161PDF page: 161PDF page: 161PDF page: 161
7 P
er
fo
rm
an
ce
a
nd
D
eg
ra
da
tio
n o
f P
V S
ys
te
ms
in
T
hr
ee
C
lim
at
es
12
5
Fig
ure
7.1
T
he
ge
og
rap
hica
l d
istr
ibu
tion
of
the
ph
otov
olta
ic
(PV
) sy
stem
s,
clim
ate
lo
catio
ns,
a
nd
an
nua
l g
lob
al
irra
dia
tion
on
a h
ori
zont
al
surf
ace
(kW
h/m
2/y
ear)
. T
he m
ap is
bas
ed
on
[2
63
], ir
rad
iati
on d
ata
are
ob
tain
ed f
rom
Glo
bal
Sol
ar
Atla
s 2
.0,
a fr
ee,
we
b-b
ase
d a
pp
lica
tion
dev
elo
pe
d a
nd
op
era
ted
by
Sol
arg
is s
.r.o
. on
be
half
of
the
Wo
rld
Ba
nk G
rou
p,
with
fu
nd
ing
pro
vid
ed
by
the
Ene
rgy
Se
cto
r M
ana
gem
ent
Ass
ista
nce
Pro
gra
m (
ES
MA
P).
For
ad
diti
ona
l
info
rmat
ion:
htt
ps:
//g
lob
als
ola
ratla
s.in
fo.
46.46°N
23.69°S 6.67°S 0.52°N
Alic
e S
prin
gs,
Aus
tral
ia, B
Wh
2245
kW
h/ m
2 /ye
ar
Cira
ta, I
ndon
esia
, Af
1770
kW
h/m
2 /ye
ar
Pek
anba
ru, I
ndon
esia
, Af
1650
kW
h/m
2 /ye
ar
Bol
zano
, Ita
ly, C
fb
1400
kW
h/m
2 /ye
ar
133.
88°E
10
7.35
°E
101.
45°E
11
.33°
E
555225-L-sub01-bw-Kunaifi555225-L-sub01-bw-Kunaifi555225-L-sub01-bw-Kunaifi555225-L-sub01-bw-KunaifiProcessed on: 8-2-2021Processed on: 8-2-2021Processed on: 8-2-2021Processed on: 8-2-2021 PDF page: 162PDF page: 162PDF page: 162PDF page: 162
7 Performance and Degradation of PV Systems in Three Climates
126
Here, kd is the diffuse fraction and its value depends on the clearness index, �, and
the selected decomposition model. Furthermore, GHI, DHI, and the direct normal
irradiance, DNI, can be described by Equation (7.3).
GHI = DHI + DNI × cos(θs) (7.3)
where θs is the solar elevation angle (°). All decomposition models use at least the
clearness index, kt, as input for computing kd, while the other models require additional
variables such as elevation angle, ambient temperature, or relative humidity (RH). All
models can estimate both DHI and DNI effectively [262]. In this work, we use the Erbs
decomposition model [264] due to simplicity because it requires only � as the input
variable to compute kd.
Next, a transposition model is used to determine GPOA using Equation (7.4).
GPOA = GbPOA + GrPOA + GdPOA
(7.4)
where GbPOA= DNI x cos (θ), with θ being the angle of incidence of the sunbeam on the
plane of the array surface.
The calculation of GrPOA is implemented using Equation (7.5) which is based on an
isotropic model.
GrPOA= GHI × ρ×
1-cos (β)
2 (7.5)
where ρ is the ground albedo, and β is the tilted angle of the PV array. Albedo is the
fraction of GrPOA and GHI on the ground that is reflected by a surface, with a value that
can be significant, reaching up to 100 W/m2. Albedo is close to zero when the surface
is very dark, and albedo is 1 when the surface is bright white, metallic, or a mirror. A
ground albedo value of 0.2 is widely accepted and is used in the modeling of PV systems
[265].
To estimate GdPOA, Equation (7.6) is used by assuming that the sky is a uniform
source of diffused irradiance [266]. Thus, GdPOA can be found from DHI and the tilt angle
of the PV array.
GdPOA= DHI ×
1 + cos (β)
2 (7.6)
If the PV module temperature, Tm, was not available, it can be estimated using the
Sandia module temperature model shown in Equation (7.7).
Tm = GPOA �ea + b. ν� + Tamb (7.7)
where ν is the wind speed in m/s, a and b are parameters that depend on the module
construction and materials, as well as the mounting configuration of the module. The

555225-L-sub01-bw-Kunaifi555225-L-sub01-bw-Kunaifi555225-L-sub01-bw-Kunaifi555225-L-sub01-bw-KunaifiProcessed on: 8-2-2021Processed on: 8-2-2021Processed on: 8-2-2021Processed on: 8-2-2021 PDF page: 163PDF page: 163PDF page: 163PDF page: 163
7 Performance and Degradation of PV Systems in Three Climates
127
table that lists representative values for a and b for various common module types and
configurations is provided in [267].
The estimations of GPOA and Tm were implemented using PVLIB Python, initiated by
Sandia National Laboratories and developed by the PVLIB community [268]. PVLIB
calculations are documented on Sandia’s PV Performance Modelling Collaborative
(PVPMC).
If no meteorological data were available, the meteorological data from PVGIS were
used [269]. PVGIS provides historical satellite data from many locations in the world and
has been extensively used in scientific publications.
Monitoring sensors for PV systems in Alice Springs are cleaned fortnightly. The
monitoring sensors in Italy are not cleaned periodically due to enough rain and low soiling
rates. However, information regarding the sensors used in the monitoring system and
maintenance of the sensors is not given for systems in Indonesia. The history of the
plants and the record of the inverter failures are also available for systems in Alice
Springs. Accordingly, we translated the moments of inverter failure into missing values
and later dropped them from the analysis. Of all systems, only the system in Cirata is
known to be free from any obstacles causing shading on the PV arrays throughout the
year. The PV system in Italy has shading from the surrounding mountains, but that holds
for the systems as well as for the irradiance sensors and simple filter-detected moments,
where one is shaded but the others are not. For the other systems, there is no
information available about shading.
The climates are classified according to Köppen–Geiger, which takes differences in
temperature and rainfall as the basis for classification [97,270,271]. In the Köppen–
Geiger classification, the Earth is classified into five main climate classes and 30
subtypes. The codification of the climate classes uses two or three letters (Figure 7.2).
The first letter represents the five climate groups, where A is for equatorial or tropical,
B is for arid, C is for warm temperate, D is for cold or snow, and E is for polar.
Furthermore, subgroups are assigned as the second letter, which indicates the type of
precipitation (water vapor condensation product in the atmosphere). The third letter, if
applicable, represents the air temperature. Figure 7.2 shows a matrix of the complete
and updated list of the 30 climate classes from Köppen–Geiger. The left axis represents
the first letter, the top axis is for the second letter, and the bottom axis is for the third
letter. For example, climate Aw is read as tropical, savannah; climate Dsc is read as
cold, dry summer, cold summer.
The PV systems are located in three different climates and countries: one system
in climate Cfb in Italy, two systems in climate Af in Indonesia, and twelve systems in
climate BWh in Australia. Table 7.1 summarizes the list of PV systems and the
corresponding climatic information.
Most PV systems in Alice Springs are connected to identical SMA Sunny Mini
Central 6-kW inverters. Only the PV systems in Site 17 (HIT modules) and Site 7 (CdTe)
use differently sized inverters. Site 17 uses an SMA Sunny Mini Central 7-kW, and Site

555225-L-sub01-bw-Kunaifi555225-L-sub01-bw-Kunaifi555225-L-sub01-bw-Kunaifi555225-L-sub01-bw-KunaifiProcessed on: 8-2-2021Processed on: 8-2-2021Processed on: 8-2-2021Processed on: 8-2-2021 PDF page: 164PDF page: 164PDF page: 164PDF page: 164
7 Performance and Degradation of PV Systems in Three Climates
128
7 uses a Fronius Primo 6 kW. The CdTe thin-film modules in Alice Springs Site 7 were
originally rated by the manufacturer for installation in Europe. They were installed in Alice
Springs without the installer, having gained approval from the manufacturer. PV systems
in Site 3 and Site 11 in Alice Springs use p-Si modules with identical size and
configuration. However, Site 3 is a roof installation, while Site 11 is ground-mounted.
Therefore, it would be interesting to observe the performance difference between these
two arrays and explain the impact of mounting an array on the roof.
Figure 7.2 Thirty climatic subclasses according to Köppen–Geiger [271] and updated by [270].
Table 7.1 shows the mentioned parameter next to the total active area, Aa, of PV
arrays and the temperature coefficient of the maximum output power (γPmp) of the PV
modules. γPmp indicates how strongly the PV array power output depends on the cell
temperature. It is a negative number because power output decreases with increasing
cell temperature.
The PV system capacity ranges from 1.76 to 6.96 kWp, tilted 20° toward an
orientation of 0° (North) for systems in Alice Springs. Systems in Pekanbaru and Cirata
in Indonesia were tilted 10° toward an orientation of 180° (South) and 15°, respectively.
The array angle of the system in Bolzano was 30°, with an orientation of 188.5° (South-
West).
Figure 7.3 shows a chart of data availability for all PV systems and weather data. In
general, data were available from September 2008 to January 2019. As shown, data
from each PV and weather monitoring system were distributed over different periods.

555225-L-sub01-bw-Kunaifi555225-L-sub01-bw-Kunaifi555225-L-sub01-bw-Kunaifi555225-L-sub01-bw-KunaifiProcessed on: 8-2-2021Processed on: 8-2-2021Processed on: 8-2-2021Processed on: 8-2-2021 PDF page: 165PDF page: 165PDF page: 165PDF page: 165
7 P
er
fo
rm
an
ce
a
nd
D
eg
ra
da
tio
n o
f P
V S
ys
te
ms
in
T
hr
ee
C
lim
at
es
12
9
F
igur
e 7
.3 T
he
per
iod
of
da
ta a
vaila
bili
ty f
or
each
PV
sys
tem
. G G
ree
n:
da
ta a
re a
vaila
ble
. RR
ed:
da
ta a
re n
ot
avai
lab
le.

555225-L-sub01-bw-Kunaifi555225-L-sub01-bw-Kunaifi555225-L-sub01-bw-Kunaifi555225-L-sub01-bw-KunaifiProcessed on: 8-2-2021Processed on: 8-2-2021Processed on: 8-2-2021Processed on: 8-2-2021 PDF page: 166PDF page: 166PDF page: 166PDF page: 166
7 Performance and Degradation of PV Systems in Three Climates
130
There was no period of time shared by all systems. Therefore, in this work, we
analyzed each PV system according to the period of data availability rather than using
the same period of time. The PV system in Bolzano had the longest period of available
data of nine years, from February 2011 to January 2019. In contrast, the PV system in
Cirata had the shortest period of two years of data, from March 2016 to March 2018. At
a monthly level, most of the systems did not have missing values except for the PV
systems in Site 27, which missed two months in total, and Site 7, which had a total of a
half-year of missing data, both in Alice Springs. The weather data in Alice Springs are
only available until October 2016. That is why all systems have the same end date.
77.3. Methods
7.3.1. Data Preparation
The measurement data should be as free from errors as possible. However, this is
rarely the case. Data used in this work contain wrong values, gaps, outliers, spikes,
drops, and other types of noise. Data also contain wrong or different formats of
timestamps. These common problems affect the readiness of data for analysis, the
quality of the time series, and, further, the quality of the analysis.
To ensure the systematic patterns of the time series data more salient, we applied
a series of data preprocessing techniques to the raw data for each PV system. (1) Data
were filtered according to standard IEC61724-1:2017 [216]. Namely, the daytime data
were selected by eliminating irradiance values below 200 W/m2 and above 1500 W/m2.
For Tamb, only values between −40 and 60 °C were used. For the module temperature,
Tm, values between Tamb and Tamb plus 30 °C were included [272]. Wind speed values, ν,
between 0 to 30 m/s were included. (2) The data were thoroughly checked to ensure
consistency and to detect gaps. Duplicates in the data were detected and removed. (3)
Further general outlier removal was applied based on predefined criteria depending on
the characteristic of the data. If a variable value, X, minus the population mean, μ, is
greater than two times the standard deviation, σ, then that specific X value is an outlier,
and it will be excluded.
�X - μ� >2σ (7.8)
(4) Any abnormal value, such as largely negative and dead values that were stuck for
one hour or longer, were removed. (5) Due to many incomplete records based on the
previous treatments, we selected data with high monitoring fractions (MFs), either
intrahours, intradays, or intramonth. A minimum MF of 85% was found to be optimal to
keep the data quality high without losing too much data.
555225-L-sub01-bw-Kunaifi555225-L-sub01-bw-Kunaifi555225-L-sub01-bw-Kunaifi555225-L-sub01-bw-KunaifiProcessed on: 8-2-2021Processed on: 8-2-2021Processed on: 8-2-2021Processed on: 8-2-2021 PDF page: 167PDF page: 167PDF page: 167PDF page: 167
7 Performance and Degradation of PV Systems in Three Climates
131
77.3.2. Calculation of the Performance Ratio
The monitoring standard IEC61724-1:2017 [216] was applied to calculate the PR.
In chapter 3 Section 6.3.1, a detailed performance calculations has been given. Three
types of PR were calculated: PR, STC temperature-corrected PR, PRstc, and annual-
averaged temperature-corrected PR, PRann. For the calculation of PRstc. and PRann., the
temperature coefficient of maximum power (γPmp) is a critical component.
7.3.3. Calculation of the Performance Loss Rate Using Linear Regression and STL
In this work, PLR was evaluated using linear regression (LR), STL decomposition,
and the YoY approach. With the first approach, PLR was computed by evaluating the
PRann time series using linear regression. With the second approach, the calculation of
PLR involved three main steps. First, the decomposition of continuous monthly PR time-
series into its components using STL (see Equation (7.1)). We used the annual-averaged
temperature-corrected PR, PRann, as the base data from which the PLR was calculated.
PRann. was calculated using Equation (7.14) [273].
PRann = � Eac_ii
� �P0 � IiGref
� �1-γPmp
100 �Tm,ave � Tm,i���i
(7.9)
where i is a given point in time, Eac is the measured a.c. electrical generation (kWh).
The STL algorithm extracts Tt using a locally weighted polynomial fitting. The STL
decomposition results in the “trend”, “seasonal”, and “residual” components of the
original temperature-corrected PR time series. STL has been implemented in other PV
performance studies using the software R [229][232][244][261]. Other studies such as
[261][274] have also applied STL without mentioning the tools used to implement it in
the analysis of PV systems’ time-series. In this work, the STL algorithm was implemented
using a Python library named STLDecompose [275], according to the LOESS smoothing
method [243]. The annual analysis period of 12 months is used, which represents the
number of months in a year. To accommodate strong annual periodicity within the years
of daily observations, if needed, a period of 365 days would be appropriate.
Second, the calculation of the linear least-squares regression values of the “trend”
component, Tt, of the temperature-corrected PR using Equation (7.15).
Tt = ax + b (7.10)
where x is an independent variable or the variable to make predictions, a is the slope of
the regression line that represents the effect x has on Tt, and b is the Tt-intercept. The
final PLR value, in percentage, is the rate of change, either positive or negative, of the
regression of the trend component. From the regression parameters, the relative PLR is
computed using Equation (7.16) [257].
555225-L-sub01-bw-Kunaifi555225-L-sub01-bw-Kunaifi555225-L-sub01-bw-Kunaifi555225-L-sub01-bw-KunaifiProcessed on: 8-2-2021Processed on: 8-2-2021Processed on: 8-2-2021Processed on: 8-2-2021 PDF page: 168PDF page: 168PDF page: 168PDF page: 168
7 Performance and Degradation of PV Systems in Three Climates
132
PLRr= 12a
b (7.11)
where 12 is the number of months in a year. Further, removing the denominator b, if
needed, will result in an absolute value of PLR, also known as PL.
As its name implies, the year-on-year (YoY) method uses performance time-series
over year-on-year distributions. It aggregates the data points of the chosen metric
between the same calendar days of subsequent years [224] by which the effects are
minimized by comparing points at similar times of the year. The standard metric used in
RdTools is renormalized power/energy values based on PVWatts.
77.3.4. Calculation of the Performance Loss Rate Using the YoY Approach
We calculated PLR based on monitoring data (using sensors) and a clear sky model
using NREL’s RdTools. Figure 7.4 shows an example of degradation calculations taken
from a CIGS PV module in Alice Springs in daily resolution. The time-series charts on
the left-hand side show the year-on-year energy production normalized using baseline
a.c. energy values from PVWatts calculation according to the following equation [276].
P=GPOA
1000*P0(1+γPmp(Tm-25°C) (7.12)
PVWatts is a free software provided by NREL. It uses typical meteorological data to
generate predicted energy production.
As shown, the annual PLR value was observed to be large enough to be visually
detectable when calculated using sensor data compared to using the clear sky model.
The histograms on the right-hand side present the distribution of the daily PLR values
calculated by comparing a renormalized energy value of one particular date in a
particular year to another PR value on the same date from the previous year. Depending
on the comparison result of the energy output of two consecutive days, PLR values can
be both positive and negative, as shown in the histograms. The median of the PLR values
becomes the final single annual PLR value to be reported.
Degradation values obtained by the clear-sky method and measurement sensor
method differ. Using the example from the CIGS PV system in Alice Springs (Figure 7.4),
the clear-sky method resulted in a smaller degradation value, 0.17%/year, as compared
to 1.2%/year based on measurements. This can be explained by the different origins of
irradiance data in these methods. Namely, a clear-sky model simulates irradiance by
geometric sun position modeling and atmospheric clear sky modeling [277], which is
ideal as compared to the real world irradiance measured by irradiance sensors which
can be disturbed by clouds and shading by neighboring objects. Since monitoring data
represent the actual operation of PV systems, they measured irradiance data provide
the best input to PV performance analysis and hence the determination of degradation

555225-L-sub01-bw-Kunaifi555225-L-sub01-bw-Kunaifi555225-L-sub01-bw-Kunaifi555225-L-sub01-bw-KunaifiProcessed on: 8-2-2021Processed on: 8-2-2021Processed on: 8-2-2021Processed on: 8-2-2021 PDF page: 169PDF page: 169PDF page: 169PDF page: 169
7 Performance and Degradation of PV Systems in Three Climates
133
rates. If monitoring data are not available, then the clear-sky method could be a useful
alternative to estimate degradation values with less accuracy.
(aa)
(bb)
Figure 7.4 Examples of the degradation rate of a copper indium gallium selenide (CIGS) PV
system from Site 27 in Alice Springs. The degradation calculation based on (a) measurement
sensors, and (b) a clear sky model.
7.4. Results and Discussion
7.4.1. Performance Ratio
Figure 7.5 presents an example of daily performance ratios of a selected PV system,
a p-Si system in Cirata, during the year of 2017. The performance ratio, PR, is shown in
blue, PRstc. in orange, and PRann. in green. Scatter plots are the actual values, and the
lines are the 30-day averaged values. As shown, the PR and PRann. values are close
together while the PRstc. values are higher, about 0.1.
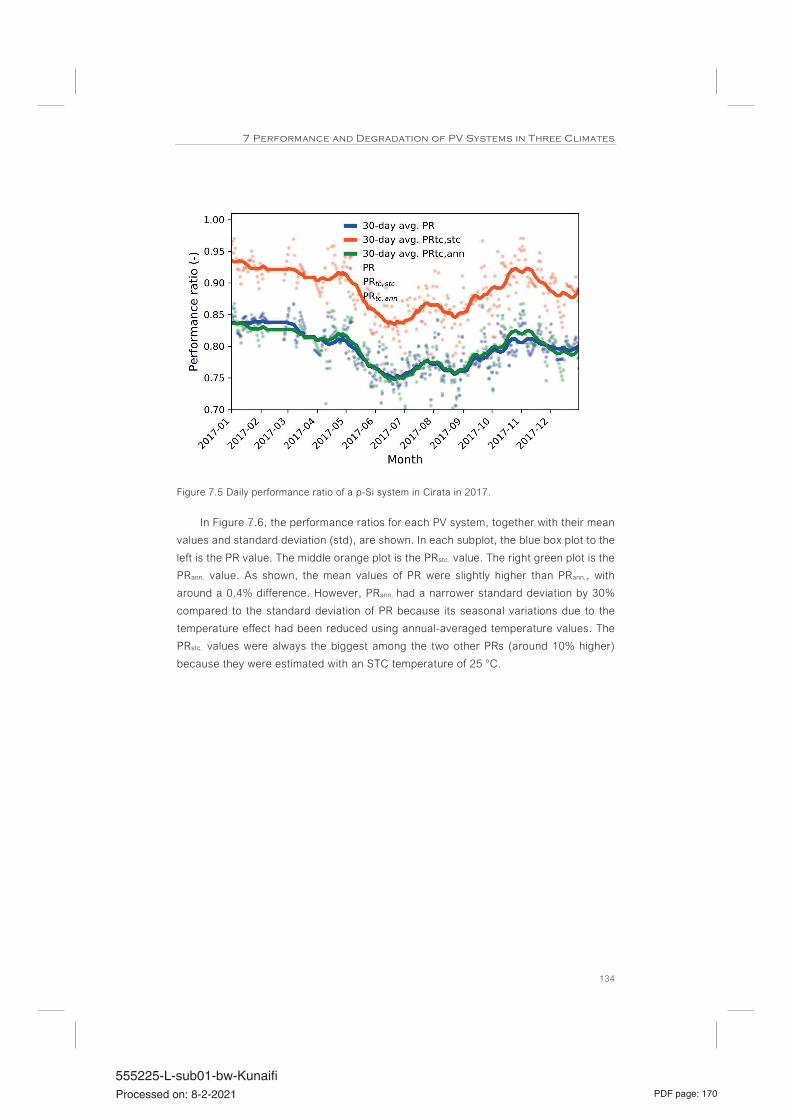
555225-L-sub01-bw-Kunaifi555225-L-sub01-bw-Kunaifi555225-L-sub01-bw-Kunaifi555225-L-sub01-bw-KunaifiProcessed on: 8-2-2021Processed on: 8-2-2021Processed on: 8-2-2021Processed on: 8-2-2021 PDF page: 170PDF page: 170PDF page: 170PDF page: 170
7 Performance and Degradation of PV Systems in Three Climates
134
Figure 7.5 Daily performance ratio of a p-Si system in Cirata in 2017.
In Figure 7.6, the performance ratios for each PV system, together with their mean
values and standard deviation (std), are shown. In each subplot, the blue box plot to the
left is the PR value. The middle orange plot is the PRstc. value. The right green plot is the
PRann. value. As shown, the mean values of PR were slightly higher than PRann., with
around a 0.4% difference. However, PRann. had a narrower standard deviation by 30%
compared to the standard deviation of PR because its seasonal variations due to the
temperature effect had been reduced using annual-averaged temperature values. The
PRstc. values were always the biggest among the two other PRs (around 10% higher)
because they were estimated with an STC temperature of 25 °C.

555225-L-sub01-bw-Kunaifi555225-L-sub01-bw-Kunaifi555225-L-sub01-bw-Kunaifi555225-L-sub01-bw-KunaifiProcessed on: 8-2-2021Processed on: 8-2-2021Processed on: 8-2-2021Processed on: 8-2-2021 PDF page: 171PDF page: 171PDF page: 171PDF page: 171
7 Performance and Degradation of PV Systems in Three Climates
135
Figure 7.6 Box plots of the performance ratio of each PV system. Left/blue: PR, middle/orange:
temperature-corrected PR by STC, right/green: annual-averaged temperature-corrected PR.
Numbers at the upper right corners in the boxes indicate the duration of the analyzed data in the
number of years.
Figure 7.7 shows the mean performance ratio and its standard deviation by
technology. The CIGS module has the highest values of all PR types, followed by HIT.
The performance superiority of CIGS and HIT modules were also reported in Thailand,
which has a tropical climate as well [237]. The p-Si and CdTe modules follow in terms
of the values of PR and PRann. However, when the temperature is closer to STC, p-Si
modules performed better than CdTe modules. In addition, the performance range of p-
Si modules is smaller than CdTe modules. A similar comparison was observed for mono-
Si and a-Si modules in terms of STC temperature; the mono-Si modules had a higher PR
than a-Si while their PR and PRann. were relatively similar.

555225-L-sub01-bw-Kunaifi555225-L-sub01-bw-Kunaifi555225-L-sub01-bw-Kunaifi555225-L-sub01-bw-KunaifiProcessed on: 8-2-2021Processed on: 8-2-2021Processed on: 8-2-2021Processed on: 8-2-2021 PDF page: 172PDF page: 172PDF page: 172PDF page: 172
7 Performance and Degradation of PV Systems in Three Climates
136
Figure 7.7 Performance ratio by technology.
Table 7.2 shows the performance ratio and their standard deviation by climate. For
the climatic comparison of PRs, we use p-Si modules because 50% of the evaluated PV
systems fall in this category. In terms of PR and PRann., the p-Si system in climate Cfb of
Italy has a higher performance of 0.84 than those in climates BWh (Australia) and Af
(Indonesia) with the same value of 0.81. In contrast, PRstc. in climates BWh and Af were
slightly higher than those in climate Cfb. The reason for this is because the average
temperature in climates BWh and Af are closer to 25 °C.
Table 7.2. Performance ratio of p-Si systems and their standard deviation by climate.
CClimate Country PR PRstc. PRann.
BWh Australia 0.81 ± 0.03 0.92 ± 0.02 0.81 ± 0.02
Af Indonesia 0.81 ± 0.03 0.90 ± 0.03 0.81 ± 0.03
Cfb Italy 0.84 ± 0.04 0.89 ± 0.03 0.84 ± 0.03
7.4.2. Performance Loss Rate Calculation Using LR and STL
PLR has been evaluated using linear regression and STL decomposition. Figure 7.8
shows the monthly PRann. time-series, their fitting lines, and trend components. As shown,
the data do not have the same length, ranging from two to nine years. The grey lines are
PRann., also shown in blue lines for PV systems with data less than a five-year period. The
dashed orange lines are the applied linear regression fits of PRann., and the green lines are
the STL-extracted “trend” component of the PRann. time-series. For almost all systems, the
difference between the regression fits with the trends is very small, which means that the
STL method is useful for an accurate calculation of changes in performance.

555225-L-sub01-bw-Kunaifi555225-L-sub01-bw-Kunaifi555225-L-sub01-bw-Kunaifi555225-L-sub01-bw-KunaifiProcessed on: 8-2-2021Processed on: 8-2-2021Processed on: 8-2-2021Processed on: 8-2-2021 PDF page: 173PDF page: 173PDF page: 173PDF page: 173
7 Performance and Degradation of PV Systems in Three Climates
137
Figure 7.8 Annual-averaged monthly temperature-corrected performance ratios, PRann., of the PV
systems (grey or blue lines), their linear fit (dashed orange line), and trend components (green
line) over the monitoring period. Numbers at the top right of the charts indicate the lengths of the
data in years.
The quantities of PLR using STL are presented in Figure 7.9, grouped by module
technologies and climate zones. The values of PLR are presented as relative values
(chart on the left-hand side) and absolute values (chart on the right-hand side). Reading
the mean of relative values, p-Si shows the lowest PLR of −0.6%/year, followed by CIGS
at −0.8%/year, mono-Si at −0.84%/year, HIT at −1.01%/year, and CdTe at −1.18%/year.
The strongest degradation was experienced by a-Si modules at -1.58%/year. CdTe
systems have the largest range, from −0.38%/year to −2.20%/year. In contrast, the
range of PLR values of p-Si systems was the smallest, from −0.19%/year to
−0.97%/year. The results are in line with a previous similar study [232].

555225-L-sub01-bw-Kunaifi555225-L-sub01-bw-Kunaifi555225-L-sub01-bw-Kunaifi555225-L-sub01-bw-KunaifiProcessed on: 8-2-2021Processed on: 8-2-2021Processed on: 8-2-2021Processed on: 8-2-2021 PDF page: 174PDF page: 174PDF page: 174PDF page: 174
7 Performance and Degradation of PV Systems in Three Climates
138
(aa)
(bb)
Figure 7.9 Performance loss rate of the PV systems using STL. (a) Grouped by module
technologies, ((b) grouped by climate. Left: relative values, right: absolute values.
7.4.3. Comparison of PLR Values Using STL and YoY
While the methodology of calculating PR is widely accepted and standardized, the
degradation of PV systems is estimated using different approaches. For that reason, in
this section, we compare the PLR values presented in Section 7.4.2 with the ones
retrieved using the YoY approach. For the YoY approach, the PLR calculation is mainly
focused on using sensor-based data, but additional analysis is also performed using a
clear sky model.
As shown in Figure 7.10a, the PLR calculation based on monitoring data showed
that p-Si modules degraded the least while the highest rate was observed for the a-Si
modules. On average, p-Si modules degrade at −0.93%/year, followed by mono-Si at
−1.01%/year, HIT at −1.07%/year, CIGS at −1.2%/year, CdTe at −1.38%/year, and a-Si
at −1.63%/year. If we apply the clear sky model for the calculation, the lowest PLR is
observed for the HIT modules with −0.12%/year, while the a-Si system still experiences
the highest PLR at −1.22%/year. In between, CIGS degrades at −0.17%/year, mono-Si
at −0.28%/year, p-Si at −0.53%/year, and CdTe at −0.82%/year.
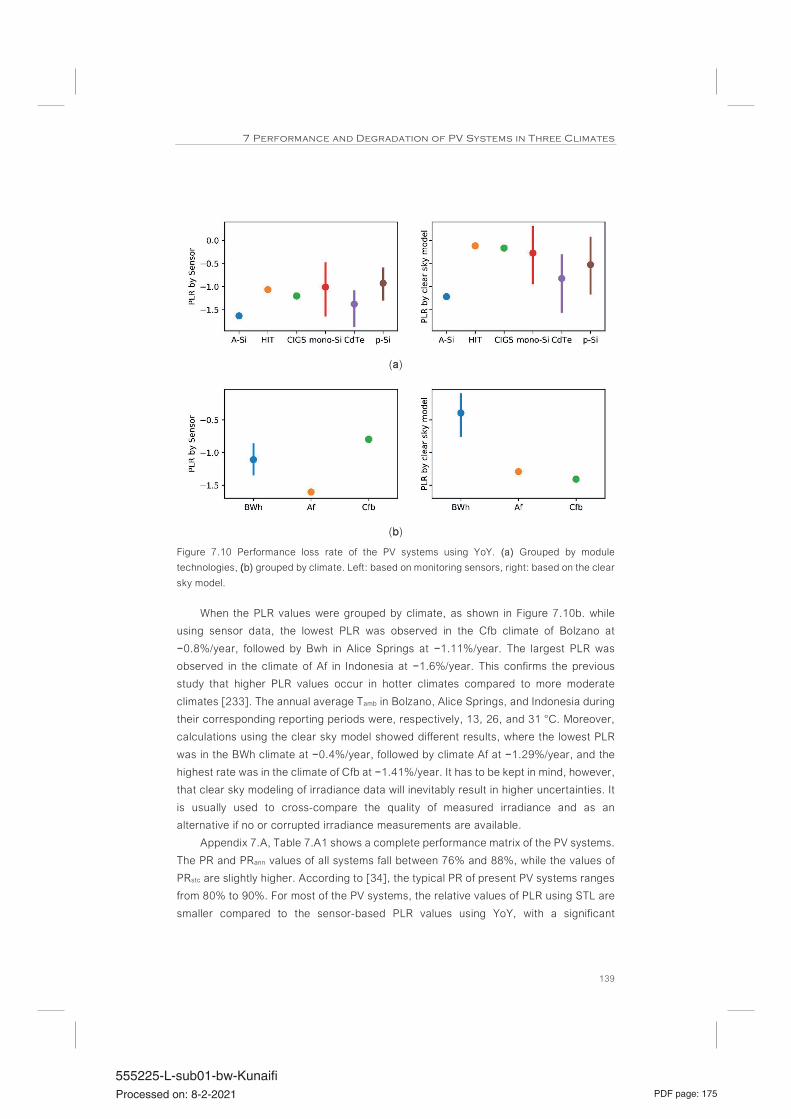
555225-L-sub01-bw-Kunaifi555225-L-sub01-bw-Kunaifi555225-L-sub01-bw-Kunaifi555225-L-sub01-bw-KunaifiProcessed on: 8-2-2021Processed on: 8-2-2021Processed on: 8-2-2021Processed on: 8-2-2021 PDF page: 175PDF page: 175PDF page: 175PDF page: 175
7 Performance and Degradation of PV Systems in Three Climates
139
(aa)
(bb)
Figure 7.10 Performance loss rate of the PV systems using YoY. (a) Grouped by module
technologies, ((b) grouped by climate. Left: based on monitoring sensors, right: based on the clear
sky model.
When the PLR values were grouped by climate, as shown in Figure 7.10b. while
using sensor data, the lowest PLR was observed in the Cfb climate of Bolzano at
−0.8%/year, followed by Bwh in Alice Springs at −1.11%/year. The largest PLR was
observed in the climate of Af in Indonesia at −1.6%/year. This confirms the previous
study that higher PLR values occur in hotter climates compared to more moderate
climates [233]. The annual average Tamb in Bolzano, Alice Springs, and Indonesia during
their corresponding reporting periods were, respectively, 13, 26, and 31 °C. Moreover,
calculations using the clear sky model showed different results, where the lowest PLR
was in the BWh climate at −0.4%/year, followed by climate Af at −1.29%/year, and the
highest rate was in the climate of Cfb at −1.41%/year. It has to be kept in mind, however,
that clear sky modeling of irradiance data will inevitably result in higher uncertainties. It
is usually used to cross-compare the quality of measured irradiance and as an
alternative if no or corrupted irradiance measurements are available.
Appendix 7.A, Table 7.A1 shows a complete performance matrix of the PV systems.
The PR and PRann values of all systems fall between 76% and 88%, while the values of
PRstc are slightly higher. According to [34], the typical PR of present PV systems ranges
from 80% to 90%. For most of the PV systems, the relative values of PLR using STL are
smaller compared to the sensor-based PLR values using YoY, with a significant
555225-L-sub01-bw-Kunaifi555225-L-sub01-bw-Kunaifi555225-L-sub01-bw-Kunaifi555225-L-sub01-bw-KunaifiProcessed on: 8-2-2021Processed on: 8-2-2021Processed on: 8-2-2021Processed on: 8-2-2021 PDF page: 176PDF page: 176PDF page: 176PDF page: 176
7 Performance and Degradation of PV Systems in Three Climates
140
difference ranging from −12% to −20% for mono-Si in Alice Springs and −13% to −60%
for p-Si in the same location. The differences in degradation values retrieved from STL
and YoY were caused by the underlying differences in the methods themselves. The PLR
using STL was calculated based on a decomposition of the temperature corrected PR
while the YoY-based PLR was calculated using the differences in daily instances of PR
and renormalized energy using PVWatts.
77.5. Conclusions
Two performance matrices of fifteen PV systems of six module technologies
operating under real conditions in three climates were calculated. The PV systems
consist of one amorphous silicon (a-Si) solar cell system, one heterojunction with
intrinsic thin layer (HIT) hybrid silicon system, one copper indium gallium selenide (CIGS)
system, three monocrystalline silicon (mono-Si) systems, three cadmium telluride
(CdTe) systems, and six polycrystalline silicon (p-Si) systems. The PV systems are
located in Australia, Indonesia, and Italy. The matrices include performance ratio (PR)
and performance loss rate (PLR). PLR was calculated using two different approaches.
Seasonal and trend decomposition using locally weighted scatterplot smoothing (STL
decomposition) was applied to temperature-corrected PR time-series, while the Year-
on-Year approach was applied to renormalized energy values based on the power
predictive model PVWatts. The latter was furthermore applied to sensor-based
irradiance data as well as clear-sky modeled data. The general conclusions of this work
are
1. The annual-averaged temperature-corrected performance ratio, PRann, with an
average value of all systems from each technology. The CIGS system performed
best with an average PR value of 0.88 ± 0.04. The least performing technology was
the a-Si PV systems, with an average PR value of 0.78 ± 0.05. The p-Si systems in
climate Cfb of Italy had a higher average PR of 0.84 than those operating in climates
BWh (Australia) and Af (Indonesia), with the same value of 0.81.
2. Performance loss rates based on the STL approach. For almost all systems, the use
of STL for the calculation of PLR is helpful, especially if monitoring data of high
quality was not available. The p-Si systems show the lowest PLR among the
technologies with an average PLR value of -0.6%/year. The strongest performance
loss was experienced by a-Si modules at -1.58%/year.
Results from Indonesia were appreciated because they provide the first study on
the topic. However, they were based on only two PV systems with a data period of two
and three years, which is not representative enough to draw a strong general conclusion
and is subject to very high uncertainties. In addition, PV systems that used a-Si, CIGS,
and HIT were represented by only one PV system each. More studies involving PV
systems in South-East Asia and other climates are needed. Moreover, further
555225-L-sub01-bw-Kunaifi555225-L-sub01-bw-Kunaifi555225-L-sub01-bw-Kunaifi555225-L-sub01-bw-KunaifiProcessed on: 8-2-2021Processed on: 8-2-2021Processed on: 8-2-2021Processed on: 8-2-2021 PDF page: 177PDF page: 177PDF page: 177PDF page: 177
7 Performance and Degradation of PV Systems in Three Climates
141
investigations are required to show the nonlinear behavior in PV system performance,
which is the actual case, while this work and many others assume a linear performance.
The differences in the calculation methods, in this case using STL and YoY, result
in significant degradation values. STL employs a decomposition of the temperature
corrected PR and the YoY was based on differences in daily instances of renormalized
energy values. Distinct differences among the calculated PLR values between both
approaches demand a standardization along the whole calculation chain from input data
treatment to the application of statistical methods to calculate reliable PLR.

555225-L-sub01-bw-Kunaifi555225-L-sub01-bw-Kunaifi555225-L-sub01-bw-Kunaifi555225-L-sub01-bw-KunaifiProcessed on: 8-2-2021Processed on: 8-2-2021Processed on: 8-2-2021Processed on: 8-2-2021 PDF page: 178PDF page: 178PDF page: 178PDF page: 178
7 Performance and Degradation of PV Systems in Three Climates
142

555225-L-sub01-bw-Kunaifi555225-L-sub01-bw-Kunaifi555225-L-sub01-bw-Kunaifi555225-L-sub01-bw-KunaifiProcessed on: 8-2-2021Processed on: 8-2-2021Processed on: 8-2-2021Processed on: 8-2-2021 PDF page: 179PDF page: 179PDF page: 179PDF page: 179
7 Performance and Degradation of PV Systems in Three Climates
143
Conclusions,
Discussion, and
Recommendations

555225-L-sub01-bw-Kunaifi555225-L-sub01-bw-Kunaifi555225-L-sub01-bw-Kunaifi555225-L-sub01-bw-KunaifiProcessed on: 8-2-2021Processed on: 8-2-2021Processed on: 8-2-2021Processed on: 8-2-2021 PDF page: 180PDF page: 180PDF page: 180PDF page: 180
7 Performance and Degradation of PV Systems in Three Climates
144
555225-L-sub01-bw-Kunaifi555225-L-sub01-bw-Kunaifi555225-L-sub01-bw-Kunaifi555225-L-sub01-bw-KunaifiProcessed on: 8-2-2021Processed on: 8-2-2021Processed on: 8-2-2021Processed on: 8-2-2021 PDF page: 181PDF page: 181PDF page: 181PDF page: 181
145
CChapter 8. Conclusions,
Discussion, and Recommendations
8.1. Conclusions
In this thesis, the societal aspects of the electricity grid and the performance of PV
systems in Indonesia have been studied with the purpose to answer the main research
question of this thesis: What are the experiences and attitudes of Indonesian end-users
towards the electricity grid, as well as solar energy, and would a transition towards solar
photovoltaic (PV) systems be feasible considering the performance of PV systems
operating under Indonesia’s tropical climate conditions?
At the end of this section, we will be able to answer this main research question based
on findings related to sub-research questions, which were presented in Chapter 1. These sub-
research questions will therefore be answered in the following sub-sections, 8.1.1 to 8.1.5.
8.1.1. What are the Main Factors that Influence the Energy Situation in Indonesia?
As shown in Chapter 2, several aspects have been influencing the energy situation,
particularly the electricity sector, in Indonesia. Those aspects are briefly described as
follows. Being one of the largest archipelagoes in the world, Indonesia has a unique
power supply system. With a total area of 8.3 million km2 and the existence of more than
17,000 islands [56], a centralized power system connecting the whole country is not
suitable for Indonesia. Extending power lines between the big islands and extending the
grid to the smaller islands are often technically or economically unviable. With such a
geographical factor, it can be seen that Indonesia has many isolated power systems of
different sizes. Also, for decades, diesel generators have been very popular on small
islands in Indonesia due to their simple installation and low initial costs.
The demand for energy in Indonesia is strongly influenced by its economic and
population conditions. Indonesia has a big economy which grows positively. Regarding
the gross domestic product (GDP) based on purchasing power parity (PPP), Indonesia
is predicted to become one of the world’s economic leaders in the coming decades. In
2019, Indonesia’s GDP (PPP) was US$3.3 billion, which was ranked seventh in the world
and contributed to 2.5% of the total global GDP (PPP). The economic growth in 2019
was 5.02% [70] with a target of 7% in the coming years7.
7 The target of 7% of economic growth in 2020 was set before the coronavirus outbreak occurred.

555225-L-sub01-bw-Kunaifi555225-L-sub01-bw-Kunaifi555225-L-sub01-bw-Kunaifi555225-L-sub01-bw-KunaifiProcessed on: 8-2-2021Processed on: 8-2-2021Processed on: 8-2-2021Processed on: 8-2-2021 PDF page: 182PDF page: 182PDF page: 182PDF page: 182
8 Conclusions, Discussion, and Recommendations
146
The economic condition of Indonesia strongly correlates with the high and
increasing demand for energy. Besides the economy, population size also influences
energy demand. In 2019, Indonesia was the fourth most populous country in the world
with a total population of 268 million [86].
Indonesia needs a new approach in developing its power system. This is affected
by its geography that consists of distributed islands and the ever-increasing electricity
demand. Namely, Indonesia should increase the share of renewable energy in its
national energy mix. Renewable energy uses limitless local energy sources which is
suitable for a distributed generation (DC). Vast potential for renewable energy is
available in Indonesia’s, thanks to its unique topography and climate. Being part of the
Pacific Ring of Fire, the total potential of 312 geothermal sites across Indonesia is
approximately 28.9 gigawatt (GW) [60]. Also, its topography is characterized by the
existence of mountain and valley which provides around 75 GW hydro-power potential
[278]. Further, being a tropical rainforest climate, Indonesia is a rich source of biomass
energy and has a good solar irradiance across the year. The potential for biomass
electricity is around 50 GW [279] and the potential for solar PV will be presented in
Section 8.1.2. To ensure a steady improvement of renewable energy development in
Indonesia, stakeholders call for supporting regulation by the government to ensure a
higher share of renewable energy in the national energy mix.
88.1.2. What are the Challenges in Providing Proper Electrical Power Supply to the Whole
Population in Indonesia?
At present, Indonesia is still facing challenges in providing a proper electrical power
supply to the whole population and to pursue the 5.8% annual growth of electricity
demand [118]. In 2019, 1.1% of Indonesian population remained without electricity
services [3], which has been decreased from 4.7% in 2017 [117]. We identified three
groups of challenges as have been discussed in Chapter 3 of this thesis and briefly
presented below.
First, Indonesia is characterized by significant variations between regions regarding
access to electricity, power sale, price of electrical energy, and the reliability of
electricity service by the grid. The western and central regions are relatively better
developed than the eastern region. By the end of 2019, the electrification rate (ER)
ranged from the lowest value of 85% in East Nusa Tenggara (ENT), the average value
of around 91%, to the highest value of 99% in some provinces in Java and Sumatra [3].
Most of the electricity sales take place in Java, with a figure of 2.6 times higher than for
all other regions outside Java combined [118]. The electrical energy price disparity
exists between urban and rural areas where the costs of electricity in urban areas are
lower than those in rural areas. Since the end of 2017, the household electricity tariff
provided by PLN is IDR1,352/kWh (≈ US$9 cent/kWh) [123] while electricity generated

555225-L-sub01-bw-Kunaifi555225-L-sub01-bw-Kunaifi555225-L-sub01-bw-Kunaifi555225-L-sub01-bw-KunaifiProcessed on: 8-2-2021Processed on: 8-2-2021Processed on: 8-2-2021Processed on: 8-2-2021 PDF page: 183PDF page: 183PDF page: 183PDF page: 183
8 Conclusions, Discussion, and Recommendations
147
by diesel generators on smaller islands cost IDR2,730/kWh (≈US$39 cent/kWh) in 2018
[124], which was typical values for diesel generators that normally run less than 12 h
per day [125]. The reliability of the power grid in Indonesia is improving. Nevertheless,
power supply in Indonesia is still characterized by frequent blackouts and brownouts.
On the main islands of Java and Bali, the grid is more reliable than elsewhere, where
blackouts occur daily.
Second, despite its economic size and growth rate, electricity consumption in
Indonesia is relatively low compared to other Asian countries and any European country.
In 2017, the annual electricity consumption per capita was only 1 megawatt-hour (MWh)
[119], which was low compared to that in Vietnam at 1.6 MWh/capita, Thailand at 2.7
MWh/capita, Singapore at 8.7 MWh/capita [65], and Netherlands at 6.7 MWh/capita
[120].
Third, power infrastructure development and climate change mitigation in Indonesia
seems to be conflicting with each other. To tackle a power shortage that reached 21,000
MW in 2015, the government of Indonesia initiated the “35,000 MW Power Plant
Development Program” for a duration of five years starting from 2015. However, while
the CO2 emissions were supposed to be reduced in Indonesia, the program consists of
around 20 GW of coal-powered plants that are predicted to emit more than 10
Megatonne CO2-equivalents each year or a cumulative amount of 1.4 Gigatonne CO2-
equivalents until 2035 [139].
The Indonesian national fossil fuel reserves are depleting. Without discoveries in
the forthcoming period, the coal reserve would be depleted in 20-61 years, natural gas
in 17-19 years, and oil in 9 years. This is a clear message that renewable energy should
play a crucial role in the future to combat climate change and ensure energy security in
Indonesia. Policy-wise, the government has set a 23% target for new and renewable
energy in the national energy mix by 2025. But, progress has been slow showing at the
implementation level, renewable energy is not a priority at the moment. The total
renewables installed capacity, both on-grid and off-grid, until the end of 2019 was only
10.17 GW [28]. The renewable energy mix was mainly dominated by hydropower (5.4
GW) and geothermal energy (2.13 GW) totaling 74% of the total renewable energy
capacity [28]. The contribution of other types of renewable was bioenergy at 1.9 GW,
mini/micro hydro at 464.7 MW, wind at 148.5 MW, solar PV at 152.4 MWp, and waste
power plant at 15.7 MW [28].
One of the main reasons for the low progress of renewable energy in Indonesia is
the large influence of the central government in the energy sector. This is not favorable
for building local and sectoral capacity in developing the energy sector across the
nation. The central government holds important roles in initiating the changes, for
example by initiating a more aggressive development of renewable energy and
decentralizing the energy sector to local entities.
Solar energy is the largest renewable source in Indonesia [28]. The average specific
daily PV power output over Indonesia’s region ranges between 2.82 kWh/kWp and 4.62
555225-L-sub01-bw-Kunaifi555225-L-sub01-bw-Kunaifi555225-L-sub01-bw-Kunaifi555225-L-sub01-bw-KunaifiProcessed on: 8-2-2021Processed on: 8-2-2021Processed on: 8-2-2021Processed on: 8-2-2021 PDF page: 184PDF page: 184PDF page: 184PDF page: 184
8 Conclusions, Discussion, and Recommendations
148
kWh/kWp or equivalent to around 1029 kWh/kWp to 1686 kWh/kWp annually [31].
Studies in 2013 [280] and 2015 [106] which were updated in 2020 [26] concluded that
Indonesia could host 49 TWp of grid-connected and off-grid PV systems in 2018.
However, taking the actual electricity demand into account, the total potential for PV
systems is estimated to be 734 GWp. However, by 2019, the total capacity of solar PV
in Indonesia was only 152.4 MWp [28] or around 0.003% and 0.02% of the total
theoretical and actual potential, respectively. With the right implementation approach, a
great opportunity for large-scale PV systems in Indonesia is widely opened.
88.1.3. What are the Experiences of End-users with the Electricity Grid in Indonesia?
In Chapter 4 of this thesis, end-user experiences regarding the reliability of
electricity supply in their homes have been explored and compared with the reliability
indices as reported by the national utility company for the cities of Pekanbaru in the
Province of Riau, Kupang in the Province of East Nusa Tenggara (ENT), and Jayapura
in the Province of Papua, Indonesia. The study was executed using data from 114
randomly-selected respondents in the city of Pekanbaru, 65 in the city of Kupang, and
26 in the city of Jayapura, totaling 205 participants. The study was executed for the
year 2017 and indicators used for this comparison are the SAIDI and SAIFI, meaning the
System Average Interruption Duration Index and System Average Interruption
Frequency Index, respectively. The use of SAIDI and SAIFI indicators is relevant because
they can be applied for evaluations of smaller areas of cities with known distribution
network configurations. The Perceived- (P) SAIDI and P-SAIFI values resulted in this
research show that the end-users experience more frequent and longer duration
outages compared to the SAIDI and SAIFI values reported by PLN. Also, users
experience a larger number of outages and longer duration for each interruption than
those that are reported by the authority. P-SAIFIs are 4-fold to 14-fold higher than the
PLN’s SAIFIs. Also, P-SAIDIs are 8-times to 12-times the PLN’s SAIDIs for the
corresponding provinces.
Further, it is interesting to observe the relations between different variables, such
as P-SAIDI, P-SAIFI, households’ income, and the willingness to pay (WTP). There exist
strong positive correlations between P-SAIDI and P-SAIFI in Pekanbaru and Kupang with
R2 values of 0.8 and 0.6, respectively, as is also valid for the correlation between the
reported SAIDI and SAIFI.
In our analysis, it was found that middle-high income and high-income households
experience a slightly higher P-SAIDI than those from low-middle and low-income
households. An interesting finding from our analysis shows that in Pekanbaru and
Kupang more low-medium income households are willing to pay extra for improved
power reliability, although this income group experiences fewer outages. On the other
hand, the WTP among high-income households is rather low. This is because high-
income households often own gensets, which incur an extra cost of operation and
555225-L-sub01-bw-Kunaifi555225-L-sub01-bw-Kunaifi555225-L-sub01-bw-Kunaifi555225-L-sub01-bw-KunaifiProcessed on: 8-2-2021Processed on: 8-2-2021Processed on: 8-2-2021Processed on: 8-2-2021 PDF page: 185PDF page: 185PDF page: 185PDF page: 185
8 Conclusions, Discussion, and Recommendations
149
maintenance, and this makes them rather reluctant to spend more income to improved
electricity services. The increase in the monthly electricity bill for improved electricity
services in the cities in Indonesia is 10% to 30% somewhat higher than those in other
countries. However, the values in dollars, which are represented in a US$3 to US$8
increase for a comparable outage duration, can also be found in other countries, such
as Cyprus [184] and Sweden [207]. Therefore, it can be concluded that the WTP is
determined by the outage duration [207] as well as by genset ownership. The latter is
due to the assumption among respondents that “improved reliability” does not imply a
complete escape from outages, which means that household expenditure for gensets
and other costs may still be needed.
88.1.4. What are the Attitudes of the Grid’s End-users toward Solar Photovoltaic
Systems?
To answer this sub-question the results of the end-user surveys which were
conducted in the cities of Pekanbaru in the Province of Riau, Kupang in the Province of
ENT, and Jayapura in the Province of Papua was further evaluated in Chapter 5. It was
found that 55% to 77% of the grid’s users were knowledgeable about renewable energy.
Based on these values, it can be expected that 51%, 57%, and 81% of the participants
in resp. Pekanbaru, Kupang, and Jayapura, respectively, believe that renewable energy
is important for Indonesia. Logically, the more they know about renewable energy, the
more important they found renewable energy.
Sixty-nine to 92% of the grid’s users were knowledgeable about climate change.
Their knowledge about climate change seemed to influence their attitude towards
climate change where the majority of participants were worried about climate change;
60% in Pekanbaru, 51% in Kupang, and 85% in Jayapura. As such, it can be concluded
that awareness and concerns about climate change are closely related.
Most of the grid’s users in the three cities had some knowledge about PV systems.
However, they had limited knowledge about the difference in the price of electricity from
the grid and PV systems. Most of the participants in Pekanbaru did not know which one
is cheaper, while a significant number of the participants in Pekanbaru believed that PV
systems generate more affordable energy than the grid does. Differently, in Kupang and
Jayapura, the majority of the participants believed that the price of electricity from PV
systems is lower than the electricity from the grid (PLN). The lack of knowledge of the
participants about the difference in price between the electricity from the grid and PV
systems is logical because none of the participants had experience with PV systems. In
fact, this is a difficult question even for an expert. The truth is that under the official
tariffs, the price of electricity from PV systems was more than two times higher than the
price of electricity from the grid. However, the price of electricity from the grid paid by
the end-users did not reflect the true price of energy production because the
government subsidizes electricity which is supplied to consumers.

555225-L-sub01-bw-Kunaifi555225-L-sub01-bw-Kunaifi555225-L-sub01-bw-Kunaifi555225-L-sub01-bw-KunaifiProcessed on: 8-2-2021Processed on: 8-2-2021Processed on: 8-2-2021Processed on: 8-2-2021 PDF page: 186PDF page: 186PDF page: 186PDF page: 186
8 Conclusions, Discussion, and Recommendations
150
Most of the grid’s users in the three cities knew that PV systems generate electricity
which is more sustainable than electricity from the grid. However, most of the
participants did not know which power source is more reliable: PV systems or the grid?
In Kupang, while the majority of the participants did not know the best option for them,
the second largest percentage of participants favored off-grid PV systems, followed by
those who wanted grid-connected PV systems, and the lowest percentage chose
electricity from the grid. In Jayapura, 58% of the participants favored PV systems in
particular grid-connected installations. Only 19% of the participants in Jayapura
selected the grid, while 15% of the participants did not know how to answer the question.
Many households in this study (65% in Pekanbaru, 71% in Kupang, and 88% in
Jayapura) wanted to have PV systems on their houses’ rooftops, either to increase the
reliability of electricity supply or to become separated from the grid. The majority of the
participants who refused to have rooftop PV systems were concerned about the strength
of their houses’ roofs for accommodating PV system components and structures.
88.1.5. How Well do PV Systems in Indonesia Function, and How is their Performance as Compared to PV Systems which are Installed in Other Climates?
To answer this sub-question in Chapter 6, we first compared the performance and
degradation rate of a 1 MWp copper, indium and selenium (CIS) PV system with those
of a 5 kWp poly-crystalline silicon (p-Si) PV system operating in Cirata, West Java.
Concerning the final yield (Yf), the CIS system outperformed the p-Si system by 14%.
The daily-averaged performance ratio (PR) of the CIS system was 89.6%, which is
12.2% higher relative to the PR of the p-Si system of 80%. Based on the monitored a.c.
power (Pac), the degradation rate (Rd) of the PV systems in Cirata at the module level
was high; namely, the CIS system degraded by 1.53% per year, while the Rd of the p-Si
system was 3.72% per year. However, at the system level, the Rd values were within
acceptable boundaries. By considering the other technical performance indicators, it
can be concluded that CIS technology performs better than p-Si in Indonesia’s tropical
climate. However, there may be some uncertainty concerning the calculation of the Rd.
Such uncertainties are caused by soling and the relatively short two-year monitoring
period.
Secondly, in Chapter 7, we evaluated the performance evolution of fifteen
photovoltaic (PV) systems of six different PV module technologies in three different
climates. Changes in performance are presented using the performance ratio (PR) and
the performance loss rate (PLR). PR was calculated using IEC standard 61724, and PLR
was calculated using seasonal and trend decomposition, applying locally weighted
scatterplot smoothing (STL decomposition) and the year-on-year approach from
NREL/RdTools. PV technologies applied in these PV plants are amorphous silicon (a-Si)
solar cells (one system), heterojunction with intrinsic thin layer (HIT) hybrid silicon (one
system), copper indium gallium selenide (CIGS, one system), monocrystalline silicon
555225-L-sub01-bw-Kunaifi555225-L-sub01-bw-Kunaifi555225-L-sub01-bw-Kunaifi555225-L-sub01-bw-KunaifiProcessed on: 8-2-2021Processed on: 8-2-2021Processed on: 8-2-2021Processed on: 8-2-2021 PDF page: 187PDF page: 187PDF page: 187PDF page: 187
8 Conclusions, Discussion, and Recommendations
151
(mono-Si, three systems), cadmium telluride (CdTe, three systems), and polycrystalline
silicon (p-Si, six systems). The PV systems are located in three different climates,
namely, Alice Springs, Australia (arid, desert, hot), Cirata and Pekanbaru, Indonesia
(tropical, rainforest), and Bolzano, Italy (temperate, dry summer, hot summer). We
analyzed monitoring data from 2008 to 2019, ranging from two to nine years from the
PV systems.
The general conclusions of this work are:
1) The annual-averaged temperature-corrected performance ratio, PRann, with an
average value of all systems from each technology. The CIGS system performed
best with an average PR value of 0.88 ± 0.04. The least performing technology was
the a-Si PV systems, with an average PR value of 0.78 ± 0.05. The p-Si systems in
climate Cfb of Italy had a higher average PR of 0.84 than those operating in climates
BWh (Australia) and Af (Indonesia), with the same value of 0.81.
2) Performance loss rates are based on the STL decomposition approach. For almost
all systems, the use of STL for the calculation of PLR is helpful, especially if
monitoring data of high quality was not available. The p-Si systems show the lowest
PLR among the technologies with an average PLR value of -0.6%/year. The
strongest performance loss was experienced by a-Si modules at -1.58%/year.
88.1.6. General Conclusion
Based on the results reported above the answer to the main research question can
be discussed, which is: What are the experiences and attitudes of Indonesian end-users
towards the electricity grid, as well as solar energy, and would a transition towards solar
photovoltaic systems be feasible considering the performance of PV systems operating
under Indonesia’s tropical climate conditions?
The end-users of the grid who participated in this study experienced more frequent
and longer duration of outages compared to reported reliability values by the authorities.
To improve the reliability of domestic power supply, they appeared to be willing to pay a
10% to 30% higher electricity bill or an equivalent of about US$3 to US$8 per month.
They recognized the importance of renewable energy and were concerned about climate
change. They were knowledgeable about PV systems although they had limited
knowledge about the difference in the price of electricity from the grid and PV systems.
Also, they knew that PV systems generate more sustainable electricity as compared to
the electricity from the grid although they could not assess the difference between PV
systems and the grid regarding the reliability. Many of them wanted to have PV systems
on their houses’ rooftops, either to increase the reliability of electricity supply as the user
of the grid or to become separated from the grid although some were concerned about
the strength of the roofs of their houses for accommodating PV system installations.
However, because this conclusion was based on field research, it contains uncertainties
due to the limited availability of time and persons to conduct the survey. By executing

555225-L-sub01-bw-Kunaifi555225-L-sub01-bw-Kunaifi555225-L-sub01-bw-Kunaifi555225-L-sub01-bw-KunaifiProcessed on: 8-2-2021Processed on: 8-2-2021Processed on: 8-2-2021Processed on: 8-2-2021 PDF page: 188PDF page: 188PDF page: 188PDF page: 188
8 Conclusions, Discussion, and Recommendations
152
similar studies in more of the 34 provinces in Indonesia would result in a more
representative conclusion for the whole Indonesia. In Section 8.2.3, we present the
limitation of this study in more detail.
A transition towards solar PV systems is feasible for Indonesia. PV systems would
be a sustainable option along with other renewable power generation technologies amid
fossil fuel reserves that are facing depletion in Indonesia. The quality of the performance
of PV systems in Indonesia with a PR of 78 to 90% is comparably as high as those in
other sunny climates. A plus point for Indonesia is that a high solar irradiance is available
the whole year through. Actually for this reason autonomous solar PV systems are a
proven option for the electrification of rural areas and remote islands. The greatest
application is the integration of PV systems with the grid. However, much work remains
to be done at the level of implementation of renewables. Namely, Indonesia needs to
include all potential and current stakeholders in a correct strategy that is beneficial to
all. Moreover, the energy transition should be supported by effective regulations for the
connection and feed-in tariffs of PV systems to the national grid. The central government
holds important roles in initiating the changes, for example by decentralizing the energy
sector to local entities, creating supporting and consistent policies. Hence the
government and PLN, with their dominant power and authority, are expected to facilitate
a fair ‘playing field’ for renewable power generation. However, in order to draw stronger
conclusions, the number of monitored and analyzed PV systems in Indonesia should
become higher.
88.2. Discussion
In this section, the scientific contributions, practical contributions, and limitations
of the conducted research are discussed.
8.2.1. Scientific Contribution
This thesis brings two main scientific contributions. The first contribution is related
to the opinion of the grid users on the reliability of electricity service they get from the
grid. Previously, the reliability of the electricity services in Indonesia was represented
using SAIDI and SAIFI values which is periodically reported by PLN. We appreciate those
metrics, but they should not be used as a single standard because the quality of
electricity services is also a day to day experience of the grid users. Therefore, in this
thesis, we have introduced new metrics to complement the conventional ones, namely
P-SAIDI and P-SAIFI. The letter ‘P’ indicates the users' perception of or their actual
experience with the grid. The users were households in Pekanbaru, Kupang, and
Jayapura, respectively in Western, Central, and Eastern Indonesia. We believe that this
approach would provide a balance between what the service provider reports and what
the service recipients get. To the best of our knowledge, there was no previous literature
proposing a similar approach, at least in the context of the electricity grid in Indonesia.

555225-L-sub01-bw-Kunaifi555225-L-sub01-bw-Kunaifi555225-L-sub01-bw-Kunaifi555225-L-sub01-bw-KunaifiProcessed on: 8-2-2021Processed on: 8-2-2021Processed on: 8-2-2021Processed on: 8-2-2021 PDF page: 189PDF page: 189PDF page: 189PDF page: 189
8 Conclusions, Discussion, and Recommendations
153
The second scientific contribution of this thesis is regarding the performance of
grid-connected PV systems in Indonesia. Before this study was started, there were only
a few pieces of literature that evaluating the performance of grid-connected PV systems
in Indonesia. However, that literature was based on only one grid-connected PV system
which is located in Jayapura. Jayapura is located in the easternmost part of Indonesia
where electricity demand is small. From the western part of Indonesia, where the
electricity demand is the greatest, no study available regarding the performance of PV
systems. Therefore, we believe that this thesis, which presents the analysis of PV
systems from the western region of Indonesia, is filing the spatial gap of PV system
performance study in Indonesia. Furthermore, this thesis does not only present PR as a
performance metric, as the previous study did, but also presents the performance loss
rate or the degradation of PV systems. Degradation is an important topic in the solar PV
domain because it directly links to the financial health of solar PV projects.
88.2.2. Practical Contribution
The practical contribution offered by this thesis mainly comes from its technical
part, namely the performance and degradation of PV systems. As mentioned above, in
Indonesia only a few studies are available on this topic. Therefore, there are no
benchmarks available related to important technical options in solar PV projects. For
example, what are the performances of various PV module technologies operating under
Indonesia's tropical climate? How do PV systems in Indonesia perform compared to
those in other climates? In this thesis, the answers to those questions are offered.
Indeed, this thesis does not offer a conclusive benchmark for strategic choices in solar
PV projects in Indonesia. However, the research reported in this thesis offers new
answers to Indonesia, especially those frequently asked by PV project developers.
Further studies are needed to achieve more permanent answers.
8.2.3. Limitations
The first limitation relates to the field research presented in Chapter 4 and Chapter
5. Like all studies involving field research, our research also includes limitations mainly
due to the availability of time, cost, and person-hours. The field research was executed
at three locations across the large geography of Indonesia. This situation and a few other
factors that could affect the results of this research are explained as follows:
1) We present the values for SAIDI and SAIFI at the provincial level because of the
related statistics available at that level. However, due to time and cost constraints,
our field survey was conducted at specific locations, namely in the capital cities of
the provinces. Thus, we extrapolate the P-SAIDI and P-SAIFI values from the city
level to the provincial level. However, it is still surprising that the officially reported

555225-L-sub01-bw-Kunaifi555225-L-sub01-bw-Kunaifi555225-L-sub01-bw-Kunaifi555225-L-sub01-bw-KunaifiProcessed on: 8-2-2021Processed on: 8-2-2021Processed on: 8-2-2021Processed on: 8-2-2021 PDF page: 190PDF page: 190PDF page: 190PDF page: 190
8 Conclusions, Discussion, and Recommendations
154
values of reliability indices are lower than those recorded by our measurements on
the grid and reported by end-users. In fact, higher values can be expected for the
officially reported SAIDI and SAIFI because they cover the whole province, which
contains urban areas, with a relatively high-quality supply of electricity, and rural
areas, which tend to have a lower power quality. It would, therefore, be valuable to
expand this study to other locations in the studied provinces and other provinces to
obtain more evidence.
2) It is obvious that both reliability indices, those reported by PLN and those introduced
in this study, have advantages and drawbacks. On the one hand, the PLN SAIFI and
SAIDI data are likely generated based on careful documentation of actual outages,
which could offer more reliable information. However, because they are based on
large provincial areas ranging from 664 km2 to 154,000 km2, they do not distinguish
between urban and rural areas. On the other hand, the perceived reliability indices
introduced in this study are based at the city level with smaller resolution areas of
180 km2 to 936 km2, which could result in better accuracy.
3) The values of P-SAIDI and P-SAIFI were based on the user’s perspective captured
from the user survey. Perception could be biased. Respondents might exaggerate
their perception compared to their real behavior or situation [198]. However, we
applied a correction factor of 30%, C, to P-SAIFI and P-SAIDI values obtained from
the survey according to an empirical finding by List and Gallet [199] to decrease bias.
Still, we found the perceived values of the reliability metrics were higher than the
reported values.
4) In the city of Jayapura, only 26 households participated in the user survey compared
to the higher numbers of participants in the other two cities. In this thesis, therefore,
we mark the results from Jayapura being not representative. However, given
difficulties to access Jayapura from the other parts of Indonesia, we include results
from Jayapura because it provides valuable preliminary information on the topic.
5) In our study, the income-bias of the respondents were not accounted for. As a result,
this study mostly represents high and upper-middle-income classes.
Apart from the above potential points of improvement, this study is unique and fills
a void in existing real-life data on experienced power quality, and it confirms our initial
hypothesis that the reported indices of the reliability of the power supply from PLN are
lower than the user experience. As far as we know, this is the first independent study in
Indonesia to evaluate the user experiences on the reliability of the power supply by the
distribution grid and how the user experiences compare to the reported data from the
utility. It can be concluded that the reliability of the power supply in these three cities in
Indonesia could be improved considerably.

555225-L-sub01-bw-Kunaifi555225-L-sub01-bw-Kunaifi555225-L-sub01-bw-Kunaifi555225-L-sub01-bw-KunaifiProcessed on: 8-2-2021Processed on: 8-2-2021Processed on: 8-2-2021Processed on: 8-2-2021 PDF page: 191PDF page: 191PDF page: 191PDF page: 191
8 Conclusions, Discussion, and Recommendations
155
The second limitation relates to the performance of PV systems in Indonesia and
some other countries as reported in Chapter 6 and Chapter 7. They are described
below.
1) The number of PV systems in Indonesia being analyzed in this research should have
been higher. In Chapter 6, we analyzed three PV systems in the same location in
West Java. In Chapter 7, we used one of these PV systems again with an addition
of another PV system in Pekanbaru. Therefore, only four PV systems from two
locations were used in this research. Both locations are in Western Indonesia
although they are around 500 km longitude and 750 km latitude apart. The single
reason for not analyzing a higher number of PV systems is due to the limited amount
of good quality data. The majority of PV systems in Indonesia are those of kilowatt-
peak size systems lacking a monitoring system that is suitable for research
purposes. Many of the PV systems that are monitored did not measure the critical
variable required for the performance analysis. Some PV systems must be excluded
from the analysis because the duration of their monitoring data was too short or the
quality was not satisfactory. Some megawatt-scale PV systems owned by
companies are equipped with good monitoring data. However, they seem reluctant
to give the data for research purposes even though a series of official approach
had received a positive response and was followed by a visit to the location where
the data are stored. A better analysis would be assured when the number of PV
systems was higher. Yet, results from Indonesia are appreciated because they
provide the first study on the topic. However, due to a small number of PV systems
from Indonesia, it is not representative enough to draw a strong conclusion and is
subject to high uncertainties. In addition, module technologies that use amorphous
silicon (a-Si), CIGS, and heterojunction with intrinsic thin layer (HIT) hybrid silicon
were represented by only one PV system each. More studies involving PV systems
in South-East Asia and other climates are needed.
2) In Chapter 7, the performance of PV systems in one climate was compared to PV
systems in the other climates. In this work, comparisons were only carried out on PV
systems that use module technology of p-Si. The data availability, again, is the reason
for this selection. The only module technology that its data was available at all of the
studied climates was from the type of p-si. However, when comparing the
performance of PV systems by technology, we used the other module technologies,
namely a-Si, HIT, CIGS, mon-crystalline silicon (mono-Si), and cadmium telluride
(CdTe).
3) Although it is stated in this thesis that this study was conducted in Indonesia, the
actual research involved a few locations only. Indonesia is a large country with an
area nearly the same as the size of Europe and is divided into three time zones. Also,
instead of having one climate class, Indonesia has four climates, which reflect the
vast area of Indonesia. Therefore, to be representative, we took three locations

555225-L-sub01-bw-Kunaifi555225-L-sub01-bw-Kunaifi555225-L-sub01-bw-Kunaifi555225-L-sub01-bw-KunaifiProcessed on: 8-2-2021Processed on: 8-2-2021Processed on: 8-2-2021Processed on: 8-2-2021 PDF page: 192PDF page: 192PDF page: 192PDF page: 192
8 Conclusions, Discussion, and Recommendations
156
according to time zones, one location each in the Western, Central, or Eastern part
of the country.
88.3. Recommendations
This research has shown many variables that play a role and should be addressed
to ensure a smoother transition from the current power supply system to another one in
which solar PV had a higher fraction in Indonesia. This final section presents several
recommendations regarding further research as well as policy and managerial
implications to a lesser extent. They address the solar PV researchers, the Indonesian
central government, and developers of PV systems.
Recommendation for further research
First, further studies on the experience of the grid users should involve higher
statistics than those presented in this thesis. The study locations could be selected from
each city class according to the number of population. Namely, the city can be classified
as small, medium big, metropolitan, and megapolitan. Normally, the reliability of
electricity services in Indonesia is higher in a larger city than in smaller ones. The sample
size from each location should also be increased. As a general rule of thumb, for a survey
in a city with a 300,000 to 1 million population, a sample size of 385 would result in a
95% confidence level and confidence interval of 5.
Second, future research on the performance of PV systems in Indonesia should
include a higher number of PV systems from each module technology and region. To
generate more widely applicable results, each module technology should be represented
by multiple PV systems in different locations. It would also valuable to select PV systems
from each big island: Sumatra, Java, Kalimantan, Sulawesi, and Papua, because those
islands are evenly distributed across Indonesia’s area. For now, monitoring is usually
lacking in private solar PV projects. If monitoring were available, access to the data
would be difficult. However, an initiative from the government involving multiple agencies
could solve the issue of lacking data in PV system research in Indonesia. For example,
the Ministry of Energy and Mineral Resources (MEMR) could collaborate with Indonesia’s
Bureau of meteorology, BMKG, to build a nationwide solar PV monitoring network. For
this purpose, those government institutions could optimize their utilization of their
existing infrastructure and involve research institutions and universities.
Third, other types of research are required to develop more knowledge about PV
systems in Indonesia such as nowcasting and forecasting of solar PV performance as
well as geographic mapping of PV system implementation. Again, for nowcasting and
forecasting of solar PV performance, rigorous data sets of meteorological and PV
system’s electrical variables would be required. Research on the geographic mapping
of PV implementation could be conducted upon the availability of recent maps of the
studied regions. These maps should include georeferenced aerial photos or high-
555225-L-sub01-bw-Kunaifi555225-L-sub01-bw-Kunaifi555225-L-sub01-bw-Kunaifi555225-L-sub01-bw-KunaifiProcessed on: 8-2-2021Processed on: 8-2-2021Processed on: 8-2-2021Processed on: 8-2-2021 PDF page: 193PDF page: 193PDF page: 193PDF page: 193
8 Conclusions, Discussion, and Recommendations
157
resolution satellite images from the state’s geospatial information agency and maps of
the PLN’s distribution networks. Thus, a simple procedure to obtain such maps is
necessary to be able to conduct future research.
RRecommendations regarding energy policy and grid management
Indonesia is characterized by a vast area, geographical challenges, big population
size, as well as differences and disparities between one region or island, to the other.
Therefore, surrendering the energy sector to a national level government could
introduce challenges when it comes to the implementation stage. It is therefore
recommended that the central government establishes policies and regulations that
support the steady implementation of solar PV systems in Indonesia with clear market
insights. An alternative to such a national regulation is a decentralization of the electricity
sector, enabling local entities to develop electricity supply systems according to their
own needs, strengths, and other local characteristics.
Distributed generation (DG) and the smart grid are considered the future of the
electric power system. Therefore, PLN as a public company should improve its grid
management practices by transitioning from a centralized power system strategy to DG
with a smart grid. Such a transition could allow for significant investments in the solar
PV sector providing that DG is characterized by a higher penetration of sustainable
energy generation.

555225-L-sub01-bw-Kunaifi555225-L-sub01-bw-Kunaifi555225-L-sub01-bw-Kunaifi555225-L-sub01-bw-KunaifiProcessed on: 8-2-2021Processed on: 8-2-2021Processed on: 8-2-2021Processed on: 8-2-2021 PDF page: 194PDF page: 194PDF page: 194PDF page: 194
8 Conclusions, Discussion, and Recommendations
158

555225-L-sub01-bw-Kunaifi555225-L-sub01-bw-Kunaifi555225-L-sub01-bw-Kunaifi555225-L-sub01-bw-KunaifiProcessed on: 8-2-2021Processed on: 8-2-2021Processed on: 8-2-2021Processed on: 8-2-2021 PDF page: 195PDF page: 195PDF page: 195PDF page: 195
159
AAcknowledgements
“When a calamity befalls you on the sea, lost are [all] those you invoke except for
Him. But when He delivers you safely to the shore you turn away from Him” (Al Quran
(17:67)).
This Ph.D. journey to me was like taking a long ‘hiking trail’ rather than a quick
picnic in a flower garden on a nice spring day. The trail was a combination of a downhill,
flat, and climbing path. More often the path was smooth, but also happened it was rocky
and slippery. There were times when the road was wide, but there were also dark narrow
tunnels to get through. The surrounding environment often had colorful flowers that smell
good, but sometimes were boring. The weather was often cool and sunny, but it was not
uncommon for rainstorms and strong wind. Indeed, that is how a complete hiking trail
should be. To me, this Ph.D. journey was not just an intellectual work. It was a rich
journey of life taking me deeper into a spiritual world of light. “… There certainly has
come to you from Allah a light and a clear Book, with which God guides to the ways of
peace those who follow what pleases Him, bringing them from darkness out into light,
by His will, and guiding them to a straight path” (Al Qur’an 5: 15-16).
Accumulated at the end of this ‘track’ are sweet memories, contentment, and
gratitude. All of these are not possible without appropriate guidance and support, which
I found indispensable during my Ph.D. work. I thank Lembaga Pengelola Dana
Pendidikan (LPDP), which is an Indonesia Endowment Fund for Education, of the
Ministry of Finance of the Republic of Indonesia for a scholarship granted to me and my
family to do a Ph.D. research and experience life in the Netherlands.
Now it is a special moment for me to fully express my deepest gratitude and
appreciation for all kind help and support both in my scientific and daily life during my
Ph.D. trajectory.
I would like to start with my promotor and supervisor, prof.dr.Angèle Reinders. I
remember that your guidance was started on the very first page of my research proposal.
Perhaps, I would not be where I am today without your never-ending support and sincere
supervision. Our weekly meetings did refresh my mind and inspired my work. You gave
me invaluable experiences to do a scientific mission at EURAC and to participate in the
events organized by PEARL PV COST Action. You put a lot of effort to help me when we
must decide that the initial research topic regarding the integration of GIS into PV system

555225-L-sub01-bw-Kunaifi555225-L-sub01-bw-Kunaifi555225-L-sub01-bw-Kunaifi555225-L-sub01-bw-KunaifiProcessed on: 8-2-2021Processed on: 8-2-2021Processed on: 8-2-2021Processed on: 8-2-2021 PDF page: 196PDF page: 196PDF page: 196PDF page: 196
Acknowledgment
160
decision-making must be changed due to difficulties to obtain critical data from the
authorities in Indonesia. You did the same again when we must change the second
topic, PV systems for disaster response because it seemed to not very useful for
Indonesia. I am happy that the time consumed for those changes, adding with Covid-
19 and my health situations, did not delay the completion of my Ph.D. too long. I highly
appreciate that you helped me in many ways with my research as well as daily life with
my family in the Netherlands. You have been a very helpful supervisor.
Special thanks to Ibu Ratna Prabandari of LPDP as well as LPDP awardees and
families, ir. Fajar Sidiq, ir. Julia Saliha, dr. ir. Kamia Handayani, and Mas Edi, for your
touching approach, supplies, shelter, and helps when my family and I were quarantined
at Wisma Atlet, the Covid-19 center, and transited, in Jakarta.
Then the biggest acknowledgment must go to dr. ir. Cihan Gerçek. To me, you are
much more than just an office mate. I learned a lot from your kindness and attitudes
toward life and people. You had been very helpful to me and my family during the last
days of our stay in the Netherlands and weeks after. Knowing you has been a gift to me.
Next, I would like to thank friends and colleagues at the University of Twente.
Thanks to (late) prof. dr. Fred van Houten and prof. dr. Andy Nelson for valuable inputs
during my qualifier. Thanks to prof. dr. ir. Jörg Henseler, dr. ir. Hero Marhaento, dr. Arif
Widiyatmoko, and dr. Sutomo, for your ‘life-saving’ inputs during my hard time. Thanks
to ir. Amrita Raghoebarsing, ir. Alonzo Sierra Rodriguez, dr. ir. Moreno de Respinis, dr.
ir. Georgia Apostolou, ir. Roberto Reyes Garcia, and ir. Marijn Zwier, for sharing valuable
thought, humor, time, and experience. Thanks to Inge Dos Santos Smit, Inge H.J. Lefers,
Annemarie Bos-Lubbers, and Saskia Groenendijk for your kind help from the first day to
the end of my Ph.D. Thanks to dr. ing. Robert Wendrich, ir. Marten Toxopeus, dr. Marcus
Pereira Pesoa, and Nick, for nice chats in the corridor and the common room of the
DPM. I am very sorry for not being able to meet you in person before leaving the
Netherlands due to the Covid-19 restriction.
I would like to thank colleagues at EURAC in Bolzano, Italy for their hospitality and
discussions during my scientific mission there, as well as for allowing me to use their PV
monitoring data in my research. Thanks to ir. Sascha Lindig for your tireless advice from
the very beginning of my mission to the preparation of my last article. Thanks to dr. David
Moser for accepting me at EURAC and helping me with the content and processing cost
of my last article. Thanks to ir. Alexander Astigarraga for taking me around Bolzano
visiting the outdoor and indoor labs as well as introducing delicious Italian foods to me.
Thanks to dr. Marco Pierro for your advice about the forecasting of solar irradiation.
My sincere gratitude to Huud Alam for helping me with the formulation of the first
chapters of my thesis. Thanks to prof. dr. ing. Magnus Jaeger of OTH Amberg Weiden
for allowing me to use PV monitoring data in Pekanbaru. Thanks to Aripriantoni
Harmanto, Dimas Kaharudin, Kirjono Mudiarto, and Wirawan of PT PJB for providing PV
monitoring data and later discussions. Thanks to Frengki Numberi and dr. ir. Herbert
Innah for providing PV monitoring data in Jayapura. Thanks to the Desert Knowledge

555225-L-sub01-bw-Kunaifi555225-L-sub01-bw-Kunaifi555225-L-sub01-bw-Kunaifi555225-L-sub01-bw-KunaifiProcessed on: 8-2-2021Processed on: 8-2-2021Processed on: 8-2-2021Processed on: 8-2-2021 PDF page: 197PDF page: 197PDF page: 197PDF page: 197
Acknowledgment
161
Australia Solar Centre (DKASC) for providing datasets from their PV systems in Alice
Springs, Northern Territory, Australia.
My greatest appreciation for the help given by friends, colleagues, and students at
UIN Suska Riau University regarding the preparation and implementation of my field
works. Thanks to Zul Kariman, M.Sc. for sheltering me, accompanying me, taking care
of me when I was sick, and doing the remained works during and after my fieldwork in
Jakarta. Thanks to Saide, MIT, and Muhammad Absor for arranging field research
permits and other administrative works for me. Thanks to Dwi (Cui) Ariesta for your tips
in conducting field works in Kupang and Papua. Thanks to dr. ir. Kamia Handayani for a
valuable discussion regarding the power system in Indonesia before my fieldwork,
introducing me to helpful people at PLN, and good articles that inspired my works.
Thanks to Pak Lambok Siregar who enabled me to ‘get into’ PLN in Jakarta, Riau,
Kupang, and Papua. Thanks to Pak Wahyu Anjarjati (BMKG Pekanbaru), Pak Sumawan
(BMKG Kupang), and Mas Suroto (BMKG Jayapura) for helping me with the climate data
and measurement of the local electricity grid. Thanks to dr. Promadi and staff at LPPM
UIN Suska Riau University for helping me with research administration. Thanks to Melki
Rumania, Mas Aji Putra Perdana, Aldino Rizaldy, and Jarot Mulyo Semedi, for sharing
your knowledge about GIS and helping me with my visit to BIG. Thanks to Mas Fajar Eko
for introducing me to Pak Sani of PLN Maluku which later introduced me to Pak Bellar
of PLN NTT as well as Pak Akbar and Mas Doni of PLN Papua, also for helping me in
installing the floor of the house together with Alkindi Riski. Thanks to dr. ir. Alex Wenda
and ir. Fitri Amillia for borrowing measuring instrument from an Electrical Engineering
Lab of UIN Suska Riau to me. Thanks to Yurnalis for helping me transferring statistical
data from web pages to Excel. Thanks to the students at the Department of Electrical
Engineering at UIN Suska Riau University in Pekanbaru and Aqil Mahri who helped me
with the survey and grid measurements in Pekanbaru. Thanks to good friends, Donna
Sofia and Aang Darmawan, for your hospitality in Paris and for helping me with data from
MEMR, and for introducing me to important people at MEMR. Thanks to Ali Rosidin for
your hospitality and help with my fieldwork in Bandung and Cirata. Thanks to Pak Roni,
Pak Ramlan, Pak Kurniawan, and Pak Sudarminto of PT. SEI. Thanks to dr. Zakarias
Seba Negara’s: Pak Kris, Bu Rini Marini, Kumar Saputra, Alen, and Dilon, for your shelter
during my field works in East Nusa Tenggara, as well as for your hospitality and
invaluable kindness. Thanks to dr. Jusuf Haurissa and Pak Suyatno of USTJ Jayapura
for your shelter and hospitality during my fieldwork in Jayapura. Thanks to Pak Bagdad,
Pak Wahyu, Pak Dhani Yulfin, and Pak M. Yusuf of PLN WRKR. Thanks to Pak
Andriansyah and Pak Abdul Rahman of The Bodyshop in Jakarta. Thanks to prof.
Hamzah Hilal of BPPT for discussion about the smart grid. Thanks to Pak Revi, Pak Ari
Wardhana, and Mbak Yuyun of PLN head office in Jakarta for your administration support
for my fieldwork. Thanks also to Encik Mohamad Amran for a fruitful discussion regarding
PV installations.

555225-L-sub01-bw-Kunaifi555225-L-sub01-bw-Kunaifi555225-L-sub01-bw-Kunaifi555225-L-sub01-bw-KunaifiProcessed on: 8-2-2021Processed on: 8-2-2021Processed on: 8-2-2021Processed on: 8-2-2021 PDF page: 198PDF page: 198PDF page: 198PDF page: 198
Acknowledgment
162
As an academic at UIN Suska Riau University, my Ph.D. research in the Netherlands
requires official permission of which I owe the following individuals who helped me with
the permission: prof. dr. Munzir Hitami, dr. Hartono, dr. ir. Alex Wenda, ir. Ewi
Ismaredah, ir. Mulyono, dr. GP Ade Darmawi, dr. ir. Harris Simaremare, ir. Aulia Ullah,
ir. Rika Susanti, Wirdah Kamsan, and Yusri Yenti.
Thanks to Ahmad Ibrahim for helping me to obtain IEC standards. Thanks to
Muhammad Yasir for helping me with web scraping using Python and Arief Ibrahim for
helping me with imputing missing data using Python’s Sklearn. Thanks to Matahari LPDP
for the inspiration, discussion, and collaborations.
I am indebted to the love, care, and kindness I received from Josephine Walsarie
and Dale, our Dutch family in Enter, who guided us through the intricacies of Dutch
culture and traditions in the last four years of our stay in the Netherlands, for taking us
around, introducing us to Dutch people, cooking for us, cleaning our house's yard, and
thinking about us. We pray for your health and wellbeing. Thanks to Patrick van Lierop,
Dewi van Lierop and Emira van Lierop for your friendship and for taking me to the night
doctor when I was sick.
Most importantly, I would like to thank all Indonesian families in Germany and the
Netherlands for helping us with transferring to a new house and for invaluable friendship:
Andre Muhammad, ir. Aden Firdaus, ir. Ratri Endah Putri, ir. Viriega Fauzia Rachmanda
and family, Kak Rani and family, Zakiah Thaib and family, Uni May Büsker and family,
Pak Chandra, Mbak Annisa, ir. Girindra Wardana and family, ir. Heksi Lestari Soewignyo,
ir. Faisal Wicaksono and family, ir. Zulkarnain and Mbak Nden with family, ir. Adhitya
Fernando, ir. Aminuddin, dr. Taufik Arifin and family, and ir. Iqbal Yulizar. I also would
like to thank ir. Debby Fajar and family, ir. Deden, dr. ir. Habiburrahman Zulfikri, dr. ir.
Rahma Muthia, ir. Capt. Okky Daulay and family, ir. Pesi Normakristagaluh and family,
ir. Nova Hadi and family, Pak Dhadhang Kurniawan and family, Aulia Akbar, Asti, ir. Bima
Anggun Putra and family, ir. Dzul Karnain, ir. Khrisna Arianto, ir. Laksmana Hanif
Nugroho, Nico, ir. Niswatun Hasanah, Novi, Ridwan Saptoto, dr. Riswan Sianturi, ir.
Rheza Adipratama, ir. Diah Apriyanti, Uda Reza and family, ir. Imam Sudrajat, dr. Sunu
Widianto and family, ir. Yan Freksi, Nissa Syifa, dr. ir. Dwi Mandaris and family, dr. Abdul
Rahman, ir. Rizal Batubara, Dwi Priwitaningrum, Juli Nurdiana, dr. ir. Muhammad Khafid
and family, Refi Rifaldi, Wibisono, Yasmin Lurusati, ir. Akhyar Sadad, dr. Rindia Maharani
Putri, Robby Wijaya, Mbak Nung and family, Faris, Yosia Hadisaputro, ir. Abdan Satria
and family, Akbar Aryanto and family, ir. Eva Nurlatifah, ir. Muhammad WIldan Gifari,
Irene Maureen, Ratna Sari Pakpahan and family, .
I would like to sincerely express my gratitude to the people of EnReach and their
families, ir. Novriyanto, ir. Nesdi E. Rozanda, ir. M. Irsyad, and dr. ir. Liliana for valuable
discussion and friendship during the last seventeen years. Special thanks to dr. ir.
Zulfatri Aini, Pak Rinaldi, and Arfa, for your warm welcome during our home quarantine
days in Pekanbaru until today, and for dr. ir. Petir Papilo for your insights about the

555225-L-sub01-bw-Kunaifi555225-L-sub01-bw-Kunaifi555225-L-sub01-bw-Kunaifi555225-L-sub01-bw-KunaifiProcessed on: 8-2-2021Processed on: 8-2-2021Processed on: 8-2-2021Processed on: 8-2-2021 PDF page: 199PDF page: 199PDF page: 199PDF page: 199
Acknowledgment
163
research method and designing the cover of my thesis. It has been a pleasure working
with you all.
From the bottom of my heart, I am grateful to my family, Murparsaulian, S.Pd., MA.,
Zia Alkhair Nailian, Abhivandya Abdullah Nailian, for their love, understanding, and
endless support. They have never doubted me. Mur, your faith and love have kept me
going even when I thought I couldn’t. The words here are too pale to express my thanks
to you. Zia, you are a bright young smart man with a careful and lovely personality who
always worries if I go to bed late because of my work. You are always thinking about me
first instead of yourself. Abhiv, you are an always happy person who knows how to cheer
people up and respect you. When I was too tired to tell you bedtime stories, you did it
for me, instead.
I thanks to my extended family for your support and pray: Ayah Mansur
Simanjuntak, Ibu Damsiah, Uda Edison and family, Abang Nelfizon Asmi and family,
Kakak Sacra and family, Uni Rinda Sutri and family, Abang Herdian Asmi and family, Uni
Meliani and family, Uni Rita Eliza and family, Fitri Zalianis and family, Udo Nurman and
family, Kakak Umi Khoiri and family, Udo Samson Rambah Pasir and family, Kakak
Dumasari and family, Kakak Tiurlan and family. Thanks to Raja Saleh, Ira Mairianti, and
family.
I believe that more people are not listed here than those whose names are written
here but have helped me at one point in time within the period of my Ph.D. To those who
are not named here, I pray for your peace, safety, and success.
The sun has been the largest source of energy on Earth for millions of years now. I
believe it will stay that way after the solar PV system will be the biggest source of
electrical energy in the future. Allah says in the Quran (28:71) that “… Imagine if Allah
were to make the night perpetual for you until the Day of Judgment, which god other
than Allah could bring you sunlight? Will you not then listen?”
KKunaifi
February 2021, Enschede and Pekanbaru

555225-L-sub01-bw-Kunaifi555225-L-sub01-bw-Kunaifi555225-L-sub01-bw-Kunaifi555225-L-sub01-bw-KunaifiProcessed on: 8-2-2021Processed on: 8-2-2021Processed on: 8-2-2021Processed on: 8-2-2021 PDF page: 200PDF page: 200PDF page: 200PDF page: 200
164

555225-L-sub01-bw-Kunaifi555225-L-sub01-bw-Kunaifi555225-L-sub01-bw-Kunaifi555225-L-sub01-bw-KunaifiProcessed on: 8-2-2021Processed on: 8-2-2021Processed on: 8-2-2021Processed on: 8-2-2021 PDF page: 201PDF page: 201PDF page: 201PDF page: 201
165
RReferences
1. BPPT. Outlook Energy Indonesia. Available online: https://www.esdm.go.id/assets/media/content/content-indonesia-energy-outlook-2019-english-version.pdf (accessed on Sep 6, 2020), 2019.
2. IBRD - The World Bank. State of Electricity Access Report. Available online: http://documents1.worldbank.org/curated/en/364571494517675149/pdf/114841-revised-june12-final-sear-web-rev-optimized.pdf (accessed on Sep 7, 2020), 2017.
3. Dirjen Ketenagalistrikan ESDM. Realisasi Rasio Elektrifikasi Akhir Tahun 2019, 2020.
4. Knowledgia. How did Indonesia become Muslim? Available online: https://www.youtube.com/watch?v=vf-VVg8PIOE (accessed on Oct 7, 2020).
5. Maulidia, M.; Dargusch, P.; Ashworth, P.; Ardiansyah, F. Rethinking renewable energy targets and electricity sector reform in Indonesia: a private sector perspective. Renew. Sustain. Energy Rev. 2019, 101, 231–247.
6. Dasuki, A.S.; Djamin, M.; Lubis, A.Y. The strategy of photovoltaic technology development in Indonesia. Renew. Energy 2001, 22, 321–326.
7. Rumbayan, M.; Abudureyimu, A.; Nagasaka, K. Mapping of solar energy potential in Indonesia using artificial neural network and geographical information system. Renew. Sustain. Energy Rev. 2012, 16, 1437–1449.
8. Kunaifi; Reinders, A. Perceived and reported reliability of the electricity supply at three urban locations in Indonesia. Energies 2018, 11.
9. T.Falentinaa, A.; Resosudarmoa, B.P. The impact of blackouts on the performance of micro and small enterprises: Evidence from Indonesia. World Dev. 2019, 124, 1–12.
10. Stern, D.I.; Burke, P.J.; Bruns, S.B. The Impact of Electricity on Economic Development: A Macroeconomic Perspective. Energy Econ. Growth. 2019.
11. Birol, F. The coronavirus crisis reminds us that electricity is more indispensable than ever Available online: https://www.iea.org/commentaries/the-coronavirus-crisis-reminds-us-that-electricity-is-more-indispensable-than-ever (accessed on Sep 7, 2020), 2020.
12. AlMuhaini, M. Impact of Distributed Generation Integration on the Reliability of Power Distribution Systems. In Distributed Generation Systems: Design, Operation and Grid Integration; Butterworth-Heinemann, 2017; pp. 453–508.
13. Lin, J.; H. Magnago, F.; Foruzan, E.; Albarracín-Sánchez, R. Market Design Issues of Distributed Generation. In Distributed Generation Systems: Design, Operation and Grid Integration; Butterworth-Heinemann, 2017; pp. 369–413.
14. Adefarati, T.; Bansal, R.C. Reliability assessment of distribution system with the integration of renewable distributed generation. Appl. Energy 2017, 85, 158–171.
15. Ansari, O.A.; Safari, N.; Chung, C.Y. Reliability Assessment of Microgrid with Renewable Generation and Prioritized Loads. In Proceedings of the 2016 IEEE Green Energy and Systems Conference (IGSEC); IEEE Conference Publications, 2016.

555225-L-sub01-bw-Kunaifi555225-L-sub01-bw-Kunaifi555225-L-sub01-bw-Kunaifi555225-L-sub01-bw-KunaifiProcessed on: 8-2-2021Processed on: 8-2-2021Processed on: 8-2-2021Processed on: 8-2-2021 PDF page: 202PDF page: 202PDF page: 202PDF page: 202
References
166
16. Nazir, R.; Nurdin, M.; Fitrianto, E. Voltage Profile Improvement of the 20 kV Painan Distribution System with Multiple Distributed Renewable Energy Generation. Int. J. Technol. 2016, 7, 26–37.166
17. Daisy Dunne. The Carbon Brief Profile: Indonesia. Available online: https://www.carbonbrief.org/the-carbon-brief-profile-indonesia (accessed on Sep 7, 2020), 2019.
18. Prihatno, J.; Rachmawaty, E.; Marjaka, W. Indonesia: Second Biennial Update Report under the United Nations Framework Convention on Climate Change. Available online: https://unfccc.int/sites/default/files/resource/Indonesia-2nd_BUR.pdf (accessed on Sep 7, 2020), 2018.
19. Government of Indonesia. Intended Nationally Determined Contribution Republic of Indonesia. Available online: https://www4.unfccc.int/sites/ndcstaging/PublishedDocuments/Indonesia First/First NDC Indonesia_submitted to UNFCCC Set_November 2016.pdf (accessed on Aug 22, 2020), 2016.
20. Wijaya, A.; Chrysolite, H.; Ge, M.; Wibowo, C.K.; Pradana, A.; Utami, A.F.; Austin, K. How Can Indonesia Achieve its Climate Change Mitigation Goal? An Analysis of Potential Emissions Reductions from Energy and Land-Use Policies Available online: https://wri-indonesia.org/sites/default/files/WRI Layout Paper OCN v7.pdf (accessed on Sep 12, 2020), 2017.
21. United States Environmental Protection Agency. Emission Factors for Greenhouse Gas Inventories. Available online: https://www.epa.gov/sites/production/files/2015-07/documents/emission-factors_2014.pdf (accessed on Sep 11, 2020), 2014.
22. Handayani, K.; Krozer, Y.; Filatova, T. Trade-offs between electrification and climate change mitigation: An analysis of the Java-Bali power system in Indonesia. Appl. Energy 2017, 208, 1020–1037.
23. Handayani, K.; Krozer, Y.; Filatova, T. From fossil fuels to renewables: An analysis of long-term scenarios considering technological learning. Energy Policy 2019, 127.
24. Papilo, P.; Marimin, M.; Hambali, E.; Sitanggang, I..; Permata, E..; Kurniawan, R.; Novriyanto, N. Policy system for palm oil based bioenergy sustainability. IOP Conf. Ser. Earth Environ. Sci. 2020, 472.
25. Papilo, P.; Marimin; Hambali, E.; Sitanggang, I.. Sustainability index assessment of palm oil-based bioenergy in Indonesia. J. Clean. Prod. 2018, 196.
26. Kunaifi, K.; Veldhuis, A.; Reinders, A. The Electricity Grid in Indonesia: The Experiences of End-users and Their Attitudes Toward Solar Photovoltaics; Springer International Publishing: Switzerland, 2020.
27. Yo, M.; Dunn, C. Indonesia rejoining OPEC despite being a net importer of petroleum. Available online: https://www.eia.gov/todayinenergy/detail.php?id=23352 (accessed on May 18, 2020), 2015.
28. Tampubolon, A.P.; Alfath, A.; Damayanti, H.; Marciano, I.; Simamora, P. Indonesia Clean Energy Outlook: Tracking Progress and Review of Clean Energy Development in Indonesia; Jakarta, 2020.
29. Dutch New Energy. Research Dutch Solar Trend Report 2020: Summary, 2020.
30. World Bank Group. Solar Resource and Photovoltaic Potential of Indonesia, 2017.
31. Solargis. Global Solar Atlas 2.0. Available online: https://globalsolaratlas.info (accessed on Sep 8, 2020), 2020.

555225-L-sub01-bw-Kunaifi555225-L-sub01-bw-Kunaifi555225-L-sub01-bw-Kunaifi555225-L-sub01-bw-KunaifiProcessed on: 8-2-2021Processed on: 8-2-2021Processed on: 8-2-2021Processed on: 8-2-2021 PDF page: 203PDF page: 203PDF page: 203PDF page: 203
References
167
32. International Energy Agency. Global Energy Review 2019: The latest trends in energy and emissions in 2019. Available online: http://www.iea.org/reports/global-energy-review-2019 (accessed on Oct 20, 2020), 2020.
33. International Energy Agency. Snapshot of Global PV Markets 2020. Available online: https://iea-pvps.org/wp-content/uploads/2020/04/IEA_PVPS_Snapshot_2020.pdf (accessed on Aug 10, 2020), 2020.
34. Fraunhofer - ISE. Photovoltaics Report, updated: 23 June 2020; Freiburg, 2020.
35. Vartiainen, E.; Masson, G.; Breyer, C.; Moser, D.; Román Medina, E. Impact of weighted average cost of capital, capital expenditure, and other parameters on future utility-scale PV levelised cost of electricity. Prog. Photovoltaics Res. Appl. 2020, 28, 439–453.
36. Hamdi, E. Indonesia’s Solar Policies: Designed to Fail? Available online: https://ieefa.org/wp-content/uploads/2019/02/Indonesias-Solar-Policies_February-2019.pdf (accessed on Aug 9, 2020), 2020.
37. Vardimon, R. Assessment of the potential for distributed photovoltaic electricity production in Israel. Renew. Energy 2020, 36, 591–594.
38. Harapan, H.; Anwar, S.; Bustamam, A.; Radiansyah, A.; Angraini, P.; Fasli, R.; Salwiyadi, S.; Bastian, R.A.; Oktiviyari, A.; Akmal, I.; et al. Willingness to pay for a dengue vaccine and its associated determinants in Indonesia: A community-based, cross-sectional survey in Aceh. Acta Trop 2017, 166, 249–256.
39. Vollmer, D.; Ryffel, A.N.; Djaja, K.; Grêt-Regamey, A. Examining demand for urban river rehabilitation in Indonesia: Insights from a spatially explicit discrete choice experiment. Land use policy 2016, 57, 514–525.
40. Suparman, Y.; Folmer, H.; Oud, J.H.L. The willingness to pay for in-house piped water in urban and rural Indonesia. Pap. Reg. Sci. 2016, 95, 407–426.
41. Soo, J.S.T. Valuing Air Quality in Indonesia Using Households’ Locational Choices. Environ. Resour. Econ. 2017, 1–22.
42. Anna, Z.Z.Z. Economic valuation of whale shark tourism in Cenderawasih Bay National Park, Papua, Indonesia. Biodiversitas 2017, 18, 1026–1034.
43. Hendratmoko, P.; Guritnaningsih; Tjahjono, T. Analysis of interaction between preferences and intention for determining the behavior of vehicle maintenance pay as a basis for transportation road safety assessment, VL-7. 2016, 105–113.
44. Ambarwati, L.; Verhaeghe, R.; Arem, B. V; Pel, A.J. Assessment of transport performance index for urban transport development strategies — Incorporating residents’ preferences. Environ. Impact Assess. Rev. 2017, 6, 107–115.
45. Kojima, R.; Ishikawa, M. Consumer willingness-to-pay for packaging and contents in Asian countries. Waste Manag. 2017.
46. Miller, S.; Tait, P.; Saunders, C.; Dalziel, P.; Rutherford, P.; Abell, W. Estimation of consumer willingness-to-pay for social responsibility in fruit and vegetable products: A cross-country comparison using a choice experiment. J. Consum. Behav. 2017, 16, 13–25.
47. Lensink, R.; Raster, T.; Timmer, A. Liquidity Constraints and Willingness to Pay for Solar Lamps and Water Filters in Jakarta. Eur. J. Dev. Res. 2017.
48. Kumashiro, H.; Kharisma, V.; Morgana Sianipar, C.P.; Koido, K.; Takahashi, R.; Dowaki, K. The design of an appropriate geothermal energy system. 5th Int. Conf. Energy Sustain. 2014, 207–217.
49. Cabraal, A.; Cosgrove�Davies, M.; Schaeffer, L. Accelerating sustainable photovoltaic market development. Prog. Photovoltaics 1998, 6, 1998.
555225-L-sub01-bw-Kunaifi555225-L-sub01-bw-Kunaifi555225-L-sub01-bw-Kunaifi555225-L-sub01-bw-KunaifiProcessed on: 8-2-2021Processed on: 8-2-2021Processed on: 8-2-2021Processed on: 8-2-2021 PDF page: 204PDF page: 204PDF page: 204PDF page: 204
References
168
50. Nieuwenhout, F.D.J.; Dijk, A. van; Lasschuit, P.E.; Roekel, G. van; Dijk, V.A.P. van; Hirsch, D.; Arriaza, H.; Hankins, M.; Sharma, B.D.; Wade, H. Experience with solar home systems in developing countries: a review. Prog. Photovoltaics Res. Appl. 2001, 9, 455–474.
51. Reinders, A.; Sudradjat, A.; Dijk, V. Van; Mulyadi, R.; Turkenburg, W. Sukatani revisited: on the performance of nine-year-old solar home systems and street lighting systems in Indonesia. Renew. Sustain. Energy Rev. 1999, 3, 1–47.
52. Veldhuis, A.J.; Reinders, A.H.M.E. Performance of a 34 kWp Grid-Connected PV System in Indonesia- A Comparison of Tropical and European PV Systems. 2014 IEEE 40th Photovolt. Spec. Conf. 2014.
53. Veldhuis, A.J. Modeling and simulation of photovoltaic systems in Indonesia: a technical evaluation at multiple levels. PhD thesis, University of Twente: Enschede, 2015.
54. Veldhuis, A.J.; Nobre, A.M.; Peters, I.M.; Reindl, T.; Ruther, R.; Reinders, A.H.M.E. An Empirical Model for Rack-Mounted PV Module Temperatures for Southeast Asian Locations Evaluated for Minute Time Scales. IEEE J. Photovoltaics 2015, 5, 774–782.
55. Reinders, A.H.M.E.; Veldhuis, H.; Susandi, A.; Indartono, Y.S.; Halim, B.; Iswarayoga, N. PV Electricity in Indonesia – A Sustainable Transition with Great Potential. 29th Eur. Photovolt. Sol. Energy Conf. Exhib. 2014, 4109–4112.
56. Badan Informasi Geospasial. Rujukan Nasional Data Kewilayahan: Luas NKRI 8,3 Juta Kilometer Persegi, 2018.
57. Indonesian Ministry of Trade. Indonesia Facts and Figures. Available online: https://www.embassyofindonesia.org/index.php/basic-facts/ (accessed on Jun 17, 2019), 2015.
58. Dalet, D. Indonesia Available online: http://www.d-maps.com/ (accessed on Jun 17, 2019), 2020.
59. Hall, R. Indonesia , Geology. 2009, 454–460.
60. Pambudi, N.A. Geothermal power generation in Indonesia, a country within the ring of fire: Current status, future development and policy. Renew. Sustain. Energy Rev. 2018.
61. CIA. The World Factbook, 2019.
62. USGS. Which country has the most earthquakes? Available online: https://www.usgs.gov/faqs/which-country-has-most-earthquakes? (accessed on Jun 17, 2019).
63. Bons, K.C.A.; Soekmono, A.; Azhari, N.; Restiawan, A.; Tunggal, L.; Yazid, A.; Dini Uljati, I.; Tata Samiadji, B.; Tangkas, P.; Suryana; et al. Indonesia Country Water assessment, 2016.
64. Global Forest Watch. Forest Loss Map, 2019.
65. PwC. Power in Indonesia. 2017.
66. Dirjen Ketenagalistrikan ESDM. Realisasi Rasio Elektrifikasi Akhir Tahun 2017, 2018.
67. Tan, Y.; Meegahapola, L.; Muttaqi, K.M. A review of technical challenges in planning and operation of remote area power supply systems. Renew. Sustain. Energy Rev. 2014, 38, 876–889.
68. Mudiantoro, B.; Galvez, J. Investing in Renewable Energy Generation and Power Transmission in Eastern Lessons Learned from ADB ’ s Renewable Energy. 2015.
69. Gammal, A. El Photovoltaics, Tomorrow’s Technology Available Today. Clim. Action 2009/2010 2010, 86–89.

555225-L-sub01-bw-Kunaifi555225-L-sub01-bw-Kunaifi555225-L-sub01-bw-Kunaifi555225-L-sub01-bw-KunaifiProcessed on: 8-2-2021Processed on: 8-2-2021Processed on: 8-2-2021Processed on: 8-2-2021 PDF page: 205PDF page: 205PDF page: 205PDF page: 205
References
169
70. Indonesia Central Bank. Pertumbuhan Ekonomi Indonesia 2019 Tetap Berdaya Tahan Available online: https://www.bi.go.id/id/ruang-media/siaran-pers/Pages/SP_220820.aspx (accessed on Oct 20, 2020).
71. The World Bank. GDP Growth (% annual). Available online: https://data.worldbank.org/indicator/NY.GDP.MKTP.KD.ZG (accessed on Oct 20, 2020), 2020.
72. Hawksworth, J.; Audino, H.; Clarry, R. The Long View. How will the global economic order change by 2050, 2017; Februrary.
73. The World Bank. GDP per capita, PPP (current international $). Available online: https://data.worldbank.org/indicator/NY.GDP.PCAP.PP.CD (accessed on Oct 20, 2020), 2020.
74. Brown, K. Human development and environmental governance: A reality check. Gov. Sustain. 2009, 32–52.
75. Singh, N.; Nyuur, R.; Richmond, B. Renewable Energy Development as a Driver of Economic Growth: Evidence from Multivariate Panel Data Analysis. Sustainability 2019, 11, 2018.
76. The World Bank. Population, total. Available online: https://data.worldbank.org/indicator/SP.POP.TOTL (accessed on Sep 2, 2019), 2019.
77. The World Bank. Energy use (kg of oil equivalent per capita). Available online: https://data.worldbank.org/indicator/EG.USE.PCAP.KG.OE (accessed on Sep 2, 2019), 2019.
78. BPS. Statistical Yearbook of Indonesia 2018. Indonesia: Jakarta, 2018.
79. Indonesia Central Bank. Inflasi. Available online: https://www.bi.go.id/id/moneter/inflasi/data/Default.aspx (accessed on Sep 2, 2019), 2020.
80. ADB. Asian Development Outlook 2020. Available online: https://www.adb.org/sites/default/files/publication/492711/ado2019.pdf (accessed on Oct 21, 2020), 2020.
81. Stern, D.I. The environmental Kuznets curve after 25 years; Canberra, 2015.
82. Özokcu, S.; Özdemir, Ö. Economic growth, energy, and environmental Kuznets curve. Renew. Sustain. Energy Rev. 2017, 72, 639–647.
83. IRENA; CEM The socio-economic benefits of large-scale solar and wind energy: an econValue report. 2014, 108.
84. Dinda, S. Environmental Kuznets Curve hypothesis: A survey. Ecol. Econ. 2004, 49, 431–455.
85. US PopClock. U . S . and World Population Clock 2019, 2019, 1–5.
86. BPS-Statistics. Indonesia Statistical Yearbook of Indonesia 2020. Available online: https://www.bps.go.id/publication/2020/04/29/e9011b3155d45d70823c141f/statistik-indonesia-2020.html (accessed on Oct 12, 2020), 2020.
87. Worldometer. South-Eastern Asia Population. Available online: https://www.worldometers.info/world-population/south-eastern-asia-population/ (accessed on Oct 12, 2020), 2020.
88. Jones, G. The 2010 - 2035 Indonesian Population Projection. J. Nucl. Med. 2014, 55, 9N-15N.
89. BPS-Statistics Indonesia. Jumlah Desa Tertinggal (Desa). Available online: https://www.bps.go.id/indikator/indikator/view_data/0000/data/1231/sdgs_10/1 (accessed on Oct 21, 2020), 2020.
90. ESDM. Program Indonesia Terang Dicanangkan 2016, 2019.

555225-L-sub01-bw-Kunaifi555225-L-sub01-bw-Kunaifi555225-L-sub01-bw-Kunaifi555225-L-sub01-bw-KunaifiProcessed on: 8-2-2021Processed on: 8-2-2021Processed on: 8-2-2021Processed on: 8-2-2021 PDF page: 206PDF page: 206PDF page: 206PDF page: 206
References
170
91. World Atlas. The Worlds Most Densely Populated Cities, 2019.
92. BPS Statistik. Indonesia dalam Infografis 2018. 2018.
93. Lane, C. Solar panel efficiency: most efficient solar panels in 2020. Available online: https://www.cleanenergyreviews.info/blog/most-efficient-solar-panels (accessed on Oct 12, 2020), 2020.
94. Fraunhofer ISE. Photovoltaics Report, updated: 14 March 2019; Freiburg, 2019.
95. Wirjohamidjojo, S.; Swarinoto, Y. Iklim Kawasan Indonesia (Dari Aspek Dinamik - Sinoptik); 2010.
96. Rafi’i, S. Meteorologi dan Klimatologi; ANGKASA: Bandung, 1995.
97. Peel, M.C.; Finlayson, B.L.; McMahon, T.A. Updated world map of the Köppen-Geiger climate classification. Hydrol. Earth Syst. Sci. 2007, 11, 1633–1644.
98. Rubel, F.; Brugger, K.; Haslinger, K.; Auer, I. The climate of the European Alps: Shift of very high resolution Köppen-Geiger climate zones 1800-2100. Meteorol. Zeitschrift 2017, 26, 115–125.
99. Febrianti, N. Perubahan Zona Iklim di Indonesia dengan Menggunakan Sistem Klasifikasi Koppen. Pros. Work. Apl. Sains Atmos. 2008.
100. BMKG. Perubahan Iklim: Tren Suhu. Available online: https://www.bmkg.go.id/iklim/?p=tren-suhu (accessed on Jul 21, 2019), 2019.
101. BPS. Kecepatan Angin dan Kelembaban di Stasiun Pengamatan BMKG, 2011-2015; 2017.
102. Beck, H.E.; Zimmermann, N.E.; McVicar, T.R.; Vergopolan, N.; Berg, A.; Wood, E.F. Present and future Koppen-Geiger climate classification maps at 1-km resolution. Sci Data 2018, 5, 180214.
103. Bonkaney, A.L.; Madougou, S.; Adamou, R. Impact of Climatic Parameters on the Performance of Solar Photovoltaic (PV) Module in Niamey. Smart Grid Renew. Energy 2017, 08, 379–393.
104. Bett, P.E.; Thornton, H.E. The climatological relationships between wind and solar energy supply in Britain. Renew. Energy 2016, 87, 96–110.
105. Bahaidarah, H.; Rehman, S.; Subhan, A.; Gandhidasan, P.; Baig, H. Performance Evaluation of a PV Module under Climatic Conditions of Dhahran, Saudi Arabia. Energy Explor. Exploit. 2015, 33, 909–929.
106. Veldhuis, A.J.; Reinders, A.H.M.E. Reviewing the potential and cost-effectiveness of off-grid PV systems in Indonesia on a provincial level. Renew. Sustain. Energy Rev. 2015, 52, 757–769.
107. Yudha, S.W.; Tjahjono, B. Stakeholder Mapping and Analysis of the Renewable. 2019, 1–19.
108. Kontan, Permen ESDM Nomor 49/2018 Hambat Investasi PLTS Atap. Available online: https://insight.kontan.co.id/news/permen-esdm-nomor-492018-hambat-investasi-plts-atap (accessed on Jun 20, 2019), 2019.
109. ESDM. Handbook of Energy and Economic Statistics of Indonesia 2019. Available online: https://www.esdm.go.id/en/publication/handbook-of-energy-economic-statistics-of-indonesia-heesi (accessed on Oct 21, 2020), 2020.
110. Eurostat. Energy consumption in 2018. Available online: https://ec.europa.eu/eurostat/documents/2995521/10341545/8-04022020-BP-EN.pdf/39dcc365-bdaa-e6f6-046d-1b4d241392ad#:~:text=The EU has an energy,than 959 Mtoe in 2020 (accessed on Oct 21, 2020), 2020.
111. Sugiyono, A. Pengembangan Kelistrikan Nasional Prosiding Seminar Nasional Pengembangan Energi Nuklir II , 2009. 2009.
555225-L-sub01-bw-Kunaifi555225-L-sub01-bw-Kunaifi555225-L-sub01-bw-Kunaifi555225-L-sub01-bw-KunaifiProcessed on: 8-2-2021Processed on: 8-2-2021Processed on: 8-2-2021Processed on: 8-2-2021 PDF page: 207PDF page: 207PDF page: 207PDF page: 207
References
171
112. Adam, L.; Sambodo, M.T. Indonesia’s Dynamic Electricity Power Sector: Investigating Need and Supply Performance. Econ. Financ. Indones. 2015, 61, 53–68.
113. Rehman, A.; Deyuan, Z. Investigating the Linkage between Economic Growth, Electricity Access, Energy Use, and Population Growth in Pakistan. Appl. Sci. 2018, 8, 2442.
114. BPPT. Indonesia Energy Outlook 2018. Jakarta, Indonesia, 2018.
115. Eurostat. Electricity and heat statistics. Available online: https://ec.europa.eu/eurostat/statistics-explained/index.php/Electricity_and_heat_statistics#Production_of_electricity (accessed on Oct 21, 2020), 2020.
116. Department of Statistics, Ministry of Trade & Industry, Republic of Singapore. Singapore’s Population Trends 2020. Available online: https://www.singstat.gov.sg/-/media/files/publications/population/population2020.pdf (accessed on Oct 22, 2020), 2020.
117. Dirjen Ketenagalistrikan ESDM. Realisasi Rasio Elektrifikasi Akhir Tahun 2018; 2019.
118. PLN Statistik. PLN 2019. Available online: https://web.pln.co.id/statics/uploads/2020/08/Statistik-2019-4-8-20-rev.pdf (accessed on Oct 22, 2020), 2019.
119. Kamarudin, Y.; Natakusumah, G.; Winzenried, S.; Watson, T. Power in Indonesia: Investment and Taxation Guide Available online: https://www.pwc.com/id/en/publications/assets/eumpublications/utilities/power-guide-2018.pdf (accessed on Feb 12, 2019), 2018.
120. IEA. IEA Atlas of Energy. Available online: http://energyatlas.iea.org (accessed on Sep 12, 2019), 2019.
121. Dirjen Ketenagalistrikan ESDM. Statistik Ketenagalistrikan 2017; Jakarta, Indonesia, 2018.
122. Vasconcelos, J. Some brief remarks on security of electricity supply. 2004, 1–18.
123. PLN. Eectricity Tariff Adjustment August 2016; PLN: Jakarta, 2016.
124. U.K. Foreign & Commonwealth Office. Indonesia Renewable Energy Business Opportunities. Available online: https://www.the-eic.com/portals/0/Website/Publications/Indonesia-Business-Opportunities-Study.pdf (accessed on Oct 21, 2020), 2020.
125. NREL. Sustainable Energy in Remote Indonesian Grids: Accelerating Project Development; NREL: Golden, 2015.
126. OECD. Development Centre Economic Outlook for Southeast Asia. 2015, 3.
127. World Bank. Getting electricity - Factors affecting the reliability of electricity supply. 2017.
128. Schwab, K.; Sala-i-Martín, X. The Global Competitiveness Report2017–2018 Available online: http://www3.weforum.org/docs/GCR2017-2018/05FullReport/TheGlobalCompetitivenessReport2017–2018.pdf (accessed on Oct 21, 2020), 2017.
129. PLN. Statistik PLN 2012; PLN: Jakarta, Indonesia, 2013.
130. PLN. Statistik PLN 2013; PLN: Jakarta, Indonesia, 2104.
131. PLN. Statistik PLN 2014; PLN: Jakarta, Indonesia, 2015.
132. PLN. Statistik PLN 2015; PLN: Jakarta, Indonesia, 2016.
133. PLN. Statistik PLN 2016; PLN: Jakarta, Indonesia, 2017.
555225-L-sub01-bw-Kunaifi555225-L-sub01-bw-Kunaifi555225-L-sub01-bw-Kunaifi555225-L-sub01-bw-KunaifiProcessed on: 8-2-2021Processed on: 8-2-2021Processed on: 8-2-2021Processed on: 8-2-2021 PDF page: 208PDF page: 208PDF page: 208PDF page: 208
References
172
134. PLN. Rencana usaha penyediaan tenaga listrik. Rencana Usaha Penyediaan Tenaga List. 2019, 2019–2028.
135. IEA. World Energy Outlook 2015; International Energy Agency: Paris, 2015.
136. BPPT. Indonesia Energy Outlook 2015; BPPT: Jakarta, 2015.
137. IEA. IEA World Energy Balances 2018. Available online: https://www.iea.org/countries/Indonesia/ (accessed on Jul 15, 2019), 2018.
138. ESDM. Electricity Supply Business Plan (RUPTL) 2016-2025, 2016.
139. Muryanto, B. Greenpeace warns of environmental impact of Indonesia’s 35,000 MW project. Available online: http://news.asiaone.com/news/asia/greenpeace-warns-environmental-impact-indonesias-35000-mw-project (accessed on Jul 15, 2017), 2015.
140. detikcom. Program 35.000 MW Baru 24%, Tak Selesai di Era Jokowi. Available online: https://finance.detik.com/energi/d-5184641/program-35000-mw-baru-24-tak-selesai-di-era-jokowi (accessed on Oct 12, 2020), 2020.
141. Suharsono, A.; Lontoh, L. Indonesia’s Energy Policy Briefing. Available online: https://www.iisd.org/system/files/2020-08/indonesia-energy-policy-briefing-july-2020-en.pdf (accessed on Oct 12, 2020), 2020.
142. PLN. Annual Report 2019: Redefining Challenges, Enhancing Services. Available online: https://web.pln.co.id/statics/uploads/2020/07/PLN_AR_2019_OJK_Med_260620.pdf (accessed on Oct 21, 2020), 2019.
143. Indonesia Power. Laporan Statistik Indonesia Power. Available online: https://www.indonesiapower.co.id/id/komunikasi-berkelanjutan/Reports/Laporan Statistik PT Indonesia Power 2018.pdf (accessed on Oct 21, 2020), 2018.
144. PJB. PJB Unit Pembangkitan. Available online: https://www.ptpjb.com/unit-pembangkitan/ (accessed on May 29, 2019), 2019.
145. Brown, M. Perusahaan Listrik Negara ( PLN ): A Power Company Out of Step With Global Trends. 2018, 1–20.
146. PLN. Statistik PLN 2009; Jakarta, 2010.
147. Setyawan, D. Assessing The Current Indonesia’s Electricity Market Arrangements and The Opportunities to Reform. Int. J. Renew. Energy Dev. 2015, 3, 55–64.
148. Lovei, L. The Single-Buyer Model : A Dangerous Path toward Competitive Electricity Markets. Available online: https://openknowledge.worldbank.org/bitstream/handle/10986/11409/multi0page.pdf?sequence=1&isAllowed=y (accessed on Oct 12, 2020), 2020.
149. Blumsack, S. Electricity Industry Structure and Regulation. Available online: https://www.e-education.psu.edu/eme801/node/529 (accessed on Oct 12, 2020), 2020.
150. PLN. Statistik PLN 2017; Perusahaan Listrik Negara (PLN): Jakarta, Indonesia, 2018.
151. Dirjen Ketenagalistrikan ESDM. Statistik Ketenagalistrikan 2018. Available online: https://gatrik.esdm.go.id/assets/uploads/download_index/files/2242b-statistik-ketenagalistrikan-2019.pdf (accessed on Oct 20, 2020), 2018.
152. Yahya, H. How Renewable Energy can Boost Indonesia’s Businesses and Drive Economic Growth. Available online: https://www.youtube.com/watch?v=D0t0XOQbmuM (accessed on Oct 30, 2020), 2020.
153. Bridle et al. Missing the 23 Per Cent Target: Roadblocks to the Development of Renewable Energy in Indonesia. 2018.

555225-L-sub01-bw-Kunaifi555225-L-sub01-bw-Kunaifi555225-L-sub01-bw-Kunaifi555225-L-sub01-bw-KunaifiProcessed on: 8-2-2021Processed on: 8-2-2021Processed on: 8-2-2021Processed on: 8-2-2021 PDF page: 209PDF page: 209PDF page: 209PDF page: 209
References
173
154. Arinaldo, D.; Adiatma, J.C.; Simamora, P. Indonesia Clean Energy Outlook Imprint Indonesia Clean Energy Outlook. 2018.
155. Indonesia. Regulation of Ministry of Energy and Mineral Resources 17 Year 2013. 2013.
156. Media Indonesia. Kebut Elektrifikasi dan Energi Terbarurak RUPTL PLN Diubah. Available online: https://mediaindonesia.com/ekonomi/223886/kebut-elektrifikasi-dan-energi-terbarukan-ruptl-pln-diubah (accessed on Oct 30, 2020), 2020.
157. International Energy Agency. World Energy Outlook 2016 Executive Summary; International Energy Agency: Paris, 2016.
158. Khoury, J.; Mbayed, R.; Salloum, E.; Monmasson, E. Optimal sizing of a residential PV-battery backup for an intermittent primary energy source under realistic constraints. Energy Build. 2015, 105, 206–216.
159. Alramlawi, M.; Gabash, A.; Li, P. Optimal operation strategy of a hybrid PV-battery system under grid scheduled blackouts. In Proceedings of the IEEE International Conference on Environment and Electrical Engineering and 2017 IEEE Industrial and Commercial Power Systems Europe (EEEIC / I&CPS Europe); IEEE: Milan, Italy, 2017.
160. Hasan, M.H.; Muzammil, W.K.; Mahlia, T.M.I.; Jannifar, A.; Hasanuddin, I. A review on the pattern of electricity generation and emission in Indonesia from 1987 to 2009. Renew. Sustain. Energy Rev. 2012, 16, 3206–3219.
161. Murphy, P.M.; Twaha, S.; Murphy, I.S. Analysis of the cost of reliable electricity: A new method for analyzing grid connected solar, diesel and hybrid distributed electricity systems considering an unreliable electric grid, with examples in Uganda. Energy 2014, 66, 523-534.
162. World Bank Group. Enterprise Surveys Data for Indonesia 2017, 2017.
163. Torell, W.; Avelar, V. Mean Time Between Failure: Explanation and Standards. Available online: https://www.controldesign.com/assets/11WPpdf/110516-Schneider-mean-time-between-failure.pdf (accessed on Jan 18, 2021), 2020.
164. IEEE. IEEE Std 493TM-2007 IEEE Recommended Practice for the Design of Reliable Industrial and Commercial Power Systems; IEEE: New Yersey, 2007.
165. IEEE. IEEE Guide for Electric Power Distribution Reliability Indices 2012, IEEE Std 1, 2012.
166. Government of Indonesia. President Decree Regarding National Energy General Plan, 2017-2026; Government of Indonesia: Jakarta, 2017.
167. Asian Development Bank. Achieving Universal Electricity Access in Indonesia 2016, 113.
168. The World Bank. Acess to Electricity 2017. Available online: http://data.worldbank.org/indicator/EG.ELC.ACCS.ZS (accessed on Jan 18, 2021), 2017.
169. International Agency Agency. Electricity access in Developing Asia - 2016; Paris, 2016.
170. Knoema. Quality of electricity supply. World Bank, 2014.
171. CRO Forum. Power Blackout Risks: Risk Management Options, 2011.
172. Erahman, Q.F.; Purwanto, W.W.; Sudibandriyo, M.; Hidayatno, A. An assessment of Indonesia’s energy security index and comparison with seventy countries. Energy 2016, 364–376.
173. Jamal Hisham Hashim, Z.H. Climate Change, Extreme Weather Events, and Human Health Implications in the Asia Pacific Region. Asia Pacific J. Public Heal. 2016, 28, 8S-14S.
555225-L-sub01-bw-Kunaifi555225-L-sub01-bw-Kunaifi555225-L-sub01-bw-Kunaifi555225-L-sub01-bw-KunaifiProcessed on: 8-2-2021Processed on: 8-2-2021Processed on: 8-2-2021Processed on: 8-2-2021 PDF page: 210PDF page: 210PDF page: 210PDF page: 210
References
174
174. Zoro, R.; Mefiardhi, R. Insulator Damages due to Lightning Strikes in Power System : Some Experiences in Indonesia. In Proceedings of the 2006 IEEE 8th International Conference on Properties & applications of Dielectric Materials; 2006.
175. Christian, H.J.; Blakeslee, R.J.; Boccippio, D.J.; Boeck, W.L.; Buechler, D.E.; Driscoll, K.T.; Goodman, S.J.; Hall, J.M.; Koshak, W.J.; Mach, D.M.; et al. Global frequency and distribution of lightning as observed from space by the Optical Transient Detector. J. Geophys. Res. Atmos. 2003, 108, ACL 4-1-ACL 4-15.
176. Bi, C.; Qi, B. Reliability improvement of long distance transmission line protection in Indonesia. 2016 China Int. Conf. Electr. Distrib. 2016.
177. NASA. Lightning Flash Rate. Available online: http://www.sos.noaa.gov/Datasets/dataset.php?id=6 (accessed on Jan 13, 2018), 2018.
178. Handayani, K.; Filatova, T.; Krozer, Y. The vulnerability of the power sector to climate variability and change: Evidence from Indonesia. Energies 2019, 12.
179. Handayani, K.; Filatova, T.; Krozer, Y.; Anugrah, P. Seeking for a climate change mitigation and adaptation nexus: Analysis of a long-term power system expansion. Appl. Energy 2020, 262.
180. Liliana, L.; Setiawan, D. A Guideline on Designing a Safe and Appropriate Grounding System: A Review of Selected Papers. IOP Conf. Ser. Earth Environ. Sci. 2020, 469.
181. Chattopadhyay Madhuchhanda Mitra, and Samarjit Sengupta, S. Electric Power Quality; Springer: Dordrecht, 2011;
182. Pontt, J.; Rodríguez, J.; Valderrama, W.; Sepúlveda, G.; Alzamora, G. Resonance effects, power quality and reliability issues of high-power converters-fed drives employed in modern SAG circuits. Miner. Eng. 2004, 17, 1113–1125.
183. Sjöberg, L. Political decisions and public risk perception. Reliab. Eng. Syst. Saf. 2001, 72, 115–123.
184. Ozbafli, A.; Jenkins, G.P. Estimating the willingness to pay for reliable electricity supply: A choice experiment study. Energy Econ. 2016, 56, 443–452.
185. Bernués, A.; Rodríguez-Ortega, T.; Ripoll-Bosch, R.; Alfnes, F. Socio-Cultural and Economic Valuation of Ecosystem Services Provided by Mediterranean Mountain Agroecosystems. PLoS One 2014, 9.
186. O’Connor, B.; Balasubramanyan, R.; Routledge, B.R.; Smith., N.A. From Tweets to Polls: Linking Text Sentiment to Public Opinion Time Series. In Proceedings of the Fourth International AAAI Conference on Weblogs and Social Media; 2010.
187. Matsukawa, I.; Fujii, Y. Customer Preferences for Reliable Power Supply: Using Data on Actual Choices of Back-Up Equipment. Rev. Econ. Stat. 1994, 76, 434–446.
188. Sagebiela, J.; Rommel, K. Preferences for electricity supply attributes in emerging megacities — Policy implications from a discrete choice experiment of private households in Hyderabad, India. Energy Sustain. Dev. 2014, 21, 89–99.
189. Sagebiel, J.; Müller, J.R.; Rommel, J. Are consumers willing to pay more for electricity from cooperatives? Results from an online Choice Experiment in Germany. Energy Res. Soc. Sci. 2014, 2, 90–101.
190. Kalkbrenner, B.J.; Yonezawa, K.; Roosen, J. Consumer preferences for electricity tariffs: Does proximity matter? Energy Policy 2017, 107, 413–424.
191. Bartczak, A.; Chilton, S.; Czajkowskia, M.; Meyerhoff, J. Gain and loss of money in a choice experiment. The impact of financial loss aversion and risk preferences
555225-L-sub01-bw-Kunaifi555225-L-sub01-bw-Kunaifi555225-L-sub01-bw-Kunaifi555225-L-sub01-bw-KunaifiProcessed on: 8-2-2021Processed on: 8-2-2021Processed on: 8-2-2021Processed on: 8-2-2021 PDF page: 211PDF page: 211PDF page: 211PDF page: 211
References
175
on willingness to pay to avoid renewable energy externalities. Energy Econ. 2017, 65, 326–334.
192. Sagebiel, J. Preference heterogeneity in energy discrete choice experiments: A review on methods for model selection. Renew. Sustain. Energy Rev. 2017, 69, 804–811.
193. Shina, J.; Hwang, W.-S. Consumer preference and willingness to pay for a renewable fuel standard (RFS) policy: Focusing on ex-ante market analysis and segmentation. Energy Policy 2017, 106, 32–40.
194. Ghozali, A.; Kaneko, S. Climate Change Policies and Challenges in Indonesia Consumer behavior and ecolabeling; Springer : Japan, 2016.
195. PLN. Statistik PLN 2010; PLN: Jakarta, 2011.
196. PLN. Statistik PLN 2011; PLN: Jakarta, 2012.
197. Matthews, B.; Ross, L. Research Methods: A Practical Guide for the Social Sciences; Pearson Longman, 2010.
198. Jimenez, R.; Serebrisky, T.; Mercado, J. What does “better” mean? Perceptions of electricity and water services in Santo Domingo. Util. Policy 2016, 41, 15–21.
199. List, J.A.; Gallet, C.A. What Experimental Protocol Influence Disparities Between Actual and Hypothetical Stated Values? Environ. Resour. Econ. 2001, 20, 241–254.
200. Manikandan, S. Measures of central tendency: The mean. J. Pharmacol. Pharmacother. 2011, 2, 140–142.
201. Mathcentre. Variance and standard deviation (grouped data). Available online: http://www.mash.dept.shef.ac.uk/Resources/var_stand_deviat_group.pdf (accessed on Jan 18, 2021), 2003.
202. Aini, Z.; Krismadinata; Ganefri; Fudholi, A. Power system analysis course learning: A review. Int. J. Eng. Adv. Technol. 2019, 8.
203. Ministry of Energy and Mineral Resources. Minister of Energy and Mineral Resources Decree No. 18/2016 regarding Sumatra Electric Power System Regulation; Ministry of Energy and Mineral Resources: Jakarta, 2016.
204. DeCaria, J.E.; Montero-Odasso, M.; Wolfe, D.; Chesworth, B.M.; Petrella, R.J. The effect of intra-articular hyaluronic acid treatment on gait velocity in older knee osteoarthritis patients: A randomized, controlled study. Arch. Gerontol. Geriatr. 2012, 55, 310–315.
205. Štěrbová, V.; Kupka, J.; Thomas, J.; Lichnovský, J.; Andráš, P. Land snail assemblages of production forest in relation to selected environmental factors (HrabĚtice forest, Czech republic). In Proceedings of the International Multidisciplinary Scientific GeoConference on Surveying Geology and Mining Ecology Management, SGEM; Albena, Bulgaria, 2015; Vol. 2, pp. 295–299.
206. Stout Jr., W.A.; Tawney, B. An excel forecasting model to aid in decisionmaking that affects hospital resource/bed utilization-hospital capability to admit emergency room patients. In Proceedings of the Proceedings of the 2005 IEEE Systems and Information Engineering Design Symposium; Charlottesville, VA, USA, 2005; pp. 222–228.
207. Carlsson, F.; Martinsson, P. Willingness to pay among Swedish households to avoid power outages: A random parameter Tobit model approach. Energy J. 2007, 28, 75–89.
208. Kirubi, C.; Jacobson, A.; Kammen, D.M.; Mills, A. Community-Based Electric Micro-Grids Can Contribute to Rural Development: Evidence from Kenya. World Dev. 2009, 37, 1208–1221.

555225-L-sub01-bw-Kunaifi555225-L-sub01-bw-Kunaifi555225-L-sub01-bw-Kunaifi555225-L-sub01-bw-KunaifiProcessed on: 8-2-2021Processed on: 8-2-2021Processed on: 8-2-2021Processed on: 8-2-2021 PDF page: 212PDF page: 212PDF page: 212PDF page: 212
References
176
209. International Copper Association Southeast Asia. Power Quality Loss Survey Reportfor Indonesia; 2012.
210. Goel, L. A Comparison of Distribution System Reliability Indices for Different Operating Configurations. Electr. Mach. Power Syst. 1999, 27, 1029–1039.
211. Kunaifi; Reinders, A. Perceived and reported reliability of the electricity supply at three urban locations in Indonesia. Energies 2018.
212. Creutzig, F.; Agoston, P.; Goldschmidt, J.C.; Luderer, G.; Nemet, G.; Pietzcker, R.C. The underestimated potential of solar energy to mitigate climate change. Nat. Energy 2017, 2.
213. Ministry of Energy and Mineral Resources. Solar Energy in Indonesia: Potentials, Plannings and Framework Conditions; Berlin, 2012.
214. Elfani, M. The impact of renewable energy on employment in Indonesia. Int. J. Technol. 2011, 2, 47–55.
215. Kunaifi, K.; Reinders, A.H.M.E. Performance of a Remote Hybrid PV System Based on Real and Modelled Data in Indonesia. In Proceedings of the 35th European Photovoltaic Solar Energy Conference and Exhibition; Verlinden, P., Kenny, R., Helm, P., Eds.; WIP Renewable Energies: Brussels, 2018; pp. 2060–2065.
216. The International Electrotechnical Commission. IEC 61724-1: Photovoltaic system performance–Part 1: Monitoring. Available online: https://webstore.iec.ch/publication/33622 (accessed on Aug 20, 2019), 2017.
217. Meyer, E.L.; E. Ernest van Dyk Assessing the Reliability and Degradation of Photovoltaic Module Performance Parameters. IEEE Trans. Reliab. 2004, 53, 83–92.
218. John, J.J.; Alnuaimi, A.; Elnosh, A.; Stefancich, M.; Banda, P. Estimating degradation rates from 27 different PV modules installed in desert conditions using the NREL/Rdtools. In Proceedings of the 2018 IEEE 7th World Conference on Photovoltaic Energy Conversion, WCPEC 2018 - A Joint Conference of 45th IEEE PVSC, 28th PVSEC and 34th EU PVSEC; 2018; pp. 712–714.
219. Jordan, D.C.; Sarah R. Kurtz Photovoltaic degradation rates - An Analytical Review. Prog. Photovoltaics Res. Appl. 2013, 21, 12–29.
220. Setiawan, A.; Setiawan, E.A. Optimization of a Photovoltaic Power Plant in Indonesia with Proper Tilt Angle and Photovoltaic Type Using a System Advisor Model. Int. J. Technol. 2017, 8, 539–548.
221. Pryor, T.; Watt, M.; Watt, M. Australian-PV-System-Monitoring-Guideline-2013; 2013.
222. Jordan, D.C.; Deline, C.; Kurtz, S.R.; Kimball, G.M.; Anderson, M. Robust PV Degradation Methodology and Application. IEEE J. Photovoltaics 2018, 8, 525–531.
223. NREL. RdTools version 1.2.2. Available online: https://github.com/NREL/rdtools (accessed on Aug 20, 2019), 2018.
224. Hasselbrink, E.; Anderson, M.; Defreitas, Z.; Mikofski, M.; Shen, Y.C.; Caldwell, S.; Terao, A.; Kavulak, D.; Campeau, Z.; Degraaff, D. Validation of the PVLife model using 3 million module-years of live site data. Conf. Rec. IEEE Photovolt. Spec. Conf. 2013, 7–12.
225. Jordan, D.C.; Deceglie, M.G.; Kurtz, S.R. PV degradation methodology comparison - A basis for a standard. 2017 IEEE 44th Photovolt. Spec. Conf. PVSC 2017 2017, 1–6.
226. Kunaifi, K.; Reinders, A.H.M.E. Estimating the Technical Potential of Grid-Connected PV Systems in Indonesia: A Comparison of a Method Based on Open Access Data with a Method Based on GIS. In Proceedings of the 33rd European

555225-L-sub01-bw-Kunaifi555225-L-sub01-bw-Kunaifi555225-L-sub01-bw-Kunaifi555225-L-sub01-bw-KunaifiProcessed on: 8-2-2021Processed on: 8-2-2021Processed on: 8-2-2021Processed on: 8-2-2021 PDF page: 213PDF page: 213PDF page: 213PDF page: 213
References
177
Photovoltaic Solar Energy Conference and Exhibition; Smets, A., Taylor, N., Helm, P., Eds.; WIP Renewable Energies: Amsterdam, 2017; pp. 2652–2658.
227. Honrubia-Escribano, A.; Ramirez, F.J.; Gómez-Lázaro, E.; Garcia-Villaverde, P.M.; Ruiz-Ortega, M.J.; Parra-Requena, G. Influence of solar technology in the economic performance of PV power plants in Europe. A comprehensive analysis. Renew. Sustain. Energy Rev. 2018, 82, 488–501.
228. Del Cueto, J.A.; Rummel, S.; Kroposki, B.; Osterwald, C.; Anderberg, A. Stability of CIS/CIGS modules at the outdoor test facility over two decades. Conf. Rec. IEEE Photovolt. Spec. Conf. 2008.
229. Ingenhoven, P.; Belluardo, G.; Moser, D. Comparison of statistical and deterministic smoothing methods to reduce the uncertainty of performance loss rate estimates. IEEE J. Photovoltaics 2018, 8, 224–232.
230. Fouad, M.M.; Shihata, L.A.; Morgan, E.S.I. An integrated review of factors influencing the performance of photovoltaic panels. Renew. Sustain. Energy Rev. 2017, 80, 1499–1511.
231. Graaf, L.E. de; Weiden, T.C.J. van der Characteristics and performance of a PV-system consisting of 20 AC-modules. In Proceedings of the Conference Record of the IEEE Photovoltaic Specialists Conference; 1994; pp. 921–924.
232. Ingenhoven, P.; Belluardo, G.; Makrides, G.; Georghiou, G.E.; Rodden, P.; Frearson, L.; Herteleer, B.; Bertani, D.; Moser, D. Analysis of Photovoltaic Performance Loss Rates of Six Module Types in Five Geographical Locations. In Proceedings of the IEEE Journal of Photovoltaics; IEEE, 2019; Vol. 9, pp. 1091–1096.
233. Jordan, D.C.; Kurtz, S.R.; VanSant, K.; Newmiller, J. Compendium of photovoltaic degradation rates. Prog. Photovoltaics 2016, 24, 978–989.
234. Makrides, G.; Zinsser, B.; Schubert, M.; Georghiou, G.E. Performance loss rate of twelve photovoltaic technologies under field conditions using statistical techniques. Sol. Energy 2014, 103, 28–42.
235. Larrivee, J. An analysis of degradation rates of PV power plants at the system level [M.Sc Thesis], Utrecht University, 2013.
236. Sharma, V.; Chandel, S.S. A novel study for determining early life degradation of multi-crystalline-silicon photovoltaic modules observed in western Himalayan Indian climatic conditions. Sol. Energy 2016, 134, 32–44.
237. Limmanee, A.; Udomdachanut, N.; Songtrai, S.; Kaewniyompanit, S.; Sato, Y.; Nakaishi, M.; Kittisontirak, S.; Sriprapha, K.; Sakamoto, Y. Field performance and degradation rates of different types of photovoltaic modules: A case study in Thailand. Renew. Energy 2016, 89, 12–17.
238. Hyndman, R.J.; Athanasopoulos, G. Forecasting: principles and practice; OTexts, 2013;
239. Carr, A.J.; Pryor, T.L. A comparison of the performance of different PV module types in temperate climates. Sol. Energy 2004.
240. Phinikarides, A.; Makrides, G.; Zinsser, B.; Schubert, M.; Georghiou, G.E. Analysis of photovoltaic system performance time series: Seasonality and performance loss. Renew. Energy 2015, 77, 51–63.
241. Mills, T.C. Applied Time Series Analysis: A Practical Guide to Modeling and Forecasting; Elsevier: London, 2019;
242. Phinikarides, A.; Philippou, N.; Makrides, G.; Georghiou, G.E. Performance loss rates of different photovoltaic technologies after eight years of operation under warm climate conditions. Proc. 29th EU-PVSEC Conf. 2014, 2664–2668.
555225-L-sub01-bw-Kunaifi555225-L-sub01-bw-Kunaifi555225-L-sub01-bw-Kunaifi555225-L-sub01-bw-KunaifiProcessed on: 8-2-2021Processed on: 8-2-2021Processed on: 8-2-2021Processed on: 8-2-2021 PDF page: 214PDF page: 214PDF page: 214PDF page: 214
References
178
243. Cleveland, R.B.; Cleveland, W.S.; McRae, J.E.; Terpenning, I. STL: A Seasonal-Trend Decomposition Procedure Based on Loss. J. Off. Stat. 1990.
244. Lindig, S.; Kaaya, I.; Weis, K.A.; Moser, D.; Topic, M. Review of statistical and analytical degradation models for photovoltaic modules and systems as well as related improvements. IEEE J. Photovoltaics 2018, 8, 1773–1786.
245. Srivastava, R.; Tiwari, A.N.; Giri, V.K. An overview on performance of PV plants commissioned at different places in the world. Energy Sustain. Dev. 2020, 54, 51–59.
246. Elibol, E.; Özmen, Ö.T.; Tutkun, N.; Köysal, O. Outdoor performance analysis of different PV panel types. Renew. Sustain. Energy Rev. 2017, 67, 651–661.
247. Li, C.; Zhou, D.; Zheng, Y. Techno-economic comparative study of grid-connected PV power systems in five climate zones, China. Energy 2018, 165, 1352–1369.
248. Oda, K.; Hakuta, K.; Nozaki, Y.; Ueda, Y. Characteristics evaluation of various types of PV modules in Japan and U.S. In Proceedings of the 2016 IEEE International Conference on Renewable Energy Research and Applications (ICRERA); Birmingham, UK, 2016.
249. Leloux, J.; Taylor, J.; Moretón, R.; Narvarte, L.; Trebosc, D.; Desportes, A.; Solar, S. Monitoring 30 ,000 PV systems in Europe : Performance , Faults, and State of the Art. 31st Eur. Photovolt. Sol. Energy Conf. Exhib. 2015, 1574–1582.
250. Haghdadi, N.; Copper, J.; Bruce, A.; Macgill, I. Operational performance analysis of distributed PV systems in Australia. Asia-pacific Sol. Res. Conf. 2016.
251. Burhan, M.; Ernest, C.K.J.; Choon, N.K. Electrical Rating of Concentrated Photovoltaic (CPV) Systems: Long-Term Performance Analysis and Comparison to Conventional PV Systems. Int. J. Technol. 2016, 2, 189–196.
252. Limmanee, A.; Songtrai, S.; Udomdachanut, N.; Keawniyompanit, S.; Sato, Y.; Nakaishi, M.; Kittisontirak, S.; Sriprapha, K.; Sakamoto, Y. Comparison of Photovoltaic Degradation Rates in Tropical Climate Derived from Different Calculation Methods. 2018 IEEE 7th World Conf. Photovolt. Energy Conversion, WCPEC 2018 - A Jt. Conf. 45th IEEE PVSC, 28th PVSEC 34th EU PVSEC 2018, 735–738.
253. Lindig, S.; Moser, D.; Curran, A.J.; French, R.H. Performance Loss Rates of PV systems of Task 13 database. Proceeding IEEE PVSC Chicago 2019, 2019.
254. Kiefer, K.; Farnung, B.; Müller, B. Degradation in PV Power Plants: Theory and Practice. In Proceedings of the 36th European PV Solar Energy Conference and Exhibition; 2018; pp. 9–13.
255. Kyprianou, A.; Phinikarides, A.; Makrides, G.; Georghiou, G.E. Definition and Computation of the Degradation Rates of Photovoltaic Systems of Different Technologies With Robust Principal Component Analysis. IEEE J. Photovoltaics 2015, 5, 1698–1705.
256. Phinikarides, A.; Makrides, G.; Georghiou, G.E. Estimation of annual performance loss rates of grid-connected photovoltaic systems using time series analysis and validation through indoor testing at standard test conditions. 2015 IEEE 42nd Photovolt. Spec. Conf. PVSC 2015 2015, 1–5.
257. Belluardo, G.; Ingenhoven, P.; Sparber, W.; Wagner, J.; Weihs, P.; Moser, D. Novel method for the improvement in the evaluation of outdoor performance loss rate in different PV technologies and comparison with two other methods. Sol. Energy 2015, 117, 139–152.
258. Kunaifi, K.; Reinders, A.; Kaharudin, D.; Harmanto, A.; Mudiarto, K. A Comparative Performance Analysis of A 1 MW CIS PV System and a 5 kW Crystalline-Si PV

555225-L-sub01-bw-Kunaifi555225-L-sub01-bw-Kunaifi555225-L-sub01-bw-Kunaifi555225-L-sub01-bw-KunaifiProcessed on: 8-2-2021Processed on: 8-2-2021Processed on: 8-2-2021Processed on: 8-2-2021 PDF page: 215PDF page: 215PDF page: 215PDF page: 215
References
179
System under the Tropical Climate of Indonesia. Int. J. Technol. 2019, 10, 1082–1092.
259. Kumar, M.; Kumar, A. Performance assessment and degradation analysis of solar photovoltaic technologies: A review. Renew. Sustain. Energy Rev. 2017, 78, 554–587.
260. Ye, J.Y.; Reindl, T.; Aberle, A.G.; Walsh, T.M. Performance Degradation of Various PV Module Technologies in Tropical Singapore. IEEE J. Photovoltaics 2014, 4, 1288–1294.
261. Phinikarides, A.; Makrides, G.; Kindyni, N.; Georghiou, G.E. Comparison of trend extraction methods for calculating performance loss rates of different photovoltaic technologies. 2014 IEEE 40th Photovolt. Spec. Conf. PVSC 2014 2014, 3211–3215.
262. Lave, M.; Hayes, W.; Pohl, A.; Hansen, C.W. Evaluation of Global Horizontal Irradiance to Plane-of-Array Irradiance Models at Locations Across the United States. IEEE J. Photovoltaics 2015, 5, 597–606.
263. d-maps.com. Map World (Pacific ocean in the center): states. Available online: https://d-maps.com/pays.php?num_pay=275&lang=en (accessed on Aug 20, 2019), 2020.
264. Erbs, D.G.; Klein, S.A.; Duffie, J.A. Estimation of the diffuse radiation fraction for hourly, daily and monthly-average global radiation. Sol. Energy 1982, 28, 293–302.
265. Gul, M.; Kotak, Y.; Muneer, T.; Ivanova, S. Enhancement of albedo for solar energy gain with particular emphasis on overcast skies. Energies 2018, 11, 1–17.
266. Hottel, H.C.; Woertz, B.B. Evaluation of flat-plate solar heat collector. Trans. ASME 1942, 64.
267. Sandia National Laboratories. Sandia Module Temperature Model. Available online: https://pvpmc.sandia.gov/modeling-steps/2-dc-module-iv/module-temperature/sandia-module-temperature-model/ (accessed on Aug 20, 2019), 2020.
268. Holmgren, W.F.; Hansen, C.W.; Mikofski, M.A. PVLIB Python: a Python Package for Modeling Solar Energy Systems. J. Open Source Softw. 2018.
269. Huld, T.; Müller, R.; Gambardella, A. A new solar radiation database for estimating PV performance in Europe and Africa. Sol. Energy 2012, 86, 1803–1815.
270. Beck, H.E.; Zimmermann, N.E.; McVicar, T.R.; Vergopolan, N.; Berg, A.; Wood, E.F. Present and future köppen-geiger climate classification maps at 1-km resolution. Sci. Data 2018, 5, 1–12.
271. Kottek, M.; Grieser, J.; Beck, C.; Rudolf, B.; Rubel, F. World Map of the Köppen-Geiger climate classification updated. Meteorol. Zeitschrift 2006, 15, 259–263.
272. Fthenakis, V.; Yu, Y. Analysis of the potential for a heat island effect in large solar farms. In Proceedings of the IEEE 39th Photovoltaic Specialists Conference (PVSC); IEEE, 2013; pp. 3362–3366.
273. Dierauf, T.; Growitz, A.; Kurtz, S.; Cruz, J.L.B.; Riley, E.; Hansen, C. Weather-Corrected Performance Ratio; 2013.
274. Singh, R.; Sharma, M.; Rawat, R.; Banerjee, C. Field Analysis of three different silicon-based Technologies in Composite Climate Condition – Part II – Seasonal assessment and performance degradation rates using statistical tools. Renew. Energy 2020, 147, 2102–2117.
275. Montague, J. stldecompose 0.0.5. Available online: https://pypi.org/project/stldecompose/ (accessed on Dec 20, 2019), 2019.
555225-L-sub01-bw-Kunaifi555225-L-sub01-bw-Kunaifi555225-L-sub01-bw-Kunaifi555225-L-sub01-bw-KunaifiProcessed on: 8-2-2021Processed on: 8-2-2021Processed on: 8-2-2021Processed on: 8-2-2021 PDF page: 216PDF page: 216PDF page: 216PDF page: 216
References
180
276. NREL. PVWatts Calculator. Available online: https://pvwatts.nrel.gov/ (accessed on Dec 20, 2019), 2019.
277. Meyers, B.; Deceglie, M.; Deline, C.; Jordan, D. Signal Processing on PV Time-Series Data: Robust Degradation Analysis Without Physical Models. IEEE J. Photovoltaics 2020, 10, 546–553.
278. Indonesia Investment Coordinating Board. Investing in Indonesia’s Hydro Energy sector: An overview of opportunities, capabilities and provisions. Available online: https://indonesien.um.dk/~/media/indonesien/tc/sector reports eu-indo/energy/2015 tcf sector propositions hydroenergy.pdf?la=en#:~:text=Not only it is the,hydro potential is currently utilized. (accessed on Sep 22, 2020), 2015.
279. Sugiyono, A.; Nurrohim, A. Prospect of Biomass Energy for Electricity Generation in Indonesia. J. Ilm. Teknol. Energi 2012.
280. Veldhuis, A.J.; Reinders, A.H.M.E. Reviewing the potential and cost-effectiveness of grid-connected solar PV in Indonesia on a provincial level. Renew. Sustain. Energy Rev. 2013, 27, 315–324.
555225-L-sub01-bw-Kunaifi555225-L-sub01-bw-Kunaifi555225-L-sub01-bw-Kunaifi555225-L-sub01-bw-KunaifiProcessed on: 8-2-2021Processed on: 8-2-2021Processed on: 8-2-2021Processed on: 8-2-2021 PDF page: 217PDF page: 217PDF page: 217PDF page: 217
References
181
281. International Electrotechnical Commission. IEC 60904-3:2019: Photovoltaic devices - Part 3: Measurement principles for terrestrial photovoltaic (PV) solar devices with reference spectral irradiance data; International Electrotechnical Commission: Geneva, 2019.
282. W. H. Cai, D.; Adlakha, S.; Low, S.H.; Martini, P. De; Chandy, K.M. Impact of residential PV adoption on Retail Electricity Rates. Energy Policy 2013, 62, 830–843.
283. Nijkamp, P.; Perrels, A. Impacts of electricity rates on industrial location. Energy Econ. 1998, 10, 107–116.

555225-L-sub01-bw-Kunaifi555225-L-sub01-bw-Kunaifi555225-L-sub01-bw-Kunaifi555225-L-sub01-bw-KunaifiProcessed on: 8-2-2021Processed on: 8-2-2021Processed on: 8-2-2021Processed on: 8-2-2021 PDF page: 218PDF page: 218PDF page: 218PDF page: 218
References
182
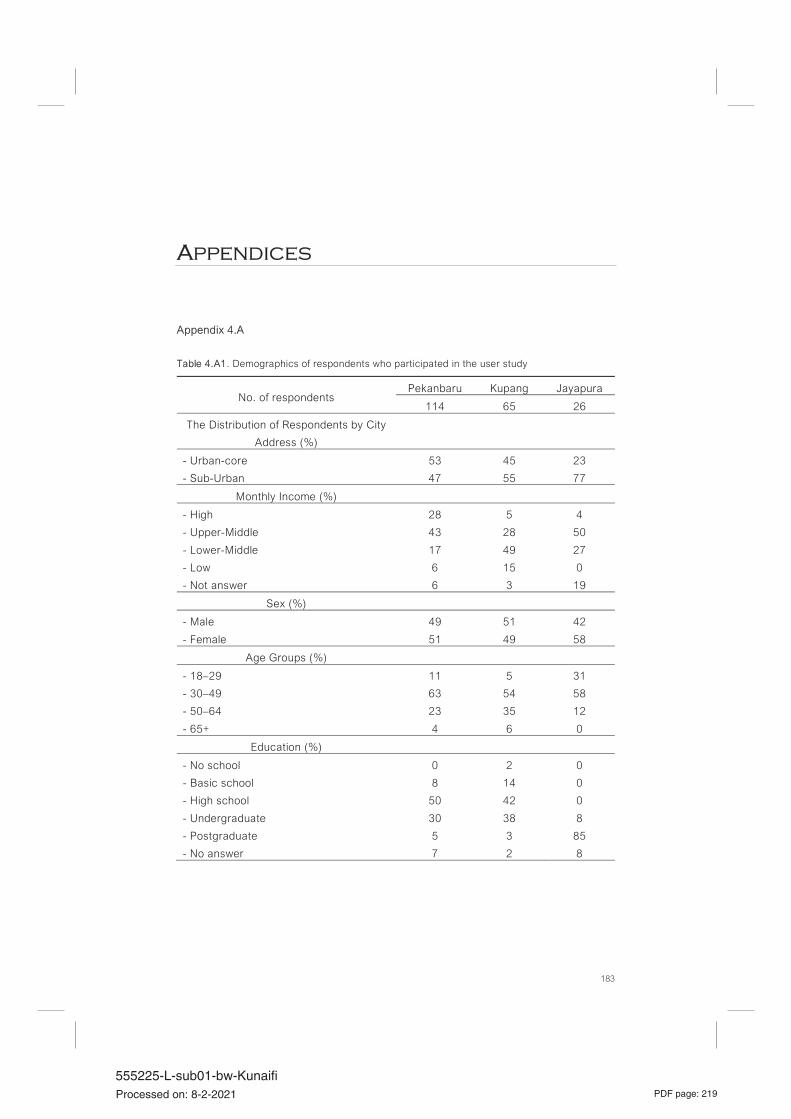
555225-L-sub01-bw-Kunaifi555225-L-sub01-bw-Kunaifi555225-L-sub01-bw-Kunaifi555225-L-sub01-bw-KunaifiProcessed on: 8-2-2021Processed on: 8-2-2021Processed on: 8-2-2021Processed on: 8-2-2021 PDF page: 219PDF page: 219PDF page: 219PDF page: 219
183
AAppendices
Appendix 4.A
Table 4.A1. Demographics of respondents who participated in the user study
No. of respondents Pekanbaru Kupang Jayapura
114 65 26
The Distribution of Respondents by City
Address (%)
- Urban-core 53 45 23
- Sub-Urban 47 55 77
Monthly Income (%)
- High 28 5 4
- Upper-Middle 43 28 50
- Lower-Middle 17 49 27
- Low 6 15 0
- Not answer 6 3 19
Sex (%)
- Male 49 51 42
- Female 51 49 58
Age Groups (%)
- 18–29 11 5 31
- 30–49 63 54 58
- 50–64 23 35 12
- 65+ 4 6 0
Education (%)
- No school 0 2 0
- Basic school 8 14 0
- High school 50 42 0
- Undergraduate 30 38 8
- Postgraduate 5 3 85
- No answer 7 2 8

555225-L-sub01-bw-Kunaifi555225-L-sub01-bw-Kunaifi555225-L-sub01-bw-Kunaifi555225-L-sub01-bw-KunaifiProcessed on: 8-2-2021Processed on: 8-2-2021Processed on: 8-2-2021Processed on: 8-2-2021 PDF page: 220PDF page: 220PDF page: 220PDF page: 220
Appendices
184
AAppendix 4.B
The survey sheet (English-translated).
A. General Information
Respondent Information
Income group : ET/EM/ES/ER (to be filled by the surveyor)
Sex : M/F (circle an answer)
Age : _______________________________ years
Occupation : ___________________________________
Education : No formal school/Primary/Junior H./
Senior H./Diploma/UG/M/PhD (circle an answer)
Marital status : Nor married/Married/Widow (circle an answer)
Ethnic group : ___________________________________
Address : Village : _______________________
District : _______________________
Regency/City : _______________________
Province : _______________________
Confidentiality
Your personal information will be kept confidential and be treated based on standard
practice. You can also mention below if there are other information you will provide that
you would like to be confidential as well.
__________________________________________________________________
__________________________________________________________________
__________________________________________________________________
Signature___________________
B. Questions
Please circle (O) on the most proper answers.
1. Would you accept an increase in your electricity bill for better electricity service?
a. Yes
b. No
2. How much increase in your electricity bill would you find acceptable?
a. 10%–30%
b. 30%–50%
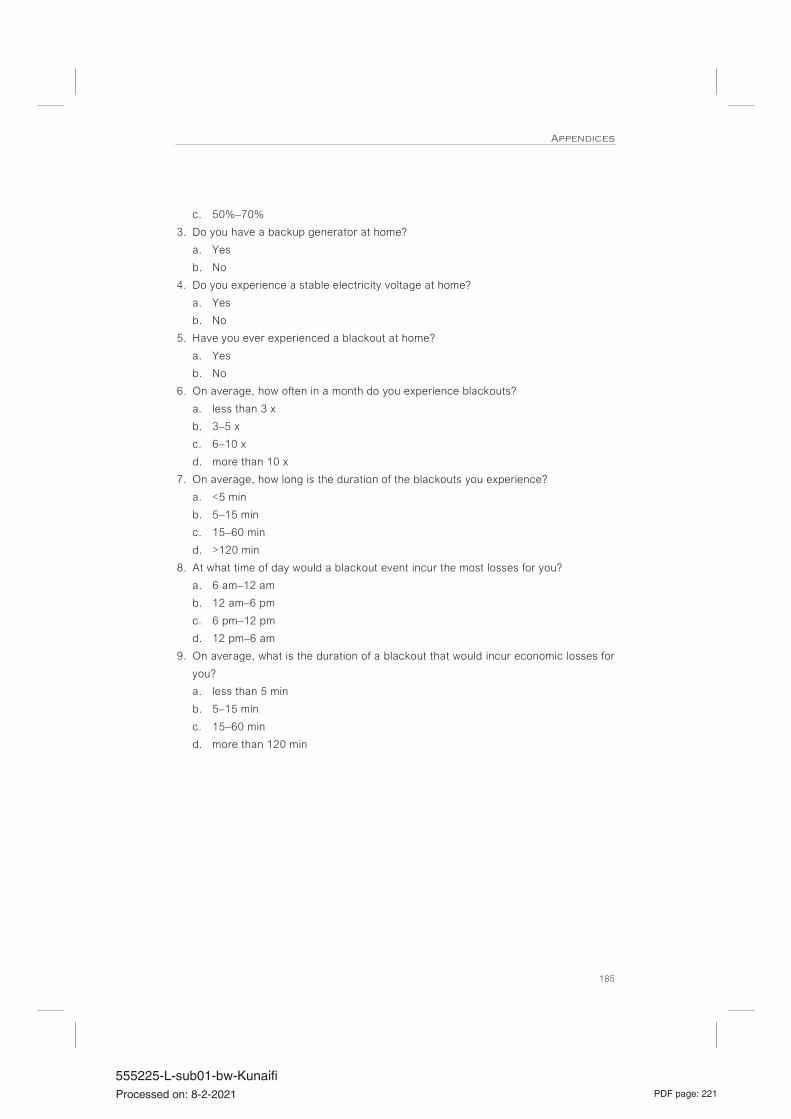
555225-L-sub01-bw-Kunaifi555225-L-sub01-bw-Kunaifi555225-L-sub01-bw-Kunaifi555225-L-sub01-bw-KunaifiProcessed on: 8-2-2021Processed on: 8-2-2021Processed on: 8-2-2021Processed on: 8-2-2021 PDF page: 221PDF page: 221PDF page: 221PDF page: 221
Appendices
185
c. 50%–70%
3. Do you have a backup generator at home?
a. Yes
b. No
4. Do you experience a stable electricity voltage at home?
a. Yes
b. No
5. Have you ever experienced a blackout at home?
a. Yes
b. No
6. On average, how often in a month do you experience blackouts?
a. less than 3 x
b. 3–5 x
c. 6–10 x
d. more than 10 x
7. On average, how long is the duration of the blackouts you experience?
a. <5 min
b. 5–15 min
c. 15–60 min
d. >120 min
8. At what time of day would a blackout event incur the most losses for you?
a. 6 am–12 am
b. 12 am–6 pm
c. 6 pm–12 pm
d. 12 pm–6 am
9. On average, what is the duration of a blackout that would incur economic losses for
you?
a. less than 5 min
b. 5–15 min
c. 15–60 min
d. more than 120 min

555225-L-sub01-bw-Kunaifi555225-L-sub01-bw-Kunaifi555225-L-sub01-bw-Kunaifi555225-L-sub01-bw-KunaifiProcessed on: 8-2-2021Processed on: 8-2-2021Processed on: 8-2-2021Processed on: 8-2-2021 PDF page: 222PDF page: 222PDF page: 222PDF page: 222
Ap
pe
nd
ic
es
18
6
AAp
pen
dix
4.C
Ta
ble
4.A
2.
Th
e p
rop
ort
ion
of
resp
on
de
nts’
an
swe
rs t
o su
rve
y q
uest
ions
, in
pe
rce
nta
ges
.
Que
stio
n 1
W
oul
d y
ou
acc
ep
t a
n in
crea
se in
yo
ur e
lect
rici
ty b
ill f
or
be
tter
ele
ctri
city
ser
vice
?
Ans
wer
Yes
N
o
NA
P
K
J P
K
J
P
K
J
56
6
8
58
3
5
31
3
8
9
2
4
Que
stio
n 2
H
ow
mu
ch in
cre
ase
in y
ou
r e
lect
rici
ty b
ill w
ou
ld y
ou
find
acc
epta
ble
?
Ans
wer
10
%–3
0%
3
0%
–50
%
50
%–7
0%
N
A
P
K
J P
K
J
P
K
J P
K
J
89
5
5
50
7
0
0
0
0
0
4
4
5
50
Que
stio
n 3
D
o y
ou
have
a b
ack
up g
ene
rato
r a
t ho
me?
Ans
wer
Yes
N
o
NA
P
K
J P
K
J
P
K
J
21
1
4
65
6
7
83
2
7
12
3
8
Que
stio
n 4
D
o y
ou
exp
erie
nce
a s
tab
le e
lect
rici
ty v
olta
ge
at
hom
e?
Ans
wer
Yes
N
o N
A
P
K
J P
K
J
P
K
J
82
4
9
50
1
1
48
4
2
8
3
8
Que
stio
n 5
H
ave
you
eve
r e
xper
ienc
ed a
bla
cko
ut
at
hom
e?
Ans
wer
Yes
N
o N
A
P
K
J P
K
J
P
K
J
89
9
7
85
2
0
8
1
0
3
8
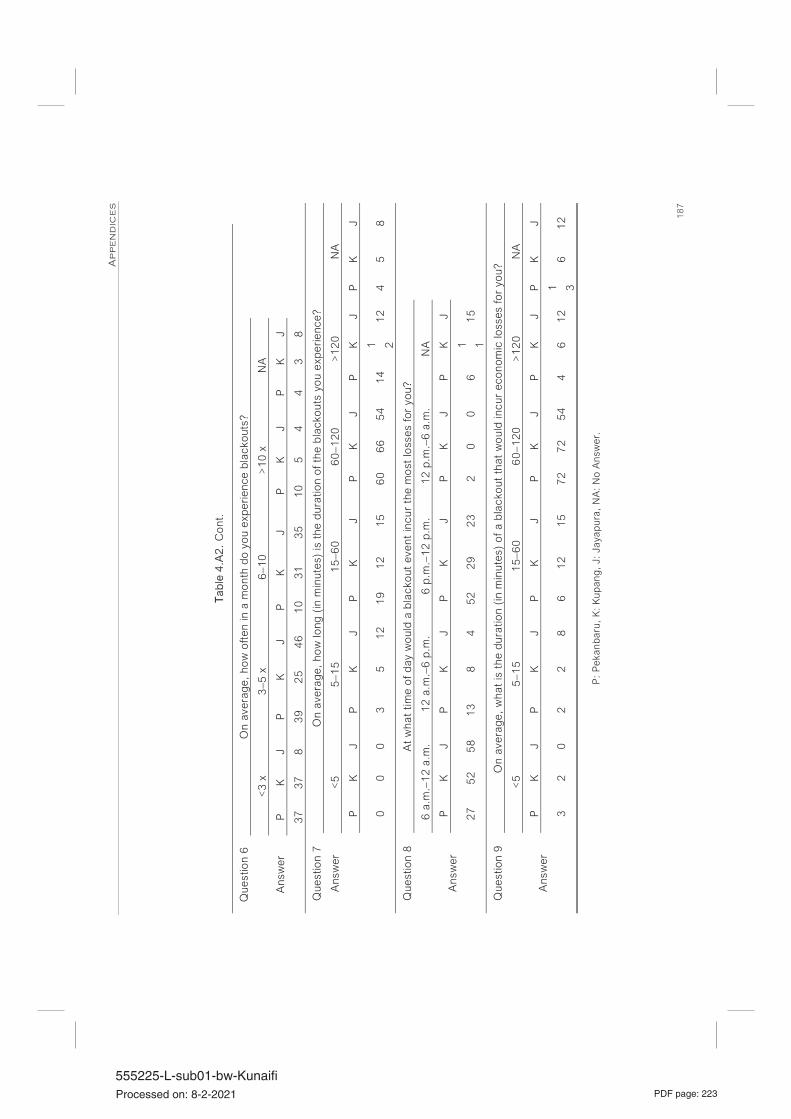
555225-L-sub01-bw-Kunaifi555225-L-sub01-bw-Kunaifi555225-L-sub01-bw-Kunaifi555225-L-sub01-bw-KunaifiProcessed on: 8-2-2021Processed on: 8-2-2021Processed on: 8-2-2021Processed on: 8-2-2021 PDF page: 223PDF page: 223PDF page: 223PDF page: 223
Ap
pe
nd
ic
es
18
7
TTa
ble
4.A
2.
Co
nt.
Que
stio
n 6
O
n a
vera
ge
, ho
w o
ften
in a
mo
nth
do
yo
u e
xpe
rie
nce
bla
cko
uts?
Ans
wer
<3
x
3–5
x
6–1
0
>1
0 x
N
A
P
K
J P
K
J
P
K
J P
K
J
P
K
J
37
3
7
8
39
2
5
46
1
0
31
3
5
10
5
4
4
3
8
Que
stio
n 7
O
n av
erag
e, h
ow
long
(in
min
ute
s) is
th
e d
ura
tion
of
the
bla
cko
uts
yo
u e
xper
ienc
e?
Ans
wer
<
5
5–1
5
15
–60
6
0–1
20
>
12
0
NA
P
K
J
P
K
J P
K
J
P
K
J P
K
J
P
K
J
0
0
0
3
5
12
1
9
12
1
5
60
6
6
54
1
4
1 2
12
4
5
8
Que
stio
n 8
A
t w
hat
time
of
day
wo
uld
a b
lack
out
eve
nt
incu
r th
e m
ost
loss
es f
or
you?
Ans
wer
6 a
.m.–
12
a.m
. 1
2 a
.m.–
6 p
.m.
6 p
.m.–
12
p.m
. 1
2 p
.m.–
6 a
.m.
NA
P
K
J P
K
J
P
K
J P
K
J
P
K
J
27
5
2
58
1
3
8
4
52
2
9
23
2
0
0
6
1 1
1
5
Que
stio
n 9
O
n a
vera
ge
, w
hat
is t
he
du
ratio
n (i
n m
inu
tes)
of
a b
lack
out
th
at w
ou
ld in
cur
eco
no
mic
loss
es f
or
you?
Ans
wer
<5
5
–15
1
5–6
0
60
–12
0
>1
20
N
A
P
K
J P
K
J
P
K
J P
K
J
P
K
J P
K
J
3
2
0
2
2
8
6
12
1
5
72
7
2
54
4
6
1
2
1 3
6
12
P:
Pek
an
ba
ru,
K:
Ku
pa
ng
, J:
Ja
yap
ura
, N
A:
No
An
swe
r.

555225-L-sub01-bw-Kunaifi555225-L-sub01-bw-Kunaifi555225-L-sub01-bw-Kunaifi555225-L-sub01-bw-KunaifiProcessed on: 8-2-2021Processed on: 8-2-2021Processed on: 8-2-2021Processed on: 8-2-2021 PDF page: 224PDF page: 224PDF page: 224PDF page: 224
Ap
pe
nd
ic
es
18
8
AAp
pen
dix
7.A
Ta
ble
7.A
1.
Th
e co
mp
lete
per
form
anc
e m
atri
ces
of
the
PV
sys
tem
s.
No
. C
ity
Clim
ate
Tec
hno
log
y P
R
PR
stc
. P
Ran
n.
PLR
(%/y
ear)
Yo
Y
PL
R (
%/y
ear)
ST
L
Se
nsor
C
lear
Sky
R
ela
tive
1
Alic
e S
pri
ngs
BW
h
a-S
i 0
.78
± 0
.05
0
.82
± 0
.05
0
.78
± 0
.05
−1
.63
−1
.22
−1
.58
2
Alic
e S
pri
ngs
BW
h
HIT
0
.86
± 0
.04
0
.91
± 0
.03
0
.86
± 0
.03
−1
.07
−0
.12
−1
.01
3
Alic
e S
pri
ngs
BW
h
CIG
S
0.8
8 ±
0.0
4
0.9
6 ±
0.0
3
0.8
8 ±
0.0
3
−1.2
0
−0.1
7
−0.8
0
4
Alic
e S
pri
ngs
BW
h
mo
no-
Si
0.7
9 ±
0.0
3
0.8
6 ±
0.0
2
0.7
9 ±
0.0
2
−0.9
1
−0.1
9
−0.8
0
5
Alic
e S
pri
ngs
BW
h
mo
no-
Si
0.7
6 ±
0.0
4
0.8
5 ±
0.0
2
0.7
6 ±
0.0
2
−0.5
0
+0
.29
−0
.41
6
Alic
e S
pri
ngs
BW
h
mo
no-
Si
0.7
9 ±
0.0
5
0.8
7 ±
0.0
5
0.7
9 ±
0.0
4
−1.6
2
−0.9
3
−1.3
0
7
Alic
e S
pri
ngs
BW
h
Cd
Te
0.7
6 ±
0.0
5
0.8
0 ±
0.0
5
0.7
6 ±
0.0
5
−1.8
5
−1.5
5
−2.2
0
8
Alic
e S
pri
ngs
BW
h
Cd
Te
0.8
4 ±
0.0
3
0.8
8 ±
0.0
3
0.8
4 ±
0.0
3
−1.1
0
−0.3
2
−0.9
5
9
Alic
e S
pri
ngs
BW
h
Cd
Te
0.8
7 ±
0.0
3
0.9
2 ±
0.0
2
0.8
7 ±
0.0
2
−1.1
9
−0.6
0
−0.3
8
10
A
lice
Sp
ring
s B
Wh
p-S
i 0
.86
± 0
.03
0
.95
± 0
.01
0
.86
± 0
.01
−0
.47
+
0.3
3
−0.1
9
11
A
lice
Sp
ring
s B
Wh
p-S
i 0
.78
± 0
.04
0
.94
± 0
.03
0
.78
± 0
.02
−1
.12
−0
.36
−0
.97
12
A
lice
Sp
ring
s B
Wh
p-S
i 0
.78
± 0
.03
0
.87
± 0
.02
0
.78
± 0
.02
−0
.64
+
0.0
9
−0.5
6
13
C
irat
a A
f p
-Si
0.8
1 ±
0.0
3
0.9
0 ±
0.0
3
0.8
1 ±
0.0
3
n.a
n.a.
−0
.60
14
P
eka
nba
ru
Af
p-S
i 0
.85
± 0
.02
0
.93
± 0
.02
0
.85
± 0
.02
−1
.60
−1
.29
−0
.62
15
B
olz
ano
C
fb
p-S
i 0
.84
± 0
.04
0
.89
± 0
.03
0
.84
± 0
.03
−0
.80
−1
.41
−0
.77

555225-L-sub01-bw-Kunaifi555225-L-sub01-bw-Kunaifi555225-L-sub01-bw-Kunaifi555225-L-sub01-bw-KunaifiProcessed on: 8-2-2021Processed on: 8-2-2021Processed on: 8-2-2021Processed on: 8-2-2021 PDF page: 225PDF page: 225PDF page: 225PDF page: 225
189
AAbout the Author
Kunaifi is an academic and consultant in sustainable
energy.
His first teaching experience began at the Department
of Electrical Engineering UIN Sultan Syarif Kasim Riau
University, Indonesia, 17 years ago with some general
electrical engineering (EE) courses. Since 2010, he focuses
his teaching on energy-related courses such as Renewable
Energy System Design and Energy & Sustainable
Development. He enjoys interactions with students outside lecture hours. The EE
students kindly gave me the Best Lecturer Award in 2012.
His first research experience was on the topic of biomass energy. Then, he works
more on solar photovoltaic applications and hybrid power systems. Kunaifi co-founded
the Energy Research Group (EnReach) in 2011 and became its first Chair of Boards for
5 years. With EnReach, he led and involved in energy consulting projects, mostly funded
by Europeans and Indonesian institutions.
His B.Eng. in Electronics was finished in 2001 from STTNAS, a technical university
in Indonesia (self-funded). Being an environmentalist, his passion changed. In 2008, he
got a Postgraduate Diploma (PgDip) in Energy Studies (EnSt), and in 2009 he completed
a Master of Science (M.Sc.) in Renewable Energy, both from Murdoch University in
Western Australia (funded by AusAid). The same passion remained. He took a Ph.D.
position in solar photovoltaic systems at the University of Twente (funded by LPDP).
Kunaifi likes traveling to rural areas and eager to visit more villages, remote islands,
and developing countries as he did before. Spending time with local people is always a
meaningful and joyful experience for him.
Kunaifi and his wife, Murparsaulian, are raising two great boys, Zia Alkhair Nailian
and Abhivandya Abdullah Nailian.
555225-L-sub01-bw-Kunaifi555225-L-sub01-bw-Kunaifi555225-L-sub01-bw-Kunaifi555225-L-sub01-bw-KunaifiProcessed on: 8-2-2021Processed on: 8-2-2021Processed on: 8-2-2021Processed on: 8-2-2021 PDF page: 226PDF page: 226PDF page: 226PDF page: 226
190
PPublications
During the Ph.D. project presented in this thesis, the following publications were generated by the author for an international audience.
Journal contributions
Kunaifi, K. and Reinders, A.H.M.E., Perceived and Reported Reliability of the Electricity Supply at Three Urban Locations in Indonesia. Energies 11, 140, 2018.
Kunaifi, K., Reinders, A.H.M.E., Kaharudin, D., Harmanto, A., Mudiarto, K ., A Comparative Performance Analysis of a 1 MW CIS PV System and a 5 kW Crystalline-Si PV System under the Tropical Climate of Indonesia. International Journal of Technology 10, 6, 2019.
Kunaifi, K., Reinders, A.H.M.E., Lindig, S., Jaeger, M., Moser, D., Operational Performance and Degradation of PV Systems Consisting of Six Technologies in Three Climates. Applied Sciences 10, 16, 2020.
Book contribution
Kunaifi, K., Veldhuis, A.J., and Reinders, A.H.M.E., The Electricity Grid in Indonesia: The Experiences of End-users and their Attitudes Toward Solar Photovoltaics. Hardback book, ISBN 978-3-030-38342-8, Springer Nature Switzerland AG, 2020.
Conference contributions
Kunaifi, K., Reinders, A.H.M.E., Kaharudin, D., Harmanto, A., Mudiarto, K. A Comparative Performance Analysis of a 1 MWatt CIS PV System and a 5 kWatt Crystalline-Si PV System under the Tropical Climate of Indonesia. In: International Tropical Renewable Energy Conference (i-TREC). The Faculty of Engineering Universitas Indonesia and co-hosted by the Faculty of Engineering Chulalongkorn University, Bali, Indonesia (14-16 August 2019).
Kunaifi, K., Reinders, A.H.M.E. Performance of CIS and c-Si photovoltaic systems in tropical climate of Indonesia. In: COST Action PEARL PV Workshop. COST Action PEARL PV, Lisbon, Portugal (26-28 February 2019).

555225-L-sub01-bw-Kunaifi555225-L-sub01-bw-Kunaifi555225-L-sub01-bw-Kunaifi555225-L-sub01-bw-KunaifiProcessed on: 8-2-2021Processed on: 8-2-2021Processed on: 8-2-2021Processed on: 8-2-2021 PDF page: 227PDF page: 227PDF page: 227PDF page: 227
Publications
191
Kunaifi, K., Reinders, A.H.M.E. Performance of a Remote Hybrid PV System based on Real and Modelled Data. In: 35th European Photovoltaic Solar Energy Conference and Exhibition. WIP Renewable Energies, Brussels, Belgium (24-18 September 2018). pp. 2060–2065.
Kunaifi, K. Stand-alone Hybrid Power Supply Option for a Remote Island in Indonesia. In: Workshop on Sustainable Islands. ARISE Symposium, Enschede, The Netherlands. (31 May 2018)
Kunaifi, K., Reinders, A.H.M.E. Estimating the Technical Potential of Grid-connected PV Systems in Indonesia: A Comparison of a Method based on Open Access Data with a Method based on GIS. In: 33rd European Photovoltaic Solar Energy Conference and Exhibition. WIP Renewable Energies, Amsterdam, The Netherlands (25-29 September 2017). pp. 2652–2658.
Kunaifi, K. User Experiences with the Reliability of Electricity Supply in Indonesia. In: Workshop on Sustainable Islands. ARISE and RARCC, Kri Island, Indonesia (15-22 October 2017).
Kunaifi, K., Reinders, A.H.M.E. Opportunities for Photovoltaic Solar Energy Systems in Indonesia. Poster presented in: Sunday Conference. Holland Solar, Eindhoven, The Netherlands (23 November 2016).

555225-L-sub01-bw-Kunaifi555225-L-sub01-bw-Kunaifi555225-L-sub01-bw-Kunaifi555225-L-sub01-bw-KunaifiProcessed on: 8-2-2021Processed on: 8-2-2021Processed on: 8-2-2021Processed on: 8-2-2021 PDF page: 228PDF page: 228PDF page: 228PDF page: 228
Copyright © 2022 FDOKUMEN


![355 Motion ol Thanks on [ RAJYA SABHA ] President's Address 356 ...](https://static.fdokumen.com/doc/165x107/633d6a0483491b55fb06ff79/355-motion-ol-thanks-on-rajya-sabha-presidents-address-356-.jpg)


![INSTALL GUIDE OL-NI(RS)-NI5-[OL-RS-NI5]-EN - iDatalink](https://static.fdokumen.com/doc/165x107/633aa8bc006fce433007d856/install-guide-ol-nirs-ni5-ol-rs-ni5-en-idatalink.jpg)