Solar disinfection of drinking water contained in transparent plastic bottles : characterizing the...
11
Journal of Applied Microbiology 1998, 84, 1138–1148 Solar disinfection of drinking water contained in transparent plastic bottles : characterizing the bacterial inactivation process K.G. McGuigan 1 , T.M. Joyce 2 , R.M. Conroy 3 , J.B. Gillespie 4 and M. Elmore-Meegan 5 Departments of 1 Physics, 2 International Health and Tropical Medicine, and 3 Epidemiology, The Royal College of Surgeons in Ireland, and 4 Department of Industrial Microbiology, University College Dublin, Ireland and the 5 International Community for the Relief of Suffering and Starvation, Ngong, Kenya 6444/10/97: received 14 October 1997, revised 14 November 1997 and accepted 18 November 1997 K.G. MCGUIGAN, T.M. JOYCE, R.M. CONROY, J.B. GILLESPIE AND M. ELMORE-MEEGAN. 1998. A series of experiments is reported to identify and characterize the inactivation process in operation when drinking water, heavily contaminated with a Kenyan isolate of Escherichia coli, is stored in transparent plastic bottles that are then exposed to sunlight. The roles of optical and thermal inactivation mechanisms are studied in detail by simulating conditions of optical irradiance, water turbidity and temperature, which were recorded during a series of solar disinfection measurements carried out in the Kenyan Rift Valley. Optical inactivation effects are observed even in highly turbid water (200 ntu) and at low irradiances of only 10 mW cm -2 . Thermal inactivation is found to be important only at water temperatures above 45 °C, at which point strong synergy between optical and thermal inactivation processes is observed. The results confirm that, where strong sunshine is available, solar disinfection of drinking water is an effective, low cost method for improving water quality and may be of particular use to refugee camps in disaster areas. Strategies for improving bacterial inactivation are discussed. INTRODUCTION A primary concern of many communities in developing coun- tries is that of obtaining clean drinking water. It has been suggested that solar energy might be of use in improving water quality in those parts of the developing world that experience hot, sunny climates (Acra et al. 1980 ; Ciochetti and Metcalf 1984 ; Lawand et al. 1988 ; De Lorenzi et al. 1989 ; Acra et al. 1990 ; Joyce et al. 1992 ; Reed 1997 ; Sommer et al. 1997). A previous paper (Joyce et al. 1996) showed that the heating effect of Kenyan sunlight could produce complete inactivation of high populations of the faecal indicator organ- ism, Escherichia coli, in highly turbid water (approximately 200 nepholometric turbidity units (ntu)) within 7 h if the water temperature reached at least 55 °C. Furthermore a recently reported clinically controlled field trial of solar dis- infected drinking water in the reduction of diarrhoea in Ken- Correspondence to : Dr Kevin G. McGuigan, Department of Physics, The Royal College of Surgeons in Ireland, St Stephens Green, Dublin 2, Ireland (e-mail : [email protected]). © 1998 The Society for Applied Microbiology yan Maasai children between the ages of 5 and 16 years (Conroy et al. 1996) showed that children who stored their drinking water in 1·5 l plastic (polyethylene terephthalate (PET)) bottles that were placed in direct sunlight for con- tinuous periods of not less than 6 h experienced a 9% reduction in incidences of diarrhoea and a 26% reduction in incidences of severe diarrhoea (which was defined in the study as diarrhoea severe enough to prevent performance of daily duties) over the 3 month duration of the trial, compared with the control group of children who kept their water bottles out of the sun. In this paper, results of an investigation of the roles of optical irradiance, water temperature and turbidity in the bacterial inactivation processes that occur under simulated Kenyan solar disinfection conditions for populations of wild type E. coli in water samples contained in plastic containers are reported. The optical irradiances and water temperatures reproduced in the simulations are those measured for 1·5 l water samples contained in PET plastic bottles during solar disinfection trials in Maasailand, Kenya (Joyce et al. 1996).
Transcript of Solar disinfection of drinking water contained in transparent plastic bottles : characterizing the...
Journal of Applied Microbiology 1998, 84, 1138–1148
Solar disinfection of drinking water contained in transparentplastic bottles : characterizing the bacterial inactivationprocess
K.G. McGuigan 1, T.M. Joyce 2, R.M. Conroy 3, J.B. Gillespie 4 and M. Elmore-Meegan 5
Departments of 1Physics, 2International Health and Tropical Medicine, and 3Epidemiology, The Royal College ofSurgeons in Ireland, and 4Department of Industrial Microbiology, University College Dublin, Ireland and the 5InternationalCommunity for the Relief of Suffering and Starvation, Ngong, Kenya
6444/10/97: received 14 October 1997, revised 14 November 1997 and accepted 18 November 1997
K.G. MCGUIGAN, T.M. JOYCE, R.M. CONROY, J.B. GILLESPIE AND M. ELMORE-MEEGAN. 1998. Aseries of experiments is reported to identify and characterize the inactivation process inoperation when drinking water, heavily contaminated with a Kenyan isolate of Escherichiacoli, is stored in transparent plastic bottles that are then exposed to sunlight. The roles ofoptical and thermal inactivation mechanisms are studied in detail by simulating conditionsof optical irradiance, water turbidity and temperature, which were recorded during a seriesof solar disinfection measurements carried out in the Kenyan Rift Valley. Optical inactivationeffects are observed even in highly turbid water (200 ntu) and at low irradiances of only 10mW cm−2. Thermal inactivation is found to be important only at water temperatures above45 °C, at which point strong synergy between optical and thermal inactivation processes isobserved. The results confirm that, where strong sunshine is available, solar disinfection ofdrinking water is an effective, low cost method for improving water quality and may be ofparticular use to refugee camps in disaster areas. Strategies for improving bacterial inactivationare discussed.
INTRODUCTION
A primary concern of many communities in developing coun-tries is that of obtaining clean drinking water. It has beensuggested that solar energy might be of use in improvingwater quality in those parts of the developing world thatexperience hot, sunny climates (Acra et al. 1980 ; Ciochettiand Metcalf 1984 ; Lawand et al. 1988 ; De Lorenzi et al.1989 ; Acra et al. 1990 ; Joyce et al. 1992 ; Reed 1997 ; Sommeret al. 1997). A previous paper (Joyce et al. 1996) showed thatthe heating effect of Kenyan sunlight could produce completeinactivation of high populations of the faecal indicator organ-ism, Escherichia coli, in highly turbid water (approximately200 nepholometric turbidity units (ntu)) within 7 h if thewater temperature reached at least 55 °C. Furthermore arecently reported clinically controlled field trial of solar dis-infected drinking water in the reduction of diarrhoea in Ken-
Correspondence to : Dr Kevin G. McGuigan, Department of Physics, The RoyalCollege of Surgeons in Ireland, St Stephens Green, Dublin 2, Ireland (e-mail :[email protected]).
© 1998 The Society for Applied Microbiology
yan Maasai children between the ages of 5 and 16 years(Conroy et al. 1996) showed that children who stored theirdrinking water in 1·5 l plastic (polyethylene terephthalate(PET)) bottles that were placed in direct sunlight for con-tinuous periods of not less than 6 h experienced a 9%reduction in incidences of diarrhoea and a 26% reduction inincidences of severe diarrhoea (which was defined in the studyas diarrhoea severe enough to prevent performance of dailyduties) over the 3 month duration of the trial, compared withthe control group of children who kept their water bottlesout of the sun.
In this paper, results of an investigation of the roles ofoptical irradiance, water temperature and turbidity in thebacterial inactivation processes that occur under simulatedKenyan solar disinfection conditions for populations of wildtype E. coli in water samples contained in plastic containersare reported. The optical irradiances and water temperaturesreproduced in the simulations are those measured for 1·5 lwater samples contained in PET plastic bottles during solardisinfection trials in Maasailand, Kenya (Joyce et al. 1996).

SOLAR DISINFECTION OF DRINKING WATER 1139
The bacterial inactivation effect of heat and light is examinedboth in isolation and in combination, and the contribution ofturbidity as a confounding factor is studied.
MATERIALS AND METHODS
Solar simulation apparatus
The apparatus used to reproduce the Kenyan solar irradianceand water temperature regimens used in the simulations con-sists of two systems : one to reproduce the optical irradiances,the other to reproduce the water temperatures. Both systemscan be used either independently or simultaneously.
The system for controlling the water temperature consistsof a platinum resistance temperature sensor, which was cali-brated against a Type J Iron-Constantan thermocouple, andimmersed in the sample within the container. The outputfrom this sensor is monitored by a temperature controllerunit (model E5CS-X, Omron, The Netherlands) that controlsthe mains supply to an ordinary 2·2 kW domestic fan heater(model CE793, Cascade, China) which blows heated air ontothe sample bottle. The sample container is surrounded by acubic plastic housing that has a hole cut into two sides. Alarge hole faces the fan heater and a smaller hole allows theirradiating light through. The purpose of the housing is totrap as much of the heated air as possible around the bottleto speed up the heating process.
The irradiating light source is a 150 W Xenon arc lamp(model 150W/1 XBO, Osram, Germany) fitted with a rearreflector and U.V.-Grade fused silica F1 collecting optics.The light from the lamp passes through a schott glass heat-absorbing filter (model KG02, Melles-Griot, Cambridge,UK) which helps approximate the short wavelength trans-mission properties of the atmosphere. The filter also atten-uates the strong infrared (IR) emissions produced by theXenon lamp between 0·8 and 1·05 mm. A U.V. Grade fusedsilica converging lens is placed between the filter and thesample container to improve the homogeneity of the illumi-nating field and to facilitate the production of a range ofirradiances.
Figure 1a shows the irradiance spectra of the filtered Xearc lamp and of solar radiation after it has passed through theearth’s atmosphere at equatorial latitudes measured at sealevel (Watson 1993). The Xenon spectrum depicted is aconvolution of the arc spectrum (Oriel Corp. 1994) and thetransmission spectrum of the bandpass filter (Melles Griot1995). The filtered Xe lamp light is a good approximation tothe solar spectrum for the U.V. and visible regions of thespectrum. The similarity ends in the IR region. However,both Acra et al. (1990) and Mancini (1978) have shown thatthese IR wavelengths do not play a significant role in thebactericidal action of both real and simulated sunlight. Thefiltered lamp system can produce irradiances up to 100 mW
© 1998 The Society for Applied Microbiology, Journal of Applied Microbiology 84, 1138–1148
Fig. 1 (a) Comparison of irradiance spectra of the solar filteredXe arc lamp output (solid line) and of ground level solar spectrum(Watson 1993) (dotted line). (b) Transmission spectra of theKenyan water container material (PET, solid line), the polystyreneUniversal container material (dotted line) and the heat-absorbingsolar filter (dashed line)
cm−2 but beyond 70 mW cm−2, the illuminating spot sizebecomes too small for uniform sample coverage. Allirradiances were measured using a calibrated optical powermeter (model 200/10¦, Coherent, Cambridge, UK) whichis sensitive over the range 0·3–10·2 mm.
Container material
The solar disinfection field measurements taken in Africa,and the subsequent field trials, used 1·5 l transparent, PETsoft-drink bottles as water containers. The Xe lamp used inthe solar simulation system cannot irradiate such a largesurface with the required power density. Consequently, thewater samples in the simulations were held in transparentpolystyrene 20 ml Universal containers (BDH, Leicester,UK). A comparison of the transmission spectra of poly-styrene, PET and the solar bandpass filter used in the simu-lator lamp system is shown in Fig. 1b. Although polystyreneallows more of the highly bactericidal U.V.-B (290–320 nm)to pass through than PET, these wavelengths are highly

1140 K.G. McGUIGAN ET AL.
attenuated by the atmosphere which is simulated using thesharp cut-off of the bandpass filter at 320 nm. By convolvingthe transmission spectrum of the filter with that of each ofthe container materials, the total energy content of the lamplight reaching the water in the polystyrene container is cal-culated to be only 3% higher than that passing through thePET, and this advantage is evenly distributed across thevisible wavelengths.
Bacterial preparation and enumeration
A wild type strain of E. coli, isolated from the stool of a Maasaichild living near Esonorua (the Kenyan solar irradiation site ;latitude 1 29S, longitude 36 38E), was inoculated into 25ml of sterile nutrient broth (Oxoid CM67) and incubatedovernight at 37 °C. The culture was washed the followingmorning to remove nutrients. To do this, the culture wastransferred into a sterile Universal container and centrifugedat 855 g for 10 min. The supernatant solution was thendiscarded and the pellet resuspended in 20 ml of HPLCanalytical reagent (Analar) grade sterile water. This washingprocedure was repeated three times. Finally, the pellet wasresuspended in 8 ml of sterile water to form the stock solution.A viable bacteria count of this prepared stock was performedusing the Miles and Misra drop count technique (Miles andMisra 1938) and standard plate count agar plate (OxoidCM463). Stock prepared in this manner consistently pro-duced a viable count of approximately 107 cfu ml−1.
Turbidities were measured in nephelometric turbidityunits (ntu) using a standard turbidity tube (Robens Institute,Guildford, UK). Test samples of varying turbidities (200 and0 ntu) with bacterial concentrations of 105 cfu ml−1 wereused to simulate the complete range of water conditionsencountered in Kenya. Dust and soil collected from aroundthe Esonorua River site was gradually added to 300 ml ofHPLC Analar grade sterile water until the required turbiditywas achieved. This solution was then sterilized by autoclavingfor 15 min at 20 lb pressure and 120 °C. Then, 3 ml of theE. coli stock solution were added to 297 ml of the sterile turbidsample to make a test sample with a bacterial concentration of105 cfu ml−1. The control solution was prepared in the samemanner. Once prepared, 7 ml of the test sample were placedin a 30 ml Universal container. Volumes of 100 ml were takenfrom the test and control samples at the beginning of eachsimulation and hourly after that for 8 h. The final volumeswere taken 24 h after the start of the experiment. Thesevolumes were diluted in a series of 10-fold dilutions. A 20 mlvolume was taken from each dilution and dropped onto aStandard Plate Count Agar plate (Oxoid CM463). Eachdilution was sampled three times to ensure accuracy. Plateswere incubated overnight at 37 °C and counted the followingday. Only those plates that showed discrete colonies in thedrop area, preferably those that gave less than 40 colonies per
© 1998 The Society for Applied Microbiology, Journal of Applied Microbiology 84, 1138–1148
drop, were selected and counted. The count was divided bythe number of drops, multiplied by 50 to convert to 1 ml,and then by the dilution itself to give the number of cfu ml−1
(Miles and Misra 1938).A marked reduction in the size of some colonies was
observed as the optical and combined simulations progressed.As this was not observed for any of the thermal simulations,it is assumed that it resulted from damage caused by theincident optical radiation. There was therefore a risk thatbacterial populations might be underestimated because oftheir small size. To avoid this problem, samples were dilutedin a maximum recovery diluent (CM733, Oxoid, Basingstoke,UK) instead of sterile water and left standing at room tem-perature for 45 min before being plated. However this pro-duced no significantly different recovery from the originalsterile water diluent. In fact, the maximum recovery diluentwas found to promote growth in samples that were left stand-ing for periods above 1 h. Consequently, this interventionwas stopped. Samples were thus inoculated onto plates andleft at room temperature for the duration of the 8 h exposureexperiment, and then incubated overnight. If, when readingthe colony counts from the optical experiments, the colonieswere small or just a shadowy background, they were rein-cubated for a further 8–12 h. This usually increased thecolony size, thereby facilitating reading.
Simulations
Three types of simulations were performed : (1) thermal only,(2) optical only and (3) combined thermal and optical. Forthermal simulations, the sample water temperature wasadjusted hourly to reproduce one of the high, medium or lowwater temperature regimens recorded in Kenya (Fig. 3a).These regimens were recorded in Kenya for 1·5 l watersamples exposed, on different days, to high, medium and lowlevels of solar radiation (Joyce et al. 1996) under conditionsof cloud cover which roughly corresponded to cloudless,scattered cloud (approximately half cloud cover) and com-pletely overcast, respectively.
In optical simulations, samples were irradiated at roomtemperature (22 °C) for 8 h at one of three irradiances : 70,40 and 10 mW cm−2, corresponding to Kenyan conditionsof strong sunlight, hazy sunlight and completely overcast,respectively. The Kenyan field measurements of irradiancevaried from a maximum of 89 mW cm−2 to a minimum of 3mW cm−2 (Joyce et al. 1996). However, the upper irradiancelimit of the solar simulator was 70 mW cm−2 for the reasonsexplained earlier. These irradiance values produce cor-responding optical doses of 2·02, 1·15 and 0·29 kJ cm−2,respectively, during each optical simulation and are in goodagreement with doses used elsewhere (Fujioka et al. 1981 ;McCambridge and McMeekin 1981 ; Zemke et al. 1990).The maximum water temperature recorded in the Kenyan
SOLAR DISINFECTION OF DRINKING WATER 1141
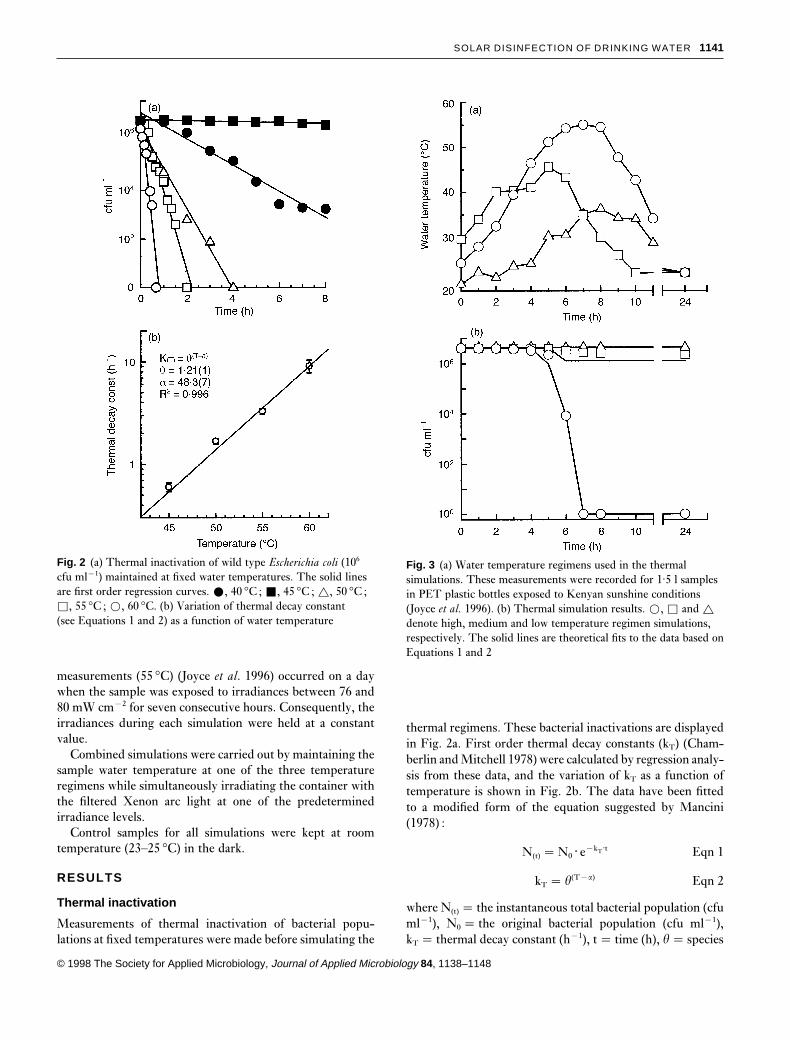
Fig. 2 (a) Thermal inactivation of wild type Escherichia coli (106
cfu ml−1) maintained at fixed water temperatures. The solid linesare first order regression curves. ž, 40 °C ; Ž, 45 °C ; r, 50 °C ;�, 55 °C ; �, 60 °C. (b) Variation of thermal decay constant(see Equations 1 and 2) as a function of water temperature
measurements (55 °C) (Joyce et al. 1996) occurred on a daywhen the sample was exposed to irradiances between 76 and80 mW cm−2 for seven consecutive hours. Consequently, theirradiances during each simulation were held at a constantvalue.
Combined simulations were carried out by maintaining thesample water temperature at one of the three temperatureregimens while simultaneously irradiating the container withthe filtered Xenon arc light at one of the predeterminedirradiance levels.
Control samples for all simulations were kept at roomtemperature (23–25 °C) in the dark.
RESULTS
Thermal inactivation
Measurements of thermal inactivation of bacterial popu-lations at fixed temperatures were made before simulating the
© 1998 The Society for Applied Microbiology, Journal of Applied Microbiology 84, 1138–1148
Fig. 3 (a) Water temperature regimens used in the thermalsimulations. These measurements were recorded for 1·5 l samplesin PET plastic bottles exposed to Kenyan sunshine conditions(Joyce et al. 1996). (b) Thermal simulation results. �, � and r
denote high, medium and low temperature regimen simulations,respectively. The solid lines are theoretical fits to the data based onEquations 1 and 2
thermal regimens. These bacterial inactivations are displayedin Fig. 2a. First order thermal decay constants (kT) (Cham-berlin and Mitchell 1978) were calculated by regression analy-sis from these data, and the variation of kT as a function oftemperature is shown in Fig. 2b. The data have been fittedto a modified form of the equation suggested by Mancini(1978) :
N(t) �N0 · e−kT·t Eqn 1
kT � u(T−a) Eqn 2
where N(t) � the instantaneous total bacterial population (cfuml−1), N0 � the original bacterial population (cfu ml−1),kT � thermal decay constant (h−1), t� time (h), u� species

1142 K.G. McGUIGAN ET AL.
specific fit parameter, and a� nominal activation tem-perature ( °C).
The solid line in Fig. 2b is a fit to the data using values ofu� 1·21(1) and a� 48·3(7). Temperatures below 45 °C havenegligible inactivating effects on the bacteria whereas inac-tivation rates increase with temperatures above this value.This is in good agreement with the variation of the thermaldecay constant reported by Mancini (1978) for other unspeci-fied coliforms.
Reasonable agreement between measured and predicted(solid lines, Fig. 3b) thermal inactivations are obtained if thedefinition of kT in equation 2 is altered such that :
kT � 0 for T³ 45 °C
kT � 1·21(T−48·3) for T× 45 °C
Simulations of the temperature regimens show that the lowtemperature regimen (maximum temperature� 36·3 °C, seeFig. 3a) produces no inactivation, which is to be expectedsince the temperature never exceeds 45 °C. The mediumtemperature regimen produces an inactivation of less thanone order of magnitude over the 8 h simulation period.However, all the high temperature regimen simulations pro-duce total and permanent inactivations within 7 h, as pre-viously reported (Joyce et al. 1996). The inactivation achievedfor each thermal simulation was independent of the turbidity(data not shown) ; consequently, only the 200 ntu measure-ments are displayed in Fig. 3b.
Optical inactivation
The bacterial inactivations produced by optical irradiationonly are shown in Fig. 4. The decreases in bacterial popu-lation were permanent and no subsequent increase wasobserved in the 24 h period after the simulation ended. Allbut the 10 mW cm−2, 0 ntu simulation show evidence ofa population decrease consistent with a double-exponentialdecay. This behaviour is attributed to the presence of bothlight resistant and light sensitive bacteria among the startingpopulation. The solid lines in Fig. 4 are theoretical fits to thedata, assuming first order decay kinetics of the form :
N(t) �Ns · e−ks·t ¦NR · e−kR·t Eqn 3
where N(t) � the instantaneous total bacterial population (cfuml−1), Ns � the original light sensitive bacterial population(cfu ml−1), NR � the original light resistant bacterial popu-lation (cfu ml−1), t� time (h), ks � decay constant for thelight sensitive population (h−1) and kR � decay constant forthe light resistant population (h−1).
Non-linear regression analysis (Jandel Scientific 1992) wasused to obtain parameter values for ks, kR and NR and thesevalues are listed in Table 1. For the sake of simplicity, Ns isassumed to be equal to N0. Optical inactivation is clearly
© 1998 The Society for Applied Microbiology, Journal of Applied Microbiology 84, 1138–1148
Fig. 4 Optical simulation results for water samples withturbidities of (a) 200 ntu and (b) 0 ntu, respectively. (�),(�) and (r) denote optical irradiances of 70, 40 and 10 mWcm−2, respectively
dependent on turbidity. Comparison of the 0 ntu ks valueswith those reported by Mancini (1978) shows good agreementfor the 40 and 10 mW cm−2 data. The 70 mW cm−2 valuesare lower than those predicted by Mancini (1978), but hiscalculations were based on assumptions of light falling upona large body of water and make no allowance for eitherreflective losses of incident radiation from the curved surfaceof the bottle, or absorption losses within the containermaterial itself. Simulations using 0 ntu water samples achieveapproximately one order of magnitude greater inactivationsthan the corresponding 200 ntu samples for irradiancesbetween 40 and 70 mW cm−2.
The decision to analyse the observed optical inactivationson the basis of a double exponential decay correspondingto separate populations of light resistant and light sensitivebacteria is reasonable, and is further supported by the obser-vation, mentioned earlier, for the optical and combined simu-lations, of colonies of both normal and reduced size. Thiseffect was not observed in any of the thermal only simulations.

SOLAR DISINFECTION OF DRINKING WATER 1143
Table 1 Parameter and coefficient ofdetermination values for theoretical fits tothe optical irradiance simulationmeasurements usingEquation 3 and non-linearregression. These fits aredisplayed as solid lines in Fig. 4
—––––––––––––––––––––––––––––––––––––––––––––––––––––––––––––––––––––––––––
Optical Coefficient ofirradiance Turbidity kS kR NR determination(mW cm−2) (ntu) (h−1) (h−1) (cfu ml−1) R2
—––––––––––––––––––––––––––––––––––––––––––––––––––––––––––––––––––––––––––70 200 0·32 (3) 0·00 (1) 3×10⁴ 0·96740 200 0·27 (2) 0·020(4) 3×10⁵ 0·95810 200 0·25 (2) 0·07 (1) 0 0·96370 0 1·04 (9) 0·17 (1) 1×10⁵ 0·97140 0 0·45 (4) 0·14 (3) 1×10⁵ 0·98610 0 0·25 (2) 0·00 (1) 1×10⁶ 0·962—––––––––––––––––––––––––––––––––––––––––––––––––––––––––––––––––––––––––––
Combined thermal and optical inactivation
The entire set of possible combined simulations can be sub-divided into nine groups (three temperature regimens at threeirradiance values). Each group contains two simulations takenat different turbidity values (0 and 200 ntu) but subjected tothe same optical irradiance and temperature regimen. Ineffect, each group corresponds to a specific solar exposure, ormeteorological environment. All nine groups of simulations,which are listed in Table 2, were carried out. None of thesesimulations produced an increase in bacterial population.Irrespective of the irradiance level, all samples that experiencethe highest water temperature regimen (maximum tem-perature 55 °C) are totally inactivated within, at most, 7 h ofthe start of the simulation, and in each case, no subsequentbacterial recovery is observed after leaving the samples tocool down overnight. For all values of thermal regimen andturbidity, an increase in the irradiance produces a cor-responding increase in bacterial inactivation.
Table 2 Temperature regimen and optical irradiance values forthe combined simulations and the corresponding meteorologicalconditions that these most closely match. Note each group ofsimulations was carried out at 0 and 200 ntu turbidity—–––––––––––––––––––––––––––––––––––––––––––––––––––––
Combined Optical Correspondingsimulation irradiance Temperature meteorologicalgroup (mW cm−2) regimen* conditions—–––––––––––––––––––––––––––––––––––––––––––––––––––––1 70 High Sunny, hot2 70 Medium Sunny, warm3 70 Low Sunny, cool4 40 High Hazy, hot5 40 Medium Hazy, warm6 40 Low Hazy, cool7 10 High Overcast, hot8 10 Medium Overcast, warm9 10 Low Overcast, cool—–––––––––––––––––––––––––––––––––––––––––––––––––––––
* See Fig. 2a.
© 1998 The Society for Applied Microbiology, Journal of Applied Microbiology 84, 1138–1148
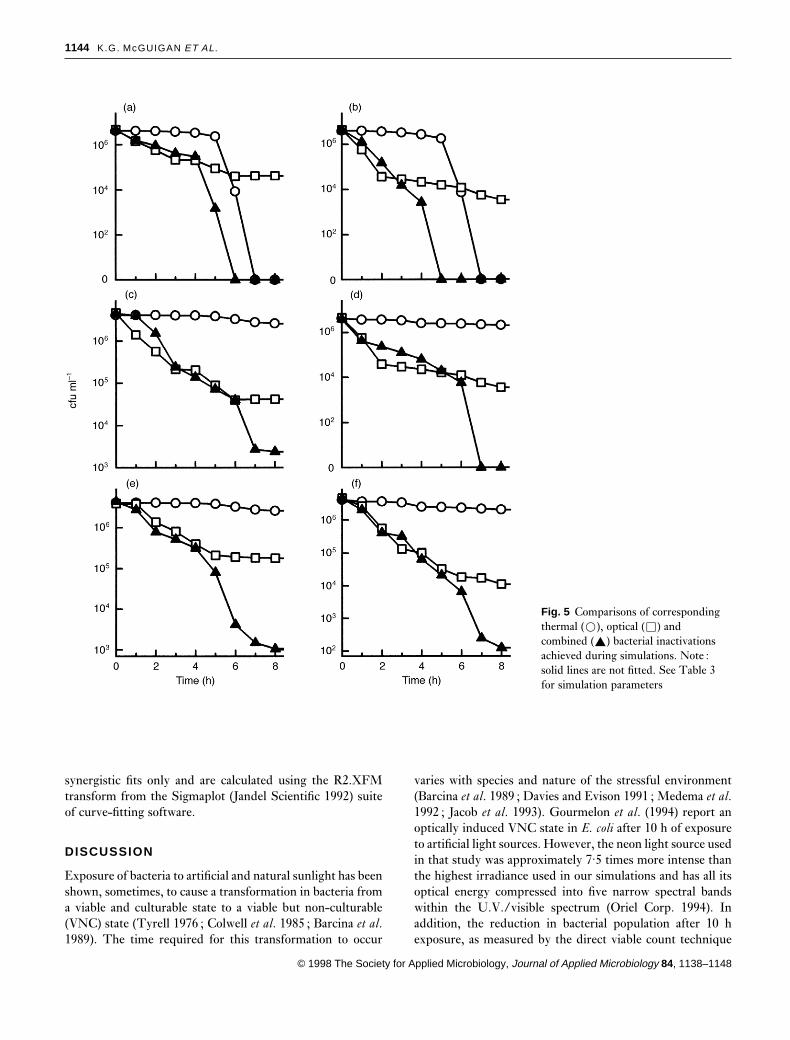
Groups 4, 7 and 8 in Table 2 do not correspond to solarexposure conditions that can realistically be expected in thefield and so are not discussed further. Of the remaininggroups, those combined simulations that utilize the low tem-perature regimen (groups 3, 6 and 9) produce inactivationsthat are not significantly different (paired Student t-test atthe P� 0·05 significance level (Jandel 1992)) to those exposedto light only (data not shown). Plots of the viable bacterialpopulations for the remaining three groups of simulations (1,2 and 5) are shown in Fig. 5. The results of these combinedsimulations (triangles) are displayed in each panel alongsidethe corresponding thermal only (circles) and optical only(squares) simulation results for comparison purposes.
Attempts to model the population dynamics of the com-bined simulations were made using an equation derived fromEquations 1, 2 and 3, of the form :
N(t)�Ns · e−(ks+kT)·t ¦NR · e−(kR+kT)·t Eqn 4
where each term retains its previous meaning. Equation 4assumes a non-synergistic relationship between the opticaland thermal components of the observed combined inac-tivation. However, this consistently underestimates the mea-sured inactivation (dashed line in Fig. 6), showing that therelationship between optical and thermal inactivation mech-anisms is more than additive in the combined simulations.The synergistic relationship between the optical and thermalprocesses can be modelled by multiplying the decay constantsin Equation 4 by an extra synergy term S in the mannershown in Equation 5. Values of S larger than 1·0 indicate thatsynergy occurs.
N(t)�Ns · e−S · (ks+kT) · t ¦NR · e−S · (kR+kT) · t Eqn 5
The solid lines in Fig. 6 are fits to the data made using thisequation, and from the values of the correlation coefficients,it can be seen that they are reasonable. The parameter valuesof NR, kR and ks that were used in both the non-synergistic(dashed line) and synergistic (solid line) fits in Fig. 6 areidentical and are listed in Table 3. The coefficients of deter-mination values (R2) listed in each panel of Fig. 6 refer to the
1144 K.G. McGUIGAN ET AL.
Fig. 5 Comparisons of correspondingthermal (�), optical (�) andcombined (R) bacterial inactivationsachieved during simulations. Note :solid lines are not fitted. See Table 3for simulation parameters
synergistic fits only and are calculated using the R2.XFMtransform from the Sigmaplot (Jandel Scientific 1992) suiteof curve-fitting software.
DISCUSSION
Exposure of bacteria to artificial and natural sunlight has beenshown, sometimes, to cause a transformation in bacteria froma viable and culturable state to a viable but non-culturable(VNC) state (Tyrell 1976 ; Colwell et al. 1985 ; Barcina et al.1989). The time required for this transformation to occur
© 1998 The Society for Applied Microbiology, Journal of Applied Microbiology 84, 1138–1148
varies with species and nature of the stressful environment(Barcina et al. 1989 ; Davies and Evison 1991 ; Medema et al.1992 ; Jacob et al. 1993). Gourmelon et al. (1994) report anoptically induced VNC state in E. coli after 10 h of exposureto artificial light sources. However, the neon light source usedin that study was approximately 7·5 times more intense thanthe highest irradiance used in our simulations and has all itsoptical energy compressed into five narrow spectral bandswithin the U.V./visible spectrum (Oriel Corp. 1994). Inaddition, the reduction in bacterial population after 10 hexposure, as measured by the direct viable count technique

SOLAR DISINFECTION OF DRINKING WATER 1145
Fig. 6 Comparison of synergistic (solidline, see Equation 5) and non-synergistic (dashed line, see Equation4) theoretical fits to the combinedsimulation measurements shown inFig. 5
Table 3 Theoretical fit parametersfor the combined simulationsin Fig. 5 using Equation 4
—––––––––––––––––––––––––––––––––––––––––––––––––––––––––––––––––––––––––––
Optical ResistantCombined Temperature irradiance Turbidity population kR kS
simulation* regimen (mW cm−2) (ntu) (cfu ml−1) (h−1) (h−1)—––––––––––––––––––––––––––––––––––––––––––––––––––––––––––––––––––––––––––a High 70 200 0 0 0·75b High 70 0 0 0 1·85c Medium 70 200 4×10⁴ 0 0·95d Medium 70 0 5×10⁴ 0·4 1·5e Medium 40 200 4×10⁴ 0·4 0·75f Medium 40 0 4×10⁴ 0·4 1·1—––––––––––––––––––––––––––––––––––––––––––––––––––––––––––––––––––––––––––
* As in Fig. 5.
© 1998 The Society for Applied Microbiology, Journal of Applied Microbiology 84, 1138–1148

1146 K.G. McGUIGAN ET AL.
(Kogure et al. 1979) was only 1 log unit lower than thatmeasured using the Acridine Orange Direct Count (AODC,Hobbie et al. 1977) method for measuring VNC bacteria.Davies and Evison (1991) observed no evidence of a VNCstate being induced in E. coli exposed to solar irradiances of25 mW cm−2 in fresh water for periods up to 10 h, andreported that the number of bacteria estimated by the AODCmethod was consistently higher than those counted by cul-turable methods, even at the start of each simulation. Concernhas been expressed regarding the accuracy of the AODCmethod (Al-Hadithi and Goulder 1989 ; Singh et al. 1989).In addition, all of the decreases in bacteria populations thatwere measured in the simulations were of a permanent nature,and no subsequent re-activation after 24 h was observed onany occasion. For these reasons, it was deemed reasonable touse the Miles and Misra drop count enumeration method(Miles and Misra 1938) for our simulations.
The relative importance of thermal inactivation in com-parison to optical inactivation depends very much on bothinitial water quality and prevailing weather conditions. Thetransmission properties of the PET container material (seeFig. 1b) are such that most of the U.V.B wavelengths (280–320 nm), whose bactericidal properties are well documented(Chamberlin and Mitchell 1978 ; Davies and Evison 1991),are filtered out of the incident light before they can reach thebacteria. The optical inactivation mechanisms in operationduring solar disinfection must result from the remainingU.V.A (320–400 nm) and visible light. Turbidities above200 ntu absorb approximately 99% of the incident radiationwithin the first centimetre of optical path (Joyce et al. 1996).While a sizeable optical inactivation under such cir-cumstances might not be expected, the opacity associatedwith turbid water will change the optical absorption charac-teristics, which in turn affects the thermal inertia of thesample since darker surfaces have higher emissivities thanlighter surfaces and the turbid agent (dust, algae, etc.) willusually have a lower specific heat capacity than the wateritself. Consequently the temperature dynamics of highly tur-bid water samples can be faster than those of clearer sampleswhich would help thermal inactivation processes.
Our measurements show that the inactivation of E. coliduring solar disinfection results from a synergistic relation-ship between the optical and thermal inactivation mech-anisms, if, and only if, the water temperature exceeds 45 °C.All the combined simulations displayed in Fig. 5 show similarpopulation dynamics to the corresponding optical only simu-lations until the water temperature exceeds 45 °C, at whichpoint the inactivation rate increases beyond that expected forthe addition of the thermal decay constant (kT) and the opticaldecay constants (kS or kR) in Equation 4 (dashed lines in Fig.6). This is in broad agreement with Wegelin et al. (1994) whoreported that water temperatures between 20 and 40 °C donot affect the inactivation of bacteria by UVA and visible
© 1998 The Society for Applied Microbiology, Journal of Applied Microbiology 84, 1138–1148
light but synergistic effects are observed at a threshold watertemperature of 50 °C.
Furthermore, a complete inactivation of high populationsof E. coli can be produced in drinking water, even of highturbidity (200 ntu), by exposing 1·5 l volumes containedin plastic soft drink containers to strong to medium solarirradiances for periods of at least 7 h. If a water temperaturegreater than 55 °C is reached in the sample, thermal stressis primarily responsible for the observed inactivation. Theinactivated bacteria do not recover as the water cools fol-lowing solar exposure. Bacteria in samples that achieve inter-mediate water temperatures (about 45 °C) can still be fullyand permanently inactivated if the water is of low turbidityand is exposed to high irradiances (70 mW cm−2) for periodsof up to 7 h.
The benefits of such a simple and cheap method of improv-ing water quality are obvious for developing countries. Thetechnique can be improved considerably by the inclusion ofany of several simple steps to the technique. Such steps mightbe pre-filtration or reduction of the turbidity using locallyavailable flocculation agents (Folkard et al. 1996). Reed (1997)has shown that inactivation increases as dissolved oxygenconcentration levels increase, and suggests that periodic agi-tation of the bottle during exposure would speed up thedisinfection process. If the water is of sufficient clarity, theoptical inactivation process can be improved by wrappingthe rear half of the bottle with reflective aluminium foil.Alternatively, the thermal inactivation process can beenhanced by coating the rear half of the bottle with a darkopaque substance (mud or paint) and keeping thebottle sheltered from the convective cooling effects of thewind.
None of the above interventions were included in the workreported here because the aim was to determine whether thebasic solar disinfection process, using the clear bottle onlyand no pre-treatment for the water, would be effective underconditions that might exist in a refugee camp or disastersituation. Our results show that solar disinfection of drinkingwater taken directly from a contaminated source, stored intransparent plastic bottles and exposed to the sun, would bean effective first option under such situations if strong sun-shine is available. Even if strong sunshine is not available,our results show that solar exposure will, at best, improve thewater quality and at worst, leave it no worse than it was before.This is further confirmed by the results of our controlled fieldtrial of solar disinfected drinking water in the reduction ofdiarrhoea in Kenyan Maasai children between the ages of 5and 16 years (Conroy et al. 1996) which showed a 26%reduction in incidences of severe diarrhoea over a 3 monthperiod compared with the control group. This reduction inthe incidence of diarrhoea also suggests that even if it isnot certain whether the water-borne pathogens are killed,inactivated or transformed into a VNC state, solar dis-

SOLAR DISINFECTION OF DRINKING WATER 1147
infection does reduce the risk of diarrhoeal disease. It isreasonable to assume that the thermal and optical inactivationmechanisms observed in our simulations play some role inthis process.
ACKNOWLEDGEMENTS
This work was funded by Forbairt under grant no. SC94089and by the Research Committee of the Royal College ofSurgeons in Ireland under grant no. 94-54-657. The authorsare most grateful to the combined Services Third WorldFund, the Garda Siochana Third World fund and ElectricAid for financial support for various aspects of this research.
REFERENCES
Acra, A., Karahagopian, Y., Raffoul, Z. and Dajani, R. (1980) Dis-infection of oral rehydration solutions by sunlight. Letter. TheLancet ii : 1257–1258.
Acra, A., Jurdi, M., Mu’allem, H., Karahagopian Y. and Raffoul,Z. (1990) Water disinfection by solar radiation. IDRC-TS66e.Ottawa, Canada : International Development Research Centre.
Al-Hadithi, S.A. and Goulder, R. (1989) An alternative approachto the yeast extract nalidixic acid method for determining theproportion of metabolically active aquatic bacteria. Letters inApplied Microbiology 8, 87–90.
Barcina, L., Gonzalez, J.M., Iriberri, J. and Ega, L. (1989) Effectsof visible light on progressive dormancy of E. coli cells during thesurvival process in natural fresh water. Applied and EnvironmentalMicrobiology 55, 246–251.
Chamberlin, C. and Mitchell, R. (1978) A decay model for entericbacteria in natural waters. In Water Pollution Microbiology Vol. 2ed. Mitchell, R. pp. 325–348. New York : Wiley-Interscience.
Ciochetti, D. and Metcalf, R.H. (1984) Pasteurization of naturallycontaminated water with solar energy. Applied and EnvironmentalMicrobiology 47, 223–228.
Colwell, R.R., Brayton, P.R., Grimes, D.J., Roszak, D.B., Huq, S.A.and Palmer, L.M. (1985) Viable but non-culturable V. cholera andrelated pathogens in the environment : implications for release ofgenetically engineered micro-organisms. Biotechnology 3, 817–820.
Conroy, R.M., Elmore-Meegan, M., Joyce, T.M., McGuigan, K.G.and Barnes, J. (1996) Solar disinfection of drinking water andincidence of diarrhoea in Maasai children : a controlled field trial.The Lancet 348, 1696–1697.
Davies, C.M. and Evison, L.M. (1991) Sunlight and the survival ofenteric bacteria in natural waters. Journal of Applied Bacteriology7, 265–274.
De Lorenzi, G., Volta, C. and Monjour, L. (1989) Application dela desinfection solaire a l’eau de boisson en milieu tropical. Bulletinde la Societe Pathologie Exotique 82, 255–259.
Folkard, G.K., Al-Khalili R.S. and Sutherland, J.P. (1996) Contactflocculation-filtration using a natural polyelectrolyte for the treat-ment of low turbidity surface waters in developing countries. In
© 1998 The Society for Applied Microbiology, Journal of Applied Microbiology 84, 1138–1148
Chemical Water and Wastewater Treatment IV : Proceedings of the7th International Gothenburg Conference on Chemical Treatment,Edinburgh, 23–25 Sept. ed. Hahn, H.H., Hoffmann, E. andOšdegoard, H. New York : Springer-Verlag.
Fujioka, R.S., Hashimoto, H.H., Siwak, E.B. and Young, R.H.F.(1981). Effect of sunlight on survival of indicator bacteria inseawater. Applied and Environmental Microbiology 41, 690–696.
Gourmelon, M., Cillard, J. and Pommepuy, M. (1994) Visible lightdamage to E. coli in seawater : oxidative stress hypothesis. Journalof Applied Bacteriology 77, 105–112.
Hobbie, J.F., Daley, R.J. and Jasper, S. (1977) Use of nucleoporefilters for counting bacteria by fluorescence microscopy. Appliedand Environmental Microbiology 33, 1225–1228.
Jacob, J., Martin, W. and Holler, C. (1993) Characterisation ofviable but non-culturable stage of E. coli with respect to electronmicroscopic findings, whole cell protein and lipo-oligosaccharidepatterns. Zentralblatt fur Mikrobiologie 148, 3–10.
Jandel Scientific (1992) Non-linear regression. In Sigmaplot Scien-tific Graphing Software : Transforms and Curve Fitting. Erkrath,Germany : Jandel GmbH.
Joyce, T., Kenny, V., McGuigan, K.G. and Barnes, J. (1992) Dis-infection of water by sunlight. Letter. The Lancet 340, 921.
Joyce, T.M., McGuigan, K.G., Elmore-Meegan, M. and Conroy,R.M. (1996) Inactivation of fecal bacteria in drinking water bysolar heating. Applied and Environmental Microbiology 62, 399–402.
Kogure, K., Simidu, V. and Taga, N. (1979) A tentative directmicroscopic method for counting living marine bacteria. CanadianJournal of Microbiology 25, 415–420.
Lawand, T.A., Alward, R., Odeyemi, O., Hahn, J., Kandpal, T.C.and Ayoub, J. (1988) Solar Water Disinfection. Proceedings of aWorkshop held at the Brace Institute, Montreal, Canada. Ottawa,Ontario, Canada : IDRC.
Mancini, J. (1978) Numerical estimates of coliform mortality undervarious conditions. Journal of the Water Pollution Control Fed-eration 50, 2477–2484.
McCambridge, J. and McMeekin, T.A. (1981) Effect of solar radi-ation and predacious microorganisms on survival of faecal andother bacteria. Journal of Environmental Microbiology 41, 1083–1087.
Medema, G.J., Schets, F.M., van de Geissen, A.W. and Havelaar,A.H. (1992) Lack of colonization of 1 day old chicks by viablenon-culturable C. jejuni. Journal of Applied Bacteriology 75, 512–516.
Melles Griot Inc. (1995/96) Heat absorbing filters. In Melles-GriotComponents Catlog (1995/96), p. 14. Irvine, CA USA : Melles-Griot.
Miles, A.A. and Misra, S.S. (1938) The estimation of the bactericidalpower of the blood. Journal of Hygiene 38, 732.
Oriel Corp. (1994) Light Sources, Monochromators and Spectrographs,Detectors and Detections Systems, Fiber Optics pp. 1–29. Stratford,CT, USA : Oriel Corp.
Reed, R.H. (1997) Solar inactivation of faecal bacteria in water : thecritical role of oxygen. Letters in Applied Microbiology 24, 276–280.
Singh, A., Pyle, B.H. and McFeters, G.A. (1989) Rapid enumeration

1148 K.G. McGUIGAN ET AL.
of viable bacteria by image analysis. Journal of MicrobiologicalMethods 10, 91–101.
Sommer, B., Marino, Y., Salas, M.L. et al. (1997) SODIS—anemerging water treatment process. Journal of Water ScienceResearch and Technology—Aqua 46, 127–137.
Tyrell, R.M. (1976) Synergistic lethal action of UV radiations andmild heat in E. coli. Photochemistry and Photobiology 24, 345–351.
Watson, L. (1993) Solar simulation technical discussions. In SolarSimulation. Stratford, CT, USA : Oriel Corporation.
© 1998 The Society for Applied Microbiology, Journal of Applied Microbiology 84, 1138–1148
Wegelin, M., Canonica, S., Meschner, K., Fleischmann, T., Pesaro,F. and Metzler, A. (1994) Solar water disinfection : scope of theprocess and analysis of radiation experiments. Journal of WaterScience Research and Technology 43, 154–169.
Zemke, V., Podgorsk, L. and Schoenen, D. (1990) Ultraviolet dis-infection of drinking water : Inactivation of E. coli and coliformbacteria. Zentralblatt fur Hygiene und Umweltmedizine 190, 51–56.