Soil development on dolerite and its implications for landscape history in southeastern Tasmania
27
1 Soil development on dolerite and its implications for landscape history in southeastern Tasmania Rafael Osok and Richard Doyle a School of Agricultural Science, University of Tasmania, PO Box 252-54, Hobart, TAS 7001 Abstract Soil genesis has been examined using field description, particle size distributions, chemical properties, mineralogy and elemental distributions of five soil profiles developed on dolerite on Mt Nelson and Tolmans Hill near Hobart in Tasmania. The soils form a sequence ranging from a Black Vertosol (P8) to four texture contrast soils namely a Eutrophic Brown Chromosol (P5), two Mottled-Subnatric Grey Sodosols (MN8 and P4), and a Mottled Mesonatric Grey Sodosol (P7). The soil stratigraphic and pedological relationships of these soils have been investigated to help understand their distribution and improve understanding of soil formation history. The knowledge of the soil stratigraphy and weathering features aid in the determination of the broader landscape history. The field observations show the local dolerite has been subjected to both deep weathering and severe erosional periods. Pockets of deeply weathered dolerite occur adjacent to thin A/C soils or hard outcropping rock. Deeper colluvial soil materials occur on lower slopes. The presence of protruding dolerite columns now buried by transported clayey slope-wash materials indicates partial landscape stripping followed by re-burial. The presence of buried stone-lines separating the upper profile from the clayey subsoils supports the idea of a second major erosional-depositional cycle. A pronounced variation between the A and B horizons particle-size distribution, mineralogy and elemental distribution supports the conclusion that the modern soils are composed of several sedimentary layers which cap a variable thickness of in situ weathered dolerite (termed “mealy material”) above fresh dolerite. Bedrock jointing, veins and rock fabric extend upward from the bedrock into the mealy material but are truncated abruptly at the contact with the clayey subsoil. Soil forming processes have operated to modify soil colours and mottling, soil structure and cation chemistry. These findings have important implications for landscape history, slope processes and the improved understanding of the distribution of dolerite derived soils in Tasmania. a Corresponding author. Tel.: +61-3-6226 2622; fax: +61-3-6226 2642 E-mail address: [email protected]
-
Upload
independent -
Category
Documents
-
view
1 -
download
0
Transcript of Soil development on dolerite and its implications for landscape history in southeastern Tasmania
1
Soil development on dolerite and its implications for landscape history in
southeastern Tasmania
Rafael Osok and Richard Doylea
School of Agricultural Science, University of Tasmania, PO Box 252-54, Hobart, TAS
7001
Abstract
Soil genesis has been examined using field description, particle size distributions,
chemical properties, mineralogy and elemental distributions of five soil profiles
developed on dolerite on Mt Nelson and Tolmans Hill near Hobart in Tasmania. The
soils form a sequence ranging from a Black Vertosol (P8) to four texture contrast soils
namely a Eutrophic Brown Chromosol (P5), two Mottled-Subnatric Grey Sodosols
(MN8 and P4), and a Mottled Mesonatric Grey Sodosol (P7). The soil stratigraphic and
pedological relationships of these soils have been investigated to help understand their
distribution and improve understanding of soil formation history. The knowledge of the
soil stratigraphy and weathering features aid in the determination of the broader
landscape history. The field observations show the local dolerite has been subjected to
both deep weathering and severe erosional periods. Pockets of deeply weathered
dolerite occur adjacent to thin A/C soils or hard outcropping rock. Deeper colluvial soil
materials occur on lower slopes. The presence of protruding dolerite columns now
buried by transported clayey slope-wash materials indicates partial landscape stripping
followed by re-burial. The presence of buried stone-lines separating the upper profile
from the clayey subsoils supports the idea of a second major erosional-depositional
cycle.
A pronounced variation between the A and B horizons particle-size distribution,
mineralogy and elemental distribution supports the conclusion that the modern soils are
composed of several sedimentary layers which cap a variable thickness of in situ
weathered dolerite (termed “mealy material”) above fresh dolerite. Bedrock jointing,
veins and rock fabric extend upward from the bedrock into the mealy material but are
truncated abruptly at the contact with the clayey subsoil. Soil forming processes have
operated to modify soil colours and mottling, soil structure and cation chemistry. These
findings have important implications for landscape history, slope processes and the
improved understanding of the distribution of dolerite derived soils in Tasmania.
a Corresponding author. Tel.: +61-3-6226 2622; fax: +61-3-6226 2642 E-mail address: [email protected]
2
Keywords: dolerite, soil stratigraphy, stone-line, erosion, landscape, weathering
1. Introduction
Dolerite-derived soils cover about one third of Tasmania and are found under a wide
range of topographic, climatic and vegetative conditions. Five soils formed on dolerite
at Mt Nelson and Tolmans hill were selected for further investigation. The key types of
soil formed on dolerite were first outlined by Nicolls (1958) as Black clay soils on
dolerite (Bld), Brown soils on dolerite (Bd), Podzolic soils on dolerite (Pd), Krasnozems
on dolerite (Kd) and Yellow-brown soils on dolerite solifluction deposits (Ybs). Tiller
(1962) examined the mineralogy and redistribution of some trace elements during
weathering and formation of dolerite derived soils. Neither of these studies determined
the stratigraphy of these soils but Loveday (1957) suggested the high quartz content of
the fine sand fraction from topsoils of dolerite derived soils north-east of Hobart may be
aeolian. Our field observations have shown that many of the soils on dolerite in the Mt
Nelson and Tolmans Hill areas of Hobart are characterised by a surface layer of
powdery, stone-free, loamy fine sand overlying fine sandy loam A2 or A3 horizon
which is abruptly separated by a stone-line from the gritty clay subsoils (B21, B22).
The clayey B2 horizons abruptly cap a compact, gritty weathered dolerite C horizon,
termed “mealy material” that appears in-situ as it exhibits rock fabric and veins extend
upward from the bedrock into it. The stone-lines that separate the upper lighter textured
profile from the clayey lower horizons may contain abundant ferruginous nodules
particularly at impeded or poorly drained sites. As data on the petrology and
geochemical variation of dolerite are limited fresh samples from both Mt Nelson and
Tolmans Hill were analysed. The presence of stratified profiles based on field evidence
is further supported by detailed mineralogical, chemical and particle-size analysis.
The aim of this work has been to demonstrate the complex erosion, depositional and soil
development history on dolerite hill slopes in Southeastern Tasmania. The findings have
implications for the understanding of soil profiles and their development and hence their
landscape distribution.
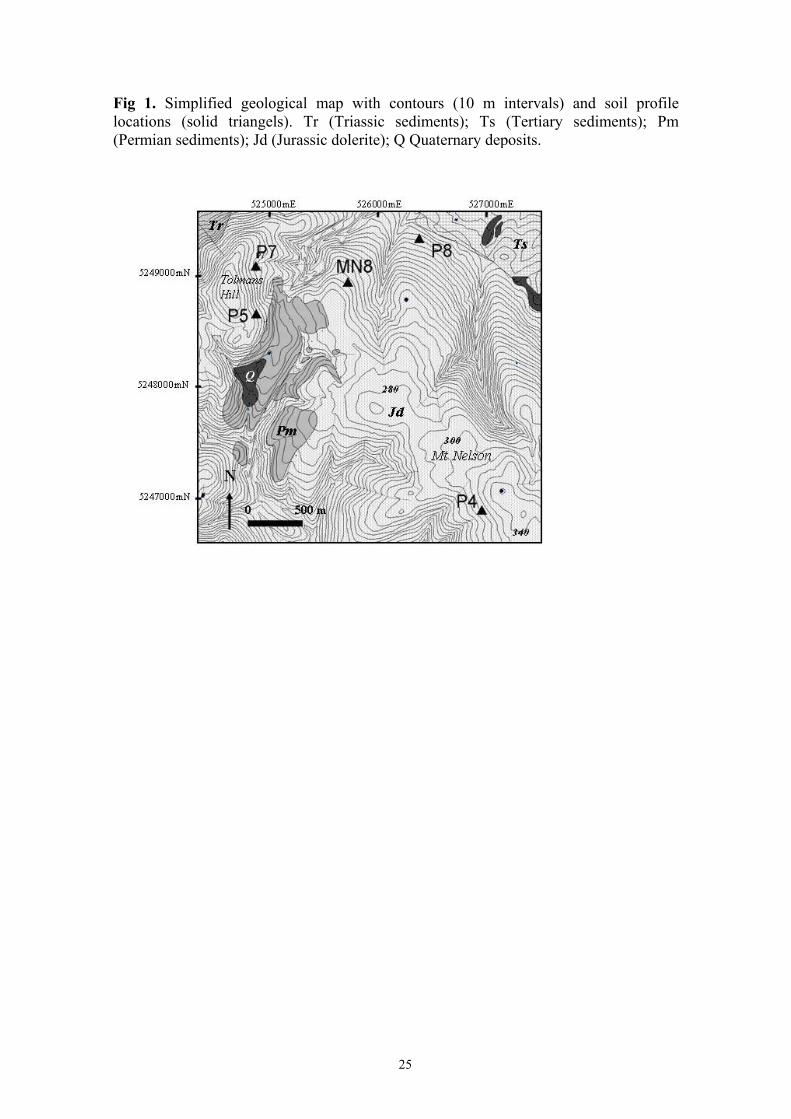
2. Study area
The five soil profiles studied are located at Mt Nelson and Tolmans Hill, Hobart,
Tasmania (Figure 1). Mt Nelson and Tolmans Hill were selected because they have
extensive areas of dolerite with a wide range of soils developed across a range of
3
topographic settings. The study area is generally hilly and elevation ranges 50-350 m
above sea level. Topography consists mainly of dolerite plateaux forming hilltops with
steep side-slopes and narrow incised valleys. The study area is located within the dry
zone of Tasmania (<800mm/yr). The annual rainfall is 619mm/yr at Ellerslie Rd
Station Hobart City (5km NE of Mt Nelson). The mean rainfall ranges between 41mm
(Feb) and 63mm (Oct). In January and February pan evaporation is three times rainfall
and only in June and July does rainfall greatly exceeds pan evaporation thus leaching is
very limited. The vegetation type is dry sclerophyll forest and woodland dominated by
Eucalyptus globulus (blue gum), E. ovata (swamp gum) and E. pulchella (white
peppermint) with acacia and others herbaceous types as the second strata. Themeda
australis and Poa australis grasses are the most common ground cover.
3. Methods
3.1. Field sampling
Five representative soil profiles were selected from key geomorphic locations and
described according to McDonald et al. (1998). A total of 43 bulk samples including
coarse fragment and ferruginous nodules were collected. Dolerite bedrock was sampled
from both Mt Nelson and Tolmans Hill area. Seepage water was collected from the
abrupt A2 - B21 boundary of profiles MN8 and P7 in the late Spring (2001).
3.2. Laboratory analysis
All bulk samples were air-dried and 2 mm sieved for particle size analysis, chemical,
mineralogy and elemental analysis. Coarse fragments and ferruginous nodules were
removed by dry sieving at 2mm, washed and dried. Particle size analysis was carried
out according to the plummet balance method of McIntyre and Loveday (1974). The
sand fraction was then separated by sedimentation, air-dried and sieved through 1 mm,
0.5 mm, 0.25 mm, 0.125 mm, 0.09 mm, 0.063 mm and 0.045 mm mesh Endecott sieves.
Chemical characteristics included pH and electrical conductivity in 1:5 soil to water
ratio, organic carbon (Walkley-Black method), exchangeable cations and aluminium by
ammonium chloride extraction were measured according to Rayment and Higginson
(1992). Phosphate in water was determined by Ion Chromatography APHA method
4110C. Total Al, Fe, Ca, Mg, K and Na in water were analysed by APHA method
3030/3120. Major elements in the whole soil samples (Si, Ti, Al, Fe, Mn, Mg, Ca, Na,
K and P) were determined using a Philips PW 1480 X-Ray Spectrometer using lithium
4
borate fusion discs. While trace elements (Zr, V, Sr, Ga, Cu, Zn, Ni, Co and Mo) were
determined using pressed powder pellet (only Zr presented here). The mineralogy of the
whole soil samples (<2 mm), rock samples, and 63µm and 500µm sand samples were
determined using randomly oriented samples an automated Philips X-ray Diffractometer
with Cu radiation and a graphite monochromator. Semi-quantitative analysis using peak
height was used to calculate mineral abundances.
4. Results
4.1. Characteristics of parent rock
On Mt Nelson and Tolmans Hill the dolerite is dominantly medium-grained (1-5mm)
with coarse columnar jointing. Finer medium-grained (1-3 mm) dolerite sometimes
occurs with an associated finer jointing pattern. In places, strongly weathered medium-
grained dolerite with a spheroidal weathering pattern produces a thick zone of yellowish
brown, gritty material. This weathered material extends down joints with a distinct flaky
fabric (Plate 1). Coarser medium-grained dolerite (3-5 mm), ranging from slightly to
strongly weathered, forms more reddish brown iron stained, coarse gritty mealy
material. In places calcified tree roots have precipitated in the weathering mealy
material along joint planes. The jointing density affects both deep drainage and
weathering while the grain-size affects the weathering rate, weathering pattern and soil
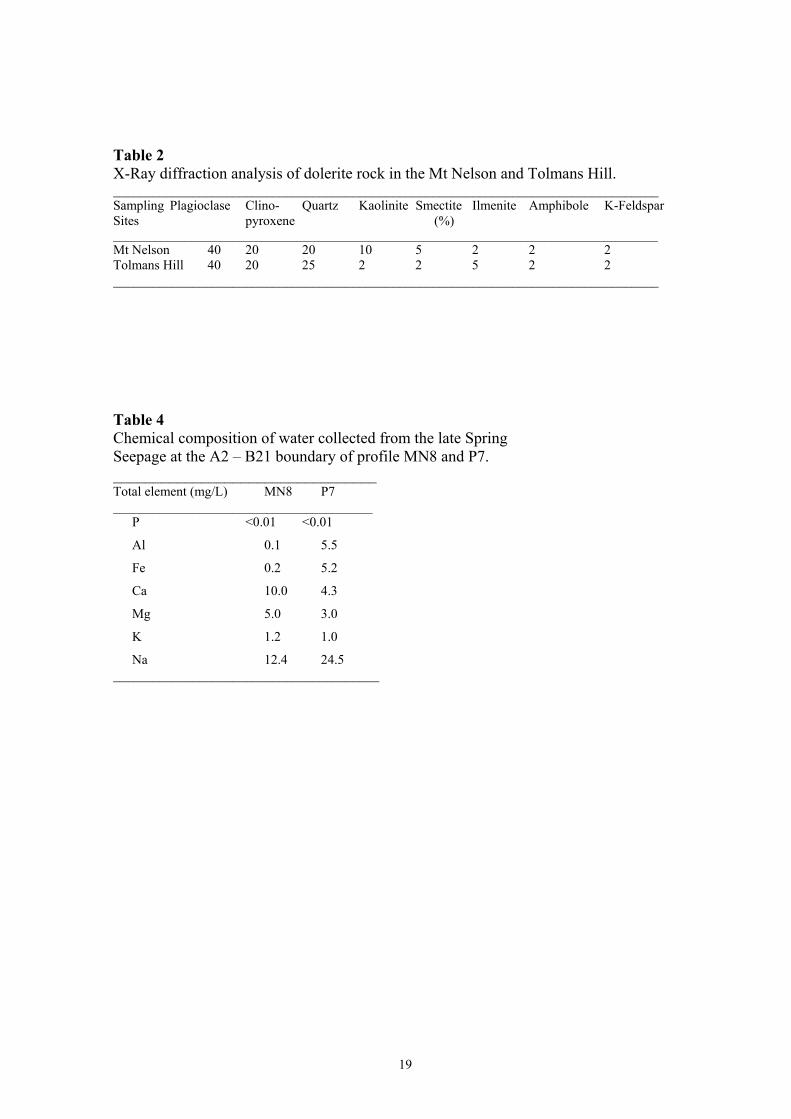
colour (Leaman, 2002). Table 2 shows that the mineralogy of the dolerite on both Mt
Nelson and Tolmans Hill consists mainly of plagioclase, clinopyroxene, quartz,
kaolinite, smectite, ilmenite, amphibole and K-feldspar. The minerals plagioclase,
clinopyroxene, amphibole and K-feldspar are quite consistent between the sites. The
medium-grained dolerite was slightly coarser on Mt. Nelson and it shows lower
amounts of quartz and higher amounts of the clay minerals kaolinite (10%) and smectite
(5%). This suggests it may be more weathered. The slightly finer medium-grained
dolerite from Tolmans Hill has slightly more ilmenite and quartz and is lower in both
the clay minerals. Table 3 shows that there are only minor differences in elemental
contents between the two sites. Mt Nelson has higher MgO, CaO and Al2O3 reflecting
the clay minerals present. Tolmans Hill is higher in SiO2 reflecting the higher quartz
levels and lower levels of clay minerals. Zirconium is a little higher in Tolmans Hill.
The main conclusion drawn for the XRD and XRF data is that the chemistry and
mineralogy of dolerite on both sites is very similar and that it has quite high SiO2 level,
and is high in Al2O3, CaO and Fe2O3. Both dolerites have moderate amounts of sodium.
5
4.2. Site characteristics and soil morphology
The five selected profiles (Figure 1) were classified according to Isbell (1996) and they
represented three important soil orders; Sodosol, Chromosol and Vertosol. Summary of
the profile descriptions (Table 1) are according to Field Handbook (McDonald, et al.,
1998). Profile P5 (Eutrophic Brown Chromosol) is well drained and is on a moderately
steep middle slope (26%) with a NE aspect. Regular dolerite outcrops occur on these
slopes and they act as a source of stones and boulders for both soils and the land surface
immediately down slope. Profile MN8 (Mottled-Subnatric Grey Sodosol) is moderately
well drained and is on shoulder of the NE slope at Mt Nelson. The site is on a gentle
slope (8%) section that gives way to a steeper valley slope and an incised gully. A few
dolerite outcrops are found on this slope and they become very common on the steeper
lower slopes. They are the source of coarse fragments for soils forming immediately
down slope. Profile P4 (Mottled-Subnatric Grey Sodosol, Plate3) is located on the
lower part of a SW facing mid-slope of Mt. Nelson with imperfectly drained. The slope
angle is 26% and rock outcrops are common along the slope. Profile P7 (Mottled-
Mesonatric Grey Sodosol, Plate 2) is poorly drained and forms in a drainage depression
descending the Tolmans hill crest. The site has a 10% slope and NE aspect. Dolerite
outcrops are common surrounding the site and they provide sources for surface and
profile stones. Profile P8 (Black Vertosol) is a dark cracking clay soil that occupies the
lower part of a NE facing slope (16%) descending the Mt Nelson plateaux-crest. It
extends up slope until a marked break in slope at 280 m where slope angle decreases
and texture contrast soils develop. Dolerite outcrops are common and are the source of
scattered surface and stone-line coarse fragments.
Profiles P5, MN8, P4 and P7 are all texture-contrast profiles or duplex in the scheme of
Northcote (1960). They have fine sandy surface horizon capping gritty clay B horizons
and the presence of a stone-line composed of dolerite fragments and ferruginous
nodules marks the abrupt topsoil-subsoil boundary. Large pebbles (20-60 mm) with
sub-rounded to angular shapes are dominant in P5 and MN8 indicating poor sorting and
short transport distances. The weak weathering of the fragments (weathering rinds < 2
mm) indicates a source of fresh bedrock exposure up slope. In the lower slope and
wetter sites, P4 and P7, the dolerite fragments consist of more rounded large pebbles
(20-60 mm) and few cobbles (60-200 mm). The abundance of ferruginous nodules also
increases in the A2 and B21 horizons of P4 and P7. This is associated with more severe
6
and more regular redox phases in these profiles (Rhoton et al., 1993). Gleyic colouring,
mottling and massive structure are prominent features (P4 and P7). Large pebbles and
cobbles that form stone-lines cannot have been sourced from the in situ bedrock beneath
as the stone-line and fresh rock are separated by highly weathered mealy dolerite or the
C horizon. The four texture-contrast profiles also exhibit a distinctive grittiness in the
clayey B2 and B3 horizons. The grittiness increases with depth due to an increased
content of the lithic fragments that appear to have been derived from disaggregation and
transport of the formerly exposed mealy layers up slope. The B2 horizons tend to be
blocky structured when dry but appear massive when wet which induces lateral
moisture seepage along their upper boundary, a marked textural hiatus. Profile P5 has a
high chroma and value in the B2 horizons indicates better drainage, while the presence
of ochreous mottling in the B21 horizon of the MN8, P4 and P7 indicates Winter-Spring
wetness. Profile P8 exhibits weaker differentiation of soil horizons probably due to
shrinking-swelling properties as indicated by common medium to coarse cracks (5-20
mm) above the B2 horizon. Profile P8 has a fine sandy A1 horizon and then grades to
clay loam and heavy clay with depth. Profile P8 has a more diffuse stone-line, which is
discontinuous along the boundary of the A12 horizon and A3 horizon. The more
gradational nature of this soil and the less distinct stone-line is probably a reflection of
the pedo-turbation. In P5 and P7, a B3 horizon occurs below the B22 horizons and
contains more gritty lithic fragments, however it does not have the distinctive rock
fabric or vein features as found in the C horizon and are considered transported
materials. The subsoils of all profiles overlie weathering in situ dolerite termed “mealy”
material or C horizon (Nicolls, 1958). In P8, the mealy layer has been divided into an
upper more clayey C1 and less clayey C2 horizons. The C horizon appears to be formed
from weathering in place due to the presence of bedrock weathering features such as
veins and rock fabric that extend upper-ward from the fresh rock into the mealy layer.
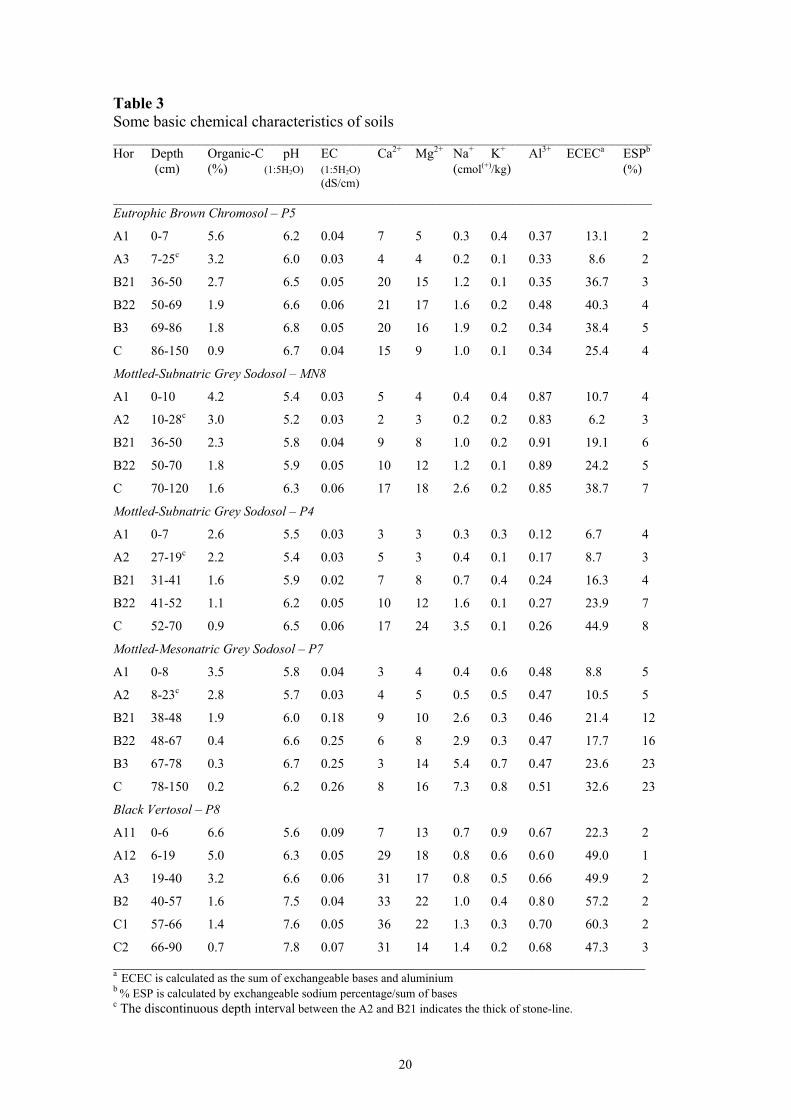
4.3. Key chemical characteristics of soils
Basic soil chemical parameters were determined to measure the influence of pedogenic
processes on the profile (Table 4). Organic matter accumulation, cation leaching and
strong pH depth trends appear as the key pedogenic influences on the soil materials.
Organic carbon is high in the surface horizon of all profiles and decreases rapidly with
depth. The soil pH is slightly acid at the surface horizon of all profiles, and tends to
increases with depth. The slight decrease of pH in the A2 (MN8, P4, P7) and A3
7
horizons (P5) reflects the leaching of Ca2+ by lateral seepage (Table 5). Profile P8
shows the most dramatic increase in pH with depth, from slightly acid in the A11 and
A12 surface to slightly alkaline in the B2 and moderately alkaline in the C horizon. The
increase of pH in the lower horizons of the all profiles is linked to the dominance of
Ca2+ and Mg2+ ions on exchange complex in the B2, B3 and C horizons. Exchangeable
Ca2+ and Mg2+ show an abrupt change in the all profiles. They dominate the B21 and
B22 horizons and tend to increase with depth. Profile P8 has the highest levels of
exchangeable Ca2+ and Mg2+ throughout the profile. The high ECEC in the B and C
horizons of all profiles are more related to higher clay content, and the presence of
smectite. The poorer drained profiles (P4, P7) have higher sodicity in the B and C
horizons. Sodicity increases with site wetness and is quite dramatic in the wetter
subsoils. Sodium has been shown to be the major ion in rainwater in eastern Tasmania
(Jackson, 2000). Thus Na is continually supplied and leached through the landscape
and can accumulate in the lower lying profiles. Profile P7 has the highest subsoil
electrical conductivity values and it is classified as slightly saline (0.26 dS/m).
The chemical composition of seepage water sampled at the A2-B21 boundary of MN8
and P7 highlights the movement of large amounts of Na, Fe and Al is critical for both
the formation of ferruginous nodules and the development of sodicity (Table 5).
Calcium and Na dominate the lateral drainage water from MN8. The data highlight the
movement of the exchangeable cations in particular Ca and Na in both soils (MN8 and
P7), and the mobility of Fe and Al in the wetter site (P7).
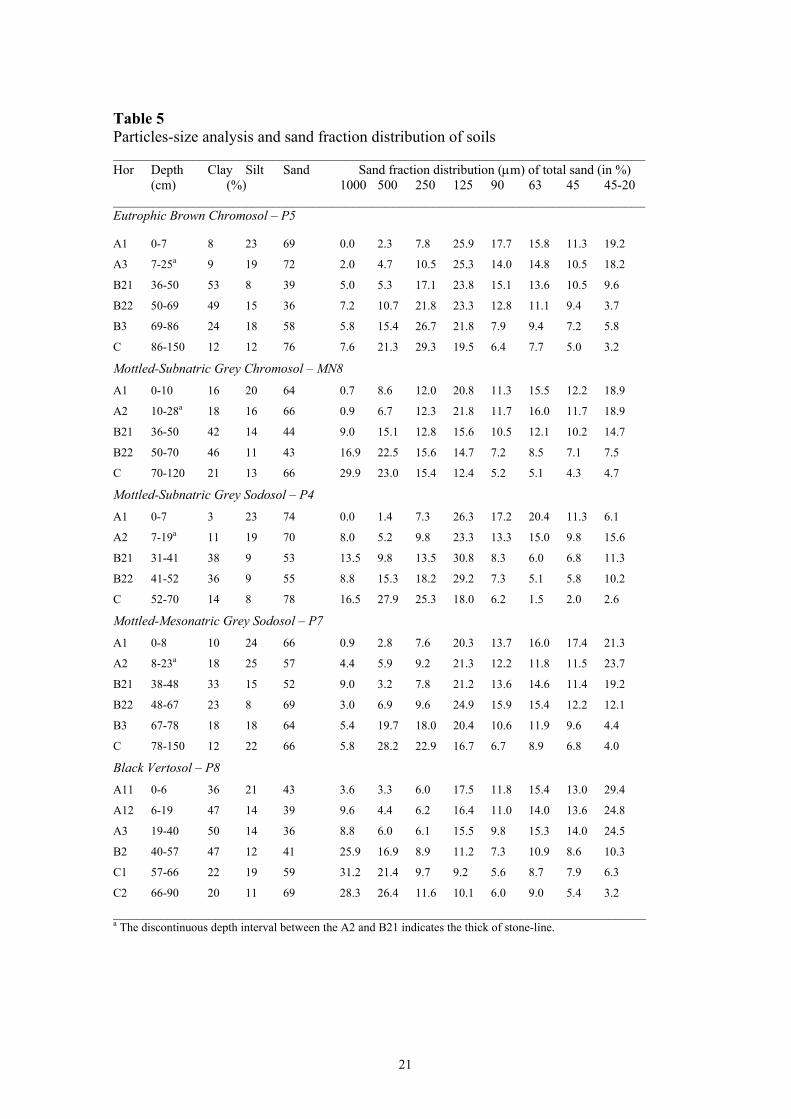
4.4. Particle size distribution
The results of particle size analysis (Table 6) show a marked difference in the size
fractions with depth of all profiles, in particular the changes from the A horizons to the
B2 horizons, and from the B22/B3 horizons to the C horizon. The better-drained
profiles (P5, MN8) express this most clearly highlighting the three very differently
textured materials in the profiles. Silt is also highest in the surface of all profiles. Clay
contents abruptly increase in the B21 horizons of all soils and then generally decrease
with depth in B22 and B3 horizons. Clay contents then drop abruptly in the C horizon.
Detailed analysis of sand fractions were undertaken to clarify the field textures which
indicated that although both the topsoils and the mealy substrate were both sandy they
were quite different sand fractions. There are significant changes in sand-size
distributions with depth in all profiles. All surface horizons are dominated by fine (<125
µm) to very fine (45-20 µm) sand while the mealy substrate is dominated by the coarser
8
sand fractions. There is an abrupt increase in the coarser sand fractions (>250 µm) of all
the B2 horizons, except for profile P7 that occurs in a drainage depression. The coarser
sand in the lower horizons is composed almost entirely of dolerite lithic fragments and
ferruginous nodules. The high fine sand fraction in all the surface horizons (A1, A2 and
A3) concurs with the high silt contents and supports the notion of exotic aeolian
provenance (loess). A distinct clay bulge occurs in all subsoils commonly the B21 or
A3 horizon. The source of the clay is likely to be from slope wash derived from sub-
aerially exposed mealy layers up slope, as it is bimodal, being both gritty and clayey.
The mealy layer (C horizons) at the base of all soils is considered to be in-situ
weathered material and contain moderate amounts of both clay and coarse sand. Silt
distribution shows a distinct maximum in the surface horizons (A2, A3) of all profiles.
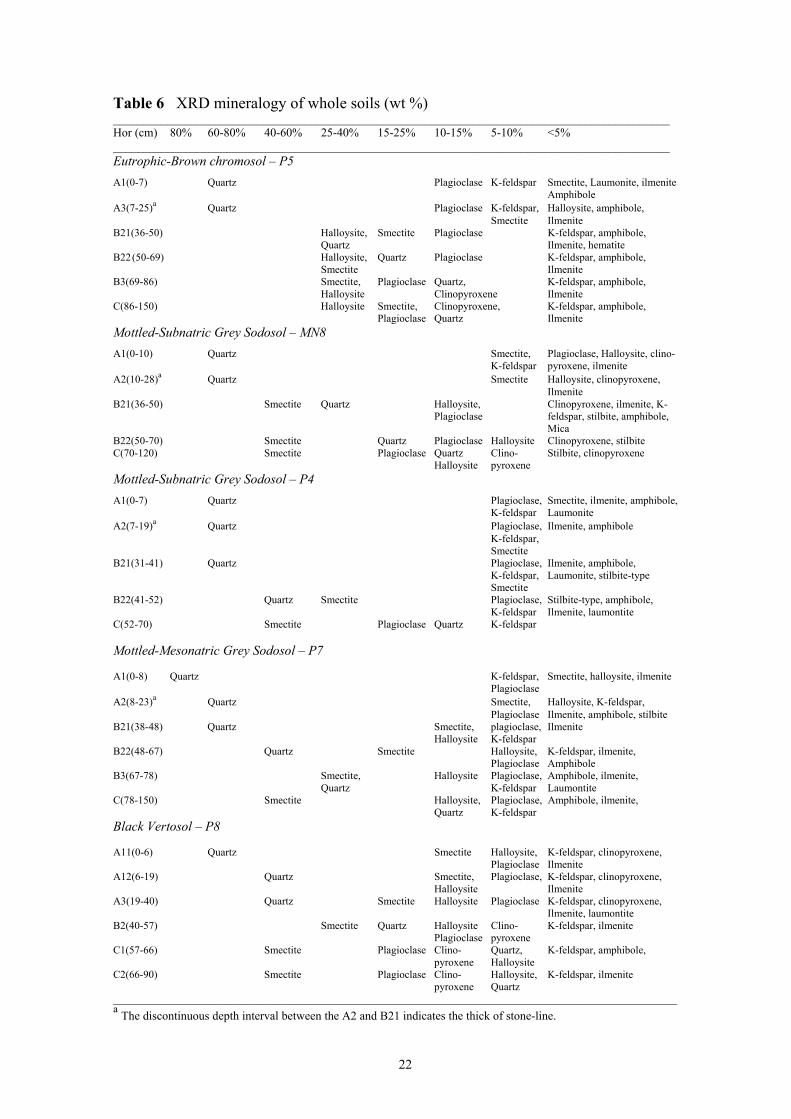
4.5. Mineralogy of soils
The distribution of soil minerals in all profiles (Table 7) varies abruptly with depth thus
adding support to the field stratigraphy identified. Quartz is the most abundant mineral
in the all A horizons of all profiles. Quartz is greater that 80% in the A1 horizon of P7
and is 60-80% in the surface horizon of all other soils despite fresh dolerite containing
only 20% quartz (Table 2). Quartz remains high (60-80%) in the A2 and A3 (P5) except
P8 where it is (40-60%). In both better-drained soils (P5, MN8), quartz drops abruptly
to 25-40% in the B21 and to 15-25% in the B22 horizons. In the wetter soils (P4, P7),
quartz remains high in the B21 and B22 suggesting more active winnowing of clays by
slope wash. In these soils fine sand was observed lining shrinkage cracks in the B2
horizons, having been washed there from the sandy A2 horizons or the upper horizons.
The in situ weathered mealy layer (C horizon) contains only 10-15% quartz, which is
less than the fresh dolerite (20-25%). This suggests that differential weathering in place
does not concentrate quartz, by contrast some quartz may be weathered to clays or lost
by leaching. This lost quartz probably reflects the prolonged weathering of the in situ
mealy layer. The marked difference in quartz distribution indicates at a partly exotic
source of quartz. While localised winnowing by slope wash may provide an efficient
supply, aeolian accession from adjacent siliceous parent materials is compatible with the
high fine sand and silt fractions common to the upper part all profiles.
The C horizon (mealy layer) of all soils is dominated by plagioclase, quartz and
clinopyroxene, and smectite and halloysite, the same minerals that dominate fresh
dolerite. Plagioclase and clinopyroxene appear to have suffered the greatest losses due
9
to weathering and result in the formation of smectite and halloysite. The absence of
clinopyroxene in the P4 and P7 indicates it may also have been altered to amphibole by
earlier hydrothermal weathering (Sutherland, 1997; Leaman, 2002). Plagioclase content
progressively increases with depth highlighting its low resistance to both weathering
and subaerial transport. On higher landscape positions or in the better-drained profiles
(P5, MN8) smectite shows a sharp increase from the surface to the B2 horizons, while
on the lower landscape position the wetter sites (P4, P7) and P8 smectite content is more
constant with depth. In the B2 horizons, halloysite dominates the well-drained soil (P5)
and smectite dominates the poorer drained profiles (P4, P7, and P8). Ilmenite,
amphibole and laumonite show no significant changes with depth. Stilbite, an alteration
product associated with hydrothermal environments and as discussed earlier may
indicate ancient hydrothermal weathering of dolerite in some parts of the landscape.
X-ray diffraction analysis of the 500 µm and 63 µm sand fractions supports the idea of
sedimentary layering in the solum (Table 8). Quartz is highly concentrated in both
coarse and fine sand fraction of the A and B horizons, while the C horizon is dominated
by plagioclase. The highest proportion of quartz is found in the 63 µm sand fraction of
the A1 and A2, typical of loess (Margolis and Krinsley, 1971, Mokma et al, 1972). The
sharp break in the distribution of 63 µm quartz between the B22 (50-60%) and C
horizons (10-15%) supports the notion of the transported nature of the subsoil. K-
feldspar occurs in greatest proportion in the A1 and A2 of coarse fraction (500 µm) and
in the B21 and B22 and is probably derived by slope-wash from exposed mealy
materials upslope. Profile MN8 and P7 support this as no K-feldspar was detected in
the mealy layer but K-feldspar is present at 5-10% levels in the surface. The presence
of both plagioclase and smectite in the coarse and fine sand fraction of the C horizon in
MN8 indicates that the smectite maybe forming inside the plagioclase crystals on
weathering as indicated by Taboada and Garcia (1999). The presence of 5-10% hematite
in the 500 µm sand fraction of A1 and A2 (MN8) is associated with fine ferruginous
nodules.
4.6. Distribution of selected elements in the profiles
Examination of the data in Table 9 should be made with reference to Table 3. Silica,
TiO2 and Zr are all significantly higher in the upper horizons of all profiles (Table 9).
A dramatic decrease in SiO2 and TiO2 occurs in the B21 of the P5 and MN8, although
the values are still higher than fresh dolerite. Despite the chemical weathering evident in
10
the C horizon, they contain similar amounts of SiO2, Zr and TiO2 as dolerite bedrock.
This supports the idea that weathering alone has not lead to the relative concentration of
these elements in the upper layers, some degree of sedimentary winnowing or exotic
providence is required. Potassium is higher in the upper horizons of all profiles and is
most affected by the amount of K-feldspar present, which is relatively resistant to
weathering (Goldich, 1938). K-feldspar is elevated in the surface horizon of all texture-
contrast soils and is considered detrital. The lower SiO2 level in the B21 of P7 reflects
the higher content of ferruginous nodules and hence iron oxide content at this wet site.
Both Al2O3 and Fe2O3 follow similar trends with depth. They have the second and third
highest concentration in all profiles. They are low in the upper sandy surface horizons
and sharply increased in the B21 and B22 horizons. The rapid increase in Al relates to
the increase in clay content while the increase in Fe relates to the presence of
ferruginous nodules in both B21 and A2 horizons. In poor-drained profile (P7), the
marked decrease in Al2O3 and Fe2O3 in the B22 corresponds with a peak in SiO2. The
content of both Al and Fe oxides in the lower horizons (B3, BC and C horizons) is
similar to that of fresh dolerite and suggests little loss of released Al and Fe on
weathering. These elements are thus retained in clay minerals and Fe oxides in the
weathered fraction and not lost through leaching. This contrast with the upper sandy
horizons where transport and winnowing of clays has lead to much lower amounts of
both Al and Fe oxides. More mobile elements such as Ca, Mg, and Na exhibit strong
relative losses from all the upper layers where sub-aerial weathering and transport have
depleted these elements due to loss of plagioclase feldspars and smectite. A marked
increase in the content of Mg, Ca and Na occurs between the A2 or A3 and the B21
horizon in the two better-drained soils (P5, MN8). Both Ca and Mg are more depleted,
by leaching, from the wetter sites, especially P7 and these elements accumulate in the
lower profiles of the drier sites of P8 and P5. Manganese is more mobile under
anaerobic conditions (McKenzie, 1977) and it is thus not surprising that Mn is much
higher in the better-drained profiles (P5, P8) than in the poorly drained sites (P4, P7).
Zirconium is highest in the A1, A2 and A3 of all profiles reflecting its presence in the
weathering-resistant, detrital mineral zircon. This difference also supports the
assumption of a discontinuity of soil material between the upper profiles (A1 and A2,
A3) and the subsoils. Zirconium then decreases with depth in the subsoils reflecting
their origin as re-worked mealy material, derived locally from upslope. Zirconium is
lowest in the C horizon despite the dominance of clay minerals indicating strong
11
alteration of this horizon. Thus weathering in situ does not appear to increase zirconium
content while increased intensity of sub-aerial winnowing and transport does.
5. Discussion
Examination of the five soil profiles and analytical data presented indicate that at least
four separate soil stratigraphic materials can be identified on soils formed above
dolerite. Only the mealy weathered dolerite (C horizon) and the bedrock itself appear
in-situ. Pedogenic modification has altered the character of some materials such that the
soil matrix colours, mottling and ferruginous nodule abundance vary with drainage
condition. Organic matter accumulation and lower pH values in the upper profile further
reflect pedological influences. Soil structure is also affected by pedological processes
such as exchangeable Na+, organic matter levels and shrinkage on drying. Halloysite
appears to be more abundant in the better-drained soils. However, soil texture, stoniness
and mineralogy highlight an inherited soil stratigraphy, which greatly impacts on the
sequence of soil horizons present. Four key separable materials are identified as
follows:
1) A loamy fine sand A1 horizon with relatively free coarse fragments and having a
soft powdery structure forms the 4-6 cm deep topsoil. This layer is dominated by
quartz and has high amounts of Zr, SiO2 and TiO2 which typically occur in resistant
sand fraction minerals. The layer has high silt and fine sand contents and aeolian
influxes are considered highly likely. The A2/A3 horizon below is typically fine
sandy. In wetter sites (P4, P7) this material develops a gleyic character (A2 type
horizon; McDonald et al 1998), while at drier (P5, P8), sites it forms a lower topsoil
(A3 type of horizon).
2) A dolerite stone-line separates the A2 from the clayey B21 horizon lying below.
This sedimentary lag is partly incorporated into the A2 above and the B21 below.
The stones range in size from 20-200 mm and vary in shape from sub-rounded to
angular. In some soils dolerite of much finer grain size was noted in the stone-lines
than the dolerite underlying the profile clearly demonstrating it is sourced from
further upslope. Very thin, <2mm, weathering rinds suggest the stone lines are a
moderately recent feature.
3) Plastic, tough, compact, gritty and/or sandy clay. This clay horizon forms a B21
horizon and the matrix color and mottling are affected by topographic position. In
profiles on gentle slopes (MN8) the clay has orange mottles while on steep convex
12
slopes (P5) the clay is brown to reddish brown. On lower slopes this clay material is
very dark brown to black (P8) while in topographic depressions (P7) it is quite
mottled and grey. At most sites this horizon is underlain by blocky, plastic, gritty
sandy clay, which forms a B22 horizon. This clayey B22 material is similar to the
B21 above but contains more grit and may have gleyic features if it contacts
compact mealy substrate (hydraulic hiatus).
4) “Mealy” material forming an in situ gritty C horizon. This material and the dolerite
rock below are the only parts of the profile in situ. It forms a gritty material
composed of weathering dolerite rock and can be seen to grade into the underlying
fresher rock by a series of spheroidal weathering clasts and a flaky structured mealy
dolerite extending down joints.
The presence and significance of stone-lines in soils has been reported previously by
Parizek and Woodruff (1957), Ruhe (1958) and Moeyersons (1989). The wide variation
in size and shape of the stones support the notion they are transported or the product of
sedimentary processes (Finkl and Churhward, 1976). Ruhe (1958) indicates that the
presence of stone-lines in a soil profile indicates that the soils have formed from more
than one material. The occurrence of stone-lines on a marked textural hiatus is
associated with restricting water movement in several of the studied soils.
Seepage water sampled during the wet Winter-Spring period (2001) indicated that Na,
Ca and Mg were the major ions moving through the drainage waters of moderately well
drained soil (MN8). In addition Fe and Al were mobile in the poor drained soil (P7).
The alternating wet and dry conditions also promotes the formation of Fe-nodules at this
textural hiatus (Rhoton et al., 1993).
The extremely high quartz contents in the soil above the stone-line of texture-contrast
soils (P5, MN8, P4, P7) and above the A3 of Black Vertosol (P8) indicate the detrital
nature of the material. The very high amounts of smectite in the C horizon of all soils
indicates that smectite is the key weathering product of dolerite and its formation
indicates a low leaching weathering environment. Its formation appears to be due to in
situ weathering of plagioclase and pyroxene. The moderate levels of smectite in the
B21 and B22 of all profiles and its presence in the A1 and A2 horizons suggests it is
resilient to sub-aerial exposure and slope wash. This also indicates a low leaching
weathering environment has been a feature of this landscape for some considerable
time.
13
The high content of quartz in both the coarse and fine sand fraction in the upper profiles
and the high K-feldspar in the coarse sand fraction support the notion of sedimentary
winnowing and concentration of resistance mineral components. These resistant
minerals occur in very low levels in the weathered mealy layer (C horizon).
The evidence of elemental distribution shows that the resistant oxides of silicon,
zirconium and titanium are very high and retained in the surface layers above the stone-
line, but decrease markedly in the subsoil and drop further still in the mealy material. In
the mealy layer most elements show little difference in concentration from that of fresh
dolerite bedrock other than a slight loss in Si. The wetter sites (MN8, P4, P7) also show
loss of Ca while the better-drained sites (P5, P8) show loss of both K and Na through
leaching. This data strongly suggest the mealy layer or C horizon has weathered in place
in a low leaching aerobic environment.
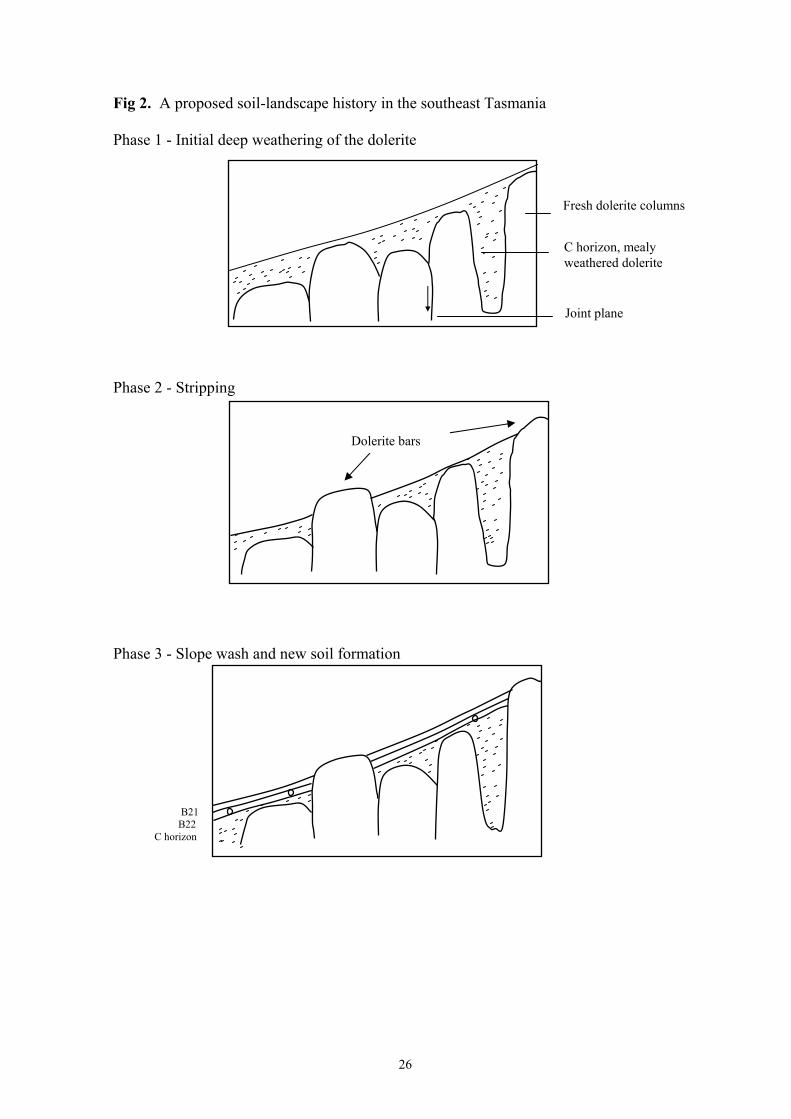
6. History of soil development
Outlined below is a proposed soil-landscape history based on the data presented above
and field examination of the soil pattern (Figure 2).
Phase 1 – Initial deep weathering of the dolerite
A period of extended soil formation and deep weathering of the dolerite during which a
deep weathering profile developed, remnants of which can be seen protected behind
fresh dolerite bars on Mt Nelson and Tolmans Hill. The modern day irregular pattern
of deeply weathered zones of dolerite adjacent to fresh rock may indicate fractures in
the dolerite were important for the pattern of weathering. The fractures would allow
water and possibly hydrothermal activity to localised and accelerate weathering.
Phase 2 – Stripping
Deep weathering was followed by regional stripping over much of the soil landscape.
This left a truncated soil consisting simply of an in situ, gritty, mealy layer above the
less weathered dolerite and protected deeper weathered soils behind dolerite bars.
Much of this stripping may have occurred during the various glacial phases of the
early-mid Pleistocene, accelerated by frost action and slope wash (Colhoun, 2002).
Phase 3 – Slope wash and new soil formation
14
Some time following landscape stripping re-working of the exposed mealy materials
has provided sediment to generate the gritty and clayey B22 and less gritty B21. These
materials were probably exposed for a short period of soil formation and weathering.
The presence of floaters within the B2’s with only thin weathering rinds indicates the
brevity of landscape stability.
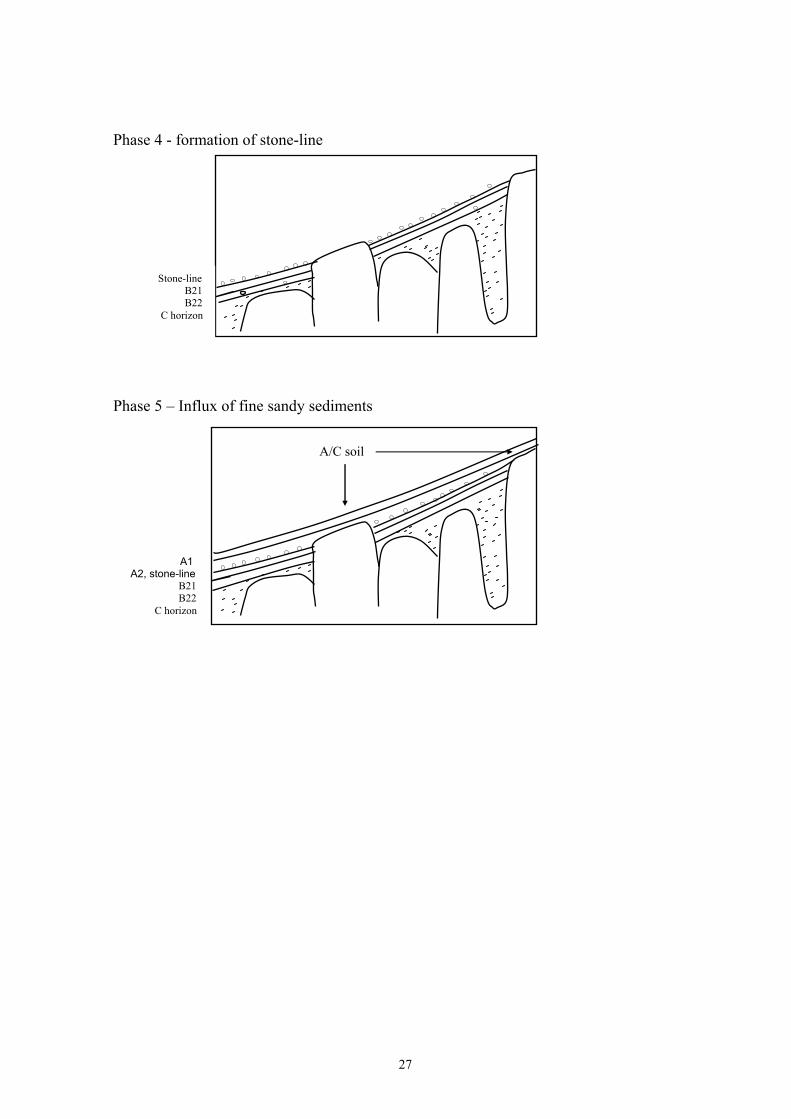
Phase 4 – Formation of stone-line
Following an unknown period of soil weathering a deposit of coarser material has
mantled the B21 and B22s forming a distinct stone-line in the landscape. These stones
are likely to have been derived from freeze-thaw processes acting on exposed outcrops,
associated with the last and coldest part of the last Glaciation (18 Ka BP). Indeed their
movement though the landscape is likely to have been accelerated by peri-glacial
environments.
Phase 5 – Influx of fine sandy sediments
The stone-lines have been capped by fine sandier materials dominated by quartz. Given
the silty and fine sandy particle-size distribution and very high quartz content it is
likely that much of the upper soil is foreign to the local landscape i.e., it is reworked
loess. Quartz rich sources abound the broader regional geology (Triassic and Permian
sediments; Figure 1) and aeolian deposits are common to all eastern regions of
Tasmania (Loveday 1957, Nicolls, 1958a, Sigleo and Colhoun, 1982; McIntosh, 1999
and Colhoun, 2002). Thus the conclusion drawn here is that a good proportion of the
upper profile is aeolian derived, though subject to local reworking by slope wash
processes and pedo-turbation.
6. Conclusions
This study of five selected soils on dolerite suggests that the occurrence of texture-
contrast soils and a Black Vertosol are formed in materials related to erosional-
depositional landscape history of the study area. At least four soil materials can be
identified and separated using field and laboratory analysis and only the C horizon
(mealy layer) is in-situ. Pedogenesis has affected mottling, bleaching, soil colours,
organic matter levels, ferruginous nodule formation, sodicity and soil pH trends.
However, the mineralogy, soil textures and their changes down the profile are largely
determined by sedimentary deposited materials. Clay translocation cannot be invoked
15
to explain the texture contrast in the profiles, in fact the reverse was noted as in several
profiles fine sand was seen to have migrated down shrinkage cracks for the A2 to the
B2 horizons. In situ weathering occurs in the mealy layer as indicated by the decrease
in quartz, plagioclase and clinopyroxene and the increase in smectite and only minor
changes in chemistry. The mealy material (C horizon) also exhibits bedrock features
such as veins and rock fabric. Very high levels of quartz occur in the A horizons and
high levels in the B horizons. Such concentration requires a winnowing sedimentary
process given the low amounts of quartz in the dolerite bedrock. The peaks in resistant
oxides of silicon, titanium, and zirconium particularly in the A horizons but also the B
horizons strongly suggests sedimentary action. The presence of stone-lines between
the topsoil and the subsoil layers demonstrates the separation of layers and sedimentary
nature of the upper profile. These findings indicate two major erosion–deposition
cycles have occurred that have important implications for landscape history, slope
processes, weathering and the factors affecting soil occurrence in southeast Tasmania.
Acknowledgements
We would like to express our thanks to the Australian Agency for International
Development (AusAID) for financial support of this study.
References
Colhoun, E.A., 2002. Peri glacial landforms and deposits of Tasmania. South Africa
Journal of Science, 98: 55-63.
Finkl, Jnr, C. W and Churhward, H.M., 1976. Soil stratigraphy in a deeply weathered
shield landscape in South-western Australia. Australian Journal of Soil Research,
14, 109-120.
Goldich, S.S., 1938. A study in rock weathering. J. Geology, 46, 17-58
Isbell, R.F., 1996. The Australian soil classification. CSIRO Australia.
Jackson, W.D., 2000. Nutrient stocks in Tasmanian vegetation and approximate losses
due to fire. Paper and Proceeding of the Royal Society of Tasmania, 134, 1-18.
Leaman, D.E., 2002. The rock, which makes Tasmania. Leaman Geophysics, Hobart,
Tasmania.
Loveday. J., 1957. The soils of the Sorell Carlton- Copping area, Southeast Tasmania
with special references to the soil formed on basalt. Soil publication no.48,
CSIRO Melbourne.
16
McBride, M.B., 1994. Environmental chemistry of soils. Oxford University Press, Inc.
Toronto.
McDonald R.C., Isbell R.F., Speight J.G., Walker J. and Hopkins M.S., (1998),
Australian soil and land survey – Field handbook. Second edition. Australian
Collaborative Land Evaluation Program, CSIRO Land and Water, Canberra.
Margolis and Krinsley. 1971. Submicroscopic frosting on aeolian and subaqueous
quartz sand grain. Geological Society of America Bulletin, 82, 3395-3406.
McIntyre, D.S., Loveday, J., 1974. Particle-size analysis. In: Loveday, J. (Eds.).
Methods for analysis of irrigated soils. Commonwealth Agriculture Bureau
Technology Communication, 54, 88-99.
McKenzie, R.M. 1977. Manganese Oxide and Hydroxides. In: Dixon, J.B., Weed, S.B.,
Kittrick, J.A., Milford, M.H and White, J.L. (Eds.), Minerals in soil
environments. Soil Science Society of America, Madison, Wisconsin, USA, pp.
181-191.
McIntosh, P.D., 1999. Problem soils: Aeolian deposits on dolerite. Forest Practices
News, 1,1, 17.
Moeryersons. J., 1989. The concentration of stones into stone-lines, as a result from
subsurface movements in fine and loose soils in the tropics. Geo-Eco-Trop., 11,
11-22.
Mokma, D.L., Syers, J.K. and Jackson, M.L., 1972. Aeolian addition to soils and
sediments in the South Pacific area. J. Soil Science, 23, 2, 147-162.
Nicolls, K.D., 1958. Soil formation on dolerite in Tasmania. In: Carey, W., (Eds.)
Dolerite – a symposium. Department of Geology, University of Tasmania 1957,
pp 204-211.
Nicolls, K.D., 1958a. Aeolian deposits in river valleys in Tasmania. Australian Journal
of Science, 21, 50-51.
Northcote, K.N., 1960. ‘A Factual Key for the Recognition of Australian Soils’.
CSIRO Division of Soils. Report No.4/60. CSIRO, Melbourne.
Parizek, E. J and Woodruff, J.F., 1957. Description and origin of stone layer in soils of
the south-eastern states. J. Geology, 65, 24-34.
Rayment, G.E and Higginson, R.E., 1992. Australian Laboratory Handbook of Soil and
Water Chemical Methods. Inkata Press, Melbourne. Australia.
17
Rhoton, F.E., Bigham, J.M and Schulze, D.G., 1993. Properties of iron-manganese
nodules from a sequence of eroded fragipan soils. Soil Science Society of
American Journal, 57, 1386-1392.
Ruhe, R.V., 1959. Stone lines in soils. J. Soil Science, 87, 223-231
Sigleo, W.R. and Colhoun, E.A., 1982. Terrestrial dunes, man and the late quaternary
environment in southern Tasmania. Paleogeography, Palaeoclimatology,
Paleoecology, 39, 87-121.
Sutherland F.L., 1977. Zeolite minerals in the Jurassic dolerites of Tasmania: Their use
as possible indicators of burial depth. J. Geological Society of Australia, 24, 3,
171-178.
Taboada, T and Garcia, C., 1999. Smectite formation produced by weathering in a
coarse granite saprolite in Galicia (NW Spain). Catena, 35, 281-290.
Tiller, K.G., 1962. Weathering and soil formation on dolerite in Tasmania with
particular reference to several trace elements. Australian Journal of Soil
Research, 1, 74-90.
18
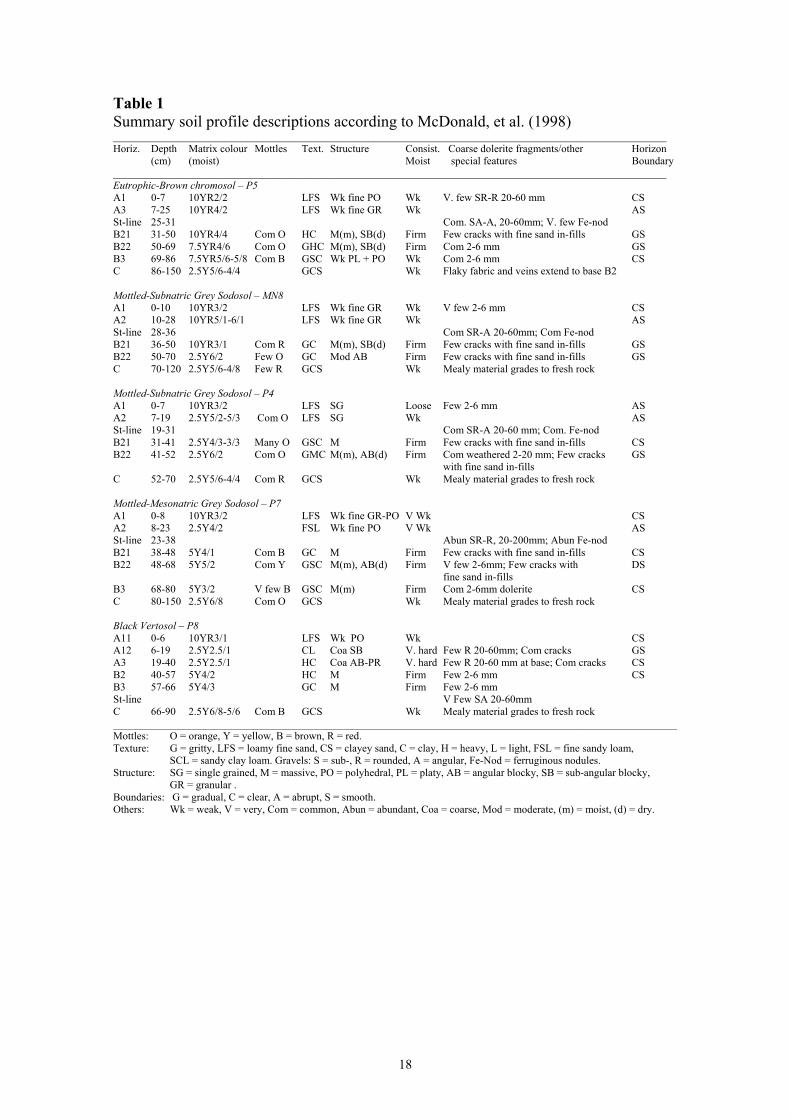
Table 1 Summary soil profile descriptions according to McDonald, et al. (1998) ________________________________________________________________________________________________________ Horiz. Depth Matrix colour Mottles Text. Structure Consist. Coarse dolerite fragments/other Horizon
(cm) (moist) Moist special features Boundary ________________________________________________________________________________________________________ Eutrophic-Brown chromosol – P5 A1 0-7 10YR2/2 LFS Wk fine PO Wk V. few SR-R 20-60 mm CS A3 7-25 10YR4/2 LFS Wk fine GR Wk AS St-line 25-31 Com. SA-A, 20-60mm; V. few Fe-nod B21 31-50 10YR4/4 Com O HC M(m), SB(d) Firm Few cracks with fine sand in-fills GS B22 50-69 7.5YR4/6 Com O GHC M(m), SB(d) Firm Com 2-6 mm GS B3 69-86 7.5YR5/6-5/8 Com B GSC Wk PL + PO Wk Com 2-6 mm CS C 86-150 2.5Y5/6-4/4 GCS Wk Flaky fabric and veins extend to base B2 Mottled-Subnatric Grey Sodosol – MN8 A1 0-10 10YR3/2 LFS Wk fine GR Wk V few 2-6 mm CS A2 10-28 10YR5/1-6/1 LFS Wk fine GR Wk AS St-line 28-36 Com SR-A 20-60mm; Com Fe-nod B21 36-50 10YR3/1 Com R GC M(m), SB(d) Firm Few cracks with fine sand in-fills GS B22 50-70 2.5Y6/2 Few O GC Mod AB Firm Few cracks with fine sand in-fills GS C 70-120 2.5Y5/6-4/8 Few R GCS Wk Mealy material grades to fresh rock Mottled-Subnatric Grey Sodosol – P4 A1 0-7 10YR3/2 LFS SG Loose Few 2-6 mm AS A2 7-19 2.5Y5/2-5/3 Com O LFS SG Wk AS St-line 19-31 Com SR-A 20-60 mm; Com. Fe-nod B21 31-41 2.5Y4/3-3/3 Many O GSC M Firm Few cracks with fine sand in-fills CS B22 41-52 2.5Y6/2 Com O GMC M(m), AB(d) Firm Com weathered 2-20 mm; Few cracks GS with fine sand in-fills C 52-70 2.5Y5/6-4/4 Com R GCS Wk Mealy material grades to fresh rock Mottled-Mesonatric Grey Sodosol – P7 A1 0-8 10YR3/2 LFS Wk fine GR-PO V Wk CS A2 8-23 2.5Y4/2 FSL Wk fine PO V Wk AS St-line 23-38 Abun SR-R, 20-200mm; Abun Fe-nod B21 38-48 5Y4/1 Com B GC M Firm Few cracks with fine sand in-fills CS B22 48-68 5Y5/2 Com Y GSC M(m), AB(d) Firm V few 2-6mm; Few cracks with DS fine sand in-fills B3 68-80 5Y3/2 V few B GSC M(m) Firm Com 2-6mm dolerite CS C 80-150 2.5Y6/8 Com O GCS Wk Mealy material grades to fresh rock Black Vertosol – P8 A11 0-6 10YR3/1 LFS Wk PO Wk CS A12 6-19 2.5Y2.5/1 CL Coa SB V. hard Few R 20-60mm; Com cracks GS A3 19-40 2.5Y2.5/1 HC Coa AB-PR V. hard Few R 20-60 mm at base; Com cracks CS B2 40-57 5Y4/2 HC M Firm Few 2-6 mm CS B3 57-66 5Y4/3 GC M Firm Few 2-6 mm St-line V Few SA 20-60mm C 66-90 2.5Y6/8-5/6 Com B GCS Wk Mealy material grades to fresh rock __________________________________________________________________________________________________________ Mottles: O = orange, Y = yellow, B = brown, R = red. Texture: G = gritty, LFS = loamy fine sand, CS = clayey sand, C = clay, H = heavy, L = light, FSL = fine sandy loam, SCL = sandy clay loam. Gravels: S = sub-, R = rounded, A = angular, Fe-Nod = ferruginous nodules. Structure: SG = single grained, M = massive, PO = polyhedral, PL = platy, AB = angular blocky, SB = sub-angular blocky, GR = granular . Boundaries: G = gradual, C = clear, A = abrupt, S = smooth. Others: Wk = weak, V = very, Com = common, Abun = abundant, Coa = coarse, Mod = moderate, (m) = moist, (d) = dry.
19
Table 2 X-Ray diffraction analysis of dolerite rock in the Mt Nelson and Tolmans Hill. __________________________________________________________________________________ Sampling Plagioclase Clino- Quartz Kaolinite Smectite Ilmenite Amphibole K-Feldspar Sites pyroxene (%) ___________________________________________________________________________________________ Mt Nelson 40 20 20 10 5 2 2 2 Tolmans Hill 40 20 25 2 2 5 2 2 __________________________________________________________________________________
Table 4 Chemical composition of water collected from the late Spring Seepage at the A2 – B21 boundary of profile MN8 and P7. _________________________________ Total element (mg/L) MN8 P7 _______________________________________ P <0.01 <0.01
Al 0.1 5.5
Fe 0.2 5.2
Ca 10.0 4.3
Mg 5.0 3.0
K 1.2 1.0
Na 12.4 24.5 ________________________________________
20
Table 3 Some basic chemical characteristics of soils _________________________________________________________________________________ Hor Depth Organic-C pH EC Ca2+ Mg2+ Na+ K+ Al3+ ECECa ESPb
(cm) (%) (1:5H2O) (1:5H2O) (cmol(+)/kg) (%) (dS/cm) _________________________________________________________________________________ Eutrophic Brown Chromosol – P5
A1 0-7 5.6 6.2 0.04 7 5 0.3 0.4 0.37 13.1 2
A3 7-25c 3.2 6.0 0.03 4 4 0.2 0.1 0.33 8.6 2
B21 36-50 2.7 6.5 0.05 20 15 1.2 0.1 0.35 36.7 3
B22 50-69 1.9 6.6 0.06 21 17 1.6 0.2 0.48 40.3 4
B3 69-86 1.8 6.8 0.05 20 16 1.9 0.2 0.34 38.4 5
C 86-150 0.9 6.7 0.04 15 9 1.0 0.1 0.34 25.4 4
Mottled-Subnatric Grey Sodosol – MN8
A1 0-10 4.2 5.4 0.03 5 4 0.4 0.4 0.87 10.7 4
A2 10-28c 3.0 5.2 0.03 2 3 0.2 0.2 0.83 6.2 3
B21 36-50 2.3 5.8 0.04 9 8 1.0 0.2 0.91 19.1 6
B22 50-70 1.8 5.9 0.05 10 12 1.2 0.1 0.89 24.2 5
C 70-120 1.6 6.3 0.06 17 18 2.6 0.2 0.85 38.7 7
Mottled-Subnatric Grey Sodosol – P4
A1 0-7 2.6 5.5 0.03 3 3 0.3 0.3 0.12 6.7 4
A2 27-19c 2.2 5.4 0.03 5 3 0.4 0.1 0.17 8.7 3
B21 31-41 1.6 5.9 0.02 7 8 0.7 0.4 0.24 16.3 4
B22 41-52 1.1 6.2 0.05 10 12 1.6 0.1 0.27 23.9 7
C 52-70 0.9 6.5 0.06 17 24 3.5 0.1 0.26 44.9 8
Mottled-Mesonatric Grey Sodosol – P7
A1 0-8 3.5 5.8 0.04 3 4 0.4 0.6 0.48 8.8 5
A2 8-23c 2.8 5.7 0.03 4 5 0.5 0.5 0.47 10.5 5
B21 38-48 1.9 6.0 0.18 9 10 2.6 0.3 0.46 21.4 12
B22 48-67 0.4 6.6 0.25 6 8 2.9 0.3 0.47 17.7 16
B3 67-78 0.3 6.7 0.25 3 14 5.4 0.7 0.47 23.6 23
C 78-150 0.2 6.2 0.26 8 16 7.3 0.8 0.51 32.6 23
Black Vertosol – P8
A11 0-6 6.6 5.6 0.09 7 13 0.7 0.9 0.67 22.3 2
A12 6-19 5.0 6.3 0.05 29 18 0.8 0.6 0.6 0 49.0 1
A3 19-40 3.2 6.6 0.06 31 17 0.8 0.5 0.66 49.9 2
B2 40-57 1.6 7.5 0.04 33 22 1.0 0.4 0.8 0 57.2 2
C1 57-66 1.4 7.6 0.05 36 22 1.3 0.3 0.70 60.3 2
C2 66-90 0.7 7.8 0.07 31 14 1.4 0.2 0.68 47.3 3 ________________________________________________________________________________ a ECEC is calculated as the sum of exchangeable bases and aluminium b % ESP is calculated by exchangeable sodium percentage/sum of bases c The discontinuous depth interval between the A2 and B21 indicates the thick of stone-line.
21
Table 5 Particles-size analysis and sand fraction distribution of soils ________________________________________________________________________________ Hor Depth Clay Silt Sand Sand fraction distribution (µm) of total sand (in %)
(cm) (%) 1000 500 250 125 90 63 45 45-20 ________________________________________________________________________________ Eutrophic Brown Chromosol – P5
A1 0-7 8 23 69 0.0 2.3 7.8 25.9 17.7 15.8 11.3 19.2
A3 7-25a 9 19 72 2.0 4.7 10.5 25.3 14.0 14.8 10.5 18.2
B21 36-50 53 8 39 5.0 5.3 17.1 23.8 15.1 13.6 10.5 9.6
B22 50-69 49 15 36 7.2 10.7 21.8 23.3 12.8 11.1 9.4 3.7
B3 69-86 24 18 58 5.8 15.4 26.7 21.8 7.9 9.4 7.2 5.8
C 86-150 12 12 76 7.6 21.3 29.3 19.5 6.4 7.7 5.0 3.2
Mottled-Subnatric Grey Chromosol – MN8 A1 0-10 16 20 64 0.7 8.6 12.0 20.8 11.3 15.5 12.2 18.9
A2 10-28a 18 16 66 0.9 6.7 12.3 21.8 11.7 16.0 11.7 18.9
B21 36-50 42 14 44 9.0 15.1 12.8 15.6 10.5 12.1 10.2 14.7
B22 50-70 46 11 43 16.9 22.5 15.6 14.7 7.2 8.5 7.1 7.5
C 70-120 21 13 66 29.9 23.0 15.4 12.4 5.2 5.1 4.3 4.7
Mottled-Subnatric Grey Sodosol – P4 A1 0-7 3 23 74 0.0 1.4 7.3 26.3 17.2 20.4 11.3 6.1
A2 7-19a 11 19 70 8.0 5.2 9.8 23.3 13.3 15.0 9.8 15.6
B21 31-41 38 9 53 13.5 9.8 13.5 30.8 8.3 6.0 6.8 11.3
B22 41-52 36 9 55 8.8 15.3 18.2 29.2 7.3 5.1 5.8 10.2
C 52-70 14 8 78 16.5 27.9 25.3 18.0 6.2 1.5 2.0 2.6
Mottled-Mesonatric Grey Sodosol – P7 A1 0-8 10 24 66 0.9 2.8 7.6 20.3 13.7 16.0 17.4 21.3
A2 8-23a 18 25 57 4.4 5.9 9.2 21.3 12.2 11.8 11.5 23.7
B21 38-48 33 15 52 9.0 3.2 7.8 21.2 13.6 14.6 11.4 19.2
B22 48-67 23 8 69 3.0 6.9 9.6 24.9 15.9 15.4 12.2 12.1
B3 67-78 18 18 64 5.4 19.7 18.0 20.4 10.6 11.9 9.6 4.4
C 78-150 12 22 66 5.8 28.2 22.9 16.7 6.7 8.9 6.8 4.0
Black Vertosol – P8 A11 0-6 36 21 43 3.6 3.3 6.0 17.5 11.8 15.4 13.0 29.4
A12 6-19 47 14 39 9.6 4.4 6.2 16.4 11.0 14.0 13.6 24.8
A3 19-40 50 14 36 8.8 6.0 6.1 15.5 9.8 15.3 14.0 24.5
B2 40-57 47 12 41 25.9 16.9 8.9 11.2 7.3 10.9 8.6 10.3
C1 57-66 22 19 59 31.2 21.4 9.7 9.2 5.6 8.7 7.9 6.3
C2 66-90 20 11 69 28.3 26.4 11.6 10.1 6.0 9.0 5.4 3.2
_________________________________________________________________________________________ a The discontinuous depth interval between the A2 and B21 indicates the thick of stone-line.
22
Table 6 XRD mineralogy of whole soils (wt %) _____________________________________________________________________________________________ Hor (cm) 80% 60-80% 40-60% 25-40% 15-25% 10-15% 5-10% <5% _____________________________________________________________________________________________ Eutrophic-Brown chromosol – P5 A1(0-7) Quartz Plagioclase K-feldspar Smectite, Laumonite, ilmenite Amphibole A3(7-25)a Quartz Plagioclase K-feldspar, Halloysite, amphibole, Smectite Ilmenite B21(36-50) Halloysite, Smectite Plagioclase K-feldspar, amphibole,
Quartz Ilmenite, hematite B22 (50-69) Halloysite, Quartz Plagioclase K-feldspar, amphibole,
Smectite Ilmenite B3(69-86) Smectite, Plagioclase Quartz, K-feldspar, amphibole,
Halloysite Clinopyroxene Ilmenite C(86-150) Halloysite Smectite, Clinopyroxene, K-feldspar, amphibole,
Plagioclase Quartz Ilmenite Mottled-Subnatric Grey Sodosol – MN8 A1(0-10) Quartz Smectite, Plagioclase, Halloysite, clino-
K-feldspar pyroxene, ilmenite A2(10-28)a Quartz Smectite Halloysite, clinopyroxene, Ilmenite B21(36-50) Smectite Quartz Halloysite, Clinopyroxene, ilmenite, K-
Plagioclase feldspar, stilbite, amphibole, Mica
B22(50-70) Smectite Quartz Plagioclase Halloysite Clinopyroxene, stilbite C(70-120) Smectite Plagioclase Quartz Clino- Stilbite, clinopyroxene
Halloysite pyroxene Mottled-Subnatric Grey Sodosol – P4 A1(0-7) Quartz Plagioclase, Smectite, ilmenite, amphibole,
K-feldspar Laumonite A2(7-19)a Quartz Plagioclase, Ilmenite, amphibole K-feldspar,
Smectite B21(31-41) Quartz Plagioclase, Ilmenite, amphibole, K-feldspar, Laumonite, stilbite-type
Smectite B22(41-52) Quartz Smectite Plagioclase, Stilbite-type, amphibole, K-feldspar Ilmenite, laumontite C(52-70) Smectite Plagioclase Quartz K-feldspar Mottled-Mesonatric Grey Sodosol – P7 A1(0-8) Quartz K-feldspar, Smectite, halloysite, ilmenite
Plagioclase A2(8-23)a Quartz Smectite, Halloysite, K-feldspar,
Plagioclase Ilmenite, amphibole, stilbite B21(38-48) Quartz Smectite, plagioclase, Ilmenite
Halloysite K-feldspar B22(48-67) Quartz Smectite Halloysite, K-feldspar, ilmenite,
Plagioclase Amphibole B3(67-78) Smectite, Halloysite Plagioclase, Amphibole, ilmenite, Quartz K-feldspar Laumontite C(78-150) Smectite Halloysite, Plagioclase, Amphibole, ilmenite,
Quartz K-feldspar Black Vertosol – P8 A11(0-6) Quartz Smectite Halloysite, K-feldspar, clinopyroxene,
Plagioclase Ilmenite A12(6-19) Quartz Smectite, Plagioclase, K-feldspar, clinopyroxene,
Halloysite Ilmenite A3(19-40) Quartz Smectite Halloysite Plagioclase K-feldspar, clinopyroxene,
Ilmenite, laumontite B2(40-57) Smectite Quartz Halloysite Clino- K-feldspar, ilmenite
Plagioclase pyroxene C1(57-66) Smectite Plagioclase Clino- Quartz, K-feldspar, amphibole,
pyroxene Halloysite C2(66-90) Smectite Plagioclase Clino- Halloysite, K-feldspar, ilmenite
pyroxene Quartz __________________________________________________________________________________________________________ a The discontinuous depth interval between the A2 and B21 indicates the thick of stone-line.
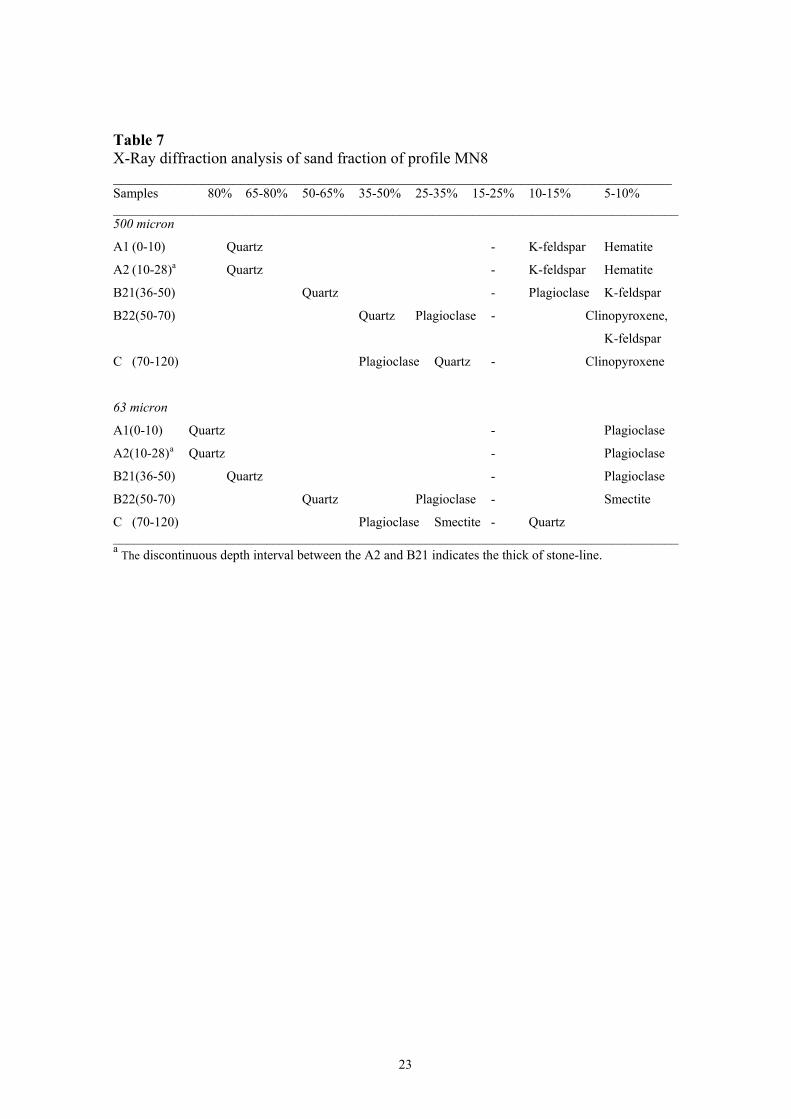
23
Table 7 X-Ray diffraction analysis of sand fraction of profile MN8 ______________________________________________________________________ Samples 80% 65-80% 50-65% 35-50% 25-35% 15-25% 10-15% 5-10% _____________________________________________________________________________________ 500 micron
A1 (0-10) Quartz - K-feldspar Hematite
A2 (10-28)a Quartz - K-feldspar Hematite
B21(36-50) Quartz - Plagioclase K-feldspar
B22(50-70) Quartz Plagioclase - Clinopyroxene,
K-feldspar
C (70-120) Plagioclase Quartz - Clinopyroxene
63 micron
A1(0-10) Quartz - Plagioclase
A2(10-28) a Quartz - Plagioclase
B21(36-50) Quartz - Plagioclase
B22(50-70) Quartz Plagioclase - Smectite
C (70-120) Plagioclase Smectite - Quartz _____________________________________________________________________________________ a The discontinuous depth interval between the A2 and B21 indicates the thick of stone-line.
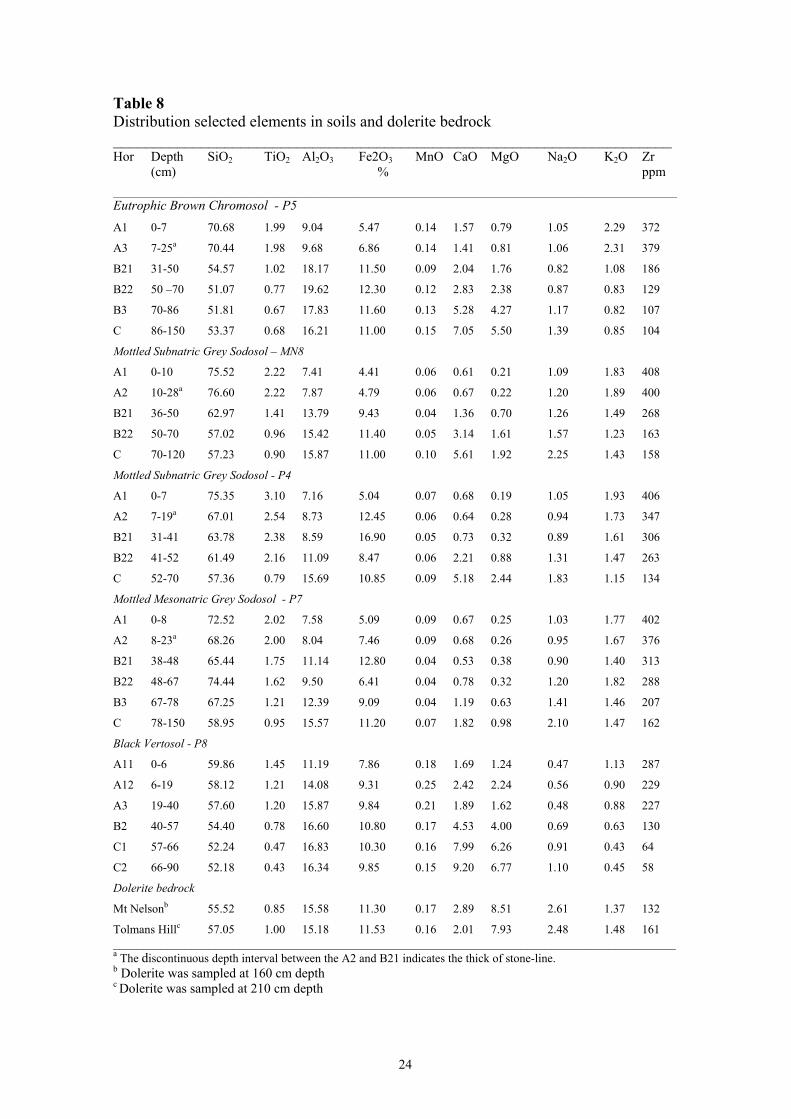
24
Table 8 Distribution selected elements in soils and dolerite bedrock ______________________________________________________________________ Hor Depth SiO2 TiO2 Al2O3 Fe2O3 MnO CaO MgO Na2O K2O Zr (cm) % ppm __________________________________________________________________________________________________________ Eutrophic Brown Chromosol - P5 A1 0-7 70.68 1.99 9.04 5.47 0.14 1.57 0.79 1.05 2.29 372
A3 7-25a 70.44 1.98 9.68 6.86 0.14 1.41 0.81 1.06 2.31 379
B21 31-50 54.57 1.02 18.17 11.50 0.09 2.04 1.76 0.82 1.08 186
B22 50 –70 51.07 0.77 19.62 12.30 0.12 2.83 2.38 0.87 0.83 129
B3 70-86 51.81 0.67 17.83 11.60 0.13 5.28 4.27 1.17 0.82 107
C 86-150 53.37 0.68 16.21 11.00 0.15 7.05 5.50 1.39 0.85 104
Mottled Subnatric Grey Sodosol – MN8
A1 0-10 75.52 2.22 7.41 4.41 0.06 0.61 0.21 1.09 1.83 408
A2 10-28a 76.60 2.22 7.87 4.79 0.06 0.67 0.22 1.20 1.89 400
B21 36-50 62.97 1.41 13.79 9.43 0.04 1.36 0.70 1.26 1.49 268
B22 50-70 57.02 0.96 15.42 11.40 0.05 3.14 1.61 1.57 1.23 163
C 70-120 57.23 0.90 15.87 11.00 0.10 5.61 1.92 2.25 1.43 158
Mottled Subnatric Grey Sodosol - P4
A1 0-7 75.35 3.10 7.16 5.04 0.07 0.68 0.19 1.05 1.93 406
A2 7-19a 67.01 2.54 8.73 12.45 0.06 0.64 0.28 0.94 1.73 347
B21 31-41 63.78 2.38 8.59 16.90 0.05 0.73 0.32 0.89 1.61 306
B22 41-52 61.49 2.16 11.09 8.47 0.06 2.21 0.88 1.31 1.47 263
C 52-70 57.36 0.79 15.69 10.85 0.09 5.18 2.44 1.83 1.15 134
Mottled Mesonatric Grey Sodosol - P7
A1 0-8 72.52 2.02 7.58 5.09 0.09 0.67 0.25 1.03 1.77 402
A2 8-23a 68.26 2.00 8.04 7.46 0.09 0.68 0.26 0.95 1.67 376
B21 38-48 65.44 1.75 11.14 12.80 0.04 0.53 0.38 0.90 1.40 313
B22 48-67 74.44 1.62 9.50 6.41 0.04 0.78 0.32 1.20 1.82 288
B3 67-78 67.25 1.21 12.39 9.09 0.04 1.19 0.63 1.41 1.46 207
C 78-150 58.95 0.95 15.57 11.20 0.07 1.82 0.98 2.10 1.47 162
Black Vertosol - P8
A11 0-6 59.86 1.45 11.19 7.86 0.18 1.69 1.24 0.47 1.13 287
A12 6-19 58.12 1.21 14.08 9.31 0.25 2.42 2.24 0.56 0.90 229
A3 19-40 57.60 1.20 15.87 9.84 0.21 1.89 1.62 0.48 0.88 227
B2 40-57 54.40 0.78 16.60 10.80 0.17 4.53 4.00 0.69 0.63 130
C1 57-66 52.24 0.47 16.83 10.30 0.16 7.99 6.26 0.91 0.43 64
C2 66-90 52.18 0.43 16.34 9.85 0.15 9.20 6.77 1.10 0.45 58
Dolerite bedrock
Mt Nelsonb 55.52 0.85 15.58 11.30 0.17 2.89 8.51 2.61 1.37 132
Tolmans Hillc 57.05 1.00 15.18 11.53 0.16 2.01 7.93 2.48 1.48 161 ______________________________________________________________________________________________ a The discontinuous depth interval between the A2 and B21 indicates the thick of stone-line. b Dolerite was sampled at 160 cm depth c Dolerite was sampled at 210 cm depth
25
Fig 1. Simplified geological map with contours (10 m intervals) and soil profile locations (solid triangels). Tr (Triassic sediments); Ts (Tertiary sediments); Pm (Permian sediments); Jd (Jurassic dolerite); Q Quaternary deposits.
26
Fig 2. A proposed soil-landscape history in the southeast Tasmania Phase 1 - Initial deep weathering of the dolerite Phase 2 - Stripping Phase 3 - Slope wash and new soil formation
Fresh dolerite columns
Joint plane
C horizon, mealy weathered dolerite
Dolerite bars
B21 B22 C horizon
27
Phase 4 - formation of stone-line Phase 5 – Influx of fine sandy sediments
Stone-line B21 B22 C horizon
A1 A2, stone-line B21 B22 C horizon
A/C soil