software quality conference - Google Research
600
TWENTY-FIFTH ANNUAL PACIFIC NORTHWEST SOFTWARE QUALITY CONFERENCE October 9-10, 2007 Oregon Convention Center Portland, Oregon Permission to copy without fee all or part of this material, except copyrighted material as noted, is granted provided that the copies are not made or distributed for commercial use.
-
Upload
khangminh22 -
Category
Documents
-
view
4 -
download
0
Transcript of software quality conference - Google Research

TWENTY-FIFTH ANNUAL PACIFIC NORTHWEST
SOFTWARE QUALITYCONFERENCE
October 9-10, 2007
Oregon Convention Center Portland, Oregon
Permission to copy without fee all or part of this material, except copyrighted material as noted, is granted provided that the copies are not made or distributed
for commercial use.


TABLE OF CONTENTS
Welcome ............................................................................................................................... ...................... v
Board Members, Officers, and Committee Chairs ......................................................... vii
Program Committee ....................................................................................................................... viii
Keynote Address – October 9
Schedule Games: Recognizing and Avoiding the Games We Play ................................................. 1
Johanna Rothman
Keynote Address – October 10
Hunting Security Vulnerabilities: The Illustrated Guide ............................................................. 13
Herbert (Hugh) Thompson
People Track – October 9
Cognitive Illusions in Development and Testing ............................................................................ 15
Dorothy Graham
Ten Tendencies That Trap Testers ..................................................................................................... 35
Jon Bach
Flexing Your Mental Muscle to Obtain Defect-Free Products ...................................................... 49
Rick Anderson
Transitioning to Agile: Tips for Test Teams ..................................................................................... 59
Lisa Crispin
Process Track – October 9
TimeLine: Getting and Keeping Control Over Your Project ......................................................... 77
Niels Malotaux
Implementing a System to Manage Software Engineering Process Knowledge ....................... 89
Rhea Stadick
Building Quality in from the Beginning
Using Lean-Agile Quality Assurance Practices ............................................................................ 107
Jean McAuliffe
An Exploratory Tester’s Notebook ..................................................................................................... 117
Michael Bolton
Agile Quality Management with CMMI-DEV and Scrum ............................................................ 137
Andreas Schliep, Boris Gloger
i

Managing Change in the Software Test Environment ................................................................. 161
Diane Manlove, Jerry Parrish
Products, Tools, & Techniques Track – October 9
Feedback, Analysis and Synthesis-Based Testing (FAST) .......................................................... 175
Vijay Upadya, Daigo Hamura, Tiki Wan, Yuval Mazor
Ultra Lightweight Software Test Automation (ULSTA) in an Agile Environment ............... 187
Dr. James McCaffrey
The “Swim” System for User-Oriented Presentation of Test-Case Results .............................. 205
Ward Cunningham, Bjorn Freeman-Benson, Karl Matthias
A Graphical Display of Testing Status for Complex Configurations ....................................... 225
Douglas Hoffman
Efficient Software Testing Using Statistical Methods ................................................................. 239
Alex Tarvo, Junaid Ahmed, Koushik Rajaram, Kashif Dastgir
Applying Selective Revalidation Techniques at Microsoft ......................................................... 255
Jean Hartmann
Potpourri Track – October 9
Project Intelligence .............................................................................................................................. 267
Rong Ou
Maintainability in Testing ................................................................................................................. 275
Brian Rogers
Tick-the-Code Inspection: Empirical Evidence (on Effectiveness) ............................................ 283
Miska Hiltunen
7 Words You Can Never Use in a Requirements Specification ....................................................301
Les Grove
AJAX Testing – How to test the Asynchronous? ............................................................................. 309
Manoharan Vellalapalayam
Introduction to Software Risk Management .................................................................................. 317
Karl Wiegers
People Track – October 10
Facilitating Effective Retrospectives ............................................................................................... 329
Debra Lavell
Mapping for Quality – Past, Present, and Future ......................................................................... 345
Celeste Yeakley, Jeffrey Fiebrich
Customer Interaction and the Role of the Test Engineer ............................................................ 359
Shalini Joshi
The Devil’s in the Decisions ............................................................................................................... 371
Rob Goatham, Jim Brosseau
ii

Resistance as a Resource .................................................................................................................... 381
Dale Emery
Process Track – October 10
A Tool to Aid Software Practitioners in Selecting a Best-Fit Project Methodology .............. 413
Robert Roggio, I Nengah Mustika
Process Optimization by Design ........................................................................................................ 427
David Card
Software Process Improvement: Ten Traps to Avoid .................................................................... 437
Karl Wiegers
Levels of Ceremony for Software Configuration Management .................................................. 447
Daniel Brook, Kal Toth
Critical Success Factors for Team Software Process (TSP) Adoption ..................................... 459
Jim Sartain
Building Quality In – A Model for Achieving High Quality on Any Type of Project ............. 469
Kathleen Iberle
Products, Tools, & Techniques Track – October 10
State-Driven Testing ........................................................................................................................... 485
Sandeep Bhatia, Vipin Puri
Approaching Write Once, Run Anywhere:
Maximizing Code Reuse for Cross Platform Development ......................................................... 499
Raleigh Ledet, Ken Loftus
Functional Tests as Effective Requirements Specifications ....................................................... 511
Jennitta Andrea
Testing Web Services ............................................................................................................................ 525
Keith Stobie
Potpourri Track – October 10
User Acceptance Testing: A Context-Driven Perspective ............................................................. 535
Michael Bolton
Two Futures of Software Testing ...................................................................................................... 549
Michael Bolton
Building for a Better Automation Future: One Company’s Journey ........................................ 559
Todd Fitch, John Ruberto
Testable Software Architectures ....................................................................................................... 571
David Langer, Troy Schneringer
Scaling Quality ..................................................................................................................................... 581
Robert Fagen
Proceedings Order Form .................................................................................................. last page
iii

iv

Welcome to the Pacific Northwest
Software Quality Conference!
For the past 25 years, the mission of the Pacific Northwest Software Quality Conference
has been to increase awareness of the importance of software quality and to promote
software quality by providing education and opportunities for information exchange. So
it was fitting we chose “25 Years of Quality, Building for a Better Future” as our theme.
We have a fantastic line up of keynote and invited speakers. On Tuesday, the dynamic
Johanna Rothman will address schedule games and how to identify the signs, root
causes and strategies to overcome these types of obstacles and problems. Wednesday,
Hugh Thompson, one of the top 5 most influential thinkers in IT security, will share
techniques to uncover security bugs and the current state of the software security
practice. Don’t miss these inspiring keynote presentations.
Our paper presenter format is a 45-minute presentation with time to answer questions
and ensure this conference provides you with the opportunity to find answers to the
toughest questions. We changed our format slightly to allow 5 minutes between
sessions, so paper presenters can get set up and you can find a comfortable seat.
On Tuesday evening, we will provide complimentary appetizers and beverages during
our Conference Reception. The reception is an opportunity for all attendees to
collaborate with our exhibitors and attendees on the state-of-the-art best practices so
you will go back to your office with practical solutions to your specific challenges.
Immediately following the reception, the Rose City SPIN meeting (sponsored by
PNSQC) is where Niels Malotaux will talk about “And You Thought You Could
Estimate?” His presentation concludes at 8:00 PM.
During lunch on Wednesday, we have a panel of seasoned software professionals, here
a lively discussion!
The panelists have been involved in PNSQC for many years, so they will share their
perspective on what they have observed from the past and what they feel the future may
bring.
We are so glad you are here! We believe this is the best software conference on the West
Coast. We have packed each day with interesting paper presentations, full-day
workshops, keynote and invited industry professionals who care about the same issues
that matter to you and are here to share their experiences with you. Enjoy 25 years of
quality!
Cheers,
Debra Lavell
President, PNSQC
v
to talk about their “Reminiscences of 25 Years of Quality.” I believe the topics will spark

vi

BOARD MEMBERS, OFFICERS, and COMMITTEE CHAIRS
Debra Lavell– Board Member & President
Intel Corporation
Paul Dittman – Board Member & Vice President
McAfee, Inc.
David Butt – Board Member & Secretary
Doug Reynolds – Board Member, Treasurer & Selection Chair
Tektronix, Inc.
Ian Savage – Board Member & Program Chair
McAfee, Inc.
Arlo Belshee – Board Member & Technology Chair
Keith Stobie – Board Member
Microsoft
Esther Derby – Keynote, Invited Speaker & Workshop Chair
Esther Derby Associates
Patt Thomasson – Communications Chair
McAfee, Inc.
Diana Larsen – Networking Chair
FutureWorks Consulting
David Chandler – Publicity Chair
Nationwide Insurance
Bill Gilmore – Operations and Infrastructure Chair
Shauna Gonzales – Luncheon Program Chair
Nike, Inc.
Cynthia Gens – Review Committee Chair
Sabrix, Inc.
vii

PROGRAM COMMITTEE
Randal Albert
Oregon Institute of Technology
Rick Anderson
Tektronix, Inc.
John Balza
Hewlett Packard
Kit Bradley
Wildblue Consulting
Robert Cohen
Tektronix, Inc.
Julie Csoppenszky
Jeppesen
Moss Drake
Daisy Dental
James Fudge
McAfee, Inc.
Sara Garsuch
Symetra
Rebecca Gee
Frank Goovaeters
Tektronix, Inc.
Les Grove
Tektronix, Inc.
Bhushan Gupta
Hewlett Packard
Brian Hansen
Craig Huber
Kathy Iberle
Hewlett Packard
Gurprett Kang
Randy King
Dave Liesse
Roslyn Lindquist
Windriver
Launi Mead
Symetra
Jonathan Morris
Kronos/Unicru, Inc.
Marilyne Pelerine
Symetra
Ganesh Prabhala
Intel Corporation
John Prohodsky
Mike Roe
Symyx
Gary Simmons
Vidiom Systems
Wolfgang Strigel
QA Labs Inc.
Ruku Tekchandani
Intel Corporation
Richard Vireday
Intel Corporation
Scott Whitmire
SA Whitmire & Co.
Doug Whitney
McAfee, Inc.
Sherry Yang
Oregon Institute of Technology
viii

Schedule Games:
Recognizing and Avoiding the Games We Play
Johanna Rothman Are your schedules off as soon as you create them? Does your management expect you to meet impossible deadlines? Have you ever been surprised by how long tasks took to complete? If you answer yes to any of these questions, chances are someone in your organization is playing schedule games. There are many different schedule games, but they all have similar results: the project team is behind the eight ball. We'll look at how to recognize the signs of schedule games, how to address the underlying problems, and how to change the rules. What attendees will learn:
• Indications of schedule games • Root causes of schedule games • Strategies to solve schedule games
Johanna Rothman consults, speaks, and writes on managing high-technology product development. As a consultant, she has assisted managers, teams, and organizations become more effective by applying her pragmatic approaches to the issues of project management, risk management, and people management. Johanna has helped Engineering organizations, IT organizations, and startups hire technical people, manage projects, and release successful products faster. Her action-based assessment reports have helped managers and teams improve their projects, products, and financial results. She is a sought-after speaker and teacher in the areas of project management, people management, and problem-solving.
Johanna most recent book is Manage It! Your Guide to Modern Pragmatic Project Management. In addition, she is a coauthor (with Esther Derby) of popular and pragmatic Behind Closed Doors, Secrets of Great Management. She is also the author of the highly acclaimed Hiring the Best Knowledge Workers, Techies & Nerds, and is coauthor (with Denise Robitaille) of Corrective Action for the Software IndustryJohanna is a host and session leader at the Amplifying Your Effectiveness (AYE) conference.
1

Guerilla Agile: Adopting Agile Practices…
© 2007 Johanna Rothman www.jrothman.com
781-641-4046 [email protected]
Schedule Games:
Recognizing and Avoiding the
Games We Play
Johanna RothmanAuthor of Manage It!: Your Guide to Modern, Pragmatic Project Management
Coauthor of Behind Closed Doors: Secrets of Great Management
Author of Hiring the Best Knowledge Workers, Techies & Nerds: The Secrets and Science of Hiring
Technical People
www.jrothman.com
781-641-4046
© 2007 Johanna Rothman www.jrothman.com [email protected] 2
Projects and Schedules
• They all start with a schedule
• Sometimes the project team meets the schedule
• Too often, the project team doesn’t meet the schedule
• But that’s not always because the project team doesn’t try to
create a reasonable schedule or meet one…
• Sometimes management “decides” something about your
schedule
2

Guerilla Agile: Adopting Agile Practices…
© 2007 Johanna Rothman www.jrothman.com [email protected] 3
Bring Me a Rock
• Make sure you’ve been clear aboutwhat you’re providing
• Elicit success criteria
• Define release criteria
• Negotiate for time, feature set,defects
• Develop a ranked product backlog
• Implement by feature in timeboxes
© 2007 Johanna Rothman www.jrothman.com [email protected] 4
Hope is Our Most Important Strategy
• Articulate the risks
• Choose any lifecycle other than aserial lifecycle
• Hudson Bay Start
• Milestone criteria
• Plan to iterate
• Use timeboxed iterations
• Gather data (velocity chart) as youproceed to see where you aremaking progress
3

Guerilla Agile: Adopting Agile Practices…
© 2007 Johanna Rothman www.jrothman.com [email protected] 5
Queen of Denial
• Articulate the risks using High,Medium, Low
– Numbers will start the riskpromotion/demotion game
• Choose any lifecycle other than a seriallifecycle
• Measure velocity
• Plan to iterate
• Ask context free questions
• Ask how little can you do
• Use timeboxed iterations
• Define a product backlog so you canimplement by feature in order of value
© 2007 Johanna Rothman www.jrothman.com [email protected] 6
Sweep Under the Rug
• Rank the requirements
• Choose any lifecycle other than aserial lifecycle so you can obtainfeedback as you proceed
• Develop release criteria
• Use timeboxed iterations
• Develop a ranked product backlog
• Implement by feature in order ofvalue
4

Guerilla Agile: Adopting Agile Practices…
© 2007 Johanna Rothman www.jrothman.com [email protected] 7
Happy Date
• If you must use a serial lifecycle,use schedule ranges, not a single-point date
• For other lifecycles, use a three-daterange (possible, likely, Murphy)
• Use multi-dimensionmeasurements, not just theschedule milestones
• Use timeboxed iterations
• Chart velocity
© 2007 Johanna Rothman www.jrothman.com [email protected] 8
Pants on Fire
• Use an incremental oriterative/incremental lifecycle
• Implement by feature
• Develop a product strategy
• Rethink how you estimate
• Use timeboxed iterations
• Use a velocity chart to see progress
5

Guerilla Agile: Adopting Agile Practices…
© 2007 Johanna Rothman www.jrothman.com [email protected] 9
Split Focus
• Rank requirements
• Implement by feature
• Use a staged delivery lifecycle
• One week timeboxed iterations
• Ranked product backlog
• Implement by feature
© 2007 Johanna Rothman www.jrothman.com [email protected] 10
Schedule == Commitment
• Date for a date
• Percentage confidence in a schedule
• Short timeboxed iterations
• Implement by feature
6

Guerilla Agile: Adopting Agile Practices…
© 2007 Johanna Rothman www.jrothman.com [email protected] 11
We'll Know Where We Are When We
Get There
• Beware of “chasing skirts”
• Define a goal—any goal!
• Timeboxed iterations
• Ranked product backlog
• Implement by feature
© 2007 Johanna Rothman www.jrothman.com [email protected] 12
Schedule Dream Time
(The Schedule Tool is Always Right)
• Use rolling wave scheduling
• Use a low-tech scheduling approach
• Use confidence levels for yourestimates
• Explain that pretty schedules donot make a successful project
• Short timeboxed iterations
• Measure velocity so you can betteryour prediction
7

Guerilla Agile: Adopting Agile Practices…
© 2007 Johanna Rothman www.jrothman.com [email protected] 13
We Gotta Have It;
We're Toast Without It
• Negotiate for more/less time,people, money, or features
• Develop a ranked product backlog
• Implement by feature
• Use short timeboxed iterations
• Offer to exchange one thing ofequal value for another within aniteration
© 2007 Johanna Rothman www.jrothman.com [email protected] 14
We Can’t Say No
• Ask the team to generate a planthey can commit to
• Timebox overtime and see if thatmakes a difference
• Surgically add more people
• Timeboxed iterations
• Velocity charts
8

Guerilla Agile: Adopting Agile Practices…
© 2007 Johanna Rothman www.jrothman.com [email protected] 15
Schedule Chicken
• No public status meetings
• Help people develop inch pebbles
• Implement by feature
• Standup meetings
• User stories (1-2 day tasks or inch-pebbles)
• Implement by feature
• Short iterations
© 2007 Johanna Rothman www.jrothman.com [email protected] 16
90% Done
• Coach person to develop inch-pebbles
• Make status visible to everyoneinvolved
• Coach person with how to trackestimates
• Implement by feature (implementonly what’s needed for a feature)
• Short timeboxed iterations
9

Guerilla Agile: Adopting Agile Practices…
© 2007 Johanna Rothman www.jrothman.com [email protected] 17
We’ll Go Faster Now
• Measure velocity
• Ask people why they are optimistic
• Measure earned value for tangibleparts of the project
• Timeboxed iterations
• Implement by feature
© 2007 Johanna Rothman www.jrothman.com [email protected] 18
Schedule Trance
• Measure velocity
• Use short iterations
• Daily standups
• Implement by feature
10

Guerilla Agile: Adopting Agile Practices…
© 2007 Johanna Rothman www.jrothman.com [email protected] 19
Agile Practices Help
• Ranked product backlog
• Implement by feature
• Timeboxed iterations
• Measure what’s done: velocity charts
– No credit for partial work
• Deliver highest value first
© 2007 Johanna Rothman www.jrothman.com [email protected] 20
What Would Prevent You From Using
These Ideas?
• Keep the kimono closed
– You don’t have to tell your management everything
– Do they really care how you manage your project as long as youaccomplish what they need?
• Open-book management
– Explain “The whole team wants to do the best job we can. Here’s a waythat will help us finish the project so we can deliver a great product.”
11

Guerilla Agile: Adopting Agile Practices…
© 2007 Johanna Rothman www.jrothman.com [email protected] 21
Velocity Chart
© 2007 Johanna Rothman www.jrothman.com [email protected] 22
More Resources
• Managing Product Development blog on jrothman.com
• Ken Schwaber’s Agile Project Management with Scrum
• Mike Cohn’s Agile Estimating and Planning
• Manage It! Your Guide to Modern, Pragmatic Project Management
12

Hunting Security Vulnerabilities: The Illustrated Guide
Herbert (Hugh) Thompson
Chief Security Strategist, People Security
This presentation graphically dissects the software security bug with live
demonstrations of some of the most virulent vulnerabilities in software. Dr.
Herbert Thompson, author of numerous books on software security, talks about
how security vulnerabilities make their way into software, the most common
security mistakes, and the state of the software security practice. You will also see
demonstrations of the most effective techniques to find security bugs in
software.
Dr. Herbert H. Thompson is a world-renown expert in application security. As
Chief Security Strategist at People Security, he heads the company’s security
education program and directs research projects for some of the world’s largest
corporations. In additional to creating methodologies that help clients build
demonstrably more secure software, he has trained developers, architects,
security testers and executives at some of the world’s largest software
companies including Microsoft, HP, Motorola, IBM, Cisco, Symantec, and SAIC.
As the chair of the Application Security Industry Consortium, Inc. (AppSIC), he
leads an association of industry technologists and leaders to help establish and
define cross-industry application security guidance and metrics. He hosts “The
Hugh Thompson Show” on AT&T’s techchannel , which premiered in April
2007.
Dr. Thompson has co-authored five books including How to Break Software
Security: Effective Techniques for Security Testing (with Dr. James
Whittaker, published by Addison-Wesley, 2003), and the upcoming Protecting
the Business: Software Security Compliance (to be published by Wiley,
2007).
In 2006, SC Magazine named him one of the “Top 5 Most Influential Thinkers in
IT Security.” He has authored more than 60 academic and industrial
publications on software security and frequently writes for such industry
publications as Dr. Dobbs Journal, IEEE Security & Privacy, CSO Magazine,
Network World, CIO Update, Journal of Information and Software Technology,
and ACM Queue.
Hugh earned his Ph.D. in Applied Mathematics from Florida Institute of
Technology, where he remains a member of the graduate faculty. He also holds
the CISSP certification.
13

14

Cognitive Illusions in Development and Testing
Dorothy Graham,
Grove Consultants
We are all familiar with optical illusions: we see something that turns out to be
not as it first appears. Isn't it strange that some part of our mind knows that
another part of our mind is being deceived?
However, we are subject to self-deception in technical areas as well: these are
cognitive illusions. This presentation explores some of the ways in which we
deceive ourselves and why we do it. Examples are taken from the way Inspection
is often practiced, testing issues, attitudes toward complexity, and the way in
which "groupthink" can influence technical decisions.
There are a number of ways in which we "turn a blind eye" to issues which are
vitally important such as quality and planning. Addressing these issues may help
to explain why measurement programs often fail, why post-project reviews are
seldom done, what causes anxiety for developers, managers and testers, and how
to counteract a blame culture.
Dorothy Graham is the founder of Grove Consultants, which provides advice,
training and inspiration in software testing, testing tools and Inspection. Dot is
co-author with Tom Gilb of "Software Inspection" (1993), co-author with Mark
Fewster of "Software Test Automation" (1999) both published by Addison-
Wesley, and co-author with Rex Black, Erik van Veenendaal and Isabel Evans of
"Foundations of Software Testing: ISTQB Certification" Thompson, 2007.
Dot was Programme Chair for the first EuroSTAR Conference in 1993. She is on
the editorial board of the Better Software magazine. She was a founder member
of the UK ISEB Software Testing Board, which provides Foundation and
Practitioner Certificates in Software Testing. She was a member of the working
party that produced the ISTQB Foundation Syllabus, and is a member of the UK
Software Testing Advisory Group. She is a popular and entertaining speaker at
international conferences worldwide. Dorothy received the European Excellence
Award in Software Testing in 1999.
15

PNSQC, 8 – 10 Oct 2007Presenter: Dorothy Graham
© Grove Consultantswww.grove.co.uk+44 1625 616279
Cognitive illusions in development and testing
PNSQC, 8 – 10 Oct 2007
in development and testingPrepared and presented by
Dorothy Graham
Grove ConsultantsGrove House
www.grove.co.uk© Grove Consultants
Grove House40 Ryles Park Road
MacclesfieldSK11 8AH UK
Tel +44 1625 [email protected]
Cognitive illusions
Contents
Optical illusionsCognitive illusionsCause (anxiety) and effects (symptoms) Dispelling cognitive illusions
PS: Recent “research” into brain function
16

Optical illusions
Tribar
17

Cognitive illusions
Contents
Optical illusionsCognitive illusionsCause (anxiety) and effects (symptoms) Dispelling cognitive illusions
Illusions and self-deception
“The eye sees what it seesyeven when the mind knows what it knows”-- some parts of our minds are unable to use information some parts of our minds are unable to use information
available to us in other parts of our mindsavailable to us in other parts of our minds
We have the ability to deceive ourselves-- things we don’t seem to seethings we don’t seem to seethings we don t seem to seethings we don t seem to see
-- tradetrade--off between anxiety and awarenessoff between anxiety and awareness
cognitive illusion-- something your subconscious mind knows, something your subconscious mind knows,
but doesn’t allow your conscious mind to be aware ofbut doesn’t allow your conscious mind to be aware of
18

Subconscious and conscious mind
subconscious mindcontrols autonomic nervous system (heart lungs)controls autonomic nervous system (heart lungs)-- controls autonomic nervous system (heart, lungs)controls autonomic nervous system (heart, lungs)
-- does what you tell it (selfdoes what you tell it (self--fulfilling prophecy)fulfilling prophecy)
-- acts to protect your conscious mindacts to protect your conscious mind
conscious mind-- your “thinking” self, judgement, where you feel pain your “thinking” self, judgement, where you feel pain
-- what you are what you are awareaware ofof
“gate” to allow awareness-- is in the subconscious mind!is in the subconscious mind!
•• Satir’s 1Satir’s 1stst unhelpful belief: “It’s not ok to see what is”unhelpful belief: “It’s not ok to see what is”
Lack of detail in test plans
Content of test plans
•• 2 weeks?2 weeks?
p•• 6 weeks6 weeks
-- Shorter one looks exactly the same insideShorter one looks exactly the same inside•• therefore it must not be any different in naturetherefore it must not be any different in nature
“testing”
“testing”
therefore it must not be any different in naturetherefore it must not be any different in nature•• 2 weeks is better for my schedule2 weeks is better for my schedule
-- Can’t see any difference, therefore there is noneCan’t see any difference, therefore there is none
19

Plans
Plan
End date
Early Inspection: design needs re-writing
Now thinkExtra
work
Delay
Very late
Really had Problems
Huge problems
coming later
Review versus Inspection
“review the whole document” – find defects, this was useful
Inspection can find deep-seated defects- remove similar defects- sampling – process improvement
“We are missing something”
20

Complexity rules OK
simplicity seen as less goodp y g-- “it’s “it’s onlyonly common sense”common sense”
complexity seen as good-- I don’t understand this, so it must be really goodI don’t understand this, so it must be really good
-- afraid to challenge (everyone else understands)afraid to challenge (everyone else understands)
$1b$1b-- $1b pen$1b pen
Now and then
this time last time-- time pressuretime pressure
-- something innovativesomething innovative
-- good team, some newgood team, some new
-- done something similardone something similar
-- very importantvery important
-- time pressuretime pressure
-- something innovativesomething innovative
-- good team, some newgood team, some new
-- done something similardone something similar
-- very importantvery important
-- it’s different this timeit’s different this time
-- very optimisticvery optimistic•• we’re sure it will be a we’re sure it will be a
successsuccess
-- it’s different this timeit’s different this time
-- very optimisticvery optimistic•• but was not a successbut was not a success
insanity: expecting a different output with the same inputs
21

Failure to study history
what happened last time?pp-- probably not too wonderful probably not too wonderful -- creates anxietycreates anxiety
what we do: divert attention-- but it will be different this (next) timebut it will be different this (next) time
-- we don’t have time to spend looking back, we have we don’t have time to spend looking back, we have a new project to get on witha new project to get on witha new project to get on witha new project to get on with
hope against all the evidence to the contrary-- remember what we hoped, not what really happenedremember what we hoped, not what really happened
-- why Postwhy Post--Project Reviews are seldom done?Project Reviews are seldom done?
Measurement
over 80% of measurement programmes failp gmost organisations don’t measure much-- real facts would destroy our comfortable illusionsreal facts would destroy our comfortable illusions
most organisations don’t benchmark-- some don’t even count defectssome don’t even count defects
•• “since one could be catastrophic why count any?”“since one could be catastrophic why count any?”•• since one could be catastrophic, why count any?since one could be catastrophic, why count any?
you can’t control what you can’t measure-- if you don’t measure, no one can blame you? if you don’t measure, no one can blame you?
22

Blame helps?
human nature: it’s not my fault y-- (Bart Simpson)(Bart Simpson)
perceived desired effect: improvement-- actual effect: guilt, hide the truth, no improvementactual effect: guilt, hide the truth, no improvement
misguided attempt to get people to accept responsibilityresponsibility-- responsibility (like an insult) must be taken, it responsibility (like an insult) must be taken, it
cannot be givencannot be given
-- responsibility thrives if it is OK to make a mistakeresponsibility thrives if it is OK to make a mistake
Opposite of blame?
learningg-- making a mistake isn’t so badmaking a mistake isn’t so bad
-- making the same one twice is not goodmaking the same one twice is not good
forgiving-- not necessarily forget (otherwise no learning)not necessarily forget (otherwise no learning)
it’ OK i th l t l ’ dit’ OK i th l t l ’ d-- it’s OK, wipe the slate clean, governor’s pardonit’s OK, wipe the slate clean, governor’s pardon
-- leave it behind, doesn’t continually affect nowleave it behind, doesn’t continually affect now
-- not the easy option (blame is easier!)not the easy option (blame is easier!)
23

Cognitive illusions
Contents
Optical illusionsCognitive illusionsCause (anxiety) and effects (symptoms) Dispelling cognitive illusions
Why do we deceive ourselves?
anxiety is caused by various factorsy y-- fear, worry, insecurity, uncertaintyfear, worry, insecurity, uncertainty
awareness is selective-- our attention can be directed to some things, our attention can be directed to some things,
and can ignore othersand can ignore others
what we ignore is a “blind spot”what we ignore is a “blind spot”-- what we ignore is a blind spotwhat we ignore is a blind spot•• can occur for individuals, groups, societycan occur for individuals, groups, society
-- social pressure (“groupthink”)social pressure (“groupthink”)•• the world is flat, the Othe world is flat, the O--rings are saferings are safe•• “we can make that deadline!” (“project“we can make that deadline!” (“project--think”)think”)
24

What causes anxiety?
developersp-- have I done a good job? (want to show off) have I done a good job? (want to show off)
-- will it work (properly)/(forefront of technology)will it work (properly)/(forefront of technology)
project managers-- will we meet our deadlines? (promised resources)will we meet our deadlines? (promised resources)
h d d t t ff t th ?how do good testers affect these concerns?-- find lots of bugs, makes everything worse!find lots of bugs, makes everything worse!
–– worse for developers: find bugs, have to fix not move onworse for developers: find bugs, have to fix not move on–– worse for manager: delay project, need more resourcesworse for manager: delay project, need more resources
Illusion: “piece of string” testing
symptom: h t t t l fit h d l b tth t t t l fit h d l b tt
“testing”
“testing”
-- shorter test plan fits my schedule bettershorter test plan fits my schedule better
illusion:-- nothing changed by cutting testing short (except time)nothing changed by cutting testing short (except time)
anxiety: -- deadline pressure (overdeadline pressure (over--run in other area run in other area –– my fault?)my fault?)p (p ( y )y )
-- don’t know enough about testing (& won’t admit it?)don’t know enough about testing (& won’t admit it?)
solution:-- show detail in test plansshow detail in test plans
-- choose what to cut out (arm or leg)choose what to cut out (arm or leg)
25

Illusion: plans should not be changed
symptom: -- plan remains the same in spite of new informationplan remains the same in spite of new information
illusion:-- we can make our original plan anywaywe can make our original plan anyway
anxiety: -- late delivery blame let others down everyone elselate delivery blame let others down everyone else-- late delivery, blame, let others down, everyone elselate delivery, blame, let others down, everyone else
is ok, have to be strongis ok, have to be strong
solution:-- study past historystudy past history
-- permission to change if good reasonpermission to change if good reason
Illusion: risks are bad - be positive
symptom: -- don’t discuss risk, optimism, “candon’t discuss risk, optimism, “can--do” attitudedo” attitude
illusion:-- if we don’t identify them, they won’t happenif we don’t identify them, they won’t happen
•• have you bought life insurance? made a will?have you bought life insurance? made a will?
anxiety:anxiety:-- fear of failure, fear of blamefear of failure, fear of blame
solution:-- education about risk managementeducation about risk management
-- reassurance reassurance –– it’s ok to talk about risksit’s ok to talk about risks
26

Illusion: defect-free coding
symptom: -- don’t need to test don’t need to test mymy codecode
illusion:-- my code is ok / the best / perfectmy code is ok / the best / perfect
anxiety: -- I make mistakes I’m not perfectI make mistakes I’m not perfect-- I make mistakes, I m not perfectI make mistakes, I m not perfect
solution:-- actively look for your own bugsactively look for your own bugs
-- assume there are someassume there are some
-- it’s ok to be merely human!it’s ok to be merely human!
Symptoms: developers
what do you mean, it doesn’t work? it works on my machineit works on my machine-- it works on my machineit works on my machine
-- it worked yesterdayit worked yesterday
-- Nelson’s telescope “I see no bugs”Nelson’s telescope “I see no bugs”
-- defensiveness: that’s not a bug, it’s a featuredefensiveness: that’s not a bug, it’s a feature
-- people who find bugs are not nicepeople who find bugs are not nice
-- don’t find any [more], it will slow us downdon’t find any [more], it will slow us down
-- why don’t you find something important instead?why don’t you find something important instead?
-- you misyou mis--used the system used the system -- a real user would never a real user would never do thatdo that
27

What causes anxiety for testers?
-- will we find all the bugs? will we find all the bugs?
h h i i h?h h i i h?-- how much testing is enough?how much testing is enough?
-- have we tested everything?have we tested everything?
-- not enough time to do a proper job not enough time to do a proper job
-- why should I have to fight the developerswhy should I have to fight the developers–– I just report their own bugs, why should they hate me?I just report their own bugs, why should they hate me?
-- will I get any recognitionwill I get any recognition•• how can anyone tell I’ve done a good job?how can anyone tell I’ve done a good job?•• guilt about bugs not found guilt about bugs not found •• what if bugs I found weren’t fixed what if bugs I found weren’t fixed -- is it my fault?is it my fault?
Symptoms: testers
I want to be your friendy-- feel guilty about finding bugs in my friend’s workfeel guilty about finding bugs in my friend’s work
•• turn a “blind eye” to bugsturn a “blind eye” to bugs
it’s never enough-- want to keep testing forever / I’m not done yetwant to keep testing forever / I’m not done yet
it’s all my faultit s all my fault-- feel guilty about any bugs missed in testingfeel guilty about any bugs missed in testing
•• we should continually improve, but can’t get them allwe should continually improve, but can’t get them all•• remember, you didn’t put them in!remember, you didn’t put them in!
28

What causes anxiety for test managers?
test manager concernsg-- will we finish testing on time?will we finish testing on time?
-- will we find the worst of the bugs?will we find the worst of the bugs?
-- will it be noticed if I do a good job?will it be noticed if I do a good job?
-- how to control the uncontrollablehow to control the uncontrollable
dit h dit i dno credit where credit is due-- if system is good, developers are praisedif system is good, developers are praised
-- if system is bad, testers are blamedif system is bad, testers are blamed
Symptoms: project managers
conflict of interest: how to please project managerby doing a good job as a test manager?by doing a good job as a test manager?-- by doing a good job as a test manager?by doing a good job as a test manager?
-- want to encourage my testers to do a good jobwant to encourage my testers to do a good job•• do a good job if we find lots of defectsdo a good job if we find lots of defects
-- project manager doesn’t want us to delay the projectproject manager doesn’t want us to delay the project•• better if we don’t find many defectsbetter if we don’t find many defects
dd-- paradoxparadox•• if you find defects, you delay the projectif you find defects, you delay the project•• if you ignore defects, you’re not doing a good jobif you ignore defects, you’re not doing a good job•• if you delay the project, your manager is unhappyif you delay the project, your manager is unhappy•• so if you do a good job, you don’t please your managerso if you do a good job, you don’t please your manager
29

Cognitive illusions
Contents
Optical illusionsCognitive illusionsCause (anxiety) and effects (symptoms) Dispelling cognitive illusions
Should you dispel a cognitive illusion?
for yourself?y-- yes, if you are ready to confront the anxiety that is yes, if you are ready to confront the anxiety that is
causing the illusioncausing the illusion
for someone else?-- very dangerous! use extreme caution!very dangerous! use extreme caution!
youyou willwill raise their anxiety levelsraise their anxiety levels-- youyou willwill raise their anxiety levelsraise their anxiety levels•• their illusion is protecting them from something even their illusion is protecting them from something even
scarierscarier
-- if you touch a survival rule, it can be very damagingif you touch a survival rule, it can be very damaging•• could be worse than the cognitive illusioncould be worse than the cognitive illusion
30

Survival rules
Virginia Satir’s work in family therapyi l ii l i-- “survival reactions”“survival reactions”
-- we learn ways of coping as childrenwe learn ways of coping as children
-- because the rule worked then, it becomes part of us because the rule worked then, it becomes part of us •• in our subconsciousin our subconscious
-- it is scary to violate a survival ruleit is scary to violate a survival ruleyy
examples of survival rules•• mustn’t ever change a decisionmustn’t ever change a decision•• mustn’t tell bad news, always be nicemustn’t tell bad news, always be nice
Source: AYE conferences 2006, 2004
Dealing with your own illusions
at some level, you may know you are deceiving lfyourself
-- when your own reaction surprises you (e.g. anger)when your own reaction surprises you (e.g. anger)
-- talk with a trusted friend or colleaguetalk with a trusted friend or colleague
what are you afraid of – face your fears-- what’s the worst that would happen?what’s the worst that would happen?pppp
-- how would you cope with that?how would you cope with that?
can you transform your rule into a guideline?-- facing the truth is better than protecting the illusionfacing the truth is better than protecting the illusion
31

Transforming a rule to a guideline
transform rules to guidelines: examplest ’t h d i it ’t h d i i•• mustn’t ever change a decisionmustn’t ever change a decision
–– it’s ok to change a decision when I have new informationit’s ok to change a decision when I have new information–– it’s ok to change my mind if I am not happy with my first it’s ok to change my mind if I am not happy with my first
decision, on further reflection decision, on further reflection –– strength, not weaknessstrength, not weakness
•• mustn’t tell bad news, always be nicemustn’t tell bad news, always be nice–– be nice when I can, but need to be honest about bad newsbe nice when I can, but need to be honest about bad news
it’s ok to tell bad news when not telling it will cause moreit’s ok to tell bad news when not telling it will cause more–– it s ok to tell bad news when not telling it will cause moreit s ok to tell bad news when not telling it will cause moreharm (nicer in the long run)harm (nicer in the long run)
–– I can tell bad news in the nicest possible wayI can tell bad news in the nicest possible way–– some things are more important than being popularsome things are more important than being popular
-- you give yourself permission to violate your own you give yourself permission to violate your own survival rules in some circumstancessurvival rules in some circumstances
How to dispel someone else’s illusion(if you feel you must)
-- ask their permission to discuss it (it may be painful)ask their permission to discuss it (it may be painful)p ( y p )p ( y p )
-- ensure it is a safe environment for them (and you)ensure it is a safe environment for them (and you)
-- approach it together: approach it together: •• ““wewe may be working under an illusion here …”may be working under an illusion here …”
-- address the anxiety, lead by example: address the anxiety, lead by example: •• “I am worried about / afraid of ”“I am worried about / afraid of ”I am worried about / afraid of …I am worried about / afraid of …
-- if inappropriate response or resistance, back offif inappropriate response or resistance, back off•• “I may be wrong about that “I may be wrong about that –– let me think a bit more”let me think a bit more”
-- can you help them break their illusion safely?can you help them break their illusion safely?•• e.g. transform a rule into a guidelinee.g. transform a rule into a guideline
32

Conclusion
We have the ability to deceive ourselvesy-- recognise when we do itrecognise when we do it
-- recognise when others do itrecognise when others do it
Understand the reasons for it-- anxiety anxiety --> attention diverted / don’t see> attention diverted / don’t see
Wh t t d b t it?What to do about it?-- observe and learn (self and others)observe and learn (self and others)
-- be honest with yourselfbe honest with yourself
-- face (unpleasant) facts face (unpleasant) facts -- it may help you!it may help you!
References
-- “Vital lies, simple truths: the psychology of self“Vital lies, simple truths: the psychology of self--deception”, by Daniel deception”, by Daniel G l ( th f E ti l I t lli ) Bl b P bli hiG l ( th f E ti l I t lli ) Bl b P bli hiGoleman (author of Emotional Intelligence), Bloomsbury Publishing, Goleman (author of Emotional Intelligence), Bloomsbury Publishing, 1985.1985.
-- “Inevitable Illusions: How mistakes of reason rule our minds”, by “Inevitable Illusions: How mistakes of reason rule our minds”, by Massimo PiattelliMassimo Piattelli--Palmarini, translated by the author and Keith Botsford, Palmarini, translated by the author and Keith Botsford, John Wiley & Sons, 1994.John Wiley & Sons, 1994.
-- “Organisational psychology”, 3rd edition, by Edgar H. Schein, Prentice “Organisational psychology”, 3rd edition, by Edgar H. Schein, Prentice Hall, 1988.Hall, 1988.
“G hi k” 2 d di i b i i h iffli 1982“G hi k” 2 d di i b i i h iffli 1982-- “Groupthink”, 2nd edition, by Irving L. Janis, Houghton Mifflin, 1982.“Groupthink”, 2nd edition, by Irving L. Janis, Houghton Mifflin, 1982.
-- AYE Conference, November 2006 AYE Conference, November 2006 www.ayeconference.comwww.ayeconference.com-- Brain diagrams inspired by male and female brains, from Allen & Brain diagrams inspired by male and female brains, from Allen &
Barbara Pease, “Why men don’t listen and women can’t read maps”,Barbara Pease, “Why men don’t listen and women can’t read maps”,PTI, 1998.PTI, 1998.
33

34

Ten Tendencies That Trap Testers
An informal 10-year study of limiting behaviors seen during job interviews
Jon Bach
Manager for Corporate Intellect
Quardev, Inc.
August 13, 2007
35

Bio:
Jon Bach is lead consultant and corporate intellect manager for Quardev – an outsource test lab
in Seattle, Washington.
He is co-inventor (with his brother James) of “Session-Based Test Management” – a technique
for managing (and measuring) exploratory testing.
For 12 years, Jon has worked as a test contractor, full-time test manager, and consultant for
companies such as Microsoft, Rational, Washington Mutual, and Hewlett-Packard. He has
written articles for Computer magazine and Better Software (formerly STQE Magazine). He is
also a frequent speaker and presenter at testing conferences like STAR, CAST, TCS, TISQA,
QAI, and PNSQC.
At Quardev, Jon manages testing projects ranging from a few days to several months using
Rapid Testing techniques (like SBTM). He is the speaker chairman for Washington Software
Alliance’s Quality Assurance SIG, as well as Conference President for the Association of
Software Testing.
Abstract:
For the last 10 years, I have conducted over 400 job interviews for people seeking test positions.
Called “auditions,” these job interviews are meant to be interactive project simulations, designed
to allow the tester to demonstrate their testing skill. This paper discusses the pathologies I have
seen that tend to limit a candidate’s ability to be effective and suggests some remedies for those
tendencies. This is not a scientific study, but part of my conclusions are founded on test data
(log files of mouse clicks and keystrokes) from 65 interviewees as they each used the same piece
of software to demonstrate their skills.
© Jon Bach, Quardev, Inc.
36

Overview
As a software testing provider, software comes to us with its weaknesses usually hidden. The
same can be said for humans. We have weaknesses, too, and most of us are very good at keeping
them hidden (especially on job interviews), until, like software, our programming is tested or
triggered into revealing them.
This paper is about my experience testing software testers during job interviews. It’s about a
process I use to get them to reveal their strengths and weaknesses to me so I can determine if
they would be a good fit for the jobs we have at Quardev – an outsource, onshore test lab in
Seattle. It is an informal accounting of my experiences as interviewer, or host, of over 400
individual “auditions” – roughly one-hour sessions where job candidates demonstrate their
testing skill to me. Although I consider myself a scientist, this is not a scientific study because
the data I collected is contextual. Other than my experience as an interviewer, this paper
includes, in its foundation, data from log files kept as the candidates tested the software.
The interview process starts with having received a resume, which leads to a phone screen where
the tester is asked about their work experience. Then they are given a product to test (over
email) for 20 minutes, where they must write up one bug. After that, they are invited into the lab
where they go through an in-person Concise In-Depth Survey (CIDS) of their work experience.
The audition (project simulation) is the last stage. It consists of me standing up at the whiteboard
as I introduce a sample testing project.
I write the word “Bugs” on a whiteboard and underline it. This is where they will write their
problem reports. I tell them I just need a title (not the full report) and that it must be 20 words or
fewer.
Under that, I write “Issues / Questions”. This section is for any questions they ask me as well as
any issues they’d like to raise.
An “Issue” is a concern that could affect the success of the project. It could read like a bug title:
“No setup.exe in the main directory.” Why not file this under the “Bugs” section? The tester
may not be confident that it’s a bug because they may be unsure if it is by design, so filing it as
an issue preserves their credibility. The fact that there is no setup.exe could be a bug, it just
depends on the candidate’s level of confidence in their model of how the program is designed.
If a tester is too cautious, however, and never file bugs in the “Bugs” section during the audition,
I’d be concerned. I look for a balance between caution and confidence. Being too cautious is a
pathology, but so is ardent righteousness where testers declare any concern in their mind to be a
bug, no matter the context.
At this point in the audition, I summarize. I remind the tester that they have three choices when
they encounter what may be a problem in the software: 1) file a bug, 2) raise an issue, or 3) ask a
question.
I then draw two columns next to the “Bugs” and “Issues / Questions” section: “Test Ideas” and
“Tests Run”.
37

I explain that “Test Ideas” are verbal “commitments” to run tests or use techniques that take too
long to actually run in the interview (like localization or scalability) whereas the “Tests Run”
section is a running shorthand list of tests I see the tester perform.
At this point, the whiteboard looks like this:
As I stand at the whiteboard, prepared to be their scribe for the next hour, the candidate sits in
front of a laptop running Windows XP TM
. The laptop is connected to a projector so I can see
what’s on their screen without having to stand over them as they test. In front of them on the
laptop is an open directory containing several files necessary for the program to run. I explain
that these are the contents of the “shipping CD” or “release candidate” that the client wants our
lab to test.
In that directory, they find the following files:
38

I explain the mission – find interesting bugs (crashes, hangs, data loss).
The program I want them to test is called the Triangle Program. It was built in Visual Basic and
looks like this:
I depict this on the whiteboard and explain that the UI takes three numbers separated by commas,
such that when the CHECK button is pressed, it tells you what kind of triangle it would make.
There are five possible outputs – “scalene” (three unequal sides), “equilateral” (three equal
sides), “isosceles” (two equal sides), “invalid”, and “Not a Triangle.”
I declare the audition underway and ask if the tester has any questions to get the ball rolling.
Right away, I start looking for testing skill. Things like:
• Questioning: Do they ask questions to frame their testing or do they start testing right
away?
• Resourcing: Do they ask for mission-clarifying or oracle-building project artifacts like
specs, test cases, emails, requirements?
• Modeling: How will they take notice of the files in the directory? Will they open every
file? Ask questions about what each one is? Design tests around them?
• Recording: Will they take notes as they test?
• Conjecturing: If they don’t ask me any questions, what assumptions do they have about
the product and how do they act on them?
I’m looking for what I call “The 3 C’s” -- caution, critical thinking, and curiosity. (Note: a reviewer
of this paper suggested “creativity” as a 4th
“C”, and although I look for that as well, it is usually later in the
audition.)
If they decide to ask me a question, I will break into one of several characters, answering as
programmer, project manager, test lead, CEO, etc. Sometimes I answer as well-meaning-but-
misinformed client. Sometimes I contradict myself, as happens on real projects.
39

My aim is to see their skill, but to trap them in ways I have seen myself and others get trapped.
Being “trapped” means a situation that constrains or limits the candidate such that a testing risk
is created. Some traps are not that dire, other traps can torpedo a project. There are multiple
ways out of every trap I set.
In seeing testers go through the audition, I have seen some behaviors that I will call tendencies.
Here are the top ten tendencies I’ve seen that have trapped testers, starting with the least
common:
Trap #10: Stakeholder Trust
This trap happens when testers believe that stakeholders are the keepers of all of the necessary
information, and that all the information given is current and relevant.
As I play the roles of stakeholders like Programmer, Test Manager, Program Manager, CEO, and
Customer, I see if the candidate questions the information they are given. In my experience,
people who usually have no idea about testing theory or practice have mistaken beliefs about the
role and value of testers, so I look to see if candidates push back on fallacious notions (like being
told that they are solely responsible for quality).
Trap #9: Compartmental Thinking
This trap occurs when testers think only about what’s proximate or in their field-of-view. When
testers do not take into account other, opposite, or orthogonal dimensions, it causes them to miss
systemic bugs or to leave whole features untested.
Trap #8: Definition Faith
When testers don’t consider that terms like “regression testing”, “test case”, “function” or
“feature” mean different things to different people. As a result, the tester could accidentally use
these terms to convey a notion of testing completeness when testing actually hasn’t yet started.
Trap #7: Inattentional Blindness
A bit different than the Compartmental Thinking trap, Inattentional Blindness is meant to
describe when the tester sees something in their field of view, but does not process the
information, so in effect, does not really “see” the behavior. Derived from the concept of
compartmentalization in cognitive psychology, it is “The inability to perceive features in a visual
scene when the observer is not attending to them.” (Wikipedia)
A video produced by the University of Illinois’ Visual Cognition lab demonstrates this
phenomenon. It can be viewed at http://viscog.beckman.uiuc.edu/grafs/demos/15.html
40

Trap #6: Dismissed Confusion
Too often, the testers see and identify suspicious behavior but rule it out because they’re not
confident in their reasoning. They think confusion is weakness and often believe the problem
isn’t the software because smarter or more veteran people than they created it.
Trap #5: Performance Paralysis
This is where a tester temporarily fears ideas. Either they have no idea of what to do or so many
ideas that they do not choose one out of fear that another will be forsaken. The fear of choosing
one idea over or failing to produce any idea for fear that it may be the “wrong” one, causes
testers to freeze, making no choice at all.
Trap #4: Function Fanaticism
Running tests that only reveal what the program does or doesn’t do through its UI, instead of
what it is comprised of, what it processes, how it’s used, or what it depends upon. The
“fanaticism” comes when the tester goes right for opening the UI and stays locked in function
tests for a majority of the audition, forsaking all other test ideas, techniques, planning, or
approaches.
Trap #3: Yourself, untested
This trap is when the tester does not take the time to evaluate their work through the eyes of key
stakeholders. Examples include test ideas they cannot explain to a CEO, testing knowledge they
assume everyone has, imprecise notes that tell an incomplete story to a test manager, notes that
are so precise that the story of testing is ambiguous, bug titles that are misleading to developers,
and bug reports that have missing information that programmers notoriously ask for. In short,
it’s when testers do not understand (or choose not to understand) stakeholder expectations for
information that might be valuable.
Trap #2: Bad Oracles
Oracles are principles or mechanisms with which to identify problems. Without oracles, there
can be no testing because we won’t know whether a test passed or failed. A “bug” is a difference
between desired behavior and actual behavior, and oracles indicate the desired behavior. The
“bad oracles” trap is when testers do not know what oracle they are using (i.e. cannot sufficiently
describe it to others), or base their conclusions on faulty reasoning.
Trap #1: Premature Celebration
This means to rush to an incomplete judgment of a bug despite the prospect of easily gathering
better information. Failures are symptoms of faults, and testers are often content with reporting
failures without looking for the underlying cause. Filing failures is fine in the audition especially
because time is short, and besides, I don’t need testers to investigate bugs in the audition to the
degree where they can point out the problem in the code. But the trap I see the most (putting
credibility on the line every time) is when testers stop their investigation too soon, writing the
41

bug despite the fault being just a few more clicks away had the tester continued on their testing
path.
This is a trap because usually the bug is a failure, not a fault, but worse, the tester does no
follow-up testing or investigation to make sure they are providing a more complete picture or
context of the problem.
This is one bug commonly found by testers in the audition:
It is easily found because it lies in a pre-existing value in a dropdown list, one of only a few
functions available to test in the UI:
A tester will often select this value and click the “Check” button, which causes the error. Right
away, they will file this as a bug with a title like: “Run-time error ‘6’ Overflow.”
I look to see if they run follow-up tests around this. For example, if they don’t know what “run-
time” means, ok, but do they have ideas on whether this be a serious problem with
interoperability or is this an isolated event? They see that 3,3,3 produces an equilateral triangle,
and they see that 16767,16000,32768 produces a run-time error, so will they do something like a
binary search to narrow down the point at which the problem starts?
42

Traps Summary
# Tendency Description
10 Stakeholder Trust The belief that the stakeholders are the keepers of all
of the necessary information for the tester to do a
thorough job and that all the information they have is
current and relevant.
9 Compartmental Thinking Thinking only about what’s proximate or in the
tester’s field-of-view.
8 Definition Faith Not considering that subjective terms like “regression
testing”, “test case”, “function” or “feature” mean
different things to different people.
7 Inattentional Blindness When the tester sees something in their field of view,
but does not process the information correctly so in
effect, does not really “see” the behavior.
6 Dismissed Confusion The tester sees and identifies a suspicious behavior
but rules it out as a bug because they’re not confident
in their reasoning.
5 Performance Paralysis When a tester temporarily fears ideas.
4 Function Fanaticism Running tests that only reveal what the program does
through its UI.
3 Yourself, untested When the tester does not take the time to evaluate
their work through the eyes of key stakeholders.
2 Bad Oracles When the tester does not know [or cannot sufficiently
describe] the principle or method they used to
identify a problem.
1 Premature Celebration To rush to an incomplete judgment of a bug at the
cost of better information that’s readily available.
Each trap is not only avoidable, each has a way out. I look for trap-avoidance skill in the audition
because it is an important martial art to have on a project. You may have seen movies where a
kung fu master has felled 50 opponents, and instead of brushing off and simply walking away,
the master is alert for the 51st
, backing slowly out of the battle arena, scanning for that next threat
from any direction.
My thoughts about remedies for these traps (some of which I have seen testers do in the audition
even after getting trapped), are as follows. It is my hope that reading this list provokes reflection
and inspires you to become not only better job candidates yourself, but better interviewers as
well:
10) Stakeholder Trust
Remedy:
Create a line of inquiry -- a structure that organizes reading, questioning, conversation, testing, or
any other information-gathering tactic. It is investigation oriented around a specific goal. Many
lines of inquiry may be served during exploration.
43

Remedy:
Try the Brute Cause Analysis game. It’s called “brute” cause because the game encourages
testers to force reasons for causality. It’s a game played with two people (but can be played
alone). It starts with one person describing any failure (like “Invalid or Missing DLL:
RICHTX32”). The other person describes a feature, like “Help / About” which has a link to the
latest upgrade. The first person then has to tell a story about a possible link between the two
even when none might exist. This exercise is meant to break testers out of unchallenged
assumptions. Assumptions are not dangerous, but if unchallenged could cause us to look foolish.
Compartmental thinking is a trap that can be avoided by looking at system interactions between
things (like product features and error messages describing missing DLLs).
8) Definition Faith
Remedy:
What do you think when you hear the word “test”? Could mean someone wants you to evaluate
or find problems? Compare and contrast with something else? Suggest improvements? Verify,
corroborate, experiment? Since each of these activities may be orthogonal and have different
costs, imagine some of these different definitions and check in with stakeholders to know which
focus you need in order to be of value to them. Yes, it may be that they say “yes” to all of them,
but if that’s the case, weight the risk of trying each definition because each may have a different
cost.
Then ask “test for what?” Scalability, usability, reliability, performance, robustness, correctness,
compliance, regression? Each of these attributes might need you to use a different technique,
which can be more or less time-consuming or expensive than others. The spirit of the
“Definition Faith” remedy is to place the focus on being clear with terms so that you can manage
the risk of prioritizing activities that best suit the definition of the stakeholders to which you are
in service as a tester.
7) Inattentional Blindness
Remedy:
It’s a Catch-22, how do you know you’re not seeing something when you’re not seeing it?
Should we go through life paranoid, questioning everything three or four times just to be on the
safe side? I’ve never faulted testers in the interview when they did not see something that to me
was obvious, but I did see testers that either re-executed tests to get more information or
consulted a separate, anchoring source (like the spec) to populate their notions of where faults
were, even if it was right in front of them. These actions allowed them to see heretofore hidden
things because their knowledge of the underlying environment was improved with different
elements of context needed to see the whole picture.
9) Compartmental Thinking
Here’s an idea: act like a pilot. Pilots are trained to consult a variety of sources so they don’t
rely what might be a faulty instrument. Known as “situational awareness”, they scan a variety of
44

6) Dismissed Confusion
Remedy:
Your confusion is not a liability, it is a weapon for you to use. Learn to recognize your
confusion as a trigger, a powerful tool that tells you that something confusing may be going on
and that to remedy your uneasy gut feeling, you must ask a question or raise an issue. It is this
that often provokes excellent conversations and keeps confusion from being a virus that is passed
along to the customer. Knowing that you can provide this service on a project could be an easy
way for you to feel empowered instead of feeling shame that you should have known better.
5) Performance Paralysis
Remedy:
Life is a journey and so is testing. It is a pursuit that has to start somewhere. When I see testers
paralyzed, I try to provoke them into showing me any idea, as lame or silly as I think it might be,
to see how they react to it.
One remedy is to try a P.I.Q. cycle: Plunge-In-and-Quit. Start anywhere, with any idea, follow
it, but when it gets too complex or abstract, causing your brain to hurt, quit! Take a break, come
back to it later with new eyes.
Testers in the auditions I’ve hosted have never had a lack of ideas, only a fear of picking one and
describing it. When I see this happen, I will leave the room, saying I need some water asking if
they want anything. When I come back, they are usually ready to show me an idea.
4) Function Fanaticism
Remedy:
In the audition, many testers run function tests (likely because time is short, so they go right for
the UI to find a crash, hang, or loss of data), but it’s a tendency to get themselves trapped.
When trapped like this, use a heuristic or a checklist. One I use is a mnemonic device I call
SFDPO, (said as “San Francisco Depot”), which reminds me to try tests in the domains of
Structure, Function, Data, Platform, Operations. Although function tests are the F in that
mnemonic, it also includes tests that are designed to reveal errors in whatever the product is
comprised of (S), whatever data it can process (D), whatever other software or hardware it
depends upon (P), and how it is meant to be used (O).
In the “Test Ideas” column on the whiteboard, I look to see if the tester is familiar and can
describe the quality factors (also known as the “ilities”) like scalability, reliability, portability,
maintainability, capability, usability, installability, etc.
instruments meant to tell them the same data in different ways.*
* (Fighter pilots often get so fixated on their target that they lose track of what the airplane is doing. This necessitated electronic voices in
instruments -- a different sense than sight -- telling them “Pull up, pull up…” even when they could see the ground fast approaching.)
45

3) Yourself, untested
Remedy:
Do you evaluate your testing techniques, strategy, approach, plan, risk assessment – any artifact
of your testing before you deliver it? In the interview, I want candidates to show me they have
some confidence that they're right for the job instead of assuming they did a good job with
whatever they did during the interview. I look for critical thinking in their testing throughout the
interview, but I also look for them to apply that critical thinking to their own work – e.g. do they
ask me how they did, or what they could have done better, or do they change their mind on a bug
report after further review. Some call this “humility”, and I agree. It is often a virtue for a tester,
but I’m saying that too much (or too little of it) of it can jeopardize your credibility.
2) Bad Oracles
The most common bad oracle I have seen when testers test the Triangle Program is the belief that
any three numbers makes a triangle. The tester types in any three numbers and they expect the
program to give a result of either equilateral, isosceles, or scalene. I do not expect them to be
trigonometry experts, but I do expect them to have a notion of impossible triangles. For
example, the numbers 1, 1, 10 can never be three lengths for the sides of a triangle because the
sides will never connect, but if they don’t realize this, I ask them to come to the whiteboard and
draw it for me. Most testers quickly realize it is impossible and so I give them the oracle: “for
any triangle to be legitimate, the sum of the two smallest sides must be greater than the third.”
From that point on, I watch how their testing changes.
A remedy for the notion of bad oracles is to get other stakeholders’ ideas on whether or not a bug
is a bug. Raising issues is a good way to do this, which is why I have a section on the
whiteboard for it in the audition. It’s a way to MIP a bug (mention-in-passing) as if you’re
standing in the hallway informally talking to the Program Manager to say “by the way, I saw this
weird thing…”, giving you the opportunity to hear them talk about how the design should work
without risking your credibility.
Very few testers notice in the audition that there is a second revision of the Triangle Program in
the directory – a version that actually draws the triangle. This could serve as an oracle to get a
bearing on what triangles are legitimate and what triangles are invalid.
1) Premature Celebration
Remedy:
It wasn’t hard to find the run-time I showed in the traps section above, and yes, it’s fine for a
tester to feel validated that they’ve done their job to find important problems quickly, but what if
they started the party a bit later? How do they know it’s not just the tip of the iceberg and they
could get the platform to bluescreen with a little more prodding? At this point, I’m looking to
see if testers jump to conjectures, not conclusions.
46

There is a heuristic that I’ve been practicing to help me avoid this trap more consistently. It is
called “Rumble Strip.” It takes its name from the grooves in the shoulder of a highway meant to
make your car tires noisy if you go over them – an audible alert that you are going off into the
shoulder and that bad things might happen if you continue on that path. It is meant to get us
back on the road. But what if as testers, we used the rumble strip as a guide to make bad things
even worse – to find those better problems just a mouse click or two away?
This is where a hacker mentality comes in handy. In other words, yes, you found a hang or a
crash, but before you report it, can you exploit the state of the machine to find something even
worse? In other words, can you continue to give the program input or cause it to reveal a
memory leak? Think of any bug you find like an invitation to a larger party with VIPs to which
you are always invited. It begins with the discovery of a bug, continues with newly formed
conjectures and follow-up tests, and may end with the celebration of the year when you find an
even more severe bug than what you started with.
Summary:
47

Caveats
Data: It’s important to note that this paper is non-scientific. Although the Triangle Program has
a hidden logging feature that captures their mouse clicks and keystrokes, those tests do not show
the full range of a candidate’s testing ability. The traps I have seen are not limited to the
audition, but are also present in the phone screen exercises and the written exercise portion of the
interview process.
Bias: One of the flaws in my research is my bias toward extrovert testers – testers who can
openly communicate their thinking in real time and tend to enjoy (and get fueled by) interaction.
Introverts, on the other hand, tend to need solitude to refuel. This was pointed out to me last
year, so I amended the audition to include time for me to leave the room and let testers consider a
problem before demonstrating a technique. It also encouraged me to incorporate a written
portion of the interview well before the audition.
Results: The audition is used in conjunction with a phone screen, a written interview, and a one-
hour survey of their work experience. When they get to the final audition phase, they are ready
for a test of their skill and we use the audition as a project simulator. People who do well in the
audition usually become hired because it is the toughest part of the interview process. Those that
make it through have caused me to have confidence that they can work on any project at the lab,
no matter the nature, mission, or context because they will have shown questioning ability,
technical ability, test idea creation balanced with test execution in a short amount of time.
48

Flexing Your Mental Muscle to Obtain Defect-Free Products
By Rick Anderson ([email protected])
ABSTRACT
Much time is spent on improving our engineering processes; however, we have seen only small
gains over the past twenty years in improving our on-time delivery and the quality of our ever
complex products. Somewhere, the key ingredients for winning in product development have
escaped us. This paper will explore the unlocking of our mental abilities to improve product
delivery. Taking lessons from sports psychology, we will explore relatively simple concepts like
getting better every day, the power of belief, visualization, goal setting, motivation and the negative
power of excuses. We will apply some of these concepts to product development and quickly speak
about some of those processes which we should be spending more time on to better achieve defect-
free products.
BIOGRAPHY
Rick Anderson is a Senior Software Engineering Manager at Tektronix, Inc. (Beaverton, Oregon),
a provider of world-class test and measurement equipment for the electronics industry. In this role,
Rick leads a large multi-site team of Software Engineers and Software Quality Engineers in the
pursuit of defect-free oscilloscope software that “wows” our customers. Prior to this, Rick worked
for a small start-up doing interactive television systems and a large telephone switch manufacturer.
Rick is a member of the IEEE and ASQ. He also serves on Industry Advisory Boards at Oregon
State University and Arizona State University. In his spare time he coaches highly competitive
youth sports. Rick can be reached at [email protected]
49

INTRODUCTION
For many years, engineers have worked on many different improvement projects to better schedule
delivery and product quality. Unfortunately, we continue to miss schedules and produce products
of questionable content and quality. Martin Cobb, the Secretariat of the Treasury Board of Canada,
states in Cobb’s Paradox: “We know why projects fail, we know how to prevent their failure – so
why do they still fail?”
Maybe it is time to approach the problem differently than we have in the past. Instead of endlessly
focusing on improving our processes and tools, maybe we should adjust our thinking. Flexing our
mental muscle - using the power of belief - is not something we usually talk about when we want to
improve our product quality or schedule delivery. But maybe we should. In this paper, we will
attempt to draw some lessons from sports psychology to adjust our thinking about the problem.
GETTING BETTER EVERY DAY
“It’s a funny thing about life; if you refuse to accept anything but the best, you very often get it.”
W. Somerset Maugham (see reference 12).
As head coach of several competitive youth sports teams, there are only two rules our players
follow. First, keep it fun. If it isn’t fun, the kids won’t come back. Second, get better every
practice or game. If you are getting better every day, you are moving in the right direction. Note
that winning is not a direct goal. While we can control our own actions, we cannot control the skill
level of the other team. So by focusing on getting better every day, the team plays within our own
abilities and assuming we play well, it is a successful outing.
Within product engineering, the goal of getting better every day is also a good one. We should be
focused on continuously improving our abilities and learning from our past experiences. This
passion should be engrained into the culture of the organization. Many organizations do a single
post-project review at the end of the project (and beyond that, few really get better from them). If
one believes in getting better each day, they would be having mid-project reviews every few weeks
as the project goes along, thereby building continuous learning into our processes (reference 1).
HOW BAD IS IT?
One does not need to look far to see examples of failed projects. According to the Standish Group
in their 2001 Extreme CHAOS report (reference 2):
� Only 28% of all projects finish on time, on budget and with all features
� 23% of the projects deliver no code (they fail)
� Of those projects that do produce something:
o 45% are over budget
o 63% are over schedule
o 67% of the feature set is delivered
It is hard to consider this winning. And while our profession has made some progress from the
original 1994 CHAOS report (where 16% of the projects finished on time, on budget and with all
features in place), our improvement has been slow. This does not seem to be getting better every
day! As engineering professionals, this is not something we should be proud of.
50

EXCUSES
Before we get too far into the discussion of improving, we have to address excuses. These are
everywhere and we use them as a crutch. On my sports teams, here are some common excuses:
• The sun was in my eyes
• I didn’t know the play
• I left my equipment at home
• She was taller than me
While all of these have some merit, they are also all roadblocks to us improving. If we believe we
cannot do anything about the sun in our eyes, we are resigned to “living with it” and thus it becomes
an obstacle. But if we turn around this excuse into a solvable problem, we remove the obstacle and
progress forward. On the softball field, I might recommend using a hat or visor, shielding the sun
with your hands or positioning yourself a bit differently to approach the ball.
Within our engineering groups, we’ve certainly heard our share of excuses:
• We’ve always done it that way
• We don’t have the time to do it right
• That’s not my area
• Management won’t let us
• We know that’s best practice, but …
Excuses do not help us become better. In fact, they are sources of negative energy and detract from
moving forward. We must accept responsibility and work to remove these roadblocks. Creating an
engineering environment or culture where excuses are not tolerated is one important step toward
become defect-free.
DEFECT-FREE MENTALITY
A defect-free mentality (DFM) is a mindset or a belief that we can produce defect-free products,
and if by chance we do not, we will remove the introduced defects from our products in the phase of
the lifecycle they are introduced. There are some important things to recognize about this
definition. First, it is not a process. While certain processes might figure into it, it’s more of a
mental state. It really doesn’t matter what product development lifecycle you are using – you can
still practice a DFM. Second, the definition implies a certain amount of confidence. There is no
room for excuses. Third, the mindset should equate to action. It’s not just something we believe,
but something we act on. Fourth, while this is an individual concept with individual responsibility,
it is also a team one. It has to do with high achieving individuals, who then make up high
performing teams.
It is important to point out that a defect-free mentality is different from zero-defect software or
hardware. We want to believe and act as though we can produce very high quality products with no
defects. Doing this will improve our product quality. Given that we aren’t perfect, there will
51

undoubtedly be defects. When these do occur, you should find and fix them sooner, with the goal
of minimizing the number of defects that slip into future lifecycle phases.
It might also be worthwhile to define the term “defect”. A defect is (1) any behavior of your
product that does not satisfy the customer, (2) any behavior of your product that does not meet
requirements, or (3) any imperfection in your work products or processes. The words “bug” and
“defect” are used interchangeably.
If one has a defect-free attitude, there are three guiding strategies:
1. Do it right the first time (no defects, avoid rework)
2. Find and fix defects earlier
3. Meet commitments
The first strategy goes along with the adage “If you don’t have time to do it right, when are you
going to have time to do it again?” Reducing rework increases productivity and allows us more
time to focus on other tasks (or more importantly, to finish the ones we have committed to). The
first guiding strategy is an expectation of high quality.
We have all heard that it is more expensive to fix defects late in the development cycle. The second
guiding strategy indicates that if defects do slip through, we want to find them as early in the
product development lifecycle and fix them as early as possible as well. Indeed, fix defects in the
phase they are found. This strategy is a sense of urgency that quality must come early and often. It
is every phase of your development cycle being as good as it can be.
Finally, a defect-free attitude is not just about quality. We want to translate our positive attitude
into improving our schedule delivery as well. Holding ourselves accountable for scheduled tasks
goes hand-in-hand with a defect-free mentality.
In my estimation, few organizations and engineers think about product development in this way.
We do not often discuss being defect-free or what it might mean to us and our organization. A
DFM should drive your decision making.
In sports, the first few years are spent learning the basic fundamentals of the game. After five or so
years, the focus turns from fundamentals to teamwork and game strategy. Beyond that, training
becomes much less physical and much more mental. In engineering, we are talking about the
mental side of the game. You must believe defect-free products are possible.
Elite athletes often use a number of different mental methods to improve their abilities, including
the power of belief, goal setting, visualization and motivation. Each of these mental methods will
be briefly examined.
52

The Power of Belief
As mentioned, a defect-free mentality includes believing you will remove defects from your
products. Tiger Woods, undeniably the greatest golfer of our time, does not get to the 18th
hole at
the Masters and think “I wonder if I’m going to sink this putt.” He has physically practiced and
mentally rehearsed this putt many times before and is confident that he will make it. Basketball
great Michael Jordan doesn’t view missing free throws as normal. These elite athletes have a
certain belief about their abilities and this translates directly into their actions. Personal
development evangelist Earl Nightingale states this well: “You become what you think about”
(reference 4).
If the typical engineer views defects as normal, their actions will match this. But if they believe
defects are not a normal occurrence, their actions will be much different. Modest expectations tend
to produce modest results.
The more you expect from a situation, the more you will achieve. There are several medical studies
which have shown how positive thinking has improved one’s health. The University of
Pennsylvania tracked 120 men after they had their first heart attack. After eight years, 80% of the
pessimists had died of a second heart attack compared with only 33% of the optimists (reference 5).
Shape your engineering team to believe defects are not normal. This mindset will cause several
actions which will reduce defects and rework.
Goal Setting
Goal setting is widely used in both sports and business to decide what is important, to separate the
important from the irrelevant, to motivate yourself to achievement and/or to build self-confidence
based on measured achievement of goals. It is a powerful process for both team and individual
planning. According to sports psychologist Kenneth Baum, the simple act of goal setting improves
one’s performance on average by 8 to 16% just by setting goals (reference 5). Imagine what the
improvement might be if you really practiced proper goal setting, tracking and follow through.
Given that setting goals improves performance, it is interesting we don’t set more goals around
product quality and reduction of our defects. There are a number of good books and websites on
how to do goal setting (reference 6). I propose that many of us could use goal setting more in our
organizations.
53

Visualization
Mental visualization (or imagery, reference 7) is one technique that can be used to improve skill,
concentration and endurance. It is often used as a way to see ourselves succeeding before we
actually do so. In this form, visualization helps put the mind and body into a situation that hasn’t
yet occurred; it is basically thinking ahead and seeing success. While I have not tried to visualize
myself writing defect-free software (interesting experiment though…), it is worthwhile to consider
what a defect-free environment would look like. And just as importantly, how does a DFM change
the way we work? Consider these additional questions:
� What would technical reviews look like?
� What would it do to our project schedule?
� Would we have a Software Quality group?
� Would we need a defect tracking system?
� What would the week leading up to release look like compared to today?
Jim Fannin, author of S.C.O.R.E. for Life: The Secret Formula for Thinking like a Champion
(reference 8), says the average person has 2,000 – 3,000 thoughts per day, but true champions only
have 1,100 – 1,300. He believes that fewer thoughts produce more results. In essence, you are
more focused.
The Soviet Union conducted a study prior to the 1980 Olympics (reference 5). They broke their
elite athletes into four groups:
• Group #1 did 100% physical training
• Group #2 did 75% physical training and 25% mental training
• Group #3 did 50% physical training and 50% mental training
• Group #4 did 25% physical training and 75% mental training
The greatest improvement was made by the group which did the most mental training (group #4),
followed in order, by group #3, #2 and #1. It seems like there might be something with this mental
stuff.
Motivation
If one wants to improve the performance of our teams, we must also consider the role that
motivation plays. Some of the early efforts at Tektronix regarding a defect-free mentality have
succeeded because the focus on reducing defects has also increased employee motivation. The old
saying “what gets measured, gets done” comes to mind.
1950’s researcher Frederick Herzberg (reference 13) showed that achievement, setting goals,
recognition and responsibility were among the factors that motivated people (others include the
work itself, growth and advancement). Besides goal setting mentioned above, a DFM does promote
these other factors. Maybe the early success of a DFM feeds on itself as the “snowball effect” –
achieving and recognizing a small initial improvement because it’s something new and then it
grows because of increased motivation around that achievement and recognition.
54

TEKTRONIX DEFECT-FREE MENTALITY JOURNEY
At Tektronix, we started putting together the DFM framework right after PNSQC 2006. Some of
the ideas introduced there, combined with the author’s research of sports psychology, helped to
form the idea. We also knew we wanted to reduce rework, improve schedule accuracy and find and
fix defects early. While we did not set hard numeric goals for how much improvement we wanted,
the DFM framework became a great umbrella for these things.
A presentation was given on this topic in February 2007 to the Rose City SPIN group and in March
2007 at an internal company-wide engineering symposium. Our first pilot project (let’s call it
Project X, a software-only project) was started in April 2007 and it finished in June 2007.
The Project X team spent about four hours in four separate meetings discussing what a defect-free
mentality meant to them. They also received some motivation in the form of a few inspiration
videos (reference 9). The team members vowed that they would not use excuses as a crutch during
their program and acknowledged to each other throughout the project when excuses where being
used. The team identified 5 or 6 things (from the list presented in the next section) to do differently
versus past programs and these were built into the project plans and schedules.
Three main metrics were used to compare this program’s performance to past programs in the area
of DFM. First, we looked at the number of defects found by the software engineering team versus
other users and testers (the Implementer Defect Submit Rate metric). The hypothesis was that if the
SWE team had a defect-free mentality, they would find defects before the SQE team and others
found them (obviously a good thing, as finding defects earlier in the lifecycle is less costly). This
was indeed the case, with SWE finding 30% more defects than the average project of the same type.
The second metric used was the percent of defect resubmits. If the SWEs are following the first
DFM strategy (doing it right the first time), one would expect the number defects that were resolved
and then reopened to be smaller than the average. Here the team was almost perfect with only one
true resubmit, which is far better than the average project of the same type.
The final metric was associated with product delivery schedules (schedule delivery metric). If a
DFM is successful, we would expect to pull-in our schedules as overall we have less rework and we
are finding our defects earlier in the lifecycle where they are less costly to fix. Once again, this
program did not disappoint, delivering ahead of its planned schedule.
In all three metrics, Project X delivered better than historic Tektronix projects measure. While a
sample size of one certainly isn’t conclusive that a DFM is a secret for success, the results thus far
are favorable. At this point we are piloting this mindset on other programs to see if the results are
repeatable.
One person was worried that we would become paralyzed by following a DFM, because we would
spend so much time trying to avoid defects. This worry never materialized. Much of a defect-free
mentality revolves around product tasks that you have to do anyway. Doing them right the first
time avoids rework.
55

As a potential next step for DFM, we are considering implementation of a Defect-Free Club. This
would be a fun concept where you advance through a series of steps (ala CMM, Six Sigma, etc.) to
condition yourself to think and act defect-free in your daily activities.
From an engineer’s point-of-view, this is viewed as challenging and exciting. It provides a
framework and language to talk about high quality products. It helps set expectations and changes
some of the ground rules that were previously thought to exist.
IMPLEMENTING A DEFECT-FREE MENTALITY
Like any other process improvement or new tool implementation, shifting to a DFM does not
happen overnight. Introducing the topic within your organization, finding champions and starting it
on a pilot project all make sense, but take time, effort and perseverance. Geoffrey Moore’s viral
adoption model (reference 11) comes to mind as a good way to get something like this implemented
– work with enthusiastic adopters / innovators first, help them to become future champions and then
work with the next set of adopters. As the concept gains momentum, it can be reinforced and the
laggards can be brought along. Expect it to take upwards to five years for it to become part of your
culture. As with anything new, constant reinforcement is required, along with the celebration of
even small successes.
While a DFM is a mental attitude and belief, as previously mentioned, this translates into action.
The actions include improvement in various processes and tools related to defect prevention. The
following are some activities one might consider when following a Defect-Free Mentality towards
product development:
� Robust technical peer reviews of requirements, architecture and design documents
� Technical peer reviews of select code segments (critical, performance driven, interfaces,
defect prone, overly complex, new engineer)
� Separate Software Quality Engineering (SQE) group performing system level testing
� Use of automated testing by SWE and SQE
� Technical peer review of SQE System Test Plans
� Code analysis (static and dynamic)
� Unit Testing of one’s code
� Test-Driven Development (TDD)
� Daily builds (continuous integration)
� Smoke tests on daily builds
� Integration Testing / SW Evaluation Testing cycles
� Testing with coverage analysis tools
� Use of multiple testing types or methods
� Defect verification
� Mini-milestones (reference 10)
� More use of formal detailed design techniques
� Causal analysis / root cause analysis of high priority defects
� Prioritize high risk tasks first
� Refactoring of code as required
� Really learn the code you are working on (learn from others, teach to others)
� Add logging/debugging code for more understanding
� Focus on the –ilities (extensibility, maintainability, etc.)
56

� Potentially more focus on negative testing than normal
� SQE goal of not having more than 10% “false” defects (defects which are duplicates,
resolved as not a defect, misunderstandings, etc.)
An individual with a DFM will come up with more project-specific actions than the ones listed
above. This list is not new. It consists of many best practices experts have recommended for years.
At Tektronix, we have started to see that a DFM opens the door to acceptance of some of these best
practices. Teams seem a bit more willing to accept the change and cost of these best practices given
their new attitude toward defects.
Attacking those parts of the development lifecycle that provide the least cost / most benefit are
clearly recommended. Following past research on best practices is also strongly recommended. A
past PNSQC presentation on improving schedule accuracy has additional tips to consider (reference
3).
CONCLUSION
For most of us, existing techniques for product development improvement have shown only small
gains. The time has come to be a bit more aggressive in our pursuits. Flexing your mental muscle –
the power of the mind – through belief, goal setting, visualization, motivation and excuse avoidance
could be the key piece that has been missing from your environment to achieve engineering success.
Pioneering American Psychologist William James (reference 14) said “The greatest discovery of
our generation is that human beings can alter their lives by altering their attitudes of mind. As you
think, so shall you be.” Having a defect-free mentality puts us in the right state-of-mind for
success. I believe it will take you a long way toward improving your product development. Good
luck!
57

REFERENCES
1. Anderson, Rick D., “Maximizing Lessons Learned: A Complete Post-Project Review Process”,
PNSQC 1997 Proceedings, page 129.
2. The Standish Group website is http://www.standishgroup.com and the 1994 CHAOS report can
be found here. The Standish Group Extreme CHAOS 2001 report can be found at the following
URL: http://www.vertexlogic.com/processOnline/processData/documents/pdf/extreme_chaos.pdf
Cobb’s Paradox was published in a 1996 Standish Group report called “Unfinished Voyages”.
http://www.geocities.com/athens/2921/StandishVoyages.html
3. Anderson, Rick D., “Secrets Exposed: Improving Schedule Accuracy”, PNSQC 2001
Proceedings, page 347.
4. Earl Nightingale’s web site has a number of great articles on the mental side of life. This article
on the importance of ATTITUDE is a good place to start:
http://www.earlnightingale.com/store/index.cfm?fuseaction=feature.display&feature_id=3
5. Baum, Kenneth, “The Mental Edge”, 1999 Perigee Books. This sports psychology book focuses
on improving the mental side. Another great book in this area is Gary Mack’s “Mind Gym”.
6. Proclaimed as the Internet’s most visited career training site with 4.2 million visitors per year,
http://www.mindtools.com has a number of good mental tools for improving oneself. Specific tools
for Goal Setting can be found here: http://www.mindtools.com/page6.html
7. A good article to understand the basics of sports visualization can be found here:
http://www.vanderbilt.edu/AnS/psychology/health_psychology/mentalimagery.html This is one
mental technique which has not received much attention in business or academics.
8. Fannin, Jim, “S.C.O.R.E for Life: The Secret Formula for Thinking Like a Champion”,
http://www.amazon.com/gp/product/0060823259/qid=1148300676/sr=2-1/ref=pd_bbs_b_2_1/002-
8766212-5546462?s=books&v=glance&n=283155
9. Mac Anderson and www.simpletruths.com has a number of inspirational videos which cover the
mental side of life, sports and business. www.211movie.com in particular is a good one for
motivating your team toward a defect-free mentality.
10. Goovaerts, Frank and Shiffler, Doug, “Evoluationary Methods (Evo) at Tektronix: A Case
Study”, PNSQC 2006 Proceedings, page 63. Also see materials by N. R. Malotaux at
http://www.malotaux.nl/nrm/Evo/
11. Moore, Geoffrey A., “Crossing the Chasm”, Harper Business Essentials, 2002.
12. Read about English playwright and novelist W. Somerset Maugham at
http://en.wikipedia.org/wiki/W._Somerset_Maugham
13. Good information on Frederick Herzberg and his motivational research at
http://en.wikipedia.org/wiki/Frederick_Herzberg
14. Learn more about psychologist and philosopher William James at
http://en.wikipedia.org/wiki/William_James
58

Transitioning to Agile: Tips for Test Teams
Lisa Crispin
http://lisa.crispin.home.att.net
When we think about testing on agile teams, we usually assume the testers are
fully integrated team members, working side by side with programmers and
customers, helping to identify and execute acceptance tests. What do you do
when your company has an independent test team? How do you integrate that
team into the agile process?
Lisa will share her own experiences as a tester on agile teams, and what she has
learned from other teams. She will discuss how to address cultural,
organizational, technical, and logistical issues when transitioning to agile. She'll
cover tips on how to handle areas such as defect tracking, lack of detailed
requirements and the quick pace of delivery. This is intended to be an interactive
discussion, so come prepared with your questions.
Lisa Crispin is the co-author, with Tip House, of Testing Extreme Programming
(Addison-Wesley, 2002). She is currently a tester on an agile team using Scrum
and XP at ePlan Services Inc. in Denver, CO, and has worked on agile teams
developing web applications since 2000. You can often find Lisa at agile- and
testing-related conferences, user group meetings, and seminars in the U.S. and
Europe, helping people discover good ways for agile teams to do testing, and for
testers to add value to agile teams. She contributes agile testing articles to
publications such as Better Software Magazine, Methods and Tools and
Novatica.
59

1
Transitioning to Agile:
Tips for Test Teams
PNSQC 2007
Lisa Crispin
With Material from Janet Gregory
2
Copyright 2007: Lisa Crispin
Transitioning to Agile
� How do ‘traditional’ test
teams transition to agile?
� Build an agile foundation
� Cultural
� Organizational
� Technical
� Logistical
� Tips for success
� Traditional vs. Agile
3
Copyright 2007: Lisa Crispin
Cultural Issues
“Traditional”
� “Quality Police”
� No specs, can’t test
� Micromanagement
� Business controls technical decisions
� QA team responsible for “quality”
� Passive approach – ‘over the wall’
4
Copyright 2007: Lisa Crispin
Cultural Issues
Fear!
60

5
Copyright 2007: Lisa Crispin
Addressing Cultural Issues
� Encourage “whole team” approach
� Responsible for quality
� Testers included (at least virtually)
� Self-directed team
� Testers participate in all meetings
� Don’t wait around, be proactive
� Develop a relationship with the developers
� Pair, collaborate
� Be confident! Your team will help.
6
Copyright 2007: Lisa Crispin
Addressing Cultural Issues
� Show how each role adds value & quality
� Understand your role
� Use a ‘consulting’ mindset – lend your
expertise
� Testers provide information
� Testing helps the team learn about the
new features
7
Copyright 2007: Lisa Crispin
Key Success Factors
� Understand how stories/examples/test
serve as requirements
� Ask clarifying questions
� Know your application, see the big picture
� Testing tasks are as critical as
programming, other tasks
8
Copyright 2007: Lisa Crispin
Key Success Factors
� Trust
� Between managers and team
� Between developers and testers
� Between business and technical
� We control our own velocity
� No death marches
� Time
� Quality is goal
61

9
Copyright 2007: Lisa Crispin
Key Success Factors
� The right people
� People feel protective of their traditional
role
� New skills may be needed
� Identify roles you need and fill them
� Team members wear many hats
� Collaborate with developers, business
10
Copyright 2007: Lisa Crispin
Key Success Factors
� Celebrate successes
� No matter how small
� “Friday Fun”
� Helps build trust and teamwork
No donkeys were harmed
in the production of these slides
11
Copyright 2007: Lisa Crispin
My Team’s Story
Pre-agile Obstacles:
� Engineers couldn’t talk to business
� V.P. made all technical decisions
� Micromanagement
� Low trust
� Quality not on radar
� Weak testing skills
12
Copyright 2007: Lisa Crispin
My Team’s Story
What helped us:
� New team members brought needed
expertise
� Whole team approach to testing/quality
� Everyone willing to do testing tasks
� Quality is focus
� Rule: No story ‘done’ until testing
complete!
� Unfortunately – agile not a fit for everyone
62

13
Copyright 2007: Lisa Crispin
Organizational Issues
� Separate functional teams
� Conformance to audit requirements
� Traditional processes
� Defect tracking
� SDLC
� PMO
� Managers feel threatened
� Specialist teams feel threatened
14
Copyright 2007: Lisa Crispin
Key Success Factors
� Whole team approach
� Virtual teams as needed
� Testers have independent viewpoint – no
matter who they report to!
� Team chooses practices, tools by
consensus
� Collective ownership
15
Copyright 2007: Lisa Crispin
Key Success Factors
� Identify missing roles
� Bring in expertise, from inside or outside
� Try to involve specialist teams
� Such as configuration management
� Get management support
� Get ‘grassroots’ support
� Brown bag sessions
� Book groups, user groups
� Do what needs doing
� Do now, apologize later!
16
Copyright 2007: Lisa Crispin
Key Success Factors
� Provide tests of audit requirements
� Integrate different roles with development
team
� Project managers
� Process experts
� Domain experts
� Specialists transfer skills
� Retrospectives
� Identify where people feel pain
� Brainstorm action items to mitigate
63

17
Copyright 2007: Lisa Crispin
My Team’s Story
Pre-Agile Obstacles:
� Heavily regulated domain
� Business lacks time to provide expertise
� Incomplete, outdated requirements
� Heavy resistance to change
� Conflicting priorities between business
functions
18
Copyright 2007: Lisa Crispin
My Team’s Story
What helped us:
� Operations V.P. made product owner
� Gets business to achieve ‘advance clarity’
� Provides regulation details with examples
� Always available to provide expertise
� Use tests to drive development
19
Copyright 2007: Lisa Crispin
Technical Issues
� Everyone hates change
� TDD is hard to learn
� Any kind of test automation hard to learn
� Most agile practices are simple… but hard
to learn!
� Skill levels exposed
20
Copyright 2007: Lisa Crispin
Technical Issues
� Legacy systems
� Low testability
� Lots of hidden traps
� Few or no automated tests
� Working without a net!
64

21
Copyright 2007: Lisa Crispin
Addressing Technical Issues
� Time
� To decide how to deal with legacy
system
� To choose tools
� To learn practices
� Baby steps and patience critical
22
Copyright 2007: Lisa Crispin
Key Success Factors
� Creative team problem solving
� What problem are we solving?
� Look at all alternatives, eg., open
source tools
� What’s the one thing holding us back?
23
Copyright 2007: Lisa Crispin
Key Success Factors
� Retrospectives
� What worked? What didn’t?
� Stop, Start, Continue
� Focus on one or two problems
24
Copyright 2007: Lisa Crispin
Key Success Factors
� Team controls own velocity
� Team chooses tools by consensus
� Team is free to experiment
� Do what works for team
� Big visible charts
65

25
Copyright 2007: Lisa Crispin
Key Success Factors
� Drive development with tests and
examples
� Unit level or “Developer Facing”
� “Story Tests” or “Customer-facing tests”
26
Copyright 2007: Lisa Crispin
My Team’s Story
Pre-Agile Obstacles:
� Buggy, untestable legacy system
� Widely varied programming skill levels
� Zero automated tests
� Not even manual test scripts
� No agile knowledge/experience
27
Copyright 2007: Lisa Crispin
My Team’s Story
What helped us:
� Management made quality #1 goal
� Really, they meant it
� Time to learn, expert training
� Entire team did manual regression testing
� New team members with technical and
agile experience
� “Stop/Start/Continue” addressed limiting
factors
28
Copyright 2007: Lisa Crispin
Logistical Issues
� Infrastructure
� Integration and builds
� Test environments
� Tools
66

29
Copyright 2007: Lisa Crispin
Logistical Issues
� Technical debt
� Untestable legacy code
� Hacks on hacks
� Defect backlog
� Can’t refactor
30
Copyright 2007: Lisa Crispin
Logistical Issues
� Distributed teams
� Huge organizations
� Physical facility
� No room for pairing
� No open common areas
� Technical issues
� Embedded systems
� Third-party tools
31
Copyright 2007: Lisa Crispin
Addressing Logistical Issues
� Investment in hardware
� Investment in tools
� Time to learn them much higher than
initial $ cost
� Infrastructure stories
� Time up front – focus on architecture
32
Copyright 2007: Lisa Crispin
Key Success Factors
� Continuous integration essential
� Test environments & deployable builds
essential
� Investment in tools (selected by team)
� Whole team approach
� Feedback
67

33
Copyright 2007: Lisa Crispin
Key Success Factors
� Team (virtual or otherwise) located
together or collaborate often
� Open plan
� Cubicles accommodate pairing
� Whiteboards/task boards/common
areas
34
Copyright 2007: Lisa Crispin
Key Success Factors
� “Engineering sprints”
� Time devoted to reducing technical debt
� Time devoted to avoiding technical debt
� But avoid BUFD
� Big visible cues
35
Copyright 2007: Lisa Crispin
Key Success Factors
� Correct priorities
� Look at ROI
� Test the happy path first
� Test the minimum
� Choose appropriate
processes/practices 36
Copyright 2007: Lisa Crispin
My Team’s Story
Pre-Agile Obstacles:
� Overwhelming technical debt
� No build process
� Insufficient test environments
� Tiny cubes
� No tools
68

37
Copyright 2007: Lisa Crispin
My Team’s Story
What helped us:
� Implemented continuous build first
� Company invested in hardware, software
� Test, staging environments
� Hiring expertise we needed (eg., DBA)
� Team chose tools
� Team commitment to driving development
with tests
� Open plan office
38
Copyright 2007: Lisa Crispin
Test Approach - The Agile Way
Project InitiationGet an understanding of the project
Participate in estimating stories Create Test Plan Release Planning
Each Iteration
1
….
X
Write and execute story tests
Write and execute new functional test cases
Perform Load Test
Pair test with other testers, developers
Automate new functional test cases
Run automated regression test cases
Complete Regression Test
Perform UAT
Perform Mock Deploy
Participate in Release Readiness
The End Game
(System Test)
Participate in Release to Prod
Participate in Retrospectives
Release to Prod/
Support
39
Copyright 2007: Lisa Crispin
Tips for Test Teams
� Agile benefits
� What testers contribute
� Maintaining conformance
� Requirements
� Test Plans
� Automation
� Regression Testing
� What else?
40
Copyright 2007: Lisa Crispin
How Agile Helps Testers
� Collaboration, integration
� Non-adversarial
� Agile processes are all about
quality
� Coding and testing are part of a
whole
� Changing requirements embraced
69

41
Copyright 2007: Lisa Crispin
How Testers Help Agile
� Unique Dual Perspective
� Understands possibilities
and details from a
programmer viewpoint
� Cares about what the
customer cares about,
understands big picture
� Constructive Skepticism
42
Copyright 2007: Lisa Crispin
How Testers Help Agile
� Change your mindset!
� Team responsibility for quality
� Give feedback, early and often
� Rather than just finding defects
� Work closely with the developer
� “Show me”
� Collaborate, Pair test
� Make it easy for the developer
� Give them the tests up front
43
Copyright 2007: Lisa Crispin
How Testers Help Agile
� Is the fast turnaround expected/feasible?
Tips / Techniques
� Use examples in your Acceptance Tests
� Test the minimum, write executable tests
� Pair test
� Be vocal, Be courageous
� Don’t be a victim & don’t wait for things to
come to you
� Trick is to think sustainable
44
Copyright 2007: Lisa Crispin
Conformance to Audit Requirements
� Will audit requirements cause heavy
processes?
Tips / Techniques:
� Understand the requirements
� Work to solve problems, not symptoms
� Sometimes they are guidelines
� not strict requirements
� Think simple first
70

45
Copyright 2007: Lisa Crispin
Defect Tracking
� Can you have a simple process?
� Do you need a tool?
Tips / Techniques
� Simple tool
� Simple process – do what you need
� Every defect entered adds rework time
� Story cards – defect cards
� It is not a communication tool
46
Copyright 2007: Lisa Crispin
No Requirements?
� What do you test if you don’t have full
requirements?
Tips / Techniques
� Remember your special perspective
� Help to flush out the requirements
� Ask questions
� Whiteboard discussions
� Examples of desired behavior
47
Copyright 2007: Lisa Crispin
Changing Requirements?
How can you keep up when the
requirements keep changing?
Tips / Techniques
� Embrace change, but work efficiently
� Assess impact
� To automation
� To tests being created and run
� To other parts of the application
� To regression tests
48
Copyright 2007: Lisa Crispin
Test Plans?
� Is there a place for test plans?
Tips / Techniques
� Think concise, lightweight, fulfill a purpose
� Address project specific testing issues
� What is the scope of the testing?
� What are the testing risks, assumptions?
� What are the critical success factors?
� Think about “What do people need to know?”
� Remove static information
� Remove extraneous info (ex. TOC)
71

49
Copyright 2007: Lisa Crispin
Automation
Is automation absolutely necessary?
Benefits
� Allows time to find the real issues, & explore
� Removes the boring repetitive work
� Safety net always there
Tips / Techniques
� Automate the pieces you can
� Look for the greatest pain to choose first
� Team responsibility – developers help
� Apply agile coding practices to tests
50
Copyright 2007: Lisa Crispin
Regression Testing?
How can a regression test cycle fit into an iteration?
Tips / Techniques
� Goal: 100% automation
� Takes time to get there!
� Run every build or daily (quick feedback)
� Maintain all tests (refactor)
� Otherwise – technical debt occurs
51
Copyright 2007: Lisa Crispin
What about…
Other forms of testing?
� Performance, load, stress
� Security
� Usability
� Integration with other systems
� …
52
Copyright 2007: Lisa Crispin
Get the Expertise You Need
� Shared resources
� Can they sit at least part time with team?
� Transfer their skills
� Performance, security, ‘ility’ specialist
� Team member
� Transfer skills
� Break down ‘silos’
72

53
Copyright 2007: Lisa Crispin
Successful Agile Team
� We improve practices every iteration
� Entire development team feels
responsible for quality
� Our testing expertise helps team
produce higher quality
� Tests drive development, ensure
business requirements met
� Success!
54
Copyright 2007: Lisa Crispin
Agile Resources
� eXtreme Programming
www.xprogramming.com
�DSDM www.dsdm.org
� SCRUM www.controlchaos.com,
mountaingoatsoftware.com
�Adaptive Software Development
www.adaptivesd.com
�Crystal www.crystalmethodologies.org
� Feature Driven Development
www.featuredrivendevelopment.com
� Lean Development www.leantoolkit.com
55
Copyright 2007: Lisa Crispin
Agile Testing Resources
�lisa.crispin.home.att.net
�www.agilealliance.org
�www.testing.com
�www.fitnesse.org
�webtest.canoo.com
�fit.c2.com
56
Copyright 2007: Lisa Crispin
Agile Resources
User Stories
Applied
by Mike Cohn
73

57
Copyright 2007: Lisa Crispin
Agile Resources
Agile Estimating
and Planning
By Mike Cohn
58
Copyright 2007: Lisa Crispin
Collaboration
Collaboration Explained :
Facilitation Skills for
Software Project Leaders
By Jean Tabaka
Available on Amazon
59
Copyright 2007: Lisa Crispin
Implementing Change
Fearless Change: Patterns
for introducing new ideas
By Linda Rising and Mary
Lynn Manns
Available on Amazon
60
Copyright 2007: Lisa Crispin
Agile Testing Resources
Available
on
Amazon
74

61
Copyright 2007: Lisa Crispin
Coming in 2008!
Agile Testing
By Lisa Crispin and Janet Gregory
62
Copyright 2007: Lisa Crispin
Goal
Have fun, whatever you do!
75

76

TimeLine: Getting and Keeping Control over your Project
Niels Malotaux N R Malotaux - Consultancy
The Netherlands [email protected]
www.malotaux.nl/nrm/English
Abstract
Many projects deliver late and over budget. The only way to do something about this is changing our way of working, because if we keep doing things as we did, there is no reason to believe that things will magically improve. They won’t.
The Evolutionary Project Management (Evo) approach is about continuously introducing small changes (hence evolutionary) in the way we do things, constantly improving the performance and the results of what we are doing. Because we can imagine the effect of the change, this evolutionary change can be biased towards improvement, rather than being random.
One of the techniques having emerged out of the Evo way of working is the TimeLine technique, which allows us to get and keep the timing of projects under control while still improving the project results, using just-enough estimation and then calibration to reality. TimeLine doesn’t stop at establishing that a project will be late. We actively deal with that knowledge: instead of accepting the apparent outcome of a TimeLine exercise, we have ample opportunities of doing something about it. One of the most rewarding ways of doing something about it is saving time. And if we can save time when a project is late, why not use the same techniques even if the project won’t be late, to be done even earlier?
This paper describes the Goal of a project, which enables us to focus on Result. It then describes the basic TimeLine technique, connecting high-level planning to weekly Task Planning and back. It continues with the options we have for dealing with the outcome, especially when we see that the time available seems insufficient to achieve what we think has to be achieved in the project. Finally, some estimation techniques are explained.
Authors bio
Niels Malotaux ([email protected], www.malotaux.nl/nrm/English) is an independent Project Coach specializing in optimizing project performance. He has over 30 years experience in designing hardware and software systems, at Delft University, in the Dutch Army, at Philips Electronics and 20 years leading his own systems design company. Since 1998 he devotes his expertise to helping projects to deliver Quality On Time: delivering what the customer needs, when he needs it, to enable customer success. To this effect, Niels developed an approach for effectively teaching Evolutionary Project Management (Evo) Methods, Requirements Engineering, and Review and Inspection techniques. Since 2001, he coached some 80 projects in 20+ organizations in the Netherlands, Belgium, Ireland, India, Japan and the US, which led to a wealth of experience in which approaches work better and which work less well in practice. He is a frequent speaker at conferences and has published four booklets related to the subject of this paper.
Copyright © 2007 N R Malotaux - Consultancy V0.6 - 20070818
77

1. How do we get projects on time?
Insanity is doing the same things over and over again and hoping the outcome to be different (let alone better) (Albert Einstein 1879-1955, Benjamin Franklin 1706-1790, it seems Franklin was first)
Many projects deliver late. If we don’t change our ways, projects will continue to be late. The only way to get projects on time is to change the way we do things. The Evolutionary Project Management (Evo) approach [1] is about continuously introducing small changes (hence evolutionary) in the way we do things, constantly improving the performance and the results of what we are doing. Because people can imagine the effect of the change, this evolutionary change can be biased towards improvement, rather than being random.
One of the techniques having emerged out of the Evo way of working is the TimeLine technique, which allows us to get and keep the timing of projects under control while still improving the project results, using just-enough estimation and then calibration to reality. TimeLine doesn’t stop at establishing that a project will be late. We actively deal with that knowledge: instead of accepting the apparent outcome of a TimeLine exercise, we have ample opportunities of doing something about it. One of the most rewarding ways of doing something about it is saving time.
An essential prerequisite of getting projects on time is, however, that we care about time.
2. The Goal of a project
Many projects treat requirements as sacred: they say: “This is what we have to do!” However, many requirements used in projects are not real Requirements, but rather wishes and assumed requirements. Let’s, as a driver for finding the real Requirements, define the following as an universal Goal for a project:
Providing the customer with what he needs, at the time he needs it, to be satisfied, and to be more successful than he was without it …
What the customer needs may be different from what he asks for and the time he needs it may be earlieror later than he asks for. If the customer is not satisfied, he may not want to pay for our efforts. If he is not successful, he cannot pay. If he is not more successful than he already was, why should he pay? Of course we have to add that what we do in a project is:
… constrained by what the customer can afford, and what we mutually beneficially and satisfactorily can deliver in a reasonable period of time.
What the customer wants, he cannot afford
If we try to satisfy all customer’s wishes, we’ll probably fail from the beginning. We can do so many nice things, given unlimited time and money. But neither the customer nor we have unlimited time and money. Therefore: The Requirements are what the Stakeholders require, but for a project the Requirements are what the project is planning to satisfy.
If the Requirements aren’t clear (which they usually aren’t), any schedule will do
If the Requirements are unclear or incorrect, we will be spending time on the wrong things, wasting time and money. That’s in contradiction to the Goal of the project. And what use is a schedule that plans for doing the wrong things? Using the Goal as a top-level Requirement helps us to focus on what we have to do and what not. Understanding better what we should and shouldn’t do is one of the drivers for doingless, while delivering more. Continuous Requirements Engineering and Management is imperative for optimizing the duration of a project.
In almost all projects the requirements are not really clear. Even if they seem to be, they will change during the project, because we learn, they learn and the circumstances change. If the requirements aren’t really clear and will change anyway, why spend too much time on very detailed estimation of the project based on what we only currently think we have to do? If whatever time needed to do the work cannot be exact, because our understanding of the work is not exact, any ballpark figure will do. “But they want more exact estimations!” Well, if you estimated the work to be between 800 and 1000 days of work, but they insist in a more exact number, give them any exact looking figure, like 893 days, or 1093 if you like. If that keeps them quiet, you don’t have to waste more time on determining a figure that isn’t exact anyway. Can I do that? Yes, you can. It saves you time you need for more important things. And we should spend our time only on the most important things, shouldn’t we?
78

3. TimeLine The standard procedure of defining the time needed to arrive at an expected end date of a project is (figure 1)adding up the time we think we need for all the things we think we have to do and then adding some time for contingency.
Usually, however, the customer needs the result earlier. The date the customer needs a result from the project, we call it the FatalDate, is a Requirement, so it has to be treated as seriously as any other Requirement.
If we really take the FatalDate seriously, we can define a more refined procedure, called “TimeLine”:
1. Define a deadline or FatalDate. It is better to start with the end: planning beyond the available time/money budget is useless, so we can avoid wasting time if we find out that what we have to do takes more time than we have. Often we count back from the FatalDate to see when we should have started.
2. Write down whatever you currently think you have to accomplish 3. List in order of priority. Note that priority is based on value contribution and hence is influenced by
many things! 4. Write the same down in elements of work (don’t detail more than necessary) 5. Ask the team to add forgotten elements and add duration estimates (days or weeks of calendar time,
depending on the size of the project) 6. Get consensus on large variations of estimates, using a Delphi process (see section 6.3)7. Add up the duration of all elements 8. Divide by the number of available people 9. This is a first estimate of the duration
This technique can be used on any scale: on a program, a project, on deliveries, on tasks. The technique is always same.
If the estimate of the duration is longer than the time available before the FatalDate (figure 2), we will first have to resolve this problem, as it’s of no use continuing the work if we know we won’t succeed. We can discuss the TimeLine with our customer and explain: • What, at the FatalDate, surely will be done • What surely will not be done • What might be done (after all, estimation is not an exact science)
If what surely will be done is not sufficient for success, we better stop now to avoid wasting valuable time and money, rather spending it on more rewarding activities. Note that we put and keep putting what we plan in strict order of priority, so that at the FatalDate we have done the most important things that could be done in the time available. Customers usually don’t really mind about the bells and whistles. Time to Market is more important. Because priorities may change very dynamically, we have to constantly reconsider the order of what we do and when.
figure 1: Standard approach: it takes what it takes
figure 2: Basic TimeLine
79

Initially, customers can follow this “will be done - won’t be done - might be done” reasoning, but still want “it all”. Remember that they don’t even exactly know what they really need, so “wanting it all” usually is a fallacy, although we’d better not say that. What we can say is: “OK, we have two options: In a conventional project, at the FatalDay, we would come to you and tell that we didn’t make it. In this project, however, we have another option. We already know, so we can tell you now that we will not be able to make it and then we can discuss what we are going to do about it. Which option shall we choose?” If we explain it carefully, the customer will, eventually, choose the latter option. He will grumble a bit the first few weeks. Soon, however, he will forget the whole issue, because what we deliver is what we promised1. This enforces trust. Note that many customers ask for more, because they expect to get less. The customer also will become more confident: He is getting Deliveries2 way before he ever expected it. And he will recognize soon that what he asked was not what he needed, so he’s not asking about “all” any more. At the very first encounter with a new customer we cannot use this method, telling the customer that he will not get “it all”. Our competitor will promise to deliver it all (which he won’t, assuming that we are not less capable than our competitor), so we lose if we don’t tell the same, just as we did before using the Evo approach. There’s no risk, because we apparently survived promising “all” in our previous projects. If, after we won the contract, we start working the Evo way, we will soon get the confidence of our customer, and on the next project he will understand and only want to work with us.
If the estimated duration is more than the available time, we first have to resolve this problem, before going into any more detail. If it fits exactly the available time, we’d better assume that we still won’t make it, as we probably will have forgotten some elements of work. If the estimated duration fits easily the available time, then there is a good chance that we may succeed (figure 3).
3.1 Setting a Horizon If the total project takes more than 10 weeks, we define a Horizon at about 10 weeks on the TimeLine, because with the limited size of our skull [2] we cannot really oversee longer periods of time. We may set a Horizon once we have done three things to make sure that we’ll not be surprised when we start looking over the Horizon again.
The TimeLine procedure continues: 10. Choose a Horizon (default: 10 weeks from now) 11. Determine when to look over the Horizon again as shown in figure 4: a (default: halfway) 12. Determine the amount of work proportionally to the total work (figure 4: b) 13. Pull tasks from beyond the Horizon that need earlier preparation not to get surprised later (figure 4: c)
1 We assume that we are using the Evo TaskCycle [14] to organize the work, by which we quickly learn what we can promise and how to live up to our promise.
2 We also assume that we use Evo DeliveryCycles [14] to check the requirements and assumptions, delivering real results to Stakeholders for feedback.
figure 3: Only if the estimated time is well under the available time, we may succeed
figure 4: Three things we have to do before we can set a Horizon
80

Now we can, for the time being, “forget” about what’s beyond the Horizon and concentrate on a more limited period of time. A period of 10 weeks proves to be a good compromise between what we can oversee, while still being long enough to allow for optimizing the order in which we deliver results. We don’t use a sliding window of 10 weeks, but rather define a 10 weeks period, and try to accomplish our plans within this TimeBox. When we decide the time is right, we move to the next 10 week window.
3.2 DeliveryCycles
Within these 10 weeks, we plan Evo DeliveryCycles [14] (figure 5), each not more than 2 weeks in length: What are we going to deliver to Whom and Why. Deliveries are for getting feedback from appropriate Stakeholders. We are humble enough to admit that our (and their) perception of the requirements is probably not perfect and that many of our assumptions are probably incorrect. That’s why we need communication and feedback and that’s why we make many short DeliveryCycles: to find out about the real Requirements, which assumptions are correct, and to waste as little time as possible on incorrect requirements and assumptions, saving precious time. In order to get feedback, we have to deliver to eagerly waiting Stakeholders. If the appropriate Stakeholders aren’t eagerly waiting, either they’re not interested and we may better work for other Stakeholders, or they have to be made eagerly waiting by delivering what we call juicy bits.
The TimeLine procedure continues:
14. Put the work for 10 weeks in optimum order, defining Deliveries of 2 weeks 15. Work should be estimated in more detail now 16. Make a rather detailed description of the first one or two Deliveries 17. Check the feasibility of completing Deliveries in two weeks each, with the available resources
We don’t only design the product, we are also constantly redesigning the project. Defining Deliveries is about designing the project: in which order should we do things to find out what is really necessary for a successful result and what is superfluous. How can we make sure that at any time, looking back, we can say: “We weren’t perfect, but we couldn’t have done it better”.
Task a 2Task b 5Task c 3Task d 6Task e 1Task f 4Task g 5Task h 4Task j 3Task k 1
26
do
donot
Task a 2Task b 5Task c 3Task d 6Task e 1Task f 4Task g 5Task h 4Task j 3Task k 1
2626
do
donot
figure 5: TimeLine summary: setting a FatalDate, a Horizon, Deliveries, TaskCycles, and then calibrating back
81

3.3 TaskCycles Once we have divided the work over Deliveries, which also behave like Horizons, we first concentrate on the first few Deliveries and define the actual work that has to be done to produce these Deliveries. This work is organized in TaskCycles of one week, every TaskCycle defining a weekly Horizon. In the TaskCycle we define Tasks, estimated in effort-hours (see for a more detailed explanation: [14]). We plan the work in plannable effort time which defaults to 2/3 of the available time (26 hrs in case of a 40 hr week). We put this work in optimum order, divide it over the people in the project, have these people estimate the time they would need to do the work, see that they don’t get overloaded and that they synchronize their work to optimize the duration.
If we take the example of figure 6, we can see that if Carl doesn’t start Task-f about 6+9+11+9 = 35 hr before the end of the Delivery-Cycle, he’s putting the success of the Delivery on the line. If this Delivery was planned for the coming week, we also see that John should start right at the beginning of the Cycle, otherwise Carl can’t start in time. It’s easy to imagine that if the work of this Delivery wasn’t designed this way, the Delivery probably wouldn’t be on time. Designing the order of work for the Delivery saves time.
The TimeLine procedure goes on: 18. Determine Tasks for the first week 19. Estimate the Tasks, now in real effort (net) hours needed to 100% complete each Task 20. Select Tasks to fit the plannable time (default: 2/3 of available time) of the people in the team 21. Select only the most important Tasks, never ever plan nor do less important Tasks 22. Now we have the Tasks for the first week defined 23. Make sure this is the most important set of Tasks 24. Put the Tasks in optimum order, to see how to synchronize individual people’s work during the week,
e.g. as in the example of figure 6.
3.4 Calibration
Having estimated the work that has to be done for the first week, we have captured the first metrics to start calibrating the TimeLine. If the Tasks for the first week would deliver only about half of what we need to do in that week, we now can, based on this limited material, extrapolate that our project is going to take twice as long, if we don’t do something about it. Of course, at the start this seems weak evidence, but it’s already an indication that our estimations may be too optimistic. Putting our head in the sand for this evidence is dangerous. One week later, when we have the real results of the first week, we have even better numbers to extrapolate and scale how long our project may take. Week after week we will gather more information with which we can calibrate and adjust our notion of what will be done at any FatalDate. This way, the TimeLine process provides us with very early warnings about the risks of being late. The earlier we get these warnings, the more time we have to do something about it.
The TimeLine procedure now concludes with two more steps: 25. Calibrate the TimeLine estimations and take the consequence26. Repeat every one or two weeks.
figure 6: Planning serial and parallel Tasks to fit the available time Note: “6/9h”: 6 is effort hours (planned), 9 is duration (allowing for unplanned activities)
82

Let’s take an example of taking the consequence of the TimeLine:
At the start, we estimate that the work we think we have to do in the coming 10 weeks is about 50 person Weeks of Work (WoW; figure 7, line a). With a team of 5 people this seems doable. After 4 weeks, we find that 15 WoW have been completed (line b), instead of the expected 20 WoW. We now already know that the project will probably be late!
If we keep working this way, we may expect that at the end of the 10 weeks, we’ll have completed 10/4 ∗ 15 = 37.5 WoW (line c). This is 25% less than the original 50 WoW expected. Alternatively, the original 50 WoW may be done in 13.3 weeks, or 33% more time than originally expected (line d). In case the deadline is really hard, the typical reaction of management is to throw more people at the project. How many people? Let’s calculate:
The velocity (actual accomplished against planned effort; see also Cohn [3]) is 15/20 = 0.75 WoW per week. With a velocity of 0.75, we will need for the remaining 35 WoW 35/0.75 = 46.7 person weeks in the remaining 6 weeks. So we need 7.8 people instead of the original 5. Management decides to add 3 people (expecting line e).
But there is another issue: based on our progressing understanding of the work we found that we forgot to plan some work that “has” to be done (requirements creep?) to complete the result we planned for the 10 weeks period: now we think we have, in the remaining 6 weeks, 40 WoW to do instead of the 35 WoW originally estimated (line f). This would mean 40/0.75 = 53.3 person weeks in the remaining 6 weeks, which makes management believe that they actually need 53.3/6 = 8.9 people. So they decide to add 4 people to the project, because they don’t want the project to take almost 50% longer and they think they are prepared to absorb the extra development cost, in order to win Time-to-Market. Beware, however, that this is a solution to be used with utmost care, because it may work out counterproductive, as explained in section 4.1. Much overlooked, but most rewarding and usually quite possible, is doing things more cleverly (line g), as explained in section 4.6.
4. If things don’t fit If what we think we have to do doesn’t fit the available time, or if we want to fit what we think we have to do into a shorter timeframe, there are several options we see being used in practice: • To be used with utmost care: Adding people • Deceptive options:
• Hoping for the best • Going for it • Working Overtime • Adding time: Moving the deadline
figure 7: Earned Value (up to week 4) and Value Still to Earn (from week 5)
83

• Most interesting to exploit, but mostly overlooked: Saving time • Not doing things that later prove to be superfluous • Doing things differently • Doing things at the right time, in the right order • TimeBoxing
4.1 Adding people … A typical move is to add people to a project, in order to get things done in less time. Intuitively, we feel that we can trade time with people and finish a 12 person-month project in 6 months with 2 people or in 3 months with 4 people, as shown in figure 8. In his book The Mythical Man-Month, Brooks [4] shows that this is a fallacy, defining Brooks’ Law: Adding people to a late project makes it later.Putnam [5] confirms this with measurements on some 500 projects. He found that if the project is done by 2 or 3 people, the project-cost is minimized, while 5 to 7 people achieve the shortest project duration at premium cost. Adding even more people makes the project take longer at excessive cost. Apparently, the project duration cannot arbitrarily be shortened, because there is a critical path of things that cannot be parallelized. We call the time in which nobody can finish the project the nine mothers area, which is the area where nine mothers produce a baby in one month. When I first heard about Brooks’ law, I assumed that he meant that you shouldn’t add people at the end of a project, when time is running out. After all, many projects seem to find out that they are late only by the end of the project. The effect is, however, much worse: if in the first several weeks of a project we find that the development speed is slower than predicted, and thus have to assume that the project will be late, even then adding people can make the project later. The reason is a combination of effects:
• Apparently, the time needed to complete a development project is depending on more parameters than just the number of people
• It takes time for the added people to get acquainted with the project • It takes time of the people already in the project to help the new people getting acquainted • The new people are likely to introduce relatively more bugs during their introduction period, causing
the need for extra find-and-fix time • Having more people on the team increases the capacity linearly, but the lines of communication
between these people increase much quicker, every nth person adding (n-1) extra lines of communication
• The architect who has to prepare and oversee what everybody has to do may become the bottleneck when there are more people to manage
• The productivity of different people can vary vastly, so people cannot simply be exchanged for time
So, adding people is not automatically a solution that works, it can even be very risky. How can those mega-projects, where 100’s of people work together, be successful? Well, in many cases they aren’t. They deliver less and later than the customer expects and many projects simply fail, as found in numerous research, like the Standish reports [6]. The only way to try to circumvent Brooks’ Law is to work with many small teams, who can work in parallel, and who only synchronize their results from time to time, for example in bi-weekly DeliveryCycles. And yes, this adds complexity to the design of the project, for which the architect may become a bottleneck.
figure 8: The Mythical Man-Month
84

4.2 Hoping for the best Most projects take more time than expected. Your past projects took longer than expected. What makes you think that this time it will be different? If you don’t change something in the way you run the project, the outcome won’t be different, let alone a better. Just hoping that your project will be on time this time won’t help. We call this ostriching: putting your head into the sand waiting until Murphy strikes again.
4.3 Going for it We know that the available time is insufficient, but it has to be done: “Let’s go for it!” If nothing goes wrong (as if that is ever the case) and if we work a bit harder (as if we don’t already work hard) … Well, forget it.
4.4 Working Overtime Working overtime is fooling yourself: 40 hours of work per week is already quite exhausting. If you put in more hours, you’ll get more tired, make more mistakes, having to spend extra time to find and “fix” these mistakes (half of which you won’t), and you think you are working hard, but you aren’t working smart. It won’t work. This is also ostriching. As a rule, never work overtime, so that you have the energy to do it once or twice a year, when it’s really necessary.
4.5 Adding time: moving the deadline Moving the deadline further away is also not a good idea. The further the deadline, the more danger of relaxing the pace of the project. We may call this Parkinson’s Law3 [7] or the Student Syndrome4 [8]. At the new deadline we probably hardly have done more, pushing the project result even further. Not a good idea, unless we really are in the nine mother’s area, where nobody, even with all the optimization techniques available, could do it. Even then, just because of the Student Syndrome, it’s better to optimize what we can do in the available time before the deadline. The earlier the deadline, the longer our future is afterwards, in which we can decide what the next best thing there is to do. We better optimize the time spent right from the beginning, because we’ll probably need that time anyway at the end. Optimizing only at the end won’t bring back the time we lost at the beginning.
4.6 Saving time Instead of letting things randomly be undone at the FatalDay, it’s better to choose what we won’t have done, preferably those things that weren’t needed anyway. We know that we won’t have enough time, so let’s save time wherever possible! There are several ways to save time, even without negatively affecting the Result of the project:
• Efficiency in what to do: doing only what is needed, not doing things that later prove to be superfluous. This includes efficiency in knowing why and for whom to do it. Because people tend to do more than necessary, especially if the goals are not clear, there is ample opportunity for not doing what is notneeded.
• Efficiency in how to do it: doing things differently.We can probably do the same in less time if we don't immediately do it the way we always did, but first think of an alternative and more efficient way.
• Efficiency in when to do it: doing things at the right time, in the right order.A lot of time is wasted by synchronization problems, like people waiting for each other, or redoing things because they were done in the wrong order. Actively Synchronizing [15] and designing the order of what we do (e.g. as in figure 6), saves a lot of time.
In my experience, these are all huge time savers. And of course we can also apply these time savers if what we think we have to do easily fits in the available time. We don’t have to wait until we’re in trouble … TimeBoxing provides incentives to constantly apply these ways to save time, in order to stay within the TimeBox. TimeBoxing is much more efficient than FeatureBoxing (waiting until we’re ready), because with FeatureBoxing we lack a deadline, causing Parkinson’s Law and the Student Syndrome to kick in badly. Note that this concept of saving time is similar to “eliminating waste” in Lean thinking, and already indicated by Henry Ford in his book “My Life and Work”, back in 1922.
3 “Work expands so as to fill the time available for its completion”. Observation by Parkinson [7]: “Granted that work (and especially paperwork) is elastic in its demands on time, it is manifest thatthere need be little or no relationship between the work to be done and the size of the staff to which it may be assigned.”
4 Starting as late as possible, only when the pressure of the FatalDate is really felt. Term attributed to E. Goldratt [8].
85

5. Preflection, foresight and prevention Because “hindsight is easy”, we can often use it to reflect on what we did, in order to learn: Could we have avoided doing something that now, in hindsight, proves to be superfluous? Could we’ve done it more efficiently? Reflection, however, doesn’t recover lost time: the time is already spent and can never be regained. Only with preflection we can try to foresee and thus prevent wasting precious time. Preflection and then acting on the foresight is essential for saving time. The Plan-Do-Check-Act or Deming Cycle [9] is the mechanism for just doing that.
6. Estimation There are several methods for estimation. There are also ways to quickly change from optimistic to realistic estimation. An important precondition is that we start treating time seriously, creating a Sense of Urgency. It is also important to learn how to spend just enough time on estimation. Not more and not less.
6.1 Changing from optimistic to realistic estimation In the Evo TaskCycle [14] we estimate the effort time for a Task in hours. The estimations are TimeBoxes, within which the Task has to be completely done, because there is not more time. Tasks of more than 6 hours are cut into smaller pieces and we completely fill all plannable time (i.e. 26 hours, 2/3 of the 40hr available time in a work week). The aim in the TaskCycle is to learn what we can promise to do and then to live up to our promise. If we do that well, we can better predict the future. Experience by the author shows that people can change from optimistic to realistic estimators in only a few weeks, once we get serious about time. At the end of every weekly cycle, all planned Tasks are done, 100% done. The person who is going to do the Task is the only person who is entitled to estimate the effort needed for the Task and to define what 100% done means. Only then, if at the end of the week a Task is not 100% done, that person can feel the pain of failure and quickly learn from it to estimate more realistically the next week. If we are not serious about time, we’ll never learn, and the whole planning of the project is just quicksand!
6.2 0th order estimations 0th order estimations, using ballpark figures we can roughly estimate, are often quite sufficient for making decisions. Don’t spend more time on estimation than necessary for the decision. It may be a waste of time. We don’t have time to waste. Example: How can we estimate the cost of one month delay of the introduction of our new product? How about this reasoning: The sales of our current most important product, with a turnover of about $20M per year, is declining 60% per year, because the competition introduced a much better product. Every month delay, it costs about 5% of $20M, being $1M. Knowing that we are losing about $1M a month, give or take $0.5M, could well be enough to decide that we shouldn’t add more bells and whistles to the new product, but rather finalize the release. Did we need a lot of research to collect the numbers for this decision …? Any number is better than no number. If a number seems to be wrong, people will react and come up with reasoning to improve the number. And by using two different approaches to arrive at a number we can improve the credibility of the number.
6.3 Simple Delphi If we’ve done some work of small complexity and some work of more complexity, and measured the time we needed to complete those, we are more capable than we think of estimating similar work, even of different complexity. A precondition is that we become aware of the time it takes us to accomplish things. There are many descriptions of the Delphi estimation process [10], but also here we must be careful not to make things more complicated than absolutely necessary. Anything we do that’s not absolutely necessary takes time we could save for doing more important things! Our simple Delphi process goes like this: 1. Make a list of things we think we have to do in just enough detail. Default: 15 to 20 chunks. 2. Distribute this list among people who will do the work, or who are knowledgeable about the work. 3. Ask them to add work that we apparently forgot to list, and to estimate how much time the elements of
work on the list would cost, “as far as you can judge”. 4. In a meeting the estimates are compared.
86

5. If there are elements of work where the estimates differ significantly between estimators, do not take the average, and do not discuss the estimates, but discuss the contents of the work, because apparently different people have a different idea about what the work includes. Some may forget to include things that have to be done, some others may think that more has to be done than needed.
6. After the discussion, people estimate individually again and then the estimates are compared again. 7. Repeat this process until sufficient consensus is reached (usually repeating not more than once or
twice). 8. Add up all the estimates to end up with an estimate for the whole project.
Don’t be afraid that the estimates aren’t exact, they’ll never be. By adding many estimations, however, the variances tend to average and the end result is usually not far off. Estimates don’t have to be exact, as long as the average is OK. Using Parkinson’s Law in reverse, we now can fit the work to fill the time available for its completion.
6.4 Estimation tools
There are several estimation methods and tools on the market, like e.g. COCOMO [11], QSM-SLIM [12] and Galorath-SEER [13]. The tools rely on historical data of lots of projects as a reference. The methods and tools provide estimates for the optimum duration and the optimum number of people for the project, but have to be tuned to the local environment. With the tuning, however, a wide range of results can be generated, so how would we know whether our tuning provides better estimates than our trained gut-feel? The use of tools poses some risks: • For tuning we need local reference projects. If we don’t have enough similar (similar people,
techniques, environments, etc …) reference projects, we won’t be able to tune. So the tools may work better in large organizations with a lot of similar projects.
• We may have to start working for the tool, instead of having the tool work for us. Tools don’t pay salaries, so don’t work for them. Only use the tool if it provides good Return On Investment (ROI).
• A tool may obscure the data we put in, as well as obscure what it does with the data, making it difficult to interpret what the output of the tool really means, and what we can do to improve. We may lose the connection with our gut-feel, which eventually will make the decision.
Use a tool only when the simple Delphi and 0th order approaches, combined with realistic estimation rather than optimistic estimation, really prove to be insufficient and if you have sufficient reasons to believe that the tool will provide good ROI.
7. Conclusion TimeLine doesn’t solve our problems. TimeLine is a set of techniques to expose the real status of our project early and repeatedly. Instead of accepting the apparent outcome of a TimeLine exercise, we have ample opportunities of doing something about it. We can save a lot of time by not doing the things that later would prove to be superfluous. Because people do a lot of unnecessary things in projects, it’s important to identify those things before having started, otherwise the time is already spent, and never can be recovered. By revisiting the TimeLine every one or two weeks, we stay on top of how the project is developing and we can easily report to management the real status of the project. Doesn’t all this TimeLining take a lot of time? The first one or two times it does, because we are not yet acquainted with the various elements of the project and we have to learn how to use TimeLine. After a few times, however, we dash it off and we’re getting into a position that we really can start optimizing the results of the project, producing more than ever before. TimeLine allows us to take our head out of the sand, stay in control of the project and deliver Results successfully, on time. Still, many Project Managers hesitate to start using the TimeLine technique for the first time. After having done it once, however, the usual reaction is: “I got much better oversight over the project and the work than I ever expected”, and the hesitation is over. The TimeLine technique is not mere theory. It is highly pragmatic, and successfully used in many projects coached by the author. The most commonly encountered bottleneck when introducing the TimeLine technique in a project is that no one in the project has an oversight of what exactly the project is really supposed to accomplish. This could be a reason why Project Managers hesitate to start using the technique. Redefining what the project is to accomplish and henceforth focusing on this goal is the first immediate timesaver of the technique, with many savings to follow.
87

References[1] Gilb, Tom: Principles of Software Engineering Management, 1988, Addison Wesley,
ISBN 0201192462. Gilb, Tom: Competitive Engineering, 2005, Elsevier, ISBN 0750665076.Malotaux, Niels: How Quality is Assured by Evolutionary Methods, 2004. Pragmatic details how to implement Evo, based on experience in some 25 projects in 9 organizations. www.malotaux.nl/nrm/pdf/Booklet2.pdf Malotaux, Niels: Controlling Project Risk by Design, 2006. www.malotaux.nl/nrm/pdf/EvoRisk.pdf
[2] Dijkstra, E.W.: The Humble Programmer, 1972, ACM Turing Lecture, EWD340. “The competent programmer is fully aware of the strictly limited size of his own skull; therefore he approaches the programming task in full humility, and among other things he avoids clever tricks like the plague.” www.cs.utexas.edu/~EWD/ewd03xx/EWD340.PDF
[3] Cohn, Mike: Agile Estimating and Planning, 2005, Prentice Hall PTR, ISBN 0131479415. [4] Brooks, F.P: The Mythical Man-Month, 1975, Addison Wesley, ISBN 0201006502.
Reprint 1995, ISBN 0201835959. [5] Putnam, Doug: Team Size Can Be the Key to a Successful Project, www.qsm.com/process_01.html [6] Standish Group: Chaos Report, 1994, 1996, 1998, 2000, 2002, 2004, 2006.
www.standishgroup.com/chaos/intro1.php [7] Parkinson, C. Northcote: Parkinson’s Law: http://alpha1.montclair.edu/~lebelp/ParkinsonsLaw.pdf [8] Goldratt, E.M.: Critical Chain, Gower, ISBN 0566080389 [9] Malotaux, Niels: Controlling Project Risk by Design, 2006, www.malotaux.nl/nrm/pdf/EvoRisk.pdf,
chapter 6 Deming, W.E.: Out of the Crisis, 1986. MIT, ISBN 0911379010. Walton, M: Deming Management At Work, 1990. The Berkley Publishing Group, ISBN 0399516859.
[10] www.iit.edu/~it/delphi.html [11] Boehm, Barry: Software Engineering Economics, Prentice-Hall, 1981, ISBN 0138221227 [12] www.qsm.com [13] www.galorath.com [14] See [1] (Malotaux, 2004): Chapter 5 and 6 [15] See [1] (Malotaux, 2006): Chapter 10
88

Implementing a System to Manage Software Engineering
Process Knowledge
Rhea Stadick
Intel Corporation
Author Biography: Rhea Stadick works in the Intel Software Quality group under the
Corporate Quality Network at Intel Corporation. Currently, she is a platform software
quality engineer for next generation ultra mobile products. Rhea has spent a significant
portion of her two years at Intel researching and developing information and knowledge
management systems. During this time she has implemented and supported a software
engineering process knowledge management system that is used by the world-wide
software engineering community at Intel. Rhea holds a bachelor’s in computer science.
Abstract: Information management and even knowledge management can be easy to
accomplish within a small group. Trying to achieve this same capability across multiple
software engineering groups that are distributed world-wide and accustomed to managing
information locally within one team is a different story. The ability to share information
and knowledge in this circumstance, much less retain it and effectively apply it, becomes
a daunting task. This paper discusses a solution that was developed to enable software
engineers to easily share and access best practices through a centralized corporate
knowledge base. The key objectives of this solution were to reduce duplication of effort
in SW engineering process improvement, increase reuse of best practices, and improve
software quality across the company by enabling practitioners corporate-wide to quickly
access the tools, methodologies, and knowledge to get their job done more effectively
and efficiently.
89

Introduction
Knowledge is often considered the most valuable asset of a company. Nonetheless,
managing knowledge is often an oversight for many businesses. To improve our
company’s management of software engineering knowledge, the Intel Software Quality
group studied the process improvement environment at Intel. From this effort, a core
constraint to effective software engineering process knowledge management became
clear: teams were highly isolated in their information management and most software
engineering knowledge was managed within individual groups. Because of the local
management of software engineering knowledge, software teams had widely varying
competencies across the company with differing strengths and weaknesses. There was no
corporate strategy to utilize and share software engineering information across software
teams. Lacking the capability to quickly share and find knowledge between highly
distributed groups effectively put a cap on efficient continuous improvement of software
engineering processes across the company. By studying the core problems behind our
knowledge management, a vision and eventually a process knowledge management
(PKM) system was created that would solve the problems of previous centralized systems
and allow software engineers to quickly access and collaborate on information.
This paper details the problems that the led to the creation of the PKM System, the
implementation of the system, the benefits of having a knowledge management system,
and the results of the implementation.
The Case for a Knowledge Management Solution
The idea for a common knowledge management system that would enable collaborative
process improvement and facilitate the sharing of best practices came from several
pervasive problems found among our software quality and engineering teams. These
problems led to inefficiency, duplication of effort, and they became a constraint to
continuous improvement in software processes across the software engineering
community. Overall, these problems fell under two umbrella issues that we termed the
“derivative” and the “ownership” problems.
The Derivative Problem
The typical methods of developing processes and supporting collateral in software teams
was to either create them from scratch or borrow information from internal or external
resources and modify it to make it their own. This latter method of developing software
engineering practices was much more prevalent as it enabled teams to build on existing
knowledge. This type of process development did not include knowledge sharing and
90

because it led to many similar but differing practices it was known as the “derivative
problem.”
This derivative problem can be exemplified through the following scenario:
1) Group A develops an original change control process and documents it.
2) Group B finds an early version of the process (likely by knowing one of the
members of Group A) and modifies it to suit their needs.
3) Group C creates a third derivative of Group A’s work based on Group B’s
modification of the original change control process.
As the process changed hands from one group to another, more and more duplicated
work was spent on maintaining and modifying the same process. Additionally, any
improvements that Group C made to the process would not be propagated back to Group
B or Group A’s process. This all too common scenario would not only happen with a
single process, but across the whole suite of software engineering information.
Knowledge about how to best perform a process that was not captured in a process
document was often lost. Systemic process improvement across the company was not
realized because focus was placed on improving local group information and not directed
to one central, base-lined process that all groups could collaborate on.
There was a reason why the derivative problem existed. To clearly identify this reason,
we looked at how groups managed their information. Every group that we interviewed
had their own information storage area, or repository, where they kept their process
collateral. The information stored in these repositories was maintained by the group and
was often closed to other groups. This was in part due to the available information
storage tools. There was no way for a group to do a corporate-wide search for a specific
process across these repositories. The only way an engineer would know about another
group’s process was if they had a connection to someone in the group, had worked in the
group at one time, or had accidentally stumbled upon a repository. Practitioners were
often frustrated in their search for the information they needed for their job because it
was scattered around the company on local hard drives, web sites, and document storage
systems. Rather than spend the time to search for information (which was often fruitless)
groups would either spend a great deal of effort to develop a process from scratch, use the
only the information they could find as a base and build from it, or they would learn best
practices from outside of Intel. In this last case, teams would often tailor this information
to align with Intel’s other related practices, creating many similar but differing processes
within the company. Even more frustration occurred when individuals moved to a
different group. They would have to relearn similar but still different basic processes used
in software development such as metrics, software configuration management,
requirements engineering, test practices and so forth. This was compounded by the fact
that each group owned its own repository, making any information transfer a manual
effort that then required re-alignment of the process to the new group’s development
practices.
The “not invented here” syndrome was also a prevalent instigator in the drive to develop
new processes when new teams were formed. Rather than use the methodologies that
team members brought from their previous teams, much effort was placed into creating
91

new processes and collateral that were “specific” to the new team. The lack of
availability of a central system only served to reinforce this behavior as the great amount
of duplication was not glaringly obvious. One could not look across the company and
easily point out how many similar processes existed across groups or ask why teams
didn’t use the company’s “best practices.” Unfortunately, there were few globally
recognized “best practices” and the term “best known method” was liberally applied to
the point that it really only meant that it was the most commonly used process in a
particular group.
The Ownership Problem
Another problem we discovered was that a great deal of information was lost due to the
knowledge owner’s departure from the company or, more often than not, just moving to a
new group within the company. This problem arose because of the business need to
constantly refocus software engineering teams on new projects which created new
management and reporting structures for teams. As new teams and reporting structures
were put in place, new technologies were used to develop the local information
repositories, new development practices were deployed, and new owners put in place that
may or may not be familiar with existing processes.
This lack of central ownership was a key issue. The changing nature of the company
meant that process champions often went to new groups with new responsibilities. The
information that they left behind eventually become obsolete without the owner to update
it. We knew that we had to create a system that did not rely on the ownership of a single
individual or group. Yet it had to be open and adaptable enough to accommodate the use
of this information in diverse teams supporting different development methodologies. It
had to be corporate-wide, yet it could not require centralized knowledge maintenance or
we would fall into the same problem of losing the knowledge owners. Centralized
software process management had been tried at Intel before by different teams and while
some repositories lasted longer than others, most eventually lost sponsorship and became
obsolete. Somehow the problem of process knowledge being supported solely by its
original owner had to be overcome.
Problem Statement and Solution
Based on the two main barriers to knowledge management and the understanding of the
information management environment, the problem statement was summarized as
follows:
The current practice is to invent local repositories from scratch using new
or adopted collateral. This leads to inconsistent practices and duplication
of effort to create and manage knowledge. Additionally, valuable
knowledge and lessons learned are often lost due to restructuring of teams
and attrition, creating a constraint to continuously improving SW
Engineering processes across the company.
92

To solve these problems we needed a system that would:
1. Provide a central “best place to go” for SW engineers to obtain good information
about SW quality and SW engineering practices
a. Provide a quick and easy way to find information centralized within a
single system
b. Enable collaboration across diverse teams and allow for the integration of
incremental improvements that are developed locally
c. Gather the abundance of information on SW processes that already existed
at Intel and allow for the identification of best in class or most applicable
information
d. Enable practitioners isolated in various locations to locate information and
people who have valuable knowledge or experience
2. Be persistent across the corporation, so as groups and teams come and go, the
knowledge base would not be lost
a. Enable Intel to create a baseline of accepted best practices
Without such a centralized system, the derivative problem would continue to exist
because there would be no effective alternative to developing processes in this manner.
Creating a corporate-wide knowledge base was the first step. In order to be successful, it
was necessary to not only solve the issues described in the problem statement, but also
avoid the mistakes made in past attempts at global information management. Many
practitioners could point to one or two “good” sites to get information at the company.
Unfortunately, these sites were often severely outdated due to a lack of ownership.
From our research on existing problems, a vision for a knowledge management capability
was developed that led to the realized Process Knowledge Management system in use
today.
Implementing the Process Knowledge Management System
In order to be successful, this system had to have direct business results. The PKM
system would not only allow us to be more efficient, it would save us money by avoiding
duplication of effort. More importantly, it would lead to greater competencies in
software engineering groups across the company by allowing teams to learn from the best
practices developed by other teams and then collaborate on those practices to make them
even better. The system needed to improve productivity and cross-team collaboration by
creating a single source of continuously improving information on SW Engineering
practices.
Given the problem statement and the business opportunities, a vision for the system was
created:
• All software engineers have a common baseline understanding of our best
practices in software development and software quality
• Practitioners no longer spend time wondering where to find or post best practices
on a topic area; all the latest best practices are located in one place
93

• Teams can integrate their process management into a central system that allows
them to collaborate with geographically dispersed groups across the company to
significantly improve their process on a continuous basis
� Lessons learned from each group using the process or from their own
innovation is fed back into the process
� Groups know how to share this information and can collaborate to
integrate it into an improved process (continuous improvement is realized)
• Duplication of effort is minimized as much as possible
• Reuse is implemented to the greatest extent possible
• Information is well managed and kept up to date and has supporting examples of
its usage that can be used to measure its value
• Practitioners are supported in the timely resolution of problems they encounter
when performing their tasks
• The system is widely accessible across the company, encouraging practitioners to
participate
System Definition
With this vision in mind, a set of features were developed to ensure that the goals of the
system were met regardless of the tool selected to hold process information.
Process Navigation
After years of experience with search engines, we realized that relying solely on key-
word searching in the system would not allow us to achieve our goal of getting
practitioners the right information as quickly as possible. First, given the diverse
terminology in the company, we could not rely on practitioners to find the exact
information they needed using keywords because many groups used different terms for
the same process. Additionally, the typical keyword search return of several hits did not
establish confidence in the user that they had found the right information. For any
process, we wanted to ensure that there was one place to go and all users had the ability
to quickly access it.
To enhance searching, we used a search methodology that was based on a common
hierarchical understanding of software engineering practices. This enabled teams to
“scope” their search within a specific domain in our central repository. The idea behind
the scope-based search was to give users the ability to take a high level process domain
and drill down to specific processes and collateral within that domain. For example,
within the top-level domain of software engineering, there are several commonly
understood major sub-domains such as requirements engineering, software validation,
and software configuration management. If users are interested in one of these areas,
such as requirements engineering, they can go to the requirements engineering process
and get more information on its sub-processes such as requirements gathering and
elicitation, requirements analysis, specification, and requirements validation. Depending
on the detail of information required, the user can continue to explore and dive further
94

into the process. Additionally, using this hierarchy for process knowledge management,
users can easily get a sense of where the process falls with respect to other processes. To
correctly implement this vertical navigation, we needed to structure software engineering
processes appropriately.
A software engineering “taxonomy” was developed to provide a common understanding
of the relationship of software engineering processes and allow the hierarchical scoping
of information. The taxonomy divided all software engineering processes into common
process domains and their sub-processes. The categorization was based on common
industry process groupings. SEI CMMI [1], IEEE SWEBOK [2], DOE Best Practices
Clearinghouse [3], DOD Defense Acquisition Guidebook [4], and the SSC San Diego
Process Asset Library [5] were used to get an understanding of common categorization.
Additionally, the process domains were tailored so that they reflected how the software
engineering community within Intel used this information.
Process
Domains
Sub-
Processes
Figure 1. Software Engineering Taxonomy
This taxonomy provided a way to identify information independent of the terminology
used. As users become familiar with the structure, they would be able to find processes
even if they had an unfamiliar name. The largest benefit of the taxonomy was that it
provided a structure for information so that similar processes could be grouped together
and any duplicate information would quickly be identified. Additionally, new practices
or sub-processes could be added to existing processes or domains allowing the
95

knowledge base to expand to accommodate new and potentially even competing
methodologies.
System Tools
It was important to find a tool that did not hamper the open access, collaboration, and
process navigation needed for the system. There are several information management
tools available and using the criteria we had established, we evaluated and compared
them. No tool, even the ones that came very close in features, met all of our needs. One
tool that seemed to best support the concept of centralized collaboration by diverse teams
was the wiki model. This model is designed to support open collaborative development of
information. Wiki software, which allowed for very easy open sharing, updating, and
linking of information, met nearly every requirement we had. It was available corporate-
wide with no internal access controls so that everyone could have access. By extending
the idea of Wikipedia [6] to create a living directory of knowledge on all software
engineering processes, the system could further avoid the derivative problem by
establishing one common home page for each process. From this home page,
information about processes can be structured to minimize the amount of tailoring
required by individual teams and maximize the amount of re-used information.
A wiki on its own does not serve as a good information management system. It lacks the
structure necessary to direct users to share information and collaborate on a common
subject. By combining the information storage and easy inter-page linking capabilities of
the wiki tool with a hierarchical structure for process navigation (described above), we
were able to produce a system that promotes collaboration across groups on any specific
topic and enables users to find relevant information quickly. We set out to tailor the wiki
to meet the needs of the system by developing common process information pages,
adding categorization, and implementing quality control.
In addition to the front-end wiki interface, we provided a common document
management system (DMS) on the back-end to enhance the control and management of
documents. Documents in the DMS are included in the wiki system via URLs on the
wiki pages. Because access control lists were not used within the wiki, only a certain
level of confidential information was allowed on process pages. Having a secure DMS
that allowed several levels of confidential information through permission sets and access
control lists enabled the PKM system to potentially contain any type of software
engineering information and knowledge at the company.
The wiki software that was chosen was open source and required only a small amount of
maintenance. The backend used a DMS that was already available at the company and,
under a corporate-wide license, did not require extra funding to support the PKM system.
These systems were chosen not only because they met the requirements of the system,
but also because they were the most cost effective. Choosing a system based on tools
that did not require high maintenance costs over time or yearly fees also helped to ensure
that it would be in a better position to survive cost cutting measures.
96

Common Process Information Pages
In the system we developed, process documentation is stored on wiki pages. Each
process page is structured so that the main content of the page contains “common”
information. Common information is defined as:
• The business objectives the process is trying to address and high-level metrics
used to measure if a specific implementation meets those objectives
• Information that is as specific as possible but is generally usable by any
practitioner
• Process information that is an approach recommended by a subject matter
expert and/or Community of Practice and agreed upon by the community
• Information developed and updated based on community collaboration or
expert experience
Having this common process information as the main content allows all of our software
engineers, regardless of their team or location, to collaborate using the same baseline
knowledge about a process. This has had the additional benefit of promoting a common
understanding about each process, its goals, benefits and challenges. In addition to this
common information, these pages had to be flexible enough to allow teams to tailor the
process to their specific environment when needed. Otherwise, the system faced the risk
of teams falling into old habits and creating their own local repositories because the PKM
system processes were not the best suited solution to their particular product development
practices. To allow teams to keep specific tailoring of process information alongside of
the common process knowledge, a sidebar was added to each common process page that
allowed teams to link their specific procedures to that page. By giving teams the ability
to see examples from other groups on how they implement the process, teams were able
to better learn key concepts that allowed them to drive implementation of the best
practice in their own team. Additionally, it allowed practitioners to see the range of
tailored practices and decide if they were improvements that would be applicable to most
groups. The lessons learned in the group specific practice could easily be incorporated
back into the common process, enabling the best practice to stay current.
In addition to specific team implementations of a process, the sidebars on common
information pages also contained associated process collateral (standards, job aids,
references, and examples) to enable application and deeper understanding of the
information. External links to related information that must either be stored in document
form or that required a higher level of security could reside in our DMS while still
presenting the users with a seamless presentation of similar process information in one
location.
97

Common
Process
Information
References, Job Aids,
or team operational
procedures
Figure 2. Process Page Structure
System Structure
There is no ability to implement a physical hierarchical structure within a wiki system as
they are developed to have a flat structure and organization. To enable scope searching
and organization in alliance with the software engineering taxonomy, a faux structure
was added to the wiki pages through the use of wiki categories. This allowed users to
follow the process hierarchy to more specific pages, or see a listing of all pages within a
process domain. The use of Wiki categorization enabled us to effectively implement the
vertical navigation that helps individuals to find and work on specific processes of
concern to them. This categorization can be seen at the bottom of each page. The
example in Figure 3 comes from our Inspections page:
Figure 3. Software Engineering Categorization
98

In addition to categories, a central Software Engineering Portal page was created. All top
level process domain pages and sub-process pages were linked to this portal page and
structured according to the taxonomy (see the Topics section in Figure 4). This central
page helps to orient users and provided a quick overview of available information in the
system.
Figure 4. Software Engineering Portal
Quality Control
It was important that process pages represented the best practices available in the
company. Pages are open for anyone to edit, so there had to be some quality control to
ensure that the information, including the local derivatives, was the best available . The
role of “contributing editor” was established for each process domain. Contributing
editors were responsible for monitoring pages and collaborating with other practitioners
using the common home page to continually improve the process information. The
contributing editors of a process page are listed on the page so that they can easily be
identified and contacted by all practitioners who access the page. Contributing editors
were selected based on their status of being recognized as content experts on a specific
process area. As more contributing editors were added to a process area, a community of
practice would organically form to further improve the page and ensure a higher quality
of information. Additionally, bringing multiple knowledge experts together to
collaborate opened the door to innovative changes in the process. Local derivatives that
99

were indeed general improvements now had a means to be feed-back into the general
knowledge base. The flexibility of the system to keep dissimilar methodologies under the
same umbrella domain or process also allows for experimentation that can then be
compared to existing practices to determine if it is indeed a better solution.
To help users determine if a page is a best practice, a stamp was placed on pages that
were sponsored by the Intel Software Quality group. This indicated that the page was
developed based on collaboration by several subject matter experts in the process area
and that it continued to be monitored and updated by contributing editors through
collaboration and consensus.
Collaboration
Every process page has an associated discussion page attached to it that allows for
asynchronous collaboration. This enables those who use the process to detail their
experiences and share their knowledge while not changing the best practice information
on the page. Additionally, this serves as a forum to discuss changes to the page. Every
change to a page is associated with the person who made the change and stored in the
page’s history. Any changes to a page can also easily be rolled back. Since contributing
editors and other practitioners are watching pages of interest, they automatically receive a
notification when a page changes. This functionality in the wiki software has helped to
alleviate many concerns that practitioners had when they first encountered the paradigm
shift where anyone in the company can modify a page and no access or edit controls
exist.
The process we defined to help mediate changes was to request that all major changes be
first communicated to other practitioners through the discussion page and then a
consensus gained before the change was made. A major change was defined as the
editing or deleting of main content on a common process information page that changed
the terminology, meaning, intent, or understanding of the process. Additionally,
modification of the taxonomy or categorization and deletions of sidebar content was
considered a major change. For minor changes (such as grammar or spelling fixes), no
collaboration was required. Contributing editors enforced this process and, if it was not
followed, simply rolled back changes temporarily and worked with the person who made
the edit to increase the quality of the change or understand the reasoning behind it. The
benefit of being in a corporate environment is that there are few, if any, unwanted
changes made to pages. The responsibility of a contributing editor to monitor pages is a
very small portion of their overall role. Instead, contributing editors focus more of their
time keeping information up to date and increasing the value of pages.
System Results
One drawback to using the wiki software was the lack of data that could be obtained on
system usage. The system does not readily indicate how many different visitors visit a
page a day, how long they stay, or what they download. The data that we could easily
obtain were how many different process pages were in the system and the number of hits
100

per page that were received. To encourage usage of the system, we spent a great deal of
time upfront to post best practice processes in the system. These best practices were
determined based on the years of experience of established knowledge experts in the
process area. A useful set of information, we determined, would encourage usage and
increase interest in the system. Prior to announcing the system outside of the group, a
base set of 40 process pages were put into the PKM system.
After several external communications, we began to monitor the number of visits to a
representative sampling of main process pages. Each month, we tracked the number of
hits to 28 key pages. We also kept track of the dates when we did large communications
(such as during an Intel SPIN meeting or at a conference). After the initial set of
communications (all before September of 2006), there was a significant spike in the
number of page hits (see graph in Figure 4). After September, there were no targeted
communications about the system yet page usage continued to rise sharply. Some pages
received hits that were largely not proportional to the average page. For example, three
specific process pages received over 20,000 hits as compared to the average of the 28
page sampling which was only 6,000 hits. The large number of hits indicated that there
was a great deal of interest and usage of the centralized process knowledge management
system in these areas. It also indicated that practitioners were willing to search outside of
their group to find and use information on software engineering practices. Today, one
year later, there are 178 process pages in the system and this continues to grow. Figure 5
indicates the high usage rates across the system. Note that the total number of hits per
month is based on how many the representative 28 page sampling received which is only
a fraction of the core process pages available in the system.
101

PKM Usage
0
1000
2000
3000
4000
5000
6000
6/23/2006
7/23/2006
8/23/2006
9/23/2006
10/23/2006
11/23/2006
12/23/2006
1/23/2007
Hits
P
er P
ag
e
Software Engineering Portal
Category: Software Engineering
Category: Software V&V
Software V&V
Validation Methods
Validation Life Cycle
Validation Process Improvement
Validation Tools and Environment
SW Engineering Glossary A-B*
SW Engineering Glossary C-D
Software Quality Plan
Reviews
Review Methods
Best Practices in Conducting Reviews
Inspections
Inspectors
Moderators
Defect Terminology
Software Subcontract Management
Software Test Plan
Document Life Cycle
Requirements Management
Requirements Engineering
Software Defect Communication
Static Analysis Tools
SW Quality Metrics
SEPG
SCM
Figure 5. PKM System Usage Based on Number of Hits Per Page
102

Total Page Views Per Month
0
20000
40000
60000
80000
100000
120000
140000
160000
6/30/2006
7/30/2006
8/30/2006
9/30/2006
10/30/2006
11/30/2006
12/30/2006
1/30/2007
2/28/2007
Figure 6. Cumulative Total PKM System Page Views per Month
Despite the number of visits to the process pages, the amount of un-solicited
contributions back to the system were very few. At first glance this would seem to
indicate that people were unwilling to share their information with others. However,
given the many forums at the company where practitioners exchange knowledge and
process collateral, and the unguarded willingness to post links to team information on
PKM system pages, this did not appear to be reason for the lack of contribution to the
system. Unfortunately, without this contribution of knowledge back to the common
process information, the risk of the information becoming outdated is very high.
We conducted research to understand typical barriers to collaboration and knowledge
sharing that users encountered with the PKM system. While not all of the research will
be shared here, we did determine improvements that may help to overcome the issues that
we are seeing in the system. The improvements are as follows:
1) Increasing the amount of contributing editors and encouraging more interaction
within the common process pages
2) Incorporating other methods of sharing knowledge into the PKM system where
possible
3) Encouraging contributions to the PKM system through recognition and rewards
4) Changing behaviors so that knowledge sharing is a part of process development
and use of the PKM system is integrated into the common work flow
The first two improvements can be implemented relatively easily. However, the last two
require a change in the values and reward systems used with regard to developing
processes. While the current use of the PKM system relies solely on a bottom-up
approach where practitioners come to the site and add information only because they
want to and not because it’s demanded by their managers, we see that a top-down
involvement needs to happen in order to move the rest of the software engineering
103

population to begin using the system. This doesn’t mean that we require all practitioners
to use the PKM system only, but it does mean that a top-down reward and recognition
system for collaboration and knowledge sharing would help encourage this type of
practice. While this reward system doesn’t exist for many groups today, this doesn’t
appear to be an unachievable goal. Since the creation of the system, we’ve seen the
attitude toward knowledge sharing begin to shift. In the beginning, many practitioners
outright rejected the idea of open sharing and free presentation of information that
characterized the wiki model. Since then, we’ve seen several groups and practitioners
begin to grasp the benefits of sharing information across the company, although most
have yet to take the first step in transferring their local control of information to the
common control of the PKM system.
Conclusion
Through analysis of process development and improvement within our company, a
system was developed that encouraged greater rewards through improved management of
process knowledge. The system was consciously designed to overcome issues in prior
process information management repositories, to implement features that improved
sustainability and to achieve our knowledge management goals. The PKM system
differentiates itself from past repositories because it maintains relevant and current
information despite loss of process owners, enables searching for information by related
subjects instead of relying solely on key-word searches, allows for asynchronous and
synchronous collaboration across different geographies, significantly reduces duplication
of effort through improved re-use, provides easy identification of best practices by users,
provides quality control of shared information and has the ability to survive changes in
organizational structure.
By aligning the system goals with business goals the importance and benefit is clear. The
PKM system improves overall software quality by propagating best practices in software
engineering and enabling cross-team collaboration to drive innovative solutions and
continuous process improvement. It also increases efficiency by saving engineers’ time
and allowing them to focus on product development instead of process development.
This is achieved by reducing the effort necessary to maintain, develop, understand, and
share processes. Overall, it creates a cost savings to the company by reducing duplication
of effort.
In addition to business benefits, a centralized system built on sharing of information and
collaboration presents benefits to individual practitioners by allowing users to spend less
time on redefinition of common processes, quickly find information that is relevant to
their jobs, and easily collaborate with other practitioners on topics of interest. Another
side benefit for contributors has been to provide a means where innovators and those
developing best practices now have a visible forum for their work that spans across
organizational boundaries. Sharing not only reduces our overall maintenance cost and
improves ROI for locally sponsored improvement initiatives, but also provides
individuals visible recognition within a community of their peers.
104

This system, while designed for software engineering, is not specific to software
engineering, and can be applied to most processes within a business. For any businesses
to succeed in the future, knowledge management must be an integrated capability within
the company that exists at a level accessible to each worker and their specific job.
Innovation rests not only on the sharing of ideas between knowledge workers with
varying perspectives, but also on the critical evaluation of proposed solutions by other
practitioners to ensure the innovation actually addresses the business objectives in a more
effective manner .
Future areas of improvement to this system will focus on improving management support
and reward systems for individual and team collaboration, creating better metrics on
process reuse, setting baseline metrics for process effectiveness, developing
methodologies that will further reduce the need for tailoring of process information,
incorporating knowledge management into daily tasks, and increasing collaborative
communities of practice associated with major processes areas.
References
1. Software Engineering Institute (SEI). CMMI . Carnegie Mellon.
<http://www.sei.cmu.edu/cmmi/>.
2. IEEE. SWEBOK. <http://www.swebok.org/htmlformat.html>.
3. Best Practices Clearinghouse. Department of Energy.
<http://professionals.pr.doe.gov/ma5/MA-
5Web.nsf/Business/Best+Practices+Clearinghouse?OpenDocument>
4. Defense Acquisition Guidebook. Department of Defense.
<https://akss.dau.mil/dag/DoD5000.asp?view=functional>.
5. SSC San Diego Process Asset Library. Space and Naval Warfare Systems Center San
Diego. <http://sepo.spawar.navy.mil/>.
6. Wikipedia. <http://en.wikipedia.org/wiki/Main_Page>.
105

106

Building Quality in from the Beginning using Lean-Agile
Quality Assurance Practices
Jean McAuliffe
Net Objectives, Inc
Abstract
From the beginning of software, we have been dealing with defects. It is costing us billions of dollars each
year. We have tried many ways to detect and remove these defects, but quality has not improved. We
can learn from Lean principles to instead “Build Quality In” The role of Quality Assurance then should be
to prevent defects from happening. We need to develop a quality process to build quality into the code
from the beginning. By preventing these defects from getting into the hands of testers and ultimately our
customers, and helping ensure we are building the right product, we will indeed reduce the costs from
defects and better delight our customers. This paper explores Lean-Agile and how we can apply seven
Lean-Agile Quality Assurance practices to significantly improve our quality.
Author Bio:
Jean McAuliffe ([email protected]) is a senior consultant and trainer for Net Objectives.
She was a Senior QA Manager for RequisitePro at Rational Software, and has been a Product Manager for
two agile start-ups. She has over 20 years experience in all aspects of software development (defining,
developing, testing, training and support) for software products, bioengineering and aerospace companies.
The last five years she has been actively and passionately involved in Lean Agile software development.
She has a Masters in Electrical Engineering from the University of Washington. Jean is a member of the
Agile Alliance, and charter member of the Agile Project Leadership Network.
© Net Objectives, 2007
107

Defect-Driven Software Development Has Not Improved Our Quality
We have been dealing with the problem of software quality since the inception of computer technology.
Software defects can affect the few or the many, but as the NIST report above so painfully points out,
defects are costing us billions of dollars—a number that is much too big to ignore.
Many a software quality improvement process has been suggested over the years; some have had more
success than others. Most of these efforts have involved using testers to find defects in software code
rather than attempting to prevent these defects in the first place. Product quality has suffered from this
approach. As Steve McConnell pointed out to us in 1993, there is no way to effectively and thoroughly
find all software
defects via testing.
And, even if it were
possible, it is wildly
expensive (Jones
2005).
After fourteen years
and billions of dollars
in wasted money, the
industry continues to
spend entirely too
much time, money,
and people on finding
and fixing defects. We
need to elevate and examine the role of quality assurance. By using Lean-Agile principles and practices,
we can get to the root of the problem and start to assure quality instead of trying to test it in.
In Mary and Tom Poppendieck’s books5,6
, they
discuss seven principles to help teams and
organizations produce quality software at a lower
cost. One of those principles is to “Build Quality In.”
This principle must be the focus of our efforts to deal
effectively with the defect crisis. We need to build
quality in from the beginning if we are to reduce the
number of defects and help reduce the cost of
producing software.
“Testing by itself does not improve software quality. Test results are
an indicator of quality, but in and of themselves, they don't improve
it. Trying to improve software quality by increasing the amount of
testing is like trying to lose weight by weighing yourself more often.
What you eat before you step onto the scale determines how much
you will weigh, and the software development techniques you use
determine how many errors testing will find. If you want to lose
weight, don't buy a new scale; change your diet. If you want to
improve your software, don't test more; develop better.”
Steve C. McConnell3
1993
“Effective software quality control is the
most important single factor that
separates successful projects from
delays and disasters. The reason for this
is because finding and fixing bugs is the
most expensive cost element for large
systems, and takes more time than any
other activity.”
Capers Jones Software Engineering: the
State of the Art, 2005
”Software bugs, or errors, are so prevalent and so detrimental that they cost the U.S.
economy an estimated $59.5 billion annually, or about 0.6 percent of the gross domestic
product,” finds a report done in 2002 by the Department of Commerce's National Institute
of Standards and Technology. The report goes on to say, “At the national level, over half of
the costs are borne by software users and the remainder by software developers/vendors.”
The study also found that, although all errors can never be removed, more than a third of
the costs associated with errors, or an estimated $22.2 billion, could be eliminated by an
improved testing infrastructure that enables earlier and more effective identification and
removal of software defects. These savings are associated with finding an increased
percentage (but not 100 percent) of errors closer to the development stages in which they
are introduced. Currently, over half of all errors are not found until downstream in the
development process or during post-sale software use.
--NIST report 2002
108

To get us started down the proactive path to eliminating faults at their inception or, at the very least, in
near real-time, seven quality assurance activities will be identified and examined. Quality in a lean-agile
environment is everyone’s responsibility, so these seven practices will span across many roles and
responsibilities, from product champions to developers to testers. This article explores how we can apply
these seven lean-agile practices to significantly improve our quality, and reduce the cost and effects of
defects. We can then quickly deliver the right product for our customers, in the right way with sustainable
quality development and with the right money for our business by minimizing wastes. By doing so, we will
delight both our customers and our business.
Here are the seven Lean-Agile Practices to consider:
1. Enhance Code Quality
2. Drive With Continuous Integration
3. Be Mindful in Testing
4. Apply Agile Quality Planning & Execution
5. Use Lean-Agile Verification & Validation
6. Be Test-Driven, Not Defect-Driven
7. Apply Smart Lean Metrics
Practice One: Enhance Code Quality
Enhancing code quality is one of the most significant activities teams can implement to achieve higher
quality. Some common practices that teams have found to add significant value and quality are
• Test-Driven Development (TDD)1
& unit testing
• Refactoring to improve existing design
• Coding with design patterns7
• Pair programming
• Shared code responsibilities
The first three items are about creating better code through better practices. In the next section we’ll
address the value that TDD provides to teams and the product by reducing defects. We also are striving
for having more maintainable code. It is important that redundancies are removed because this adds
considerable waste and effort when changes occur. One thing for certain in lean-agile development is that
change is a certainty. By embracing change, we need to plan for changes to happen and changing code
must be as easy as possible.
Pair programming and shared code responsibilities also add quality to the code. By having multiple
people involved with the code (by pairing and sharing), the quality has been shown to improve (For more
information see http://www.extremeprogramming.org/rules/pair.html). Extreme Programming teams have
been using this technique successfully for many years now. With two people looking at the code (either
pairing or sharing), you will find that issues and defects will be discovered much sooner. Two brains are
indeed better than one for writing quality code. Teams that are new to TDD or pair programming
sometimes think that having two people pairing or writing tests first will slow the development down. This
may happen only when first trying them out. The time is more than made up on not having to find and fix
defects later in the development cycle.
Developing in isolated silos has not been a very good approach and potentially has helped contribute to
the mess we are in. By applying design patterns and refactoring you can create cleaner, more
understandable and more maintainable code for the future. TDD and unit testing provide assurance that
you are building the product correctly from the start. Collectively, they all enhance the overall quality of
the code being produced right out of the gate.
109

Practice Two: Drive
with Continuous
Integration
Continuous Integration is
the “engine that drives
agility.” In order to be agile-
fast, you need a practice
that ensures fast, frequent
builds. It is a wonderful
practice for ensuring your
software never gets very far
off track. You check in and
build continuously (or frequently). This eliminates the nightmare of integration builds that seem to take
days or weeks before they are ready to test. And it supports the lean principles, building knowledge into
software processes and eliminating the waste of rework and delay.
Continuous Integration does take some finesse and dedication to do well. Martin Fowler calls out the
following ten practices to be successful:
• Maintain a single source repository
• Automate the build
• Make your build self-testing via unit testing
• Have everyone commit their changes at least every day (preferably more often)
• Ensure that every commit builds successfully on an integration machine and not just on the local
developer machine
• Keep the build fast
• Test in a clone of the production environment
• Make it easy for anyone to get the latest executable
• Make it possible to have everyone see what's happening
• Automate deployment
All of the parts as well as the whole
provide an environment for quality
code to emerge. The self-testing
piece is crucial in that we have a
baseline for measuring success or
failure. Agile teams adopt a culture
of not wanting to break the build. All
of these practices follow lean
principles. By maintaining a single
source repository, we avoid time
synch wastes in having to merge
changes. By automating the build,
you build in knowledge into the
process. This avoids mistakes, and
makes it possible to for anyone to
do a one-click build. Doing so
reduce hand-offs and eliminating
more time wastes in waiting on
someone to do the build.
By doing frequent build and tests we know if we do find a problem, the answer lies in what we just did.
This eliminates the time waste of having to search to find where the problem was introduced. Agile teams
that I have been associated with, all report at least a 50% reduction in defects after applying continuous,
test-driven integration. Just recently I spoke with a team that had only one defect reported from the field.
“Continuous Integration is a software development practice where
members of a team integrate their work frequently, usually each
person integrates at least daily - leading to multiple integrations
per day. Each integration is verified by an automated build
(including test) to detect integration errors as quickly as possible.
Many teams find that this approach leads to significantly reduced
integration problems and allows a team to develop cohesive
software more rapidly.”
http://www.martinfowler.com/articles/continuousIntegration.html
Martin Fowler May 2006
“The greatest value in quality for teams comes when they
combine TDD and Continuous Integration into a
continuous, test-driven, integration practice. Together,
they help teams identify almost immediately when a
problem has surfaced. These teams find that a significant
number of defects are simply fixed before any defect has
ever been logged. It is not uncommon to see a reduction
of 50 percent in the total number of defects being
managed in a release the very first time these practices
are implemented and many
teams have reported even greater reductions: 80-90
percent defect elimination”
Mary & Tom Poppendieck, 20076
.
110

They compared their results to other similar sized teams and projects in their organization that were not
applying this practice and found the average was more in the hundreds. These two practices can and
indeed do build the quality in and significantly reduce the waste that defects add to software
development.
Practice Three: Be Mindful in Testing
What does it mean to test mindfully? It means testing efficiently and effectively while keeping an eye on
the ultimate goal of quality for the customer. Doing so will prevent waste from creeping into testing. It
ensures that there is just the right amount of testing coverage so that the team can be confident that the
process is sound and the code quality is good. But what is the right amount? We can crank out many
tests maybe without thinking of their value or impact. Many teams seem to think more tests are better.
This may not be the case, and in some cases, we may be over testing, or causing maintenance
nightmares. The question to ask then, is there a minimal, but still credible set of tests we can use that
could possibly work?
Alistair Cockburn2
has defined a criticality scale for projects that may help teams determine how much
testing is good enough. First, assess your product according to its system criticality and failure impact
using the following guidelines:
� Loss of Comfort – annoyed customers
� Loss of Discretionary money – loss of money and customers
� Loss of Essential money – loss of business
� Loss of Life - someone could die
Now, think about the impact if something goes wrong in your product/project. The level of testing should
be higher or stronger if a feature falls in the essential or life category. On the other hand, a lower level of
testing may be perfectly acceptable if the feature is at the comfort or discretionary money level. Risk-
based analysis may also shed some light on how much testing is needed and where we should spend our
testing dollars. Also, if we are applying continuous test-driven integration practices, the need for
exhaustive functional test suites will be reduced. We will be able to spend our testing time making sure
we have just enough breadth in all the types of testing we do including the non-functional type testing
(security, performance, scalability, etc) to verify the correctness of functionality.
Once we determine how much we need, we need to be mindful of the kinds of testing implementations we
have and quality of these tests. What should be our mix of automated and manual tests? Agile testing
requires a high level of automation to be in place to deliver quickly. Manual regression suites will derail
agile teams quickly as the size grows. They both have a place and serve a purpose in quality.
A technique that is proving very
valuable as a complement to
automated testing is exploratory
testing. Written, scripted manual tests
are not lean: they are hard to
maintain, time-consuming to run, and
are dormant until someone manually
runs them. Exploratory testing, on the
other hand, can be very powerful. For
example, you can use session-based
(James Bach
http://www.satisfice.com/sbtm/index.s
html) and/or a quick explore methods
to see where issues are and what
automated tests might be written.
Being mindful of our needs will help
to determine the right balance
between automated and exploratory testing.
Exploratory software testing is a powerful approach, yet
widely misunderstood. In some situations, it can be
orders of magnitude more productive than scripted
testing. All testers
practice some form of exploratory testing, unless they
simply don’t create tests at all. Yet few of us study this
approach, and it doesn't get much respect in our field.
This attitude is beginning to change as companies seek
ever more agile and cost effective methods of
developing software.
James Bach Exploratory Testing Explained, 2003
111

Examine your automated testing for both quality and amount of coverage. Is the coverage the right
amount for your product? Are you testing at the user interface level too much? Can you add business
logic tests below the presentation layer that are easier and more maintainable? Have redundancies crept
in? Care and feeding of these automated tests is just as important as your product code. The good code
quality practices for programming discussed earlier can apply to the development of the test code. Pairing
and shared testing code responsibilities, refactoring, attention to design will add quality to your testing
code.
Mindful, lean-agile testing suggests that we need to start from the small, minimal credible set and only
add more tests if they add value. Based on the criticality score, the minimal-credible testing set could be
very small to very large. Be mindful of how you are testing and at what level in the application. Where is it
easiest to automate? Think about maintenance of these tests. If we are changing, we will need to have
easy ways to change our tests as well. Also, think how exploratory testing can be used to its advantage.
Consider many angles when determining how much coverage you need. Do not just add tests because
you think that it will add to the quality of the product. It is easy sometimes to get caught up in the fever
and pressure of testing and lose sight of what is really needed. Applying mindfulness will help.
Practice Four: Apply Agile Quality Planning & Execution
Agile methods use multiple levels of planning and execution. Multi-level planning is very lean in that we
only focus on what we need to do when we need to do it. The mantra “just enough, just-in-time” is a good
one. The typical planning levels are at the product (the
highest), release, iteration, and story (lowest level).
Product planning provides a way for the product champion
to prioritize and set the vision for the product. Typically,
this is at the highest (fuzziest) level, such as capturing
features.
Release planning provides the ability to group stories into themes for a release. The planning horizon is
typically a few months. From a quality perspective, we need to look at the quality criteria that are required
to accept the release. Drivers for this could be the type of release and the criticality score we have. Lean-
Agile methods bring the discussion of the quality criteria to the table so that the whole team understands
what is expected of them and the product. The goal is not to go over or under, but instead to deliver only
what is needed.
The quality criteria for teams transitioning to Lean-Agile could involve the number of defects / number of
issues not resolved, test coverage (including unit testing), types of testing, test pass/fail rates, or anything
else that the team deems important. For experienced Agile teams, the criteria could be stated as simply
as, “all stories accepted and no unresolved defects or issues.” What is important is that all team members
understand the objectives and vision of the release, comprehend the business goals, and have a shared
stake in the quality of the released software.
Iteration planning allows teams to further refine quality planning. The time period of focus is much shorter
(weeks, not months). Once again, the team should understand the quality criteria for the iteration. The
focus should be, “What will it take to accept and close the iteration?”
The lowest level of quality planning is the story. Each story should have its own acceptance criteria.
When is the story really done? It is done when the story has been accepted. When can it be accepted?
The story can be accepted when all the acceptance tests have passed. We’ll talk more about acceptance
testing in the next section.
Execution tracking is about knowing where we are and if we will reach our destination in time. Release
tracking, iteration tracking, and story tracking give us visibility into whether or not we are on schedule for
the items we planned and allow us to fine tune at the level that is necessary. Lean-Agile allows teams to
In preparing for battle I have always
found that plans are useless, but
planning is indispensable,”
-Dwight D. Eisenhower
112

steer their way to success. By having a set of quality criteria at every level, we have a way to assure our
success and quality at each step along the way.
Practice Five: Use Lean-Agile Verification and Validation
Software validation asks the question, "Are we building the right product?" Lean-Agile provides many
ways to assure that we are indeed building the right product. In lean-agile development, validation is an
activity that is shared among the product champion, the testers and the developers. Agile acceptance
testing is the standard means to achieve validation of what the feature is supposed to do. Defining the
acceptance tests should occur as early as possible. Many teams start out defining the tests after the
Iteration or coding has begun. This is not necessarily ideal. We have moved testing way forward from the
non-agile ways, but there are ways to move it even farther forward.
The better way to help drive definition and understanding is to define the tests even earlier. In the
previous section on agile planning and execution, it was mentioned that we should all agree on the quality
criteria for the Release, the Iteration and the Story. Part of the quality criteria is that the acceptance tests
should all be passing in order to accept the story, the Iteration and the Release. The acceptance tests
can become the specification of what the story really means. IndustrialXP (For more information, see
http://industrialxp.org/storytesting.html) talks about the storytest as being one thing. This is a good way to
think about it. We want to blur the distinction and eliminate the need to have separate requirements and
associated tests to validate the functionality. From a lean perspective, this makes sense. Why have two
things that you have to update or modify, when one will suffice?
These storytests or acceptance tests become the agreement between the product champion, the
developers and the testers on the needed functionality. If these tests are written earlier (starting with
Release Planning but mostly in the Iteration Planning timeframe), before development has occurred, then
we truly are running test-first on all cylinders. Acceptance Test-Driven Development or ATDD means that
the developers can use these tests to help define the design and code, above what they do with unit test-
driven development that was discussed in the first practice. Acceptance testing and ATDD will eliminate
many of the post code delivery tester-driven development issues that are found in more traditional
development cycles (bugs filed as “I don’t think this is behaving correctly”), and clears up most
misunderstandings between the stakeholders before coding even begins.
Agile acceptance testing does need to be as automated as possible. In order to be agile fast, teams have
to test at the speed of need. This involves moving away from written manual tests and towards
executable documentation. Using a tool such as Fit or FitNesse (For more information, see the FitNesse
website at http://fitnesse.org/) will allow all the stakeholders to collaborate and agree on the what, and
execute the tests in an automated way4
. The beauty of Fit/FitNesse is that the test specifications can be
readable and understandable to all, easily updated when change occurs, and provide pass-fail status on
the execution of individual tests or for a suite of tests. When the story has been accepted, these tests
then merge into the regression suite and continue to add value to the team and product as they execute
at least nightly.
Software verification asks the question, "Are we building the product correctly?" This is a major tenant in a
Lean-Agile environment. By building the product correctly from the beginning, quality improves. Unit
testing helps to verify operation at the code level while functional testing (and other tests) verifies that the
product is operating correctly at higher levels.
Another type of exploratory test that is useful is what I like to refer to as a Release Explorathon. This
practice brings many different stakeholders (sales, marketing, tech support people, etc.) to the testing
process, some of whom will be seeing the product for the first time. It can also reveal a great deal about
the development process. If few issues are found, the process is working, verified and validated. On the
other hand, if many defects or issues surface, something in the quality process has failed and we need to
examine what has happened and fix the process.
113

Verification and Validation are important tenets to many software teams. In lean-agile, we still want to
hold onto the value these activities provide to the team, the organization and ultimately to the customer.
We may do things in a different order, or in different ways than a non-agile team does them, but we are
making sure that we have validated that the product is the right product, and verified that it is functioning
correctly and that we have a quality development process in place.
Practice Six: Be Test-Driven, Not Defect-Driven
Earlier, I stated that teams are dealing with too many software defects. These include defects found by
customers and defects found by the team. Critical defects are those that escape into customers’ hands
and that can adversely affect the business, both in terms of credibility and in terms of dollars. While the
defects found by the team do not incur a credibility cost, they still cost time and effort to resolve, and that
still amounts to a dollar cost to the business. With continuous test-driven integrations, teams can find and
fix defects very early so few should be escaping into verification.
I would like to go one step further and ask, “Why log defects in acceptance testing during the iteration?”
Sure, testers and programmers are very familiar and used to logging and fixing defects, but does this
practice offer any benefits or value? I don’t think so. I can say this because of our lean-agile practices we
are now using. During the iteration, Agile teams are swarming to complete the stories. Communication is
very tight and programmers and testers are jointly developing and running many tests (both unit and
acceptance). Everyone is paying attention to any tests that are failing through the Continuous Integration
or nightly build reports. Does it add value to create an artifact called defect or is the failed test sufficient to
signal to the team that something is not correct? This does pre-suppose that you have automated
acceptance tests. If a defect is found and there is not a test for it yet, then you should just create a test.
Thinking in terms of lean principles, there is waste in creating yet another artifact to track. It takes time
and resources to pass the defect artifact around. Shouldn’t we just fix whatever we find and create the
automated test to make sure it doesn’t happen again? In essence we can fix and forget.
Many who are new to Lean-Agile find that this practice flies in the face of logic and their sense of what is
needed for tracking. There might be value in understanding high-risk areas or examining clusters of
defects. But is it the artifact that is helping or is it just helping us keep track? If there are quality issues in
particular areas, then we need to stop and examine what is going on, and correct the problem. If the team
has applied all the previous recommendations, then truly we have improved our quality, and we won’t be
finding many bugs during the iteration. Teams that are rolling with agile have eliminated the need for big
bug tracking systems. They just don’t find that many, and when they do, they just immediately fix the
problem.
I would like to recommend that you keep tracking defects just until you have proven the ROI on some of
the other new practices you have implemented. It would be nice to know that the defect counts did get
reduced by fifty percent or more for your team. Once your team or organization has seen the
improvement, shift away from being defect-driven as fast as you can. On the rare occasion when a
customer should find a problem, it still makes sense to keep tracking these. But with our new improved
way of creating and building quality in from the beginning, this should indeed be a rare event. The next
practice looks at what things you should be tracking.
Practice Seven: Apply Smart Lean Metrics
Be careful what you measure. Consider the following:
"Tell me how you will measure me and I will tell you how I will behave!"
(Theory of Constraints founder Eliyahu Goldratt)
There are many metrics we have tried over the years to measure our quality and our successes and
failures. Sometimes the measurement can affect behavior in an adverse way. My favorite Dilbert cartoon
from many years ago has the developer and tester in cahoots to get the bonus for the most defects found.
To counter the negative side of metrics, use metrics that help support things that make you better. From
114

Lean teachings, you should look at those metrics
that contribute the most value and then move on
when they stop adding value.
From the business perspective, the “one big thing”
to track is how much customer and or business
value we are delivering. After all, if delivered value
is going down, the business had better
understand why. We can measure the number of
delivered stories but it is important to have an
assigned value. I like to keep track not only of the
story’s size in story points, but also have an
assigned value point. This makes it easy to track
the value we are delivering. In addition, it is
crucial to know and measure customer
satisfaction.
Together, these lead to tracking the following:
• Number of defects customers find, and the
• Number of calls support is getting—both questions and feature requests.
In addition to the business metrics mentioned above, the following may also prove useful to you to gain
insight into how your Lean-Agile team is doing:
• Unit Tests
o Look at coverage. Is it increasing or decreasing?
o Code coverage percentage. How much of the code is covered by unit tests? Can you get
to 100%?.
• Hardening Time. How long does it take to wrap up the release for deployment? Is it increasing or
decreasing?
• Impediments opened/closed per iteration. (What are the things that are getting in the way of
success)
• Number of story points not accepted per iteration (split, moved to next, moved to backlog)
• Number of builds per iteration
Some metrics may be more useful than others. Teams should figure out what makes sense to track and
why they want to track it. There is the old adage: you can’t change what you don’t know. Tracking adds
visibility into what you are doing. You should track only as long as it adds value. If unit testing is not a
habit yet, tracking the numbers might prove useful. Once it has become a habit and all new code is unit
tested, then this metric has served it usefulness and is no longer needed.
Conclusions
Defects are costing us millions, both as software users and in the software business. We must come up
with a quality process that ensures we are building the right product and building it right—even better,
building it right from the start. When the seven lean quality assurance practices discussed in this article
are applied, they will help to achieve this result. But these should not be viewed as prescriptive recipes. It
requires us to continuously reflect, inspect, and adapt to make sure that the practices are adding value
and improving the quality of software. The team is responsible for figuring out what works best in their
situation and environment. These practices serve as a good starting point for teams to examine and
evaluate their current quality and assess the quality they need to delight their customers and get out of
the defect grip that is affecting too many teams.
“Measure-UP, the practice of measuring
results at the team rather than the individual
level, keeps measurements honest and
robust. The simple act of raising a
measurement one level up from the level over
which an individual has control changes its
dynamic from a personal performance
measurement to a system effectiveness
indicator.”
Measuring Maturity Dr. Dobbs January 12,
2004, Mary Poppendieck
115

References
1. Beck, Kent, Test-Driven Development By Example, Addison-Wesley, 2003
2. Cockburn, Allistair, Agile Software Devlopment, Addison-Wesley, 2002
3. McConnell, Steve, Code Complete: A Practical Handbook of Software Construction, 1993
4. Mugridge, Rick, Cunningham, Ward, Fit for Developing Software, 2005
5. Poppendieck, Mary, Poppendieck, Tom, Lean Software Development-An Agile Toolkit, 2003
6. Poppendieck, Mary, Poppendieck,Tom, Implementing Lean Software Development – From
Concept to Cash,2007
7. Shalloway, Alan, Trott, James, Design Patterns Explained, 2001
116

An Exploratory Tester’s Notebook Michael Bolton, DevelopSense [email protected]
Biography Michael Bolton is the co-author (with senior author James Bach) of Rapid Software Testing, a course that presents a methodology and mindset for testing software expertly in uncertain conditions and under extreme time pressure.
A testing trainer and consultant, Michael has over 17 years of experience in the computer industry testing, developing, managing, and writing about software. He is the founder of DevelopSense, a Toronto-based consultancy. He was with Quarterdeck Corporation for eight years, during which he delivered the company’s flagship products and directed project and testing teams both in-house and around the world.
Michael has been teaching software testing around the world for eight years. He was an invited participant at the 2003, 2005, 2006, and 2007 Workshops on Teaching Software Testing in Melbourne and Palm Bay, Florida; was a member of the first Exploratory Testing Research Summit in 2006. He is also the Program Chair for TASSQ, the Toronto Association of System and Software Quality, and a co-founder of the Toronto Workshops on Software Testing. He has a regular column in Better Software Magazine, writes for Quality Software (the magazine published by TASSQ), and sporadically produces his own newsletter.
Michael lives in Toronto, Canada, with his wife and two children.
Michael can be reached at [email protected], or through his Web site, http://www.developsense.com
Abstract: One of the perceived obstacles towards testing using an exploratory testing approach is that exploration is unstructured, unrepeatable, and unaccountable, but a look at history demonstrates that this is clearly not the case. Explorers and investigators throughout history have made plans, kept records, written log books, and drawn maps, and have used these techniques to record information so that they could report to their sponsors and to the world at large. Skilled exploratory testers use similar approaches to describe observations, to record progress, to capture new test ideas, and to relate the testing story and the product story to the project community. By focusing on what actually happens, rather than what we hope will happen, exploratory testing records can tell us even more about the product than traditional pre-scripted approaches do.
In this presentation, Michael Bolton invites you on a tour of his exploratory testing notebook and demonstrates more formal approaches to documenting exploratory testing. The tour includes a look at an informal exploratory testing session, simple mapping and diagramming techniques, and a look at a Session-Based Test Management session sheet. These techniques can help exploratory testers to demonstrate that testing has been performed diligently, thoroughly, and accountably in a way that gets to the heart of what excellent testing is all about: a skilled technical investigation of a product, on behalf of stakeholders, to reveal quality-related information of the kind that they seek.
117

Documentation Problems There are many common claims about test documentation: that it’s required for new testers or share testing with other testers; that it’s needed to deflect legal liability or to keep regulators happy; that it’s needed for repeatability, or for accountability; that it forces you to think about test strategy. These claims are typically used to support heavyweight and formalized approaches to test documentation (and to testing itself), but no matter what the motivation, the claims have this in common: they rarely take context, cost, and value into account. Moreover, they often leave out important elements of the story. Novices in any discipline learn not only through documents, but also by observation, participation, practice, coaching, and mentoring; tester may exchange information through conversation, email, and socialization. Lawyers will point out that documentation is only one form of evidence—and that evidence can be used to buttress or to skewer your case—while regulators (for example, the FDA1) endorse the principle of the least burdensome approach. Processes can be repeatable without being documented (how do people get to work in the morning?), and auditors are often more interested in the overview of the story than each and every tiny detail. Finally, no document—least of all a template—ever forcedanyone to think about anything; the thinking part is always up to the reader, never to the document.
Test documentation is often driven by templates in a way that standardizes look and feel without considering content or context. Those who set up the templates may not understand testing outside the context for which the template is set up (or they may not understand testing at all); meanwhile, testers who are required to follow the templates don’t own the format. Templates—from the IEEE 829 specification to Fitnesse tests on Agile projects—can standardize and formalize test documentation, but they can also standardize and formalize thinking about testing and our approaches to it. Scripts stand the risk of reducing learning rather than adding to it, because they so frequently leave out the motivation for the test, alternative ways of accomplishing the user’s task, and variations that might expose bugs.
Cem Kaner, who coined the term exploratory testing in 1983, has since defined it as “a style of software testing that emphasizes the personal freedom and responsibility of the individual tester to continually optimize the value of her work by treating test-related learning, test design, and execution as mutually supportive activities that run in parallel throughout the project.”2 A useful summary is “simultaneous test design, test execution, and learning.” In exploratory testing, the result of the last test strongly influences the tester’s choices for the next test. This suggests that exploratory testing is incompatible with most formalized approaches to test documentation, since most of them segregate design, execution, and learning; most emphasize scripted actions; and most try to downplay the freedom and responsibility of the individual tester. Faced with this problem, the solution that many people have used is simply to avoid exploratory testing—or at least to avoid admitting that they do it, or to avoid talking about it in reasonable ways. As
1 The Least Burdensome Provisions of the FDA Modernization Act of 1997; Concept and Principles; Final Guidance for FDA and Industry. www.fda.gov/cdrh/modact/leastburdensome.html 2 This definition was arrived at through work done at the 2006 Workshop on Heuristic and Exploratory Testing, which included James Bach, Jonathan Bach, Scott Barber, Michael Bolton, Tim Coulter, Rebecca Fiedler, David Gilbert, Marianne Guntow, James Lyndsay, Robert Sabourin, and Adam White. The definition was used at the November 2006 QAI Conference. Kaner, “Exploratory Testing After 23 Years”, www.kaner.com/pdfs/ETat23.pdf
118

McLuhan said, “We shape our tools; thereafter our tools shape us.”3 Test documentation is a tool that shapes our testing.
Yet exploration is essential to the investigative dimension of software testing. Testing that merely confirms expected behaviour can be expected to suffer from fundamental attribution error (“it works”), confirmation bias (“all the tests pass, so it works”), and anchoring bias (“I know it works because all the tests pass, so it works”). Testers who don’t explore the software fail to find the bugs that real users find when they explore the software. Since any given bug is a surprise, no script is available to tell you how to investigate that bug.
Sometimes documentation is a product, a deliverable of the mission of testing, designed to be produced for and presented to someone else. Sometimes documentation is a tool, something to help keep yourself (or your team) organized, something to help with recollection, but not intended to be presented to anyone4. In the former case, presentation and formatting are important; in the latter case, they’re much less important. In this paper, I’ll introduce (or for some people, revisit) two forms of documentation—one primarily a tool, and the other a product—to support exploratory approaches. The first tends to emphasize the learning dimension, the latter tends to be more applicable to test design and test execution.
This paper and the accompanying presentation represent a highly subjective and personal experience report. While I may offer some things that I’ve found helpful, this is not intended to be prescriptive, or to offer “best practices”; the whole point of notebooks—for testers, at least—is that they become what you make of them.
An Exploratory Tester’s Notebook Like most of us, I’ve kept written records, mostly for school or for work, all my life. Among other means of preserving information, I’ve used scribblers, foolscap paper, legal pads, reporter or steno notepads, pocket notepads, ASCII text files, Word documents, spreadsheets, and probably others.
In 2005, I met Jon Bach for the first time. Jon, brother of James Bach, is an expert exploratory tester (which apparently runs in the family) and a wonderful writer on the subject of E.T., and in particular how to make it accountable. The first thing that I noticed on meeting Jon is that he’s an assiduous note-taker—he studied journalism at university—and over the last year, he has inspired me to improve my note-taking processes.
The Moleskine Notebook One factor in my personal improvement in note-taking was James Bach’s recommendation of the Moleskine pocket notebook. I got my first one at the beginning of 2006, and I’ve been using it ever since. There are several form factors available, with soft or hard covers. The version I have fits in a pocket; it’s perfect-bound so it lies flat; it has a fabric bookmark and an elasticized loop that holds the book closed. The pages can be unlined, lined, or squared (graph paper)5. I prefer the graph paper; I find that it helps with sketching and with laying out tables of information.
3 Marshall McLuhan, Understanding Media: The Extensions of Man (Critical Edition). Gingko Press, Costa Madera, CA, September 2003. 4 See Kaner, Cem; Bach, James, and Pettichord, Bret, Lessons Learned in Software Testing. John Wiley & Sons, New York, 2002. 5 They can also be lined with five-line staff paper for musicians.
119

Figure 1: Page from Michael Bolton's Notebook #2
The Moleskine has a certain kind of chic/geek/boutique/mystique kind of appeal; it turns out that there’s something of a cult around them, no doubt influenced by their marketing. Each notebook comes with a page of history in several languages, which adds to the European cachet. The page includes the claim that the Moleskine was used by Bruce Chatwin, Pablo Picasso, Ernest Hemingway, Henri Mattisse, Andre Breton, and others who are reputed to have used the Moleskine. The claim is fictitious6, although these artists did use books of the same colour, form factor, with sewn bindings and other features that the new books reproduce. The appeal, for me, is that the books are well-constructed, beautiful, and inviting. This reminds me of Cem Kaner’s advice to his students: “Use a good pen. Lawyers and others who do lots of handwriting buy expensive fountain pens for a reason. The pen glides across the page, requiring minimal pressure to leave ink.”7 A good tool asks to be used.
Why Use Notebooks? In the age of the personal digital assistant (I have one), the laptop computer, (I have one), and the desktop computer (I have one), and the smart phone (I don’t have one), why use notebooks?
They’re portable, and thus easy to have consistently available. They never crash. They never forget to auto-save. The batteries don’t wear out, they don’t have to be recharged—and they’re never AA when you need AAA or AAA when you need AA. You don’t have to turn them off with your other portable electronic devices when the plane is taking off or landing.
Most importantly, notebooks are free-form and personal in ways that the “personal” computer cannot be. Notebooks afford diversity of approaches, sketching and drawing, different thinking styles, different note-taking styles. All Windows text editors, irrespective of their features, still look like Windows programs at some level. In a notebook, there’s little to no reformatting; “undo” consists of crossing out a line or a page and starting over or, perhaps more appropriately, of tolerating imperfection. When it’s a paper notebook, and it’s your own, there’s a little less pressure to make things look good. For me, this allows for a more free flow of ideas.
In 2005, James and Jonathan Bach presented a paper at the STAR West conference on exploratory
6 http://www.iht.com/articles/2004/10/16/mmole_ed3_.php 7 http://www.testingeducation.org/BBST/exams/NotesForStudents.htm
120

dynamics, skills and tactics. Michael Kelly led a session in which we further developed this list at Consultants’ Camp 2006.
Several of the points in this list—especially modeling, questioning, chartering, observing, generating and elaborating, abandoning and recovering, conjecturing, and of course recording and reporting—can be aided by the kinds of things that we do in notebooks: writing, sketching, listing, speculating, brainstorming, and journaling. Much of what we think of as history or scientific discovery was first recorded in notebooks. We see a pattern of writing and keeping notes in situations and disciplines where learning and discovery are involved. A variety of models helps us to appreciate a problem (and potentially its solution) from more angles. Thinking about a problem is different from uttering it, which is still different from sketching it or writing prose about it. The direct interaction with the ink and the paper gives us a tactile mode to supplement the visual, and the fact that handwriting is, for many people, slower than typing, may slow down our thought processes in beneficial ways. A notebook gives us a medium in which to record, re-model, and reflect. These are, in my view, essential testing skills and tactics.
From a historical perspective, we are aware that Leonardo was a great thinker because he left notebooks, but it’s also reasonable to consider that Leonardo may have been a great thinker at least in part because he used notebooks.
Who Uses Notebooks? Inventors, scientists, explorers, artists, writers, and students have made notebook work part of their creative process, leaving both themselves and us with records of their thought processes.
Leonardo da Vinci’s notebooks are among the most famous books in history, and also at this writing the most expensive; one of them, the Codex Leicester, was purchased in 1994 for $30.8 million by a certain ex-programmer from the Pacific Northwest8. Leonardo left approximately 13,000 pages of daily notes and drawings. I was lucky enough to see one recently—the Codex Foster, from the collection of the Victoria and Albert Museum.
8 Incidentally, the exhibit notes and catalog suggested that Leonardo didn’t intend to encrypt his work via the mirror writing for which he was so famous; he wrote backwards because he was left-handed, and writing normally would smudge the ink.
121

Figure 2: Leonardo da Vinci, The Codex Foster
As a man of the Renaissance, Leonardo blurred the lines between artist, scientist, engineer, and inventor9, and his notebooks reflect this. Leonardo collects ideas and drawings, but also puzzles, aphorisms, plans, observations. They are enormously eclectic, reflecting an exploratory outlook on the world. As such, his notebooks are surprisingly similar to the notebook patterns of exploratory testers described below, though none has consciously followed Leonardo’s paradigms or principles, so far as I know. The form factor is also startlingly similar to the smaller Moleskine notebooks. Obviously, the significance of our work pales next to Leonardo’s, but is there some intrinsic relationship between exploratory thinking and the notebook as a medium?
What Do I Use My Notebook For? I’ve been keeping three separate notebooks. My large-format book contains notes that I take during sessions at conferences and workshops. It tends to be tidier and better-organized. My small-format book is a ready place to record pretty much anything that I find interesting. Here are some examples:
Lists of things, as brainstorms or catalogs. My current lists include testing heuristics; reifications; and test ideas. These lists are accessible and can be added to or referenced at any time. This is my favorite use of the Moleskine—as a portable thinking and storage tool.
“Fieldstones” and blog entries. Collections of observations; the odd rant; memorable quotes; aphorisms. The term “fieldstone” is taken from Gerald M. Weinberg’s book Weinberg on Writing: The Fieldstone Method. In the book, Jerry uses the metaphor of the pile of stones that are pulled from the field as you clear it; then you assemble a wall or a building from the fieldstones.10 I collect ideas for articles and blog entries and develop them later.
9 How To Think Like Leonardo da Vinci 10 Weinberg, Gerald M., Weinberg on Writing: The Fieldstone Method.
122

Logs of testing sessions. These are often impromptu, used primarily to practice testing and reporting, to reflect and learn later, and to teach the process. A couple of examples follow below.
Meeting notes. He who controls the minutes controls history, and he who controls history controls the world.
Ultra-Portable PowerPoints. These are one-page presentations that typically involve a table or a diagram. This is handy for the cases in which I’d like to make a point to a colleague or client. Since the listener focuses on the data and on my story, and not on what Edward Tufte11 calls “chartjunk”, the portable PowerPoints may be more compelling than the real thing.
Mind maps and diagrams. I use these for planning and visualization purposes. I need to practice them more. I did use a mind map to prepare this presentation.
Notes collected as I’m teaching. When a student does something clever during a testing exercise, I don’t want to interrupt the flow, but I do want to keep track of it so that I can recount it to the class and give recognition and appreciation to the person who did it. Moreover, about half the time this results in some improvement to our course materials12, so a notebook entry is very handy.
Action items, reminders, and random notes. Sometimes the notebook is the handiest piece of paper around, so I scribble something down on a free page—contact names (for entry later), reminders to send something to someone; shopping lists.
Stuff in the pocket. I keep receipts and business cards (so I don’t lose them). I also have a magic trick that I use as a testing exercise that fits perfectly into the pocket.
I try to remember to put a title and date on each page. Lately I’ve been slipping somewhat, especially on the random notes pages.
I’ve been using a second large-format notebook for notes on books that I’m studying. I haven’t kept this up so well. It’s better organized than my small format book, but my small format book is handy more often, so notes about books—and quotes from them—tend to go in that.
I’m not doing journaling, but the notebooks seem to remind me that, some day, I will. Our society doesn’t seem to have the same diary tradition as it used to; web logs retrieve this idea. Several of my colleagues do keep personal journals.
How Do Other Exploratory Testers Use Notebooks? I’ve done a very informal and decidedly unscientific survey of some of my colleagues, especially those who are exploratory testers.
11 Tufte, Edward, Envisioning Information. Graphics Press, Chesire, Connecticut, 1990. 12 Bach, James, and Bolton, Michael, Rapid Software Testing. http://www.satisfice.com/rst.pdf.
123

Adam White reports, “My notebook is my life. It's how I keep track of things I have to do. It supplements my memory so that I don't waste brain power on remembering to remember something. I just record it and move on.
“I have found a method of taking notes that brings my attention to things. If someone tells me about a book then I will write "Book" and underline it twice. Then when flipping back through my notes I can see that I have a reference to a book that I thought was interesting at some point in time. I use this process for other things like blogs, websites, key ideas, quotes etc. It makes organizing information after the fact very easy.”
Adam reports similar experiences to my own in how he came to use Moleskines. He too observed Jon Bach and James Bach using Moleskine notebooks; he too uses a selection of books—one large-form for work, one large-form for personal journaling, and a small one for portability and availability. He also says that the elastic helps to prevent him from losing pens.
Jonathan Kohl also reports that he uses notebooks constantly. “My favorite is my Moleskine, but I also use other things for taking notes. With my Moleskine, I capture test ideas; article ideas; diagrams or models I am working on for articles; teaching materials, or some other reason for an explanation to others; and testing notes13. I have a couple of notes to help focus me, and the rest are ideas, impressions, and the starred items are bugs. I translated the bugs into bug reports in a fault tracking system, and the other notes into a document on risk areas. For client work, I don't usually use my Moleskine for testing, since they may want my notes.” This is an important point for contractors and full-time employees; your notebook may be considered a work product—and therefore the property of your company—if you use it at work, or for work.
“I also use index cards (preferably post-it note index cards), primarily for bug reports,” continues Jonathan. “My test area is often full of post-its, each a bug, at the end of a morning or afternoon testing session. Over time, I arrange the post-its according to groups, and log them into a bug tracker or on story cards (if doing XP.) When I am doing test automation/test toolsmith work, I use story cards for features or other tasks, and others for bugs.”
Jonathan also uses graph-paper pads for notes that he doesn't need to keep. They contain rough session and testing notes; diagrams, scrawls, models, or things that he is trying to understand better; analysis notes, interview points, and anything else he’s interested in capturing. “These notes are illegible to most people other than me, and I summarize them and put what is needed into something more permanent.” This is also an important point about documentation in general: sometimes documentation is a product—a deliverable, or something that you show to or share with someone else. At other times, documentation is a tool—a personal aid to memory or thought processes.
“I worked with engineers a lot starting out, so I have a black notebook that I use to record my time and tasks each day. I started doing this as an employee, and do it as a consultant now as well.”
Fiona Charles also keeps a project-specific notebook. She uses a large form factor, so that it can accommodate 8½ x11 pages pasted into it. She also pastes a plastic pocket, a calendar, and loose notes from pre-kickoff meetings—she says that a glue stick is an essential part of the kit. In the
13Jonathan provides an example at http://www.kohl.ca/articles/ExploratoryTesting_MusicofInvestigation.pdf
124

notebook, she records conversations with clients and others in the project community. She uses clear termination line for dates, sets of notes, and “think pages.”
Jerry Weinberg also uses project notebooks. On the first page, he places his name, his contact information, and offer of a reward for the safe return of the book. On the facing page, he keeps a list of contact info for important people to the project. On the subsequent pages, he keeps a daily log from the front of the book forwards. He keeps a separate list of learnings from the back of the book backward, until the two sections collide somewhere in the middle; then he starts a new book. “I always date the learnings,” he says. “In fact, I date everything. You never know when this will be useful data.” Like me, he never tears a page out.
Jerry is also a strong advocate of journaling14. For one thing, he treats starting journaling—and the reader’s reaction to it—as an exercise in learning about effecting change in ourselves and in other people. “One great advantage of the journal method,” he says, “is that unlike a book or a lecture, everything in it is relevant to you. Because each person’s learning is personal, I can’t you what you’ll learn, but I can guarantee that you’ll learn something.” That’s been my experience; the notebook reflects me and what I’m learning. It’s also interesting to ask myself about the things, or kinds of things, that I haven’t put it.
Jon Bach reports that he uses his notebooks in several modes. “‘Log file’, to capture the flow of my testing; ‘epiphany trap’, to capture "a ha!" moments (denoted by a star with a circle around it); diagrams and models—for example, the squiggle diagram when James and I first roughed out Session-Based Test Management; to-do lists—lots and of lots them, which eventually get put into Microsoft Outlook's Task Manager with a date and deadline—reminders, flight, hotel, taxi info when traveling, and phone numbers; quotes from colleagues, book references, URLs; blog ideas, brainstorms, ideas for classes, abstracts for new talks I want to do; heuristics, mnemonics; puzzles and their solutions (like on a math exam that says "show your work"); personal journal entries (especially on a plane); letters to my wife and child -- to clear my head after some heinous testing problem I might need a break from.”
Jon also identifies as significant the paradigm “‘NTSB Investigator.’ I'll look back on my old notes for lost items to rescue—things that are may have become more important than when I first captured them because of emergent context. You would never crack open the black box of an airplane after a successful flight, but what if there was a systemic pattern of silent failures just waiting to culminate in a HUGE failure? Then you might look at data for a successful flight and be on the lookout for pathologies.”
Example: An Impromptu Exploratory Testing Session I flew from Delhi to Amsterdam. I was delighted to see that the plane was equipped with a personal in-flight entertainment system, which meant that I could choose my own movies or TV to watch. As it happened, I got other entertainment from the system that I wouldn’t have predicted.
The system was menu-driven. I went to the page that listed the movies that were available, and after scrolling around a bit, I found that the “Up” button on the controller didn’t work. I then inspected the controller unit, and found that it was cracked in a couple of places. Both of the
14 Becoming a Technical Leader, pp. 80-85
125

cracks were associated with the mechanism that returned the unit, via a retractable cord, to a receptacle in the side of the seat. I found that if I held the controller just so, then I could get around the hardware—but the software failed me. That is, I found lots of bugs. I realized that this was an opportunity to collect, exercise, and demonstrate the sorts of note-taking that I might perform when I’m testing a product for the first time. Here are the entries from my Moleskine, and some notes about my notes.
When I take notes like this, they’re a tool, not a product. I don’t expect to show them to anyone else; it’s a possibility, but the principal purposes are to allow me to remember what I did and what I found, and to guide a discussion about it with someone who’s interested.
I don’t draw well, but I’m slowly getting better at sketching with some practice. I find that I can sketch better when I’m willing to tolerate mistakes.
In the description of the red block, at the top of the left page, I failed to mention that this red block appeared when I went right to the “What’s On” section after starting the system. It didn’t reproduce.
126

Whenever I look back on my notes, I recognize things that I missed. If they’re important, I write them down as soon as I realize it. If they’re not important, I don’t bother. I don’t feel bad about it either way; I try always to get better at it, but testers aren’t omniscient. Note “getting sleepy”—if I keep notes on my own mental or emotional state, they might suggest areas that I should revisit later. One example here: on the first page of these notes, I mentioned that I couldn’t find a way to contact the maker of the entertainment system. I should have recognized the “Feedback” and “Info” menu items, but I didn’t; I noticed them afterwards.
After a few hours of rest, I woke up and started testing again.
Jon Bach recently pointed out to me that, in early exploration, it’s often better to start not by looking for bugs, but rather by trying to build a model of the item under test. That suggests looking for the positives in the product, and following the happy path. I find that it’s easy for me to fall into the trap of finding and reporting bugs. These
notes reflect that I did fall into the trap, but I also tried to check in and return to modeling from time to time. At the end of this very informal and completely freestyle session, I had gone a long way towards developing my model and identifying various testing issues. In addition, I had found many irritating bugs.
Why perform and record testing like this? The session and these notes, combined with a discussion with the project owner, might be used as the first iteration in the process of determining an overall (and perhaps more formal) strategy for testing this product. The notes have also been a useful basis for my own introspection and critique
127

of my performance, and to show others some of my though process through an exploratory testing session.
A More Formal Structure for Exploratory Testing Police forces all over the world use notebooks of some description, typically in a way that is considerably more formalized. This is important, since police notebooks will be used as evidence in court cases. For this reason, police are trained and required to keep their notebooks using elements of a more formal structure, including time of day; exact or nearest-to location; the offence or occurrence observed; the names and addresses of offenders, victims or witnesses; action taken by the officer involved (e.g. arrests), and details of conversations and other observations. (The object of the exercise here is not to turn testers into police, but to take useful insights from the process of more formal note-taking.)
How can we help to make testing similarly accountable? Session-Based Test Management (SBTM), invented by James and Jonathan Bach in 2000 is one possible answer. SBTM has as its hallmark four elements:
CharterTime Box Reviewable Result Debriefing
The charter is a one- to three-sentence mission for a testing session. The charter is designed to be open-ended and inclusive, prompting the tester to explore the application and affording opportunities for variation. Charters are not meant to be comprehensive descriptions of what should be done, but the total set of charters for the entire project should include everything that is reasonably testable.
The time box is some period of time between 45 minutes and 2 ¼ hours, where a short session is one hour (+/- 15 minutes), a long session is two, and a normal session is 90 minutes. The intention here is to make the session short enough for accurate reporting, changes in plans (such as a session being impossible due to a broken build, or a session changing its charter because of a new priority), but long enough to perform appropriate setup, to get some good testing in, and to make debriefing efficient. Excessive precision in timing is discouraged; anything to the nearest five or ten minutes will do. If your managers, clients, or auditors are supervising you more closely than this,
The reviewable result takes the form of a session sheet, a page of text (typically ASCII) that follows a formal structure. This structure includes:
CharterCoverage areas (not code coverage; typically product areas, product elements, quality criteria, or test techniques) Start Time Tester Name(s) Time Breakdown
session duration (long, normal, or short)
128

test design and execution (as a percentage of the total on-charter time) bug investigation and reporting (as a percentage of the total on-charter time) session setup (as a percentage of the total on-charter time) charter/opportunity (expressed as a percentage of the total session, where opportunity time does not fit under the current charter, but is nonetheless useful testing work)
Data Files Test Notes Bugs (where a “bug” is a problem that the tester and the test manager reasonably believe represents a threat to the value of the product) Issues (where an “issue” is a problem that threatens the value of the testing process—missing information, tools that are unavailable, expertise that might be required, questions that the tester might develop through the course of the session)
There are two reasons for this structure. The first is simply to provide a sense of order and completeness for the report and the debrief. The second is to allow a scripting tool to parse tagged information from the session sheets, such that the information can be sent to other applications for bug reporting, coverage information, and inquiry-oriented metrics gathering. The SBTM package, available at http://www.satisfice.com/sbtm, features a prototype set of batch files and Perl scripts to perform these tasks, with output going to tables and charts in an Excel spreadsheet.
The debrief is a conversation between the tester15 who performed the session and someone else—ideally a test lead or a test manager, but perhaps simply another tester. In the debrief, the session sheet is checked to make sure that it’s readable and understandable; the manager and the tester discuss the bugs and issues that were found; the manager makes sure that the protocol is being followed; and coaching, mentoring, and collaboration happen. A typical debrief will last between five to ten minutes, but several things may add to the length. Incomplete or poorly-written session sheets produced by testers new to the approach will prompt more questions until the tester learns the protocol. A highly complex or risky product area, a large number of bugs or issues, or an unfamiliar product may also lead to longer conversations.
Several organizations have reported that scheduling time for debriefings is difficult when there are more than three or four testers reporting to the test manager or test lead, or when the test manager has other responsibilities. In such cases, it may be possible to have the testers debrief each other.
At one organization where I did some consulting work, the test manager was also responsible for requirements development and business analysis, and so was frequently unavailable for debriefings. The team chose to use a round-robin testing and debriefing system. For a given charter, Tester A performed the session, Tester B debriefed Tester A, and at regression testing time, Tester C took a handful of sheets and used them as a point of departure for designing and executing tests. For the next charter, Tester B performed the testing, Tester C the debrief, and Tester A the regression; and so forth. Using this system, each tester learned about the product and shared information with others by a variety of means—interaction with the product, conversation in the debrief, and written session sheets. The entire team reported summaries of
15 Or “testers”; SBTM can be used with paired testers.
129

the debriefings to the test manager when he was not available, and simply debriefed directly with him when he was.
Two example session sheets follow. The first is an account of an early phase of exploratory testing, in which the testers have been given the charter to create a test coverage outline and a risk list. These artifacts themselves can be very useful, lightweight documents that help to guide and assess test strategy. Here the emphasis is on learning about the product, rather than searching for bugs.
The second is an account of a later stage of testing, in which the tester has sufficient knowledge about the product to perform a more targeted investigation. In this session, he finds and reports several bugs and issues. He identifies moments at which he had new test ideas and the motivations for following the lines of investigation.
130
Example: Session Sheet for a Reconnaissance Session
Sessions in which 100% of the time is spent on test design and execution are rare. This reconnaissance session is an exception; the focus here is on learning, rather than bug-finding.
SBTM lends itself well to paired testing. Two sets of eyes together often find more interesting information—and bugs—than two sets of eyes on their own.
Any data files generated or used during the session—in the form of independent reports, program input or output files, screen shots, and so on—get stored in a directory parallel to the library of session sheets.
Test coverage is not merely code coverage. Functional areas, platforms, data, operations, and test techniques, are only a few ways to model the test space; the greater the number and variety of models, the better the coverage.
A test coverage outline is a useful artifact with which to guide and assess a test strategy (the set of ideas that guide your test design), especially one which we’re using exploratory approaches. A test coverage outline can be used as one of the inputs into the design of session charters.
131

A risk list is another useful tool to help guide a test strategy. The risk list can be as long or as short as you like; it can also be broken down by product or coverage areas.
“Issues” are problems that threaten the value of the testing process. Issues may include concerns, requests for missing information, a call for tools or extra resources, pleas for testability. In addition, if a tester is highly uncertain whether something is a bug, that can be reported here.
132

Example: Session Sheet for a Bug-Finding Session
Information generated from the session sheets can be fed back into the estimation process.
First, we’ll cast a set of charters representing the coverage that we’d like to obtain in a given test cycle. (Let’s say, for this example, 80 charters). Second, we’ll look at the number of testers that we have available. (Let’s say 4.) Typically we will project that a tester can accomplish three sessions per day, considering that a session is about 90 minutes long, and that time will be spent during the day on email, meetings, breaks, and the like. We must also take into account the productivity of the testing effort. Productivity is defined here the percentage of the tester’s time spent, in a given session, on coverage—that is, on test
A single session can cover more than one functional area of the product. Here the testers obtain coverage on both the QuickBuild wizard and the report generator
The goal of any testing session is to obtain coverage—test design and execution, in which we learn good and bad things about the product. Bug investigation (learning things about a particular bug) and setup (preparing to test), while valuable, are interruptions to this primary goal. The session sheet tracks these three categories as inquiry metrics—metrics that are designed to prompt questions, rather than to drive decisions. If we’re doing multiple things at once, we report the highest-priority activity first; if it happens that we’re testing as we’re investigating a bug or setting up, we account for that as testing.
Test notes tend to be more valuable when they include the motivation for a given test, or other clues as to the tester’s mindset. The test notes—the core of the session sheet—help us to tell the testing story: what we tested, why we tested it, and why we believe that our testing were good enough.
133

design and execution. Bug investigation is very important, but it reduces the amount of coverage that we can obtain about the product during the session. It doesn’t tell us more about the product, even though it may tell us something useful about a particular bug.Similarly, setup is important, but it’s preparing to test, rather than testing; time spent on setup is time that we can’t spend obtaining coverage. (If we’re setting up and testing at the same time, we account for this time as testing. At the very beginning of the project, we might estimate 66% productivity, with the other third of the time spent on setup and bug investigation. This gives us our estimate for the cycle:
80 charters x .66 productivity x 4 testers x 3 sessions per day = 10 days
Exploratory testing, by intention, reduces emphasis on specific predicted results, in order to reduce the risk of inattentional blindness. By giving a more open mandate to the tester, the approach affords better opportunities to spot unanticipated problems.
New test ideas come up all the time in an exploratory testing session. The tester is empowered to act on them right away.
“Opportunity” work is testing done outside the scope of the current charter. Again, testers are both empowered and encouraged to notice and investigate problems as they find them, and to account for the time in the session sheet.
“Some options” might be vague here; more likely, based on our knowledge of the tester, the specific options are be unimportant, and thus it might be wasteful and even misleading to provide them. The tester, the test manager, and product team develop consensus through experience and mentoring on how to note just what’s important, no less and no more.
The #BUG tag allows a text-processing tool to transfer this information to a master bug list in a bug tracking system, an ASCII file, or an Excel spreadsheet.
134

When new information comes in—often in the form of new productivity data—we change one or more factors in the estimate, typically by increasing or decreasing the number of testers, increasing or reducing the scope of the charters, or shortening or lengthening the cycle.
Some questions have been raised as to whether exploratory approaches like SBTM are acceptable for high-risk or regulated industries. We have seen SBTM used in a wide range of contexts, including financial institutions, medical imaging systems, telecommunications, and hardware devices.
Some also question whether session sheets meet the standards for the accountability of bank auditors. One auditor’s liaison with whom I have spoken indicates that his auditors would not be interested in the entire session sheet; instead, he maintained, “What the auditors really want to
Listing all of the possible expectations for a given test is impossible and pointless; listing expectations that have been jarred by a probable bug is more efficient and more to the point.
A step-by-step sequence to perform a test leads to repetition, where variation is more likely to expose problems. A step-by-step sequence to reproduce a discovered problem is more valuable.
135

see is the charter, and they want to be sure that there’s been a second set of eyes on the process.They don’t have the time or the inclination to look at each line in the Test Notes section.”
ConclusionNotebooks have been used by people in the arts, sciences, and skilled professions for centuries. Many exploratory testers may benefit from the practice of taking notes, sketching, diagramming, and the like, and then using the gathered information for retrospection and reflection.
One of the principal concerns of test managers and project managers with respect to exploratory testing is that it is fundamentally unaccountable or unmanageable. Yet police, doctors, pilots, lawyers and all kinds of skilled professions have learned to deal with problem of reporting unpredictable information in various forms by developing note-taking skills. Seven years of positive experience with session-based test management suggests that it is a useful approach, in many contexts, to the process of recording and reporting exploratory testing.
Thanks to Launi Mead and Doug Whitney for their review of this paper.
136

Agile Quality Management with
CMMI-DEV and Scrum
Authors
Andreas Schliep
SPRiNT iT Gesellschaft für Lösungen mbH
Andreas Schliep is a Certified Scrum Practitioner. He works as a passionate Scrum Coach and
retrospective facilitator for SPRiNT iT, Ettlingen/Germany. He has 8 years of leadership experience as a
team and group leader. His development experience is based on projects in the field of video
conferencing, VoIP and instant messaging, focusing on C++, Java, databases and network protocols.
Boris Gloger
SPRiNT iT Gesellschaft für Lösungen mbH
Boris Gloger has been implementing Scrum since 2003. He became a Certified Scrum Trainer in 2004.
He organized the first Scrum Gathering in Vienna in 2004 and the Retrospective Facilitator Gathering
2006, in Baden-Baden. Boris Gloger leads Scrum implementations and is a SPRiNT-iT partner.
Abstract
Agile processes are becoming increasingly popular as they promise frequent deliveries of working code.
Traditional Quality Management methods appear to be old fashioned and not suitable for this new era of
self-organizing teams, emergent systems and empirical project management. Engineering practices like
Test Driven Development propose high quality code without the need of extensive test phases between
coding and release.
Yet Quality Management is a field of high expertise and specialization just like system development or
database administration. Its practices and measures have been developed to cope with a variety of failure
reasons and conditions. Some of them have been incorporated into internationally accepted standards
and best practices collections like ISO 9001, Capability Maturity Model Integrated, or ISO 15504
(Software Process Improvement and Capability Determination / SPICE.
There are many opportunities being explored today. More and more companies start using agile
processes to cope with stagnant projects and missed deadlines. Many of them are asking about a way to
keep or gain a high organizational maturity level in this new situation. Some already managed to
implement process frameworks like Scrum in organizations on CMMI Level 3 and higher. We will
demonstrate that Scrum fits well into a corporate Quality Management strategy based on systematic
process improvement.
Keywords
Agile, Quality Management, Process Improvement, Scrum, XP, CMMI
Copyrights
CMMI, CMM, and Capability Maturity Model are registered in the U.S. Patent and Trademark Office.
CMM Integration, SCAMPI, and IDEAL are service marks of Carnegie Mellon University.
137

1 Introduction
In God we trust – all others bring data.
W. Edwards Deming
Agile process management methodologies are often considered too immature and not suitable to comply
with process improvement and quality management goals. However, we and other Scrum (1) trainers and
coaches have worked with a couple of Fortune 500 companies. They have started using Scrum and
related processes to improve the quality of their products and the reliability of their deliveries.
We have discussed the top issues of project management with process improvement experts, QA
engineers, testers and consultants. They all identified the same problem areas:
• Requirements
• Communication
• Resources
• Quality
Late completion of the requirements specification, late involvement of quality assurance and the poor
execution of quality control contribute to the difficulties in these areas. Agile approaches promise to
handle the different problem areas through a new set of values, principles and roles. They promise more
flexibility and customer interaction. In this scenario requirements should emerge together with the system
in the course of the project. Teams are given room to organize themselves and improve both their
process and practices.
Nevertheless, we have experienced so called agile implementations that have resulted in more trouble
and quality issues than working code. After we performed retrospectives with the affected teams, we
found out that they shared a huge misconception about the implementation of agile methods. They
focused on the delivery of features and neglected the necessary practices to ensure the quality of the
output. They did not understand that agility is not an excuse for a lack of discipline. What was missing?
In fact, we discovered a lack of knowledge about quality management basics and elementary engineering
practices in small companies – actually the opposite of the misconceptions about agile we found in
organizations familiar with heavy-weight processes. So we decided to look for approaches that would help
both sides to understand the power of an agile mindset together with a core understanding of process
improvement. We took a closer look at Capability Maturity Management Integrated for Development
(CMMI-DEV) (3) and Software Process Improvement and Capability Determination (SPICE) (5). This led
us to rediscover quality management and capability and maturity models, to see them in the light of the
agile goals. And we were surprised by their compatibility. The Scrum process is powerful enough to
comply with most of the goals and practices stated in CMMI-DEV.
2 Quality Management and Agile Methods
Quality is such an attractive banner that sometimes we think
we can get away with just waving it, without doing the hard work necessary to achieve it.
Miles Maguire
The international quality management core standard ISO 9001:2000 (4) states 8 quality management
principles:
1) Customer Satisfaction
138

2) Leadership
3) Involvement of People
4) Process Approach
5) System Approach to Management
6) Continual Improvement
7) Factual Approach to Decision Making
8) Mutually Beneficial Supplier Relationships
Capability Maturity Model™ Integration for Development (CMMI-DEV) (3) and the exemplary process
assessment model ISO-15504-5 (1) –referred to as Software Process Improvement and Capability
Determination (SPICE) - were designed with these intentions in mind. A quality management (QM)
department can compare the current process implementations with the goals and practices in the model.
Shortcomings can be identified, appropriate measures planned, executed and reviewed. The best
practice collection would give suggestions on how the processes could be enhanced in order to achieve a
higher capability level.
The presence of best practices in CMMI™ and ISO 15504-5 helps internal and independent appraisers or
assessors to get an overview about a particular organization’s process landscape. Yet they might distract
the observer from the goals behind them. This is the main reason for the difficulties CMMI™ appraisers or
SPICE assessors are facing when it comes to agile processes.
• ISO 15504-5 is based on the process reference model (PRM) ISO 12207 – which describes a
number of practices and work products that might not be present in agile processes. SPICE
assessments allow for no separation between goals and practices: “Evidence of performance of
the base practices, and the presence of work products with their expected work product
characteristics, provide objective evidence of the achievement of the purpose of the process.” (1)
• CMMI appears to be more flexible than SPICE regarding the fulfillment of specific practices. The
practices listed can be interpreted as expectations, not prescriptions : “Before goals can be
considered satisfied, either the practices as described, or acceptable alternatives to them, are
present in the planned and implemented processes of the organization.” (3)
While it is certainly not impossible to figure out an agile SPICE implementation, we have heard about the
difficulties. Luckily, we do not need a new model for Scrum and XP to be able to incorporate it into our
quality management strategy with CMMI. We found out that we basically have to take a closer look at the
goals. Are they fulfilled by Scrum? How are they fulfilled? A mapping of Scrum practices to CMMI
practices can provide a deeper understanding – while there still might be gaps to fill.
Agility and quality management are no contradictions but necessary companions to improve an
organization’s processes and lead it towards higher maturity. We want to demonstrate this through an
example based on the experiences with some of the companies we’ve worked with recently.
3 Scenario: Scrum Enterprise Transition Project
A journey of thousand miles begins with a single step.
Confucius
A Web portal company - SAMPLE Co. - wants to speed up their development processes without suffering
quality tradeoffs. SAMPLE Co. has grown from a dozen to several hundred employees in just a few years.
The software development process is phase oriented, yet there are numerous shortcuts and workarounds
to deal with the growing quality problems. SAMPLE Co. wants to change this situation.
139

The development managers pick Scrum as a promising process framework. But how can they determine
whether the new processes are an improvement compared to their current situation? The Capability
Maturity Model Integrated CMMI-DEV 1.2 offers a catalog of capability goals that could be held against
the results of the Scrum implementation. The challenge is to figure out how it is possible to implement
Scrum in a controlled way. CMMI appraisers should be able to evaluate the actual process capability
levels.
3.1 Staging
The initial project phase consists of an Agile Readiness Assessment and a subsequent Scrum pilot
implementation. A couple of software teams at SAMPLE Co. are introduced into the Scrum methodology.
External Scrum Masters work with business people and developers to gather experiences with the new
approach. Appraisers trained in the Standard CMMI Appraisal Method for Process Improvement
(SCAMPI) are brought into the project.
The Rollout Plan for Agile Software Process Improvement is demonstrated at SAMPLE Co. Based on
dialogues with the SCAMPI appraisers, an enterprise transition project roadmap with combined CMMI
and Scrum approaches is produced.
This project resembles the Scrum process model for enterprise environments (9). It is based on Scrum
with the addition of processes to meet special organizational needs. Based on the model and following
the process, a project roadmap and a project structure are built.
The chart (Agile Transition Project Structure) describes the setup of the process improvement steering,
the process implementation team and the scrum / development teams.
The Process Improvement Steering Committee is responsible to guide the process implementation
team by providing a clear vision and the support through the organization.
The Process Implementation Team is responsible to implement the change. It will be led by a change
manager. The change manager will organize the change throughout the organization by setting up the
process implementation team. He/she will develop the overall project plan in alignment with the process
improvement steering. The process implementation team will guide the work of the project teams.
The Development Scrum Teams will work according to the standard process that the process
implementation team will develop - based on the experiences of the development teams. They will have
the responsibility to give feedback to the process implementation team in order to guide the development
of standard process.
The overall implementation approach will be to run this project as a Scrum project. The project leader of
this project is supposed to have experience with Scrum in a CMMI context or vice versa.
140

Figure 1 : Agile Transition Project Structure
3.2 The Process Framework: Scrum and XP for Software
Development
The main two practices I introduce to a new team are Continuous Integration and Testing. And Testing.
Bas Vodde, Certified Scrum Trainer
Unlike heavyweight process methodologies, the Scrum framework itself does not mention any specific
engineering practices. It deals with the management of projects, not with the particular steps of
development or production. Unlike eXtreme Programming (9), Scrum embraces any practice that is
Process
Implementation
Project Charter &
Roadmap
Strategic Process
Implementation
Backlog
Sprint Backlogs
Process Improvement Steering
Committee
Process Implementation Team
Development Scrum Teams
141
suitable to reach the goals of the project. This circumstance might lead to the misconception that the
explicit introduction of engineering and quality management practices is not necessary. The lack of
suitable engineering practices – whether agile or traditional – is one of the major problems in new Scrum
implementations.
So, how is it possible for an organization to comply to CMMI if it uses Scrum? Most of the current CMM /
CMMI Level 2 or higher appraised organizations using Scrum have accomplished their goal with the
integration of XP engineering practices. In fact, Scrum and XP – sometimes called XP@Scrum™ – is a
powerful and widely used combination.
The XP engineering practices are an agile interpretation of commonly accepted best practices for
software engineering. There are several versions of the set available. We will refer to the most widely
accepted version of the XP core practices as published in the 2nd
edition of “eXtreme Programming
Explained” (9).
Category / XP Practice Explicit Coverage by Scrum Practice Process
Improvement
Fine Scale Feedback Test
Pair Programming
Planning Game Release and Sprint planning
Test Driven Development
Whole Team Cross-functional teams
Continuous Process
Continuous Integration
Design Improvement
Small Releases Fixed length Sprints
Shared Understanding
Coding Standard
Collective Code Ownership
Simple Design
System Metaphor
Programmer Welfare
Sustainable Pace Team Estimates
Retrospectives
Figure 2 : XP Practice Coverage by Scrum
While other applicable engineering practices probably fit into the Scrum framework, the software
engineering practices of XP completely comply with the values and principles of Scrum.
3.3 Enterprise Scrum Implementation and Appraisal Roadmap
Scrum implementation activities and SCAMPI appraisals are brought together in a common roadmap.
Ideally, it should be possible to reach CMMI-DEV Maturity Level 3 with Scrum in about three years,
possibly even less – provided the entire company is not too resistant to follow the new ways. This
142

approach could be considerably faster than typical CMMI implementations that take roughly two years per
level.
The following chart illustrates such a high level combined roadmap with initial steps.
Phase 0 Phase 1 Phase 2 Phase 3
Start x 1 yr x+1yr 1yr x+2yrs 1yr x+3yrs
Set up the project-
team, get funding
and start the first
pilot projects.
Get a CMMI-DEV
Level 2 certificate
for Software
Development
based on agile
software
development
processes
Transition from
CMM-DEV Level 2
to Level 3. All
process
implementation
teams work based
on the common
methodology
Get a CMMI-DEV
Level 3 Certificate
based on agile
management
processes
Figure 3 : Scrum and CMMI Implementation Roadmap (Extract)
The roadmap contains two SCAMPI appraisals. It should be possible to perform the first SCAMPI
appraisal after the first year of the Scrum implementation. The organization should be able to reach
Maturity Level 2 with Scrum then. A second appraisal is planned for the end of the third year. The
transition from CMMI-DEV Level 2 to Level 3 is considerably harder than the transition up to Level 2. We
have to deal with more process areas that are not explicitly covered by Scrum/XP. The next section -
Scrum CMMI-DEV Process Area Coverage - provides an overview of the process areas and their
possible coverage. The Appendix A: Exemplary Mapping of CMMI-DEV 1.2 Practices to Scrum/XP –
shows a possible detailed mapping of CMMI-DEV practices by Scrum.
4 Scrum CMMI-DEV Process Area Coverage
Scrum is no Silver Bullet
Ken Schwaber
Scrum is suitable for a lot of project management and planning activities. It is focused on the delivery of
business value and quality. Through the simplicity of Scrum, it can be introduced very quickly. Yet there
are several process areas that need to be treated individually. CMMI-DEV helps to fill the gaps, enabling
organizations in transition to define adequate agile process implementations.
4.1 Generic Goals
A process framework that does not meet CMMI-DEV Generic Goals will surely not be able to withstand an
examination regarding its compliance to the Specific Goals (SG) and Practices (SP) within the different
143

process areas. Yet a Scrum process implementation is capable of meeting even the Optimizing Level
through its inspect and adapt cycles. Scrum and custom metrics can be introduced to manage the
process quantitatively over the time and identify shortcomings in the process implementation. Scrum
project outputs can be measured in a couple of ways. One actual measure for process performance could
be the acceptance percentage – the ratio of deliverables that passed the acceptance criteria versus the
team commitment. Scrum incorporates empirical process adjustment, using frequent retrospectives to
adopt lacking practices and identifying issues that block the particular team. The effects of any adjustment
to the process implementation can be compared to previous adjustments.
4.2 Process Areas
The Scrum process framework is suitable for almost any activity related to creative work, including
software development, system design and organizational development. However, there are some process
areas of CMMI-DEV Version 1.2 which are not explicitly covered by Scrum. The following table helps to
identify those areas, assuming a certain interpretation of Scrum Enterprise implementation practices in
addition to the Scrum Framework. CMMI-DEV 1.2 process areas are listed with their groups and maturity
levels. The Scrum Framework Coverage indicates how much Scrum as a defined process framework can
be applied to the specific process area.
The meanings of the coverage attributes for Scrum are:
• A defined coverage means that the guidelines about how to apply Scrum to reach the goals of a
specific process area are explicitly defined in Scrum.
• An applicable coverage indicates that Scrum can be used to introduce and manage practices
which are not explicitly defined in Scrum.
• A partly applicable coverage is assumed for process areas where Scrum can be used to cover
part of the required goals.
• Demanded by Scrum means that the practices of this process area are a necessary prerequisite
for Scrum processes.
CMMI-DEV
Process Area
CMMI-DEV Group CMMI
Maturity
Level
Scrum Framework
Coverage
Configuration Management (CM) Support 2 demanded by Scrum
Measurement and Analysis (MA) Support 2 defined
Process and Product Quality Assurance
(PPQA)
Support 2 applicable
Project Monitoring and Control (PMC) Project Management 2 defined
Project Planning (PP) Project Management 2 defined
Requirements Management (REQM) Engineering 2 defined
Supplier Agreement Management (SAM) Project Management 2 partly applicable
144

Decision Analysis and Resolution (DAR) Support 3 partly applicable
Integrated Project Management +IPPD
(IPM+IPPD)1
Project Management 3 defined
Organizational Process Definition +IPPD
(OPD+IPPD)6
Process Management 3 applicable - see (9)
Organizational Process Focus (OPF) Process Management 3 partly applicable
Organizational Training (OT) Process Management 3 required by Scrum
Product Integration (PI) Engineering 3 required by Scrum
Requirements Development (RD) Engineering 3 applicable
Risk Management (RSKM) Project Management 3 applicable
Technical Solution (TS) Engineering 3 defined – combined
with XP Engineering
Practices (9)
Validation (VAL) Engineering 3 applicable
Verification (VER) Engineering 3 applicable
Organizational Process Performance
(OPP)
Process Management 4 defined
Quantitative Project Management (QPM) Project Management 4 applicable
Causal Analysis and Resolution (CAR) Support 5 partly applicable
Organizational Innovation and
Deployment (OID)
Process Management 5 partly applicable
Figure 4 : Applicability of Scrum for CMMI-DEV 1.2 Process Areas
For a closer look at any particular process area, see Appendix A.
5 Conclusion
I have made this letter longer than usual, only because I have not had the time to make it shorter.
Blaise Pascal
CMMI-DEV is a very good means to determine whether the new process implementations really brought
improvements – measured in a higher capability or maturity. It is possible to cover most of the CMMI-DEV
1.2 process areas with processes based on the Scrum framework. CMMI-DEV Appraisals for Scrum
companies might be easier or harder than typical appraisals. They are definitely different.
Moreover, the agile approach can help organizations to quickly find a path out of their daily chaos, without
a big portion of the massive overhead brought by heavy-weight processes. Scrum is a suitable method for
process improvement itself. Any enterprise can take the challenge and reengineer their process
landscape, using a process implementation backlog and a Scrum process.
1
This process area has "+IPPD" after its name because it contains a goal and practices that are specific to IPPD. The
material specific to IPPD is called an "IPPD addition." All process areas with IPPD additions have "+IPPD" after
their name.
145

Scrum /XP Benefits for CMMI Implementations CMMI Benefits for Scrum Implementations
Focus on important values Helps to produce a complete agile practice set
for ENG
Focus on team Address organizational learning and support
Result driven Address leadership
Business value driven Institutionalization
Explicit promotion of values for every single
participant
Address organizational support
Figure 5 : Mutual Benefits for CMMI-DEV and Scrum
We must admit that the described approach to achieve a sound quality management through the
transition to mature agile processes appears to be quite ambitious and challenging. Whether an
organization wants to prove or improve their maturity using an agile approach in combination with CMMI –
they will need to be ready for the dialogue and courageous enough to face the challenges. Scrum is very
suitable for the creation of a communicative, creative and constructive environment.
The mapping tables in Appendix A are meant to work as examples for possible process introduction or
appraisal considerations.
6 Bibliography
(1) Agile Alliance Website, http://www.agilealliance.org
(2) Certifying for CMMI Level 2 and ISO 9001 with XP@Scrum,
http://ieeexplore.ieee.org/iel5/8714/27587/01231461.pdf?arnumber=1231461
(3) CMMI® for Development, Version 1.2, CMU/SEI-2006-TR-008, 2006
(4) ISO/IEC 9001:2000 Quality Management Systems – Requirements, International
Standardization Organization, ISO/IEC 9001:2000, Edition 3, May 2005
(5) ISO/IEC 15504-5 Information technology — Process Assessment Part 5: An exemplar Process
Assessment Model, International Standardization Organization, ISO/IEC 15504-5:2006(E),
March 2006
(6) Jeffrey Liker, The Toyota Way: Fourteen Management Principles from the World's Greatest
Manufacturer, McGraw-Hill Companies, ISBN 0071392319, January 2004
(7) Dr Jeff Sutherland, Is CMMI worth doing?, http://jeffsutherland.com/scrum/2006/11/is-cmmi-
worth-doing.html
(8) Ken Schwaber and Mike Beedle, Agile Software Development with Scrum, Prentice Hall, ISBN
0130676349, October 2001
(9) Ken Schwaber, The Enterprise and Scrum, Microsoft Press Corp., ISBN 9780735623378, June
2007
(10) Kent Beck, Extreme Programming Explained: Embrace Change (2nd
edition), Addison-Wesley,
ISBN 0201616416, October 1999
(11) Vadivelu Vinayagamurthy, Challenges in assessing Agile Development projects for CMMI Level
3 based on SCAMPI methodology, Proceedings of the International SPICE Days 2007 in
Frankfurt/Main, Germany, ISQI, June 2007
146

Appendix A: Exemplary Mapping of CMMI-DEV 1.2 Practices
to Scrum/XP
Essentially, all models are wrong, but some are useful.
George Box
The mappings include all suitable CMMI-DEV 1.2 process areas for Maturity Level 3 and some of the
process areas of Maturity Level 3. The purpose of these mappings is not to define a fixed rule about the
application of Scrum for CMMI. They are rather intended to work as an orientation point.
We assume that a Scrum/XP process definition is available throughout the organization. The references
(1) are supplemented by organization specific additions.
We used these abbreviations in the mapping tables:
• SG : CMMI-DEV 1.2 Specific Goal
• SP : CMMI-DEV 1.2 Specific Practice
6.1 CMMI-DEV 1.2 Maturity Level 2 Process Areas
Not explicitly covered:
• Configuration Management
6.1.1 Measurement and Analysis (MA)
The purpose of Measurement and Analysis (MA) is to develop and sustain a measurement capability that
is used to support management information needs.
CMMI Goals and Practices Scrum/XP fulfills this practice if you...
Measurement objectives and activities are aligned
with identified information needs and objectives. SG 1
Establish and maintain measurement objectives that
are derived from identified information needs and
objectives. SP 1.1
Identify useful statistics for your information
needs, i.e. Product and Sprint Backlog
statistics for project management purposes.
Specify measures to address the measurement
objectives. SP 1.2
Ensure that the measures are known to all
and followed in the process.
Specify how measurement data will be obtained and
stored. SP 1.3
Add any measurement data to the information
in the Product Backlog and Scrum reports.
Specify how measurement data will be analyzed and
reported. SP 1.4
Specify in the dept handbook, that Backlog
Analysis and statistics on Total Effort, Team
Velocity, Defect Count and any other required
data are performed and maintained.
Measurement results that address identified
information needs and objectives are provided. SG 2
147

Obtain specified measurement data. SP 2.1 Add any other specified information need to
the Product Backlog.
Analyze and interpret measurement data. SP 2.2 Add measurement interpretation tasks to the
Product Backlog.
Manage and store measurement data, measurement
specifications, and analysis results. SP 2.3
Specify the management and storage of data,
specifications and results in the Product
Backlog.
Report results of measurement and analysis activities
to all relevant stakeholders. SP 2.4
Ensure that the Product Backlog and any
analysis are visible to everybody.
6.1.2 Project Monitoring and Control (PMC)
The purpose of Project Monitoring and Control (PMC) is to provide an understanding of the project’s
progress so that appropriate corrective actions can be taken when the project’s performance deviates
significantly from the plan.
CMMI Goals and Practices Scrum/XP fulfills this practice if you...
Actual performance and progress of the project are
monitored against the project plan. SG 1
Monitor the actual values of the project planning
parameters against the project plan. SP 1.1
Use Sprint-, Release- and Product Backlog
Burndown Charts to illustrate the progress of
the development against scheduled Review-,
Release- or Completion dates.
Monitor commitments against those identified in the
project plan. SP 1.2
Keep the original Release Backlog and
compare it to the Selected Backlogs for each
Sprint.
Monitor risks against those identified in the project
plan. SP 1.3
Make the progress of risk evaluation as put
into relation to highest level Backlog Items
visible. An Impediment Backlog is maintained
to make additional risks transparent.
Monitor the management of project data against the
project plan. SP 1.4
As Scrum demands, integrate and document
everything each Sprint, including project data.
Monitor stakeholder involvement against the project
plan. SP 1.5
Record each Backlog Item with its originator.
Thus any changes in the project can be
documented with their origin.
Periodically review the project's progress,
performance, and issues. SP 1.6
Use Scrum reporting. The progress is made
visible. The team meets daily to exchange the
status. Product Owners perform their own
Daily Scrum to keep track of the project.
Review the accomplishments and results of the
project at selected project milestones. SP 1.7
Perform a Sprint Review after each Sprint in
the project. The progress is made visible. A
retrospective is performed to gather additional
impediments or ways to improve.
148

Corrective actions are managed to closure when the
project's performance or results deviate significantly
from the plan. SG 2
Collect and analyze the issues and determine the
corrective actions necessary to address the issues.
SP 2.1
Use an Impediment Backlog to collect team
related and other issues. The team is
responsible to identify organizational issues
which are communicated by the Scrum
Master.
Take corrective action on identified issues. SP 2.2 Ensure that any Impediment is prioritized and
worked on by team and management.
Manage corrective actions to closure. SP 2.3 Ensure that any issue or impediment is only
removed from the Impediment Backlog when
it is completely resolved.
6.1.3 Project Planning (PP)
The purpose of Project Planning (PP) is to establish and maintain plans that define project activities.
CMMI Goals and Practices Scrum/XP fulfills this practice if you...
Estimates of project planning parameters are
established and maintained. SG 1
Establish a top-level work breakdown structure
(WBS) to estimate the scope of the project. SP 1.1
Categorize Product Backlog Items. Equivalent
to a WBS, the Product Backlog can be
grouped by features and teams. (There is no
task level planning in Scrum before the Sprint
Planning)
Establish and maintain estimates of the attributes of
the work products and tasks. SP 1.2
Perform Estimation Meetings. Backlog Items
can be estimated using relative sizes, called
Story Points. While Story Points have no
absolute meaning, they indicate the relative
complexity of each Backlog Item.
Define the project life-cycle phases upon which to
scope the planning effort. SP 1.3
Order features in the Product Backlog by their
business importance. The top of the Product
Backlog is estimated in detail, the remainder
more roughly.
Estimate the project effort and cost for the work
products and tasks based on estimation rationale. SP
1.4
Summarize the Product Backlog estimates for
a given release and compare it to the team
velocity to calculate the project effort.
A project plan is established and maintained as the
basis for managing the project. SG 2
Establish and maintain the project's budget and
schedule. SP 2.1
Ensure that the Product Owner establishes
and maintains the budget and schedule for
the project.
Identify and analyze project risks. SP 2.2 Analyze the risk of Backlog Items. Some of
the most risky Backlog Items are prioritized
very high so they can be evaluated in the
149

beginning of the project.
Plan for the management of project data. SP 2.3 Store the Product Backlog in a central place
which is accessible for all project participants
and stakeholders. Each comment, task or test
associated to a Backlog Item is made visible.
Plan for necessary resources to perform the project.
SP 2.4
Allocate Scrum teams based on the project
budget and provide them with their working
environment. The team may determine to
extend the working environment or add team
members itself constrained by the given
budget.
Plan for knowledge and skills needed to perform the
project. SP 2.5
Start the project with a cross functional team
which includes all necessary skills. Scaling
mechanisms will take care of the spreading of
knowledge. Teams may acquire additional
training at any time.
Plan the involvement of identified stakeholders. SP
2.6
Invite stakeholders to participate in the
planning and review sessions. They are
allowed to watch the Daily Scrum meetings.
Establish and maintain the overall project plan
content. SP 2.7
Use the Product Backlog as mentioned
above.
Commitments to the project plan are established and
maintained. SG 3
Review all plans that affect the project to understand
project commitments. SP 3.1
List any deliverables and constraints on the
Product Backlog that possibly affect the work
of any team.
Reconcile the project plan to reflect available and
estimated resources. SP 3.2
Adjust the estimations and prioritizations on
the Product Backlog on demand. The Team
Velocity is used to calculate the validity of
planning.
Obtain commitment from relevant stakeholders
responsible for performing and supporting plan
execution. SP 3.3
Ensure that the budget has to be approved by
stakeholders in order to start any Sprint.
6.1.4 Process and Product Quality Assurance (PPQA)
The purpose of Process and Product Quality Assurance (PPQA) is to provide staff and management with
objective insight into processes and associated work products.
CMMI Goals and Practices Scrum/XP fulfills this practice if you...
Adherence of the performed process and associated
work products and services to applicable process
descriptions, standards, and procedures is objectively
evaluated. SG 1
Objectively evaluate the designated performed
processes against the applicable process
Ensure that the team sticks to the Scrum
Rules. The ScrumMaster is responsible to
150

descriptions, standards, and procedures. SP 1.1 confront the team with deviations from the
original Scrum process or other agreements.
Objectively evaluate the designated work products
and services against the applicable process
descriptions, standards, and procedures. SP 1.2
Ensure that the acceptance criteria for each
work product are added to the Backlog Item
description, that acceptance tests are
performed and their results documented.
Noncompliance issues are objectively tracked and
communicated, and resolution is ensured. SG 2
Communicate quality issues and ensure resolution of
noncompliance issues with the staff and managers.
SP 2.1
Ensure the objectivity of the ScrumMaster (by
being a QA staff member; for instance), Be
honest and transparent in the Sprint Review
meetings. Perform retrospectives to address
the reasons behind quality issues and resolve
them using the Impediment Backlog.
Establish and maintain records of the quality
assurance activities. SP 2.2
Verify the completion of Backlog Items on
base of their test fulfillment. An incomplete
Backlog Item can only be removed from the
Product Backlog if the according requirement
is no longer needed in the Sprint, release or
product.
6.1.5 Requirements Management (REQM)
The purpose of Requirements Management (REQM) is to manage the requirements of the project’s
products and product components and to identify inconsistencies between those requirements and the
project’s plans and work products.
CMMI Goals and Practices Scrum/XP fulfills this practice if you...
Requirements are managed and inconsistencies with
project plans and work products are identified. SG 1
Develop an understanding with the requirements
providers on the meaning of the requirements. SP 1.1
Discuss Vision, Goals and Product Backlog
Items in the Release and Sprint Planning
meetings.
Obtain commitment to the requirements from the
project participants. SP 1.2
Ensure that Product Owner and Scrum Team
agree at least about the stability of the
Selected Product Backlog for the duration of
a Sprint. Only the Product Owner is entitled to
prioritize the remaining Product Backlog.
Manage changes to the requirements as they evolve
during the project. SP 1.3
Add Backlog Items to the Product Backlog
that is not currently selected for a Sprint.
Priorities, size or effort estimates, Business
Value of the Product Backlog may be
adjusted.
Maintain bidirectional traceability among the
requirements and the project plans and work
products. SP 1.4
Make the Product Backlog visible for
everyone. Each Backlog Item contains a full
list of references to other information sources
and vice versa. A Sprint Backlog contains
151

only tasks that can be mapped to Product
Backlog Items.
Identify inconsistencies between the project plans
and work products and the requirements. SP 1.5
Split the Product Backlog into Sprints and
Releases to support the ongoing project
planning. The actual work is noted in the
Product Backlog after each Sprint. Any
changes to Backlog Items are noted in the
Product Backlog.
6.1.6 Supplier Agreement Management (SAM)
The purpose of Supplier Agreement Management (SAM) is to manage the acquisition of products from
suppliers.
CMMI Goals and Practices Scrum/XP fulfills this practice if you...
Agreements with the suppliers are established and
maintained. SG 1
Determine the type of acquisition for each product or
product component to be acquired. SP 1.1
Perform a Backlog Planning. Identify Product
Backlog that should be implemented by
external suppliers.
Select suppliers based on an evaluation of their ability
to meet the specified requirements and established
criteria. SP 1.2
Incorporate the supplier evaluation and
selection - in the initial Sprints. If necessary,
create and refine selection criteria.
Establish and maintain formal agreements with the
supplier. SP 1.3
Ensure that the supplier commits to the
Selected Product Backlog. Each Sprint will be
followed by a review. Tests are added to
Backlog Items to provide specific acceptance
criteria.
Agreements with the suppliers are satisfied by both
the project and the supplier. SG 2
Perform activities with the supplier as specified in the
supplier agreement. SP 2.1
Ensure that Sprint Review and Retrospective
are scheduled and performed.
Select, monitor, and analyze processes used by the
supplier. SP 2.2
Ensure that the supplier processes fit into the
Scrum process. Ideally, the supplier has
incorporated agile engineering practices as
well.
Select and evaluate work products from the supplier
of custom-made products. SP 2.3
Incorporate the evaluation and selection of
custom-made products into so called Staging-
(or Zero-) Sprints
Ensure that the supplier agreement is satisfied before
accepting the acquired product. SP 2.4
Accept any Backlog Item only if it fulfills the
defined acceptance criteria, including tests.
Transition the acquired products from the supplier to
the project. SP 2.4
Establish Continuous Integration to ensure
the smooth transition. Integration work is
included into the Product Backlog
152

6.2 CMMI-DEV 1.2 Maturity Level 3 Process Areas
Not explicitly covered:
• Decision Analysis and Resolution (DAR)
• Organizational Process Definition +IPPD (OPD+IPPD)
• Organizational Process Focus (OPF)
• Organizational Training (OT)
6.2.1 Integrated Project Management +IPPD (IPM+IPPD)
The purpose of Integrated Project Management (IPM) is to establish and manage the project and the
involvement of the relevant stakeholders according to an integrated and defined process that is tailored
from the organization’s set of standard processes.
For IPPD, Integrated Project Management +IPPD also covers the establishment of a shared vision for the
project and the establishment of integrated teams that will carry out objectives of the project.
CMMI Goals and Practices Scrum/XP fulfills this practice if you...
The project is conducted using a defined process that
is tailored from the organization's set of standard
processes. SG 1
Establish and maintain the project's defined process
from project startup through the life of the project. SP
1.1
Select a main ScrumMaster. The
ScrumMaster holds the responsibility to
maintain the process.
Use the organizational process assets and
measurement repository for estimating and planning
the project’s activities. SP 1.2
Incorporate Scrum into the corporate process
framework portfolio.
Establish and maintain the project's work environment
based on the organization's work environment
standards. SP 1.3
Establish the project work environment in an
initial Sprint and improve it as required.
Integrate the project plan and the other plans that
affect the project to describe the project’s defined
process. SP 1.4
Ensure that the Product Backlog contains the
entire plan. References to the process
description can be added.
Manage the project using the project plan, the other
plans that affect the project, and the project’s defined
process. SP 1.5
Enable the ScrumMaster to ensure that all
participants follow the plan according to the
Scrum process.
Contribute work products, measures, and
documented experiences to the organizational
process assets. SP 1.6
Maintain a Scrum process knowledge base.
The ScrumMaster is responsible for the
contribution of all necessary artifacts,
retrospective results or conventions.
Coordination and collaboration of the project with
relevant stakeholders is conducted. SG 2
Manage the involvement of the relevant stakeholders
in the project. SP 2.1
Ensure that stakeholder involvement is well
defined for the team. The Product Owner
takes the responsibility to regard the
stakeholders’ needs in the Product Backlog
Participate with relevant stakeholders to identify, Let multiple Product Owners form a Product
153

negotiate, and track critical dependencies. SP 2.2 Owner team that interfaces with other
stakeholders.
Resolve issues with relevant stakeholders. SP 2.3 Ensure that ScrumMaster and Product Owner
work together to remove impediments.
The project is managed using IPPD principles. SG 3
Establish and maintain a shared vision for the project.
SP 3.1
Create and communicate the shared vision as
the heart of each Scrum project.
Establish and maintain the integrated team structure
for the project. SP 3.2
Build Cross-functional teams. They are not to
be changed – at least for the duration of one
Sprint.
Allocate requirements, responsibilities, tasks, and
interfaces to teams in the integrated team structure.
SP 3.3
Perform a scaled planning (9). Allocate
Backlog Items to suitable teams.
Establish and maintain integrated teams in the
structure. SP 3.4
Ensure that everyone required to deliver the
product increment is in the particular team.
Ensure collaboration among interfacing teams. SP
3.5
Establish Scrum of Scrums meetings, where
team members exchange information.
6.2.2 Product Integration (PI)
The purpose of Product Integration (PI) is to assemble the product from the product components, ensure
that the product, as integrated, functions properly, and deliver the product.
CMMI Goals and Practices Scrum/XP fulfills this practice if you...
Preparation for product integration is conducted. SG
1
Determine the product-component integration
sequence. SP 1.1
Let the team determine and implement the
product-component integration sequence.
Establish and maintain the environment needed to
support the integration of the product components.
SP 1.2
Let the team set up and maintain a
continuous integration environment.
Establish and maintain procedures and criteria for
integration of the product components. SP 1.3
Define integration and system tests early in
order to provide common criteria for
component integration.
The product-component interfaces, both internal and
external, are compatible. SG 2
Review interface descriptions for coverage and
completeness. SP 2.1
Review Interfaces reviewed through their
integration. Completeness of the description
is not necessary. At the contrary, an interface
is considered complete as it fulfills the
necessary integration tests.
Manage internal and external interface definitions,
designs, and changes for products and product
components. SP 2.2
Perform Continuous Integration which
ensures that changes at the interface level do
not break the system.
154
Verified product components are assembled and the
integrated, verified, and validated product is
delivered. SG 3
Confirm, prior to assembly, that each product
component required to assemble the product has
been properly identified, functions according to its
description, and that the product component
interfaces comply with the interface descriptions. SP
3.1
Perform integration tests on various levels to
ensure component compliance.
Assemble product components according to the
product integration sequence and available
procedures. SP 3.2
Ensure that the assembly is being conducted
automatically.
Evaluate assembled product components for
interface compatibility. SP 3.3
Perform the required tests in the course of
Continuous Integration.
Package the assembled product or product
component and deliver it to the appropriate customer.
SP 3.4
Let the team establish deployment routines.
Ideally, the Continuous Integration
environment performs the packaging and
delivery. Each Sprint delivers a potentially
shippable product increment.
6.2.3 Requirements Development (RD)
The purpose of Requirements Development (RD) is to produce and analyze customer, product, and
product component requirements.
CMMI Goals and Practices Scrum/XP fulfills this practice if you...
Stakeholder needs, expectations, constraints, and
interfaces are collected and translated into customer
requirements. SG 1
Elicit stakeholder needs, expectations, constraints,
and interfaces for all phases of the product life cycle.
SP 1.1
Add input from stakeholders to the Product
Backlog at any time. Only the Selected
Product Backlog must not be changed.
Transform stakeholder needs, expectations,
constraints, and interfaces into customer
requirements. SP 1.2
Discuss requirements and transform them
into Backlog Items / Stories and tests.
Customer requirements are refined and elaborated to
develop product and product-component
requirements. SG 2
Establish and maintain product and product-
component requirements, which are based on the
customer requirements. SP 2.1
Break down or detail Backlog Items to be
small, measurable, achievable, relevant and
timed.
Allocate the requirements for each product
component. SP 2.2
Refine the Product Backlog into feature
groups or teams if multiple teams have to
work on multiple product components.
Identify interface requirements. SP 2.3 Let the team identify interface requirements.
155

They are documented in the code.
The requirements are analyzed and validated, and a
definition of required functionality is developed. SG 3
Establish and maintain operational concepts and
associated scenarios. SP 3.1
Collect operational concepts and associated
scenarios. They are maintained by the
Product Owner and communicated to the
team in the Sprint Planning meeting.
Establish and maintain a definition of required
functionality. SP 3.2
Prioritize the Product Backlog by business
value. Required functionality is always visible.
Analyze requirements to ensure that they are
necessary and sufficient. SP 3.3
Create a shared understanding in the
Planning meetings. Ensure that the Product
Backlog is maintained well.
Analyze requirements to balance stakeholder needs
and constraints. SP 3.4
Use the Scrum planning, review and reporting
techniques. The transparency of Scrum
uncovers any conflicts between needs and
constraints. The Sprint Review meeting is
used to demonstrate the reached state and
gather insight for the next step.
Validate requirements to ensure the resulting product
will perform as intended in the user's environment
using multiple techniques as appropriate. SP 3.5
Perform Frequent Deliveries and Reviews to
ensure that the product meets its
requirements.
6.2.4 Risk Management (RSKM)
The purpose of Risk Management (RSKM) is to identify potential problems before they occur so that risk-
handling activities can be planned and invoked as needed across the life of the product or project to
mitigate adverse impacts on achieving objectives.
CMMI Goals and Practices Scrum/XP fulfills this practice if you...
Preparation for risk management is conducted. SG 1
Determine risk sources and categories. SP 1.1 Add the project risk source and category
determination to the Product Backlog. Add
corporate risk source and category
determination to the Company Backlog.
Define the parameters used to analyze and
categorize risks, and the parameters used to control
the risk management effort. SP 1.2
Add the project risk parameter definition to
the Product Backlog. Add corporate risk
parameter definition to the Company Backlog.
Establish and maintain the strategy to be used for risk
management. SP 1.3
Use the Product Backlog to manage known
project risks and the Impediment Backlog to
manage risks with organizational impact.
Risks are identified and analyzed to determine their
relative importance. SG 2
Identify and document the risks. SP 2.1 Add the risk to the Product or Impediment
Backlog.
Evaluate and categorize each identified risk using the
defined risk categories and parameters, and
Evaluate the risk and prioritize it according to
156

determine its relative priority. SP 2.2 its impact.
Risks are handled and mitigated, where appropriate,
to reduce adverse impacts on achieving objectives.
SG 3
Develop a risk mitigation plan for the most important
risks to the project as defined by the risk
management strategy. SP 3.1
Put the most important risks on top of the
Product Backlog.
Monitor the status of each risk periodically and
implement the risk mitigation plan as appropriate. SP
3.2
Perform Sprint Reviews and retrospectives
and include the mitigation of risks.
6.2.5 Technical Solution (TS)
The purpose of Technical Solution (TS) is to design, develop, and implement solutions to requirements.
Solutions, designs, and implementations encompass products, product components, and product-related
lifecycle processes either singly or in combination as appropriate.
CMMI Goals and Practices Scrum/XP fulfills this practice if you...
Product or product-component solutions are selected
from alternative solutions. SG 1
Develop alternative solutions and selection criteria.
SP 1.1
Use initial Sprints to select appropriate basic
approaches. The team always demonstrates
the best solution from its perspective at the
next Sprint Review.
Select the product-component solutions that best
satisfy the criteria established. SP 1.2
Use initial and subsequent Sprints to narrow
on the best solutions.
Product or product-component designs are
developed. SG 2
Develop a design for the product or product
component. SP 2.1
Establish a Simple Design that fits to the
current needs.
Establish and maintain a technical data package. SP
2.2
Define Coding Standards to define technical
packages.
Design product component interfaces using
established criteria. SP 2.3
Use the Coding Standards practice to decide
upon interface criteria.
Evaluate whether the product components should be
developed, purchased, or reused based on
established criteria. SP 2.4
Ensure that decisions about this are made by
the development team together with their
Product Owner
Product components, and associated support
documentation, are implemented from their designs.
SG 3
Implement the designs of the product components.
SP 3.1
Acknowledge that Analysis, Design and
Implementation are no longer separate
phases.
Develop and maintain the end-use documentation. Ensure that every deliverable has to be
157

SP 3.2 complete, including documentation.
6.2.6 Validation (VAL)
The purpose of Validation (VAL) is to demonstrate that a product or product component fulfills its intended
use when placed in its intended environment.
CMMI Goals and Practices Scrum/XP fulfills this practice if you...
Preparation for validation is conducted. SG 1
Select products and product components to be
validated and the validation methods that will be used
for each. SP 1.1
Let the Product Owner determine the
selection in the Product Backlog. The
methods are determined and implemented by
the team.
Establish and maintain the environment needed to
support validation. SP 1.2
Ensure that the team is responsible for
creating the acceptance environment.
Establish and maintain procedures and criteria for
validation. SP 1.3
The team designs Acceptance methods to
validate the functionality delivered at the
Sprint Review.
The product or product components are validated to
ensure that they are suitable for use in their intended
operating environment. SG 2
Perform validation on the selected products and
product components. SP 2.1
Perform Acceptance tests.
Analyze the results of the validation activities and
identify issues. SP 2.2
Compare the actual results of the acceptance
tests to the expected results.
6.2.7 Verification (VER)
The purpose of Verification (VER) is to ensure that selected work products meet their specified
requirements.
CMMI Goals and Practices Scrum/XP fulfills this practice if you...
Preparation for verification is conducted. SG 1
Select the work products to be verified and the
verification methods that will be used for each. SP 1.1
Define appropriate integration tests for each
component and performed before and at the
Sprint Review to verify the delivered
functionality.
Establish and maintain the environment needed to
support verification. SP 1.2
Ensure that the test environment is an
integral part of the Continuous Build
environment.
Establish and maintain verification procedures and
criteria for the selected work products. SP 1.3
Collect test criteria to complete the Backlog
Item descriptions.
Peer reviews are performed on selected work
158

products. SG 2
Prepare for peer reviews of selected work products.
SP 2.1
Establish frequent peer reviews via Pair
Programming and / or as separate sessions.
Conduct peer reviews on selected work products and
identify issues resulting from the peer review. SP 2.2
Perform Code Reviews in addition.
Analyze data about preparation, conduct, and results
of the peer reviews. SP 2.3
Let the team define and keep bug counts, hint
data and other useful information in order to
measure the success of collaborative
reviews.
Selected work products are verified against their
specified requirements. SG 3
Perform verification on the selected work products.
SP 3.1
Verify separate work products using Unit
Tests or other appropriate measures.
Analyze the results of all verification activities. SP 3.2 Communicate test results immediately in
order to identify and perform corrective action
as soon as possible.
159

160

Managing Change in the Software Test
Environment
Diane Manlove & Jerry Parrish
[email protected], [email protected]
IBM® STG, System i* SW FST, Rochester, MN
Diane Manlove is a test coordinator and team lead for System i Final Software Test at IBM in Rochester,
MN. Her background includes software quality management, software and hardware test, and
manufacturing quality. She is certified by the American Society for Quality as a Software Quality Engineer,
a Quality Manager, and a Reliability Engineer and by the Project Management Institute as a Project
Management Professional. Ms. Manlove holds a Master's degree in Reliability and has been employed by
IBM since 1984.
Jerry Parrish is a key technical leader for System i & i5/OS. He is a well recognized expert in the area of
system software testing and customer simulation testing. He was one of the original test engineers /
designers of the System i Platform Execution Test (PET) environment. In addition to his expertise in
software system testing, Jerry also has in-depth knowledge of both IBM and industry techniques and
methods for modeling & measuring customer-like activities during test for determining predictive post-GA
product quality. As a test strategist and architect for i5/OS, he has played a key role in delivering System i
& i5/OS (as a recognized high quality, integrated offering) to our customers. Jerry has authored several
technical articles and has been an active participant promoting the value of System Test across IBM.
Jerry’s current role is the lead test engineer for i5/OS.
Abstract
Change, driven by the need for continuous advancement, is a do-or-die imperative for software
test organizations today. There is constant pressure to make process and tool changes that do
a better job of finding software defects and to do it more efficiently. Poorly implemented
change, however, can turn the expectation of organizational improvement into a nightmare of
lost productivity, diminished effectiveness, and eroded employee morale. This paper defines a
process for evaluating and introducing change, which minimizes the risk of unintended
outcomes and significant disruption to the test organization. In addition, the process has been
designed to support the industry-standard Software Engineering Institute’s Capability Maturity
Model Integration (CMMI).
Change – A double-edged sword
In today’s challenging business environment, test organizations cannot avoid change without
becoming obsolete. This is particularly true of the globally integrated, dynamic world of
161

software test. To keep pace with the demands of advancing technology and quality
expectations, test organizations today must aggressively investigate, invent, and adopt
improvements on an on-going basis. Every employee in the organization must feel empowered
to brainstorm and suggest potential improvement ideas which will help the organization
achieve its goals.
Unfortunately, introducing any type of change often introduces risk. New tools may not
perform as advertised, technologies may prove more difficult to implement than anticipated,
and people may behave in unexpected ways. Even ‘minor’ process changes can have far-
reaching and potentially serious consequences.
As one example of the impact to an organization caused by a ‘minor’ change, we once
observed the result of reformatting data collected for defect management and tracking
purposes. The change was a simple re-ordering of columns in an output file. This change was
first discovered by subsequent users of the data when analysis uncovered inconsistencies in
reported results. In addition to correcting the report and cleaning the input data so that it was
ordered consistently, several days worth of effort were required to update the downstream
tools.
A change for the better
Fortunately, with early investigation, measured study, and good planning, even significant
changes to a test organization’s tools, methods, or processes can be executed without
disruption or other negative side-effect and organizational improvement can be achieved.
Meeting these goals start with a written procedure for organizational change management.
This procedure must establish three things:
1. The change management procedure’s objective
2. How opportunities for improvement are identified and selected for further evaluation
3. Requirements for change planning
Establishing a change management procedure which includes these three elements provides a
basic framework to support CMMI’s requirements for the Organizational Innovation and
Deployment Key Practice Area.
The change management procedure’s objective
Contemporary wisdom postulates that the only constant is change. That being said, an
organization must be wary of change for change’s sake. Any proposed change must be viewed
through the lens of the organization’s overall business goals and everyone in the organization
should be reminded of this periodically too. Process change should be focused on achieving
these business goals and on providing continuous improvement. The procedure for managing
change should state these goals and how they are supported by the procedure. This is an acid
test for any process -- if a process doesn’t support the organization’s goals, it should be
changed or eliminated.
162

Figure 1 gives an example statement that identifies the organization’s goal for continuous
improvement and the procedure’s role in supporting it. This example closely matches the
goal statement used by our own organization, which is kept at a high level within the written
procedure. More specific yearly goals are defined by the organization which narrow the focus
of continuous improvement based on current business needs. Other organizations might
choose to define their process goal more specifically, such as, ‘Evaluate and implement
technologies to achieve the organization’s goal of 10% year to year product quality
improvement.’
Figure 1. Example process objective
How opportunities for improvement are identified and selected for further
evaluation
Wouldn’t it be great if process improvement occurred naturally like evolution? Unfortunately,
the reverse is often true. Without a process to identify new technologies, benchmark
industry practices, and analyze existing methodologies for improvement opportunities, tools
and processes can stagnate and erode, leaving organizations with ineffective processes and
uncompetitive products. A documented process for identifying and selecting new
technologies can help to prevent these problems from occurring.
Additionally, test organizations can identify a person or persons who will have primary
responsibility for leading the improvement effort. The organization also needs to cultivate a
culture of improvement whereby all employees feel empowered to suggest positive changes.
This is accomplished through education, organizational policies and programs, and by
management and the change leader(s) ‘walking the talk’. In other words, employee
suggestions need to be recorded, fairly evaluated, and, when appropriate, implemented. It is
the latter, the implementation of ideas for positive change that come from employees at
large, that convinces people throughout the organization that positive change is embraced.
This in turn encourages the spontaneous growth of participation and cultivates an
organizational spirit of on-going improvement.
Improvement ideas should be selected for additional evaluation based on the organization’s
objectives and an initial assessment of the change’s potential benefits and cost. Once a
proposed change is selected for further evaluation, ownership is assigned to an individual or
team.
Within our organization we have one technical focal point that proactively identifies
improvement opportunities based on his knowledge of the organization’s plans, review of new
technologies, and evaluation of our existing performance. In addition, we maintain a
database where testers can submit new ideas at any time. Ideas are solicited periodically
based on test cycles. A small team reviews these ideas (also periodically based on test
cycle). Ideas are then identified for further evaluation either by our technical focal point or
by the review team. Logical owners are assigned either by the technical focal point or
management. The owner then creates the EQRP and manages the change per the process,
involving stakeholders as required.
Achieve the organization’s goal of continuous improvement by facilitating
good decision-making and non-disruptive change
163

This two-pronged approach to idea gathering works well for us because it helps us identify
both strategic and tactical improvement opportunities. In general, strategic ideas come from
our technical focal point. This person has a big-picture view of the organization that includes
long-term plans and goals. He has knowledge of the organization’s performance capabilities
and has visibility to customer feedback, field problems, etc. In addition, one of his assigned
roles is to stay current with industry trends and new technologies.
Testers provide a view ‘from the trenches’ that, in general, is more tactical. New ideas are
often generated as a result of existing problems or ‘lessons learned’ exercises. The
evaluation for each of these ideas by our team of reviewers is recorded directly into the
database that the team uses to record their ideas. In this way the process is ‘closed loop’,
and our test team is encouraged to continue to record their ideas because they know they will
receive serious consideration.
Requirements for change planning
The best defense against poorly implemented change is a good plan. The organization’s
procedure for managing change must require the change owner to prepare a detailed, written
plan. This plan should cover three areas as shown in Figure 2.
50
40
30
20
10
0
10
20
30
40
50
120
100
80
0
20
20
40
60
60
40
FF
OO
C
O
C
O
Evaluation
Qualification
Roll-out
Figure 2. The three key elements of a change plan
In Figure 2 evaluation, qualification, and roll-out represent three sequential stages of
evaluating and implementing a change within a test organization. These are high-level
stages. Within each stage disciplined techniques and tools are applied. Examples are Plan-
Do-Check-Act for managing the product qualification, and design of experiments for the
evaluation of competing ideas.
We can use the process of buying a new car as a simple example to illustrate these stages.
The evaluation stage consists of the up-front work to identify the makes and models of cars
that meet our needs. A buyer could compare data such as cost, safety ratings, and
164

maintenance reports, as well as personal requirements like style and prestige, in order to
narrow down the choices to two or three cars.
In the next phase, qualification, we would test drive the cars that were identified by our
evaluation work. Actually driving the cars enables us to see how they perform under real
operating conditions and to evaluate criteria, such as comfort, that we couldn’t assess based
on data alone. At the end of the qualification stage we will hopefully know which car we
want to buy. Now we will focus on roll-out planning. We’ll buy insurance, register
ownership, show the family how to work the windshield wipers, etc.
Now we will look at the steps in greater detail.
Evaluation
The objective of the evaluation phase is to determine if the change should be implemented.
Evaluation would include risk/reward or cost/benefit analysis. It may also include
comparison of competing products and an analysis of make versus buy. The result may be a
few options deemed worthy of further study; it might result in a single option; it is also
possible that the evaluation will reject the proposed change entirely.
The evaluation section of the change plan should support the organization’s needs with
respect to the proposed change, including a cost/benefit analysis. This section should
document a systematic plan for evaluating the change under consideration with respect to
those needs. The criteria that will be used for evaluation should be included here and should
be linked to the organization’s objectives. Records from the execution of this stage should
document relevant cost and performance projections, potential risks, and evaluation results.
Qualification
During the qualification phase the change owner should:
1. Determine which solution, if any, will be implemented.
2. Verify the expected performance of the solution within the organization’s
environment.
3. Identify any issues which must be addressed prior to full implementation, including
potential impacts to tester productivity and effectiveness.
Once again, this section of the plan should begin with an objective which clearly identifies
what we expect to gain by conducting the qualification. It should then define how the
solution(s) will be tested in order to determine the extent to which the organization’s
requirements will be met. This could include before/after comparisons, formal design of
experiments, or a pilot of the change. The qualification section will also define the data that
will be collected to assess performance and the success/failure criteria that will be used.
The data collected and criteria used should support the organization’s objectives.
If a pilot of the proposed change is planned, the qualification section should address the
needs of the personnel who will be involved in the pilot, including their education and
training. In a way, pilots are like a ‘mini roll-out’, so the same considerations explained in
165

the following sub-section can be used here. For employees who are involved in the pilot, the
qualification period can be likened to a first date. It has been said that people make a
judgment within the first few seconds of meeting you, based on their first impression. First
impressions tend to linger and a poor first impression, even if it is due to the way the change
is introduced rather than the actual change itself, can set employees against implementation
from the start. If that happens, you will have additional barriers to overcome beyond any
technical or process problems that arise.
During the qualification phase it is important to identify any problems, or potential problems,
which should be addressed prior to roll-out. This is key to the success of the roll-out phase.
Potential problem areas include required changes to other tools or processes and the need for
additional education or training. It is wise to pay attention to both objective and subjective
data during qualification. Interviews with involved parties can uncover issues that were not
observable in the data.
If the change being evaluated fails qualification, the organization will have to determine the
next course of action. The qualification could be repeated after changes are made to resolve
critical issues. The organization may choose to return to the evaluation phase to re-evaluate
previously rejected solutions. Finally, the project could be shelved entirely for a variety of
reasons. It might be that the technology is found to be too immature, or that the solution is
not compatible with the organization’s environment.
Roll-out
Assuming that the qualification phase identifies an acceptable solution, the final step is to
plan a controlled roll-out. A roll-out is a project in and of itself. Good project management
is essential to the overall success. This includes a project plan identifying stakeholders and
future users, risks, assumptions, and dependencies. Tasks are identified, resources assigned,
and a schedule is developed. This may be overkill in some cases, but even for small changes
it is better to spend some time thinking through each of these items and sketching a high
level plan than to be taken by surprise. Any problems identified during the qualification
phase need to be addressed prior to roll-out. Any changes to processes, tools, or procedures
that will be required to align them with the proposed change must also be planned and
executed.
People, and their reaction to the change, should be a big focus of the roll-out phase. The
dangers in roll-outs include sabotage (quiet and complicit), lack of management support,
general inertia, and fear. Good stakeholder communications, starting as early as the
evaluation phase in some cases, can help to address these problems. A thorough
communication plan is especially important during the roll-out stage, regardless of the size of
the change. Basically, a communication plan states the information that each stakeholder
group needs, when they need it, and how it will be delivered. Education and training also
need to be planned according to the needs of each stakeholder group.
The Process in Practice
In this section we provide examples from actual practice for the change process that we have
explained. These examples come from IBM® System i* Final System Test (FST).
166

An Example Process Document
Figure 3 shows a process document similar to the one used by the System i FST organization.
In our organization this process was incorporated as a section within our overall test process
document, which is maintained by our test project lead. Key features of this process
document include:
• The important elements of the change process are addressed, including the process
objective and requirement for a plan specific to each technology change
• It Is ‘high level’
• It specifies that results will be recorded within the plans
Technology Evaluation,
Qualification, and Rollout
Plans
Identification of new test technologies (tools, methods, and
processes) is an on-going objective for continuous FST
improvement. This procedure defines the requirements for
evaluating and introducing these technologies in order to
facilitate good decision making and orderly transitions.
New technologies are identified through industry literature, FST
improvement efforts, and strategic initiatives, and are selected for
evaluation based on their technological capabilities and the FST
team’s needs. The FST team establishes an Evaluation,
Qualification, and Rollout Plan (EQRP) for the introduction of any
new technologies which may have a significant impact on quality
or productivity. Once a technology is selected, an owner is
assigned to create the EQRP. The EQRP includes:
•A systematic plan for evaluating the technology, including
make/buy tradeoff studies where applicable
•A plan to pilot the technology within the area, including
objectives and evaluation criteria, to determine functional
and cost effectiveness
•A rollout plan to smoothly transition to the new technology,
which would include changes to existing process
documentation, education, and communication as
appropriate
The EQRP is approved by the area’s technical lead and
managers of affected groups, and results are reviewed after each
stage (evaluation, pilot, rollout). The pilot and rollout sections of
the plan may be TBD until the prior stage results are reviewed, in
which case plan approval is required by stage.
Figure 3. Example Evaluation, Qualification, and Roll-out Plan Process
Document
There are many valid ways to evaluate and qualify a proposed change. The method chosen
depends on the organization’s needs and the technology under consideration. For those
reasons, the process document is kept high-level, in order to allow for customization.
Specific details for each project are documented in the EQRP plans. The process also allows
167

the plan owner to develop the plan in stages. This makes sense in many cases because the
best method of qualification may not be determined until the proposed change is evaluated
and better understood. Similarly, important details of the roll-out plan may not be known
until qualification is underway or complete. Problems identified during qualification would
be one example.
Regardless of the outcome, it is useful to archive evaluation, qualification, and change plans
(EQRPs) for future reference. Old plans can be used as a starting point when creating new
plans or as a source of ideas. As personnel change (or memories fail), the archived plans can
provide answers about how a given technology was evaluated. Often the results captured are
of more value than the plan. Why was a proposed change rejected? What alternatives were
considered and how did they fair? For that reason, the example procedure in Figure 3
specifies that the plan be treated as a ‘living document’. As such, results are documented
within the plan as they are obtained. This means there will be only one document to
maintain, retain, and reference. The completed and closed plan serves as a report of all of
the activity undertaken. This is particularly useful for audit or assessment purposes,
including CMMI. A single document which adheres to the test organization’s process and
includes plans and results makes an excellent artifact. The process document establishes the
maturity of practices followed. These completed plans provide evidence that the process has
been implemented and is adhered to.
An Example Plan Template
In addition to the process document, an EQRP template can be created, to make writing the
plan easier, provide suggestions for consideration during planning, and facilitate consistency
across the organization. Figure 4 shows a simple template which is used by the FST team.
Using this template, the plan owner will first identify the proposed change and the approval
status of the EQRP. Since the EQRP is a living document and will likely go through multiple
reviews, the status needs to state if the current version is pending approval (being reviewed)
or if approval is complete. Our process allows for staged planning so, the status must also
explain what stage the EQRP is in, such as ‘approval complete for evaluation plan’ or
‘approval complete for evaluation results’.
The remainder of the template outlines the background, evaluation, qualification, and roll-
out sections of the plan. The background section is optional, but can be useful for setting the
context for the proposed change, documenting ground rules and assumptions, or recording
initial stakeholder criteria. The evaluation section prompts the EQRP owner to document the
objective of the evaluation and the planned method for meeting the objective. The
qualification section includes these same elements as well as a target completion date. The
roll-out section includes a reminder to include education, communication, installation, and
resolution of known problems in roll-out planning.
168

Evaluation, Qualification, and Roll-out Plan for
XXXX
Owner:
Approvers (technical lead & managers of affected areas):
Approval Status: <Approval pending or complete? For
Evaluation, Qualification, &/or Roll-out phase? Plans only, or
results? Examples: “Approval pending for qualification results”,
“Approval Complete for evaluation, qualification & roll-out plans”>
Approval Date:
Project background
<This section is not mandatory & can be deleted. If appropriate,
use this section to provide useful background information to
readers.>
Evaluation
<What is the objective of this evaluation? How will the solution be
selected for qualification/pilot? Document make vs. buy decision
information, evaluation of competing products, etc. Document the
criteria used for evaluation, any cost and performance
projections, potential risks, & results (when complete).>
Qualification/Pilot
<The qualification/pilot is intended to verify that the technology
will perform acceptably within the FST environment. This section
should include the objectives of the qualification/pilot, the plan for
achieving these objectives, and the objective criteria for
evaluating the results of the qualification. When complete, results
should be documented in this section.>
Objectives:
Plan:
Evaluation criteria:
Qualification target completion date:
Roll-out Plan
<This section should document the plans to ensure a smooth
introduction of the testware into the iPET environment. Areas of
consideration should include: education, communication,
installation, and resolution of known problems.>
Roll-out target completion date:
Figure 4. Example EQRP Template
An Example Plan
To illustrate the use of this change management process, we will share an example from our
own organization. The IBM System i* Software Final System Test (FST) Team is an independent
test group that conducts the final test phase in the i5/OS release process. Our mission is to
test each new release of i5/OS in a customer-like environment, before each release becomes
available externally. This customer-like environment simulates an enterprise environment with
a network of systems, including CPU-intensive applications and interactive computing. During
test execution, this environment is run as though it is a true 24-hour-a-day, seven-day-a-week
production environment. CPU utilization is tracked for targeted test systems to ensure that
goals for stressing the systems are met. It has become increasingly important to target and
monitor system indicators for other areas as well, such as memory and I/O.
As system capability and complexity continued to increase, so does the complexity of testing
the system. Our team develops sophisticated applications and implements them in a complex
system network designed to emulate very demanding customer usage. Our technical leaders
proposed the concept of a test framework that would allow our test team to more easily
169

manage, control, and monitor specific test applications. Industry applications were
researched, but no existing tool fit the vision for our framework, which included system-
specific features. Figure 5 of the project’s EQRP provides a high-level description of the
project’s background and objectives. In this example the EQRP is complete, so the approval
status at the top of the page shows that the results were approved and the plan is now closed.
Background
As IBM System I capabilities have increased, so have the
demands on the FST Team. With increased system
capability, FST's agents (applications which exercise a
specific area of the system, such as database or the
integrated file system) have become more diverse and
complex. In order to manage the growing number of
agents, allow cross-tester sharing, and enable the team to
better monitor the agents' effects on system performance,
a new test framework is needed. This framework should
be capable of controlling any application and enabled to
display relevant system parameters.
Agent Control Engine Evaluation, Qualification, and
Roll-out Plan
Owners:
…
Author: …
Approvers:
…
Approval Status: Evaluation, Qualification, & Rollout
results approved.
Approval Date: 8/25/06 Plan/Results closed.
Figure 5. Example Plan Background Section
Figure 6 shows the evaluation section of the plan. This section documents the rationale for
creating the tool and the criteria for the tool’s function. It also documents the work done by
our technical lead to research industry solutions. References to specific industry products have
been omitted from this example.
For this project, dubbed the Agent Control Engine (ACE), a team of 3 programmers, plus a
project manager, were allocated part-time for 9 months. As referenced in the evaluation
section, the project followed an iterative development process with the first phase being a
minimum function and minimum investment ‘proof-of-concept’ tool. This early version was
used to validate the framework concept and pilot its use within our organization.
170

Evaluation
The Agent Control Engine (ACE) will be designed to
provide a simple and intuitive interface for managing
various agents and their parameters across a set of
heterogeneous systems and monitoring the resulting
system behavior. Historically, these agents have been
executed with a static set of parameters (typically
definable during some pre-runtime setup process) and
monitored by a single person (usually the person who
wrote it).
The goals of ACE are to:
1. allow anyone to easily control these agents
2. allow agents' parameters to be changed on-the-fly
3. monitor the systems' behaviors to these changes
Justification for this project is based on providing a
strategic solution for easier system workload
management and exerciser integration, as well as the
increased testing demands due to system complexity
and capability.
A search of available industry solutions determined that no
off-the-shelf solution exists today which will satisfy the
defined requirements. Therefore, internal development
resources have been allocated for ACE development.
To mitigate potential risk, initial development and
qualification will focus on proof-of-concept, with
minimum investment.
Figure 6. Example Plan Evaluation Section
A Microsoft Project schedule was created to manage tool development as well as the project
qualification and roll-out activities. Figure 7 shows a high-level project plan for the
qualification and roll-out phases. It is interesting to note that milestones which are relevant
to the roll-out phase, such as completion of user documentation, occurred during the
development phase! In fact, consensus-building with stakeholders began during the
evaluation phase (and even earlier) through requirements-gathering with future users and
project plan reviews with the overall team, managers, and sponsors.
On-going communication with stakeholders was emphasized throughout the project, but
particularly during qualification and roll-out. As Figure 7 shows, the project team used
several vehicles to get user feedback and stakeholder buy-in, including meetings, a project
web page, and a database where users could record problems and suggestions. Toward the
end of ACE roll-out the project team created a game using a Jeopardy format to test the
success of ACE education across the FST team. This was a fun approach that allowed the
team to validate the roll-out process.
171

May ’06 June ’06 July
Phase 1
Development
Complete
ACE Qualification & Roll-out Plans
Qualification Roll-out
ACE installation
User 1
(Workloads) /
System 1
ACE installation
User 2
(Workloads) /
System 2
Development &
Test
3 people, ½ time
Agent integration -
User 3
Gather
feedback
from early
users
Demo tool, webpage, &
issues DB to FST Team,
gather feedback for Phase 2
Phase 2 Planning
& Development
Agent Owner
Education
Status to FST Team at weekly meeting,
discuss concerns, etc.Documentation &
install script complete
Early User
Education & Use
System Maint.
Education
Deploy across
environment
Update process
documentation &
test plans
Note:
Bi-weekly management & team
lead updates on-going through
project completion, quarterly
executive reviews.
ACE Jeopardy (Tool
education review)
ACE Team Post-mortem
Figure 7. High-level Qualification and Roll-out Plan for the ACE Project
The plan qualification section in Figure 8 covers the objectives for the phase, high-level
plans, and criteria for evaluation. The plan included the resources (hardware), users, and
duration for the qualification. Qualification covered installation of the tool as well as use.
Whenever possible we recommend objective, measurable criteria for the qualification phase.
The criteria in this example are more subjective than we would prefer, but the results, as
172

documented at the bottom of the page, were overwhelmingly positive.
Qualification/Pilot
Objectives:
•Establish ‘proof of concept’
•Obtain early feedback from users to establish the
technology’s value and influence future direction
Plan: The technology will be developed on a short cycle
and with minimum function. Initial deployment will be on
two systems and with a small set of users. These users
will be engaged for early feedback after two week’s use.
The installation process will be validated by at least one
user.
Evaluation criteria:
Users indicate improved productivity for test
development and execution over current process and
tools, confirm that functional requirements have been
met, & do not encounter significant quality problems.
Qualification target completion date: 6/30/2006
Results: 6/13/2006
•Positive feedback from all users confirming
evaluation criteria
•Users indicate desire to use technology over
existing tools
•Users and testing confirm functional requirements
have been met.
•Successful user installation
•No significant problems during installation or use
Figure 8. Example Plan Qualification Section
The primary actions to address the tool roll-out are shown in Figure 9. These were developed
by considering the needs and viewpoints of the three distinct user groups affected. These
users included system maintenance personnel who would install the tool, the FST team
members responsible for achieving weekly system performance targets (users of tool report
data), and testers whose applications interfaced with the framework. Discussions were held
with each set of users throughout roll-out to gather information, validate assumptions, and
obtain early feedback. As documented in the results, roll-out completed successfully as
scheduled.
173

Roll-out Plan
The primary concerns for this roll-out are education
and communication to users. Actions to address
these areas are:
•Plans, demos/education, and status will be
provided to users via the weekly FST team
meeting. This communication will be on-going
throughout qualification and roll-out.
•A webpage will be created for communications,
documentation, and tool updates.
•An issues database will be provided to users for
submitting suggestions and reporting problems.
•Documentation will include instructions for
installation and set-up, and a user’s guide.
•A packaged install script will be created for ease
of use.
•One-on-one education will be provided to users
as needed.
Roll-out target completion date: 7/31/2006
Results: Full roll-out of Version 1.0 completed by
7/31/2006. Education, communication, and support
will be on-going for future versions.
Figure 9. Example Plan Roll-out Section
Summary
Software test process and tool change is a requisite for on-going improvement. To ensure
that improvement ideas are generated and soundly evaluated and that technology
introduction is non-disruptive, organizations need to have a process for managing change.
The process should include the key elements of evaluation, qualification, and roll-out. In
addition, specific plans should be developed which address each of these elements for
improvements which are identified as worthy of further study. Successful implementation of
this strategy helps organizations move forward and maintain competitiveness.
* IBM and System i are trademarks or registered trademarks of International Business Machines
Corporation in the United States, other countries, or both.
References
Chrissis, Mary Beth, Mike Konrad, and Sandy Shrum. CMMI: Guidelines for Process Integration
and Product Improvement. Boston: Pearson Education, Inc., 2003.
Paulk, Mark C., Charles V. Weber, Bill Curtis, and Mary Beth Chrissis. The Capability Maturity
Mode: Guidelines for Improving the Software Process. Indianapolis: Addison-Wesley
Longman, Inc., 1995.
174

Feedback, Analysis and Synthesis based Testing
(FAST)
Vijay Upadya, Microsoft
I have been involved in software test for over 10 years; the last 8 at Microsoft. I’m currently working in the
Microsoft Visual C# group as Software Design Engineer in Test and I primarily focus on test strategy, test
tools development and test process improvements for the Linq To SQL team.
Daigo Hamura, Microsoft
I am Senior Test Lead in Visual C# team and manage the testing team for Linq To SQL project. Prior to
this project I worked in the C# Compiler test team for almost 5 years.
Tiki Wan, Microsoft
I am a Software Design Engineer in Test in the Linq To SQL test team in Visual C# group. My primary
work apart from testing the Ling To SQL framework involves writing database centric applications and
designing and maintaining SQL Server database for the team.
Yuval Mazor, Microsoft
I am a Software Design Engineer in Test in the C# Compiler team.
Abstract
The computational power of modern day computers has increased dramatically, making test generation
solutions attractive. Feedback, Analysis and Synthesis based Testing (FAST) is an innovative testing
methodology that takes advantage of cheap machine time by producing large numbers of directed tests
with integrated verification.
FAST adopts a bottom-up approach to solve test problems that have plagued software testing teams
such as high development and maintenance costs and integration test holes, while increasing test
efficiency and allowing testers to better leverage their technical skills. In addition, FAST takes advantage
of existing test suites with the help of a feedback system and test analysis tools to produce new
composite tests which achieve high levels of cross-feature and cross-component test coverage without
the additional proportionate costs. The techniques used by FAST are generic and applicable across many
software test domains.
This paper discusses an example which illustrates how the FAST methodology was used in the Visual C#
Team. It includes specific results of applying the FAST methodology and discusses its benefits. We
encourage test teams to consider FAST as an alternative to traditional hand-crafting approaches.
175

1. Introduction
The complexity of software products is continuously increasing, as are customers’ expectations of its quality. As
a result, testing effectively and efficiently is becoming more challenging.
Traditional testing practices focus on manually crafting tests based on feature specifications. This process of
maintaining and adding new tests as new scenarios and features are introduced, incurs large costs to the test
team. Additionally, since features are primarily tested in isolation, integration bugs often surface late in the
product cycle when they are more expensive to fix.
The pitfalls of traditional testing approaches are becoming increasingly well-known and attempts to avoid and
minimize the costs are growing in popularity. One of the most attractive solutions involves automating the entire
testing process. Currently, most of the focus in the test industry is in the area of automating test case execution,
and to a lesser degree, automatic test generation. These approaches have been effective and necessary;
however, they are not sufficient. There are still numerous opportunities for methodological advances in the
testing space.
Feedback, Analysis and Synthesis based Testing (FAST) attempts to solve these test problems by enabling
directed test case generation with verification. This paper explains the details of the FAST methodology and
includes an example of how the Visual C# team adopted it in recent product cycles. We also address how
FAST increases the efficiency of test organizations and allows testers to better leverage their technical skills.
176

2. Feedback, Analysis and Synthesis based Testing
Test generation is not a new concept in the testing world; many techniques have been proposed and developed
for generating tests. There are a few significant obstacles to using existing test generation techniques as a
practical and reliable testing strategy. Many test generators produce random or semi-random tests which makes
it difficult to scale to large, complex software systems. An even greater challenge with these testing
methodologies is the difficulty of generating correct verification mechanisms for the generated tests. Generating
thousands of tests randomly is a relatively easy task, but generating the corresponding verification and
validation is a more difficult task.
The FAST methodology provides a way to synthesize a controlled set of reusable tests with verification. In this
section we describe the FAST methodology to deconstruct a testing problem and how this approach enables
efficient test synthesis.
2.1 Terminology
This paper uses the following terminology:
A scenario is a narrative describing interactions between users and the system or between two software
components.
A test is a scenario coupled with the verification of the expected outcome. The terms "test" and "test case" are
used synonymously.
System Under Test (SUT) refers to an application or piece of software that is being tested.
2.2 Test Synthesis
Coming up with a test synthesis system consists of identifying testable entities in SUT and implementing the
actual test generation system. Test Synthesis has four components:
• Test Info Provider
• Test Feedback System
• Test Generator
• Test Verification System
Among the four components above, the Test Feedback System and Test Info Provider make the FAST
methodology unique compared to other test generation strategies. Figure 1 illustrates the Test Synthesis
process which is described in detail in the sections below.
177

Figure 1: FAST Test Synthesis Process
2.2.1 Test Info Providers
Info providers are domain specific tools that provide information about a scenario or test data and its execution
environment. This information is exposed so that test generators can query it programmatically. Info Providers
are either static or dynamic, depending on the type of test information they provide. The Info Providers enable
FAST to dynamically generate test cases with full verification.
Scenario
Pool
Scenario
Generators
Feedback
Loop
Hand-crafted
Scenarios
Test Plan A
Test Plan B
Test Plan C
1
2
2
3
3, 64
Test
cases+
Info Providers
Verifications
Synthesized
Scenarios
5
Test Synthesis Steps:
1. The test domain is broken down into small features or testable entities.
2. Test owners write the domain specific test generator or hand-craft the basic
scenarios mentioned in the test plan
3. The generated and hand-crafted scenarios are input into the scenario pool
4. Test generators use scenarios from the scenario pool to create new scenarios
which are fed back into the scenario pool in a feedback loop
5. At each level of generation, generators looks for interesting testing points
based on the specific feature being tested using Info Providers and generate
new scenarios
6. These scenarios act as next-level seeds, as they are fed back into the system
7. Scenarios are combined with verification to create test cases
7
178

2.2.1.1 Static Info Provider
Static Info Providers give an understanding of the symbolic information of a given input. Essentially, these are
test case analysis tools that provide a portal into the meaning and intent of a test case.
One well-known example of a Static Info Provider is FxCop, a tool that analyzes managed code for common
coding mistakes.
2.2.1.2 Dynamic Info Provider
Dynamic Info Providers give an understanding of the runtime behavior of applications and their tests.
Generators can decide how to direct test behavior based on this information. Dynamic techniques obtain the
necessary data by executing the program under test. These tools are currently much less common, but they
have the potential to enable testing more advanced and complex scenarios.
One example of a Dynamic Info Provider is a tool to profile the dynamic runtime behavior of code under
execution. Consider testing breakpoints in a debugger where the code below is passed as test data.
if (x) {
…
}
else {
…
// set breakpoint here
…
}
The execution path of the code depends on the value of ‘x’ at runtime. Static Info Providers will not be able to
determine which branch will be executed. However, with the Dynamic Info Provider, it is possible to determine
which branch is taken at runtime by a given invocation of the code path and use this information to set a
breakpoint.
2.2.2 Test Feedback System
The feedback system takes existing scenarios as inputs into generators to create more advanced scenarios.
These generated scenarios become potential inputs to subsequent iterations of the feedback loop. This system
can be viewed as a seed model where each test becomes a new scenario for future tests. By linking scenarios
together at each stage, the system can produce tests for larger components as well as the complex interactions
between components. This feedback system makes FAST unique from other test generation approaches.
2.2.3 Test Generator
A test generator produces tests in two ways:
1. Basic functional scenarios for the smallest testable entity are generated. These base-level scenarios are
stored in a common pool of scenarios.
2. Generators consume scenarios produced by multiple entities. The generators use Info Providers to
analyze the scenarios and find applicable ‘test points’ to synthesize more advanced scenarios.
This process of consumption of scenarios removes the burden from testers to come up with all the interesting
combinations of pre-defined scenarios to test a specific feature. This decreases the likelihood of accidentally
missing important test scenarios.
Note that it may not be feasible or practical to come up with generators for all features, main reason being the
cost of implementing the verification. For e.g. testing a feature may involve verifying very specific behavior that
is hard to implement in the generator. In such cases we fall back to traditional approach of manually hand-
crafting scenarios. FAST adopts a philosophy of ‘generated testing when possible; hand-crafted testing when
needed’. Regardless of how the scenarios are produced, by a generator or by hand-crafting, all the scenarios
are fed into the scenario pool for reuse.
179

2.2.4 Test Verification System
The Verification System is responsible for coming up with specific verification methods for the scenarios being
generated. In the FAST methodology, the generators control test generation based on information from the Info
Providers. Since each scenario is verifiable, and the generators only add a single atomic action per iteration,
the generators know the expected result of applying the test data to the scenarios. With this knowledge, they
can create the verification methods as the tests are synthesized.
2.3 Applying FAST to Test Legos
It is easier to understand the details of the FAST methodology by looking at an actual test domain. For this
purpose, let us assume that we are testing the contents of a box of Lego bricks. Our goal as testers is to ensure
that the Lego bricks in the box can be put together to form bigger structures.
Using the FAST methodology, we take on the problem by focusing on the basic entities inside the box – the
shapes of the Lego bricks. We define a scenario for our test domain as a structure of 0 or more bricks,
assembled together into a structure. Since we have multiple types of bricks we need to create multiple scenario
generators, one for each type of brick.
Let’s take a close look at the scenario generator for 4-stud Lego bricks, as pictured in Figure 2. This scenario
generator requires a Static Info Provider to understand the nature of 4-stud Lego bricks and how they can be
used. For example 4-stud bricks have two rows of two studs on the top and are connected to other bricks by
inserting one or more studs into another brick’s bottom.
Figure 2: Lego 4-stud Scenario Generator
The next step involves querying the scenario pool for existing scenarios. For each scenario in the scenario pool
the generator uses a Dynamic Info Provider to understand the brick structure and determine how to plug in a
new 4-stud Lego. For example, imagine that we choose a scenario consisting of a single 6-stud brick. Our 4-
stud brick can be inserted anywhere along the top or bottom of the 6-stud brick. Finding these possibilities and
choosing which one to try is called Dynamic Test Point Analysis.
180

Based on this step, verification ensures that the new 4-stud Lego has been attached correctly to the existing
Lego structure. Assuming that the process succeeds, the scenario generator completes the Feedback Loop by
adding the new 2-brick structure to the scenario pool so it can be used by other generators to build more
advanced structures.
2.4 Benefits of FAST
• High test coverage: The number of tests that are produced and the reuse of both hand-crafted and
generated tests in multiple contexts lead to high test coverage with lower marginal costs compared to
just hand-crafting tests.
• Little additional cost for cross-feature and cross-component testing: In traditional testing, new
hand-crafted tests must be written for each interaction with different features and components. The
Test Feedback System enables tests written for one test domain to be easily reused in another test
domain providing inexpensive cross-feature and cross-component testing.
• Controllable and verifiable test generation: Tests are synthesized in a directed fashion making it
attractive for functional testing and reducing the risk of large numbers of redundant tests.
• Fewer test holes and human errors in test creation: Hand-crafting each test results in logic errors in
verification and can leave holes in the test matrix coverage. Test generation removes this human error
since repetitive work is taken care of by the generators.
• More leveraged work from testers: When working at a higher level of abstraction, testers can be
more efficient at attacking a test problem.
• Lower maintenance costs: After the initial investment in building the test synthesis system, tests are
generated and executed automatically. This frees up valuable tester time to focus on finding more
subtle and interesting bugs in the product and cover more end-to-end scenarios instead of maintaining
hand-crafted tests.
2.5 Costs of FAST
• Higher initial upfront cost: Teams need to spend time building the components of FAST before they
can generate and execute tests and find bugs. As a result, bugs are not found until the execution phase
at which point a large number of bugs may be found all at once, as a large surface area is tested in a
very short period of time. In traditional methods, the testing surface grows more linearly and the bug
flow is more constant.
• Large number of generated tests: Generating all possible combination of tests can lead to exponential
test growth.
• Test failure analysis: Due to the large number of tests generated, test failure analysis can be costly,
especially at the beginning of the product cycle when the possibility of test failure is high.
181

3. Real World Example
This section describes an example where the Visual C# QA Team used the FAST methodology and the
improvements in efficiency and quality that resulted from using FAST.
3.1 Example
The Visual C# QA team used FAST as the primary strategy to test ‘LINQ to SQL’. LINQ to SQL is an O-R
mapping engine for SQL.
To better understand how the FAST methodology is applied we will look at the Create, Update and Delete
(CUD) functionality in ‘Linq to SQL’. This feature exposes an object model to allow users to insert, update and
delete records to and from a database through the ‘Linq to SQL’ framework.
Scenario Pool
Feedback loop
Delete Test Plan
Insert Test Plan
Delete Scenario
Generator
Insert Scenario
Generator
Information Providers
Figure 3: First Level Generation of Insert and Delete Scenarios
182

Figure 4: Second Level Generation of Insert and Delete Scenarios
3.1.1 Breaking down the problem
Bottom-Up Approach
CUD by itself is a fairly complex feature. Operations can be performed multiple times on any data schema, and
there are intimate interactions with many related features such as transactions, optimistic concurrency detection
and resolution. In a top-down approach, Insert, Update, Delete, transactions, optimistic concurrency detection
and resolution can all be considered separate sub-features of CUD. Each would be tested individually, possibly
leading to redundancies in the scenarios, test data, and verification schemes.
Using a bottom-up approach, the atomic entities of CUD are identified as a) Insert b) Update and c) Delete.
These atomic entities serve as the building blocks on which testing all related functionality is based. For brevity
purposes only Insert and Delete are considered in the rest of the section.
Separation of Concerns
Once the basic testable entities are identified, the next step is to come up with the scenarios, test data and
verification methods to be used for testing this feature. The scenarios for this example are: ‘Insert a new
record’, ‘Delete an existing record’, etc. The test data includes different kinds of database schemas and row
values. The verification method needs to ensure that the data is saved correctly in the database after operations
are performed and that the user’s object model reflects these operations. The test data, generation and
verification are treated as separate tasks and handled separately from scenario generation. This enables
reusing the scenarios, test data and verification methods in other contexts.
The outcome of the above two steps are a test plan capturing all the necessary information: test scenarios for
insert and delete, test data and verification.
183

3.1.2 Test Synthesis
Test Feedback System
Generating the basic scenarios provides good coverage across the core features of Insert and Delete. The next
step leverages the test generators and scenarios to produce more advanced scenarios. This step uses the basic
scenarios as seeds which are input back into the scenario pool for the next level of generation.
In our example, the insert generator produces the initial scenario of inserting a single record. The delete
generator produces a scenario for deleting a single record. These tests are represented as level-1 tests in
Figure 3. When a level-1 test is fed back into the system, more advanced scenarios that consist of two
operations are generated; for example, a test to insert a record and then delete a record, or a test to insert two
records in succession. These are referred to as level-2 tests in Figure 4. This feedback can continue as the tests
grow in depth and complexity until a desired level is achieved.
Test Info Provider
Two test Info Providers were developed to test the CUD feature:
1. The first Info Provider provides information on the scenario by analyzing the input seed scenarios and
determining what operations can be appended to produce new scenarios.
2. The second Info Provider provides information on the test data by querying the database to provide data
values (records) which are then added to the test.
Test Generator
The generator analyzes the tests to control the test synthesis. After choosing a scenario, it uses the Info
Provider to analyze the test and dynamically discover appropriate test points. We can generate all the level-1
scenarios for Insert and Delete and store them as test data in a database. The generators can pull the test data
from the scenario pool to produce new tests. The Dynamic Info Provider adds logic to the system, by analyzing
the scenarios in the pool and ensuring that the generated tests are valuable. In our specific example, at each
level the delete generator asks the Info Provider to inspect the database and determine what records exist to
make sure that it only deletes records that exist. Similarly, the insert generator asks the Info Provider to see
what records exist to make sure that it does not add a record that already exists.
As with the original scenarios, the new scenarios are fed back into the system and are available for generating
the level-3 scenarios.
Verification
Two core principles of our compositional test synthesis technique makes the verification step straight forward:
1. Basic steps are added incrementally at each level of generation.
2. The Info Provider has all the information necessary to generate the incremental step.
Consequently, test verification is reduced to verifying that the incremental step functions correctly. In other
words, all previous steps are verified by previous tests. As long as the initial scenarios are verifiable, verification
of more advanced scenarios grows compositionally.
In the Insert/Delete example, the basic verification is a check that the simple Insert or Delete operation
succeeded. This is done by querying for the appropriate record in the database. For subsequent levels of tests,
the verification only needs to add a check for the last operation using the results of the input scenario as a
baseline. For example, for an {Insert + Delete} test produced by taking an Insert scenario and adding a new
Delete operation, the basic {Insert} test has already been verified, so the new test only has to verify the new
operation {Delete}. By taking a snapshot of the database before and after each new operation, we can ensure
that the only difference is the deleted record. The same logic can be applied to verify any number of operations
where the tests are incrementally generated and verified before generating the next level of tests.
184

4. Conclusion
Machine time is inexpensive compared to human time. Test automation attempts to take advantage of machine
resources, but often relies on hand-crafting for test authoring which makes test development a time consuming
process. FAST helps in automating the test authoring process and allows testers to focus on more challenging
test problems.
The FAST methodology overcomes the limitations of hand-crafting tests and enables generation of highly
effective tests with full verification. This makes it very attractive for use in functional testing. The Test Feedback
System and Test Info Provider are unique components of FAST that take generation techniques to the next
level, by adding measures of directed generation and integrated verification. Furthermore, FAST enables a
system where tests are reusable in multiple contexts giving extensive coverage to cross-component and cross-
feature testing with little additional cost.
FAST can also be a huge asset for test teams and individual testers as it frees them from much of the mundane
and repetitive tasks associated with hand-crafting and maintaining tests. This leads to more effective testers as
they can focus their creativity and technical skills on more complex testing problems.
We believe that it is an exciting time to explore test generation and that the FAST methodology can help teams
solve test problems in a directed way.
Acknowledgements
Many thanks to everyone who reviewed this paper including Luca Bolognese, Anson Horton, Dinesh Kulkarni,
Alan Page, Min Kwan Park, Suma Sushilendra, Simon Tam, Mads Torgersen, Steve Toscano and Santosh
Zachariah. Special thanks to Adam Braden, Jason Cooke, Kathy Lu and Rusty Miller for giving us great
feedback at all hours of the day and night. We want to explicitly acknowledge our Test Manager, Rusty Miller,
for encouraging us to invest in new testing techniques. Finally, we want to thank the entire Visual C# team for
assisting our efforts to make testing more efficient and productive.
References
1. Michael Hunter, ”Verily, 'Tis Truth”, The Braidy Tester, July 20, 2005,
<http://blogs.msdn.com/micahel/archive/2005/07/20/VerilyTisTruth.aspx>
2. Jeffrey Liker, Toyota way The Toyota Way: 14 Management Principles From The World's Greatest
Manufacturer (New York: McGraw-Hill, 2004)
185

186

Ultra Lightweight Software Test Automation (ULSTA) in an Agile Environment
Presented at the 2007 Pacific Northwest Software Quality Conference
October 8 - 10, 2007
Portland, Oregon
by Dr. James McCaffrey
Volt Information Sciences, Inc.
Abstract
Creating software test automation is frequently difficult in an Agile software development environment. In
a fast-paced Agile setting, the time required to create much traditional software test automation can
render the test automation obsolete before the automation can be deployed. A growing trend in software
quality assurance is the increasing use of ultra lightweight software test automation (ULSTA). Ultra
lightweight software test automation is characterized by being script-based, short, quick to write, and
disposable. Script-based test automation is automation which can be created using a simple text editor
and which can run on a host system with minimal overhead. In non-Windows operating system
environments, JavaScript and Perl are usually the best choices of programming languages because of
their maturity and extensive libraries of support routines. In a Windows operating System environment,
Windows PowerShell is the clearly the best choice of language because of PowerShell's .NET support
and interactive capabilities. In the context of ultra lightweight software test automation, "short" test
automation generally means two pages of code or less. Similarly, in an ULSTA context, "quick to create"
generally means the automation can be written by an average-skilled SQA engineer in two hours or less.
All ultra lightweight software test automation is disposable by design. A typical life span for an ULSTA
script is one Agile iteration, often roughly two to four weeks. This paper presents concrete examples of
four types of software test automation where ultra lightweight test automation has proven to be especially
effective: automated unit testing, application UI test automation, automated Web application HTTP
request-response testing, and Web application UI test automation. The four ULSTA examples are
presented using Windows PowerShell, the new Windows-based command shell and scripting language
which are essentially replacements for the old cmd.exe command shell and .bat files. The use of ultra
lightweight software test automation is most appropriate to replace mundane manual test activities,
freeing up a software quality engineer's time to perform more advanced, important, and interesting test
activities where the engineer's experience and intuition play a large role.
Author
Dr. James McCaffrey works for Volt Information Sciences, Inc., where he manages technical training for
software engineers working at Microsoft's Redmond, Washington campus. He has worked on several
Microsoft products including Internet Explorer and MSN Search. James has a doctorate from the
University of Southern California, an M.S. in Information Systems from Hawaii Pacific University, a B.A. in
Mathematics from California State University at Fullerton, and a B.A. in Psychology from the University of
California at Irvine. James is a Contributing Editor for Microsoft MSDN Magazine and is the author of
".NET Test Automation Recipes" (Apress, 2006). He can be reached at [email protected] or v-
187

===== 1.0 Introduction =====
The growing popularity of the use of Agile software development methodologies has increased the
importance use of lightweight test automation. Because Agile development iterations are short (often two
to four weeks), a testing effort cannot take months to create sophisticated test automation -- the
automation is obsolete before it can be used. Although lightweight test automation is nothing new, my
colleagues and I have recently observed a significant increase in the use of what we call ultra lightweight
software test automation (ULSTA) techniques. We have somewhat arbitrarily defined ULSTA test
automation as characterized by being script-based (Perl, VBScript, Windows PowerShell, and so on),
short (two pages of code or less), quick to write (two hours or less by an average-skilled test engineer),
and disposable by design (generally retired after two to four weeks). The purpose of this paper is to
describe some specific techniques and general principles of ultra lightweight software test automation and
to describe how the use of ULSTA techniques fits with other testing techniques.
A non-published, internal 2005 survey of over 100 Microsoft software test managers with hiring authority
identified four fundamental testing activities (meaning most managers picked these techniques as being
important for their software test engineers to understand and perform). These four testing techniques are:
module/unit testing, Windows form-based application UI testing, HTTP request-response testing, and
Web application UI testing. In order to give you a broad view of ULSTA techniques, in this paper I present
ultra lightweight software test automation examples of each of these four types of testing. In the sections
of this paper that follow, I first present a simplistic but representative Windows form-based application and
an analogous Web application (in section 2.0), which will serve as the basis for my four ULSTA examples.
Next I present examples of ULSTA
• module/unit testing (section 3.0)
• Windows form-based UI testing (section 4.0)
• request-response testing (section 5.0)
• Web application UI testing (section 6.0)
I conclude with a discussion (section 7.0) of some of the key advantages and disadvantages of ultra
lightweight software test automation compared to other testing approaches so that you can decide how
and when to use ULSTA techniques in your particular development environment.
My test automation examples all use Windows PowerShell, the new Microsoft shell environment and
scripting language. Windows PowerShell incorporates many of the best features of older scripting
languages and can directly call into the extensive .NET Framework library. And although Windows
PowerShell is clearly the best choice of scripting language for ultra lightweight software test automation
for Microsoft-based applications, let me emphasize that ULSTA principles are not language-specific (Perl,
Python, Ruby, JavaScript, and so on are all excellent choices) and ULTSA principles apply to software
applications written with non-Microsoft-specific languages such as C++ and Java. In order to fully
understand ultra lightweight software test automation it is important to see actual ULSTA code. However,
because of space limitations it is not practical to present all the code for both application examples and
the four ULSTA example scripts. This paper presents the just key code for each application and example.
The complete code for all the programs discussed in this paper is available at
http://207.115.81.187/PNSQC2007/default.html.
188

===== 2.0 The Example Applications under Test =====
In this section I present two simple but representative example applications which will serve as the targets
for the four ultra lightweight software test automation examples presented in sections 3.0 through 6.0 of
this paper. The screenshot in Figure 1 shows a Windows form-based application named StatCalcApp
which accepts a variable number of integer inputs from the user and computes a mean (arithmetic,
geometric, or harmonic) of those inputs. The arithmetic mean is just a simple average and is used for
ordinary values, the geometric mean is used for ratio values, and the harmonic mean is used for rate
values. For example, the (arithmetic) mean of 30 grams and 60 grams is (30 + 60) / 2 = 45.00 grams. The
(geometric) mean of ratios 30:1 and 60:1 is sqrt(30 * 60) = 42.43:1, and the (harmonic) mean of 30 miles
per hour and 60 miles per hour over a fixed distance is 2 / (1/30 + 1/60) = 40.00 miles per hour, not (30 +
60) / 2 = 45.00 miles per hour, a common mistake. Behind the scenes, the StatCalcApp application calls
into a DLL code library named StatCalcLib.dll which actually computes the indicated mean.
Figure 1 - The Windows-Based StatCalcApp Application under Test
The screenshot in Figure 2 shows a Web-based application which closely mirrors the Windows form-
based application. The Web application accepts user input, and submits the input as an HTTP request
when the Calculate button is pressed. The Web server accepts the input, computes the indicated mean,
constructs a new Web page with the computed mean, and returns the Web page as an HTTP response
back to the client where the page is rendered by the Web browser (Internet Explorer in this case).
189

Figure 2 - The StatCalc Web Application under Test
Behind the scenes, the Web application uses ASP.NET technology with the C# programming language.
The mathematical calculations are performed directly on the Web server. Let me emphasize that although
both target applications are based on the C# language, the ULSTA techniques and principles I present in
this paper also apply to applications which are based on non-Microsoft technologies (for example, Java
and PHP). The structure of the StatCalcLib library is:
using System;
namespace StatCalcLib {
public class Methods {
public static double ArithmeticMean(params int[] vals) { . . . }
private static double NthRoot(double x, int n) { . . . }
public double GeometricMean(params int[] vals) { (calls NthRoot }
public static double HarmonicMean(params int[] vals) { . . . }
}
} // ns
Notice that each of the three Mean methods can accept a variable number of arguments because of the
use of the C# params keyword. Also notice that the public GeometricMean() method calls a private
NthRoot() helper method. The ArithmeticMean() and HarmonicMean() methods are static and so
will be called in a class context, but GeometricMean() is somewhat artificially an instance method (just
so I can demonstrate testing an instance method) and so will be called in an object context.
190

For simplicity, all the logic of the StatCalcApp application is placed inside button1_Click() method
which handles the click event for the button1 control:
private void button1_Click(object sender, EventArgs e) {
string[] sVals = textBox1.Text.Split(' ');
int[] iVals = new int[sVals.Length];
for (int i = 0; i < iVals.Length; ++i)
iVals[i] = int.Parse(sVals[i]);
if (radioButton1.Checked)
textBox2.Text = Methods.ArithmeticMean(iVals).ToString("F4");
else if (radioButton2.Checked) {
Methods m = new Methods();
textBox2.Text = m.GeometricMean(iVals).ToString("F4");
}
else // if (radioButton3.Checked)
textBox2.Text = Methods.HarmonicMean(iVals).ToString("F4");
}
I am deliberately not using good coding style so that I can keep my examples relatively short and simple.
Poor coding style also approximates the crude nature of application code in early iterations of the
development process, which is often when test automation is most useful. Because of the unifying effect
of the .NET Framework, the code for the StatCalc Web application shown running in Figure 2 is virtually
identical to the code for the form-based StatCalcApp. For the StatCalc Web application, the
ArithmeticMean(), GeoemetricMean(), and HarmonicMean() methods are placed directly inside
a local class definition rather than an external class library.
191

===== 3.0 Ultra Lightweight Module Test Automation =====
Arguably the most fundamental type of test automation is automated module testing. The idea is to test
the underlying building blocks of an application rather than the application as a whole. Module testing is
also sometimes called unit testing, component testing, and API testing. Technically the terms are quite
different, but in casual usage you can think of the terms as having roughly the same meaning. In this
section I present example ultra lightweight test automation which tests the underlying StatCalcLib library
that contains the mathematical functionality for the Windows form-based StatCalcApp application shown
in Figure 1. The screenshot in Figure 3 shows a simple ultra lightweight software test automation module
test run.
Figure 3 - ULSTA Module Testing
The Windows PowerShell test harness begins by loading the DLL under test:
write-host "Loading library StatCalcLib.dll `n"
[Reflection.Assembly]::LoadFile('C:\ULSTA\StatCalcLib\bin\ Debug\StatCalcLib.dll') |
out-null
192

When testing Windows-based software, an advantage of Windows PowerShell compared to other
scripting languages is PowerShell's ability to directly call the .NET Framework as shown here with the call
to LoadFile(). Of course other scripting languages can load .NET libraries but Windows PowerShell
makes this task especially easy. Next the test harness reads information from a test case file and iterates
through each line of the file; each line represents one test case.
$f = get-content '.\testCases.txt'
foreach ($line in $f)
{
# process each test case here
}
write-host "`nEnd test run`n"
The entire contents of file testCases.txt are read into memory using the intrinsic Windows PowerShell get-
content cmdlet (pronounced "command-let") which simplifies processing text files compared to explicit
line-by-line techniques. The dummy test case file used for the test run shown in Figure 5 is:
001 : ArithmeticMean : 2,4,8 : 4.6667
002 : ArithmeticMean : 1,5 : 3.0000
003 : GeometricMean : 2,4,8 : 5.0000 : deliberate error
004 : GeometricMean : 0,0,0 : 0.0000
005 : HarmonicMean : 30,60 : 40.0000
006 : HarmonicMean : 2,4,8 : 3.4286
Each line represents a test case ID, a method to test, a set of inputs, and an expected value. Test case
003 is a deliberate error for demonstration purposes (the geometric mean of 2, 4, and 8 is 4.0000). Inside
the main processing loop, the test harness tokenizes each line of input using the String.Split()
method:
($tokens) = $line.split(':')
$caseID = $tokens[0]
$method = $tokens[1].trim()
$inp = $tokens[2].trim()
$expected = $tokens[3].trim()
($inputs) = $inp.split(',')
After parsing out colon-delimited test case information, the harness parses the comma-delimited input
vector into an array named $inputs. Windows PowerShell variable/object names begin with the '$'
character and PowerShell is not case sensitive. The parentheses syntax around $tokens and $inputs is
an optional implicit array-type declaration. Processing each test case follows the usual test automation
pattern of first calling the object under test with the test case input set, and then fetching a return state or
value:
if ($method -eq "ArithmeticMean") {
$actual = [StatCalcLib.Methods]::ArithmeticMean($inputs)
$a = "{0:f4}" -f $actual
}
elseif ($method -eq "GeometricMean") {
$m = new-object StatCalcLib.Methods
$actual = $m.GeometricMean($inputs)
$a = "{0:f4}" -f $actual
}
// etc.
The syntax shown here is specific to Windows PowerShell but the principle is identical for virtually any
scripting language. In this example, the "{0:f4}" formats the actual result to four decimal places. Once
a return state is determined, determining a test case pass or fail result is simply a matter of comparing the
actual state with the test case expected state:
193

if ($a -eq $expected) {
write-host " Pass " -backgroundcolor green -foregroundcolor darkblue
}
else {
write-host "*FAIL*" -backgroundcolor red
}
Notice that this compares the formatted string version of the actual result to the (string) expected result.
Windows PowerShell supports exception handling, so it is possible to catch fatal errors inside the main
processing loop:
trap {
write-host "Fatal error trapped at case " $caseID
continue
}
194

===== 4.0 Ultra Lightweight UI Test Automation =====
Before the availability of managed code, writing application UI test automation with C++ or Visual Basic
was very difficult and time-consuming. In this section I present an example of ultra lightweight UI test
automation for the Windows form-based StatCalcApp application. The screenshot in Figure 4 shows a
sample test run.
Figure 4 - ULSTA Application UI Testing
The first few lines of output in Figure 4 suggest, correctly, that I have written a small custom UI
automation library which has eight Windows PowerShell cmdlets: get-window, get-control, get-
controlByIndex, send-chars, send-click, get-listBox, send-menu, and get-textBox. Most scripting
languages provide you with the ability to create custom libraries, and Windows PowerShell is no different.
With Windows PowerShell you can create custom cmdlets using C#. For example, the code for my get-
window cmdlet is:
[Cmdlet(VerbsCommon.Get, "Window")]
public class GetWindowCommand : Cmdlet
{
[DllImport("user32.dll", EntryPoint="FindWindow", CharSet=CharSet.Auto)]
static extern IntPtr FindWindow(string lpClassName, string lpWindowName);
private string windowName;
[Parameter(Position = 0)]
public string WindowName {
get { return windowName; }
195

set { windowName = value; }
}
protected override void ProcessRecord()
{
IntPtr wh = FindWindow(null, windowName);
WriteObject(wh);
}
}
Essentially I simply wrap a call to the FindWindow() Win32 API function using the P/Invoke mechanism.
My implementation class inherits from a Cmdlet class which does most of the behind-the-scenes
plumbing. Because Windows PowerShell is based on a pipeline architecture, I return my result (a handle
to a window control) using a special WriteObject() method rather than by using the "return" keyword. The
Reference and Resources section of this paper has a reference to information on creating custom UI
automation cmdlets. With a UI automation library in place, it is very easy to write ULSTA test automation.
The script which generated the output shown in Figure 4 begins by launching the StatCalcApp application
with:
write-host "`nLaunching application to automate"
invoke-item '..\StatCalcApp\bin\Debug\StatCalcApp.exe'
[System.Threading.Thread]::Sleep(4000)
Then the automation harness obtains handles to controls on the application with code like:
$app = get-window "StatCalcApp"
$tb1 = get-controlByIndex $app 4
$btn = get-control $app "Calculate"
And the application can now be easily manipulated with code like:
write-host "`nSending '2 4 8' to textBox1"
send-chars $tb1 "2 4 8"
write-host "Clicking 'Calculate' button"
send-click $btn
The state of the application can be checked and a test scenario pass/fail result can be determined:
$result = get-textbox $tb2
if ($result -eq '4.6667') {
write-host "Found '4.6667' in textBox2!"
}
else {
write-host "Did NOT find '4.6667' in textBox2"
$pass = $false
}
The entire script which generated the screenshot in Figure 4 is less than one page of code and required
less than one hour to create. Of course the custom UI automation library does most of the work, but even
that library is less than four pages of code and required less than four hours to create.
196

===== 5.0 Ultra Lightweight HTTP Request-Response Test Automation =====
The most fundamental type of test automation for Web applications is HTTP request-response testing. In
this type of testing, the test harness sends a programmatic HTTP request to the Web application under
test; the Web server processes the request and generates an HTTP response which is sent back to the
test harness. The test harness then examines the response for an expected value. The screenshot in
Figure 5 shows an example of ULSTA request-response testing.
Figure 5 - ULSTA HTTP Request-Response Testing
The heart of HTTP request-response test automation is code which sends an HTTP request. In the case
of Windows PowerShell, you can create an HttpWebRequest object using the Create() method of the
WebRequest class in the System.Net namespace:
[net.httpWebRequest] $req = [net.webRequest]::create($url)
$req.method = "POST"
$req.ContentType = "application/x-www-form-urlencoded"
$req.ContentLength = $buffer.length
$req.TimeOut = 5000
Once the HttpWebRequest object is created, you can set up post data. For example, the automation code
shown executing in Figure 5 contains embedded test case data:
$cases = (
'0001,TextBox1=2 4 8&Means=RadioButton3&Button1=clicked,value="3.4286"',
'0002,TextBox1=1 5&Means=RadioButton1&Button1=clicked,value="2.0000"',
'0003,TextBox1=0 0 0 0&Means=RadioButton2&Button1=clicked,value="0.0000"'
)
197

You can interpret the first test case as: the test case ID is #0001, with inputs TextBox1=2 4 8, and
Means=RadioButton3, with an action of Button1=clicked, and an expected result of value="3.4286". If you
parse this test case data, you can set up post data like:
$postData = $input
$postData += '&__VIEWSTATE=' + $vs
$postData += '&__EVENTVALIDATION=' + $ev
$buffer = [text.encoding]::ascii.getbytes($postData)
This code modifies the post data by appending ViewState and EventValidation values. These values are
necessary for ASP.NET Web applications and can be obtained by a helper method. Now you can simply
write the post data into a RequestStream object and then fetch the entire response stream:
[net.httpWebResponse] $res = $req.getResponse()
$resst = $res.getResponseStream()
$sr = new-object IO.StreamReader($resst)
$result = $sr.ReadToEnd()
At this point, you have the HTTP response as a string and can search for the presence of a key substring
(such as value="3.4286") in the response and then determine a test case pass or fail result:
if ($result.indexOf($expected) -ge 0) {
write-host " Result = Pass" -foregroundcolor green
}
else {
write-host " Result = *FAIL*" -foregroundcolor red
}
Ultra lightweight software test automation techniques are particularly powerful for HTTP request-response
testing. The code for the example shown in Figure 5 took less than 30 minutes to create, and is less than
one page of code.
198

===== 6.0 Ultra Lightweight Web Application UI Test Automation =====
The increasing use of Web applications has made Web application UI test automation increasingly
important and valuable in the software development process. ULSTA techniques for Web application UI
testing are useful because you can perform a complete end-to-end test of your system. The screenshot in
Figure 6 shows an example of ULSTA Web application UI testing in action.
Figure 6 - ULSTA Web Application UI Testing
The basis of the Windows PowerShell automation technique illustrated in Figure 6 is a set of custom
cmdlets which can access and manipulate the client area of a Web browser. In the example in Figure 6, I
have created and registered four custom cmdlets: get-browserCount, set-url, get-inputElement, and get-
selectElement. The key code for the get-inputElement custom cmdlet is:
protected override void ProcessRecord()
{
SHDocVw.ShellWindows browserColl = new SHDocVw.ShellWindows();
int i = 0;
SHDocVw.InternetExplorer ie = null;
while (i < browserColl.Count && ie == null) {
SHDocVw.InternetExplorer e = (InternetExplorer)browserColl.Item(i);
if (e.HWND == (int)p.MainWindowHandle) {
ie = e;
}
++i;
}
HTMLDocument doc = (HTMLDocument)ie.Document;
HTMLInputElement hie = (HTMLInputElement)doc.getElementById(elementID);
WriteObject(hie);
}
199

I use functions in the SHDocVw.dll classic COM library to fetch a collection of active shell windows
(instances of Windows Explorer, Internet Explorer, and so on), and an instance of an InternetExplorer
object. Then after I identify the browser that is hosting my Web application under test, I can use the
Document property of the InternetExplorer object and HTML-related definitions which are housed in the
mshtml.dll primary interop assembly to get a reference to an HTML element (such as a button or textbox
control). Notice that this technique is browser-specific (Internet Explorer in this case) but the technique
can be extended to any browser which has libraries which expose the browser's Document Object Model.
With a tiny custom UI automation library in place, it is relatively easy to write ultra lightweight software test
automation. I can use the static Start() method to launch a Web browser:
write-host 'Launching IE'
$ie = [Diagnostics.Process]::Start('iexplore.exe', 'about:blank')
[System.Threading.Thread]::Sleep(5000)
After a delay to give the browser a chance to fully launch, I can load my application under test:
write-host 'Navigating to StatCalc Web application'
set-url $ie 'http://localhost/StatCalc/Default.aspx'
Next I can obtain references to controls I wish to manipulate:
write-host "`nGetting controls"
$tb1 = get-inputElement $ie 'TextBox1'
$rb1 = get-inputElement $ie 'RadioButton1'
$btn = get-inputElement $ie 'Button1'
Then I can use various HTML element properties and methods to manipulate the Web application under
test:
write-host "Setting input to 30 60"
$tb1.value = "30 60"
write-host "Selecting 'Harmonic Mean' option"
$rb3.checked = $true
write-host "`nClicking button"
$btn.click()
And I can determine a test scenario pass/fail result by examining the Web application's controls for
expected values:
$ans = get-inputElement $ie 'TextBox2'
if ($ans.value -eq '40.0000') {
write-host "`nTest scenario: Pass" -foregroundcolor 'green'
}
else {
write-host "`nTest scenario: *FAIL*" -foregroundcolor 'red'
}
Although there are several alternatives to Web application UI automation, for relatively simple scenarios
an ultra lightweight software test automation approach is quick, easy, and efficient. Complex scenarios,
such as testing Web applications with custom controls, or applications which use AJAX technology, are
often best tested by non-ULSTA techniques.
200

===== 7.0 Conclusion =====
The preceding sections of this paper have demonstrated concrete examples of ultra lightweight software
test automation techniques for four fundamental testing activities: module/unit testing, Windows form-
based application UI testing, HTTP request-response testing, and Web application UI testing. Although
there are minor technical challenges to overcome with each ULSTA technique, the more interesting issue
is deciding when ULSTA techniques are appropriate to use and when other manual or automation testing
approaches are better choices. The advantages of test automation over manual testing can be
summarized by the acronym SAPES -- compared to manual testing, automation has superior speed,
accuracy, precision, efficiency, and skill-building. Automation can execute many thousands of test cases
per hour, but manual testing is generally limited to about 100 test cases at most per day. Test automation
is not subject to common errors that occur in manual testing such as forgetting to execute a test case or
incorrectly recording a test result. Test automation executes the same way every time it is run, but manual
testing, even when very carefully specified, usually is performed slightly differently by different testers.
(However, executing test cases slightly differently does have certain advantages such as helping to
uncover bugs due to timing issues). Automation is far more efficient than manual testing; automation can
run unattended, say overnight. And writing test automation actively enhances a test engineer's skill set
while mundane manual testing can be mind-numbingly boring. Now this is not to say that test automation
can replace manual testing. Test automation is ideal for repetitive, simple test cases, which frees you up
for interesting manual test scenarios where your intuition and experience play a key role.
The two main automation-based alternatives to ultra lightweight software test automation techniques are
using commercial test frameworks and writing traditional custom test automation. There are many
excellent commercial test frameworks available from companies such as Mercury (HP), Segue, and
Rational (IBM). The advantages of using a commercial test automation framework include a huge set of
automation tools and integration with bug-reporting, version control, test case management, and similar
tools. However, commercial frameworks have a very high initial cost, and have a long and steep learning
curve. Additionally, in my opinion and based on my experience, when using a commercial test framework,
there is very strong tendency to test a system based on the capabilities of the test framework rather than
on solid testing principles. For example, if a commercial framework has a great record-playback feature, I
tend to find myself doing a lot of record-playback type testing regardless of how appropriate that type of
testing is for the system.
Ultra lightweight software test automation is characterized by being script-based, short, quick to create,
and disposable by design. Traditional test automation has several advantages compared to ULSTA
techniques. Consider Web application UI automation created using the C++ language or Java with an IDE
such Visual Studio or NetBeans. Such an automation environment gives you easy access to code
debuggers, an integrated help system, and the ability to create very complex programs. However, in
some cases traditional test automation is somewhat more difficult and time-consuming to create than
script-based test automation. Additionally, when creating traditional test automation I have observed a
very strong tendency for what I call "test spec-lock". By this I mean I can find myself planning my test
automation specifications for days and days, or even weeks and weeks, and never getting any actual
testing done. Ultra lightweight software test automation implicitly encourages you to dive right in and get
test automation up and running quickly. This is not to say that ULSTA techniques should completely
replace commercial test frameworks and traditional test automation; my argument is that ULSTA
techniques nicely complement these other approaches.
Although every testing situation is different, there are some general principles that guide how and when to
use ultra lightweight software test automation techniques. In an Agile software development environment,
each iteration, in theory at least, produces a software system which is a possible release version of the
system. So, compared to the steps in traditional development methodologies, each Agile iteration is to
some extent relatively independent of other iterations. This leads to an increased need for disposable
software test automation -- because many test cases and scenarios are specific to a particular iteration,
you must be able to quickly create your test automation, and not hesitate to get rid of the automation
when necessary. Let me emphasize again that ULSTA techniques complement rather than replace other
201
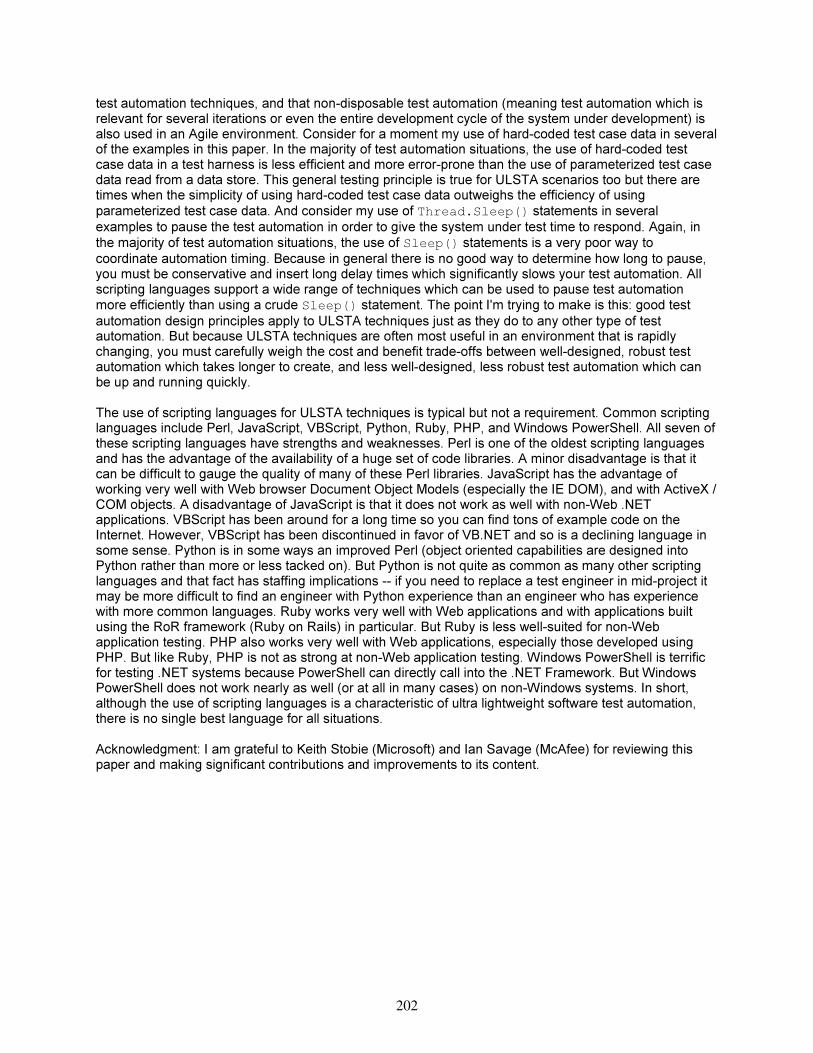
test automation techniques, and that non-disposable test automation (meaning test automation which is
relevant for several iterations or even the entire development cycle of the system under development) is
also used in an Agile environment. Consider for a moment my use of hard-coded test case data in several
of the examples in this paper. In the majority of test automation situations, the use of hard-coded test
case data in a test harness is less efficient and more error-prone than the use of parameterized test case
data read from a data store. This general testing principle is true for ULSTA scenarios too but there are
times when the simplicity of using hard-coded test case data outweighs the efficiency of using
parameterized test case data. And consider my use of Thread.Sleep() statements in several
examples to pause the test automation in order to give the system under test time to respond. Again, in
the majority of test automation situations, the use of Sleep() statements is a very poor way to
coordinate automation timing. Because in general there is no good way to determine how long to pause,
you must be conservative and insert long delay times which significantly slows your test automation. All
scripting languages support a wide range of techniques which can be used to pause test automation
more efficiently than using a crude Sleep() statement. The point I'm trying to make is this: good test
automation design principles apply to ULSTA techniques just as they do to any other type of test
automation. But because ULSTA techniques are often most useful in an environment that is rapidly
changing, you must carefully weigh the cost and benefit trade-offs between well-designed, robust test
automation which takes longer to create, and less well-designed, less robust test automation which can
be up and running quickly.
The use of scripting languages for ULSTA techniques is typical but not a requirement. Common scripting
languages include Perl, JavaScript, VBScript, Python, Ruby, PHP, and Windows PowerShell. All seven of
these scripting languages have strengths and weaknesses. Perl is one of the oldest scripting languages
and has the advantage of the availability of a huge set of code libraries. A minor disadvantage is that it
can be difficult to gauge the quality of many of these Perl libraries. JavaScript has the advantage of
working very well with Web browser Document Object Models (especially the IE DOM), and with ActiveX /
COM objects. A disadvantage of JavaScript is that it does not work as well with non-Web .NET
applications. VBScript has been around for a long time so you can find tons of example code on the
Internet. However, VBScript has been discontinued in favor of VB.NET and so is a declining language in
some sense. Python is in some ways an improved Perl (object oriented capabilities are designed into
Python rather than more or less tacked on). But Python is not quite as common as many other scripting
languages and that fact has staffing implications -- if you need to replace a test engineer in mid-project it
may be more difficult to find an engineer with Python experience than an engineer who has experience
with more common languages. Ruby works very well with Web applications and with applications built
using the RoR framework (Ruby on Rails) in particular. But Ruby is less well-suited for non-Web
application testing. PHP also works very well with Web applications, especially those developed using
PHP. But like Ruby, PHP is not as strong at non-Web application testing. Windows PowerShell is terrific
for testing .NET systems because PowerShell can directly call into the .NET Framework. But Windows
PowerShell does not work nearly as well (or at all in many cases) on non-Windows systems. In short,
although the use of scripting languages is a characteristic of ultra lightweight software test automation,
there is no single best language for all situations.
Acknowledgment: I am grateful to Keith Stobie (Microsoft) and Ian Savage (McAfee) for reviewing this
paper and making significant contributions and improvements to its content.
202

===== 8.0 References and Resources =====
Complete source code for all the examples in this paper is available at
http://207.115.81.187/PNSQC2007/default.html.
Information about Windows PowerShell, Microsoft's new shell environment and scripting language which
is used for the examples in this paper, is available at: http://www.microsoftcom/powershell/.
Information on creating custom Windows PowerShell cmdlet libraries, a key to the UI test automation
techniques presented in this paper, is available at: http://msdn2.microsoft.com/en-
us/library/ms714395.aspx.
An in-depth explanation of ultra lightweight software test automation for module testing is: McCaffrey,
James D., "Lightweight Testing with Windows PowerShell", MSDN Magazine, May 2007, Vol. 21, No. 5.
Available online at: http://msdn.microsoft.com/msdnmag/issues/07/05/TestRun/default.aspx.
An in-depth explanation of the UI automation techniques presented in this paper is: McCaffrey, James D.,
".NET Test Automation Recipes", Apress Publishing, 2006, ISBN: 1-59059-6633.
<end of document>
203

204

The “Swim” System for
User-Oriented Presentation of
Test-Case Results
Ward Cunningham
Chief Technology Officer, AboutUs
Ward Cunningham is CTO of AboutUs.org, a growth company hosting the communities formed
by organizations and their constituents.Ward is well known for his contributions to the
developing practice of object-oriented programming, the variation called Extreme Programming,
and the communities supported by his WikiWikiWeb. Ward hosts the AgileManifesto.org. He is
a founder of the Hillside Group and there created the Pattern Languages of Programs conferences
which continue to be held all over the word.
Bjorn Freeman-Benson
Director, Open Source Process, Eclipse Foundation
While striving to be a Renaissance Man, Bjorn keeps falling back into the clutches of conformity
with engineering stereotypes such as dynamic languages, software engineering, juggling and
general aviation. His escape attempts have been through orienteering, bicycling, planting trees
and painting his airplane. He is passionate about doing things instead of just talking about them,
and he thoroughly enjoys the annual party he helps organize for the Eclipse community.
Karl Matthias
Systems Administrator, Eclipse Foundation
Karl is the Portland arm of the IT team and isn't the "new guy" at the Foundation any more
(thanks Chris!). When he's not supporting the infrastructure, working on the portal, or knocking
items off of Bjorn's wish list, he's in the garage restoring his 1969 Alfa Romeo GTV.
Abstract
We describe "Swim", an agile functional testing system inspired by FIT, the Framework for
Integrated Test, and exceeding FIT's capabilities through the inclusion of an end-user-accessible
results-rendering engine. Its output allows developers, testers and end-users to explore business
logic and consequent output from multiple points of view and over extended periods of time.
We've incorporated this engine in the Eclipse Foundation portal to support situated reasoning
about foundation processes and their automation.
205

The “Swim” System for
User-Oriented Presentation of
Test-Case Results
Ward Cunningham, AboutUs
Bjorn Freeman-Benson, Eclipse Foundation
Karl Matthias, Eclipse Foundation
Introduction
As staff members of the Eclipse Foundation, we faced the challenge of automating many of our
manual workflows while minimizing the cost of doing so. Having seen similar efforts fail, we
chose a new design point that we believed would entice more of our stakeholders to participate.
This paper is about that design point and its success-to-date.
The Eclipse Foundation is a not-for-profit, member-supported corporation that hosts the Eclipse
Projects and helps cultivate both an open source community and an ecosystem of complementary
products and services. In general, the Eclipse Foundation provides four services to the Eclipse
community: IT infrastructure, IP management, project management, and ecosystem
development. Many of these services contain processes best described by an event oriented
workflow, for example, the election of a new Committer to an Eclipse Project
(http://tinyurl.com/2bxnyh) has events such as “start election,” “vote,” “approval needed,”
“committer legal agreement received,” and so on. A simpler example is changing a member's
address and phone number (http://tinyurl.com/22rqdg): even this seemingly simple process
involves checking if the address change is triggered by an employment change because an
employment change will require new committer legal agreements.
Like all organizations, we don't have resources to waste, so an important characteristic of our
solution was our investment in durable test scripts: we didn't want to write the scripts once, use
them to test the system, roll it to production, but then never use the scripts again. We believe that
the only way to protect our test script investment was to involve all the stakeholders in the
production and consumption of scripts, and the only way to achieve that was to use the right
level of abstraction in the scripts (and thus not try to do detailed testing of every API).
Visualizing Long Running Transactions
Our realization, and thus our solution, is based on the fact that the Eclipse Foundation workflows
are really just long running transactions. The transactions operate against a database (technically
against five separate databases, but that's an almost irrelevant technical detail) and our user
interface is HTML and AJAX. The code is all written in PHP.
Our testing solution is to script and visualize these long running transactions by simulating them
using test databases and capturing the output for display.
206

{screenshot of committer election swim diagram}
The simulation uses as much of the real application code as possible, replacing only the real
databases with test databases, the user input routines with the test scripts, and the browser output
with output stored in buffers for post-processing and evaluation. Consequently the simulated
transactions are the real transactions and the scripts are testing the real application code and
business logic.
Because our transactions can take weeks or months to complete, we obviously run our
simulations faster than real time using a simulated clock. The visualizer post-processes the
results of the simulation to produce an overview two dimensional picture of the progression of
the transaction through time, using a page format inspired by the "swim lane diagrams" made
popular in business process reengineering [Rummler & Brache, 1995]. The overview contains a
column of each person involved in the transaction and icons with fly-out details representing
important interactions. This format has worked well for our need, but could easily be substituted
with some other format without invalidating the rest of our results or even modification of the
test scripts.
The simulator and visualizer are used in development and testing, but are also deployed with the
finished application as a form of documentation. This use of the tests as documentation has
the natural advantage of the documentation being automatically maintained, but it also forces us
to make design choices so that the tests actually make good documentation. In our previous
207

attempts to provide this same “the tests are the documentation” failed because the tests contained
too much detail to be good documentation; detail that was necessary for testing, but
overwhelming as documentation in the sense of “can't see the forest for the trees”. Our solution
here has a carefully chose set of abstractions that make the scripts both useful as tests and useful
as documentation.
Visualizing for Programming and Testing
The swim visualization we have implemented is useful for both programming and testing. We
take as a given that programmers benefit from test driven development. We also take as a given
that the agile style of “all programming is extending a working system” is an ideal way to build
systems in partnership with users.
Programming
Our simulation and visualization system supports these programming styles in a number of ways.
First, it provides the real “as is” system for detailed study by the programmers and testers.
Second, the test scripts are just PHP code and do not require any special software or training,
thus they are easily composed in advance of programming.
{example test script}
During development, a test failure may result from incorrect application code or an incorrect test
case. These failures are rendered with red boxes within the visualization, allowing the
programmers to narrow their search for the cause.
208

{visualization of failed test}
One of the features we've added to our scripts is the option to verify whether all of the output has
been checked against expected values. Our scripts are often arranged in suites with one main
comprehensive test and a bevy of smaller variations. The main test verifies all the output against
expected values; additionally, because it verifies all the output, it fails if there is additional
unexpected output.
Additional smaller test scripts only verify the portions of the output that are new and/or different
from the main test and do not re-verify previous results.
209

{ignored emails at end of test}
One programming technique that we have found useful is to add “notes” to a script under
development, often pending changes that we haven't gotten around to including yet. Other uses
of the notes include describing interactions between the user and the system that are not captured
by the script.
{notes used for out-of-band data}
Another very useful programming technique is annotating a script with “variations”. Variations
allow us to group scripts without resorting to external meta-data. Variations are noted in the
script in a straightforward manner identical to all other script commands. Variations are
assertions that succeed if there is another script with the variant name, e.g., if a script named
“contact address” has a variation named “two quick changes”, then the variation command will
succeed if there is another script named “contact address with two quick changes”.
{variations visualized in swim diagram}
{variations in the script itself}
210
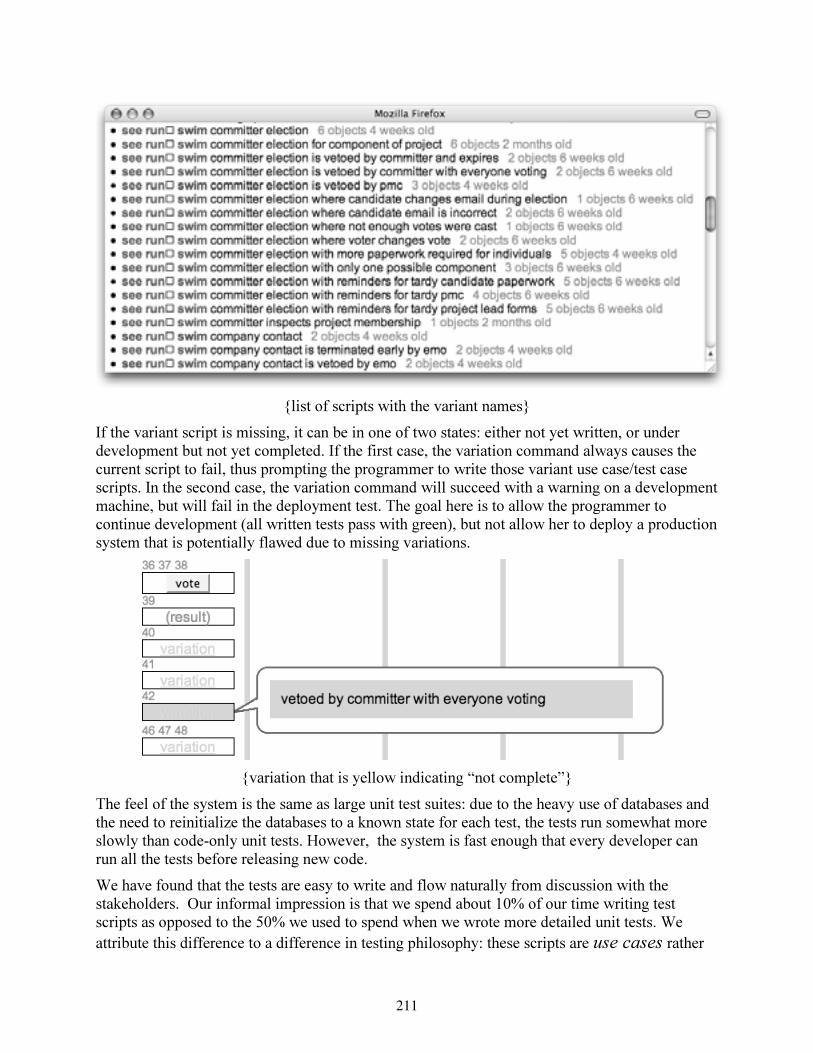
{list of scripts with the variant names}
If the variant script is missing, it can be in one of two states: either not yet written, or under
development but not yet completed. If the first case, the variation command always causes the
current script to fail, thus prompting the programmer to write those variant use case/test case
scripts. In the second case, the variation command will succeed with a warning on a development
machine, but will fail in the deployment test. The goal here is to allow the programmer to
continue development (all written tests pass with green), but not allow her to deploy a production
system that is potentially flawed due to missing variations.
{variation that is yellow indicating “not complete”}
The feel of the system is the same as large unit test suites: due to the heavy use of databases and
the need to reinitialize the databases to a known state for each test, the tests run somewhat more
slowly than code-only unit tests. However, the system is fast enough that every developer can
run all the tests before releasing new code.
We have found that the tests are easy to write and flow naturally from discussion with the
stakeholders. Our informal impression is that we spend about 10% of our time writing test
scripts as opposed to the 50% we used to spend when we wrote more detailed unit tests. We
attribute this difference to a difference in testing philosophy: these scripts are use cases rather
211

than unit tests. As use cases, they are demonstrating and documenting a particular long duration
transaction. Because the scripts and visualizations are easy to write and read, we get good
cooperation from the stakeholders and that leads to our lower effort. Additionally, because the
scripts are not unit tests, they are not rigorous tests of the APIs and thus do not carry adverse
properties that such tests entail, such as brittleness.
We do write scripts for both sunny and rainy day tests for the underlying business processes; we
understand that sunny day tests alone are completely insufficient for a robust system. However,
our rainy day tests are tests of the business logic, not of the underlying frameworks, PHP engine,
MySQL databases, or Apache web server – we accept the low risk of those untested failure
modes as appropriate to our mission. Our IT staff provides additional up-time testing of those
services as a supplement to the scripts and visualization we describe here.
Testing
We believe that testers benefit from exploratory testing and thus our scripting and visualization
system supports that exploration in two ways. First, the visualization works as a map of useful
program and database states. Testers can use the map to direct their exploration and testing – for
example, we find ourselves pointing at an area of a large diagram as we discuss working “over
there”.
Second, we designed the system to allow a user to switch from a passive examiner to an active
participant in testing with a single click. First, all state variables are stored in the databases: we
have a stateless web server without session states. Thus each step of the long running transaction
results in a particular database state (set of tables, rows, and values). As we all know, setting up a
particular complex state so as to replicate an interesting behavior or bug can be time consuming.
The scripts, however, do that set-up automatically just by their execution. Thus we've
implemented a feature where the user can click on any numbered step in a large diagram and be
switched to an interactive version of the system (i.e. the real system connected to a test
database), pre-populated with the database in the exact state that it was in at that step of the
script.
212

{user about to click on the gray step number 105}
{user is taken to interactive interface with database initialized to step 105}
Visualizing for Conversations
The scripting and visualization system facilitates conversations with our stakeholders (analysts
and users) in a number of ways. For example, the visualization of each script produces a unique
URL, so of course that URL can be emailed and IM'ed to someone else. Additionally, the
visualization is fairly generic HTML with CSS, so it too can be saved and emailed as a
conversation reference.
213

{general appearance of browser viewing a large swim diagram}
Each visualization has numbered steps which allow precise discussion even over the phone. We
have already experienced a number of conversations along the lines of "after 46 and before 49,
we need to send an email to the user informing them about X" or "here at 32, the dialog box is
confusing".
Visualizations also have exact renderings of the real interface panels with soft yellow
highlighting to show which fields and buttons have been modified and pressed. Because the state
of the long running transactions are immediately visible in the interface panels, and because the
interface panels are familiar to the users, we find that conversations with the users and
stakeholders are much easier than if we had used a more traditional "bubbles and arrows" state
machine description.
214

{general appearance of a BPEL bubbles and arrows process description
courtesy http://e-docs.bea.com/wli/docs92/overview/}
As we mentioned earlier, the simulation and visualization system is also available in production
as a form of end-user documentation of the processes (long running transactions) being
automated. We invite our users to explore these visualizations through an "explore" link by each
action button in the user interface panels.
215

{explore link next to vote button}
The explore link implements the usual context sensitive help text one would find in an
application, but it also provides additional context by showing the user all the use-cases
containing that same action.
{process explorer text and list of use-cases}
216

We have found this additional context particularly useful because it helps explain the possible
branches in the long running transaction, not just the single action (e.g., "save") that the user is
about to perform. This is similar to the "see also" links in help systems, but because our list is the
complete list of use-cases that define the state space, we believe that it more useful than a set of
more general help messages.
Additionally, because we use the use-cases as the definition of, and the quality assurance tests of,
the application and then the users use the same use-cases as the documentation of the
application, both ourselves and our users "know" the application through the same set of use-
cases. This common set of vocabulary (use-cases) definitely facilitates conversations and reduces
common "programmer versus user" misunderstandings.
Open and Transparent
Because we are an organization dedicated to open source, we believe that both our code and our
processes should be open and transparent. This visualization tool supports that belief that
showing all states and sub-states of each long running transaction, even those that some other
organizations might consider privileged. For example, even through our portal provides an
interface panel for an Eclipse member company to change their contact people, a self-service
activity that one might assume directly updates the database, the use-cases show that such
changes require approval from Eclipse Foundation staff.
{swim diagram revealing that organization contact changes require approval}
Compare this transparency to submitting a review to a website like Amazon: you are never sure
if your comments require approval by a human before posting, or perhaps are subject to
retroactive disapproval by a human, or are never considered by a human at all.
An example of where this transparency was useful is that EG, an Eclipse Committer and leader,
received an email from the portal and quickly emailed back to us "why am I receiving this?" We
pointed him to the url defining the committer election process and the particular email he
received and thus explained why he received that email. He examined the visualization and
understood his role in the process.
217

Our hope is that making the use-cases (the tests) available through "explore" links and our
visualization system will make them valuable to more people. It simplifies or avoids the need to
write extensive textual documentation due to the "a picture is worth a thousand words"
characteristics of the visualizations and the fact that the comprehensive tests cover the expected
user experiences.
Additionally, because the use-cases are both our documentation and our quality tests, we find
that there is additional incentive for keeping the tests up-to-date.
Implementation
Our system is implemented entirely in PHP 5 and MySQL 5 on top of an Apache 2.x web server.
It is operating system agnostic and has been run on Linux, Mac OS, and Windows XP
and Vista.
The system is stateless in the sense that each http request is processed without session state and
thus all object state information is saved in the database through direct SQL calls. Each interface
panel is defined by a separate PHP application object that processes method invocations and
returns HTML.
The live system uses AJAX calls from the interface panels through a single point of control,
dispatch.php, which verifies permissions, instantiates objects, invokes the appropriate action
method, and then returns the new HTML. On the client (web browser side), the AJAX call
replaces the old contents of the interface panel with the new returned HTML.
We chose to use straight HTML (or rather, HTML + CSS) rather than an object transport format
such as JSON because we wanted all the rendering and layout to happen on the server-side. The
option of moving objects across the wire and then rendering them on the client-side would have
required that our visualization framework (which runs entirely on the server) exactly duplicate
that client-side rendering. Thus, for simplicity, we chose to transport HTML and use the existing
rendering functions built into the browser.
All of the context information, such as the names and logins to the databases, are defined in a
single context object. This allows the simulator to easily replace all the live data with simulated
data, and the real clock time with simulated clock time, etc.
In the simulation and visualization system, we replace the single point of interaction,
dispatch.php, with a different control script, swim.php.
Benefits of Conversations
218

{comparison of linear run.php output (left) and columnar swim.php output (right)}
The run.php simulation and visualization is a simpler system than the swim.php simulation and
visualization. Run.php was our initial version and is still useful for certain kinds of debugging.
Run.php and swim.php use the same driver and differ only in the visualizer.
Our test scripts are just PHP, i.e., not some special testing language, and the test driver is
effectively a PHP interpreter written in PHP. It reads and eval's the test script line by line. The
test script is written as a sequence of PHP function calls to functions defined in our test
harness.php file. These harness.php functions form a domain specific language for testing long
running transactions and include: login as a particular user, enter some text in a form field, press
a form button, assert that a string does/does not appear on the page, assert that an email was/was
not sent, etc.
These harness.php functions simulate the AJAX actions that a user would trigger in using the
live version of the system. Thus application object performs its real business logic (against the
test databases) and then returns the appropriate HTML. Run.php displays the test script line
numbers, the function being eval'd, and the resulting HTML all in a sequence on the output web
page. We added a little Javascript using HTML entity ids and changing style sheets so that we
can annotate the top of the web page (rendered early) with the test results (determined late). We
also have a Javascript timer that catch the cases where the entire PHP system crashes so that we
can also annotate those web pages as having failed.
Running a Script
However, before describing swim.php, we'll describe an intermediate step: run.php.
219

{comparison of successful run (left) and failed run (right)}
Visualizing a Script
To produce our two-dimensional visualizations, we replace the "print resulting HTML" of the
run.php script with saving the resulting HTML from each step in an array indexed by simulated
user and time. We then post process this array into an HTML table and print that table to the web
page at the end of the simulation.
The columns of the table are the personas involved in the long running transaction. Some of
these are the simulated users defined by the login(...) statements in the script. Other personas are
defined by the application logic itself: for example, the committer election process sends
notification emails to a number of interested parties who may or may not be represented by
login(...) statements in this particular script.
220

{personas involved in committer election appear across top of output}
Obviously, the set of personas is not known until the script is complete and all the business logic
has been executed and thus the visualization cannot be produced incrementally.
Application objects can report the effective user when their action is better classified under some
other column. The best example of this is that emails show up under the "sent to" person, rather
than the user who was logged in at the time the email was sent.
{email appears under sent-to persona}
We design our test data so that the personas are useful, e.g., "Polly Programmer" rather than
"person1". We could use real users from our real production databases, but we choose not to
due to privacy concerns.
The rows of the table are determined by the "advance" of time. We use an explicit advance(...)
statement in our scripts to advance simulated time. There are two good reasons for this: first, by
allowing many sequential events to appear in parallel in the table, we can have more compact
table and, in spite of larger and larger displays, screen real estate is always at a premium.
Second, it allows the script author to distinguish between important and accidental sequencing of
events. For example, if there are four people voting in a particular committer election, the order
in which they vote is not important and thus we show them as all voting in the same horizontal
row.
221

{one slice of time showing many things happening at once}
Because we use a real MySQL database for data and states, and because we use real DATETIME
columns in that database, our simulated time has to produce real DATETIME values for the
database at the same time it provides sortable values for the PHP code. We solved this problem
by assembling a SQL expression for "now", and then always using the MySQL database to
compare and resolve time variables.
Visualizing an Action
Each action in the script is summarized as either just a reference number, or as a reference
number and an icon. We defined a simple set of rules to determine when an action is interesting
enough to merit an icon for example, press() and enter() statements are interesting, whereas
login() and check() are not. The test script can override these rules with a show() statement,
although we have observed that two additional rules would eliminate our need for show()
statement.
These are:
• A login()/find() pair with no subsequent press(), is interesting and thus earns an icon.
• The last button press in a time segment in a column is also interesting.
The icons contain a visual summary of the script statement, such as a button or an href link for a
press() statement, a yellow title for an email, or a purple note. Errors are, of course, red.
Application objects can provide an effective label if the default label is not sufficiently
descriptive. The entire HTML result is available via a fly-out (implemented with Javascript).
222

{a fly-out shows exact screen image}
The harness.php functions know the form and format of the standardized HTML that our PHP
application objects return, enabling some simple pattern-based HTML augmentation for
highlighting the modified form fields and/or pressed action buttons.
{a fly-out includes highlighting of active areas}
223

Conclusion
Our system has been in continuous use for over six months now - not enough time to declare it
"the future of all things good and wonderful", but definitely enough time for us to do make some
initial conclusions.
The Eclipse Foundation staff has been happy with the results. Our team (the three of us) is
judged helpful, responsive, and productive. Other staff members want to add their processes
(long running transactions) to the portal, either with our assistance or on their own. The
Foundation staff has shown a definite preference for automation using this framework over the
other frameworks and tools available on our servers.
Perhaps the highest compliment we received was when one of our customers (SC) said that she
easily understood how everything worked because it "uses her words" in the interface panels and
documentation.
We believe that there have been two major reasons for our success to date: First, we've focused
on supporting conversations: conversations between developers, conversations between
developers and sysadmins; conversations between developers and users; and even conversations
between users and other users.
Second, we've worked at, and visualized, the right level of abstraction. Our abstractions are
simple enough to understand because we don't talk in computer terms such as "database
updates", "ajax form posts", or "user1"; instead we use the user's vocabulary, show the user's
interface panels, and use the names of real people and roles in our simulations. At the same time,
our abstractions are detailed enough to be believed because we are running the real code in our
simulations instead of bubbles and arrows diagrams. We respect the user's expertise without
dumbing down our system or forcing them to use our terminology.
References
[Rummler & Brache, 1995] Improving Performance: How to Manage the White Space in the
Organization Chart. Jossey-Bass, 1995. ISBN 0787900907.
224

A Graphical Display of Testing Status for
Complex Configurations
PNSQC 2007
Douglas Hoffman
BACS, MSEE, MBA, ASQ-CSQE, ASQ-CQMgr, ASQ Fellow
19333 Vallco Parkway
Cupertino, CA 95014
408-825-2408
Bio
Douglas has more than thirty years experience as a consultant, manager, and engineer in the
computer and software industries. He is currently a Software QA Program Manager for Hewlett-
Packard.
Douglas is extremely active in quality communities. He has been Chair and Program Chair for
several local, national, and international quality conferences. He has been a speaker at numerous
conferences, including PNSQC. Douglas is a Past Chair of the Santa Clara Section of the
American Society for Quality (ASQ) and the Santa Clara Valley Software Quality Association
(SSQA), a task group of the ASQ. He is a founding member and past Member of the Board of
Directors for the Association for Software Testing (AST), and a member of ACM and IEEE.
225

Introduction
Representing the status of software under test is complex and difficult. It becomes more difficult
when testers are trying new ways to uncover defects or when testing priorities shift as new
information is discovered about the software under test. This is sometimes compounded when
there are many interacting subsystems and combinations that must be tracked. This paper
describes a workbook method developed to provide a single page representation of the test space
for large and complex sets of product components and configurations. The workbook can be
used as the focal point for project testing.
The workbook is used to describe:
• the components to be tested
• sets of components that should be tested
• priorities for configurations of components to be tested
• individual test outcomes
• level of testing coverage
• the aggregate of tests (quality of the product as identified through testing)
Once the components are identified and grouped, the workbook can be used to show
configurations to be tested, record test outcomes, and represent the overall state of testing
coverage and outcomes.
The paper uses an example modified from an actual test configuration. (See attached example
workbook.) The example has 8 interdependent variables with 70 components. Together they
represent a possible configuration space of 14,310,912 (since 11*11*11*14*8*8*4*3 =
14,310,912).1
A Workbook Approach
Several elements are considered during planning for testing of a software product. Important
parts of the product are identified; important configuration elements, environmental factors,
product functions, and tests, for example. The plan for testing works through identifying and
combining these elements to outline the testing strategy. For small products and simple
configurations, the description and tracking of the elements can be straightforward. For larger
products or complex combinations of elements, the identifying and tracking can become a
nightmare. Trying to picture the combined results of many parallel test activities (or the sum of
test results over time) can be overwhelming. Sometimes we cannot really tell how much of the
product, configurations, or other elements have been covered.
The workbook approach is an attempt to simplify specifying the elements in such a way that the
one simple layout helps to better understand what to test and what the results of testing seem to
1
The latest project where I used the approach had 11 interdependent Variables with 281 Components
with over five trillion possible combinations on the one page (39 x 9 x 5 x 4 x 5 x 5 x 36 x 5 x 49 x 61 x
63 = 5,948,618,130,000).
226

indicate. The approach takes a stab at rolling up specifying, organizing, prioritizing, reporting,
and summarizing test activities and outcomes. The focus is on the active testing of live code, and
not for other quality activities such as inspections. It also presumes that analysis has taken place,
quality strategy established, elements identified, and other project activities taken care of. For
this paper, I have provided a made up example that assumes a product with the specified set of
Variables and Components. The example should be complex enough to make its point, but not
nearly as complex as testing for many real products.
What’s In the Workbook
The test cycle workbook contains versions of the Configuration Master tab used for various
purposes. The attached file Config Sheet.xls provides an example created using Excel 2000. The
layout of each spreadsheet in the workbook is nearly the same, the differences primarily based on
the purpose or use made of the spreadsheet. The Configuration Master Sheet contains the basic
contents used to generate and use all the other sheets except for the Overall Test Coverage
spreadsheet. The sections below describe the contents and use of each tab.
Configuration Master Sheet
The Configuration Master Sheet shows the layout of the Variables and Components. This is
typically the first spreadsheet created for a product test cycle since it includes fields common to
most of the sheets. Figure 1 shows the example Configuration Master Sheet. Several other tabs
in the workbook look very similar, but used for different purposes. The fields on the
Configuration Master tab show the Variables and Components specific to the product under test.
The Variables are titles given to each group of somewhat independent elements involved in
testing the product. A test will involve zero or more Components from each group and most tests
will use one Component from each Variable group. The example outlines a hypothetical client-
server application configurable for a variety of host systems, different languages, processors, etc.
Seven Variables are shown, with from three to fourteen Component parts listed under them.
Variables provide the labels for groups of similar Components. Each Variable has a list of items
that fall into that category. In the hardware world, examples of Variables include processor type,
size of memory, type of I/O connection, printer, or display pixels. Software examples include
different applications that might be tested, programs that might interfere with the software under
test, application features, program functions, and user activities. Variables describe the things
that combine and possibly interact during testing.
The Components are the specific elements grouped under a Variable. These are configuration
items or test activities thought to be important to the test coverage. Configuration testing looks
for problems in the interactions among the Components.
Three other fields of note here are Tester ID, Date of testing, and Test Focus (name or purpose
for the test).Tester ID and Test Focus are text fields, allowing for entry of any type of value. The
Date + Time is a formatted field to identify the testing using mm/dd/yy hh:mm format. (Later
sections of the paper describe the remaining fields.)
227

Figure 1: Example Configuration Master Sheet
Configuration Priorities Sheet
The Configuration Priorities Sheet provides an indication of the relative importance for testing of
individual Components. Updating of this spreadsheet occurs throughout a product test cycle to
show the relative importance or priorities for testing of Components. The spreadsheet changes to
reflect shifts in testing progresses and test priorities. Figure 2 shows the example Configuration
Priorities Sheet. The difference between this sheet and the Configuration Master Sheet is the use
of priorities columns to show the relative importance of testing each component.
The Priority Columns indicate the relative priority for each Component within each Variable’s
group. This column is the second one to the left of each Component. The priorities are set to one
of four values: High (H), Medium (M), Low L), or Don’t Care (blank). Placing the character
indicating the importance (H, M, or L) in the Priority cell in front of a Component sets the cell
Client Environment Server Environment Activity Processor
Solaris 9 Solaris 9 Create new Pentium Class I
Solaris 10 Solaris 10 Edit existing Pentium Class II
LINUX 2.5 LINUX 2.4 Remove Dual-Core
LINUX 2.6 LINUX 2.6 Weird file names Quad-core
Windows NT 4 Windows NT 4 Multiple users MIPS
Windows 2000 Windows 2000 Positive testing PPC
Win XP Basic Win XP Basic Negative testing ARM
Win XP Prof Win XP Prof Relocate files SPARC
Win XP Bus Win XP Bus Huge work product
Win Vista Basic Win Vista Basic Initial connect
Win Vista Prof Win Vista Prof Secure connect
Session relocate
Client Install Browser Debugger - GUI
Install clean CDE Debugger - CLI
CLI install clean IE 5
Re-install IE 6 Language
CLI Re-install IE 7 English
Upgrade install KDE French
Relocate client Firefox 1.4 German
System Recovery Firefox 1.5 Japanese
multiple instances CLI
Registry consistency
Default options C-S Link
Change options Ethernet
Serial
Pipe
Priority Test Results
H High Priority to test Y Some testing done
M Priority to test R Severe errors
L Not Important to test G Tested OK
Tester Test SPR# SPR#
5/3/07 12:30 PM
Date + Time SPR# SPR# SPR#
Color Key:
Tester Identifier Test Name
or Purpose
Component
Variables
228

Client Environment Server Environment Activity Processor
M Solaris 9 Solaris 9 Create new Pentium Class I
H Solaris 10 Solaris 10 Edit existing M Pentium Class II
LINUX 2.5 LINUX 2.4 Remove H Dual-Core
H LINUX 2.6 H LINUX 2.6 M Weird file names Quad-core
Windows NT 4 Windows NT 4 H Multiple users L MIPS
L Windows 2000 Windows 2000 Positive testing L PPC
H Win XP Basic Win XP Basic L Negative testing ARM
M Win XP Prof M Win XP Prof L Relocate files H SPARC
M Win XP Bus H Win XP Bus M Huge work product
H Win Vista Basic L Win Vista Basic Initial connect
M Win Vista Prof H Win Vista Prof M Secure connect
Session relocate
Client Install Browser L Debugger - GUI
Install clean L CDE L Debugger - CLI
H CLI install clean IE 5
M Re-install M IE 6 Language
CLI Re-install H IE 7 English
H Upgrade install M KDE M French
L Relocate client Firefox 1.4 German
L System Recovery H Firefox 1.5 H Japanese
multiple instances CLI
Registry consistency
Default options C-S Link
H Change options H Ethernet
M Serial
Pipe
Priority Test Results
H High Priority to test Y Some testing done
M Priority to test R Severe errors
L Not Important to test G Tested OK
Tester Test SPR# SPR#
5/3/07 12:30 PM
Date + Time SPR# SPR# SPR#
Color Key:
Figure 2: Example Configuration Priority Sheet
color to purple, blue, or gold; indicating the priority. The default condition for the Priority cell is
Don’t Care, which may be entered by typing a blank or deleting the contents of the cell. The
priorities are not exclusive among the Components grouped under a Variable, i.e., any number of
Components in a group may be labeled as high, medium, low, or don’t care priorities.
• High indicates that the Component is important to test. It does not mean that every test
session will involve the Component, but rather tells the testers which Components have
the most importance.
• Medium indicates that the Component is desirable to test.
Priority Columns
Priority Color Key
229

• Low indicates to test the Component only if it is central to performing tests on other,
more important Components.
• Don’t Care (blank) indicates that it is not important one way or another.
Note that Low Priority and Don’t Care may indicate already or planned sufficient testing, a
broken Component, or many other things. The priorities do not indicate NOT to test the
Component, only the testing emphasis appropriate at this time.
The Priority Color Key provides a visual indication of what the assigned priorities represent.
Test Results Sheets
The Test Results Sheets provide a record for each test session. A copy of the Configuration
Master sheet becomes the basis for the Configuration Priorities Sheets. A copy of that becomes
the basis for a Test Results Sheet, which provides a record of outcomes at the end of each test
session. Filling out the Test Results spreadsheet records the results from the test session. Each
Test Results Sheet summarizes the configuration tested, amount of testing performed, and major
errors discovered in the Components. Figure 3 shows an example of a Test Results Sheet.
The Test Results Columns indicate the use and general results for each Component involved
with the test session. This column is immediately to the left of each Component. The results are
set to one of four values: Red (R), Yellow (Y), Green (G), or Not Tested (left blank)2
. Entering
the results color character (R, Y, or G) indicates the general outcome for each Component. The
color changes to red, yellow, or green for the corresponding cell and Component name. The Not
Tested condition is the default, and can be entered by leaving the cell alone, typing a blank, or
deleting the character in the cell.
• Red indicates that the Component failed one or more tests and it is not ready for release.
An entry in one of the SPR # fields gives the problem report number corresponding to the
discovered defect.
• Yellow indicates either exercising of the Component (but not thorough testing) or filing
of one or more minor to moderate severity SPRs. This shows some coverage of the
Component without finding any results that might threaten a release.
• Green indicates testing the Component reasonably well without uncovering significant
problems.
• Not Tested (blank) indicates that, if exercised at all, insignificant use and no reported
defects in the Component.
The Test Results Color Key provides a visual indication of what the assigned result colors
represent.
2
Note: It has been suggested that a fourth color (e.g., Blue) be added to indicate that one or more problem
reports were filed for less severe defects. This has a different meaning from Yellow, which then indicates
that no defects were reported. As the workbook has been implemented, Yellow covers both situations.
Additional notes below further explain the use of the Blue color.
230

Client Environment Server Environment Activity Processor
M Solaris 9 Solaris 9 Create new Pentium Class I
H Solaris 10 Solaris 10 Y Edit existing M Pentium Class II
G LINUX 2.5 LINUX 2.4 Remove H Y Dual-Core
H LINUX 2.6 H G LINUX 2.6 M G Weird file names Quad-core
Windows NT 4 Windows NT 4 H Multiple users L MIPS
L Windows 2000 Windows 2000 Positive testing L PPC
H Win XP Basic Win XP Basic L Negative testing ARM
M Win XP Prof M Y Win XP Prof L Relocate files H SPARC
M Win XP Bus H Win XP Bus M Y Huge work product
H Win Vista Basic L Y Win Vista Basic Initial connect
M Win Vista Prof H Win Vista Prof M Secure connect
Session relocate
Client Install Browser L Debugger - GUI
G Install clean L CDE L Debugger - CLI
H CLI install clean IE 5
M G Re-install M Y IE 6 Language
CLI Re-install H IE 7 G English
H R Upgrade install M Y KDE M French
L Relocate client Firefox 1.4 German
L System Recovery H Y Firefox 1.5 H Japanese
multiple instances CLI
Registry consistency
Default options C-S Link
H Y Change options H Ethernet
M Y Serial
Pipe
Priority Test Results
H High Priority to test Y Some testing done
M Priority to test R Severe errors
L Not Important to test G Tested OK
Engr 1 LINUX Install DY703 DY705
Tester Test SPR# SPR#
5/5/07 12:30 PM DY708
Date + Time SPR# SPR# SPR#
Color Key:
Figure 3: Test Session Log Example
Overall Test Coverage Sheet
The Overall Test Coverage Sheet rolls up the information from the Test Results Sheets and
summarizes the status of testing. Figure 4 shows the Overall Test Coverage Sheet in the Config
Sheet.xls workbook corresponding to the status of the example testing based on the example
Configuration Priorities and two Test Results Sheets. [Refer to Figures 1 through 3 for help
identifying the parts of the sheets.] The Overall Test Coverage Sheet shows the progress and
status of testing in a straightforward, one-page graphical dashboard.
The Priorities Columns on the Overall Test Coverage Sheet reflect the current Configuration
Priorities. This provides the information needed with the results to determine quickly the most
important outstanding areas to test. Since the Overall Test Coverage Sheet combines this
information with the testing results, it shows the overall state of testing at a glance; enabling
testers to know where testing makes the most valuable contribution at that moment.
Used in
Testing
Well
Tested
Tested With
Errors
Test Results
Columns
231

Figure 4: Overall Test Coverage Sheet – Current State in the Example
Highlighted Components show the extent and gross results of testing. The color for each
Component shows one of four values reflecting the information entered on the Test Results
Sheets. The colors are the same as the colors entered on the Test Results Sheets: red, yellow,
green, or blank.
• Red indicates that the Component failed one or more tests and it is not ready for release.
This shows when any of the Test Results Sheets have that Component’s results marked
with Red. The Red overrides other test result entries for the Components.
• Yellow indicates no Red or Green results and at least one Yellow for the Component. For
some projects, a specified number of Yellow indicators may be tagged as Green, because,
Client Environment Server Environment Activity Processor
M Solaris 9 Solaris 9 Create new Pentium Class I
H Solaris 10 Solaris 10 Y Edit existing M Y Pentium Class II
G LINUX 2.5 LINUX 2.4 Remove H Y Dual-Core
H LINUX 2.6 H G LINUX 2.6 M G Weird file names Quad-core
Windows NT 4 Windows NT 4 H Multiple users L MIPS
L Windows 2000 Windows 2000 Positive testing L PPC
H Win XP Basic Win XP Basic L G Negative testing ARM
M Y Win XP Prof M Y Win XP Prof L Relocate files H SPARC
M Win XP Bus H Y Win XP Bus M Y Huge work product
H Win Vista Basic L Y Win Vista Basic Initial connect
M Win Vista Prof H G Win Vista Prof M Secure connect
Session relocate
Client Install Browser L Debugger - GUI
G Install clean L CDE L Debugger - CLI
H Y CLI install clean IE 5
M G Re-install M Y IE 6 Language
CLI Re-install H Y IE 7 G English
H R Upgrade install M Y KDE M French
L Relocate client Firefox 1.4 German
L System Recovery H Y Firefox 1.5 H Japanese
multiple instances CLI
Registry consistency
Y Default options C-S Link
H Y Change options H Y Ethernet
M Y Serial
Pipe
Priority Test Results
H High Priority to test Y Some testing done
M Priority to test R Severe errors
L Not Important to test G Tested OK
5/5/07 12:30 PM
Date + Time
Color Key:
232

although none of the tests were considered complete by themselves, the number of uses
of the Component without significant problems is thought to be enough3
.
• Green indicates reasonably good testing of the Component on one or more Test Results
Sheets with no significant problems (Red) recorded.
• Blank indicates an insignificant amount of testing and no significant problems (Red)
recorded for the Component.
The Priority Color Key and Test Results Color Key provide guides for what the assigned result
colors represent.
Figure 4 shows an early stage of testing. It shows many Components as White or yellow;
showing little test coverage. It shows many of the same Components with High or Medium
Priority to test (e.g., ‘CLI install clean,’ ‘Multiple users,’ and ‘Secure Connect’). This shows
inadequate testing of some important configurations at this time.
Figure 4 also shows a few Components having thorough testing (e.g., ‘LUNUX 2.5,’ ‘Install
clean,’ and ‘Weird file names’) and one Component with severe errors (the red shaded ‘Upgrade
install’ Component).
In contrast, Figure 5 shows what the project might look like toward the end of testing. Here,
there are many more Components showing thorough testing (Green) and some testing (Yellow).
Nearly all the Components prioritized as High or Medium have Green or Yellow indicators.
There are very few Components showing no testing, and these have been designated ‘Not
Important to test.’ Management may declare readiness for release because of adequate testing of
the most important parts, or they may require more testing for specific Components.
3
Note: In projects using this approach to date, the goal of the presentation on the Overall Test Coverage
Sheet is to indicate how much testing has taken place in each Component. Yellow provides no indication
of whether or not defects were reported or resolved.
An additional color (Blue) could also be used to indicate whether reported defects are resolved. When
any defect is reported, the Component is tagged with Red or Blue, depending on the Severity of the
problem. In this case, Yellow indicates that the Component was only exercised, and a specified number of
Blue indicators may be rolled up to the Overall Summary Sheet as Red. This is because, although none of
the reported defects is considered significant enough to hold the release by themselves, the number of
cases where the Component has unresolved problems is thought to be enough to indicate that it is not
ready for release.
233

Figure 5: Overall Test Coverage Sheet – Final Test Coverage from the Example
Who Uses the Spreadsheets
There are several intended users and uses for the spreadsheets, as outlined in the table below. It
is not necessary for all of the activities to take place or to have participation from all of the
participants to get value from the sheet. For example, there is value if only the tester uses it.
Client Environment Server Environment Activity Processor
M Y Solaris 9 L Solaris 9 G Create new Y Pentium Class I
G Solaris 10 Y Solaris 10 G Edit existing G Pentium Class II
G LINUX 2.5 Y LINUX 2.4 L Y Remove G Dual-Core
Y LINUX 2.6 G LINUX 2.6 G Weird file names Y Quad-core
L Windows NT 4 Y Windows NT 4 Y Multiple users Y MIPS
L Windows 2000 L Windows 2000 G Positive testing Y PPC
H G Win XP Basic L Win XP Basic G Negative testing L ARM
M G Win XP Prof G Win XP Prof H G Relocate files Y SPARC
M Y Win XP Bus G Win XP Bus G Huge work product
H G Win Vista Basic Y Win Vista Basic G Initial connect
M Y Win Vista Prof G Win Vista Prof H G Secure connect
G Session relocate
Client Install Browser G Debugger - GUI
G Install clean Y CDE L Y Debugger - CLI
H G CLI install clean L Y IE 5
M G Re-install Y IE 6 Language
G CLI Re-install G IE 7 G English
Y Upgrade install L Y KDE Y French
Y Relocate client Y Firefox 1.4 L German
H Y System Recovery G Firefox 1.5 H G Japanese
G multiple instances M Y CLI
Y Registry consistency
G Default options C-S Link
M Y Change options G Ethernet
M Y Serial
Y Pipe
Priority Test Results
H High Priority to test Y Some testing done
M Priority to test R Severe errors
L Not Important to test G Tested OK
5/5/07 12:30 PM
Date + Time
Color Key:
234

Stakeholder Activities Value of Workbook
Test Designer Identify Variables, Components, and
priorities for testing
Organize and communicate the
Components involved in testing,
Tester Record test configuration, general test
run profile, and observe areas yet
untested or under tested
Simple summary of configurations,
test coverage, and test outcomes
Test Manager Identify priorities, assign test
configuration priorities, monitor/manage
individual test activities, and observe
current status to make recommendations
Communicate priorities, simply
assign test Goals, read test
summaries for sessions, and quick
assessment of overall state of
testing
Developers Observe current status and read test
summaries for sessions. Monitor test
results for Components of interest.
Quick assessment of the state of the
project and product based on
testing. Details for tests are in the
Test Results Sheets.
Other
Decision
Makers
Observe current status and read test
summaries for sessions
Quick assessment of state of
project and product based on tests
Workbook Mechanics
The Configuration Master Sheet is filled out when the test strategy is laid out and the scope of
testing is defined. Test management, test designers, and developers work together to identify the
Components that need to be tested. Similar Components are grouped to provide the categories
for Variables. The Variables are generally independent of one another to the degree that one or
more Components in each group are generally involved in a test.
For example, a Variable could be a type of printer. There may be a number of printers that need
to be tested sometime during product testing, and these could be listed under the Variable
heading “Printer.” However, it is not necessary that a printer be thoroughly exercised in tests of
product installation. It is also possible that several different printers could be exercised in tests of
printing reports.
The order of Variables and Components is not significant. The groups and the number of
elements in each group are determined by the hardware and software Components to be tested.
The Configuration Master Sheet is copied to create the Configuration Priorities Sheet and that, in
turn is copied to create the Test Results Sheets.
The layout of the Variables and Components on the Configuration Master Sheet is fixed once the
testing begins. The other sheets in the workbook are created by making copies from the
Configuration Master Sheet, and the functioning of the Overall Test Coverage Sheet depends on
the common location of Components on every Test Results Sheet. It is not practical to change
235

the positioning of the items on the sheet after Test Results Sheets are generated, although it is
possible to add Components on blank lines.
The Configuration Priorities Sheet is initially copied from the Configuration Master. Once
created, the one Configuration Priorities Sheet is updated to reflect the testing priorities. The
Priorities column is designed to accept one of the three characters and appropriately color code
the cell. Each Component is rated as High, Medium, or Low priority by entering the single letter
corresponding (h, m, or l); or the Priority column is left blank to indicate neutrality or
indifference. Updates to the priorities are frequent for most projects; at least once a day. That
way a tester has the most up to date priorities when they begin an active testing session.
A great deal of information is available to help decide what the priorities should be. As testing
progresses, the summary provided on the Overall Test Coverage Sheet shows the Components
that have been tested and their status. Components that have received thorough testing may
become low priority, while ones that have not been well tested or have had problems may get
higher priority.
The Configuration Priorities need to be considered fluid. Because they may change, testers need
to copy the current sheet to begin a testing session. By making a copy they record the priorities at
that time, avoiding second-guessing, finger pointing, and he-said-she-said episodes that often
accompany the last minute pressures to release software.
Test Results Sheets are copied from the Configuration Priorities Sheet. The tester either works
with the sheet as a guide during testing or fills it out immediately after the test session is
completed so the information is fresh and easily recalled and entered. By adding tabs into the
workbook for each test session, the Overall Test Coverage Sheet is able to automatically reflect
the summary status.
The Overall Test Coverage Sheet rolls up the information from the Test Results Sheets. The
sheet presents the current priorities and status of testing with the color codes as described above.
If any cells are marked red in a Test Results Sheet it will continue to show on the Overall Test
Coverage Sheet until changed on the Test Results Sheet. The sheet will be revisited when the
problem is resolved and the cell color changed to indicate the fix has been verified. Note that if
any of the cells for a Component are red, the summary will continue to reflect that fact until all
of them have been changed to some other color.
At the beginning of testing, the Overall Test Coverage Sheet is fairly colorless. As testing
progresses, the colors may shift toward yellow, red, or green. Yellow shows progress, green
shows successful testing, and red indicates potential problem areas. Well behaved, good quality
software should progress from white to yellow to green.4
4
Personally, I have not experienced or even heard of well-behaved, good quality software progressing
through testing that way. Software is complex and testers are good at their jobs, so there are ample
opportunities for the software to misbehave even when it is good quality.
236

Summary
A workbook composed of four types of spreadsheets describes the testing configurations,
progress, priorities, specific test session results, and overall state of the testing project within a
flexible framework.
The Overall Test Coverage Sheet provides a one-page summary of the state of testing.
The Configuration Master Sheet identifies the Components involved in testing.
The Configuration Priorities Sheet provides a quick summary statement of current testing
priorities.
Test Results Sheets record the information summarizing each test session; Components, depth of
testing, and major problems uncovered.
Although the tracking mechanism described here is not sufficient for test planning or detailed
test reporting, it provides a straightforward way to represent test priorities, very complex
configurations, test session reporting, and test results summarization. The spreadsheets that make
up the workbook fit together to provide a strong framework for dynamic communication about
the progress of testing.
237

238

EFFICIENT SOFTWARE TESTING USING STATISTICAL METHODS
Oleksandr Tarvo, Junaid Ahmed, Koushik Rajaram and Kashif Dastgir
E-mail: (alexta|jahmed|koushikr|kashifd)@microsoft.com Windows Serviceability, Microsoft.
Alex (Oleksandr) Tarvo is a Software Development Engineer in Test (SDET) in Windows Serviceability
team at Microsoft. He works on statistical models for risk prediction of software. His professional interests
include machine learning and software reliability. Oleksandr received his both BS and MS degrees in
Computer Science in Chernigov State Technological University, Ukraine.
Junaid Ahmed is a SDET in the Windows Serviceability team. He researches on software metrics and
techniques that can help in predicting future bugs and ultimately help in efficient testing. His areas of
interest include Artificial Intelligence, Statistics and Advanced Algorithms. He has a BS from NUCES
(Karachi, Pakistan) and is currently pursuing an MS (CS) degree at the University of Washington.
Kashif Dastgir is a SDET working for the Windows Serviceability team at Microsoft. He works on the
quality and efficiency of test processes for Windows updates and security releases. His interests include
design and development of software frameworks, software usability and process automation. He received
his BS degree in Computer Science from FAST Institute of Computer Science (NUCES), Lahore,
Pakistan.
Koushik Rajaram is a Lead Software Development Engineer in Test in the Windows Serviceability team at
Microsoft. He drives the quality and efficiency of test processes for Windows security releases with focus
on data driven testing. His interests include Software architecture, Design patterns and Image processing.
He received his Masters in Computer Science from BITS Pilani, India.
ABSTRACT
In a software life cycle, testing is crucial as it directly impacts the quality of the product. As the complexity
and size of software products increase, testing cost also increases resulting in a growing need for efficient
software testing. The challenge of striking a balance between the limited test resources and the desired
product quality has become common in most modern software organizations. The objective of this paper
is to present an approach that is geared towards higher product quality and lower testing cost.
The overall strategy is to predict the fault proneness of the constituents of a software system and, direct
the test resource requirements based on the fault proneness. In the presented approach, a large software
system is decomposed into smaller units that can be tested independently. This specific type of code unit
is referred to as a component; it can be an executable file or any module which is part of the overall
software product. For each component, a large number of software metrics such as code complexity,
code criticality, code churn, historic defect metrics etc are considered as contributors to risk. Statistical
models, such as neural networks and logistic regression, are then used to predict future risk by
correlating the combination of these metrics to a measure of failures fixed. Relationship amongst
components is also considered to determine the impact of the risk that one unit has to the other.
Components are calibrated on the basis of their predicted risk of having failures. A model based on
constraint satisfaction problems has been developed to minimize risk and maximize test efficiency for a
given set of resource and risk constraints.
The paper will conclude with a case study conducted at Microsoft in the Windows Serviceability group.
Key factors leading to software failures were investigated and the presented approach has been applied
for achieving test efficiency. The paper will include an elaboration on the end-to-end process of achieving
test efficiency, risk assessment, quantifying relationship between components and, finally the method of
coming up with test recommendations. Results are presented where reduction in test efforts is achieved
with minimal risk to product quality.
239

1. INTRODUCTION
As the cost of computation becomes cheaper, customers desire richer computing experiences resulting in
the size and complexity growth of software systems. As software systems grow in size and complexity,
the cost of development and testing increases. The bigger the project, the bigger is the cost of
development and testing. While development of large scale systems has its own unique challenges, we
focus most of our study on testing in this paper.
Software testing is any activity aimed at evaluating an attribute or capability of a program or system and
determining that it meets its required results [9].The difficulty in software testing stems from the
complexity of software and in case of a big project like Microsoft Windows, software testing becomes a
huge enterprise itself. To reduce overall cost of the product and to increase quality, software
manufacturers need to prioritize resource allocation, paying most of attention to the parts of the system
that are most likely to fail or that are most fault-prone. This is especially important for products that
undergo incremental development or that are in maintenance phase. In such cases, software
manufacturers need to focus their testing on less stable parts of the system instead of retesting the entire
system. Paraphrased, manufacturers need to be able to cut down testing cost for incremental product
development once the product has reached an acceptable baseline quality.
In our research, we focused on the maintenance phase of Windows Server 2003 where changes to the
product were mostly customer reported bugs and a limited set of incremental feature changes. During the
4 year interval after release, only 13% of the Windows Server 2003 code base changed with an average
churn rate of 5%. Given the stable state of the product, we could target the testing in our research to parts
of the system that are more fault prone and allocate resources appropriately. That said, this approach can
be applied to products under development as well if the product has met a minimum quality bar and, if
further changes are limited to specific parts of the system (example – post Beta or post RC testing).
Below is a summary of the approach used in our research:
1. Division (of the system) and Data Collection
The software system is logically divided into components and software metrics are collected for
these components.
2. Quantifying dependency between components
Since the components are mutually dependent, it is essential to understand how each component
affects the other. This is accomplished by establishing a dependency metric.
3. Predicting Fault Proneness
Develop a risk model that predicts the fault proneness of a component with respect to the
dependency and various other software metrics;
4. Allocation of Resources
Components are prioritized based on their risk due to the changes in the system; this establishes
the criteria for the intelligent allocation of test resources with respect to the components’ risk
The paper is organized as follows. Section 3 contains information pertaining to logical division and data
collection. Section 4 describes dependencies between components. Section 5 deals with prediction of
fault proneness and Section 6 presents the approach for resources allocation. Section 7 is the conclusion
and presents the results.
2. RELATED WORK
Most of related work is targeted on early detection and prediction of post-release defects. Various
software traits are considered as a factor in early detection of bugs and statistical correlation mechanisms
are often employed to establish a relationship between these factors and future bugs. In “Predicting
240

Defect Densities in Source Code Files with Decision Tree Learners” [3] decision trees are used to
establish a relationship of past defect density with future defect density. “Mining Metrics to Predict
Component Failures” [2] uses various code metrics like cyclomatic complexity and depth of inheritance is
used to predict future defects. “Predicting Fault-Prone Components in a Java Legacy System” [1] uses
source files measures like number of violations, number of duplicated code sections etc. Various types of
regression [2, 4], decision trees [3] and neural networks [7] are among the statistical methods known to
be used for prediction.
Our research is similar to these endeavors in the perspective of predicting future defects; however, the
nature of the solution and the overall scope of the problem in the perspective of integration testing are
quite different. By differentiating the nature of bug fixes, we have brought in our research the notion of
classifying code changes. Research has been carried out across multiple code branches that intrinsically
have different code characteristics. Hence our learning model has been validated on components with
diverse code properties. The concept of quantifying dependencies is introduced for the first time which
quantifies relationship between software constituents. This allows us to measure the effect of the risk of
one component over the other. We have also tried to apply our predictive model by using CSPs
(Constraint Satisfaction Problem) to target testing in testing exercises executed in regular intervals by the
Windows Serviceability team.
3. DIVISION AND DATA COLLECTION
3.1 DECOMPOSITION OF SYSTEM INTO LOGICAL COMPONENTS
Software systems composed of loosely coupled parts are easy to develop, test and maintain. “Loosely
coupled” is an attribute of systems, referring to an approach to designing interfaces across modules to
reduce the interdependencies across modules or components – in particular, reducing the risk that
changes within one module will create unanticipated changes within other modules. Real world software
systems are far from this idealistic approach and the subject of our study, Windows Server 2003, is no
exception to this rule.
Ideally, we would have wanted to divide the OS into isolated parts, but in reality this is not possible as the
parts are highly dependent on each other. So, the logical division of the OS took on the basis of the
testability. If a particular part of the OS could be tested and released separately, it was labeled as a
discrete component. This logical division allowed us to gain a thorough understanding of how fault in one
part affected the other. The calculation of fault proneness and the allocation of the testing resources are
performed at a level of a component in our research.
3.2 SOFTWARE METRICS
Below are the key software metrics we use as indicators of fault proneness.
� Code churn is a quantification of the amount of changes that a component goes through in a specific
time period. We have also used the term “binary churn” which is a measure of the number of binary
blocks changed, where binary block is a set of processor instructions that has only one entry point
and only one exit point.
� Change frequency refers to the number of times a component has been changed/churned over a
specific time period.
� Dependency quantification is a metric that quantifies the relationship between the components of a
larger software system. Its evaluation is dealt in more detail later in the paper.
� Size measures the amount of code in the component. In our research component size was measured
in binary blocks as well.
241

� Complexity is a measure of the program’s cyclomatic complexity, initially described by McCabe [10].
� Criticality refers to the number of components or code paths in a system dependent on the current
component or code path. Paraphrased criticality is also the frequency of use for a component or a
code path.
� Miscellaneous code metrics like maximum number of functions, depth of inheritance, average
number of parameters per function etc. have been used as indicators to fault proneness (total of 23,
see appendix 1 for more details).
4. QUANTIFYING DEPENDENCY BETWEEN COMPONENTS
As mentioned earlier, components in Windows Server 2003 are not loosely coupled and it is necessary to
evaluate the degree to which the risk in one component affects the other. This is accomplished by
quantifying the cohesiveness amongst components and then acknowledging the cohesiveness of
interdependent components in the evaluation of the fault proneness of a particular component.
We establish this quantification by tracking functional calls between components. Give two components A
and B, if a function Fl from A calls another function F
m from B, it can be said there is a functional
dependency between components A and B. This dependency is a fan-out (outgoing) dependency for
component A and fan-in (incoming) dependency for component B. In a real software system, component
A can call functions from more than one component B1…B
k, so it can be said component A depends on
components B1…B
k.
Assume function Fm in component B
i, ki ,1= has been changed. In this case function F
l will call changed
variant of function Fm, and if the change in component B
i has been done inaccurately, it can lead to an
undesired affect on the behavior of component A (a software regression). From a defect prediction
standpoint, we can conclude that the effect of changing component B might lead to a bug in component
A, even if A itself is unchanged and, this is the motivation behind the quantification of dependencies.
4.1 BINARY DEPENDENCY QUANTIFICATION METRIC (BDQM)
Establishing relationship with the components that change and those which do not change is crucial in
making testing decisions.
BDQM refers the quantification of the dependencies between components. In our study, BDQM quantifies
dependencies across executable binaries (like exe and dll) in Windows and is defined from the
perspective of the called binary. BDQM can also be cumulated in multiple ways to derive dependency
quantification at a higher component level.
Consider a binary A calling binary B taking the change. Now, A is dependent upon B and the
quantification of this dependency from A to B is described below:
)(
BtocomponentotheranyfromcallsfunctionalofnumberMaximum
BtoAfromcallsfunctionalofNumber
LogBDQMBA
=
→
(1)
The logarithm is necessary for reducing the skewness of the distribution and making BDQM proportional
to the functional calls flowing between the components. To predict the potential impact of a change in
component Bi on component A, we combined functional dependency metrics with change frequency and
code churn.
242

DEP_CF represents impact on component A from change frequency of components B1…B
k, on which A
depends upon.
∑=
⋅=
k
i
iiBCFBABDQMCFDEP
1
)(),(_ (2)
where CF(Bi) is the change frequency of binary Bi.
DEP_Churn represents impact on component A from code churn in components B1…B
k and can be
represented in a similar way.
∑=
⋅=
k
i
iiBCCBABDQMChurnDEP
1
)(),(_ (3)
where CC(Bi) is the code churn of binary Bi.
5. FAULT PRONENESS
An important step toward test targeting is to be able to evaluate the fault proneness of a component. In
our study we create a statistical model that can predict the fault proneness for each component based on
past historical data. This metric will be used later to allocate test resources during testing.
Software metrics for a component have been used as predictor variables for a statistical model to predict
fault proneness for a particular component. After a set of predictor variables has been collected, a
statistical correlation method, like log-linear regression or neural network, can be used to predict fault
proneness. The given model would accept a vector of predictors as an input and output a predicted value
of the fault proneness for a given component.
In order to train such a model, it is necessary to define not only predictor variables, but also a dependent
variable (sometimes referred as an answer variable), representing an estimated fault proneness of the
component. In this case some supervising learning algorithm can be used to train the model to predict
dependent variable based on predictor variables. Formally, a set of example
pairs DdPpdp ∈∈ ,),,( needs to be created, where p
is a vector of predictor variables and d
is a
value of future fault proneness (dependent variable) of the component. Data from the past was used to
train a neural network, and once the training was complete, the trained neural network was used to
predict the fault proneness for future.
In order to achieve this, we collected the data on a software system (Windows Server 2003) over three
last consecutive releases (see fig. 2). Time between each two consecutive releases was two years.
� Ri: current release (version) of the system, Windows Server 2003 SP2;
� Ri-1
: previous release of the system, Windows Server 2003 SP1;
� Ri-2
: Initial releases of the system, Windows Server 2003 RTM.
First set of predictor variables was collected during time interval from release Ri-2
(March 2003, Windows
Server 2003 RTM release) to Ri-1
(March 2005, Windows Server 03 SP1 release). This set has been used
to create vectors of predictor variables for training the model, forming a set P . Second set of variables
was collected during time interval from release Ri-1
(Windows Server 2003 SP1 release, March 2005) until
Ri (data was collected in December 2006, which is close to Windows Server 2003 SP2 release in March
2007). It was used to estimate fault proneness of binary modules while training the model, forming a set
243

D . Neural network training was performed using these two sets, P and D. After the training was
complete, we used the trained neural network to predict fault proneness for the subsequent time periods.
In this case data from Ri-1
to Ri formed a predictor set P to predict future fault proneness for the time
period Ri to R
i+1.
5.1 ESTIMATING FAULT PRONENESS OF THE COMPONENT
For supervised learning, it is necessary to provide a dependent variable d which is correlated with the
predictor variables. In essence, we are trying to use the predictor variables to predict the dependent
variable. In the context of our research, that dependent variable is the estimated fault proneness of a
component. In most of the related works, “number of defects”, discovered in software module, or “defect
density” (number of defects divided by module size) have been used to define a dependent variable d.
Such approach is quite reasonable because software defects are the root cause of almost all failures in a
component. However, the impact of all software defects isn’t equal: some defects are much more serious,
hence their contribution to fault proneness is comparatively larger. For example, a fix to a security
vulnerability, affecting millions of customers worldwide, is much more serious than a non-security defect,
affecting only a small segment of customers. So, in our approach, we consider the user impact and fix
severity in addition to number of defects in our estimation of fault proneness. This leads to better focus of
test resources as we start using fault proneness for targeted testing.
It can be said, that each defect has its own weight associated with it: the higher the weight of the defect,
the higher the contribution to fault proneness for the component from that defect’s perspective. To
estimate defect’s weight we are using following criteria:
� User impact: defects leading to failures only in specific situation or environment have a lesser
contribution to fault proneness rather than defects affecting all users.
� Fix size and complexity: the bigger and more complex amount of code in the fix, the higher is
severity of an error.
The user impact and the fix severity directly influence the weight associated with a defect. So, to correctly
estimate fault proneness of some component, we had to take in account not only the number of defects,
discovered in the module, but also the set of all factors.
Product release Figure 2 – data, used to build a risk prediction model
Ri-2
Ri-1
Ri(current release)
Data used to train model (known)
Predictor P (Software metrics)
Dependent variable D
(Estimated fault proneness)
Predictor P of the future fault proneness Future fault proneness
(Unknown)
244

Directly calculating weights for all defects might not always be possible. The number of defects and
severity of defects can be obtained directly from bug-tracking databases, version control systems, code
churn or by other means; however, data on user impact might not be obtained that easily. In our
approach, we use the code branching structure of the project to provide an indirect estimation of the user
impact.
Code branching is a technique of creating a separate copy of product source code in a way that source
code in a newly created branch is an exact copy of source code it was branched from. After splitting from
a parent branch, newly created branch is independent and can evolve in a different way than the parent
branch. Branching is important during both development and maintenance phases of the product and, is
key to separating the less stable part of the code from the stable parts. Such schema is a de-facto
standard for most of large projects, like Mozilla (see fig. 3), Linux Kernel, Microsoft Windows and many
others. Specifically in the subject of our study, Windows Server 2003, branching is used in the
maintenance phase to isolate the high user impact fixes (e.g., security fixes) from the low user impact
fixes (e.g., hotfixes focused on specific customer scenarios). In this case, we would be able to assign
different weights to defects based on the branch the defect originates from.
We are now interested in estimating fault proneness FP(x) for some software component x in that
product, using known code churn CC(x) and change frequency CF(x) for multiple branches. Please note –
we are not predicting future fault proneness of a given software component, but merely estimating
(calculating) it’s current fault proneness, based on data we already know.
There are N releases of a software product currently in service. Each release i
R has
Mi branches, Ni ,1= ; for each branch ij
B (j-th branch of the i-th release) we have two parameters:
)(xCFij
- change frequency of the software component x in j-th code branch of i-th product
release
)(xCCij
- code churn of the software component x in j-th code branch of i-th product release. It
represents the size of the fixes, being done during a specific time interval
Propagating code changes
across branches
Firefox 3.0 maintenance
branch
Main
branch
Firefox 1.5
maintenance branch
Firefox 2.0
i t b h
End-of-life of the branch
Product update
Product releaseFigure 3 – branch structure of Mozilla project
245

The parameters given above are an appropriate manifestation of both the number of defects in the
software component x as well as their severity. However, a combination is needed of the two metrics so
that one numeric value can reflect both properties To associate a value of the code churn into fault
proneness for that component, we use linear functions, bounded between 0 and 1:
>+⋅
<+⋅<+⋅
<+⋅
=
1)(,1
1)(0,)(
0)(,0
))((
ij
CC
ijij
CC
ij
CC
ijij
CC
ij
CC
ijij
CC
ij
CC
ijij
CC
ijij
CC
bxCCaif
bxCCaifbxCCa
bxCCaif
xCCFP
(4)
where: ))(( xCCFPij
ij
CC
- fault proneness, associated with a code churn of component x in j-th code
branch of i-th product release.
ij
CC
ij
CC
ba , - coefficients representing the slope and intercept of the linear function for j-th code
branch of i-th release of the product. They cumulatively represent the customer impact of the fixes from
this branch: intercept ij
CC
b represents a point, where code churn starts contributing to the fault proneness
of the component. Slope ij
CC
a represents relative importance of j-th branch in comparison to other
branches: the more the user impact of the j-th branch, the higher is its slope value.
Similar technique is used to calculate fault proneness, associated with a change frequency of the defect.
))(( xCFFPij
CF
ij. Values of ))(( xCCFP
ij
CC
ij and ))(( xCFFP
ij
CF
ijcan be combined together in a
following way to represent a contribution from the j-th code branch of i-th release of the product
)(xFPij
to the total fault proneness of the component )(xFP :
))(())(())(())(()( xCFFPxCCFPxCFFPxCCFPxFPij
CF
ijij
CC
ijij
CF
ijij
CC
ijij⋅−+= (5)
Once contribution to component’s fault proneness is calculated for all i and j, it is possible to merge them
together using following recursive formula:
=⋅−+
<⋅−+
==
−−
++
MijxFPxFPxFPxFP
MijxFPxFPxFPxFP
xFPxFP
ijijijij
MijiijMijiij
Miii
;)()()()(
);()()()(
)()(
11
...1,...1,
..1, (6)
where )(xFPi
- contribution to the total fault proneness of the component from all branches of the i-th
release of the component;
Mi – number of branches for i-th release of the component. It is possible that different releases
of the product have different number of branches in service;
)(
...,
xFPbai - contribution to the fault proneness of the component from the branches a,
a+1,.., b-1, b of the i-th release of the product.
In practice, number of branches is fairly low. For example, if first release of the product has two branches
in service, contribution to the fault proneness from the branches of first release will be
246

121112111
)( FPFPFPFPxFP ⋅−+=
Contribution to fault proneness from all releases is calculated in a similar manner:
=⋅−+
<⋅−+
==
−−
++
NixFPxFPxFPxFP
NixFPxFPxFPxFP
xFPxFP
iiii
NiiNii
N
;)()()()(
);()()()(
)()(
11
...1...1
..1 (7)
where N – number of releases currently in service;
)(...
xFPba - contribution to the fault proneness of the component from releases a, a+1,.., b-1,
b of the product.
Normally, number of both branches and releases that are serviced in a particular moment of time
is low. For example, suppose there’s a product with two releases currently in service; first release has one
branch, second release – two branches. So fault proneness of component x can be calculated:
)()()()()(
)()()()()(
);()(
2121
222122212
111
xFPxFPxFPxFPxFP
xFPxFPxFPxFPxFP
xFPxFP
⋅−+=
⋅−+=
=
The resulting metric FP(x) represents an estimated fault proneness for a component x; it will always have
values between 0 and1. The higher value of the metric FP(x), the more fault prone component x is.
5.2 PREDICTING FAULT PRONENESS OF THE COMPONENT
As mentioned earlier, we use two statistical methods, logistic regression and neural network to predict
fault proneness of the components in Windows Server 2003. For each binary, a set of total 58 software
metrics was collected, including code churn, change frequency, dependency data and static software
metrics. Code churn, change frequency and dependency data have been collected across multiple
branches of the project – two maintenance branches and one main branch.
Overall, data for 2445 binary modules was collected. About 315 modules (13%) appeared to be fault-
prone modules (estimated fault proneness ≥ 0.1). Rest of the binaries appeared to be low-risk binaries
with estimated fault proneness close to zero.
Matlab Neural Network toolbox v.5 and Statistics Toolbox v.6 were as tools to build models. Principal
Component Analysis (PCA) was carried out to eliminate multi-collinearity in the data. All principal
components were taken as predictors both for a logistic regression and neural network. Multi-layered
perceptron was used as a network of choice, having 58 neurons in the input layer, 8 neurons in the
hidden layer and one neuron in the output layer. Back-propagation algorithm with variable learning rate
was used to train neural network.
To validate quality of prediction, holdout validation was used. Holdout validation is a technique to estimate
accuracy of a machine learning method. During holdout validation, some portion of data is extracted from
a training set, forming a test set. After system is trained using training set, test set is used to estimate
quality of learning. We used 25% of the training set was used as a test set to estimate quality of the
prediction. In case of the neural network, additional 15% of the training set was used as validation set to
avoid overtraining of the network: training was stopped when error on the validation set started to grow.
247

System was trained 50 times each time with a different combination of training and test sets to average
results. Training and test sets were formed by random permutation of input data set using rand() Matlab
function.
Following results were obtained for neural network and logistic regression:
Accuracy Precision
Neural network 0.77 0.78
Logistic regression 0.78 0.79
6. ALLOCATION OF RESOURCES
The fault proneness metric has been created in a way that the components that are more fault prone
need more testing than the ones that are less fault prone. Like mentioned earlier, once a product has
reached an acceptable quality bar, the overall fault proneness metric can guide the allocation of test
resources to the less stable areas. However, as changes (incremental development or maintenance)
happen across a tightly coupled product, it becomes difficult to assess the impact of changes across the
product. An example could be due to the use of shared resources - a component modifying a shared
registry key causing a regression in an entirely unrelated component.
Hence the allocation of resources needs to be done not just using the overall fault proneness, but also by
calibrating the risk of the “unchanged” components with reference to the changing components. In
essence, the component that is highly related to a changing component is likely to be affected by that
change. This argument provides the basis of how we classify the entire system on a risk level with respect
to changing components and assign resources as appropriate. The more the risk of a component having
a defect, the more testing it needs. This selective allocation of test resources results in efficient utilization
and yet focusing on the parts of the system that need most testing.
To measure risk and assess the impact, a combination of dependency, risk and various other
code/historical metrics are used. This prioritization of components with respect to metrics can be
considered as a Constraint Satisfaction Problem (CSP). CSPs are the search for an optimum solution that
satisfies a given set of constraints. The constraints in this case, are the metric values; the higher the
value is, the more risk it represents. The CSP is formulated in such a way that a certain set of
components are identified as low risk components and low test priority is given to those components.
6.1 FORMAL REPRESENTATION OF CSP
In terms of CSP, we have a set X of all N software components in the system. Each
component NjXxj
,1, =∈,
where N stands for an overall number of components, can be described by
a vector of software metrics ),...,(1 m
ppp = . The metrics that are used as variables in the constraints are
fault proneness, BDQM, and other code/historical metrics (code criticality, code complexity etc). Hence
the CSP approach is meant to be extensible so other metrics can be added or removed.
CSP requires that for every metric pi of the vector p
, a set of domain values D
i, mi ,1= must be defined.
It is assumed that the higher the value of the software metric pi, the more risky the component is. So, to
classify components as risky or not risky based on their metric values, we introduce a set of constraints
[ ]m
ccC ,...,
1
= that are applicable to the variables. Each constraint has a form of
iii
tpc ≤= , (8)
248

where ti is a predefined threshold. Component x
j can be considered as non-risky if and only if all its
metrics are falling below thresholds (constraints are satisfied):
mitpii
,1, =∀≤
(9)
Even if one metric is higher than threshold, component is considered as a high-risk and cannot be
eliminated. A set of variance factors with respect to each of the software metric is defined
as [ ]m
vvV ,...,
1
= . This is a value by which if the threshold is increased, one more additional component
will satisfy the constraint C.
However, low risk and high risk are subjective to the input to the system. In our study, we were
constrained by total the number of resources available to test the entire system and the goal was to
identify a percentage of least risky components (say ά). Hence the CSP should find a total of ά percent
components that are least risky. The thresholds would automatically adjust according to the solution of
the CSP to allow ά percent components to be classified as low risk.
Assuming that RLand R
H are the low risk and high risk components respectively:
Therefore: (L + H = N),
where L = number of the low-risk components
H = number of the high-risk components
The constraint that is to be evaluated is:
100
N
L
⋅
≥
α
(10)
The objective function for identifying the low risk binaries is:
∑∑= =
=
N
j
m
i
i
R
xpZ
L
1 1
)(minarg
(11)
This finds the set RL that contains binaries with minimal values of the metrics. This objective function
ensures that that the binaries selected are low risk and the rest of the remaining binaries are classified as
high risk.
6.2 SOLVING THE CSP
The CSP can be solved by following the approach of the conventional backtracking search for CSP [8].
The basic approach is that the algorithm starts with an initial assignment of low values for thresholds.
After the first iteration an initial set of the low-risk components are collected that have all the binaries
satisfying constraint C. Now, we iterate over the remaining components, increasing the thresholds of each
of the metrics by the corresponding variance factor. This process is repeated until we get the desired ά
percent components that are least risky. Below is the pseudo code of a variation of the conventional back
tracking algorithm:
Variables:
LowRiskX: Set of low Risk components
TotalX : set of all components in the system
alpha: percentage of components that have to identified as least risky
[ ]m
vv ,...,1
: Variance factor that increases percentage of thresholds t
249

function BACKTRACKING-SEARCH(TotalX, int alpha) returns a solution
{
LowRiskX = {null};
TotalX = total components;
return BACKTRACKING(LowPriorityX, alpha)
}
function BACKTRACKING(LowRiskX,TotalX, alpha) returns a solution
while(LowRiskX is not alpha% of TotalX)
foreach (i in m)
Increase thresholds ti by v
i%;
Foreach x in TotalX
Boolean IsEliminated = true;
foreach (i in m)
If(!IsValid(x, ti)) {checks the constraints (8)
IsEliminated = false;
If(IsEliminated)
Add x in LowRiskX;
Return LowRiskX;
End function
Performance of the algorithm was not a requirement, however, the accuracy of the classification was. The
algorithm is straight forward in selecting all components that fall below the adjusted threshold in relation
of the input percentage.
7. CONCLUSION
The principles of this research were applied in actual testing exercises done by the Windows
Serviceability team on a bimonthly basis. The results are encouraging. Using the fault proneness and
numerous other metrics mentioned in (3.2), we were to save 30% of the component resources. Over a
period of one fiscal year, this amounts to substantial reductions in testing cost. There was no case in
which a binary classified as “low risk” suffered a regression.
One of directions for our future work will be to increase accuracy and precision of fault-proneness
prediction by refining the metrics and using more advanced methods of statistical learning models. We
plan to integrate our results with code coverage which would allow us to select and execute actual tests
that cover the impacted code paths.
250

8. APPENDIX
8.1 METRICS USED TO PREDICT FAULT PRONENESS OF THE COMPONENT
Metric name Metric description
BC Component size, binary blocks
AvgBlocks Average function size, binary blocks
MaxBlocks Maximum function size in the component, binary blocks
MaxComplex Maximum McCabe complexity of any function in the component
AvgLocals average number of local variables per function in the component
MaxLocals Maximum number of local variables in some function in the component
AvgParameters Average number of parameters per function in the component
MaxParameters Maximum number of parameters in some function in the component
AvgFanInOut average number of calls between function in the module
MaxFanIn Maximum number of calls into some function in the module
AvgFunctionLocalCpl
Average number of dependencies to other classes through local variables
declaration in the functions of the module
AvgProcCpl
Average number of dependencies between functions in the component by sharing
an address of a variable
MaxProcCpl
Average number of dependencies between functions in the component by sharing
an address of a variable
AvgAddrCpl
Maximum number of dependencies between functions by sharing an access to a
global variable
MaxAddrCpl
Average number of dependencies between functions by sharing an access to a
global variable
AvgMethods Average number of methods in a class in the module
MaxMethods Maximum number of methods in a class in the module
AvgBaseClasses Average number of base classes for a class in the module
AvgSubClasses Average number of subclasses for a class in the module
MaxBaseClassCpl
Maximum number of dependencies between immediate base classes of the
module
MaxClassMemberCpl
Maximum number of dependencies between classes through member variables of
the classes
AvgRetValueCoupling
Average number of dependencies between classes through return values of the
member functions
251

8.2 SAMPLE BDQM GRAPHS FOR TWO CORE WINDOWS BINARIES
BinaryA.dll is a binary in the networking component of Windows Server 2003
BinaryB.dll is implements core OS features in Windows Server 2003
252

9. REFERENCES
1. E. Arisholm, L.C. Briand. “Predicting Fault-Prone Components in a Java Legacy System”,
Proceedings of the 2006 ACM/IEEE International Symposium on Empirical Software Engineering
(ISESE), September 21-22, Rio de Janeiro, Brazil.
2. N. Nagappan, T. Ball, A. Zeller, “Mining Metrics to Predict Component Failures”, Proceeding of
the 28th international conference on Software engineering, May 20-28, 2006, Shanghai, China
3. P. Knab, M. Pinzger, A. Bernstein, “Predicting Defect Densities in Source Code Files with
Decision Tree Learners”, Proceedings of the 2006 international workshop on Mining software
repositories, May 22-23, 2006, Shanghai, China
4. N. Nagappan, T. Ball, “Use of Relative Code Churn Measures to Predict System Defect Density”,
Proceedings of the 27th international conference on Software engineering, p.284-292, May 15-
21, 2005, St. Louis, MO, USA
5. D. Neumann, “An Enhanced Neural Network Technique for Software Risk Analysis”, IEEE
Transactions on Software Engineering, v.28 n.9, p.904-912, September 2002
6. D. T. Larose, “Data mining methods and models”, 322p., Wiley-Interscience, Hoboken, NJ, 2006.
7. T.M. Khoshgoftaar, R.M. Szabo, “Using neural networks to predict software faults during testing”,
IEEE Transactions on Reliability, Vol. 45, no. 3, pp. 456-462.
8. P. Norwig, S. Russell, “Artificial Intelligence: A Modern Approach”, 2nd
edition, 1132 p., Prentice
Hall, 2003
9. W.C. Hetzel, “The Complete Guide to Software Testing”, 2nd
edition, 280 p., QED Information
Sciences, Inc , Wellesley, MA 1988
10. T. J. McCabe, “A complexity measure”, Proceedings of the 2nd international
conference on Software engineering, p.407, October 13-15, 1976, San Francisco,
California, United States
253

254

Applying Selective Revalidation Techniques at Microsoft
Jean Hartmann IE Test Architect
Microsoft Corp. Redmond, WA 98052
Tel: 425 705 9062 Email: [email protected]
Biography
I currently hold the position of Test Architect in the Internet Explorer (IE) team. My main responsibility
includes driving the concept of software quality throughout the IE development lifecycle. My technical
interests, while diverse, have gravitated over the years towards three main areas of interest, namely testing,
requirements engineering and architectural analysis. Previously, I was the Manager for Software Quality at
Siemens Corporate Research for twelve years and earned my Ph.D. in Computer Science in 1992
researching the topic of selective regression testing strategies, whilst working with the British Telecom
Research Labs (BTRL) in Ipswich, U.K.
Abstract
The Internet Explorer (IE) test team faces two key testing challenges:
• Efficiently and effectively regression testing code changes in the context of a large and complex code base
• Managing the size and complexity of a large suite of tests while maintaining its effectiveness
At the same time, the team also wants to maintain the quality bar across the range of different IE versions, the Windows platforms on which IE runs and its 32-/64-bit binary releases. All of these factors are then also being considered in the context of shorter development test cycles.
Our approach to addressing these challenges is to apply so-called selective revalidation techniques, which leverage our existing code coverage data. Regression test selection enables a potentially significant reduction in the number of regression tests that need to be rerun in response to a given code modification. Test set optimization focuses on a mechanism to better prioritize our large test suite and identify potential redundancy. We anticipate that both of these techniques will not only encourage more systematic and efficient testing procedures, but significantly streamline our current test development cycle.
While research into selective revalidation techniques has been conducted for thirty years, there have been very few publications that have discussed this topic beyond the academic setting. This paper attempts to address this and showcases the activities conducted in this area within Microsoft. This paper examines specific challenges facing the IE team and outlines its requirements for selecting selection revalidation techniques. We describe how these requirements were met by these techniques and their application to key activities within the IE development test process. We also demonstrate how existing in-house tools have been leveraged, customized and deployed to support the process. Examples, taken from the recent IE7/Vista development lifecycle, are given throughout.
255

1 Introduction
Over the past twelve years, Internet Explorer (IE) has evolved into a large and complex product of several million lines of C/C++ code with a test suite to match it. The Web browser’s code base has been subjected to infusions of new code during major releases --- tabbed browsing and RSS being two good examples of this in IE7 --- and hundreds of continuous, smaller maintenance changes in response to customer needs, security enhancements, evolving Web standards and competition from other browsers. Along with these code changes, test suites have evolved --- the current IE test suite comprises close to 60K functional IE7/Vista tests. All of this work has been conducted by many generations of Microsoft developers and testers with their own coding and test-scripting styles, documentation practices and knowledge/experience of the existing product and test code.
1.1 Challenges and Goals
Based on these facts, the IE test team is addressing two key challenges to improve product validation:
1. Streamline the test suite --- we are facing the issue of how to streamline a continuously growing test suite containing tens of thousands of automated/manual feature tests whose impact is felt most during our major test passes, which typically have taken two weeks to complete. Many of the tests were created years ago and are potentially redundant in that they have been superseded by other tests that better exercise product functionality.
2. Develop effective regression testing (or buddy testing) --- with shorter development cycles and high quality being key objectives for the test team, we are looking to reduce the time taken to identify the impact of code changes to features as well as provide a more efficient and effective way to determine regression tests. We are looking for efficiency gains by executing fewer and more relevant tests. This leads to earlier detection of breaking code changes prior to code being checked in by developers.
These two challenges need to be considered in a broader context. One goal is to streamline the existing test suite, so that it represents a ‘core’ test set with which to validate the existing IE feature set. Another related goal is to focus on augmenting and complementing this core test set with additional scenario- and API-based tests; these are currently being developed to better reflect customer requirements and typical user scenarios [1]. Achieving these two goals will result in a ‘rejuvenated’ test suite from which testers are able to then efficiently select more effective regression tests.
1.2 Requirements for Selective Revalidation
The following requirements guided us in our exploration of suitable selective revalidation techniques and tools to address the above challenges. The approach needed to be:
• Based on an established quality metric - we wanted to leverage an established and accepted quality metric, such as code coverage, to better understand and quantify the contribution each existing test case made to exercising product code.
• Scalable, efficient and cost effective - we needed a simple, flexible and scalable selection strategy based on code coverage that could select tests quickly, even in the presence a large number of code changes and tests, and had the potential of being tuned via parameters.
• Easily integrated and applicable --- we required a selection strategy that could be uniformly applied across all supported IE shipping lanes and easily integrated into our existing test cycle and tools environment.
The remaining paper describes how we intend to deploy selective revalidation techniques based on the above requirements. Thus, Section 2 discusses how we gathered, analyzed and enhanced our code coverage data to form the basis for selective revalidation. In Section 3, we then discuss how that coverage data is used in conjunction with a specific type of selective revalidation technique and how it can be applied in the
256

context of regression test selection and test set optimization. For Section 4, we highlight key testing activities in the IE development test process that we believe will benefit from this approach. Section 5 outlines how in-house tools are being used to support these activities and integrated into the existing tool environment. Section 6 defines the framework for an empirical study we intend to conduct to evaluate the different regression test selection strategies. Finally, Section 7 briefly discusses some of the related work as well as our conclusions and future work.
2 Code Coverage
The IE test team felt that leveraging an established and accepted quality metric, such as code coverage, was an important first step in better understanding and quantifying how their current test collateral was actually contributing towards testing, that is, exercising the product. Improving our code coverage numbers represented a significant test improvement activity in itself. It also contributed to increasing the effectiveness of any code-based selective revalidation technique that we would choose1. Code coverage data was used to:
• Identify ‘test holes’ --- these ‘test holes’ represented areas of the product with insufficient coverage of the code - they needed to be ‘filled’. A significant benefit of this work was that the analysis of uncovered code helped testers to better understand the product design, engage in deeper and more meaningful discussions with developers and resulted in additional feature tests being created for the test suite. A by-product of these discussions was the identification of dead product code that was removed by developers leading in turn to improved code coverage numbers.
• Align feature and code ownership --- apart from using code coverage data to gain a better understanding of how their features were implemented, testers were able to use this data to help them map their features to code. With testers knowing which parts of the code base implement their features, we believe that testers can more quickly determine how a given feature/code change affects them and related features. This leads to more effective buddy testing by focusing testers on the impacted code and helping them scope their testing responsibilities and efforts.
Gathering code coverage data was a mandatory activity during the development of the Windows Vista operating system. Each component of Vista, including IE7, had to meet a quality bar for which each DLL had to reach at least 70% block (statement) coverage2. This mandate not only encouraged teams to strive for highest possible code coverage numbers, but it ensured that the teams were centrally supported with suitable automated tools to instrument, collect, analyze and maintain their respective coverage data. This availability of tools was a key factor to our subsequent exploration of selective revalidation.
These tools enabled us to develop a custom code coverage process around the automated instrumentation of daily IE7/Vista builds that drove the coverage numbers for the majority of IE components well beyond the 70% mark3. Code coverage data was kept current for testers by a frequent merging schedule, so that it always corresponded to the latest build updates. As the product was being globally developed, we addressed the process issues associated with gathering coverage data locally at sites in India and China and then merging this data with our central coverage database in Redmond. This enabled the remote teams to test and measure code coverage independently for their features, but then to view their contributions to the overall product numbers.
1 One important characteristic of our test suite that will help increase the effectiveness of these approaches is that there is no test case dependency - each test case is independent of each other.2
The IE product contains at least sixty .DLL and .EXE files as part of its retail releases.
3
An appreciable percentage of IE binaries represent 3rd
party (MS) binaries (aka binary drops); we are not
responsible for collecting code coverage for these.
257

3 Selective Revalidation
Our second selective revalidation requirement led us to the exploration of existing code-based techniques. We were attracted to these by the fact that we could leverage our existing code coverage data. These techniques also have a proven track record of research spanning the past twenty years. Our efforts focused upon a particular class of test selection techniques that distinguish themselves in terms of their relative simplicity, flexibility and efficiency. These techniques all have a common characteristic --- they express the problem of selective revalidation using mathematical linear programming models. Solving these models results in a minimal set of tests being identified that either prioritize the set - whilst maintain the code coverage numbers of the original test set (test set optimization) - or exercise all modified code entities (regression test selection).
3.1 Linear Programming
Linear programming techniques have been applied to the problem of selective revalidation for nearly thirty years [2,3,4,5]. The problem is expressed as a set-covering problem, which is NP-complete. For this reason, researchers started applying heuristics, such as greedy algorithms [6], which can obtain near optimal solutions in reasonable timeframes. The main, repetitive selection step of such greedy algorithms entails identifying a next best test case based on whether it traverses the fewest or most code coverage entities (e.g. blocks/statements) 4 from the set of remaining tests until all entities are covered by the selected set of tests. Algorithms vary on their starting point --- they either select the test with the shortest or longest coverage vector, respectively.
Essentially, this approach gauges the effectiveness or quality of a given test case by the length of its coverage vector --- either shorter or longer vectors are deemed ‘better’ tests. We considered tests with the longest coverage vectors to be more valuable/effective as they exercised longer execution paths, potentially resulting in better fault detection capabilities.
3.1.1 Test Case Weightings
Greedy algorithms, that is, linear programming models are not only simple to implement and scalable, but they are also flexible in that they enable us to influence their solutions via their so-called cost or objective functions. In the context of a selective revalidation problem, the cost function depicts each test case as a variable with an associated cost parameter or weighting. Typically, when each test case is weighted equally, the greedy algorithm considers each of them equally during selection. However, this changes when weightings can be assigned to each test case to influence the selection step of the algorithm.
Later, we will highlight IE7 situations in which we applied these different weightings to both test set optimization and regression test selection. Here are some examples of test weightings that we can specify as part of our models:
• Test Duration --- represents a weighting that reflects the time taken to execute and verify a given test and could be used to influence test selection in the presence of automated or manual tests
• Test Priority - represents a weighting that reflects the priority or importance of a given test and could be used to influence test selection given a suite of mixed priority tests
• Test Category - represents a weighting that characterizes a given test according to whether it exercises basic product functionality (e.g. HTML/CSS language construct), user scenarios (e.g. subscribing to an RSS feed) or API.5
4
Also known as the test’s coverage vector.
5 This weighting can be used to offset the greedy algorithm’s tendency to favor those tests that possess the longer code coverage vectors.
258

3.1.2 Usage
Flexibility was taken a step further by examining some of the other key usage scenarios. For example, we want to enable testers to tag key tests that they feel are important for selective revalidation and then ensure that the greedy algorithm selects additional tests incorporating the requested ones. This scenario blends the automated selection of tests by the greedy algorithm with the intuition, knowledge and experience of testers for their product.
Another usage scenario involves solving a linear programming model with multiple objective functions. The goal here is enable testers to determine a set of regression tests that satisfies more than one (cost) objective. For example, an IE tester validating a time-critical maintenance fix related to a UI-centric code change may want to identify a minimal test set where all tests are automated and scenario-based. Models are therefore developed and solved by the greedy algorithm using the above test duration and test category as weightings [7].
3.2 Regression Test Selection
Effective regression test selection is now characterized as the application of the above linear programming
concepts in two different ways:
• With code changes – an approach that takes into account the results of a binary difference
analysis between two IE builds. In other words, we first consider the impact of code changes
between two product builds, expressed in terms of differences in code binaries. We then leverage
that list of differences as well as our code coverage data to establish a set of linear constraints for
the model. Solving this model provides a minimal regression test set containing only those tests
that traverse the impacted code.
• Without code changes – a less focused, yet still effective approach that ignores the code changes
between product builds and solves the resulting model to provide a prioritized (and minimal)
regression test set containing tests that provide same representative code coverage as the original
test set. This approach can be interpreted as ‘test set optimization in a regression testing context’6.
Further filtering mechanisms can be applied to either constrain or widen the view of impacted features –
this allows testers to focus on revalidating individual features or sharing details of the impact with
colleagues who own related, that is, dependent features. Whenever code changes are made and considered
for which there is no coverage, no tests will be selected. This implies that the given code change was not
exercised by any test case, which is valuable feedback for testers to create additional tests. Thus, this
approach to regression test selection provides both quantitative and focused feedback to developers and
testers on where and how they need to improve code, that is, test quality.
3.3 Test Set Optimization
We can characterize test set optimization as the simple application of the above linear programming
models. Given the code coverage data, we establish a set of linear constraints for the model along with
equal weightings for all tests. As mentioned above in the regression test selection context, solving such a
model provides us with a representative set of tests with the same code coverage numbers as the original
test set. Test set optimization supported several IE7 test initiatives whose overall objective was the
migration of existing test cases to a new test case management system.
Here some sample initiatives:
• Drive towards Total Test Automation--- As previously mentioned, the IE test suite comprises both manual and automated tests. As part of a separate test initiative, the team set itself the goal of automating as many of its remaining manual test cases as possible. Previously, testers had little
6
Also known as test suite minimization or test case prioritization.
259

guidance or focus as to the order in which to automate these tests. Test set optimization now provided that guidance - testers identified the manual tests within the representative set and started
to automate those first. For example, test set optimization identified approximately 200 manual
tests for testing the IE user interface out of a total of approximately 500 manual tests. From that
representative test set, testers automated approximately 80 tests, which led to a 10-15% increase in
code coverage.
• Reviewing and Updating Test Priority --- the IE test suite comprises of mixed priority tests ranging from P0 (high priority) to P2 (low priority). Over the years, high priority tests that were developed to validate the latest features for a specific IE release where often demoted by one priority level when work commenced on a newer release. For example, P0 tests developed for IE5.5 became P1 tests during the testing of IE6; similarly, P1 tests became P2 tests and so forth. As a result, the contributions made by these lower priority (older) tests were often forgotten as there was no means of measure their effectiveness. With code coverage, we have been able to better quantify that effectiveness. More importantly, test set optimization highlighted situations in which an appreciable portion of the selected tests were actually lower priority ones. This led us to review and potentially upgrade tests again to a higher priority. For example, the HTML engine in IE comprises a total of about 43K tests for IE7/Vista. By using test set optimization, we identified a set of about 3.7K tests of which 3.5K tests were priority P1 and P2 tests. As a result, we upgraded those P1 and P2 tests to P0 status and now have an effective suite of P0 tests that we use to maintain our code coverage of the HTML engine and its existing features going forward.
• Focusing on Test Redundancy - while test set optimization helps with test case ordering or prioritization as described above, it also draws testers’ attention to the remaining tests that may potentially be redundant from a structural code point of view. In the above example, the P1 and P2 tests remaining after the P0 upgrade, are now being investigated further and deleted, if necessary. Deletion hinges upon manual inspection to determine whether the test is redundant from a functional point of view (along with other non-functional aspects such as runtime stability).
4 IE Development Test Process
The IE development test process is typical of the test lifecycle within Microsoft. It is essentially split in two
verification stages:
• Pre-checkin – where the reviewed code changes supplied by developers are analyzed and
validated by testers during buddy testing. Only after testers approve the changes can developers
check-in the changes. The goal is to ensure that neither the product build, nor the tests that
exercise it, are broken and to perform these tasks with maximum effectiveness and efficiency, so
that developer productivity does not suffer by being blocked for check-ins.
• Post-checkin – where the code changes become part of the product build and testers validate the
product in a broader context. This is achieved by running larger numbers of feature tests7
at given
milestones, e.g. daily, weekly, RIs (integration point) and test passes. The goal is to ensure product
quality and compliance with requirements, while ensuring maximum effectiveness and efficiency
with respect to tester productivity.
4.1 Pre-checkin Verification
Despite this two stage verification process, a number of bad code check-ins and regressions still made it
into IE7/Vista. Inconsistency in how the buddy testing process was applied across and within feature teams
was one issue. However, the key issue was insufficient detailed knowledge of the nature of the code change
and its impact. Testers were typically not involved in code reviews prior to testing. In addition, they did not
7
Non-functional tests, such as security, localization/globalization and performance test, are also run at
major milestones.
260

possess tools to help them assess the impact of a given change, so testers relied on their product knowledge
and test experience to understand and scope the change, then rerun the appropriate set of tests. Rerunning
was often slowed by the fact that many of the selected regression tests were manual tests. As a result, a
backlog of code changes that required buddy testing built up, blocking and frustrating developers. Under
pressure to relieve that backlog, testers were often tempted to sacrifice quality.
As part of this ongoing test initiative, we are updating and streamlining the existing buddy testing process
as well as creating an automated test set dedicated to this type of testing. The work described in this paper
addresses the need for supporting strategies and tools that can aid testers in performing regression test
selection for individual features - scoping and assessing the impact of code quickly as well as selecting an
effective set of automated tests. If no tests exist to validate the change, testers are focused on which areas
they need to create new automated tests for. Quicker turnaround directly benefits developer productivity.
4.2 Post-checkin Verification
The challenges faced by testers during this stage are not so much centered on the time it takes to execute a
mostly automated test suite (although a reduction in test execution time is always beneficial), but the time
they spend on failure analysis by having to examine a potentially large number of test results. Failure
analysis is extremely time-consuming as differences in test results need to be distinguished as either a
product or test bug. Therefore, any support that testers can get to reduce the set of regression tests and
associated failure analysis time directly benefits their productivity. The work described in this paper
describes supporting strategies and tools that can aid:
a) Test lab administrators in effectively and efficiently selecting a subset of automated feature tests
tailored to the importance and time constraints of the given milestone, e.g. a daily test run would
entail selecting an effective regression test set from the P0 tests and helping testers reduce the
failure analysis time.
b) Testers with, for example, reducing the number of remaining manual tests that they need to be run
for a given testing milestone8
.
5 Tools
The third selective revalidation requirement is based on the ability to easily customize and integrate the
supporting tools into the existing development test cycle as well as be able to apply them as a unified
solution across all IE shipping lanes. The Magellan tool set, which has been developed in-house, fulfills
this third requirement and plays an essential part in the success of this ongoing test initiative and the
associated empirical study. This section provides only a brief overview of these tools, more details are
available in [8].
The Magellan tool set provides an infrastructure for instrumenting, collecting, storing, analyzing, and
reporting code coverage data. The core of Magellan comprises of a SQL Server-based repository that can
store the coverage vector or trace information associated with executing each test. That trace data can be
mapped to the static structure of the program: the procedures, files, directories, binaries etc. that make up
the program from which the coverage statistics are then computed. All the program binaries that were
tested and their corresponding symbol files for all relevant versions of the program are stored in a separate
symbol repository. The information in the symbol repository can be related to the information in the
coverage repository.
The toolset includes separate utilities to:
• instrument the target set of program binaries
• monitor and store to disk any trace data created during test execution
8
It may not be possible or worthwhile to automate specific sets of tests for a product.
261

• import the trace data into Magellan’s repository
• view the stored trace data with a graphical mapping to source code
• blend/merge trace data from various versions of the program
• perform test selection using a greedy algorithm
The toolset used by the IE team was customized to provide a localized code coverage and selective
revalidation solution. The most extensive work was conducted in integrating the Magellan tools with IE’s
specific test execution harnesses and test case management system. That solution enabled us to report IE-
specific code coverage for both manual and automated tests as well as provide virtually instantaneous
feedback to our testers as to their code coverage contributions. In addition, it enabled us to contribute our
coverage results to the Vista-wide code coverage data collection effort upon demand.
6 Case Study
Whenever new test initiatives are introduced within the IE team, we aim to also measure their effectiveness
and efficiency gains. The following section outlines a case study that we are embarking on to compare
selective and traditional regression testing techniques. While goals, key variables and the general approach
may appear similar to other studies found in the literature, we believe that our use of real product data is a
more compelling factor in demonstrating the benefits and limitations of these techniques.
6.1 Goals
As with previous empirical studies, the goals of this study are twofold:
a) Examine the percentage reduction in the number of regression tests given a code modification
b) Assess the fault detection capabilities of rerunning this reduced set of regression tests to validate
the code change
6.2 Leveraging Product Data
Few empirical studies have been conducted on the selective revalidation of software [9,10,11]. Typically,
such studies have:
• Used small sample programs (max: 50KLOCs of code)
• Simulated program errors by seeding pre-defined faults/fault types
• Exercised code with small numbers of test cases (max: 1000 tests)
This upcoming case study will redress that situation and provide a more realistic picture of benefits and
limitations. Once completed, we believe the study will be of significant interest to the software testing
community at large. We feel that there are significant benefits that make IE and other Microsoft
applications, attractive candidates for study:
• Large amounts of source (binary) code are available, version-controlled and actively maintained
for IE6 and IE7, which run on multiple Windows platforms
• Code coverage data is available on a per test case basis and can be collected against the most
common coverage criteria, namely statement (block) and branch (arc) coverage. The data can be
easily gathered at regular intervals and merged to reflect evolving product builds. Also, the
collection of code coverage data is mandated and thus does not need to be factored into our cost-
benefit analysis.
262

• Large numbers of code changes are available, reflecting actual product enhancements, feature
changes and simple maintenance fixes
• Large amounts of functional tests, which exhibit no dependencies amongst each other, are
available to exercise IE usage scenarios, APIs and web language constructs. These tests have been
generated via manual scripting as well as a variety of automatic test generators.
• Testers are available for consultation and to assist in collecting the pertinent data for this study.
They are being trained in the use of the tools and the goals of the study.
6.3 Key Variables
We intend to evaluate the benefits of selective revalidation and have identified the following key (and
familiar) variables for our study:
• Test selection strategy – we will be comparing a total of five regression testing strategies, two
traditional and three selective ones. The two traditional ones will include:
o Re-running all tests for a given change (also known as retest-all)
o Select tests based on testers’ product knowledge and test experience.
All three selective strategies will leverage our code coverage data with two strategies using linear
programming. The selective strategies include:
o Aggregate or ‘safe’ approach that identifies tests based simply on the traversal of the
modified code.
o Use of the greedy algorithm to minimize the test set and considering code change
information
o Use of the greedy algorithm to minimize the test set without considering code change
information
• Code coverage criteria – as we have gathered code coverage data in the form of statement
(block) and branch (arc) coverage, we are looking to shed light on the existing hypothesis of how
test granularity can affect test selection. We will be applying the test selection strategies
mentioned above to test suites created using these two coverage criteria and determining the
cardinality and fault detection effectiveness of the subsets. At the same time, we will be
investigating those test selection strategies whose algorithms select tests based on multiple
coverage criteria [12].
• Code modification patterns – we are trying to ensure that we examine a representative set of
code modification patterns based on the type of change being made, its location and scope and
the complexity of software. Past studies have indicated that this variable is very important as it
affects the number and type of tests selected and the faults caught. We intend to sample code
modifications and select a representative set from major IE components.
Our case study is taking into consideration the ideas described by Harrold et al. [13] in their evaluation
framework for comparing different regression testing approaches.
6.4 Cost-Benefit Analysis
Gathering code coverage data for IE is a mandated activity. This simplifies our comparison of the different
revalidation techniques considerably. Analysis will focus on measuring the costs associated with traditional
testing strategies such as the time to execute and resolve test failures versus determining costs for
computing code differences, selecting and rerunning minimal or aggregate test sets. Unlike previous studies
that focused mainly on the time savings gained by selective revalidation techniques during test execution,
263

our analysis will focus primarily on time savings associated with test results analysis. These costs will be
examined and compared against the fault detection capabilities of each technique.
7 Conclusions and Future Work
Regression testing is a very important topic for companies, such as Microsoft, who are developing and
maintaining large software platforms and applications over long time periods [14]. The subject of selective
revalidation is therefore of great interest to these companies as they attempt to shorten their testing cycles
and reduce costs, while maintaining software quality. Numerous papers have been published, which
describe and compare a wide variety of techniques including ones based on linear programming models. Of
these, there are a very small number of papers that discuss empirical studies of these techniques. None of
these studies was able to collect and leverage product development lifecycle data to the extent that we have
described above. In future, we are looking to co-operate with other Windows and Microsoft business
groups in order to evaluate an even larger set of data. We feel that the results of our studies will not only
provide companies, such as Microsoft, with efficient and effective ways of validating their products, but
potentially re-invigorate the research into this topic.
6 Acknowledgements
I would like to thank Jason Upton, IE Principal Test Manager, for his support with this ongoing test initiative and thank my colleagues from the IE Test Team, in particular, Carey Brown, Reza Nourai and Nomita Paul for their significant contributions, support and discussions concerning this work. Thanks are also due to the Windows code coverage team, namely Duke Kamstra and Kevin Burrows, whose tools and support were essential in the success of this project.
7 References
1 Hartmann J., “Leveraging Model-driven Testing Practices to Improve Software Quality at Microsoft”,
PNSQC Conf., pp. 441-50, Oct. 2006.
2 Fischer K.F., F. Raji and A, Chruscicki, “A Methodology for Retesting Modified Software”, National
Telecomm Conference, pp. B6.3.1-6, 1981.
3 Hartmann J., “Techniques for Selective Revalidation”, IEEE Software, pp. 31-6, Jan 1990.
4 Harrold M.J., R. Gupta and M.L. Soffa, “A Methodology for Controlling the Size of a Test Suite”,
IEEE ASE Conference, pp.176-85, 1993.
5 Chen T.Y. and M.F. Lau, “Dividing Strategies for the Optimization of a Test Suite”, Information
Processing Letters, pp. 135-41, March 1996.
6 Chvatal V., “A Greedy Heuristic for the Set-Covering Problem”, Math. Operations Research, pp. 233-
5, Aug. 1979.
7 Black J., E. Melachrinoudis and D. Kaeli, “Bi-criteria Models for All-Uses Test Suite Reduction”, Intl.
Conf. on Software Engineering, 2004.
8 Srivastava A. and J. Thiagarajan, “Effectively Prioritizing Test in Development Environment”,
International Symposium in Software Testing and Analysis (ISSTA), pp. 97-106, 2002.
9 Rothermel G. and S. Elbaum, “Putting Your Best Tests Forward”, IEEE Software, Sept./Oct. 2003.
264

10 Elbaum S., A.G. Malishevsky and G. Rothermel, “Test Case Prioritization: A Family of Empirical
Studies”, IEEE Trans. On Software Engineering, pp. 159-82, Feb 2002.
11 Rosenblum D. and E. Weyuker, “Lessons Learned from a Regression Testing Case Study”, Empirical
Software Engineering, pp. 188-91, 1997.
12 Jeffrey D. and N. Gupta, “Improving Fault Detection Capability by Selectively Retaining Test Cases
during Test Suite Reduction”, IEEE Trans. On Software Engineering, pp. 108-23, Feb. 2007.
13 Rothermel G. and M.J. Harrold, “Analyzing Regression Test Section Techniques”, IEEE Trans. On
Software Engineering, pp. 529-51, August 1996.
14 Onoma A.K., W-T. Tsai, M. Poonawala, H. Suganuma, “Regression Testing in an Industrial
Environment”, Comm. Of the ACM, pp. 81-6, May 1998.
265

266

Project Intelligence
Rong Ou
Google Inc.
1600 Amphitheatre Parkway
Mountain View, CA 94043
(650) 253-3297
Abstract
Modern software development is mostly a cooperative team effort, generating large amount of
data in disparate tools built around the development lifecycle. Making sense of this data to gain a
clear understanding of the project status and direction has become a time-consuming, high-
overhead and messy process. In this paper we show how we have applied Business Intelligence
(BI) techniques to address some of these issues. We built a real-time data warehouse to host
project-related data from different systems. The data is cleansed, transformed and sometimes
rolled up to facilitate easier analytics operations. We built a web-based data visualization and
dashboard system to give project stakeholders an accurate, real-time view of the project status. In
practice, we saw participating teams gained better understanding of their corresponding projects
and improved their project quality over time.
Biography
Rong Ou is a Software Engineer at Google working on engineering tools to help other engineers
build better software faster. Before coming to Google, he was a Principal Software Architect at
Sabre Airline Solutions, where he had been an enthusiastic proponent and active practitioner of
Extreme Programming (XP) since 2000. He has an MS in CS from The University of Texas at
Austin and a BA in Physics from Peking University.
267

Introduction
Software development has become a complicated business, especially in a large global
organization like Google [1]. Even for a project that starts with an engineer’s “20 percent time”
[2], it soon takes on a life of its own, generating a multitude of artifacts. Developers write their
unit tests, which are run every time the code is checked in, with pass/fail and code coverage
information recorded. QA engineers perform manual and automated tests, with their own set of
results and coverage data. More specialized testing, such as load and performance testing,
security testing, internationalization testing, generates more data. Throughout the whole project
life cycle, different stakeholders create and work on bugs, feature requests and customer reported
issues. All this data may be kept in different systems, which may not be fully integrated. To add
to the complexity, project team members can be spread across the globe in different time zones.
How do we get a clear understanding of a project, its past trend, current status and future
direction? How do we communicate that understanding concisely and in real time to our global
team? How do we know if a product is ready to launch? Or perhaps for the ultimate goal, how do
we apply our understandings to improve a project’s quality?
The approach we have taken, as demonstrated in this paper, is to treat the software development
process as a business, and use Business Intelligence (BI) tools and techniques to address these
concerns.
Definitions
The Data Warehouse Institute, a provider of education and training in the data warehouse and BI
industry, defines business intelligence as:
The process, technologies, and tools needed to turn data into information, information
into knowledge, and knowledge into plans that drive profitable business action. Business
intelligence encompasses data warehousing, business analytic tools, and
content/knowledge management. [3]
As this definition implies, BI is a broad concept, covering not only tools and technologies, but
also processes and people. In our context, we are most interested in two technologies: data
warehouse and information dashboard.
The term data warehouse is sometimes used interchangeably with business intelligence. For our
purpose, we consider a data warehousing system as the backend, or infrastructural, component
for achieving business intelligence. The approach to building a data warehouse falls into two
camps centered around two pioneers of the field. In Inmon’s paradigm [4], an enterprise has one
data warehouse, and data marts source their information from the data warehouse. In the data
warehouse, information is stored in third normal form [5]. In Kimball’s paradigm [6], the data
warehouse is the conglomerate of all data marts within the enterprise. Information is always
stored in the dimensional model.
268

Debating the merit of each approach is beyond the scope of this paper. In practice we mostly
followed Kimball’s dimensional modeling, defined as:
A methodology for logically modeling data for query performance and ease of use that
starts from a set of base measurement events. In the relational DBMS environment, a fact
table is constructed generally with one record for each discrete measurement. The fact
table is then surrounded by a set of dimension tables describing precisely what is known
in the context of the measurement record. Because of the characteristic structure of a
dimensional model, it is often called a star schema. [6]
Dashboard is also an overloaded term, but this definition has worked for us:
A dashboard is a visual display of the most important information needed to achieve one
or more objectives, consolidated and arranged on a single screen so the information can
be monitored at a glance. [7]
The Central Idea
Once we have the terminologies defined, it becomes clear that the applicability of BI is not
limited to any specific business domain. For any human endeavor that generates large amounts
of data used to drive business decisions, BI can help. Software development certainly fits that
description.
On the simplest level, writing software is turning ideas into executable code. Although a
superstar programmer can still produce large amount of code, sometimes even full-blown
products, all alone, in most cases software development is a team effort. Product managers
generate ideas, requirements, use cases, or in the case of agile development, user stories [8].
Project managers define project plans, releases, and milestones. Developers write code and check
it into a source repository; hopefully they also write unit tests, integration tests, and acceptance
tests, using them to drive design, verify behavior and facilitate future refactoring. Perhaps there
is a continuous build system in place, which builds the system and runs all the tests whenever
code is checked in. There may be additional hooks in place to do static analysis or check test
coverage. QA engineers do manual and automated testing against the system, ideally with the
results recorded in some data repository. Specialists do reviews and testing for user interface,
load and performance, security, internationalization, launch readiness, etc. Throughout this
whole process, there is likely a bug tracking system, whether it is commercial, open source, or
home built, faithfully recording bugs, feature requests, and customer-reported issues.
In an ideal world, all of this data would be stored in a big data warehouse that is easy to query
and analyze, and is updated in real time to reflect the latest status. Everyone involved in the
project would have access to a dashboard that displays the most relevant information to her job
function. A manager would see the number of features completed or a burn-down chart [9],
outstanding critical bugs, overall health of the project – for example, bugs fixed vs. found over
time. A developer would see the build status, failing tests if there are any, test coverage, assigned
269

bugs, issues found through static analysis. A QA engineer would see test results from general or
specialized testing, bugs reported, fixed and verified over time. A production support engineer
would see a check list of reviews and further testing the project has to complete before
launching. A director or VP of engineering would have access to a set of key metrics across
different projects – displayed on a single screen – that helps her make decisions on whether to
add or subtract resources, launch a product, or if necessary, cancel a project.
In reality, however, the tools used around the development lifecycle are likely to be a
hodgepodge of systems. They tend to store their data differently – in a database, as flat files, or
in a proprietary system like Bigtable [10]. More often than not, these systems are designed and
built as operational systems, making it easy to put the data in, but not necessarily easy to get the
data out. Take a bug tracking system for example. Assuming data is stored in a relational
database, there is likely a “Bugs” table that stores each bug in a row. If we want to plot the total
number of bugs reported for a project as a time series, a naively written query would scan
through the whole table for each point in time, easily taking many seconds or even minutes to
finish. The user interfaces for these tools may range from command line to web-based – some
may even have a “dashboard” that displays information specific to that tool. Trying to assemble a
holistic picture of a project usually ends up being a tedious, error-prone, and frustrating
experience.
The central idea of project intelligence, then, is to put all the project-related data into a data
warehouse, build an information dashboard on top it, turn the data into information, knowledge,
and plans that drive project-related actions.
Implementation Details
It would be a major undertaking to analyze every source of project-related data and try to unify
them into a central data warehouse. Our approach has been more pragmatic. We concentrated our
initial effort on the bug tracking system and a few other testing-related systems. Because these
other systems have relatively straightforward relational database back ends and simpler
requirements, we decided to access the data directly. For the bug tracking system, we built a data
mart to host the bug information in a dimensional model (see Figure 1).
A few notable things about the schema:
• The Bug Fact table is at the center of the schema. The primary key, Bug Id, is reused
from the operational system. Some of the dimensions are more stable – component,
priority, type – and thus are used as keys for creating summary tables, while other
dimensions are of a more transient nature, reflecting the current state of the bug.
• Each row in the date dimension table represents a calendar day, with additional attributes
to indicate the actual date, textual description, day of week, month, year, quarter, etc.
This makes it easy to create user-friendly report labels.
• The component dimension is a little bit tricky. Each bug can be filed against any
component in a variable-depth component tree. Instead of using a recursive pointer, we
insert a bridge table between the component dimension and the fact table. The bridge
270

table contains one row for each pathway from a component to each subcomponent
beneath it, as well as a row for the zero-length pathway from a component to itself.
• The rest of the dimension tables are relatively straightforward, almost direct translations
from their operational counterparts.
Figure 1 Bug fact and related dimension tables.
In addition to the base bug fact table, we also built additional summary tables to help speed up
the most frequently used reports. These include:
• A weekly bug snapshot table, which records the number of bugs created, resolved, and
verified each week, for each combination of component, priority, and type;
• A weekly bug cumulative snapshot table, which records the total number of bugs created,
resolved, and verified to date, for each combination of component, priority, and type;
• A weekly open bug snapshot table, which records the number of open bugs for each
component, priority, and type combination. We also record the number of days these
bugs have been open so that a report can be built to show the average age of open bugs.
These tables are created by a set of ETL (Extract, Transform, Load) [11] scripts written in
Python [12]. To ensure consistency, every night a script recreates the data mart from scratch
from the operational database; then throughout the day another script polls the operational
database and updates the bug fact table incrementally, and reconciles the weekly summary
tables.
For the project dashboard, we started with a simple web-based system that allows a user to
generate different reports and put them on the dashboard. Because we want the dashboard to be
customizable, tailored to users with various roles in the project, the user interaction became very
complex and unintuitive. We rewrote the front end using Google Web Toolkit (GWT) [13] to
make the user interface more responsive and dynamic (see Figure 2).
271
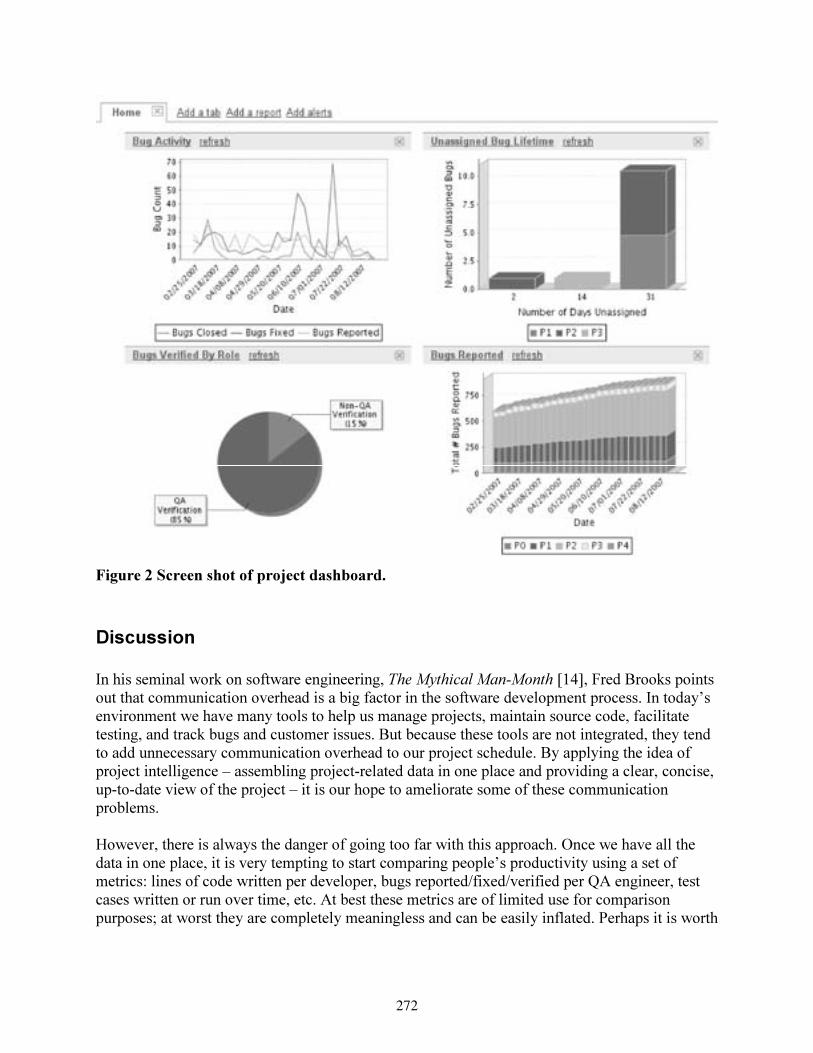
Figure 2 Screen shot of project dashboard.
Discussion
In his seminal work on software engineering, The Mythical Man-Month [14], Fred Brooks points
out that communication overhead is a big factor in the software development process. In today’s
environment we have many tools to help us manage projects, maintain source code, facilitate
testing, and track bugs and customer issues. But because these tools are not integrated, they tend
to add unnecessary communication overhead to our project schedule. By applying the idea of
project intelligence – assembling project-related data in one place and providing a clear, concise,
up-to-date view of the project – it is our hope to ameliorate some of these communication
problems.
However, there is always the danger of going too far with this approach. Once we have all the
data in one place, it is very tempting to start comparing people’s productivity using a set of
metrics: lines of code written per developer, bugs reported/fixed/verified per QA engineer, test
cases written or run over time, etc. At best these metrics are of limited use for comparison
purposes; at worst they are completely meaningless and can be easily inflated. Perhaps it is worth
272

remembering a line from the Agile Manifesto [15]: “Individuals and interactions over processes
and tools.” Great software is not written by “Plug Compatible Programming Units” [16].
On a more tactical level, one of the biggest challenges we faced was to find a consistent
definition of the project across different tools. The source code repository may consider a project
as a directory in the source tree, while the bug tracking system may have its own components,
and a test case management system its own “projects” – all with different granularity and
hierarchy. To have a unified project directory would be very helpful in correlating different
pieces of data, but since it involves many systems, it is a difficult task. As of this writing we still
rely on manual mapping to correlate data from different systems.
Once we have the system built, getting people to use it is the next challenge. Every project uses a
different set of metrics, differently. Satisfying all the requirements is a delicate act of balancing
customizability and commonality. Our hope is to use the system as a tool for cross-pollination of
best practices, eventually coming up with a set of most useful metrics for each stereotypical
project.
Conclusion
Working in today’s large, global software development shops can be overwhelming. By applying
the ideas presented in this paper, we can build a better environment for everyone involved. As
with business intelligence, the idea of project intelligence is not just tools and technologies, it is
also the processes and people that lead to our ultimate goal: better software faster.
Acknowledgements
I wish to thank Erik Beans, David Bronner, Lana Bryan, Ming Chao, Meghna Gummuluru, Sara
Haider, Anju Jain, Daniel Khuong, Yogita Potluri, David Rasti, and Christine Reilly for their
hard work on this project.
References
1. Google Offices: http://www.google.com/intl/en/corporate/address.html
2. The engineer’s life at Google:
http://www.google.com/support/jobs/bin/static.py?page=about.html
3. D. Loshin, Business Intelligence: The Savvy Manager's Guide, Morgan Kaufmann, 2003.
4. W. H. Inmon, Building the Data Warehouse, Wiley, 2005.
5. E. F. Codd, "Further Normalization of the Data Base Relational Model." (Presented at
Courant Computer Science Symposia Series 6, "Data Base Systems," New York City, May
24th-25th, 1971.) IBM Research Report RJ909 (August 31st, 1971). Republished in Randall
J. Rustin (ed.), Data Base Systems: Courant Computer Science Symposia Series 6. Prentice-
Hall, 1972.
273

6. R. Kimball, M. Ross, The Data Warehouse Toolkit: The Complete Guide to Dimensional
Modeling, Wiley, 2002.
7. S. Few, Information Dashboard Design: The Effective Visual Communication of Data,
O'Reilly Media, 2006.
8. M. Cohn, User Stories Applied: For Agile Software Development, Addison-Wesley
Professional, 2004.
9. K. Schwaber, Agile Project Management with Scrum, Microsoft Press, 2004.
10. F. Chang, J. Dean, S. Ghemawat, W. C. Hsieh, D. A. Wallach, M. Burrows, T. Chandra, A.
Fikes, and R. E. Gruber, Bigtable: A Distributed Storage System for Structured Data, OSDI
’06: 7th USENIX Symposium on Operating Systems Design and Implementation.
11. R. Kimball, J. Caserta, The Data Warehouse ETL Toolkit, Wiley, 2004.
12. Python Programming Language, online at http://www.python.org/.
13. Google Web Toolkit, online at http://code.google.com/webtoolkit/.
14. F. P. Brooks, The Mythical Man-Month: Essays on Software Engineering, 20th Anniversary
Edition, Addison-Wesley Professional, 1995.
15. Manifesto for Agile Software Development, online at http://agilemanifesto.org/.
16. M. Fowler, The New Methodology, online at
http://www.martinfowler.com/articles/newMethodology.html.
274

Maintainability in Testing
Brian Rogers [email protected]
Abstract
Is your organization focused on short term deliverables or sustained success? How resistant are your tests
to breaking changes? If you go on vacation, could someone realistically take your tests, execute them,
and analyze the results? What will become of your tests after you ship? Each of the previous questions
relates to a specific concern about maintainability in testing. While these are all important questions, we
often overlook them in the rush to finish a product release. To properly plan for maintainability, however,
we must address all of these questions and more.
Teams that do not plan for maintainability run the risk of being haunted by their own legacy. In the worst
case, they end up in perpetual reactive mode, constantly fixing problems from the past with little time to
properly design solutions for the future. Once you enter this vicious cycle, it is hard to break free. It is
clear that maintainability needs to be considered right from the start to avoid painful lessons later on.
The principles of maintainability are deceptively simple and are characterized by the following actions:
documenting everything, designing for change, developing solutions rather than workarounds, and
communicating with your peers. Each action can be applied in some way at any scope, from the test
organization as a whole down to an individual test artifact. On the same token, there are various don’ts in
maintainability: don’t file bugs with “come stop by my office” in the repro steps, don’t fall into the trap of
“hack until it works,” and most importantly, don’t wait for a disaster before you consider maintainability.
Although the concepts are simple, the implementation is somewhat difficult. Various factors prevent
teams from actually adopting maintainable processes and developing maintainable tests. A prevailing
perception is that such processes incur prohibitive overhead and expense. The key to dispelling these
beliefs is gathering data that shows how much more expensive it is to maintain the status quo and to
champion the benefits of maintainability.
Author bio
Brian Rogers is a software design engineer in test at Microsoft. He is a strong proponent of engineering
excellence within the test discipline and has designed and developed static analysis tools for detecting
defects in test artifacts. Brian has a degree in Computer Engineering from the University of Washington.
275

Introduction
Tech Corp Systems: A Cautionary Tale
“I need you to finish the new feature tests by the end of the day, Keith.” Deepa, senior test manager at
Tech Corp Systems, was growing concerned about the impending release deadline. “This product is
going out to customers all over the world in exactly one month, and if we don’t have our initial test results
by tomorrow, we risk another slip.”
Keith, himself a six year veteran of Tech Corp, was no stranger to schedule pressure. “Deepa, I
understand that the customers are anxious to get a hold of our latest version and try out the new
functionality. However, during this release cycle, I was really hoping to set aside some time to look at
our overall test plan, address some of the inefficiencies, and make some improvements. Our existing tests
weren’t designed to cover some of these new scenarios, and they seem to grow more brittle with every
change.”
Deepa understood Keith’s desire to streamline their testing processes, but it sounded expensive and she
could not justify the time. “I know where you’re coming from, Keith, but the project manager is
expecting us to sign off this week. We’ve been able to get by with the tests we have for the past few
versions, so it shouldn’t be too much of a problem to fix them up a bit, run a few new cases, and send out
the results. Please just do what you can to finish up. We’ll fix it in the next release.”
“I’ve heard that one before,” Keith thought to himself. Not wishing to start an argument, he finally said,
“Alright, Deepa, I’ll get right on it and meet with you again tomorrow.” Keith went back to his office and
slumped down in his chair. It took a few hours of overtime, but he finished coding the automated tests,
executed them, and got the results Deepa had requested. Unfortunately, with the closeness of the
deadline, Keith could not automate everything he had hoped. He would have to rely on a few manual
passes to cover some of the newer areas of their product.
“This shouldn’t be so bad,” Keith said to himself. “I’ll just spend two more hours walking through the
important scenarios by hand.” After all, his team always did a small amount of manual testing with every
new release. However, Keith was rushed to get results and was simply not able to cover the full set of
configurations that their automation system would have exercised. It was starting to get late and Keith
felt he had done all he could; he was not thrilled with the quality of his work, but the pass rates seemed to
indicate that things were in working order.
The test team ultimately signed off and the product was released right on schedule. Unfortunately, it
suffered from several minor defects and a few major bugs that would have been caught by Keith’s tests (if
only they had been updated for the new release). These bugs prevented adoption by many of their most
loyal customers. An emergency service release was quickly planned and delivered four weeks later.
Although the quality was much improved in the service release, about 10% of their existing customers
chose not to upgrade and made plans to transition away from Tech Corp’s products.
What went wrong?
276

The story of Tech Corp Systems, while fictional, is all too familiar to software testers. “Crunch time” has
come to be an accepted part of shipping software and in the rush to complete deliverables, tradeoffs are
unavoidable. However, some tradeoffs can have negative repercussions in terms of the continuing
success of a product. In the above example, the time saved by delaying test engineering improvements in
order to ship on time actually led to lost revenue due to a low quality release.
Motivations for maintainability
Before moving on to how to address and improve maintainability, I will first discuss the definition of the
term and some risks and rewards relevant to the topic.
What is maintainability?
According to IEEE, maintainability is “the ease with which a software system or component can be
modified to correct faults, improve performance, or other attributes, or adapt to a changed environment.”
[1] A testing process which is maintainable will enjoy sustained success in the face of inevitable changes.
Changes in this sense apply to a variety of aspects of a given project, including staffing changes (e.g.
losing or gaining employees), product code changes (e.g. adding or updating features), and changes in
strategy (e.g. new testing approaches to improve scenario coverage). For this discussion, “success” refers
to the ability of the test organization to provide an accurate measurement of the quality of the software
product within a reasonable timeframe. By contrast, an unsuccessful test organization may still be able to
provide a quality measurement, but it could be inaccurate or slow to obtain due to inefficiencies or
deficiencies in the testing workflow.
What are the risks?
There are two ways to position this question. First, what are the risks involved when no thought is given
to maintainability? In the worst case, we can imagine the consequences are quite severe. A body of tests
which cannot be easily maintained may be unstable and unreliable, resulting in a skewed or
nondeterministic measurement of product quality. Creating new tests or executing existing ones may be
prohibitively expensive resulting in missed coverage or reduced tester efficiency. Releases may be
delayed, or may ship with low quality.
On the other hand, a skeptic may ask, what happens if too much attention is paid to maintainability?
Certainly a form of analysis paralysis can result when evaluating the benefits and drawbacks of a testing
process. Testers may expend too much energy on maintainability for little gain in the long run, for
example, by holding design meetings for the even the smallest changes in a test plan. As with a decidedly
non-maintainable process, excessively maintainable testing may still lead to schedule slips and
inefficiency.
What are the rewards?
If sufficient consideration is given to maintainability, the rewards are numerous. Testers, having been
liberated from inefficient, unmaintainable practices can execute more effectively, take on new challenges,
and generally do their jobs better with higher satisfaction. Higher efficiency means that more meaningful
test work can be assigned and completed within a new product cycle, resulting in better quality
measurements. It must also be stressed that focusing on quality throughout the entire development
277

process will often save time near the end of the project cycle, bypassing many of the usual “time vs.
quality” tradeoffs that occur at that point.
Principles
There are a variety of ways by which maintainability can be assured in testing. Some are tailored to very
specific testing domains while others are more broadly useful. For the purposes of this discussion, I will
focus on four principles which have the best general applicability.
S hare knowledge with peers
E ngineer solutions rather than workarounds
E xpect and plan for change
D ocument critical information
The “SEED” principles should not be taken as the sole methodology for maintainability in testing.
However, following these principles can result in improving the maintainability of nearly any testing
process.
Share knowledge with peers
The work of every large software project is invariably divided among teams. While the word “team”
implies cooperation towards a common goal, too often teams become “collections of individuals” who
have little knowledge of the world outside their individual responsibilities.
Sharing knowledge is absolutely essential to a maintainable testing process. Imagine if a new employee
is added to the team; how long will it take the tester to become effective if the rest of the team is too busy
to lend a hand? Perhaps more importantly, imagine if an invaluable team member goes on vacation. If
peers have become accustomed to working mostly within their own test areas, they will have difficulty
effectively backing each other up in the case of an absence. If this practice is allowed to continue, a
serious long term maintenance problem will result (not to mention the short term crisis that would emerge
in this situation). Turnover in software projects is inevitable. It is thus advantageous to spread valuable
knowledge as much as possible across multiple people.
Why do teams have trouble with sharing knowledge? Asking ten testers this question will probably result
in ten different answers. Here are some common reasons, as told by Tech Corp Systems employees:
• Deepa, senior test manager: “While I do encourage experienced testers to mentor the newer
employees, I don’t have time to check up with everyone to enforce this. Besides, if someone was
having trouble grasping a concept or solving a problem, they would certainly ask for help.”
• Keith, senior test engineer: “Being one of the more senior members of the team, I get the majority
of the complex and time-consuming testing tasks. I barely have time to finish my own work, let
alone share some of my experiences with others. Even if I did, I’m not sure how easy it would be
to explain to the rest of the team; I’ve been told my explanations tend to go right over people’s
heads.”
278

• Ying, junior test engineer: “I really try hard to solve problems on my own whenever possible.
When I do ask for help, I get the feeling that I’m taking time away from someone else’s
deliverables. And anyway, who wants to be known as the ‘newbie’ that can’t figure anything
out?”
Deepa has the right idea by encouraging the team mindset and believes that most people would break
down and ask the question eventually, but Ying has expressed apprehension, not wanting to be labeled
incompetent. Keith sounds too concerned by his lack of time and communication skills to be much help.
One solution to address all these problems is to set aside time at the weekly team meeting for Q&A
sessions and presentations. (If your team does not have weekly meetings, now is the time to start.)
Encourage each tester to bring a difficult question to the meeting and see if the team can brainstorm an
answer; it is important that all testers participate so that no one is singled out. Testers could also choose
from topics of interest to the team to research and present the information. Giving a presentation is a
great way for team members to improve communication skills and also promote growth of knowledge and
skills. Roe presents similar ideas [2].
Engineer solutions rather than workarounds
A workaround, by definition, is a method or series of steps to avoid a known problem or error. Anyone
who has spent even three months on a test team is familiar with such workarounds. Perhaps it was only
meant to be temporary until a better solution came along, or maybe the problem was not well understood
but “restarting the machine seemed to fix it.” Keith from Tech Corp explains one of his experiences:
“In older versions of one of Tech Corp’s products, there was an obscure bug that prevented a few
of our automated test scenarios from working reliably. The bug would often (but not always)
vanish if the test scenario was simply rerun, thus allowing the subsequent tests to execute and
provide useful information. Being good at scripting, I was able to code up a very quick
temporary solution that would restart a test if it failed. The script wasn’t pretty, and admittedly
did not work 100% of the time, but it helped unblock our progress for that release cycle. As news
about ‘Keith’s Hack’ spread across the team, more and more testers began relying on it. Years
later, this so-called ‘temporary hack’ persists in many of our automated tests, even some that
were never affected by the bug at all. Not only that, I still get e-mail from people requesting
support for this script.”
Realistically, test teams will need to work around bugs, broken features, and other problems from time to
time. However, there is delicate balancing act between applying “works for now” and “works forever”
philosophies. Before employing a workaround, ask yourself three questions:
1. Is the problem I am trying to work around safe to ignore?
2. How long am I willing to live with the workaround?
3. Is there a better solution?
The first question is vitally important, especially if the issue to work around is in the product being tested.
Testers must never become blind to the types of issues that they were hired to find and report. A defect is
a defect and should be diagnosed, reported, and analyzed promptly. Chances are an annoying bug that a
279

tester encounters will be just as annoying to a potential customer. However, no software is 100% defect-
free and sometimes tradeoffs must be made.
If the problem has no fix forthcoming, or alternatively, exists outside of the product (e.g. a test lab setup
issue), then a workaround may be appropriate. Great care must be taken, however, to prevent temporary
workarounds from becoming permanent. If progress must be made right away, apply the workaround but
explicitly add an item to the test schedule to fix the underlying issue.
Better yet, if there is a true solution to the problem, determine if it is feasible to work on that instead of
the workaround. Do a cost benefit analysis; you may be surprised to find out that two people expending
the four days of effort to fix a problem for good is better than a single person’s 40 minute hack that
partially fixes the problem and still requires 10 minutes of manual intervention from each tester on a 50
person team. (For example, 4 days per tester x 8 hours per day x 2 testers = 64 hours; compare this to 40
minutes + 10 minutes per tester per test pass x 50 testers x 10 test passes = 84 hours. The “expensive”
solution actually saves 20 hours over the workaround. Even better, the solution has no recurring cost, and
thus remains the same whether there are 50 or even 100 tests passes.)
Expect and plan for change
Software is constantly evolving. Customers demand new features, requirements change, and assumptions
are challenged. Maintainable test processes make as few assumptions as possible about pieces that are
likely to change. Ying from Tech Corp shares an experience where changed assumptions resulted in
constant rework:
“I was assigned a set of stress tests that required a large SQL database of customer records. In
normal scenarios, our product API would be used to populate this database, but it was a fairly
slow and involved process to go through the application layer. Although I was relatively new to
the team, I was good with databases and was able to develop a small bit of automation to directly
insert records into the database. I was pleased with the solution, as it was about 50% faster than
the API our product provided. The tests worked great for about a month, but almost overnight
everything began failing. After spending several hours looking at test logs and debug traces, I
determined that the database schema had changed. I spent several more hours installing the
product, using the APIs to insert a few records to determine the new data format, updating my
code, testing my changes, and putting them in production. Things worked again for a while, but
inevitably the data format changed again. By the fourth change, I had learned my lesson and
reverted to using the product APIs to populate the database.”
Ying’s clever solution involved a dangerous assumption which led to real maintainability problems.
Despite the fact that the solution seemed technically sound, it required knowledge of internal
implementation details – which cannot be relied on in any circumstances.
Of course, assumptions and dependencies are unavoidable. The point is to minimize unnecessary
dependencies and limit assumptions to the bare minimum required to do efficient, effective testing. Keep
in mind that the design and architecture of a test is often just as important as that of the product being
tested. Senior developers have learned techniques to write serviceable and extensible product code,
including designing a comprehensible object model, using encapsulation and separation of concerns to
280

reduce duplication, and avoiding “clever” programming tricks in favor of clear, easy to understand
algorithms. Senior testers could do well to apply these same principles to their test code.
For more guiding principles around maintainable automated test design, see Kaner’s treatment of the
topic. [3]
Document critical information
It seems obvious, but is quite rare in practice. Few testers list writing documentation among their favorite
pastimes. However, it is essential that all information critical to the operation of a test organization is
documented or discoverable in some way. What is critical may vary from team to team, but the following
list should provide a good starting point:
• Manual tests: a complete script (ordered sequence of steps) such that a person who knows little
about the product can execute the test and determine success or failure.
• Automated tests: a brief description of the general scenario being tested, the assumptions, and the
expected results.
• Test infrastructure: step by step documentation explaining how to set up the product for a test
pass, a description and overview of any test automation systems in use.
• Best practices: team standards around designing tests, the proper way to fill out bug reports, and
any other “institutional knowledge” that must be passed along to new hires.
In general, all items of major importance to the team at large should be well-documented so that vacations
or unplanned absences of the area experts do not interfere with the deliverables of the organization.
A good overview of test documentation can be found in Kaner’s and Bach’s Black Box Software Testing
series. [4]
Practices
Putting into practice the principles of maintainability is not as easy as flipping a switch. The culture and
politics of a team play a large role in how maintainability can be improved within a test organization. The
following suggestions should be of use to any test team willing to consider making a change for the
better.
Start small
It is unrealistic to expect a test team that has zero documentation and ten years worth of legacy to produce
detailed specifications for every existing test artifact. Start with a small achievable goal and see where
this takes you. For example, it might be better to start with the goal of producing documentation for all
shared infrastructure currently in use; as time permits, the scope can be expanded to high priority test
cases, and so on. Continued success on the road to maintainability ensures that such tasks remain staples
of the everyday testing process; an unrealistic approach will ultimately lead to failure and quickly
extinguish the team’s desire for improvement.
Consider a quality milestone
281

Some improvements require a concerted effort that cannot be achieved in a week or even a month. If
maintainability is a prime concern, it is worth considering a full milestone to research and deploy long-
awaited solutions to these problems. A quality milestone should not be entered into lightly; it must be
well-planned and justifiable to all stakeholders (particularly the project managers).
Focus on the pain
A testing process that already works “well enough” may not need a complete overhaul. Instead, look at
the biggest pain points and focus on addressing them.
Cost it out
Finally, and most importantly, always determine the cost of proposed maintainability improvements and
contrast this with the price of doing nothing. Be willing to prove your assertions that maintenance costs
are becoming unmanageable with real data. If you successfully plead your case, management will have
no choice but to agree.
Conclusion
The stories from Tech Corp Systems illustrate some of the universal challenges and pitfalls faced by test
organizations related to maintainability. How can we do better? In this paper, we have discussed four
helpful principles, summarized by the acronym “SEED,” which can motivate more maintainable
practices:
• Share knowledge with your peers; critical information should never start and end within a single
individual.
• Engineer solutions, rather than workarounds; hacks rarely save time and effort in the long term.
• Expect and plan for change; software evolves constantly, and tests must follow suit.
• Document critical information; use this documentation to ramp up new hires and stop relying on
“oral history.”
As Tech Corp Systems has learned, saving time by failing to address maintainability concerns can be a
recipe for disaster. Don’t wait for a catastrophe; find ways to improve maintainability within your test
team today.
References
1. Institute of Electrical and Electronics Engineers. IEEE Standard Computer Dictionary: A
Compilation of IEEE Standard Computer Glossaries. New York, NY: 1990.
2. Roe, Mike. “The Imagination Factor in Testing,” PNSQC 2006 Proceedings (2006), pp.167-173.
3. Kaner, Cem. Improving the Maintainability of Automated Test Suites (1997),
<http://www.kaner.com/lawst1.htm>.
4. Kaner, Cem and James Bach. “Requirements Analysis for Test Documentation,” Black Box
Software Testing (2005),
<http://www.testingeducation.com/k04/documents/BBSTtestDocs2005.pdf>.
282

Tick-the-Code Inspection: Empirical Evidence (on Effectiveness)
Miska Hiltunen Qualiteers, Bochum, Germany
Miska Hiltunen teaches Tick-the-Code to software developers. After developing the method and the training course for it, he founded Qualiteers (www.qualiteers.com). Mr.Hiltunen is on a mission to raise the average software quality in the industry. He has been in the software industry since 1993, mostly working with embedded software. Be-fore starting his freelance career, he worked for eight years in R&D at Nokia. He gradu-ated from Tampere University of Technology in Finland with a Master of Science in Computer Science in 1996. Mr. Hiltunen lives and works with his wife in Bochum, Ger-many.
Abstract
This paper demonstrates that as software developers we introduce a lot of inadvertent complexity into the software we produce. It presents a method for removing inadvertent complexity and shows how any software developer can easily learn to identify it in source code.
The paper starts with a hypothetical scenario of software development showing how bugs can come into being essentially from nothing. The paper also claims that the cur-rent ways of producing software leave much to be desired. The main argument is that there is a lot of inadvertent complexity in the software produced by the industry and that it is possible and feasible to get rid of.
The paper presents four experiments and their results as evidence. All experiments use the Tick-the-Code method to check source code on paper. The experiments show that both the developers and the source code they produce can be significantly improved. The results indicate that, almost regardless of the target source code, the developers can easily find and suggest numerous improvements. It becomes clear from the results that it is feasible to use Tick-the-Code often and on a regular basis. In one of the ex-periments, the software engineers created almost 140 improvement suggestions in just an hour (of effort). Even in the least effective experiment, the participants created on average one suggestion per minute (70/h).
The last part of the paper demonstrates the effects of ticking code often and on a regu-lar basis. For a software organization, nothing makes more sense than to improve the coding phase and make sure it is up to par. Once inadvertent complexity is kept in check on a regular basis, other concerns, like requirements analysis, can be more read-ily taken into consideration. As long as the organization has to waste time on reworking requirements and careless coding, maturity of operation is unachievable.
283

1. The Claim: Complexity Hole Causes BugsThe software industry still shows signs of immaturity. Errors are part of usual practice, project failures are common and budget overspends seem to be more the rule than the exception. The industry is still young compared to almost any other branch of engineer-ing. Tools and methods are changing rapidly, programming languages keep developing and ever more people are involved in software projects. The industry is in constant tur-moil.
1.1. A Development EpisodeLet s dive deep into a developer s working life. John, our example software developer, isabout to create a new class in C++. The requirements tell him what the class needs to do. The architectural design shows how the class fits with the rest of the application. John starts writing a new method. The method starts simply, but soon the code needs tobranch according to a condition. John inserts an if statement with a carefully consid-
ered block of code for the normal case of operation. In his haste to finish the class in thesame day, John forgets to consider the case when the conditional expression isn t true. Granted, it is unusual and won t happen very often.
if(FLAG1 & 0x02 || !ABNORMAL_OP){
header(param, 0, 16);cnt++;
}
One of the class member variables is an array of integers for which John reserves space with a plain number
int array[24];
In the vaguely named method ProcessStuff(), John needs among other things to go
through the whole array. This he accomplishes with a loop structure, like so
for(int i=0; i <= 23; i++)
In order to send the whole array to another application, the method Message() pack-
ages it along with some header data in a dynamically reserved array
Msg *m = new Msg(28);
As it doesn t even cross John s mind that the code could run out of memory for such a small message he doesn t check for the return value from the statement.
By the end of the day, John has tested his class and is happy with the way it seems to satisfy all functional requirements. In two weeks time, he will change his mind. The sys-tem tests show several anomalies in situations John would consider exotic or even im-possible in practice. The tests need to pass though and John has no alternative but to
284

try and modify his class. This proves harder than expected and even seemingly simple changes seem to break the code in unexpected ways. For instance, John needs to sendmore integers over to the other application, so he changes the for loop to look like
for(int i=0; i <= 42; i++)
That change breaks his class in two places. It takes several rounds of unit testing for John to find all the places related to the size of the array in the class. The hard-coded
message packaging routine Message() stays hidden for a long time causing mysteri-
ous problems in the interoperability of the two applications. The code works erratically,sometimes crashing at strange times and other times working completely smoothly.
This development example shows how seemingly innocent design decisions lead to complex and strange behavior. John s slightly hurried decisions are often mistakes and oversights, which cause real failures in the application. The failures affect the test team, frustrate John, anger his manager and in the worst case, cause the customer to lose faith in the development capability of the company employing John. There is a lot of seemingly innocent complexity in source code produced today all over the world. Takingit out is possible and even feasible, but because of a general lack of skill, ignorance of root causes of failures and a defeatist attitude towards faults, not much is being achieved. Constant lack of time in projects is probably the biggest obstacle for more maintainable and understandable code.
Although complexity in software is difficult to quantify exactly, we can divide it into two categories for clarification:
a) essential complexity (application area difficulties, modeling problems, functional is-sues)
b) inadvertent complexity (generic programming concerns, carelessness)
This paper deals with b) inadvertent complexity.
The current working practices in the software industry leave a gaping hole for inadver-tent complexity to creep into the source code. In large enough doses, it adversely af-fects all activities in software projects, not just coding. Inadvertent complexity is rampantin source code today, yet currently there are no incentives or effective methods in use toget rid of it. Inadvertent complexity is holding the software industry back. Inadvertent complexity is an unnecessary evil, it does not have to be this way.
285

2. The Evidence: Complexity NOWNext four real-life experiments. A few terms related to the Tick-the-Code method used in the experiments need to be explained. A tick in code marks a violation of a rule. Atick doesn t necessarily mean a bug, in most cases it denotes an environment where bugs are more difficult to identify. Some ticks precede bugs. The best way to think aboutticks is to see some of them (perhaps every third) as realistic improvement suggestions.A rule is a black-and-white statement. Code either follows a rule or it doesn t. “Do not divide by zero” is a rule. Each rule has a name, which in this paper is written in capital letters (RULENAME). Ticking refers to a checker going through source code marking rule violations one rule at a time. In other words, ticking produces ticks. An author is the person responsible for maintaining the source code, not necessarily the originator.A checker ticks the source code. A checker needs to be familiar with the programminglanguage (although not necessarily with the source code.) For more information, see Chapter 3. or [2].
2.1. Experiment: Free Ticking for an HourIn this experiment, the participants were taught Tick-the-Code as a theoretical exercise.They were then given an hour to tick their source code using any of the predefinedrules. The participants had been instructed to bring approximately one thousand physi-cal lines of code with them. Table 1. summarizes the results.
Participants Total time Total lines (physical)
Total ticks Average rate of finding
85 81h45min 93393 5900 72 ticks/h
Table 1. Experiment: Free Ticking for an Hour. With proper guidance, it takes on average less than a minute for a software developer to generate a tick (= source code improvement suggestion). The experi-
ment took a little more than a week to conduct between Feb 6 and Feb 15, 2006.
2.2. Experiment: Before and AfterAlmost eighty software developers from six software companies took part in Experi-ment: Before and After. The participants were first asked to “perform a code review” on their own code. They were given 15 minutes to complete the task and no further ex-planation as to what “performing a code review” means. After fifteen minutes, the num-ber of markings they made was collected. The severity of the markings was not judged. The collected results were extrapolated to a full hour. The participants were then taught a new method of checking called Tick-the-Code. This took about two hours. They were given an hour to tick the same code as before. The number of ticks was collected.
The graph in Figure 1. shows the before and after performances of the 78 partici-pants. In the graph they are ranked in ascending order by their before results. In many cases, the number of findings for individual checkers were dramatically higher with Tick-the-Code than before. It indicates a clear skill gap. Most developers have had no idea what to look for in a code review, or have been overlooking smaller items whilst
286

searching for those they believe to be more critical. Given better guidelines and stricter rules, they can find places to improve easily and quickly.
Tick-the-Code helps developers cover larger amounts of source code in a relatively short period of time. Table 2. summarizes the overall results of the ticking part of the ex-periment. In less than 80 person-hours, the novice checkers managed to tick over 80000 physical lines of code creating over 8200 ticks. Even if only 10% of the ticks werevalid improvement suggestions, the developers had still generated over 800 ways of making their code better. This proves that developers can feasibly improve their code from its current state.
Participants Total time Total lines (physical)
Total ticks Average rate of finding
78 78h 80218 8230 106 ticks/h
Table 2. Experiment: Before and After. The results of almost eighty software developers ticking real, production-level source code for an hour. Covering over 80000 lines of code systematically and target-oriented is possible and feasible with negligible time. The tick yield, i.e. the number of source code im-
provement suggestions is massive, considering that most source code had already gone through the ex-isting quality control processes. The experiment was conducted between May 31 and Oct 23, 2006.
Before (Extrapolated to 1h) After (Ticks found in 1h)
0
100
200
300
400
Checkers
Figure 1. The number of findings before (the monotonically increasing line) and after (the spikes) learning Tick-the-Code. To be more descriptive, the checkers on the X-axis are
sorted in ascending order of their extrapolated before results. In most cases the extrapo-lated result is much lower than the one Tick-the-Code yields. Each pair of values ( before
and after ) on the X-axis shows the performance of an individual checker.
287

2.3. Experiment: Five-minute Ticking, or Surely You Can t Tick Any Faster?In this experiment there were 144 software developers from different organizations. Once again, all participants had about one thousand lines of production-level code. Thistime the participants were given much clearer instruction on the ticking method than in the previous two experiments. Each time a rule was presented, the participants had ex-actly five minutes (!) to search for its violations. Then the number of ticks was recorded. Sometimes the participants didn t get through all of their code, sometimes they man-aged to have spare time before the bell rang.
The participants checked eight, nine or ten rules in a training session. With the five-minute limit that meant that everybody spent effectively 40-50 minutes ticking. On aver-age, each and every participant found 103 ticks in under an hour! In Table 3, you see that the average (extrapolated) rate of finding ticks is approximately 136 ticks/h.
Averaging all collected ticks over the effective time used for checking (108h, over all participants) gives us some interesting insights. In this calculation we treat the work-force as a mass of work, nothing more. The ticks the participants found have been givento this mass of work and the average has been calculated. See Table 4. for the results. The table shows that spending an hour on proactive quality could result in 46 sugges-tions of improving modularity by refactoring blocks of code inside bigger routines into their own subroutines (CALL). Alternatively, a software developer could suggest 53 un-necessary comments to be removed from clouding the code (DRY). We can also see that in one hour, given enough source code, anybody could find over five hundred hard-coded numbers, character constants and strings (MAGIC). Some of them are missing information linking them to their origin and relating them to other values in the code. That missing information is certain at least to slow down maintenance but it is also true that some of the plain numbers will just plain cause bugs.
Partici-pants
Total time Total lines(physical)
Total ticks Average rate offinding
144 4d 12h 35min > 100 000 14906 136 ticks/h
Table 3. Experiment: Five-minute Ticking. The training courses took place between 26-Oct-06 and 12-Jun-07. Unfortunately the experimenter sometimes forgot to collect the numbers of lines from the partici-
pants, but everybody was always instructed to bring about one thousand lines of code.
Isn t it illuminating to see that any software developer could complain about 92 bad vari-able, function and method names and he d just need an hour to point them out precisely(NAME)? It would take longer to come up with better names but not prohibitively so. How much does an error cost? How much effort does it take to test, write an error re-port, find a responsible person, debug, fix, retest and whatever else is part of repairing an error? One hour, ten hours, a hundred hours, a thousand hours? How many im-provement suggestions could be found and taken into consideration before the chaotic code results in errors? Table 4. is saying: “Many”. That is the choice for each software developer to make. There is the option of continuing to fix errors hoping for the best and
288

then there is the option of proactively preventing errors using methods like Tick-the-Code to clarify code now.
Rule CALL CHECK-IN DEAD DEEP DEFAULT DRY ELSE
Ticks/h 46 82 45 76 11 53 322
Rule HIDE MAGIC NAME NEVERNULL TAG UNIQUE
Ticks/h 186 516 93 90 18 20
Table 4. The average number of ticks found for each checking hour per rule. Software developers could find this many violations in one hour in the code they produce, if they chose to. 144 developers checked
for 108h to create the data.
2.4. Experiment: Open Source Wide OpenTen source code files from four different Open Source projects were randomly selected to be ticked. The author ticked all of the modules with 24 Tick-the-Code rules. Once again, each file was approximately one thousand physical lines long. Physical lines are all the lines in a source code file. Physical lines are the simplest unit of measurement. Using them avoids all problems of how to interpret empty lines, or lines containing just acomment, or lines with multiple statements. As physical lines, they all count as one line each, respectively. In other words, the line numbering of your favorite editor matches the definition of physical lines exactly.
For some of the files, several versions from different phases of development were se-lected. File address-book-ldap.c (later a.c) is a C-language module and there were four versions of it: the first version from the year 2000, another version several evolutionary steps later from year 2002, and two more dated in 2004 and 2007, respectively. Theformat a.c(04) is used to refer to the third snapshot of file address-book-ldap.c. The filelap_init.c (l.c) only had one version to tick. There are two versions from ipc_mqueue.c (i.c) and OSMetaClass.cpp (O.cpp). The letters A and B are used to denote the older and newer version, respectively. For example, O.cpp(B) refers to the newer version of OSMetaClass.cpp. PeerConnection.java (later P.java) was the only Java file included in the experiment. See Figure 2. for the sizes of the sampled source code files. The filea.c, for example, has grown from a mere 400 lines to 1000 lines over the seven years ofits development.
289

Figure 2. The sizes of the sampled files. Manual is the figure the author counted by hand. LOCphy are physical lines (should be equal to Manual , slight errors are visible), LOCpro program code lines, LOCbl
are blank lines and LOCcom commentary lines. All the LOC counts were generated by CMT++ and CMTjava.
In addition to ticking all the modules with all the rules, Testwell Oy, a company in Finland(www.testwell.fi) helped with some additional measurements. Their tools CMT++ and CMTjava were used to measure C/C++ files and the Java module, respectively. Theticking took almost 29 hours to complete, while the tools took only seconds to complete their tasks. The ticking revealed over 3700 ticks, i.e. possible improvements. The total results are summarized in Table 5.
Checkers Total time Total lines (physical)
Total ticks Average rate of finding
1 28h 52min 8517 3723 129 ticks/h
Table 5. Experiment: Open Source Wide Open. The experiment took a little more than a month to con-duct between 5-May and 11-Jun-07.
One of the best known complexity measurements for source code is the cyclomatic number [1]. It points out “unstructured” code and uses graph theory to compute the cy-clomatic number. CMT++ and CMTjava calculate the cyclomatic number for their input files.
An interesting observation: the correlation between the cyclomatic numbers for the ten files and the normalized total tick count series is as large as 0.7. Although the sample is small, the files were selected in random, so the result isn t just a coincidence. It seems that the ticks and cyclomatic numbers are related and can both be used as indicators forcomplex source code. See Figure 3. for a graphical view of the cyclomatic number and
Manual LOCphy LOCpro LOCbl LOCcom
0
300
600
900
1,200
1,500
a.c(00) a.c(02) a.c(04) a.c(07) l.c i.c(A) i.c(B) P.java O.cpp(A) O.cpp(B)
290

tick counts. Additional experiments are needed to confirm the link. One reasonable method would be to remove the ticks already found by refactoring the modules and thenmeasuring them again. If there is a relationship between the two, both the tick count andthe cyclomatic number should go down.
Figure 3. Normalized tick counts and the cyclomatic numbers. The correlation between the series is large, 0.7. Please, note that the Y-axis values of the two series have different units.
The Tick-the-Code rules are based on certain principles of coding. Breaking the princi-ples for whatever reason will usually cause trouble sooner or later. Examining the rules more carefully, we can divide them into four categories:
1. Extra baggage2. Missing info3. Chaos-inducers4. Risky assumptions
1. Some of the rules point out unnecessary items in a module file. For example, a com-ment that repeats what the code already says is just a waste of disk space. A prime ex-ample is the line
count++; // increment counter
Not only are they a waste of disk space, any extra comment increases chances of out-dated comments. Such comments are distracting, and impair maintenance. One rule points out such redundant comments (DRY). Another rule points out duplicated blocks
Normalized tick count (ticks/1000LOCphy) Cyclomatic number (v(G))
0
130
260
390
520
650
a.c(00) a.c(02) a.c(04) a.c(07) l.c i.c(A) i.c(B) P.java O.cpp(A) O.cpp(B)
291

of code (UNIQUE), which are also usually unnecessary and harmful. A few other rules make up the “Extra baggage” category.
2. A few rules aim at noticing when something is missing from the code. One rule asks for an else branch to be found at each if statement (ELSE). Whenever a literal num-
ber is used in code (hard-coded), another rule is violated (MAGIC). Literal numbers don t reveal where they come from or if they are related to any other numbers in the code. The missing information causes bugs very easily, or at least slows down the main-tenance work unnecessarily. The category “Missing info” consists of similar rules.
3. There are elements in code that add to the confusion. Usually software is complex to begin with, but certain constructs make it even harder to understand. Using the keywordreturn too readily can lead to functions having too many exit points, which can hinder
understanding of the flow of code and impair its testability (RETURN). Blocks of code that could be their own subroutine but are inside a bigger routine instead are unneces-sarily complicating the source code (CALL). Bad names give code a bad name (NAME).This category is called “Chaos-inducers”.
4. Blindly assuming that everything is fine is dangerous in software. Anything could go wrong, especially with pointers. A good programmer defends his code by generously sprinkling checks for NULL pointers in it. Some rules spot possible references through NULL pointers (NEVERNULL), variables used without any checking (CHECK-IN) and freed, but not invalidated pointers (NULL). These rules reveal locations where a more defensive approach is possible. The category is called “Risky assumptions”. Table 6. shows the categories and their rules.
Extra baggage Missing info Chaos-inducers Risky assumptions
DEAD DEFAULT CALL CHECK-IN
DRY ELSE NAME NEVERNULL
INTENT MAGIC RETURN NULL
ONE PTHESES SIMPLE CONST 1ST
UNIQUE TAG FAR ZERO
ACCESS DEEP PLOCAL
HIDE FOCUS ARRAY
VERIFY
Table 6. The four categories of rules. Twenty-four of the rules form the active rule-set in Tick-the-Code.
The normalized tick counts for all categories are shown in Figure 4. Apart from the filei.c, all files leave out valuable information, which needs to be dug up or guessed in
292

maintenance. Every tenth line of file a.c contains some confusing constructs. On the other hand, there doesn t seem to be too much extra baggage in any of the example files. This is hardly surprising considering the tendency in human nature to be too lazy rather than overly explicit or verbose. All four categories correlate strongly with the cy-clomatic number. The correlation for “Extra baggage” is 0.67, for “Missing info” as high as 0.96, for “Chaos-inducers” 0.73 and for “Risky assumptions” 0.68.
Figure 4. The normalized tick counts for the rule categories. Files a.c and l.c will be most likely to sufferproblems in their maintenance because of missing information. On average, more than every third line (350/1000) in l.c is missing some information. In this group, the file i.c seems much better to maintain.
2.5. Conclusions Drawn from the ExperimentsA. Software developers could perform much better code reviews than they currently do.B. Currently produced source code leaves a lot to be desired in terms of understandabil-ity and maintainability.C. Tick count measures (at least some aspects of) software complexity, just like cyclo-matic number does.D. Software developers could prevent many errors if they chose to do so.E. The effort to do so would be negligible.F. Systematic ticking of the code leads to code that is easier to maintain. G. Easier-to-maintain source code benefits all stake-holders in the software industry.
Extra baggage Missing info Chaos-inducers Risky assumptions
0
70
140
210
280
350
a.c(00) a.c(02) a.c(04) a.c(07) l.c i.c(A) i.c(B) P.java O.cpp(A) O.cpp(B)
293

3. A Solution: Tick-the-Code[2] describes the details of Tick-the-Code. Suffice to say that it is a rule-based ap-proach for reviewing code on paper. Checkers mark each and every rule violation on theprinted paper and deliver the ticks to the author of the code. The author considers each and every tick, but maintains the right to silently ignore any one of them. Whenever possible the author replaces the ticked code with a simpler, more maintainable version. Sometimes the change is simple, sometimes it is more than a trivial refactoring.
The rules are extremely clear and explicit. They designate an axis and show which end of the axis is the absolute evil. For example, there is a rule called ELSE, which says that“each if must have an else”. On the one end of the axis there is an if with an else
branch and on the other extreme there is the if without an else branch. The rule says
that the former case is right and that the latter is absolutely wrong. The reasoning be-hind the rule is that if the code could possibly be missing something important (the codefor the exceptional case in the else branch), it could lead to problems. And vice versa,
an if with a carefully considered else branch is less likely to be problematic. Missing
information, or in this case missing code, is a hole in the logic of the code.
Every ticked if provides the author with a chance to double-check his thinking and fix itbefore a functional bug occurs. The same principle applies to all the rules, most of which are not quite as simple to find as rule ELSE. Each rule is based on a solid pro-gramming principle and divides a dimension into two extremes, one right, one wrong. Making the world black-and-white is an excellent way to provide clarity, even though it only catches certain errors. The good thing is that it normally catches all of them. Some-times the else branch contains the wrong kind of code, sometimes it is the if. Com-
bined with a sensible author, this kind of merciless ticking starts to make sense in prac-tice.
The search is very often the most time consuming part of an error hunt. Not the fixing,nor the testing, nor the verification of the fix, but the search. In Tick-the-Code the search has been tweaked to be as fast as possible. Even though it is manual, it is fast incomparison to most other methods. It might seem that Tick-the-Code is aimed at mak-ing the source code better. That is the truth, but not the whole truth. The main purpose is to make the checkers better. In other words, in ticking the checkers get to see a lot of source code, some of it written by themselves, most of it written by somebody else, and they look at code from a different stance than during the source code construction phase. Exposure to others source code gives them examples of how problems can be solved and have been solved.
With the help of the rules and principles the checkers learn to prevent failures. By see-ing the code their colleagues are writing they also learn at least what the colleagues areworking on. Ticking code helps spread information about the developers and their tasks among the checkers (i.e. developers). It helps make the current product better and at the same time teaches the checkers new ideas and thus helps make future products better.
294
4. The Effect: Complexity in the Future - a Thought
ExperimentRegular use of Tick-the-Code makes the produced source code clearer and easier to maintain. Clearer source code contains less careless programming errors. There are still errors, though. Even a perfect implementation phase cannot produce perfect sourcecode if the requirements are poor. The developers will notice that meeting bad require-ments doesn t make the customer happy. They can apply the lessons learned from the rule-driven and systematic ticking of code. Their analysis can help in gathering require-ments. They notice missing requirements, vaguely described requirements and several unnecessary, or minor requirements or redundant ones. Some of the requirements just add to the overall confusion. The developers can considerably improve the quality of therequirements when they add the missing ones, reformulate the fuzzy ones, uncover the hidden assumptions and remove the unnecessary or dangerous ones and separate the minor ones from the important ones. When both the implementation and requirement gathering phases are under control, reworking becomes almost unnecessary. Require-ments meet customer expectations and implementation fulfills the requirements.
Similarly, as the organization saves time with less rework, they can turn their attention toother problematic areas. With problems in the coding process, the organization isn table to build a real software culture. Their whole development process is immature; there are design and architecture problems, and both error handling and testing have been overloaded. This all can change now systematically. With the basics under control,a software development culture can emerge and higher-level concerns like usability cancome to the fore.
The most natural place to start making a software organization more mature is coding. As the experiments show, many software organizations try to build on the quicksand of unnecessarily complex code.
5. References[1] T. J. McCabe, “A Complexity Measure,” IEEE Transactions on Software Engi-
neering, Vol. SE-2, No.4, December 1976
[2] M. Hiltunen, “Tick-the-Code Inspection: Theory and Practice,” Software Quality Professional, Vol. 9, Issue 3, June 2007
295

6. Appendix
A1. Rules
The table provides a list of all the rules mentioned in this paper. For various reasons, exactly 24 rules form the active rule set of Tick-the-Code.
Name Rule
DEAD Avoid unreachable code.
DRY A comment must not repeat code.
INTENT A comment must either describe the intent of the code or summarize it.
ONE Each line shall contain at most one statement.
UNIQUE Code fragments must be unique.
Table A1. Extra baggage rules.
Name Rule
DEFAULT A switch must always have a default clause.
ELSE An if always has an else .
MAGIC Do not hardcode values.
PTHESES Parenthesize amply.
TAG Forbidden: marker comments.
ACCESS Variables must have access routines.
HIDE Direct access to global and member variables is forbidden.
Table A2. Missing info rules.
296

Name Rule
CALL Call subroutines where feasible.
NAME Bad names make code bad.
RETURN Each routine shall contain exactly one return .
SIMPLE Code must be simple.
FAR Keep related actions together.
DEEP Avoid deep nesting.
FOCUS A routine shall do one and only one thing.
Table A3. Chaos-inducers.
Name Rule
CHECK-IN Each routine shall check its input data.
NEVERNULL Never access a NULL pointer or reference.
NULL Set freed or invalid pointers to NULL .
CONST 1ST Put constants on the left side in comparisons.
ZERO Never divide by zero.
PLOCAL Never return a reference or pointer to local data.
ARRAY Array accesses shall be within the array.
VERIFY Setter must check the value for validity.
Table A4. Risky assumptions rule category.
297

A2. Miscellaneous questions and answers
1. How is Tick-the-Code different from implementing coding standards?
The answer depends on what “implementing coding standards” means. To me, Tick-the-Code “implements coding standards”. What I find is that often people in software organizations think they have implemented coding standards when they have written a document titled “Coding standards”. The other half is normally missing. Coding stan-dards need reenforcing. Without constant and active checking, the coding standards arenot followed. At least you can t know for sure.
Tick-the-Code provides a limited set of clear rules and an extremely effective way of reenforcing them. The rules don t deal with stylistic issues and they don t set naive nu-merical limitations on the creativity of the developers. On the other hand, the veto rights of the author (to ignore any tick) keep the activity sensible. It makes it possible to break the rules when necessary without losing effectiveness. Too strict checking can easily turn in on itself, and becomes counterproductive.
2. How long does it take to learn Tick-the-Code? Does it depend on the number of rules?
The technique of checking one rule at a time is fairly quickly explained and tried out. In three hours, I ve managed to teach the method and hopefully instill a sense of motiva-tion and positive attitude towards striving for quality to help make Tick-the-Code a habitfor the participants. It does depend on the number of rules, yes. Some of the rules are simple searches for keywords, while others demand a deep understanding of software architecture. You learn the rules best when you try them out and when you receive feedback on your own code so that you see when you ve violated certain rules.
3. How many rules did you use in your tests? What is a reasonable number? Can you have too many rules?
Good questions. In most of the experiments, the participants checked for up to an hour.Normally they checked with up to nine different rules in that time. I have a rule of thumb that says that you can check one thousand lines of code with one card in one hour. Onecard contains six rules and an hour of checking is a reasonable session with complete concentration. In the experiments the time for each rule is limited so that the total check-ing time won t exceed one hour.
You can definitely have too many rules, yes. Some coding standards contain so many rules and guidelines that if they weren t written down, nobody would remember all of them. The worst example so far has been a coding standard with exactly 200 rules and guidelines. How are you supposed to reenforce all those rules?
4. Does awareness of the rules improve the code a developer produces?
Yes, that is the main idea of Tick-the-Code.
298

5. Can different people look at the same code using different rules?
The fastest way to cover all 24 rules is to divide them among four checkers and have them check the same code in parallel. Yes, that is possible and recommended.
6. Can it be automated?
Some of the rules are available in static analysis tools, so yes, they can be automated. The fact that those rules are most often violated, leads me to believe that such automa-tion is not working. Whatever the reason, code always contains violations of simple rules. Simple means simple to find, not necessarily error-free. Breaking a simple rule can have fatal consequences in the code.
My opinion is that automating the checking of some of the rules is taking an opportunity away from the checkers. They need to expose themselves to code as much as possible in order to learn effectively. What better way to start exposing than looking for rule viola-tions, which you are sure to find? Getting a few successful finds improves the motivationto continue and makes it possible to check for more difficult rules.
7. Where do you plan to go from here?
There will be a few articles more in this area, maybe a paper or two, too. I have a book in the works about Tick-the-Code. In my plans Tick-the-Code is just one part of a quality-aware software development philosophy. I call it qualiteering . That s why my website is called www.qualiteers.com.
I will continue training people in willing companies and spread the word. It is my hope that Tick-the-Code will reach a critical mass in the development community so that a vibrant discussion can start in Tick-the-Code Forum (www.Tick-the-Code.com/forum/).
One possibility is to follow a few open source projects up close and a little bit longer to see the effects of Tick-the-Code in the long-term. If you re interested in volunteering your project or company, let me know ([email protected]).
299

A3. An example file
In Figure A1, there s a page of code from one of the open source modules of chapter 2.4 Experiment: Open Source Wide Open.
Figure A1. Ticks on this page of code are the author s handwriting.
300

7 Words You Can Never Use
in a Requirements Specification
Les Grove
Tektronix, Inc.
P.0. Box 500 M/S 39-548
Beaverton, OR 97077
AbstractA requirement specification is the one place where all stakeholders of a project have a vested
interest. Unfortunately, requirements are often not written clearly for the people who depend on
them. This paper will help people to use precise language in writing their requirements, detect
problems when reviewing requirements, and avoid misunderstandings when using
requirements. Actual Tektronix requirements will be used as examples and tools to help write
better requirements will be covered.
This paper was originally published and presented at the Telelogic Users Conference in 2006.
Biography
Les Grove is a software engineer at Tektronix, Inc., in Beaverton, Oregon. Les has worked at
Tektronix for 10 years and has 20 years of experience in software development, testing, and
process improvement. He holds a Bachelors of Science in Computer Science from California
Polytechnic State University, San Luis Obispo and has a Masters degree in Software
Engineering from the University of Oregon through the Oregon Masters of Software
Engineering program.
301

Introduction
The characteristics of a well-written requirements statement are that it’s unambiguous,
complete, correct, necessary, prioritized, identified, verifiable, consistent, and concise [7]. This
paper proposes that the most important characteristic, the one that the others are dependant on,
is that it is unambiguous – written in such a way that it is clear and that there should only be one
interpretation of its meaning by any stakeholder who reads it. Requirements are written down
using vague terms in the first place for various reasons – usually because it’s first captured in the
early stages of analysis with the intention of making more precise at a later time, but deadlines
and other details prevent authors from fixing the vague requirements before someone else has to
use them to do their work.
The “7 Words You Can Never Say on Television” [2] are banned because they are offensive and
shock people when they hear them. The same case should be made for bad words in
requirements that indicate that a requirement is not ready for anyone to use in their development
(planning, architecture, design, code, test, documentation, or shown to customers). People
should be shocked and offended when they see these words and demand that their equivalent to
the FCC, the CCB, SQA, or ISO organization, should reprimand the author and send the
specification back for rewrite.
Importance of Precise Requirements
The requirement specification is where the interests of all stakeholders intersect. At Tektronix,
the stakeholders include program management, customer support, customers and end users,
manufacturing, marketing, quality, documentation and various disciplines of engineering. With
so many stakeholders with varying points of view and expectations, writing vague requirements
places the burden of interpreting requirements on the readers. This leads to important details
being hidden, difficulty in planning and tracking projects, and injection of defects that adds
rework and slips schedules.
Bad requirements are like sticks of dynamite with very slow, long fuses [9]. Figure 1 shows the
relative cost of fixing a requirement defect. The later a requirement defect is found, the more
expensive it is to fix. Requirements errors found during the requirements phase cost one unit
(whether that be time or effort). Requirements errors found in later phases increases costs
exponentially until the Operational phase (in use by user/customer) can cost anywhere from 60
times to 300 times (depending on the study) what the error would have cost to fix had it been
found in the requirements phase.
If an organization is finding that most of the requirements errors are not discovered until late in
the project, then the costs to fix multiply several times over.
302

Figure 1 Cost of bad requirements
The 7 Bad Word Types
There aren’t only seven words that shouldn’t be used in a requirement specification, there are
many. These can be grouped into seven types of bad words that create problems.
1 Unquantified
The problem with words like all, always, every, and never is that certainty is implied, but can
never be verified. How does one verify that ‘Values shall always be available’ or ‘The system
shall never fail’? When words like this appear, the statement is capturing a desire – we would
love it if our computers never crashed and all values were visible when we needed them, but as
the song goes: you don’t always get what you want. Adding quantifiers to statements like these
will create better requirement statements: ‘Values shall be available by no more than two mouse
clicks’ or ‘The mean time between system failures is 20 days’.
2 Ambiguous
Terms such as most, some, sometimes, and usually are just plain vague and can be interpreted a
number of ways. When a requirements states that ‘There will be some restrictions on changes a
user can make’, this leaves it up to the designer to either spend time talking with the author or
guessing at what the restrictions should be. This requirement would be better written as a set of
requirements each listing an individual restriction.
3 Vague Adjectives
Words like easy, appropriate, user-friendly, fast, and graceful indicate that a requirement is not
fully thought through. An author may think that anyone would understand ‘Put up an
Requirements Design Code Integration Testing Operation
303

appropriate message when there are no more available slots’, but this type of use could indicate
something more problematic. What is the real requirement here? There needs to be an
indication that there are no available slots, but the author had dabbled into design by stating that
the solution should be in the form of a message – but just didn’t want to specify the message.
So in this example a more basic problem is uncovered by catching the vague adjective.
4 Vague Verbs
Vague verbs such as handle, improve, provide, reject, and support do not describe what the
system will actually do. It is a sign that the author has thrown up their hands in frustration
because the system should do something in a given situation, but can’t decide what. When a
requirement states that ‘The application must handle suppressed data’ the developer has nothing
to base any design decisions on.
5 Implied Multiple Requirements
Words and phrases like and, another, etc., other, including, not limited to, and such as not only
indicate multiple requirements, but often indicate missing requirements. Multiple requirements
in one statement are easy to catch with words such as and, but when there are lists indicated by
including, not limited to, and such as, missing requirements can also be found. For example,
‘The user shall be notified of loss of signal, loss of clock, etc.’ indicates that there are other
states and conditions that the user should be notified about but are not specified. This
requirement also has the problem of containing multiple requirements in the single statement
that need to be separated out.
6 Pronouns
Pronouns in requirement statements can be very clear to the author but misleading to the
readers. The statement ‘Touch screen operations provide audio feedback. User can turn it on or
off’’ does not indicate whether it refers to the touch screen or the audio feedback. Also, it
indicates that there are two requirements: audio feedback and some sort of switching capability.
Just separating the two sentences in this example does not solve any problems either because the
second sentence totally loses its context because of the pronoun. The word this is another
pronoun to avoid.
7 Implied Uncertainty
At Tektronix, this word should is the worst offender as it is used more frequently than any other
of the words mentioned. This opinion goes against some other requirements books and the
practice of some very large companies (particularly defense and finance) but Tektronix relies on
priority designations on each requirement to indicate whether a requirement will be
implemented and how important it is. Because it implies uncertainty, testers cannot be sure
there is an error if the negative happens. When a requirement states that ‘The default should be
auto-detection’ is it an error during testing if the default is something else? Other uncertain
words are and/or, can, could, if possible, and may.
304

Eradicating Bad Requirements
Vague words should be considered the same as using “TBD” in the text – flagged as something
that needs to be resolved before the requirement can be used. There are a number of ways to
make requirements precise:
Peer Reviews
Authors should look for vague terms in their own specifications before sending them out for
review. If an author is unable to resolve some of the vague terms before the review, then the
vague requirements need to be noted by the author and given to the reviewers. It also must be
determined if a specification that is essentially incomplete (with the equivalent of TBD’s) is
even ready enough for review or needs additional time. If schedule constraints dictate that the
specification must be reviewed before the vague terms are clarified, then resolution of the
known vague terms needs to be tasked – and added to the schedule – or added to the risk
identification list.
Reviewers need to note vague terms when they find them during their review activity. Sections
with many vague terms may be an indication of problem areas.
People who are using requirements and find vague terms should not make any assumptions as to
what the intended meaning of a requirement is and follow up with the author.
Boilerplates
The nice thing about using boiler plates in writing requirement statements is that it forces the
author to write in a consistent and precise format. Although Hull [8] provides a variety of
boilerplates, there are essentially two basic types that are targeted to either the problem domain
or the solution domain. For capabilities provided to the stakeholder, use
The <stakeholder> shall be able to <capability>.
For responses provided by the system, use
The <system> shall <function>.
These two boilerplates enforce good grammar in an active voice while avoiding long narrative
paragraphs.
Planguage
Tom Gilb [6] has developed a keyword-driven syntax that deals with all the “extra” information
that people need to include with requirements. Planguage is intended to provide a standard
format and a set of essential keywords for each requirement. Although there are some
recommended keywords (tag, source, requirement, priority, etc.) an organization can create
custom keywords to suit their system’s needs (see below). See Figure 2 for a short planguage
example.
305

Key Word Definition
Tag Save.EventResults
Source John Doe, Marketing Manager
Requirement The application shall save Event Results in a rich text
format.
Priority High
Rationale Creates the ability to export Event Results to MS
Word.
Figure 2 Example Planguage Requirement
Math
There are a number of solutions that attempt to move away from the traditional shall-type set of
requirements statements using English sentences to a more mathematical approach. Formal
methods such as Z attempt to eliminate the ambiguity of English and replace it with a
mathematical notation. The reason this hasn’t caught on is that it requires all stakeholders to
understand the notation. Figure 3 shows a simple requirement to maintain the status of a
monitor to normal until a threshold is exceeded.
∆Monitor
status? : monitor
normal
status? = exceeds threshold
tripped”
Figure 3 Z Example
The idea of using tests as requirements falls under this category as well. The idea is to capture
the requirements in a logic-based format.
Tools
Having a tool that can catch bad words can save time and increase the likelihood that as many
words as possible can be found.
NASA’s Automated Requirements Measurement (ARM) tool [11] captures metrics of
requirement specifications including size, number of requirements, and readability. It also
counts specific weak phrases (see below) giving an indication as to the quality of the
specification.
PHRASE OCCURRENCE
--------- ----------
normal 1
may 2
handle 1
should 1
TBD 2
306

Other tools include TEKChecker [4], SAT [3], TIGERPRO [15], Requirements Assistant [14],
and SmartCheck [13]. Each of these tools also performs other requirements or specification-
related tasks and varies in cost. The object of any tool is to make it easier and faster to find
weaknesses in requirements.
At Tektronix, Telelogic’s DOORS tool is used to manage requirements. With its built-in
scripting capability, we have developed a script to catch bad words from a specification (see
Figure 4). This does not remove the need for peer reviews at Tek, but can help reviewers
identify statements or sections of the specification that need to be reworked. With this, the
stakeholders can focus on content during the review.
Figure 4 Bad Words DOORS Script
Conclusion
No matter how requirements are captured, whether it be natural language statements, planguage,
mathematical models, or test-driven, the more precise the requirements the more likely it is that
all stakeholders will understand them – as intended. When using natural language requirements,
vague words pose a risk to the quality of the requirements that can have a huge impact of the
success of a project. Vague words should be treated as TBDs and need to be resolved before
downstream stakeholders need to use them. There are several ways to minimize vague words in
specifications from peer reviews and structured templates, to tools that automatically find the
words. There is no silver bullet to removing ambiguities from specifications, but there are many
silver bits to fight this problem.
307

References
1. Alexander, I., 10 Small Steps to Better Requirements,
easyweb.easynet.co.uk/~iany/consultancy/ten_steps/ten_steps_to_requirements.htm, 2005.
2. Carlin, G., Class Clown, Atlantic Records, 1972.
3. CassBeth Inc., Specification Analysis Tool, www.cassbeth.com
4. ClearSpec Enterprises, TEKChecker, www.livespecs.com.
5. Gauss, D., Weinberg, G., Exploring Requirements, Quality Before Design, Dorset House,
1989.
6. Gilb, T., Competitive Engineering, Elsevier, 2005
7. Grove, L., et al, Control Your Requirements Before They Control You, Pacific Northwest
Software Quality Conference, 2003.
8. Hull, E., et al, Requirements Engineering, Springer, 2004.
9. Hooks, I., Farry, K., Customer-Centered Products, AMA, 2001.
10. Lawrence, B., Unresolved Ambiguity, American Programmer, 1996.
11. NASA, Automated Requirements Measurement (ARM) Tool, satc.gsfc.nasa.gov/tools/arm.
12. Schratz, D., Clear, Concise, Measurable Requirements – Are They Possible, Pacific
Northwest Software Quality Conference, 2005.
13. Smartware Technologies, SmartCheck, www.smartwaretechnologies.com.
14. Sunnyhills Consultancy BV, Requirements Assistant, www.requirementsassistant.nl.
15. Systems Engineering & Evaluation Centre, TIGERPRO,
www.seecforum.unisa. edu.au/SEECTools.html.
16. Wiegers, K., Software Requirements, 2nd Edition, Microsoft Press, 2003.
17. Wiegers, K., More About Software Requirements, Microsoft Press, 2006.
308

AJAX Testing - How to test the Asynchronous?
Manoharan S. Vellalapalayam Software Architect Intel Corporation
BIO
Manoharan Vellalapalayam is a Software Architect at Intel with Information technology group. Mano’s primary area of focus is .NET, Database and Security application architectures. He has over 15 years of experience in software development and testing. He has created innovative test tool architectures that are widely used for validation of large and complex CAD software used in CPU design projects at Intel. Chaired validation technical forums and working groups. He has provided consultation and training to various CPU design project teams in US, Israel, India and Russia. He has published many papers, and is a frequent speaker at conferences including PNSQC, PSQT and DTTC.
ABSTRACT
Undeniably AJAX (Asynchronous JavaScript and XML) is the future for rich user experience on the web with cross-browser support. AJAX Web pages are more responsive due to asynchronous lightweight data transfer. Testing the asynchronous responses poses a huge challenge to ensure security and lightweight data transfer over the wire. This paper describes what the challenges are and why conventional approach to testing fails to work. Also this paper offers an innovative and practical approach to reliably test AJAX enabled applications without compromising security.
INTRODUCTION
AJAX, Asynchronous JavaScript and XML, is a web development technique for creating truly rich web applications supported by most modern browsers. The intent is to make web pages feel more responsive by exchanging small amounts of data with the server behind the scenes asynchronously. This is meant to increase the web page's interactivity, speed, and usability. Google Maps, Google Suggest, Gmail, Yahoo! Mail and Amazon search control are some of the popular AJAX enabled applications.
However the benefits of AJAX bring along certain complexities and even more of a burden on testing teams to make smart choices. AJAX presents additional security and performance issues that a simple web page might not face.
This paper, first presents an overview of AJAX and how AJAX works. It then illustrates the difference between a conventional and an AJAX web application. The paper then captures the challenges and risks for going enterprise AJAX.
Next the paper describes in detail why conventional testing (wait for the response and verify) is no longer sufficient and is often unreliable. It then, discusses testing of asynchronous response – a new practical approach that can be successfully applied for ajaxifying the enterprise. AJAX security dangers and ways to test the security issues are explained for the benefit of the reader.
AJAX IS FOR REAL - BACKGROUND
AJAX isn't a single technology. It is a combination of multiple technologies:
• Standards-based presentation using XHTML and CSS• Dynamic display and interaction using the Document Object Model• Asynchronous server communication using XMLHttpRequest• JavaScript on the client side binding everything together
309

How Does AJAX Work?
The dynamic Web programming platform has become more popular in the past year because the collection of coding techniques facilitates instant interactions with Web sites. Users don’t need to wait for pages to completely reload to find desired information.
The core of AJAX is the XmlHttpRequest JavaScript object. This JavaScript object was originally introduced in Internet Explorer 5, and it is the enabling technology that allows asynchronous requests. In short, XmlHttpRequest lets you use JavaScript to make a request to the server and process the response without blocking the user. [1]
The diagrams below compare the user interaction models of conventional web application in Figure 1 against AJAX-fied web application in Figure 2
Figure 1 shows how a user interaction occurs when conventional web application is used. Here a user has to stop and wait until a response is received. This means that data fetching activity interrupts the user operation.
Figure 1. Interrupted user operation while data is being fetched.
Figure 2 shows how a user interaction occurs for AJAX application. In this model, a user keeps operating since the data fetching occurs in the background.
310

Figure 2. Uninterrupted user operation while data is being fetched
Figure 3, shows the server side and client side interactions in an AJAX page. AJAX code gets injected into the browser during the initial loading. Later on AJAX code performs the server communication for the AJAX enabled elements on the page.
Figure 3. AJAX interactions
311

AJAX Usage scenarios
By performing screen updates on the client, you have a great amount of flexibility when it comes to creating your Web site. Here are some ideas for what you can accomplish with AJAX:
• Update the totals on a shopping cart without forcing the user to click Update and wait for the server to resend the entire page.
• Exchange smaller amount of data to increase site performance by reducing the amount of data downloaded from the server. For example, dynamically update the price of a stock sticker without reloading the entire page.
• Auto suggest like Google suggest as you type in a drop down list with data fetched from a database.
It is important to remember that AJAX is purposed for interactive web applications, not for static web pages. Dynamic web pages are potential AJAX targets because user interactions on the page require page re-loading where as static web pages are not.
WHAT ARE THE CHALLENGES?
However the benefits of AJAX bring along certain complexities as even more of a burden on testing teams to make smart choices. AJAX presents additional security and performance issues that a simple web page might not face:
• Malformed data is the biggest risk. A denial of service can be done quite easily because of asynchronous code. There is the potential result of resource exhaustion on the server side or of a denial of service causing a server crash.
• An unauthenticated user can quickly elevate his or her privileges if there is no server-side protection
• Performance, though, is potentially a bigger issue. AJAX may allow better data validation on the client side, but need to put new additional validation requirements on server, which is an added risk and overhead
• Client side AJAX source is viewable in a browser. A user with malicious intent could hack the site and run own injected code.
WHY CONVENTIONAL METHOD OF TESTING FAILS TO WORK?
Conventional testing of web pages to wait for the HTTP response and verify the content will not work as the page is not completely loaded when the request returns. Some of the AJAX elements are still getting loaded asynchronously.
Moreover, the data format returned in AJAX requests is not necessarily in HTML, it can be a piece of Java Script code or in any other custom data format. This makes testing more challenging and demands new approach to ensure that benefits outweigh the risks.
This is a major barrier to enterprise AJAX adoption. The lack of proper automated testing tools in the market has severely limited the fast adoption of AJAX for enterprise projects. Without the automated tools, manual testing of these applications is extremely labor intensive and some require extra resources to get enough testing capacity.
HOW TO TEST THE ASYNCHRONOUS? - THE NEW PRACTICAL APPROACH
This paper offers new innovative and practical approach to testing of AJAX enabled web applications.
312

Do not just test the client? Include server too.
• Do not simply eval() anything in JavaScript. • Apply validation of data before eval(). • Realize that all JavaScript can be reverse engineered. Don't put anything in JavaScript that you
would not feel safe handing over to a bunch of hackers. • Do NOT depend on JavaScript to do any input validation
In AJAX we are decoupling the user interaction from the server communication. Because of this the server communication happens completely behind the scenes without user knowledge. Malicious inputs can be sent to server side. So validate the inputs on the server side as you would do for a normal web page.
How to test the AJAX applications to avoid server side security risks, performance
issues and scalability?
Test for authentication and authorization • Know all of the AJAX endpoints that requests/receives data from server on a page. Protect these
endpoints with proper authentication and authorization. • Check for tokens for all GET/POST requests. • It is easy to just pick a function in an existing project and decide to make it a Web service
including Web services that do very sensitive functions, such as adding users or validating credit card numbers, without any sort of authentication or authorization. It does not matter if a normal user called the admin functions or if a third-party Web site decides to start using their Web service to validate their credit card numbers.
• Protect a web service like you would protect a Web form like input validation, security check etc.,
Encode incoming and outgoing data Do not submit sensitive data over a Web service in clear text and in a simple "GET" request where the data is in the URL. For example, if a web application that has an AJAX function (like autosuggest) and as soon as a user enters a credit card number and expiration date, it validates the data when the user tabs out of the field. The Web service it calls does not make an SSL connection, and the data is sent in the URL, it is fully exposed in the Web logs.
Similarly Cross-site scripting (XSS) has always been a big problem with Web applications. But now with AJAX, the exploitation technique for XSS has been elevated much higher. So make it a practice to not only encode incoming sensitive data but also safely encode that data going out. This will help solve the pesky XSS problem.
Exposure of Web services With everyone implementing AJAX capability these days developers are starting to open up server side APIs to Web methods. Some of these web methods are not for public consumption, and some are for authorized users only. Since JavaScript source is viewable, any curious person can go through the code and identify all points in which a Web service is available to call, thus enabling, a hacker to call the Web service directly without using the GUI interface they should use.
Why is this dangerous? For example, let's say a developer has decided to "AJAXify" his existing application like Google Autosuggest to list all admin users; a hacker can easily exploit it if left unprotected. When a hacker sends letter 'a' to the web method, it will return all admin users that start with letter “a”. Now the hacker gets access to every username that starts with an 'a' in the system. It is important to test for web service methods for protected access like input validation, security check etc.,
Test for performance and scalability issues AJAX dramatically increases the amount of XML content over the network. AJAX extends Web services from business-to-business to business-to-consumer, thereby making the user's Web browser into a Web
313

services portal. This may expose the web browser to consume potentially corrupted data leading to browser crash or poor performance. Also malformed messages can disrupt server performance due to excessive parsing and exception handling. Excessive XML traffic can consume more than double the bandwidth of traditional binary data formats, leading to system wide performance degradation.
In order to test AJAX performance, design test cases that track network traffic, available bandwidth, track client memory usage and slowness.
How do we test what we do not see?
Users do not see the asynchronous responses because they happen behind the scenes initiated by user actions or events. We need a different approach called latency enabled testing for the asynchronous responses. Instead of validating when the page loads (which would always fail!), wait for the asynchronous response to arrive before beginning to test. Create and use events like wait until state changed, wait for an element or object not null or wait for set amount of time.
Let's say that we have a web page containing a text field and a button. The initial value of the text field is "oldValue". If you click the button, some AJAX magic will happen and the value of the text field will be changed to "newValue", without reloading the page. Using conventional testing approach, open the page, click the button, and then check the value of the text field. However if we do that in a browser the test case could fail.
The obvious reason for the test failure is that because of the asynchronous nature of the AJAX call, the response does not come back from the server immediately. So, the value of the field may change a few seconds after the button click, but if the test case checks the value immediately it could get the old value!
How do we go about testing this? The obvious approach is to Wait For It...
Create the following set of JavaScript functions and add to your test tool library for testing asynchronous effects.
• WaitForValueChange() • WaitForSpecificValue() • WaitForElement() • WaitForTitle() • WaitFor…anything…()
Avoid ClickAndWait()One way to test the asynchronous effect is to use the clickAndWait() approach instead of click. This will make the test case to wait for a page-reload. This might seem like it would work, but it will not because the page is not reloaded, clickAndWait() will make the test case wait forever.
To overcome this indefinite wait problem one might think to set a timeout period to clickAndWait()approach. It might work most of the time, but it may fail if the server takes more than 5 seconds. This might happen for any number of reasons such as,- slow network, overloaded test machine. You can keep increasing the timeout value before checking the result, but this will make your tests run slower and slower. So this clearly isn't the smartest solution because it's not guaranteed to work and makes your tests run signifigantly slower than necessary. The solution to this problem as explained in the previous section is to use “Wait For It...” functions.
Use waitUntilTrue() What happens if none of the WaitFor…() functions meet your needs? Use waitUntilTrue () function that takes a Boolean expression as a parameter that causes the test case to wait until the expression evaluates to true or the specified timeout value. This could prove useful when testing more complicated asynchronous effects.
314

HOW TO TEST AGAINST AJAXSECURITY DANGERS?
"AJAX and security is something that brings fear among developer/tester community. But the fact is that a lot of the security concerns are not unique to AJAX. One of the biggest mistakes is the failure to validate data on the server. Technically speaking, AJAX-based web applications are vulnerable to the same hacking
methodologies as ‘normal’ applications but with increased attack surface.
There is also an increase in session management vulnerabilities and a greater risk of hackers gaining access
to many hidden URLs which are necessary for AJAX requests to be processed. Another weakness of AJAX is
the process that formulates server requests. The AJAX technology uses JS to capture the user commands and
to transform them into function calls. Such function calls are sent in plain visible text to the server and may
easily reveal database table fields such as valid product and user IDs, or even important variable names, valid
data types or ranges, and any other parameters which may be manipulated by a hacker.
With this information, a hacker can easily use AJAX functions without the intended interface by crafting specific
HTTP requests directly to the server. In case of cross-site scripting, maliciously injected scripts can actually
leverage the AJAX provided functionalities to act on behalf of the user thereby tricking the user with the
ultimate aim of redirecting.
The solution is to protect all end points in an AJAX enabled application.
Popular AJAX attacks
Yamanner Worm Hits Yahoo Mail! Yamanner worm exposed the Yahoo Mail vulnerability that relied on a JavaScript function in connection with uploading images from a message to their mail server. Yahoo Mail made limited use of AJAX to spur interactions between the mail user and Yahoo's servers. The Yamanner worm exploited one of the few JavaScript functions by substituting its own JavaScript commands where the image-handling code was meant to go. The JavaScript executes in background, the browser performs no checks on whether it is performing the expected function or not, and the worm shows no telltale of its activity on the user's screen, except a possible slowdown in other activities.
In addition to ordering the user's computer to query the Yahoo mail server for the user's address book, generate a message and send them out to each name in the address book, Yamanner also captured the addresses and uploaded them to a still unidentified Web site. By doing so, it was building an email list with many thousands of names that could be sold to spammers, according to web security experts [2].
Samy is my hero Samy in 2005 wrote a worm utilizing AJAX vulnerability that spread all over the MySpace web community – infecting everybody that crossed its path with “ins tant friendship”, thus gaining Samy more than a million friends before the MySpace team disabled the worm (taking pretty much the whole site offline to do so). The automatically included message “Samy is my hero”, however, remains in thousands of homepages [3]
Recommendations
Following are the recommended steps in order to test the AJAX web application against security dangers: • Review and document the inputs that are allowed in your application. • Ensure that all input is validated before being sent to the server for processing, in addition to
server side validation. • Protect all server-side end points by doing security check and input validation.
• Use white listing rather than black listing for validation. White listing involves accepting what you know to be good data, while black listing uses a list of data not to allow. For example, you know that the zip code should always be five numbers; white listing the zip code input means accepting only five numbers and nothing else.
• Implement the Web application over the Secure Socket Layer (SSL) protocol for sensitive data.
315

• Restrict the exposure of application logic and database structure in JavaScript.
SUMMARY
We have seen what AJAX is and why it is the future for web technologies. We have looked at the
challenges and practical approach to successful AJAX testing.
Going forward more and more AJAX enabled Framework will be developed and available to users to build
Web applications with minimum development effort. The way that the XMLHttpRequest object gets
created will be standardized. The future generation of browsers will be more and more AJAX friendly. Of
course, AJAX community will identify and share best practice and design patterns for developing AJAX
applications. Testing AJAX-enabled applications will become easier as new frameworks are created and
existing frameworks evolve to support the interaction model.
Whatever the tool or platform is used, It is important to remember not to trust data but always validate on
both client and server side. Choose white listing over blacklisting methodology to ensure security.
ACKNOWLEDGEMENTS
Author would like to acknowledge reviewers Bhushan B Gupta, Scott A Whitmire and Jonathan Morris for their valuable inputs to improve the quality and structure of this paper to a great extent. Many Thanks!
BIBLIOGRAPHY/REFERENCES
1. GARRETT, J.J., (2005), “AJAX: A New Approach to Web Applications”, Adaptive Path: http://adaptivepath.com/publications/essays/archives/000385.php
2. Charles Babcock., (2006), “Yahoo Mail Worm May Be First Of Many As AJAX Proliferates”
http://www.informationweek.com/security/showArticle.jhtml?articleID=189400799
3. Philipp Lenssen., (2005) “Samy, Their Hero” http://blog.outer-court.com/archive/2005-10-14-n81.html
316

Introduction to Software Risk Management
Karl E. Wiegers
Principal Consultant, Process Impact
www.processimpact.com
Copyright © 2007 Karl E. Wiegers
Author Biography:
Karl E. Wiegers is Principal Consultant with Process Impact, a software process consulting and
education company in Portland, Oregon. His interests include requirements engineering, peer
reviews, process improvement, project management, risk management, and metrics. Previously,
he spent 18 years at Eastman Kodak Company, where he held positions as a photographic
research scientist, software developer, software manager, and software process and quality
improvement leader. Karl received a B.S. in chemistry from Boise State College, and M.S. and
Ph.D. degrees in organic chemistry from the University of Illinois. He is a member of the IEEE,
IEEE Computer Society, and ACM.
Karl’s most recent book is Practical Project Initiation: A Handbook with Tools (Microsoft Press,
2007). He also wrote More About Software Requirements: Thorny Issues and Practical Advice
(Microsoft Press, 2006), Software Requirements, 2nd Edition (Microsoft Press, 2003), Peer
Reviews in Software: A Practical Guide (Addison-Wesley, 2002), and Creating a Software
Engineering Culture (Dorset House, 1996). Karl is also the author of more than 170 articles on
software development, chemistry, and military history. Karl has served on the Editorial Board for
IEEE Software magazine and as a contributing editor for Software Development magazine. He is
a frequent speaker at software conferences and professional society meetings.
Abstract:
This paper provides an introduction to the principles of identifying and managing risks on a
software project. The importance of managing risks is pointed out. The subcomponents of risk
management are described: risk assessment (identification, analysis, and prioritization), risk
avoidance, and risk control (risk management planning, resolution, and monitoring). Typical risk
factors in several categories are identified, including dependencies, requirements issues,
management issues, knowledge-related issues, and outsourcing. Two templates for documenting
individual risks are included, along with recommendations for effective ways to state risks and
estimate the threat they pose to the project. Several traps are discussed that can interfere with
effective risk management.
317

Introduction to Software Risk Management1
Karl E. Wiegers
Software engineers are eternal optimists. When planning software projects, we usually
assume that everything will go exactly as planned. Or, we take the other extreme position: the
creative nature of software development means we can never predict what’s going to happen, so
what’s the point of making detailed plans? Both of these perspectives can lead to software
surprises, when unexpected things happen that throw the project off track. In my experience,
software surprises are never good news.
Risk management has become recognized as a best practice in the software industry for
reducing the surprise factor [Brown 1996; DeMarco and Lister 2003]. Although you can never
predict the future with certainty, you can apply structured risk management practices to peek
over the horizon at the traps that might be looming. Then you can take actions to minimize the
likelihood or impact of these potential problems. Risk management means dealing with a
concern before it becomes a crisis. This improves the chance of successful project completion
and reduces the consequences of those risks that cannot be avoided.
During project initiation take the time to do a first cut at identifying significant risks. At
this stage it’s most important to consider business risks, the risks of either undertaking or not
undertaking the project. It’s possible that the risks will outweigh the potential benefits of the
project. More likely, getting an early glimpse of potential pitfalls will help you make more
sensible projections of what it will take to execute this project successfully. Build time for risk
identification and risk management planning into the early stages of your project. You’ll find
that the time you spend assessing and controlling risks will be repaid many times over.
What Is Risk?
A “risk” is a problem that could cause some loss or threaten the success of your project,
but which hasn’t happened yet. And you’d like to keep it that way. These potential problems
might have an adverse impact on the cost, schedule, or technical success of the project, the
quality of your products, or team morale. Risk management is the process of identifying,
addressing, and controlling these potential problems before they can do any harm.
Whether we tackle them head-on or keep our heads in the sand, risks have a potentially
huge impact on many aspects of our project. The tacit assumption that nothing unexpected will
derail the project is simply not realistic. Estimates should incorporate our best judgment about
the potentially scary things that could happen on each project, and managers need to respect the
assessments we make. Risk management is about discarding the rose-colored glasses and
confronting the very real potential of undesirable events conspiring to throw the project off track.
1
Adapted from Karl E. Wiegers, Practical Project Initiation: A Handbook with Tools (Microsoft Press, 2007).
318

Why Manage Risks Formally?
A formal risk management process provides multiple benefits to both the project team
and the development organization as a whole. First, it gives us a structured mechanism to
provide visibility into threats to project success. By considering the potential impact of each risk
item, we can focus on controlling the most severe risks first. We can marry risk assessment with
project estimation to quantify possible schedule slippage if certain risks materialize into
problems. This approach helps the project manager generate sensible contingency buffers.
Sharing what does and does not work to control risks across multiple projects helps the team
avoid repeating the mistakes of the past. Without a formal approach, we cannot ensure that our
risk management actions will be initiated in a timely fashion, completed as planned, and
effective.
Controlling risks has a cost. We must balance this cost against the potential loss we could
incur if we don’t address the risks and they do indeed bite us. Suppose we’re concerned about the
ability of a subcontractor to deliver an essential component on time. We could engage multiple
subcontractors to increase the chance that at least one will come through on schedule. That’s an
expensive remedy for a problem that might not even exist. Is it worth it? It depends on the down
side we incur if indeed the subcontractor dependency causes the project to miss its planned ship
date. Only you can decide for each individual situation.
Typical Software Risks
The list of evil things that can befall a software project is depressingly long. The
enlightened project manager will acquire lists of these risk categories to help the team uncover as
many concerns as possible early in the planning process. Possible risks to consider can come
from group brainstorming activities or from a risk factor chart accumulated from previous
projects. In one of my groups, individual team members came up with descriptions of the risks
they perceived, which I edited together and we then reviewed as a team.
The Software Engineering Institute has assembled a taxonomy of hierarchically-
organized risks in 13 major categories, with some 200 thought-provoking questions to help you
spot the risks facing your project [Carr et al. 1993]. Steve McConnell’s Rapid Development
[1996] also contains excellent resource material on risk management and an extensive list of
common schedule risks.
Following are several typical risk categories and some specific risks that might threaten
your project. Have any of these things have happened to you? If so, add them to your master risk
checklist to remind future project managers to consider if it could happen to them, too. There are
no magic solutions to any of these risk factors. We need to rely on past experience and a strong
knowledge of software engineering and management practices to control those risks that concern
us the most.
Dependencies
Some risks arise because of dependencies our project has on outside agencies or factors.
We cannot usually control these external dependencies. Mitigation strategies could involve
TRAP: Expecting the project manager to identify all the relevant risks. Different project
participants will think of different possible risks. Risk identification should be a team effort.
319

contingency plans to acquire a necessary component from a second source, or working with the
source of the dependency to maintain good visibility into status and detect any looming
problems. Following are some typical dependency-related risk factors:
• Customer-furnished items or information
• Internal and external subcontractor or supplier relationships
• Inter-component or inter-group dependencies
• Availability of trained and experienced people
• Reuse from one project to the next
Requirements Issues
Many projects face uncertainty and turmoil around the product’s requirements. Some
uncertainty is tolerable in the early stages, but the threat increases if such issues remain
unresolved as the project progresses. If we don’t control requirements-related risks we might
build the wrong product or build the right product badly. Either outcome results in unpleasant
surprises and unhappy customers. Watch out for these risk factors:
• Lack of a clear product vision
• Lack of agreement on product requirements
• Inadequate customer involvement in the requirements process
• Unprioritized requirements
• New market with uncertain needs
• Rapidly changing requirements
• Ineffective requirements change management process
• Inadequate impact analysis of requirements changes
Management Issues
Although management shortcomings affect many projects, don’t be surprised if your risk
management plan doesn’t list too many of these. The project manager often leads the risk
identification effort, and most people don’t wish to air their own weaknesses (assuming they
even recognize them) in public. Nonetheless, issues like those listed here can make it harder for
projects to succeed. If you don’t confront such touchy issues, don’t be surprised if they bite you
at some point. Defined project tracking processes and clear project roles and responsibilities can
address some of these conditions.
• Inadequate planning and task identification
• Inadequate visibility into project status
• Unclear project ownership and decision making
• Unrealistic commitments made, sometimes for the wrong reasons
• Managers or customers with unrealistic expectations
• Staff personality conflicts.
Lack of Knowledge
Software technologies change rapidly and it can be difficult to find suitably skilled staff.
As a result, our project teams might lack the skills we need. The key is to recognize the risk areas
early enough so we can take appropriate preventive actions, such as obtaining training, hiring
consultants, and bringing the right people together on the project team. Consider whether the
following factors apply to your team:
• Lack of training
• Inadequate understanding of methods, tools, and techniques
320

• Insufficient application domain experience
• New technologies or development methods
• Ineffective, poorly documented, or ignored processes
• Technical approaches that might not work
Outsourcing
Outsourcing development work to another organization, possibly in another country,
poses a whole new set of risks. Some of these are attributable to the acquiring organization,
others to the supplier, and still others are mutual risks. If you are outsourcing part of your project
work, watch out for the following risks:
• Acquirer’s requirements are vague, ambiguous, incorrect, or incomplete.
• Acquirer does not provide complete and rapid answers to supplier’s questions or requests for
information.
• Supplier lacks appropriate software development and management processes.
• Supplier does not deliver components of acceptable quality on contracted schedule.
• Supplier is acquired by another company, has financial difficulties, or goes out of business.
• Supplier makes unachievable promises in order to get the contract.
• Supplier does not provide accurate and timely visibility into actual project status.
• Disputes arise about scope boundaries based on the contract.
• Import/export laws or restrictions pose a problem.
• Limitations in communications, materials shipping, or travel slow the project down.
Risk Management Components
Risk management is the application of appropriate tools and procedures to contain risk
within acceptable limits. As with other project activities, begin risk management by developing a
plan. Figure 1 suggests a template for a risk management plan. This template is suitable for
larger projects. Small projects can include a concise risk management plan as a section within the
overall project management plan.
Risk management consists of the sub-activities illustrated in Figure 2 and described
below [Boehm 1989].
1. Purpose
2. Roles and Responsibilities
3. Risk Documentation
4. Activities
5. Schedule for Risk Management Activities
6. Risk Management Budget
7. Risk Management Tools
Appendix. Sample Risk Documentation Form
Figure 1: Risk management plan template.
321

Risk Assessment
Risk assessment is the process of examining a project to identify areas of potential risk.
Risk identification can be facilitated with the help of a checklist of common risk areas for
software projects, such as the brief lists presented in this paper. You might also study an
organization-wide compilation of previously identified risks and mitigation strategies, both
successful and unsuccessful. Risk analysis examines how project outcomes might change as a
result of the identified risks.
Risk prioritization helps the project focus on its most severe risks by assessing the risk
exposure. Exposure is the product of the probability of incurring a loss due to the risk and the
potential magnitude of that loss. I usually estimate the probability from 0.1 (highly unlikely) to
1.0 (certain to happen), and the loss (also called impact) on a relative scale of 1 (no problem) to
10 (deep tapioca). Multiplying these factors together provides an estimate of the risk exposure
due to each item, which can run from 0.1 (don’t give it another thought) through 10 (stand back,
here it comes!). It’s simpler to estimate both probability and loss as High, Medium, or Low.
Figure 3 shows how you can estimate the risk exposure level as High, Medium, or Low by
combining the probability and loss estimates. It’s also a good idea to consider the time horizon
during which a risk might pose a threat. Confront imminent risks more aggressively than those
for which you still have some breathing space.
Risk Management
Risk Assessment
Risk Identification
Risk Analysis
Risk Prioritization
Risk Avoidance Risk Control
Risk Management Planning
Risk Resolution
Risk Monitoring
Figure 2: Components of risk management.
Loss
Probability Low Medium High
Low Low Low Medium
Medium Low Medium High
High Medium High High
Figure 3: Risk exposure is a function of probability and potential loss.
322

Risk Avoidance
Risk avoidance is one way to deal with a risk: don’t do the risky thing! You might avoid
risks by not undertaking certain projects, or by relying on proven rather than cutting-edge
technologies when possible. In certain situations you might be able to transfer a risk to some
other party, such as a subcontractor.
Risk Control
Risk control is the process of managing risks to achieve the desired outcomes. Risk
management planning produces a plan for dealing with each significant risk, including
mitigation approaches, owners, and timelines. Risk resolution entails executing the plans for
dealing with each risk. Finally, risk monitoring involves tracking your progress toward
controlling each risk item, as well as detecting when a risk has become a genuine problem.
Let’s look at an example of risk management planning. Suppose the “project” is to take a
hike through a swamp in a nature preserve. You’ve been warned that the swamp might contain
quicksand. So the risk is that we might step in quicksand and be injured or even die. One strategy
to mitigate this risk is to reduce the probability of the risk actually becoming a problem. A
second option is to consider actions that could reduce the impact of the risk if it does in fact
become a problem. So, to reduce the probability of stepping in the quicksand, we might be on the
alert, looking for signs of quicksand as we walk, and we might draw a map of the swamp so we
can avoid these quicksand areas on future walks. To reduce the impact if someone does step in
quicksand, perhaps the members of the tour group should rope themselves together. That way if
someone does encounter some quicksand the others could quickly pull him to safety. In that way
we reduce the impact of stepping in the quicksand. Although, of course, we still stepped in the
quicksand.
Even better, is there some way to prevent the risk from becoming a problem under any
circumstances? Maybe we build a boardwalk as we go so we avoid the quicksand. That will slow
us down and it will cost some money. But, we don’t have to worry about quicksand any more.
The very best strategy is to eliminate the root cause of the risk entirely. Perhaps we should drain
the swamp, but then it wouldn’t be a very interesting nature walk. By taking too aggressive a risk
approach, you can eliminate the factors that make a project attractive in the first place.
Documenting Risks
Simply identifying the risks facing a project is not enough. We need to write them down
in a way that lets us communicate the nature and status of risks throughout the affected
stakeholder community over the duration of the project. Figure 4 shows a form I’ve found to be
convenient for documenting risks. It’s a good idea to keep the risk list itself separate from the
risk management plan, as you’ll be updating the risk list frequently throughout the project.
323

Figure 4: A risk documentation form.
Use a condition-consequence format when documenting risk statements. That is, state the
risk situation (the condition) that you are concerned about, followed by at least one potential
adverse outcome (the consequence) if that risk should turn into a problem. Often, people
suggesting risks state only the condition—“The customers don’t agree on the product
requirements”—or the consequence—“We can only satisfy one of our major customers.” Pull
those together into the condition-consequence structure: “The customers don’t agree on the
product requirements, so we’ll only be able to satisfy one of our major customers.” This
statement doesn’t describe a certain future, just a possible outcome that could harm the project if
the condition isn’t addressed.
Keep the items that have high risk exposures at the top of your priority list. You can’t
address every risk item, so use this prioritization mechanism to learn where to focus your risk
control energy. Set goals for determining when each risk item has been satisfactorily controlled.
Your mitigation strategies for some items may focus on reducing the probability, whereas the
approach for other risks could emphasize reducing the potential loss or impact.
The cell in the form labeled Mitigation Approaches allows you to identify the actions you
intend to take to keep the risk item under control. With any luck, some of your mitigation
approaches will attack multiple risk factors. For example, one group with which I worked
identified several risks related to failures of components of their Web delivery infrastructure
(servers, firewall, e-mail interface, and so forth). A mitigation strategy that addressed several of
those risks was to implement an automated monitoring system that could check the status of the
servers and communication functions periodically and alert the team to any failures.
Figure 5 illustrates an alternative template for your risk list. This format includes
essentially the same information that’s in Figure 4 but it is laid out in a way that is amenable to
storing in a spreadsheet or a table in a word-processing document. Storing the risks in a table or
spreadsheet facilitates sorting the risk list by descending risk exposure.
ID: <sequence number or a more meaningful label>
Description: <List each major risk facing the project. Describe each risk in the form
“condition-consequence.”>
Probability: <What’s the
likelihood of this risk
becoming a problem?>
Loss: <What’s the damage if
the risk does become a
problem?>
Exposure: <Multiply
Probability times Loss.>
First Indicator: <Describe the earliest indicator or trigger condition that might indicate that
the risk is turning into a problem.>
Mitigation Approaches: <State one or more actions to control, avoid, minimize, or otherwise
mitigate the risk.>
Owner: <Assign each risk mitigation action to
an individual for resolution.>
Date Due: <State a date by which the
mitigation approach is to be completed.>
324

Fig
ure
5: A
n a
lte
rn
ative
ris
k lis
t te
mp
la
te
.
ID
De
sc
rip
tio
nP
LE
Firs
t In
dica
to
r
Mitig
atio
n A
pp
ro
ach
O
wn
er
Date D
ue
<
Lis
t each m
ajo
r ris
k facin
g
the proje
ct. D
escrib
e each
ris
k in
the form
“conditio
n –
consequence”.
Exam
ple
:
“S
ubcontractor’s
staff does
not have suffic
ient technic
al
expertis
e, so their w
ork is
dela
yed for train
ing and
slo
wed by le
arnin
g curve.”>
P*
L #
E
$
<
For each ris
k,
describ
e the earliest
indic
ator or trig
ger
conditio
n that m
ight
indic
ate that the ris
k is
turnin
g in
to a
proble
m.>
<F
or each ris
k, state one or m
ore
approaches to avoid
, transfer,
control, m
inim
ize, or otherw
ise
mitig
ate the ris
k. A
cceptin
g the
ris
k is
another optio
n.
Ris
k m
itig
atio
n approaches
should
yie
ld dem
onstrable
results, so you can m
easure
whether the ris
k exposure is
changin
g.>
<A
ssig
n
each
ris
k
actio
n to
an in
di-
vid
ual.>
<S
tate a
date by
whic
h each
mitig
atio
n
actio
n is
to
be
com
ple
ted.
>
*P
=
P
ro
bab
ility o
f o
ccu
rre
nce
o
f the ris
k, e
xp
re
sse
d a
s a
n
um
be
r b
etw
ee
n 0.1
(h
ighly
unlikely
) and 1 (guaranteed
to
ha
ppe
n). A
lte
rn
ativ
ely
, yo
u co
uld
e
stim
ate
th
is a
s Low
, M
ed
ium
, o
r H
igh
.
#
L =
R
ela
tiv
e lo
ss if th
e ris
k d
oe
s tu
rn
in
to
a
p
rob
lem
, e
xp
re
sse
d a
s a
num
be
r b
etw
een 1 (m
inim
al im
pact) and 10
(ca
ta
stro
ph
e). A
lte
rn
ativ
ely
, yo
u co
uld
e
stim
ate
th
is a
s Lo
w, M
ed
ium
, o
r H
igh
. E
ven better, estim
ate the
actu
al lo
ss in
te
rm
s o
f ca
len
da
r w
ee
ks fo
r sche
du
le im
pa
ct, d
olla
rs fo
r a
co
st im
pact, etc.
$
E =
R
isk E
xp
osu
re
. If n
um
eric
valu
es w
ere a
ssig
ne
d to
P
ro
bab
ility a
nd
L
oss, th
en
R
isk E
xposure =
P
* L. If
re
lativ
e va
lue
s w
ere
u
se
d (L
ow
, M
ed
ium
, H
igh
), e
stim
ate
the
o
ve
ra
ll ris
k e
xp
osure usin
g the table
in
F
igure 3.
O
nce
th
e ris
k e
xp
osu
re
s a
re
ca
lcu
late
d fo
r ea
ch
ris
k ite
m, so
rt them
in
o
rd
er o
f decreasin
g ris
k exposure.
Fo
cu
s m
itig
atio
n effo
rts o
n item
s h
avin
g th
e h
igh
est ris
k e
xpo
su
re
.
325

Risk Tracking
As with other project management activities, you need to get into a rhythm of periodic
monitoring. You may wish to appoint a risk manager or “risk czar” for the project. The risk
manager is responsible for staying on top of the things that could go wrong, just as the project
manager is staying on top of the activities leading to project completion. One project team
dubbed their risk manager “Eeyore” after the Winnie-the-Pooh character who always bemoaned
how bad things could become. It’s a good idea to have someone other than the project manager
serve as the risk manager. The project manager is focused on what he has to do to make a project
succeed. The risk manager, in contrast, is identifying factors that might prevent the project from
succeeding. In other words, the risk manager is looking for the black cloud around the silver
lining that the project manager sees. Asking the same person to take these two opposing views of
the project can lead to cognitive dissonance; in an extreme case, his brain can explode!
Keep the top ten risks highly visible [McConnell 1996] and track the effectiveness of
your mitigation approaches regularly. As the initial list of top priority items gradually gets beaten
into submission, new risks might float up into the top ten. You can drop a risk off your radar
when you conclude that your mitigation approaches have reduced the risk exposure from that
item to an acceptable level.
A student in a seminar once asked me, “What should you do if you have the same top
five risks week after week?” A static risk list suggests that your risk mitigation actions aren’t
working. Effective mitigation actions should lower the risk exposure as the probability, the loss,
or both decrease over time. If your risk list isn’t changing, check to see whether the planned
mitigation actions have been carried out and whether they had the desired effect. Managers who
fail to fund and staff the planned mitigation actions may as well not bother to identify risks in the
first place.
Risk Management Can Be Your Friend
The skillful project manager will use risk management to raise awareness of conditions
that could cause the project to go down in flames. Consider a project that begins with a fuzzy
product vision and no customer involvement. The astute project manager will spot this situation
as posing potential risks and will document them in the risk list. Early in the project’s life, the
impact of this situation might not be too severe. However, if time passes and the lack of product
vision and customer involvement are not improved, the risk exposure will steadily rise.
TRAP: Assuming that a risk is controlled simply because the selected mitigation action has
been completed. Controlling a risk might require you to change the risk control strategy if
you conclude it is ineffective.
TRAP: Failing to look for new risks that might arise during the course of the project.
Conditions can change, assumptions can prove to be wrong, and other factors might lead to
risks that weren’t apparent or perhaps did not even exist at the beginning of the project.
326

By reviewing the risk list periodically, the project manager can adjust the estimated
probability and/or impact of these risks. The project manager can escalate risks that aren’t being
controlled to the attention of senior managers or other stakeholders. They can then either
stimulate corrective actions or else make a conscious business decision to proceed in spite of the
risks. In this way we’re keeping our eyes open and making informed decisions, even if we can’t
control every threat the project faces.
Learning from the Past
We can’t predict exactly which of the many threats to our projects might come to pass. However, most of us can do a better job of learning from previous experiences to avoid the same pain and suffering on future projects. As you begin to implement risk management approaches, record your actions and results for future reference. Try these suggestions:
• Record the results of even informal risk assessments, to capture the thinking of the project
participants.
• Document the mitigation strategies attempted for each risk you chose to confront, noting
which approaches worked well and which didn’t pay off.
• Conduct retrospectives to identify the unanticipated problems that arose. Should you have
been able to see them coming through better risk management, or would you likely have been
blindsided in any case? Could these same problems occur on other projects? If so, add them
to your growing checklist of potential risk factors for the next project to consider.
Anything you can do to improve your ability to avoid or minimize problems on future
projects will improve your company’s business success. Risk management can also reduce the
chaos, frustration, and constant fire-fighting that impair the quality of work life in so many
software organizations. The risks are out there. Find them before they find you.
References
Boehm, Barry W., ed. 1989. Software Risk Management. Washington, D.C.: IEEE Computer
Society Press.
Brown, Norm. 1996. “Industrial-Strength Management Strategies.” IEEE Software, 13(4): 94-
103.
Carr, Marvin J., et al. 1993. “Taxonomy-Based Risk Identification,” Technical Report
CMU/SEI-93-TR-6. Pittsburgh, Penn.: Software Engineering Institute.
DeMarco, Tom, and Timothy Lister. 2003. Waltzing with Bears: Managing Risk on Software
Projects. New York: Dorset House Publishing.
McConnell, Steve. 1996. Rapid Development: Taming Wild Software Schedules. Redmond,
Wash.: Microsoft Press.
327

328

Facilitating Effective Retrospectives
Debra Lavell
Intel Corporation
Abstract
Many software development teams are looking for ways to improve their current
processes. Process improvement efforts are always difficult, but additional challenges
such as geographically dispersed teams, cultural differences, and the lack of overlapping
work hours compound the problems. At Intel, few teams are located in the same state,
much less in the same building. We have teams spread out among 290 locations in
approximately 45 countries. The challenge: How do you facilitate an effective
retrospective in spite of all these challenges? This paper will share the key lessons
learned from delivering over 50 retrospectives at Intel Corporation.
Bio
Debra has over 10 years experience in quality engineering. She currently works as a
Capability Content Expert in the Corporate Platform Office at Intel Corporation. Since
January 2003, Debra has delivered over 80 Project and Milestone Retrospectives for Intel
worldwide. In the past 5 years, Debra designed and delivered “Facilitating Effective
Retrospectives” to over 50 teams to build a network of certified facilitators throughout
the organization. Prior to her work in quality, Debra spent 8 years managing an IT
department responsible for a 500+ node network for ADC Telecommunications. Debra is
a member of the Rose City Software Process Improvement Network Steering Committee.
For the past 6 years she has been responsible for securing the monthly speakers. She
currently is the President of the Pacific Northwest Software Quality Conference, Portland,
Oregon. She holds a Bachelor's of Arts degree in Management with an emphasis on
Industrial Relations.
To contact please email: [email protected]
329

Introduction
You have been asked to come into an organization to improve their software
development practices. This includes engaging with the software development teams
who are looking for help to improve their processes. Such process improvement efforts
are always a challenge, especially if you are tasked to look at all the activities to deliver
finished end-user software products, out-of-box solutions, or a combination of sub-
processes. The problems are compounded when dealing with geographically dispersed
teams, cultural differences and disparate time zones with few overlapping work hours.
At Intel, very few software teams are located in the same country, same state, much less
in the same building. We have teams spread out among approximately 290 locations in
approximately 45 countries. One way we have approached teams asking for help to
improve their software processes is to conduct a retrospective. A retrospective:
• Occurs during three strategic points across the software development lifecycle so
teams can apply lessons learned and continuously improve
• Is led by a trained, objective facilitator
• Follows a defined, objective process
• Focuses on the opportunity for the team to learn and improve in a constructive
way.
• Leads to actionable change for the processes guiding this and other development
teams (improved effectiveness and efficiency)
• Yields results via improvements implemented
The key question: How do you facilitate an effective retrospective in spite of all these
challenges? This paper shares the key lessons learned from delivering over 50
retrospectives at Intel Corporation over the past five years so you can begin facilitating
effective retrospectives in your organization.
When to get started
In the beginning stages of a process improvement initiative one of the best ways to get an
understanding of the current state, or the “As Is” model, is to conduct a mid-project
retrospective. Many times software teams are either approaching or have just passed a
milestone in their project. If possible, schedule the retrospective within two to six weeks
of a major deliverable. Schedule a short meeting with the software development team
lead, or software manager (sponsor) to educate them on the main benefits of conducting a
Retrospective. The key objectives are:
1. Structured methodology that objectively identifies key issues and root causes
2. Empowers the team to solve the problems and eventually observe actual results
from their efforts
3. Key issues are translated into specific Action Plans to rectify them
4. Lessons can be applied to the current project early enough to make an impact
right away.
330

Once the sponsor is in agreement on the objectives, spend a few minutes to educate them
on the process flow (Appendix A) and the process (Appendix B) you are going to follow.
Below is the four step process we have been using at Intel for the past five years:
Step 1: Set the Stage by putting together a plan
Step 2: Generate Insights and Discussions about what happened
Step 3: Decide how to improve the effectiveness of the team
Step 4: Close the Loop to ensure something changes
Let’s discuss each step in detail.
Step 1: Set the stage by putting together a plan
The most important step is the planning! There are so many things to discuss and decide
with the sponsor that it’s helpful to have a useful resource. Both Norm Kerth’s book,
Project Retrospectives: A Handbook for Team Reviews [NOR01] and Esther Derby and
Diana Larsen’s book Agile Retrospectives: Making Good Teams Great [DER02]
significantly influenced the methodology used at Intel.
As the facilitator of the meeting, you will want to discuss the following items in the
initial discussions with the sponsor to ensure you have planned effectively all the
logistics for the retrospective:
1. Identify the high-level process improvement sponsor and agree on the
objective of the meeting: To ensure you have support from the right people. It
is very important the sponsor understands why a Retrospective is important
and how you are going to use the data collected.
2. Interview the sponsor about the team. You will want to learn how mature the
team is, where is the team in the software development lifecycle, what issues
have been identified in previous process improvement efforts, and any other
information about the team dynamics.
3. Discuss the Retrospective process: Explain how you will set the stage, create
a survey (if needed), develop an agenda, and identify the appropriate activities
to draw out the story. Explain the objectives of the retrospective meeting and
the duration and timing.
4. Talk about what the sponsor expects as outcomes and deliverables from the
retrospective. The goal is at least one (recommended no more than five)
completed Action Plan (see Appendix C for a template and Appendix D for an
example) where the team documents what they want to do differently next
time in enough detail they can actually make behavior changes and
improvements.
331

5. Negotiate who will attend and on what date. If possible, piggyback on an
existing meeting. A typical Retrospective is four hours. If needed, the
meeting can be split into two, 2 hour meetings. As the facilitator of the
meeting, you want to find a date that the majority of the software team (core
members) will attend.
6. After the date has been set and the participants identified, agree on a location
for the meeting. The most effective Retrospective is a face-to-face meeting
with all the key participants. If possible, serve food, it always entices good
participation.
Step 2: Generate Insights and Discussions about what happened
With all the budget constraints a face-to-face meeting is usually very difficult and
sometimes impossible to arrange. Most software development teams at Intel are globally
dispersed spanning many time zones. Ask your sponsor if there is a kick-off meeting or a
quarterly extended team meeting where a retrospective can be scheduled. If planned
enough in advance, you can have participants stay an extra day to attend.
If people are in different locations and the meeting must be done virtually there are three
areas you want to concentrate on:
Gather participants into a few locations:
• Try to have as many participants congregate in as few locations as possible.
Reserve a conference room at strategic locations for participants to assemble,
equipped with collaboration devices such as an Infocus type projection system to
attach to a computer to display in the room. The objective is to create synergy
with those in each room and then use activities to cross-pollinate ideas to
collectively decide on a course of action.
• Designate a facilitator for each location, and poll locations regularly for questions
and input. Use online instant messaging (IM) or other ichat software to help
conduct real-time chat sessions.
Use technology to your advantage:
• Ensure all collaboration devices are in working order. Physically visit the
room to test out the devices, especially the speaker phone and the projection
system. You want to confirm any other room logistics, such as the presence of
flip charts or markers, well before the meeting date. Have any missing, broken
equipment repaired or replaced prior to the meeting.
• Become an expert with the collaboration software and hardware available to
you. Understand how to display collaborative presentations and practice using
whiteboard capabilities to display information in real time between a whiteboard
and remote PCs. Take a look at the 3M Digital Wall Display Plus Series. It is a
dry-erase whiteboard with a computer projection screen for document or
332

presentation displays.
(www.solutions.3m.com/wps/portal/3M/en_US/Meetings/Home)
• Learn how to use the speaker phone. There are many PC-based client-server
software solutions that can effectively handle voice conferencing as well as video
and slide sharing so you don’t have to use a separate audio conferencing bridge
service. AT&T has a range of conferencing services. Another resource is
Spiderphone (www.spiderphone.com) it is a web-based audio-conferencing
service which allows up to 60 participants on a conference call with full access to
their browsers.
• Use services such as streaming video over the Internet to participate in real time
in various locations. Kinkos has video-conferencing services at more than 150
locations worldwide. Caution, this can be very expensive!
• Check out web-based project collaboration software for distributed teams. One
popular tool is Basecamp. (www.basecamphq.com) Net Meeting, a Microsoft
web-based tool, is used widely at Intel to quickly show slides, capture ideas and
comments in real time, and generally to ensure our meetings are effective.
(www.microsoft.com/windows/netmeeting). Live Meeting, (formerly known as
Place Ware) is more interactive, allowing you to present to remote locations.
Intel has piloted Live Meeting (www.microsoft.com/uc/livemeeting/default.mspx)
and it is becoming the Intel standard. A free application-sharing and on-line
meeting tool is WebEx (www.webex.com). These tools enable you to collaborate
on-line, real-time with just a PC and an Internet connection. These types of web-
based tools are excellent for retrospective meetings because many are very cost
effective.
• Web sites are also an important part of an effective retrospective. A Wiki is a
special type of web site that makes it easy for anyone to post material or edit
existing material. (www.wiki.org) At Intel we use both Wikis and Twikis
(www.twiki.org) to encourage and simplify information exchange and
collaboration among teams.
Select activities to increase participation:
The logistics of meeting, effectively reviewing the project, and managing the
retrospective are even more challenging when the team is virtual. One suggestion – keep
the participants engaged! If you don’t, they may be distracted by arriving email,
incoming phone calls, and co-workers who walk by and want to interrupt.
• Use breakout sessions to increase participation, gather inputs and allow increased
individual participation. Be creative and inventive to make virtual meetings more
enjoyable. A German based company, Ambiente has an innovative product based
on the concept of Computer-Supported Cooperative Work (CSCW). Ambiente
has a desktop-based and meeting-room based collaboration tools called “Room
Ware” which includes the “ConnecTable”. It is a desk with a pen-writeable
display. When two desks are placed next to each other, the display surfaces
become one large work area where virtual teammates can collaborate efficiently.
(www.ipsi.fraunhofer.de/ambiente/english/index.html)
333

• Employ interviewing, polling, and voting to speed data gathering and limit
unstructured discussions. TeamBoard (www.teamboard.com) is an amazing tool.
It is an electronic white board that quickly captures notes and any free hand
drawings electronically. The interactive screen turns “your finger into a mouse”!
Step 3: Decide how to improve the effectiveness of the team
Either in person or virtually, the key to an effective retrospective is to use all the
collaboration tools available to you! As discussed earlier, the goal of the Retrospective is
to uncover opportunities for the team to improve. The focus is on learning, not finger
pointing or blaming. In the meeting, you want to use activities to elicit from the team a
list of possible improvement areas. Below are three effective strategies to help uncover
areas for improvement:
1. Conduct a survey: One of the most effective tools to uncover areas for
improvement is a survey. Many times team members don’t feel comfortable
“disclosing their dirty laundry” in a public forum. Surveys are useful to get input
from all of the team members, including those not invited to the retrospective
meeting. If possible, send the survey out two weeks prior to the meeting using a
web-based survey tool. If you don’t have access to an internal survey tool, a good
external resource is Survey Monkey (www.surveymonkey.com) the cost is less
than $20 a month with unlimited number of pages and questions. Whatever
survey tool you use, make sure the participant’s feedback is anonymous. Many
times there are cultural issues that can be overcome using a questionnaire or
survey. English as a second language can inhibit participation when participants
speaking skills are less advanced than their writing skills. Sharing their
perspective in writing allows them to “speak” more freely and sometimes more
verbose!
2. Spend time interviewing key participants: Prior to the retrospective, schedule 30
minute “interview” to ask the key members:
a. What went well? What would you recommend we repeat?
b. What did you learn?
c. What do you recommend we do differently next time?
d. What still puzzles you?
e. What “hot topics” do you think we need to discuss later in more detail?
Use the interview to help discover sensitive areas that may need to be
discussed during the retrospective. As part of the interview, draw out what is
the number one item that MUST be discussed to make the retrospective
valuable to them.
3. Create a “virtual timeline”: Prior to the retrospective ask the participants to
respond to these questions:
a. What was fun or made you laugh?
b. What was frustrating?
c. What was challenging?
334

d. What was a shock?
e. What was satisfying or rewarding?
From the feedback create “virtual stickies” using a different color for each
category. Place the comments into a Power Point presentation and ask the team to
help identify when that significant event took occurred and then place it
appropriately on the timeline. Spend time reviewing the comments, this will help
to ensure they are actively engaged. Ask the team what color seems to dominate.
Pull out discussion around what patterns or themes jump out at them. (See
Appendix E for an example of a virtual timeline).
From these discussions, guide the team into the next phase by narrowing down the topics
discussed to the most important 3-5 areas for improvement. Voting is very effective.
Use IM or email to have the team members quickly vote on their top three items.
Weighting the votes helps the cream rise to the top. Their top vote is given 5 points, their
second 3 points, and their last vote only 1 point.
Once the top three to five issues are collectively identified, lead the team into creating an
effective action plan for each. One effective way to assign who will work on what is to
ask: Who in this group has passion around one of these topics and is willing to lead a
discussion around how we are going to fix it? Then pause, someone will likely volunteer.
Then ask: Who would like to partner with (volunteer name goes here) to brainstorm a
solution to this problem? Ask those who volunteered to go offline (either call one
another on a different phone line or move closer together in the room) to spend time
talking about and documenting an action plan:
• What is the problem and how did it impact the project? Ask the team questions
such as: How did this problem affect work on this software project? Was cost,
schedule, quality, productivity, or morale affected ?
• What is your recommended solution? What are some of the advantages and
disadvantages to implementing your solution?
• What is the impact of solving this problem? If we solve this problem, will it save
time or money? Will it increase effectiveness, productivity, or morale?
• What obstacles could get in the way of implementation? Who needs to support
this recommendation? Are there approval processes we need to follow?
• What are the next steps? Who will be the owner and can we establish due dates
for the next steps?
Each breakout team is responsible for producing their Action Plan with all these items,
reference Appendix C for the template and Appendix D for an example. Keeping the
team focused on producing a complete plan will help them ensure something will actually
change once the meeting is over.
335

Step 4: Close the Loop to ensure something changes
As part of the process improvement effort, the facilitator of the retrospective will mentor
and coach the software development team to close and implement their action plans.
Following up with the team two weeks, three months, and one year after the retrospective
will help guarantee change really happens.
Here are the five questions you want answered by the team when you check back with
them:
1. What software process improvements were implemented from the Retrospective
action plans?
2. What was the impact?
3. What action plans were abandoned? Once the team got back to reality, what
didn’t make sense to follow through with?
4. What action plans were handed off to another team? After the management report,
what plans were combined with another already formed effort?
5. What process improvement efforts are still ramping up?
If there are any “Key Learnings” gleaned from the team, it is helpful to share those with
other software organizations so they too can benefit from the lessons learned. If possible,
encourage the sponsor to communicate the retrospective outcomes upward to their
management to increase the visibility of the process improvement efforts. It is important
to gain support from the right level of management to really see forward progress.
Don’t forget to ask the sponsor when you can facilitate another Retrospective! Suggest a
good intercept point near the next major milestone or deliverable. Probe to see if there
are additional lessons to be applied to the current project or to be passed on to teams just
starting.
Are you cut out to be a Facilitator?
Facilitating an effective Retrospective takes a special talent and a specific skill set. Many
seasoned facilitators find they don’t have all the necessary skills to be effective. Review
the following list, do you have these facilitation skills?
• People skills:
• Do you have the ability to draw people out to participate and share their
perspectives?
• Can you deal with difficult people? Especially in a virtual Retrospective,
some participants feel they can be hard to work with since you can’t see
them!
• Is influencing change something you like doing?
• Managing conflict:
336

• Do you understand different cultures and the impact of demographics in a
team?
• Can you effectively read non-verbal messages?
• Identifying the right process and exercises:
• Can you quickly adjust the process as necessary?
• Is it difficult for you to identify exercises to draw out root cause for
complex projects?
• Do you have experience running virtual meetings? What length, 2 hours?
4 hours? 6+ hours?
If you are not the right person to facilitate the Retrospective, partner or enlist someone
who does. The level of success of the process improvement efforts directly relates to the
effectiveness of the facilitator.
Once you have the right facilitator, the role includes managing all the following
activities in combination with the sponsor:
• Define the objectives of the Retrospective
• Identify the Retrospective attendees
• Create a Retrospective survey (optional)
• Gather and analyze the survey data for themes
• Design and deliver an effective Retrospective meeting (face-to-face or
virtual) with action plans to improve the issues identified
• Participate in management report out
• Share good practices across the organization
Conclusion
One effective method to help software development teams improve their software
development practices is to conduct a retrospective to help uncover ways to increase the
effectiveness of the team by:
• Sharing perspectives to understand what worked well in the project so we can
reinforce it
• Identifying opportunities for improvement and lessons learned so they can
improve the current and subsequent projects
• Making specific recommendations for changes
• Discussing what the team wants to do differently
• Helping the team see ways to work together more efficiently
By engaging with software development teams who are hungry for help to improve their
processes, we can help them find ways to work for effectively. Globally dispersed teams
are becoming more common. When the teams span several time zones and encompass
many cultures, conducting a successful retrospective is very challenging.
At Intel, most software teams are located in different countries and in different states. By
using all the technology and resources available to us, we have been able to effectively
337

draw out from the teams what is working well, what needs to be done differently next
time, what we learned, and what still puzzles us. Armed with this information we have
been able to develop action plans to improve and change the way software is developed
at Intel.
References
[NOR01] Kerth, Norman L., 2001. Project Retrospectives: A Handbook for Team
Reviews. New York: Dorset House Publishing Company, Incorporated.
[DER02] Derby, Esther and Larsen, Diana, 2006. Agile Retrospectives: Making Good
Teams Great. Pragmatic Bookshelf.
Online Retrospective Facilitator Group: [email protected]
Summary Web URLs:
3M: www.solutions.3m.com/wps/portal/3M/en_US/Meetings/Home
Ambiente: www.ipsi.fraunhofer.de/ambiente/english/index.html
Basecamp: www.basecamphq.com
Microsoft Live Meeting: www.microsoft.com/uc/livemeeting/default.mspx
Microsoft Net Meeting: www.microsoft.com/windows/netmeeting
WebEx: www.webex.com
Spiderphone: www.spiderphone.com
SurveyMonkey: www.surveymonkey.com
TeamBoard: www.teamboard.com
Twiki: www.twiki.org
Wiki: www.wiki.org
338

Appendix A – Typical process flow
24
Copyright © 2007 Intel Corporation. No part of this presentation
may be copied without the written permission of Intel Corporation.
Typical Retrospective Process flow
Milestone
Survey
Setup Survey
Criteria
Create survey
Set the
stage
and
generate
insights
Decide what
to do
Close the
loop
Decide what
to do
Create
management
report out
No
Yes
Review action plans Senior Management
and Directors
Set agenda
Virtual
meeting
Share
Survey
Results
Determine if
F2F or
Virtual
meeting
Action
Plans
Yes
No Done
Yes
Yes
Yes
Conduct
Survey &
prepare
analysis
Close the
loop
F2F
No
Yes
339

Appendix B – Four step process adapted from Agile Retrospectives: Making Good
Teams Great [DER02]
12
Copyright © 2007 Intel Corporation. No part of this presentation
may be copied without the written permission of Intel Corporation.
Retrospective Process:
1. Set the stage
• Collect important
data for the team
to discuss
4. Close the Loop
• Implement Action
Plans
• Document BKMs
• Apply changes in
current (if applicable)
& future programs
• Communicate
outcomes to
Management
2. Generate insights
• Opportunity to “inspect and
adapt”
• “Harvest” the data using 5
Key Questions
• Identify Action Plans
3. Decide what to do
• Create Action Plans with
owners and due dates
Defined Retrospective Methodology
340

Appendix C
Action Plan Template
Submitted by: _______________________________________ Date: ____________
• Problem description and impact
– How did this effect work on this project? Cost, schedule, quality,
productivity, morale?
• Recommended solution
– Advantages/Disadvantages
• Impact
– Will solving this problem save time or money?
– Will solving this problem increase effectiveness, productivity, or morale?
• Obstacles
– Who or what could get in the way of implementing?
• Support
– Who needs to support this recommendation?
• Next Steps
(Proposed) Owner: _______________________________________
Next follow-up Due date: _________________________
341

Appendix D – Example of a completed Action Plan
Action Plan #1 - Prototyping
Submitted by: Nghia Noaw, Karl Rain, and Kevin Smith Date: 4-21-07
Problem description and impact
Lack of early prototyping and analysis leads to:
1. Cannot show how the design will function
2. Added risk and burden on the system integrator due to unproven design
3. Lack of analysis to mitigate risk given that there are no prototypes
4. Iterative process of changing the spec based on only recommendations and not
data driven
How did this effect work on this project?
– Engaged late in the process – Nghia didn’t see the impact
– From feedback from our partners, there were concerns with reliability and
confidence the spec would work. Also affected the SW Quality and
productivity (time). Several builds which elongated the process.
– Concurrent engineering, trying to get ahead of development. Driving the
spec with development already in process. Used some drawings etc. to
help drive the subsequent specs. This helped but did not have this
resource for our project.
– The software specification is based off the design from Franko, we did not
get funding for prototyping until the spec was complete.
Recommended solution – Do prototyping early and often during the development of
the software requirements specification (SRS).
– Advantages
• Complete return on investment for selected prototyping
• Mitigate risks
• Identify resources available and synch with the spec
delivery
• Get commitment from our team members to invest in resources to
designing and prototyping in their field of expertise
• Identify opportunities for analysis over prototyping
• Data share
• Give some insights into feasibility of requirements
• Customer preferences
– Disadvantages
• Prototyping cost big $$$!
• Early prototype may not be representative of the production
sample
342

• Who wants to commit resources to prototyping without a return on
investment?
Impact
• Positive
• Risk mitigation
• Creative design
• Ensures form/fit/function
• Facilitates much better internal and external customer
feedback
• Negative
• More time
• More money
• More resources
• IP implication
– Will solving this problem save time or money? Yes
– Will solving this problem increase effectiveness, productivity, or morale?
Yes
Obstacles
– Who or what could get in the way of implementing?
• Budget
• Business strategy and time to market
Support
– Who needs to support this recommendation?
• Our partners
• Other business units we are dependent on for information
• Customers for implementation specific prototypes
• Marketing
• Directors
Next Steps
– Formal milestone for the feedback on the prototypes – as long as you get
commitment from those building it.
– Need to have a working prototype early (prior to the spec being baselined)
to drive the delivery of the spec.
– Are we willing to give up some of the control of the schedule for
prototyping?
– Drive prototyping into the deliverables and project criteria – is there a
logical intersection point?
– Intel business units need to buy-into prototyping – are we meeting the
customer needs.
Owner: Jim Kennedy First volunteer to work on this with Jim: Nghia (thanks)
Next follow-up Due date: May 2, 2007 at the next SW Planning sub-team meeting
343

Appendix E – Example virtual TimeLine
6 Intel Confidential
Time
☺
�
�
Training
Shrimp Scampi Project Timeline
Readiness Review On-site Period
Identify 1-2 comments for each of the below categories
• What was Fun/made you laugh?
• What was a challenge?
• What was frustrating?
• What was a shock
• What was satisfying/rewarding
Comment Comment
Comment Comment
Comment Comment
Comment Comment
Comment Comment
Team
Dinner
Amount of time for
activities seemed short
(Final findings
presentation)
Maintain
energy/exciteme
nt level difficult
SB: Team co-
location worked
well.
SB: Interviewees
FTF was postitive
Teams
presentation may
be hiding real
opportunity
SA/B: single
examples may mislead
actual competency
Didn’t have access to
reviews – ran by
someone else,
needless restrictions
Management said they didn’t
get enough recommendations
Informing
Management on
CMMI
intent/scope
SA/B: meeting efficiency
could be improved. AR’s
not always captured.
Bridge issues, livemeeting
issues, conf. booking
Ground Rules,
protocols not
established prior to
On-site period
Didn’t have scripts for
different types of meetings
SA: Agenda said
start at 8…but
meeting agenda
didn’t start until
8:30. Regular
Breaks.
Interviews tend to be
leading in the
questions..give them
answers. Questions
weren’t always clear
on intent.
Inconsistent level of
details between
teams…direct vs.
indirect evidence.
Enjoyed working
with the Team on
CMMI…mature/exp
erienced.
Spent a lot of time
wordsmithing, but
didn’t ask the
question as writtent
(intent missed)
Not all participants
knew why they were
present…what to
expect
Didn’t maintain source
data traceability
…hurt in the
interviews
SB: didn’t consider
order in which we
addressed the process
areas…jumped around
Didn’t know what
the product, Life
cycle, customer,
content was all
about…made asking
questions difficult
Training didn’t fully
explain criteria of
what is needed to
pass/fail
Sub-practices
importance
downplayed, but
actually important
SA/B: appraisal
observation when
not part of the team
helped with
objectivity, outside
perspective
Sticking to notes vs.
scheduling follow-up
sessions made in
frustrating. Made
assumptions
SEI: Didn’t
understand their
ground-rules.
SEI: Practical
application of the
methodology/proces
s was good
SCAMPI
banana
was fun
Hanging out with the
team was fun. Allowing
everyone to get lunch
344

Mapping for Quality – Past, Present, and Future
Celeste Yeakley
Education Finance Partners
and
Jeffrey Fiebrich
Freescale Semiconductors, Inc.
Abstract
Sometimes, as software professionals, we get so wrapped up in processes and templates that we
forget we are human beings. Human beings (as opposed to human doings) do not think in
straight lines. In other words, few of us can just jump into the flow of a software process without
being affected by things that influence us in our daily work.
Moreover, humans have always and will always tend to live in communities. To dismiss the
human element of good software quality processes is to dismiss the richness that can be gained
from different perspectives of quality. The next 25 years of software quality evolution depends
on our ability to create and understand the map of the software community where people work.
These maps will be very different for each company – and even for different groups within a
company. Understanding your own maps will be essential for building a better future to
explosive improvements in quality within your organization for years to come.
To start the process, we will demonstrate that how you perceive your software world affects how
you view quality and the processes that support quality. This may seem a difficult, if not
impossible task. The difficulty of creating a map is, in itself, a revealing element of the mapping
exercise. This session will demonstrate how to create your map and how you can work to
improve the processes that influence it.
An interactive session will be included in this presentation and the group will compare their
maps and discuss some elements of what we call “Process Intelligence”. Understanding how
communities need to come together to create a world view that effectively integrates the people
and processes while delivering quality products will determine how well the software industry
will deliver products in the next 25 years.
345

Biographies
Celeste Yeakley is an organizational leader with more than twenty years of experience in
software/systems engineering and process improvement. She is a broad-based team lead and
participant, with proven skills that focus teams by applying creative and innovative business
planning processes. She’s accomplished in business strategy, business planning, team/project
management (certificate in Software Project Management), software capability enhancements,
and organizational leadership. As an internal assessor, she either participated or led software
process evaluations for organizations in the United States, Brazil and Russia. A University of
Texas at Austin graduate with a Master’s degree in Science & Technology Commercialization,
Celeste has collaborated at small start up companies as well as large corporate giants such as
Dell and Motorola. She has contributed to her profession by serving on the UT Software Quality
Institute board from 1993-2003 as well as in community quality assessments. Her passion is for
helping people understand how to work together using established frameworks like CMMI and
ISO to their best advantage. She encourages lateral thinking and uses every day examples to
drive people to understand the big picture and how it fits into their software worlds.
Jeff Fiebrich is a Software Quality Manager for Freescale Semiconductor Inc. He is a member
of the American Society for Quality (ASQ) and has received ASQ certification in Quality
Auditing and Software Quality Engineering. He has also achieved CMMI-Dev Intermediate
certification. He has previously worked as a Quality Manager for Tracor Aerospace in the
Countermeasures Division. A graduate of Texas State University with a degree in Computer
Science and Mathematics, he served on the University of Texas, Software Quality Institute
subcommittee in 2003 - 2004. He has addressed national and international audiences on topics
from software development to process modeling. Jeff has over twenty years of Quality
experience as an engineer, project manager, software process improvement leader, and
consultant. As both an internal and external consultant, he has played significant roles in helping
organizations achieve ISO certification and Software Engineering Institute (SEI) Maturity
Levels. He has led numerous process improvement initiatives in many areas of software
engineering including project management, employee empowerment, software product
engineering, quantitative management, training program management, and group problem
solving. Jeff has worked extensively on efforts in the United States, Israel, Romania, France,
India, and China.
Celeste and Jeff are the authors of the recently released book, ‘Collaborative Process
Improvement’, Wiley-IEEE Press, 2007.
346

Introduction
In the high tech world of software, it is sometimes tempting to look at the technology of
our products while eschewing the people and processes that help to create them. Somewhere
during college when we all started learning how to be scientists and engineers, we forgot we all
belong to a single race – the human race. Maybe it isn’t that way in your organization, but
oftentimes very talented (and logical) people get lost in the great technology aspects of work and
begin to make assumptions that may or may not be correct. In the process of building great
software products, we can get myopic, focusing on what we think we know and not
understanding how all the pieces fit together to make a product that people want to sing about..
Disorganization is sometimes frowned upon and collaboration, though necessary, can be seen as
a necessary evil – one that some of us would rather do without.. What really matters is if
organization or disorganization works for your organization. Can your workers collaborate
effectively in the context of their work environment or is there something holding them back?
What assumptions do you make about your immediate work group and the work groups around
you? You can’t know everything about every functional group’s inner workings and because of
this, a chasm in understanding can lead to mis-steps. The problem is that our distance from each
other can cripple our ability to create a world-class product that not only serves the needs of our
business but ultimately delivers a quality product to our customers.
In many sessions with leaders of organizations, we have found that people make
assumptions; assumptions about each other, about how work gets done and about how people
think. Often, when you gather a group together, you can ask about these assumptions if you
know where to probe. The problem is that you don’t know what assumptions to challenge
because you are all making them based on your backgrounds and frame of reference. By working
with maps and using them as discussion builders, you can expose assumptions. It doesn’t take a
particularly skilled facilitator to do this – but in some larger groups or more reserved groups, it
would help to have someone who can direct a discussion.
Using maps helps to uncover assumptions people are making about how “the world
turns” in an organization. Mapping forces a relative representation of the work that is going on in
an organization. For example, if you are far removed from corporate initiatives or if the
corporate initiatives are unknown or not well understood, they are not likely to show up as a
driving force in your map. If corporate initiatives don’t play a big role in your organization, then
they will not show up on the map. If you’ve been assuming that your communication campaign
to drill the initiatives into the organization has been successful, wouldn’t you be disappointed to
see them absent from work maps? What would you do if you saw those initiatives represented on
maps at some levels of the organization and absent on others?
Elements of the Community
Sometimes, the organization appears to us as not making sense. “Its too bureaucratic!”,
“This is the way we always do things here”, and a sense of fatalistic resignation ensue. Then, it
seems, there is no point in trying to do anything different because the culture of our company is
thus-and-so. By opening our eyes to the full picture, or map of our organization, we can break
through the blindness of our own limited viewpoints and open up the possibilities that we can use
technology along with people and processes to deliver on a promise; a promise of an outstanding
product that meets or exceeds customer expectations for perceived quality.
347

Think for a little while about your own organization. How does development and test
collaborate? Does each live in its own silo of operations? Do you really understand what goes on
in each other’s worlds, or do you just assume it is an “us vs. them” society that you live in and
have to deal with? If you are fortunate enough to understand how development and test work
together, and then do you also understand what your overall business value is? Do you
understand how the finance department can influence what you do? Do you know how the
organization as a whole operates and benefits from each other? Do you see your team of project
managers as friends or foes? Do you understand how you use your technology inside of your
overall process and community? Do you understand all the players in your community?
The answers to these questions can help you and your organization achieve greatness.
Most people want to work on a winning team. It makes us competitive, and that sense of
competition makes us great. Sometimes it even makes us competitive with the wrong people.
Sometimes, it can be hard to separate the competition from the true goal of delivering on a
promise. In software, you can think of the promise as a set of requirements. Once the
requirements are accepted, the organization promises to deliver. Every step reflects the people,
processes and technology it takes to deliver. Yet sometimes we all get busy with the easy parts of
working in our silos and forget the big picture of how to work in community with one another.
We put our heads down and drive to a delivery date and leave the community in the cold –
waiting for that all-important promise to be delivered without understanding how it all works
together.
We like to use Ptolemy’s historic maps as an example of how the world view of any
community can be distorted. Ptolemy was a Greco-Roman scholar based in Alexandria who
around 150 C.E. created an atlas of the known world. This map became the dominant influence
for about 1300 years and many other maps were based upon the drawings of Ptolemy. Like the
rest of us, Ptolemy created a world view that was distorted. Things that he knew well were much
larger and more detailed than things he had little knowledge of. We are all made of the same
stuff that Ptolemy was made of – a flawed perspective. Of course, Ptolemy didn’t have satellite
images to refer to, or elegant and sophisticated mariner tools. The technology he was working
with was not conducive to highly accurate map making. He had limited people to consult with on
the topic and we can only conjecture about his processes. I wonder if he had been able to
interview people from each native land if his map would have been more accurate. If he had
been able to get enough people together who could draw very accurate maps of their known
areas, just like he was able to with his map of the Mediterranean, then they could all have
discussed their individual maps and brought them all into perspective by agreeing that the world,
indeed, was represented by a new map. A map might have been created that considered all
communities by talking to the people who lived in them. That wasn’t possible in his time
because not all the lands were occupied by enough people who could communicate. I would like
to think that today you can create a company map that represents the whole of what and who you
are.
You might say that you have organizational charts that map out who reports to who – so
of course, you have a world view. Yet, as humans we do not always think in straight lines. Many
of us categorize our thoughts. We group things that we don’t know much about into a “test” or
“development” or “quality” cluster, categorize them off into areas we don’t need to worry about
348

and then go about what is urgently pressing for our attention. We forget about all those other
clusters of things going on. Yet, all those other things can affect the way we work. Few of us can
just jump into the flow of a software process without being affected by things that influence us in
our daily work.
While we work in a total community, we somehow divorce ourselves from the
community we work in. We politely nod as we pass by the other functions, but tend to stay in our
own worlds when it comes to project work. Just like Ptolemy, if we had the big picture, we might
be able to represent our world more completely. Our work community, if modeled, would tell us
a lot about how our organizations work and could engage the whole picture in solving problems
at hand. In order to fulfill the promise of our requirements, we need to engage the organization at
a level that causes us to understand the true meaning of software. The future of software quality
depends on creating and understanding the map of the software community that people work in.
Our maps will be very different for each company – and even for different groups within a
company. Understanding your own maps will be a key that can open the door to explosive
improvements in quality throughout your organization. By uncovering your unique barriers to
successful collaboration, you can begin to improve your work and products so you can move
from good to great.
Piecing the Community Together
Hidden barriers to success and sustainability of continuous improvement programs exist
in almost all organizations. Such barriers often transcend typical continuous improvement
tactics applied to produce culture change. Cultural conditions that create obstacles to
improvement are not always obvious, but their symptoms are easily recognizable:
• Organizational silos that are tolerated or accepted by management.
• Processes delayed by months or years due to rework.
• Personality conflicts that interfere with efficient communication or process
management.
• Start-up dates for new equipment or operations that are pushed months past initial
estimates because no one seems to understand the master plan.
These symptoms and their associated hidden barriers still can exist after a continuous
improvement implementation if the company depends only on charts, graphs and process flows
to deliver improvement and culture change. This is because charts, graphs and process flows do
not directly address the people side of improvement. Mapping, on the other hand, does address
the people side of improvement. It breaks down silos in an organization, improves
communication and reduces rework that occurs when multiple departments execute a process. It
involves educating the users about what your process requires and where value is being lost.
Users then can see how they can add value, anticipate your needs and suggest changes to
help all parties meet their requirement. Mapping enables process owners and customers to think
as one mind about maximizing the performance of jointly owned processes. When employees
are trained in the mapping approach, they tend to incorporate process thinking into everything
they do. That’s when an organization’s culture moves toward self actualization on a grand scale.
Counter to this, many organizations hand out organizational charts to all employees, with boxes
drawn around areas of responsibility. These tend to encourage the formation of organizational
349

silos. The box for each individual defines his or her role but often does not include touchpoints
with other departments, which are assumed to be co-owned by department managers. In reality,
there often is no joint accountability, so managers don’t make the touchpoints a priority. This is
especially true for the suppliers, or contributors, of a process. As a result, broken touchpoint
processes become area of contention between departments and might go unresolved, even during
a process improvement initiative.
Your community
We’ve discussed the reasons to create an organizational world view using mapping and
now it is time to walk through the exercise of building your own maps. This exercise can be done
in small groups or large and is quite simple but extremely revealing. It can help you and your
organization visualize where touch point gaps exist and how you might begin to address them.
The first step in creating a map is to decide who you will ask to build maps. It could be a
workgroup, or a cross functional group, a management group or any combination of stakeholders
that makes sense.
The table below illustrates some groups and recommended usages:
Group type Possible uses
Executive Management Insight into perceived work flows
Communication to the organization
Alignment check between management
members
Workgroup Uncover problems within working groups
Revealing how workgroup perceives
management and other groups
Cross functional teams Reveal how functions perceive each other
Spur discussion on influences of each group on
each other
Project teams Reveal communication problems within the
team
Expose fuzzy communication paths between
your group and others
Direct reports Understand how team members communicate
Understand how people interact with each
other
Customer groups Determine the perception of what quality is to
them. Ask them to draw your product or
service in relationship to their needs.
The next step is to gather the group and lay out the rules of building a map. Like
traditional mind mapping, each person should have a blank piece of paper – no lines, no
markings. From this blank slate each person should think about all the components that affect
their daily work. Unlike traditional mind mapping, the main topic needn’t be in the middle of
the page. In fact, the individuals doing the exercise should think about what is at the center of
their respective worlds. For some organizations, the perception may be that marketing runs the
350

organization and that their part is merely an extension of the marketing program. For others, the
CEO may be seen as the center of the universe. The important part is to spend time thinking
about how all the parts fit together and then trying to represent that on paper. Not everyone is
artistically inclined so the map may not need to be graphical in nature. It can be as simple as a
collection of words and arrows or as complex as pictures that are symbolic and elegant. Style
should not be a consideration when looking at maps – the important things to note are the
symbolism and the amount of detail in each segment.
Here is a summary of the mapping guidelines:
• Start with a blank piece of paper in landscape mode
• Think about all the areas of work that affect you and try to visualize how they
work together
• Begin to represent how work gets done using whatever means you can.
• Do not use strictly words to describe your work – try to represent your work as a
flow, a collection of pictures or symbols along with words, arrows, etc. Do
whatever it takes to describe what the world looks like to you.
• The facilitator of the session should demonstrate the idea by discussing a map
covering a different topic, like their home life or some aspect of life away from
work, like life as a baseball coach, etc. Try to use non- work examples.
• Provide different sorts of media – colored pens, rulers, markers, stars, etc. for
individuals to express themselves.
• Announce the amount of time you are devoting to the exercise, typically 10 to 15
minutes.
• Allow the individuals to create their maps.
• Once the maps are created, discuss them within your group. Note any symbolism
present and have an open discussion on what you see.
• Discuss what information you can take from the session. Note particularly: things
that look similar across maps, things that look like opportunities for improvement,
things that appear to be strengths, etc.
The next few figures will expose a few assumptions that you can use to fuel discussions and pave
the way for a better understanding of how individual groups perceive each other.
351

Figure 1. Development-Centric work map
Figure 2. QA-Centric work map
352

Figure 3 Highly Structured/Organized work map
Figure 4 “One-Body” work map
Figure 1 depicts a lot of pressure on the Development group. They are not closely
managed and get “hammered on” by quality to deliver. Their products are raindrops that fall on
353

top of customers. Executive management is either happy all the time or provides sun that dries
up the cloud of development. The project management team seems to be examining the
development team and that doesn’t look like much value-add to the group. The idea here is to
have fun with this exercise and get into rich discussions of why things look the way they do.
Figure 2 shows the QA group holding up development and saving the day. Project
management is shown as bean counters and producers of paperwork and the executive team is
totally missing from this world view. Development could either be interpreted as a black box or a
coffin (scary), but either way, QA is the only “human” in the picture (albeit a funny-looking
human).
Figure 3 is interesting also in that it looks very organized with people fitting into a big
cascade. IT infrastructure forms the base of this pyramid and would lead you to think that IT runs
the company. At least the executives are represented as feeding the company goals to work by. It
looks like a very organized and structured place to work with lots of tasks for the developers and
support people. IT is also engaged at the project level and test follows development – notice that
their name is in all caps.
Figure 4 is actually a pretty encouraging work map. At least the components are all
together in “one body” and working together. Most of the teams are represented. This map came
from a financial services company therefore credit is represented as being the feet of the
company and finance as the hands. IT is shown as the spine and nerves and Program
Management the veins and arteries. Sales is represented as the eyes of this working group that
implies they are watching the customer. The product group thinks about what the eyes see and
figures out what the body is to do.
I have not included a map that I have seen more than I’d like to. It is the “spaghetti” map.
Everything is just a scribble and group names are just thrown in wherever without regard for any
organization at all. This should be an indicator to you that either: the organization is perceived as
being very disconnected and unorganized or the person just hates the exercise and doesn’t even
want to try to depict a work map.
If you brought together the people who drew maps 1 and 2, you’d probably get a more
balanced picture of how things should work. At the least, you could have a reasonable discussion
about why the development team in Figure 2 feels they are being hammered by the QA team. If
you then brought in the Figure 3 authors and asked them how their picture fit into yours, you
might find out where goals should fit into the big picture.
By bringing together the people who have conflicting work maps, you can begin the
discussions around erroneous perceptions of your organization. In the examples above, with the
exception of perhaps Figure 3, that corporate initiative message (that we talked about being
communicated in the introduction to this paper) didn’t make it down to the troops.
Building the Product
How are individual employees and departments affected by mapping? It helps
department and manger proactively choose to co-own problems. It facilitates interdepartmental
354

communication required for improvement because it calls for face-to-face contact. Sending e-
mails and handing out manuals are ineffective methods of communicating process changes when
more than one department is involved. Unfortunately, these methods of communicating changes
are chosen because they are quick, easy and allow the process owner to avoid unwanted
confrontation. Such impersonal ways of communication prevent the culture change that is
supposed to result from process improvement.
Lack of employee commitment to change is the ultimate deal breaker for continuous
improvement. People must believe a new way of doing things really will be better for them
before they choose to make a permanent commitment to change. Mapping helps employees
make this choice by showing them how they personally affect the rest of the organization and the
value they create when they perform according to what their customer needs, not what they want
to deliver or have always delivered.
The exercise in itself will spur conversation about what is important to the organization
as a whole and how everyone involved can serve the customer better. That service to the
customer may or may not be to bring the best quality to the product. Remember that quality has
different aspects that don’t just include the technical quality. This is another mapping exercise!
What are the elements of quality as seen by your customer?
Quality could mean bringing the most innovative product to market before anyone else
(e.g. bringing portable memory chips out or high definition television). Or it could mean the best
quality in the software (aeronautics software). The important thing about quality is that it is in
the “eye” of the customer – and that also has to align with your own company’s Vision and
Mission about itself. This is why the mapping exercise is valuable. Only you and your workers
can determine what they perceive this to be in relationship to the way the organization gets their
work done.
You can probably quickly see that maps will be unique depending on the perspective of
the individuals that create them. By drawing maps and talking about them you will be able to see
areas of commonality and begin to bring your maps together into a coherent picture.
Bringing the Maps Together
By bringing the maps together and engaging your organization in healthy discussions
about them, you can begin to bring them together and build a new perspective of your
organization. There has been a lot of money spent on “learning maps” at different organizations.
These are slick, focused large scale overviews of what the process “should be” – or are presented
as a way to get everyone in the company aligned to a common understanding of what the
company or process is really like. They can sometimes look like a board game, much like
Monopoly. “Do this process right and collect your paycheck”.
The mapping process we speak of is more primitive in a way but definitely more
collaborative. We have found that building processes and strategies collaboratively is an
effective way of not only engaging workers but making them feel as though they are personally
part of the solution to any problem. The maps draw out perceptions about a product or process.
355

As many of us know, “perception is reality” to most people. The heart of this mapping exercise
is to reveal perceptions about problems, process and interactions.
Once you have built your maps it is time to discuss them together. Your team should feel
very safe discussing aspects of their work together and discussions should be left at a non-
personal level. Just as you would not criticize the author of a software document (requirements,
design, etc.), you will not want to criticize the worker but rather consider the work and what the
perspective means to the organization at large. The examples above will serve as our guideline in
this example of how to have a discussion.
Some examples of questions to ask your group are:
• What looks like the most important element of the map?
• Do you see potential problems? How could we mitigate the risk?
• Is there any way to bring the pieces together? Does this accurately reflect how
things work?
• How large a role does each group play? Are there pieces that are too large in
comparison to others?
The richness of this exercise is in the discussion, not in the map drawing. Of course, you
could draw a new map and it might look like Figure 5.
Figure 5 Consolidated Work Map
Figure 5 is an example of how the work maps from Figures 1 through 4 could come
together and bring all the elements into better proportion. Maybe some elements will even be
missing. Some elements will be smaller but represented in more detail and other elements will be
brought into balance. We often like to quote Eisenhower who said “Plans are nothing, planning
is everything”. The map is nothing but a representation of a discussion of agreed-to
improvements and a realigned perspective. Since perspective is, in essence, reality, you are
356

aligning everyone’s reality of their work in a way that balances the picture of quality or
processes for optimum return.
Once you get the hang of the mapping experience, you can use it to map where you were
in the past, where you are now and where you want to be in the future. The past will tell you the
perspective that you have on what has gone before you, the view of the culture that existed and
point out the path or gaps that you might have been trying to fill in using your current processes.
Your current map will tell you how you are doing today and what you need to do to get to the
future vision of quality and excellence in your daily work. Understanding how your processes
combine to create your current reality is what we like to call “Process Intelligence”.
Just as “Emotional Intelligence” or Emotional Quotient (EQ) is a key indicator of the
ability, capacity, or skill to perceive, assess, and manage the emotions of an individual, of others,
and of groups, “Process Intelligence” or Process Quotient (PQ) is a key indicator of the ability,
capacity or skill to perceive, assess and manage the processes of an individual, others or an
organization. PQ can help an organization evaluate not only how process improvement ready
they are, but can also point out areas of weakness that can be improved in any of four areas:
organizational culture, management, executive management and customer perspectives.
Conclusion and Future Community Work
Bring down barriers and nurturing interdepartmental relationships results in real culture
change but takes time. Nurturing change is like tending to a garden. Management must be
willing to give employees time to build trust between departments and develop commitment to
working together in new ways. Patience is essential. Watch for the following signs to know
sustainable culture change is occurring for clients when they use mapping as part of continuous
improvement work:
• Language changes from finger pointing to talk of broken processes.
• A continuous improvement program changes to a balanced approach – removing
people barriers is just as important as proficient use of tools.
• Stress level goes down.
• Communications are process focused.
• Employees step up and co-own interdepartmental issues.
• Employees ask the right questions.
• Measuring change is as important as measuring today’s performance
Mapping can be foundational work for any continuous improvement program. Tools
such as control charts, trend graphs, root cause analysis, Six Sigma and lean will not effect a
sustainable culture change unless employees understand the upstream and downstream
requirements and make those requirements a priority in their daily work and communication.
Process mapping is valuable when mapping out work flows. Work mapping is helpful for
understanding the holistic view of work as it encourages people’s perceptions to be expressed.
Work mapping has the potential to deliver significant culture change because it addresses the
people side of improvement. Sometimes this sort of mapping can just be fun. Work teams can
laugh with each other and at themselves. If the mapping exercise does nothing but relieve some
stress, it will have been worth the time. If it does more, then it will return many times the effort
put into it.
357

References and Resources
The following sources were either used in the preparation of this paper, or will serve as resources
to the practitioner:
Fiebrich, J., C. Yeakley, “The Quality KISS: Keeping Quality Simple in a Complex World,” in
Proceedings, International Conference on Practical Software Quality Techniques East, March
2004, Washington, D.C.
Yeakley, C., J. Fiebrich, “Strategic Quality: Planned Empowerment,” in Proceedings,
International Conference on Practical Software Test Techniques North, October 2004,
Minneapolis, Minnesota.
Fiebrich, J., C. Yeakley, “The Q-Files: What Is Your Customer’s Definition of Quality?” in
Proceedings, Software Develop & Expo West 2005, March 2005, Santa Clara, California.
Yeakley, C., J. Fiebrich, “Development Lifecycles – Plunging Over the Waterfall!”, in
Proceedings, International Conference on Practical Software Quality Techniques West, May
2005, Las Vegas, Nevada.
Fiebrich, J., C. Yeakley. “Customer Facing – It’s Time for and Extreme Makeover!”, in
Proceedings, International Conference on Practical Software Quality Techniques West, May
2005, Las Vegas, Nevada.
Yeakley, C., J. Fiebrich, “Configuration Management – A Matter of Survival!” in Proceedings,
Unified Model Language and Design World Conference, June 2005, Austin, Texas.
Fiebrich, J., C. Yeakley. “Deploying Guerilla Quality – Modern Techniques for Quality
Initiatives” ISBN 3-9809145-2-6, International Software Quality Institute 3rd World Congress
for Software Quality, September 2005, Munich, Germany.
Fiebrich, J., C. Yeakley. “Building a House of Quality”, in Proceedings, International
Conference on Software Process Improvement, April 2006, Orlando, Florida.
Fiebrich, J., C. Yeakley. “Embedding Software Quality: Capitalizing on Available Resources”,
Software Quality Professional, September 2006, Volume 8, Number 4.
Yeakley, C., J. Fiebrich. “Collaborative Process Improvement”, IEEE-Wiley Press, March 2007.
Fiebrich, J., D, Garay. “What Happens in Guadalajara Will Not Stay in Guadalajara!”, in
Proceedings, Better Software Conference & Expo, June 2007, Las Vegas, Nevada.
358

Customer Interaction and the Role of the Test Engineer
By Shalini Joshi
Microsoft Corporation
Abstract
Most of us understand and realize the traditional role of the test engineer in the life cycle of the
product, from conceptualization to final shipment. However, there is still one area where test
engineers can play a significantly useful role, and this is the part of the product life cycle that
deals with customer interaction and feedback.
Often, during product development, it is easy to overlook the importance of getting involved with
customers early enough in the product cycle. The servicing phase is when there is expected to be
maximum interaction between customers and the product team, primarily through expensive
Product Support calls. Therefore, it is not only desirable but also profitable for the business to
incorporate customer satisfaction and feedback mechanisms formally in every phase of the
product life cycle.
This paper deals with exploring the concept of customer interaction through all the major phases
of the product cycle, as well as the role of the test engineer as based on my own experiences
while working with the Windows Peer-to-Peer team. Approaching the matter of customer
feedback integration with a breadth, as well as a depth of knowledge about product internals,
common development issues, and proven real-world scenarios, our team found that test engineer
participation in community forums, blogs, and support calls is not only a valuable experience, but
also an effort clearly appreciated by the customer. The paper discusses a few low-cost ways and
tools to help teams get directly involved with customers throughout the product life cycle. It also
discusses ways to quantify and measure success for each of these techniques.
Biographical Sketch
Shalini Joshi is a Software Design Engineer/Test working at Microsoft for the Windows Peer-to-
Peer team for the past 2.5 years. During this time, she has been involved in driving test scenarios
for Peer Channel--a platform for the development of managed peer-to-peer applications--, which
shipped with Windows Communication Foundation (WCF) in Windows Vista (.NET Framework
3.0). Prior to this, she graduated as a Masters student in Computer Science at Columbia
University, New York.
© 2007 Microsoft Corporation
359

1. The Product Life Cycle
Every product is geared towards specific customers. The customers, directly or indirectly, come
into the picture during the course of the product’s life cycle, from the requirements and planning phase at
the beginning through implementation, testing and release, and spread across several milestones that
ultimately conclude with the shipment.
Often, during product development, it is easy to overlook the importance of getting involved with
customers early enough in the product cycle. The servicing phase is when maximum interaction between
customers and the product team is anticipated. Often, this interaction primarily occurs through Product
Support calls that are expensive for the organization. Thus, it is not only desirable, but also profitable, for
the business to incorporate and evaluate customer satisfaction and feedback formally in every phase of the
product life cycle.
Product support and servicing (PSS) teams are formally responsible for dealing with customers
and their issues after a product has shipped. Corresponding support calls actually add to business
operating costs; however, investing time and cycles in customer interaction throughout the life cycle of a
product ensures that this expense is ultimately reduced. It also helps the development team to share
information and tips about known issues and scenarios with the servicing team throughout the product life
cycle. This, in turn, improves turnaround times for solutions to customer issues.
When approached with a both a breadth and a depth of knowledge about product internals,
existing issues, and real-world test scenarios, test engineers who actively participate in the customer
feedback process can not only achieve the goal of reducing operating costs, but vastly improve customer
relations and future iterations of the product..
The following steps illustrate the case for customer interaction in each of the various stages of
product development, and suggest ways test engineers could get involved in this two-way interaction to
work for the benefit of the team and the product.
1.1 Planning:
1.1.1 Customer feedback processes for this phase:
• Include customer feedback during requirements gathering, with particular
consideration for common usage scenarios and feature requests.
1.1.2 Benefits of test engineer participation:
• Helps test engineers plan for and develop test plans for, real customer scenarios.
These scenarios can often be indentified early through customer interaction.
• In this stage of the product cycle, test engineers have most likely completed
testing of the product for previous milestones. Compared to developers and
program managers, they are likely to have more bandwidth available to spend on
working with and building on an initial customer base.
• Deriving product requirements and getting customer- requested features included
in the product design:
o Increases our chances of creating an appreciated and successful product.
o Reduces expensive and breaking design changes in the future.
1.1.3 Tools and cost:
360

The costs for activities during this phase of the product include the following:
• Researching various tools that might be rolled out for channeling information to
and from the customers. Examples include setting up team blogs and forums,
planning and costing to include such channels like customer experience reporting
within the product itself.
• Planning the product life cycle for multiple and shorter release cycles or beta
programs. This planning would allow the customer to keep getting previews and
updates on what has been implemented so far, and to keep the
feedback/questions/comments coming in on a rolling basis.
1.2 Implementation:
1.2.1 Customer feedback processes for this phase:
• Getting customer feedback on initial beta versions of the product in an attempt to
decide usability and the kind of customer experience data that could be gathered
and the metrics that could be defined in the product.
1.2.2 Benefits of test engineer participation:
• Collaboration with customers and product support teams, as well as enabling
some amount of scenario testing to complete during the implementation phase
itself. Initial communication and channeling of information can be done
through email, customer onsite visits, forums, and other communication venues.
• Bugs that are found, as well as feature requests by the customer can be promptly
reported by the test engineer as a potential bug or a feature request for the final
version. Thus, not only does the test team partner obtain real-world test results,
but it also gets what might be termed as “free bugs” – which are really bugs the
test engineer can take credit for and report to the team even though they were
not directly responsible for finding them.
1.2.3 Tools and cost:
• This phase includes the cost of actually setting up any team/individual blogs that
the team decides to setup in the planning phase, as well as deciding what
subjects to write articles. Often times, legal considerations for online or extranet
content must be factored in as well.
• Education on proactive testing techniques must be provided to make sure the
product has had at least a couple of test passes before beta versions are provided
to customers for feedback. This can mean having to work closely with the
developers on functional tests while the product is being developed.
1.3 Testing:
1.3.1 Customer feedback processes for this phase:
• Gathering information about real customer scenarios and test environments that
the test team can use to prioritize testing and simulate real-world test
environments should drive this phase.
361

• Gathering first hand information and feedback for the beta version of the product.
(This step can coincide with the feedback processes for the Implementation
phase.) This will also give the team a sense of what is working and what is not
working as far as the product’s features are concerned early enough to
incorporate necessary changes or reprioritize features.
1.3.2 Benefits of test engineer participation:
• Allows for the incorporation of real-world scenarios based on feedback and
questions from customers in public forums, developer conferences, blogs, and
other venues in the regular testing plan for the product. This ties in directly with
the regular tasks of the test team and thus is best suited for their discipline.
• Test engineers are better aware of a wide variety of known issues discovered
during routine functional testing and can thus work with the documentation team
to channel information out to the customers formally or post “Known Issues”
blog posts for various beta versions of the product.
1.3.3 Tools and cost:
• Frequently updating blogs and forums with known issues and new issues found
by customers.
• Tracking turn-around time for response to customer questions on forums.
1.4 Release and Post-Release:
1.4.1 Customer feedback processes for this phase::
• Increased regular blogging and response to public forum questions.
• Making sure release notes for every milestone document known product bugs
and issues
• Triaging incoming customer bugs and feature requests
1.4.2 Benefits of test engineer participation:
• The earlier we start involving our initial customers after the release, the more
chances of us getting patches and fixes out before too many users start running
into them.
• If we treat the product servicing team as our first level customer, and get them
involved in testing the product before releasing it to the actual customers,
potential expensive customer calls and issues might be avoided.
1.4.3 Tools and cost:
• Education of all team members on post-release customer interaction avenues
• Cost of product fixes for post-release issues
2. Structuring the Interaction: Tools and Tracking
Once the product team recognizes the value of working with the customer during all phases of the
product lifecycle, the next step is to identify what tools and avenues can be used to channel information
and how to track customer feedback from these channels.
362

The goal of any new process in a team should be to improve the quality of the product without
adding too much to the overall cost of development of the product. Below are some easy and low-cost
ways to channel information to and from the customer, as well as ways to track this activity and measure
customer satisfaction with the product.
2.1 Blogs
With so many people these days relying on the internet for latest information exchange, blogs are
increasingly becoming acceptable, formal tools for product teams and organizations to channel
information to and from their customers. There are many places where teams and individuals can choose
to host their blogs and the majority of them are free of cost. http://blogs.msdn.com, for example, is one
such place that allows developers and their customers alike to sign up for a blog. It is not restricted to
only Microsoft employees.
2.1.1 Team vs. Individual Blogs:
Product teams may choose to either host blog content as a collective team or individual team
members may choose to create and maintain their own personal blogs that talk about their specific
product expertise. One type maybe created to complement the content of the other.
Some benefits of having one team blog for the entire product are:
• Shared responsibility and broader, more frequent participation in content updates
• Single point of entry for all news and information related to the product
• Easy tracking of comments and feedback: RSS feeds can be sent to a single team alias
that makes tracking and responding to post comments easier.
An individual blog, on the other hand, could be taken advantage of in case any member of the
product team is already an avid blogger and maintains a technical blog about the product. However, as
long as the correct and relevant information is being channeled out to and in from existing and potential
customers, a team could go for any type of blog.
2.1.2 Suggested blog topics:
• Product overview and features
• Team members and contacts- their bio and contact information
• Known issues and bugs with the current version of the product
• How to obtain the product– this could include links to download locations or subscription
information or team contact information
• Product diagnostics and other information that might not have made it to the formal
reference documentation.
2.2 MSDN Forums, Communities and Newsgroups
While blogs are aimed primarily at channeling information out to the customers, forums and
newsgroups are a great low-cost way to gather customer feedback and issues coming in from the
customers and users.
Aside from the ability to allow free conversation between the product team and customers – both
existing and potential- forum questions and threads also make for great potential blog content.
363

Many Microsoft product groups, for example, create public forums on
http://forums.microsoft.com where users are free to post questions. Responses and turn around time for
the responses are kept track of by forum administrators or moderators. Spam on the forums can be
reported to the moderators.
Discussion forums can also be added to existing websites for a team or a product. Instead of
starting from scratch, sites that are hosted on Windows operating systems can make use of Community
Server [4]. Community Server is a web-based community platform that includes a suite of applications to
help quickly and easily build a web community.
2.3 Onsite Customer Visits, Hands-On Labs
The idea of hands-on labs is to have the customer describe their scenarios to us, and then have us
describe our product’s features and functionality to them. After that, we can set up the lab onsite for them
and work with them while they are working on their product and get almost-live feedback.
If feasible, another good idea is to get some of your early customers (particularly those customers that
you have closely worked with) to make onsite visits and demonstrate their applications to the team and
management.
The main objective in this case is to get information flowing in both directions--both to and from the
customer.
2.4 Building tracking into the product
This is another way to quantify customer satisfaction and the success of your product to some
extent. It does require some investment by the product team during design time to build in diagnostic data
collection and reporting mechanisms into the product itself. An example is the Microsoft Watson logs,
which capture customer errors and submit them for evaluation. Another Microsoft example is what is
publicly known as the Customer Experience Improvement Program [5]. Products, either during
setup/uninstall or general failure conditions are designed to get explicit permission from the user to
collect product-specific diagnostic information to be sent back to the team for analysis.
2.5 Test and Developer Conferences
Attending conferences to demonstrate the team’s technology and products and interact with the
customers directly is a great way to both market the technology and build a strong customer base early on.
It is not only useful for the team, but it is also really appreciated by the customers when they get to hear
from and talk to team members with a hands-on knowledge of the product and implementation, rather
than the usual marketing presentations. The annual Professional Developer Conference (PDC) and Tech
Ed are some conferences available for participation.
3. Case Study: Windows Collaboration Technologies
Windows Collaboration Technologies provides peer-to-peer based managed and unmanaged APIs
and Experiences for Windows. The feature I worked on, Peer Channel, is a set of managed APIs that
shipped in Vista as part of Windows Communication Foundation in the .Net Framework 3.0.
As a test engineer on the Windows Collaboration (Peer-Peer) team, I had the unique position of
simultaneously being part of two different product groups. Thus, I was able to learn from one and try to
propagate similar ideas on to my parent test team. While my own feature, Peer Channel, shipped as part
of Windows Communication Foundation (included in the .Net Framework 3.0), the team that owned this
364

component was part of the separate Windows organization. Here, I will talk about experiences, both as
part of the test processes in the WCF (formerly codenamed Indigo) team and my parent team.
3.1 Customer feedback processes
Like any new process, there needed to be a driving force or motivating factor(s) for our team to
get excited about and adopt customer interaction as part of our overall product development. Some factors
that helped our team and us test engineers, in particular, were:
3.1.1 Push and Recognition by the Management :
• Organization-wide annual goals: Adoption by our team was made easier by the fact
that there was a Windows organization-wide initiative to make customer interaction an
essential part of every team’s individual and team-wide annual goals. This in turn
drove group and program managers to drive efforts in this area within our team itself.
Success would be measured in terms of number of customers owned by teams and
individuals.
• Recognition and awarding effort and contribution: Another driving force that got us
excited. These included awards like certificates, lunch coupons, and even little but
meaningful gestures like special mention in broad emails to higher management etc.
3.1.2 Free Bugs: Special incentive for Test Engineers:
• Another motivation that worked really well for us as test engineers. Questions on
forums, blogs are a great source for new free bugs. They are ‘free’ in the sense that
technically they are owned and filed by the test engineer, even though it may have
been reported first by the customer.
• However, not only are customers a great source for new bugs, but they also aid in
getting known but otherwise lower priority issues fixed in future product roll-outs.
Customer issues generally are prioritized higher in triage, and if too many customers
are complaining about and running into the same bug, it only adds to your case for
fixing the bug.
3.1.3 Means to Promote and Market the Product:
• Since we had started working on building a customer base starting with our beta
releases, regular discussion of new features/known issues/workarounds/download
locations for these beta versions and our samples in monthly Customer Technology
Preview (CTP) SDKs helped us build a rapport with both new and existing customers.
3.1.4 Professional Satisfaction of Resolving Customer Problems:
• For me, personally, this was one of the driving factors, particularly because as a test
engineer, this is the closest I and my work on the product would get to a customer.
3.1.5 Test and Improve Essential Communication/Professional Skills:
• This again, has been another personal driving factor for me. I enjoy writing and
blogging seemed like a good means to practice communicating ideas/issues clearly
and succinctly. This again is relatively easier for test engineers because of our
experience with writing (hopefully) succinct and clear bug reports.
• I also took this as an opportunity to assume responsibility for driving this initiative
across the rest of my test team (with a lot of support from my immediate management
and peers).
365

3.2 Tools Used
Most of the techniques and tools used by our team were low-cost and common techniques to
channel information to and from our customers. I discuss some of these along with how I, as a test
engineer, could contribute to the successful use of these for tracking and measuring customer satisfaction.
Some of these were already in place and all we needed to do was take ownership for areas relevant to our
feature; others were put in place and maintained by us throughout the development life cycle (and even
now).
3.2.1 Team Blog:
We chose to go with creating our own team blog as opposed to trying to maintain individual
blogs like some of our team members had done before this effort. The benefits of a team blog have
already been noted in section 2.1.1 above and played a part in this decision as well.
3.2.1.1 My posts as a test engineer:
• Product Behavior Posts: Apart from regular news and updates, I also saw the
blog as a way to also talk about my own discoveries about the product behavior
during the course of writing test cases and running into potential usability issues;
i.e. I would assume the product to work a certain way; when it didn’t, apart from
being a bug, it would also make for helpful blog posts.
• Real-world Issues and Experiences: While testing our feature in the real world,
we discovered that the majority of the issues we saw were primarily related to
underlying network issues of some sort or the other. Again, that made for useful
posts in the blog.
• First-Hand Knowledge of Postponed bugs: As a test engineer, I knew which
one of my bugs had not been able to meet the triage bug bar level and had been
postponed for a milestone. Again, firsthand knowledge of such issues made for
great blog articles.
3.2.2 MSDN Forums And Newsgroups:
We found that many questions related to our product were being posted on existing forums
owned by our partner team (Windows Communication Foundation, WCF). This saved us a lot of setup
and monitoring tasks. All we needed to take care of was to make sure we were answering questions
promptly and to the customer’s satisfaction. The forum complemented our blog content. These were also
a great way to discover what questions were being asked repeatedly and thus would make for great blog
articles and perhaps design changes in future product versions.
3.2.2.1 Participation As a Test engineer
• Eagerness to work with a customer and resolve their issues: The forums were
perhaps the closest I had gotten to being able to share my experience with real, live
customers. In addition, as a test engineer this was extra special to me since this was
how the customers could hopefully notice my involvement in the making of the
product.
• Knowledge of already existing blog posts: Since I was also involved in updating
and maintaining the blog for our team, I could save the customers’ time and point
them to our blog posts if need be without repeating solutions and workarounds in
every thread where similar issues were revisited.
366

• Depth of knowledge across product features: I had become familiar with features
other than my own over the course of testing the product and this helped me to pitch
in and respond to posts outside my feature area as well.
3.3 Other Channels:
These were some other channels that my team used to increase customer interaction amongst the
test engineers in particular. I mention these even though I was not directly involved in these activities but
was provided helpful information by fellow test engineers on my team.
• Attending and Interacting at Conferences: A fellow test engineer on my team presented
another one of our group’s offerings to customers at TechEd, China, to overwhelming response
from the attendees. This was primarily because of the practical knowledge of issues and features
that the test engineer brought with him and not just the theoretical aspects typical of many
marketing presentations.
• Windows Customer Experience Improvement Program [7] Participation: One of our team’s
primary offerings, the Peer Name Resolution Protocol (PNRP), was implemented in Vista with its
code instrumented to gather useful data for use with the Windows Customer Experience
Improvement Program tools. This data was analyzed by the test team to gather information about
product usage and patterns that are currently being used for testing and future product planning
purposes as well.
3.4 Accountabilities: Measuring Success
3.4.1 Blog visibility and success:
• At one point, we got so involved with the blog that we would have contests as to which
blog (team vs. other existing individual blogs) would rank higher on internet search
results. (Our team blog still gets the first rank today-
http://search.msn.com/results.aspx?q=Peerchannel&form=QBRE )
• The success was evident when other bloggers started linking to our posts along with our
increasing hit count. Our blog was also asked to be included in the list of bloggers for
Tech Ed, Orlando, 2007 [7].
• Cross-References to the blog in our answers to questions on public forums/newsgroups.
3.4.2 Tracking Forum Questions and Responses:
• Forums were monitored and moderated not only for unanswered open questions and
threads, but also for previously answered threads, which had been reopened. MSDN
forums allow for convenient RSS feeds that one can subscribe to in order to keep track of
new questions or comments to previously replied-to questions.
• Keeping track of response rate for questions and communicating this data to the team on
a regular basis was another way we monitored the forums and measured the effectiveness
of our responses. For example, the following table was generated using data and statistics
obtained through an internal tool that monitors public product forums.
367

WCF1
PU2
Split
Total
Questions
# Answered3
Questions
Total Answered
%
UnansQuestions4
w/o first reply in 7
days
Peer Channel 34 32 94% 1
Table 1: Peer channel MSDN forum statistics
1 Windows Communication Foundation
2 Product Unit
3 Forum questions that have a reply tagged as “Answer”
4 Forum questions that haven’t received any reply at all or any reply that has been tagged as
“Answer’
3.4.3 Actual product bugs reported
During the entire lifetime of the product, about 1% of total bugs that were filed came
from both internal as well as external customers.
The table below shows some interesting statistics about the number of customer bugs
filed against the product and how the majority of the bugs were found and fixed prior to release.
Only one bug was filed through the Servicing team and resulted in a private product patch post-
release. These statistics further reiterate the significance of gathering and working with customer
feedback earlier on in the life cycle so high priority bugs and design requests can be taken care of
without incurring a lot of development and test cost.
Total No. of customer
bugs reported
Total No. of
customer
bugs fixed
% Fixed
(Pre + Post
release)
No. of
customer
bugs fixed
Pre-release
% of
customer
bugs fixed
Pre-release
20 11 55% 10 91%
Table 2: Peer Channel customer bug statistics
3.4.4 Customer Reaction
Many of our industry customers have used the channels described earlier to post and get
answers to their questions. Among the customers that successfully shipped their Peer Channel-
enabled v1 products around the same time that we shipped are:
- Neudesic [8]
- 90 Degree Software [9]
I also note a small but just as significant example of positive customer feedback from one of
our customers from the public forums:
“Thank you so much for all, you are so kind people!
I think I owe you a dinner! When will you come to China? ^_^” - Hailong
4. Challenges and lessons learnt
Some of the challenges we faced are listed below along with suggestions on how to possibly deal
with them on your team.
368

4.1 In my experience, one of our biggest challenges has had to do with the scalability of our
solutions. Owing to the popular nature of the technology behind our product (peer-to-
peer), we had customers ranging from large-scale businesses that demanded immediate
attention to young hobbyists trying to build music-sharing applications using Web
services and Peer Channel. Since our product team was limited in its collective
availability to answer questions, it would sometimes lead to longer delays in responding
to all the questions posted on forums and blogs.
• A weekly status report sent out to broader team aliases, including upper
management, in theory, could ensure that team members are accountable for
good or bad answer rates for the team. Apart from letting the management step-
in if numbers are too low, the added visibility of these efforts could possibly
motivate team members to participate more actively.
• Prioritizing customers and triaging incoming questions and issues, based on
the scale of the solutions they are building also helps to make sure that high
priority issues are taken care of promptly.
4.2 Sharing responsibility and driving this effort across the team was sometimes assumed
as the responsibility of a single person – something that we had sought to avoid when
choosing the team blog approach. This is basic human nature, I guess, and has to be dealt
with. There has to be at least one person driven enough to at least periodically take
initiative and keep the forums and blog alive. This person either could be a volunteer or
would need to be nominated by the team/management.
4.3 Keeping down test cost, was a challenge. However, the fact that other team members
from the development and project management disciplines were just as involved in this
process helped a lot. Another reason was that most of the issues that were brought up on
blogs and forums were issues that had more to do with configuration and functionality of
the product rather than actual code defects. Most of the investment was documentation
work and analysis work like blog posts and articles, and trouble shooting.
5. Conclusion:
To summarize, in the previous sections we talked about:
• Promoting customer interaction throughout the life cycle of a product.
• Recognizing the unique potential of a test engineer in channeling information to and from
the customer through the product cycle.
• Helpful tools and groundwork required in every stage to achieve and measure customer
satisfaction.
The whole point behind this exercise is to ultimately take one more step towards making the
product successful and profitable for the organization and fostering goodwill for both the product and the
organization amongst the customers and partners.
369

6. References and Links
[1] Peer Channel Team Blog: http://blogs.msdn.com/peerchan
[2] Windows Communication Foundation (“Indigo”) Web Forums:
http://forums.microsoft.com/msdn/showforum.aspx?forumid=118&siteid=1
[3] Windows Peer-to-Peer Networking team home page: http://blogs.msdn.com/p2p
[4] Community Server: http://communityserver.org/
[5] Windows Customer Experience Improvement Program information:
http://technet2.microsoft.com/WindowsVista/en/library/9fd915d5-cc1f-4785-9bc2-
6ac16d6ab4081033.mspx?mfr=true
[6] Microsoft Tech Ed, 2007: http://www.microsoft.com/events/teched2007/default.mspx
[7] Tech Ed Bloggers (Featuring Peer Channel team blog): http://techedbloggers.net/
[8] Neudesic - http://neudesic.com/Main.aspx
[9] 90 Degree Software: http://www.90degreesoftware.com/
370

2007 Robert Goatham & Jim Brosseau
The Devil’s in the Decisions
Lead Author – Robert Goatham B.Sc.(Hons) , PMP
Email – [email protected]
Second Author – Jim Brosseau, Clarrus Consulting
Email – [email protected]
About Robert Goatham
With 20 years in the IT Industry and a broad range of experience in both Project Management
and Quality Management, Robert Goatham has long been an advocate for quality. Robert has an
Honors degree in Aeronautical Engineering from Kingston University, UK and became a Certified
Quality Analyst in 1999. He has broad international experience and established the IT Quality
function for Singapore Airlines. In addition he has played an active role in quality programs in
many organizations. Always pragmatic, Robert's mix of fundamentals and from the trenches
experience leaves audiences with a new and distinct perspective on the key issues affecting the
IT Industry.
About Jim Brosseau
Jim has a technology career spanning more than 20 years in a variety of roles and
responsibilities. He has held successively more responsible positions in military and defense
contracting, commercial software development, and training and consulting. He has worked in the
QA role, and has acted as team lead, project manager, and director. In addition, Jim has worked
with more than 75 organizations in the past 10 years with a goal of reducing business
inefficiencies. An integral part of this effort has been a focus on techniques for measurement of
productivity gains and ROI for refined development and management practices.
Abstract
In a paper that looks at software development from a new perspective, the authors ask us to
consider the central role that decision-making plays in software projects. Teams are aware of the
key decisions made in a project, but many will not have considered that decision-making is the
pervasive thought process that affects even the smallest detail of a project’s outcome.
Given that teams that consistently make good decisions are likely to succeed, while teams that
make bad decisions are likely to fail, the paper considers the factors that affect the ability of the
team to make effective decisions.
Teams wanting to improve their performance need to understand the different elements that lead
to bad decisions and consider ways of tuning their practices to optimize their decision-making
capabilities. To assist teams who are interested in improving their capabilities, an assessment
tool is provided that allows teams to explore the issues that could prevent from them making
effective decisions. By understanding the factors that drive effective decision making and the
relationship between those elements, project teams will be better able to identify weaknesses in
their decision making capabilities and address those weaknesses before the project is
compromised by a set of bad decisions.
2007 Robert Goatham & Jim Brosseau
371

The Devil’s in the Decisions
Decision-making is so ubiquitous that we rarely stop and think about how central its role is in
software projects. We are aware of the key decisions made in a project, but we don’t consider
that decision-making is the pervasive thought process that affects even the smallest detail of a
project’s outcome.
It’s not a quantum leap to theorize that the success of a project is correlated to the effectiveness
of the team’s decision-making capabilities. Consistently make good decisions and the chances
are you’ll succeed. Make bad decisions and your chances of success are greatly diminished.
Traditionally, Project Management and Quality Management disciplines approach software
development as a process-based activity [1]. Much like manufacturing, projects are viewed as a
set of discrete tasks that lead from one to the next and result in the final product. In software
development, these tasks typically include Requirements, Design, Development, Test and
Deployment. Depending on the methodology being used, the tasks are organized around a
framework that establishes the order of the tasks, the methods to be used and whether the tasks
are to be performed once, more than once, sequentially or in parallel.
While this is a convenient view, it masks the inner “atomic structure” of a project. At the atomic
level, a project is more accurately represented as a large-scale complex web of inter-related
decisions.
Figure 1 provides a graphical representation. The panel to the left shows the traditional view of a
project. Work is represented as a set of process and tasks that are sequenced in such a way that
the work follows a logical path from start to end. The panel to the right shows a small fragment of
the project at the atomic level. A chain of decisions flows from left to right, with individual
decisions acting as the stepping-stones that lead from project initiation to the delivery of the final
product. Each box represents an individual decision and the connections between boxes show
the relationship between decisions and the flows of information, as one decision becomes the
basis for determining the next question or set of questions needing to be answered.
D
D
D
D
D
D
D
D
D
D
D
DD
D
D
D
D
D
D
D
D
D
D
D
D
D
D
D
D
DD
D
D
D
D
D
D
D
D
D
D
D
D
D
D
D
D
DD
D
D
D
D
D
D
D
D
D
D
D
D
D
D
D
D
DD
D
D
D
D
D
D
D
D
D
D
D
D
D
D
D
D
DD
D
D
D
D
D
D
D
D
D
D
D
D
D
D
D
D
D
D
D
D
D
D
D
D
D
D
D
D
D
D
D
D
D
D
DD
D
D
D
D
D
D
D
D
D
D
D
D
D
D
D
D
DD
D
D
D
D
D
D
D
D
D
D
D
D
D
D
D
D
DD
D
D
D
D
D
D
D
D
D
D
D
D
D
D
D
D
DD
D
D
D
D
D
D
D
D
D
D
D
D
D
D
D
D
D
D
D
D
D
D
D
D
D
D
D
D
D
D
D
D
DD
D
D
D
D
D
D
D
D
D
D
D
D
D
D
D
D
DD
D
D
D
D
D
D
D
D
Process
Inputs Outputs
Process Process Process Process
Task Task Task Task
Tools
Techniques
Traditional View of a Project A Fragment of the Atomic View
Figure 1 – A Contrast in Views
D
D
D
D
D
D
D
D
D
D
D
DD
D
D
D
D
D
D
D
D
D
D
D
D
D
D
D
D
DD
D
D
D
D
D
D
D
D
D
D
D
D
D
D
D
D
DD
D
D
D
D
D
D
D
D
D
D
D
D
D
D
D
D
DD
D
D
D
D
D
D
D
D
D
D
D
D
D
D
D
D
DD
D
D
D
D
D
D
D
D
D
D
D
D
D
D
D
D
D
D
D
D
D
D
D
D
D
D
D
D
D
D
D
D
D
D
DD
D
D
D
D
D
D
D
D
D
D
D
D
D
D
D
D
DD
D
D
D
D
D
D
D
D
D
D
D
D
D
D
D
D
DD
D
D
D
D
D
D
D
D
D
D
D
D
D
D
D
D
DD
D
D
D
D
D
D
D
D
D
D
D
D
D
D
D
D
D
D
D
D
D
D
D
D
D
D
D
D
D
D
D
D
DD
D
D
D
D
D
D
D
D
D
D
D
D
D
D
D
D
DD
D
D
D
D
D
D
D
D
D
D
D
D
D
D
D
D
D
D
D
DD
D
D
D
D
D
D
D
D
D
D
D
D
D
D
D
D
DD
D
D
D
D
D
D
D
D
D
D
D
D
D
D
D
D
DD
D
D
D
D
D
D
D
D
D
D
D
D
D
D
D
D
DD
D
D
D
D
D
D
D
D
D
D
D
D
D
D
D
D
DD
D
D
D
D
D
D
D
D
D
D
D
D
D
D
D
D
DD
D
D
D
D
D
D
D
D
D
D
D
D
D
D
D
D
DD
D
D
D
D
D
D
D
D
D
D
D
D
D
D
D
D
DD
D
D
D
D
D
D
D
D
D
D
D
D
D
D
D
D
DD
D
D
D
D
D
D
D
D
D
D
D
D
D
D
D
D
DD
D
D
D
D
D
D
D
D
D
D
D
D
D
D
D
D
D
D
D
D
D
D
D
D
D
D
D
D
D
D
D
D
D
D
DD
D
D
D
D
D
D
D
D
D
D
D
D
D
D
D
D
DD
D
D
D
D
D
D
D
D
D
D
D
D
D
D
D
D
DD
D
D
D
D
D
D
D
D
D
D
D
D
D
D
D
D
DD
D
D
D
D
D
D
D
D
D
D
D
D
D
D
D
D
DD
D
D
D
D
D
D
D
D
D
D
D
D
D
D
D
D
DD
D
D
D
D
D
D
D
D
D
D
D
D
D
D
D
D
DD
D
D
D
D
D
D
D
D
D
D
D
D
D
D
D
D
D
D
D
D
D
D
D
D
D
D
D
D
D
D
D
D
DD
D
D
D
D
D
D
D
D
D
D
D
D
D
D
D
D
DD
D
D
D
D
D
D
D
D
D
D
D
D
D
D
D
D
DD
D
D
D
D
D
D
D
D
D
D
D
D
D
D
D
D
DD
D
D
D
D
D
D
D
D
Process
Inputs Outputs
Process Process Process Process
Task Task Task Task
Tools
Techniques
Process
Inputs Outputs
Process Process Process ProcessProcess Process Process Process
Task Task Task TaskTask Task Task Task
Tools
Techniques
Traditional View of a Project A Fragment of the Atomic View
Figure 1 – A Contrast in Views
372

At the atomic level the clean delineation between different tasks implied by the traditional view
breaks down. Although at an overall level early decisions are more likely to be requirements type
decisions, while those later in the chain are more likely to be implementation type decisions, the
sequence and structure of the decisions at the atomic level is more complex than the traditional
view would imply. Often planning, requirements, design and even implementation type decisions
are made in parallel and certain decisions may affect multiple aspects of the project rather than
just one.
This heavily interconnected chain of decisions poses a significant problem for software
development teams. If a bad decision is made early in the project, it can have a cascading affect
for subsequent decisions that follow. The significance of a bad decision is compounded as more
and more subsequent decisions are based on or influenced by the bad one [2].
It is important to note that for software projects, many bad decisions are ones that are not made,
or are made far too late in the project. As an example, in one study the U.S. Navy found that 31%
of all requirements errors were errors of omission [3]. Omissions are easy to make if the team
lacks sufficient subject matter domain knowledge or technical knowledge in order to identify and
ask the right questions at the right time.
D
D
D
D
D
D
D
D
D
D
D
DD
D
D
D
D
D
D
D
D
D
D
D
D
D
D
D
D
DD
D
D
D
D
D
D
D
D
D
D
D
D
D
D
D
D
DD
D
D
D
D
D
D
D
D
D
D
D
D
D
D
D
D
DD
D
D
D
D
D
D
D
D
D
D
D
D
D
D
D
D
DD
D
D
D
D
D
D
D
D
D
D
D
D
D
D
D
D
D
D
D
D
D
D
D
D
D
D
D
D
D
D
D
D
D
D
DD
D
D
D
D
D
D
D
D
D
D
D
D
D
D
D
D
DD
D
D
D
D
D
D
D
D
D
D
D
D
D
D
D
D
DD
D
D
D
D
D
D
D
D
D
D
D
D
D
D
D
D
DD
D
D
D
D
D
D
D
D
D
D
D
D
D
D
D
D
D
D
D
D
D
D
D
D
D
D
D
D
D
D
D
D
DD
D
D
D
D
D
D
D
D
D
D
D
D
D
D
D
D
DD
D
D
D
D
D
D
D
D
Figure 2 - Cascading Effect of a Bad Decision
D
D
D
D
D
D
D
D
D
D
D
DD
D
D
D
D
D
D
D
D
D
D
D
D
D
D
D
D
DD
D
D
D
D
D
D
D
D
D
D
D
D
D
D
D
D
DD
D
D
D
D
D
D
D
D
D
D
D
D
D
D
D
D
DD
D
D
D
D
D
D
D
D
D
D
D
D
D
D
D
D
DD
D
D
D
D
D
D
D
D
D
D
D
D
D
D
D
D
D
D
D
D
D
D
D
D
D
D
D
D
D
D
D
D
D
D
DD
D
D
D
D
D
D
D
D
D
D
D
D
D
D
D
D
DD
D
D
D
D
D
D
D
D
D
D
D
D
D
D
D
D
DD
D
D
D
D
D
D
D
D
D
D
D
D
D
D
D
D
DD
D
D
D
D
D
D
D
D
D
D
D
D
D
D
D
D
D
D
D
D
D
D
D
D
D
D
D
D
D
D
D
D
DD
D
D
D
D
D
D
D
D
D
D
D
D
D
D
D
D
DD
D
D
D
D
D
D
D
D
Figure 2 - Cascading Effect of a Bad Decision
With time moving from left to right, Figure 2 shows the potential cascading affect of making a bad
decision early in the project. White boxes represent good decisions; black boxes bad decisions
and gray boxes represent sub-optimal decisions. As shown, the effect of a bad decision early in
the project can have far reaching consequences throughout the project. Although ideally project
teams would go back and correct every bad decisions as soon as it were identified, in practical
terms teams can only move forward from where they are and projects rarely have the budget or
time to go back and correct anything other than minor errors. As a result, unless caught and
corrected early, many projects are compromised by the failure of one or more key decisions
made early in the project.
373

Clearly, a key goal for software organizations is to build an environment in which individuals and
teams are able to make decisions as effectively as possible and an environment where bad
decisions are identified and corrected as soon as possible. Failure to do so results in a larger
number of bad decisions, with the corresponding consequences.
Clearly some teams are able to make better decisions than others. Many studies have shown
that some teams are more effective than others at making decisions [4]. We believe that many of
the factors that have been identified as drivers for team effectiveness are key to building an
infrastructure for effective decision-making. The key question to be answered is: “What are the
elements that allow some teams to consistently make better decisions than others?”
A Recipe for Successful Decision Making
Over the years, the authors have participated in and observed a wide range of projects and
teams. By distilling those experiences, we have identified a number of ingredients as consistent
themes in the most effective project teams. These ingredients cover a number of organizational,
process and people factors. Our observations show that successful projects are those where all
of the ingredients are present and are sufficiently robust. As a counterpoint, our observations
show that the absence of one or more ingredients has been a recurring theme in projects that
have encountered serious difficulties.
By recognizing and understanding these ingredients and relationships between them, Project
Managers have a powerful tool that allows them to identify where their team may encounter
problems making effective decisions. The identification of such issues early in the project allows
the Project Manager to address the problems, thereby avoiding the pain of having to correct bad
decisions long after they have been made. These key ingredients are:
1. Subject Matter Domain Knowledge Be it a business, scientific, social or academic
project, subject matter knowledge is a key foundation stone for successful projects.
Although not ever team member needs to have subject matter knowledge, the team as a
whole needs to include the necessary knowledge (or access to it) and the flows of
communications within the team need to ensure that the knowledge reaches those in the
team that need it in order to perform their work. Where the team lacks such knowledge
they lack the situational awareness required to ask the right questions and make the right
decisions. When key questions are missed, the seeds of a troubled project are sown.
Such gaps lead to flaws in the project scope, inappropriate architectures, designs that fail
to meet user requirements and a host of other problems.
2. Technical Knowledge and Skills – The implementation of a system is dependent on the
ability of the team to implement the required solution using the technologies available to
them and the team’s ability to select the most appropriate technology. The stronger the
team’s knowledge of the technology, the faster they will be able to work, the more the
team will be able to optimize their designs and the less likely the team is to encounter
unforeseen technical problems.
3. Leadership and Direction – While the two knowledge domains (subject matter and
technical) fuel the project, the team needs to share a common picture of what they are
trying to achieve and how they will get there if they are to make effective decisions along
the way. Leadership draws together the big picture and communicates it to the team
while helping the team focus their decision-making activities to align with the project goal.
As changes occur, leadership alters the course as necessary and keeps the channels of
communication open to ensure on-going alignment. To ensure the team is able to make
effective decisions, the big picture needs to cover a number of different aspects of the
project including the vision of the end product, the overall system architecture as well as
the project plan of how the system will be built. Without the big picture, team members
374

loose the ability to correctly align their decisions with those made by their colleagues,
thereby damaging the integrity of the project as a whole.
4. Engagement and Participation – Having the right stakeholders engaged in the project
from the start is another key ingredient. Stakeholders need to include those providing the
project resources, those affected by the project outcomes and those performing the work.
As noted earlier, decisions made early in the project become the foundations for all
subsequent decisions. Where key stakeholders are omitted from the decision making
process early in the project, critical information can be missed. Similarly if key team
members don’t have sufficient time to participate effectively, either the project will
struggle to gain traction, or decisions will be made based on insufficient analysis. In
either case, there is an increased risk that ineffective decisions will be made.
5. Ownership and Commitment – Clear ownership of decisions and the team’s willingness
to commit to making decisions are further elements required to establish a sound
decision-making environment. Without the clarity of clear ownership, decisions fall
through the cracks as individuals think someone else is responsible. Where there is a
lack of willingness to commit to decisions, time, budget and energy are sapped from the
project while the team waits for clear decisions to be made, or worse the project
proceeds without having established clear answers to critical decisions.
6. Shared Understanding – Everyone’s been told, “communicate, communicate,
communicate”, but effective teams go beyond communication by building shared
understandings and consensus. If a team is to make effective decisions, they need to
share common understandings among themselves, with their stakeholders and with their
leadership. Shared understandings require skills from both the communicator and the
recipient as they both ensure they have common understandings. Shared
understandings are necessary if the team is going to be able to coordinate at the detailed
level. A failure to build shared understandings undermines teamwork and leads not only
to bad decisions, but also problems detecting when bad decisions have been made.
7. Integration – The ability of individual team members to align and integrate their
decisions into the larger whole is another critical element. Many will have seen projects
in which different parts of the team have headed off in different directions and the
resulting problems as the different pieces are bought together for final integration.
Integration problems are one of the most common failures of projects in trouble.
8. Governance and Control – Although words such as governance and control have
negative implications for some, all projects have some form of control. The nature of the
methods used may vary dramatically, but to one degree or another all successful projects
have some mechanisms in place to control and govern what the team does. Such control
acts as the checkpoint that allows the team to continually ensure alignment of their
decisions as well helping the team in identifying where bad decisions have been made as
soon as possible so that they can be corrected with minimal lost time or budget.
Decision Engine Assessment
We can view these ingredients as one system in order to evaluate the ability of the team as a
whole to make effective decisions. Our observations show that only when the ingredients are
present and robust is the team able to make effective decisions. Weakness in any one ingredient
can severely damage the ability of the team as a whole to make sound decisions. A good
analogy is to view these ingredients as an eco-system. Much like an eco-system, when all
elements are strong, the whole eco-system thrives. If one or more elements are compromised,
the eco-system as a whole can be impaired. We call this eco-system the Decision Engine. Many
of the root causes that lie behind failed or “challenged” projects can be traced back to problems in
the project’s Decision Engine.
375

One of the problems seen in failed projects is that the Project Manager is not aware of gaps in the
project that prevent the team from making effective decisions. A flood of emails and issues
swamps the Project Manager, distracting his attention such that he looses sight of the big picture
for which he is responsible: the responsibility to build a team that can make effective decisions.
To help maintain an awareness of the team’s decision-making capabilities, it’s a useful exercise
for teams (and even organizations) to evaluate their project against the ingredients of the
Decision Engine presented above. By considering the relative strength of each element, a team
can gain a picture of the issues that could prevent them from making effective decisions and
hence reduce their chances of success.
Figure 3 (see below) shows such an assessment. The different ingredients in the Decision
Engine are shown as arms on a radar chart and are ranked with scores from one to five. A
ranking of five means that the element is strong and a ranking of one represents weakness. A
set of assessment questions we have successfully used to determine rankings for each ingredient
is included at the end of this article. Managers, Project Managers or team members who are
interested in evaluating the abilities of the team can use the tool. In addition, the tool can be used
to facilitate group sessions between team members to understand differing perspectives that may
further help the team as a whole gain insights to how effectively the team is working.
Our observations show that successful projects typically score a four or above for most of the
elements. Hence for discussion purposes a target line has been drawn around the chart at a
value of four.
The authors have worked with a number of project teams to perform the assessment. The
assessment shown in Figure 3 is a typical result. The project team shown has strong technical
knowledge but has weakness in the other elements. It is reasonable to predict that such a team
Figure 3 - Decision Engine Assessment
0
1
2
3
4
5
Engagement &
Participation
Integration
Leadership &
Direction
Governance &
Control
Ownership &
Commitment
Technical
Knowledge &
Skills
Shared
Understandings
Subject Matter
Domain Knowledge
Assessment Target
376

will encounter significant “challenges” in their efforts to deliver. By using the assessment as a
tool to initiating discussion and reflection, many of the teams we have worked with have initiated
a broad range of changes in their approach in order to address weaknesses identified through the
tool. Changes made include: organizational changes to ensure better oversight of work;
increasing the number of reviews to validate decisions earlier; adopting a program of lunch and
learns to help share domain knowledge; changes to ensure stakeholders are involved more
closely with key project decisions; and many other changes.
Organizations that would like to improve the performance of their teams should consider looking
at the Decision Engine to determine areas where actions could improve performance the most.
Team Leaders can use the tool at project start up and periodically thereafter to help maintain
situational awareness as the dynamics of the project unfold. The tool can assess the overall
project or to zoom into one particular area. Rather than using the assessment as a snapshot that
may predict success or failure for a project, teams will be able to identify areas to shore up in an
effort to increase their chances of success for a given project.
Dimensional Factors Influencing the Decision Engine
A healthy Decision Engine acts as the power plant of progress. Having looked at the ingredients
in play, though, it is worth understanding that the way the engine works for two fresh college
graduates building the next killer application in their basement suite won’t be the same as it is for
a large team trying to put an astronaut on Mars. The key is not the level of process formality
used or applying a particular organizational structure, but the appropriate tuning of the team’s
practices to the needs of the project. To understand the difference between the college
graduates and the Mars explorer team, we need to consider a number of dimensions.
The first of those dimensions is size (i.e. the number of functions needing to be developed and
the complexity of those functions). As project size increases, so too does the number of
decisions needing to be made. Usually this means more people are involved and with more
people comes the need for greater coordination. Communication is the oil that lubricates that
coordination. Where a quick discussion and a whiteboard might suffice for the college graduates,
the Mars explorer team would need far more extensive structures in place to achieve the same
level of communication. Similarly more formal methods of communication, such as written and
reviewed documentation, may be required for many other reasons such as where teams are
distributed or where a project calls for coordination between organizational groups that may have
different methods or styles of working.
The second dimension is time. Larger projects usually take more time. This means the
timeframe between early decisions and those made later in the project is extended. Extended
timeframes tax memories unless appropriate steps have been taken to ensure the project has a
project repository independent of the brains of the individual team members.
The consequence of failure is the third dimension to be considered. Where failure involves loss
of life, significant monetary loss or severe damage to the reputation of an organization, the
practices employed need to take this into account. The usual method for preventing such failure
involves increasing the number of reviews and validations that take place. Such checkpoints
validate decisions and help ensure that the team is proceeding based on a solid base. Although
all projects benefit from such checks, the timing and formality of the reviews is often driven by the
consequences of failure.
Perhaps the final dimension is the structure of the web of decisions itself. Not all projects share a
common structure. Depending on a number of requirements, design and technological
considerations, some projects have broad but shallow chains of decisions while others have
narrower, but deeper chains. One-way this structure becomes manifest is to think through the
number of architectural decisions made in the project. Architectural decisions are significant
because many subsequent decisions will be based upon them. A flaw in an architectural decision
377
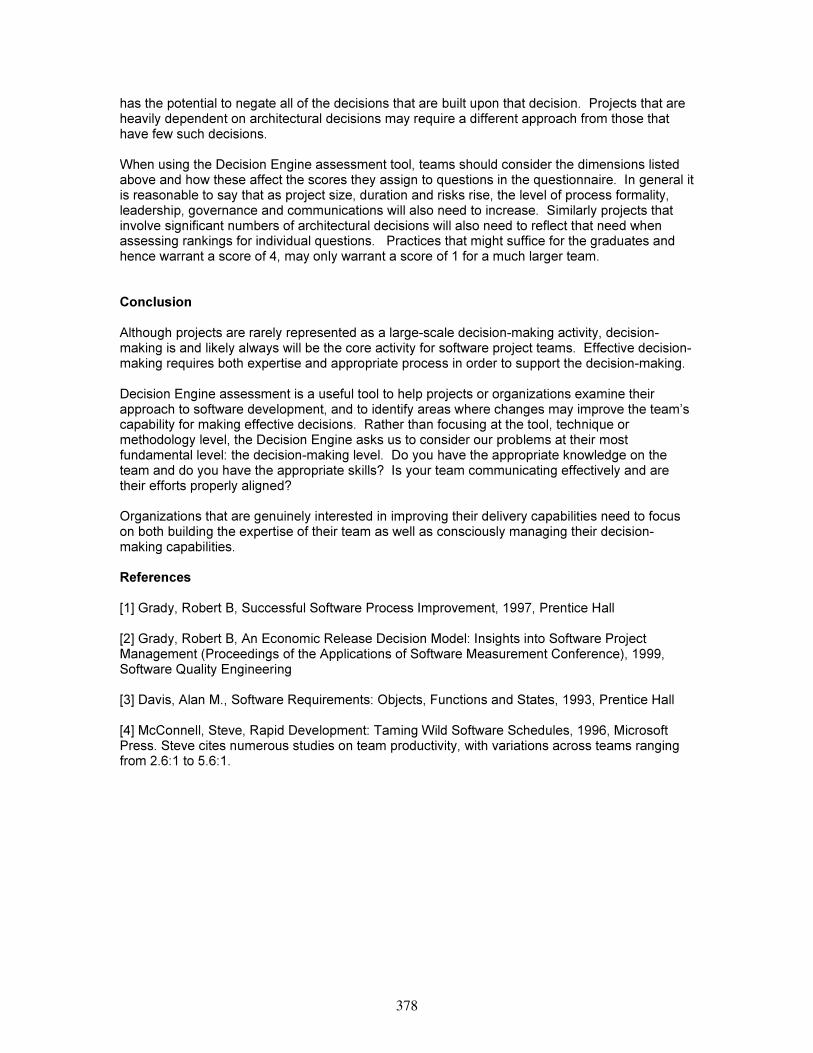
has the potential to negate all of the decisions that are built upon that decision. Projects that are
heavily dependent on architectural decisions may require a different approach from those that
have few such decisions.
When using the Decision Engine assessment tool, teams should consider the dimensions listed
above and how these affect the scores they assign to questions in the questionnaire. In general it
is reasonable to say that as project size, duration and risks rise, the level of process formality,
leadership, governance and communications will also need to increase. Similarly projects that
involve significant numbers of architectural decisions will also need to reflect that need when
assessing rankings for individual questions. Practices that might suffice for the graduates and
hence warrant a score of 4, may only warrant a score of 1 for a much larger team.
Conclusion
Although projects are rarely represented as a large-scale decision-making activity, decision-
making is and likely always will be the core activity for software project teams. Effective decision-
making requires both expertise and appropriate process in order to support the decision-making.
Decision Engine assessment is a useful tool to help projects or organizations examine their
approach to software development, and to identify areas where changes may improve the team’s
capability for making effective decisions. Rather than focusing at the tool, technique or
methodology level, the Decision Engine asks us to consider our problems at their most
fundamental level: the decision-making level. Do you have the appropriate knowledge on the
team and do you have the appropriate skills? Is your team communicating effectively and are
their efforts properly aligned?
Organizations that are genuinely interested in improving their delivery capabilities need to focus
on both building the expertise of their team as well as consciously managing their decision-
making capabilities.
References
[1] Grady, Robert B, Successful Software Process Improvement, 1997, Prentice Hall
[2] Grady, Robert B, An Economic Release Decision Model: Insights into Software Project
Management (Proceedings of the Applications of Software Measurement Conference), 1999,
Software Quality Engineering
[3] Davis, Alan M., Software Requirements: Objects, Functions and States, 1993, Prentice Hall
[4] McConnell, Steve, Rapid Development: Taming Wild Software Schedules, 1996, Microsoft
Press. Steve cites numerous studies on team productivity, with variations across teams ranging
from 2.6:1 to 5.6:1.
378

Decision Engine Assessment Questions
For each question below, respondents are asked to evaluate to what degree the statement
describes their project. If the statement is 100% true, the question should be given a rank of 5. If
the statement is completely untrue, a value of 1 would be assigned. Values can be entered to
reflect the degree to which the statement is a reflection of the project.
Respondents are asked to answer within the context of their project. For example, a 2 person
project requires less formality than a 200 person project. As such, even by following informal
practices, a 2 person project may score highly for a given question, where the same informal
practices may result in a low score for a 200 person project.
Rankings for each set of questions should be averaged in order to plot the results on a radar
chart.
Contact the authors if you are interested in participating in this assessment with your project
team.
Business Domain Knowledge
a) The team has extensive knowledge and experience of the business domain.
b) Full and up to date documentation of the business domain is available.
c) The team has the appropriate analytical skills to understand the business domain.
d) The team has access to the end-user community.
e) The business domain is highly complex.
Technical Domain Knowledge
a) The team has extensive knowledge and experience of the technical domain.
b) Architectural diagrams and technical documentation of the system area available and up to
date.
c) Tools in use have been used before, are stable and well understood.
d) The technical domain is highly complex.
Engagement and Participation
a) The project team includes representation from all affected stakeholder groups.
b) Team members have sufficient time available to participate in the project effectively.
c) People making decisions have the authority to make decisions.
Ownership and Commitment
a) Roles and responsibilities are clear.
b) People are willing to take ownership for decisions.
c) People are willing to commit to decisions.
Shared Understanding
a) Key decisions are clearly identified and expressed.
b) Key decisions are recorded.
c) Key decisions are communicated to all affected parties.
d) Records are organized and easily accessible to all.
e) Records are clear and unambiguous.
Governance and Control
a) Key decisions are stable once made.
b) A mechanism is used to ensure the impact of changes are properly assessed.
c) A mechanism is used to ensure changes are properly communicated to all affected parties.
d) Steps are taken to validate risky decisions before committing fully.
e) Key decisions are validated through an appropriate peer review or test process.
379

Leadership and Direction
a) The project has clear goals towards which it is working.
b) The project has established clear scope boundaries within which to work.
c) A plan is followed that allows the team to focus on performing the work in a logical sequence.
Integration
a) Information is flowing effectively between team members.
b) Team members are cooperating with each other.
c) All individuals who need to participate in a key decision are included in the decision-making
process.
d) The project timeline allows sufficient time for all necessary work to be completed successfully.
An on-line version of the questionnaire is available at:
http://www.clarrus.com/services/Decisions_assessment.htm
Users of the on-line version will be provided with an email response that includes the radar chart
showing the outcome of the assessment.
380

Resistance as a Resource
Dale Emery
http://www.dhemery.com
You are a quality professional, creative, intelligent, and insightful. Part of your
job is to improve your organization. You identify a need, envision an
improvement, and make your proposal.
Someone to your right says, "But we tried that before, and it didn't work."
Someone to the left says, "But we've never done that before." Right in front of
you, a third person says, "But that's no different from what we're doing now."
From the background, you hear a rising chorus of, "But we don't have time!"
You're getting resistance. Now what do you do?
In this presentation, we will explore an approach that works — crank up your
curiosity and empathy!
Whatever else it may be, resistance is information— information about the values
and beliefs of the people you are asking to change, about the organization, about
the change you are proposing, and about yourself as a change agent.
This presentation is about how to turn resistance from a frustration into a
resource. You will learn and create new ways to interpret people's responses as
valuable information, and new ways to translate that information into effective
action to move forward with change.
Dale Emery helps software people lead more effectively to create greater value
for their customers, for their colleagues, and for themselves.
Dale has worked in the software industry since 1980, as a developer, manager,
process steward, trainer, and consultant. Since 1995, he has consulted to IT and
software product development organizations about leadership, software
development, process improvement, software testing, project management, and
team and interpersonal effectiveness.
Dale's personal mission is to help people create value, joy, and meaning in their
work. He especially enjoys helping people discover and apply untapped talents
to serve their deeply held values.
381

Three Definitions, Three Perspectives
Resistance is any response that I don’t like. From this perspective, it is thechange agent’s likes and dislikes that determine whether a response is resistance.Though we change agents don’t admit that this is what we mean by resistance, weoften act as if this is what we mean.
Resistance is any force that opposes change. In this perspective, what makessomeone’s response resistance is that it opposes some change. This definition putsthe change itself front and center. On the surface, this is a more neutral view ofresistance. But when we change agents use this definition of resistance, we oftenwield it with the assumption that the change is good, and therefore the resistance isbad.
Resistance is any response that maintains the status quo. The focus here, thestandard by which we determine whether a response is resistance, is the effect of theresponse with relation to the status quo. This definition acknowledges the intentionsof the person who is resisting: they are trying to preserve something that matters tothem.
382

What you want the person to do
Describe the specific, concrete actions that you want the person to do. Try todescribe what you want in sensory terms: What would you see and hear that letsyou know that the person is doing what you want? Be as specific as you can.What the person is doing or saying
Try to describe the person’s words or actions in sensory terms: What do you seethem doing or hear them saying?It can be tempting here to describe the person’s thoughts or feelings or attitude:“They’re afraid to try something new” or “they think it’s a bad idea.” Try to avoidmindreading here. Instead, focus on what you seem them doing or hear themsaying.
383
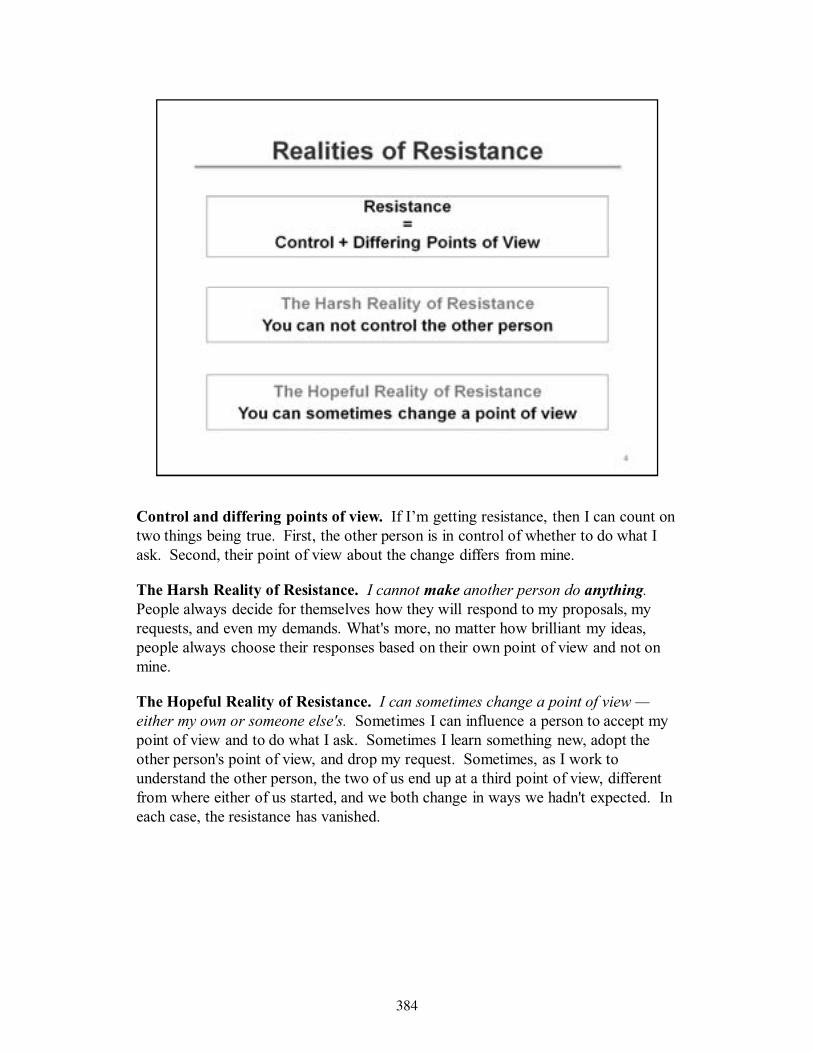
Control and differing points of view. If I’m getting resistance, then I can count ontwo things being true. First, the other person is in control of whether to do what Iask. Second, their point of view about the change differs from mine.
The Harsh Reality of Resistance. I cannot make another person do anything.People always decide for themselves how they will respond to my proposals, myrequests, and even my demands. What's more, no matter how brilliant my ideas,people always choose their responses based on their own point of view and not onmine.
The Hopeful Reality of Resistance. I can sometimes change a point of view —either my own or someone else's. Sometimes I can influence a person to accept mypoint of view and to do what I ask. Sometimes I learn something new, adopt theother person's point of view, and drop my request. Sometimes, as I work tounderstand the other person, the two of us end up at a third point of view, differentfrom where either of us started, and we both change in ways we hadn't expected. Ineach case, the resistance has vanished.
384

Build a Shared Point of View
If you want to resolve resistance, you must build mutually compatible points ofview with the people who are not doing what you ask. You might attempt this byredoubling your effort to persuade, by trying to explain your viewpoint so clearly, sobrilliantly, and so convincingly that the other person is won over. Unfortunately,there are problems with this method. One is that it requires you to know whatinformation the person would find clear, brilliant, and convincing. Another is thatpeople are not always open to being convinced.
A more reliable method — the key to resolving resistance — is to become curiousabout the other person’s point of view, and empathetic to their needs.
Overcoming Resistance versus Resolving Resistance
This presentation is not about how to overcome resistance. Striving to overcomeresistance means holding tightly onto your perspective. The tighter you hold, theless you learn about the other person’s perspective. The less you understand theother person, the less hope you have of changing their mind. And the less hope youhave of learning whatever wisdom their perspective can provide.
My approach is not to overcome resistance, but to resolve it. To resolve resistance, Imust be willing to change my own perspective.
385

What I’m asking for here are not reasons that someone might have for accepting orrejecting a request, but real examples of your reasons from your experience.
386

Four Factors that Affect Resistance
I have asked hundreds of people about their reasons for doing or not doingsomething that another person had asked them to do. From their answers, I haveidentified four broad factors that affect how people decide whether or not to do whatanother person asks:
• Motivations about the change
• Communication about the change
• The relationship with the person making the request
• Influences from the environment
387

Resistance as a Resource
A great way to learn about someone’s point of view about a change is to exploretheir responses — especially the responses that strike you as resistance. Everyresponse carries valuable information, clues about the person, about theenvironment around you, about your request, or about yourself. Treat each responseas a precious resource.
Clues About the Four Factors
The way people respond to your requests gives you clues to what people arethinking and feeling about the four resistance factors—motivations, communication,relationship, and environment. If you can interpret these clues, they can give younew options for resolving resistance. You just might end up with an outcome evenbetter than what you were asking for.
Interpreting the Clues
Let’s take a look at each of the four resistance factors. We’ll explore what makeseach factor important, how to interpret resistance for clues about each factor, andhow those clues can give ideas for resolving resistance.
388

Broccoli is healthy. You want your kids to be healthy, so you want them to eatbroccoli. Unfortunately, your kids won't eat broccoli. It tastes oogie. It lookswicked gross. And George H. W. Bush made it okay to just say no to the stuff.
All of that healthy broccoli is of little use if it stays on the plate. That's TheBroccoli Principle: It doesn't matter how healthy it is if they won't eat it.
The Broccoli Principle applies to your proposals, too, and not just to yucky healthyfood. No matter how beneficial you perceive your proposal to be, your impeccableidea will produce little value if people won't adopt it. And people will adopt orreject your proposal for their reasons, not for yours.
If you want people to adopt your proposals, understand their reasons—that is, theirvalues and expectations—and relate your proposal to their reasons.
389

The MARV Model of Motivation
People will do anything if:• They believe they are able• They believe they have a reasonably clear idea of what the results will be• On balance, they want the results they expect
Each factor is important. If people are convinced that they will not be able to do agiven action, they will be less likely to try, even if they would enjoy succeeding. Ifthey have no idea what might happen, they will be less likely to try, even if theybelieve they are able. If they don't want the results they expect, they will be lesslikely to do the action, even if they believe they are able.
Not Quite Math
Motivation = Ability × Results × Value.
Don't take this "equation" seriously as being mathematically precise. I use it only asa handy summary of my Motivation Model. Each factor (confidence in ability,certainty about what will happen, strength of preference) can be high or low. If anyfactor is near zero, motivation will be low. And values have not only magnitudebut also valence (or sign)—we may be attracted to a given result (positive valence)or averse to it (negative valence).
390

Responses about Ability
• “I don’t know how to do t hat.”
Responses about Expected Results
• “It wouldn't work in our environment”
• “It's not going to help us ”
• “It takes too long ”
Responses about Value
• “ Don't tell the testers too much; they'll use it against us”
• “Why do testers need to know that anyway? ”
• “I don't get paid enough ”
• “It takes too long”
• “I didn’t want dishpan hands”
391

My friend Louise invited me many times to go sport kayaking, navigating white waterrapids in a one-person rubber raft called a "duckie." For years, I declined, fearing that I didnot have the skill I would need. One day Louise told me about a company that offered asport kayaking package for beginners that included training, life vests, and three expertguides to accompany a group of beginners down an exciting but relatively mild river. I wasintrigued. At long last, I accepted Louise's invitation.
The expert guides strapped us into seemingly unsinkable life vests, showed us to ourduckies, and trained us briefly. Then we set off down the river. Several times during the day,I fell out of my duckie and did a little freestyle white water swimming. By the end of theday, I was shooting the rapids with at least a little skill, and I yelled with exhilaration as Isplashed through the longest, most treacherous rapids at the end of the course.
I had declined Louise's invitations for so long not because I was unable to survive the rapids,but because I had feared I would be unable. My reluctance had come not from my actualability, but from my expectations about my ability.
What changed my mind?
Louise offered me training on sport kayaking. The company trained people who, like me,were complete novices. Part of the training was practice. We practiced on a very smallpatch of barely moving rapids, which would give me a small taste before deciding whetherto set off down the river.
This trip was designed for beginners. It was on a relatively mild river, which means that itwould be a relatively safe environment for my first experience with sport kayaking. Andaccompanying us would be three expert white-water guides, which meant that even if wegot into trouble, help would be nearby.
392

Acknowledge each point of agreement. Often we tend to focus on our points ofdisagreement. This can give the impression that we disagree more than we do.Make a point of acknowledging the expectations you agree with.
Negotiate ways to test differing expectations. My William Pietri says, “When theworld knows something that people disagree about, it's worth asking the world.”Can you run a small experiment or two that would help sort out which expectationsare warranted?
Acknowledge your doubts. Do you have any doubts about the change you arepromoting? If so, acknowledge those. This can increase your credibility.
Adjust your expectations. As you talk with the other person and learn more abouttheir abilities, expectations, and values, adjust your own expectations based on whatyou learn. And as you update your thinking, let the other person know.
Adjust your request. Given what you’re learning through conversation with theother person, does your request still make sense? If not adjust it accordingly.
Offer new information. This is often the approach of first resort for change agents.I recommend offering new information only after you’ve heard the other personfully, and after they feel heard. Only then will they be able to hear your newinformation.
393

People resist loss. Change artist William Bridges says, “People don’t resist change,they resist loss.” If people are resisting, then you know there is something theyvalue, something of concern to them, that they expect to lose.
So listen carefully for any signs of what losses the person expects. Find out what isof concern for the person.
Acknowledge their concerns. If people believe that you don’t care about theirneeds, they will be less likely to listen cleanly to your ideas. So when peopleexpress their concerns, acknowledge them. You don’t have to agree that the personwill suffer a loss (see the next slide), but you must let the person know that youhave heard and understood their concern.
The Value Question. If you don’t what makes some concern that the person hasexpressed, you can ask The Value Question: “If you had that, what would that dofor you that is important to you?” The answer tells you about the concern behindthe concern.
Adjust your request. Can you adjust your request so that it avoids the loss that theperson expects?
394

Acknowledge the loss. If there will be a loss, acknowledge it. Be careful not todismiss the loss as you acknowledge it. For example, do not say, "Yes, this costsmoney, but it will also save time." Instead, say, "Yes, this will cost money," andstop. That way, people are more likely to understand that you hear what they aretelling you and that you are not deaf to their concerns. Once people know that youhave heard them, you can talk about some of the following ways to deal with theloss.
Show a gain instead of a loss. If managers fear that Extreme Programming maydecrease their control, can you show that it might instead increase their control? Ifpeople fear that code reviews would delay product delivery, can you show that theywould more likely speed delivery?
Prevent the loss. Can you upgrade the company's e-mail servers on the weekend,when fewer people will be affected by the down time?
Restore the value after the initial loss. Can you show how time spent now ondesign reviews will be repaid by time saved later?
Compensate the loss with some other value. Can you show that even if anotherweek of testing means delaying revenue, the reduced support cost will more thancompensate?
Limit the loss. Can you upgrade only one team to the new developmentenvironment, and have that team bring others up to speed with a shorter learningcurve?
395

Do they understand you?
If people don’t understand what you are asking them to do, they are less likely to dowhat you want. So: Do they understand what you are asking? How do you know?How can you find out?
Do you understand them?
You can respond effectively to resistance only if you understand what the person istrying to tell you.
So rather than quickly concluding, “Oh yes, of course I understand them,” pauseand check your communication. How do you know you understand them? Howcould you find out?
396

Intake. My internal communication process begins with Intake. Through my fivesenses, I become aware of the messages that some person is sending to me throughwords, gestures, tone of voice, facial expressions, or other means.
Meaning. My next step is to interpret the message. I give the message a meaning,based partly on information present in the message itself, and partly on informationfrom my own experience.
Significance. Now that I have interpreted the message, I next assign it asignificance. I create a feeling — happy, hurt, angry, afraid, proud, or any of athousand emotions — that indicates how the message affects the things I care about.The strength of the feeling signifies the size of the effect. The pleasantness orunpleasantness of the feeling signifies whether that effect is good or bad.
In this step, as in the Meaning step, I add a lot of information. The significance Iassign comes not just from the message, but also from the relationship of themessage to my goals, concerns, feelings, values, past experiences, and informationabout what is happening around me.
Response. Based on the message I've received, the meaning I've made, and thesignificance I've assigned, I start thinking of possible responses. I filter theseresponses through whatever rules I have about what is okay or not okay to say.Finally, I respond by doing or saying something.
For more information, see [Satir 1991] and [Weinberg 1993].
397

An Intake Error
Here's an example of how Intake can go wrong. Jennifer, a tester, has spent threedays testing the new customer contact database. She finished the testing, and senther test report to Robert, the test manager. The next day, Robert called Jennifer,furious. "You wasted three days testing the contact database? We tested thatalready! I told you to test the contract database!"
Test your Intake
When your communications get tangled, first make sure you are getting the Intakeright. Ask yourself, "What did I see and hear?" Then validate your answer with theother person. "Did you say to test the contact database or the contract database?“
Test the other person’s Intake
When others respond to you in a puzzling way, it may help to check their Intake.You might say, "I'm not sure what you heard me say," and ask them to paraphrase itback to you.
For more information, see [Weinberg 1993].
398

Think of three meanings
A helpful principle for testing meaning is Jerry Weinberg's Rule of ThreeInterpretations: If I can't think of at least three different interpretations of what Ireceived, I haven't thought enough about what it might mean. Before responding toany one meaning, think of at least two other possible meanings.
Ask
The Rule of Three Interpretations guide you to identify possible meanings. It isn’tabout mindreading. The person may have intended any of the three meanings youthough of, or might have meant something else altogether.
So once you have identified a number of possible meanings, test them. The simplestway is to tell the sender what meaning you made, and ask whether you got it right.
For more information, see [Weinberg 1993].
399
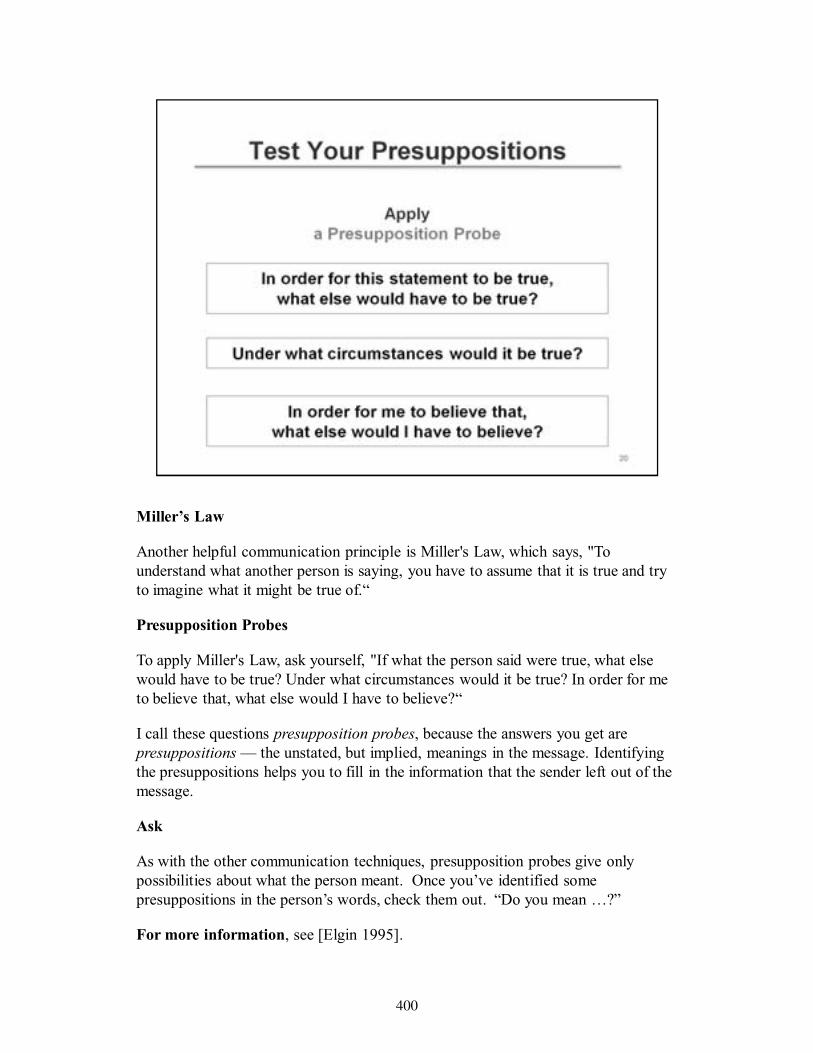
Miller’s Law
Another helpful communication principle is Miller's Law, which says, "Tounderstand what another person is saying, you have to assume that it is true and tryto imagine what it might be true of.“
Presupposition Probes
To apply Miller's Law, ask yourself, "If what the person said were true, what elsewould have to be true? Under what circumstances would it be true? In order for meto believe that, what else would I have to believe?“
I call these questions presupposition probes, because the answers you get arepresuppositions — the unstated, but implied, meanings in the message. Identifyingthe presuppositions helps you to fill in the information that the sender left out of themessage.
Ask
As with the other communication techniques, presupposition probes give onlypossibilities about what the person meant. Once you’ve identified somepresuppositions in the person’s words, check them out. “Do you mean …?”
For more information, see [Elgin 1995].
400

Our Pool of Personal Meaning
Each of us enters conversations with our own personal pool of meaning—orbeliefs, values, desires, and thoughts. And each person’s pool of personalmeaning differs from those of others in the conversation.
The Pool of Shared Meaning
If you want to resolve resistance (or any other kind of conflict), one usefulapproach is to fill the pool of shared meaning. Fully express your meaning ina way that the other person can hear. Invite the other person’s meaning, andmake it safe for the other person to express their meaning fully.
Similarities and Differences
Filling the pool of shared meaning is not about sorting out who is right andwho is wrong. Instead, focus on where your meanings are similar and wherethey differ. It can help to start with an area of agreement, then expand theconversation to include differences.
For more information, see [Patterson 2002]
401

Resistance and Relationships
Every time I ask a group of people their reasons for accepting or rejecting another’srequest, some of the most powerful reasons are about the relationship between theperson asking and the person being asked. For example:
• I understood how important it was to the person
• I trusted the person’s judgment
• I liked the person
• Didn’t want requester to look good
• Didn’t want to set a precedent for being a pushover
Your relationship enters the room before you do
Clearly, as these examples indicate, our relationships affect how we interpret andrespond to each other’s behavior. People who trust and respect you are more likelyto listen, understand, and respond as you ask. You are more likely to attend to theneeds of people you trust and respect. These factors greatly influence your prospectof resolving resistance.
402

Silence means to willfully withhold meaning from the pool of sharedmeaning. People move to silence when they don’t feel safe putting theirmeaning into the pool. Silence can take such forms as placating, sarcasm,avoiding sensitive subjects, or withdrawing from the conversation entirely.
Violence means trying to force your meaning into the pool and others’meaning out. Violence can take such blatant forms as name calling andinsulting, and more subtle forms such as overstating facts, speaking inabsolutes, or “leading” questions.
Safety. People move to silence and violence when they do not feel safeputting their meaning into the pool. If people do not feel safe, yourrelationship likely lacks one of two key safety conditions: mutual purposeand mutual respect.
Mutual Purpose and Mutual Respect. The next four slides give ideas abouthow to increase mutual purpose and mutual respect.
For more information, see [Patterson 2002]
403

Why Listening Matters. You can move forward only when the other person feelsfully heard and understood. The test is not whether I think I’ve heard andunderstood, but whether the other person feels heard and understood.
Test for Listening. In any situation in which listening is especially important, myfirst goal is to make sure I am prepared to listen. To test how well I am prepared tolisten, I ask myself, "To what extent am I willing to be changed?“ If I enter aconversation intent on persuading the other person to my point of view, unwilling tochange my own point of view, I limit my ability to listen.
Test for Understanding. To test my understanding, I say what meaning I'm makingof the person's words and behaviors, then ask "Is that what you mean?" If the personreplies, "Yes, that's what I mean," I've understood. If not, I haven't.
Test for Listening Fully. To test whether I have listened fully, I ask, "Is there morethat you want to say?"
Sometimes the person has more to say, and says it. I use the "test for understanding"to make sure I've understood the new information and how it fits with what theperson said earlier. Then I ask again, "Is there more?" When the person says, "No,there's no more I want to say," I've listened fully.
Relationships and Listening Fully. Listening fully can be a big step towardrepairing a damaged relationship. Listening fully can build mutual respect, and giveyou the information you need to build mutual purpose, and can therefore buildsafety in the relationship.
404

Focus on needs. “No” indicates an unmet need. Listen carefully for anyexpression of needs, especially for expectations of loss. Then acknowledge theperson’s concerns.
Before persuading, empathize. Acknowledge the other person’s concerns. “Itsounds as if delivering on time is really important to you. Is that right?” Then stopand wait for confirmation or further information.
Requests for empathy. Silence and violence indicate unmet needs. Treat them asrequests for empathy.
Seek agreement on needs. Do you share the need that the other person isexpressing? If so, clearly express your own commitment to the need. If not, youmay need to ask The Value Question to identify a deeper concern that you do agreewith.
Relate expectations to needs. Once you have agreement on needs, then talk abouthow your request and their response related to the shared needs.
Invite empathy. Express your own needs, and ask whether they are a concern forthe other person.
405

Generous Interpretations. If you find yourself attributing the person’s response tosome unflattering personal characteristic. Maybe you imagine they’re respondingthat way because they are stupid, or incompetent, or uncaring. If you find yourselfmaking such ungenerous interpretation, stop and find a more generousinterpretation.
Can you think of a reason that an intelligent, competent, sincere, well-meaningperson might respond in that way to your request?
The Danger of Ungenerous Interpretations. What if you just can’t bring yourselfto see the other person as intelligent, competent, sincere, and well-meaning? Whatif, for example, you are certain that the person is incompetent? Then one of twothings is true:• You’re right, and the person truly is incompetent. In this case, congratulate
yourself for your perception, and then notice this: You are asking the personto do something you don’t think they can do. This is not a high-payoffstrategy, so stop it.
• You’re mistaken, and the person is actually competent. In this case, yourjudgment of incompetence is unwarranted, and is very surely distorting yourunderstanding of their response and their intentions, keeping you fromlearning the very information you need to make progress. Again, this is nota high-payoff strategy.
Find a generous interpretation. Do everything you can to give the person’sresponse a generous interpretation. An ungenerous interpretation blocks you frommaking progress. It is only with a generous interpretation that you have any hopefor resolving resistance.
406

Story
Story is all of the stuff we bring into the room that isn’t happening here and now—all of our beliefs and judgments and expectations, good or bad, about ourselves, theother person, and our history and relationship. The way we tell the story greatlyinfluences what is possible in the conversation.
The hero and the villain
In the story we change agents tell ourselves about resistance, we’re always the goodguys. The “resisters” are always the bad guys. We may not come right out and sayit, or even think it, in such blatant terms, but below the surface we are making suchjudgments, and they are influencing our behaviors and our interpretations.
Three Stories
My story. We already know our story about this change and this resistance. Buthow would other people tell the story? In particular
Your story. What if the other person told the story of this resistance? Whatjudgments would they make about our behaviors and intentions? About their own?Try telling the story from the other person’s point of view, and notice how it differsfrom your story. Then ask the other person to tell the story.
The third story. How would a neutral third person tell the story? Try telling thestory with only description and no judgment of any kind about either party’sbehavior or intentions. How does this story differ from yours? From the otherperson’s?
407

Why Environment Matters
The environment can
• Expand or limit what is possible
• Support or hinder your change
• Expand or limit people’s expectations about what is possible.
Limiting Possibilities. If every expense over $25 needs the CEO’s approval, thatlimits the kinds of change people can make.
Hindering Possibilities. If people are always working under urgent, high-pressuredeadlines, they are less likely to have time for whatever learning curve your idearequires. Even though it would be possible for them to take the time to learn youridea, the environment hinders that.
Lowered Expectations. If people are discouraged or cynical, that’s a sign thatsomething in the organization environment has lowered their expectations aboutwhat is possible. Your change might be possible in the organization, but peopledon’t believe it is possible.
For more information, see [Porras 1987].
408

I once worked for a large, successful company that made computer hardware andsoftware. The company’s policy was that it would run on its own hardware andsoftware, not on products made by competitors. This allowed the company to be ashowcase for its own products.
The company issued a new policy: The company would now run on its betahardware and software. This would allow product teams to get early, relevant betafeedback from real use of its products.
After a few months, the organization noticed that its system administrators were stillrunning the company on released products, and not on beta versions. In some cases,the administrators were not even using the most recent releases, but older versionsof the company’s products.
I was asked to investigate: Why were administrators resisting company policy?
I quickly learned the answer. System administrators’ pay was based on quarterlyperformance ratings. The primary factor in those ratings was system uptime.Installing any equipment or software, whether released or beta versions, requireddowntime. Running beta products increased the risk of even more downtime.
The system administrators, caught between conflicting priorities, chose the policythat affected them most directly.
For more information about the influence of the formal organization see [Porras1987]. Porras uses the term “Organizational Arrangements” instead of “The FormalOrganization.”
409

I once worked for a company that manufactured CAD/CAM systems. The productincluded a number of printed circuit boards, also manufactured by the company.The PC boards passed through a series of inspections and tests before beingcombined into the final product. I wrote software to track the results of thoseinspections and tests, to spot problems in the equipment and processes by which wemanufactured the PC boards.
The company ran into financial trouble and closed the plant where I worked.Several months later I was consulted by one of the other plants to help themunderstand why the software was no longer identifying problems.
I learned that inspectors sometimes overlooked certain kinds of defects that weredetected only later during the testing process. The managers had had the softwaremodified to report such instances. From these reports they identified “good”inspectors and “bad” inspectors.
Inspectors and testers learned of these reports. Testers learned that if they reportedcertain kinds of defects, the inspectors—who were their friends—would get introuble. So instead of reporting the defects, they corrected the defects withoutreporting them. As a result, managers could no longer rely on the program’s reportsto identify problems in the processes and equipment.
For more information about the influence of the informal organization see [Porras1987]. Porras uses the term “Social Factors” instead of “The InformalOrganization.”
410
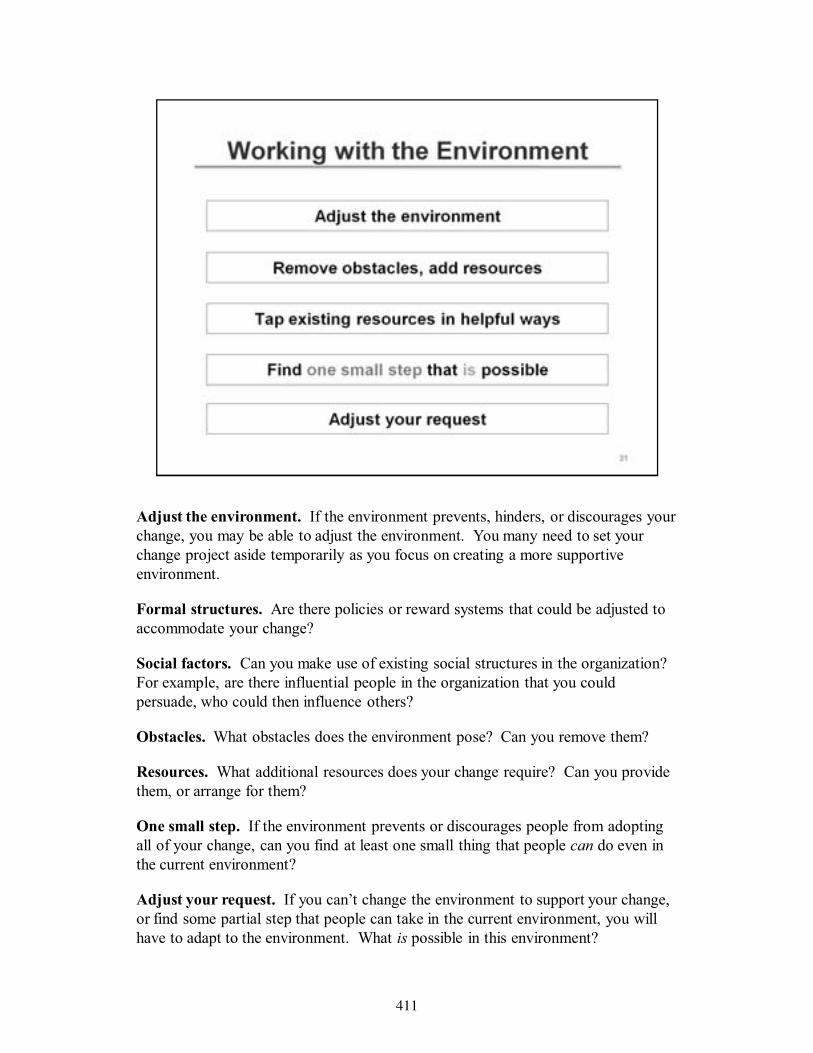
Adjust the environment. If the environment prevents, hinders, or discourages yourchange, you may be able to adjust the environment. You many need to set yourchange project aside temporarily as you focus on creating a more supportiveenvironment.
Formal structures. Are there policies or reward systems that could be adjusted toaccommodate your change?
Social factors. Can you make use of existing social structures in the organization?For example, are there influential people in the organization that you couldpersuade, who could then influence others?
Obstacles. What obstacles does the environment pose? Can you remove them?
Resources. What additional resources does your change require? Can you providethem, or arrange for them?
One small step. If the environment prevents or discourages people from adoptingall of your change, can you find at least one small thing that people can do even inthe current environment?
Adjust your request. If you can’t change the environment to support your change,or find some partial step that people can take in the current environment, you willhave to adapt to the environment. What is possible in this environment?
411

References
Elgin, Suzette Haden. BusinessSpeak. New York: McGraw-Hill, 1995.
Emery, Dale H. Conversations with Dale (weblog). www.dhemery.com/cwd
Emery, Dale H. “Resistance as a Resource.”www.dhemery.com/articles/resistance_as_a_resource.html
Patterson, Kerry et al. Crucial Conversations. New York: McGraw-Hill, 2002.
Porras, Jerry I. Stream Analysis. Reading, MA: Addison-Wesley, 1987.
Satir, Virginia et al. The Satir Model. Palo Alto, CA: Science and Behavior Books,1991.
Weinberg, Gerald M. Quality Software Management Volume 2: First-OrderMeasurement. New York: Dorset House Publishing, 1993.
412

A Tool to Aid Software Practitioners in Selecting a Best-Fit Project
Methodology
I Nengah Mustika Robert F. Roggio
Idea Integration, Inc. School of Computing
Jacksonville, FL 32202 University of North Florida
email: [email protected] Jacksonville, FL 32224
email: [email protected]
Brief Biographies
I Nengah Mustika received a Master of Science in Computer and Information Sciences from the
University of North Florida in April 2007. Since 2004, he has been working as a Solution
Developer for Idea Integration, Inc. in Jacksonville, Florida. Idea Integration is a consulting and
technology solutions firm specializing in application development, business intelligence,
infrastructure, information security, and interactive marketing
Bob Roggio is a professor of computer and information sciences in the School of Computing at
the University of North Florida. Prior to his academic career started in 1981, Bob spent twenty
years in the U.S. Air Force where his principal duties centered on the design, development and
implementation of a wide range of computing applications. He holds a B.S. degree in
mathematics from Oklahoma, an M.S. degree in computer science from Purdue, and a Ph.D. in
Computer Engineering from Auburn.
Abstract
Project failure in information technology is often attributed to project development underpinned
with little or no regard to any defined process. So, what are some practical measures that might
be undertaken by software practitioners that would increase the probability of a successful
development effort? Would selecting an appropriate software development methodology
favorably impact the likelihood of a successful effort?
This paper discusses the implementation of a web-based application designed to assist software
practitioners in selecting a “best-fit” methodology. Through a short series of questions, answers
relating to project characteristics (team size, criticality of the development, need for heavy
documentation, and more) are used to compute scores that suggest a methodology that best fits
the project. The application provides a framework that is extensible, and can accommodate
additional questions and methodologies. At the time of this writing, the application is not
available in a public domain; however, the algorithm will be provided upon request.
1. Introduction
IT project failure rate of software development projects continue to plague organizations.
According to The Standish Group Report, a report published by an IT research group located in
Massachusetts, the United States spends in excess of $275 billion annually on approximately
200,000 projects related to IT application development. "Many of these projects will fail, but not
for lack of money or technology; most will fail for lack of skill and project management" [13].
413

Significantly, these failures are often attributed to project development with little or no regard to
any defined process.
Software Engineering is an expanding discipline, and both new and improved development
methodologies seem to emerge each year. The appearance of these methodologies is often the
result of attempts to improve software development processes needed to guide the every-
increasing complexity and diversity of modern computer-based solutions.
Two classes of methodologies have evolved and are, with some modifications, commonly
accepted classifications used across the software development industry. They are heavy weight
and light weight methodologies. The heavy weight methodology is also called a plan-driven
methodology because of its support for comprehensive planning, thorough documentation, and
detailed design [3]. Light weight methodologies are often referred to as agile methodologies, and
these emphasize individuals over processes, working software over documentation, collaboration
over negotiation, and responding to change over following a plan. Please note these contrasting
descriptions do not propose that the second item is not important (for instance documentation is
less important than working software); rather, it is generally less important than the first [6].
This paper will first present a very brief description (with references for more information) of
some popular software methodologies followed by a discussion of a number of major project
characteristics. This background will set the stage for discussion and screen shots of the
methodology tool.
2. Heavy-Weight Methodologies
Heavy-weight methodologies are also known as “traditional” methods; these methodologies are
typically “plan-driven” in that their process begins with the elicitation and documentation of a
nearly complete set of requirements, followed by architectural and high level design,
development and implementation. (Note: terms heavy-weight, traditional, and plan-driven will
be used interchangeably throughout this paper.)
2.1 Waterfall Model
According to Reed Sorenson, Waterfall is “an approach to development that emphasizes
completing one phase of the development before proceeding to the next phase” [11]. In
Sorenson’s article titled “A Comparison of Software Development Methodologies,” he describes
which methodologies may be best suited for use in various situations and how the use of
traditional software development models is widespread and often regarded as the proper and
disciplined approach for the analysis and design of software applications. Each phase comprises
a set of activities and deliverables that should be completed before the next phase can begin.
Change is not embraced and risk is typically addressed late in the development cycle.
2.2 Spiral Methodology
While the Waterfall model has become the basis of software development, its elaborate
documentation and rather rigid approach to process has created difficulties and led software
practitioners to seek alternative processes. A number of years ago, Barry Boehm developed the
Spiral Model with its distinguishing feature that “…creates a risk-driven approach to the
software process rather than a primarily document-driven or code-driven process” [4]. Spiral
414

still significantly resembles the waterfall model, but its emphasis on risk was a significant
improvement.
2.3 The Rational Unified Process (RUP)
“RUP is a process framework that has been refined over the years by Rational Software (and
more recently IBM), on a variety of software projects, from small to large.” [10] The RUP
approach is a lighter heavy weight method, where the aim is to work with short, time-boxed
iterations within clearly articulated phases. Elaborate workflows, specification of activities and
roles characterize some of RUP’s main features [7]. The RUP is in widespread use nowadays and
is gaining more and more acceptance particularly for larger projects even though it may be
tailored for much smaller projects.
3. Agile Methodologies
The agile methods place more emphasis on people, interaction, working software, customer
collaboration, and change, rather than on processes, tools, contracts and plans. Agile
methodologies continue to gain popularity in industry as more streamlined approaches to
software development are sought so that applications may be developed reliably but in shorter
timeframes. Agile techniques, in general tend to blend or abbreviate some of the more
traditional development activities in an effort to use a ‘leaner’ approach to development. Some
of these precepts mix accepted and controversial software engineering practices. Although some
practitioners will assert plan-driven approaches are still largely used for larger projects that
require the ultimate quality, reusability, documentation and similar characteristics, many others
quickly assert more significant growth lies with agile or flexible methods.
3.1 Feature Driven Development (FDD)
Feature Driven Development (FDD) is a model-driven, short-iteration software development
process [1]. The FDD process starts by establishing an overall model shape. This is followed by
a series of two-week “design by feature, build by feature” iterations. According to Boehm and
Turner, FDD consists of five processes: develop an overall model, build a features list, plan by
feature, design by feature, and build by feature [3].
3.2 Scrum
One of the most popular agile methodologies is the Scrum software development approach.
Scrum is an iterative software development approach which aims to deliver as much quality
software as possible within a series of short-time boxes called “Sprints” [12]. Each ‘sprint’
addresses several work items captured in a Backlog. Sprint begins with a Sprint Planning
Meeting where the product owner, customers, developers and other relevant stakeholders meet to
define the immediate Sprint Goal. The final list of product items is transferred from Product
Backlog to Sprint Backlog. The Product Backlog is a list of requirements, product items, and or
prioritized product features desired by the customers.
After addressing the Product Backlog, Scrum development process focuses on addressing the
Sprint Backlog. According to Linda Rising and Norman Janoff [9], the Sprint Backlog is the
final list of product items ultimately transferred from the Product Backlog. The Scrum Team
breaks down the Sprint Backlog into small tasks and allocated them to its team members. The
Sprint Backlog is updated daily to reflect the current state of the sprint. Every day a short
meeting called (“Daily Scrum Meeting”) to track the progress of the Sprint. After 30 days of the
415

sprint, a “Sprint Review Meeting” is held to allow developers to demonstrate their results to the
product owner.
3.3 eXtreme Programming (XP)
XP is “a discipline of software development based on values of simplicity, communication and
feedback” [9]. This methodology works by bringing the whole development team together to
collaborate in simple practices, with enough feedback to allow the team to see and monitor their
project improvement and be able to address any issue that occurs throughout the phases of the
development process.
Agile methodologies such as eXtreme Programming seem to be the most suitable in responding
to requirement changes. Communication between team members is conducted through informal
contact, such as face-to-face meetings. Face-to-face communication is also utilized when
communicating with customers [3].
4. Analysis of Project Characteristics
Software projects have a number of variables that will impact the development process. Team
size, urgency, and product safety, for example, can influence which methodology should be
chosen. This paper presents key project characteristics to be considered in determining the best
approach for methodology selection.
4.1 Team Size
According to Kent Beck in his book, Extreme Programming Explained, team size is a great
determining factor when selecting software methodology. Beck says, “You probably couldn’t
run an XP project with a hundred programmers. Not fifty nor twenty. Ten is definitely doable”
[2]. Agile methodologies seem to work best with smaller projects and teams of up to ten people.
Conversely, methodologies such as the RUP are usually associated with larger team size. Large
team sizes often have more roles to be fulfilled (such as only in testing: test designer, integration
tester, system tester, performance tester…), more detailed documentation (many produced
artifacts), and very specific activities [7]. It is sometimes clear that larger problems/systems
typically require a larger team size and a larger, more comprehensive methodology. According
to Alistair Cockburn, “a larger group needs a larger methodology” [5]. The smaller team size
usually associated with agile methodologies forces the process to have tight coordination
between team members, and usually relies on tacit knowledge that prevents agile methods
supporting a team size in excess of forty [3].
4.2 Project Communication
Heavy methodologies typically employ comprehensive communication procedures. All
foreseeable events and issues are usually documented. Meetings and reviews seem to abound.
RUP, for instance, initiates the documentation process from the inception phase.
“Traditional development approaches create much documentation. Such records serve as useful
artifacts for communication and traceability of design” [8]. This documentation generally
codifies process and product knowledge. Communication among project team members is
416

formalized through these documents. In agile approaches, however, the communication is
conducted very frequently and normally person-to-person. Additionally, agile teams mostly rely
on “tacit knowledge” instead of “explicit documented knowledge” [3]. Means of
communications can impact methodology.
4.3 Project Primary Goals
Methodology selections differ accordingly when addressing different project goals. If the
primary goals of the project are to address high assurance, predictability, and stability, a heavier
methodology appears to be the better choice [3]. Projects that implement safety critical or health
critical requirements such as medical instruments, air traffic control, and military operations,
should likely require a plan-driven methodology to include specific documents that adhere to
certain standards.
Agile methodologies focus on different priorities, such as rapid changes and responsiveness.
“This is a reactive posture rather than a proactive strategy” [3] say Boehm and Turner. If the
primary goals of the project are to address rapid and proactive changes, then agile methodologies
are better able to adapt rather than heavier ones which must consider the established plan,
documentation requirements, and more. Methodologies that are less bureaucratic and do not rely
on documentation tend to allow for a more rapid process and quicker turn-around.
4.4 Project Requirements: Anticipated Rate of Change
Agile methods convey project requirements in an informal way; such as informal stories of
clients and users. Close interaction between the clients and the development team is normally
accommodated to address requirement priorities included in each iteration. “Plan-driven methods
generally prefer formal, base-lined, complete, consistent, traceable and testable specifications”
[3]. Heavy methodologies such as the System Development Life Cycle (SDLC) usually first
identify requirements, specify the requirements and then hand off the software requirements to
an appropriate development team. Additionally, these plan-driven methods also focus more on
dealing with quality of nonfunctional requirements such as reliability, throughput, real-time
deadline satisfaction, or scalability [3].
4.5 Project Planning and Control
Plan-driven methodologies emphasize project planning. With Spiral, for instance, the project is
reviewed and plans are drawn up for the next round of activities within the spiral. Another plan-
driven methodology such as the RUP, considers planning as activities which produce artifacts;
such as a “…software development plan (SDP), business case, and the actual process instance
used by the project” [7]. Some projects rely on heavily documented process plans (schedules,
milestones, etc) and product plans (requirements, architectures, and standards) to keep
everything coordinated.
In marked contrast, agile methodologies perceive “planning as a means to an end” rather than a
means of recording text [3]. Most planning is completed through a deliberate group planning
effort rather than a part of the methodology itself.
4.6 Design and Development
Architecture plays a central role in a plan-driven methodology such as the RUP. Kruchten says
that a large part of the Rational Unified Process focuses on modeling [7]. Plan-driven
417

methodologies advocate formal architecture-based designs; projects need to utilize architectural-
based design to accommodate foreseeable changes. Software reuse and robustness are primary
goals.
Agile methodologies advocate simple design. “The simpler the design the better” is one of the
extreme programming goals [3]. Such methodologies look at only catering to the minimum
requirements as set up by the users or customers. They do not anticipate new features and in fact
expend effort to remove them. “Design for the battle, not the war,” is the motto of YAGNI
(“You Aren’t Going to Need It”), [3] as stated by Boehm and Turner. This means that the design
should conceal what is being developed and requested by the customers.
4.7 Testing
One of the agile methodologies’ important concepts is “test-driven development.” Using agile
methods, functions/methods or modules are incrementally tested. According to Boehm and
Turner [3], the test cases are normally written by developers with customers’ input before and
during coding. This approach will minimize the developers’ dependency on requirements
documentation, requirement test metrics, and test cases.
Rigorous testing is essential for high-quality software, such as air traffic control, missile
guidance, and others where failures can be very harmful. For plan-driven methodologies, testing
is not a single activity; a plan-driven methodology, such as the RUP, addresses testing issues
from the inception phase of the development life cycle. Kruchten states, “If developers are to
obtain timely feedback on evolving product quality, testing must occur throughout the lifecycle”
[7].
4.8 Team Skills
In an Agile development environment, the many decisions are made by the development team
and the customers; therefore, adoption of an agile methodology typically requires more technical
skills on the part of team members [3]. The development team is subject to knowing how to
capture requirements, code, and communicate with the customers. It is more difficult to
assimilate entry level individuals into a project.
Plan-driven methods need fewer people with high level and diverse competence because each
role is specified with the particular skill of the team members. For example, using XP, the
requirement gathering, coding, and testing are oftentimes handled by the same people; however,
with RUP, requirements gathering will be accomplished by business analyst(s), coding will be
done by a team of developers, and testing will be completed by quality assurance teams
(consisting of a test manager(s), test analyst(s), test designer(s), and tester(s)). These four main
roles of the test discipline characterize use of the RUP methodology [7].
4.9 Customer Relations
Customer Relations is an important area that needs to be addressed during the project lifecycle.
Customer relations may be quite different from methodology to methodology. Heavy
methodologies generally depend on some form of contract between the vendor and clients as the
basis for customer relations. Both parties attempt to deal with foreseeable problems by working
through them in advance and formalizing the solutions in a documented agreement.
418

Nonetheless, having formal contracts can cause project start-up delays since contracts usually
require enormous efforts and process. Contracts need to be extremely precise to encompass all
perceived expectations. An incomplete or imprecise contract can lead to unsatisfactory results
due to incomplete or unmet expectations. The net result may lead to project failure and lead to a
loss of trust and an adversarial relation between the vendor and the customer. Heavy
methodologies cache on their process maturity to provide confidence in their work [3].
Light methodologies, such as Scrum, strongly depend on the dedication and collaboration of
customer representatives and the client to keep the projects focused on adding rapid value to the
organization [3]. However, care must be taken to ensure these customer representatives act as
liaisons and further that there is total sync between the system users they represent and the
project team. If the representatives do not completely understand the user needs or are unable to
reflect them to the systems development team, there can be total project failure. Light
methodologies use working software and customer participation to instill trust in their track
record, the systems they have developed, and the expertise of their people.
4.10 Organizational Culture
Organizational Culture is another essential factor to consider when selecting a project
methodology. If the organizational culture dictates that clear policies and procedures will define
a person’s role then heavy methodologies tend to better fit that organization. In this case, each
person’s task may be well-defined and documented. The general rule is that each developer,
programmer, analyst will accomplish the tasks given to him or her to exact specifications so that
their work products will easily integrate into others work products. Often individuals have
limited knowledge of what others are actually doing [3]. Roles and responsibilities within the
defined process are clear throughout the project and across the organization.
If organizations are less rigid, people have more freedom to define their work-roles, and policies
are made as required, then a light methodology might be a better fit. In this case, each person is
expected and trusted to do whatever work is necessary to assure a successful project. There is
often no definite role or scope of work that has to be completed by each person. It is expected
that unnoticed tasks are completed by the person who first notices them and similar work ethics.
One person may wear different hats at different times for the purpose of task completion.
5. An Algorithm for Choosing a Methodology
The above project characteristics may assist software practitioners in selecting a “best-fit”
methodology, but how are these process characteristics compiled to give the practitioners the
answer? To answer this question, a calculation metric is defined in Figure 1. This figure
illustrates the score calculation for both heavy and light-weight methodologies. Two formulas
are used to obtain the total score of each methodology. The use of a particular formula depends
on the project characteristic; for instance, if the project’s primary goals require the system to be
predictable and stable, this would favor the heavyweight methodologies. For this project
characteristic, heavyweight methodologies such as Waterfall, Spiral, and RUP will use the
following formula: Score * Weight.
Conversely, to address the same characteristic, such as “the project’s primary goals require the
system to be predictable and stable,” the agile methods will use the following formula:
419

((MaxScore + 1) – Score) * Weight). The MaxScore is used because the maximum score each
methodology can receive is the value of five (5), as represented on User Interface of this
application, where each question is provided with five radio button options. These values (1 - 5)
are typically found on many surveys and questionnaires.
5.1 Applying the Process
The pseudocode algorithm is presented more formally below:
1. Put each score for each question into one of two separate groups (heavy or lightweight).
2. Assign each question a value of between 1 - 5 (except the question for team size, which
has a range of 1 - 3). Determine how one value is related with the others and compare
them between each pair of groups.
3. Total each pair of groups to get the total scores.
4. Sort the totals.
5. Display result with methodology names and the respective score percentages.
5.2 Heuristics
To process the response to the questions answered by the users, the system uses rules of thumb
or heuristics based on research found on project characteristics. These heuristics produce patterns
for project characteristics scoring in relation to a particular methodology; that is, whether a
particular characteristic or question will favor the heavy or lightweight methodologies.
Example applied for “Anticipated Rate of Change, Project Documentation and Control”:
If the project requires stable requirements,
Choose heavier method such as the Waterfall Model
Else
Select light-weight method such as XP
End If
If the communication of the project is conducted through person-to-person or with
face-to-face communication,
Select an agile method like XP
Else
If all foreseeable communication needs to be documented,
Select a heavier method such as RUP
End If
End If
Example based on compound project characteristics:
If ((the project requires predictability and stability)
AND (the software will be developed using bare minimum requirements))
Select a methodology located somewhere between heaviest and lightest such as FDD.
End If
420

Project
Characteristics Characteristic Parameters SCORES WATERFALL SPIRAL RUP FDD SRUM XP
Team Size
1 Team size fewer than 10 1 0.4 0.5 0.5 3.5 0.8 0.9
2 Team size between 10 and 50 0 0 0 0 0 0
3 Team size greater than 50 0 0 0 0 0 0
Primary Proejct
Goals
1 Project requires predictability 5 4 4 4.5 0.5 0.4 0.3
2 Project is system critical 3 2.7 2.7 2.7 2.1 2.1 2.1
Requirement
Rate of Change
1 Requirements are stable over time 5 4.5 4.5 4.5 0.5 0.7 0.6
2 Requirement can be determined in advance 5 4.5 4.5 4 0.7 0.7 0.7
Doc., Planning,
& Control
1 Project needs heavy documentation 5 4.5 4 4 0.6 0.5 0.3
2 Project needs to be tracked against planning 5 4.5 4.5 4 0.7 0.5 0.3
Project
Communication
1
Communication procedures need to be
comprehensive 5 4.5 4.5 4 0.7 0.5 0.3
2 All foreseeable solutions needs to be communicated 5 4.5 4 4 0.6 0.6 0.3
3 Communication through person-to-person. 1 1.5 1.5 2 0.6 0.7 0.9
Design and
Development Project needs to use architecture based design
1 Software reuse and robustness is a primary goal 5 4.5 4.5 4.5 4 3.5 3.5
2 Develop bare minimum requirements 2 1.2 2.5 2.5 1.2 1.6 1.8
3 New features are not anticipated but rather removed 2 2 2 2 1.2 16 1.8
Testing
1
Testing will strictly be implemented based on
requirements, specification and architecture 5 4.5 4 4 0.6 0.4 0.2
2 Testing will be done incrementally 1 1.5 3 4 0.8 0.8 0.9
Team Skills
1
Level 3 - Able to revise a method to fit an
unprecedented new situation 2 2.4 2.8 2.8 1.6 1.6 1.8
2
Level 2 – Able to tailor a method to fit a precedented
new situation 2 2.8 2.8 3.2 1.6 1.6 1.8
3
Level 1A – With training, able to perform discretionary
method steps and with experience, can become Level
2 4 3.6 3.2 3.2 1.4 1.2 0.8
4
Level1B – With training, able to perform procedural
method steps (e.g. coding a simple method, simple re-
factoring). 5 4.5 4 3.5 0.5 0.6 0.3
Customer
Relations
1
Contract and process maturity are used to produce
confidence in the final product 4 3.6 2.8 2.4 1 0.6 0.2
2
Customer participation and colaboration are used to
instill confidence in the product. 3 1.5 1.8 1.8 2.1 2.4 2.7
Organizaitonal
Structure
1
Clear policies and procedures that determine a
person's role 5 4.5 3.5 3 0.5 0.4 0.2
2
Team members have high degree to determine
his/her roles and responsibility 3 1.5 1.8 2.1 2.1 2.4 2.7
TOTAL 35.2 34.2 33.7 7 6.7 5.8
L
I
G
H
T
W
E
I
G
H
T
H
E
A
V
Y
W
E
I
G
H
T
Figure 1. Methodology Scoring
An example of a question that favors heavyweight methods;
these methodologies use the first formula: (Score * Weight)
Example of a question that favors lightweight methodologies;
methodologies use second formula: ((MaxScore +1) - Score * Weight
421

5.3 Rationale for Internal Scoring
Each question in the user interface calls for an input that has a value ranging from 1 to 5. (See
“Score” column on Figure1). These values are typically found on many surveys and
questionnaires. There is nothing magical about these. However, each of these values is then
mapped into an internal integer value ranging from 1 to 10. The determination of these internal
values was reached via informal discussions with many practitioners in workplace environments.
The value of 1 to 5 is mapped to the internal values of 1 to 10 to obtain sub-total of score values
for each methodology. These sub-totals are than computed to produce the total scores for each
methodology, as seen on figure 6.
As previously stated, this system addresses ten major project characteristics, and these
characteristics propose a total of twenty six questions. To provide better system usability, the ten
characteristics are divided into five screens that flow in a wizard-like approach. To achieve the
best possible result for methodology selection every question in each screen should be answered.
6. Best-Fit Methodology Application.
6.1 Basic Tool Usage
Below are four screen shots of the application that prompts a project manager or those in charge
of selecting an appropriate methodology, to support development (not all screens are shown).
Sample data are indicated in Figures 2-5. Data are captured ‘by project characteristic.’ Sample
results are shown in Figure 6.
6.2 Reconfigurable Weights
While a preconfigured set of weights are presented for each metric, based on the above analysis
of project characteristics, an administrative tools menu allows the user to provide his/her own
weights for each metric. A user might see the ‘distance’ between the RUP and Scrum, for
example, as very distant and can enter one to ten different values. The application also allows
the user to store the results of running the application for comparative results. Thus, after one
run of the application, project managers may selectively change weights assigned to the
methodologies as well as to their own assessment of their project characteristics. See Figure 7.
By then answering the questions again, a new set of values is produced.
6.3 Project-Unique Questions
In addition to the above features, additional questions can be mapped to project characteristics.
Specific additional questions that may be of special importance to a project can be easily added
and factored in to the percentage calculation equations, as shown in Figure 8. Of course, while
the interface is easy to adapt to new questions, the internal computations must be added to the
source code and compiled into the executable. This, however, is not a difficult task no matter
what implementing language is used.
422

Figure 2. Selection for Team size and Project Primary Goals
Figure 3. Selection for Anticipated Rate of Change, Project Documentation, Planning and
Control
423

Figure 4: Selection for Project Communication, Design, and Development
Figure 5: Selection for Testing and Team Skills
424

Figure 6: Result of the Methodology Selection
Figure 7: Reconfigurable Weights
Figure 8: Add Question and Assign Weights for Every Methodology
7. Conclusions and Future Work
Software development is a complex human activity that requires the effective blending of many
technical skills, supporting development environments, and a host of behavioral and soft skills.
None of these are simple and all seem to exhibit a high degree of variability. Extensive upfront
planning is the basis for predicting, measuring, and controlling problems and challenges that will
arise during the development process. The objective of this paper is to organize, analyze and
address some of the major features that might lead to the selection of a heavy and agile software
development methodology. Based on the result of the presented analysis and tool use,
practitioners may be better able to make a more informed decision regarding methodology
425

choice. One software methodology does not fit all software development circumstances;
therefore, it hoped that this tool may assist software developers, project managers, and business
stakeholders in selecting a methodology that best fits their project.
This tool represents a work in progress, as we attempt to take the theoretical work presented here
in the form of a tool and make it more practical to add clear value to project managers who may
have a choice in methodology selection for project development. The heart of this algorithm is
the ability to produce a statistical data for software practitioners to use as guidance when
selecting their software methodology for their project. This tool has not yet been made publicly
available, as plans for its enhancement include adding a third dimension to the model. In
addition to a rather linear model (light to heavy), a reviewer’s suggestion was to add a cost axis.
This is an excellent idea. The authors will work to incorporate such a parameter into the model.
Other interesting suggestions include the degree of interaction / dependency with other systems
such as a BizTalk server, Web Services, COM objects, and others. Inclusion of additional
characteristics as parameters might lead to a better methodology choice, without significantly
complicating the model.
BIBLIOGRAPHY
[1]. Abrahamsson, P., O. Salo, J. Ronkainen and J. Warsta, Agile Software Development
Methods: Review and Analysis, Julkaisija Utgivare Publisher, Finland, 2002.
[2]. Beck, K., Extreme Programming Explained, Addison-Wesley, Boston, 1999, p. 157.
[3]. Boehm, B. and Tuner, R., Balancing Agility an Discipline, Pearson Education, Inc., Boston,
2004.
[4]. Boehm, B, “A Spiral Model of Software Development and Enhancement,” ACM SIGSOFT
Software Engineering Notes 11, 4 (1998), pp. 14-24.
[5]. Cockburn, A. and J. Highsmith, “Agile Software Development: The People Factor,”
Computer, 34, 11 (2001), pp. 131-133.
[6]. Coram, M. and S. Bohner, “The Impact of Agile Methods on Software Project
Management,” Engineering of Computer-Based Systems, 2005. ECBS '05. 12th IEEE
International Conference and Workshops (April, 2005), pp. 363-370.
[7]. Kruchten, P., The Rational Unified Process An Introduction, Addison-Wesley, Boston, 2004,
p. 43, 81.
[8]. Nerur, S., R. Mahapatra and G. Mangalaraj, “Challenges of Migrating to Agile
Methodologies,” Communications of the ACM 48, 5 (2005), pp. 72-78.
[9]. Rising, L. and N. Janoff, “The Scrum Software Development Process for Small Teams,”
IEEE Software 17, 4 (2000), pp. 26-32.
[10]. Smith, J., “A Comparison of RUP® and XP”,
http://www.yoopeedoo.com/upedu/references/papers/
pdf/rupcompxp.pdf, last revision 2001
[11]. Sorensen, R., “A Comparison of Software Development Methodologies,”
http://www.stsc.hill.af.mil/crosstalk/frames.asp?uri=1995/01/Comparis.asp, last revision
1995, last accessed December 20, 2006.
[12]. Sutherlan, J., “Future of Scrum: Parallel Pipelining of Sprints in Complex Projects”,
http://agile2005.org/RP10.pdf, last revision 2005, last accessed September 20, 2006.
[13]. The Standish Group Report, “Chaos Report,”
http://www.standishgroup.com/sample_research/chaos_1994_1.php, last revision 1995.
426

Process Optimization by Design
David N. Card
DNV ITGS
Dahai Liu and Stephen Kropp
Embry-Riddle Aeronautical University
David Card is the managing director of the US operations of Det Norske Veritas
Information Technology Global Services. He spent one year as a Resident Affiliate at the
Software Engineering Institute and seven years as a member of the NASA Software
Engineering Laboratory research team. Mr. Card is the author of Measuring Software
Design Quality (Prentice Hall, 1990), co-author of Practical Software Measurement
(Addison Wesley, 2002), and co-editor ISO/IEC Standard 15939: Software Measurement
Process (International Organization for Standardization, 2002). He is a Senior Member
of the American Society for Quality.
Dr. Dahai Liu is an assistant professor in the Human Factors and Systems department at
Embry-Riddle Aeronautical University. He is a member of HFES, IIE, AIAA and
INCOSE. Dr. Liu specializes in the areas of human computer interaction and systems
engineering. His experience includes human system performance modeling, quality,
simulation and usability engineering.
Stephen Kropp holds a Bachelor of Science Degree from Embry-Riddle Aeronautical
University (ERAU) in Aeronautical Science with a minor in Business Administration and
is currently working on a Master’s Degree at ERAU in the Human Factors and Systems
Engineering program. He currently works as a Systems Analyst in the Information
Technology Middleware Services Department at ERAU
Abstract
The “Lean” paradigm for process improvement is becoming increasingly popular in
software and systems engineering, as well as manufacturing. However, the Lean
influence arrives most often as redesign and rework in the form of a Kaizen event. This
article explains how the Lean principles can used to help design good processes from the
start. Moreover, since Lean is based on queuing theory, processes designed in this
manner can be optimized through simulation. The article demonstrates the application of
these concepts with results from a simulation study of an industrial software process. It
also discusses the relationship of Lean concepts to Agile and the CMMI.
Introduction
Many different approaches to process improvement have found their way into the
software and information technology industry in recent years. Lean [1] is a current focus
of discussion. Lean thinking evolved from concepts employed at Toyota beginning
around 1950. Lean derives from experience in manufacturing, but has been applied
427

successfully in service and software processes [2]. The five widely recognized Lean
principles [1] are as follows:
• Value – identify and focus on the value to be produced for the customer
• Value Stream – manage the process (stream) producing the value
• Flow – maintain a smooth flow of work products through the process
• Pull – only produce work products when the next process step or customer is
ready
• Perfection – make each work product defect free, including intermediate work
Each of these principles includes both a cultural and technical component. Although this
author recognizes the importance of culture to successful process improvement, this
article focuses on the technical component of Lean, which is often misunderstood and
misapplied. The cultural components include language, national culture, and general
adoption challenges. While these are important, too, they can only be addressed once the
technical foundation has been properly understood.
Typically, Lean principles are deployed through Kaizen events where processes (often
laboriously established through CMMI, ISO 9001, and Six Sigma-based approaches) are
reworked to remove “waste”. A Kaizen meeting focuses on improving a selected portion
of the value stream, or process, by identifying obstacles to realizing the Lean principles.
Fortunately, those organizations just beginning the process improvement journey have
the option of building the Lean principles into their processes from the start through
“Process Optimization by Design”, rather than through later Kaizen working meetings.
Lean and Process Definition
Many people have come to believe that Lean is about the volume or quantity of process
description. That is, it is commonly believed that a Lean process is one that is defined in
a few pages of text and diagrams, rather than a more lengthy document. Actually, the
word “lean” in the process context, refers to the amount of inventory (parts and materials
in storage) and work in progress (work products underway, but not yet completed). Lean
does not refer the volume (e.g., number of pages of definition) of the process that
transforms them. A Lean process is one that operates with minimal inventory and work in
progress. That may require an extensive process description, or not. Lean stresses
developing process descriptions that implement the Lean principles, not arbitrarily
reducing page count.
When organizations do focus on reducing the volume of their process descriptions, they
often think only of the organizationally defined process. That is, they seek to remove
steps or activities from the general process requirements. These are only a small part of
the effective process volume of an organization. In most organizations, the
organizationally defined process gets extensively tailored for individual projects. Thus,
each element of the organizational process has many local instantiations. The result is
that most of the volume of processes in an organization results from project-specific
428

tailoring. Standardizing, or reducing the amount of project-specific tailoring and
alternatives, usually is a more effective method of reducing the real volume of processes.
Lean is about the amount of work in progress, not volume of processes. What does this
mean in the context of software development? Examples of work in progress include:
• Requirements that have been approved, but not designed
• Design units that have been approved, but not coded
• Code that has been approved, but not tested
Thus, Lean is about reducing the amount of these kinds of items – thus, making
production of software flow continuously. The simulation model discussed in a later
section helps to show how reducing work in progress leads to greater efficiency and
higher throughput.
This notion of Lean matches the vision of Agile development. The Waterfall model is the
antithesis of Lean. A typical Waterfall model requires that all requirements analysis be
completed before design, all design be completed before code, all code be completed
before testing, etc. Thus, the Waterfall model maximizes work in progress. For example,
all of the work done to date for each phase is work in progress because it cannot proceed
further into production.
The Lean view of process indicates that the Waterfall model is the least efficient,
although it requires the least discipline to execute. True Agile development requires more
discipline than Waterfall development. For example, Lindvall and Muthig [7] report that
configuration management (a basic development discipline) is especially difficult for
large Agile projects. Unfortunately, many practitioners view Agile approaches as an
excuse for dispensing with discipline, usually resulting in poor quality as well as lower
efficiency.
Lean and Queuing Theory
The approach of Process Optimization by Design focuses on the implications of the
queuing theory underlying Lean thinking. The performance of a queue can be described
mathematically, as follows:
C
u
uVV
T
pw
−
+
=
12
22
Where:
T = actual cycle time
Vw = variability in work (task) size
Vp = variability in process performance
u = utilization
C = theoretical cycle time to process one unit of work
429

Figure 1 shows the interactions among these terms. The curves represent the relationship
between utilization and throughput for different levels of variability (Vw plus Vp). At 100
percent of capacity cycle time becomes infinitely long. However, processes with low
variability (represented by the lower curves in Figure 1) can operate closer to 100%
capacity without experiencing dramatic degradation of performance. Interestingly, most
software organizations have little insight into the capacity of their processes and don’t
actively manage it. Managers often aim, unrealistically, for 100% (or higher) utilization.
Cycle
T
ime
Utilization
Increasing Variability
100%
Cycle
T
ime
Utilization
Increasing Variability
100%
Figure 1. Process Throughput for Various Conditions (from [2])
This model helps to explain the phenomenon of the “mythical man-month” [5], in which
adding staff to a project that is late, tends to make it later. Traditionally, this has been
attributed to the increased communication overhead associated with larger teams.
However, the queuing model suggests other factors may be more important. Adding
capacity (in terms of staff) to the project reduces the theoretical cycle time (C) for
processing one item of work. At the same time it results in a reallocation of the work
among the staff (increasing Vw) and redeployment of processes (increasing Vp). Since the
variabilities are power functions and the capacity (theoretical cycle time) is linear (see
equation above), the effect of increased variability can easily exceed the benefit of an
increase in resources.
Other quantifiable factors also contribute to the performance of queues (although we will
not go into the arithmetic behind them here). Thus, queuing theory defines the
characteristics of an effective and efficient process, including:
430

• Balance the work load across subprocesses
• Break work into small packages
• Manage process utilization
• Control process variation
• Control task variation
• Minimize hand-offs and waiting
These characteristics can be built into a process during its initial definition, regardless of
the specific modeling or representation technique employed in the definition (e.g., IDEF,
ETVX), or applied during subsequent updates to definitions.
Moreover, these characteristics are measurable properties (or performance parameters) of
the process. They help to describe its local performance and determine its overall
throughput. During initial process definition, many of these performance parameters may
be estimated in order to make design decisions. Those decisions can be supported with
simulation studies, as described in a subsequent section. Later, during process execution,
these parameters should be measured to guide subsequent process management decisions.
Consequently, the Lean paradigm links simulation, measurement, and process definition
together.
This article reports the results of a discrete simulation study of process performance. The
study employed the Arena modeling package (Rockwell Automation) and generic
industry data. The simulation results show how decisions about task size and work
balance affect overall process performance. The article demonstrates that a systematic
process design approach incorporating Lean concepts and simulation makes it possible to
optimize the quality and throughput of processes during their design.
Relationship of Lean to Agile
A simple comparison of the five recognized principles of Lean [1] with the twelve
principles of the Agile Manifesto [3] suggests some commonality. In particular, six Agile
principles map to three of the Lean principles, as shown below:
Value
• Our highest priority is to satisfy the customer.
Perfection
• Continuous attention to technical excellence and good design enhances agility.
• At regular intervals, the team reflects on how to become more effective, then
tunes and adjusts its behavior accordingly
Flow
• Deliver working software frequently.
• Working software is the primary measure of progress.
• The sponsors, developers, and users should be able to maintain a constant pace
indefinitely
431

Despite the alignment of two Agile principles with the Lean Principle of perfection, many
implementations of Agile methods have been criticized for failing to pay sufficient
attention to quality (i.e., perfection), resulting in software that does not satisfy the
customer.
The Lean principles of Pull and Value Stream are not incorporated into most Agile
methods. This is not surprising given that the Agile Manifesto downgrades the
importance of processes (i.e., Value Stream) relative to other contributors to software
development. Pull is a property that can only be understood in the context of a specific
process. In contrast, Lean views the process as the mechanism for achieving perfection,
optimizing flow, and responding to pull.
Many practitioners use Agile as a rationale for avoiding process discipline. However, a
Lean process requires disciplined performance to coordinate the continuous flow of work
through it. An effective implementation of Agile methods also requires discipline.
Proponents of Agile methods might benefit by studying the Lean principles of Pull and
Value Stream and giving these factors additional weight.
Simulation of Process Design
The effects of the Lean principles on performance can be demonstrated through discrete
simulation modeling. The authors are conducting two phases of simulation studies. The
first phase involves a simplified process characterized by industry data from published
sources. The second phase will study an actual industrial process using data obtained
from real projects developed using an actual process.
Figure 2 shows the simple process segment simulated in Phase 1 of our study. While
similar to industry practices, it is a substantial simplification of a real-world process.
Design
Design
ReviewCode Test
Code
ReviewReqts. Software
Resources
Defects Discovered
Time to
Complete
Latent
Defects
Design
Design
ReviewCode Test
Code
ReviewReqts. Software
Resources
Defects Discovered
Time to
Complete
Latent
Defects
Figure 2. Description of Simulated Phase 1 Process
This process includes five activities. The activities process a fixed set of requirements
using a fixed pool of resources (personnel). Each requirement results in one or more units
432

of work called a Design Unit. At each stage, iteration may be required due to defects
inserted in the Design and Code activities, and then found in the Design Review, Code
Review, and Test activities. The performance of this process is evaluated in terms of the
time required to complete processing all requirements and the latent defects remaining.
Design (work) Units are grouped into packages for implementation. All the units of a
package flow through the process together. This process was simulated under two
different conditions of work package size (or scenarios):
• Large packages with an average size of 10 Design Units
• Small packages with an average size of 5 Design Units
This initial simulation study employed the Arena modeling package (Rockwell
Automation) [4] and generic industry data. Approximately 1000 work units were
processed in each simulation run. The simulation was repeated 50 times for each
scenario. Performance was evaluated in terms of cycle time (duration), effort expended,
and latent defects. Table 1 summarizes the results.
Table 1. Initial Simulation Results
Performance
Measure
Small Design
(Work) Packages
Large Design
(Work) Packages
Improvement (%):
Large to Small
Cycle Time per Unit 0.79 0.93 17
Effort per Unit 12.29 14.34 17
Latent Defects 0.05 0.07 25
The table shows significant improvements on all three performance measures are
obtained simply by breaking the work into smaller packages for processing. This is a
principle of both Lean and Agile, although as previously reported, configuration
management [7] becomes a significant challenge with large Agile (and Lean) projects.
The Phase 1 results are sufficient to show that work package size can have an effect on
performance. Phase 2 will provide more accurate information on the effects of this and
other factors in a real industrial setting. This will demonstrate the value of simulation in
helping to design processes and work flows.
Process Optimization by Design
Process Optimization by Design is an approach to implementing the Lean principles at
the start of process definition activities, rather than as later improvement rework. This
approach involves fives steps, as described in Figure 3.
433

Analyze Architecture
Improve Process
Identify Value
Define Architecture
Define Subprocesses
Customer
Needs
Existing
Process
Existing
Process
Performance
Data
ISO 9001,
CMMI, etc.
Estimated
Performance
Analyze Architecture
Improve Process
Identify Value
Define Architecture
Define Subprocesses
Customer
Needs
Existing
Process
Existing
Process
Performance
Data
ISO 9001,
CMMI, etc.
Estimated
Performance
Figure 3. Process Optimization by Design
The five steps and techniques commonly used to implement them are as follows:
• Identify the value to be delivered by the process. Obviously, a software process
is intended to deliver software, but what are the “critical to quality” characteristics
of that software? These are the factors that the process should seek to optimize.
Quality Function Deployment (QFD) may be useful here.
• Define the architecture of the overall process. The architecture includes the
specification of basic components, connections, and constraints. Many process
design methods focus on identifying individual components and say little about
the architecture. IDEF0 is a process description technique often employed to
describe the high-level organization of processes.
• Analyze the architecture to identify bottlenecks and optimum operating
conditions. Lean principles and the queuing model help to evaluate how well this
process will operate. Many factors, such as task size and task effort, will have to
be estimated at this stage. The authors recommend discrete process simulation at
this stage.
• Define the subprocesses. Techniques such as Entry-Task-Verification-Exit
(ETVX) may useful for documenting individual subprocesses within the overall
architecture. The details on individual activities must be specified in sufficient
detail to guide implementers.
434

• Improve the process. Factors that were estimated while evaluating the
architecture should be measured and analyzed during process execution to
identify improvement opportunities. Conventional Six Sigma methods are useful
for analysis. McGarry, Card, et al. [8] provide general measurement guidance.
The focus on analyzing the process architecture is the most significant contribution of
Process Optimization by Design. Many sources recommend developing a process
architecture (e.g., [6]). However, few provide any substantial guidance on evaluating the
process architecture. Process Optimization by Design views the performance of the
process architecture in terms of the Lean heuristics, as well as from the perspective of
simulation. Process designers get meaningful feedback on the likely performance of their
designs before investing in detailed subprocess specifications.
Summary
Lean Principles can be applied during initial process design as well as during Kaizen and
other after-the-fact improvement activities. Simulation of process designs help to
identify bottlenecks, evaluate alternatives, and adjust operational policies. The “Process
Optimization by Design” approach incorporates Lean principles, established process
definition techniques, and simulation to help ensure the definition of close to optimal
process designs.
Future work, i.e., Phase 2 of the simulation study will apply this approach to specific
industry processes and projects, rather than working with a generic process and data. This
will provide examples of specific decisions based on this approach.
References
[1] J. Womack, D. Jones, and D. Roos, The Machine that Changed the World, Harper,
1991
[2] P. Middleton and j. Sutton, Lean Software Strategies, Productivity Press, 2005
[3] Principles behind the Agile Manifesto, www.agilemanifesto.org, 26 June 2007.
[4] W. Kelton, R. Sadowski, and D. Sturrock, Simulation with Arena, 4th
Edition,
McGraw Hill, 2007
[5] F. Brooks, The Mythical Man Month, Addison Wesley, 1975
[6] M. Crissis, M. Konrad and C. Schrum, Capability Maturity Model – Integration, 2nd
Edition, Addison Wesley, 2007
[7] M. Lindvall, D. Muthig, et al., Agile Software Development in Large Organizations,
IEEE Computer, December 2004
[8] J. McGarry, D. Card, et al., Practical Software Measurement, Addison-Wesley, 2002
435

436

Software Process Improvement: Ten Traps to Avoid
Karl E. Wiegers
Principal Consultant, Process Impact
www.processimpact.com
Copyright © 2007 Karl E. Wiegers
Author Biography:
Karl E. Wiegers is Principal Consultant with Process Impact, a software process consulting and
education company in Portland, Oregon. His interests include requirements engineering, peer re-
views, process improvement, project management, risk management, and metrics. Previously, he
spent 18 years at Eastman Kodak Company, where he held positions as a photographic research
scientist, software developer, software manager, and software process and quality improvement
leader. Karl received a B.S. in chemistry from Boise State College, and M.S. and Ph.D. degrees
in organic chemistry from the University of Illinois. He is a member of the IEEE, IEEE Com-
puter Society, and ACM.
Karl’s most recent book is Practical Project Initiation: A Handbook with Tools (Microsoft Press,
2007). He also wrote More About Software Requirements: Thorny Issues and Practical Advice
(Microsoft Press, 2006), Software Requirements, 2nd Edition (Microsoft Press, 2003), Peer Re-
views in Software: A Practical Guide (Addison-Wesley, 2002), and Creating a Software Engi-
neering Culture (Dorset House, 1996). Karl is also the author of more than 170 articles on soft-
ware development, chemistry, and military history. Karl has served on the Editorial Board for
IEEE Software magazine and as a contributing editor for Software Development magazine. He is
a frequent speaker at software conferences and professional society meetings.
Abstract:
Even well-planned software process improvement initiatives can be derailed by one of the many
risks that threaten such programs. This paper describes ten common traps that can undermine a
software process improvement program. The symptoms of each trap are described, along with
several suggested strategies for preventing and dealing with the trap. By staying alert to the threat
of these process improvement killers, those involved with leading the change effort can head
them off at the pass before they bring your process improvement program to a screeching halt.
The risk areas described include:
• Lack of management commitment
• Unrealistic management expectations
• Stalling on action plan implementation
• Jumping on the latest bandwagon
• Making achieving a maturity level the primary goal
• Providing inadequate training
• Expecting defined procedures to make people interchangeable
• Failing to scale processes to project size
• Turning process improvement into a game
• Process assessments are ineffective
437

Software Process Improvement: Ten Traps to Avoid1
Karl E. Wiegers
Surviving in the increasingly competitive software business requires more than hiring
smart, knowledgeable engineers and buying the latest development tools. You also need to use
effective software development processes, so those smart engineers can apply the best technical
and managerial practices to successfully complete their projects. More organizations are looking
at software process improvement as a way to improve the quality, productivity, and predictability
of their software development, acquisition, and maintenance efforts. However, process improve-
ment efforts can be derailed in many ways, leaving the members of the organization jaded, frus-
trated, and more committed than ever to the ways of the past.
This paper describes ten common traps that can undermine a process improvement pro-
gram. Learning about these process improvement killers—and their symptoms and solutions—
will help you prevent them from bringing your initiative to its knees. However, remember that
none of the solutions presented here are likely to be helpful if you are dealing with unreasonable
people.
Objectives of Software Process Improvement
As you plan your process improvement program, keep these four primary objectives of
process improvement in sight:
1. To understand the current state of software engineering and management practice in an or-
ganization.
2. To select improvement areas where changes can yield the greatest long-term benefits.
3. To focus on adding value to the business, not on achieving someone’s notion of “Process
Utopia.”
4. To prosper by combining effective processes with skilled, motivated, and creative people.
It is easy to lose sight of these objectives and become distracted by the details of the process im-
provement model you are following. Emphasize the business and technical results you are trying
to achieve, and avoid the checklist or audit mentality that seems to provide a simple, tempting
approach.
Trap #1: Lack of Management Commitment
Symptoms: While individual groups can improve the way they do their work through
grass roots efforts, sustainable changes across an organization require management commitment
at all levels. Senior managers may claim to support process improvements (how can they say
otherwise?). However, they might not really be willing to make short-term sacrifices to free up
the resources required for the long-term investment. Larger organizations need alignment be-
tween senior management and one or more layers of mid-managers.
If you’re leading the process improvement effort, you might obtain senior management
commitment but get pushback from middle managers. In this case you’ll be forced to spend time
1
This paper was originally published in Software Development, May 1996. It is reprinted (with modifications) with
permission from Software Development magazine.
438

and energy debating the importance of process improvement with people who should only have
to be educated, not sold.
Such mixed signals from management make it hard for improvement leaders and practi-
tioners to take the effort seriously. Watch out for lip service and buzzwords masquerading as
commitments. Lower-level managers who assign their least capable people (or nobody) to the
program are sending a clear sign that the lack of management commitment is about to foil your
effort.
Solutions: Managers at all levels need to send consistent signals about process improve-
ment to their constituencies. Executives must be educated about the costs, benefits, and risks so
they have a common vision and understanding of this complex area. Commitments need to be
aligned along the organizational hierarchy, so that managers are not working at cross purposes,
and a reluctant manager cannot sabotage the effort through inaction. There’s a big difference be-
tween “support” and “commitment.” Make sure that commitments from management translate
into resources devoted to process improvement, realistically defined expectations, and account-
ability for the results.
Management commitment also affects the morale and dedication of people who are work-
ing to advance the organization’s effectiveness. When management objectives change with the
wind and the staff devoted to facilitating process improvement is downsized, those affected may
be embittered at having months or years of their careers sidetracked for nothing. Don’t expect
these people to step forward the next time the organization is looking for people to enable
change.
Trap #2: Unrealistic Management Expectations
Symptoms: Excessive enthusiasm by ambitious managers can also pose risks to the im-
provement program. If the goals, target dates, and results expected by managers are not realistic,
the process improvement effort is set up for failure. Managers, particularly those with little soft-
ware experience, may not appreciate the effort and time involved in a large-scale process im-
provement effort, such as one based on the five-level Capability Maturity Model Integration
(CMMI). These managers may be confused about how process improvement frameworks like
CMMI relate to other software engineering approaches and methodologies, such as agile. They
may focus on issues of pressing importance to them that are not realistic outcomes of the process
improvement effort. For example, a manager may hope to solve current staff shortages by driving
the organization to reach CMMI Level 2, which typically leads to higher software productivity
and quality. However, since it can take a year or more to reach Level 2, this is not an effective
solution to near-term staffing problems.
Management needs to understand that the behavioral changes and organizational infra-
structure also are critical elements of a successful process improvement program. These cannot
be mandated or purchased. Catchy slogans like “Level 5 by ’05” or “Six Sigma by ’06” aren’t
helpful. In an unhealthy competitive environment, process improvement can become a contest:
Department A sets an objective of achieving CMMI Level 3 by the end of 2007, so the head of
Department B says that they can do it by the middle of 2007. With rare exceptions, such behavior
is neither inspiring nor motivating.
Solutions: Educate your managers so they understand the realities of what a serious proc-
ess improvement initiative will cost and what benefits they might expect. Collect data from the
software literature on results that other companies achieved. Also note the investments those
companies made over a specified time period. Every organization is different, so it’s risky to
promise an eight-fold return from each dollar invested just because you read that some company
439

actually achieved that level of success. Use data available from the software literature or from
other areas of your own company to help your managers develop realistic expectations and set
reasonable, even ambitious, goals. Software process improvement is no more of a magic silver
bullet than any other single software tool or technology.
Trap #3: Stalling on Action Plan Implementation
Symptoms: Teams might write action plans after a process assessment, but they make
little progress on the plans because management doesn’t make them a clear priority or assign re-
sources to them. Managers may never mention the action plans after they are written. This gives
team members the message that achieving improvement by implementing the action plans isn’t
really important. The lack of progress on improvement plans frustrates those who actually want
to see progress made, and it devalues the investment of time and money made in the process as-
sessment.
Even if team members are permitted to work on improvement tasks, these tasks often get
low priority. “Real work” can easily squeeze process improvement activities out of a busy engi-
neer’s schedule. Project managers might respond to the pressure of delivering the current product
by curtailing the effort that should go into upgrading the organization’s process capability.
Solutions: A good way to turn action plans into actions is to treat improvement activities
as mini-projects. This gives them the visibility and legitimacy they need for success. Write an
action plan for each mini-project. This plan identifies resources, states timelines, itemizes deliv-
erables, clarifies accountability, and defines techniques to assess the effectiveness of the new
processes implemented. Don’t try to solve every process problem in your group at once.
Concentrate on just two or three improvement areas at a time to avoid overwhelming the
project team. You need to measure progress against the plans, and to measure the impact of each
action plan on the business results achieved. For example, a plan to improve unit testing effec-
tiveness might include an interim goal to acquire test automation tools and train developers in
their use. These interim goals can be tracked easily. The desired business outcome of such an ac-
tion plan should be a specific quantitative reduction, over some period of time, in the number of
defects that slip through the unit tests.
Project managers can’t just assign their least effective people to the process improvement
efforts, either. We all want to keep our best people working on technical projects. However, if
good people and respected leaders are not active contributors, the process improvement outputs
will have less credibility with the rest of the organization.
If your project managers never seem to make much progress against their action plans,
you may need to implement a management oversight function to encourage them to take process
improvement more seriously. In one organization I know of, all project managers must report the
status of their action plans every three months to a management steering committee. No one
wants to be embarrassed by reporting little or no progress on his plans.
From one perspective, such periodic reporting reflects appropriate management account-
ability for the commitments that people have made to improve their software processes. From
another, this approach represents a “big stick” strategy for enforcing process improvement. It’s
best to avoid the big stick unless action plans simply are not being implemented. Your culture
will determine the most effective techniques for driving action plans to completion. The man-
agement oversight approach did achieve the desired effect in the organization I mentioned.
440

Trap #4: Jumping on the Latest Bandwagon
Symptoms: It's not unusual for software developers and managers to latch onto the hot-
test new fad heating up the pages of professional magazines and packing the rooms at technical
conferences. "We have to do Extreme Programming," cries one developer just back from a con-
ference. "No, no" protests the project manager who recently read an article on the airplane.
"Scrum will solve all our problems." What about Evo, rapid prototyping, spiral, lean, or Six
Sigma? Is one of these going to magically boost your productivity, quality, and overall effective-
ness? I've heard the phrase "management by BusinessWeek” used to describe this temptation to
adopt the current most fashionable methodology or philosophy, without really knowing what
you're getting into, what it can do for you, or whether it will even fit into your culture. Another
symptom is that software teams don’t give new methodologies enough time to work before they
abandon it for the Next Great Thing.
Solutions: As a consultant, potential clients often tell me they need to take a certain ac-
tion to solve certain problems. Perhaps they think they need training, or a new tool, or a new
methodology to increase their productivity. But my first question back to these people is, “What
is impeding your productivity today?" In other words, before you adopt a specific new approach,
perform a root cause analysis to understand the underlying factors that currently prevent you
from getting the results you want. Often, spending just an hour or so working through a fishbone
diagram to clearly understand the real problem and two or three levels of underlying causes is
enough to identify actionable solutions. Perhaps the solution will indeed be whatever software
strategy is currently making headlines. But maybe it won't.
Take the time to analyze your problem and your situation before you make a radical
change in how you ask your team to operate. All of the new methodologies have their advantages
and their limitations. They all require training the team to make sure they understand the new ex-
pectations. Adopting a new methodology involves significant cultural changes as well. It's not
just a simple matter of plugging in a new tool and vocabulary. Any specific methodology could
be an excellent fit for certain situations and a disaster for others. Look before you leap.
Trap #5: Achieving a Maturity Level Becomes The Goal
Symptoms: Organizations that adopt the CMMI framework for process improvement risk
viewing attainment of a specific CMMI maturity level as the process improvement goal. They
don’t emphasize process improvement as one mechanism to help achieve the organization’s
business goals. Process improvement energy may be focused on a race to the maturity level rat-
ing. This can neglect specific problem areas that could contribute quickly to the quality, produc-
tivity, and management issues facing the organization.
Sometimes a company is in such a rush to reach the next maturity level that the recently
implemented process improvements have not yet become well established and habitual. In such
cases, the organization might actually regress back to the previous maturity level, rather than
continue to climb the maturity ladder as it is attempting to do. Such regression is a surefire way
to demoralize practitioners who are eager to keep moving forward.
Solutions: In addition to aiming at the next maturity level, make sure your improvement
effort aligns with corporate business and technical objectives. Mesh the software process activi-
ties with any other improvement initiatives that are underway, such as ISO 9001 registration, or
with an established software development framework already in use. Recognize that advancing to
the next maturity level can take a year or more. It is not feasible to leap from an initial ad hoc de-
velopment process to a super-sophisticated engineering environment in one step. Your goal is not
to be able to chant, “We’re Level 5! We’re Level 5!” Your goal is to develop improved software
441

processes and more capable practitioners so your company can prosper by building higher quality
products faster than before.
Use a combination of measurements to track progress toward the business goals as well
as measure the progress of the process improvement program. Goals can include reducing project
cycle times and product defect levels. One way to track process improvement progress is to per-
form low-cost interim assessments to check the status of your project teams in various CMMI
process areas (such as requirements management, project planning, and configuration manage-
ment). Over time, you should observe steady progress toward satisfying both CMMI goals and
your company’s software success factors. This is the outcome of a well-planned and well-
executed program.
Trap #6: Providing Inadequate Training
Symptoms: A process improvement initiative is at risk if the developers, managers, and
process leaders lack adequate skills and training. Each person involved must understand the gen-
eral principles of software process improvement, the process model being applied, change leader-
ship, software measurement, and related areas.
Inadequate knowledge can lead to false starts, well-intentioned but misdirected efforts,
and a lack of progress. This can undermine the improvement effort. Without training, the organi-
zation’s members won’t have a common vocabulary. They won’t all understand how to assess
the need for change or how to properly interpret the improvement model being used. For exam-
ple, “software quality assurance” and “requirements management” mean different things to dif-
ferent people. Training is needed to achieve a common understanding of such terms among all
participants.
Solutions: Training to support established process improvement frameworks can be ob-
tained from various commercial sources, or you can develop such training yourself. Different
participants in the process improvement activities will need different kinds of training. If you’re
using a CMMI-based approach, the process improvement team members should receive two to
three days of training on CMMI. However, a few hours of training about process improvement
using the CMMI will be enough for most participants.
If you become serious about process improvement, consider acquiring training in other
key software improvement domains: setting up a software engineering process group (SEPG),
establishing a metrics program, assessing the process capability of a project team, and action
planning. Use commercial training sources wherever possible instead of creating all your own
training courseware. Of course, managers and practitioners also need training in specific techni-
cal areas, such as requirements engineering, estimation, design, and testing.
Trap #7: Expecting Defined Processes to Make People Interchangeable
Symptoms: Managers who have an incomplete understanding of the CMMI sometimes
expect that having repeatable processes available means that every project can achieve the same
results with any random set of team members. They may think that having defined processes
available will make all software engineers equally effective. They might even believe that work-
ing on process improvement means that they can neglect technical training for their software en-
gineers.
Solutions: Individual programmers have been shown to have a 10-to-1, 20-to-1, or even
greater range of performance (quality and productivity) on software projects. Process improve-
ments alone can never equalize such a large range of individual capability. You can close the gap
442
quite a bit by expecting people to follow effective defined processes, rather than just using what-
ever methods they are used to. This will enable people at the lower end of the capability scale to
achieve consistently better results than they might get otherwise. However, never underestimate
the importance of attracting, nurturing, and rewarding the best software engineers and managers
you can find. Aim for software success by creating an environment in which all team members
share a commitment to quality and are enabled—through superior processes, appropriate tools,
and effective team interactions—to reach their peak performance.
Trap #8: Failing to Scale Process to the Project
Symptoms: A small organization can lose the spirit of a process improvement framework
while attempting to apply the model to the letter. This introduces excessive documentation and
formality that can actually impede project work. Such an outcome gives “process” a bad name, as
team members look for ways to bypass the official procedures in an attempt to get their work
done efficiently. People naturally are reluctant to perform tasks they perceive as adding little
value to their project.
Solutions: To reach a specific CMMI maturity level, you must demonstrate that your or-
ganization satisfies all of the goals of each process area defined at that maturity level and at
lower levels. The processes you develop should be no more complicated or elaborate than neces-
sary to satisfy these goals. Nothing in the CMMI says that processes should be massive or un-
wieldy. Strive for a practical balance between documenting procedures with enough formality to
enable repeatable project successes, and having the flexibility to get project work done with the
minimum amount of overhead effort.
This nondogmatic view doesn’t mean that smaller organizations and projects cannot
benefit from the discipline provided by the CMMI or other formal improvement models. It sim-
ply means that the processes and practices should be scaled rationally to the size of the project. A
20-hour project should not demand eight hours of project planning just to conform to a CMMI-
compliant “documented procedure.” Your process improvement action teams should provide a
set of scaleable processes appropriate for the various sizes and types of projects in your group.
Trap #9: Process Improvement Becomes a Game
Symptoms: Yet another way that process improvement can falter is when the participants
pay only lip service to the real objective of improving their processes. This creates the illusion of
change while actually sticking with business as usual for the most part. The focus is on making
sure a process audit is passed, rather than on really changing the culture of the organization for
the better. Software process improvement looks like the current flavor of the month, so people
just wait for this latest fad to pass so they can get back to their old familiar ways. Sometimes, the
quest for ever-higher process maturity levels becomes a race. Project teams go through the mo-
tions in an attempt to satisfy some aspect of the CMMI, but management doesn’t provide time for
the group to internalize the behaviors before they charge after the next goal.
Solutions: Focus on meeting organizational and company objectives with the help of im-
proved software processes. Do not simply try to conform to the expectations of an established
framework. It is not enough to simply create documented procedures to satisfy the letter of some
improvement framework. Team members must also satisfy the spirit of the framework by actu-
ally following those procedures in their daily project work.
Institutionalizing process improvements refers to making new practices routine across the
organization. Practitioners must also internalize improved procedures. This entails becoming
committed enough to the new processes that they wouldn’t consider reverting to their old, less
443

effective ways of working. As a process change leader, identify the behaviors you would expect
to see throughout the organization in each improvement area if superior processes are success-
fully internalized and institutionalized. As a manager, your group members need to understand
that you are serious about continually striving to improve the way they build software; the old
methods are gone for good. Continuous improvement means just that, not a one-shot game we
play so that someone can tick off a checklist item.
Trap #10: Ineffective Process Appraisals
Symptoms: If process capability appraisals (often led by the SEPG) are conducted with-
out adequate participation by the software development staff, they feel more like audits. This can
lead to a lack of buy-in and ownership of the appraisals findings by the project team. Appraisal
methods that depend solely on the responses to a questionnaire can overlook important problem
areas that should be addressed. Outside “experts” who purport to identify your group’s process
weaknesses based on insufficient practitioner input will have little credibility with your technical
staff.
Solutions: Process change is a cultural change. The ease of this cultural change depends
on how involved the practitioners are with the assessment and action planning activities. Include
a free-form discussion with a representative group of project team members as part of the as-
sessment. This discussion can identify problem areas that might relate to practices that the as-
sessment questionnaire didn’t cover but which still must be addressed. For example, software
testing is not addressed by Level 2 of the staged version of CMMI. But if poor testing practices
are hurting a project in a Level 1 organization, do something about that soon. Similarly, topics
may come up in a project team discussion that are not part of the CMMI at all, including man-
agement and organizational issues.
Use your SEPG to actively facilitate the change efforts of your project teams, not just to
audit their current process status and report a long, depressing list of findings. Identify process
liaisons or champions in the project teams to augment the assessment activities of the process
group. Those process liaisons can also help drive effective changes into the project team’s behav-
iors and technical practices. The project team must understand that the SEPG is doing process
improvement with the members of the project team, not for them or to them.
Requirements for Effective Software Process Improvement
Successful software process improvement requires the synergistic interaction of several
elements. Begin with smart, trained, creative software engineers and managers who can work to-
gether effectively. Consistent management leadership and expectations help grow a culture hav-
ing a shared focus on quality. This includes honest appraisal of problem areas, clear improvement
goals, and the use of metrics to track progress. Time must be provided for the team members to
identify, pilot, and implement improved processes. Finally, realize that most of process im-
provement is based on thoughtful common sense, combined with a commitment to improve the
way software development is performed in the organization.
As you chart a course to improve your software process capability, be aware of the many
minefields lurking below your organization’s surface. Your chances of success increase dramati-
cally if you watch for the symptoms that identify these traps as a threat to your process improve-
ment program and make plans to deal with them right away. Process improvement is succeeding
at many companies. Make yours one of them, by controlling these risks—and others—as well as
you can.
444

References
Ben-Yaacov, Giora, and Arun Joshi. 1999. “Investing in Quality Does Indeed Pay: A Software
Process Improvement Case Study.” Software Quality Professional, 1(3): 45-53.
Chrissis, Mary Beth, Mike Konrad, and Sandy Shrum. 2003. CMMI: Guidelines for Process In-
tegration and Product Improvement. Boston, Mass.: Addison-Wesley.
Haley, Thomas J. 1996. “Software Process Improvement at Raytheon.” IEEE Software, 13(6):
33-41.
Humphrey, Watts S. 1989. Managing the Software Process. Reading, Mass.: Addison-Wesley.
Maguire, Steve. 1994. Debugging the Development Process. Redmond, Wash.: Microsoft Press.
Wiegers, Karl E. 1996. Creating a Software Engineering Culture. New York: Dorset House.
Wiegers, Karl. 1996. “Misconceptions of the CMM” Software Development 4(11): 57-64.
Wiegers, Karl E. 2005. Software Process Improvement Handbook.
http://www.processimpact.com/handbooks.shtml.
445

446

Levels of Ceremony for Software Configuration Management Dan Brook and Kal Toth
About the Authors
Dan Brook is a software engineer at Rohde&Schwarz, Inc. where he currently develops software for cell phone test devices. He is a recent graduate of the Masters of Software Engineering (OMSE) program at Portland State University in Portland, Oregon and holds a bachelor's degree from Whitman College in Walla Walla, Washington. Email: [email protected]
Dr. Kal Toth is Associate Professor in the Maseeh College of Engineering and Computer Science at Portland State University. He is also the Director of the OMSE program. He conducts research in the areas of software engineering education and information security and has a Ph.D. in Electrical Engineering from Carleton University, Ottawa, Canada. Email: [email protected]
AbstractThe task of the software engineer at the outset of a project is to characterize the problem at hand and select a level of process ceremony that will yield a successful product without burdening the process with unnecessary overhead. Just as too much ceremony can drive up project costs unnecessarily, too little ceremony can expose the project to runaway requirements and fragile implementations - in other words, both choices can lead to project failure. The right amount of ceremony should balance these extremes.
Experience tells us that software processes are most efficient and productive when ceremony is aligned with the characteristics of the project. But we have little guidance on how to tailor software processes. This paper examines process ceremony in the context of Software Configuration Management (SCM), in particular, the process of artifact development. Our approach provides practical tailoring guidance for the software engineer when undertaking a new software project. This paper continues the work of a graduate project at Portland State University in the spring of 2007 [1], which was inspired by an article published in April 2005 [2].
447

Introduction Before a project is undertaken, software engineers should characterize the problem at hand, and select or adapt a suitable process to guide the project effectively and efficiently. Too much ceremony may inhibit agility and smother the project with unnecessary overhead; too little ceremony may lead to lost project control, low software quality, and excessive maintenance effort. For example, an Agile development process may not be adequate to support the development of aircraft collision avoidance software. By the same token, a monolithic waterfall development effort may be overkill for a small web service. Therefore, the prudent practitioner should carefully consider the attributes of the problem before rushing into development. Herein we consider: requirements uncertainty, requirements volatility, expected code-base size, problem complexity, market pressure, team size, team distribution, domain knowledge, and mission criticality [2].
In this paper, we explore the challenges of selecting suitable Software Configuration Management (SCM) artifact development process at three levels of ceremony, namely, low, medium and high. An example of a project needing high ceremony SCM is a safety-critical application characterized by many regulatory requirements. At the other end of the spectrum we might encounter a commercial application choosing to employ Agile development methods where fairly basic, low ceremony SCM may be sufficient. We therefore reason that is should be possible to define a range of SCM processes upon which to draw when adapting an SCM process for the next project that may come along. We begin by describing high and low ceremony SCM processes; we then characterize the range of problems addressed by high and low ceremony SCM processes. Finally we characterize an exemplar problem that can be satisfied by a medium ceremony SCM process, applying our findings to adapt the high and low ceremony SCM processes to meet the needs of the exemplar.
Ceremony The term “ceremony” originated with the Rational Unified Process (RUP) and was adopted by the XP and Agile software development community [3][4]. The RUP associates ceremony with project control, repeatability, and maintainability. In XP development, the elimination of ceremony is considered an advantage because XP’s strength is derived from reducing or even eliminating process ceremony.
Given these contrasting views, let us then define this term. Process ceremony can be thought of as a composite of three perspectives:
1. Precision, the degree to which a process specifies details required to produce accurate results such as the number of steps, length of checklists, and the number of checks needing to be performed;
2. Formality, the rigor with which stakeholders make decisions and approvals about entering and exiting processes – for example, whether an individual, a peer group, or an independent third party approves a work product, and how the responsible party arrives at the decision to approve;
3. Fidelity, the degree to which stakeholders are actually required to follow a given process.
Ideally, the chosen level of ceremony for a project should be consistent with the attributes of the problem being tackled. In other words, the nature of the problem should drive how much precision, formality and fidelity should be practiced when executing the project.
Levels of Ceremony Most software development processes are neither distinctly high ceremony nor distinctly low ceremony, but rather are a hybrid process somewhere in the middle of the two extremes. For example, a real world software development process will have some supporting documentation and procedures with or without a modest amount of traceability maintained among artifacts. It will likely combine the informality of low ceremony with some of the formalism of high ceremony. This mid-level degree of ceremony is usually the most applicable for teams that are developing commercial applications without direct, day-to-day contact with the software’s users. It is not uncommon for such teams to find high ceremony too formal and the low ceremony too informal, thus a hybrid combination of low and high ceremony processes are developed for
448

use. The medium ceremony SCM process modeled in this paper is for a mid-sized development team creating commercial business applications for users that require user documentation and training material to be produced as well as the software. The modeled SCM process takes aspects from both low and high ceremony and the method for adaptation is discussed in detail.
This paper addresses a continuum of possible levels of Process Ceremony for SCM from high to low. The range of levels is what could be considered typical in commercial software development. However, it is important to keep in mind that these extremes do not capture the possible extremes in all real world scenarios. Even though this paper does not address processes outside these defined limits, it is important that the reader realize that these extreme levels of process do exist, and in the unlikely event that such a process is appropriate to the reader’s situation, they should avail themselves of such a process when appropriate.
Low Ceremony Process
A software development process that produces a minimum of supporting documentation, artifacts, and overhead is considered low ceremony. It has little formality in the working procedure. Audits to ensure fidelity to a precise process are not needed. At the lowest extreme of low ceremony is ad hoc development. An example of a project that would use this type of ceremony would be one that is being developed by a team that is familiar with working in loosely defined environments, such as an internal departmental project. Low ceremony is often found on small development teams or on low risk projects. Projects that have low cost or low political overhead also are often low ceremony. Although it is not at the lowest extreme of low ceremony, the agile software development methodology Extreme Programming (XP) is an example of low ceremony [5]. XP is designed to deliver the software to meet the customer needs when they are needed. Within XP, the developers confidently respond to changing customer requirements/stories, even late in the life cycle. Software Configuration Management process in XP could be very light and addressed via collective ownership, continuous integration and small release.
High Ceremony Process
A high ceremony process is a software development process that has a significant degree of formality and precision in ceremonies such as Fagan code inspections [6], a Change Control Board (CCB), change request tracking and defect tracking databases. They are very concerned with fidelity to the defined processes and use auditing to ensure adherence to the standards and methods required. At the highest extreme of high ceremony is process paralysis, where each development activity is accompanied by a large amount of required ritual. A good example is the degree of rigor and formalism required in mission critical projects like those at NASA [7]. Projects like these have a very high risk and cost for failure involving safety and security (e.g. aerospace, military, financial, or security programs). Other software projects that would have a high degree of process ceremony are large multi-vendor development projects, organizations with international teams, and any large organization where more people equate to more communication and more decisions.
Software Configuration Management The authors have previously described SCM as “The collective set of steps, actions, checkpoints, and processes performed upon software engineering artifacts for the purpose of gaining and maintaining control of the project artifacts” [1]. More informally, SCM can be thought of as a set of steps performed upon input artifacts to produce output products. Taken as a whole, this high level view is not yet very useful to us. Refining the abstraction, we have divided SCM into three distinct subcomponents, which help break down the high level abstraction of SCM into more understandable and concrete abstractions. These subcomponents are: Change Request, Artifact Development, and Release Management.
Change Request - This is where an artifact is actually created or selected for modification. Necessary permissions are secured, the artifact is defined, change request “paperwork” is completed, and so forth. At the conclusion of this step, an artifact is ready to be worked on, but no real work has been performed, other than the meta-work of SCM.
449

Artifact Development - The artifact is developed from a concept to an actual existing object. At the conclusion of this step the artifact has completed some level of confidence that it is the right artifact and is done correctly.
Release Management - The artifact, along with possibly other related artifacts, is assembled into a larger object in the process of creating a releasable product.
This definition of SCM assumes that there are items already in existence called artifacts. These artifacts can take on a variety of forms, such as requirements, source code, binary code, documentation, firmware code, hardware diagrams, and so forth. Project work products are placed under SCM control in a previous Identification of Artifact step. It is up to each project to define the appropriate artifacts for their environment, project, and situation. In this paper, we do not discuss how and what should be defined as an artifact; however, we suggest that artifact definition be part of the project definition step.
The examples in this paper will focus on the Artifact Development subcomponent of SCM. Throughout this paper, it is assumed that the primary example artifact is source code; however, the processes we define can be applied to any artifact. The SCM concepts will be the same for most, if not all, artifacts in a project. Perhaps the only modification needed would be to adjust the labels of the steps where appropriate. Such an exercise is left to the reader.
Low Ceremony Artifact Development
As shown in Figure 1, Low Ceremony Artifact Development starts from the change request produced in the Change Request step of SCM. In XP, the code artifacts are under version control. The collective code ownership and continuous integration practices are combined to control the source code artifacts. First of all, the developer checks-out or synchronizes with the latest implementation code and unit test code from the source control repository. The unit tests are white-box tests, which test the individual subroutines and procedures in a program to demonstrate the unit performs correctly. Test-Driven Development (TDD) is a key practice in XP and software development technique that involves repeatedly first writing a test case and then implementing only the code necessary to pass the test. For a particular user story, the developer first writes the unit test to test the story then writes the code to implement the story. If the unit tests pass, the developer can be confident that the code meets all the tested requirements. After the unit testing is passed, the static code analysis will be performed to ensure the code meets any coding standards. After the code analysis is performed, the implementation code will be peer reviewed and may undergo re-factoring [8]. Before the source code is checked into the source code control repository, all available unit tests must be performed to ensure the new code will not break the current system. Finally, the developer checks in both the implementation code and unit test code into the source control repository.
High Ceremony Artifact Development
As shown in figure 2, Artifact development entails all design, implementation and verification of the individual change. The Change Request (CR) record is assigned to the appropriate developer. The current state of all dependent artifacts must be acquired (i.e. synchronized). Changes to artifacts are implemented according to the needs of the CR. The implementation is unit tested or reviewed by the assigned individual and, if acceptable, is checked in. Automated change management tools such as source control applications have proven to be almost indispensable in modern software development of any appreciable size and scope. This is an example of a single action that represents an entire process in itself.
Linking the change to the CR is an important step to create traceability so that in the future, the connection between implemented change and requested change can be preserved. In a high ceremony Process, formal change reviews are typical to ensure quality and enforce standardization early in the change implementation. Changes requested in the review process are added to the implementation and resubmitted to unit testing and possibly iterative review until satisfactory. As in design and implementation, Review Change is an abstraction made up of additional steps within this action. Separate from unit testing, integration testing examines the artifact in the context of dependencies. Affected modules and documentation are checked for compatibility. Testing failure can even reject a change entirely. Passing unit testing and failing integration testing usually indicates a larger problem at a system
450

level. This often requires modification of the CR itself and a review by the CCB. Acceptance at integration completes the artifact development.
Change Artifact
Check In Changes
Review Change
Unit Testing
Integration Testing
[Pass]
[Fail]
Create/Modify Unit Test Code
Create/Modify Implementation Code
Execute Unit Test Code
[Fail]
[Pass]
Check Out Implement & Unit Test Code
Perform Code Analysis
Check In Implement & Unit Test Code
Refactor Implementation Code
Review Implementation Code
Perform Unit Tests
[Pass]
[Fail]
Synchronize to Appropriate Version
[Fail]
[Fail]
Link to Change Request
Review Change Request
Assign Change Task
[Reject]
[Reject]
Figure 1: Low Ceremony Artifact Development
Characterizing the Problem at Hand
Figure 2: High Ceremony Artifact Development
Table 1 lists key attributes of the problem at hand that are likely to influence the choice of process ceremony for the project. Development goals, such as producing a safety critical system, or a constraint such as team location, are good examples. To support our analysis each attribute ranges over a simplified spectrum of three values: small, medium, and large.
451

Table 1: Spectrum of Problem Attributes [1]
Spectrum of Problem Attributes
Problem Attributes Small Medium Large
RequirementsUncertainty/ Volatility
Requirements are certain and most likely won’t change.
Some uncertainty in requirements exists and they are likely to change, although not significantly.
Stakeholders are not sure what will change until parts of the system have been fielded. Major requirements changes are possible.
Size / Complexity < 10K LOC (Lines of Code) Between 10K and 500K LOC > 500K LOC
Technical Uncertainty Mature products utilizing proven technology.
Not quite sure how to build the system.
New products utilizing new technology.
Application Domain / Mission Criticality
The only cost of failure is the investment in the project. Beta and field trial services, proof-of-concept prototypes.
Established market – the cost of failure is loss of money and reputation. Business and enterprise applications.
Safety critical with significant exposure – the cost of failure is human lives or essential moneys. Safety, reliability, security, etc.
Team Size < 5 ~15 ~100
Team Location Same room Same building Multi-site, World Wide
Domain Knowledge Developers know the domain as well as expert users.
Developers require some domain assistance.
Developers have little or no knowledge about the domain.
Market Pressure Is not critical – there is no serious competition.
Some market pressure exists, but it is not significant.
The product needs to be released ASAP in order not to miss market opportunity.
SCM Process Ceremony Adaptation Guide
Table 2 below contains sample recommendations for the practitioner to consider when adapting SCM processes and tools for a given project. They are broken out by the spectrum of the problem attributes identified above.
Table 2: SCM Process Ceremony Adaptation Guide
Problem Attribute Recommended SCM Process Changes
Requirements Uncertainty / Volatility
Iterative development, prototyping, and customer involvement will generally be adopted to address uncertainty and volatility. Smaller, more agile projects will rely more on customer and user collaboration to control changes. More mission-critical projects will adopt systematic but fairly informal requirements change controls and CCBs prior to baselining, and quite formal change controls after baselining. Version controls and problem tracking processes and tools need to be quite robust to handle the inevitable downstream changes for such projects.
Size / Complexity Thorough attention to module and build versioning, problem tracking and change control is more important for projects of large program size with many modules and dependencies between them. Controlled integration is essential; documentation for requirements and designs are also version controlled and verified with formal review. Smaller projects can reduce the amount of design documentation and hence the level SCM ceremony.
Technical Uncertainty Typically addressed by early risk assessment and prototyping, formal change control is not needed initially but effective version control and problem tracking is critical regardless of the size and complexity of the project. Once the technical risk is mitigated, more formal change management will be required to control downstream development.
Application Domain / Mission Criticality
High criticality aerospace and military-grade projects will require more formal SCM in all areas including establishment of a CCB to control changes and other formal change control processes to ensure functional requirements, quality and other “ilities” are met. Less critical projects generally implement very informal methods for controlling changes.
Team Size Larger team size quickly escalates the degree to which SCM needs to be coordinated across the project. SCM tools must be more highly automated, integrated, and scalable to handle large team sizes. Note that the degree of SCM process precision and formality of approval decisions will be driven by some of the other factors rather than this one.
Team Location A centralized team will be able to use more informal SCM processes than a distributed one which will benefit from automated SCM tools and systematic versioning and problem tracking. As team size becomes large, the impact of physical distribution will be less apparent – large teams even in the same location rely a lot on the SCM tools. Distributed teams should integrate the customer and users through the automated SCM tools.
452

Domain Knowledge Regardless of project size or complexity, lack of domain knowledge will most likely escalate requirements volatility, will put more pressure on the project to seek close customer and user involvement, and therefore increase required SCM ceremony. Adequate domain knowledge will reduce effort and time interacting with the customer and user thereby reducing the required precision and formality of SCM for requirements management. Having said this, these effects will be more dramatic on larger and more complex projects than smaller ones.
Market Pressure Increased market pressure will tend to cause teams to avoid precision and formality in most processes, adopting more agile development strategies. To avoid degenerating into ad hoc development, it is essential for teams to have effective version control and problem tracking processes and tools in place. Meanwhile, change control can be quite informal. For projects that have high market pressure and are also large, complex and/or mission critical – all bets are off.
Adapting SCM to Medium Ceremony In this section, an example of adapting high and low ceremony SCM is examined for a fictional company called Laureato that has decided to merge two previously separate projects. The medium ceremony SCM process modeled in this section is for a mid-sized development team creating commercial business applications for users that require user documentation and training material to be produced as well as the software. The company has roughly 30 software developers divided into two teams supporting two distinct product lines. Each software application is roughly between 150,000 and 250,000 Lines of Code (LOC). Both development teams are located in the same building, but are independently managed. The first team has 10 developers and uses a high ceremony SCM process and releases a new version of the product roughly every six months. The second team has 20 developers and uses a low ceremony SCM process with more frequent, quarterly releases. Both software products have embedded help and ship with a PDF users manual. Additionally, Laureato provides onsite user training for its products to their larger corporate customers. In the following subsections, a process ceremony SCM model will be adapted for the integration of the two teams and products by taking aspects from both low and high ceremony will produce a medium ceremony SCM process.
Project Attributes
Each of the two development teams nominated a process engineer from their team to collaborate together to devise a unified SCM process. They decided to list project attributes that would impact any SCM process for the unified software application. Coincidentally, the eight attributes they chose matched the problem attributes in Table 1. Next, they assigned value rankings for the weight of each attribute on a three-part scale of low, average and high, and gave a reason for their rankings as shown in Table 3.
Table 3: Laureato Project Attributes [1]
Problem Attribute Importance ReasonRequirements Uncertainty / Volatility Avg Not quite clear how functionality of the two systems can be combined.Size / Complexity High 500,000Technical Uncertainty Low Proven TechnologyApplication Domain / Mission Criticality Avg Commercial business applicationsTeam Size Avg 30 developersTeam Location Low Same building
Domain Knowledge Avg Each team knows their product well, but not the other product, and so will require some assistance.
Market Pressure High It is important to deliver the product in the next 6-9 months.
Decision Matrix
A decision matrix (Table 4) can help a practitioner choose an appropriate level of ceremony for a given project among available processes. The first column represents project attributes and the second column represents weight (importance) of the attribute for a given project. We have chosen a range of 1-3, where 1 represents the lowest value and 3 the highest. For example, if the requirements are very clear and are not likely to change, the weight will be equal to 1. On the other hand if the requirements are quite uncertain and very volatile, a value of 3 is assigned. Specific ranges of the Weight and Fit values vary and are determined by the practitioner. Subsequent columns represent different available process ceremonies. For each process ceremony we assign Fit (how well it addresses the project attribute) and a
453

resultant Value (Fit multiplied by Weight). Once all cells have been populated the Total Value for each ceremony is summed. The higher value suggests the most appropriate ceremony for the given project.
Table 4: Laureato’s Decision Matrix [1]
Low Process Ceremony High Process CeremonyProblem Attribute Weight
(range 1-3) Fit % (0-100) Value Fit % (0-100) ValueRequirements Uncertainty / Volatility 2 80 1.6 80 1.6
Size / Complexity 3 40 1.2 100 3Technical Uncertainty 1 80 0.8 80 0.8Application Domain / Mission Criticality 2 60 1.2 100 2Team Size 2 40 0.8 100 2Team Location 1 60 0.6 100 1Domain Knowledge 2 60 1.2 60 1.2Market Pressure 3 100 3 20 0.6Total Value: 10.4 12.2
It is important to keep in mind that the decision Matrix and the corresponding Radar Chart are simply tools for thought. The practitioner should not view them as black box processors where one can simply plug in values and the right answer pops out the bottom. Anyone who follows this approach will be disappointed with the results. Instead these tools should be viewed as aids in the process of determining the correct level of ceremony. They should be used to stimulate discussion and debate within the practitioner’s organization over questions such as:
What is the relative importance of these attributes to our project? What are the characteristics of our project (size, complexity, requirements uncertainty, etc.)? Will the added cost of more ceremony pay off with an added level of control over our process?
When viewed from this perspective, the practitioner will find the method quite valuable in determining the proper level of ceremony adaptation and helping the practitioner’s organization to follow a systematic approach in their software process selection.
Project Attribute Low Ceremony High Ceremony
Size / Complexity
Requirements Uncertainty
Technical Uncertainty
Mission Criticality
Team Size
Team Location
Domain Knowledge
Time to Market
Low
Mid
High
Figure 3: Radar Chart of Process Effectiveness [1]
After discussing with the two development teams, the Laureato process engineers next used a decision matrix to see which of the two teams’ SCM processes would be the best to use as a basis for adapting. Converting the low, average, and high values to 1, 2, and 3 respectively, the two process engineers filled out the decision matrix for Laureato as show in Table 4.
454

According to the matrix, the high ceremony process was found to be more suitable for the basis of the development effort; therefore, the two process engineers will consider using it as a baseline for the unified project's SCM.
Process Effectiveness
A radar chart (or spider chart) style allows an overall impression of the project to be easily seen and compared. The solid bold black line of Figure 3 shows a visual representation of the characteristic levels of the project (see the Laureato Problem Attributes of Table 3). The dotted line represents the calculated values of high ceremony attributes, and the dot-dashed line represents the low ceremony attributes (see Table 4, Low and High Process Ceremony Values). Spokes represent different project attributes. Concentric circles represent low, average and high importance values increasing from inner to middle to outer circles respectively . Although this method allows a big picture view, valuable quantitative comparison is better accomplished through the decision matrix.
To confirm the result of the decision matrix, and to help determine the baseline SCM's process effectiveness, the process engineers graphed the two teams’ SCM processes on the radar chart as shown in Figure 3. By doing so, they were able to see visually where the chosen high ceremony SCM would need to be adapted. The solid bold black line represents the shape of the project’s attributes. This shape is a visual representation of the unified project attributes. The smaller the shape, the less ceremony is desirable; the larger the shape, the more ceremony is warranted. The process engineers used the radar chart as a visual aid to talk with the two development teams for where the SCM process would likely need to change. The importance of the Market Pressure attribute suggested to them that they would have to reduce some process overhead that potentially may compromise the unified software application's quality.
Adapted Medium Ceremony for Laureato
Adapting the Artifact Development component of a High Level Process Ceremony to the unified software project, the process engineers consulted the “SCM Process Ceremony Adaptation Guide” in Table 2, making the following modifications:
Table 5: Changes to Artifact Development [1]
Artifact DevelopmentProcess Change Description/RationaleKeep source control and unit testing. The overhead introduced by unit testing is usually paid off by increased quality and
ability to do activities such as regression testing that usually makes the downstream development more efficient. The source control (Check In/Out) is obviously very important for 500,000 LOC size.
Peer review instead of formal inspections. A peer review is done by a member of the team or an architect. A project manager assigns a peer reviewer at the beginning of the project. A peer reviewer may assist the developer with the design as well as reviewing code.A peer reviewer may be a member of the other former team that will decrease chances of accidentally breaking functionality of the other system. Having a peer review is usually less expensive and time consuming than formal inspections, while ensuring acceptable level of quality.
The results of the changes outlined in Table 5 can be seen in Figure 4.
455

Additional GuidanceThe medium ceremony SCM in the previous section is just one example of adapting a high or low ceremony SCM process. Additionally, an adapted SCM process may not come at a midlevel, but need to be higher than the exemplar high ceremony SCM or lower than the exemplar low ceremony SCM. For example, a project with volatile requirements might consider the addition of prototyping to the Change Request phase and adopting evolutionary development practices during the Artifact Development phase. Conversely, a project with a more formal requirements process might consider adding formal requirements inspections at the Change Request or Artifact Development steps.
Make Changes
Check In Changes
Peer-Review
Unit Test
Check Out
[Fail]
[Pass]
[Pass]
[Fail] Link to Change Request
Another example would be a project where the most significant project attribute is a need for a quick response to market pressure. In this case, the project might consider adding steps for continuous integration and simple design to the Artifact Development phase.
As with many other aspects of SCM, the ways in which it can be adapted to best fit a project are limited only by the imagination of the practitioner. We believe the methodology explained in and the guidance provided will assist the practitioner in adapting the SCM process to best fit his or her project’s needs (also see Table 2).
Summary of Findings Counting Boxes
Early in the study we assumed that higher levels of ceremony would result in fairly precise steps represented by additional process elements as illustrated in our visual process models. From this assumption we even concluded that perhaps there might be some way for us to quantify the level of ceremony, (i.e. “precision”) by “counting boxes” along the same lines as one measures complexity by counting the number of nodes and edges in a control flow graph of a software program [9]. However, the number of steps in our process maps did not vary significantly as a function of ceremony level.
Figure 4: Mid Ceremony ArtifactDevelopment [1]
What differed noticeably was the level of formality of certain steps. For example, each level of ceremonyincorporates a step to get permission to release software. At a high level of ceremony, this could beenacted in the form of a formal presentation and sign-off. On the other hand, at a low level of ceremonythis would be very informal and could be something like yelling over the cube wall and saying, “Bob can I release the build yet?”
It is apparent that regardless of the number of process elements, there are always a few more rigorousones that involve obtaining permission or approval. Therefore what can distinguish ceremony levels mostcritically is often the formality of approval steps. Hence, both the number of process steps, and theformality of each step can drive ceremony levels. This realization was a key discovery in ourunderstanding of the implications of differing levels of process ceremony.
456

Abstraction Is the Key to Adapting
When we first developed the different levels of ceremony and attempted to represent them in diagrams, we found that the process of tailoring was quite challenging. This was primarily due to the fact that the components of each level were not interchangeable. We quickly realized the need for interchangeable parts. Based on this need we re-developed the different levels of ceremony using the components, Change Request, Artifact Development and Change Management. Creating common components made each level interchangeable with other levels, thereby enabling fairly straightforward tailoring and adaptation by mixing and matching to fit the needs of the problem. We reasoned that this would significantly simplify the tailoring process for the practitioner.
The Process Ceremony Spectrum is Unbounded
We initially set out to describe two different ceremony levels that exemplify the extremes found in the software development world. “Low” ceremony would represent the lowest possible level, and our “high” ceremony would represent the highest possible level for our contemplated range of problems and projects. However, we soon learned that, potentially, there are many levels of ceremony beyond the extremes we were considering. We called these “Lower than Low” and “Higher than High”. We further concluded that these extremes are not very common and thus we did not try to address them in our study, as they appear to represent the fringes of software process engineering.
There Is No ‘Right’ Level of Ceremony
When we started this study we had hoped, perhaps naively, to be able to develop a cookie-cutter recipe that a practitioner could use to determine the appropriate level of ceremony. We quickly came to the conclusion that there is no ‘right’ level. Each situation is unique and many factors need to be considered.
Instead we focused our energies on developing guidelines that the practitioner could use to help them reason about the appropriate level of ceremony to choose for a particular problem. This took the form of identifying key criteria to be assessed to make choices about the processes and process elements to be selected and adapted.
Although our approach requires some patience and effort, it is fairly straightforward and systematic. It also supports visual representations of alternatives that will facilitate communications with other stakeholders and facilitate buy-in. We believe that our approach will effectively stimulate the discussions needed to address the important task of selecting a suitable level of ceremony for the problem at hand.
References[1] Dan Brook, David Czeck, Joe Hoffman, John Lin, Maxim Shishin, “Selecting and Adapting Software Configuration Management for Levels of Process Ceremony”, Portland State University OMSE Program Practicum Project, 2007
[2] Toth, Kal, "Which is the Right Software Process for Your Problem?” The Cursor, Software Association of Oregon, April 2005: 1-6.
[3] Krutchen, P., The Rational Unified Process: An Introduction, 2nd edition, Reading, MA: Addison-Wesley Professional, 2000.
[4] Cockburn, A., Agile Software Development, 1st edition, Addison-Wesley Professional, 2001.
[5] Krutchen, Philippe and Per Kroll. The Rational Unified Process Made Easy: A Practitioners Guide to the RUP, New York, NY: Professional Computing, 2003.
[6] Fagan, M., “Design and Code Inspections to Reduce Errors in Program Development,” IBM Systems Journal 15(3), 1976: 182-211.
[7] Fishman, C., “They Write the Right Stuff”, Fast Company Magazine, Dec. 1996: 95.
[8] Fowler, Martin, Refactoring: Improving the Design of Existing Code, Reading, MA: Addison Wesley, 1999.
[9] McCabe, T.J., “A Complexity Measure,” Transactions on Software Engineering SE-2(4), 1976: 308-20.
457

458

Critical Success Factors for Team Software Process (TSP) Adoption
Jim Sartain, Director, Software Quality Engineering, Intuit
Speaker Biography:
Jim Sartain is responsible for Software Quality and Process Improvement at Intuit
(makers of Quicken, TurboTax and QuickBooks). His team ensures a highly
effective work environment for software professionals by inspiring, driving and
enabling high quality and continuous improvement in products and processes.
Prior to Intuit, Mr. Sartain held product development positions at Hewlett-Packard
for 17 years. His last role was developing and providing worldwide support for an
Airline Reservation System servicing low-cost airlines. Mr. Sartain earned his
bachelor's degree in computer science and psychology from the University of
Oregon, and his M.S. in management of technology from the National
Technological University.
Abstract:
The benefits of the Team Software Process™ (TSP™) and Personal Software
Process™ (PSP™) are very attractive. Quality, schedule, scope and cost are
often considered to be strict trade-offs; but Intuit's business requires delivery of
high quality software, on schedule, with efficiency. How much interest would
there be for TurboTax on April 16 or financial products that contain calculation
errors? Intuit has seen major improvements in quality, schedule, productivity and
scope as a result of adopting TSP/PSP in its largest and fastest growing
business unit.
Business leaders at Intuit frequently ask question: "How can we more rapidly
rollout TSP/PSP in our organization? Why can't we just roll it out to the entire
organization in one go?" What is the optimal way to drive a change management
effort that involves changing how 700+ software professionals do their work? A
principle component of this presentation is an evaluation of twenty+ Intuit
TSP/PSP projects, and an assessment of the factors most critical to their degree
of success. These factors include executive leadership support, training and
coaching support.
This paper discusses what Intuit has learned about these critical success factors
for TSP/PSP adoption and how to manage to them to drive a majority of the
projects in its largest and fastest growing business unit to successfully adopt
TSP/PSP.
Copyright © 2007, Jim Sartain, Intuit, Inc.
459

1 Company Background
Intuit Inc. is a leading provider of business, financial management and tax
solutions for small businesses, consumers and accountants. Our flagship
products and services, including QuickBooks, TurboTax, Lacerte, ProSeries and
Quicken, simplify small business management, tax preparation and filing, and
personal finance. Founded in 1983 and headquartered in Mountain View,
California, we had revenue of $2.3 billion in fiscal 2006. We have approximately
7,500 employees in offices across the United States and internationally in
Canada, India, and several other locations.
2 What is the Team Software Process (TSP)?
The Team Software Process (TSP), along with the Personal Software Process
(PSP), helps engineers to deliver quality software products and improve their
software processes through training, best practices and a dedicated coach. The
use of personal and team metrics drives significant change in engineering
mindset and builds support for adoption of software best practices including
metrics and early and efficient defect removal techniques including peer reviews.
The TSP improves the effectiveness of an organization one team at a time.
Engineering teams use the TSP to develop software-intensive systems. A multi-
day planning and team-building activity called a launch walks teams and their
managers through establishing goals, defining team roles, developing a task and
schedule plans, developing a quality plan, and identifying risks.
After the launch, the TSP provides recommended practices for managing
execution by continuously refining the plan using actual data and reporting team
progress.
For more information on TSP refer to: http://www.sei.cmu.edu/tsp/tsp.html
3 TSP Rollout Strategy
Intuit used a viral adoption strategy to roll out TSP. Initial projects were selected
based on their level of initial enthusiasm for adopting TSP. There is usually a fair
amount of skepticism and resistance from team members. Teams had to agree
that they were going to give adoption an honest try and work to overcome the
obstacles they encountered. These initial projects became future champions
and reference sites for the next waves of adopters. Any failed projects at this
early stage will make it more difficult to get future projects to successfully adopt
TSP. The next wave was composed of early adopters, followed by the early
majority (pragmatists). Eventually, when a majority of a department was using
TSP, it became part of the normal way software was developed for that
department.
460

3.1 Project Characteristics
The projects that utilized TSP were from 2 to 20 team members. Some TSP
teams were composed of just software engineers while others were cross-
functional teams that included other functions such as quality assurance and
user experience design. The projects ranged from maintenance releases for
legacy software products to development of brand new architectures and
application targeted for both Web 2.0 and desktop use..
4 TSP Adoption Timeline
Intuit’s Small Business Division (SBD) started the process of adopting TSP in
September, 2003. The catalyst for the first project trying TSP was a keynote
address by Watts Humphrey; the inventor of TSP, at an internal Intuit technology
conference. After the first project was completed with great success, the
participating department decided to adopt TSP for all their projects. After that,
several other departments launched their first pilots. By the third year, 40% of
the organization’s engineers were using TSP. For the coming year the plan is to
reach 75% utilization.
5 TSP Project Outcomes
The project outcomes Intuit was driving for by using TSP were increased
engineering productivity, improved quality, delivering committed scope on time
and an increased level of employee engagement. A summary of the project
outcomes is provided below:
What’s Important How Did We Do?
Productivity – Increasing product
development throughput by reducing rework.
Goal: Minimize rework associated with post
system test rework (including post release)
TSP projects have four times less post-code
complete rework than average projects
creating more time for value-added work
Quality – Plan and practice early defect
detection and prevention. Goal: find and
remove 90% of defects before system test
and release software with <0.5
defects/KLOC.
Teams found 70-90% of defects prior to
system test and delivered software with 4x to
10x fewer post-release defects
Scope – Deliver agreed upon scope on time TSP teams delivered agreed upon (or more)
scope on time
Employee Engagement – Team leaders
and /members empowered and enabled to
improve their own work processes
TSP adopters had significantly more favorable
views towards process improvement, quality
and innovation compared to non-TSP users
based on employee surveys
TSP users scored less favorably on questions
related to decision making and we are currently
working to understand this result
461

5.1 Improved Software Quality
The table below shows the percentage of defects removed before System Test
for a sample of seven Intuit TSP projects. TSP projects establish and manage
goals and plans for removal of defects at each phase of the software engineering
lifecycle. Removing defects in the same phase they are injected is frequently an
order of magnitude less costly than the next phase.
The average removal rate for these projects is compared to the post-System Test
removal rate for non-TSP projects in the organization. Our TSP project teams
are finding a greater percentage of software defects prior to System Test
compared to non-TSP projects. Defects found before system test are
significantly less expensive to resolve. Also, the percentage of defects found
before system test is directly correlated with post-release quality since System
Testing will not find all defects. As a result, TSP teams were able to add
additional features to the current release or move to another project rather than
investing their time in post-release defect repairs.
Project
% Defects Removed
prior to System Test
Project A 86%
Project B 80%
Project C 96%
Project D 98%
Project E 86%
Project F 86%
Project G 67%
TSP Average 86%
Non-TSP Average 60%
462

5.2 Productivity (Through Reduced Rework)
One of the benefits of finding and removing most defects prior to System Test is
a significant reduction in engineering rework. The table below shows the
percentage of team effort invested post-code complete for a sample of seven
Intuit TSP projects.
These TSP teams spent 80% less time fixing defects found post-code complete
(rework) compared to the average non-TSP project. This is because defects
discovered through personal reviews, peer reviews or early unit testing (e.g.,
Test Driven Development) required an average of one hour of person-time to find
and resolve, whereas the average defect found in system test required about
eight hours. This 80% reduction in post-release rework translated directly into
these TSP teams having 25% more time available for value-added work. Also,
these teams were rarely in fire-fighting mode and able to maintain predictable
work schedules and reasonable work-life balance. As a result, most TSP teams
had a larger portion of their development cycle available and allocated to design
and implementation, versus being spent in a code-and-fix cycle during system
test.
Project % Team effort Post-Code Complete
Project A 15%
Project B 9%
Project C 2%
Project D 4%
Project E 9%
Project F 4%
Project G 15%
TSP Average 8%
Non-TSP Average 33%
5.3 Delivering Committed Scope
TSP projects did a better job of estimating the scope they could deliver with
quality. Frequently they were able to use the time they saved from rework
reduction to deliver additional features prior to the final system release while
other teams were finding and removing defects.
463

5.4 Employee Engagement (Changing Engineering Mindsets)
One of the biggest benefits of TSP is that TSP veterans frequently undergo a
mindset change regarding software engineering best practices. Since they can
see with their own personal and team data that personal reviews, peer reviews,
and early (pre-system test) unit testing pays off in reduced rework, they make it a
priority to include these activities in their software development plans. They are
also able to tailor the process based on their team retrospectives and the data
from the past projects. Some teams have adjusted their requirements processes,
and design steps, included more checks in their team peer reviews using
feedback from their past work. Having the flexibility and ownership in team
process is what makes TSP a better process for many teams. As one veteran
TSP team puts it “We own our process, the process does not own us.”
5.5 Intuit Annual Employee Survey
Intuit conducts an annual survey to understand what is going well and what
needs improvement from an employee perspective. This information was
leveraged to discover any significant differences in employee viewpoint on
software process related questions. The two populations compared were: (1)
The collection of all SBD employees that used TSP for more than one year; (2)
The rest of the SBD Product Development employees. For eight questions there
was a significantly more favorable point of view for TSP users than non-TSP
users. For two questions, there were less favorable outcomes.
5.5.1 More Favorable Questions
TSP users have a significantly more positive view about the fact their group
improved their work processes. TSP teams typically feel great ownership for
their work processes and their ability and commitment to improve them on a
continuous basis. This goes hand-in-hand with the next question that they feel
encouraged in coming up with new and better ways to do things. The next three
questions relate to a higher level of employee engagement and overall job
satisfaction. This is not surprising since these teams typically have a better
work-life balance and more time to do value-added work.
464

5.5.2 More Favorable Questions (Continued)
The next three favorable questions show that the TSP teams perceive that their
opinions count, their leaders are committed to customer satisfaction (quality), and
that their work group works well together. The processes that TSP uses to
identify clear roles, goals, and plans promotes better teamwork and gives the
leadership an opportunity to demonstrate their commitment to quality. At the
beginning of a launch process the leadership team states what is needed from a
business and customer perspective and the team comes up with their best
plan(s) to meet these goals. Having the leadership clearly state that function
AND quality are both important helps reinforce the commitment the leaders have
for delivering to customers.
5.5.3 Less Favorable Questions
The two questions below reflect where TSP teams have less favorable
responses than non-TSP teams. Both of these questions relate to
organizational decision making. In focus groups with TSP users that were part
of this survey it was learned that these teams have a much clearer picture of
what key decisions need to be made, and what the consequences of delayed or
poor decision making is. As a result, they were less satisfied with the quality of
organizational decision making.
465

6 Critical Success Factors for Adoption
The following factors were found to be critical to TSP adoption: Project
Leadership Ability, Leadership Support, Coaching Support and Adequate
Training. In the occasions where a TSP project struggled to successfully
complete the project or adopt TSP, one or more of these factors were weak or
not present. The most significant challenges to TSP adoption were: (1)
Overcoming an initial hurdle in getting team members to track their time and
defects; (2) Requiring the use of quality best practices such as unit testing and
peer reviews.
6.1 Project Leadership Ability
TSP project teams undergo major changes in how they work. It is very common
to have significant resistance to adoption. If a Project Leader is a weak leader
and does not have a good grasp of software engineering fundamentals, the team
will struggle to execute the practices they have agreed to follow as part of TSP –
particularly the tracking of time and defects. Even though the tracking of time
typically requires 1-5 minutes per day, and logging defects involves making a one
line entry in a spreadsheet or TSP tool, teams without strong leadership will
equivocate and not do this work. As a consequence, they won’t have the data
they need to know how they are doing, including where they are improving or not
improving. This will undermine the TSP/PSP process.
Another common problem is that teams will establish a plan and not treat it as a
living artifact. Everyday there are new learnings and the plans need to be
continually adjusted to meet what is known. For example, outside projects may
interfere with current work plans. The team will need to account for tasks that
were under or overestimated.
If a Project Leader is not an adequate leader, then TSP is not advised (or any
other major software development methodology changes for that matter,
including agile methods). A quality and process improvement methodology
cannot substitute for adequate leadership capability.
6.2 Coaching Support
The TSP coach acts as a co-pilot for the project. They should be experienced
and highly effective with software engineering in general and TSP in particular.
A strong coach can help an adequate project leader and team deliver excellent
work. They play a team leadership development role that will not only help
ensure the project delivers on its objectives, but, leave a more skilled and highly
engaged team in place when the project is completed.
466

6.3 Leadership Support
To deliver quality work and improve how it is done, the leadership of the
organization must expect and encourage it. Some organizations are primarily
driven to deliver sets of features requested by business leadership. In these
organizations the schedule is key, and there is not an explicitly stated goal that
the team needs to deliver requested functionality with quality. Even though it
typically takes less effort to deliver a high quality product than an average or low
quality product, date-driven organizations will focus on meeting a code-complete
or shipment date and then invest large amounts of time and effort fixing the
software. It is not uncommon in these organizations to have a System Test
schedule that is 50% of the overall product development cycle with another 25%-
50% invested post-release to resolve known and newly discovered post-
shipment defects.
In addition to providing an environment where high quality work is expected,
supported and rewarded, the leadership team must provide the necessary time,
dollars and headcount for TSP training and coaching.
6.4 Training
Intuit created a customized five-day PSP training course for a three day training
course for support staff, a two-day course for first-line managers, and a one-day
seminar for executives and senior management. Adequate training is a crucial
investment. Having teams composed of partially or untrained resources creates
unnecessary barriers to success. The investment in training is quickly recouped
through the rework savings and better planning and execution that effective TSP
teams demonstrate.
6.5 Summary and Conclusion
The benefits of the Team Software Process and Personal Software Process were
very attractive. The self-directed teams adopting TSP and PSP were able to
ensure that quality, schedule, scope and cost were not strict trade-offs. Through
a combination of better planning and estimation, improved project execution and
effective use of quality best practices such as unit testing and peer reviews,
these teams delivered high quality software, on schedule and budget, with good
work-life balance for the team. Learnings from retrospectives and improved
metrics helped drive continuous and significant improvement in product and
process. The biggest change was in the mindset that a team owns its work
processes and has primary responsibility for defining and improving it. TSP/PSP
is one way to achieve these goals. Although challenging, adoption by projects
and entire organizations is possible, provided the rollout is well planned and
managed.
467

References
1. Davis, N., and J. Mullaney, “Team Software Process (TSP) in Practice.” SEI
Technical Report CMU/SEI-2003-TR-014 (September 2003)
2. Kotter, John, “Leading Change”, Harvard Business School Press, 1996.
3. Moore, Geoffrey, “Crossing the Chasm”, Harper Business, 1991.
4. Humphrey, Watts, “Winning with Software”, Addison Wesley Professional, 2001.
5. Humphrey, Watts, “TSP – Leading a Development Team”, Addison Wesley
Professional, 2005.
6. Humphrey, Watts, “PSP – A Self-Improvement Process for Software Engineers”,
Addison Wesley Professional, 2005.
7. Software Engineering Institute , Carnegie Mellon University,
http://www.sei.cmu.edu/tsp/tsp.html
468

Building Quality In – A Model for Achieving High Quality
on Any Type of Project
Kathy Iberle
Pacific Northwest Software Quality Conference 2007
Abstract
We’ve all heard that it’s better to “build in quality” than to test in quality. Have you ever wondered how
exactly is quality built in?
Most books about quality assurance say that following good practices will ensure that quality is built in.
However, the quality assurance books describe only the “quality” practices – configuration management,
testing, auditing – and not the practices which actually create the software. Software engineering books
do describe the practices which create the software, but often without explaining how those practices
build in quality, or under what circumstances they work best.
If you understand the fundamental principles that make some software engineering practices work in
some circumstances and not in others, you’ll be able to put together a set of practices which will build in
quality for any situation. Once you understand the principles, you can choose practices, testing
methodologies, and so forth to fit whatever your environment may be.
This paper explains the fundamental principles and demonstrates how to apply them. We’ll take a look at
identifying what type of mistakes are most frequently made in your organization, and at choosing from a
toolkit of prevention and detection practices to address these mistakes. We also consider how to choose
practices which will best fit your organization’s software development process.
Biography
Kathy Iberle is a senior software quality engineer at Hewlett-Packard, currently working at the HP site in
Vancouver, Washington. Over the past two decades, she has been involved in software development
and testing for products ranging from medical test result management systems to inkjet printer drivers to
Internet applications. Kathy has worked extensively on training new test engineers, researching
appropriate development and test methodologies for different situations, and developing processes for
effective and efficient software testing.
Kathy has an M.S. in Computer Science from the University of Washington and an excessive collection of
degrees in Chemistry from the University of Washington and the University of Michigan.
Her website is at www.kiberle.com
Copyright Kathy Iberle, 2007
469

Introduction
Have you ever wondered exactly how one goes about “building quality in?” Is it possible to avoid being
constantly plagued with errors and rework, with endless “stabilization” phases, with compromise and
customer dissatisfaction?
It is possible, but rarely well explained. Worse, there’s a lot of misleading information circulating in the
industry. Most of the sources prescribe solutions that are aimed at specific contexts – a particular type of
business, or a particular type of product. The solutions do (usually) represent the application of
fundamental principles to those contexts, but the principles themselves are either mentioned superficially
or not explained at all. This makes it very difficult to apply lessons learned in one context to any other
context.
If you’re writing custom financial applications or client-server web-enabled apps, you’re in luck – those are
the two most common contexts so you’re likely to be able to find and successfully use a prescribed
solution. All the rest of the diverse software industry continues to struggle, trying to understand how
similarly good results can be achieved when you simply don’t have the ability to release every two weeks
or to work directly with your customers.
This paper is for the rest of us. I will explain the fundamental principles that are behind most of the
successful methods and processes touted in the industry. Once the principles are understood, you too
can apply those principles and assemble your own high-productivity, high-quality software development
methodology – one that will fit your environment and your business.
Fundamentals of “Building Quality In”
Software development is a creative process which is fraught with opportunity for error. Worse, defects,
once created, tend to propagate, either becoming more and more expensive to fix or breeding more
defects. [MCCO96]
Let’s talk about defects. There are two things you can do about defects:
• Prevent them from being made in the first place.
• Find the defects very early, before they have a chance to devour time and money.
These are two fundamental principles that you will find behind many of the practices in successful
software engineering and quality assurance methods. For instance,
“Prevent defects” can be found in
• ISO 9001’s insistence on tracking training records (which implies training)
• CMM’s emphasis on establishing and using known practices
• the inclusion of configuration management in quality assurance methods
• the use of code inspections to teach better coding skills
• the frequent re-assessment and tuning of practices found in most iterative software development
methods (e.g. see [MAL2002])
“Find defects early” shows up in various forms in nearly every software development method:
• Waterfall and V-model’s emphasis on inspections of specifications, designs, and code to find errors
• Agile methods’ use of test-first programming
• Prototyping to determine whether you’re on the right track.
Some combination of these two principles is the basic idea behind most “quality” methods.
470

Why Doesn’t One Method Work For Everyone?
Once a project starts controlling its most common defects, productivity will almost always increase.
That’s because, the longer a defect stays in the system, the more costly it will be to find and fix.
Setting up the control mechanisms for the first time will cost time and money, and this cost can be
significant. But once the controls are in place, the cost of producing the software goes down. This has
been demonstrated in many studies – both in waterfall-style development [MCCO98] and in agile
development.
However, if the project applies control methods that don’t control its most common defects, the cost of the
project can actually go up. New work has been introduced, and it isn’t reducing the old work enough to
compensate. I suspect this is the problem behind many failed process improvement projects. They
aimed at the wrong problems. You need to go after the problems that cause your projects’ defects, not
the problems causing somebody else’s defects.
So let’s look at defects and where they come from.
Where Do Defects Come From?
A software failure is erroneous or undesired behavior. A failure is caused by one or more faults –
incorrect code that will have to be changed. Behind most faults is a mistake – a task incorrectly
performed by some individual. The term defect is somewhat ambiguous – it is used to refer to both faults
and failures.
Almost every failure traces back to one or more mistakes made during some task. The mistake might
have been made during the task of writing the code, but it could just as easily have been made during an
earlier task in software development. It’s also possible to have defects caused by unreliable tools, in
which case the underlying mistake was in the writing of the tool or in making the choice to trust that tool.
In this paper, we’ll focus on mistakes made during software creation.
The tasks directly performed in software production fall into four main categories:
• Gather user requirements (determine what the customer wishes the product would do)
• Specify the product (decide what the product shall do)
• Design the software (figure out how the product will do those things)
• Implement the design (write the code)
In all software lifecycles, these four tasks are
performed in varying combinations. The classic
waterfall lifecycle instructs the team to
• collect all the user requirements
• specify the entire system
• design the entire system
• code the entire system
in that order.
An iterative lifecycle recommends
• collecting some user requirements
• specifying the features to meet those requirements
• designing the code for that functionality
• building that functionality
• checking with the user to see if the functionality is
what the user wanted
and then repeating the entire cycle.
Figure 1 shows the steps sequentially, for simplicity.
Figure 1: The Major Tasks
in Software Creation
471

Each of these four tasks is prone to characteristic mistakes. For instance, failure to initialize variables,
and running off the end of an array are two mistakes commonly made during coding.
Mistakes in design are often mistakes of omission – failing to handle foreseeable errors and exceptions,
or failing to check for external conditions. The mistakes made in gathering requirements are usually
either misunderstanding the user’s needs or failing to discover some of the user’s needs completely.
Figure 2 shows mistakes which are
commonly made during each task.
All organizations make most of these mistakes, but not in the same proportions. I have observed over the
years the type of mistakes most commonly made varies widely between different organizations. I no
longer assume that adoption of any particular practice will be equally effective in every organization.
I once attended a week-long class on inspections with half a dozen development teams from the same
organization. The instructor assured us at the beginning, “Code inspections are the most useful type of
inspection. My classes always discover that, but I’ll teach you to inspect everything for the sake of
completeness.” We spent the next four days practicing inspections, using samples of our own
specifications, design, and code from recent projects. After the class was over, some of the teams
compared notes. Four out of five had discovered many more mistakes in their specifications than in their
code. We didn’t know if we were uncommonly good coders, or uncommonly bad specification-writers, but
we could easily see that inspecting specifications would be more useful for us than inspecting code.
I’ve seen this diversity over and over in different organizations, both from personal experience and in the
literature (for example, see [GRAD97a]. Every group of people has its own strengths and weaknesses,
and every set of processes has its own strengths and weaknesses. This means that every organization
has its own characteristic pattern of mistakes.
Later in this paper, we’ll talk about how to identify your organization’s characteristic pattern of mistakes.
For the moment, let’s assume we have determined that pattern, and go on to consider what to do about
the mistakes.
Figure 2: Common
Mistakes
472

How to Prevent or Detect a Particular Class of Mistakes
Each type of characteristic mistake can be prevented or detected by different means. One size does not
fit all – a practice that’s very good at detecting a particular type of mistake can be terrible at detecting a
different type. For instance, white-box testing is good at finding coding errors but is blind to missing
requirements. Prototyping is good at finding requirements problems but does nothing about coding
errors. In order to craft your own customized quality control method, you not only need to know what
types of mistakes your organization typically makes, but you also need to know which practices are good
at dealing with those types of mistakes.
Prevention Methods
First, let’s take a look at prevention. Prevention means just that – the mistake is never made at all.
Prevention methods are generally under-utilized and are often ignored completely in favor of the more
obvious detection methods. Yet the cheapest way to fix a mistake is never to make it in the first place.
The two most powerful methods to prevent mistakes generally are
• using an appropriate practice or method for a given activity
• adequate training in the activity and the chosen practice or method
For instance, most of the design methods in use today are intended to prevent design mistakes by using
a systematic method and notation to help the designer think through the problem clearly. There are
different design methods for different types of software problems. Choosing a method inappropriate to
the problem (for instance, trying to design a database schema using structured programming) can
introduce a lot of mistakes. Using no design method at all is a well-known way to introduce errors.
Another example is gathering requirements. Many software engineers have had little or no training in
gathering requirements, and as a result tend to overlook the non-functional requirements of the system.
The requirements are never gathered or are poorly understood, and the developers don’t realize this.
The omissions are built into the design, and then the code, and these mistakes are not noticed until user
acceptance testing or beta testing. This is a very expensive set of mistakes, and yet they can often be
prevented by investing less than a hundred dollars on a classic software requirements book and a day or
two of developer time learning how to recognize basic omissions in non-functional requirements.
Detection Methods
Detection methods include both inspection or review of an intermediate document and exercise of the
actual software. Some sources refer to these as static and dynamic testing respectively.
Intermediate documents such as requirements documents, design documents, and code listings are all
outputs from one of the four main tasks. Inspecting output from a task generally finds mistakes made
during that task. Mistakes made during previous tasks are not usually apparent.
Various types of dynamic testing also focus on finding particular types of mistakes. Some examples:
• Black-box system testing is good at finding omitted specifications, since it compares the software to
the specifications.
• Black-box testing can be good at finding failures to consider the environment in which the software will
run.
• White-box testing is good at finding logic errors – mistakes made during coding. Some logic errors
can be found quickly by a black-box system test, but other logic errors will lurk unseen for weeks or
months, and be very difficult to diagnose when they are exposed. White-box testing generally finds them
all quite quickly.
• Automated functional testing (beloved of test-first programmers) does a great job of finding logic errors
and design errors, but usually will not find failures to consider the environment nor omitted requirements.
Table 1 (next page) lists some of the most common methods to prevent or detect each type of mistake.
473

Table 1: Methods to Prevent or Detect Particular Types of Mistakes
Sample Prevention and Detection Methods
Activity Mistake Prevention Detection
Miss requirements -- interviewing techniques
-- use cases (as opposed
to lists of features)
-- prototyping
-- requirements inspections
-- user acceptance testing
-- beta testing
Record requirements
ambiguously
-- education in writing
requirements [WIEG03]
-- requirements reviews
Gather
Requirements
Customers are
uncertain - they don’t
know what they want
-- prototyping
-- user acceptance testing
Omit some
requirements – fail to
specify any feature to
meet them
-- requirements traceability
tools
-- user acceptance testing,
beta test
-- spec reviews
Specify System
Write confusing or
ambiguous
specifications
-- SMART requirements
-- Planguage [GILB88]
[WIEG03]
-- requirements inspection
-- user acceptance testing
Omit some of the
specifications – fail to
design anything to
implement them
-- requirements traceability
tools
-- black-box functional
testing
Make logical design
errors
-- design standards
-- UML, ERD, structured
programming
-- black-box functional
testing
-- design reviews
Design System
Ignore possible
environment behavior
-- education in
technologies
-- black-box system testing
Misinterpret the design -- education -- code reviews
-- integration testing
Leave out part of
design – fail to code
anything to implement
it
-- design checklists
-- CASE tools
-- gray-box test against
design specs
Make logical coding
errors
-- Hungarian notation
-- Coding standards
-- Test-first development
-- Mentoring, education
-- see [MCCO04a] for more
code inspections
-- unit testing (white-box)
[MCC04b]
Implement System
Ignore possible
environment behavior
-- defensive programming
techniques
-- system testing
474

Designing Your Own Quality Control Method
There are a lot of different practices in the list above, and some of them actually conflict with each other.
How do you go about choosing the right practices for your organization?
There are three factors which, once understood and recognized, allow an organization to identify the
practices which will be most effective for that organization:
• Cost profile: The criticality of the software and the cost of making changes after release will make
some types of defects more expensive than others. This varies a great deal from business to
business. A given defect can be fatal in one business and merely annoying in another.
• Characteristic mistake profile: the tasks in which mistakes are typically made, and the types of
mistakes most often made.
• Existing “lifecycle”: The order in which the software creation tasks are performed, and the
prevention and detection practices already in place.
Once you’ve identified your mistake profile and understand the cost of defects for your organization, you
will know which mistakes you want to eliminate first, and you can then choose appropriate practices for
your organization. We’ll go over each of these steps in this section.
Cost Profile: Identifying the Mistakes to Target
It’s not a good idea to attempt to reduce all types of mistakes simultaneously. If you start following
someone else’s laundry list of practices, you’ll probably end up implementing at least one change which
addresses a type of mistake that isn’t prevalent in your organization. The change will cost time and
money but nothing will get much better. This not only wastes resources, it makes people less willing to
work on subsequent changes.
If a particular class of failures hasn’t already been chosen as a target, you’ll need to identify a class of
failures to work on. Most organizations would prefer to reduce the failures which are costing them the
most – in development time, in support costs, in reputation.
You may find that the organization already agrees on which failures to target, or you may find there is a
lot of debate. I’ve run into mythical failures, where a type of failure was so problematic for so long that the
management believes it’s still occurring for a year or more after it was wrestled into submission.
If a particular class of defects hasn’t been targeted, you might consider starting with failures that had an
obvious cost, such as one of these groups:
• Failures which required maintenance releases or patches
• Failures which forced a project to miss its planned release date
• Failures which routinely eat up a lot of development time – failures which are not individually
serious but are collectively numerous.
Characteristic Mistake Profile: understanding which types of mistakes are most
commonly made
Once a particular class of failures has been identified as a target, it’s necessary to understand what type
of mistakes are being made to create these failures, and why these mistakes are being made.
One of the best ways to identify characteristic mistake patterns is through root cause analysis.
[GRAD97b] Root cause analysis identifies the development task during which the fault behind a failure
originated. (The tasks are listed in Figure 2). Once the task is known, it’s easier to figure out what type of
mistake is being made and what could be done to prevent it or detect it earlier. A root cause analysis
study involves choosing a representative sample of defects and looking for patterns in their root causes.
475

In some organizations, a programmer is required to identify the root cause of a defect and record that
when fixing the defect. In other organizations, this isn’t done. Even when the original programmer is
required to record the root cause, the root cause may frequently be incorrectly identified. Many
developers will classify all defects as coding errors even when the mistake clearly originated in an earlier
task.
Generally, identifying the root cause is most accurately done by the original developer or someone else
familiar with the code and the defect. In organizations where root cause isn’t typically recorded or is often
inaccurate, root cause studies can still be done after the fact, by doing a root cause analysis on the entire
set of defects or on a randomly chosen sample.
Sometimes the developers need some help learning to attribute root causes. The developer’s initial
response to the failure report often gives me a clue to where the mistake occurred.
• “It shouldn’t be doing that.” - the code or the design is wrong
• “It works as designed.” - either there is no written specification, or unwritten requirements (as
understood by the test team) are in conflict with the written specification
• “But users won’t do that.” – requirements and specification are probably both missing
• “I’m not sure if that’s ok.” – the specification may be ambiguous
• “I didn’t know anyone wanted that.” – a missing requirement
• “These don’t match. Which one is right?” - conflict between two overlapping specifications.
The distinction between a problem introduced in design and a problem introduced in implementation is
often fuzzy to the developers, particularly if there wasn’t much of a written design in the first place. Some
symptoms of design problems:
• Disagreement between two teams over interface definition or responsibility of their code
• Fixing the problem requires ripping out big chunks of code and redoing them
• Only occurs in one environment (characteristic of design problems caused by neglecting to
account for differences between operating systems, locales, etc.)
Choosing the Appropriate Practice to Apply
Once you know which types of mistakes are being made, you can choose practices which will be the
most likely to prevent or detect those mistakes early. Table 1 offered a number of choices for many types
of mistakes. How do you choose the ones that will best work?
This usually depends on the lifecycle or software development method being used.
For instance, a requirements defect can be noticed either when the requirements are gathered (shown in
bold), or noticed after the code is created by comparing the working system with the user’s expectations
(shown in italics). The intervening development tasks don’t provide any additional opportunities to either
notice or prevent requirements errors.
Mistake Prevention Detection
Miss requirements -- interviewing
techniques
-- prototyping
-- requirements inspections
-- user acceptance testing
-- beta testing
Record requirements
ambiguously
-- education in writing
requirements
-- requirements reviews
Customers are
uncertain - they don’t
know what they want
-- prototyping
-- user acceptance testing
476

In a waterfall lifecycle, this means there are two chances to find requirements problems: at the very
beginning of the project, and close to the end. In an iterative lifecycle, there are still two chances to find a
requirements problem – but the second one is no longer close to the end of the project.
The effect of your lifecycle on the
effectiveness of a practice is easier to
see if you draw out your lifecycle and
trace the path of a particular type of
defect through the lifecycle.
Figure 3 shows the defect injection
during a project using a waterfall
lifecycle. If nothing is done to prevent or
detect defects, each task introduces
more defects and they accumulate until
the end of the project.
However, all projects have at least some
detection practices already in place. A
lifecycle with such practices is shown in
Figure 4.
Let’s consider a defect caused by the customer not telling you what they want because they don’t know
what they want until they see the product.
Follow the gray arrow marked “time”
from the original source of the defect
(the requirements task).
The first detection practice is a
requirements inspection. Will a
requirements inspection notice that the
customer didn’t tell you something?
Probably not.
Next we come to design review, and
then unit testing. Will design review or
unit testing catch it? Definitely not.
Will the black-box testing catch it?
Maybe – it depends on how well the
testers understand what the customer
wants.
Will the user acceptance test catch it?
Most likely yes.
We’ve learned that we likely won’t find this error until quite late in the project. If this class of mistakes is a
significant cause of problems for your organization, consult Table 1 for other practices. Use the diagram
to figure out if the practice will be effective within your particular lifecycle. In this case, the practice of
prototyping might work.
Figure 3: Defect Injection in a Waterfall Lifecycle
Figure 4: Mistakes in gathering requirements
are addressed by these practices
477

The effective prevention or detection practices for a given type of mistake can be considerably different in
different lifecycles. For instance, follow the same omission in requirements through the Extreme
Programming lifecycle shown in Fig. 5.
The first detection practice is test-first
development. This is not going to find
missing requirements.
The next two practices are pair
programming and unit testing. These
won’t find missing requirements
either.
The fourth practice is user acceptance
testing. When conducted by the user,
this does find missing requirements.
Thus, the missing requirement is
noticed quite early in the project, at
the end of the first iteration.
Bringing It All Together
Optimizing your software development process to build in quality boils down to these steps:
0) Knowing which types of prevention and detection practices work best for each type of mistake. (This
is “step 0” because it is background information – it doesn’t need to be repeated for every process
improvement project).
1) Identifying which mistakes your organization is most prone to making and which are the most costly
2) Understanding when in your lifecycle those mistakes are made
3) Knowing which practices are already in use in your department, and how effective those practices will
be at preventing or detecting the problems
4) Based on all of the above, choosing appropriate practices to address those mistakes and applying
them
Let’s walk through a couple of examples. These are taken from real life, with some details changed to
simplify the story and protect confidentiality.
Example 1: Project Giraffe 2.0: Backup Trauma
This project was a fairly straightforward data management application incorporating a commercial
database management system. It was created by a single team who work in the same building.
Identifying the Mistakes to Target
The Giraffe team struggled with defects in the backup/restore function of Giraffe 1.0 and 1.1.
There were multiple failures on each project and each time, it took an agonizingly long time to find the
fault behind the failure.
Figure 5: An Extreme Programming project
478

Understanding which type of mistake is occurring
While planning Giraffe 2.0, the team had a long talk about the backup/restore defects and why they had
occurred. Giraffe 2.0 was planning to completely overhaul the backup/restore system to make use of
newly released hardware with much larger storage capacity. The programmer who’d done most of the
work, Steve, admitted that he didn’t fully understand the backup/restore functionality provided by the
database vendor and felt like he was working in the dark some of the time. The rest of the team was
sympathetic, and assured him that no one else understood the backup/restore calls very well either.
Steve was making mistakes during the design of the application...
The length of time it took to diagnose each defect was discussed too. Steve kept saying it would take
him two or three days to diagnose each defect. Finally someone asked why it took that long, since the
failed call could be read out of the error log. Steve informed the team that in fact, the error log didn’t
contain the return code from the failed call – he had to re-run the entire 2-hour backup with a debugger on
to capture the return code. The error logging provided by the DBMS vendor wasn’t working as
advertised. The team agreed that this was a royal nuisance.
The cost of the design errors was compounded by the unusually high cost of replicating and diagnosing
the failures.
Choosing appropriate practices for the existing lifecycle
The Giraffe team routinely mapped
out their major detection activities in a
“quality plan”, so the entire team was
already aware of the existing
detection activities. This is shown in
Figure 6.
Figure 6: Lifecycle of Project Giraffe
After reviewing the existing prevention and detection activities, the team concluded that more design
reviews wouldn’t help, because none of them were familiar enough with the technology to notice
mistakes. Instead, they discussed employing a prevention practice – education.
The team lead talked to Steve about the backup/restore functionality and what it would take for Steve to
understand it better. Together, they identified a system administrator’s class which spent a full day on the
intricacies of backup/restore.
Another team member, Gina, had an idea which would speed up detection. She suggested writing a
custom error handler to replace the off-the-shelf error handler, so the error codes would get logged
whenever a failure occurred.
479

The team lead showed the
manager the proposed changes.
Figure 7 shows Project Giraffe with
the added prevention practice. This
type of map is often helpful when
discussing addition of practices with
management, because it’s fairly
easy to show where defects are
detected earlier and explain which
types of defects will be addressed.
Figure 7: Project Giraffe with added quality practice
After some negotiation, the project manager agreed to the changes. Steve went to the training class, and
Gina wrote the error handler in eight days (three more than her original estimate). The team was pleased
when substantially fewer defects were found during the rewrite of the new backup/restore subsystem, and
those were easier to find and fix than in the previous version.
Example 2: Project Zebra: Dialog Mismatches
The Zebra team was responsible for the installation software for a printer. The printer would be shipped
with installation software and a hard-copy setup poster, both of which instructed the user on how to install
the software and connect the printer. The printer software was created by a large set of teams who
worked in various buildings.
Identifying the mistakes to target
The Zebra team was plagued with several episodes of problems spotted during beta tests. Various install
dialogs didn’t match the setup poster, resulting in confused users. Both the dialogs and the poster were
expensive to change late in the project, so management was understandably concerned.
Understanding which type of mistake is occurring
As is often the case, the management initially said that the solution was “more testing”. But was it? The
Zebra team needed to know what mistake was occurring, and when. There wasn’t agreement on whether
the install dialogs were “wrong” or the setup poster was “wrong”, much less what the root cause of the
defect was.
The Zebra team set out to find the root cause of the problems – the task in which the mistake was
occurring. This organization (unlike the Giraffe organization) didn’t routinely map out its prevention and
detection methods, and the sheer size of the organization sometimes obscured who was doing what. The
Zebra team did some digging to find and put together the map shown in Fig. 8.
After the map was completed, the researcher traced the problem through each step in Fig. 8 to
understand who was doing what. Since it wasn’t clear where the problem was arising, the researchers
started at the very beginning and followed both the install dialogs and the setup poster through each step
in their lifecycle.
480

• Requirements: the authors of the dialog and the setup poster both readily agreed that the users
expect the install dialogs and the setup poster to match, and that they intended them to match.
– The mistake was not made in this step.
• Specification of functional requirements: the researchers were told that the earliest “specification” of
poster was a draft by the technical writers, and the earliest specification of dialogs was a sketch of
install screens
– Could the mistake have arisen here? Is dialog text stated in either specification?
• Design: there is no software interface between the dialogs and the setup poster
– The mistake didn’t arise during software design
• Coding / Implementation
– Does the install dialog code match its specification?
The Zebra team needed more information. They sent someone to find samples of the install dialog
specifications and a sample of the setup poster specification. They discovered that the early
specifications of the poster and of the dialogs were both pretty vague concerning the actual dialog text.
The authors of the dialogs continued to make changes throughout development, in response to feedback
from various departments. The authors of the poster collected dialog screenshots at some point in
development, but there was no obvious process for guaranteeing that the poster and the dialogs in synch
with each other. The first time that the poster and dialogs were tested together was in beta testing.
Choosing appropriate practices for the existing lifecycle
The most obvious practice to apply was black-box testing: add earlier testing of the dialogs and setup
poster together, rather than try to beef up the testing of either one alone. The Zebra team added a
system test (prior to beta testing) which called for comparing the draft setup poster with the dialogs. This
forced the poster writers and the test department to agree on a method for the test department to get
access to the draft posters and be informed of the poster’s deadlines. A distribution list was created.
If one wanted to prevent the mistake from occurring in the first place, then the setup poster and dialogs
would have to be kept synchronized during their development. This can be a costly change to make in a
large organization, because it involves three organizations (writers, developers, and test). It’s frequently
smart to make the less expensive change first and see how effective it is. In this case, when the
developers started receiving defect reports on dialog/poster mismatches, they asked questions,
discovered the new distribution list, and got themselves added, thereby allowing them to informally check
the synchronization between the dialogs and the poster.
Figure 8: Development process for Project Zebra
481

The Speed of Change
I’ve used the method described above in a number of different organizations over the years. It works
reliably to identify practices which will be effective, but the speed of change depends a great deal on the
organization in question.
The Giraffe team worked in an organization which had a history of analyzing problems and adapting its
practices rather quickly. For instance, this organization responded to the unexpected learnings from the
class on inspections by forming a temporary “Tiger Team” to revise the specification process for the entire
organization. (The existing specification process had consisted of two paragraphs in the lifecycle
handbook. After about three months, the team delivered a template, a three-page guideline on writing
specifications, and a short training class. This organization typically did one or two such process updates
per year, sometimes as many as four in one year.
One reason the organization could move so fast is that it was rather small – fewer than fifty software
engineers total scattered across a dozen integrated product-development teams. Everyone knew the
entire software development process rather intimately, and had easy access to all the people involved.
Problems such as the Zebra team encountered were less likely to occur in the Giraffe team’s organization
simply because there were fewer people. The process of writing a setup poster wasn’t a mystery to
Giraffe’s quality engineer, because she regularly ate lunch with one of the two learning-products
engineers responsible for such things.
However, another significant reason is that the Giraffe team’s organization invested in learning. The
organization routinely required every project to create a list of the prevention and detection activities for
its project in its “quality plan”, and required every project to assess and document its quality plan’s ability
to prevent or detect the most dangerous errors. After a few years, the staff were all accustomed to this
type of thinking and proficient at quickly choosing effective methods.
Once this sort of structure is in place, the organization is highly productive and can produce high-quality
software for a very reasonable cost. However, there is an investment in learning how to do the analysis
and then repeatedly doing the analysis, implementing the steps and observing whether or not the plan
was effective. This is not an insignificant investment.
Conclusion
There are quite a number of software engineering or software process books which offer solutions to
quality problems in the form of a process, such as the Personal Software Process [HUMP95] or eXtreme
Programming [BECK00] or even the venerable V-model. The problem with this approach is that not one
of these processes works on every single type of project. Processes which frequently produce good
results for in-house IT applications may not make sense for embedded software, and processes that
produce great embedded software may not result in excellent consumer applications.
By understanding the fundamental principles that make these processes work in their target situations,
you’ll be able to put together a process that will build in quality for any situation. Once you understand
the principles, you can choose practices, testing methodologies, and so forth to fit whatever your
environment may be.
In this paper, I explain two fundamental principles: understanding when and where mistakes are most
frequently made, and choosing from a toolkit of prevention and detection methods to either prevent or
detect the mistakes as early as possible.
482

We’ve seen:
• the types of mistakes commonly made during each of the four software development tasks
• which prevention and detection mechanisms typically work best at locating each type of mistake
• how to identify the problems that you most want to eliminate from your organization
• how to identify the types of mistakes behind those problems
• how to choose appropriate practices to eliminate those problems.
Good luck creating your own efficient and effective methodology to build in quality!
For further reading on this topic, I recommend Martyn Ould’s Managing Software Quality and Business
Risk, 1999.
References
[BECK00]: Beck, Kent; Extreme Programming Explained; Addison-Wesley; 2000.
[GILB88]: Gilb, Tom; Principles of Software Engineering Management, chapter 8; Addison-Wesley;
1988; also see www.gilb.com ;
[GRAD97a]: Grady, Robert B.; Successful Software Process Improvement; Prentice-Hall; 1997; p. 200
[GRAD97b]: Grady, Robert B.; Successful Software Process Improvement; Prentice-Hall; 1997; ch. 11
“Software Failure Analysis for High-Return Process Improvement Decisions.” Root cause analysis
appears in the literature under several keywords: defect cause analysis, defect causal analysis, root
cause analysis, and orthogonal defect classification.
[HUMP95]: Humphrey, Watts; A Discipline for Software Engineering; Addison-Wesley; 1995. Describes
the Personal Software Process
[MAL2002]: Malotaux, Neils; http://www.malotaux.nl/nrm/English/WrkSlds.htm
[MCCO96]: McConnell, Steve; Rapid Development; section 4.3 Quality Assurance Fundamentals;
Microsoft Press; 1996; McConnell refers to a series of published papers from 1988 through 1994 which
cite various figures on the cost of rework and the advantage of finding defects early. The most-often
quoted statistics on this topic date back to the early 1980s and may not be entirely applicable to the
projects of today, but the principle appears to stand firm.
[MCCO98]: McConnell, Steve; “The Power of Process”; IEEE Computer, May 1998; also see
www.construx.com. This article quotes four studies demonstrating my point.
[MCCO04a]: McConnell, Steve; Code Complete, 2nd
ed.; Microsoft Press; 2004;
[MCCO04b]: McConnell, Steve; Code Complete, 2nd
ed.; Microsoft Press; 2004; ch. 22 “Developer
Testing”
[OULD99]: Ould, Martyn; Managing Software Quality and Business Risk
[WIEG03]; Wiegers, Karl; Software Requirements ed. 2; pp. 228-229; Microsoft Press; 2003.
483

484

State driven Testing
Sandeep Bhatia and Vipin Puri
Sandeep Bhatia, Quality Leader, Small Business Division, Intuit Inc.
Sandeep has over 11 years of software development experience in various roles
including development, QA, and management of software development and QA
teams. His domain experience includes health care, semiconductor, finance,
supply chain event management (SCEM) and shrink-wrap software. Sandeep
currently holds the position of Quality Leader for an organization in Small
Business Division at Intuit. He holds a patent in software development (SCEM).
Sandeep has a B.S. in Computer Science from Regional Engineering College,
Kurukshetra, India and an M.S. in Software Engineering from San Jose State
University.
Vipin Puri, Senior Manager, Software Quality Engineering, Intuit Inc.
Vipin is a Senior Manager of Software Quality at Intuit for last 3 years. He has
14 years of software development experience in companies like Sybase, Siebel,
Oracle and Asera (a start-up). Vipin has a B.S. in Mechanical Engineering from
University of Chandigarh, Punjab, India and an M.S. in Computer Science from
Cal State Hayward.
Abstract
It is a widely known fact that cost of a defect increases enormously as it progresses
through the various phases in software lifecycle, so catching defects early is very
important.
State-driven testing is a technique, based on program configurations and their
combinations that we have successfully leveraged to minimize defect leakage and
maximize test case reuse.
This paper will explain the concept and process of state-driven testing; as well as the
benefits, challenges and recommendations of using this technique. Illustrations are
included in the later part of this paper to demonstrate how this can be applied in real life
situations with great benefits.
Copyright © 2007, Sandeep Bhatia and Vipin Puri, Intuit, Inc.
485

Introduction
It is a widely known fact that cost of a defect increases enormously as it progresses
through various phases in software lifecycle. An undetected major defect that escapes
detection and leaks to the next phase of the life cycle may cost two to ten times to detect
and correct. A minor defect may cost two to four times to detect and correct [1]. Catching
defects early, hence, is very important and beneficial.
State driven testing is a technique that we have successfully leveraged to minimize defect
leakage from early stages of software development.
In this paper/presentation we will explain what is state driven testing and how it can be
applied in real life situations with great benefits.
State driven testing is an analytical procedure of developing test combinations to catch
defects very early in the product life cycle (right from the requirements phase). It is a
simple three step process of defining, managing and verifying entities and their states.
Understanding from initial requirements is converted to different "states". These "states"
are used to create pseudo tests for validating different design documents. The test case
combinations generated from these pseudo tests can be reused later as well when the
product is ready.
There are many artifacts e.g. use cases that can be used as the basis of testing. State is
proposed as a great candidate to choose for the following reasons:
• State is direct and can be mathematically manipulated
• State is discreet and helps in making the requirements more explicit
• State combinations lead to test cases that can be reused
The technique can be applied to most of the software product testing where there is a
possibility to extract variables such as environment and UI variations into different states.
Since every software has (and should have) a defined behavior based upon various
environments and configurations, this technique can be applied considering environment
variables as entities and their values as different states.
Some of the benefits of this technique are:
• Finding defects early even before the product is ready
• Increased confidence due to extended coverage
• Early and enhanced understanding of the system
• Reuse of tests
• Reduced test planning and test development effort
The paper defines state driven testing, describes the technique details; and explains the
benefits, challenges and recommendations. There is also an example walk through with
actual demonstration of this technique.
486

Terminology
Entity: A unique program configuration variable that can assume different values forming
different test scenarios when combined with other entities. Two common examples of
entities are screen resolution and operating system type.
State: A unique value for an Entity. E.g. 1024 X 768, 1600 X 1200 for Screen Resolution,
Windows XP, Mac, etc. for OS. (Also referred to as Entity State)
State Combination: A set of values for multiple entities for a test scenario. E.g. 1024 X
768 on Windows XP.
System State: Collection of all entity state combinations for the system. A state
combination is one component of system state.
What is state driven testing?
State driven testing is an analytical procedure of developing test combinations to catch
defects very early in the product life cycle (right from the requirements phase). At a very
high level this is depicted in the diagram below.
Diagram 1: State driven testing process
Requirements
UISD
Design
Use Cases
…
States and
Entities
State
combinations
Final (prioritized
and valid) state
combinations
Validate (on Paper) Verify (on Product)
= Data flow
487

The various artifacts like requirements, UI behavior, and design are analyzed to get
various entities and states. For the purposes of clarification, the relationship between an
entity and its state is analogous to the relationship between a parameter and its value in
programming paradigm.
The states are defined and prioritized. Then state combinations are defined and verified
to be accurate. These state combinations also serve the purpose of test cases during later
phases.
Why State?
There are quite a few different ways to approach the problem of listing the different
scenarios for testing. Two common approaches to managing testing are to list all the
known test cases and to list all the use cases. For details on how to write good use cases
please refer to [6]. Each approach has its own pros and cons. Although these are closer
to user actions, the main issue with these methods is their representation. The way these
test cases & use cases are represented is purely textual, so can be time consuming and
error prone.
State is proposed as a candidate for the following reasons:
1. Clear and crisp definition
As seen from the definitions above, defining states and entities is very clear, explicit
and concise. It is a mathematically oriented process since states can be represented as
set of unique mutually exclusive values in a table format. Hence, state renders itself
to an easy manipulation in terms of combinations of these values. This also makes
managing the combinations easy. This model works for tester community also since
we are used to thinking in terms of scenarios which also aligns with state
combinations. On the contrary, if one were to represent these scenarios in textual
format, this would require multiple statements to represent each scenario.
For example, defining a scenario in table format may look like this:
Resolution OS Window Type
Expected
Behavior
1024 X 768 XP Modal A
1024 X 768 XP Modeless B
… … … …
The same scenarios listed textually will look like this:
On screen resolution = 1024 X 768, OS = XP and Window Type = Modal, the
expected behavior is A.
On screen resolution = 1024 X 768, OS = XP and Window Type = Modeless, the
expected behavior is B.
The values can easily be manipulated in table format in various ways (by sorting,
changing row order, changing column order) whereas working with textual
488

description can be time consuming and error prone since it requires reading the full
text.
2. Makes requirements more explicit
Using state helps in finding missing states, entities and helps find dependencies.
This in turn finds missing or unclear requirements. This is usually performed by
doing inspections and reviews of requirements in the view of entities and states,
as shown in the example below.
A simple example of this would be behavior expectation in requirements of a
software product on screen resolution 800 X 600 but missing behavior on other
resolutions. One can easily conclude the missing states in this case (for the
missing resolutions). On the same line, it can also be concluded how the feature
behaves on an OS (for example, Vista) with UI specific features that may be
affected. This case can further be extended to other operating system types that
may affect such behavior (such as MacOS). What about the behavior on
PDA/Blackberry?
This extending argument demonstrates how this process of thinking in terms of
states helps in finding dependencies, system prerequisites, system supported (and
non-supported) requirements etc.
As seen above, effective usage of entities and states helps in ensuring the
SMARTness criteria of requirements. The acronym SMART stands for Specific,
Measurable, Achievable, Realistic and Traceable.
3. Reuse of tests throughout the different phases
The state combinations that are developed early can be reused as test case
combinations at a later stage also in the development lifecycle – typically during
the testing phase.
The process
To utilize this technique, a three step process of defining, managing and verifying entities
and the different state combinations, is proposed:
1. Define states and entities
During this step, the input artifacts are – requirements, UI designs and any high
level design flows that have been proposed/finalized so far. Capturing the system
behavior on paper in terms of states and entities is the target of this step. The idea
is to define various states a system can be in based on the knowledge and analysis
of requirements, UI or other designs available so far.
489

As mentioned before, at a high level states can be best described as unique
configurations that are applicable to the software in test. For example, a specific
screen resolution of 1024 X 768 is a unique state. For this example, the entity
then would be screen resolution.
The artifacts above are the sources of defining different states. The simplest rule
is to take the specific states mentioned (e.g. 1024 X 768) and then generalize them
to define the entity (screen resolution in this case), and then define more states
(e.g. 800 X 600, 1280 X 1024, etc.) for that entity.
This is true for cases where there is explicit mention; but where there are implied
assumptions, the situation is different. For those cases, use imagination, past
experience, other similar products behavior, workflow. Be creative in hunting for
states and entities as they can be hidden in requirements or overlooked in UI
designs.
An example output of this step would be a listing of states and entities as follows:
Entity State
Screen Resolution e.g. 1024 X 768, 800 X 600.
Operating System e.g. XP, Vista
Window Type e.g. Modal, Modeless
2. Manage state combinations
Make mathematical combinations out of all these states. In order to do this, list
entities and states in a table in a Microsoft Excel Spreadsheet with all the
combinations of values.
Resolution OS Window Type
Expected
Behavior
1024 X 768 XP Modal
1024 X 768 XP Modeless
1024 X 768 Vista Modal
1024 X 768 Vista Modeless
800 X 600 XP Modal
800 X 600 XP Modeless
800 X 600 Vista Modal
800 X 600 Vista Modeless
In order to get a big picture view of all these combinations, use the Microsoft®
Excel® Filter feature for this after states have been identified. See appendix on
how to use this feature.
When there are a large number of states, the total number of combinations can be
huge. To avoid this explosion in number of combinations, techniques such as
grouping based on risk/priority of the feature, elimination based on conditions,
490

boundary value analysis could very effectively be used to define a realistic
number of possible variations.
Another effective technique to deal with large number of combinations is pair-
wise testing. Pair wise testing is based on the theory that 1) each state of each
entity is tested, and 2) each entity in each of its states is tested in a pair with every
other entity in each of its states [5]. Pair wise (or 2-wise) testing focuses on all
pair combinations of all entities rather than testing all the possible combinations.
The caveat with this approach is the defects that occur for specific state
combination for 3 entities. So this concept can further be extended to 3-wise
testing and further on, but then the complexity increases.
Pair wise testing hence can help reduce the number of combinations to be tested.
The above issues of defects with 3 state combinations can be addressed with
reviews, code inspections. For complexity issue, there are tools available to help
with creating combinations. James Bach has a tool called ALLPAIRS that creates
all-pairs combinations. Telcordia also has a similar tool to generate combinations
[5].
For the above table, the process of pair wise testing states that beginning from the
bottom row, eliminate the row if pair combination of 2 entities exist else higher
up in the table.
For example, considering last row #8, the combination 800 X 600 and Vista
exists, Vista and Modeless exists and 800 X 600 and Modeless exists so this row
can be removed.
Further up, for row #7, 800 X 600 and Vista does not exist else where so this row
can not be removed.
After going through the entire table, following is the result:
Resolution OS Window Type
Expected
Behavior
1024 X 768 XP Modal
1024 X 768 Vista Modeless
800 X 600 XP Modeless
800 X 600 Vista Modal
The following table is derived from the above table after the application of
elimination of non-supported combinations. Assuming Modeless Windows on
Vista are not supported, after elimination the above table gets modified as below:
Resolution OS Window Type
Expected
Behavior
1024 X 768 XP Modal
491

800 X 600 XP Modeless
800 X 600 Vista Modal
This step (after optimization, elimination, etc.) should provide a good idea about
the valid test space.
3. Validate/verify state combinations
If the product is not yet ready, for example in early development, these
combinations could be validated against Requirements and UI designs to find
defects as part of review process. Basically, look for the behavior expectations
for each of these combinations from requirements or UI designs and ensure that
the expected behavior is called out.
An example of this would be missing behavior expectation in requirements of a
product on an operating system (such as Vista). Another example that can be
commonly overlooked is different product behavior on Windows when logged in
as a standard user, guest user or admin user.
Also, these test case combinations can actually be executed as the development
progresses in the available parts of the product itself.
For the above example, when the usable part of the product is actually tested, it
may crash on a screen resolution of 800 X 600.
As it can be seen, the process itself is general in nature and the steps above can be applied
at one or more phases e.g. review of artifacts, developing test case combinations or
execution of tests.
Benefits of State Driven Testing
1. Find defects early even before the product is ready
As seen above, with test combinations, defects can already be found on paper, much
before the product is actually ready. This may result in gaps (actually defects) in
requirements or design. More so, due to the extended coverage from the beginning of
the product development phase, the confidence of system quality is increased. The
example above about missing behavior with different type of user logins on Windows
illustrates this.
2. Early and enhanced understanding of the system
This stems from the point above. The fact that team members are involved in
performing this exercise from the beginning phase results in understanding the system
and its various aspects at a deeper level. The exercise of defining state combination
leads to study, analysis and discussions on how the system is supposed to behave in
various circumstances before it is actually created and captured as state combinations.
This in turn provides more opportunity for defects to show up in early stages.
492

3. Decreased test authoring/execution effort and reuse of tests
The effort to create tests in the form of combinations rather than detailed textual
descriptions is less. Also these are written early (before the actual test planning and
development phase), and can be easily re-used and executed through different project
cycles.
Challenges of State Driven Testing
1. Visualization of entities and their states is difficult
This can be a real challenge since traditional approach of software development
focuses on traditional techniques that are textual in nature. So, this comes with
practice – use experience and prior product knowledge to come up with states. For
example for UI facing products - mostly external factors, such as OS, Screen settings
resolution, window states, etc. form the obvious choice for entities.
2. Change, change, and change
As is true with any software, the change keeps coming at various stages –
requirements, design, and implementation or sometimes even during testing phase.
This can easily make the combination matrix invalid and out of sync with the
proposed/actual system behavior. The key is to keep it up to date with the latest
system behavior as the changes occur in any phase. Some state combinations may
need to be eliminated, some to be modified and some to be added as a result of these
changes.
3. The state combinations numbers are huge!
Use techniques to manage humungous combination of states. Use pair wise testing
[3]. Pair wise testing is useful when the number of state combinations grows when
each entity can take up different states. In this case, the number of combinations can
be reduced first based on pair wise testing. The example at the end of paper shows
how to use pair wise testing to reduce the number of combinations.
Focus on the important use cases, and prioritize and order the important ones. Use
tools like Microsoft Excel to be able to get a picture on various combinations quickly.
Conclusions
Below are some of the recommendations based on our learning and experience in using
this technique. These may be adapted/modified based on individual cases.
1. Use “Use case model”
493

Usage of Use case model leads to scenarios. The point in using this technique is to
define these scenarios in terms of combinations of states. When different use cases
are getting defined, it is recommended to capture these in the form of scenarios and
finally turn them into various states and eventually state combinations.
2. Write SMART requirements – explicit and clear that can be translated in terms of
states and entities.
This is perhaps the single most important fact about quality of any software. The
quality of any product is determined by “clarity” over all and from the beginning of
development i.e. requirements. The clearer the requirements are, more the chances of
the final outcome to be of high quality.
It is also further recommended that requirements be written with mindset of entities
and state combination in mind. This helps in bringing clarity and eliminating
ambiguities/gaps in the requirements itself.
3. Define states and entities in a mutually exclusive fashion.
When state combinations are defined, ensure that they are as mutually exclusive as
possible. Using same state for different entities can very easily lead to confusion.
This saves time, can help to manage combinations easily and isolating and tracking
dependencies early in the game.
4. Develop and use a check list of commonly missed/used states
For software with multiple product lines, it is very common that these products share
common states where the products are supported e.g. supported prerequisites, OS.
What we found beneficial is that creating a standard checklist of these states helps in
reviewing and finding gaps quickly in the requirements.
In a nutshell, this technique is best suited for software projects that involve a reasonable
number of manageable combinations of conditions in which software can be used and
there is a likelihood of missing them. For very complex systems that have many entities
with many states, this process can be more effective when used in conjunction with tools
that generate all combinations and help reduce the combinations to be actually tested, so
that all combinations need not be tested to increase confidence in quality.
But in general, the process of thinking in terms of entities and states from the beginning
of the software project itself is generic and can be applied. For example, one may just
choose to validate the state combinations against the artifacts and not the actual product.
This would yield to finding defects in the documents (that form the basis of the actual
product development) which is still beneficial.
On the other hand, one may choose to use this process to generate just the test case
combinations that can be executed on the product to find defects.
494

Example
The example below is for a Windows desktop application and its help system. It is based
upon the excerpts that are listed below. These are taken from requirements and user
interface specification design and adapted slightly to improve clarity and provide context.
Excerpts:
� The proposed solution is to detect the current resolution when application opens, and
to open the Help Viewer in its floating form when the resolution is below 1024x768.
The docked version will not be available in this mode.
� Given that the Help Viewer would never be docked in this resolution, there would be
no distinction between launching Help from a modal vs. modeless window. So, if the
full Viewer was launched from a modal window, we would not close Help
automatically when the modal window is closed. (The Mini-Viewer, however, would
still be closed in that case.)
The single underlined words above like this reflect the short listed candidates of various
possible values (i.e. states) and double underlined words like this reflect the entities. The
steps are listed below on how to achieve a bigger set of states/entities.
a) Identifying states
Identify the possibilities (different values) being mentioned in the statements. The
candidates have been underlined in the above excerpts.
• 1024x768
• floating, docked
• modal, modeless window
b) Identifying entities
Generalize these possible values to form entities (like variables). Sometimes they maybe
stated explicitly but most of the times they are hidden or implied.
• Resolution (can be 1024 X 768 e.g.)
• Mode (can be floating e.g.)
• Window Type (can be modal or modeless)
E.g. a hidden entity in this example would be behavior on an Operating system (e.g.
MacOS) where docking may behave totally differently.
c) Complete entity and state values
Extend the above entities to explore more values for these. List all of them for each
entity.
Resolution Mode Window Type
1024 X 768 Floating modal
800 X 600 Docked modeless
1280 X 1024
495

Table 1: listing of entity values
d) Define combinations and expected behavior
Form mathematical combinations:
Resolution Mode Window Type Expected Behavior
1024 X 768 floating Modal
1024 X 768 floating Modeless
1024 X 768 docked Modal
1024 X 768 docked Modeless
800 X 600 floating Modal
800 X 600 floating Modeless
800 X 600 docked Modal
800 X 600 docked Modeless
1280 X 1024 floating Modal
1280 X 1024 floating Modeless
1280 X 1024 docked Modal
1280 X 1024 docked Modeless
Table 2: listing of combinations (from Table 1)
e) Apply pair wise testing & prioritize the combinations
After applying pair wise testing to the above table, we get the following table
Resolution Mode Window Type Expected Behavior
1024 X 768 floating Modeless
1024 X 768 docked Modal
800 X 600 floating Modeless
800 X 600 docked Modal
1280 X 1024 floating Modeless
1280 X 1024 docked Modal
Further apply the invalid combinations from the product behavior point of view. E.g.
assuming that for this example, docked is only supported on 1280 X 1024 we are left
with:
Resolution Mode Window Type Expected Behavior
1024 X 768 floating Modeless
800 X 600 floating Modeless
1280 X 1024 floating Modeless
1280 X 1024 docked Modal
Table 3: final listing of combinations (from Table 2)
496

f) Verify/execute the tests
If the product is not ready, verify the expected behavior against the requirements and UI
Design and find the defects.
If the product or its parts are ready as they become available, execute these test
combinations and find the defects.
References
[1] Don O’Neil: “Return on Investment Using Software Inspections”,
http://members.aol.com/ONeillDon/roi-essay.html
In this article, the author comes up with a way to calculate ROI using formal reviews
based on the defect leakage model.
[2] Wikipedia: “Model based testing”, http://en.wikipedia.org/wiki/Model-based_testing
This article provides general description about model based testing.
[3] “Pair wise testing”, http://www.pairwise.org
This website contains collection of links (papers, articles, other resources) related to this
subject.
[4] Michael Bolton: “Pair wise testing”,
http://www.developsense.com/testing/PairwiseTesting.html
The detailed step by step process of application of pair wise testing with examples is
explained on this website.
[5] Jim Heumann: “Writing good use cases”,
http://www3.software.ibm.com/ibmdl/pub/software/rational/web/pres/ucase.html
This video by a Requirements Evangelist talks on how to come up with good use cases.
Appendix – How to use Microsoft® Excel® Filter Feature?
This section explains how this feature can be used in Microsoft ® Excel®.
Consider table 3 above as an example. Paste the entire table in Excel worksheet. Ensure
that focus is on first (header) row, and click on Data -> Filter-> AutoFilter.
The top row values appear with combo boxes as below.
497

If you expand these combo boxes, each of them lists the possible values for that column.
Use the combo boxes now to vary the combination and get a handle on the big picture of
various state combinations.
An example of changing the resolution combo box selection to 1024 X 768 yields the
following:
In this way, each variable can be changed to get a picture of the various combinations
quickly.
498

Approaching Write Once Run Anywhere:
Maximizing Code Reuse for Cross-platform Development
Raleigh Ledet and Ken Loftus
Copyright 2007, Wacom Technology Corporation. All rights reserved.
Abstract:
At Wacom, our GUI (graphical user interface) application was at one time running on four vastly
different GUI systems. The financial and time savings of being able to only write the application
code once was enough for us to explore cross-platform technology and integrate it into our
development process. What we learned is that "Write once. Run anywhere," is like the concept of
zero defect software; it is a commendable goal, but impossible to achieve. Even if you relax the
phrase to "Write once. Compile anywhere," you still end up with an impossible goal for a GUI
application. A common criticism of Java is "Write once. Debug everywhere," and "Write once.
Tweak everywhere."
It is true that there are multiple cross-platform frameworks and virtual machine technologies out
there. An application can run on multiple platforms with these solutions, but inevitably,
something does not work or look quite right. For example, widgets may obviously look different,
keyboard shortcut conventions may be different, text fields may work slightly differently, menu
bars are in different locations, etc. These cross-platform frameworks have various solutions for
these problems. However, the result is an application that works, but does not feel like a native
application on any platform.
This paper describes how a cross-platform framework failed to achieve Wacom's goals and the
custom solution that has improved cross-platform code sharing from 23% to 75%.
Bios:
Raleigh Ledet is an OS X Software Engineer for Wacom Technology Corporation. He has
written software in the graphics tablet industry for over 6 years, 1 year in chiropractic office
management, and 2 years in the oil industry. He also publishes OS X shareware under the Mage
Software moniker. Raleigh holds a Bachelor degree in computer science from the University of
Southwestern Louisiana, and he is currently working on his Master in Software Engineering
from Portland State University.
Ken Loftus is a Windows Software Engineer for Wacom Technology Corporation. He has over
13 years of experience in the computer industry from customer Technical Support (1 year),
Software Quality Assurance (3 years) and Software Engineering (9+ years). Ken holds an
Associate degree in Electrical Engineering and a Bachelor degree in Automated Manufacturing.
Wacom Technology Corporation is headquartered in Vancouver, WA and is a wholly owned
subsidiary of Wacom Company, Ltd. of Tokyo, Japan. In 1989, Wacom revolutionized the nature
of digital creativity when it introduced the world's first cordless, battery-free, pressure-sensitive
pen. Wacom pen tablets are now owned by millions of photographers, designers, artists, and
other professionals worldwide. http://www.wacom.com
499

Overview
Overview . Timeline
Wacom creates and sells input devices for computers. Primarily, these devices are graphics
tablets. Initially, contractors wrote the first drivers for the tablets. These drivers were for DOS,
ADI, RIO, and Apple
’s Macintosh
MacOS
. Drivers followed this for MS Windows
3.1 and
eventually for NT3.5, SGI
Irix
and Sun
Solaris
. Even though the data from the tablet and
the general math used to place the cursor is the same for all platforms, the drivers did not share
any code. This continued for a ten-year period. Eventually Wacom brought most of the driver
work in-house, but the cost to maintain independent drivers kept increasing.
Wacom decided to redesign the software. The new model would be object oriented and share as
much code as possible under all platforms. The software that controls the hardware Wacom
produces is divided into two logical components, driver and control panel. The driver interfaces
with the actual hardware and the operating system to move the cursor. The control panel
provides a graphical interface that allows the user to modify the behavior of the driver.
After about two years of design and consideration, work started on common-code based
software. During this time, we aimed most of the design effort towards the low-level hardware
driver and not the higher-level control panel. This worked out really well for the driver as we still
use the original design and it is currently about 75% shared code.
The control panel did not fare as well. We knew we wanted the same GUI (graphical user
interface) for all platforms, so we searched for a cross-platform GUI framework. Unfortunately,
none of the existing frameworks had support for Windows, X-Window and Macintosh. We
eventually found an incomplete framework called Zinc
, by Zinc Software Incorporated
, that
already had Windows and X-Window support with promised Macintosh support before our ship
date.
As the ship date for the new driver approached, it became obvious that Zinc for the Macintosh
was not going to be acceptable. The widgets did not match the native widget look and feel of the
Macintosh OS. One particularly egregious example is that the slider widget looked like scroll
bars. We abandoned Zinc for Macintosh and quickly hired some contractors for the Macintosh
GUI who finished the control panel with a native Macintosh framework, PowerPlant by
Metrowerks. Zinc and PowerPlant are vastly different frameworks and the two control panel
projects ended up with less than 25% common-code.
Eventually, a simplified control panel was required for some markets. This market did not need
all of the complex features of the existing control panel. The existing complex control panel was
dubbed the professional control panel, and the simplified control panel was dubbed the consumer
control panel. Not wanting to repeat the mistakes of the complex control panel development
effort, Wacom re-evaluated its cross-platform options. Again, no suitable framework was found
that worked on all three platforms to our satisfaction. Given the very small nature of this new
control panel, and the success with code sharing at the non GUI driver level, Wacom decided to
write their own GUI cross-platform toolkit. The Wacom cross-platform toolkit would have a
GUI abstraction layer that would exist beneath whatever framework we wanted to use for the
500

host OS. This allows for maximum code reuse while maintaining platform native look and feel.
The platform-independent professional control panels were difficult and costly to maintain. We
identified that this new consumer project could be used to create a common-code base for both
control panel levels. The new consumer control panel was designed such that it could scale from
the small requirements of the consumer project to eventually replace the code for the platform-
independent professional control panels. A year later the new consumer control panel project was
complete and shipped with upwards of 70% common-code.
Late in 2001, Apple shipped OS X 10.1 and Wacom shipped its first OS X compatible drivers.
These drivers included direct ports of the Macintosh independent professional control panel and
the consumer control panel. The ports ran as applications, but did not quite fit in correctly in
their new environment. OS X had a new control panel plugin architecture called System
Preferences, and stand-alone control panel styled applications seemed out of place.
Unfortunately, the System Preferences plugin architecture required use of the Objective C
language and Cocoa GUI framework instead of the currently used C++ and PowerPlant GUI
framework.
Marketing decided that Wacom would add some features to the consumer control panel and ship
it worldwide instead of in just some localized markets. During this project, two OS X engineers
replaced all the PowerPlant specific code with Cocoa/Objective C++ code while the Windows
engineers added the new features to the common-code. This allowed the control panel to run as a
System Preferences plugin on OS X, as users were demanding. The power of the GUI abstraction
layer is what allowed us to integrate with a new framework environment while maintaining a
tight schedule and adding new features.
With the success of the consumer project we were finally able to start scaling the Wacom
common toolkit to create a replacement professional control panel for upcoming new hardware.
Less than a year later, Wacom shipped the professional control panel using the toolkit, which
contains upwards of 75% common-code between platforms. In the end, we refactored a few of
the original toolkit design elements, but overall, the original design scaled well.
Overview . Technical Design
The control panel is a GUI client application that gets and sets data from another non-GUI server
application. The new control panel will be built on top of our own custom cross-platform toolkit.
Our design goals for the toolkit are:
1. Have as much cross-platform (common) code as possible.
2. Leverage platform-native frameworks for the heavy GUI lifting (layout, drawing and
tracking).
3. Exist as a native control panel on each platform.
4. Separate the data from the GUI and logic.
5. Be extensible for new features and new hardware devices.
The major design hurdle is how to link two vastly different GUI frameworks and paradigms to a
common, cross-platform set of data and logic. The breakthrough is realizing that when layout,
501

drawing, and tracking are taken away, most GUI widgets have a small set of identical behaviors
and properties, such as displaying a value, changing a value, hiding, showing, etc. Furthermore,
windows and dialogs are just a collection of widgets. At this level, all widgets and collections of
widgets work the same across all platforms. Therefore, we can create in common-code a virtual
representation of the GUI called the View Hierarchy (see Figure 1). The toolkit, then, needs to
provide a base widget (View) and a base widget collection (Super View).
QuickTime™ and a
None decompressor
are needed to see this picture.
Event Translator
PFM
QuickTime™ and a
None decompressor
are needed to see this picture.
View Hierarchy
Command Event StreamView Event Stream
p
Window
Label
Super V iew
(Window)
V iew
(Checkbox)
V iew
(S lider)
Figure 1: V Irtual V iew Hierarchy
Common code
Framework specific code
Event Translator
PFM
Framework
View Hierarchy
Driver Interface
Driver
Data ModelBehavior
Figure 2: Design Overview
Common code
Framework specific code
Server process
We decided we would lay out the GUI on each framework with a virtual twin layout in common-
code. The largest remaining design hurdle then, is getting the platform framework layout and the
common-code View Hierarchy to communicate. Two simple event streams and an event
translator accomplish this.
The framework creates view events and sends them through the View Event stream where they
flow through the Event Translator into the View Hierarchy. The View Hierarchy creates
command events and sends them through the Event Translator into the framework.
The Event Translator is a common-code base class that defines an interface with the View
Hierarchy, but platform specific code subclasses it to interface with the framework. Exactly how
the Event Translator communicates with the framework, and visa versa, is completely framework
specific. We think of this framework specific support code as a nebulous cloud, referring to it
affectionately as the PFM cloud (Pure Fun and Magic).
The View Hierarchy itself does not contain any data. It acquires the values to display from the
underlying Data Model. Think of the View Hierarchy as a window into a portion of the Data
Model. The View Hierarchy does not display the entire Data Model at one time, and a widget
may get its data from different locations in the Data Model over time. The toolkit provides the
base classes needed to create collections of data items that provide a standard interface for the
toolkit widget classes.
On Windows, control panels often require the user to click an “Apply” button for their changes
to take effect. On Macintosh, however, as soon as a user modifies a setting, the new setting takes
502

effect immediately. This is referred to as “Live” behavior. While the Data Model communicates
directly to the Driver Interface, it relies on a Behavior delegate to guide this communication
based on internal state changes.
The final puzzle piece is application logic and control. By its very nature, the View Hierarchy
already has a well-defined event routing and processing mechanism to respond to framework
requests. By overriding the event handling routines with concrete Item Views and Super View
classes, custom application logic is accomplished.
Overview . Results
The Wacom common-code GUI toolkit has held up very well and is still in use today. At various
points in time, it was running on X-Window, Microsoft Windows, MacOS and OS X. We have
also layered three different GUI frameworks on top: Zinc, Power Plant and Cocoa. Currently the
code base supports OS X and Microsoft Windows and we are now considering changing the
framework used on Windows to .Net. This would not have been possible if we relied on another
cross-platform framework.
There are only eight primary, highly re-used base classes. With minor changes to base classes of
the Data Model, the toolkit can be used to create other applications as well. While not every type
of application would work well with this toolkit, many would. For example, a front end
application to a database would work well with this toolkit.
Engineering now adds new features with considerably less effort, better estimation, and better
quality. This is due to a good design that is forward-looking with a large amount of shared code.
For example, engineers from both platforms often have similar effort estimations for common-
code sections. It also allows for better resource balancing. Typically, we distribute the common-
code among all the engineers on the project. If one platform is making further progress than the
other is, those engineers can implement common-code pieces assigned to the lagging platform.
The current common-code runs on two platforms, and thus, at least two engineers test it before it
reaches Quality Assurance (QA). We have found that once one platform’s engineer writes the
common-code, when it is hooked up to another platform’s GUI code, defects are easy to spot,
track down and fix before doing release builds.
QA performs a complete suite of black box tests on all platforms. Where defects occur provides
hints on where to look in code. If the defect only occurs on one platform, then that platform’s
engineer looks at their platform specific code for the defect. Generally, this is a platform specific
wiring error, widget size error, widget label error, or a logic error in platform specific non-toolkit
code. If the defect occurs on both platforms, then any engineer looks at the common-code for the
defect. Although, when QA does find a cross-platform defect, the first thing we do is refer to the
requirements document as it generally is a misunderstood or missing requirement. Once the
cross-platform defect is fixed on one platform, the other platforms automatically pick up the fix
on their next build.
The MacOS professional control panel re-write is another toolkit success. When the professional
control panel was re-written using the common-code toolkit, we concentrated on OS X and
503
Microsoft Windows. One marketing region also wanted MacOS support. We knew this would be
the last hardware product supported on the MacOS, so we estimated how long it would take to
both modify the original independent code base and build up a new GUI using the toolkit and
recently completed professional common-code. The estimations were twelve man months to
modify the independent code versus six man months to re-write using the common-code base. It
took two Macintosh engineers three calendar months to perform the re-write and resulted in a
better quality product than modifying the independent code would have been. One of the lessons
we learned early on during development of this re-write project, was that any defect found was
probably due to platform specific code, not the common-code which was already proven on two
other platforms. In fact, we found only two minor common-code defects that the other platforms
did not expose.
This is not to say that there are not any drawbacks with the Wacom toolkit. There is so much re-
use that subclassing is very easy and straightforward. Unfortunately, this kind of reuse can make
debugging difficult. This is particularly true when tracing events as they flow through the View
Hierarchy. Most of the event routing logic is in the base class; thus, setting a breakpoint in the
base class results in many unintended debugger breaks.
It also takes longer for new engineers to come up to speed on the Wacom toolkit design.
Obviously, we cannot hire someone that has experience with an in-house toolkit. Wacom
somewhat offsets this because any available toolkit-seasoned engineer can mentor the new
engineer even if they are on different platforms.
Technical Details
Technical Details . Data Model
The Data Model represents the settings in the running driver process. It is a generic version of
the properties of the actual object instances in the driver process. In another application, the Data
Model may represent a database, or be the actual data for a document-based application. The
Data Model consists of two main base classes, Data Grouping and Data Item.
The Data Item class is the simplest and is rarely subclassed. For Wacom, it is an abstract
representation of a driver data object property. A Data Item needs to represent the current value
of the property in the driver, the user’s desired value, and the value to revert to if the user
cancels. Each Data Item uses a key to communicate the value of this property in the control panel
process with the running driver process. The key is a private data structure that is used by the
driver to route the request internally – much as a mailing address is used to deliver snail mail.
Using this toolkit in another application to retrieve data from a database, the Data Item key could
be an SQL statement.
Each Data Item connects to the Driver Interface to communicate with the running driver process.
This communication process is unique to each platform. The Driver Interface is a platform-
specific class with a cross-platform base class as an interface from common-code. For a database
application, this could be the interface to the database server. A Document-based application
may not even need this interface.
504

Each Data Item also uses a delegate object called a Behavior. The Data Item informs its
Behavior delegate when its internal state changes or specific events occur on it. The Behavior
delegate then further drives the Data Item on how to communicate with the driver.
Sometimes, the Behavior delegate is the same for both platforms. Generally, though, the Data
Item uses the default behavior of the native platform. This is accomplished via one of the very
few platform #ifdef compiler directives.
Live Apply
GetValue Read From Driver Read From Driver
ChangeValue Write To Driver Do Nothing
Apply Do Nothing Write to Driver
Revert Write To Driver Do Nothing
Reset* Write To Driver Do Nothing
* The Data Item must request the default value from the driver. It does this without
requiring the Behavior to tell it to do so. However, the Behavior does determine if
the Data Item should write its new value back to the driver as the current value, or
wait for an Apply.
Table 1: Behavior Styles
Data Groupings are a collection of Data Items and a collection of child Data Groupings called
Subordinates. The Data Items of a grouping are name indexed, and the Subordinate Data
Groupings are array indexed. For example, a “button” Data Grouping has named properties such
as “function“ and “style”. A “device” Data Grouping has named properties such as “type”,
“name”, and “serial number”. The “device” also contains one to four “button” Data Groupings
and one or more “wheel” Data Groupings. Therefore, you can ask for a “device” Data
Grouping’s Data Item named “type”, or for its second Data Grouping from the “button”
subordinate collection.
Data Grouping is a virtual class. Only concrete derived subclasses know what Data Items and
Subordinate Data Groupings belong to it, and how to instantiate them. A caching mechanism in
the Data Grouping base class handles item and subordinate storage, lookup and deallocation. The
base class searches its cache first for requested Data Items or Subordinates. If it fails to find the
item in the cache, the Data Grouping base class asks the concrete subclass to instantiate the
object. In this manner, we save memory, startup time, and most importantly, the deriving of a
concrete class is simple because it only deals with its Data Item and Subordinate creation.
Technical Details . View Hierarchy
The View Hierarchy is similar to the Data Model in that there are views and collections of views.
All views share some common properties (ID, visibility state, etc.) and interface functions
(EventHandler(), Link()). The virtual Wacom View base class, from which all views must
inherit, describes this interface.
The two main view classes are Super View and Item View, and both derive directly from
Wacom View. Super Views are collections of views but have no data to display. They link to a
Data Collection. Each Item View links to an individual Data Item for the value to display and
modify.
505

Item Views are very generic and can represent most widgets. Some widgets, such as meters or
images, only show dynamically changing content, and the frameworks do not let the user modify
them. Since the framework will never send a “change the value” event down to common-code
for these widgets, the fully featured Item View can safely be used without creating a special
read-only Item View. Similarly, some widgets, like labels and static text, are static. Their content
never changes and the user cannot manipulate them. These widgets have no counterpart in
common-code and only exist in the framework GUI layout. Derived Item View classes are
seldom created.
Unlike Item Views, Super Views are useless on their own. Concrete Super View subclasses
generally consist of only an initialization routine that instantiates the Item Views and Super
Views that it contains. They sometimes also override the default event handling routine to
provide some custom control logic. The Super View base class itself handles linking its child
views to the Data Model and routing View Events to its children views.
Objects that instantiate a Super View supply the Super View with information on which
Subordinate Data Grouping its children need. Likewise, objects that instantiate Item Views
supply the Item View with information on how to find the correct Data Item from a supplied
Data Grouping. During run time, when showing a window, or when the user selects a different
tab, the appropriate Super View links its children to a specific Subordinate Data Grouping. This
linking process works its way through the Super Views and their children views eventually
connecting each active Item View directly to a specific Data Item instance of the underlying
Data Model.
Item Views automatically hide and show themselves when linked to a Data Item. If linking fails
or the Driver Interface returns an error because the Data Item’s key is un-routable, the Item View
automatically hides itself. For example, some devices have four buttons, but others only have
one or two buttons. The Data Model may represent all devices as having four buttons. When the
“Buttons” tab is linked to a device with only two buttons, the Item Views linked to the function
of the non-existent buttons three and four catch the error and send Hide command events to their
corresponding framework GUI widgets. The framework hides the dropdown menus for those
button functions from the user. This allows the use of the same set of widgets for multiple
devices, dynamically showing only the valid widgets for the selected device. Since the logic is in
the Item View base class, no additional logic is required in a Super View subclass for these
dynamic adjustments. New views simply get this behavior free.
As the code base evolved, we also created a few more reusable high-level Super View
derivatives. The Tab View inherits from Super View and has an extra mechanism to determine if
the tab is relevant, then automatically hides or shows itself from the tab list. The List View
inherits from Super View and manages lists and list selection. The Dialog Super View also
inherits from Super View and knows how to put itself at the top of the event chain, and how to
remove itself from the event chain when dismissed.
506

Two event streams are the mechanisms of communication between the framework and the
toolkit’s View Hierarchy: the Command Event Stream and the View Event Stream. Since there is
a one-to-one correlation between the framework widgets and the common-code views, we give
each view and paired widget a unique ID to link them. Some framework widgets, such as static
text, have no common-code view pair. These widgets share the reserved ID 0. There may also be
views in common-code with no paired framework widget. These Views also have their own
unique ID. The framework PFM cloud code explicitly ignores events that have these IDs and
asserts for any ID it does not know about.
Very early on, we realized that only one of the event streams need to carry arbitrary data. One
stream could simply command the other side to issue a data-carrying event. The toolkit View
Hierarchy should control the application; thus, common-code events to the framework are
strictly commands. Command events are fixed size events containing a View ID and a command.
Each platform specific PFM cloud determines the exact details of event routing and widget
modification.
The other event stream, View Events, is more than just a means for the framework to get and
pass data to common-code. Views can also use View Events to talk to each other when they do
not have a direct pointer to the view in question. A View Event contains the ID of the target
view, the event command, and a pointer to a memory buffer for data passing.
Command Events
Update
Refresh the displayed value. Widgets typically do this by sending down a
Get View Event to acquire the value it should display. For windows,
dialogs, and tabs, this command tells them to show themselves and / or
become active.
Show Make the widget both visible and enabled.
Hide Hide the widget from the GUI, making it inaccessible to the user.
Disable
Make the widget visible, but non-modifiable by the user. (There is no
"Enable" command. Show implies enabled, and Disabled implies visible. Therefore,
there is no need for an “Enable” command.)
Table 2: Command Events
View Events
Get Get the current value.
Set Set the current value.
Revert
Set the current value to the saved revert value. Or, close the dialog without
saving changes.
SetRevert Save the current value in case revert is called.
Reset Set the current value to the default value.
Update Check the driver to see if its data is different than the current value.
Apply
Send the current value to the driver. Or, close the dialog and save the user
changes.
GetChildCount
Return how many sub-items this hierarchical list item has (see special
controls).
Technical Details . Event handling
507

While processing Command Events occur in whatever manner is appropriate for the platform,
there is a specific mechanism for the routing of View Events. The top level Super View passes
the event to the Super View that corresponds to the foremost window or dialog. This Super View
then allows each of its child Views a chance to respond to the event. If the child is a Super View,
it recursively passes the event to its children and so forth. When an Item View receives an event,
if the event contains the View’s ID, the View processes the event and replies that this event is
done processing. The Super View stops sending the event to its remaining children when one
responds “done processing” and returns the “done processing” message up to its caller.
There is one special and very important View ID called EViewIDAll. All Item Views process
events targeted to this ID, but do not reply that the event is “done processing”. For example,
often we pair this view ID with an Update event. If an Item View receives an Update event, it
makes sure its linked Data Item’s data has not changed. If the data has changed, the Item View
sends an Update Command Event with its ID to the framework. Since Item Views do not
respond with “done processing” for EViewIDAll events, each Super View will recursively send
the Update event to all of its children. This is useful at key times, such as tab switch, to make
sure the entire framework GUI is showing the correct values, or to “Reset” all the items on a
Super View to their default values.
This event routing mechanism can potentially be very inefficient. We counter this by having key
Super View subclasses override the above process and only send the event to its child views that
are potentially visible. For example, the Tab Super View manages multiple Super Views that
correspond to individual tabs in the framework GUI. This Super View only routes events to its
child Super View that corresponds to the active tab.
Technical Details . Special Controls
Button widgets do not have a value. When clicked, a button should send a “Set” View Event
with its ID. However, its common-code counterpart ignores the value the button places in the
event. For this reason NULL is often used as the memory buffer pointer for button “Set” events.
Since buttons typically perform some action, Super Views often override the base class event
handler to catch events targeting their button children, and they perform the action themselves.
This prevents the need to create a custom Item View that has no associated Data Item.
When we started to add major new features to the initial control panel, we ran into the need to
display lists. The problem is that the list control has the ID; how do you get value data for the
items in the list when they do not have an ID? Furthermore, with a dynamic number of items in
the list, trying to reserve and generate unique IDs for each item is unfeasible. After looking at the
GetChild
Return an identifier for the Nth child of a hierarchical list item (see special
controls).
Move
Move an item in a hierarchical list to another position in the list (see special
controls).
Create Create a new hierarchical list item (see special controls).
Destroy Destroy a particular hierarchical list item (see special controls).
Table 3: View Events
508

way each platform framework’s various list controls work, we decided to treat the list widget as
one Item View and funnel the data for each list item through this Item View.
We also need hierarchical lists as well as flat lists (i.e. trees and tables). We realized that a
hierarchical list encompasses all our needs for both. If a list is flat, then each of its items has no
children. We expanded the View Event with a few new child event commands. The memory
buffer for the “Get” and “Set” events to a list Item View must contain a specific structure that
describes which child item and which data piece from that item the event targets. When the
toolkit table view commands its paired GUI framework table widget to update, the PFM cloud
does the following:
1. Throw away all of the table’s current data.
2. Ask common-code for the number of children the table has with a GetChildCount event
with a reference child of 0.
3. For each child, get the child’s ID with a GetChildID event.
4. For each table column, perform a “Get” event providing the child ID, the sub data to get,
and a pointer to a memory buffer to return the value.
Hierarchical tree widgets have the extra step of asking each child how many children it has.
Originally, popup menu items were a static list of choices. Setting the menu items in the
framework resource editor easily accomplishes this. Soon we needed to dynamically add and
remove menu item entries. At first we did this by overlaying two popup menus on top of each
other in the framework and having common-code hide and show them so the correct static list of
menu items was visible to the user. After we added lists, we discovered that the same concept
applies for popup menus. Some of our popup menus are now using the list child events to get the
count of menu items and the name of each menu item, removing the need for special logic to
hide and show static popup menu lists. However, we only do this when the popup menu list
dynamically changes.
Technical Details . How it works: Putting it all together
So how do you create an application with the framework listed above? You follow these simple
steps:
1. Code the Data Model (which includes any interfaces to databases, servers, etc…)
2. Code the View Hierarchy.
3. Create one common-code master class that knows how to create the data model, root
Super View of the View Hierarchy, and link them together.
4. Layout the GUI for each platform using the native tools.
5. Create one additional platform specific file that allocates and initializes the platform
specific Event Translator, the master common-code file, and the PFM cloud.
Closing
Designing and using this common toolkit has been very beneficial to Wacom. We have improved
the product, reduced engineering effort for new features, and exceeded all our design goals.
Along the way, we have discovered some important things.
Design is key, but so are your design goals. We could have created a very good design for a
particular set of requirements for the new consumer control panel, but it probably would not have
509

scaled well for the professional control panel. Having and working towards longer term goals
can have large rewards. Nearly five years later, we continue to reap the benefits of the extra time
and effort spent on our long-term goals of cross-platform support and scalability.
Splitting the data from the logic of the application was more beneficial then we expected. This is
important for clean object oriented separation of class functionality, but it has allowed us to also
share the data model code between the consumer and professional control panels. While we
share the View Hierarchy base classes, the Super View subclasses are what differentiate the
consumer control panel from the professional one.
Platform experts are required. Common-code design needs a representative from each platform.
Each platform has some unique characteristics that only platform experts know about and
understand. They can point out potential pitfalls in the design phase before you code yourself
into a corner. Platform experts are passionate about their platform and can double as a user
proxy. We have prevented a great deal of re-work and future platform specific bugs by changing
initial designs early to work with all platforms. For example, dialogs are not modal on OS X like
other platforms. Thus, the toolkit and all the common-code do not assume the GUI framework is
in a specific code path waiting for the result of a dialog.
Abstracting the GUI in common-code in such a way that we could use any platform specific GUI
with only a small shim was the correct choice for Wacom. Windows, dialogs and widgets look
and work as the user expects because we use native GUI frameworks. Without the OS X native
framework, Cocoa, we would still be struggling with the OS X user experience as it would be
impossible for the control panel to be a System Preferences plugin. In addition, as Apple and
Microsoft evolve how localization works, we can rely on the platform GUI framework to “do the
right thing” for us.
510

Functional Tests as Effective Requirements Specifications
Jennitta Andrea, The Andrea Group
The Test-Driven Development cycle moves functional test specification to the
earliest part of the software development life cycle. Functional tests no longer merely
assess quality; their purpose now is to drive quality. For some agile process, like
eXtreme Programming, functional tests are the primary requirement specification
artifact. When functional tests serve as both the system specification and the
automated regression test safety net they must be:
• Viable for the lifetime of the production code.
• Easier to write than production code. If writing functional tests are a
bottleneck to writing production code, they will be considered optional and
quickly become incomplete and obsolete.
• More correct than production code. Bugs in functional tests will create and/or
mask bugs in production code. Functional tests drive what is developed, and
are used to detect bugs introduced over time as the production code changes.
• More readable than production code. Non-technical subject matter experts
(SME) are relied upon to validate the correctness and completeness of the
functional tests.
• More easily and safely maintained than production code. Functional tests
don't have the same type of regression safety net as production code.
• More locatable than production code. All of the relevant functional tests must
be found and updated before the production code can be updated.
This talk covers these concepts as an 'old-style' imperative test script is refactored,
step-by-step into an effective requirements specification. Emphasis is placed on
developing a domain specific testing language, and other best practices for making
your tests a valuable project asset. Advice is given for how to clean up an existing
functional test suite.
Jennitta Andrea has expanded the vocabulary and imagery associated with agile methods
to include Cinderella, step sisters, dental floss, sushi, fingerprints, and self-cleaning ovens.
When she joined her first XP project in 2000, Jennitta wondered: "Will we stop using UML
and use cases completely?"; "Will the analyst and tester roles become extinct?"; "Where do
user stories come from"; and "What does an effective functional test really look like?"
As a multi-faceted hands-on practitioner on over a dozen different agile projects since then,
Jennitta has been a keen observer of teams and processes, and has discovered answers to
these types of questions. She has written many experience-based papers for conferences
and software journals, and delivers practical simulation-based tutorials and in-house
training covering: agile requirements, process adaptation, automated functional testing,
and project retrospectives.
Jennitta is especially interested in improving the state of the art of automated functional
testing as it applies to agile requirements; she applies insights from her early experience
with compiler technology and domain specific language design. Jennitta is serving her
second term on the Agile Alliance Board of Directors, is a member of the Advisory Board of
IEEE Software, and has assisted on several conference committees. She has a B. Sc.,
Computing Science (Distinction) from the University of Calgary.
511

������������� ����� � ������
Functional Tests As EffectiveRequirement Specifications
Jennitta Andrea
�������������� ����� � ������
Agenda• Beyond red-green-refactor• Functional tests as effective specifications
�������������� ����� � ������
AgileRequirements
Process
AgilePrinciples
FTDD
ContextDriven
Adaptation
Retrospectives
Iterations
Practices
Stories
Where doStories
Come from?
FunctionalTests
EffectiveSpecification
DomainLanguage
Tools
ReduceWaste
ReduceRisk
Feedback Just Enough
Just In Time
�������������� ����� � ������
Acceptance Testing Family Members
• functionality
• usability• security• performance• integration• etc
�������������� ����� � ������
Functional Acceptance Testing• Focus on system behavior• Describe business process (work
flow) and business rules• Examples of the requirements for
a feature
�������������� ����� � ������
TDD Red-Green-Refactor
refactor
businesslogictest api
green
test api businesslogic
red
test api
512

�������������� ����� � ������
FTDD – Red Green Refactoruser stories functional tests unit tests (API) unit tests (detail)
�������������� ����� � ������
Minor Enhancements& Bug Fixes
R 1.1 R 1.2 R 2.1 R 2.2
OperationsPhase
Application Lifecycle
Project team
Operations team
Time
R 1
GreenfieldDevelopment
GreenfieldPhase
MajorEnhancement
R 2
Freezemerge
EnhancementPhase
Legacy Upgrade
R 3
Freeze
merge
LegacyPhase
multiple years, multiple projects, and multiple teams
�������������� ����� � ������
Focus of Each Lifecycle Phase
run the same test against multiple differentimplementations of an application to proveequivalence
Legacy
Enhancement
- quickly locate and understand tests written bysomeone else
- support merge tests together
Operations
write and run functional tests in a FTTD fashionGreenfield
�������������� ����� � ������
Functional Tests Must Be:•••• Easier to write than production code.
•••• More correct than production code.
•••• More readable than production code.
•••• More easily and safely maintained thanproduction code.
•••• More locatable than production code.
������������� ����� � ������
testing- validation- coverage- bestpractices
Tester
development- tool-smithing-Frameworks-automate test
ToolsmithDeveloper
analysis- elicitation/facilitation- domain expertise- domain specific language
SME
Analyst
Roles & Skills
AutomatedFTDD
�������������� ����� � ������
AgileRequirements
Process
AgilePrinciples
FTDD
ContextDriven
Adaptation
Retrospectives
Iterations
Practices
Stories
Where doStories
Come from?
FunctionalTests
EffectiveSpecification
DomainLanguage
Tools
ReduceWaste
ReduceRisk
Feedback Just Enough
Just In Time
513

�������������� ����� � ������
SpecifyingFunctional Tests
�������������� ����� � ������
Video Store Admin Domain Model
MovieTitle
Category(e.g. Sci Fi)
RentalType(e.g. one day)
Business rule:no duplicate
titles
Specification
�������������� ����� � ������
Example Storyboard Spec (Lo Fi)Specification->Example
Feature: Add Movie TitlePurpose: Test the business rule that there can be no duplicate titles in the inventory
Inventory of Movie Titles
Star TrekToy Story
Add New Movie Title
Star Wars
Add new title
Inventory of Movie Titles
Star TrekStar WarsToy Story
Save
Add New Movie Title
Star Wars
Add new title
Add New Movie TitleError: The movie Star Wars already exists
Star WarsSave
�������������� ����� � ������
Example Storyboard Spec (Hi Fi)Specification->Example
Feature: Add Movie TitlePurpose: Test the business rule that there can be no duplicate titles in the inventory
�������������� ����� � ������
Example Textual Spec (1 of 2)Feature: Add Movie TitlePurpose: Test the business rule that there can be no duplicate titles in the
inventory
1. Start at the Maintain Titles page2. Page title should be: Video Store Admin – Maintain Movie Titles3. Click the Add New Title button4. Page title should be: Video Store Admin – Add New Title5. Enter text Star Wars into the field labelled Title6. Select Science Fiction from Category selection list7. Select DVD from Media Type selection list8. Click the Save button
Specification->Example
�������������� ����� � ������
Example Textual Spec (2 of 2)
12. Click the Add New Title button13. Page title should be: Video Store Admin – Add New Title14. Enter text Star Wars into the field labelled Title15. Select Science Fiction from Category selection list16. Select DVD from Media Type selection list17. Click the Save button18. Page title should be Video Store Admin – Add New Title19. Message should be Error: The movie title Star Wars already exists.
9. Page title should be Video Store Admin – Maintain Movie Titles10. Message should be New title successfully added11. Titles should be listed as:
000VideoChildrenToy Story
000DVDSci FiStar Wars
011DVDSci FiStar Trek
# Rented# In Store# CopiesMedia TypeCategoryTitle
Specification->Example
514

�������������� ����� � ������
Example Tabular SpecFeatureName Add Movie Title
Purpose
PreConditionsMovie Title
Title Category Media TypeStar Trek Science Fiction DVD
Toy Story Children Video
ProcessingAdd Movie Title
Title Category Media TypeStar Wars Science Fiction DVD
ExpectedResults
Title Category Media Type # Copies # In Store # Rented
Star Trek Science Fiction DVD 1 1 0
created Star Wars Science Fiction DVD 0 0 0
Toy Story Children Video 0 0 0
ProcessingAdd Movie Title
Title Category Media TypeStar Wars Science Fiction DVD
ExpectedResults
MessageError: The movie title Star Wars already exists
Test the business rule that there can be no duplicate titles in the inventory
Movie Title Inventory
Add Movie Title
Specification->Example
��������������� ����� � ������
Example Graphical SpecSpecification->Example
Feature: Add Movie TitlePurpose: Test the business rule that there can be no duplicate titles in the inventory
Movie title:Star trek
Movie title:Toy Story
Movie:Rented: No
0. preconditions
Movie title:Star trek
Movie title:Toy Story
Movie:Rented: No
1. After adding Star Wars
Movie title:Star Wars
Movie title:Star trek
Movie title:Toy Story
Movie:Rented: No
2. After adding Star Wars again
Movie title:Star Wars
�������������� �������������� ��!�� �
�������������� ����� � ������
Example: Multi-ModalSpecification->Example
��������������� ����� � ������
New From Cunningham: Swim LaneSpecification->Example
https://dev.eclipse.org/portal/myfoundation/tests/swim.php?file=finished/a_complete_committer_vote_example.txt&lines=79,90,94,110
��������������� ����� � ������
New From Marick: Wire FramesSpecification->Example
http://www.testing.com/cgi-bin/blog/2006/12/19#wireframe1
��������������� ����� � ������
SummarySpecification option for a project depends on:
• Who will be reading it– They MUST be able to understand it– Visual vs. textual– Concrete vs. declarative
• Who/what will be executing it– More detailed = ‘off the street’ manual tester– Is there a graphical testing framework out there?
• Who will be writing it– Skill set
• Complexity of concepts– Pictures not always able to express a thousand words– Tabular may require humans to perform complex ‘joins’
• Stability of application– concrete vs. declarative
515

��������������� ����� � ������
A FunctionalTest Make-Over
��������������� ����� � ������
Functional Tests As Requirements• Declarative: describes ‘what’, not ‘how’
• Succinct: only include what is necessary
• Autonomous: two people understand it the same
• Sufficient: full coverage in minimal scenarios
• Locatable: organized and searchable
Specification
��������������� ����� � ������
Functional Test (1 of 2) – Version 1Purpose: Test the business rule that there can be no duplicate titles in the
inventory
1. Start at the Maintain Titles page2. Page title should be: Video Store Admin – Maintain Movie Titles3. Click the Add New Title button4. Page title should be: Video Store Admin – Add New Title5. Enter text Star Wars into the field labelled Title6. Select Science Fiction from Category selection list7. Select DVD from Media Type selection list8. Click the Save button
Fn’l Tests as Req’s
��������������� ����� � ������
Functional Test (2 of 2) – Version 1
12. Click the Add New Title button13. Page title should be: Video Store Admin – Add New Title14. Enter text Star Wars into the field labelled Title15. Select Science Fiction from Category selection list16. Select DVD from Media Type selection list17. Click the Save button18. Page title should be Video Store Admin – Add New Title19. Message should be Error: The movie title Star Wars already exists.
9. Page title should be Video Store Admin – Maintain Movie Titles10. Message should be New title successfully added11. Titles should be listed as:
224VideoChildrenAladdin
000VideoChildrenToy Story
000DVDSci FiStar Wars
011DVDSci FiStar Trek
# Rented# In Store# CopiesMedia TypeCategoryTitle
Fn’l Tests as Req’s
��������������� ����� � ������
Review Version 1
Issue: readability– Specification is just a long series of tactical steps– How long will it take a reader to understand this test?
• Did this remind you of your own functional tests?
What part of theworkflow is that?
12. Click the Add New Title button13. Page title should be: Video Store Admin – Add New Title14. Enter text Star Wars into the field labelled Title15. Select Science Fiction from Category selection list16. Select DVD from Media Type selection list17. Click the Save button18. Page title should be Video Store Admin – Add New Title19. Message should be Error: The movie title Star Wars already exists.
9. Page title should be Video Store Admin – Maintain Movie Titles10. Message should be New title successfully added11. Titles should be listed as:
000VideoChildrenToy Story
000DVDSci FiStar Wars
011DVDSci FiStar Trek
# Rented# In Store# CopiesMediaTypeCategoryTitle
• Did you notice any problems with the following?
Fn’l Tests as Req’s
��������������� ����� � ������
Strategy 1: Group Statements With aClear Comment of Intent
3. Click the Add New Title button4. Page title should be: Video Store Admin – Add New Title5. Enter text Star Wars into the field labelled Title6. Select Science Fiction from Category selection list7. Select DVD from Media Type selection list8. Click the Save button
• Click the Add New Title button• Page title should be: Video Store Admin – Add New Title• Enter text Star Wars into the field labelled Title• Select Science Fiction from Category selection list• Select DVD from Media Type selection list• Click the Save button
Steps provideextra details
3. Add movie title for the first timeMake the
intention clear
Fn’l Tests as Req’s
516

�������������� ����� � ������
Functional Test (1 of 3) - Version 2Purpose: Test the business rule that there can be no duplicate titles
in the inventory
1. Start at the Maintain Titles page2. Page title should be: Video Store Admin – Maintain Movie
Titles3. Add a movie title for the first time:
• Click the Add New Title button• Page title should be: Video Store Admin – Add New Title• Enter text Star Wars into the field labelled Title• Select Science Fiction from Category selection list• Select DVD from Media Type selection list• Click the Save button
Fn’l Tests as Req’s
��������������� ����� � ������
Functional Test (2 of 3) - Version 24. Manually verify the title was added and is displayedproperly
• Page title should be Video Store Admin – Maintain MovieTitles
• Message should be New title successfully added• Titles should be listed as:
224VideoChildrenAladdin
000VideoChildrenToy Story
000DVDSci FiStar Wars
011DVDSci FiStar Trek
# Rented# In Store# CopiesMedia TypeCategoryTitle
Fn’l Tests as Req’s
��������������� ����� � ������
Functional Test (3 of 3) - Version 2
5. Try to create a duplicate by adding the same movie titleagain
• Click the Add New Title button• Page title should be: Video Store Admin – Add New Title• Enter text Star Wars into the field labelled Title• Select Science Fiction from Category selection list• Select DVD from Media Type selection list• Click the Save button
6. Verify the error message was displayed• Page title should be Video Store Admin – Add New Title• Message should be Error: The movie title Star Wars
already exists.
Fn’l Tests as Req’s
��������������� ����� � ������
Review Version 2
Issue: maintenance– How much work will it be to update the test if an extra step is
added to this workflow?
• Did you notice any problems with the following?
5. Try to create a duplicate by adding the same movie title again• Click the Add New Title button• Page title should be: Video Store Admin – Add New Title• Enter text Star Wars into the field labelled Title• Select Science Fiction from Category selection list• Select DVD from Media Type selection list• Click the Save button
Didn’t we do allof this already?
Fn’l Tests as Req’s
��������������� ����� � ������
The importance of Maintenance• Automated functional tests need to live as
long as the application does• Great discipline is required to prevent
automated tests from becoming a seriousbottleneck
• If the tests are not maintainable, they will bediscarded (there goes your safety net!).
Fn’l Tests as Req’s
��������������� ����� � ������
Strategy 2: Create a Domain SpecificTesting Language
Verify Add Movie Title Message (message)• Page title should be Video Store Admin – Add New Title• Message should be message
Add Movie Title (title, category, media)• Start at the Maintain Titles page• Page title should be: Video Store Admin – Maintain Movie Titles• Click the Add New Title button• Page title should be: Video Store Admin – Add New Title• Enter text title into the field labelled Title• Select category from Category selection list• Select media from Media Type selection list• Click the Save button
Reusablebuilding blocks
Fn’l Tests as Req’s
517

��������������� ����� � ������
Strategy 2 cont’dManually Verify Title Inventory
• Page title should be Video Store Admin – Maintain MovieTitles
• Message should be New title successfully added• Titles should be listed as:
<value><value><value><value><value><value>
# Rented# In Store# CopiesMedia TypeCategoryTitle
Fn’l Tests as Req’s
��������������� ����� � ������
Functional Test (1 of 1) - Version 3Purpose: Test business rule: no duplicate titles in the inventory
2. Manually Verify Title Inventory
224VideoChildrenAladdin
000VideoChildrenToy Story
000DVDSci FiStar Wars
011DVDSci FiStar Trek
# Rented# In Store# CopiesMedia TypeCategoryTitle
3. Add Movie Title(Star Wars, Sci Fi, DVD)
4. Verify Add Movie Title Message (Error: The movie title Star Warsalready exists)
1. Add Movie Title(Star Wars, Sci Fi, DVD)
Details are in the‘glossary’, not in the test
Fn’l Tests as Req’s
��������������� ����� � ������
Review Version 3
Issue: self-checking– How do we really know if the test is correct?
Why is this done manually?
2. Manually Verify Title Inventory
224VideoChildrenAladdin
000VideoChildrenToy Story
000DVDSci FiStar Wars
011DVDSci FiStar Trek
# Rented# In Store# CopiesMedia TypeCategoryTitle
• Did you notice any problems with the following?
Fn’l Tests as Req’s
��������������� ����� � ������
Strategy 3: Automatic Verification• If the test is not correct, then it is
useless.– Review the test in detail (does it really test
what it is supposed to test)– Keep the test as simple (and understandable)
as possible
• Automatic verification steps helpensure the test is self-consistent– Inputs correlate to outputs– Was something missing in a previous step
• Automatic verification is often themost challenging part of the test– It’s easy to ‘fudge’ things if verification is
manual …. Don’t give up too soon!
Fn’l Tests as Req’s
�������������� ����� � ������
Functional Test (1 of 1) - Version 4Purpose: Test business rule: no duplicate titles in the inventory
1. Add Movie Title(Star Wars, Sci Fi, DVD)
2. Verify Title Inventory
224VideoChildrenAladdin
000VideoChildrenToy Story
000DVDSci FiStar Wars
011DVDSci FiStar Trek
# Rented# In Store# CopiesMedia TypeCategoryTitle
3. Add Movie Title(Star Wars, Sci Fi, DVD)
4. Verify Add Movie Title Message (Error: The movie title Star Warsalready exists)
Automateverification as
much as possible
Fn’l Tests as Req’s
��������������� ����� � ������
Review Version 4
Issue: autonomy– This is an example of the mystery guest test smell.– Where did the precondition data come from?– What happens if another test runs before this one?
• Did you notice any problems with the following?2. Verify Title Inventory
2243 dayChildrenAladdin
0003 dayChildrenToy Story
0001 daySci FiStar Wars
0113 daySci FiStar Trek
# Rented# In Store# CopiesMedia TypeCategoryTitle
Where didthey come
from?
Fn’l Tests as Req’s
518

��������������� ����� � ������
Strategy 4: Clean Slate Approach
FT WebServer
AppFacade
BizLogic Database
Step 3: validate results
Step 1: set-up precondition data
Step 2: exercise SUT
Step 4: clean-up
Fn’l Tests as Req’s
��������������� ����� � ������
Functional Test (1 of 1) - Version 5Purpose: Test business rule: no duplicate titles in the inventory
2. Add Movie Title(Star Wars, Sci Fi, DVD)
3. Verify Title Inventory
224VideoChildrenAladdin
000VideoChildrenToy Story
000DVDSci FiStar Wars
011DVDSci FiStar Trek
# Rented# In Store# CopiesMedia TypeCategoryTitle
4. Add Movie Title(Star Wars, Sci Fi, DVD)
5. Verify Add Movie Title Message (Error: The movie title Star Wars alreadyexists)
1. (preconditions)Create Movie Title(Aladdin, Children, Video)Create Movie Title(Star Trek, Sci Fi, DVD)Create Movie Title(Toy Story, Children, Video)
Now the test isSelf contained
Note: preconditionis different from
action
Note: preconditionis different from
action
Fn’l Tests as Req’s
��������������� ����� � ������
Review Version 5
Issue: succinctness- how do each of the objects contribute to the story being told in the
test?- Would the result be the same without the object?
• Did you notice any problems with the following?3. Verify Title Inventory
224VideoChildrenAladdin
000VideoChildrenToy Story
000DVDSci FiStar Wars
011DVDSci FiStar Trek
# Rented# In Store# CopiesMedia TypeCategoryTitle
What valuedoes this
add?
What valuedoes this
add?
What valuedoes this
add?
What valuedoes this
add?
Fn’l Tests as Req’s
��������������� ����� � ������
Strategy 5: Lighten Up–Keep the test succinct: as small as possible tobe unambiguous, and no smaller
–Minimize number of ‘objects’
–Focus only on critical ‘attributes’
Fn’l Tests as Req’s
��������������� ����� � ������
Bottom Up Scan of Version 5
3. Verify Title Inventory
224VideoChildrenAladdin
000VideoChildrenToy Story
000DVDSci FiStar Wars
011DVDSci FiStar Trek
# Rented# In Store# CopiesMedia TypeCategoryTitle
4. Add Movie Title(Star Wars, Sci Fi, DVD)5. Verify Add Movie Title Message (Error: The movie title Star Wars already exists)
224VideoChildrenAladdin
000VideoChildrenToy Story
000DVDSci FiStar Wars
011DVDSci FiStar Trek
# Rented# In Store# CopiesMedia TypeCategoryTitle
Purpose: Test business rule: no duplicate titles in the inventory
6. Verify Title Inventory
VideoChildrenToy Story
DVDSci FiStar Wars
DVDSci FiStar TrekMedia TypeCategoryTitle
Fn’l Tests as Req’s
��������������� ����� � ������
Bottom Up Scan of Version 5
3. Verify Title Inventory
4. Add Movie Title(Star Wars, Sci Fi, DVD)5. Verify Add Movie Title Message (Error: The movie title Star Wars already exists)
Purpose: Test business rule: no duplicate titles in the inventory
6. Verify Title Inventory
VideoChildrenToy Story
DVDSci FiStar Wars
DVDSci FiStar TrekMedia TypeCategoryTitle
VideoChildrenAladdin
VideoChildrenToy Story
DVDSci FiStar Wars
DVDSci FiStar Trek
Media TypeCategoryTitleVideoChildrenAladdin
VideoChildrenToy Story
DVDSci FiStar Wars
DVDSci FiStar Trek
Media TypeCategoryTitle
Fn’l Tests as Req’s
519

��������������� ����� � ������
Bottom Up Scan of Version 5
4. Add Movie Title(Star Wars, Sci Fi, DVD)5. Verify Add Movie Title Message (Error: The movie title Star Wars already exists)
Purpose: Test business rule: no duplicate titles in the inventory
6. Verify Title Inventory
VideoChildrenToy Story
DVDSci FiStar Wars
DVDSci FiStar TrekMedia TypeCategoryTitle
3. Verify Title Inventory
VideoChildrenToy Story
DVDSci FiStar Wars
DVDSci FiStar TrekMedia TypeCategoryTitle
1. (preconditions)Create Movie Title(Aladdin, Children, Video)Create Movie Title(Star Trek, Sci Fi, DVD)Create Movie Title(Toy Story, Children, Video)
1. (preconditions)Create Movie Title(Aladdin, Children, Video)Create Movie Title(Star Trek, Sci Fi, DVD)Create Movie Title(Toy Story, Children, Video)
2. Add Movie Title(Star Wars, Sci Fi, DVD)
Fn’l Tests as Req’s
��������������� ����� � ������
4. Add Movie Title(Star Wars, Sci Fi, DVD)5. Verify Add Movie Title Message (Error: The movie title Star Wars already exists)
Purpose: Test business rule: no duplicate titles in the inventory
6. Verify Title Inventory
VideoChildrenToy Story
DVDSci FiStar Wars
DVDSci FiStar TrekMedia TypeCategoryTitle
3. Verify Title Inventory
VideoChildrenToy Story
DVDSci FiStar Wars
DVDSci FiStar TrekMedia TypeCategoryTitle
1. (preconditions)Create Movie Title(Star Trek, Sci Fi, DVD)Create Movie Title(Toy Story, Children, Video)
2. Add Movie Title(Star Wars, Sci Fi, DVD)
Everything inthe test has a
purpose
Everything inthe test has a
purpose
Functional Test (1 of 1) - Version 6Fn’l Tests as Req’s
�������������� ����� � ������
Review Version 63. Verify Title Inventory
4. Add Movie Title(Star Wars, Sci Fi, DVD)
VideoChildrenToy Story
DVDSci FiStar Wars
DVDSci FiStar Trek
Media TypeCategoryTitle
What if we addedStarWars as
video?
Issue: sufficiency- Is this a key part of the business rule?- Is this extra detail or a variation?
Fn’l Tests as Req’s
��������������� ����� � ������
Strategy 6: Distribute Responsibility
Functional Test:Strength, structure,
size
Unit Test:Flexibility, resiliency,
support
Fn’l Tests as Req’s
��������������� ����� � ������
6. Add Movie Title(Star Wars, Sci Fi, DVD)7. Verify Add Movie Title Message (Error: The movie title Star Wars already exists)
Purpose: Test business rule: no duplicate titles in the inventory
8. Verify Title Inventory
5. Verify Title Inventory
1. (preconditions)Create Movie Title(Star Trek, Sci Fi, DVD)Create Movie Title(Toy Story, Children, Video)
2. Add Movie Title(Star Wars, Sci Fi, DVD)
Functional Test (1 of 1) - Version 7
3. Add Movie Title(Star Wars, Sci Fi, Video)4. Add Movie Title(Star Wars, Documentary, DVD)
DVDDocumentaryStar Wars
VideoSci FiStar Wars
DVDSci FiStar Trek
VideoChildrenToy Story
DVDSci FiStar Wars
Media TypeCategoryTitle
DVDDocumentaryStar Wars
VideoSci FiStar Wars
DVDSci FiStar Trek
VideoChildrenToy Story
DVDSci FiStar Wars
Media TypeCategoryTitle
Completebusiness rule
Completebusiness rule
Completebusiness rule
Fn’l Tests as Req’s
��������������� ����� � ������
Review Version 7• Did you notice any problems with the following?
Functional TestPurpose: Test business rule: no duplicate titles in the
inventory
This name ismeaningless
Critical Issue: locatability- How can I find a particular test?- How can I find all of the tests related to a particular feature?
Fn’l Tests as Req’s
520

��������������� ����� � ������
Strategy 7: Be Organized– Make each test name meaningful
– Keep the tests well organized
– Tests provide examples of the requirements
Featuredescription
FT
Overall systemDescription and
Purpose
FT
FT
FT
FeatureDescription
Fn’l Tests as Req’s
��������������� ����� � ������
6. Add Movie Title(Star Wars, Sci Fi, DVD)7. Verify Add Movie Title Message (Error: The movie title Star Wars already exists)
Purpose: Test business rule: no duplicate titles in the inventory
8. Verify Title Inventory
5. Verify Title Inventory
1. (preconditions)Create Movie Title(Star Trek, Sci Fi, DVD)Create Movie Title(Toy Story, Children, Video)
2. Add Movie Title(Star Wars, Sci Fi, DVD)3. Add Movie Title(Star Wars, Sci Fi, Video)4. Add Movie Title(Star Wars, Documentary, DVD)
DVDDocumentaryStar Wars
VideoSci FiStar Wars
DVDSci FiStar Trek
VideoChildrenToy Story
DVDSci FiStar Wars
Media TypeCategoryTitle
DVDDocumentaryStar Wars
VideoSci FiStar Wars
DVDSci FiStar Trek
VideoChildrenToy Story
DVDSci FiStar Wars
Media TypeCategoryTitle
Add Movie Title: Reject Duplicates - V8
Clear, SpecificName
Fn’l Tests as Req’s
��������������� ����� � ������
Review Version 8Fn’l Tests as Req’s
��������������� ����� � ������
Functional tests as req’s Summary• Readable: succinct and simple domain specific
testing language• Autonomous: creates its own data and cleans up
after itself; relative dates, etc• Maintainable: no duplication; tests resilient in the
face of cosmetic UI or workflow changes.• Self Checking: no manual intervention is
necessary to verify the expected results.• Sufficient: fully expresses the business rule, with
no excess information• Locatable: well named and organized
Fn’l Tests as Req’s
��������������� ����� � ������
Cleaning UpYour Test Suite
��������������� ����� � ������
How Dirty is Your Oven?
521

�������������� ����� � ������
How Dirty is Your Test Suite?
��������������� ����� � ������
Cleaning Up Your Test SuiteStep 1: Refactor tests into a DSTL (make them
readable)1. Start at the Maintain Titles page2. Page title should be: Video Store Admin – Maintain
Movie Titles3. Click the Add New Title button4. Page title should be: Video Store Admin – Add New Title5. Enter text Star Wars into the field labelled Title6. Select Science Fiction from Category selection list7. Select DVD from Media Type selection list8. Click the Save button9. Page title should be Video Store Admin – Maintain
Movie Titles10. Message should be New title successfully added11. Titles should be listed as:12. …..13. …..14. ….15. ……16. …..
1. Add Movie Title (Star Wars, Sci Fi, DVD)2. Verify Title Inventory
3. Add Movie Title (Star Wars, Sci Fi, DVD)4. Verify Add Movie Title Message (
“Error: The movie title Star Wars already exists”)
224VideoChildren
Aladdin
000VideoChildren
ToyStory
000DVDSci FiStarWars
011DVDSci FiStarTrek
#Rented
# InStore
#Copies
MediaType
Category
Title
��������������� ����� � ������
Cleaning Up Your Test Suite (cont’d)Step 2: Review tests, identify problems
– Excess detail– Ambiguity– Incomplete– Duplication
Step 3: Create incremental plan for refinement– Prioritize tests based on problems, impact, cost to fix
Step 4: Refactor each test one small step at atime– Keep safety net available at all times– May have to tweak the testing tool
��������������� ����� � ������
Starting FromScratch
��������������� ����� � ������
Typical Effort Curve
effo
rt
time
DSTL
Test
��������������� ����� � ������
One Story At A Time
522

��������������� ����� � ������
Story: Naming and StyleStory: <action - object>As a <role>I want <feature>So that <benefit>
Story: Add Movie TitleAs a clerkI want to add a movie titleSo that movies can be rented
Original titles ininventory(error msg)
Original titles ininventory(error msg)
two titles ininventory(sorted)
One title
three titles ininventory(sorted)
Two titles
N/ANo titles ininventory
One title ininventory
No titles
duplicatemissingdata
success
Add Movie Title ScenariosContext
��������������� ����� � ������
Test: Naming and Style
Test: <business rule / scenario>Given <initial context>[And <additional context>]*When <event occurs>Then <ensure outcome>[And <additional outcome>]*
Test: Reject DuplicateGiven inventory contains: Star Wars,sci fi,DVDWhen add movie title: Star Wars, sci fi, DVDThen inventory unchangedAnd message: “Error: The movie title Star Wars already exists”
Readable?
Maintainable?
Locatable?
Sufficient?
Autonomous?
Succinct?
523

524

Testing Web Services
Keith Stobie
Microsoft
One Microsoft Way
Redmond, WA 98052
ABSTRACT
This paper will discuss Testing of public Web Services. The differences between shrink-wrapped
software (desktop or server, e.g. Outlook/Exchange or WordPerfect) testing and public web
services (e.g. Hotmail or Amazon) testing will be described. The focus is on testing techniques
rarely done for shrink wrapped, but commonly done for web services testing, including
deployment, recoverability and rollback testing. Also described are Testing in production, using
production data and common web services Quality of Service metrics.
Author
Keith plans, designs, and reviews software architecture and software tests for Microsoft, and is currently a Test
Architect on the Protocol Tools and Test Team (PT3
). Keith joined Microsoft after working on distributed systems
in Silicon Valley for 20 years. Keith was Principal Software Development Engineering in Test (SDET) on the Live
Search team.
Keith’s experiences in the Live Search group, running the MSN Test Patent group, and being track leader on Testing
Web Services for Test Day at Microsoft, (where he met many other testers with perspectives on this topic) form the
basis for this paper.
With over 25 years in the field, Keith is a leader in testing methodology, tools technology, and quality process.
Keith has been active in the software task group of ASQ, participated in various standards on test methods,
published several articles, and presented at many quality and testing conferences. Keith has a BS in computer
science from Cornell University.
ASQ certified Software Quality Engineer (CSQE), ISTQB Certified Tester, Foundation Level (CTFL)
Member: ACM, IEEE, ASQ
525

1. INTRODUCTION
I briefly contrast shrink-wrap software testing challenges with Web Services testing: where they are the same and
how they are different. I introduce you to how testing in production applies and the use of experiments for A/B
testing. You will start to understand the issues surrounding deployment (rollout) and recall (rollback) of new
versions of servers. I describe how web logs and other data can be used to easily create an accelerated operational
profile. I cover the role of operational health monitoring (including auditing, monitoring, and alerting) and what that
means for testing before and after deployment.
1.1 Shrink Wrap versus Services
To understand how web services are different from shrink wrap software you must realizes some of the core forces
that shape web services.
Internet-scale web services are required to be continuously available with fewer than 4 minutes of down time a year
(99.999% availability). This requires redundancy and recovery mechanisms along with load balancing. Services
must expect failures and thus the failure scenario must be frequently exercised in production, in addition to of course
verifying recovery in test labs. Failure paths for a single service instance should be simple and a main line scenario.
For example, a special or “clean” shutdown separate from just turning off the power does not exist. You can “kill”
anything at any time to stop it since it must always be capable of handling that situation anyways. Continuous
availability requires everything about services be automated including service deployment, health monitoring,
testing, and recovery.
The scale of web services is enormous with terabytes of logs being generated daily. These logs can be stored and
their petabytes of information mined for all kinds of information, some of which will be described later. Exabytes
of information on the World Wide Web are here now and once you have more than 64 exabytes, you’ve exceeded
the range of 64-bit unsigned integers.
To work with this scale requires new methods of extreme Testing to meet the challenge.
1.2 Business Model
Most internet-scale web services obtain revenues via either advertisements or subscriptions. “Free” web services
funded by ads typically have higher quality goals and requirements than subscriptions.
1.2.1 Subscriptions
Subscriptions are widely adopted in the shrink wrapped world today. You might have a monthly subscription for a
shrink wrap anti-virus program such as Windows OneCare or a monthly subscription to an internet service such as
MSN. Downtime or unavailability on a subscription internet service (like downtime on a cable system) rarely
means immediate lost revenue, but can of course increase customer dissatisfaction.
1.2.2 Advertisement
Ads are a major method of funding many websites, especially search portals. Ads can come in many varieties such
as banner, block, or simple text. Search engine providers, to determine the order in which ads are displayed,
auction keywords. For example a general keyword like “lawyer” could be purchased or a more specific term like
“malpractice lawyer” Ads are currently rare for shrink wrapped software, but the concept of product placement such
as real products on billboards in a road racing game is increasing. Downtime or unavailability on an advertisement-
based service means immediate loss of revenues as ads not seen are ads not clicked.
2. Shrink Wrap has Many Likenesses
In discussions with many testers of either shrink wrapped software or web services, I hear many of them claim the
distinctiveness of their situation. My view is there are differences of degree, but most of the variations apply equally
to both.
2.1 Length of Release Cycles
I often hear that web services have short release cycles. While web services can change in hours (or minutes or
seconds if you don’t care about testing anything before changing), many shrink wrapped products can release
security bug fixes in under a day. Whether a shrink wrapped fix available on the internet is applied is of course an
end user decision, while fixes to web services are under the control of provider.
More frequently, web services are oriented to a periodic release cycle, say monthly. But many shrink wrapped
products release monthly as well. Many Microsoft products, for example Visual Studio, provide monthly
Community Technology Preview (CTP) releases of products in progress for customer feedback.
526

Shrink wrap products are more often associated with long, waterfall-like releases that may take years to release.
Yet, some web services, for example Windows Update, work on equally long cycles.
Finally, there is the notion that shrink wrapped products have long, sometimes over a year, beta periods, but Google
Mail is still in beta after three years.
2.2 Development Process
Many web services are less waterfall-like than shrink wrapped, but not all. Many web services are more agile, but
some just ad hoc. Shrink wrapped software traditionally was waterfall, but many have moved to an agile
development process.
Shrink wrapped software frequently wrestles with “who” is the customer (or their representative proxy) especially
when using agile methods. Web services are blessed with easy measurement of their customer as discussed later.
2.3 Engineering Team
Many teams reorganize from having testers separate from product developers or vice-versa, combining testers with
product developers as all engineers. I’ve seen this happen in both shrink wrap and web services team and it doesn’t
appear to characterize any difference between them.
Most amusing, especially with test teams, is the complaint about lack of resources. It exists for both shrink wrapped
and web service projects. Microsoft has had product groups test on the Hewlett-Packard SuperDome computer
(terabyte of RAM) at the Enterprise Engineering Center, but the teams don’t regularly have access to such hardware
in their test labs. Thus many shrink wrap teams test on environments smaller than customer environments.
Similarly in Windows Live Search, the test team does not have access to a test lab with the tens of thousands of
computers used for the product web service. The search test team verifies on a scaled down version of production
for speed of setup and to be more cost effective.
2.4 Previous Testing Techniques Mostly Still Applicable
Shrink wrapped server software exposed inside a corporate data center has a long history of testing and techniques
developed to do that testing. Almost all of the basic testing methodologies apply equally well to services. Unit
Testing, Functional Testing, Stress Testing, Performance Testing and Analysis, etc. all still apply. There are few
fundamental differences. My observation is that most differences, between applying the above-listed techniques to
web services instead of shrink wrap, are the degrees to which the specific methods of each technique are applied.
3. Why Services Testing is Different
Web services are typically deployed (rolled out) into a running system (live environment). You generally don’t get
to reboot and restart all the services and computers simultaneously. You need to have a complete rollback strategy
in case the roll out of a specific service, even after all the testing, causes unanticipated problems. Rollback returns
the versions of services to their last known good versions.
Web services are typically multi-tiered and the test group, along with the operations group, must understand a good
capacity model of the system. Focusing on just transactions per second (TPS) isn't good enough. You need to
capacity model at all tiers of your services.
To keep the continuous service availability expected of web services, you must test for all types of failures. In a
large service, every component (hardware or software) will fail at some point. The severity of the failure is relative
to many factors including the number of replicas. If you have 3 replicas and lose 1, that is not a very urgent failure.
However if you lose a second replica, leaving no replicas, that is very serious as loss of service could be much more
imminent. Test and Operations must understand: how will you monitor the service? Have you tested that your
service is monitorable and accurately reports what it is monitoring?
3.1 Testing in Production
Most shrink wrap products are tested in the lab, with maybe an internal Alpha release or external Beta release.
Server products go into production after test.
Given the vagaries of large, complex, possibly geographically distributed web services, you typically need to
“acceptance” test them after they are deployed into production. You could also conduct tests that may not be
feasible in a test lab. You can inject test data thru the production system and measure for correctness. I also
consider the continual monitoring of production as a “test” of production. To understand current availability and
527
latency, there is nothing like running real test transactions through and measuring them. Do this regularly and it
becomes another monitor of production.
Testing in production requires very reliable monitoring as discussed later. The combination of good detection and
the capability to rollback (discussed more later) allows web service nimbleness.
If test data is written into a production data store, it must be written in such a way that it can be easily identified and
purged from production.
There are also limitations of what can reasonably be done with production testing. You can’t typically test very
destructive actions (complete data center failure) or extreme error cases. Realistically most teams at Microsoft run
less than 25% of their tests in production.
Products.Live.Com uses test in production to test at scale via a constantly injected Tracer. A tracer is a piece of test
data that you inject like normal data. The Products team can do probing of various interfaces of the system as the
tracer data flows through the system and validate end to end flow to identify bottlenecks.
3.1.1 Complete Profile
Traditionally shrink wrap software has used operation profiles to characterize user behavior. Techniques like
Microsoft’s “Customer Experience Improvement Program” allow users to provide anonymous information about
their usage to build operational profiles of shrink wrapped products.
Web services offer the extreme of operation profiles, the complete profile! You can simultaneously process in a test
lab virtually every operation done by every user or record for later replay. Recording of profile information must be
sensitive to Personally Identifiable Information (PII).
Simultaneously with production or using the recorded profile you can process either:
• All the same operations. But this implies a test lab equal in capability of production, which as previously
discussed is frequently not possible.
• A constant or random percentage of the operations. This allows the test lab to be scaled much smaller than
production.
Some teams deliberately overload their test lab. The lab is scaled to say 10% of production, but is fed 20% of the
data.
You can also analyze usage logs for the “extreme” operations. This data is used similar to accelerated Operation
Profile Testing as a means to potentially find more problems sooner.
In addition recorded usage can be mined to analyze trends. This can be used for predicting problems. For example,
when data movement in the system diverges from the usual rate, it often predicts a bigger problem.
When data is recorded for later replay in test labs, PII is a big concern. One way to avoid this is to “sanitize” the
data. Replace real data with dummy data having the same characteristics. Having the same characteristics is key to
accurate prediction! Substituting people names with random strings may not provide the same distribution and
clustering of names as would be seen on a real system. The same is true for phone numbers, social security
numbers, etc. One method to do this is one way hash functions. These isolate the test data from mapping back to
the real data and when constructed properly they can keep the same average distributions.
3.1.2 Usability Testing in Production
Traditional shrink wrap products have employed usability studies and usability labs. The same can be done with
web services, especially for early, new, innovative interfaces. But usability studies generally lack large populations.
Web services offer the ability to do A or B (A/B) testing or more generally real time experiments of many variations
for multivariate analysis based on the Design of Experiments. With A/B testing you provide one implementation, A,
to a set of users (say 50% of them), and a different implementation, B, to the remaining users. Instrumented code
records users’ interactions which can then be analyzed and compared. The analysis looks to uncover which
implementation the users found better (responded faster, took fewer steps, gave better results, etc.).
A simple example was the Bluefly web site. In this case, data was collected without even a full experiment. The
data from web logs, analyzed what types of errors users experienced. The errors revealed people filled in search
keywords into the text box that says “sign up for e-mail.” This was easy to fix1
. .
1
Note: search really needs to be on the home page. Amazon also made this mistake when it went live: there was no
search box on the home page
528

A more classic A/B test case was creating the National Alert Registry for sex offenders. Figure 1was compared with
Figure 2. Which do you think users found best? Like an optometrist you can do several A/B tests. Which is better
Figure 2 of Figure 3? Even small user interface changes can drive substantial differences in satisfaction and usage.
Figure 1
Figure 2
(Figure 2 was preferred over figure 1, but figure 3 was preferred over figure 2.) Multivariate analysis can be used to
understand preferences for current production or many experiments at once.
In Live Search, there are many ways to calculate which results users may perceive as relevant. Part of the
calculation involves what is called page rank, for example how many other pages link to the page. In improving
relevance calculations, you may want to experiment with several different static rank calculations. But the problem
is this must be calculated for each of billions of web pages and the value changes as the web pages change (e.g.,
more or fewer pages linking to the page). This calculation can take days. So why not calculate many variations for
each page when the data for the calculation is at hand. Then we can use either the production value, or one of the
X, Y, or Z experimental values to choose what search results to present to users. By monitoring user reaction to the
list of results presented, we can infer which calculation presents the most relevant results for users. Example of user
reactions includes page abandonment (not completing the action on the page) and length of time on the page. A
page that is easy for users to understand should mean they need to spend less time on it for them to accomplish their
purpose.
3.2 Auditing, Monitoring, & Alerting
Application monitoring is something that itself needs to be tested. A test group can also measure service health and
compare to design parameters as one means of testing. By recording the collected measurements, monitoring can be
a useful way to find issues that have happened and guide long-term improvement.
Figure 3
529

Instrumentation to consider adding is verifying that data has to be consistent over time, resource being consumed
aids in making application health or fitness decisions. Other kinds of data can be exposed are business data
gathering like "How many users clicked the button". While not interesting for service monitoring in general, this is
critical data to run the business.
3.2.1 Failure Mode Analysis
Failure Mode Analysis (FMA) is an up-front design effort that defines a service-monitoring plan that is similar to
security threat modeling. Planning for failure allows you to optimize what you instrument and monitor to detect. A
monitoring champion ensures that a monitoring plan is a part of a service team’s development process. Bring
operations to the table as they see failures day to day. The FMA produces three artifacts:
• Instrumentation plan - Design artifacts used to write code that helps detect failures. Typically shows up in
specifications.
• Monitoring plan - Used by operations to configure the monitoring system during deployment.
• Health model - Describes service health at the service and subsystem level. It is used to understand impact of
specific types of failures on each subsystem and guides mitigation and recovery documentation.
The FMA proceeds through the following steps.
1. List what can go wrong including physical, software, and network components and cause harm to service.
Identify all failure modes and list predictable ways to fail. Understand if a listed item is a way to fail or an
effect of a failure and then prioritize according to impact on service health, probability, and cost.
2. Identify a detection strategy for each failure mode. Each high-impact item needs at least two detection
methods. Detection can be a measure or event, or can require periodic self-test code (a watchdog).
3. Add these detection elements to your coding effort.
4. Create a monitoring plan that matches the instrumentation plan above.
Failure modes are root causes. Detecting root causes directly is optimal, but you can also infer root causes via
symptoms which require correlation.
3.2.2 Alerting
An alert in a production system should indicate needed action. A well-automated, self-healing system should first
minimize alerts. Any time the system is not behaving well enough should generate alerts, and users might notice.
No customer events should occur without an alert already being raised that has detected the problems.
Unfortunately, developers get overzealous and their code starts spouting alerts all the time, and like the child who
cried “wolf” too many times, users quickly ignore all alerts as so much noise. To verify your developers do not get
overzealous, you should measure to see that your alert to actual customer event ratio is nearing 1.0 because you do
not want to raise false alarms.
Alerting is an art; and users should tune their alerts frequently via dynamic configuration. Alerts will change daily
or at least weekly, so you cannot embed the thresholds in code where it is too hard to change. Testing can verify
alerts properly triggering, and internal service checks properly detecting problems (due to test fault injection). Test
labs can also run like production systems and see how useful the alerts are for running their labs.
3.2.3 Quality of Service metrics
Test needs to monitor Qualify of Services metrics in their lab before production. Test should verify the correct
monitoring of many Quality of Service metrics, among them availability, reliability, and performance. Test also
needs to understand the difference between production Quality of Service metric values as compared to the lab
values if they differ, as they usually do. Performance is too large a topic to cover in this paper and there are many
great resources on it.
Availability is the likelihood the user will get a response. An availability of 99.999% (or 5 nines) is 5 minutes of
unavailability a year. Web services also utilize solely internal service checks as part of heartbeat and availability
measurements.
Reliability is the likelihood the user will get a correct response. Users may get a cached (possibly less correct)
response when the system is under high load to reduce the load on back end services. If the ad service is slow,
users may still get their search results, but the page as a whole is less “reliable” because the ad which may have had
the most relevant result for the user was not presented. A reliability of 99.99% (4 nines) is 4 minutes of unreliability
a month
530

Denial of Service is a real threat. Services typically need ways to throttle input and Test needs to verify that the
throttling is effective. Throttling is a technique for reducing availability for a few users to allow greater availability
for most users. Testing of throttling is not typically done on the production site, but in the Test Lab.
3.3 Recoverability Testing
In shrink wrap software, the software may need lots of code to avoid having the instance of software crash or to
quickly recover from a crash. For example, Microsoft office will attempt to “auto-recover” the file being worked
on after a crash.
This recovery logic adds significant complications and testing challenges. With web services, we use redundancy to
more reliably handle recoverability. Using the fail fast approach you immediately terminate the operation (or even
the instance of the service) once an error is detected. The presence of an error means you can no longer trust the
operation of the service instance, so the safest, simplest, and easiest approach is to terminate the operation or the
service instance. By incorporating redundancy both in the data and the service instances, loss of a single service or
data instance is recoverable. If state is involved, then an algorithm such as Paxos (more reliable than the base two
phase commit protocol) can be used [7].
Test must verify that for all possible errors the recovery action works. This means verifying continuity of service
and restoration of replicas. Test should be able to automatically fail hardware, for example, with programmatic
power strips to turn off a CPU, a disk, a router, etc. Failures extend all the way up to complete Data Center failure.
Data Centers may only have 99.995% reliability. To get the service to have greater reliability than a Data Center
you need to geographically distribute the replicas.
3.4 Rollout / Rollback
Traditionally shrink wrapped software involves install and uninstall testing. Although install/uninstall testing has its
complications (especially with a relatively unknown or varied base), it is normally comparatively easy in regard to
the fact it works against an isolated computer when installing the new program (which sometimes may even require
a reboot).
Some software introduces the extra complication of allowing multiple installations of different versions to coexist on
same the machine (e.g., CLR 1.1 and CLR 2.0). Some of the hardest install testing is for products involved in
clusters such as Active Directory or SQL server.
Some older software is not very adaptable to rollout and rollback and thus the old, expensive way for some stateful
web services to be continuously available while doing a complete change like install and reboot for shrink wrap
software was to actually have two copies of the production system. You completely update the backup copy and
then switch to have it be the active copy. This was most commonly needed due to schema changes for stateful
services.
Once again, modern services take install testing to the extreme with the concept of deployment or rolling out (or
back) a set of web services. A set of web services may have multiple dependencies amongst them. As new versions
of services are released, they are introduced into production via a “rollout” which is the replacing of the current
version on a machine with a new version. Similarly, a “rollback” changes to the previous version from the current
version. Before rolling out a new version, it must undergo testing to verify it is safe to release. Beyond all the
functional, performance, security, stress, and other tests, we have to look at compatibility.
3.4.1 Rollout Examples
Most services have multiple instances running in production. The load balancing mechanisms may direct a call for
service to any instance.
Assuming a steady state system with no rollouts currently underway, we might have Figure 4.
Figure 4
Note that client and server are just to indicate who initiates the call (the client or caller) and who receives the call
(the server or callee). Further the client or server may be a “partner” which is not part of your feature team, or part
of your product. During rollout of service Y from current version to the next version (denoted as Y+) we have, for
the service message protocols, Error! Reference source not found..
531

Figure 5
Thus during a rollout, two versions of the service must co-exist, say the current version Y and the next version Y+.
Callers to the current version must be able to call Y+ and get equivalent behavior. Similarly, Y+ calls to other
(older) services must demand no more than what Y did.
Frequently along with your service Y, the surrounding services X and Z may be rolled out also as part of the release
train. In which case, the situation looks something more like Figure 6.
Figure 6
3.4.1.1 Shared Data Rollout
The communication may be more indirect via shared data stores (e.g., log – writers/readers); coexistence of different
schemas should be allowed. Below are examples of producers or consumers of data shared via a persisted data
store. Y can “communicate with itself” via a data store that it reads and writes from (e.g. persistent state) as shown
in Figure 7. Y must be able to interpret Y+ schema and Y+ must not require the new information in Y’s schema.
Schemas are rarely rolled out transactionally. Instead, the schemas, like service protocols, must employ upgradable
formats. For example you may always keep a couple extra “unused” fields in your schema, say variable length
string. Service Y reads and writes, but ignores the fields. Service Y+ stores information in those extra fields that
are actually defined as new fields in Y+ format.
Figure 7
With data sharing, typically Y+ may be rolled out able to understand new XY or ZY formats, but the only format it
can immediately change might be the vN+1 format of its own data store, for example Figure 8.
Figure 8
The versioning among shared data stores further complicates matters and is more fully covered in the paper
“Service Compatibility” [6] which also more fully describes test requirements, rollback, and other details.
532
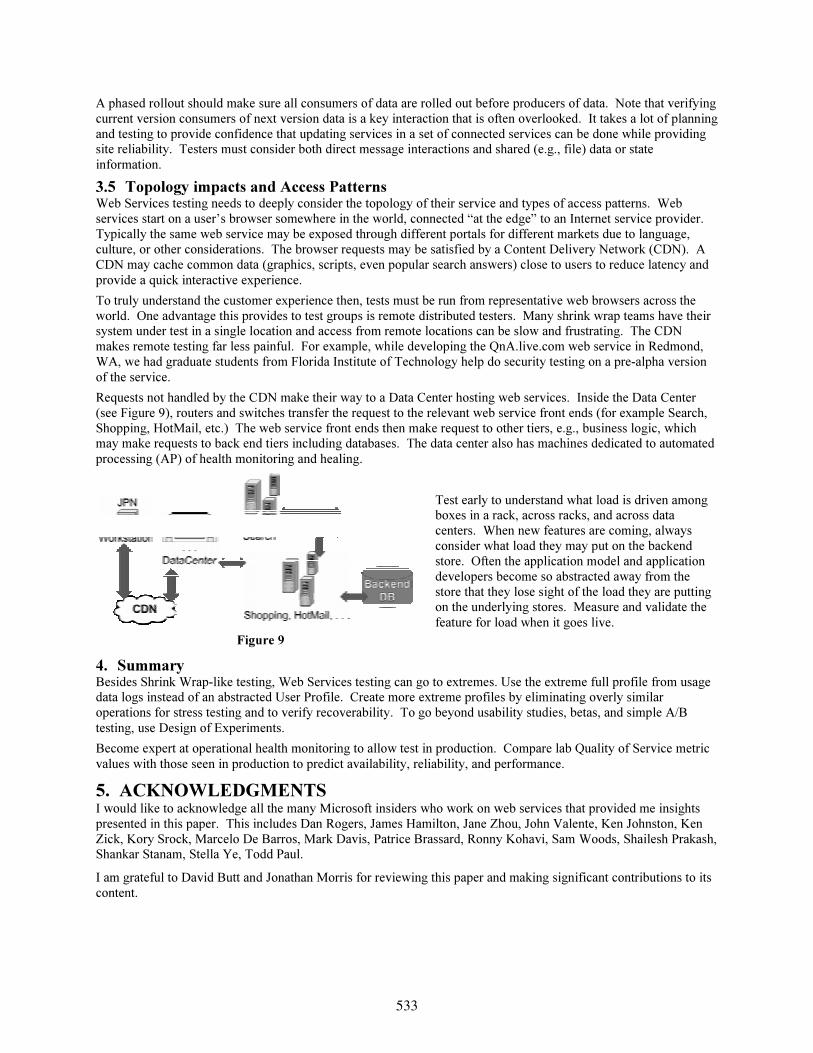
A phased rollout should make sure all consumers of data are rolled out before producers of data. Note that verifying
current version consumers of next version data is a key interaction that is often overlooked. It takes a lot of planning
and testing to provide confidence that updating services in a set of connected services can be done while providing
site reliability. Testers must consider both direct message interactions and shared (e.g., file) data or state
information.
3.5 Topology impacts and Access Patterns
Web Services testing needs to deeply consider the topology of their service and types of access patterns. Web
services start on a user’s browser somewhere in the world, connected “at the edge” to an Internet service provider.
Typically the same web service may be exposed through different portals for different markets due to language,
culture, or other considerations. The browser requests may be satisfied by a Content Delivery Network (CDN). A
CDN may cache common data (graphics, scripts, even popular search answers) close to users to reduce latency and
provide a quick interactive experience.
To truly understand the customer experience then, tests must be run from representative web browsers across the
world. One advantage this provides to test groups is remote distributed testers. Many shrink wrap teams have their
system under test in a single location and access from remote locations can be slow and frustrating. The CDN
makes remote testing far less painful. For example, while developing the QnA.live.com web service in Redmond,
WA, we had graduate students from Florida Institute of Technology help do security testing on a pre-alpha version
of the service.
Requests not handled by the CDN make their way to a Data Center hosting web services. Inside the Data Center
(see Figure 9), routers and switches transfer the request to the relevant web service front ends (for example Search,
Shopping, HotMail, etc.) The web service front ends then make request to other tiers, e.g., business logic, which
may make requests to back end tiers including databases. The data center also has machines dedicated to automated
processing (AP) of health monitoring and healing.
Test early to understand what load is driven among
boxes in a rack, across racks, and across data
centers. When new features are coming, always
consider what load they may put on the backend
store. Often the application model and application
developers become so abstracted away from the
store that they lose sight of the load they are putting
on the underlying stores. Measure and validate the
feature for load when it goes live.
4. Summary
Besides Shrink Wrap-like testing, Web Services testing can go to extremes. Use the extreme full profile from usage
data logs instead of an abstracted User Profile. Create more extreme profiles by eliminating overly similar
operations for stress testing and to verify recoverability. To go beyond usability studies, betas, and simple A/B
testing, use Design of Experiments.
Become expert at operational health monitoring to allow test in production. Compare lab Quality of Service metric
values with those seen in production to predict availability, reliability, and performance.
5. ACKNOWLEDGMENTS
I would like to acknowledge all the many Microsoft insiders who work on web services that provided me insights
presented in this paper. This includes Dan Rogers, James Hamilton, Jane Zhou, John Valente, Ken Johnston, Ken
Zick, Kory Srock, Marcelo De Barros, Mark Davis, Patrice Brassard, Ronny Kohavi, Sam Woods, Shailesh Prakash,
Shankar Stanam, Stella Ye, Todd Paul.
I am grateful to David Butt and Jonathan Morris for reviewing this paper and making significant contributions to its
content.
Figure 9
533

6. REFERENCES
[1] De Barros, M., et al. “Web Services Wind Tunnel: On performance testing large-scale stateful web services” to
appear in The 37th Annual IEEE/IFIP International Conference on Dependable Systems and Networks.
[2] Ron Kohavi, Focus the Mining Beacon: Lessons and Challenges from the World of E-Commerce
Bay Area ACM Data Mining SIG chapter in Palo Alto, CA June 14, 2006.
www.kohavi.com/acmFocusMiningBeaconNR.ppt
[3] Enterprise Engineering Center
www.microsoft.com/windowsserver/evaluation/eec/default.mspx
[4] HP SuperDome computer
channel9.msdn.com/ShowPost.aspx?PostID=27979
[5] Customer Experience Improvement Program
pschmid.net/blog/2006/10/14/66
[6] Keith Stobie, Service Compatibility
<to appear on msdn Tester Center site>
[7] Jim Gray and Leslie Lamport, Consensus on transaction commit.
ACM Transactions on Database Systems (TODS), Volume 31 , Issue 1 (March 2006)
534

User Acceptance Testing – A Context-Driven Perspective Michael Bolton, DevelopSense [email protected]
Biography Michael Bolton is the co-author (with senior author James Bach) of Rapid Software Testing, a course that presents a methodology and mindset for testing software expertly in uncertain conditions and under extreme time pressure.
A testing trainer and consultant, Michael has over 17 years of experience in the computer industry testing, developing, managing, and writing about software. He is the founder of DevelopSense, a Toronto-based consultancy. He was with Quarterdeck Corporation for eight years, during which he delivered the company’s flagship products and directed project and testing teams both in-house and around the world.
Michael has been teaching software testing around the world for eight years. He was an invited participant at the 2003, 2005, 2006, and 2007 Workshops on Teaching Software Testing in Melbourne and Palm Bay, Florida; was a member of the first Exploratory Testing Research Summit in 2006. He is also the Program Chair for TASSQ, the Toronto Association of System and Software Quality, and a co-founder of the Toronto Workshops on Software Testing. He has a regular column in Better Software Magazine, writes for Quality Software (the magazine published by TASSQ), and sporadically produces his own newsletter.
Michael lives in Toronto, Canada, with his wife and two children.
Michael can be reached at [email protected], or through his Web site, http://www.developsense.com
Abstract: Hang around a software development project for long enough and you'll hear two sentences: “We need to keep the customer satisfied,” and “The Customer doesn't know what he wants.” A more thoughtful approach might be to begin by asking a question: “Who IS the customer of the testing effort?”
The idiom user acceptance testing appears in many test plans, yet few outline what it means and what it requires. Is this because it's to everyone obvious what “user acceptance testing” means? Is because there is no effective difference between user acceptance testing and other testing activities? Or might it be that there are so many possible interpretations of what might constitute “user acceptance testing” that the term is effectively meaningless?
In this one-hour presentation, Michael Bolton will establish that there is far more to those questions than many testing groups consider. He doesn't think that “user acceptance testing” is meaningless if people using the words establish a contextual framework and understand what they mean by “user”, by “acceptance”, and by “testing”. Michael will discuss the challenges of user acceptance testing, and propose some remedies that testers can use to help to clarify user requirements--and meet them successfully.
535

User Acceptance Testing in Context
A couple of years ago, I worked with an organization that produces software that provides services to a number of large banks. The services were developed under an agile model. On the face of it, the applications did not seem terribly complicated, but in operation they involved thousands of transactions of some quantity of money each, they bridged custom software at each bank that was fundamentally different, and they needed to defend against fraud and privacy theft. The team created user stories to describe functionality, and user acceptance tests—fairly straightforward and easy to pass—as examples of that functionality. These user acceptance tests were not merely examples; they were also milestones. When all of the user acceptance tests passed, a unit of work was deemed to be done. When all of the user stories associated with the current project were finished development and testing, the project entered a different phase called “user acceptance testing”. This phase took a month of work in-house, and was characterized by a change of focus, in which the testing group performed harsh, complex, aggressive tests and the developers worked primarily in support of the testing group (rather than the other way around) by writing new test code and fixing newly found problems. Then there was a month or so of testing at the banks that used the software, performed by the banks’ testers; that phase was called “user acceptance testing.”
So what is User Acceptance Testing anyway? To paraphrase Gertrude Stein, is there any therethere?
The answer is that there are many potential definitions of user acceptance testing. Here are just a few, culled from articles, conversation with clients and other testers, and mailing list and forum conversations.
the last stage of testing before shipping tests to a standard of compliance with requirements, based on specific examples a set of tests that are run, for a customer, to demonstrate functionality a set of tests that are run, by a customer, to demonstrate functionality not tests at all, but a slam-dunk demo outside beta testing prescribed tests that absolutely must pass before the user will take the product happily prescribed tests that absolutely must pass as a stipulation in a contract any testing that is not done by a developer tests that are done by real users tests that are done by stand-ins or surrogates for real users in Agile projects, prescribed tests (often automated) that mark a code-complete milestone in Agile projects, tests (often automated) that act as examples of intended functionality; that is, tests as requirements documentation
Words (like “user”, “acceptance”, and “testing”) are fundamentally ambiguous, especially when they are combined into idioms (like “user acceptance testing”). People all have different points of view that are rooted in their own cultures, circumstances and experiences. If we are to do any
536

kind of testing well, it is vital to begin by gaining understanding of the ways in which other people, even though they sound alike, might be saying and thinking profoundly different things.
Resolving the possible conflicts requires critical thinking, context-driven thinking, and general semantics: we must ask the questions “what do we mean” and “how do we know?” By doing this kind of analysis, we adapt usefully to the changing contexts in which we work; we defend ourselves from being fooled; we help to prevent certain kinds of disasters, both for our organizations and for ourselves. These disasters include everything from loss of life due to inadequate or inappropriate testing, or merely being thought a fool for using approaches that aren’t appropriate to the context. The alternative—understanding the importance of recognizing and applying context-driven thinking—is to have credibility, capability and confidence to apply skills and tools that will help us solve real problems for our managers and our customers.
In 2002, with the publication of Lessons Learned in Software Testing, the authors (Kaner, Bach, and Pettichord) declared a testing community called the Context-Driven School, with these principles:
For context-driven testers, a discussion of user acceptance testing hinges on identifying aspects of the context: the problem to be solved; the people who are involved; the practices, techniques, and approaches that we might choose.
In any testing project, there are many members of the project community who might be customers of the testing mission1. Some of these people include:
The contracting authority Technical Support The holder of the purse strings Sales people The legal or regulatory authority Sales support The development manager Marketing people The test manager The shareholders of the company The test lead The CEO
1 Here’s a useful way to think of this, by the way: in your head, walk through your company’s offices and buildings. Think of everyone who works in each one of those rooms—have you identified a different role?
The Basic Principles of the Context-Driven School
1. The value of any practice depends on its context. 2. There are good practices in context, but there are no best practices. 3. People, working together, are the most important part of any project's context. 4. Projects unfold over time in ways that are often not predictable. 5. The product is a solution. If the problem isn't solved, the product doesn't work. 6. Good software testing is a challenging intellectual process. 7. Only through judgment and skill, exercised cooperatively throughout the entire project,
are we able to do the right things at the right times to effectively test our products
537

Testers The CFO Developers The IT manager The department manager for the people who are using the software
Network administrators and internal support
Documenters Security personnel The end-user’s line manager ProductionThe end-user Graphic designers The end-user’s customers2 Development managers for other projects Business analysts DesignersArchitectsContent providers
Release control Strategic partners
Any one of these could be the user in a user acceptance test; several of these could be providing the item to be tested; several could be mandating the testing; and several could be performing the testing. The next piece of the puzzle is to ask the relevant questions:
Which people are offering the item to be tested? Who are the people accepting it? Who are the people who have mandated the testing? Who is doing the testing?
With thirty possible project roles (there may be more), times four possible roles within the acceptance test (into each of which multiple groups may fall), we have a huge number of potential interaction models for a UAT project. Moreover, some of these roles have different (and sometimes competing) motivations. Just in terms of who’s doing what, there are too many possible models of user acceptance testing to hold in your mind without asking some important context-driven questions for each project that you’re on.
What is Testing? I’d like to continue our thinking about UAT by considering what testing itself is. James Bach and I say that testing is:
• Questioning the product in order to evaluate it.3
Cem Kaner says
• Testing is an empirical, technical investigation of a product, done on behalf of stakeholders, with the intention of revealing quality-related information of the kind that they seek. (citation to QAI November 2006)
2 The end-user of the application might be a bank teller; problems in a teller application have an impact on the bank’s customers in addition to the impact on the teller. 3 James Bach and Michael Bolton, Rapid Software Testing, available at http://www.satisfice.com/rst.pdf
538

Kaner also says something that I believe is so important that I should quote it at length. He takes issue with the notion of testing as confirmation over the vision of testing as investigation, when he says:
The confirmatory tester knows what the "good" result is and is trying to find proof that the product conforms to that result. The investigator wants to see what will happen and is expecting to learn something new from the test. The investigator doesn't necessarily know how a test will come out, how a line of tests will come out or even whether the line is worth spending much time on. It's a different mindset.4
I think this distinction is crucial as we consider some of the different interpretations of user acceptance testing, because some in some cases, UAT follows an investigative path, and other cases it takes a more confirmatory path.
What are the motivations for testing? Kaner’s list of possible motivations for testing includes
Finding defects Maximizing bug count Blocking premature product releases Helping managers make ship / no-ship decisions Minimizing technical support costs Assessing conformance to specification Assessing conformance to regulations Minimizing safety-related lawsuit risk Finding safe scenarios for use of the product (workarounds that make the product potentially tolerable, in spite of the bugs) Assessing quality Verifying the correctness of the product
I would add assessing compatibility with other products or systems assessing readiness for internal deployment ensuring that that which used to work still works, and design-oriented testing, such as review or test-driven development.
Finally, I would add the idea of “tests” that are not really tests at all, such as a demonstration of a bug for a developer, a ceremonial demonstration for a customer, or executing a set of steps at a trade show. Naturally, this list is not exhaustive; there are plenty of other potential motivations for testing
4 Kaner, Cem, The Ongoing Revolution in Software Testing.http://www.kaner.com/pdfs/TheOngoingRevolution.pdf, PNSQC, 2004
539

What is Acceptance? Now that we’ve looked at testing, let’s look at the notion of acceptance.
In Testing Computer Software, Cem Kaner, Hung Nguyen, and Jack Falk talk about acceptance testing as something that the test team does as it accepts a build from the developers. The point of this kind of testing is to make sure that the product is acceptable to the testing team, with the goal of making sure that the product is stable enough to be tested. It’s a short test of mainstream functions with mainstream data. Note that the expression user acceptance testing doesn’t appear in TCS, which is the best-selling book on software testing in history.
Lessons Learned in Software Testing, on which Kaner was the senior author with James Bach and Brett Pettichord, neither the term “acceptance test” nor “user acceptance test” appears at all. Neither term seems to appear in Black Box Software Testing, by Boris Beizer. Beizer uses “acceptance test” several times in Software Testing Techniques, but doesn’t mention what he means by it.
Perry and Rice, in their book Surviving the Top Ten Challenge of Software Testing, say that “Users should be most concerned with validating that the system will support the needs of the organization. The question to be answered by user acceptance testing is ‘will the system meet the business or operational needs in the real world?’”. But what kind of testing isn’t fundamentally about that? Thus, in what way is there anything special about user acceptance testing? Perry and Rice add that user acceptance testing includes “Identifying all the business processes to be tested; decomposing these processes to the lowest level of complexity, and testing real-life test cases (people or things (?)) through those processes.”
Finally, they beg the question by saying, “the nuts and bolts of user acceptance test is (sic) beyond the scope of this book.”
Without a prevailing definition in the literature, I offer this definition: Acceptance testing is any testing done by one party for the purpose accepting another party's work. It's whatever the tester and the acceptor agree upon; whatever the key is to open the gate for acceptance—however secure or ramshackle the lock.
In this light, user acceptance testing could appear at any point on a continuum, with probing, investigative tests at one end, and softball, confirmatory tests at the other.
User Acceptance Testing as Ceremony In some cases, UAT is not testing at all, but a ceremony. In front of a customer, someone operates the software, without investigation, sometimes even without confirmation. Probing tests have been run before; this thing called a user acceptance test is a feel-good exercise. No one is obliged to be critical in such a circumstance; in fact, they’re required to take the opposite position, lest they be tarred with the brush of not being a team player. This brings us to an observation about expertise that might be surprising: for this kind of dog and pony show, the expert tester shows his expertise by never finding a bug.
540

For example, when the Queen inspects the troops, does anyone expect her to perform an actual inspection? Does she behave like a drill sergeant, checking for errant facial hairs? Does she ask a soldier to disassemble his gun so that she can look down the barrel of it? In this circumstance, the inspection is ceremonial. It’s not a fact-finding mission; it’s a stroll. We might call that kind of inspection a formality, or pro forma, or ceremonial, or perfunctory, or ritual; the point is that it’s not an investigation at all.
User Acceptance Testing as Demonstration Consider the case of a test drive for a new car. Often the customer has made up his mind to purchase the car, and the object is to familiarize himself with the vehicle and to confirm the wisdom of his choice. Neither the salesman nor the customer wants problems to be found; that would be a disaster. In the case, the “test” is a mostly ceremonial part of an otherwise arduous process, and everyone actively uninterested in finding problems and just wants to be happy. It’s a feel-good occasion.
This again emphasizes the idea of a user acceptance test as a formality, a ceremony or demonstration, performed after all of the regular testing has been done. I’m not saying that this is a bad thing, by the way—just that if there’s any disconnect between expectations and execution, there will be trouble—especially if the tester, by some catastrophe, actually does some investigative testing and finds a bug.
User Acceptance Testing as Smoke Test As noted above, Kaner, Falk, and Nguyen refer to acceptance testing as a checkpoint such that the testers accept or reject a build from the developers. Whether performed by automation or by a human tester, this form of testing is relatively quick and light, with the intention of determining whether the build is complete and robust enough for further testing.
On an agile project, the typical scenario for this kind of testing is to have “user acceptance tests” run continuously or at any time, often via automated scripts. This kind of testing is by its nature entirely confirmatory unless and until a human tester gets involved again.
User Acceptance Testing as Mild Exercise Another kind of user acceptance testing is more than a ceremony, and more than just a build verification script. Instead, it’s a hoop through which the product must jump in order to pass, typically performed at a very late stage in the process, and usually involving some kind of demonstration of basic functionality that an actual user might perform. Sometimes a real user runs the program; more often it’s a representative of a real user from the purchasing organization. In other cases, the seller’s people—a salesperson, a product manager, a development manager, or even a tester—walk through some user stories with the buyer watching. This kind of testing is essentially confirmatory in nature; it’s more than a demo, but less than a really thorough look at the product.
The object of this game is still that Party B is supposed to accept that which is being offered by Party A. In this kind of user acceptance testing, there may be an opportunity for B to raise concerns or to object in some other way. One of the assumptions of this variety seems to be that the users are seeing the application for the first time, or perhaps for the first time since they saw
541

the prototype. At this stage, we’re asking someone who is unlikely to have testing skills to find bugs hat they’re unlikely to find, at the very time when we’re least likely to fix them. A fundamental restructuring of the GUI or the back-end logic is out of the question, no matter how clunky it may be, so long as it barely fits the user’s requirements. If the problem is one that requires no thinking, no serious development work, and no real testing effort to fix, it might get fixed. That’s because every change is a risk; when we change the software late in the game, we risk throwing away a lot that we know about the product’s quality. Easy changes, typos and such, are potentially palatable. The only other kind of problem that will be addressed at this stage is the opposite extreme—the one that’s so overwhelmingly bad that the product couldn’t possibly ship. Needless to say, this is a bad time to find this kind of problem.
It’s almost worse, though, to find the middle ground bugs—the mundane, workaday kinds of problems that one would hope to be found earlier, that will irritate customers and that really do need to be fixed. These problems will tend to cause contention and agonized debate of a kind that neither of the other two extremes would cause, and that costs time.
There are a couple of preventative strategies for this catastrophe. One is to involve the user continuously in the development effort and the project community, as the promoters of the Agile movement suggest. Agilists haven’t solved the problem completely, but they have been taking some steps in some good directions, and involving the user closely is a noble goal. In our shop, although our business analyst not sitting in the Development bearpit, as eXtreme Programming recommends, she’s close at hand, on the same floor. And we try to make sure that she’s at the daily standup meetings. The bridging of understanding and the mutual adjustment of expectations between the developers and the business is much easier, and can happen much earlier in this way of working, and that’s good.
Another antidote to the problem of finding bad bugs too late in the game—although rather more difficult to pull off successfully or quickly—is to improve your testing generally. User stories are nice, but they form a pretty weak basis for testing. That’s because, in my experience, they tend to be simple, atomic tasks; they tend to exercise happy workflows and downplay error conditions and exception handling; they tend to pay a lot of attention to capability, and not to the other quality criteria—reliability, usability, scalability, performance, installability, compatibility, supportability, testability, maintainability, portability, and localizability. Teach testers more about critical thinking and about systems thinking, about science and the scientific method.Show them bugs, talk about how those bugs were found, and the techniques that found them. Emphasize the critical thinking part: recognize the kinds of bugs that those techniques couldn’t have found; and recognize the techniques that wouldn’t find those bugs but that would find other bugs. Encourage them to consider those other “-ilities” beyond capability.
User Acceptance Testing as Usability Testing User acceptance testing might be focused on usability. There is an important distinction to be made between ease of learning and ease of use. An application with a graphical user interface may provide excellent affordance—that is, it may expose its capabilities clearly to the user—but that affordance may require a compromise with efficiency, or constrain the options available to the user. Some programs are very solicitous and hold the user’s hand, but like an obsessive
542

parent, that can slow down and annoy the mature user. So: if your model for usability testing involves a short test cycle, consider that you’re seeing the program for much less time than you (or the customers of your testing) will be using it. You won’t necessarily have time to develop expertise with the program if it’s a challenge to learn but easy to use, nor will you always be able to tell if the program is both hard to learn and hard to use. In addition, consider a wide variety of user models in a variety of roles—from trainees to experts to managers. Consider using personas, a technique for creating elaborate and motivating stories about users.5
User Acceptance Testing as Validation In general, with confirmation, one bit of information is required to pass the test; in investigation, many bits of information are considered.
• “When a developer says ‘it works’, he really means ‘it appears to fulfill some requirement to some degree.’” (One or more successes)
– James Bach • “When you hear someone say, ‘It works,’ immediately translate that into, ‘We haven't
tried very hard to make it fail, and we haven't been running it very long or under very diverse conditions, but so far we haven't seen any failures, though we haven't been looking too closely, either.’ (Zero or more successes)
– Jerry Weinberg
Validation seems to be used much more often when there is some kind of contractual model, where the product must pass a user acceptance test as a condition of sale. At the later stages, projects are often behind schedule, people are tired and grumpy, lots of bugs have been found and fixed, and there's lots of pressure to end the project, and a corresponding disincentive to find problems. At this point, the skilful tester faces a dilemma: should he look actively for problems (thereby annoying the client and his own organization should he find one), or should he be a team player?
My final take about the validation sense of UAT: when people describe it, they tend to talk about validating the requirements. There are two issues here. First, can you describe all of the requirements for your product? Can you? Once you’ve done that, can you test for them? Are the requirements all clear, complete, up to date? The context-driven school loves talking about requirements, and in particular, pointing out that there’s a vast difference between requirements and requirements documents.
Second, shouldn’t the requirements be validated as the software is being built? Any software development project that hasn’t attempted to validate requirements up until a test cycle, late in the game, called “user acceptance testing” is likely to be in serious trouble, so I can’t imagine that’s what they mean. Here I agree with the Agilistas again—that it’s helpful to validate requirements continuously throughout the project, and to adapt them when new information comes in and the context changes. Skilled testers can be a boon to the project when they supply new, useful information.
5 Cooper, Alan, The Inmates Are Running the Asylum: Why High Tech Products Drive Us Crazy and How to Restore the Sanity. Pearson Education, 2004.
543

User Acceptance Testing as Assigning Blame There are some circumstances in which relations between the development organization and the customer are such that the customer actively wants to reject the software. There are all kinds of reasons for this; the customer might be trying to find someone to blame, and they want to show the vendor's malfeasance or incompetence to protect themselves from their own games of schedule chicken. This is testing as scapegoating; rather than a User Acceptance Test, it’s more of a User Rejection Test. In this case, as in the last one, the tester is actively trying to find problems, so she’ll challenge the software harshly to try to make it fail. This isn’t a terribly healthy emotional environment, but context-driven thinking demands that we consider it.
User Acceptance Testing When The User is Other Software There is yet another sense of the idea of UAT: that the most direct and frequent user of a piece of code is not a person, but other software. In How to Break Software, James Whittaker talks about a four-part user model, in which humans are only one part. The operating system, the file system, and application programming interfaces, or APIs, are potential users of the software too. Does your model of “the user” include that notion? It could be very important; humans can tolerate a lot of imprecision and ambiguity that software doesn’t handle well.
User Acceptance Testing As Beta Testing There's another model, not a contract-driven model, in which UAT is important. I mentioned DESQview earlier; I worked for Quarterdeck, the company that produced DESQview and other mass-market products such as QEMM and CleanSweep. Those of you with large amounts of gray in the beard will remember it. We didn’t talk about user acceptance testing very much in the world of mass-market commercial software. Our issue was that there was no single user, so user acceptance testing wasn’t our thing. Requirements traceability matrices don't come up there either. We did talk about beta testing, and we did some of that—or rather we got our users to do it. It took us a little while to recognize that we weren’t getting a lot of return on our investment in time and effort. Users, in our experience, didn’t have the skills or the motivation to test our product. They weren’t getting paid to do it, their jobs didn’t depend on it, they didn’t have the focus, and they didn’t have the time. Organizing them was a hassle, and we didn’t get much worthwhile feedback, though we got some.
Microsoft regularly releases beta versions of its software (yes, I know, “and calls them releases”). Seriously, this form of user acceptance testing has yet another motivation: it’s at least in part a marketing tool. It’s at least in part designed to get customers interested in the software; to treat certain customers as an elite; to encourage early adopters. It doesn’t do much for the testing of the product, but it’s a sound marketing strategy.
One of the first papers that I wrote after leaving Quarterdeck addresses beta testing issues; you can find it on my Web site.
In those days, I was younger, and inexperienced at recognizing process traps. I read books and agonized and tried for ages to figure out how to implement UAT at Quarterdeck. It was a long time before I realized that we didn’t need to do it; it didn’t fit. This was a big lesson, and I hope I can impart it to some people: don’t listen to any statement or proclamation—especially about process stuff, in my opinion—from someone that doesn’t establish the context in which their
544

advice might be expected to succeed or fail. Without a healthy dose of context, there’s a risk of pouring effort or resources into things that don’t matter, and ignoring things that do matter.
User Acceptance Tests as Examples In the Agile world, it’s becoming increasing popular to create requirements documents using a free tool called Fit (which works with Excel spreadsheets and Word documents) or Fitnesse (which works on a Wiki Web page). The basic idea is to describe requirements in natural language, and to supplement the descriptions with tables of data. These tables contain input data and references to specific functions in the program. Developers write code (called “fixtures”) to link the function to the framework, which then feeds the tabular data to the application. The framework returns the results of the function and adds colour to the cells in the table—green for successes, and red for failures.
A number of Agilists call these User Acceptance Tests. I much prefer to take Brian Marick’s perspective: the tables provide examples of expected behaviour much more than they test the software. This attempt to create a set of tools (tools that are free, by the way) that help add to a common understanding between developers and the business people is noble—but that’s a design activity far more than a testing activity. That’s fine when Fit or Fitnesse tests are examples, but sometimes they are misrepresented as tests. This leads to a more dangerous view…
User Acceptance Tests as Milestones Fitnesse tests are sometime used as milestones for the completion of a body of work, to the extent that the development group can say “The code is ready to go when all of the Fitnesse tests run green.” Ready to go—but where? At the point the Fitnesse stories are complete, the code is ready for some serious testing. I’d consider it a mistake to say that the code was ready for production. It’s good to have a ruler, but it’s important to note that rulers can be of differing lengths and differing precision. In my opinion, we need much more attention from human eyes on the monitor and human hands on the keyboard. Computers are exceedingly reliable, but the programs running on them may not be, and test automation is software. Moreover, computers don’t have the capacity to recognize problems; they have to be very explicitly trained to look for them in very specific ways. They certainly don’t have the imagination or cognitive skills to say, “What if?”
My personal jury is still out on Fitnesse. It’s obviously a useful tool for recording test ideas and specific test data, and for rerunning them frequently. I often wonder how many of the repeated tests will find or prevent a bug. I think that when combined with an exploratory strategy, Fitnesse has some descriptive power, and provides some useful insurance, or “change detectors”, as Cem calls them.
I’ve certainly had to spend a lot of time in the care and feeding of the tool, time which might have been better spent testing. There are certain aspects of Fitnesse that are downright clunky—the editing control in the Wiki is abysmal. I’m not convinced that all problems lend themselves to tables, and I’m not sure that all people think that way. Diversity of points of view is a valuable asset for a test effort, if your purpose is to find problems. Different minds will spot different patterns, and that’s all to the good.
545

I frequently hear people—developers, mostly, saying things like, “I don’t know much about testing, and that’s why I like using this tool” without considering all of the risks inherent in that statement. I think the Agile community has some more thinking to do about testing. Many of the leading voices in the Agile community advocate automated acceptance tests as a hallmark of Agilism. I think automated acceptance tests are nifty in principle—but in practice, what’s in them?
“When all the acceptance tests pass for a given user story, that story is considered complete.” What might this miss? User stories can easily be atomic, not elaborate, not end-to-end, not thorough, not risk-oriented, not challenging. All forms of specification are to some degree incomplete; or unreadable; or both
User Acceptance Testing as Probing Testing by Users or Testers A long time ago, I learned a couple of important lessons from two books. In The Art of Software Testing, Glenford Myers suggests that testing, real testing where we’re trying to find problems, depends upon us actively searching for failures. We have to find ways to break the software. All good books on software testing, in my estimation, repeat this principle at some point. Testers can’t prove the conjecture that the software works, but at least they can disprove the conjecture that it will fail based on some test. Tests that are designed to pass are relatively weak, and when those tests pass, we don’t learn much. In contrast, tests designed to expose failures are powerful, and when those tests themselves fail to find a problem, we gain confidence. In his book The Craft of Software Testing, Brian Marick gave an example in which one powerful, hostile programmer test can provide seven different points of confirmation, but when we’re probing the software, we advocate exploratory testing in additional to scripted testing. Exploratory testing is simultaneous design, execution, and learning. There’s nothing particularly new about it—long before computers, expert testers have used the result of their last test to inform their next one. The way we like to think about it and to teach it, exploratory testing encourages the tester to turn her brain on and follow heuristics that lead towards finding bugs.
When performed by expert testers, this line of investigation is oriented towards finding out new information about the software’s behaviour. This exposing the system to weird input, resource starvation,
Much of the testing is focus on traceability, repeatability, decidability, and accountability. In some contexts, that could be a lot of busywork—it would be inappropriate, I would argue, to apply these approaches to testing video games. But I still contend that a testing a product oriented towards a technical or organizational problem requires investigative behaviour.
By the way, when I said earlier that the majority of user acceptance tests were confirmatory, I don’t have any figures on this breakdown; I can’t tell you what percentage of organizations take a confirmatory view of UAT, and which ones actually do some investigation. I have only anecdotes, and I have rumours of practice. However, to the context-driven tester, such figures wouldn’t matter much. The only interpretation that matters in the moment is the one taken by the prevailing culture, where you’re at. I used to believe it was important for the software industry to come to agreements on certain terms and practices. That desire is hamstrung by the fact that we would have a hard time coming to agreement on what we meant by “the software
546

industry”, when we consider all of the different contexts in which software is developed. On a similar thread, we’d have a hard time agreeing on who should set and hold the definitions for those terms. This is a very strong motivation for learning and practicing context-driven thinking.
ConclusionContext-driven thinking is all about appropriate behaviour, solving a problem that actually exists, rather than one that happens in some theoretical framework. It asks of everything you touch, “Do you really understand this thing, or do you understand it only within the parameters of your context? Are we folklore followers, or are we investigators?” Context-driven thinkers try to look carefully at what people say, and how different cultures perform their practices. We're trying to make better decisions for ourselves, based on the circumstances in which we're working. This means that context-driven testers shouldn’t panic and attempt to weasel out of the service role: “That’s not user acceptance testing, so since our definition doesn’t agree with ours, we’ll simply not do it.” We don’t feel that that’s competent and responsible behaviour.
So I’ll repeat the definition. Acceptance testing is any testing done by one party for the purpose of accepting another party's work. It's whatever the acceptor says it is; whatever the key is to open the gate—however secure or ramshackle the lock. The key to understanding acceptance testing is to understand the dimensions of the context.
Think about the distinctions between ceremony, demonstration, self-defense, scapegoating, and real testing. Think about the distinction between a decision rule and a test. A decision rule says yes or no; a test is information gathering. Many people who want UAT are seeking decision rules. That may be good enough. If it turns out that the purpose of your activity is ceremonial, it doesn't matter how badly you're testing. In fact, the less investigation you’re doing, the better—or as someone once said, if something isn’t worth doing, it’s certainly not worth doing well.
547

548

Two Futures of Software Testing Michael Bolton DevelopSense
Michael Bolton, DevelopSense [email protected]
Biography Michael Bolton is the co-author (with senior author James Bach) of Rapid Software Testing, a course that presents a methodology and mindset for testing software expertly in uncertain conditions and under extreme time pressure.
A testing trainer and consultant, Michael has over 17 years of experience in the computer industry testing, developing, managing, and writing about software. He is the founder of DevelopSense, a Toronto-based consultancy. He was with Quarterdeck Corporation for eight years, during which he delivered the company’s flagship products and directed project and testing teams both in-house and around the world.
Michael has been teaching software testing around the world for eight years. He was an invited participant at the 2003, 2005, 2006, and 2007 Workshops on Teaching Software Testing in Melbourne and Palm Bay, Florida; was a member of the first Exploratory Testing Research Summit in 2006. He is also the Program Chair for TASSQ, the Toronto Association of System and Software Quality, and a co-founder of the Toronto Workshops on Software Testing. He has a regular column in Better Software Magazine, writes for Quality Software (the magazine published by TASSQ), and sporadically produces his own newsletter.
Michael lives in Toronto, Canada, with his wife and two children.
Michael can be reached at [email protected], or through his Web site, http://www.developsense.com
Abstract: Niels Bohr, Woody Allen, or Yogi Berra (and perhaps all three) once said "Prediction is very difficult, especially about the future."
Michael Bolton rises to the challenge and dares to present two futures of software testing, informed by Bret Pettichord’s four (and lately five) schools of software testing. In one vision of the future, testers are the gatekeepers, responsible for assuring product quality. Testing follows a rigorously controlled process, and exploration is banned. Testers are kept separate from the developers to foster independence and objectivity. Senior testers work from extensively detailed specifications, creating plans, drawing state diagrams, and compiling test scripts from the inception of the project until coding has finished. At that point, any tester, no matter how junior, can read and follow the scripts--testing can even be entirely automated--so that management can be sure that the code is bug-free. All decisions will be based on solid numerical data. Changes to the product will be resisted
549

so that risk can be eliminated. This vision, which contains a number of truly bizarre fantasies, is the DARK vision of the future.
In the other view, testers are active investigators, critical thinkers, and highly skilled, valued members of the project team. Testers neither accept nor desire responsibility for releasing the product; instead, testers provide important, timely, credible information to managers so that they can make sound and informed business decisions. Testers work collaboratively not only with the developers, but with the entire project community, and are able to report at any time on product and project risks. Testers have an extensive understanding of tools and automation, and decide when--and when not—to use them. Most importantly, testers embrace challenge and change, adapting practices and strategies thoughtfully to fit the testing mission and its context.
Where are we now, and where are we going? In this interactive one-hour presentation, Michael shares his visions of the futures of software testing, and the roles of the tester in each of them. The presentation includes a brief exercise and a dialogue, encouraging discussion and debate from the floor.
Prediction is very difficult, especially when it’s about the future. —attributed to Niels Bohr, but disclaimed by his biographers1
Industry pundits love making pronouncements about the future. Sometimes they’re right; sometimes they’re wrong. I wanted to double my odds of being right, so I’m going to identify two. I invite the reader to check with my predictions one year hence, and then every year thereafter until at least one of these predictions come true.
Prelude: The Four Schools of Software Testing In a paper delivered at the 2003 Workshop on Teaching Software Testing, Bret Pettichord identified four philosophical perspectives, or “schools”, of software testing2.
The Analytical or Mathematical School. This school sees testing primarily as a form of analysis and review, based on principles of computer science and mathematics. This analysis depends on precise and detailed specifications, and tests are designed to demonstrate that software behaves according to these specifications. Tests are all falsifiable, expressible by a question to which there is always a true-or-false answer. Flowcharts, state diagrams are paradigmatic tools of this school, and code coverage reports are exemplary artifacts.
1 Felicity Pors, Niels Bohr Archive, Copenhagen. Letter to the Editor in The Economist, July 19, 2007.
2 http://www.testingeducation.org/conference/wtst_pettichord_FSofST2.pdf. Bret Pettichord, The Four Schools of Software Testing. Presentation at the Workshop on Teaching Software Testing, Melbourne, FL, 2003. This was an important attempt to understand testing cultures and their principles. Bret is also a very cogent thinker and writer on the subject of test automation. He is the lead developer and the principal maintainer on the WATIR project. http://www.pettichord.com
550

The Routine or Factory School. This school views testing as a planned, predictable, repeatable process. It separates (and largely segregates) the design and execution of testing. Test planning and design is based on detailed specifications, is performed by senior, experienced testers, and is expressed in the form of scripts that contain step by step instructions and expected results for each test. Test execution is then handed off to junior, less experienced testers, who are often separated from the designers by distance and time. These testers (called test practitioners, test engineers, or test technicians) are essentially interchangeable.The library of test scripts is a paradigmatic artifact of the Routine school.
The Quality School. This school sees testers as “quality gatekeepers”, responsible for ensuring that the development organization follows an established, controlled, repeated process. The testing organization is often subsumed under the title “quality assurance” or “quality control”, and test execution—configuring, operating, observing, and evaluating product—is only one activity of the group.The quality assurance organization is often responsible for establishing process in addition to enforcing compliance. The process document is a paradigmatic artifact of Quality school.
The Context-Driven School. This school emphasizes the idea that different approaches are necessary and appropriate in different contexts. People, it says, are the most important part of any project’s context. The skill is of the individual tester is at the centre of testing, which when done well is a challenging intellectual task. Our skills, our ability to think critically, our ability to learn rapidly, and our ability to choose practices appropriate to serving the testing mission, will help us to do a better job—but nothing is guaranteed to save us. Since the over-riding principle of the school is to respond to circumstance with the appropriate answer, it’s hard to identify a paradigmatic artifact. For the context-driven school, there is no single paradigmatic artifact, except in a given context; anything from a tester’s notebook to a risk list to set of coverage heuristics to a formal report to the FDA could represent an exemplar of a testing artifact.
Since the publication of the original paper, Bret has identified what he considers to be a fifth school of software testing: The Agile School. This School’s governing principles are to be found in the Agile Manifesto3, a software development methodology which places emphasis on individuals and interactions over processes and tools; customer collaboration over negotiated contracts; working software over comprehensive documentation; and responding to change over following a plan. There is value in all of these things, say the Agilists, but the things on the left side of the conjunction are more valuable than the things on the right. Agile testing places heavy emphasis on developer testing as a form of design, and on automation of both development-facing and business-facing tests.Automated test cases or a tables of examples (usually called tests) in Fitnesse, a
3 http://www.agilealliance.org
551

requirements development and automation framework, are paradigmatic examples of Agile School artifacts.
This labeling has been controversial. Many have reacted indignantly to the classification of schools—especially those who have been inserted into a pigeonhole that was not of their own making. However, the classifications may have some usefulness in terms of framing conversations about testing, and viewed sympathetically, may help us to understand the priorities, perspectives, and paradigms of the particular schools.
For example, the Routine, Quality, and Agile Schools might be all characterized as aiming to simplify testing and to make it as routine as possible; to present clear results and metrics to management for control purposes; to manage the testing process (and, in the case of the Quality School, to manage the development process as well). These are goals that seem attractive and feel right for many temperaments. The Context-Driven School sees any prescription for testing as vacant unless that description is accompanied by a context; that metrics are useful to prompt inquiry, but dangerous for control because of the large number of free variables in any development project; that testers must respond to situation and to circumstance; that testers should not drive the development process except by providing information by which others may make informed decisions about it. This approach doesn’t feel right for many temperaments, especially those who aspire to manage or control quality.
It is currently unclear which of the Schools will prevail in the long run. I see at least two possible futures.
The Dark Future There are several points that characterize a darker future of software testing.
Testing is a process of confirmation and verification. Testing is performed only according to documented requirements. Testing is a rigorously planned and controlled process, using engineering and manufacturing models. Testing is precisely estimated. All tests are scripted, with each step and each expected result specified in advance. Testing by humans is deprecated; tests done by automated processes are exalted. Testing doesn’t require skills, neither in testing, nor in programming, nor in the business domain, nor in critical thinking. Testers are kept separate from the developers to foster independence and objectivity. Testing can be easily outsourced. It’s appropriate to slow down so that testing can keep up. Changes to the product are, by default, resisted by the testing organization. Metrics drive testing. We run the product by the numbers. If you can’t measure it, there’s no value to it. Testers are gatekeepers, responsible for determining when the product is ready for release.Testers must be certified by self-appointed international standards bodies.
552

This is the Dark Future. It’s strongly rooted in the Routine and Quality Schools, but there is some input from elements of the Agile School as well (this is a perversion of the principles in the Agile Manifesto, but some Agilists seem oblivious to this). The Dark Future is premised on several fantasies: that projects and requirements should not respond to the need for change, that people are interchangeable, that testing skill is not important, that a computer program is merely “a set of steps that can be run on a computer.” The worst thing about viewing the Dark Future from today’s perspective is that it looks so much like today.
In the Dark Future, management will continue to misunderstand the role and the value of testing, at least in part because the testers themselves will do little to demonstrate their value. Testers will be granted the illusion of being quality police or gatekeepers, but will be overruled as soon as business realities trump the fantasy. In the Dark Future, testing remains a sinkhole in the career path, something for someone to do while they wait to become a developer, a marketer, or a pensioner. In the Dark Future, testing is not an intellectual process.
The Brighter Future In the Bright Future, we define a computer program as “a communication among several humans and computers who are distributed over space and time, that contains instructions that can be run by a computer4.” This informs a different perspective on testing, one founded on Weinberg’s definition of quality: “value to some person(s)5…” with Bach’s refinement, “…who matters.”6 This means that testing is not only directed towards functional correctness (per the Mathematical School), but also towards questioning other aspects of the product that might matter to different constituencies. These audiences for testing include customers (the end user, the end user’s manager, the purchaser), the organization that is developing the product (developers, project management, documenters, technical support, the testing group, senior management), and, potentially, third parties (reviewers, regulators, standards bodies). Testing is not driven by the paperwork required for delegating test activity from “test engineers” to the less skilled “test technicians” (per the Routine School). Instead, in the Bright Future, all testers are (or become) skillful; knowledge may be transmitted in many forms, including conversation, mentoring, mind maps, comparable programs, diagrams, and specifications.
Testing is not merely a process of confirmation and verification; testing is also a process of disconfirmation and exploration. As we explore the application, one principal goal is to avoid being fooled by confirmation bias. Testers do not merely try an application to see if it works; they try it to learn sufficiently about how it can work and how it might fail. Testing no longer concerns itself with “pass vs. fail”, but instead asks at every point “Is there a problem here?”
4 Kaner, Cem, Software Testing as a Social Science. Address to the Toronto Association of Systems and Software Quality, October, 2006. 5 Weinberg, Gerald M. Quality Software Management: Systems Thinking6 Bach, James, and Bolton, Michael, Rapid Software Testing. http://www.satisfice.com/rst.pdf, August 2007.
553

Testing is not only performed only according to documented requirements, but also with an awareness of requirements that might be undocumented. Testers understand the difference between requirements and requirements documents, and can infer requirements from other sources, from domain knowledge, and from experience. (As an example, note that no requirements documents ends each line with “…and the product shall not crash.”)
Testers in the Bright Future recognize that testing is driven by heuristics—fallible methods, conducive to learning, for solving problems or performing tasks—and in particular heuristic oracles—principles or mechanisms by which we may recognize a problem. This permits the tester to use many more means than requirements documentation to perceive problems that may threaten the value of the product.
Testing is not a rigorously planned and controlled process, using engineering and manufacturing models. In the Bright Future, we recognize that software development and testing are both exploratory processes that can be planned to some degree, but the point of exploration is to find new information and make new discoveries. Discovery can be fostered, but it cannot be planned; it can be anticipated, but not scheduled. In addition to the useful engineering and manufacturing metaphors for our profession, testers apply many more models, including medicine7, theatre8, music9, and detective work10.
Testing is not precisely estimated. In the Bright Future, development is estimated; testing starts when development starts and continues until development is done. There are various ways to handle this. The Agile community, for example, suggests that development is done at the end of every iteration. Other development methodologies propose other strategies, but all have this in common: testing responds to development work, but it is the completion of the fixing phase (commonly misnamed the “testing phase”) that determines the end of development work and release of the product.
Testers do not—cannot—know how many problems they are going to find; how much time they will spend investigating the problems; how long it will take to report problems; how a given problem will impact testing; whether there will be a fix; how much time it will take to test the fix, if there is one; how much waiting for the fix will impact a schedule; or whether the fix will take one iteration or ten iterations. In the Bright Future we recognize that testing time cannot be estimated in a meaningful way—except for one: testing will stop when the product ships.
7 Simo, Ben, How Doctors Think. http://qualityfrog.blogspot.com/2007/04/how-doctors-think.html, April 2007 8 Austin, Robert, and Devin, Lee, Artful Making: What Managers Need to Know About How Artists Work. FT Press, May 2003. 9 Jonathan Kohl, Exploratory Testing: Finding the Music of Software Investigation. http://www.kohl.ca/articles/ExploratoryTesting_MusicofInvestigation.pdf, June 2007.10 Kaner 2006.
554

All tests are not scripted, with each step and expected result specified in advance, unless the work is to be performed by an automaton that requires this level of guidance. One sure way to suppress discovery is to make extensive predictions, weeks or months in advance, about each step to take and what the expected result will be. This process is time-consuming and therefore expensive, and can easily lead to inattentional blindness11. Worst of all, it’s unnecessary. In the Bright Future, testers will have sufficient skill to read and follow an instruction like “choose each option” and infer reasonable results or obtain them from other sources of information.
Computing and programming have changed dramatically, but testing hasn’t kept up. In the last 20 years, the procedural programming paradigm has been largely replaced by graphical, interrupt- and event-driven programs. In this model, constraints on the users are relaxed; users are welcome and invited to perform dozens of actions at any time. In the Bright Future, testers are encouraged to vary their workflows, data, and platforms in order to greater diversity of test coverage.
Note that use cases and user stories share a limitation with more traditional forms of specification: they are at best maps or models of the requirements space, intended to describe some small subset of the system’s function. However, the system in the field will often be used in much more complex ways. Transactions will be strung together, rather than performed atomically; users will have varying degrees of sophistication, and thus will interact with the system differently; scenarios may include events or transactions that designers consider improbable or don’t consider at all. Unit tests aren’t intended to address functionality at this level. At present and in the Dark Future, customer-oriented tests—especially those that map onto use cases, stories, or specification—tend to follow simple scenarios. In the Bright Future, testers actively consider complexity, elaboration, and real-world use.
Testing by humans is not deprecated; tests done by automated processes are notexalted. Testers and managers in the Bright Future recognize that test automation is a tool, something that can dramatically extend human capabilities but that cannot replace them. In the Bright Future, testing is understood to be a sapient process12.Testers in the Bright Future also recognize automation bias13 and control for it.
Some in the Agile community have advocated—and continue to advocate—that all tests be automated14.
Testing does require skills, in testing, programming, the business domain, reporting, general systems thinking, scientific thinking, and critical thinking. Not every tester
11 Mack, Arien, and Rock, Irvin, Inattentional Blindness. http://psyche.cs.monash.edu.au/v5/psyche-5-03-mack.html. 12 Bach, James, Sapient Testing. Blog entry, http://www.satisfice.com/blog/archives/99, June 2007
13 Cummings, M.L., Automation Bias in Intelligent Time Critical Decision Support Systems.web.mit.edu/aeroastro/www/labs/halab/papers/CummingsAIAAbias.pdf 14 Crispin, Lisa, and House, Tip, Testing Extreme Programming. Addison Wesley,
555

needs to have all of these skills, but diversity of skills—on the individual and team level—permits the test organization to find more problems of different kinds.
Critical thinking is a critical skill. Testers in the Bright Future are constantly questioning the product, the claims that people make about it, and their own testing processes. Testers ask questions about the cost versus the value of every testing activity, about their coverage—the extent to which they have modeled and tested the system—and about their oracles. Testers in the Bright Future are trained to recognize and control cognitive biases, logical fallacies, and critical thinking errors15. Criticism of popular testing myths is embraced and encouraged. Testing culture is enhanced by peer conferences, at which presentations are discussed and challenged.
Testers are not kept separate from the developers, unless testers are working in a context where independence and objectivity require isolation. Indeed, in the Bright Future, developers do a significant amount of their own testing at the unit level, often collaborating with a skilled tester. Developers typically assist the testers by making a more testable project, including unit- and interface-level tests, scriptable interfaces, log files, mock objects, and modular code that can be tested without the rest of the system. Testing is fundamentally a service, and one of its most important customers is the development group. Testers assist developers by setting up and maintaining alternative platforms, by analyzing and testing the product at higher levels than the developers typically do, and by taking a more general, big-picture view. Since testers and developers are working close to each other, feedback and analysis can be more rapid. Testers recognize the assets and risks in this approach, and retain independence of thought and action while working collaboratively with the development group.
In the Bright Future, testers may be kept separate from developers in contexts that are antagonistic or that otherwise demand separation. A skeptical purchaser of a custom application may choose to hire his own test team; legal counsel may hire expert testers for patent infringement lawsuits. However, in the more typical case, developers perform a good deal of their own testing and testers are working next to them, ready to help.
Testing may be outsourced in the Bright Future, but the default assumption is that most testers will work closely with the development group, and that most outsourcing will be local to the development organization. A good deal of testing’s value comes from fast feedback and a close relationship between developers and testers; even more of it comes from the skill of the individual tester16. A development organization that retains skilled testers and integrates them into the development process is able to
15 For an introductory catalog, see Levy, David, Tools of Critical Thinking: Metathoughts for Psychology. Waveland Press, 2003. 16 Kaner notes that outsourcing might make sense in cases where we have adopted development processes that push all communication to paper, but points out that this demands early decisions and makes late changes difficult and expensive. “The local service provider is more readily available, more responsive, and more able to understand what is needed.” The Past and Future of Software Testing. http://www.kaner.com/pdfs/lightBulbTampere.pdf
556

respond more quickly and flexibly to changes in the product. When testing is outsourced, it is done on the basis of skills and resources that the internal testers don’t have, and not on the basis of the salary of an individual tester.
It’s not appropriate for product development to slow down so that testing can keep up. Testing in the Bright Future is recognized as a service to the development organization, not an obstacle to release. Testing at the unit level is inseparable from development. Unit tests—necessary in the early days of computing because the machinery was far more expensive and far less reliable than it is today—are now valuable for a different reason: to allow developers to make changes to the product rapidly and with greater confidence. This tenet of the Agile School helps to accelerate development, not slow it down.
Changes to the product are not resisted by the testing organization, but are embraced by it. In any non-trivial project, requirements are discovered and developed after the initial planning stages. Again, testing is a service to the development group, so in the Bright Future, testing responds to change just as development does.
Metrics do not drive testing. To the extent that metrics are trusted at all, they may drive questions about testing. In the Bright Future, managers and testers alike recognize that counting requirements or test cases is a classic example of reificationerror—ascribing construct attributes to things that are merely concepts.17
Requirements and test cases are ideas. It is therefore meaningless to state that a product has 30 requirements, or that 1,700 test cases were executed unless we know something about the requirements or the test cases in question.
Testers and managers in the Bright Future realize that software development metrics almost always entail so many free variables as to be effectively futile18. We recognize that data is multivariate, and we continuously look for alternative explanations for numbers that appear to tell a simple story.
Information—the most significant product of testing—is not readily quantifiable, but it can be qualitatively useful. Software engineering metrics can sometimes be used to drive inquiry, but not to draw conclusions. Like metrics in the social sciences, they provide partial answers that might be useful; they inform our choices without directing them.
Among other qualitative measurements, we know the value of observing and gauging people’s feelings, and how they may reflect the true state of the project better than any bug count.
17 Levy, 2003. 18 Kaner, Cem, and Bond, W.P., Software engineering metrics: What do they measure and how do we know? 10th International Software Metrics Symposium, Chicago, 2004. http://www.kaner.com/pdfs/metrics2004.pdf
557

Testers are not gatekeepers, and are not responsible for determining when the product is ready for release. Testers are not in a position to know about market conditions, contractual obligations, competitive pressures, executive bonuses, financial constraints, executive bonuses, or the other factors that contribute to a release decision. Managers may—indeed should—be in a position to know these things. In the Bright Future, testers are responsible for providing information to management about the state of the product so that management can make informed decisions about the quality of the product, but testers in the Bright Future politely decline to make release or quality-related decisions themselves.
Testers need not be certified by self-appointed international standards bodies. In the Bright Future, testers are certified principally by being hired to provide a given skill set for a given development organization in a given context. Certifications, if they exist at all, are skills-based, not knowledge-based. Certification by multiple-choice tests (as it’s done in the present and in the Dark Future) puts a lower standard on testing than a driver’s license puts on drivers. The driver’s licensing process involves a multiple-choice test to qualify the candidate for a learner’s permit; then, to qualify for a license, an assessor must observe and evaluate the candidate driving. Current testing certifications, such as those promoted by the ISTQB and ISEB, don’t involve the observation and evaluation step. Are certifications meaningful when the candidate is not required to demonstrate her skills?
Conclusion
The Dark Future is essentially a continuation of today’s situation: testing that is largely misunderstood by most of the project community—including many testers. In the Dark Future, testing is scripted, to a great degree performed by unskilled labour, and is done as a repeated process of rote confirmation.
The Bright Future places tester skill at the center of testing. Testing at higher levels is investigative and exploratory, far more than the confirmatory and repetitive approaches that are more appropriate for developer testing. Testing generally agrees with the principles in the Agile Manifesto, but rather than being large-A Agile, testing is small-a agile, responding nimbly to the ever-changing needs of the development organization. It is a largely context-driven activity, applying useful ideas from the other schools where those ideas might be appropriate for the context.
I thank Dave Liesse for his review of this paper.
558

Building for a Better Automation Future: One Company’s
Journey
Todd Fitch & John Ruberto
Todd Fitch
Platform Quality Leader, Small Business Division, Intuit
Todd has over 19 years experience in software development. He has held positions in QA, development,
and test automation as an individual contributor and in management positions. He has worked in the
telecommunications, healthcare, and consumer software industries. Todd is currently the Platform
Quality Leader for the Small Business Division at Intuit. He holds two patents in test automation and is a
member of the Department Advisory Council for the Computer Engineering Department at San Jose State
University. He received a B.S. in Computer Science from San Jose State University and an MBA from
the Berkeley-Columbia MBA program.
John Ruberto
Senior Software Quality Manager, Small Business Division, Intuit
John has been developing software in a variety of roles for 21 years. Roles ranging from development
and test engineer to project, development, and quality management. He has experience in Aerospace,
Telecommunications, and Consumer software industries. Currently, he is leading the Testing Center of
Excellence team in Intuit’s Small Business Division, focused on test automation. He received a B. S. in
Computer and Electrical Engineering from Purdue University, an M. S. in Computer Science from
Washington University, and an MBA from San Jose State University.
Executive Summary
Is automated testing one of your pain points? Have you ever wondered how to get from where you are to
where you need to be? At Intuit, we have a long history of pursuing test automation.
We started with ad hoc, “click and record” methods which resulted in fragile testware and mixed results.
We then progressed to a more structured approach based on software engineering principles along with
organizational changes to reinforce accountability and ownership. We focused on improving the
automation infrastructure, improving test reliability, and reducing false negatives. This resulted in where
we are today, with a centralized infrastructure team, federated testing, improved efficiency and
productivity, and an organizational mindset that values and relies on test automation.
We are extending this process to each engineer – with QA and developers collaborating to build
automated tests into our products.
This paper shares our journey along organization, technology, and process and provides some concrete
advice that you can apply to your own efforts.
Copyright © 2007, Todd Fitch and John Ruberto, Intuit, Inc.
559

Abstract
Is automated testing one of your pain points? Have you ever wondered how to get from where you are to
where you need to be? Do you lie awake at night wondering “Why am I paying for that automation team
and what am I getting from it”? If any of these have crossed your mind, then you need to come see
where we’ve been, where we are now, and where we’re going. We will share our journey along
organization, technology, and process. You will walk away with some concrete advice that you can apply
to your own efforts.
At Intuit, we have a long history of pursuing test automation. We started with a centralized automation
team, utilizing “click and record” methods, and an ad hoc process that could best be described as
“automate anything you can”. The results we obtained were, in hindsight, predictable. We ended up with
a large number of automated tests that were fragile, difficult to run, and expensive to maintain. On top of
that, we had no idea what the coverage level of the tests was. While the benefits in terms of testing and
ROI were unclear, we would still characterize this stage in our evolution as the “Renaissance”. We
realized that we needed to invest in automation because the manual testing emphasis of the past was
inefficient and didn’t scale.
Our next stage of evolution, the “Enlightenment”, we recognized that our automation efforts wouldn’t
scale. Without a change in organization, technology, and process, we were doomed to failure and
regression to the “Dark Ages” (i.e. a total reliance on manual testing). During this stage, we focused our
efforts in two distinct areas: infrastructure and process. We decentralized the test ownership and made
huge investments in reducing false negatives. We enabled developers to run tests against their personal
builds. And, we put focused efforts on improving the automation infrastructure. These actions resulted in
major advances in the mindset of the organization – automation, while still fragile, was considered a
critical component of the process. Decision-makers waited for automation results before declaring
confidence. Some developers wouldn’t check in their code unless they could run and pass the automated
tests on their personal builds.
At this point, we would consider ourselves in the “Industrial Revolution” stage. We have successfully
moved to a centralized infrastructure team with federated testing. We have moved from an attitude of
“blame the test first” for failures to “what went wrong with the code?” In the last year, we have gone from
50% of the automated tests requiring triage down to nearly 0%. We are running large automated test
suites against multiple code branches on a daily basis. We know what the tests cover and use code
metrics to add coverage in the most important areas. Developers write unit tests that integrate with our
automation system and that become part of the testing suites. Shipping a product or even promoting a
code branch is considered inconceivable without running comprehensive automated tests with flawless
results.
What are our results so far? We have decreased our testing cycles, increased efficiency, and increased
developer productivity. We’ve matured from an organization where our QA team executed tests over and
over to one where they write new tests and actively work with the developers to build quality in. We have
happier engineers, less rework, more agility to market, higher quality, and scalable development teams.
And, we have helped Intuit become America’s most admired software company and a Great Place To
Work©.
Where are we going next? What does the “Post-Industrial Revolution” look like? It’s a continuation of our
current efforts, with a larger emphasis on code coverage analysis, virtualization, reuse across Intuit
divisions, and partnerships between development and QA engineers to improve testability, improve code
coverage, and expand our ability to test below the GUI – revolutionary improvements through evolution.
560

Introduction
This paper describes our journey in building test automation in the Small Business Division of Intuit. This
journey begins with ad hoc test automation on a well established desktop application. Test automation is
now a key process that is vital to our business success. This paper shares our key learnings around test
automation from organization, infrastructure, and process perspectives.
Test Automation at Intuit – The Early Years
Our test automation efforts began with the realization that we would be unable to scale our manual testing
with such a large product that was growing every year. The organization was already straining under the
testing load and it would only get worse.
Because some of the engineering team had prior experience with test automation, we knew that building
a foundation was necessary for future growth and scalability. Therefore, the initial efforts were focused
on building an automation library and infrastructure. The team spent time building some basic building
blocks that could be used for automated scripts, connections to the products to test, and also on creating
an automation lab to run the tests.
After these basic building blocks were put in place, the automation team then began to work on
automated tests to use for build acceptance, with future plans to automate more features and create
comprehensive test suites. The team at this point had major hurdles to overcome. Most of the team
members were recent college grads with no testing or automation experience. Some of the team was
using SilkTest and the library that had been built while others used a click-and-record tool. There were
no coding standards.
What resulted was a hodge-podge of test scripts with different styles. Engineers often had difficulty
troubleshooting others’ scripts. Further, although the tests themselves were automated, the processes
around running them were almost completely manual.
Key Learning: Standardize on a tool and put coding standards and code reviews in place.
However we had shown that automated testing was a viable option for testing and they moved forward
with automating more tests. At this point, all test generation was centralized. The QA teams wrote test
specifications and the automation team created the tests, executed, triaged and maintained all
automation – i.e. test ownership was centralized.
While working on expanding the automation, we also undertook major improvement efforts. A single tool
was selected as the standard (SilkTest) and the click-and-record methodology was “banned”.
Significant work went into developing the automation infrastructure as well. The lab was built out with
servers and client test machines. Custom control software was written for product and test deployment
and execution. The team also began integrating the automated testing into the build process, with the
test scripts were kicked-off automatically.
The team began to show some big successes, with many scripts written and a huge backlog of demand.
The automated tests were run frequently and were uncovering product defects.
However, the success to this point resulted in some major issues. The centralized team was working
heavy overtime to meet demand – they could not keep up with the requests for new scripts and they
could not keep up with the execution requests. There were many failures due to overloading of the
561

network, the client machines, and server crashes. Much of the execution still required manual
intervention. Furthermore, the scripts themselves were unreliable and prone to failure, even when the
product was functioning properly.
The Enlightenment – Repeatable and Effective Automation
Based on our experiences with automation at Intuit so far and the experiences of one of us (TF) at
previous companies, we recognized that if we continued on our current path, we were going to run into
serious roadblocks and bottlenecks that would impact our ability to deliver results. We knew that our
current infrastructure and processes wouldn’t scale because we were already unable to keep up with the
business needs without Herculean efforts.
We considered a number of options and decided that to build for success, we needed to focus on and
make significant improvements in two areas – our automation infrastructure and our processes.
Automation Infrastructure & Testware
As described above, we had made huge investments in our hardware and software infrastructure (the
AutoLab). On the hardware side, we had a very large physical lab with some servers and approximately
50 client machines. The servers were a hodgepodge of machines that were scavenged cast-offs from
other teams and were prone to crashing. The clients had been accumulated over time and represented a
wide range of capabilities. Our networking infrastructure had been purchased piecemeal from local
computer stores and was unmanageable. We decided that the clients were adequate and could be made
better simply by upgrading the memory.
For the other parts of the infrastructure, a major overhaul was required. Over the course of a few months,
we redesigned (and deployed) the AutoLab around an enterprise-class network (using an expandable,
manageable switch, new cabling, and a fatter “pipe” to the rest of the Intuit network), reliable,
manageable, fault-tolerant servers, and a massive, high-speed SAN (Storage Area Network). What
resulted was a significant increase in reliability and throughput simply by improving our hardware
systems.
Key Learning: Do not build your infrastructure on a rickety foundation. Treat your automation systems as
the critical business systems that they are and design and fund them for success.
On the software side, we had a number of challenges. We were experiencing many false negatives in
our testing. There were multiple sources of failure:
• The tests themselves
• The Silk Frame (our product-specific common function library)
• The Extension Kit (the UI abstraction layer link between Silk and the product)
• The command and control software responsible for provisioning and execution
Key Learning: If people don’t trust the test results, your automation is worse than worthless.
To make improvements to the Extension Kit (EK) required work both in the EK itself and changes to the
product under tests. We decided that work on the EK was a lower priority due to an estimated lower ROI
and risk of schedule slippage. The command and control software began working remarkable well after
the changes to the hardware infrastructure were made.
562

We therefore decided to focus our efforts on cleaning up and improving the tests and cleaning up and
rewriting the Frame. We launched two separate efforts. The first was dedicated to cleaning up the
existing tests. We used the data from our daily operations to identify test scripts that were problematic
and built a (changing) list of scripts to fix. We then worked the list. The results were phenomenal. Within
a year, we had reduced false negatives by 80% and reduced triage time (for failures) by 95%.
The second effort was focused on rewriting the Frame. This effort was not as successful as the first.
There was a lot of debate on the proper structure and architecture of the Frame (which should sound
familiar to anyone who is a survivor of the constant Coding Philosophy Wars) which split the team and
impeded progress. Also, another set of actors was proposing a meta-language that would “compile” into
Silk, with the aim of allowing more tests to be written by non-engineers. By the time one of us (TF) left
the group for another assignment, most of these disagreements in philosophy and direction had not been
resolved. However, some progress had been made in cleaning up, reorganizing, and improving the
existing Frame.
Key Learning: Writing automated tests and developing infrastructure IS software development and you
should use the same rigorous processes for this work as you would for your products. Otherwise, you
can end up with a mess.
Process
While making improvements in our infrastructure and testware were important, improving our processes
was equally important. Up to this point, automation was primarily championed by the automation team –
they ran, triaged, maintained, and wrote all the tests and they maintained and developed the
infrastructure – it was mainly a “push”. This had several serious disadvantages including lack of
mindshare, lack of ownership by others in the organization, and lack of funding.
Key Learning: In the early stages, a “push” strategy may be necessary to get the organization to see the
possibilities and value of automation, but at some point, you have to transition to a “pull” strategy to make
the effort scalable and sustainable.
Therefore, we slowly drove multiple process changes aimed at embedding automation into our
development processes and gaining wider acceptance and buy-in to our automation efforts (the explicit
statement was that if automation was not important to our business, then why spend ANY money or
resources on it). Because some of our infrastructure improvements were beginning to show success, the
people in the organization were starting to see the benefits of a well-executed automation strategy.
We started with building more automation into our processes. Our SCM/build processes were already
automated and we already had some automated testing as part of those build processes. However, the
results of the automated tests were not determining factors in the quality of the build or the code – i.e.
failed tests did not necessarily result in rejecting the build. Working with the quality and development
managers we were able to change this so that passage of tests was required to declare a build “good”
and “usable”. The result of this change was that automated testing was now an integral and critical part
of the development process and we began running more tests on a more frequent basis (e.g. BATS, FST,
and Smoke Tests).
At the same time, we began working with a couple of influential developers on using the Developer Build
Test (DBT) functionality as part of their personal development process. Working with these developers,
we were able to solidify the DBT tool and process and provide significant value to them. These
developers in turn began championing the tool and evangelizing the benefits to their peers.
563

Key Learning: Enlist a couple of developers to help you champion using automation for developer
testing.
The last major process change we started was to lay the groundwork to move the execution and
ownership of the tests themselves to the QA groups. This move towards federated execution and
ownership was not widely popular, as the QA groups had become used to the centralized automation
group doing their work for them. Further, the QA groups, for the most part, did not have the skills needed
for automation. However, we were able to convince the engineering leadership that the only way that we
could have scalable and effective automation was to decentralize – the centralized approach had not
been working.
Outcome
The results of these efforts helped drive mindset changes within the organization. Automation was now
embedded in our software development processes and decision-makers relied on the automation results
before moving to the next steps. Many of the developers relied on the automated testing as part of their
personal process and would not check in their code until they had been able to run the tests cleanly.
And, we took the first steps to eliminate some of our bottlenecks and inefficiencies in test generation.
Industrial Revolution – Scaling the Organization
Integration with SCM Strategies
Our automated tests (BATS and FSTs) are used to validate each daily build. The tests had to pass in
order to declare the build good and usable. However, as the organization grew and more and more
engineers were creating code, we found that the tests very often failed the first time they were executed.
About half of builds failed due to product bugs, product changes that required test updates and false
alarms caused by test infrastructure. We instituted a build meeting each morning to determine action
items to resolve the test issues. This process was becoming expensive.
We took a several pronged approach to improve the process. First, the tests were refactored to be less
fragile to timing and UI differences. Second, we required each engineer to run the build verification tests
on his/her private build prior to check-in. Finally, we created a branching structure to bulk-head defects
and test failures – and using our automated test suites as promotion criteria between branches.
API Testing
Our build acceptance tests were created using SilkTest and interacted with the product via the GUI. The
tests were created with a combination of scripts and the Silk Frame (a library of common functions,
shared across all of the tests). These worked well to validate that the build was acceptable for use in
further testing, but the tests required frequent update.
Usability and Customer Driven Innovation are extremely important to Intuit. Having easy to use products
is part of our “secret sauce”. As such, we are constantly testing our user interfaces and refining them for
ease of use. These changes are great for our customers, but drive a lot of change for our automated
tests that interact with the UI.
Our product has an Application Programming Interface (API) that was built to allow extensions and
companion applications. We observed that the tests meant to test this API had similar coverage as the
associated UI tests – but with dramatically lower maintenance and triage effort.
564

We used this interface to refactor many of our build verification tests – resulting in 80% less triage and
maintenance. False alarms became rare. The API did not cover all of our product, though. For one of
our most important suites – the Smokes suite – only about 30% of the test cases were convertible to the
API. We created a “hybrid smokes” suite – a combination of UI interactions and API verification. This
suite reduced triage effort by 75% - and added more confidence to the tests that we execute every day.
Key Learning: Exploit the programmatic interfaces to the maximum extent possible, and then add tests
interacting with the UI to round out coverage.
Developer Build Testing
The second enhancement was to require developers to run the build verification tests prior to code check-
in, using the Developer Built Test (DBT). This helps find defects by running a standard set of tests, plus
tests the tests – to identify product changes that require test update.
Key Learning: Build your engineering processes to ensure both quality of the product as well as quality of
the tests.
Branching Strategy
One frequent action from the build huddle meetings was to lock out all new check-ins until we could
determine which change caused the failures in the build. One bug could cause a disruption to all of the
engineers. We corrected this by creating group, team, and sometimes individual engineer branches.
The main branch is maintained at an “always releasable” quality level – and we regularly run our entire
suite of automated tests to ensure this quality level.
Individual engineers check code into their team branch – along with any automated test updates.
Periodically, the team branches are promoted to the group branch – but only after all of our automated
tests run and pass. This process ensures that any defect introduced – in either the product or the test –
is contained and only impacts the team that created the defect.
Similarly, group branches are periodically promoted to the main release branch – also with strict
promotion criteria which includes running all of the automated tests.
565

The AutoLab enables this process by providing the computing assets necessary to run this many tests –
and it allows any team to run the entire set of automated tests.
Key Learning: Solid, reliable automated tests can enable branching and integration.
Metrics Guide Automation Efforts
Building upon the build verification, smoke, and regression tests – we looked for ways to add more
automated test for maximum benefit. We used two key metrics to guide additional tests, code coverage
and “the badlands”. We call this fact based testing, as opposed to faith based testing.
The badlands are the defect rich areas of our code base. The badlands are found by examining the
source control records for bug fixes. Each release shows a classic Pareto effect – with 80% of the
defects residing in 20% of the modules. Reviewing several releases of badlands showed the expected –
areas that had high levels of change tended to appear in the badlands. Also, another pattern emerged;
several modules appeared in the badlands each release.
These recurrent badlands modules became automation targets. These areas required change with each
release. Our goal was to increase automated test coverage in these areas so we could test “often and
early” – new defects could be identified close to the injection point.
The next question is, “what is our coverage in the badlands?” We used code coverage tools to measure
the coverage of the existing tests – and provide visibility to the engineers that are charged with improving
coverage.
The central automation team instrumented periodic builds, provides training, and the environment to use
the tools. The coverage environment is a virtual machine image that contains the source code and all of
the tools necessary to analyze coverage and create new tests – preinstalled. This application of
virtualization reduces setup effort – which improves productivity and adoption.
Main Release Branch
Group Branch Group Branch
Team Branch
Team Branch
Automated Tests
– Promotion
Automated Tests
– Promotion
Automated Tests
– Promotion
566

Each team has established specific test coverage baselines, goals, and report regularly on progress to
the plans. These metrics and goals are kept in an organization wide automation scorecard – and
progress is shared with senior management monthly.
Key Learning: Focus automation effort on the right areas – using your data as a guide.
Decentralized Test Ownership
We decentralized test ownership – each QA team that owns a functional area also own the automated
tests for that area. Ownership means that the team is responsible for the coverage and quality of the
tests, and responsible for ensuring that the tests are maintained – while the product is undergoing
changes.
Test ownership is explicit through the use of the Ownership matrix. The Ownership matrix lists each
feature/function of our product and identifies the code owner and quality owner. The matrix also identifies
the owners by code architectural area. Any changes or interactions with code must be coordinated with
the owners (both code and quality).
The decentralized ownership of the tests allows for the central test automation team to focus on the
testing infrastructure and further enable and drive automation in the organization – while the engineers
running and maintaining the tests have a go-to person, identified by the ownership matrix.
This also greatly improves the efficiency of test maintenance. The teams working on product changes
also own the associated tests – so they are very likely to proactively plan and update tests prior to
execution. When we had centralized ownership of the tests – the central team frequently learned of
product changes only when the tests failed – at which time it became an urgent , unplanned activity to
update the tests.
Key Learning: Explicitly define test ownership – by name to eliminate any ambiguity. Ownership of the
tests should be as close as possible to the ownership of the code for efficiency.
Decentralization does have drawbacks, especially for teams that have not planned for their engineers to
concentrate on automation. Some teams rotated the automated test execution and triage responsibility
every week to spread the “pain” around. This behavior became self-fulfilling; since each week the
engineers were new to automation & triage – once they became competent in driving the automation
system – they were rotated to another task. The groups that kept an automation team intact were much
more efficient and are leaders in automation across Intuit.
Key Learning: The learning curve applies to automated test execution & triage – just like any other
engineering discipline.
Virtualization
The main autolab contained approximately 100 test clients – each one a slim form-factor PC. The lab is
approximately 300 square feet, with 12-16 PCs on each rack. This worked well, but was difficult to scale.
The lab was running near capacity, and the amount of testing was projected to double. Growing the lab
was difficult – with the lab at limits on cooling and electrical capacity.
The lab was near capacity when measured by machine availability, but tests were actually running only
about 15% of the time. Most of the machine time was consumed with setup and teardown. The largest
567

time was spent when a test failed – the machine was locked for a period until engineer could analyze the
results.
Enter virtualization.
We used virtualization technology to help solve these problems. The hardware/software stack that we
selected runs 11 virtual machines (VM) per server. The server consumes 75% less power and much less
space than the equivalent physical PCs. Virtualization also enables efficiency improvements – reducing
the setup and teardown time per test.
Test setup is faster with virtualization: instead of imaging the hard-drive, a virtual machine is deployed
ready to test. Test teardown is more efficient. When a test fails, we can save the virtual image to storage
– instead of locking the machine. This allows additional tests to execute while waiting for the engineers to
examine the results. This has the extra benefit of keeping the entire machine context available for the
engineers for a much longer duration than 6 hours.
This year, we expanded the total lab capacity by 20% in terms of number of machines, reduced our
power consumption, and tripled the number of tests executed.
Key Learning: The effectiveness and adoption of test automation is directly proportional to the ease of
test setup, execution, and obtaining results. Investing in a system that provisions the test environment
and executes tests automatically extends the ability to distribute automation through the organization.
Unit Testing
Ideally, a test automation strategy will rest on a foundation of automated unit tests that are executed with
each and every build. When we started our test automation journey, our product was already very
successful in the marketplace, and had been through nearly a decade of development. The code was not
structured in a way to allow effective unit testing (separation of concerns, cross dependencies, etc.).
We did several pilot projects to automate unit testing on the existing codebase. These pilot projects
showed the effort to create a mock environment far outweighed the perceived benefits of automated unit
testing.
So, we took two approaches. We developed a testing framework that resided inside of our product with
tests that can run in the context of our application. This greatly reduces the effort required to create new
unit tests – these tests can interact with objects with the dependencies intact. We modeled this framework
based on the popular “xUnit” testing frameworks – so our engineers are familiar with the operation.
The tests reside in the debug version of the code – so are not delivered to our customers.
The second approach for unit testing was to require a high level of automated unit test coverage on new
modules. Our quality plans for new modules require typically 80-90% statement coverage for these unit
tests. Currently, we now have 15% to 20% of our code falls into this category – and we are projecting to
be at 80% in 3 years.
Frame Working Group
We were successful in distribution ownership of the tests across the organization. Ownership of the Silk
Frame did remain with the central automation team – because the frame was cutting across the
organization. As automation became more pervasive in the organization, we found the central team
568

again had difficulty keeping up, especially with more and more of the functionality residing in the Silk
Frame.
We formed a Frame Working Group, a collection of automation experts across the organization. The
Frame Working Group collectively owns the Silk Frame now. The group has a mailing list, meets
regularly, and has formed into a community. This has expanded the number of people that can effectively
work on maintaining the frame – with changes welcome from any of the engineers – as long as a member
of the working group reviews the changes.
What are we working on now?
Collaborative Test Development
Test automation is no longer seen as a QA effort, but collaboration between developers and QA. Goals
for testability and automated unit test coverage are built into the plans at the project start. Also, in many
areas the products are self testing.
Automated unit tests are the foundation for all testing. Each new module developed has a requirement of
80% or better statement coverage, with many achieving over 90%, prior to declaring “code complete”.
Many teams are using Test Driven Development to achieve these goals.
These unit tests are executed with each change. Continuous Integration systems monitor the source
repository for change, and automatically start a build and test execution cycle for each change.
In many areas, tests are built into the products. For example, performance testing is facilitated by our
products logging the time to completed specified workflows.
Intuit wide – scalable automation infrastructure
We have solved many test automation problems in the Small Business Division, problems that are also
being solved in our other divisions like Consumer Tax and Personal Finance. We are discovering many
opportunities to collaborate across product lines and organizational boundaries.
We are sharing many aspects of test automation: Infrastructure, license investment, training, and test
assets. For testing infrastructure, we have the same basic needs: test repository, provisioning a test
environment, installing the software to be tested, execution, and recording results.
Our two largest products are seasonal – with busy test periods in different times of the year. This provides
a great opportunity to pool software licenses – maximum benefit for minimum investment.
A large benefit of having common testing tools and methodologies comes into play when we share
components across our company. When components change, the team making the change will execute
the tests for the products that use that component, prior to release.
Conclusion
Test automation has grown in the Small Business Division from an ad hoc process into a key engineering
practice that is vital to our business success. This was accomplished first through a centralized team to
569

develop the expertise, infrastructure, coding standards, training, and early path-finding for optimal
automation strategies.
To scale automation with the growth of the organization required a more federated approach – with test
ownership residing with each team, while maintaining a central team to own the infrastructure and other
enabling functions.
Glossary
BATS – Build Acceptance Test Suite. A small suite of tests designed to ensure that at a minimum that
product would install and start properly.
Developer Build Test (DBT) – A process that allows a developer to execute any of our automated tests on
his/her private build – prior to code checkin. The tests are executed in a “QA” environment.
FST – Feature Sanity Test. A test suite that covers the basics of a particular feature set to ensure that
basic functionality works.
False Negative – any test automation failure that is not due to a product defect.
570

Testable Software Architectures
David Langer, Troy Schneringer – Ascentium Corporation
[email protected], [email protected]
Abstract
It is an established best practice in modern software engineering that rigorous usage of automated unit
testing frameworks can have a dramatic increase in the quality of software. What is often more important,
but not frequently discussed, is that software that can be rigorously tested in this manner is typically more
maintainable and more extensible – all the while consistently retaining high levels of quality. These
factors combine to drive down the Total Cost of Ownership (TCO) for software that is rigorously testable.
Modern enterprise-class software systems can have life spans of 3, 5, even 10 years. With this kind of
longevity it is not uncommon for long-term maintenance and extension costs to far outweigh initial
development costs of enterprise software systems. When this fact is combined with the benefits described
above, it becomes clear that testability should be a first-class driver when crafting software architecture.
What is also clear is that crafting high-quality software architectures that can demonstrably drive down
TCO over a long period, while maintaining high quality, hasn’t traditionally been the IT industry’s strong
suit.
While the Agile practice of Test-Driven Development (TDD), by definition, assists in the process of
developing testable software, it alone is not 100% assurance that rigorously testable (and hence
desirable) software architectures will be produced.
In this paper we will cover some of the core concepts that typify testable software architecture. We will
also discuss, through the development of an example software architecture, how the usage of Design
Patterns produces software architectures that embody these core concepts of testability. Lastly, we will
illustrate these concepts with working C# and NUnit code.
About the Authors
David Langer is a Solution Architect and Principal Consultant for Ascentium Corporation where he
leverages his decade of IT experience in delivering success to Ascentium’s clients. At Ascentium David
specializes in large-scale custom development, enterprise integration, and developer training
engagements. David’s passions include Object-Oriented Analysis & Design, Design Patterns, the Unified
Modeling Language (UML), and the practical application of Agile techniques. Previous to joining
Ascentium David was an Architect for Safeco Insurance and taught Object-Oriented programming in C++.
David holds a BA in Economics from the University of Washington.
Troy Schneringer is a Software Developer for Ascentium Corporation where he delivers custom software
solutions both for rich- and thin- client applications. His vocational passions include Design Patterns,
Test-Driven Development, and Agile software development. Prior to working at Ascentium Troy worked
researching the application of artificial intelligence and natural language processing to protect intellectual
property from insider threats. Troy holds a BS in Computer Science from Whitworth University in
Spokane, WA.
Introduction
It is an established best practice in modern software engineering that rigorous usage of automated unit
testing frameworks can have a dramatic increase in the quality of software. What is often more important,
but not frequently discussed, is that software that can be rigorously tested in this manner is typically more
maintainable and more extensible – all the while consistently retaining high levels of quality. These
factors combine to drive down the Total Cost of Ownership (TCO) for software that is rigorously testable.
571

In the enterprise software space, systems typically have long life spans. Research has shown that up to
80% of the total cost of such enterprise software systems, over their total lifecycle, is incurred after initial
development. Clearly, any and all strategies that can be employed to drive down TCO during software
development can reap substantial rewards.
Development teams that focus on testability (which we define in this paper as automated testability) of
their software employ a powerful strategy for creating systems that have favorable TCO characteristics.
The meticulous application of the Agile practice of Test-Driven Development (TDD) by expert Object-
Oriented (OO) developers, well-versed in engineering software using design patterns, produces code that
adheres to a number of OO design principles that are battle-tested ways of creating high-quality systems.
Unfortunately, the practice of TDD alone is usually insufficient to maximize the TCO benefits of testability.
For the prototypical OO development project there are three main reasons why TDD alone isn’t enough:
1. Staffing - Generally speaking, most development teams are not staffed with sufficient
numbers of OO experts to maximize the benefits of TDD. Real-time application of OO
principles and design patterns is necessary for TDD to create high-quality, robust systems.
In many organizations such OO experts are considered to be “too valuable to write code”.
2. Cost – While rigorous application of TDD dramatically drops TCO for a system, it does
increase up-front development costs. Typically, most IT governance systems make it hard
to get the added cost of TDD approved.
3. Application – Meticulous application of TDD is very difficult, and gets more difficult as the
size of the system increases.
So the question becomes if TDD is good in an ideal world, but true TDD is very difficult to execute, can I
realize the design benefits TDD produces without doing true TDD?
The short answer, as we will see, is yes.
It’s All in the Principles
The practice of TDD by expert OO developers inevitably leads to code that manifests good OO design
principles. The first step in trying to harvest TDD benefits without doing true TDD is to identify the OO
design principles that are most commonly manifested in TDD-produced code.
While any number of OO design principles organically emerges out of TDD executed by expert OO
developers, the following are the three OO design principles that are most common – and are arguably
the most important:
1. The Dependency Inversion Principle [Martin 2003].
2. GRASP – Creator [Larman 2002].
3. The Single Responsibility Pattern [Martin 2003].
Luckily for us, TDD isn’t the only way to get code that exhibits these principles.
As OO software development has matured the industry has seen the emergence of Design Patterns [GoF
1995] as a systematic way of documenting and reusing hard-won OO best practices. Just as TDD-
produced code manifests the OO design principles listed above, any number of documented Design
Patterns also manifest these principles.
As such, Design Patterns offer the ability to architect software that is testable. While expert application of
Design Patterns in an up-front Design phase does not obviate the benefits of an extensive suite of
automated unit tests, it can (and should) be used in conjunction with automated unit testing to achieve the
benefits of TDD, as canonically defined [Beck 2004], in the real world.
572

What follows is a grossly simple case study of the up-front application of Design Patterns to build a
software architecture that facilitates extensive automated unit testing by manifesting the OO design
principles listed above.
As we build up our architecture through the case study, we will be illustrating the OO and Design Pattern
concepts discussed using C# code. We will also demonstrate the testability of the created code through
the creation of NUnit automated unit tests after the fact. Finally, building on the knowledge gained from
crafting and testing our code, we will propose several rules of thumb for creating testable software
architectures.
The Dependency Inversion Principle
The Dependency Inversion Principle (DIP) states that "high-level modules should not depend on low-level
modules. Both should depend on abstractions." And additionally, "abstractions should not depend on
details. Details should depend on abstractions." [Martin 2003]. The DIP is central in designing software
that allows for maximum flexibility and ease of testing. To illustrate this principle we can use the Strategy
Pattern [GoF 1995] to show the delegation of implementation details away from the abstraction.
Let’s take the example of a financial company that needs to calculate the minimum monthly payment for
its customers. Like many financial companies, our example company rates customers based on their
credit history and profitability. Our hypothetical company has three kinds of customers Standard, Silver,
and Gold and each type of customer has different business logic to calculate minimum monthly
payments.
In the example before us there are three levels of customers where each level requires a different
calculation for minimum payment. A common technique used to solve this problem is to create an
inheritance tree with an abstract base class, Customer, that contains an abstract method
CalculateMinimumMonthlyPayment. Three inherited members would then be created, StandardCustomer,
SilverCustomer and GoldCustomer, each overriding the abstract method with its own implementation. In
addition to violating the Single Responsibility Principle (see below), this approach violates the DIP by
forcing the Customer (the abstraction) to take a direct dependency on the Calculation (the details).
By designing the Customer to depend on the Calculation, changes made to the Calculation directly
impact the Customer. In terms of testability, every time a change is made to the Calculation the
Customer must be re-tested since it has changed. This is not ideal. Using the DIP, however, we can invert
this dependency allowing the Calculation to change apart from the Customer, and as a result increase the
testability of the software.
Meyer's Rule of Change gives insight into the fault of our original design stating, "Do not use inheritance
to describe a perceived 'is-a' relation if the corresponding object components may have to be changed at
run time" [Meyer 1997]. Since our calculations will indeed be changing at runtime we have ample reason
to avoid the 'is-a' relationship imposed by the inheritance based solution.
Instead, we employ the Strategy Pattern to extract the calculations into three distinct classes and invert
the Customer-Calculation dependency. The code below outlines a simple Strategy implementation.
public abstract class MinimumPaymentCalculator
{
protected Customer customer;
public MinimumPaymentCalculator(Customer customer)
{
this.customer = customer;
}
public abstract decimal CalculateMinimumPayment();
}
573

public class StandardMinimumPaymentCalculator : MinimumPaymentCalculator
{
public StandardMinimumPaymentCalculator(Customer customer)
: base(customer)
{ }
public override decimal CalculateMinimumPayment()
{
decimal monthlyFee = 2.50M;
decimal fivePercent = this.customer.AccountBalance * .05M;
return fivePercent + monthlyFee;
}
}
public class SilverMinimumPaymentCalculator : MinimumPaymentCalculator
{
public SilverMinimumPaymentCalculator(Customer customer)
: base(customer)
{ }
public override decimal CalculateMinimumPayment()
{
decimal twoPercent = this.customer.AccountBalance * .02M;
decimal twoPercentOrTenDollars = Math.Max(twoPercent, 10.00M);
return twoPercentOrTenDollars;
}
}
public class GoldMinimumPaymentCalculator : MinimumPaymentCalculator
{
public GoldMinimumPaymentCalculator(Customer customer)
: base(customer)
{ }
public override decimal CalculateMinimumPayment()
{
decimal percent = .015M;
if (this.customer.AccountBalance > 1000.00M)
percent = .01M;
return this.customer.AccountBalance * percent;
}
}
In decoupling Calculation from the Customer any change to a Calculation will no longer affect the
Customer. As we have designed our details to depend on our abstractions, we no longer end up with
cluttered inheritance hierarchies where multiple incarnations of the same object exist and vary only by a
single method. Furthermore, we have isolated the concerns of testing to be solely that of validating the
Calculations as seen in the following unit tests.
[TestFixture]
public class StandardMinimumPaymentCalculatorTest
{
[Test]
public void MinimumPaymentIsFivePercentPlusFee()
{
decimal expected = 52.50M;
Customer customer = new Customer();
customer.AccountBalance = 1000;
StandardMinimumPaymentCalculator calculator =
new StandardMinimumPaymentCalculator(customer);
decimal actual = calculator.CalculateMinimumPayment();
Assert.AreEqual(expected, actual);
}
}
574

[TestFixture]
public class SilverMinimumPaymentCalculatorTest
{
[Test]
public void MinimumPaymentIsTenDollarsFor499DollarBalanceOrLess()
{
decimal expected = 10.00M;
Customer customer = new Customer();
customer.AccountBalance = 499;
SilverMinimumPaymentCalculator calculator =
new SilverMinimumPaymentCalculator(customer);
decimal actual = calculator.CalculateMinimumPayment();
Assert.AreEqual(expected, actual);
}
[Test]
public void MinimumPaymentIsTwoPercentForBalanceOver500()
{
decimal expected = 12.00M;
Customer customer = new Customer();
customer.AccountBalance = 600;
SilverMinimumPaymentCalculator calculator =
new SilverMinimumPaymentCalculator(customer);
decimal actual = calculator.CalculateMinimumPayment();
Assert.AreEqual(expected, actual);
}
}
[TestFixture]
public class GoldMinimumPaymentCalculatorTest
{
[Test]
public void MinimumPaymentIsOnePointFivePercentForBalanceOf1000OrLess()
{
decimal expected = 15.00M;
Customer customer = new Customer();
customer.AccountBalance = 1000;
GoldMinimumPaymentCalculator calculator = new GoldMinimumPaymentCalculator(customer);
decimal actual = calculator.CalculateMinimumPayment();
Assert.AreEqual(expected, actual);
}
[Test]
public void MinimumPaymentIsOnePercentForBalanceGreaterThan1000()
{
decimal expected = 15.00M;
Customer customer = new Customer();
customer.AccountBalance = 1500;
GoldMinimumPaymentCalculator calculator = new GoldMinimumPaymentCalculator(customer);
decimal actual = calculator.CalculateMinimumPayment();
Assert.AreEqual(expected, actual);
}
}
Any changes that are made to the Calculation Strategies no longer impact the Customer object as we
have successfully inverted the dependency.
Software designed this way, using the Dependency Inversion Principle, naturally lends itself to the use of
the design pattern known as Dependency Injection (DI). The idea behind DI is to allow for a pluggable
architecture in which dependant classes can be swapped in and out at runtime based on configuration or
another runtime state. In our example, we can realize the benefits of DI for the creation of Calculators
based on Customer type. We will explore this more in the next section.
575

Using DI is especially beneficial when writing automated unit tests for your software. Since a unit test is
used to validate a single unit of logic per test, it is important to be able to control all objects within a test
execution other than the object being tested. By creating 'mock objects' that implement the interfaces or
base classes of a dependant class you can inject this object with known state into the object being tested,
confident that you control the injected object's state. Using the mock object, test code can easily be
written knowing how the injected object will behave.
So, the first rule of thumb when architecting testable software architectures can be identified as follows:
• When algorithms can vary within an object, use Design Patterns such as Strategy to
implement details that depend on abstractions.
GRASP – Creator
General Responsibility Assignment Software Patterns (GRASP) are, “a learning aid to help one
understand essential object design, and apply design reasoning in a methodical, rational, explainable
way” [Larman 2002]. Within GRASP, the Creator pattern provides principles on the optimal assignment of
object creation responsibilities within an OO software system.
In terms of architecting a testable software system, the concepts contained within the Creator pattern are
critical as they directly enhance pluggable software architectures. According to the Creator pattern, it is
advisable to employee the Factory design pattern [GoF 1995] in instances where, “conditionally creating
an instance from one of a family similar classes based upon some external property value” [Larman
2002].
As we saw in the previous section, our architecture will utilize the Strategy pattern to encapsulate and
decouple the business logic used to calculate minimum payments for different types of Customers from
the rest of the system. The question that implicitly remained at the end of the last section was, “who
decides which concrete Strategy gets created?” The GRASP Creator pattern answers this question for us
- a Factory decides which Strategy is created for a given Customer.
In order to keep things simple we’ll create a concrete Factory that builds the appropriate concrete
Strategy based on the CustomerType. Here’s the code for the Factory:
public static class MinimumPaymentCalculatorFactory
{
public static MinimumPaymentCalculator CreateMinimumPaymentCalculator (Customer customer)
{
MinimumPaymentCalculator calculator = null;
switch(customer.CustomerType)
{
case CustomerType.Standard:
calculator = new StandardMinimumPaymentCalculator(customer);
break;
case CustomerType.Silver:
calculator = new SilverMinimumPaymentCalculator(customer);
break;
case CustomerType.Gold:
calculator = new GoldMinimumPaymentCalculator(customer);
break;
}
return calculator;
}
}
From a testability standpoint, the usage of a Factory consolidates our creation logic in one place, giving
us an easy go of writing unit tests to ensure that the proper concrete Strategy is created based on
CustomerType:
576

[TestFixture]
public class MinimumPaymentCalculatorFactoryTests
{
[Test]
public void TestStandardCalculatorCreation()
{
Customer customer = new Customer();
customer.CustomerType = CustomerType.Standard;
Assert.IsInstanceOfType(typeof(StandardMinimumPaymentCalculator),
MinimumPaymentCalculatorFactory.CreateMinimumPaymentCalculator(customer));
}
[Test]
public void TestSilverCalculatorCreation()
{
Customer customer = new Customer();
customer.CustomerType = CustomerType.Silver;
Assert.IsInstanceOfType(typeof(SilverMinimumPaymentCalculator),
MinimumPaymentCalculatorFactory.CreateMinimumPaymentCalculator(customer));
}
[Test]
public void TestGoldCalculatorCreation()
{
Customer customer = new Customer();
customer.CustomerType = CustomerType.Gold;
Assert.IsInstanceOfType(typeof(GoldMinimumPaymentCalculator),
MinimumPaymentCalculatorFactory.CreateMinimumPaymentCalculator(customer));
}
}
As we can see from the code above, the usage of the Factory design pattern allows our system to
consolidate conditional object creation logic into a cohesive and loosely coupled construct. Our ability to
quickly and easily create a thorough collection of automated unit tests is derived from this cohesion and
loose coupling.
As discussed in the previous section, the application of the Strategy design pattern enables Dependency
Injection – a hallmark of flexible, and testable, software architectures [Weiskotten 2006]. When Strategy is
combined with Factory the benefits of Dependency Injection are compounded.
The combination of the Strategy and Factory design patterns produces an elegant design solution for
configurable Dependency Injection. In this approach instances of concrete Strategies are created by a
Factory based on data read from an external source such as a configuration file or a database.
Software systems implemented using configurable Dependency Injection are extremely flexible and
powerful. Configurable Dependency Injection is so powerful, in fact, that there are design patterns (such
as the Provider Model design pattern) that are based on the concept.
As there are so many benefits to configurable Dependency Injection, we can easily identify another rule of
thumb for testable software architectures:
• When leveraging Design Patterns in conformance with The Dependency Inversion
Principle, use Factories to create detail instances of the abstraction in question.
Single Responsibility Principle
The Single Responsibility Principle (SRP) is defined as “A class should have only one reason to change”
[Martin 2003]. The SRP addresses the core problem of how to optimally assign responsibilities in classes
in our OO designs. The SRP takes a simple, but powerful, approach to defining what class responsibilities
577

are – reasons to change. The SRP then instructs OO designers on the optimal approach for assigning
responsibilities, a class should only have one responsibility.
The SRP is a deceptively simple concept that has powerful design ramifications. Take the example of a
class that knows how to retrieve and save its data to a database, something like an Employee class
[Martin 2003]. This is actually a common design, and seems totally reasonable, but yet it violates the
SRP.
The reason for this is that the Customer class invariably contains business logic (what is a valid Social
Security Number, for example) in addition to the logic for persisting the object to a database. The class
could need to be changed due to new business logic or due to a change in the persistence mechanism.
The class has more than one responsibility. According to the SRP, persistence for a Customer should be
placed into a dedicated class (maybe using something like the Data Mapper design pattern [Fowler
2003]).
The SRP also has non-intuitive applicability in the area of testable software architectures. One such non-
intuitive application is SOAP-based web services.
Let’s say that our hypothetical system needs to publish the functionality for calculating minimum
payments as a web service to allow consumption from multiple client platforms. In .NET we would declare
a web method and write code within the web method to use our Factory to create a concrete Strategy and
calculate the minimum payment.
Like our previous example, this seems like a reasonable design for our web service. This .NET web
service design is certainly common and many examples like it are published on the Internet. However, in
terms of testable software architectures, this design violates the SRP.
It can be argued that the web method has two responsibilities. First, the web method has the
responsibility of publishing functionality as a SOAP service. Second, the web method implements the
logic to execute the web method. Seen from this perspective, the design violates the SRP.
In response to the violation of the SRP we can apply a common OO principle, the GRASP – Controller
pattern [Larman 2002], to the web method to bring our design into compliance with the SRP. The first
step is to create a Controller class to implement the logic of calculating minimum payments:
public static class CustomerController
{
public static decimal CalculateMinimumPayment(Customer customer)
{
MinimumPaymentCalculator calculator =
MinimumPaymentCalculatorFactory.CreateMinimumPaymentCalculator(customer);
return calculator.CalculateMinimumPayment();
}
}
As can be seen above our Controller leverages the Factory and Strategy created previously. This code
clearly illustrates the power of our software’s architecture. New types of Customers, and
MinimumPaymentCalculators, can be quickly and easily added to the system. The logic for creating
MinimumPaymentCalculators can be changed to be configuration based - all without affecting the
CustomerController’s implementation.
The next step is to implement our .NET web service’s web method in terms of the CustomerController
class:
578

[WebMethod]
public decimal CaclulateMinimumPayment(Customer customer)
{
return CustomerController.CalculateMinimumPayment(customer);
}
The application of GRASP – Controller has decoupled the web service publishing calculations of
minimum monthly payments from the actual calculation of minimum payments. While the advantages of
applying GRASP – Controller in this example may seem minimal from an implementation perspective,
there are immediate benefits for the testability of the architecture.
By pulling the execution logic out of the web method and putting it into a dedicated class we have
simplified the dependencies needed to run automated unit tests. Instead of having to write unit tests that
call the web service, and incurring the additional configuration and deployment overhead that would
entail, we have a nice simple NUnit test that directly hits the CustomerController:
[Test]
public void TestStandardCustomerBalanceOf2000 ()
{
Customer customer = new Customer();
customer.CustomerType = CustomerType.Standard;
customer.AccountBalance = 2000.00M;
Assert.AreEqual(102.5M, CustomerController.CalculateMinimumPayment(customer));
}
As we did not write the .NET framework code that makes .NET web services work, we now have no need
to write any tests that call the web service. Further, by avoiding the need to deploy and configure our web
service into the Internet Information Services (IIS) web server after each build so that we can run our unit
tests, we’ve dramatically reduced the TCO of our suite of automated unit tests.
Now that we’ve covered the SRP, we can call out our last rule of thumb for testable software
architectures:
� Apply the Single Responsibility Principle to classes and architectural elements (services,
persistence, logging, etc) to increase cohesion and decrease coupling.
Conclusion
For organizations that don’t have an exclusive team of expert OO developers and/or have IT Governance
processes that won’t fund true TDD development, the techniques illustrated in this paper offer a model
where the benefits of TDD can be practically realized.
This realization of these benefits is borne of a three-pronged approach. First, organizations leverage their
OO experts across more junior teams through the systematic up-front application of Design Patterns to
create flexible and testable software architectures. Second, development teams build unit tests focusing
on those areas of the system that provide disproportionate value. Third, the testability of the architecture
enables efficient creation of new unit tests during maintenance and extension cycles, thereby allowing the
suite of unit tests, and the test coverage, for the system to increase over time.
579

References
[Beck 2004] Kent Beck, Extreme Programming Explained: Embrace Change, 2nd
Edition, Addison-
Wesley Professional, 2004
[Fowler 2003] Martin Fowler, Patterns of Enterprise Application Architecture, Addison Wesley, 2003
[GoF 1995] Erich Gamma, Richard Helm, Ralph Johnson, and John Vlissides, Design Patterns:
Elements of Reusable Object-Oriented Software, Addison Wesley, 1995
[Larman 2002] Larman, Craig, Applying UML and Patterns: An Introduction to Object-Oriented
Analysis and Design and the Unified Process, Prentice Hall, 2002
[Martin 2003] Martin, Robert C., Agile Software Development, Principles, Patterns, and Practices,
Prentice Hall, 2003
[Meyer 1997] Meyer, Bertrand, Object-Oriented Software Construction, 2nd
Edition, Prentice Hall, 1997
[Weiskotten 2006] Weiskotten, Jeremy, Dependency Injection & Testable Objects, Dr. Dobb’s Portal,
http://www.ddj.com/development-
tools/185300375;jsessionid=KPI4SPK1B4MXQQSNDLPSKH0CJUNN2JVN?_requestid=457658 2006
580

Scaling Quality
Rob Fagen
Currently the quality assurance manager for the Netflix website, Rob has been involved in
software development for 30 years. His first programming experience was when he learned to
program in BASIC on a TRS-80. This was at a Radio Shack store he used to ride his bike to on
weekends while growing up in Scottsdale, Arizona. He now has a desk and a computer of his
own at home.
In his professional career of just over 20 years, he has been a developer, a system and database
administrator, several flavors of software contractor and a publisher. Through it all, he’s always
gravitated towards a software quality role.
Abstract
When we develop software to support our business’ customers, we hope to make our products
successful. We want to build software that will: be used, make user’s lives easier, do what it is
supposed to do, and perform acceptably. If we are fortunate enough to be successful, the user
base grows, and we have to learn how to scale the systems to support the increasing load.
Everyone knows the three key subjects to study to deliver scalable software: design, coding and
testing. However, there’s a fourth scalability subject that’s often overlooked. That is scaling the
development and quality teams themselves.
With more cooks in the kitchen, the development environment needs to evolve. Communication
within the organization has to move past the ‘prairie-dogs popping over the cubicle wall’ style.
The code base has to be organized so that functional teams can build, test and deploy
independently. Most importantly, the new process needs to stay as nimble as the process that
fostered your current success. The pace of business innovation and deployment of systems to
support it cannot be bogged down by process and bureaucracy.
Software tools that deliver operational insight and continuous testing aid and inform how the
product is developed and delivered at all levels: product management, design, server
engineering, production engineering, operations, and of course, quality assurance. This paper
examines how Netflix has navigated between the Scylla of growing system demands and the
Charybdis of chaos at the hands of ever-larger teams.
581

Introduction
Some organizations become victims of their own success. Instincts that serve a startup team well
can cause problems in a larger team if careful attention isn’t paid to how things are done as an
organization grows. Deployability will not scale where the development engineer is also the QA,
configuration, release and operations engineer. As the systems increase and grow and more
people are working together on them, it becomes less likely that the organization can deploy
code that “worked on my box.”
The Environment
People
The corporate culture at Netflix is all about High Performance. As the company has grown, the
management team’s most important task has been to find and nurture star performers. As the
complexity and volume of work increases, there are two ways to grow to meet the challenge of
getting more done.
One is to add reasonably competent junior people (who are plentiful) and layers of management
to guide them. As the number of people and the layers of management grow, the complexity,
interconnections and overhead of coordination grows even faster. This leads to chaos. The usual
response to the pain resulting from chaos is more rules and more process. More process requires
more people to do the “real” work alongside an ever increasing volume of process work. This
leads to diminishing returns for each addition to the team.
The alternative is to find and hire senior engineers (who are scarce) who can handle increasing
complexity without the need for close supervision or rigid process. This allows the organization
to scale more efficiently. The time and effort needed to hire is significantly greater when hiring
only people that raise the performance bar. This is true because you’re recruiting out of a smaller
pool to start with. It’s also true that as you raise the bar with each successive hire, you’re further
shrinking the pool for the next hire. However, it’s the more effective way to meet the challenge
of increasing complexity because you minimize the additional coordination cost and maximize
the additional work done per person added to the team.
The consequences of this approach are openly communicated to all job candidates from the very
beginning of their job search at Netflix. Reason number six on the company website’s “8 great
reasons to work at Netflix” page states:
“At Netflix, adequate performance gets a generous severance package.”1
Here, the expectation is set immediately that there is no safe haven, that there is no cushy corner
you can expect to hide in that you’ll be able to retire from. In a High Performance culture,
everyone needs to be contributing to the bottom line all of the time. Anyone not pushing the
envelope of their discipline can expect to be replaced by someone that will.
1
Netflix. 2007. “8 Great Reasons to Work at Netflix.” Retrieved June 25, 2007
(http://www.netflix.com/Jobs?id=5366#reason6) .
582

Pace of Innovation
Rapid change is in the DNA of Netflix. We use agile processes, not necessarily any particular
brand of Agile Process. It’s a core competitive advantage to be able to deploy new features and
functions every two weeks. This presents a significant challenge to both the work and mentality
of the quality assurance team. In some ways, the most important skill of a QA engineer isn’t her
ability to test, but her ability to decide what to test. We focus our limited testing resources on
those changes that present the largest risk to the business. This means that we rely on our ability
to: quickly detect bugs in production, find the root cause, correct the problem and deploy the fix
to handle those defects not detected before deployment. A great luxury of being a web based
application is that deploying new code is transparent to users and immediately fixes the problem
for the entire user base. Contrast this with the world of shrink-wrap software, where a new
release means shoving around a big pile of atoms (CDs, boxes, documentation, etc.) and not just
bits. Even in the case of electronically delivered patches, you have to solve a number of
problems with delivery, authentication and authorization that are free when your core business
revolves around a website.
Nimble Processes
If you run with scissors and you trip, you have to be good at recovering. The ability to change
the application so often is a double-edged sword. Repeated success with short release cycles
trains business owners to rely on vision becoming working code in record time. Keeping serious
defects at bay can become a challenge when the flow of requirements becomes too mercurial.
However, this nimbleness is a great competitive advantage because you can quickly react to
changes in the market. More importantly, you can also quickly iterate on proposed improvements
to the service. With these costs and benefits in mind, experimentation has become the core value
driving how Netflix continuously improves the website and supporting systems.
We test not only the quality of the software, but the quality of the members’ experience. In the
process of creating any given feature, we will develop variations on how it works, and test those
variations on prospective, new and existing members before rolling them out as the standard
experience. We instrument code to collect metrics around whatever member behavior that
feature is supposed to drive, and we pick the version with the biggest lift in the desired behavior.
The ability to assess all of the variations during the QA cycle becomes a great challenge. To that
end, developers build in URL-parameter based hooks and other shortcuts that a software tester
can use to force the presentation of a given customer experience. Manual and automated
software tests can reproducibly verify specific versions of a member experience without lengthy
set up and tear down operations in the database or a long series of UI interactions.
By being good at creating and verifying partitioned customer experiences (A/B tests), we can:
• understand what is important to the users
• understand how well we’ve addressed those needs
• iterate quickly, honing in on the most relevant and rewarding solutions
In order to support this degree of experimentation across a growing number of functional silos,
it’s important to have tools that let us walk through the exponentially growing number of
variations of: browser, feature, test cell and customer state. To that end, we’re using the
Selenium framework to test different presentations of customer experiences undergoing A/B
583

testing.2
This allows us to programmatically walk through the same basic flows while validating
that all customers will have the correct experience.
Selenium is a powerful framework for testing browser based applications. Being written in
JavaScript and running in the actual target browser, any test scripts will have access to all of the
components that make up the rendered page. The inherent power of this model can be leveraged
by judicious design and development of the code that creates the user interface. By providing a
clear and consistent framework for rendering the site, it becomes simpler to discover and verify
that the right content is being displayed in the right places on the page.
By providing a ‘real end-user browser experience’ to test against, and by providing tools as part
of the website itself to drive a test into a specific user experience, one set of scripts can verify
that common functionality doesn’t break, even across many variations of the user experience.
Scaling Systems
Components
In the beginning, everything lived in the web application, all of the classes were available to each
other, and that was good enough. Then, the needs of the application grew. There were more
features, customers and movies. A monolithic application could no longer scale. This was not
good. The testability of the application was impaired because in order to test anything, you had
to spin up the whole web server and all of its supporting components.
As the computational needs of different parts of the application have become more intense, the
carrying capacity of an individual web server in terms of the number of simultaneous customers
has shrunk. Upgrading the web server hardware has helped expand capacity in counterpoint to
this trend. Migrating to a 64-bit OS and JVM helped to crack the 1.6GB effective maximum heap
size imposed by the 2Gb process space limit of a 32 bit OS. However, as Parkinson’s Law3
has
been applied, the base heap consumption of a web server immediately following startup has risen
from on the order of 400mb to on the order of 2GB. A ‘fully loaded’ 32 bit server carrying 1,600
customer sessions consumed approximately 1.2GB of the 1.6GB available. When the application
first migrated from 32 bit to 64 bit, the 8GB heap was able to comfortably support up to 6,400
customer sessions. This has dwindled over the last year down to 2,400 customer sessions per
server as the per-customer data used to customize the site presentation and the computational
cost of that customization have grown.
A major effort is underway to abstract business logic out of the core web application into
dedicated middle-tier servers. This is in order to meet the challenges of greater data volumes,
more personalization and more customers. This will enable improved scalability of the web
application, and improved testability of the business logic that drives the web application. It will
improve the scalability of the application because individual components serving individual
functions can be horizontally scaled. Testability of the business logic is improved because the
presentation layer will reside in the front-end and all business logic must be accessed through a
well defined API.
2
http://www.openqa.org/selenium/
3
Wikipedia. 2007. “Parkinson’s Law”. Retrieved June 26, 2007 (http://en.wikipedia.org/wiki/Parkinson's_law)
584

Operational Insight
When many developers are modifying the same code base, you cannot foresee and test all of the
possible interactions. This is why it is important to build the application on a foundation of
insight into the runtime operating environment. For example, developers have built a ‘tracer’
class that can be used to instrument method calls. The data gathered and summarized in hourly
buckets includes:
• minimum, maximum and mean execution time
• the number of executions
• a histogram for the number of executions taking <10 milliseconds, 10-50 msec, 50-100
msec, and on up to > 10 seconds.
Tools like these can be used both during the QA cycle and during the triage of production
problems. The ability to see what’s going on inside the system at production runtime is
invaluable in recovering quickly and effectively from performance issues. It is also invaluable in
understanding the change in the performance profile of an application over time.
Scaling Teams
Team Communications
Four years ago, the web quality assurance team was four QA engineers and a manager. This was
the only QA team in the company at the time. Back end systems developers did their own
testing. The web QA manager was also in charge of the engineers who built the user interface of
the website. There were three functional silos and everyone working on the website was on the
same wing of the same floor. There was even room for the data warehouse team in the same
space. The QA engineers and production engineers were sitting in the middle of the developers
for their silo, along with the product managers for that silo. If there were questions or
clarifications, they were to be had by sticking your head up over the cubicle wall and asking.
Fast forward four years, and what was Web Engineering is now Product Development. This team
now covers two floors of a much larger building, split into twelve different functional silos. The
three QA teams have three managers, fourteen QA engineers (with open requisitions) and a
configuration and release engineer. A separate QA team for the back end systems has also grown
from non-existence to eight members. Six product managers and six designers provide work for
the functional silos, but now they’re all sitting clustered together instead of living with their
teams. The QA engineers and eight production engineers are still sitting among the developers
they support, but there are many more developers being supported. The number of interested
parties has grown, but the number of interconnections has grown faster. As the QA engineers
have become more specialized, the need to share expertise with peers has become more critical.
Component Organization
With a monolithic web application and many development teams, coordination becomes a major
source of overhead. Push schedules across the different functional silos must be coordinated
because tightly coupled classes and business logic spread across the web application and the
database require that we deploy the whole world at once. To allow functional silos to push when
they’re ready instead of all pushing at the same time, we must break down the monolith into
independent services running in separate processes on separate machines. This enforces
585

encapsulation, reduces coupling and increases the cohesion of each service. This allows for more
focused triage in the event of a system issue. If something melts down, only the team responsible
for the problem area has to stop new development work to figure it out.
QA Team Organization
Four years ago, every QA engineer on the team did everything:
• tested features
• built and shared what test automation and tools that we had
• shared responsibility for builds
• shared responsibility for deployments
• pitched in on production monitoring tools and triage of site emergencies
An experiment in the fall of 2004 spun out the tool building and test automation function into a
dedicated role. That experiment met with some limited successes, and still shows promise for
future investment. We have gained some traction in having:
• a consistently running nightly regression
• a greater awareness among developers of the need for unit tests
• a greater focus on capturing QA’s expertise in automated tests instead of tribal
knowledge
In the fall of 2005, another experiment dedicated one person to configuration and release duties.
That experiment has been a complete success. The tool of yesterday was a Word document
describing all of the manual steps needed to build, deploy and restart a web server from the
command line of each server in the farm. The tool of today allows for selection of a particular
build from a particular branch with push-button build, deploy and restart, on multiple QA or
production servers simultaneously, all triggered and monitored from a simple and intuitive web
interface.
Now, every QA engineer can spend their time focused on the tasks that maximize the mitigation
of business risk:
• testing features
• building automated tests
• pitching in on production monitoring tools and triage of site emergencies
It’s time for another experiment. The team has grown from three full time engineers and a hands-
on manager to ten engineers and a full-time manager. The single manager has become a choke-
point for all of the relevant information that needs to flow from the development teams through
QA to the operational teams. To address this, splitting the team is proposed.
Instead of a single QA organization concerned with the health of the entire website, two teams
are formed, each focused on one aspect of the whole. The first is concerned with “Customers”
and the second is concerned with “Movies”. The Customer team has responsibility for all parts of
the system that are about the subscribers: signing them up, maintaining their account information
and queues, Customer Service tools and managing who they associate with via the Friends
feature. The Movie team has responsibility for all parts of the system that are about the movies:
merchandising, metadata (titles, actors, inventory levels, etc.), ratings, recommendations and
instant viewing.
586

Within these teams there is still the issue of solving the business problem of more engineers
producing more code deployed as more components. To address this, a virtual split of the two
QA teams is proposed. This is a further specialization within each sub-team, but not
specialization by functional area. This split will focus the orientation of the QA engineers into
two areas: functional QA and operational QA.
These are not job descriptions for which specific engineers are hired to do each type of testing.
The following table describes more the nature of a tester and how they approach their job within
the context of a particular functional silo.
Attribute Functional Operational
Testing Perspective Inward looking (back towards
the developers and product
managers)
Outward looking (forward
towards the NOC and the
production systems)
Testing Focus Reviews changes at the feature
and functional level
Reviews changes at the system
level and integrated systems
level
Guardian of… … the member experience … business continuity
Strongest Testing Style Black box, but not necessarily
all black box testing
White box, but also production
monitoring and production
operational tools
Answers the question… “Does it do what we said we
want it to do?”
“Will this behave how we need
it to when we roll it out?”
Bonus Points Build tools to help figure out how to fix the system when we
find that we answered these questions incorrectly.
The expected benefits are:
1. Each sub-team improves their load sharing among the team members by raising
awareness of these two sets of attributes within the role of each QA engineer. Each team
member identifies their strengths and weaknesses relative to these attributes and seeks
other team members to shore up their weak points.
2. Each sub-team is able to better identify risks to the business from each major functional
area because of the many eyes on the narrowed but shared focus (Customer vs. Movies).
3. Each sub-team is able to flexibly distribute testing load over a given push cycle without
negotiations at the level of the functional silo engineering managers having to take place.
The intent is not to remove the barriers between the functional silos, but to lower them. If you
compare this to college, every QA engineer should have a Major which corresponds to her
functional silo, and she also has a Minor within the Customer or Movie teams that they can pitch
in on when there is more business risk in someone else’s area. This proposal lets the QA
engineers more flexibly address areas where the most business risk exists within a smaller, more
focused team instead of trying to allocate resources and cross train for the whole site.
587

Conclusion
As a software product grows, development organizations face challenges that grow as fast or
faster. Blindly throwing more people at these challenges can result in a tangled mess of toes
being trod upon and defects slipping into production. Throwing intelligent people that know how
to get things done at these challenges can delay the day of reckoning. This solution relies on
personal heroics and sheer talent. However, the scalable solution is to use these talented people
to decompose the problem in two dimensions. First, simplify the application by breaking it down
into smaller units that can be tested in an automated fashion and can independently move
forward as the part of the business it serves needs it to. Second, simplify the team by breaking
down into smaller units focused on individual components instead of the whole system.
A lot can be learned from movies. For example, there are lessons to be found in The Wizard of
Oz that can be applied to how to scale a software quality team. Dorothy is a perfect example of
what can be done with a small team. She starts out all alone, lost and bewildered in a land that
someone else has built. She does what any good QA engineer would do: she starts asking
intelligent questions. Along the way, she builds a team that has all the right skills to solve a
variety of problems, where the strengths and weaknesses of the team members all compliment
each other. Eventually, the team gets to where she thinks it needs to be. They’ve reached the
oracle that knows all the answers and can fix all their problems. However, she then learns that
her journey has just begun. This all powerful wizard she’s been seeking out is merely a clever
man who built an automated system so as to appear oracular. Dorothy wakes from her dream
just as the real fun in Oz starts, where real problems get solved in a repeatable manner by
attacking the most important ones in an intelligent fashion.
588

Proceedings Order Form Pacific Northwest Software Quality Conference
Proceedings are available for the following years. Circle year for the Proceedings that you would like to order. 2006 2005 2004 2003 2002 2001 2000
To order a copy of the Proceedings, please send a check in the amount of $35.00 each to: PNSQC/Pacific Agenda PO Box 10733 Portland, OR 97296-0733
Name_________________________________________
Affiliate________________________________________
Mailing Address__________________________________
City______________________State_____Zip__________
Phone_________________________
Using the Electronic Proceedings Once again, PNSQC is proud to produce the Proceedings in PDF format. Most of the papers from the printed Proceedings are included as well as some slide presentations. We hope that you will find this conference reference material useful.
Download PDF – 2006, 2005, 2004, 2003, 2002, 2001, 2000, 1999
The 2007 Proceedings will be posted on our website in November 2007.
Copyright You can print articles or slides for your own private use, but remember they are copyright to the original author. You cannot redistribute the Acrobat files or their printed copies. If you need extra copies of the printed or electronic Proceedings please contact Pacific Agenda at [email protected].