
Software Engineering Lectures
140
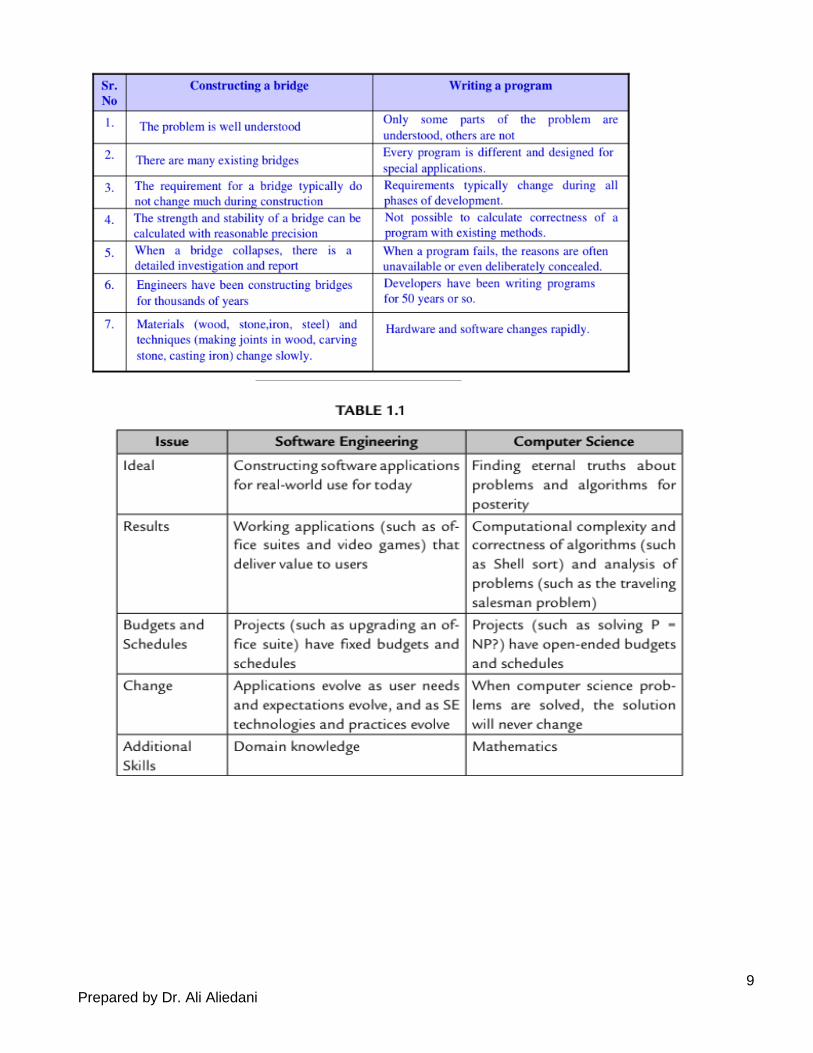
1 Prepared by Dr. Ali Aliedani Software Engineering Lectures 1- Introduction 1.1 definitions • Engineering is the use of scientific principles to design and build machines, structures, and other items, including bridges, tunnels, roads, vehicles, and buildings. • Definition of software given by the IEEE: Software is the collection of computer programs, procedure rules and associated documentation and data. Software includes: (i) Instructions (computer programs) that when executed provide desired functions and performance. (ii) Data structures that enable the programs to adequately manipulate information. (iii) Documents that describe the operation and use of the programs. Figure 1.1 List of documentation manuals
-
Upload
khangminh22 -
Category
Documents
-
view
1 -
download
0
Transcript of Software Engineering Lectures

1 Prepared by Dr. Ali Aliedani
Software Engineering Lectures
1- Introduction
1.1 definitions
• Engineering is the use of scientific principles to design and build machines, structures, and other
items, including bridges, tunnels, roads, vehicles, and buildings.
• Definition of software given by the IEEE:
Software is the collection of computer programs, procedure rules and associated documentation and data.
Software includes:
(i) Instructions (computer programs) that when executed provide desired functions and performance.
(ii) Data structures that enable the programs to adequately manipulate information.
(iii) Documents that describe the operation and use of the programs.
Figure 1.1 List of documentation manuals
2 Prepared by Dr. Ali Aliedani
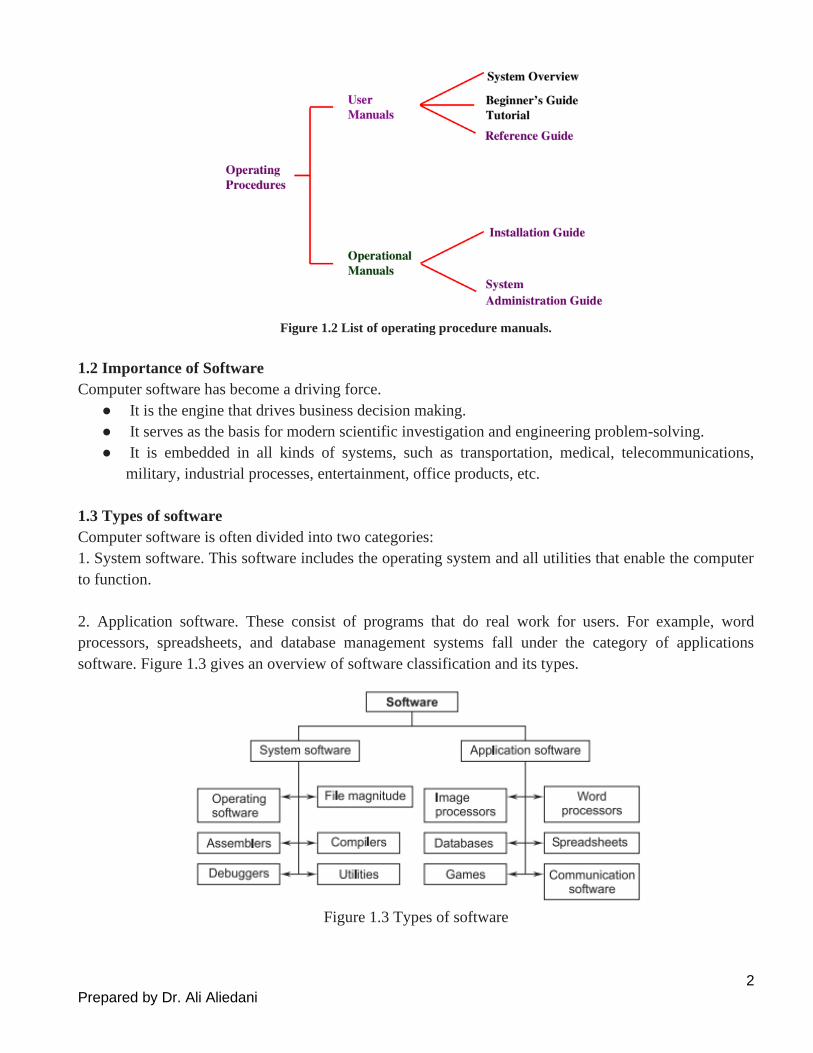
Figure 1.2 List of operating procedure manuals.
1.2 Importance of Software
Computer software has become a driving force.
● It is the engine that drives business decision making.
● It serves as the basis for modern scientific investigation and engineering problem-solving.
● It is embedded in all kinds of systems, such as transportation, medical, telecommunications,
military, industrial processes, entertainment, office products, etc.
1.3 Types of software
Computer software is often divided into two categories:
1. System software. This software includes the operating system and all utilities that enable the computer
to function.
2. Application software. These consist of programs that do real work for users. For example, word
processors, spreadsheets, and database management systems fall under the category of applications
software. Figure 1.3 gives an overview of software classification and its types.
Figure 1.3 Types of software

3 Prepared by Dr. Ali Aliedani
1.4 CLASSES OF SOFTWARE
Software is classified into the following two classes:
1. Generic Software. Generic software is designed for a broad customer market whose requirements are
very common, fairly stable, and well-understood by the software engineer.
2. Customized Software. Customized products are those that are developed for a customer where domain,
environment, and requirements are unique to that customer and cannot be satisfied by generic products.
1.5 INTRODUCTION TO SOFTWARE ENGINEERING
IEEE Comprehensive Definition. Software Engineering is the application of a systematic, disciplined,
quantifiable approach to the development, operation and maintenance of software, i.e., the application of
engineering to software.
or
Software Engineering is the application of methods and scientific knowledge to create practical cost-
effective solutions for the design, construction, operation and maintenance of software.
1.6 SOFTWARE CHARACTERISTICS
1. Most software is custom-built, rather than assembled from existing components.
2.Software is developed or engineered; it is not manufactured in the classical sense.
3. Software is flexible. We all feel that software is flexible. A program can be developed to do almost
anything.
4. Software doesn’t wear out. There is a well-known “bath-tub curve” in reliability studies for hardware
products. Figure 1.4 depicts the failure rate as a function of time for hardware.
Figure 1.4 Bath-tub Curve
4 Prepared by Dr. Ali Aliedani
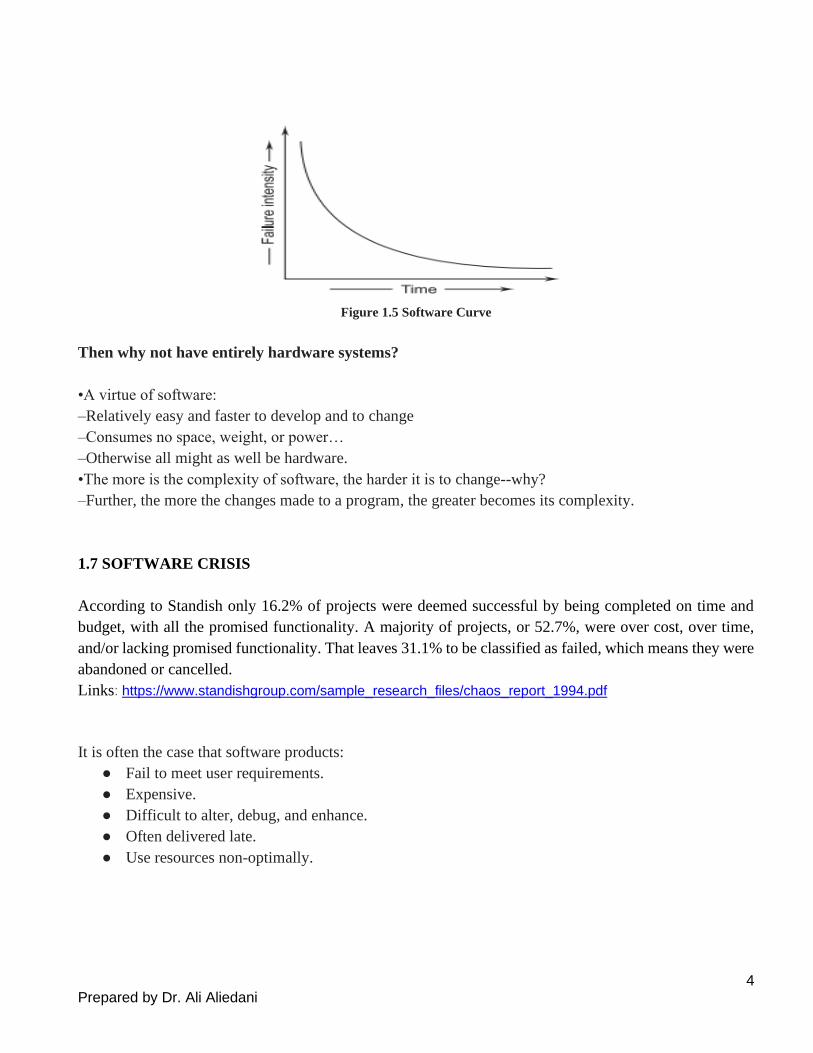
Figure 1.5 Software Curve
Then why not have entirely hardware systems?
•A virtue of software:
–Relatively easy and faster to develop and to change
–Consumes no space, weight, or power…
–Otherwise all might as well be hardware.
•The more is the complexity of software, the harder it is to change--why?
–Further, the more the changes made to a program, the greater becomes its complexity.
1.7 SOFTWARE CRISIS
According to Standish only 16.2% of projects were deemed successful by being completed on time and
budget, with all the promised functionality. A majority of projects, or 52.7%, were over cost, over time,
and/or lacking promised functionality. That leaves 31.1% to be classified as failed, which means they were
abandoned or cancelled.
Links: https://www.standishgroup.com/sample_research_files/chaos_report_1994.pdf
It is often the case that software products:
● Fail to meet user requirements.
● Expensive.
● Difficult to alter, debug, and enhance.
● Often delivered late.
● Use resources non-optimally.
5 Prepared by Dr. Ali Aliedani
1.7.1 Causes
● The quality of the software is not good because most developers use historical data to develop the
software.
● If there is delay in any process or stage (i.e., analysis, design, coding & testing) then scheduling
does not match with actual timing.
● Communication between managers and customers, software developers, support staff, etc., can
break down because the special characteristics of software and the problems associated with its
development are misunderstood.
● The software people responsible for tapping the potential often change when it is discussed and
resist change when it is introduced.
1.7.2 Factors are Contributing to the Software Crisis
● Larger problems,
● Poor project management
● Lack of adequate training in software engineering,
● Increasing skill shortage,
● Low productivity improvements.
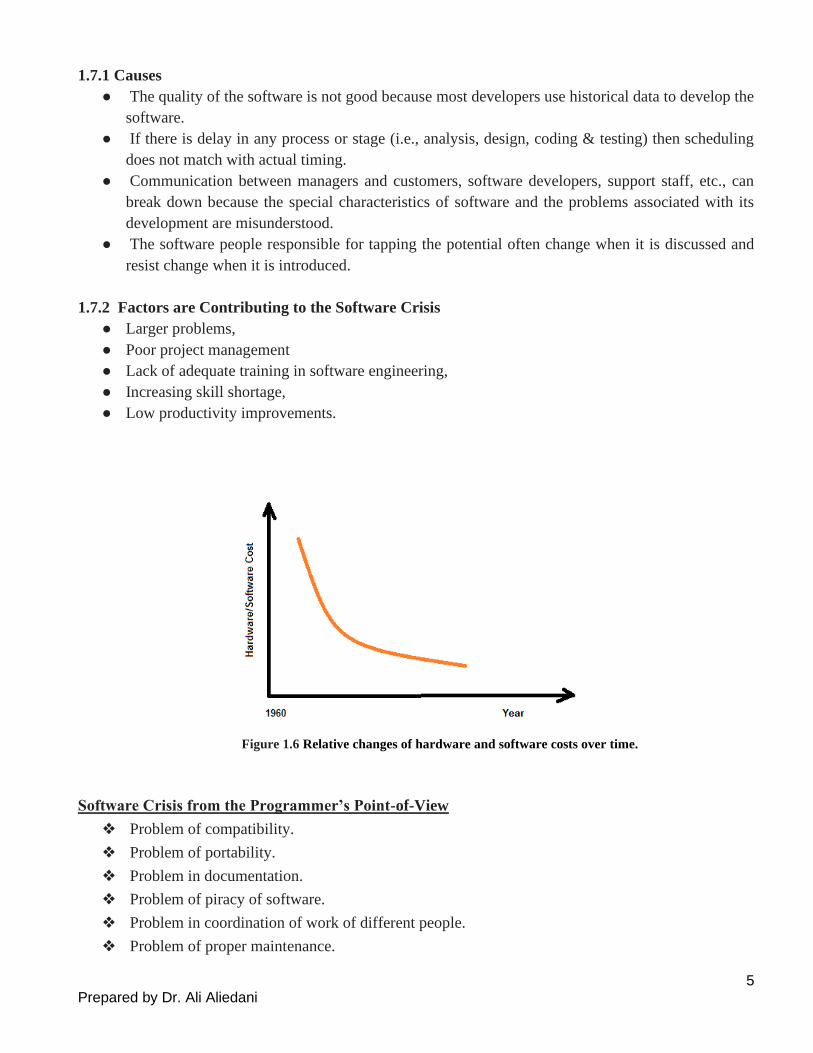
Figure 1.6 Relative changes of hardware and software costs over time.
Software Crisis from the Programmer’s Point-of-View
❖ Problem of compatibility.
❖ Problem of portability.
❖ Problem in documentation.
❖ Problem of piracy of software.
❖ Problem in coordination of work of different people.
❖ Problem of proper maintenance.

6 Prepared by Dr. Ali Aliedani
Software Crisis form the User’s Point-of-View
● Software cost is very high.
● Hardware goes down.
● Lack of specialization in development.
● Problem of different versions of software.
● Problem of views.
● Problem of bugs.
1.7.3 Examples
1- Y2K problem:
It was simply the ignorance about the adequacy or otherwise of using only last two digits of the
year.
The 4-digit date format, like 1964, was shortened to 2-digit format, like 64.
Links: https://www.nationalgeographic.org/encyclopedia/Y2K-bug/#:~:text=Powered%20by-
,The%20Y2K%20bug%20was%20a%20computer%20flaw%2C%20or%20bug%2C%20that,date
s%20beyond%20December%2031%2C%201999.&text=When%20complicated%20computer%2
0programs%20were,%2219%22%20was%20left%20out.
2- Ariane 5
It took the European Space Agency 10 years and $7 billion to produce Ariane 5, a giant rocket capable of
hurling a pair of three-ton satellites into orbit with each launch and intended to give Europe overwhelming
supremacy in the commercial space business.
The rocket was destroyed after 39 seconds of its launch, at an altitude of two and a half miles along with
its payload of four expensive and uninsured scientific satellites.
3- Windows XP
o Microsoft released Windows XP on October 25, 2001.
o On the same day company posted 18 MB of compatibility patches on the website for bug fixes,
compatibility updates, and enhancements.
o Two patches fixed important security holes.
This is Software Engineering.

7 Prepared by Dr. Ali Aliedani
1.8 Why study software engineering
1- To acquire skills to develop large programs
- Handling exponential growth in complexity with size
- Systematic techniques based on abstraction (modelling) and decomposition.
2- Learn systematic techniques of:
- specification, design, user interface development, testing, project management, maintenance, etc.
- appreciate issues that arise in team development
3- To acquire skills to be a better programmer
- Higher productivity
- Better quality programs
1.9 SOFTWARE-ENGINEERING PROCESSES
1.9.1 Process
A process is a series of steps involving activities, constraints, and resources that produce an intended output
of some kind.
Any process has the following characteristics:
● The process prescribes all of the major process activities.
● The process uses resources, subject to a set of constraints (such as a schedule), and produces
intermediate and final products.
● The process may be composed of sub-processes that are linked in some way. The process may be
defined as a hierarchy of processes, organized so that each sub-process has its own process model.
● Each process activity has entry and exit criteria, so that we know when the activity begins and
ends.
● The activities are organized in a sequence, so that it is clear when one activity is performed relative
to the other activities.
● Every process has a set of guiding principles that explain the goals of each activity.
● Constraints or controls may apply to an activity, resource, or product. For example, the budget or
schedule may constrain the length of time an activity may take or a tool may limit the way in which
a resource may be used.
1.9.2 What is a Software Process?
A software process is the related set of activities and processes that are involved in developing and evolving
a software system.
OR
A set of activities whose goal is the development or evolution of software.
8 Prepared by Dr. Ali Aliedani
These activities are mostly carried out by software engineers. There are four fundamental process activities,
which are common to all software processes. These activities are:
1. Software specifications: The functionality of the software and constraints on its operation must be
defined.
2. Software development: Software that meets the specifications must be produced.
3. Software validation: The software must be validated to ensure that it does what the customer wants.
4. Software evolution: The software must evolve to meet changing customer needs.
1.10 Some Terminologies
● Deliverables and Milestones
Different deliverables are generated during software development. The examples are source code, user
manuals, operating procedure manuals etc.
The milestones are the events that are used to ascertain the status of the project. Finalization of specification
is a milestone. Completion of design documentation is another milestone. The milestones are essential for
project planning and management.
● Product and Process
Product: What is delivered to the customer, is called a product. It may include source code, specification
document, manuals, documentation etc. Basically, it is nothing but a set of deliverables only.
Process: Process is the way in which we produce software. It is the collection of activities that leads to (a
part of) a product. An efficient process is required to produce good quality products.
If the process is weak, the end product will undoubtedly suffer, but an obsessive over reliance on process
is also dangerous.
● Productivity and Effort
Productivity is defined as the rate of output, or production per unit of effort, i.e. the output achieved with
regard to the time taken but irrespective of the cost incurred.
Hence most appropriate unit of effort is Person Months (PMs), meaning thereby number of persons
involved for specified months. So, productivity may be measured as LOC/PM (lines of code
produced/person month).
9 Prepared by Dr. Ali Aliedani

10 Prepared by Dr. Ali Aliedani
2- SOFTWARE-DEVELOPMENT LIFE-CYCLE MODELS
The software-development life-cycle is used to facilitate the development of a large software product in a
systematic, well-defined, and cost-effective way.
The software development life-cycle can be divided into 5-9 phases, i.e., it must have a minimum of five
phases and a maximum of nine phases. On average it has seven or eight phases. These are:
2.1 1- Build & Fix Model
● Product is constructed without specifications or any attempt at design
● Adhoc approach and not well defined Simple two-phase model
Figure 2.1 Build and Fix model
❖ Suitable for small programming exercises of 100 or 200 lines
❖ Unsatisfactory for software for any reasonable size
❖ Code soon becomes unfixable & enhanceable
❖ No room for structured design
❖ Maintenance is practically not possible
2.2 WATERFALL MODEL
The waterfall model is a very common software development process model. The waterfall model was
popularized in the 1970s and permeates most current software-engineering textbooks and standard
industrial practices.
The waterfall model is illustrated in Figure 2.2. Because of the cascade from one phase to another, this
model is known as the waterfall model or software lifecycle, where the output of one phase constitutes the
input to the next one. The phases shown in the figure are the following:
● Feasibility study
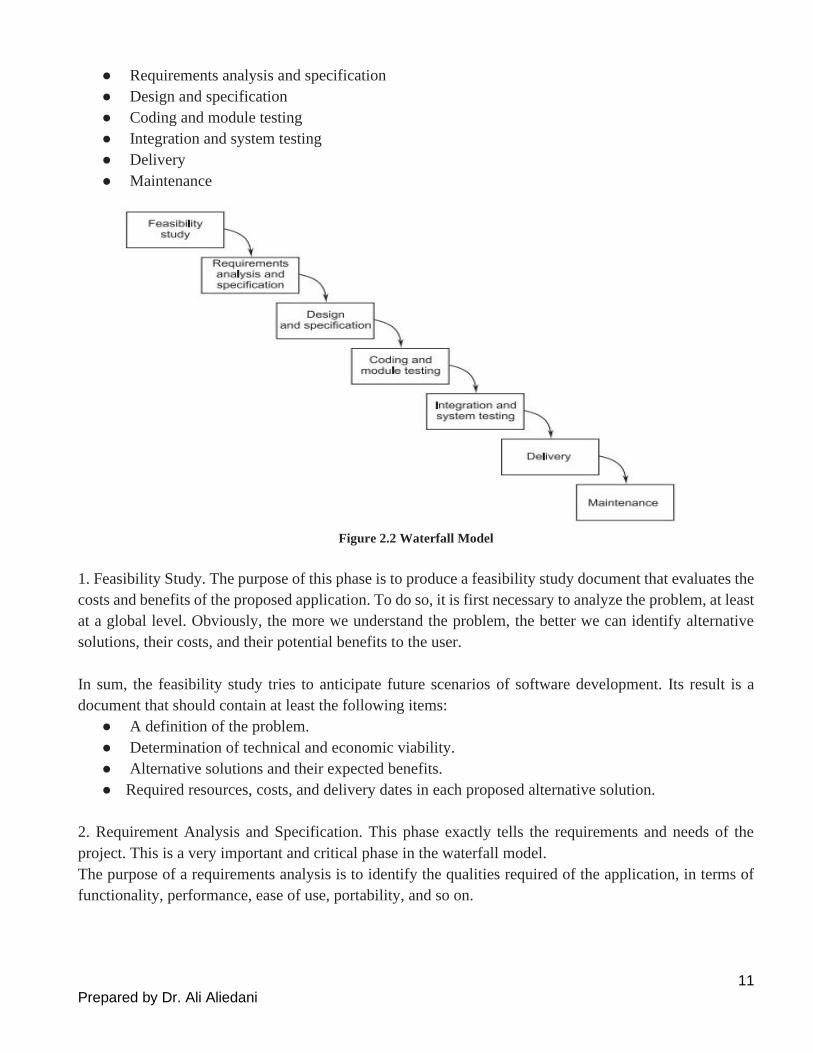
11 Prepared by Dr. Ali Aliedani
● Requirements analysis and specification
● Design and specification
● Coding and module testing
● Integration and system testing
● Delivery
● Maintenance
Figure 2.2 Waterfall Model
1. Feasibility Study. The purpose of this phase is to produce a feasibility study document that evaluates the
costs and benefits of the proposed application. To do so, it is first necessary to analyze the problem, at least
at a global level. Obviously, the more we understand the problem, the better we can identify alternative
solutions, their costs, and their potential benefits to the user.
In sum, the feasibility study tries to anticipate future scenarios of software development. Its result is a
document that should contain at least the following items:
● A definition of the problem.
● Determination of technical and economic viability.
● Alternative solutions and their expected benefits.
● Required resources, costs, and delivery dates in each proposed alternative solution.
2. Requirement Analysis and Specification. This phase exactly tells the requirements and needs of the
project. This is a very important and critical phase in the waterfall model.
The purpose of a requirements analysis is to identify the qualities required of the application, in terms of
functionality, performance, ease of use, portability, and so on.

12 Prepared by Dr. Ali Aliedani
The requirements describe the “what” of a system, not the “how.” This phase produces a large document
and contains a description of what the system will do without describing how it will be done. The resultant
document is known as the software requirement specification (SRS) document.
An SRS document must contain the following:
● Detailed statement of problem.
● Possible alternative solution to problem.
● Functional requirements of the software system.
● Constraints on the software system.
3. Design and Specification. The goal of the design phase is to transform the requirements specified in the
SRS document into a structure that is suitable for implementation in some programming language. In
technical terms, during the design phase the software architecture is derived from the SRS document.
4. Coding and Module Testing. Coding and module testing is the phase in which we actually write programs
using a programming language. It was the only recognized development phase in early development
processes, but it is just one of several phases in a waterfall process. The output of this phase is an
implemented and tested collection of modules.
Coding can be subject to company-wide standards, which may define the entire layout of programs, such
as the headers for comments in every unit, naming conventions for variables and sub-programs, the
maximum number of lines in each component, and other aspects that the company deems worthy of
standardization.
Module testing is also often subject to company standards, including a precise definition of a test plan, the
definition of testing criteria to be followed (e.g., black-box versus white-box, or a mixture of the two), the
definition of completion criteria (when to stop testing), and the management of test cases. Debugging is a
related activity performed in this phase.
5. Integration and System Testing. During the integration and system testing phase, the modules are
integrated in a planned manner. Integration is normally carried out incrementally over a number of steps.
During each integration step, the partially integrated system is tested and a set of previously planned
modules are added to it. Finally, when all the modules have been successfully integrated and tested, system
testing is carried out. The objective of system testing is to determine whether the software system performs
per the requirements mentioned in the SRS document. This testing is known as system testing.
6. Delivery and Maintenance. The delivery of software is often done in two stages. In the first stage, the
application is distributed among a selected group of customers prior to its official release. The purpose of
this procedure is to perform a kind of controlled experiment to determine, on the basis of feedback from
users, whether any changes are necessary prior to the official release. In the second stage, the product is
distributed to the customers.
We define maintenance as the set of activities that are performed after the system is delivered to the
customer. Basically, maintenance consists of correcting any remaining errors in the system (corrective

13 Prepared by Dr. Ali Aliedani
maintenance), adapting the application to changes in the environment (adaptive maintenance), and
improving, changing, or adding features and qualities to the application (perfective maintenance).
Iterative Waterfall Model
We had pointed out in the previous section that in a practical software development project, the classical
waterfall model is hard to use. We had branded the classical waterfall model as an idealistic model.
The main change brought about by the iterative waterfall model to the classical waterfall model is in the
form of providing feedback paths from every phase to its preceding phases. The feedback paths introduced
by the iterative waterfall model are shown in Figure 2.3.
• There is no feedback path to the feasibility stage. This is because once a team having accepted to
take up a project, does not give up the project easily due to legal and moral reasons.
Figure 2.3 Iterative waterfall model
Advantages of Waterfall Model
The various advantages of the waterfall model include:
❖ It is a segmental model.
❖ It is systematic and sequential.
❖ It is a simple one.
❖ It has proper documentation.
Problems of waterfall model
i. It is difficult to define all requirements at the beginning of a project
ii. This model is not suitable for accommodating any change
iii. A working version of the system is not seen until late in the project’s life
● Incremental delivery not supported
14 Prepared by Dr. Ali Aliedani
● Phase overlap not supported: For most real life projects, it becomes difficult to follow the rigid
phase sequence prescribed by the waterfall model.
● Error correction unduly expensive: In waterfall model, validation is delayed till the complete
development of the software.
● Limited customer interactions: This model supports very limited customer interactions.
● No support for risk handling and code reuse: It becomes difficult to use the waterfall model in
projects that are susceptible to various types of risks, or those involving significant reuse of existing
development artifacts.
Note:
If strict phase transitions are maintained, then the team members who complete their work early
would idle waiting for the phase to be complete, and are said to be in a blocking state. Thus the
developers who complete early would idle while waiting for their team mates to complete their
assigned work. Clearly this is a cause for wastage of resources and a source of cost escalation and
inefficiency.
As a result, in real projects, the phases are allowed to overlap.
2.3 V-Model
A popular development process model, V-model is a variant of the waterfall model.
In this model verification and validation activities are carried out throughout the development life cycle,
and therefore the chances bugs in the work products considerably reduce. This model is therefore generally
considered to be suitable for use in projects concerned with development of safety-critical software that
are required to have high reliability.
As shown in Figure 2.4, there are two main phases—development and validation phases. The left half of
the model comprises the development phases and the right half comprises the validation phases.
Figure 2.4 V-model

15 Prepared by Dr. Ali Aliedani
Note:
In contrast to the iterative waterfall model where testing activities are confined to the testing phase
only, in the V-model testing activities are spread over the entire life cycle.
Advantages of V-model
● In the V-model, much of the testing activities (test case design, test planning, etc.) are carried out
in parallel with the development activities. Therefore, before the testing phase starts, a significant
part of the testing activities, including test case design and test planning, is already complete.
● The test team is reasonably kept occupied throughout the development cycle in contrast to the
waterfall model where the testers are active only during the testing phase.
● In the V-model, the test team is associated with the project from the beginning. Therefore they build
up a good understanding of the development artifacts, and this in turn, helps them to carry out
effective testing of the software.
When to use V Model
● Natural choice for systems requiring high reliability:
–Embedded control applications, safety-critical software
● All requirements are known up-front
● Solution and technology are known
Disadvantages of V-model
● Does not support overlapping of phases
● Does not handle iterations or phases
● Does not easily accommodate later changes to requirements
● Does not provide support for effective risk handling
Validation is the process of checking whether the specification captures the customer's needs,
while verification is the process of checking that the software meets the specification:
• Verification: Are we building the product right?
• Validation: Are we building the right product?
2.4 PROTOTYPING MODEL
This model suggests building a working prototype of the system, before development of the actual software.
A prototype is a toy and crude implementation of a system. It has limited functional capabilities, low
reliability, or inefficient performance as compared to the actual software.
Necessity of the prototyping model
• It is advantageous to use the prototyping model for development of the graphical user interface
(GUI) part of an application.
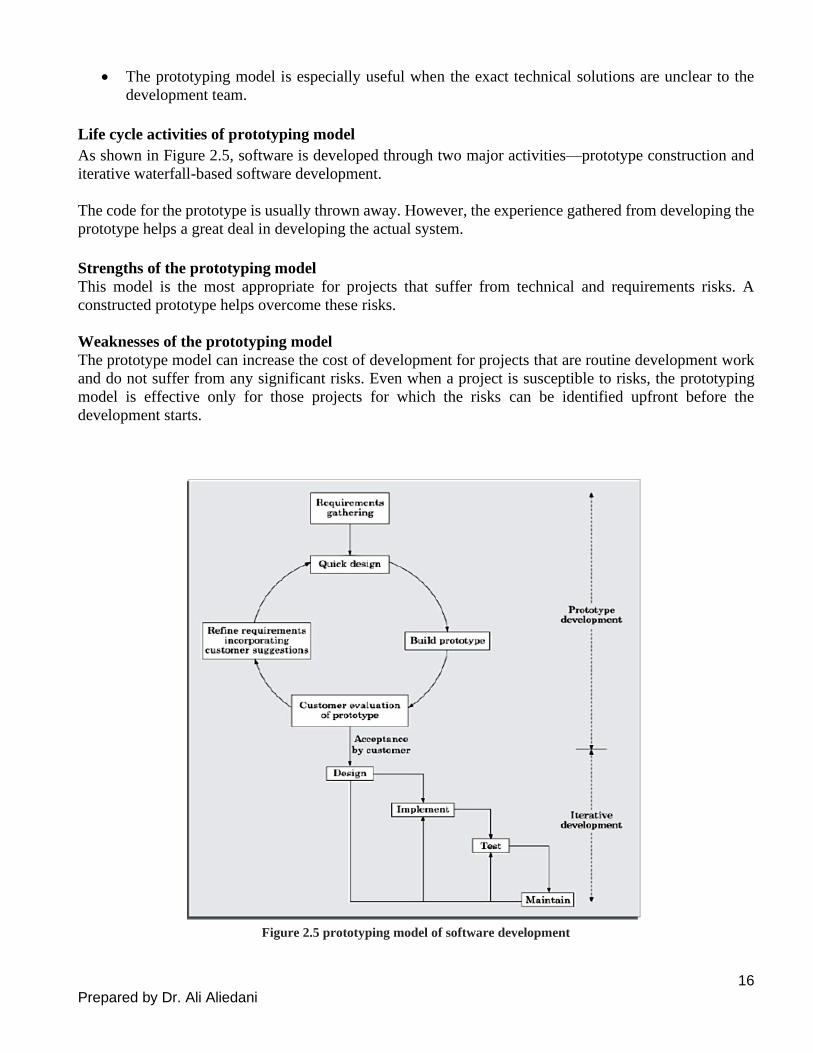
16 Prepared by Dr. Ali Aliedani
• The prototyping model is especially useful when the exact technical solutions are unclear to the
development team.
Life cycle activities of prototyping model
As shown in Figure 2.5, software is developed through two major activities—prototype construction and
iterative waterfall-based software development.
The code for the prototype is usually thrown away. However, the experience gathered from developing the
prototype helps a great deal in developing the actual system.
Strengths of the prototyping model
This model is the most appropriate for projects that suffer from technical and requirements risks. A
constructed prototype helps overcome these risks.
Weaknesses of the prototyping model
The prototype model can increase the cost of development for projects that are routine development work
and do not suffer from any significant risks. Even when a project is susceptible to risks, the prototyping
model is effective only for those projects for which the risks can be identified upfront before the
development starts.
Figure 2.5 prototyping model of software development

17 Prepared by Dr. Ali Aliedani
2.5 Incremental Development Model This life cycle model is sometimes referred to as the successive versions model and sometimes as the
incremental model. In this life cycle model, first a simple working system implementing only a few basic
features is built and delivered to the customer. Over many successive iterations successive versions are
implemented and delivered to the customer until the desired system is realised.
Figure 2.6 incremental software development
In the incremental life cycle model, the requirements of the software are first broken down into several
modules or features that can be incrementally constructed and delivered.
The incremental model is schematically shown in Figure 2.7. As each successive version of the software
is constructed and delivered to the customer, the customer feedback is obtained on the delivered version
and these feedbacks are incorporated in the next version.
• Waterfall: single release
• Iterative: many releases (increments)
–First increment: core functionality
–Successive increments: add/fix functionality
–Final increment: the complete product
• Each iteration: a short mini-project with a separate lifecycle
–e.g., waterfall
Advantages
The incremental development model offers several advantages. Two important ones are the following:
Error reduction: The core modules are used by the customer from the beginning and therefore these
get tested thoroughly. This reduces chances of errors in the core modules of the final product, leading
to greater reliability of the software.
Incremental resource deployment: This model obviates the need for the customer to commit large
resources at one go for development of the system. It also saves the developing organisation from
deploying large resources and manpower for a project in one go.

18 Prepared by Dr. Ali Aliedani
Figure 2.7 Incremental model of software development
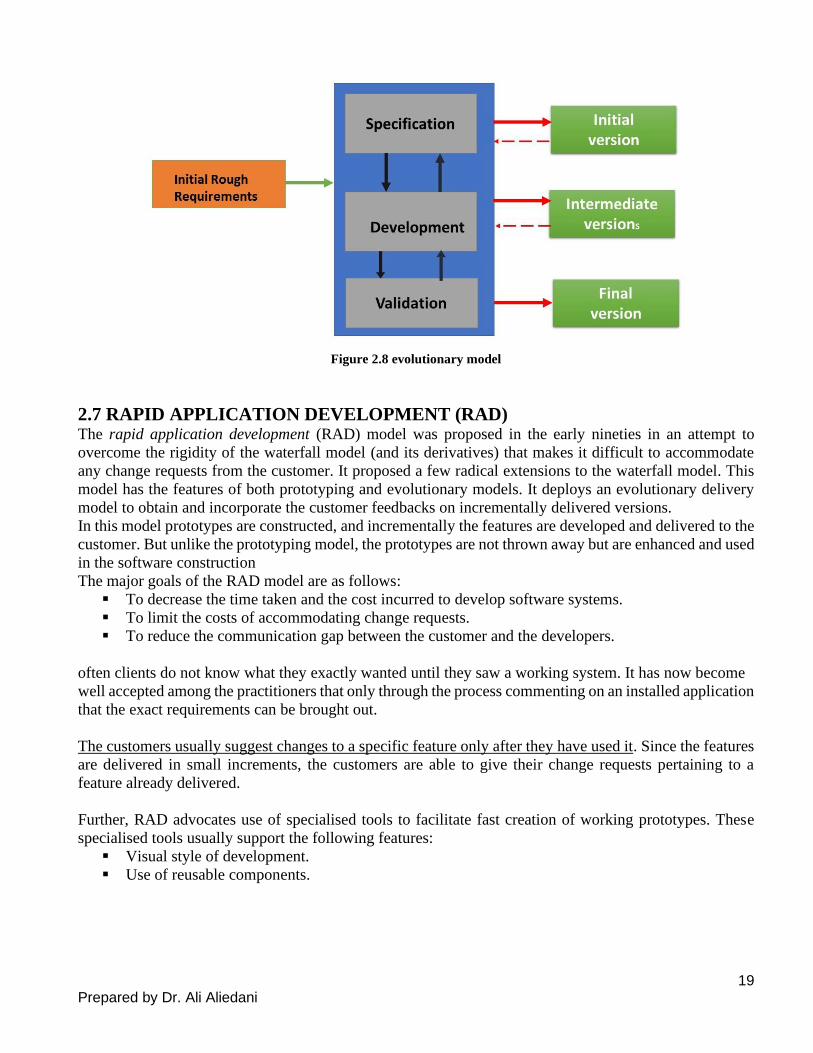
2.6 Evolutionary Model This model has many of the features of the incremental model. As in case of the incremental model, the
software is developed over a number of increments.
In the incremental development model, complete requirements are first developed and the SRS document
prepared. In contrast, in the evolutionary model, the requirements, plan, estimates, and solution evolve over
the iterations, rather than fully defined and frozen in a major up-front specification effort before the
development iterations begin. Such evolution is consistent with the pattern of unpredictable feature
discovery and feature changes that take place in new product development.
The evolutionary software development process is sometimes referred to as design a little, build a little,
test a little, deploy a little model. This means that after the requirements have been specified, the design,
build, test, and deployment activities are iterated. A schematic representation of the evolutionary model of
development has been shown in Figure 2.8.
Advantages
• Effective elicitation of actual customer requirements
• Easy handling changes requests
Disadvantages
• Feature division into incremental parts can be non-trivial: For many development projects,
especially for small-sized projects, it is difficult to divide the required features into several parts
that can be incrementally implemented and delivered.
• Ad hoc design: Since at a time design for only the current increment is done, the design can become
ad hoc without specific attention being paid to maintainability and optimality. Obviously, for
moderate sized problems and for those for which the customer requirements are clear, the iterative
waterfall model can yield a better solution.
19 Prepared by Dr. Ali Aliedani
Figure 2.8 evolutionary model
2.7 RAPID APPLICATION DEVELOPMENT (RAD) The rapid application development (RAD) model was proposed in the early nineties in an attempt to
overcome the rigidity of the waterfall model (and its derivatives) that makes it difficult to accommodate
any change requests from the customer. It proposed a few radical extensions to the waterfall model. This
model has the features of both prototyping and evolutionary models. It deploys an evolutionary delivery
model to obtain and incorporate the customer feedbacks on incrementally delivered versions.
In this model prototypes are constructed, and incrementally the features are developed and delivered to the
customer. But unlike the prototyping model, the prototypes are not thrown away but are enhanced and used
in the software construction
The major goals of the RAD model are as follows:
▪ To decrease the time taken and the cost incurred to develop software systems.
▪ To limit the costs of accommodating change requests.
▪ To reduce the communication gap between the customer and the developers.
often clients do not know what they exactly wanted until they saw a working system. It has now become
well accepted among the practitioners that only through the process commenting on an installed application
that the exact requirements can be brought out.
The customers usually suggest changes to a specific feature only after they have used it. Since the features
are delivered in small increments, the customers are able to give their change requests pertaining to a
feature already delivered.
Further, RAD advocates use of specialised tools to facilitate fast creation of working prototypes. These
specialised tools usually support the following features:
▪ Visual style of development.
▪ Use of reusable components.

20 Prepared by Dr. Ali Aliedani
Applicability of RAD Model
The following are some of the characteristics of an application that indicate its suitability to RAD style of
development:
Customised software: As already pointed out a customised software is developed for one or two customers
only by adapting an existing software. In customised software development projects, substantial reuse is
usually made of code from pre-existing software.
Non-critical software: the developed product is usually far from being optimal in performance and
reliability. In this regard, for well understood development projects and where the scope of reuse is rather
restricted, the iterative waterfall model may provide a better solution.
Large software: Only for software supporting many features (large software) can incremental
development and delivery be meaningfully carried out.
Application characteristics that render RAD unsuitable
Generic products (wide distribution): software products are generic in nature and usually have wide
distribution. For such systems, optimal performance and reliability are imperative in a competitive market.
As it has already been discussed, the RAD model of development may not yield systems having optimal
performance and reliability.
Requirement of optimal performance and/or reliability: For certain categories of products, optimal
performance or reliability is required. Examples of such systems include an operating system (high
reliability required) and a flight simulator software (high performance required). If such systems are to be
developed using the RAD model, the desired product performance and reliability may not be realised.
Lack of similar products: If a company has not developed similar software, then it would hardly be able
to reuse much of the existing artifacts. In the absence of sufficient plug-in components, it becomes
difficult to develop rapid prototypes through reuse, and use of RAD model becomes meaningless.
Monolithic entity: For certain software, especially small-sized software, it may be hard to divide the
required features into parts that can be incrementally developed and delivered. In this case, it becomes
difficult to develop a software incrementally.
RAD versus prototyping model
In the prototyping model, the developed prototype is primarily used by the development team to gain
insights into the problem, choose between alternatives, and elicit customer feedback.
RAD versus iterative waterfall model
In the iterative waterfall model, all the functionalities of a software are developed together. On the other
hand, in the RAD model the product functionalities are developed incrementally through heavy code and
design reuse.
RAD versus evolutionary model
Incremental development is the hallmark of both evolutionary and RAD models. However, in RAD each
increment results in essentially a quick and dirty prototype, whereas in the evolutionary model each
increment is systematically developed using the iterative waterfall model. Also in the RAD model, software
is developed in much shorter increments compared the evolutionary model.
21 Prepared by Dr. Ali Aliedani
2.8 SPIRAL MODEL
The spiral model, originally proposed by Boehm, is an evolutionary software model that couples the
iterative nature of prototyping with the controlled and systematic aspects of the linear segmental model.
The goal of the spiral model of the software production process is to provide a framework for designing
such processes, guided by the risk levels in the projects at hand.
Let us present a few definitions. Risks are potentially adverse circumstances that may impair the
development process and the quality of products. Boehm [1989] defines risk management as a discipline
whose objectives are to identify, address, and eliminate software risk items before they become either
threats to successful software operation or a major source of expensive software rework. The spiral model
focuses on identifying and eliminating high-risk problems by careful process design, rather than treating
both trivial and severe problems uniformly.
The spiral model is recommended where the requirements and solutions call for developing full-fledged,
large, complex systems with many features and facilities from scratch. It is used when experimenting on
technology, trying out new skills, and when the user is not able to offer requirements in clear terms. It is
also useful when the requirements are not clear and when the solution intended has multi-users, multi-
functions, multi-features, multi-location applications to be used on multiple platforms, where seamless
integration, interfacing, data migration, and replication are the issues. The radial dimension of a cycle
represents the cumulative costs, and the angular dimension represents the progress made in completing
each cycle of the spiral.
Each loop of the spiral represents a phase of the software process:
• the innermost loop might be concerned with system feasibility,
• the next loop with system requirements definition,
• the next one with system design, and so on.
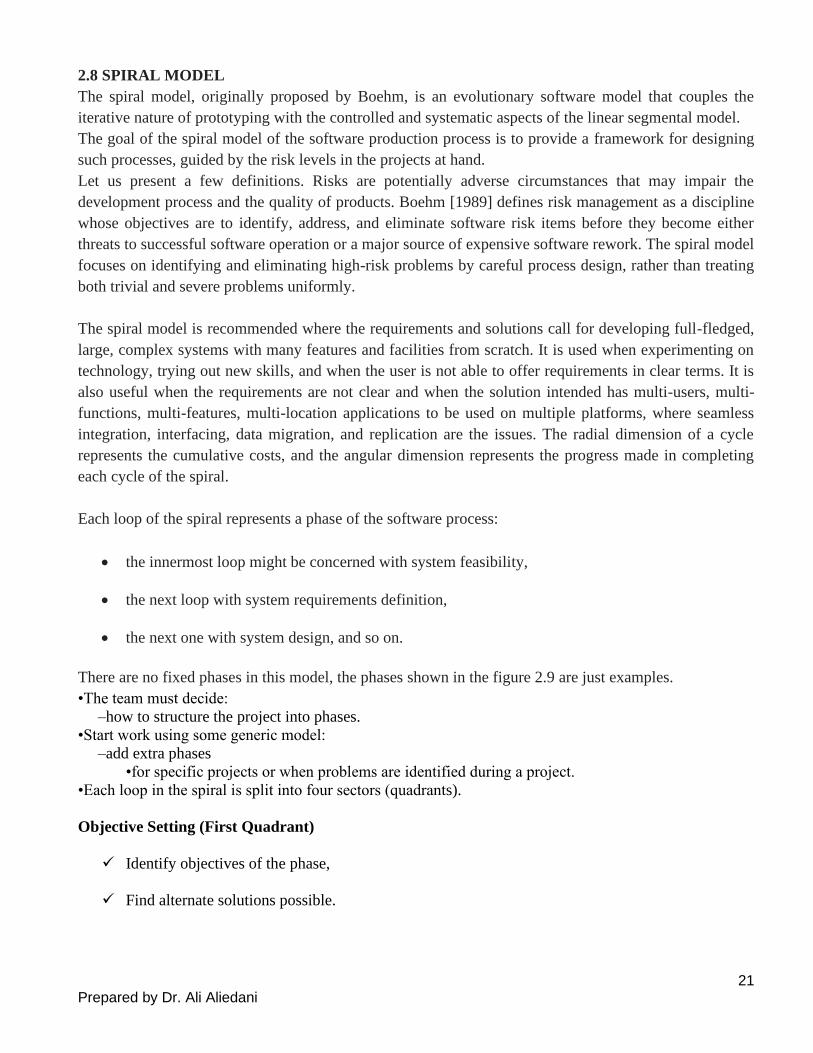
There are no fixed phases in this model, the phases shown in the figure 2.9 are just examples.
•The team must decide:
–how to structure the project into phases.
•Start work using some generic model:
–add extra phases
•for specific projects or when problems are identified during a project.
•Each loop in the spiral is split into four sectors (quadrants).
Objective Setting (First Quadrant)
✓ Identify objectives of the phase,
✓ Find alternate solutions possible.

22 Prepared by Dr. Ali Aliedani
Risk Assessment and Reduction (Second Quadrant)
✓ For each identified project risk,
➢ a detailed analysis is carried out.
✓ Steps are taken to reduce the risk.
✓ For example, if there is a risk that requirements are inappropriate:
➢ A prototype system may be developed.
Development and Validation (Third quadrant)
✓ develop and validate the next level of the product.
Review and Planning (Fourth quadrant):
✓ review the results achieved so far with the customer and plan the next iteration around the spiral.
With each iteration around the spiral:
✓ progressively more complete version of the software gets built.
Figure 2.9 The Spiral Model
23 Prepared by Dr. Ali Aliedani
2.9 Agile Model
The meaning of Agile is swift or versatile. “Agile process model" refers to a software development
approach based on iterative development. Agile methods break tasks into smaller iterations, or parts do not
directly involve long term planning. The project scope and requirements are laid down at the beginning of
the development process. Plans regarding the number of iterations, the duration and the scope of each
iteration are clearly defined in advance.
•To overcome the shortcomings of the waterfall model of development.
–Proposed in mid-1990s
•The agile model was primarily designed:
–To help projects to adapt to change requests
•In the agile model:
–The requirements are decomposed into many small incremental parts that can be developed over
one to four weeks each.
In 2001, these seventeen software developers met at a resort in Snowbird, Utah to discuss these lightweight
development methods: Kent Beck, Ward Cunningham, Dave Thomas, Jeff Sutherland, Ken Schwaber, Jim
Highsmith, Alistair Cockburn, Robert C. Martin, Mike Beedle, Arie van Bennekum, Martin Fowler, James
Grenning, Andrew Hunt, Ron Jeffries, Jon Kern, Brian Marick, and Steve Mellor. Together they published
the Manifesto for Agile Software Development.
Ideology: Agile Manifesto
•Individuals and interactions over process and tools
•Working Software over comprehensive documentation
•Customer collaboration over contract negotiation
•Responding to change over following a plan
Agile software development principles
The Manifesto for Agile Software Development is based on twelve principles:
1. Customer satisfaction by early and continuous delivery of valuable software.
2. Welcome changing requirements, even in late development.
3. Deliver working software frequently (weeks rather than months)
4. Close, daily cooperation between business people and developers
5. Projects are built around motivated individuals, who should be trusted
6. Face-to-face conversation is the best form of communication (co-location)
Face-to-face communication favoured over written documents.
•To facilitate face-to-face communication,
–Development team to share a single office space.

24 Prepared by Dr. Ali Aliedani
–Team size is deliberately kept small (5-9 people)
–This makes the agile model most suited to the development of small projects.
Figure 2.10 model of communication
7. Working software is the primary measure of progress
8. Sustainable development, able to maintain a constant pace
9. Continuous attention to technical excellence and good design
10. Simplicity—the art of maximizing the amount of work not done—is essential
11. Best architectures, requirements, and designs emerge from self-organizing teams
12. Regularly, the team reflects on how to become more effective, and adjusts accordingly
❖ The most popular Agile methods include Rational Unified Process (1994), Scrum (1995), Crystal
Clear, Extreme Programming (1996), Adaptive Software Development, Feature Driven
Development, and Dynamic Systems Development Method (DSDM) (1995). These are now
collectively referred to as Agile Methodologies, after the Agile Manifesto was published in 2001.
2.9.1 Scrum Scrum is based on the idea of adding value to a software product in an iterative manner. The software
development process is repeated—iterated—multiple times until the software product is considered
complete or the process is otherwise stopped. These iterations are called sprints, and they culminate in
software that is potentially releasable. All work is prioritized on the product backlog and, at the start of
each sprint, the development team commits to the work that they will complete during the new iteration by
placing it on the sprint backlog. The unit of work within Scrum is the story. The product backlog is a

25 Prepared by Dr. Ali Aliedani
prioritized queue of pending stories, and each sprint is defined by the stories that will be developed during
an iteration.
Figure 2.11 Scrum works like a production line for small features of a software product.
•Self-organizing teams
•Product progresses in a series of month-long sprints
•Requirements are captured as items in a list of product backlog
•Software increment is designed, coded, and tested during the sprint
•No changes entertained during a sprint
❖ The time to complete an iteration is called a time box
2.9.1.1 Scrum Framework
•Roles : Product Owner, ScrumMaster, Team
•Product Owner
–Acts on behalf of customer to represent their interests.
▪ Defines the features of the product
▪ Decide on release date and content
▪ Prioritize features according to market value
▪ Adjust features and priority every iteration, as needed
▪ Accept or reject work results.
• Scrum Master (aka Project Manager)
•Represents management to the project
•Removes impediments
•Ensure that the team is fully functional and productive
•Enable close cooperation across all roles and functions
•Shield the team from external interferences
–Facilitates scrum process and resolves impediments at the team and organization level by acting as a
buffer between the team and outside interference.
26 Prepared by Dr. Ali Aliedani
•Development Team
•Typically 5-10 people
•Cross-functional
–QA, Programmers, UI Designers, etc.
•Teams are self-organizing
•Membership can change only between sprints.
2.9.1.2 Scrum Events
Prescribed events are used in Scrum to create regularity and to minimize the need for meetings not defined
in Scrum. Scrum uses time-boxed events, such that every event has a maximum duration. This ensures an
appropriate amount of time is spent planning without allowing waste in the planning process.
Scrum Events consist of the following:
• The Sprint:
The heart of Scrum is Sprint, a time-box of one month or less during which a "Done", usable and
potentially releasable product increment is developed. Sprint have consistent duration, a new
Sprint starts immediately after the conclusion of the previous Sprint.
Sprints consist of the Sprint Planning Meeting, Daily Scrum, the development work, the Sprint
Review and the Sprint Retrospective.
During the Sprint no changes are made that would affect the Sprint Goal. Quality goals do not
decrease and scope may be clarified. Sprints are limited to one calendar month.
• Canceling The Sprint:
A Sprint can be canceled before the Sprint time-box is over. Only the product owner has the
authority to cancel the Sprint. A Sprint would be canceled if the Sprint goal becomes obsolete.
• Sprint Planning Meeting:
The work to be done in Sprint is planned during the Sprint Planning Meeting. The plan is
developed by the work of the entire Scrum team. Sprint planning is time-boxed for eight hours for
a one-month Sprint. Sprint Planning meeting consist of two parts.
Part 1: What will be done this Sprint?
In this phase team works to forecast functionality that will be developed during the Sprint.
Part 2 : How will the chosen work get done?
Once the work is selected, the team decides how it will build the functionality into a "Done"
product.
• Sprint Goal:
As the development team works it keeps this goal in mind. In order to satisfy this goal, it implements
the functionality and technology.
27 Prepared by Dr. Ali Aliedani
• Daily Scrum:
The daily scrum is a 15-minute time-boxed event for the team to synchronize activities for the next
24 hours. The Daily Scrum is held at the same time and place each day to reduce complexity. During
the meeting, each Development Team member explains:
• What has been accomplished since the last meeting?
• What will be done before the next meeting?
• What obstacles are in the way?
The Daily Scrum improves communications, eliminates other meetings and highlights and promotes
quick decision making.
• Sprint Review:
A sprint review is held at the end of the Sprint to inspect increment and adapt the product Backlog
if needed. The result of the Sprint Review is a revised Product Backlog that defines the probable
Product Backlog items for the next Sprint. The Product Backlog may also be adjusted to meet new
opportunities.
• Sprint Retrospective:
The Sprint Retrospective is an opportunity for the Scrum Team to inspect itself and create a plan
for improvements to be enacted during the next Sprint.
By end of the Retrospective, the Scrum Team should have identified improvements that it will
implement in the next Sprint.
2.9.1.3 Scrum Artifacts
• Product Backlog:
The Product Backlog lists all features, functions, requirements, enhancements, and fixes that
constitute the changes to be made to the product in the future releases. Requirements never stop
changing. Changes in business requirements, market conditions, or technology may cause changes
in the Product Backlog.
• Sprint Backlog:
The Sprint Backlog is the set of Product Backlog items selected for the Sprint plus a plan
for delivering the product Increment and realizing the Sprint Goal. The Sprint Backlog is a
forecast by the Development Team about what functionality will be in the next Increment and the
work needed to deliver that functionality.
• Monitoring Sprint Progress:
Development team tracks total work remaining at least for every Daily Scrum. Development team
tracks these sums daily and projects likelihood of achieving the Sprint Goals.

28 Prepared by Dr. Ali Aliedani
• Increment:
The Increment is the sum of all the Product Backlog items completed during a Sprint and
all previous Sprints.
2.9.2 XP Extreme Programming (XP) was created in response to problem domains whose requirements change.
Your customers may not have a firm idea of what the system should do.
When Applicable
The general characteristics where XP is appropriate were described by Don Wells
on www.extremeprogramming.org:
• Dynamically changing software requirements
• Risks caused by fixed time projects using new technology
• Small, co-located extended development team
• The technology you are using allows for automated unit and functional tests
Extreme Programming emphasizes teamwork. Managers, customers, and developers are all equal partners
in a collaborative team. Extreme Programming implements a simple, yet effective environment enabling
teams to become highly productive. The team self-organizes around the problem to solve it as efficiently
as possible.
Extreme Programming improves a software project in five essential ways; communication,
simplicity, feedback, respect, and courage. Extreme Programmers constantly communicate with their
customers and fellow programmers. They keep their design simple and clean. They get feedback by testing
their software starting on day one. They deliver the system to the customers as early as possible and
implement changes as suggested. Every small success deepens their respect for the unique contributions of
each and every team member. With this foundation Extreme Programmers are able to courageously respond
to changing requirements and technology.
Extreme Programming Activities
•XP Planning
•Begins with the creation of “user stories”
•Agile team assesses each story and assigns a cost
•Stories are grouped to for a deliverable increment
•A commitment is made on delivery date
•XP Design
•Follows the keep it simple and straightforward principle
•Encourage the use of CRC (Class-responsibility-collaboration (CRC) cards)
•For difficult design problems, suggests the creation of “spike solutions”—a design prototype
•Encourages “refactoring”—an iterative refinement of the internal program design
•XP Coding
•Recommends the construction of unit test cases before coding commences (test-driven
development)
•Encourages “pair programming”

29 Prepared by Dr. Ali Aliedani
•XP Testing
•All unit tests are executed daily
•“Acceptance tests” are defined by the customer and executed to assess customer visible
functionalities
These four basic activities need to be structured in the light of the Extreme Programming principles. To
accomplish this, the Extreme Programming practices are defined.
Kent Beck, the author of ‘Extreme Programming Explained’ defined 12 Extreme Programming practices
as follows −
1.Planning/Planning game–determine scope of the next release by combining business priorities and
technical estimates
2.Small releases–put a simple system into production, then release new versions in very short cycles
3.Metaphor–all development is guided by a simple shared story of how the whole system works
4.Simple design–system is to be designed as simple as possible
5.Testing–programmers continuously write and execute unit tests
6.Refactoring–programmers continuously restructure the system without changing its behavior to remove
duplication and simplify.
7.Pair-programming--all production code is written with two programmers at one machine
8.Collective ownership–anyone can change any code anywhere in the system at any time.
9.Continuous integration–integrate and build the system many times a day –every time a task is
completed.
10.40-hour week–work no more than 40 hours a week as a rule
11.On-site customer–a user is a part of the team and available full-time to answer questions
12.Coding standards–programmers write all code in accordance with rules emphasizing communication
through the code.
30 Prepared by Dr. Ali Aliedani
✓ A user story is a well-formed, short and simple description of a software requirement from the
perspective of an end-user, written in an informal and natural language. It is the main artifact
used in the agile software development process to capture user requirements.
✓ After user stories have been written you can use a release planning meeting to create a release
plan. The release plan specifies which user stories are going to be implemented for each system
release and dates for those releases.
✓ A spike solution is a very simple program to explore potential solutions. Build the spike to only
addresses the problem under examination and ignore all other concerns.

31 Prepared by Dr. Ali Aliedani
3. SOFTWARE PROJECT MANAGEMENT
The main goal of software project management is to enable a group of developers to work effectively
towards the successful completion of a project.
3.1 SOFTWARE PROJECT MANAGEMENT COMPLEXITIES
The main factors contributing to the complexity of managing a software project:
Invisibility: Invisibility of software makes it difficult to assess the progress of a project and is a major
cause for the complexity of managing a software project.
Changeability: Because the software part of any system is easier to change as compared to the hardware
part, the software part is the one that gets most frequently changed.
Complexity: Even a moderate sized software has millions of parts (functions) that interact with each other
in many ways—data coupling, serial and concurrent runs, state transitions, control dependency, file
sharing, etc.
Uniqueness: Every software project is usually associated with many unique features or situations. This
makes every project much different from the others. This is unlike projects in other domains, such as car
manufacturing.
Exactness of the solution: Mechanical components such as nuts and bolts typically work satisfactorily as
long as they are within a tolerance of 1 per cent or so of their specified sizes. However, the parameters of
a function call in a program are required to be in complete conformity with the function definition. This
requirement not only makes it difficult to get a software product up and working, but also makes reusing
parts of one software product in another difficult.
Team-oriented and intellect-intensive work: Software development projects are akin to research projects
in the sense that they both involve team-oriented, intellect-intensive work. In contrast, projects in many
domains are labour-intensive and each member works in a high degree of autonomy.
3.2 RESPONSIBILITIES OF A SOFTWARE PROJECT MANAGER
We can broadly classify a project manager’s varied responsibilities into the following two major categories:
• Project planning is undertaken immediately after the feasibility study phase and before the starting of
the requirements analysis and specification phase.
Project planning involves estimating several characteristics of a project and then planning the project
activities based on these estimates made.
The initial project plans are revised from time to time as the project progresses and more project data
become available.
• Project monitoring and control are undertaken once the development activities start. The focus of
project monitoring and control activities is to ensure that the software development proceeds as per plan.
Skills Necessary for Managing Software Projects
Three skills that are most critical to successful project management are the following:
• Knowledge of project management techniques.
• Decision taking capabilities.
• Previous experience in managing similar projects.
32 Prepared by Dr. Ali Aliedani
3.2.1 Project planning
➢ Requires utmost care and attention --- commitments to unrealistic time and resource estimates result
in:
o irritating delays.
o customer dissatisfaction
o adverse affect on team morale
▪ poor quality work
o project failure.
During project planning, the project manager performs the following Activities:
Estimation: The following project attributes are estimated.
• Cost: How much is it going to cost to develop the software product?
• Duration: How long is it going to take to develop the product?
• Effort: How much effort would be necessary to develop the product?
✓ The effectiveness of all later planning activities such as scheduling and staffing are dependent on
the accuracy with which these three estimations have been made.
Scheduling: the schedules for manpower and other resources are developed.
Staffing: Staff organisation and staffing plans are made.
Risk management: This includes risk identification, analysis, and abatement planning.
Miscellaneous plans: This includes making several other plans such as quality assurance plan, and
configuration management plan, etc.
Figure 3.1 shows the order in which the planning activities are undertaken.
Figure 3.1: Precedence ordering among planning activities.
Based on the effort estimation, the cost of the project is computed. The estimated cost forms the basis on
which price negotiations with the customer is carried out.
3.2.1.1 Sliding Window Planning
It is usually very difficult to make accurate plans for large projects at project initiation. A part of the
difficulty arises from the fact that large projects may take several years to complete. As a result, during the
span of the project, the project parameters, scope of the project, project staff, etc., often change drastically
resulting in the initial plans going haywire.
➢ In order to overcome this problem, sometimes project managers undertake project planning over
several stages:
o protects managers from making big commitments too early.

33 Prepared by Dr. Ali Aliedani
o More information becomes available as project progresses.
▪ Facilitates accurate planning.
3.2.1.2 The SPMP Document of Project Planning
Once project planning is complete, project managers document their plans in a software project
management plan (SPMP) document. Listed below are the different items that the SPMP document should
discuss.
Organisation of the software project management plan (SPMP) document
1. Introduction
(a) Objectives
(b) Major Functions
(c) Performance Issues
(d) Management and Technical Constraints
2. Project estimates
(a) Historical Data Used
(b) Estimation Techniques Used
(c) Effort, Resource, Cost, and Project Duration Estimates
3. Schedule
(a) Work Breakdown Structure
(b) Task Network Representation
(c) Gantt Chart Representation
(d) PERT Chart Representation
4. Project resources
(a) People
(b) Hardware and Software
(c) Special Resources
5. Staff organisation
(a) Team Structure
(b) Management Reporting
6. Risk management plan
(a) Risk Analysis
(b) Risk Identification
(c) Risk Estimation
(d) Risk Abatement Procedures
7. Project tracking and control plan
(a) Metrics to be tracked
(b) Tracking plan
(c) Control plan
8. Miscellaneous plans
(a) Process Tailoring
(b) Quality Assurance Plan
(c) Configuration Management Plan
(d) Validation and Verification
(e) System Testing Plan
(f) Delivery, Installation, and Maintenance Plan
34 Prepared by Dr. Ali Aliedani
3.3 METRICS FOR PROJECT SIZE ESTIMATION
The project size is a measure of the problem complexity in terms of the effort and time required to develop
the product.
3.3.1 Lines of Code (LOC)
o Simplest and most widely used metric.
o Comments and blank lines should not be counted.
However, accurate estimation of LOC count at the beginning of a project is a very difficult task. One
can possibly estimate the LOC count at the starting of a project, only by using some form of systematic
guess work. Systematic guessing typically involves the following.
➢ The project manager divides the problem into modules, and each module into sub-modules and so
on, until the LOC of the leaf-level modules are small enough to be predicted.
➢ To be able to predict the LOC count for the various leaf-level modules sufficiently accurately, past
experience in developing similar modules is very helpful.
Disadvantages of LOC
➢ LOC is a measure of coding activity alone. A good problem size measure should consider the
total effort needed to carry out various life cycle activities (i.e. specification, design, code, test, etc.)
and not just the coding effort.
➢ LOC count depends on the choice of specific instructions: LOC gives a numerical value of
problem size that can vary widely with coding styles of individual programmers.
➢ LOC measure correlates poorly with the quality and efficiency of the code: Larger code size
does not necessarily imply better quality of code or higher efficiency.
➢ LOC metric penalises use of higher-level programming languages and code reuse: A paradox
is that if a programmer consciously uses several library routines, then the LOC count will be lower.
➢ LOC metric measures the lexical complexity of a program and does not address the more
important issues of logical and structural complexities: Between two programs with equal LOC
counts, a program incorporating complex logic would require much more effort to develop than a
program with very simple logic.
➢ It is very difficult to accurately estimate LOC of the final program from problem
specification.
3.3.2 Function Point (FP) Metric
Function point metric was proposed by Albrecht in 1983. This metric overcomes many of the shortcomings
of the LOC metric. Function point metric has several advantages over LOC metric. One of the important
advantages of the function point metric over the LOC metric is that it can easily be computed from the
problem specification itself.
Conceptually, the function point metric is based on the idea that a software product supporting many
features would certainly be of larger size than a product with less number of features.
Albrecht postulated that in addition to the number of basic functions that a software performs, size
also depends on the number of files and the number of interfaces that are associated with the
software.
35 Prepared by Dr. Ali Aliedani
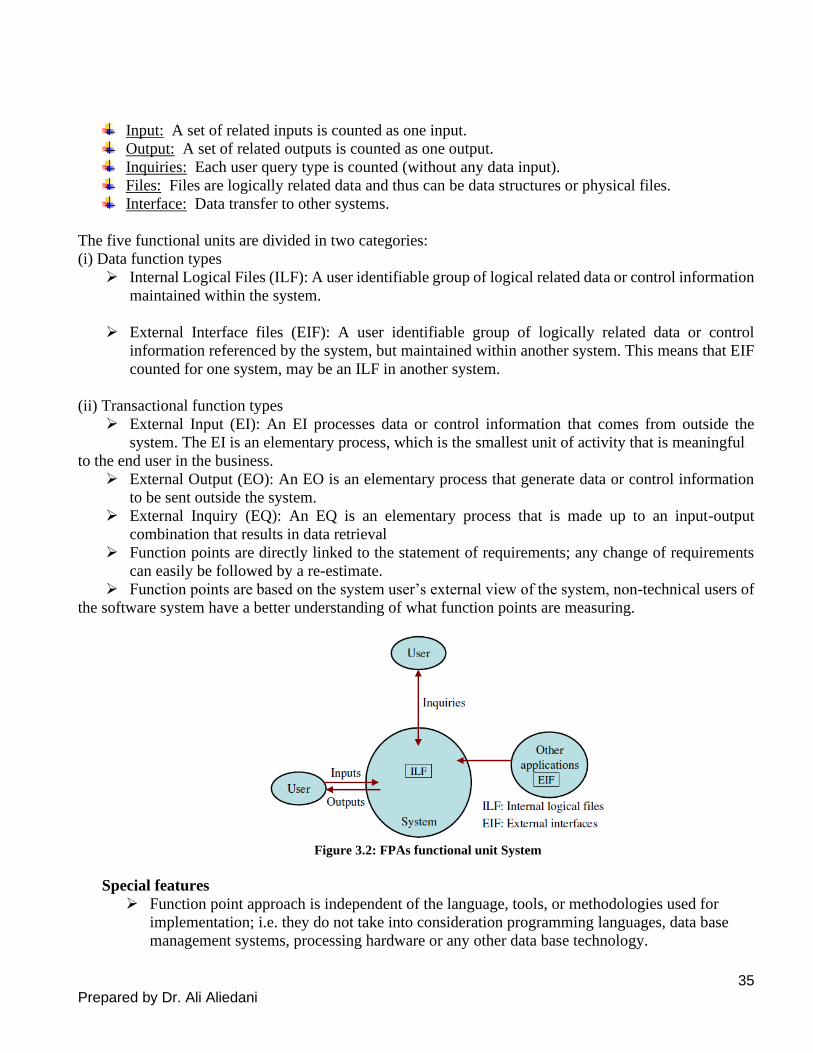
Input: A set of related inputs is counted as one input.
Output: A set of related outputs is counted as one output.
Inquiries: Each user query type is counted (without any data input).
Files: Files are logically related data and thus can be data structures or physical files.
Interface: Data transfer to other systems.
The five functional units are divided in two categories:
(i) Data function types
➢ Internal Logical Files (ILF): A user identifiable group of logical related data or control information
maintained within the system.
➢ External Interface files (EIF): A user identifiable group of logically related data or control
information referenced by the system, but maintained within another system. This means that EIF
counted for one system, may be an ILF in another system.
(ii) Transactional function types
➢ External Input (EI): An EI processes data or control information that comes from outside the
system. The EI is an elementary process, which is the smallest unit of activity that is meaningful
to the end user in the business.
➢ External Output (EO): An EO is an elementary process that generate data or control information
to be sent outside the system.
➢ External Inquiry (EQ): An EQ is an elementary process that is made up to an input-output
combination that results in data retrieval
➢ Function points are directly linked to the statement of requirements; any change of requirements
can easily be followed by a re-estimate.
➢ Function points are based on the system user’s external view of the system, non-technical users of
the software system have a better understanding of what function points are measuring.
Figure 3.2: FPAs functional unit System
Special features
➢ Function point approach is independent of the language, tools, or methodologies used for
implementation; i.e. they do not take into consideration programming languages, data base
management systems, processing hardware or any other data base technology.

36 Prepared by Dr. Ali Aliedani
➢ Function points can be estimated from requirement specification or design specification, thus
making it possible to estimate development efforts in early phases of development.
The weighting factors are identified for all functional units and multiplied with the functional
units accordingly. The procedure for the calculation of Unadjusted Function Point (UFP) is
given in table shown above.
The procedure for the calculation of UFP in mathematical form is given below:

37 Prepared by Dr. Ali Aliedani
Where i indicate the row and j indicates the column of Table 2
Wij : It is the entry of the ith row and jth column of the table 3
Zij : It is the count of the number of functional units of Type i that have been classified as having
the complexity corresponding to column j.
Organizations that use function point methods develop a criterion for determining whether a
particular entry is Low, Average or High. Nonetheless, the determination of complexity is
somewhat subjective.
Where CAF is complexity adjustment factor and is equal to [0.65 + 0.01 x ∑Fi]. The Fi (i=1 to
14) are the degree of influence and are based on responses to questions noted in table 3.
Number of factors considered ( Fi )
1. Does the system require reliable backup and recovery ?
2. Is data communication required ?
3. Are there distributed processing functions ?
4. Is performance critical ?
5. Will the system run in an existing heavily utilized operational environment ?
6. Does the system require on line data entry ?
7. Does the on line data entry require the input transaction to be built over multiple screens or
operations ?
8. Are the master files updated on line ?
9. Is the inputs, outputs, files, or inquiries complex ?
10. Is the internal processing complex ?
11. Is the code designed to be reusable ?
12. Are conversion and installation included in the design ?
13. Is the system designed for multiple installations in different organizations ?
14. Is the application designed to facilitate change and ease of use by the user ?
Functions points may compute the following important metrics:
Productivity = FP / persons-months
Quality = Defects / FP
Cost = Dollar / FP
Documentation = Pages of documentation per FP
These metrics are controversial and are not universally acceptable.
There are standards issued by the International Functions Point User Group (IFPUG, covering the
Albrecht method) and the United Kingdom Function Point User Group (UFPGU, covering the
MK11 method). An ISO standard for function point method is also being developed.

38 Prepared by Dr. Ali Aliedani
Example: 3.1
Consider a project with the following functional units:
Number of user inputs = 50
Number of user outputs = 40
Number of user enquiries = 35
Number of user files = 06
Number of external interfaces = 04
Assume all complexity adjustment factors and weighting factors are average. Compute the
function points for the project.
Solution
UFP = 50 x 4 + 40 x 5 + 35 x 4 + 6 x 10 + 4 x 7
= 200 + 200 + 140 + 60 + 28 = 628
CAF = (0.65 + 0.01 ∑Fi)
= (0.65 + 0.01 (14 x 3)) = 0.65 + 0.42 = 1.07
FP = UFP x CAF
= 628 x 1.07 = 672
Example:3.2
An application has the following:
10 low external inputs, 12 high external outputs, 20 low internal logical files, 15 high external interface
files, 12 average external inquiries, and a value of complexity adjustment factor of 1.10.
What are the unadjusted and adjusted function point counts ?
Solution
Unadjusted function point counts may be calculated using as:
= 10 x 3 + 12 x 7 + 20 x 7 + 15 + 10 + 12 x 4
= 30 + 84 +140 + 150 + 48
= 452
FP = UFP x CAF
= 452 x 1.10 = 497.2.
Example: 3.3
Consider a project with the following parameters.
(i) External Inputs:
(a)10 with low complexity
(b)15 with average complexity
(c)17 with high complexity
(ii) External Outputs:
(a)6 with low complexity

39 Prepared by Dr. Ali Aliedani
(b)13 with high complexity
(iii) External Inquiries:
(a) 3 with low complexity
(b) 4 with average complexity
(c) 2 high complexity
(iv) Internal logical files:
(a)2 with average complexity
(b)1 with high complexity
(v) External Interface files:
(a)9 with low complexity
In addition to above, system requires
i. Significant data communication
ii. Performance is very critical
iii. Designed code may be moderately reusable
iv. System is not designed for multiple installation in different organizations.
Other complexity adjustment factors are treated as average. Compute the function points for the
project.
∑ 𝐹𝑖14𝑖=1 = 3+4+3+5+3+3+3+3+3+3+2+3+0+3=41
CAF = (0.65 + 0.01 x ∑Fi)
= (0.65 + 0.01 x 41)
= 1.06
FP = UFP x CAF
= 424 x 1.06
= 449.44
Hence FP = 449
Function Point is subjective --- Different people can come up with different estimates for the same
problem
3.4 PROJECT ESTIMATION TECHNIQUES
The different parameters of a project that need to be estimated include—project size, effort required to
complete the project, project duration, and cost. Accurate estimation of these parameters is important, since
these not only help in quoting an appropriate project cost to the customer, but also form the basis for
resource planning and scheduling. These can broadly be classified into three main categories:
• Empirical estimation techniques
• Heuristic techniques
• Analytical estimation techniques
40 Prepared by Dr. Ali Aliedani
3.4.1 Empirical Estimation Techniques
Empirical estimation techniques are essentially based on making an educated guess of the project
parameters. While using this technique, prior experience with development of similar products is helpful.
1- Expert Judgement:
o Experts divide a software product into component units: e.g. GUI, database module, data
communication module, billing module, etc.
o Add up the guesses for each of the components.
o Suffers from individual bias.
2- Delphi Estimation:
➢ overcomes some of the problems of expert judgement.
➢ Team of Experts and a coordinator.
➢ Experts carry out estimation independently:
o mention the rationale behind their estimation.
➢ coordinator notes down any extraordinary rationale:
o circulates among experts.
➢ Experts re-estimate.
➢ Experts never meet each other to discuss their viewpoints.
3.4.2 Heuristic Techniques
Heuristic techniques assume that the relationships that exist among the different project parameters can be
satisfactorily modelled using suitable mathematical expressions. Different heuristic estimation models can
be divided into the following two broad categories—single variable and multivariable models.
3.4.2.1 COCOMO
COnstructive COst estimation MOdel (COCOMO) was proposed by Boehm [1981]. COCOMO prescribes
a three stage process for project estimation. In the first stage, an initial estimate is arrived at. Over the next
two stages, the initial estimate is refined to arrive at a more accurate estimate. COCOMO uses both single
and multivariable estimation models at different stages of estimation.
The three stages of COCOMO estimation technique are—basic COCOMO, intermediate COCOMO, and
complete COCOMO
A- Basic COCOMO Model
Boehm postulated that any software development project can be classified into one of the following three
categories based on the development complexity—organic, semidetached, and embedded. Based on the
category of a software development project, he gave different sets of formulas to estimate the effort and
duration from the size estimate.
41 Prepared by Dr. Ali Aliedani
• In order to classify a project into the identified categories, Boehm requires us to consider not only
the characteristics of the product but also those of the development team and development
environment.
where E is effort applied in Person-Months, and D is the development time in months. The coefficients
ab, bb, cb and db are given in table 5.
Table 5: Basic COCOMO coefficients
42 Prepared by Dr. Ali Aliedani
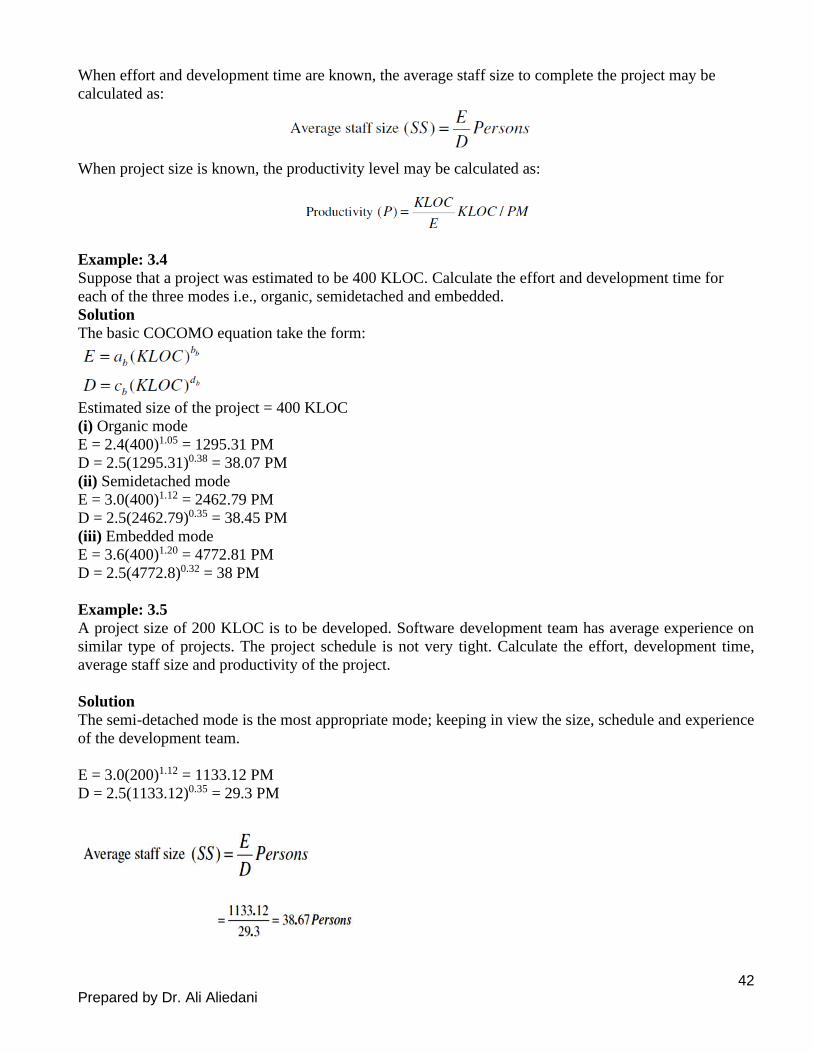
When effort and development time are known, the average staff size to complete the project may be
calculated as:
When project size is known, the productivity level may be calculated as:
Example: 3.4
Suppose that a project was estimated to be 400 KLOC. Calculate the effort and development time for
each of the three modes i.e., organic, semidetached and embedded.
Solution
The basic COCOMO equation take the form:
Estimated size of the project = 400 KLOC
(i) Organic mode
E = 2.4(400)1.05 = 1295.31 PM
D = 2.5(1295.31)0.38 = 38.07 PM
(ii) Semidetached mode
E = 3.0(400)1.12 = 2462.79 PM
D = 2.5(2462.79)0.35 = 38.45 PM
(iii) Embedded mode
E = 3.6(400)1.20 = 4772.81 PM
D = 2.5(4772.8)0.32 = 38 PM
Example: 3.5
A project size of 200 KLOC is to be developed. Software development team has average experience on
similar type of projects. The project schedule is not very tight. Calculate the effort, development time,
average staff size and productivity of the project.
Solution
The semi-detached mode is the most appropriate mode; keeping in view the size, schedule and experience
of the development team.
E = 3.0(200)1.12 = 1133.12 PM
D = 2.5(1133.12)0.35 = 29.3 PM

43 Prepared by Dr. Ali Aliedani
B- Intermediate COCOMO z Basic COCOMO model assumes
y effort and development time depend on product size alone.
z However, several parameters affect effort and development time:
x Reliability requirements
x Availability of CASE tools and modern facilities to the developers
x Size of data to be handled
z For accurate estimation,
y the effect of all relevant parameters must be considered:
y Intermediate COCOMO model recognizes this fact:
x refines the initial estimate obtained by the basic COCOMO by using a set of 15
cost drivers (multipliers) (Effort Adjustment Factor).
Cost drivers

44 Prepared by Dr. Ali Aliedani
Shortcoming of basic and intermediate COCOMO models
z Both models:
y consider a software product as a single homogeneous entity:
y However, most large systems are made up of several smaller sub-systems.
x Some sub-systems may be considered as organic type, some may be considered
embedded, etc.
x for some the reliability requirements may be high, and so on.
C- Complete COCOMO
➢ Cost of each sub-system is estimated separately.
➢ Costs of the sub-systems are added to obtain total cost.
➢ Reduces the margin of error in the final estimate.
Complete COCOMO Example
➢ A Management Information System (MIS) for an organization having offices at several places
across the country:
o Database part (semi-detached)
o Graphical User Interface (GUI) part (organic)
o Communication part (embedded)
➢ Costs of the components are estimated separately:
o summed up to give the overall cost of the system.
3.4.2.2 COCOMO-II
• The present-day software projects are much larger in size and reuse of existing software to develop
new products has become pervasive.
• New life cycle models and development paradigms are being deployed for web-based and
component-based software. During the 1980s rarely any program was interactive, and graphical
user interfaces were almost non-existent. On the other hand, the present-day software products are
highly interactive and support elaborate graphical user interface. Effort spent on developing the
GUI part is often as much as the effort spent on developing the actual functionality of the software.
To make COCOMO suitable in the changed scenario, Boehm proposed COCOMO 2 in 1995.

45 Prepared by Dr. Ali Aliedani
• It is the model that allows one to estimate the cost, effort and schedule when planning a new
software development activity.
• COCOMO 2 provides three models to arrive at increasingly accurate cost estimations. These can
be used to estimate project costs at different phases of the software product. As the project
progresses, these models can be applied at the different stages of the same project.
1- Application composition model
The application composition model is based on counting the number of screens, reports, and modules
(components). Each of these components is considered to be an object. These are used to compute the
object points of the application.
Effort is estimated in the application composition model as follows:
1. Estimate the number of screens, reports, and modules (components) from an analysis of the SRS
document.
2. Determine the complexity level of each screen and report, and rate
these as either simple, medium, or difficult. The complexity of a screen or a report is determined by the
number of tables and views it contains.
Table 7 (a): for screens
Table 7 (b): for reports

46 Prepared by Dr. Ali Aliedani
3- Assign complexity weight to each object : The weights are used for three object types i.e., screen,
report and 3GL components using the Table 8.
Table 8: Complexity weights for each level
4. Determine object points: Add all the weighted object instances to get one number and this known as
object-point count.
5. Compute new object points: We have to estimate the percentage of reuse to be achieved in a project.
Depending on the percentage reuse, the new object points (NOP) are computed
6. Calculation of productivity rate: The productivity rate can be calculated as:
Table 9: Productivity value
7. Compute the effort in Persons-Months: When PROD is known, we may estimate effort in Person-Months
as:
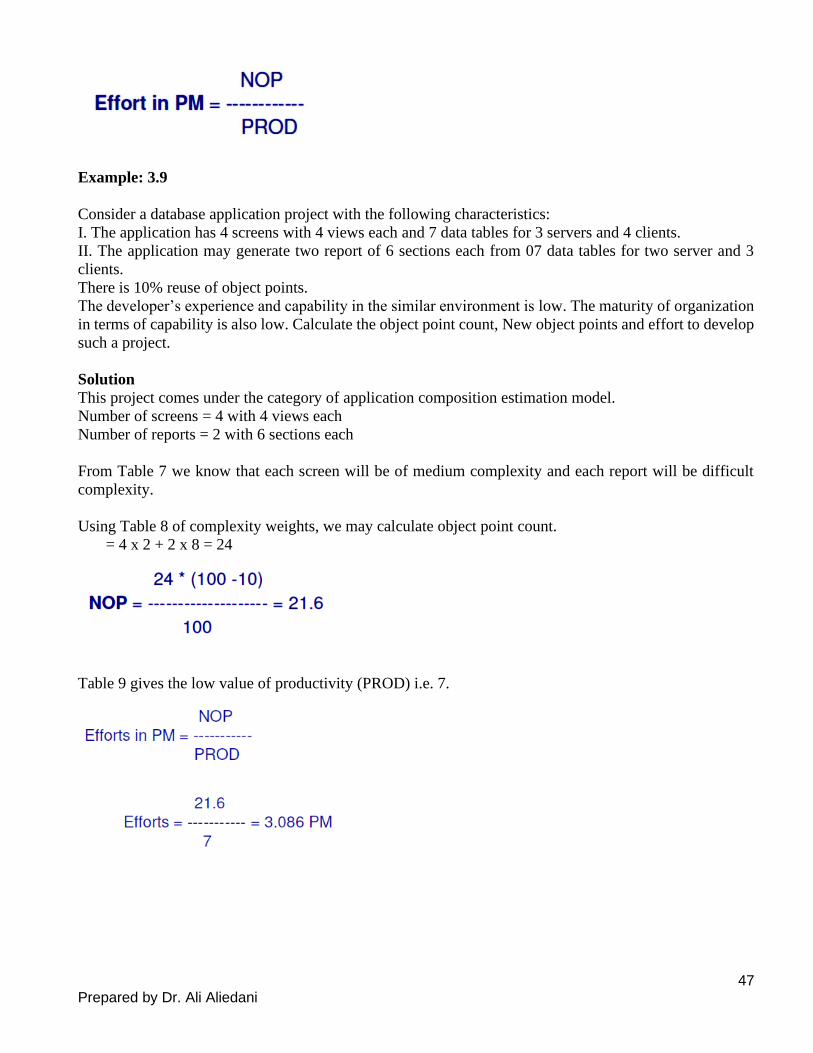
47 Prepared by Dr. Ali Aliedani
Example: 3.9
Consider a database application project with the following characteristics:
I. The application has 4 screens with 4 views each and 7 data tables for 3 servers and 4 clients.
II. The application may generate two report of 6 sections each from 07 data tables for two server and 3
clients.
There is 10% reuse of object points.
The developer’s experience and capability in the similar environment is low. The maturity of organization
in terms of capability is also low. Calculate the object point count, New object points and effort to develop
such a project.
Solution
This project comes under the category of application composition estimation model.
Number of screens = 4 with 4 views each
Number of reports = 2 with 6 sections each
From Table 7 we know that each screen will be of medium complexity and each report will be difficult
complexity.
Using Table 8 of complexity weights, we may calculate object point count.
= 4 x 2 + 2 x 8 = 24
Table 9 gives the low value of productivity (PROD) i.e. 7.
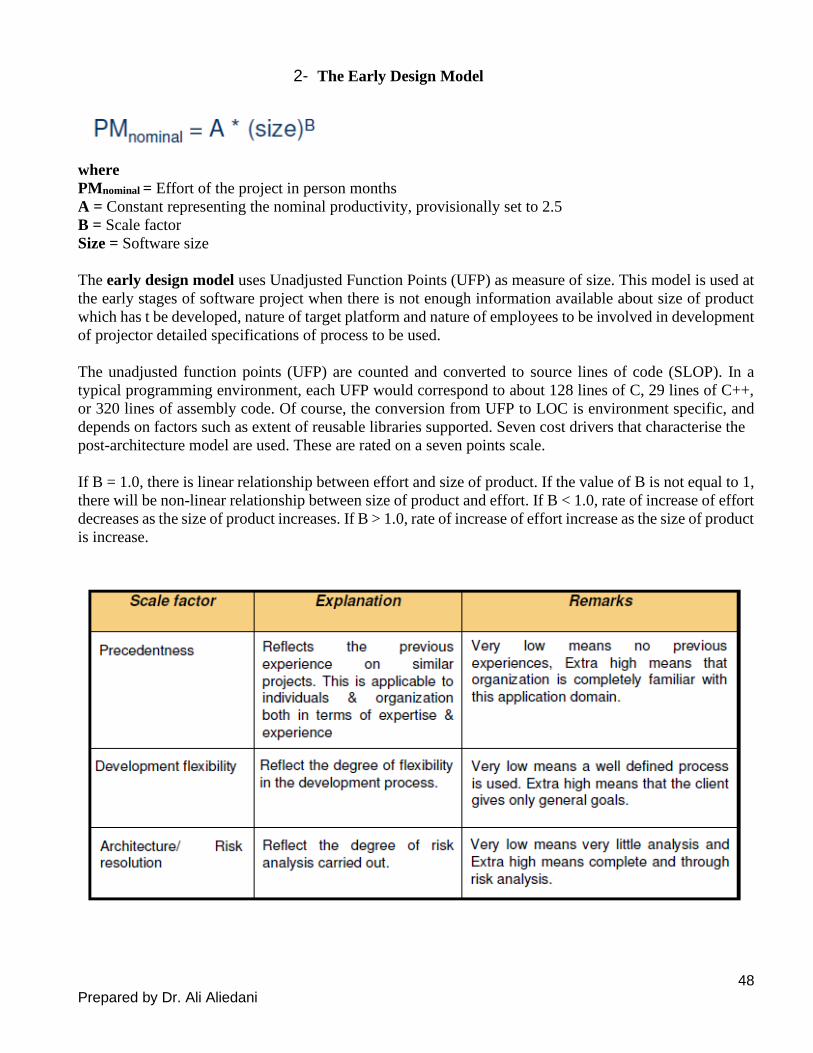
48 Prepared by Dr. Ali Aliedani
2- The Early Design Model
where
PMnominal = Effort of the project in person months
A = Constant representing the nominal productivity, provisionally set to 2.5
B = Scale factor
Size = Software size
The early design model uses Unadjusted Function Points (UFP) as measure of size. This model is used at
the early stages of software project when there is not enough information available about size of product
which has t be developed, nature of target platform and nature of employees to be involved in development
of projector detailed specifications of process to be used.
The unadjusted function points (UFP) are counted and converted to source lines of code (SLOP). In a
typical programming environment, each UFP would correspond to about 128 lines of C, 29 lines of C++,
or 320 lines of assembly code. Of course, the conversion from UFP to LOC is environment specific, and
depends on factors such as extent of reusable libraries supported. Seven cost drivers that characterise the
post-architecture model are used. These are rated on a seven points scale.
If B = 1.0, there is linear relationship between effort and size of product. If the value of B is not equal to 1,
there will be non-linear relationship between size of product and effort. If B < 1.0, rate of increase of effort
decreases as the size of product increases. If B > 1.0, rate of increase of effort increase as the size of product
is increase.
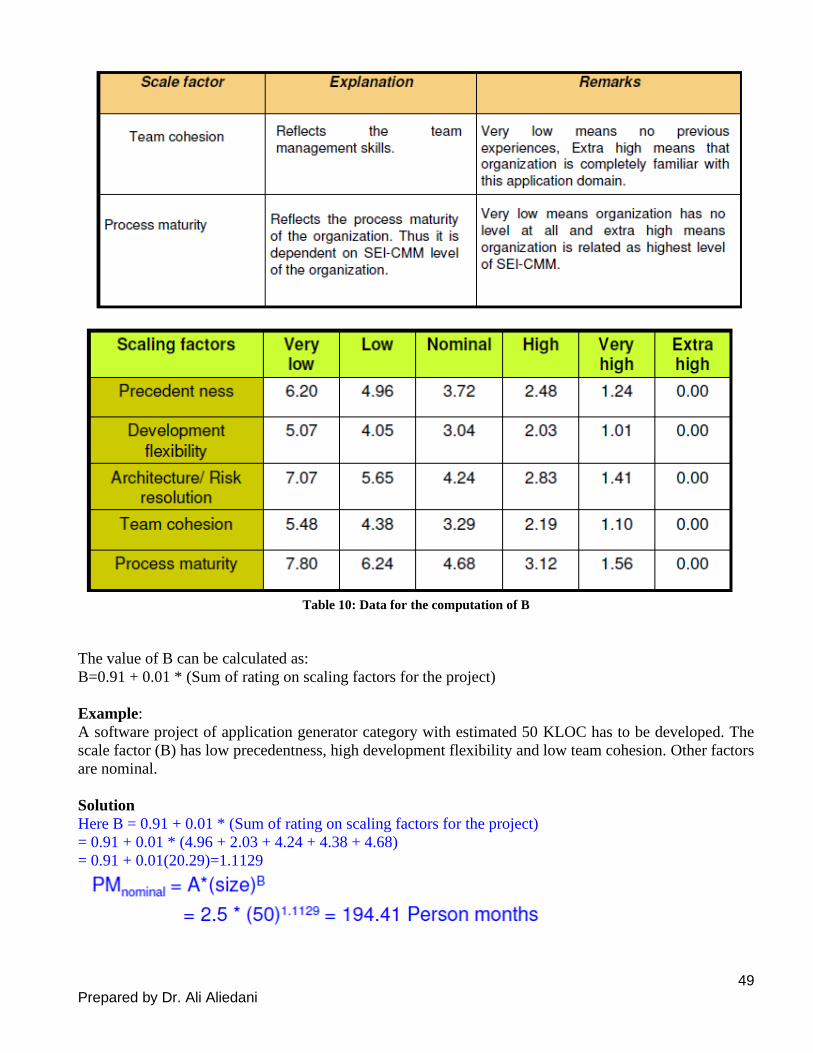
49 Prepared by Dr. Ali Aliedani
Table 10: Data for the computation of B
The value of B can be calculated as:
B=0.91 + 0.01 * (Sum of rating on scaling factors for the project)
Example:
A software project of application generator category with estimated 50 KLOC has to be developed. The
scale factor (B) has low precedentness, high development flexibility and low team cohesion. Other factors
are nominal.
Solution
Here B = 0.91 + 0.01 * (Sum of rating on scaling factors for the project)
= 0.91 + 0.01 * (4.96 + 2.03 + 4.24 + 4.38 + 4.68)
= 0.91 + 0.01(20.29)=1.1129

50 Prepared by Dr. Ali Aliedani
3- Post Architecture Model
The post architecture model is the most detailed estimation model and is intended to be used when a
software life cycle architecture has been completed. This model is used in the development and
maintenance of software products in the application generators, system integration or infrastructure sectors.
EM : Effort multiplier which is the product of 17 cost drivers.
3.5 STAFFING LEVEL ESTIMATION
Once the effort required to complete a software project has been estimated, the staffing requirement for the
project can be determined. Putnam was the first to study the problem of determining a proper staffing
pattern for software projects. He extended the classical work of Norden who had earlier investigated the
staffing pattern of general research and development (R&D) type of projects.
3.5.1 Norden’s Work
Norden concluded that the staffing pattern for any R&D project starting from a low level, increases until
it reaches a peak value. It then starts to diminish. This pattern can be approximated by the Rayleigh
distribution curve (see Figure 3.3).
Figure 3.3: Rayleigh curve.
Norden represented the Rayleigh curve by the following equation:

51 Prepared by Dr. Ali Aliedani
where, E is the effort required at time t. E is an indication of the number of developers (or the staffing level)
at any particular time during the duration of the project, K is the area under the curve, and td is the time at
which the curve attains its maximum value. It must be remembered that the results of Norden are applicable
to general R&D projects and were not meant to model the staffing pattern of software development projects.
3.9.2 Putnam’s Work
Putnam found that the Rayleigh-Norden curve can be adapted to relate the number of delivered lines of
code to the effort and the time required to develop the product. By analysing a large number of defence
projects, Putnam derived the following expression:
where the different terms are as follows:
• K is the total effort expended (in PM) in the product development and L is the product size in
KLOC.
• td corresponds to the time of system and integration and testing. Therefore, t d can be approximately
considered as the time required to develop the software.
Ck is the state of technology constant reflects factors that affect programmer productivity
z Ck=2 for poor development environment
y no methodology, poor documentation, and review, etc.
z Ck=8 for good software development environment
y software engineering principles used
z Ck=11 for an excellent environment
z Putnam observed that:
y the time at which the Rayleigh curve reaches its maximum value
x corresponds to system testing and product release.
y After system testing,
x the number of project staff falls till product installation and delivery
y From the Rayleigh curve observe that:
x approximately 40% of the area under the Rayleigh curve is to the left of td
x and 60% to the right.
Effect of Schedule Change on Cost
Putnam’s method can be used to study the effect of changing the duration of a project. By using the
Putnam’s expression
❖ For the product same size
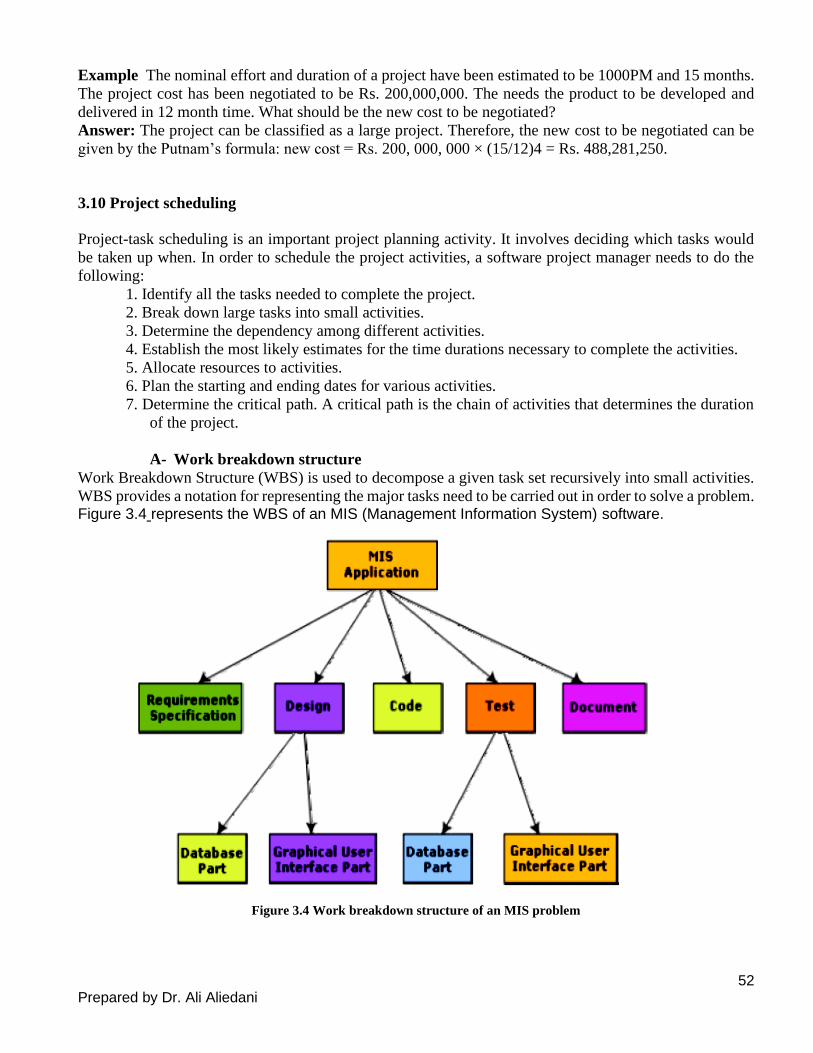
52 Prepared by Dr. Ali Aliedani
Example The nominal effort and duration of a project have been estimated to be 1000PM and 15 months.
The project cost has been negotiated to be Rs. 200,000,000. The needs the product to be developed and
delivered in 12 month time. What should be the new cost to be negotiated?
Answer: The project can be classified as a large project. Therefore, the new cost to be negotiated can be
given by the Putnam’s formula: new cost = Rs. 200, 000, 000 × (15/12)4 = Rs. 488,281,250.
3.10 Project scheduling
Project-task scheduling is an important project planning activity. It involves deciding which tasks would
be taken up when. In order to schedule the project activities, a software project manager needs to do the
following:
1. Identify all the tasks needed to complete the project.
2. Break down large tasks into small activities.
3. Determine the dependency among different activities.
4. Establish the most likely estimates for the time durations necessary to complete the activities.
5. Allocate resources to activities.
6. Plan the starting and ending dates for various activities.
7. Determine the critical path. A critical path is the chain of activities that determines the duration
of the project.
A- Work breakdown structure
Work Breakdown Structure (WBS) is used to decompose a given task set recursively into small activities.
WBS provides a notation for representing the major tasks need to be carried out in order to solve a problem. Figure 3.4 represents the WBS of an MIS (Management Information System) software.
Figure 3.4 Work breakdown structure of an MIS problem
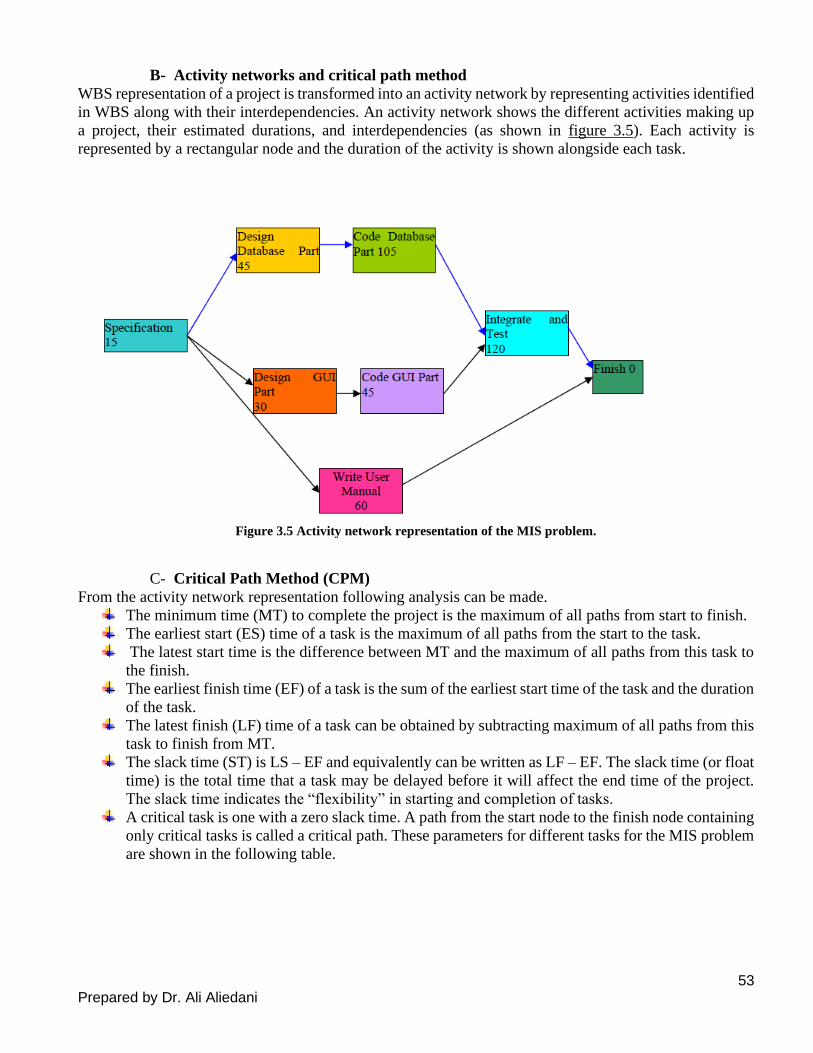
53 Prepared by Dr. Ali Aliedani
B- Activity networks and critical path method
WBS representation of a project is transformed into an activity network by representing activities identified
in WBS along with their interdependencies. An activity network shows the different activities making up
a project, their estimated durations, and interdependencies (as shown in figure 3.5). Each activity is
represented by a rectangular node and the duration of the activity is shown alongside each task.
Figure 3.5 Activity network representation of the MIS problem.
C- Critical Path Method (CPM)
From the activity network representation following analysis can be made.
The minimum time (MT) to complete the project is the maximum of all paths from start to finish.
The earliest start (ES) time of a task is the maximum of all paths from the start to the task.
The latest start time is the difference between MT and the maximum of all paths from this task to
the finish.
The earliest finish time (EF) of a task is the sum of the earliest start time of the task and the duration
of the task.
The latest finish (LF) time of a task can be obtained by subtracting maximum of all paths from this
task to finish from MT.
The slack time (ST) is LS – EF and equivalently can be written as LF – EF. The slack time (or float
time) is the total time that a task may be delayed before it will affect the end time of the project.
The slack time indicates the “flexibility” in starting and completion of tasks.
A critical task is one with a zero slack time. A path from the start node to the finish node containing
only critical tasks is called a critical path. These parameters for different tasks for the MIS problem
are shown in the following table.

54 Prepared by Dr. Ali Aliedani
D- Gantt chart
Gantt charts are mainly used to allocate resources to activities. The resources allocated to activities
include staff, hardware, and software. Gantt charts (named after its developer Henry Gantt) are
useful for resource planning.
A Gantt chart is a special type of bar chart where each bar represents an activity.
Figure 3.6 Gantt chart representation of the MIS problem

55 Prepared by Dr. Ali Aliedani
E- PERT chart
PERT (Project Evaluation and Review Technique) charts consist of a network of boxes and arrows. The
boxes represent activities and the arrows represent task dependencies. PERT chart represents the statistical
variations in the project estimates assuming a normal distribution. Thus, in a PERT chart instead of making
a single estimate for each task, pessimistic, likely, and optimistic estimates are made.
Gantt chart representation of a project schedule is helpful in planning the utilization of resources, while
PERT chart is useful for monitoring the timely progress of activities. Also, it is easier to identify parallel
activities in a project using a PERT chart. Project managers need to identify the parallel activities in a
project for assignment to different engineers.
Figure 3.7 PERT chart representation of the MIS problem
3.11 SOFTWARE-RISK ANALYSIS AND MANAGEMENT Risk analysis and management are a series of steps that help a software team to understand and manage
uncertainty.
A risk is a potential problem—it might happen, it might not. But, regardless of the outcome, it’s a really
good idea to identify it, assess its probability of occurrence, estimate its impact, and establish a contingency
plan should the problem actually occur.
Risk Management
Risk management is the area that tries to ensure that the impact of risks on cost, quality, and schedule is
minimal.
Dealing with concern before it becomes a crisis.
Quantify probability of failure & consequences of failure.
3.11.1 Typical Software Risk
Capers Jones has identified the top five risk factors that threaten projects in different applications.
1. Dependencies on outside agencies or factors.
56 Prepared by Dr. Ali Aliedani
• Availability of trained, experienced persons
• Inter group dependencies
• Customer-Furnished items or information
• Internal & external subcontractor relationships
2. Requirement issues
Uncertain requirements → Wrong product Or Right product badly
• Lack of clear product vision
• Unprioritized requirements
• Lack of agreement on product requirements
• New market with uncertain needs
• Rapidly changing requirements
• Inadequate Impact analysis of requirements changes
3. Management Issues
Project managers usually write the risk management plans, and most people do not wish to air their
weaknesses in public.
• Inadequate planning
• Inadequate visibility into actual project status
• Unclear project ownership and decision making
• Staff personality conflicts
• Unrealistic expectation
• Poor communication
4. Lack of knowledge
• Inadequate training
• Poor understanding of methods, tools, and techniques
• Inadequate application domain experience
• New Technologies
• Ineffective, poorly documented or neglected Processes
5. Other risk categories
• Unavailability of adequate testing facilities
• Turnover of essential personnel
• Unachievable performance requirements
• Technical approaches that may not work
3.11.2 Risk Management Activities
Risk Assessment
Identification of risks
Risk analysis involves examining how project outcomes might change with modification of risk input
variables.
Risk prioritization focus for severe risks.
Risk exposure: It is the product of the probability of incurring a loss due to the risk and the potential
magnitude of that loss.

57 Prepared by Dr. Ali Aliedani
Risk Control
Risk Management Planning produces a plan for dealing with each significant risks.
_ Record decision in the plan.
Risk resolution is the execution of the plans of dealing with each risk.
Exercises Q\ Describe the basic COCOMO model in detail.
Q\ Why does cost estimation play an important role in the software-development process?
Q\What is risk? Is it economical to do risk management? What is the effect of this activity on the overall
cost of the project?
Q\ What are the various reasons for poor/inacurate estimation?

58 Prepared by Dr. Ali Aliedani
4. REQUIREMENTS ANALYSIS AND
SPECIFICATION
Experienced developers take considerable time to understand the exact requirements of the customer and
to meticulously document those. They know that without a clear understanding of the problem and proper
documentation of the same, it is impossible to develop a satisfactory solution.
The goal of the requirements analysis and specification phase is to clearly understand the customer
requirements and to systematically organise the requirements into a document called the Software
Requirements Specification (SRS) document.
Requirements describe
What not How
Produces one large document written in natural language contains a description of what the system will do
without describing how it will do it.
Who carries out requirements analysis and specification?
Requirements analysis and specification activity is usually carried out by a few experienced members of
the development team and it normally requires them to spend some time at the customer site. The engineers
who gather and analyse customer requirements and then write the requirements specification document are
known as system analysts in the software industry parlance.
What are the main activities carried out during requirements analysis and
specification phase?
4.1 Requirements gathering
It is also popularly known as requirements elicitation. The primary objective of the requirements gathering
task is to collect the requirements from the stakeholders.
• A stakeholder is a source of the requirements and is usually a person, or a group of persons who
either directly or indirectly are concerned with the software.
The important ways in which an experienced analyst gathers requirements:
1. Studying existing documentation: The analyst usually studies all the available documents
regarding the system to be developed before visiting the customer site. Customers usually
provide statement of purpose (SoP) document to the developers. Typically these documents
might discuss issues such as the context in which the software is required, the basic purpose,
the stakeholders, features of any similar software developed elsewhere, etc.
2. Interview: Typically, there are many different categories of users of a software. Each
category of users typically requires a different set of features from the software. Therefore,

59 Prepared by Dr. Ali Aliedani
it is important for the analyst to first identify the different categories of users and then
determine the requirements of each.
For example, the different categories of users of a library automation software could be the library
members, the librarians, and the accountants.
3. Task analysis: The users usually have a black-box view of a software and consider the software
as something that provides a set of services (functionalities). A service supported by a software is
also called a task. We can therefore say that the software performs various tasks of the users. In this
context, the analyst tries to identify and understand the different tasks to be performed by the
software.
4. Scenario analysis: A task can have many scenarios of operation. The different scenarios of a
task may take place when the task is invoked under different situations. For different types of
scenarios of a task, the behaviour of the software can be different.
For example, the possible scenarios for the book issue task of a library automation software may be:
Book is issued successfully to the member and the book issue slip is printed.
The book is reserved, and hence cannot be issued to the member.
The maximum number of books that can be issued to the member is
already reached, and no more books can be issued to the member.
Some desirable attributes of a good requirements analyst:
–Good interaction skills,
–Imagination and creativity,
–Experience…
4.2 Requirements Analysis The main purpose of the requirements analysis activity is to analyse the gathered requirements to remove
all ambiguities, incompleteness, and inconsistencies from the gathered customer requirements and to obtain
a clear understanding of the software to be developed.
The following basic questions pertaining to the project should be clearly understood by the analyst before
carrying out analysis:
✓ What is the problem?
✓ Why is it important to solve the problem?
✓ What exactly are the data input to the system and what exactly are the data output by the system?
✓ What are the possible procedures that need to be followed to solve the problem?
✓ What are the likely complexities that might arise while solving the problem?
✓ If there are external software or hardware with which the developed software has to interface, then
what should be the data interchange formats with the external systems?
During requirements analysis, the analyst needs to identify and resolve three main types of problems in the
requirements:
Anomaly: It is an anomaly is an ambiguity in a requirement. When a requirement is anomalous, several
interpretations of that requirement are possible.
Example suppose one office clerk described the following requirement: during the final grade
computation, if any student scores a sufficiently low grade in a semester, then his parents would need to be

60 Prepared by Dr. Ali Aliedani
informed. This is clearly an ambiguous requirement as it lacks any well defined criterion as to what can be
considered as a “sufficiently low grade”.
Inconsistency: Two requirements are said to be inconsistent, if one of the requirements contradicts the
other. The following are two examples of inconsistent requirements.
Example: suppose one of the clerks gave the following requirement— a student securing fail grades in
three or more subjects must repeat the courses over an entire semester, and he cannot credit any other
courses while repeating the courses. Suppose another clerk expressed the following requirement—there is
no provision for any student to repeat a semester; the student should clear the subject by taking it as an
extra subject in any later semester. There is a clear inconsistency between the requirements given by the
two stakeholders.
Incompleteness: An incomplete set of requirements is one in which some requirements have been
overlooked. The lack of these features would be felt by the customer much later, possibly while using the
software. Often, incompleteness is caused by the inability of the customer to visualise the system that is to
be developed and to anticipate all the features that would be required.
Example: one of the clerks expressed the following—If a student secures a grade point average (GPA) of
less than 6, then the parents of the student must be intimated about the regrettable performance through a
(postal) letter as well as through e-mail. However, on an examination of all requirements, it was found that
there is no provision by which either the postal or e-mail address of the parents of the students can be
entered into the system. The feature that would allow entering the e-mail ids and postal addresses of the
parents of the students was missing, thereby making the requirements incomplete.
4.3 Software Requirements Specification •Main aim:
–Systematically organize the requirements arrived during requirements analysis.
–Document requirements properly.
- The SRS document usually contains all the user requirements in a structured though an informal form.
Users of SRS Document
Users, customers, and marketing personnel: These stakeholders need to refer to the SRS document to
ensure that the system as described in the document will meet their needs.
Software developers: The software developers refer to the SRS document to make sure that they are
developing exactly what is required by the customer.
Test engineers: The test engineers use the SRS document to understand the functionalities, and based on
this write the test cases to validate its working.
User documentation writers: The user documentation writers need to read the SRS document to ensure
that they understand the features of the product well enough to be able to write the users’ manuals.
Project managers: The project managers refer to the SRS document to ensure that they can estimate the
cost of the project easily by referring to the SRS document and that it contains all the information required
to plan the project.
Maintenance engineers: The SRS document helps the maintenance engineers to under- stand the
functionalities supported by the system.

61 Prepared by Dr. Ali Aliedani
Properties of a Good SRS Document
•It should be concise
–and at the same time should not be ambiguous.
•It should specify what the system must do
–and not say how to do it.
The SRS document should describe the system to be developed as a black box, and should specify only the
externally visible behaviour of the system. For this reason, the SRS document is also called the black-box
specification of the software being developed.
•Easy to change.,
–i.e. it should be well-structured.
•It should be consistent.
•It should be complete.
•It should be traceable
–You should be able to trace which part of the specification corresponds to which part of the design, code,
etc and vice versa.
•It should be verifiable
This means that it should be possible to design test cases based on the description of the functionality as to
whether or not requirements have been met in an implementation
–e.g. “system should be user friendly” is not verifiable
-On the other hand, the requirement—“When the name of a book is entered, the software should display
whether the book is available for issue or it has been loaned out” is verifiable.
SRS should not include...
•Project development plans
–E.g. cost, staffing, schedules, methods, tools, etc
•Product assurance plans
–Configuration Management, Verification & Validation, test plans, Quality Assurance, etc
•Different audiences
•Different lifetimes
•Designs
–Requirements and designs have different audiences
–Analysis and design are different areas of expertise

62 Prepared by Dr. Ali Aliedani
Important Categories of Customer Requirements
A good SRS document, should properly categorize and organise the requirements into different sections
[IEEE830]. As per the IEEE 830 guidelines, the important categories of user requirements are the
following.
Four important parts:
–Functional requirements,
–External Interfaces
–Non-functional requirements,
–Constraints
A- Functional Requirements
•Specifies all the functionality that the system should support
–Heart of the SRS document:
–Forms the bulk of the Document
•Outputs for the given inputs and the relationship between them
•Must specify behaviour for invalid inputs too!
Functional Requirement Documentation
•Overview
–describe purpose of the function and the approaches and techniques employed
•Inputs and Outputs
–sources of inputs and destination of outputs
–quantities, units of measure, ranges of valid inputs and outputs
–timing
•Processing
–validation of input data
–exact sequence of operations
–responses to abnormal situations
–any methods (eg. equations, algorithms) to be used to transform inputs to outputs
B- Non-functional Requirements
•Characteristics of the system which can not be expressed as functions:
•Maintainability,
•Portability,
•Usability,
•Security,
•Safety, etc.
•Reliability issues
•Performance issues:
–Example: How fast can the system produce results?
•At a rate that does not overload another system to which it supplies data, etc.
•Response time should be less than 1sec 90% of the time
•Needs to be measurable (verifiability)

63 Prepared by Dr. Ali Aliedani
C- Constraints
•Hardware to be used,
•Operating system
–or DBMS to be used
•Capabilities of I/O devices
•Standards compliance
•Data representations by the interfaced system
D- External Interface Requirements
•User interfaces
•Hardware interfaces
•Software interfaces
•Communications interfaces with other systems
•File export formats
4.4 IEEE 830-1998 Standard Title Table of Contents 1. Introduction
–1.1 Purpose –1.2 Scope –1.3 Definitions. Acronyms, and Abbreviations –1.4 References –1.5 Overview
2. Overall Description
–2.1 Product Perspective –2.2 Product Functions
–2.3 User Characteristics --Describe technical skills of each user class
–2.4 Constraints –2.5 Assumptions and Dependencies
3. Specific Requirements
–3.1 External Interfaces –3.2 Functions –3.3 Performance Requirements –3.4 Logical Database Requirements –3.5 Design Constraints –3.6 Software System Quality Attributes –3.7 Object Oriented Models
4. Appendices 5. Index
Summarize the major functional capabilities
•Include the Use Case Diagram and supporting narrative (identify actors and use cases)
•Include Data Flow Diagram if appropriate
. Identify the software product
•Enumerate what the system will and will not do
•Describe user classes and benefits for each
•Present the business case and
operational concept of the system
•Describe how the proposed system
fits into the business context
•Describe external interfaces: system,
user, hardware, software,
communication
•Describe constraints: memory,
operational, site adaptation
•Detail all inputs and
outputs(complement, not duplicate,
information presented in section 2)
•Examples: GUI screens, file formats
64 Prepared by Dr. Ali Aliedani
Example Section 3 of SRS of Academic Administration Software
3.1 Functional Requirements 3.1.1 Subject Registration
–The subject registration requirements are concerned with functions regarding subject registration which
includes students selecting, adding, dropping, and changing a subject.
•F-001:
–The system shall allow a student to register a subject.
•F-002:
–It shall allow a student to drop a course.
•F-003:
–It shall support checking how many students have already registered for a course.
•3.2 Design Constraints
•C-001:
–AAS shall provide user interface through standard web browsers.
•C-002:
–AAS shall use an open source RDBMS such as Postgres SQL.
•C-003:
–AAS shall be developed using the JAVA programming language
3.3 Non-Functional Requirements
•N-001:
–AAS shall respond to query in less than 5 seconds.
•N-002:
–AAS shall operate with zero down time.
•N-003:
–AAS shall allow upto100users to remotely connect to the system.
•N-004:
–The system will be accompanied by a well-written user manual.
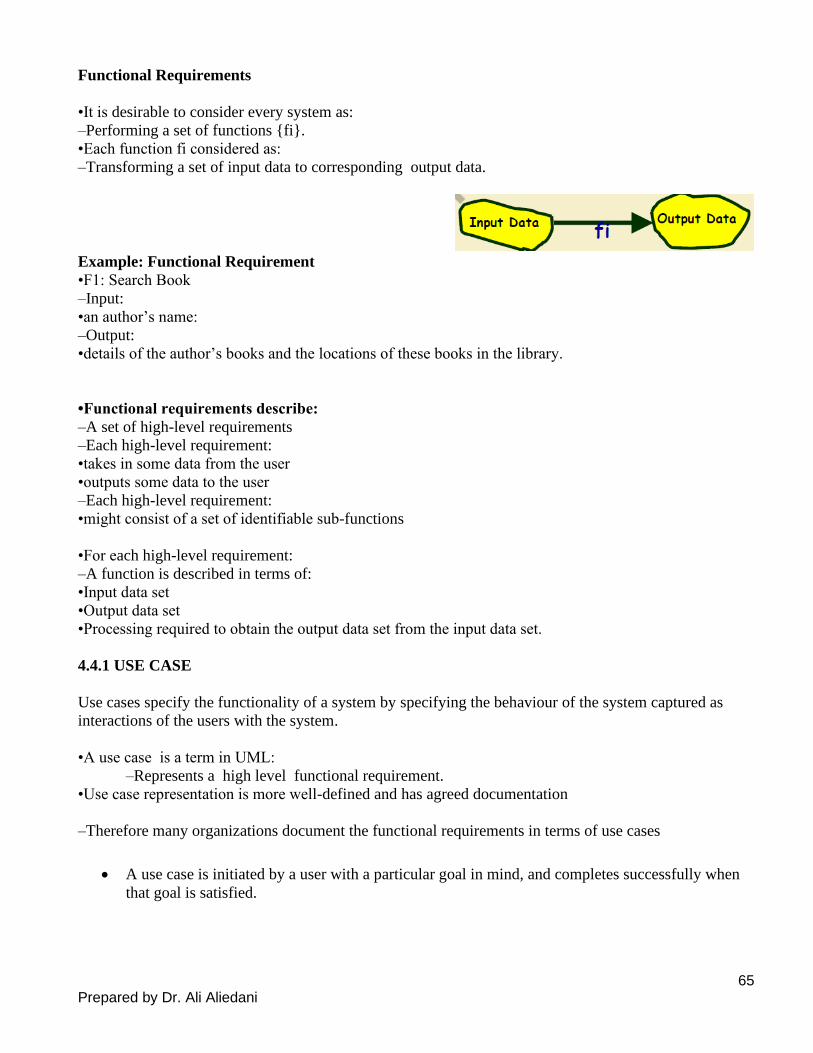
65 Prepared by Dr. Ali Aliedani
Functional Requirements
•It is desirable to consider every system as:
–Performing a set of functions {fi}.
•Each function fi considered as:
–Transforming a set of input data to corresponding output data.
Example: Functional Requirement
•F1: Search Book
–Input:
•an author’s name:
–Output:
•details of the author’s books and the locations of these books in the library.
•Functional requirements describe:
–A set of high-level requirements
–Each high-level requirement:
•takes in some data from the user
•outputs some data to the user
–Each high-level requirement:
•might consist of a set of identifiable sub-functions
•For each high-level requirement:
–A function is described in terms of:
•Input data set
•Output data set
•Processing required to obtain the output data set from the input data set.
4.4.1 USE CASE
Use cases specify the functionality of a system by specifying the behaviour of the system captured as
interactions of the users with the system.
•A use case is a term in UML:
–Represents a high level functional requirement.
•Use case representation is more well-defined and has agreed documentation
–Therefore many organizations document the functional requirements in terms of use cases
• A use case is initiated by a user with a particular goal in mind, and completes successfully when
that goal is satisfied.
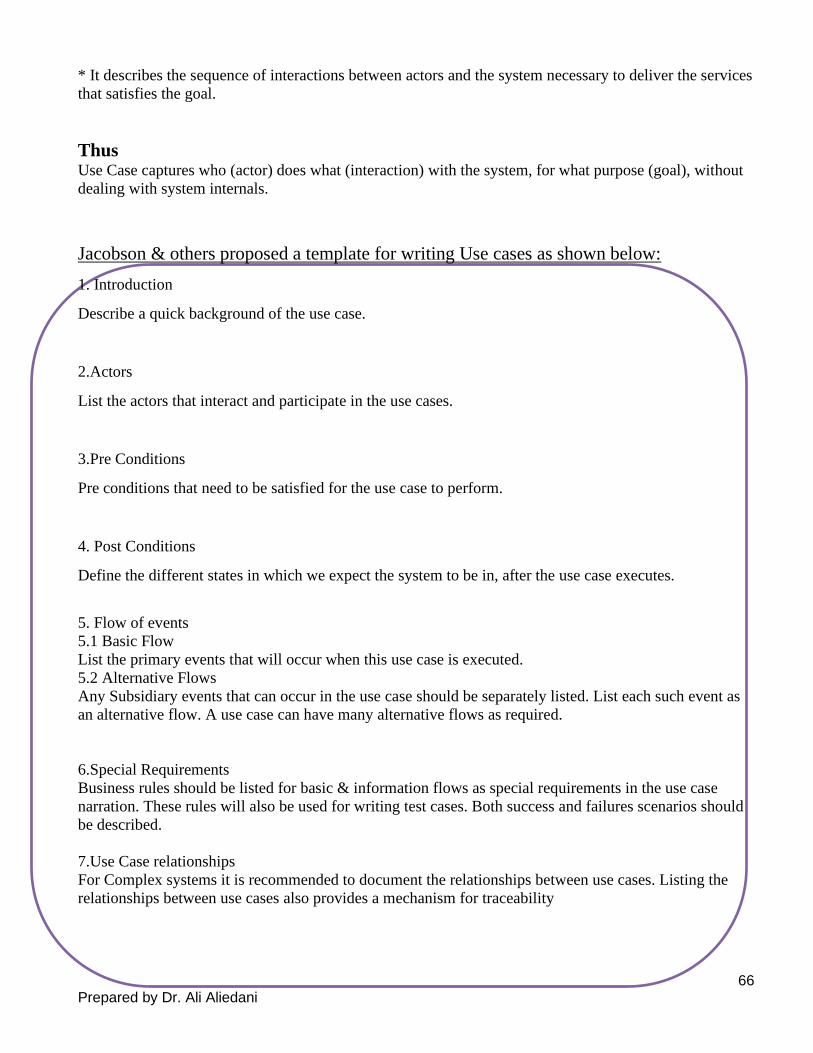
66 Prepared by Dr. Ali Aliedani
* It describes the sequence of interactions between actors and the system necessary to deliver the services
that satisfies the goal.
Thus Use Case captures who (actor) does what (interaction) with the system, for what purpose (goal), without
dealing with system internals.
Jacobson & others proposed a template for writing Use cases as shown below:
1. Introduction
Describe a quick background of the use case.
2.Actors
List the actors that interact and participate in the use cases.
3.Pre Conditions
Pre conditions that need to be satisfied for the use case to perform.
4. Post Conditions
Define the different states in which we expect the system to be in, after the use case executes.
5. Flow of events
5.1 Basic Flow
List the primary events that will occur when this use case is executed.
5.2 Alternative Flows
Any Subsidiary events that can occur in the use case should be separately listed. List each such event as
an alternative flow. A use case can have many alternative flows as required.
6.Special Requirements
Business rules should be listed for basic & information flows as special requirements in the use case
narration. These rules will also be used for writing test cases. Both success and failures scenarios should
be described.
7.Use Case relationships
For Complex systems it is recommended to document the relationships between use cases. Listing the
relationships between use cases also provides a mechanism for traceability

67 Prepared by Dr. Ali Aliedani
Use Case Guidelines
1. Identify all users
2. Create a user profile for each category of users including all roles of the users play that are relevant to
the system.
3. Create a use case for each goal, following the use case template maintain the same level of abstraction
throughout the use case. Steps in higher level use cases may be treated as goals for lower level (i.e. more
detailed), subuse cases.
4. Structure the use case
5. Review and validate with users.
4.4.2 Use case Diagrams
-- represents what happens when actor interacts with a system.
-- captures functional aspect of the system.
-- Actors appear outside the rectangle.
--Use cases within rectangle providing functionality.
--Relationship association is a solid line between actor & use
cases.
*Use cases should not be used to capture all the details of the system.
Example: Use case diagram for Result Management System

68 Prepared by Dr. Ali Aliedani
1. Maintain student Details
Add/Modify/update students details like name, address.
2.Maintain subject Details
Add/Modify/Update Subject information semester wise
3.Maintain Result Details
Include entry of marks and assignment of credit points for each
paper.
4. Login
Use to Provide way to enter through user id & password.
5. Generate Result Report
Use to print various reports
6. View Result
(i) According to course code
(ii) According to Enrollment number/roll number
Login
1.1 Introduction : This use case describes how a user logs into the Result Management System.
1.2 Actors : (i) Data Entry Operator
(ii) Administrator/Deputy Registrar
1.3 Pre Conditions : None
1.4 Post Conditions : If the use case is successful, the actor is logged into the system. If not, the system
state is unchanged.
1.5 Basic Flow : This use case starts when the actor wishes to login to the Result Management system.
(i) System requests that the actor enter his/her name and password.
(ii) The actor enters his/her name & password.
(iii) System validates name & password, and if finds correct allow the actor to logs into the system.
1.6 Alternate Flows
1.6.1 Invalid name & password
If in the basic flow, the actor enters an invalid name and/or password, the system displays an error
message. The actor can choose to either return to the beginning of the basic flow or cancel the login, at
that point, the use case ends.
1.7 Special Requirements:
None
1.8 Use case Relationships:
None
2.Maintain student details
2.1 Introduction : Allow DEO to maintain student details. This includes adding, changing and deleting
student information
2.2 Actors : DEO
2.3 Pre-Conditions: DEO must be logged onto the system before this use case begins.
2.4 Post-conditions : If use case is successful, student information is added/updated/deleted from the
system. Otherwise, the system state is unchanged.
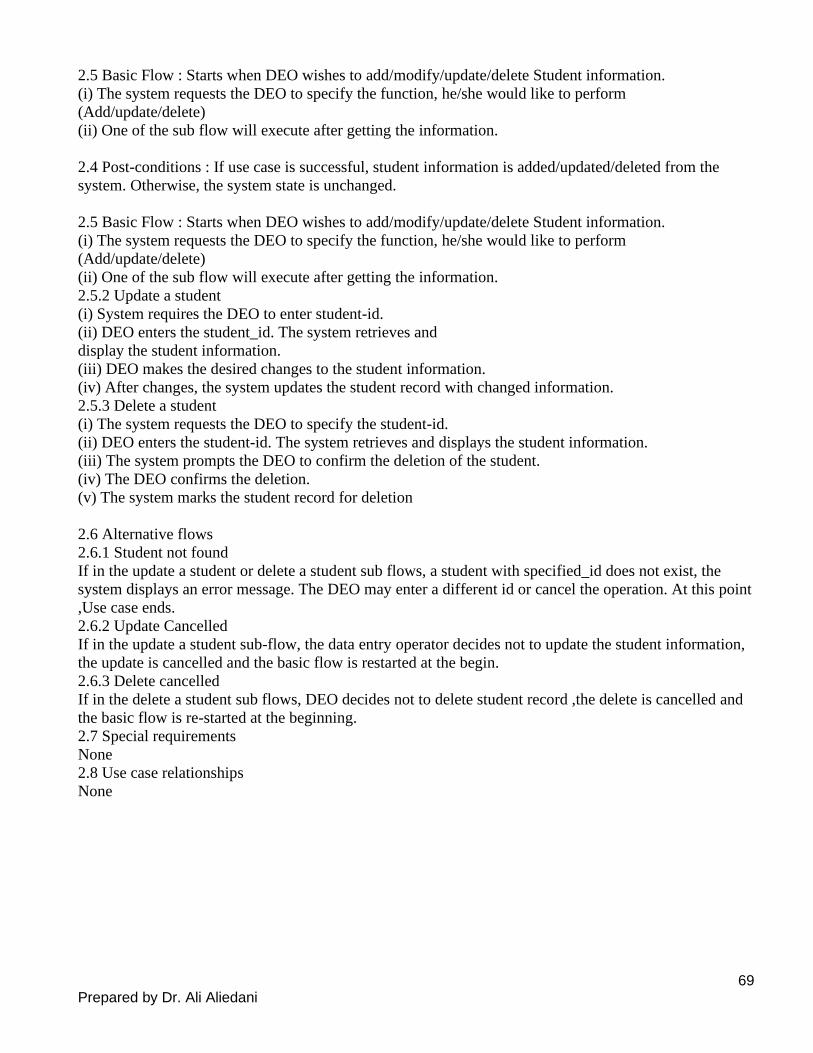
69 Prepared by Dr. Ali Aliedani
2.5 Basic Flow : Starts when DEO wishes to add/modify/update/delete Student information.
(i) The system requests the DEO to specify the function, he/she would like to perform
(Add/update/delete)
(ii) One of the sub flow will execute after getting the information.
2.4 Post-conditions : If use case is successful, student information is added/updated/deleted from the
system. Otherwise, the system state is unchanged.
2.5 Basic Flow : Starts when DEO wishes to add/modify/update/delete Student information.
(i) The system requests the DEO to specify the function, he/she would like to perform
(Add/update/delete)
(ii) One of the sub flow will execute after getting the information.
2.5.2 Update a student
(i) System requires the DEO to enter student-id.
(ii) DEO enters the student_id. The system retrieves and
display the student information.
(iii) DEO makes the desired changes to the student information.
(iv) After changes, the system updates the student record with changed information.
2.5.3 Delete a student
(i) The system requests the DEO to specify the student-id.
(ii) DEO enters the student-id. The system retrieves and displays the student information.
(iii) The system prompts the DEO to confirm the deletion of the student.
(iv) The DEO confirms the deletion.
(v) The system marks the student record for deletion
2.6 Alternative flows
2.6.1 Student not found
If in the update a student or delete a student sub flows, a student with specified_id does not exist, the
system displays an error message. The DEO may enter a different id or cancel the operation. At this point
,Use case ends.
2.6.2 Update Cancelled
If in the update a student sub-flow, the data entry operator decides not to update the student information,
the update is cancelled and the basic flow is restarted at the begin.
2.6.3 Delete cancelled
If in the delete a student sub flows, DEO decides not to delete student record ,the delete is cancelled and
the basic flow is re-started at the beginning.
2.7 Special requirements
None
2.8 Use case relationships
None
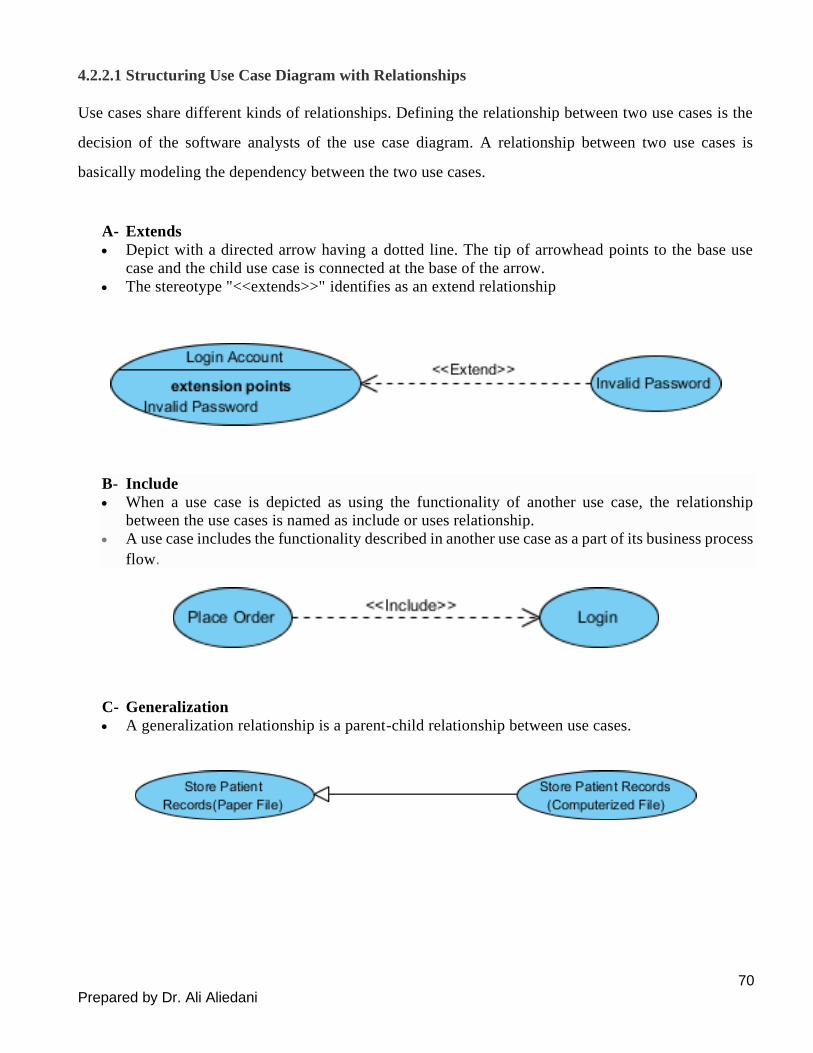
70 Prepared by Dr. Ali Aliedani
4.2.2.1 Structuring Use Case Diagram with Relationships
Use cases share different kinds of relationships. Defining the relationship between two use cases is the
decision of the software analysts of the use case diagram. A relationship between two use cases is
basically modeling the dependency between the two use cases.
A- Extends
• Depict with a directed arrow having a dotted line. The tip of arrowhead points to the base use
case and the child use case is connected at the base of the arrow.
• The stereotype "<<extends>>" identifies as an extend relationship
B- Include
• When a use case is depicted as using the functionality of another use case, the relationship
between the use cases is named as include or uses relationship.
• A use case includes the functionality described in another use case as a part of its business process
flow.
C- Generalization
• A generalization relationship is a parent-child relationship between use cases.
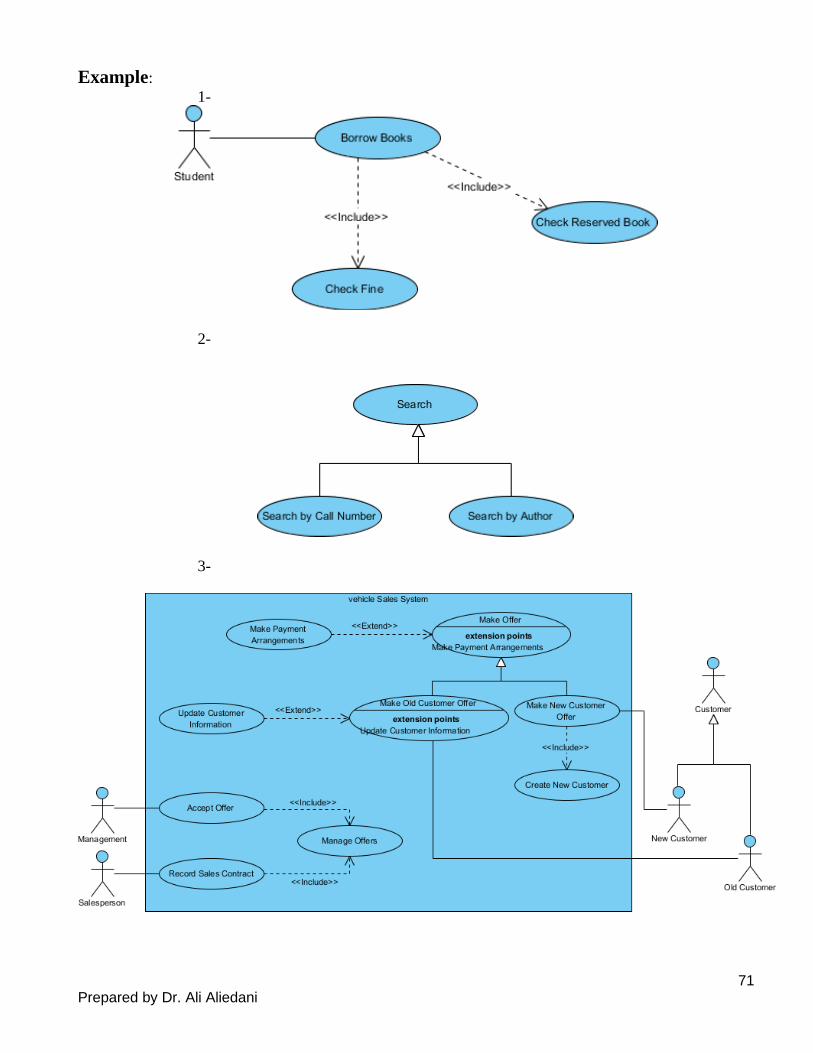
71 Prepared by Dr. Ali Aliedani
Example:
1-
2-
3-
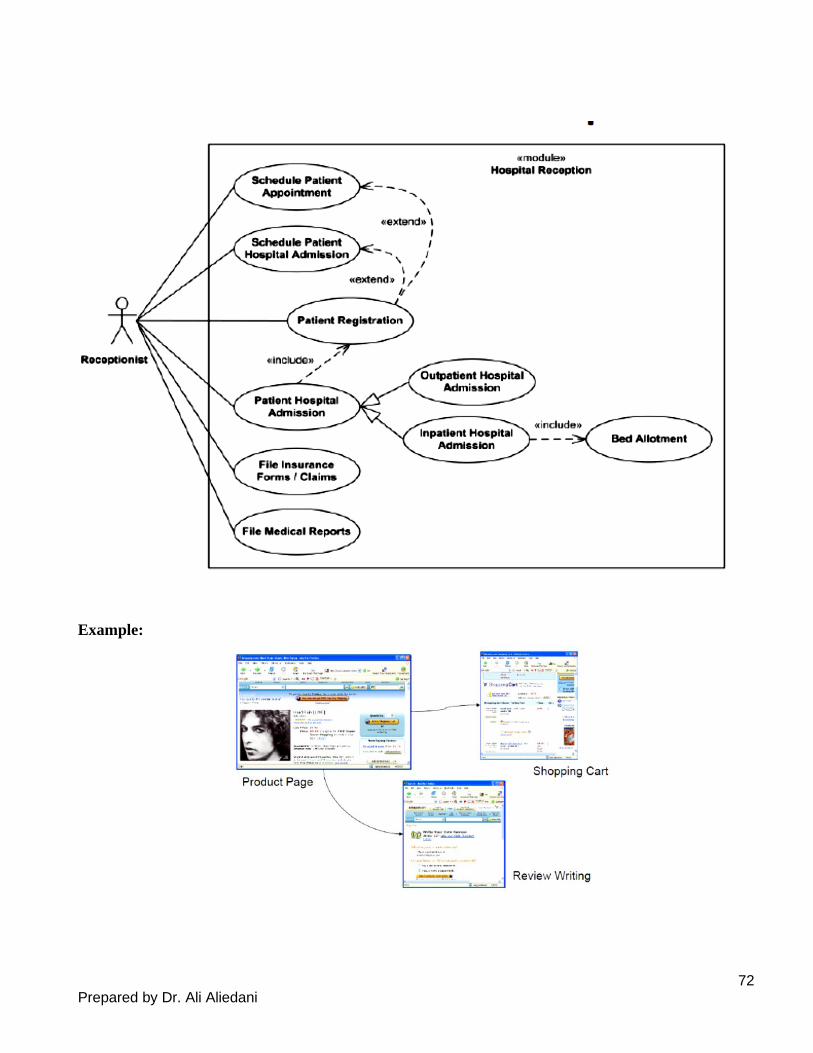
72 Prepared by Dr. Ali Aliedani
Example:

73 Prepared by Dr. Ali Aliedani

74 Prepared by Dr. Ali Aliedani
4.5 Representation of complex processing logic
•Decision trees
•Decision tables
A- Decision Tree offers a graphic read of the processing logic concerned in a higher
cognitive process and therefore the corresponding actions are taken.
–Edges of a decision tree represent conditions
–Leaf nodes represent actions to be performed.
B- Decision Table
•Decision tables specify:
–Which variables are to be tested
–What actions are to be taken if the conditions are true,
–The order in which decision making is performed.
•Upper rows of the table specify:
–The variables or conditions to be evaluated
•Lower rows specify:
–The actions to be taken when the corresponding conditions are satisfied.

75 Prepared by Dr. Ali Aliedani
Example:
Example:

76 Prepared by Dr. Ali Aliedani
Chapter
5
SOFTWARE DESIGN
The activities carried out during the design phase (called as design process) transform the SRS document
into the design document.
Figure 5.1: The design process.
5.1 OVERVIEW OF THE DESIGN PROCESS
5.1.1 Outcome of the Design Process The following items are designed and documented during the design phase.
Different modules required: The different modules in the solution should be clearly identified. Each
module is a collection of functions and the data shared by the functions of the module. Each module should
accomplish some well-defined task out of the overall responsibility of the software. Each module should
be named according to the task it performs.
Control relationships among modules: A control relationship between two modules essentially arises
due to function calls across the two modules.
Interfaces among different modules: The interfaces between two modules identifies the exact data items
that are exchanged between the two modules when one module invokes a function of the other module.
Data structures of the individual modules: Each module normally stores some data that the functions of
the module need to share to accomplish the overall responsibility of the module. Suitable data structures
for storing and managing the data of a module need to be properly designed and documented.
Algorithms required to implement the individual modules: Each function in a module usually performs
some processing activity. The algorithms required to accomplish the processing activities of various
modules need to be carefully designed and documented with due considerations given to the accuracy of
the results, space and time complexities.
77 Prepared by Dr. Ali Aliedani
5.1.2 Classification of Design Activities
A good software design is seldom realised by using a single step procedure, rather it requires iterating over
a series of steps called the design activities. We can broadly classify them into two important stages.
• Preliminary (or high-level) design
Identify:
–modules
–control relationships among modules
–interfaces among modules.
The outcome of high-level design:
–program structure, also called software architecture.
• Detailed design
For each module, design for it:
–data structure
–algorithms
•Outcome of detailed design:
–module specification.
5.2 What Is a Good Software Design?
•There is no unique way to design a software.
•Even while using the same design methodology:
–different engineers can arrive at very different designs.
•Need to determine which is a better design.
But:
•Should implement all functionalities of the system correctly.
•Should be easily understandable.
•Should be efficient.
•Should be easily amenable to change,
–i.e. easily maintainable.
–a design that is easy to understand:
• Also easy to maintain and change.

78 Prepared by Dr. Ali Aliedani
How to Improve Understandability?
•Use consistent and meaningful names
–for various design components,
•Design solution should consist of:
–A set of well decomposed modules(modularity),
•Different modules should be neatly arranged in a hierarchy:
–A tree-like diagram.
–Called Layering
5.2.1 Modularity
•Modularity is a fundamental attributes of any good design.
–Decomposition of a problem into a clean set of modules:
–Modules are almost independent of each other
–Based on divide and conquer principle.
If modules are independent:
–Each module can be understood separately,
•reduces complexity greatly.
–To understand why this is so,
•remember that it is very difficult to break a bunch of sticks but very easy to break the sticks individually.
Q\ how can we compare the modularity of two alternate design solutions?
Figure 5.2 Two design solutions to the same problem
A design solution is said to be highly modular, if the different modules in the solution have high cohesion
and their inter-module couplings are low.
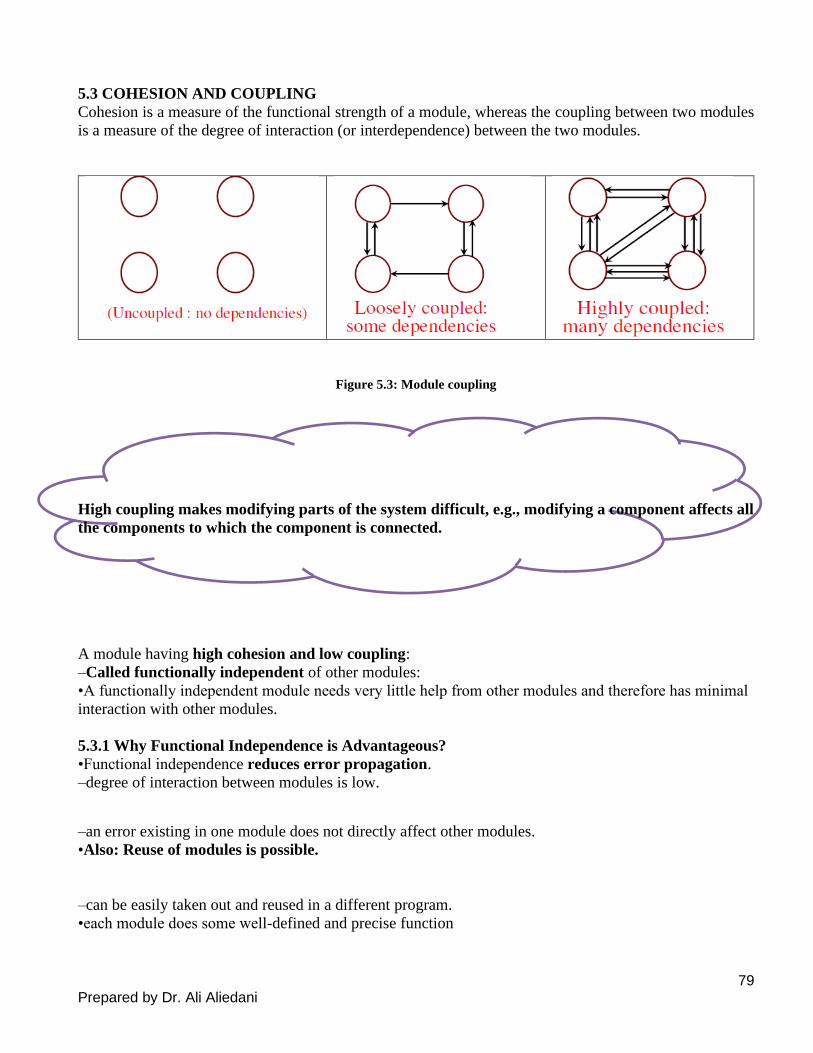
79 Prepared by Dr. Ali Aliedani
5.3 COHESION AND COUPLING
Cohesion is a measure of the functional strength of a module, whereas the coupling between two modules
is a measure of the degree of interaction (or interdependence) between the two modules.
Figure 5.3: Module coupling
High coupling makes modifying parts of the system difficult, e.g., modifying a component affects all
the components to which the component is connected.
A module having high cohesion and low coupling:
–Called functionally independent of other modules:
•A functionally independent module needs very little help from other modules and therefore has minimal
interaction with other modules.
5.3.1 Why Functional Independence is Advantageous?
•Functional independence reduces error propagation.
–degree of interaction between modules is low.
–an error existing in one module does not directly affect other modules.
•Also: Reuse of modules is possible.
–can be easily taken out and reused in a different program.
•each module does some well-defined and precise function

80 Prepared by Dr. Ali Aliedani
•the interfaces of a module with other modules is simple and minimal.
5.3.2 Measuring Functional Independence
•Unfortunately, there are no ways:
–to quantitatively measure the degree of cohesion and coupling:
–At least classification of different kinds of cohesion and coupling:
•will give us some idea regarding the degree of cohesiveness of a
module.
5.3.3 Classification of Cohesiveness
•Classification can have scope for ambiguity:
–yet gives us some idea about cohesiveness of a module.
•By examining the type of cohesion exhibited by a module:
–we can roughly tell whether it displays high cohesion or low cohesion.
Figure 5.4 classification of cohesion
Functional Cohesion
_ A and B are part of a single functional task. This is very good reason for them to be contained in the
same procedure.
Sequential Cohesion
_ Module A outputs some data which forms the input to B. This is the reason for them to be contained in
the same procedure.
Communicational cohesion
•All functions of the module:
–Reference or update the same data structure,
•Example:
–The set of functions defined on an array or a stack.

81 Prepared by Dr. Ali Aliedani
handle-Student-Data() {
Static StructStudent-data[10000];
Store-student-data();
Search-Student-data();
Print-all-students();
};
Procedural Cohesion
Procedural Cohesion occurs in modules whose instructions although accomplish different tasks yet have
been combined because there is a specific order in which the tasks are to be completed.
–certain sequence of steps have to be carried out in a certain order for achieving an objective,
•e.g. the algorithm for decoding a message.
Temporal Cohesion
_Module exhibits temporal cohesion when it contains
tasks that are related by the fact that all tasks must be
executed in the same time-span.
•Example:
–The set of functions responsible for
•initialization,
•start-up, shut-down of some process, etc.
init() {
Check-memory();
Check-Hard-disk();
Initialize-Ports();
Display-Login-Screen();
}
Logical Cohesion
•All elements of the module perform similar operations:
–e.g. error handling, data input, data output, etc.
•An example of logical cohesion:
–a set of print functions to generate an output report arranged into a single module.
module print{
void print-grades(student-file){ …}
void print-certificates(student-file){…}
void print-salary(teacher-file){…}
}
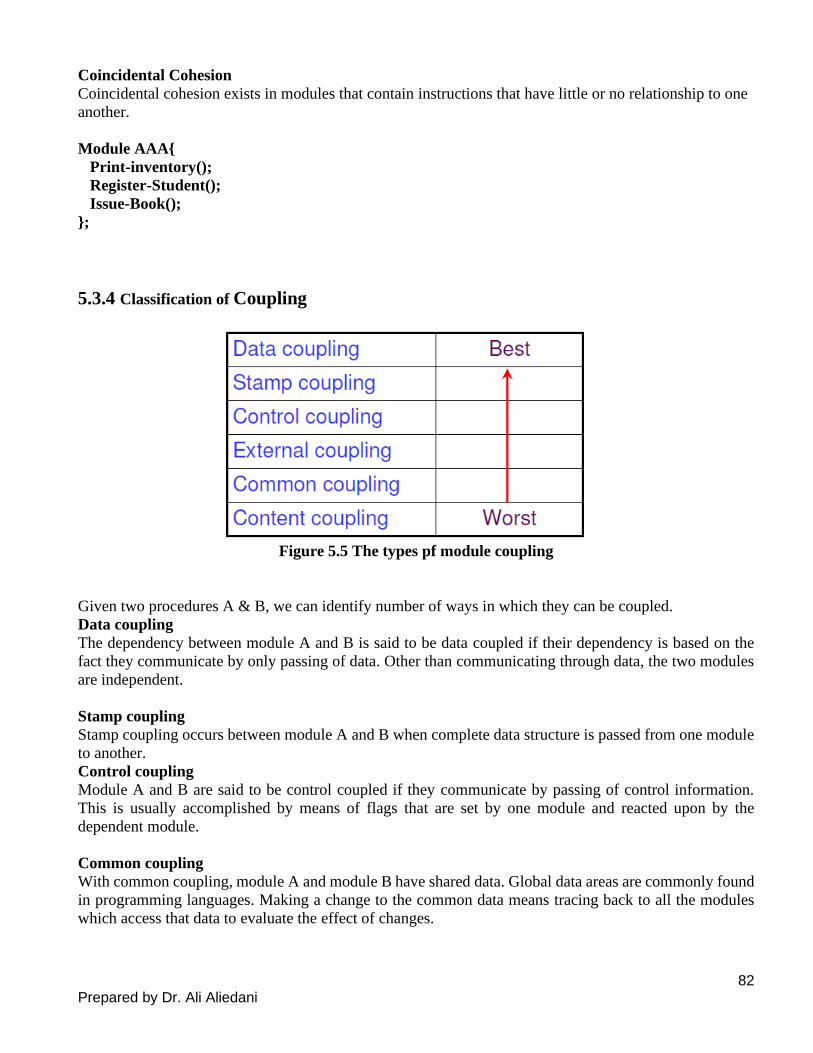
82 Prepared by Dr. Ali Aliedani
Coincidental Cohesion
Coincidental cohesion exists in modules that contain instructions that have little or no relationship to one
another.
Module AAA{
Print-inventory();
Register-Student();
Issue-Book();
};
5.3.4 Classification of Coupling
Figure 5.5 The types pf module coupling
Given two procedures A & B, we can identify number of ways in which they can be coupled.
Data coupling
The dependency between module A and B is said to be data coupled if their dependency is based on the
fact they communicate by only passing of data. Other than communicating through data, the two modules
are independent.
Stamp coupling
Stamp coupling occurs between module A and B when complete data structure is passed from one module
to another.
Control coupling
Module A and B are said to be control coupled if they communicate by passing of control information.
This is usually accomplished by means of flags that are set by one module and reacted upon by the
dependent module.
Common coupling
With common coupling, module A and module B have shared data. Global data areas are commonly found
in programming languages. Making a change to the common data means tracing back to all the modules
which access that data to evaluate the effect of changes.
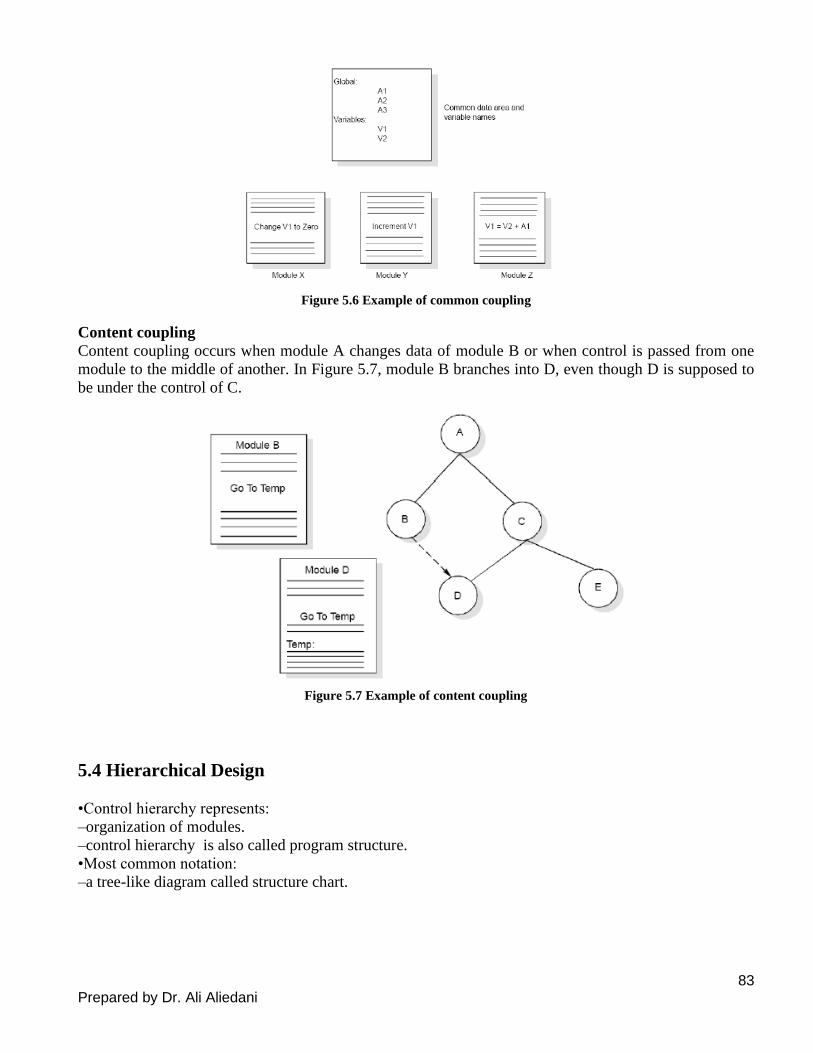
83 Prepared by Dr. Ali Aliedani
Figure 5.6 Example of common coupling
Content coupling
Content coupling occurs when module A changes data of module B or when control is passed from one
module to the middle of another. In Figure 5.7, module B branches into D, even though D is supposed to
be under the control of C.
Figure 5.7 Example of content coupling
5.4 Hierarchical Design
•Control hierarchy represents:
–organization of modules.
–control hierarchy is also called program structure.
•Most common notation:
–a tree-like diagram called structure chart.

84 Prepared by Dr. Ali Aliedani
Good Hierarchical Arrangement of modules
•Essentially means:
–low fan-out
–abstraction
Characteristics of Module Structure
•Depth:
–number of levels of control
•Width:
–overall span of control.
•Fan-out:
–a measure of the number of modules directly controlled by given
module.
•Fan-in:
–indicates how many modules directly invoke a given module.
–High fan-in represents code reuse and is in general encouraged.
• Visibility: A module B is said to be visible to another module A, if A directly calls B. Thus, only
the immediately lower layer modules are said to be visible to a module.
• Control abstraction: In a layered design, a module should only invoke the functions of the
modules that are in the layer immediately below it. In other words, the modules at the higher layers,
should not be visible.
Goodness of Design
•A design having modules:
–with high fan-out numbers is not a good design.
–a module having high fan-out lacks cohesion.
•A module that controls another module:
–said to be superordinate to the later module.
•Conversely, a module controlled by another module:
–said to be subordinate to the later module.
85 Prepared by Dr. Ali Aliedani
5.5 Classification of Design Methodologies
The design activities vary considerably based on the specific design methodology being used. A large
number of software design methodologies are available. We can roughly classify these methodologies into
procedural and object-oriented approaches.
5.5.1 Function-oriented Design
The following are the salient features of the function-oriented design approach:
Top-down decomposition: A system, to start with, is viewed as a black box that provides certain services
(also known as high-level functions) to the users of the system.
For example, consider a function create-new-library member.
This high-level function may be refined into the following subfunctions:
• assign-membership-number
• create-member-record
• print-bill
Each of these subfunctions may be split into more detailed subfunctions and so on.
Centralised system state: The system state can be defined as the values of certain data items that determine
the response of the system to a user action or external event.
For example, in the library management system, several functions such as the following share data such
as member-records for reference and updation:
• create-new-member
• delete-member
• update-member-record
Design Notations
Design notations are largely meant to be used during the process of design and are used to represent design
or design decisions.
For a function-oriented design, the design can be represented graphically or mathematically by the
following:
❖ Data flow diagrams
❖ Data Dictionaries
❖ Structure Charts
❖ Pseudocode
5.5.2 Object-oriented Design
In the object-oriented design (OOD) approach, a system is viewed as being made up of a collection of
objects (i.e. entities).
• Each object is associated with a set of functions that are called its methods.
• Each object contains its own data and is responsible for managing it.

86 Prepared by Dr. Ali Aliedani
• The data internal to an object cannot be accessed directly by other objects and only through
invocation of the methods of the object.
• The system state is decentralised since there is no globally shared data in the system and data is
stored in each object.
For example, in a library automation software, each library member may be a separate object with its own
data and functions to operate on the stored data.
→ Bottom-up approach
→ Carried out using UML
5.5.3 Object-Oriented versus Function-Oriented Design
Grady Boochsums up this fundamental difference saying:
–“Identify verbs if you are after procedural design and nouns if you are after object-oriented
design.”
•In OOD:
–software is not developed by designing functions such as:
•update-employee-record,
•get-employee-address, etc.
–but by designing objects such as:
•employees,
•departments, etc.
•In OOD:
–state information is not shared in a centralized data.
–but is distributed among the objects of the system.
Example
•In an employee pay-roll system, the following can be global data:
–names of the employees,
–their code numbers,
–basic salaries, etc.
•In contrast, in object oriented systems:
–data is distributed among different employee objects of the system.
•Objects communicate by message passing.
–one object may discover the state information of another object by interrogating it.

87 Prepared by Dr. Ali Aliedani
5.6 Unified Modeling Language (UML)
The Unified Modeling Language (UML) is a general-purpose, developmental, modeling language in the
field of software engineering that is intended to provide a standard way to visualize the design of a system.
• UML is a modelling language
Not a system design or development methodology
•
• Used to document object-oriented analysis and design results.
• Independent of any specific design methodology.
• Adopted by Object Management Group (OMG) in 1997.
➔ OMG is an association of industries
• In 2005, UML was also published by the International Organization for Standardization (ISO) as
an approved ISO standard.
Why are UML Models Required?
o Modelling is an abstraction mechanism:
• Capture only important aspects and ignores the rest.
• Different models obtained when different aspects are ignored.
o An effective mechanism to handle complexity.
o UML is a graphical modelling technique.
o Easy to understand and construct.
5.6.1 UML Diagrams
Nine diagrams in UML1.x :
✓ Used to capture 5 different views of a system:
User’s view (Use Case Diagram)
Structural view (Class Diagram, Object Diagram)
Behavioral view (Sequence Diagram, Collaboration Diagram, State-chart Diagram,
Activity Diagram)
Implementation view (Component Diagram)
Environmental view (Deployment Diagram)
✓ Views: Provide different perspectives of a software system.
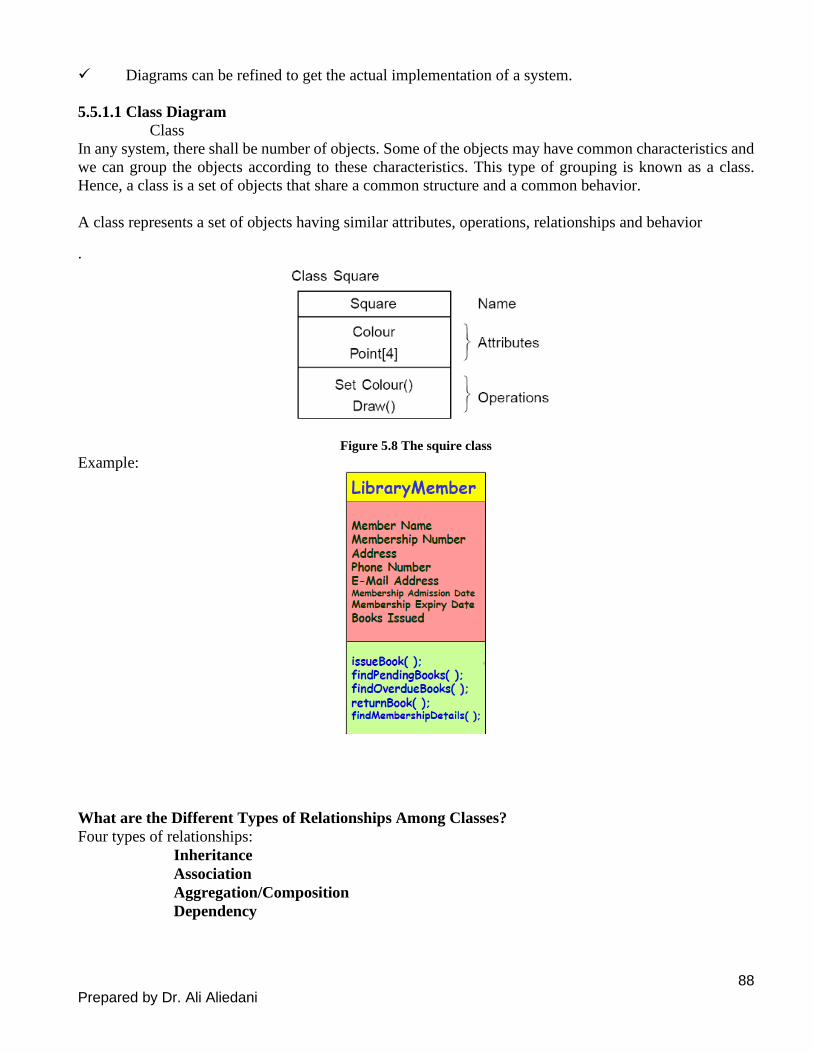
88 Prepared by Dr. Ali Aliedani
✓ Diagrams can be refined to get the actual implementation of a system.
5.5.1.1 Class Diagram
Class
In any system, there shall be number of objects. Some of the objects may have common characteristics and
we can group the objects according to these characteristics. This type of grouping is known as a class.
Hence, a class is a set of objects that share a common structure and a common behavior.
A class represents a set of objects having similar attributes, operations, relationships and behavior
.
Figure 5.8 The squire class
Example:
What are the Different Types of Relationships Among Classes?
Four types of relationships:
Inheritance
Association
Aggregation/Composition
Dependency
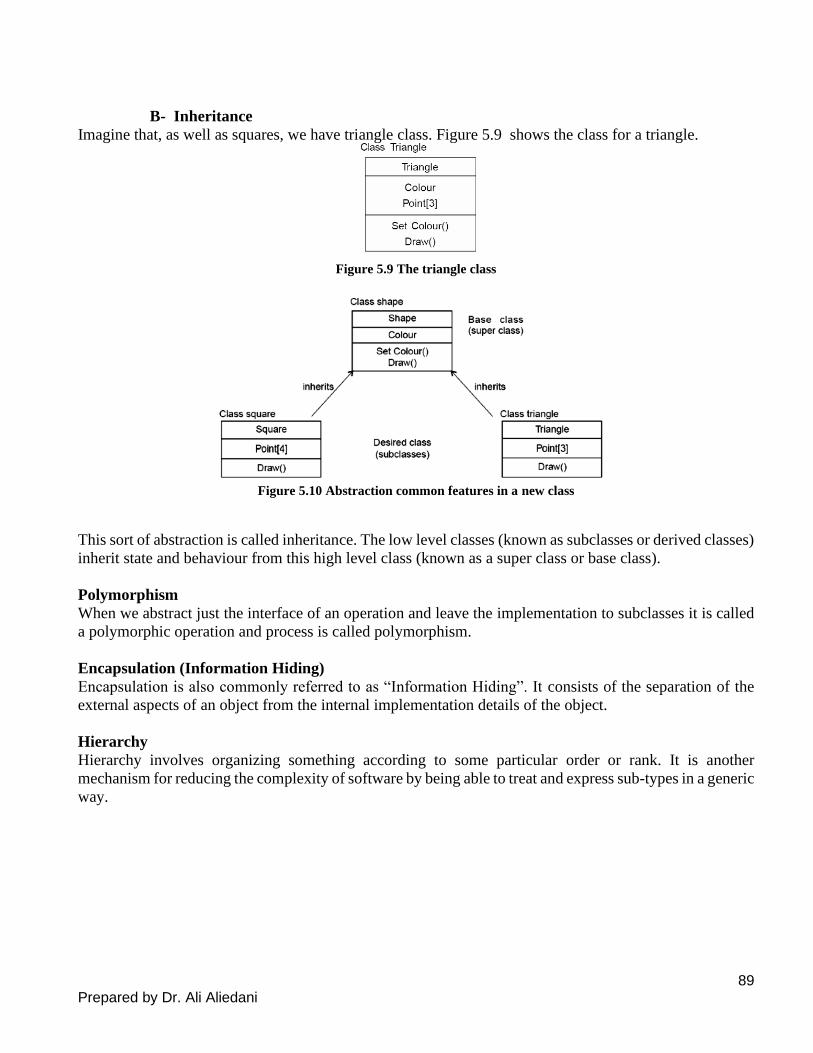
89 Prepared by Dr. Ali Aliedani
B- Inheritance
Imagine that, as well as squares, we have triangle class. Figure 5.9 shows the class for a triangle.
Figure 5.9 The triangle class
Figure 5.10 Abstraction common features in a new class
This sort of abstraction is called inheritance. The low level classes (known as subclasses or derived classes)
inherit state and behaviour from this high level class (known as a super class or base class).
Polymorphism
When we abstract just the interface of an operation and leave the implementation to subclasses it is called
a polymorphic operation and process is called polymorphism.
Encapsulation (Information Hiding)
Encapsulation is also commonly referred to as “Information Hiding”. It consists of the separation of the
external aspects of an object from the internal implementation details of the object.
Hierarchy
Hierarchy involves organizing something according to some particular order or rank. It is another
mechanism for reducing the complexity of software by being able to treat and express sub-types in a generic
way.
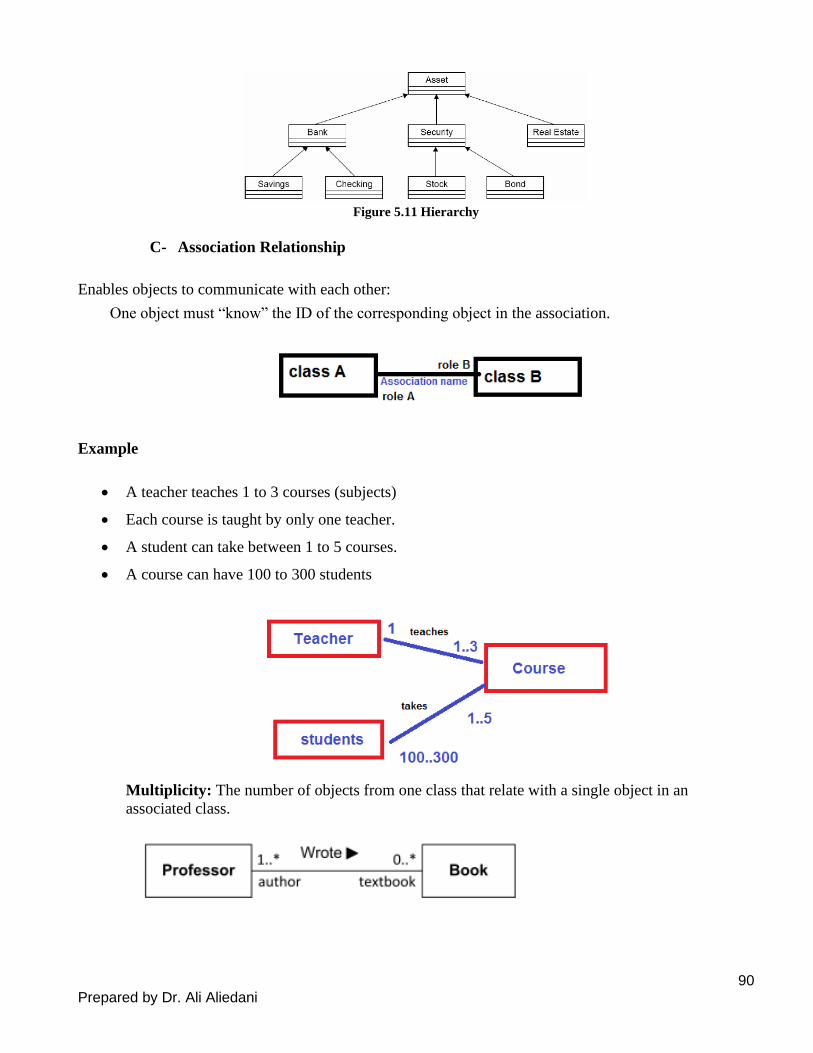
90 Prepared by Dr. Ali Aliedani
Figure 5.11 Hierarchy
C- Association Relationship
Enables objects to communicate with each other:
One object must “know” the ID of the corresponding object in the association.
Example
• A teacher teaches 1 to 3 courses (subjects)
• Each course is taught by only one teacher.
• A student can take between 1 to 5 courses.
• A course can have 100 to 300 students
Multiplicity: The number of objects from one class that relate with a single object in an
associated class.
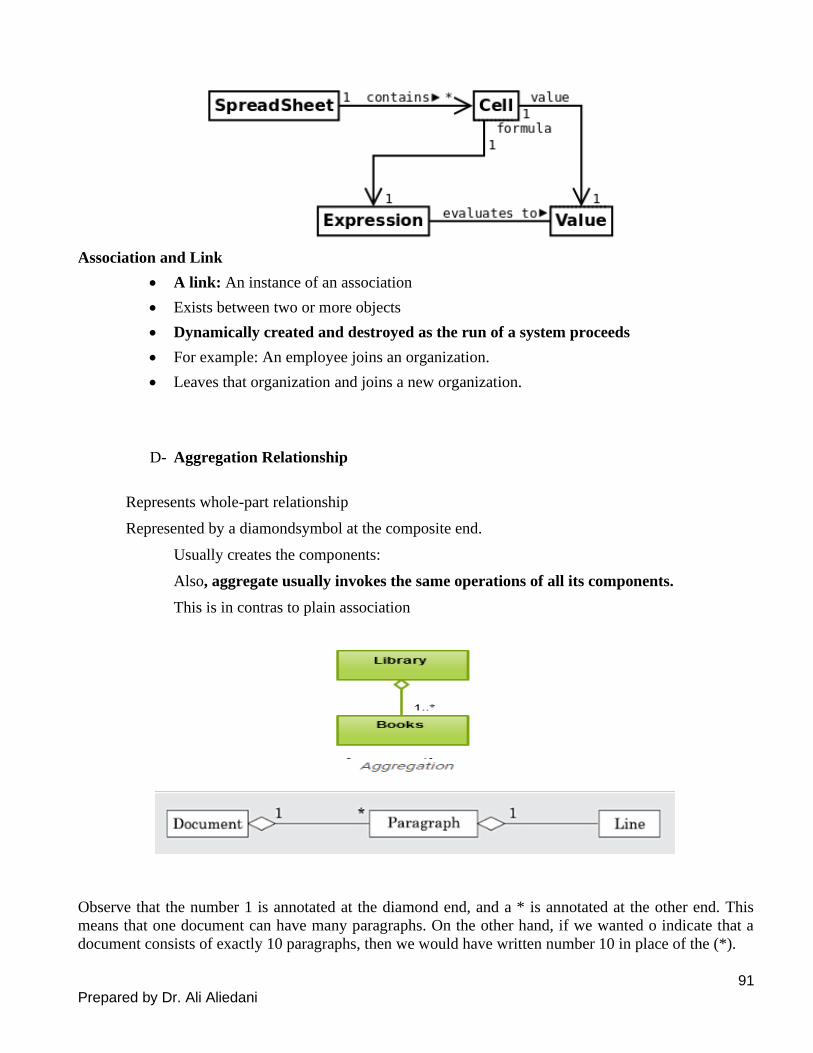
91 Prepared by Dr. Ali Aliedani
Association and Link
• A link: An instance of an association
• Exists between two or more objects
• Dynamically created and destroyed as the run of a system proceeds
• For example: An employee joins an organization.
• Leaves that organization and joins a new organization.
D- Aggregation Relationship
Represents whole-part relationship
Represented by a diamondsymbol at the composite end.
Usually creates the components:
Also, aggregate usually invokes the same operations of all its components.
This is in contras to plain association
Observe that the number 1 is annotated at the diamond end, and a * is annotated at the other end. This
means that one document can have many paragraphs. On the other hand, if we wanted o indicate that a
document consists of exactly 10 paragraphs, then we would have written number 10 in place of the (*).

92 Prepared by Dr. Ali Aliedani
Aggregation vs. Inheritance
Inheritance: Different object types with similar features.
Necessary semantics for similarity of behavioris in place.
Aggregation: Containment allows construction of complex objects.
E- Composition
o A stronger form of aggregation
o The whole is the sole owner of its part.
o A component can belong to only one whole
o
o The life time of the part is dependent upon the whole.
o The composite must manage the creation and destruction of its parts.
If any changes to any of the order items are required after the order has been placed, then the entire order
has to be cancelled and a new order has to be placed with the changed item.
Aggregation versus Composition: Both aggregation and composition represent part/whole relationships.
When the components can dynamically be added and removed from the aggregate, then the relationship is
aggregation. If the components cannot be dynamically added/delete then the components are have the same
life time as the composite.
public class Car{
private Wheel wheels[4];
public Car (){
wheels[0] = new Wheel();
wheels[1] = new Wheel();
wheels[2] = new Wheel();
wheels[3] = new Wheel();
}
}
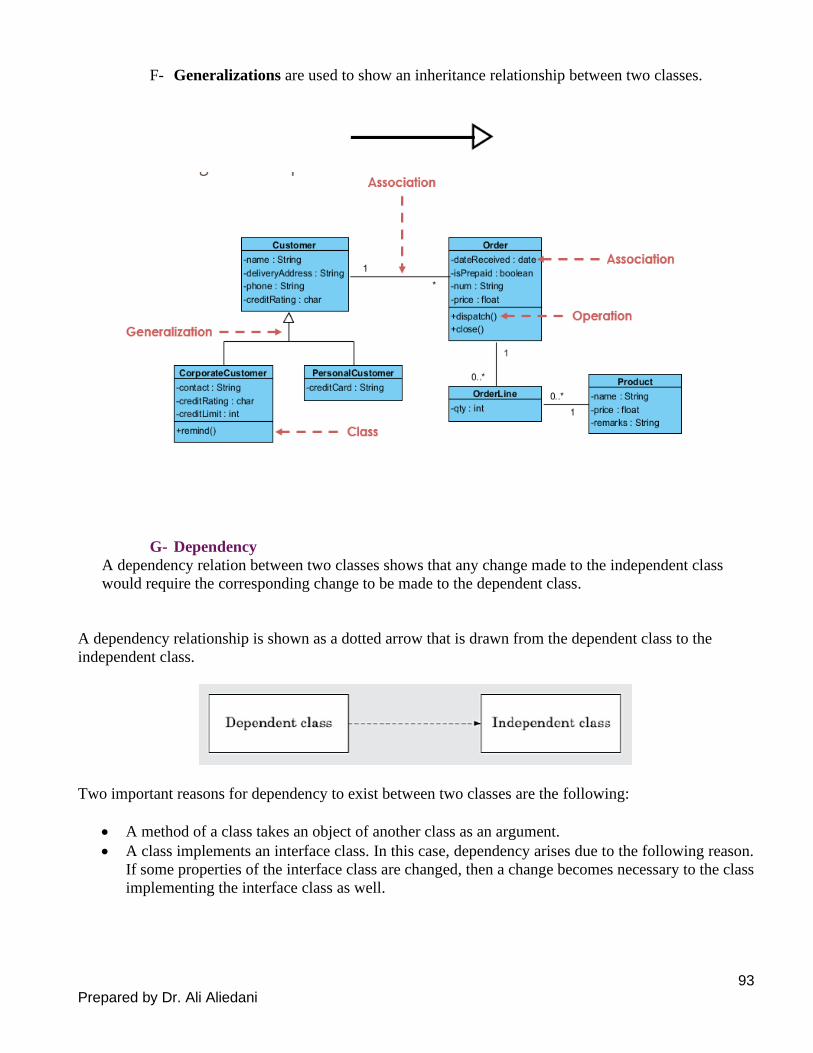
93 Prepared by Dr. Ali Aliedani
F- Generalizations are used to show an inheritance relationship between two classes.
G- Dependency
A dependency relation between two classes shows that any change made to the independent class
would require the corresponding change to be made to the dependent class.
A dependency relationship is shown as a dotted arrow that is drawn from the dependent class to the
independent class.
Two important reasons for dependency to exist between two classes are the following:
• A method of a class takes an object of another class as an argument.
• A class implements an interface class. In this case, dependency arises due to the following reason.
If some properties of the interface class are changed, then a change becomes necessary to the class
implementing the interface class as well.
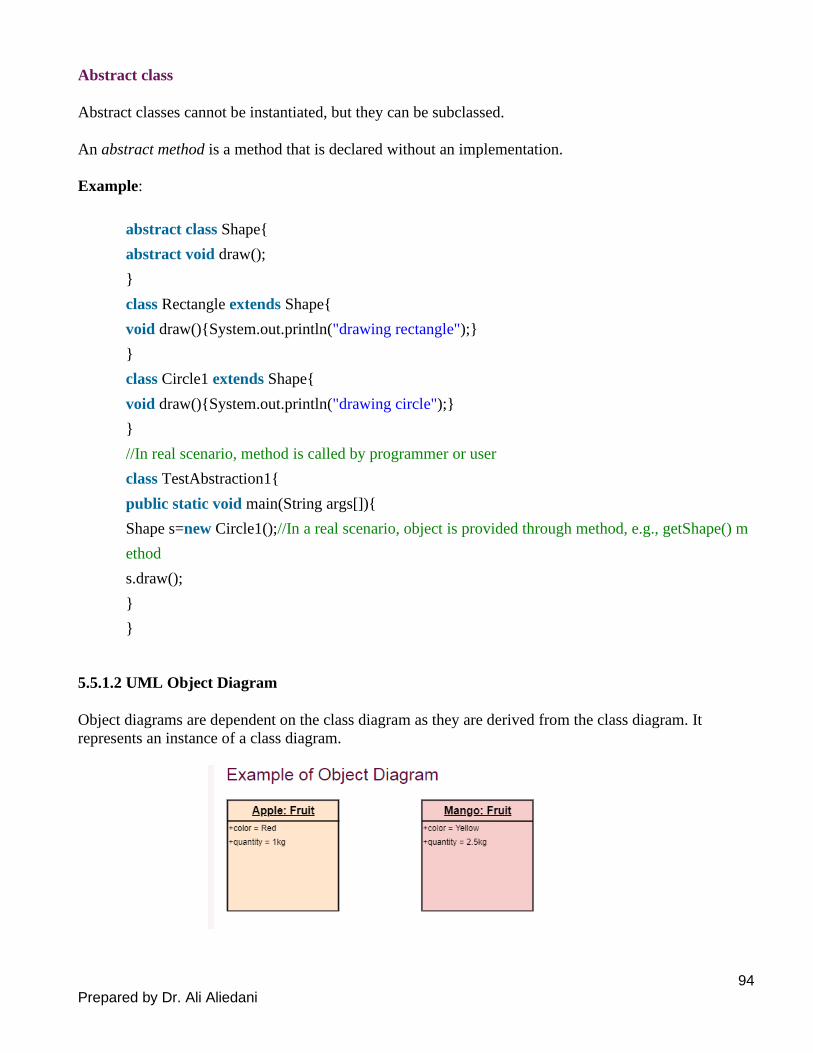
94 Prepared by Dr. Ali Aliedani
Abstract class
Abstract classes cannot be instantiated, but they can be subclassed.
An abstract method is a method that is declared without an implementation.
Example:
abstract class Shape{
abstract void draw();
}
class Rectangle extends Shape{
void draw(){System.out.println("drawing rectangle");}
}
class Circle1 extends Shape{
void draw(){System.out.println("drawing circle");}
}
//In real scenario, method is called by programmer or user
class TestAbstraction1{
public static void main(String args[]){
Shape s=new Circle1();//In a real scenario, object is provided through method, e.g., getShape() m
ethod
s.draw();
}
}
5.5.1.2 UML Object Diagram
Object diagrams are dependent on the class diagram as they are derived from the class diagram. It
represents an instance of a class diagram.

95 Prepared by Dr. Ali Aliedani
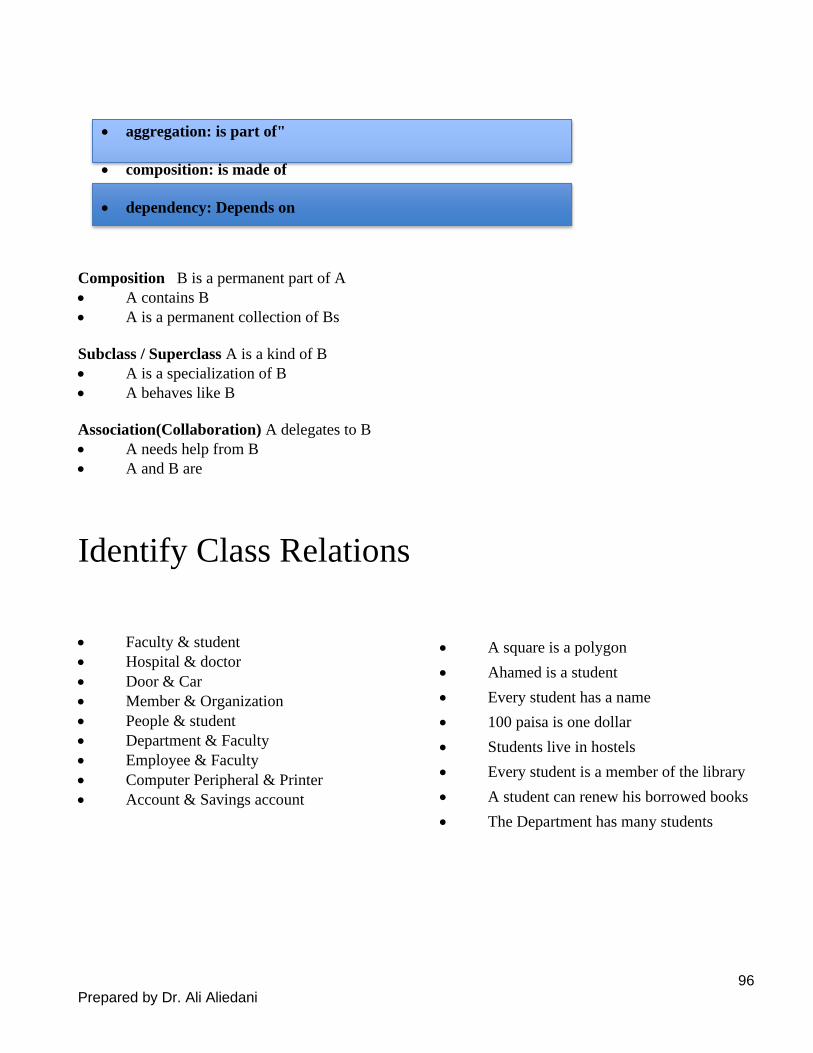
96 Prepared by Dr. Ali Aliedani
• aggregation: is part of"
• composition: is made of
• dependency: Depends on
Composition B is a permanent part of A
• A contains B
• A is a permanent collection of Bs
Subclass / Superclass A is a kind of B
• A is a specialization of B
• A behaves like B
Association(Collaboration) A delegates to B
• A needs help from B
• A and B are
Identify Class Relations
• Faculty & student
• Hospital & doctor
• Door & Car
• Member & Organization
• People & student
• Department & Faculty
• Employee & Faculty
• Computer Peripheral & Printer
• Account & Savings account
• A square is a polygon
• Ahamed is a student
• Every student has a name
• 100 paisa is one dollar
• Students live in hostels
• Every student is a member of the library
• A student can renew his borrowed books
• The Department has many students
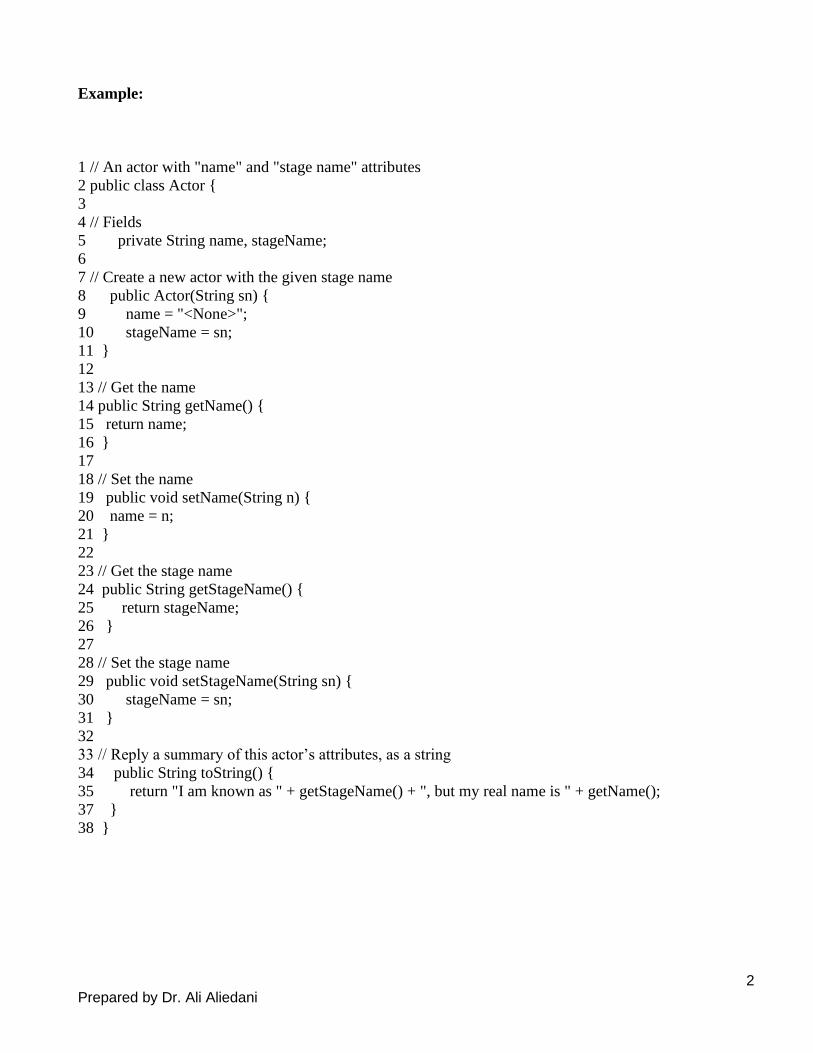
2 Prepared by Dr. Ali Aliedani
Example:
1 // An actor with "name" and "stage name" attributes
2 public class Actor {
3
4 // Fields
5 private String name, stageName;
6
7 // Create a new actor with the given stage name
8 public Actor(String sn) {
9 name = "<None>";
10 stageName = sn;
11 }
12
13 // Get the name
14 public String getName() {
15 return name;
16 }
17
18 // Set the name
19 public void setName(String n) {
20 name = n;
21 }
22
23 // Get the stage name
24 public String getStageName() {
25 return stageName;
26 }
27
28 // Set the stage name
29 public void setStageName(String sn) {
30 stageName = sn;
31 }
32
33 // Reply a summary of this actor’s attributes, as a string
34 public String toString() {
35 return "I am known as " + getStageName() + ", but my real name is " + getName();
37 }
38 }

3 Prepared by Dr. Ali Aliedani
5.5.1.3 Interaction Diagram
• Can model the way a group of objects interact to realize some behaviour.
o How many interaction diagrams to draw?
▪ Typically each interaction diagram realizes behaviour of a single use case
o Draw one sequence diagram for each use case.
A- Sequence Diagram
Captures how objects interact with each other: To realize some behaviour (use case execution).
•Emphasizes time ordering of messages.
•Can model: Simple sequential flow, branching, iteration, recursion, and concurrency

4 Prepared by Dr. Ali Aliedani
Sequence Diagram Notations
1- Lifeline
A lifeline represents an individual participant in the Interaction.
2- Actor
An Actor a type of role played by an entity that interacts with the subject (e.g., by exchanging signals and
data). An actor can also be an external to the subject (i.e., in the sense that an instance of an actor is not a
part of the instance of its corresponding subject). They typically represent roles played by human users,
external hardware, or other subjects.
Note That:
1. An actor does not necessarily represent a specific physical entity but merely a particular role of
some entity
2. A person may play the role of several different actors and, conversely, a given actor may be
played by multiple different person.
3- Activation
An activation is represented by a thin rectangle on a lifeline) represents the period during which
an element is performing an operation. The top and the bottom of the of the rectangle are aligned
with the initiation and the completion time respectively.
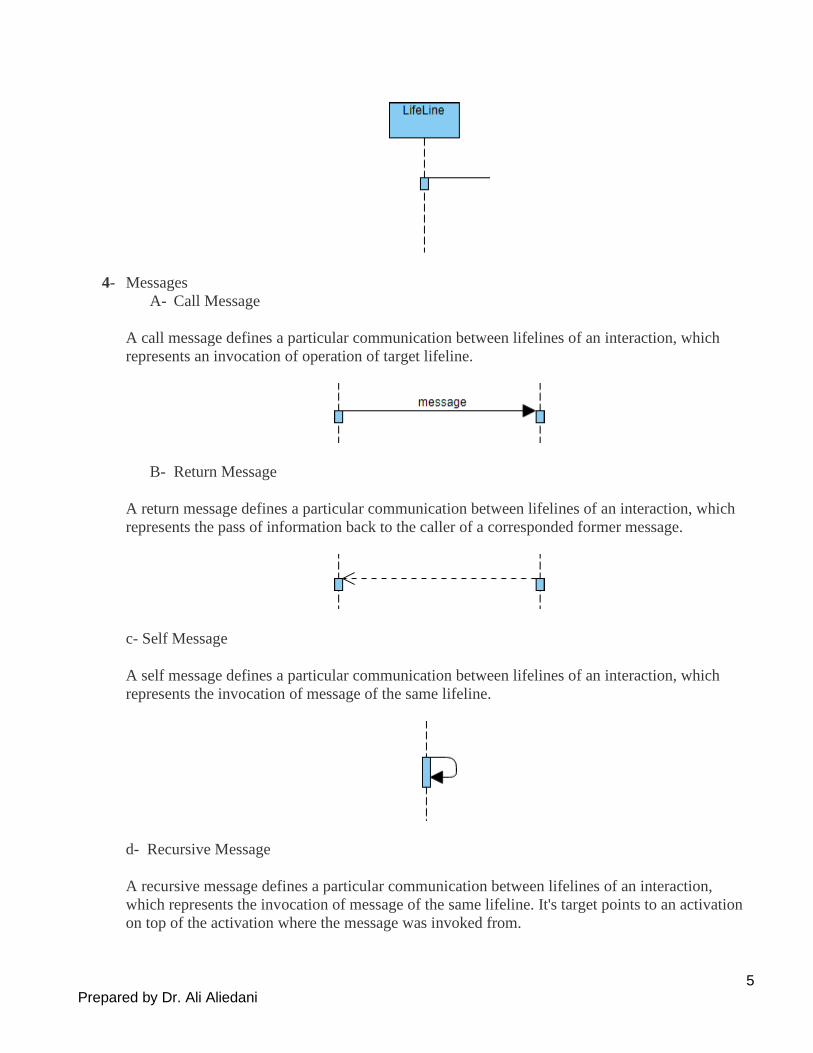
5 Prepared by Dr. Ali Aliedani
4- Messages
A- Call Message
A call message defines a particular communication between lifelines of an interaction, which
represents an invocation of operation of target lifeline.
B- Return Message
A return message defines a particular communication between lifelines of an interaction, which
represents the pass of information back to the caller of a corresponded former message.
c- Self Message
A self message defines a particular communication between lifelines of an interaction, which
represents the invocation of message of the same lifeline.
d- Recursive Message
A recursive message defines a particular communication between lifelines of an interaction,
which represents the invocation of message of the same lifeline. It's target points to an activation
on top of the activation where the message was invoked from.

6 Prepared by Dr. Ali Aliedani
e- Create Message
A create message defines a particular communication between lifelines of an interaction, which
represents the instantiation of (target) lifeline.
f- Destroy Message
A destroy message defines a particular communication between lifelines of an interaction, which
represents the request of destroying the lifecycle of target lifeline.
g- Duration Message
A duration message defines a particular communication between lifelines of an interaction, which
shows the distance between two time instants for a message invocation.

7 Prepared by Dr. Ali Aliedani
Each message is labelled with the message name. Some control information can also be included.
Two important types of control information are:
• A condition (e.g., [invalid]) indicates that a message is sent, only if the condition is true.
• An iteration marker shows that the message is sent many times to multiple receiver objects as would
happen when you are iterating over a collection or the elements of an array.
Sequence diagram for the renew book use case
• Return Values
Optionally indicated using a dashed arrow: Label indicates the return value. Don’t need when it is
obvious what is being returned,

8 Prepared by Dr. Ali Aliedani
5- Sequence Fragments
• UML 2.0 introduces sequence (or interaction) fragments. Sequence fragments make it easier to
create and maintain accurate sequence diagrams
• A sequence fragment is represented as a box, called a combined fragment, which encloses a portion
of the interactions within a sequence diagram
• The fragment operator (in the top left cornet) indicates the type of fragment
• Fragment types: ref, assert, loop, break, alt, opt, neg
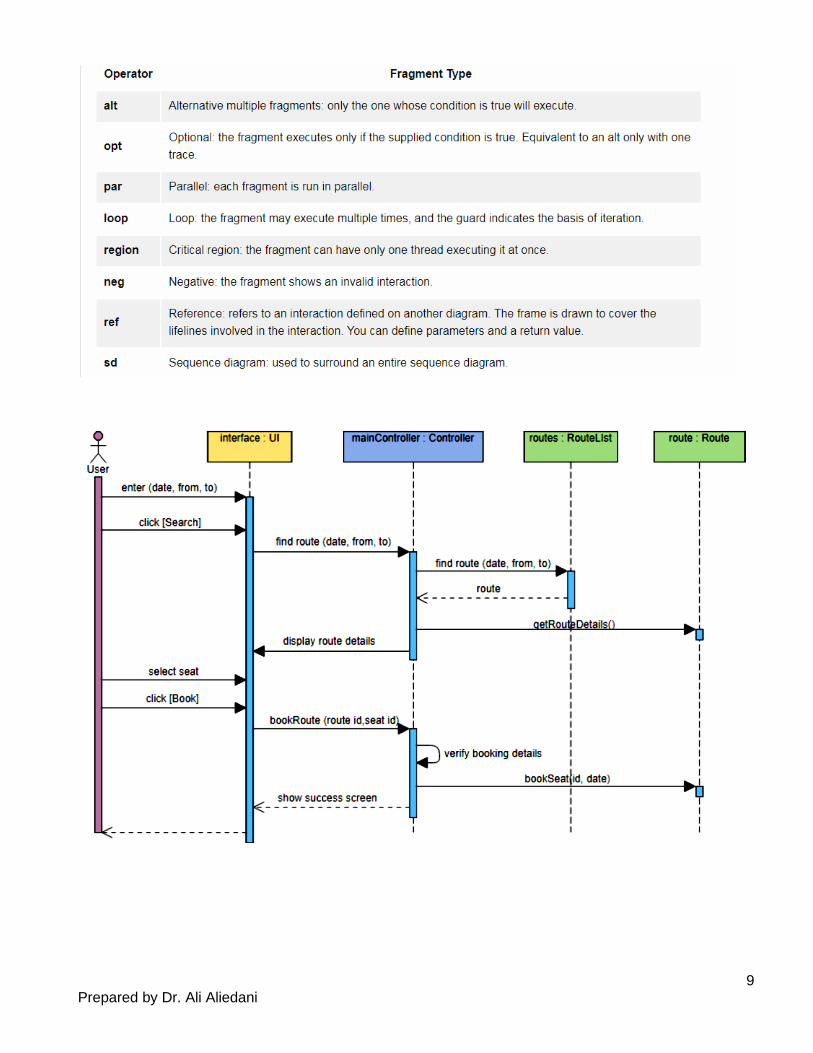
9 Prepared by Dr. Ali Aliedani

10 Prepared by Dr. Ali Aliedani

11 Prepared by Dr. Ali Aliedani
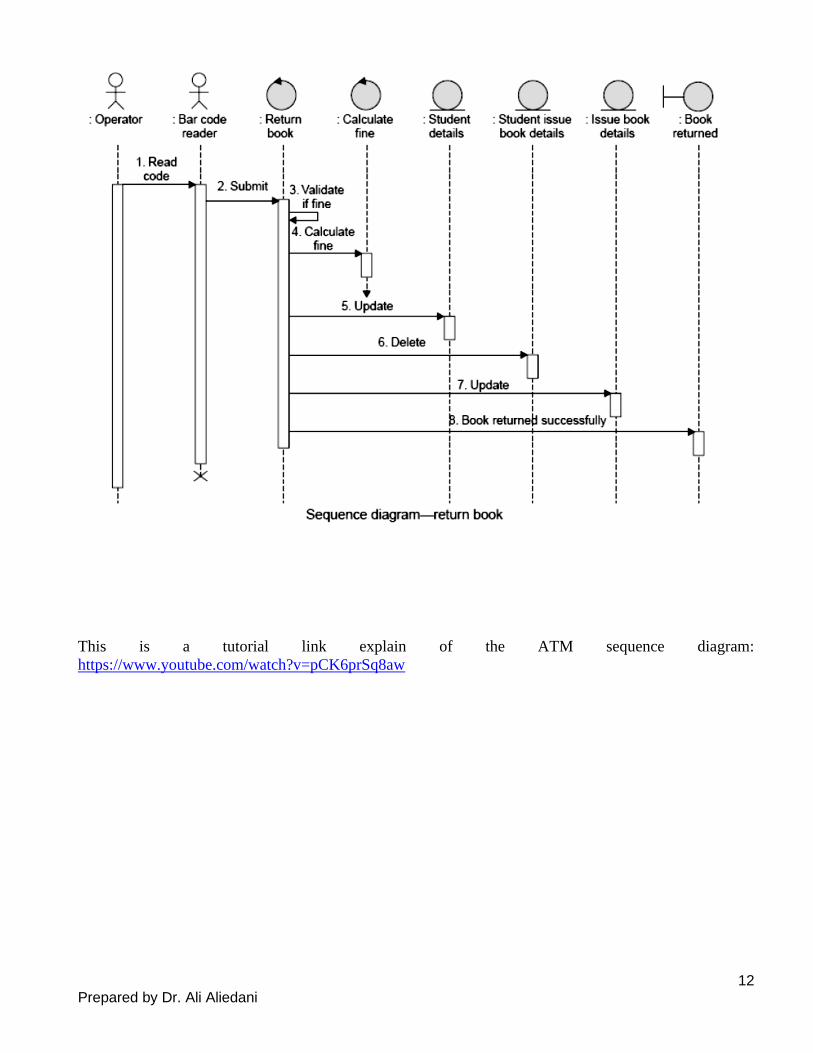
12 Prepared by Dr. Ali Aliedani
This is a tutorial link explain of the ATM sequence diagram:
https://www.youtube.com/watch?v=pCK6prSq8aw
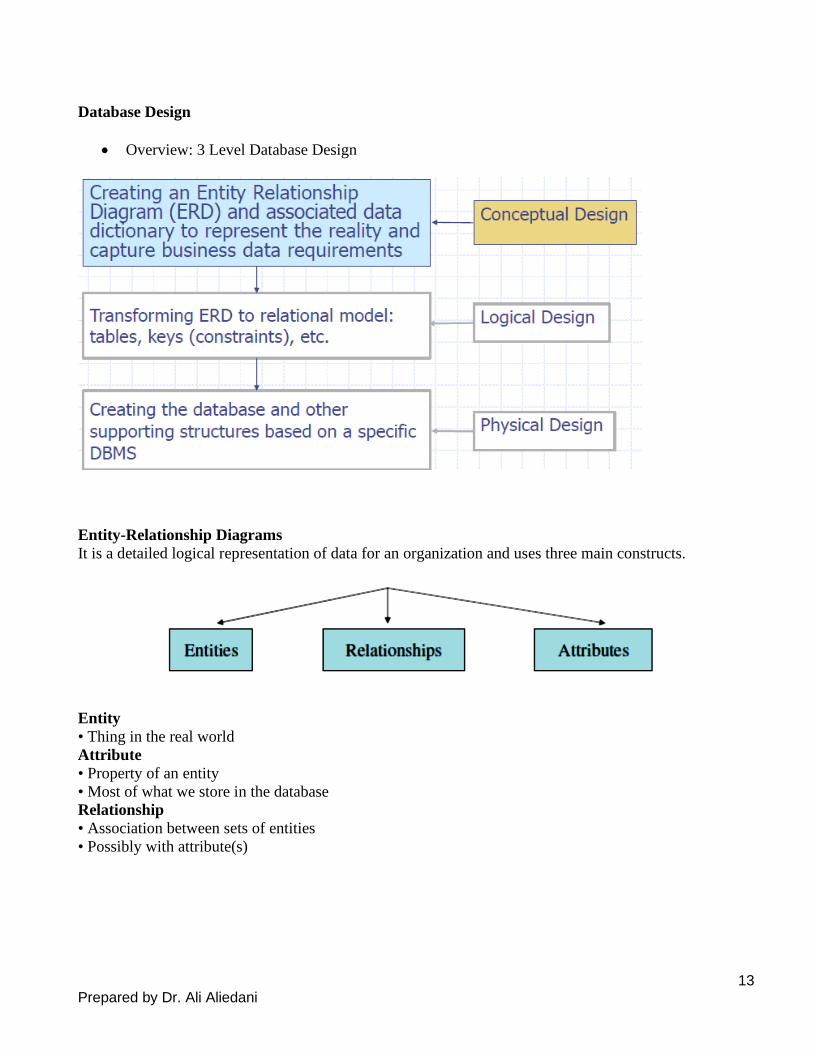
13 Prepared by Dr. Ali Aliedani
Database Design
• Overview: 3 Level Database Design
Entity-Relationship Diagrams
It is a detailed logical representation of data for an organization and uses three main constructs.
Entity
• Thing in the real world
Attribute
• Property of an entity
• Most of what we store in the database
Relationship
• Association between sets of entities
• Possibly with attribute(s)

14 Prepared by Dr. Ali Aliedani
A- Entity
- Entities can be classified into different types.
- Each entity type contains a set of entities each satisfying a set of predefined common properties.
E.g. Employee, Student, Car, House, Bank Account
Consider an insurance company that offers both home and automobile insurance policies .These policies
are offered to individuals and businesses.
B- Attributes
▪ Each entity type has a set of attributes associated with it.
▪ An attribute is a property or characteristic of an entity that is of interest to organization.
A candidate key is an attribute or combination of attributes that
uniquely identifies each instance of an entity type.
Student_ID Candidate Key
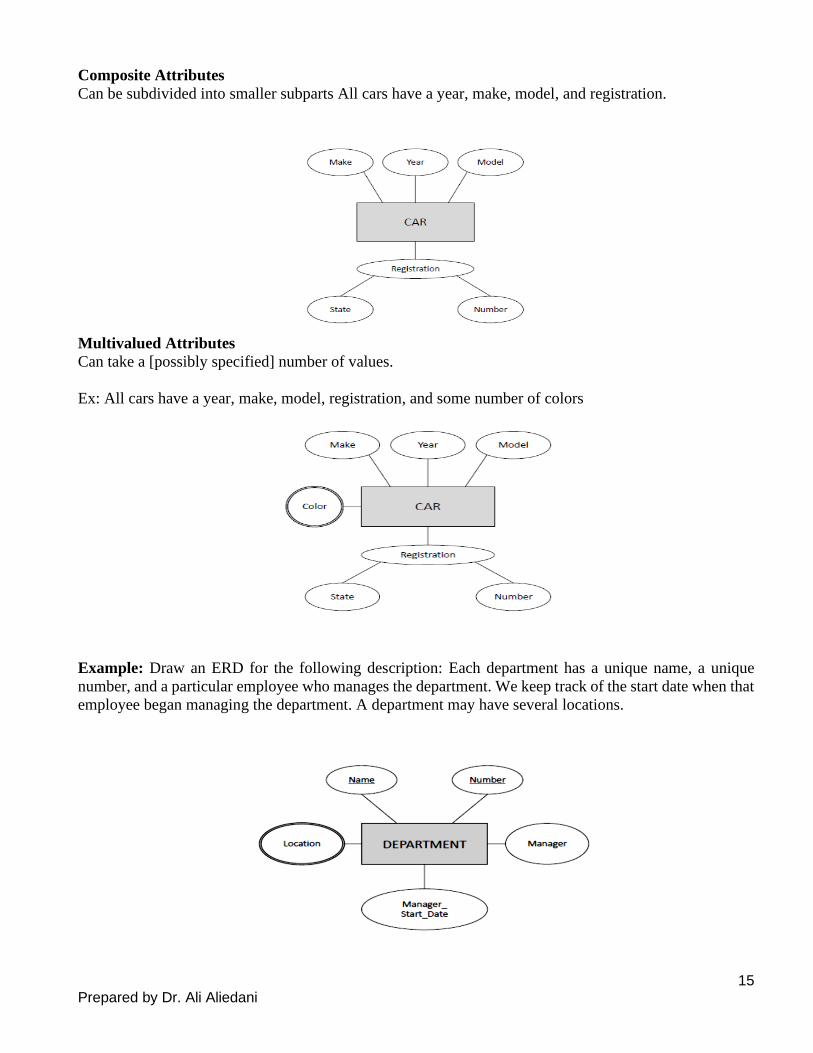
15 Prepared by Dr. Ali Aliedani
Composite Attributes
Can be subdivided into smaller subparts All cars have a year, make, model, and registration.
Multivalued Attributes
Can take a [possibly specified] number of values.
Ex: All cars have a year, make, model, registration, and some number of colors
Example: Draw an ERD for the following description: Each department has a unique name, a unique
number, and a particular employee who manages the department. We keep track of the start date when that
employee began managing the department. A department may have several locations.

16 Prepared by Dr. Ali Aliedani
C- Relationships
A relationship is a reason for associating two entity types.
Binary relationships involve two entity types
A CUSTOMER is insured by a POLICY. A POLICY CLAIM is made against a POLICY.
• Relationships are represented by diamond notation in a ER diagram.
• A training department is interested in tracking which training courses each of its employee has
completed.
• Each employee may complete more than one course, and each course may be completed by more
than one employee.
Degree of relationship
It is the number of entity types that participates in that relationship.

17 Prepared by Dr. Ali Aliedani
Relationship
One-to-Many (1:N)
A single entity instance in one entity class (parent) is related to multiple entity instances in another entity
class (child)
A book is published by (only) one publisher; a publisher can publish many (multiple) books
• A book can be written by many (multiple) authors; an author can write many (multiple) books
Minimum Cardinality
Minimum cardinality describes the minimum number of instances that must participate in a relationship
for any one instance
Minimums are generally stated as either zero or one:
0 (optional): participation in the relationship by the entity is optional.
1 (mandatory): participation in the relationship by the entity is mandatory.
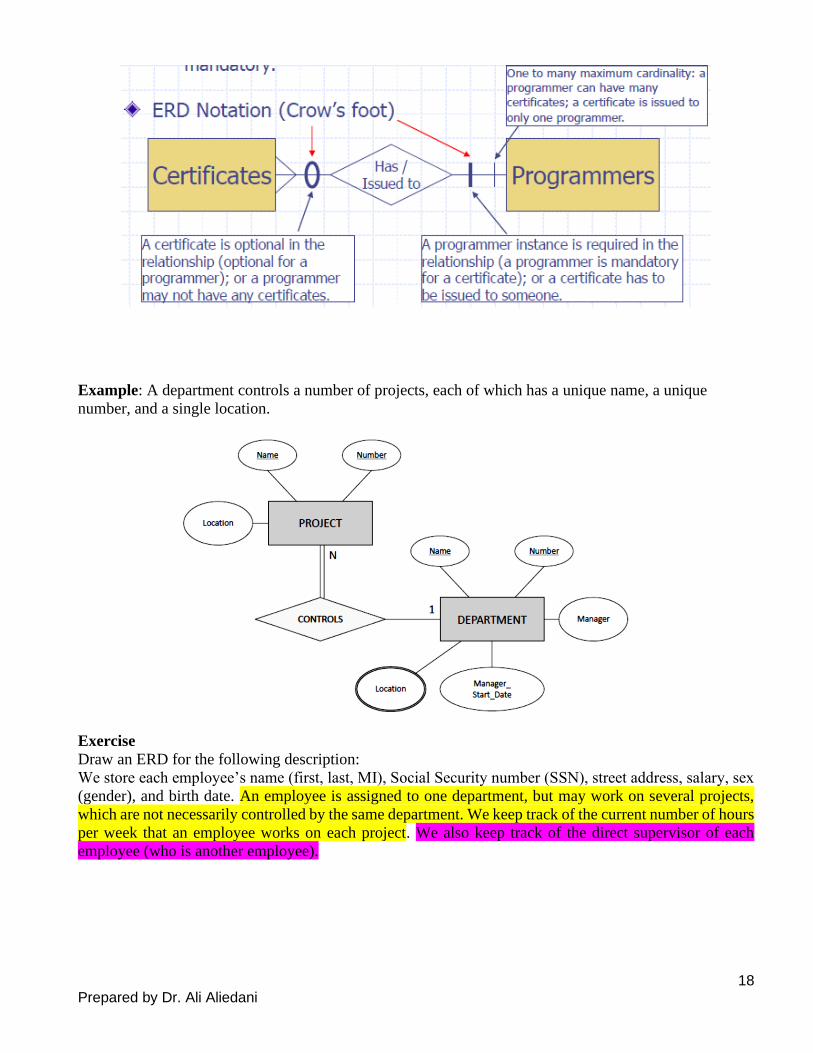
18 Prepared by Dr. Ali Aliedani
Example: A department controls a number of projects, each of which has a unique name, a unique
number, and a single location.
Exercise
Draw an ERD for the following description:
We store each employee’s name (first, last, MI), Social Security number (SSN), street address, salary, sex
(gender), and birth date. An employee is assigned to one department, but may work on several projects,
which are not necessarily controlled by the same department. We keep track of the current number of hours
per week that an employee works on each project. We also keep track of the direct supervisor of each
employee (who is another employee).
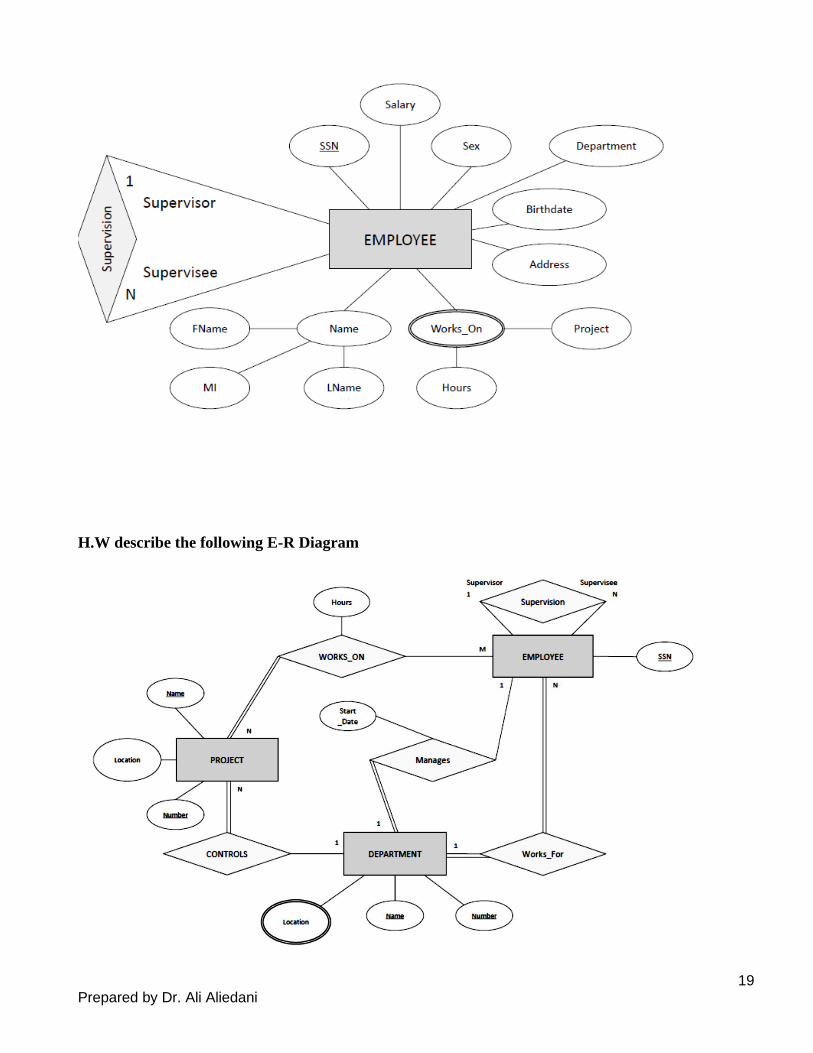
19 Prepared by Dr. Ali Aliedani
H.W describe the following E-R Diagram

20 Prepared by Dr. Ali Aliedani
Transforming E-R Diagrams into Relations
– Binary 1:N Relationships
• Add the Primary key attribute (or attributes) of the entity on the one side of the relationship as a Foreign
key in the relation on the other (N) side
• The one side migrates to the many side
• Relationship:
CUSTOMER Places ORDER(s)
• ORDER Table BEFORE Relationship:
(Order_Number, Order_Date, Promised_Date)
• ORDER Table AFTER Relationship:
(Order_Number, Order_Date, Promised_Date, Customer_ID)
CREATE TABLE ORDER(
Order_Number CHAR(1),
Order_Date DATE,
Promised_Date DATE,
Customer_ID CHAR(1),
PRIMARY KEY (Order_Number),
FOREIGN KEY (Customer_ID)
REFERENCES
CUSTOMER);
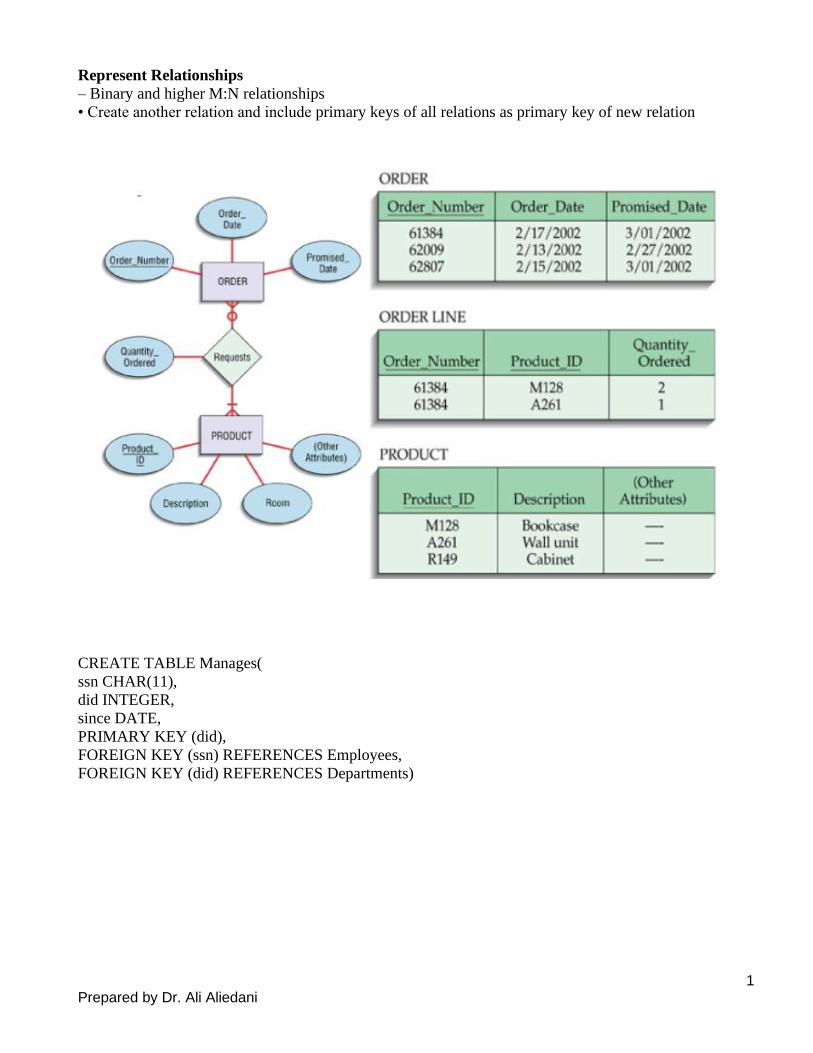
1 Prepared by Dr. Ali Aliedani
Represent Relationships
– Binary and higher M:N relationships
• Create another relation and include primary keys of all relations as primary key of new relation
CREATE TABLE Manages(
ssn CHAR(11),
did INTEGER,
since DATE,
PRIMARY KEY (did),
FOREIGN KEY (ssn) REFERENCES Employees,
FOREIGN KEY (did) REFERENCES Departments)
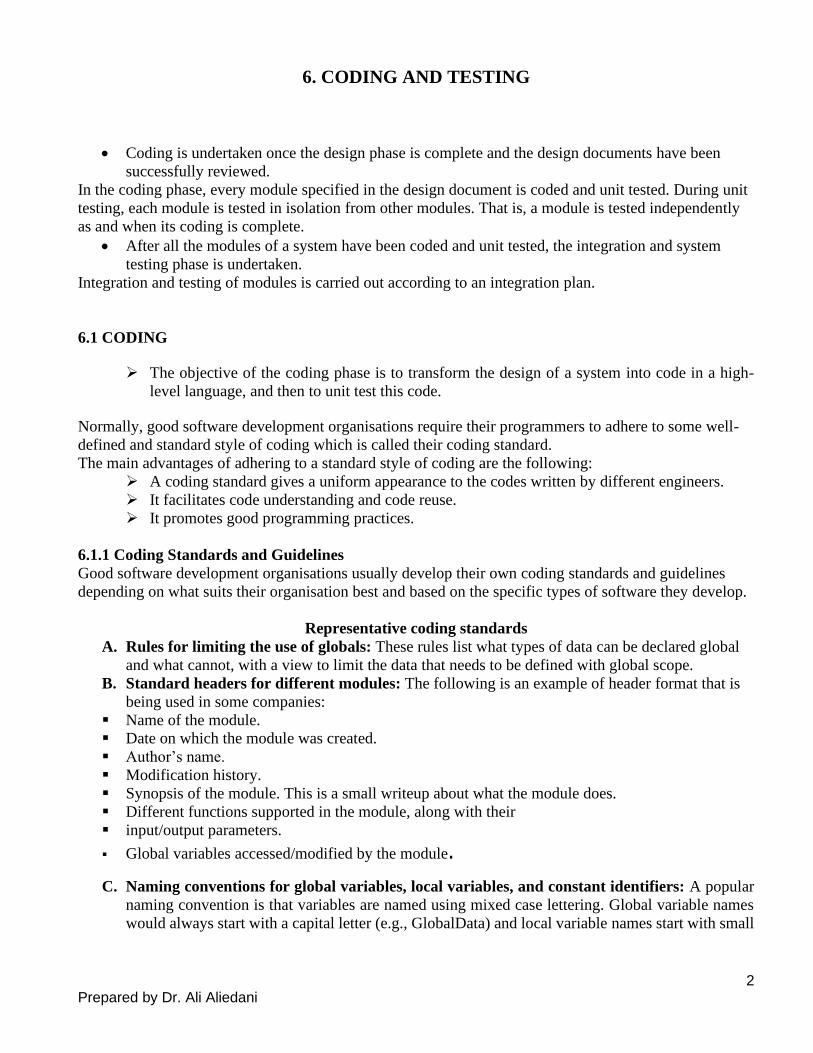
2 Prepared by Dr. Ali Aliedani
6. CODING AND TESTING
• Coding is undertaken once the design phase is complete and the design documents have been
successfully reviewed.
In the coding phase, every module specified in the design document is coded and unit tested. During unit
testing, each module is tested in isolation from other modules. That is, a module is tested independently
as and when its coding is complete.
• After all the modules of a system have been coded and unit tested, the integration and system
testing phase is undertaken.
Integration and testing of modules is carried out according to an integration plan.
6.1 CODING
➢ The objective of the coding phase is to transform the design of a system into code in a high-
level language, and then to unit test this code.
Normally, good software development organisations require their programmers to adhere to some well-
defined and standard style of coding which is called their coding standard.
The main advantages of adhering to a standard style of coding are the following:
➢ A coding standard gives a uniform appearance to the codes written by different engineers.
➢ It facilitates code understanding and code reuse.
➢ It promotes good programming practices.
6.1.1 Coding Standards and Guidelines
Good software development organisations usually develop their own coding standards and guidelines
depending on what suits their organisation best and based on the specific types of software they develop.
Representative coding standards
A. Rules for limiting the use of globals: These rules list what types of data can be declared global
and what cannot, with a view to limit the data that needs to be defined with global scope.
B. Standard headers for different modules: The following is an example of header format that is
being used in some companies:
▪ Name of the module.
▪ Date on which the module was created.
▪ Author’s name.
▪ Modification history.
▪ Synopsis of the module. This is a small writeup about what the module does.
▪ Different functions supported in the module, along with their
▪ input/output parameters.
▪ Global variables accessed/modified by the module.
C. Naming conventions for global variables, local variables, and constant identifiers: A popular
naming convention is that variables are named using mixed case lettering. Global variable names
would always start with a capital letter (e.g., GlobalData) and local variable names start with small
3 Prepared by Dr. Ali Aliedani
letters (e.g., localData). Constant names should be formed using capital letters only (e.g.,
CONSTDATA).
D. Conventions regarding error return values and exception handling mechanisms: The way
error conditions are reported by different functions in a program should be standard within an
organisation.
E. Representative coding guidelines: The following are some representative coding guidelines that
are recommended by many software development organisations.
Do not use a coding style that is too clever or too difficult to understand Clever coding can
obscure meaning of the code and reduce code understandability; thereby making maintenance and
debugging difficult and expensive.
Avoid obscure side effects: The side effects of a function call include modifications to the
parameters passed by reference, modification of global variables, and I/O operations. An obscure
side effect is one that is not obvious from a casual examination of the code.
Do not use an identifier for multiple purposes: Use of variables for multiple purposes usually
makes future enhancements more difficult
Length of any function should not exceed 10 source lines:
Do not use GO TO statements
6.1.2 CODE REVIEW
Code review for a module is undertaken after the module successfully compiles. Obviously, code review
does not target to design syntax errors in a program, but is designed to detect logical, algorithmic, and
programming errors.
Normally, the following two types of reviews are carried out on the code of a module:
Code inspection.
Code walkthrough
6.1.2.1 Code Walkthrough
The main objective of code walkthrough is to discover the algorithmic and logical errors in the code. A
few members of the development team are given the code a couple of days before the walkthrough meeting.
Each member selects some test cases and simulates execution of the code by hand.
The members note down their findings of their walkthrough and discuss those in a walkthrough meeting
where the coder of the module is present.
6.1.2.2 Code Inspection
During code inspection, the code is examined for the presence of some common programming errors. This
is in contrast to the hand simulation of code execution carried out during code walkthroughs.
Following is a list of some classical programming errors which can be checked during code inspection:
o Use of uninitialized variables.
o Jumps into loops.
o Non-terminating loops.
o Incompatible assignments.

4 Prepared by Dr. Ali Aliedani
o Array indices out of bounds.
o Improper storage allocation and deallocation.
o Mismatch between actual and formal parameter in procedure calls.
o Use of incorrect logical operators or incorrect precedence among operators.
o Improper modification of loop variables.
o Comparison of equality of floating point values.
o Dangling reference caused when the referenced memory has not been allocated.
6.1.2.3 Clean Room Testing
Clean room testing was pioneered at IBM. This type of testing relies heavily on walkthroughs, inspection,
and formal verification
6.2 SOFTWARE DOCUMENTATION
When a software is developed, in addition to the executable files and the source code, several kinds of
documents such as users’ manual, software requirements specification (SRS) document, design document,
test document, installation manual, etc., are developed as part of the software engineering process.
Different types of software documents can broadly be classified into the following:
Internal documentation: These are provided in the source code itself.
External documentation: These are the supporting documents such as SRS document, installation
document, user manual, design document, and test document.
6.3 Mapping object model to code
❖ During object design we would like to implement a system that realizes the use cases specified
during requirements elicitation and system design.
Figure 6-1 The four types of transformations: model transformations,
refactorings, forward engineering, and reverse engineering
6.3.1 Model Transformation
A model transformation is applied to an object model and results in another object model. The purpose
of object model transformation is to simplify or optimize the original model, bringing it into closer
compliance with all requirements in the specification. A transformation may add, remove, or rename
classes, operations, associations, or attributes.

5 Prepared by Dr. Ali Aliedani
A refactoring is a transformation of the source code that improves its readability or modifiability without
changing the behavior of the system.

6 Prepared by Dr. Ali Aliedani
Forward engineering is applied to a set of model elements and results in a set of corresponding source
code statements, such as a class declaration, a Java expression, or a database schema. The purpose of
forward engineering is to maintain a strong correspondence between the object design model and the code,
and to reduce the number of errors introduced during implementation, thereby decreasing implementation
effort.
Figure 6.2 Realization of the User and LeagueOwner classes (UML class diagram and Java excerpts.
Reverse engineering is applied to a set of source code elements and results in a set of model elements.
The purpose of this type of transformation is to recreate the model for an existing system, either because
the model was lost or never created, or because it became out of sync with the source code.
However, by trying to improve one aspect of the system, the developer runs the risk of introducing errors
that will be difficult to detect and repair. To avoid introducing new errors, all transformations should follow
these principles:
• Each transformation must address a single criteria. A transformation should improve the system with
respect to only one design goal.
• Each transformation must be local. A transformation should change only a few methods or a few
classes at once.
• Each transformation must be applied in isolation to other changes. To further localize changes,
transformations should be applied one at the time.
• Each transformation must be followed by a validation step.

7 Prepared by Dr. Ali Aliedani
6.3.2 Mapping Activities
6.3.2.1 - Optimizing the Object Design Model
Direct translation of analysis models to code is often inefficient. This section describes four common
optimizations to improve performance or meet other design goals.
A- Optimizing access paths.
Repeated association traversals. Operations that are performed frequently can suffer from poor
performance if a large number of associations must be traversed. Performance can be enhanced by
adding a direct link. Examine sequence diagrams of frequently performed operations to identify
long association paths.
"Many" associations. If a lot of time is being spent working down a list of associations in a one-
to-many or many-to-many situation, see if the to-many can be reduced to a to-one, possibly through
qualified associations.
Misplaced attributes. Some classes may turn out to have very little if any interesting behavior. If
an attribute is involved only in setter and getter operations, consider moving the attribute to the
class that calls it. If enough of the attributes can be moved out of the class, it can sometimes be
eliminated all together.
B- Collapsing objects: Turning objects into attributes. A class that has few attributes and behaviors,
and is associated only with one other class, can be collapsed into that class, reducing the overall
complexity of the system.
C- Delaying expensive computations. Put off performing expensive calculations until they are really
needed.
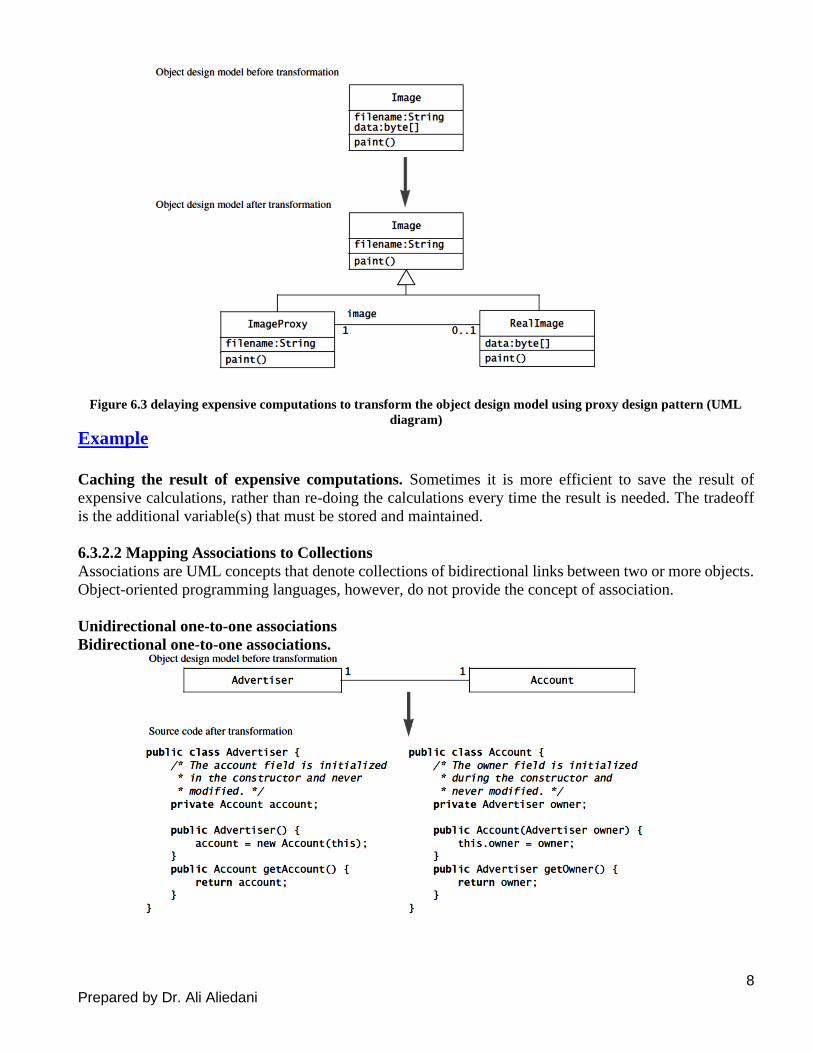
8 Prepared by Dr. Ali Aliedani
Figure 6.3 delaying expensive computations to transform the object design model using proxy design pattern (UML
diagram)
Example
Caching the result of expensive computations. Sometimes it is more efficient to save the result of
expensive calculations, rather than re-doing the calculations every time the result is needed. The tradeoff
is the additional variable(s) that must be stored and maintained.
6.3.2.2 Mapping Associations to Collections
Associations are UML concepts that denote collections of bidirectional links between two or more objects.
Object-oriented programming languages, however, do not provide the concept of association.
Unidirectional one-to-one associations
Bidirectional one-to-one associations.
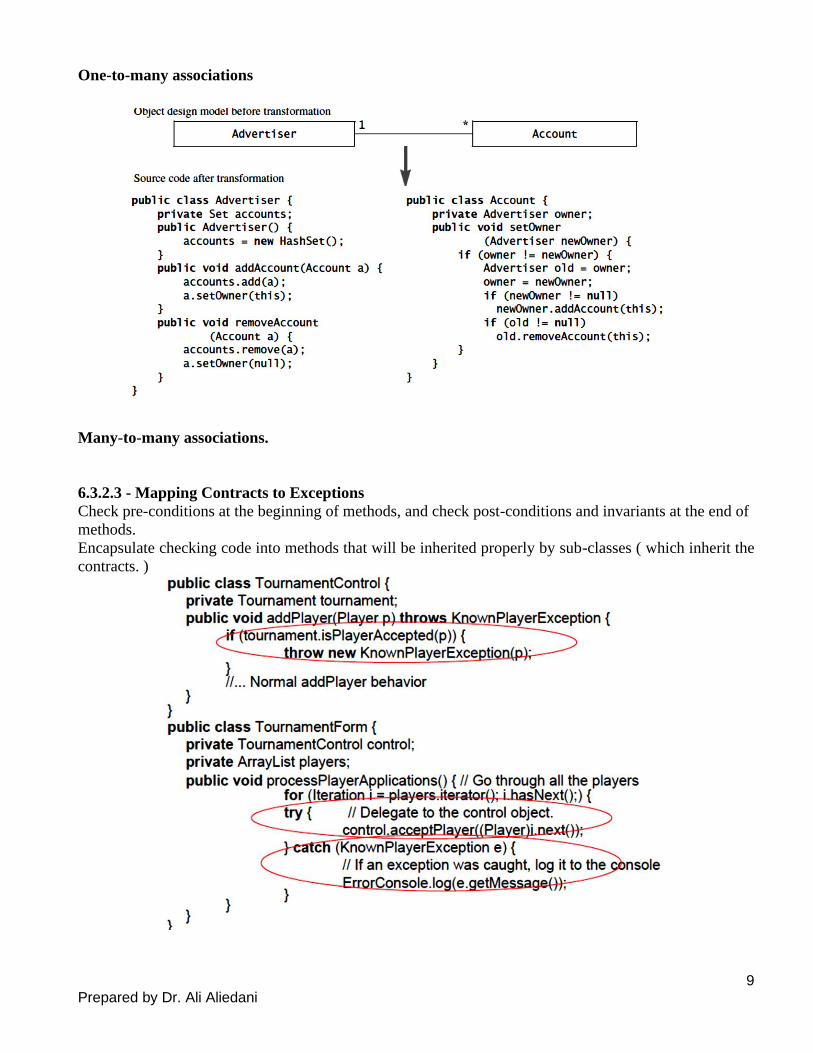
9 Prepared by Dr. Ali Aliedani
One-to-many associations
Many-to-many associations.
6.3.2.3 - Mapping Contracts to Exceptions
Check pre-conditions at the beginning of methods, and check post-conditions and invariants at the end of
methods.
Encapsulate checking code into methods that will be inherited properly by sub-classes ( which inherit the
contracts. )
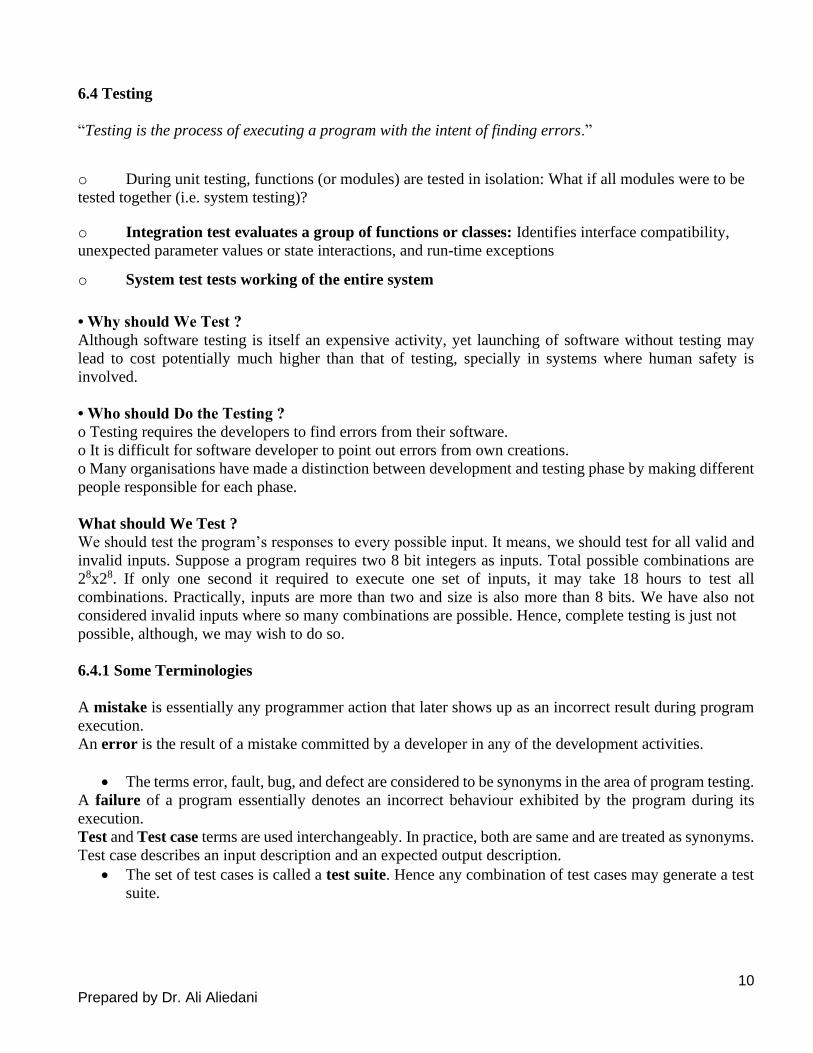
10 Prepared by Dr. Ali Aliedani
6.4 Testing
“Testing is the process of executing a program with the intent of finding errors.”
o During unit testing, functions (or modules) are tested in isolation: What if all modules were to be
tested together (i.e. system testing)?
o Integration test evaluates a group of functions or classes: Identifies interface compatibility,
unexpected parameter values or state interactions, and run-time exceptions
o System test tests working of the entire system
• Why should We Test ?
Although software testing is itself an expensive activity, yet launching of software without testing may
lead to cost potentially much higher than that of testing, specially in systems where human safety is
involved.
• Who should Do the Testing ?
o Testing requires the developers to find errors from their software.
o It is difficult for software developer to point out errors from own creations.
o Many organisations have made a distinction between development and testing phase by making different
people responsible for each phase.
What should We Test ?
We should test the program’s responses to every possible input. It means, we should test for all valid and
invalid inputs. Suppose a program requires two 8 bit integers as inputs. Total possible combinations are
28x28. If only one second it required to execute one set of inputs, it may take 18 hours to test all
combinations. Practically, inputs are more than two and size is also more than 8 bits. We have also not
considered invalid inputs where so many combinations are possible. Hence, complete testing is just not
possible, although, we may wish to do so.
6.4.1 Some Terminologies
A mistake is essentially any programmer action that later shows up as an incorrect result during program
execution.
An error is the result of a mistake committed by a developer in any of the development activities.
• The terms error, fault, bug, and defect are considered to be synonyms in the area of program testing.
A failure of a program essentially denotes an incorrect behaviour exhibited by the program during its
execution.
Test and Test case terms are used interchangeably. In practice, both are same and are treated as synonyms.
Test case describes an input description and an expected output description.
• The set of test cases is called a test suite. Hence any combination of test cases may generate a test
suite.
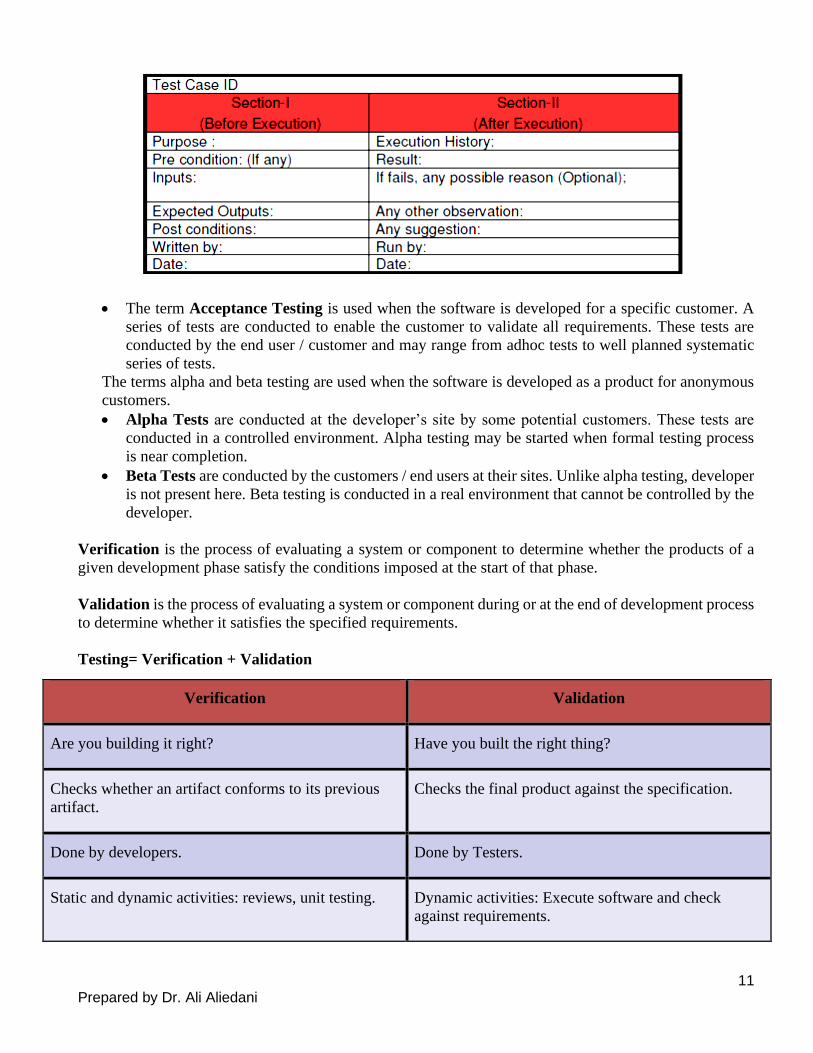
11 Prepared by Dr. Ali Aliedani
• The term Acceptance Testing is used when the software is developed for a specific customer. A
series of tests are conducted to enable the customer to validate all requirements. These tests are
conducted by the end user / customer and may range from adhoc tests to well planned systematic
series of tests.
The terms alpha and beta testing are used when the software is developed as a product for anonymous
customers.
• Alpha Tests are conducted at the developer’s site by some potential customers. These tests are
conducted in a controlled environment. Alpha testing may be started when formal testing process
is near completion.
• Beta Tests are conducted by the customers / end users at their sites. Unlike alpha testing, developer
is not present here. Beta testing is conducted in a real environment that cannot be controlled by the
developer.
Verification is the process of evaluating a system or component to determine whether the products of a
given development phase satisfy the conditions imposed at the start of that phase.
Validation is the process of evaluating a system or component during or at the end of development process
to determine whether it satisfies the specified requirements.
Testing= Verification + Validation
Verification Validation
Are you building it right? Have you built the right thing?
Checks whether an artifact conforms to its previous
artifact.
Checks the final product against the specification.
Done by developers. Done by Testers.
Static and dynamic activities: reviews, unit testing. Dynamic activities: Execute software and check
against requirements.

12 Prepared by Dr. Ali Aliedani
➢ Verification does not require execution of the software, whereas validation requires execution of
the software.
➢ Verification is carried out during the development process to check if the development activities
are proceeding alright, whereas validation is carried out to check if the right as required by the
customer has been developed.
6.4.2 Testing Activities
Figure 6.3: Testing process
Running test cases and checking the results to detect failures: Each test case is run and the results are
compared with the expected results. A mismatch between the actual result and expected results indicates a
failure. The test cases for which the system fails are noted down for later debugging.
Locate error: In this activity, the failure symptoms are analysed to locate the errors. For each failure
observed during the previous activity, the statements that are in error are identified.
Error correction: After the error is located during debugging, the code is appropriately changed to correct
the error
When test cases are designed based on random input data, many of the test cases do not contribute to the
significance of the test suite, That is, they do not help detect any additional defects not already being
detected by other test cases in the suite.
➢ A minimal test suite is a carefully designed set of test cases such that each test case helps detect
different errors. This is in contrast to testing using some random input values.
▪ Test Suite Design
▪ Run test cases Tester
▪ Check results to detect failures.
▪ Prepare failure list
o Debug to locate errors
o Correct errors. Developer

13 Prepared by Dr. Ali Aliedani
6.4.3 Unit Testing
• Unit testing carried out: After coding of a unit is complete and it compiles successfully.
• Unit testing reduces debugging effort substantially.
• Without unit test:
Errors become difficult to track down.
Debugging cost increases substantially
Before carrying out unit testing, the unit test cases have to be designed and the test environment for the
unit under test has to be developed. The following are needed to test the module:
The procedures belonging to other modules that the module under test calls.
Non-local data structures that the module accesses.
A procedure to call the functions of the module under test with appropriate parameters.
stubs and drivers are designed to provide the complete environment for a module so that testing can be
carried out.
Figure 6.4: Unit testing with the help of driver and stub modules.
❖ A stub procedure is a dummy procedure that has the same I/O parameters as the function called by
the unit under test but has a highly simplified behaviour. For example, a stub procedure may
produce the expected behaviour using a simple table look up mechanism.
❖ A driver module should contain the non-local data structures accessed by the module under test.
Additionally, it should also have the code to call the different functions of the unit under test with
appropriate parameter values for testing.
There are essentially two main approaches to systematically design test cases:
➢ Black-box approach
➢ White-box (or glass-box) approach
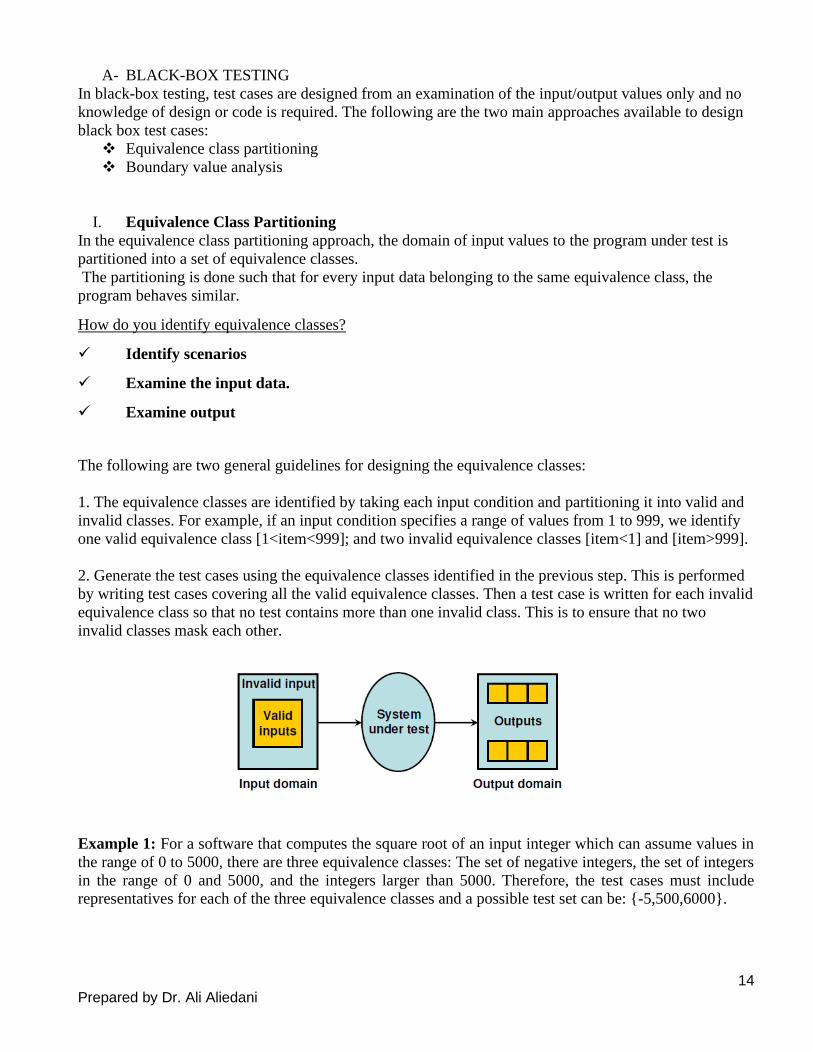
14 Prepared by Dr. Ali Aliedani
A- BLACK-BOX TESTING
In black-box testing, test cases are designed from an examination of the input/output values only and no
knowledge of design or code is required. The following are the two main approaches available to design
black box test cases:
❖ Equivalence class partitioning
❖ Boundary value analysis
I. Equivalence Class Partitioning
In the equivalence class partitioning approach, the domain of input values to the program under test is
partitioned into a set of equivalence classes.
The partitioning is done such that for every input data belonging to the same equivalence class, the
program behaves similar.
How do you identify equivalence classes?
✓ Identify scenarios
✓ Examine the input data.
✓ Examine output
The following are two general guidelines for designing the equivalence classes:
1. The equivalence classes are identified by taking each input condition and partitioning it into valid and
invalid classes. For example, if an input condition specifies a range of values from 1 to 999, we identify
one valid equivalence class [1<item<999]; and two invalid equivalence classes [item<1] and [item>999].
2. Generate the test cases using the equivalence classes identified in the previous step. This is performed
by writing test cases covering all the valid equivalence classes. Then a test case is written for each invalid
equivalence class so that no test contains more than one invalid class. This is to ensure that no two
invalid classes mask each other.
Example 1: For a software that computes the square root of an input integer which can assume values in
the range of 0 to 5000, there are three equivalence classes: The set of negative integers, the set of integers
in the range of 0 and 5000, and the integers larger than 5000. Therefore, the test cases must include
representatives for each of the three equivalence classes and a possible test set can be: {-5,500,6000}.

15 Prepared by Dr. Ali Aliedani
Example 2: Design the black-box test suite for the following program. The program computes the
intersection point of two straight lines and displays the result. It reads two integer pairs (m1, c1) and (m2,
c2) defining the two straight lines of the form y=mx + c.
The equivalence classes are the following:
• Parallel lines (m1=m2, c1≠c2)
• Intersecting lines (m1≠m2)
• Coincident lines (m1=m2, c1=c2)
Now, selecting one representative value from each equivalence class, the test suit (2, 2) (2, 5), (5, 5) (7, 7),
(10, 10) (10, 10) are obtained.
II. Boundary Value Analysis
Boundary value analysis-based test suite design involves designing test cases using the values at the
boundaries of different equivalence classes.
Example: For a function that computes the square root of the integer values in the range of 0 and 5000,
determine the boundary value test suite.
Answer: There are three equivalence classes—The set of negative integers, the set of integers in the range
of 0 and 5000, and the set of integers larger than 5000. The boundary value-based test suite is: {0,-
1,5000,5001}.
Example:
The boundary value analysis test cases for our program with two inputs variables (x and y) that may have
any value from 100 to 300 are: (200,100), (200,101), (200,200), (200,299), (200,300), (100,200),
(101,200), (299,200) and (300,200). This input domain is shown in Figure 6.5. Each dot represent a test
case and inner rectangle is the domain of legitimate inputs.
Figure 6.5 Input domain of two variables x and y with boundaries [100,300] each
Example
Consider a program for the determination of the nature of roots of a quadratic equation. Its input is a triple
of positive integers (say a,b,c) and values may be from interval [0,100]. The program output may have one
of the following words.
[Not a quadratic equation; Real roots; Imaginary roots; Equal roots]
Design the boundary value test cases.
Solution
Quadratic equation will be of type: x2+bx+c=0
Roots are real if (b2-4ac)>0
Roots are imaginary if (b2-4ac)<0
Roots are equal if (b2-4ac)=0
Equation is not quadratic if a=0

16 Prepared by Dr. Ali Aliedani
Robustness testing
It is nothing but the extension of boundary value analysis. Here, we would like to see, what happens when
the extreme values are exceeded with a value slightly greater than the maximum, and a value slightly less
than minimum. It means, we want to go outside the legitimate boundary of input domain. This extended
form of boundary value analysis is called robustness testing and shown in Figure below:

17 Prepared by Dr. Ali Aliedani
B- WHITE-BOX TESTING
White-box testing is an important type of unit testing. A large number of white-box testing strategies
exist.
Basic Concepts
A white-box testing strategy can either be coverage-based or fault based.
i. Fault-based testing
A fault-based testing strategy targets to detect certain types of faults. These faults that a test strategy
focuses on constitutes the fault model of the strategy.
ii. Coverage-based testing
A coverage-based testing strategy attempts to execute (or cover) certain elements of a program. Popular
examples of coverage-based testing strategies are statement coverage.
✓ The set of specific program elements that a testing strategy targets to execute is called the testing
criterion of the strategy.
✓ A white-box testing strategy is said to be stronger than another strategy, if the stronger testing
strategy covers all program elements covered by the weaker testing strategy, and the stronger
strategy additionally covers at least one program element that is not covered by the weaker strategy.
1- Statement Coverage
The principal idea governing the statement coverage strategy is that unless a statement is executed, there
is no way to determine whether an error exists in that statement.

18 Prepared by Dr. Ali Aliedani
2- Branch Coverage
A test suite satisfies branch coverage, if it makes each branch condition in the program to assume true
and false values in turn.
Example:
19 Prepared by Dr. Ali Aliedani
3- Multiple Condition Coverage
In the multiple condition (MC) coverage-based testing, test cases are designed to make each component
of a composite conditional expression to assume both true and false values.
4- Path Coverage
A test suite achieves path coverage if it executes each linearly independent paths ( or basis paths ) at least
once. A linearly independent path can be defined in terms of the control flow graph (CFG) of a program.
Control flow graph (CFG)
The flow graph is a directed graph in which nodes are either entire statements or fragments of a statement,
and edges represents flow of control.
Example
Consider the problem for the determination of the nature of roots of a quadratic equation. Its input a triple
of positive integers (say a,b,c) and value may be from interval [0,100].
The program is given in figure below. The output may have one of the following words:
[Not a quadratic equation; real roots; Imaginary roots; Equal roots]
Draw the flow graph.
20 Prepared by Dr. Ali Aliedani

21 Prepared by Dr. Ali Aliedani
Example:
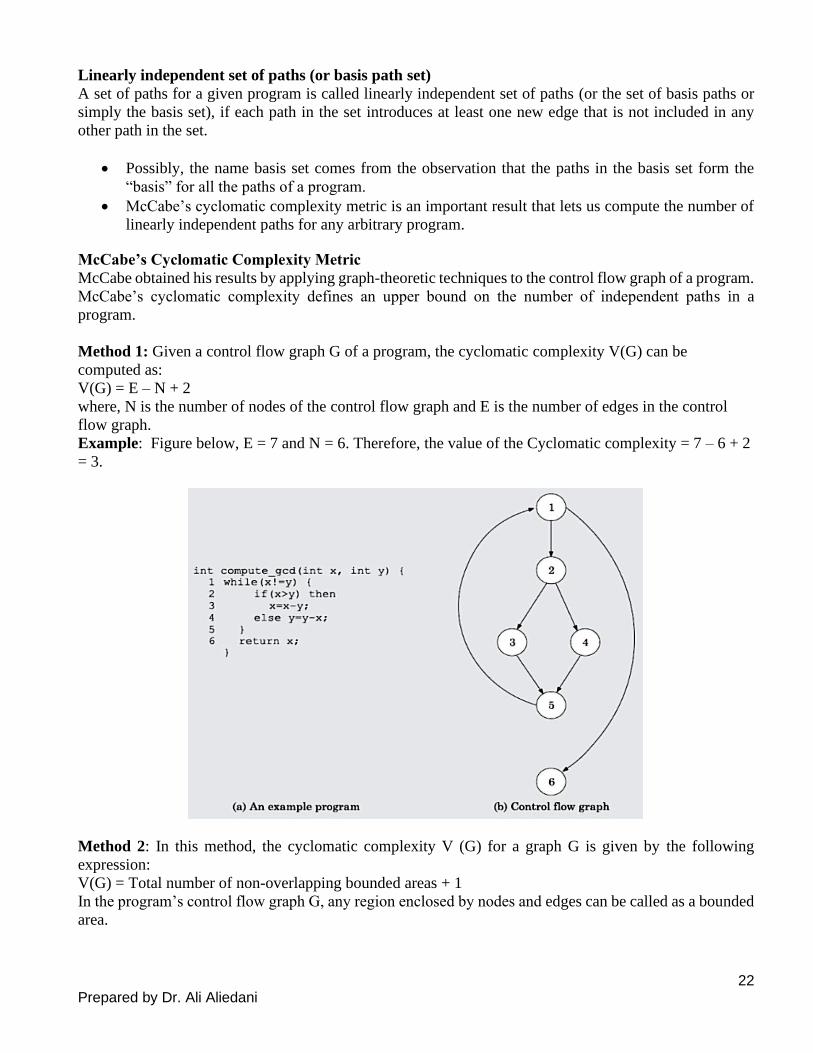
22 Prepared by Dr. Ali Aliedani
Linearly independent set of paths (or basis path set)
A set of paths for a given program is called linearly independent set of paths (or the set of basis paths or
simply the basis set), if each path in the set introduces at least one new edge that is not included in any
other path in the set.
• Possibly, the name basis set comes from the observation that the paths in the basis set form the
“basis” for all the paths of a program.
• McCabe’s cyclomatic complexity metric is an important result that lets us compute the number of
linearly independent paths for any arbitrary program.
McCabe’s Cyclomatic Complexity Metric
McCabe obtained his results by applying graph-theoretic techniques to the control flow graph of a program.
McCabe’s cyclomatic complexity defines an upper bound on the number of independent paths in a
program.
Method 1: Given a control flow graph G of a program, the cyclomatic complexity V(G) can be
computed as:
V(G) = E – N + 2
where, N is the number of nodes of the control flow graph and E is the number of edges in the control
flow graph.
Example: Figure below, E = 7 and N = 6. Therefore, the value of the Cyclomatic complexity = 7 – 6 + 2
= 3.
Method 2: In this method, the cyclomatic complexity V (G) for a graph G is given by the following
expression:
V(G) = Total number of non-overlapping bounded areas + 1
In the program’s control flow graph G, any region enclosed by nodes and edges can be called as a bounded
area.

23 Prepared by Dr. Ali Aliedani
Method 3: The cyclomatic complexity of a program can also be easily computed by computing the number
of decision and loop statements of the program. If N is the number of decision and loop statements of a
program, then the McCabe’s metric is equal to N + 1.
Steps to carry out path coverage-based testing
The following is the sequence of steps that need to be undertaken for deriving the path coverage-based
test cases for a program:
1. Draw control flow graph for the program.
2. Determine the McCabe’s metric V(G).
3. Determine the cyclomatic complexity. This gives the minimum number of test cases required to
achieve path coverage.
Test using a randomly designed set of test cases. Perform dynamic analysis to check the path coverage
achieved. until at least 90 per cent path coverage is achieved.
Uses of McCabe’s cyclomatic complexity metric
Beside its use in path testing, cyclomatic complexity of programs has many other interesting applications
such as the following:
• Estimation of structural complexity of code
From the maintenance perspective, it makes good sense to limit the cyclomatic complexity of the different
functions to some reasonable value. Good software development organisations usually restrict the
cyclomatic complexity of different functions to a maximum value of ten or so.
• Estimation of testing effort
• Estimation of program reliability
This relationship exists possibly due to the correlation of cyclomatic complexity with the structural
complexity of code. Usually the larger is the structural complexity, the more difficult it is to test and debug
the code.
6.5 DEBUGGING
After a failure has been detected, it is necessary to first identify the program statement(s) that are in error
and are responsible for the failure, the error can then be fixed.
Debugging Approaches
The following are some of the approaches that are popularly adopted by the programmers for debugging:
• Brute force method
This is the most common method of debugging but is the least efficient method. In this approach, print
statements are inserted throughout the program to print the intermediate values with the hope that some
of the printed values will help to identify the statement in error.
• Backtracking
In this approach, starting from the statement at which an error symptom has been observed, the source
code is traced backwards until the error is discovered.

24 Prepared by Dr. Ali Aliedani
• Program slicing
This technique is similar to back tracking. In the backtracking approach, one often has to examine a large
number of statements. However, the search space is reduced by defining slices.
6.6 INTEGRATION TESTING
The objective of integration testing is to check whether the different modules of a program interface with
each other properly.
The approaches of integration testing are:
• Big-bang approach to integration testing: it is the most obvious approach to integration testing. In
this approach, all the modules making up a system are integrated in a single step. • Top-down approach to integration testing
• Bottom-up approach to integration testing
• Mixed (also called sandwiched ) approach to integration testing
Exercises
1- Draw the control flow graph and determine the minimum required test cases set
void Search(int values , int key, int *found, int *index) {
int i=0;
*found=0;
while (i < N)
{
if values[i]== key
{
printf (found positive);
*found= 1;
}
else
{
printf (non-positive);
if (values[i]== -key)
{
printf (found negative);
*found 1;
}
}
if (*found)
{
printf(found at index %i, i);
*index=i;
return;
}
i;
}
}

2 Prepared by Dr. Ali Aliedani