
SoftGIS as a Bridge-Builder in Collaborative Urban Planning
28
Kahila, M. and Kyttä, M. (2008) SoftGIS as a bridge builder in collaborative urban planning, in Geertman, S. and Stillwell, J. (Eds.) Planning Support Systems: Best Practices and New Methods. Springer 19 SoftGIS as a bridge-builder in collaborative urban planning Maarit Kahila* and Marketta Kyttä Helsinki University of Technology, Centre for Urban and Regional Studies, PO Box 9300, 02015 TKK, Finland *maarit.kahila_at_tkk.fi Abstract: Current urban planning practices require a new way of thinking and new methods to improve the role of communicative and collaborative planning. Theoretically well-founded participation methods that utilize information and communication technology and geographical information systems (GIS) must be developed to support this work. New, user-friendly methods will facilitate the participation of inhabitants, allow residents to generate information about their own living environment and establish their role as the experts on that environment. SoftGIS methods aim to meet these challenges. We will introduce this new collection of methods and evaluate them in the context of current critical GIS discourse. The role of web-based softGIS emerges as a planning support system that strives to build a bridge between residents and urban planners. Keywords: softGIS; experiential knowledge; collaborative urban planning; critical GIS 19.1 Introduction Current trends in urban planning and recent changes in planning culture (Staffans, 2004; Puustinen, 2006) support the development of a new methodology for collaborative planning. Collaboration in Finland is supported by European Union (EU) directives and the Finnish Building and Land Use Act (1999). The latter aims to ensure wide participation and to support open and high-quality planning decisions and processes. In practice, such wide participation is difficult to realize as resources are inadequate. The participatory approach needs also to be evident in all phases of the planning process, which is rarely the case in reality. The views of participants can potentially smooth the planning and design processes and reduce the number of conflicts (Taylor, 1998), promote adaptation to continuously changing societal conditions (Innes and Booher, 1999), strengthen recognition of the differing values of various actors (Healey, 1997), support learning and knowledge- building (Friedmann, 1998) and, finally, help to achieve tangible regeneration outcomes
Transcript of SoftGIS as a Bridge-Builder in Collaborative Urban Planning

Kahila, M. and Kyttä, M. (2008) SoftGIS as a bridge builder in collaborative urban planning, inGeertman, S. and Stillwell, J. (Eds.) Planning Support Systems: Best Practices and New Methods.Springer
19 SoftGIS as a bridgebuilder in collaborative urban planning
Maarit Kahila* and Marketta Kyttä
Helsinki University of Technology, Centre for Urban and Regional Studies, PO Box 9300,02015 TKK, Finland
*maarit.kahila_at_tkk.fi
Abstract: Current urban planning practices require a new way of thinking and newmethods to improve the role of communicative and collaborative planning. Theoreticallywellfounded participation methods that utilize information and communication technologyand geographical information systems (GIS) must be developed to support this work. New,userfriendly methods will facilitate the participation of inhabitants, allow residents togenerate information about their own living environment and establish their role as theexperts on that environment. SoftGIS methods aim to meet these challenges. We willintroduce this new collection of methods and evaluate them in the context of currentcritical GIS discourse. The role of webbased softGIS emerges as a planning supportsystem that strives to build a bridge between residents and urban planners.
Keywords: softGIS; experiential knowledge; collaborative urban planning; critical GIS
19.1 Introduction
Current trends in urban planning and recent changes in planning culture (Staffans, 2004;Puustinen, 2006) support the development of a new methodology for collaborativeplanning. Collaboration in Finland is supported by European Union (EU) directives and theFinnish Building and Land Use Act (1999). The latter aims to ensure wide participation andto support open and highquality planning decisions and processes. In practice, such wideparticipation is difficult to realize as resources are inadequate. The participatory approachneeds also to be evident in all phases of the planning process, which is rarely the case inreality.
The views of participants can potentially smooth the planning and designprocesses and reduce the number of conflicts (Taylor, 1998), promote adaptation tocontinuously changing societal conditions (Innes and Booher, 1999), strengthen recognitionof the differing values of various actors (Healey, 1997), support learning and knowledgebuilding (Friedmann, 1998) and, finally, help to achieve tangible regeneration outcomes

(Beresford and Hoban, 2005). To implement these objectives, planners have to acquire notonly new skills and professional roles (Forester, 1989; Puustinen, 2006), but also developmore usable and effective participation methods, as well as a deeper understanding of theknowledge hidden in the experiences of the inhabitants.
In the first sections of this chapter, a new soft geographic information systemmethodology, softGIS, is introduced that has the potential to enhance participation byallowing the residents the possibility of sharing their knowledge of their living environmentwith urban planners and researchers. SoftGIS methodology refers not only to a whole set ofindividual softGIS methods but also to the special collection of theories, concepts and ideasbehind the development of these methods. SoftGIS methods will therefore be evaluated inthe light of the comments O’Sullivan (2006) makes in his critical GIS discourse. Thatincludes the observation that GIS is not merely a technical tool for handling geographicalinformation, but also takes into account its societal impact. The aim of this chapter is toanalyse to what degree and in which ways softGIS methods can build a bridge betweenresidents and urban planners. Because softGIS methodology is in the early stages ofdevelopment, we will focus on the main ideas behind the innovation, the few existingexperiences of the methodology’s use and the future development prospects concerning theuse of softGIS methodology in collaborative planning practices.
19.2 SoftGIS methods
SoftGIS methods allow residents to produce localized experiential knowledge. SoftGISleads us to ask how the everyday lives of the residents are organized, what kind of placebased positive and negative experiences (Manzo, 2003) residents have and how theybehave in their physical environment. This knowledge is collected through userfriendlyinternetbased applications (Kyttä and Kahila, 2006; Rantanen and Kahila, 2008). Finally,the localized experiential knowledge comprises a special layer in the GIS used by expertssuch as urban planners and researchers. SoftGIS methods are built on the followingprinciples:
§ the operationalization of perceived knowledge is grounded in the theories ofhumanistic geography and environmental psychology;
§ the perceived knowledge is gathered through scientifically valid, reliable andethical methods;
§ softGIS methods are developed in cooperation with urban planners, who can usethis novel knowledge in their planning practices;
§ the database makes systematic GIS and statistical analyses possible; and§ the methods provide a userfriendly internet platform for residents to evaluate
their everyday living environment.

Our aim is to build a bridge between residents, researchers and urban planners bypromoting the participation and collaboration of citizens with the help of softGIS methods.These methods promote the sharing of the residents’ experiences and behavior concerningtheir living environment. We believe that new technology, and especially webbased GISapplications, can become an important way of communication between inhabitants andplanners (Figure 19.1).
Figure 19.1: SoftGIS method as a bridgebuilder between planning practice andinhabitants’ experiences of everyday life
The technical development of these web applications has been realized by variedgroups of media technology students in the Institute of Technology of the EspooVantaaUniversity of Applied Sciences. The current technical requirements for softGIS methodsare presented in Table 19.1.

Table 19.1: The technical requirements for softGIS methods
The first softGIS prototype was launched in 2004 in Järvenpää, Finland. By fall2007 five different softGIS methods had commenced in six different municipalities. Up totoday these web questionnaires have reached about 3,000 respondents. In the followingsections we introduce five softGIS methods that we have categorized as: (i) softGISmethods capturing the general perceived quality of the environment, (ii) softGIS methodsconcentrating on a specific theme, and (iii) softGIS methods for a special user group.
19.2.1 SoftGIS methods for mapping perceived environmental quality
The first prototype of softGIS methods was developed to study broadly the perceivedquality of environment in the city of Järvenpää (www.softgis.fi). To study the localized,perceived quality factors (affordances), individual ecosocial niches, used local servicesand perceived health and wellbeing, an internetbased GIS method was developed in 2004(Table 19.2). This web questionnaire had a tube structure and it proceeded step by step,meaning that each visitor followed the same route through the application. Special attentionwas paid to the quality of the maps used in the application. Aerial photos with a scale of1:4,000 were used and the orientation was aided by highlighted roads and landmarks.Owing to technical restrictions, it was only possible to mark point information on the map,not routes or areas.

Table 19.2: The contents of the softGIS survey on the perceived quality of theenvironment
Later, in 2006, the Järvenpää pilot study was replicated in three additionalmunicipalities, Mäntsälä, Kerava and Nurmijärvi (Figure 19.2). All of these applicationswere designed in close collaboration with urban planners. The results in each case havebeen published in traditional research reports and in web summaries but part of the data hasalso been delivered as a CDrom to urban planners to be utilized in their planning projects.
Figure 19.2: The softGIS quality methods

Four hundred and twentyseven inhabitants answered the original Järvenpääsurvey and about 1,300 inhabitants participated in the following study in three additionalFinnish towns. In each case, the web questionnaire was available on the front page of thewebsites of the cities for three months and all inhabitants were eligible to answer thequestionnaire. The web surveys were advertised in local newspapers and libraries.According to our studies, middleincome households and middleaged women withchildren living in single family houses were overrepresented in these web questionnaires.
The evolution of a softGIS method to study perceived environmental quality hasmoved from more open questions to more structured ones and from longer questionnairesto shorter ones. To make the analysis easier, originally freely expressed, personalaffordances of the original questionnaire were later preclassified, but we still allowed therespondents to name their own affordances (Kyttä and Kahila, 2006). To combine thequalitative and quantitative approaches in each softGIS questionnaire the inhabitants could,for example, write down stories or memories about personally meaningful places.
19.2.2 Thematic softGIS methods
In addition to methods that collect the experiential data broadly, various thematic softGISmethods can be developed to study, for example, perceived safety, urban mobility orexperiences concerning the green environment. In each case, relevant research literatureand expert researchers should be consulted to produce valid, reliable, theoretically andpractically welloperationalized methods. These applications need to be compact and testedmodules that can also be combined with each other. The themes should support currentplanning challenges and represent themes which planners find interesting and relevant.Planners should also always have the possibility of adding to questionnaires somequestions of their own.
The softGISsafety method was developed to study the perceived safety of aneighborhood (www.pehmogis.fi/muotiala). This web survey was used in Muotiala, aneighborhood in the city of Tampere in Finland. The planning of Muotiala has beeninspired by the CPTEDmodel (Crime Prevention Through Environmental Design).Through the softGISsafety method we gathered profound feedback from the residents aboutactual perceived safety, sense of community and everyday life infrastructure in the area.The residents localized places of perceived social and traffic dangers, pleasant andunpleasant routes and signs of disorder and care. The results give detailed information toplanners how some realizations of CPTED principles, for example, lighting, public spacedesign or light traffic routing are reflected in the residents’ localized experiences and use oftheir environment (Figure 19.3). The localizations of perceived danger can also becompared with the police maps of the actual scenes of crime. The data can then also beutilized by police in their preventative work in neighborhoods.

Figure 19.3: Ten CPTED principles applied in Muotiala and inhabitants’ perceptionsof danger and social interaction
The softGISsafety questionnaire was not publicly accessible as were the earlierapplications. Instead, we gathered the addresses from the census register and sent a letter toevery household asking all inhabitants over 15 years old to answer the questionnaire on theweb. In the second round, a pen and pencil questionnaire was also offered. One hundredand eightytwo (39 per cent) inhabitants returned the questionnaire either on the web or inthe mail. About 30 per cent of the subjects chose the traditional questionnaire; the majorityof them were over 60 years old. The next new themes for thematic softGIS applicationscould be the mobility patterns and perceived health of urban inhabitants. Ewing et al.(2003) have highlighted the need for this kind of microlevel research to study the healthpromoting qualities of urban settings as well as the use of GISbased tools.

19.2.3 SoftGIS as a method for a special group
The softGIS methods have to be sensitive to the varying skills, interests and orientations ofdifferent user groups of the environment. Either special tools for different users or differinginterfaces for the same applications must be available to guarantee as wide participation aspossible. The interfaces are designed to be easytouse because they are built for peoplewho are not familiar with webbased GIS services.
The softGISchildren method in Figure 19.4 is specially designed for the use ofchildren and young people. An internetbased design game(www.kaupunginosat.net/seikkailu/) that mediated children’s environmental visionspreceded this method (Kyttä et al., 2003). Theoretically, softGISchildren is based on thedefinition of environmental childfriendliness by Kyttä (2003), where the diversity ofenvironmental resources and access to play and exploration were chosen as the two centralcriteria of a childfriendly environment. In the softGISchildren method, this twolevelmodel was enlarged with a third level, namely the wellbeing and perceived health of thechildren. In the softGISchildren method, 915 yearold children can, for example, locateplaces (affordances) that are functionally, emotionally or socially meaningful, draw a routefrom home to school and speak about their perceived health and wellbeing. This methodgrasps the essential qualities of childenvironment relationships that are theoreticallybasedand empiricallytested in earlier studies.
Figure 19.4: The softGISchildren method
Currently, we are collecting data with the softGISchildren method in the city of Turku withthe help of local comprehensive schools. The local actors, city authorities and schools havebeen active during the method development and are eager to receive the results. Thesedifferent actors have differing interests in the data. The softGISchildren application will beopen after the research data collection and a special tool to explore the experientialknowledge in web has been developed. An online, interactive mapbased data analysis tool,softGISview, is currently under construction that can be used by both planningprofessionals and the public. Privacy needs to be carefully considered in the developmentof this online tool to explore the experiential data of children and young people in web.

A future example of a method targeting a special group can be a softGISelderlytool. Although the elderly are a challenging group to approach through the web, aninteresting theme could be, for example, the mobility constraints of the environment fromthe point of view of ageing women.
19.3 The critical evaluation of the softGIS methods
The interface between geographic information science and geographical social theory hascreated an interesting critical debate concerning the different uses and theorizing aroundGIS and especially about the possibility to ‘straddle the fence’ between human geographyand GIS (O’Sullivan, 2006). In the core of this critical GIS discourse, three viewpoints areespecially relevant for the softGIS methods. We will evaluate the softGIS criticallyfollowing these three themes.
The first critique of the traditional, technical use of GIS is grounded on the workthat supports laypersons’ and communities’ capabilities to utilize GIS in their everyday life.The development of public participation GIS (PPGIS) or participatory GIS (PGIS), thatallows lay persons to take part in GIS, has been significant in recent years. On the otherhand, the planning support systems (PSS) aim mainly to support experts’ work. We willfirst compare the softGIS method with some examples of PPGIS and PSS and argue howsoftGIS can build a bridge between these two systems.
The second step in the critical GIS literature concerns the need to adapt morequalitative information to GIS. As Kwan (2000; 2004) and Pavlovskaya (2005), whorepresent feminist GIS research, have pointed out, GIS data should be completed andenriched with the details of everyday life. Talen (2000), who has developed a specialbottomup GIS (BUGIS) tool, says that “The goal of a BUGIS should not be to capture allmeaning but to strengthen the quality and depth of communication about residents’ viewsand preferences” (Talen, 2000, p. 281). Because softGIS is about attaching experientialknowledge to GIS, we will discuss the nature of the knowledge collected with softGISmethods theoretically and consider the possibilities for handling this information withexpert systems.
The critical issue for softGIS methodology is its ability to support the structuresof democratic society. In collaborative planning, the flow of information between differentactors is critical (Healey, 1997). The competence of softGIS methodology is challenged toa degree by how experiential knowledge can be transferred to various actors in the planningprocess. In the critical ‘GIS and society’ discussion, issues like privacy, access and ethicsare essential. In softGIS methods, where the mapping of individual data is central, a lot ofconcern arises about data collection, transfer, analysis and storage (O’Sullivan, 2006).

19.4 The enlarged use of GIS
GIS/PSS and PGIS/PPGIS are developed to ease and support experts’ work withgeographical information or to enhance laypersons’ access to geographical information andcommunication between different stakeholders. In the next section we will study thesimilarities and differences between softGIS and the existing methods. SoftGIS aims toform a bridge between existing traditions in the fields of participative GIS and PSS (Figure19.5).
Figure 19.5: SoftGIS: building the bridge between participative GIS and PSS
19.4.1 SoftGIS and PSS
Our target is the rich use of GIS in collecting, storing, analyzing and visualizing placebased experiential knowledge. GIS should not only be seen as a container of maps in digitalform, but also as a supporter of spatial decisionmaking (NedovicBudic, 2000), afacilitator of spatial thinking throughout the process (Pavlovskaya, 2005) and, above all, atool for revealing what is otherwise invisible in geographic information (Kwan, 2000;2004; Pavlovskaya, 2005), such as social spatial patterns or in our case the soft spatialknowledge (Rantanen and Kahila, 2008).
Owing to its technical development work and commercial applications (forexample, MapInfo and ArcGIS), GIS is known as a support system both among researchersand in the professional field like urban planning. The very placebased nature of urbanplanning encourages the adaptation of GIS techniques also to communicate with the publicand decisionmakers (NedovicBudic, 2000). PSS traditionally consists of three importantcomponents: data, models and geovisualization (Klosterman, 1999). Most of the systems

are tools that support specific tasks within planning processes (Geertman and Stillwell,2004). There are several examples of webbased PSS, such as areaspecific PlanningSystem for Sustainable Development (PSSD), and more taskspecific systems such asSPARTACUS. These systems are toolboxes that share information among experts likeurban planners (Geertman and Stillwell, 2004). Some of the systems also enhance publicparticipation. For example, games that give laypersons a possibility to familiarizethemselves with planning problems in certain areas, like the Baas op Zuid game(http://www.baasopzuid.nl/) in Rotterdam, can be seen as an example of PSS.
SoftGIS aims to support urban planning by gathering experiential knowledgesystematically and allowing the urban planners to take part in the development of softGISapplications. Still, we have to ask: in what way or to what degree can softGIS be PPS? CansoftGIS really assist planners in their work? One of our next steps is to study how softGISas a method and the produced soft information can be integrated in the urban planningprocess? According to our experience, urban planners seem to be keen to have placebasedexperiential knowledge integrated into their systems.
19.4.2 SoftGIS, PGIS and PPGIS
Quite often residents are neglected in PSS developments. This has not been the case inPGIS or PPGIS discourse, which aims to give lay persons the possibility to be integrated inGIS and to give privilege and legitimacy to local and indigenous knowledge of certainareas. In these sociallyoriented GIS applications, the aim has been more to enrich thecontent than to develop the technique. The target has been society’s greater participation inthe production and use of geographical information (Dunn, 2007) although some PPGISdevelopers still rely only on publiclyaccessible government data (Tulloch, 2007). On theweb there are a lot of examples where the aim is to offer laypersons a possibility to exploremaps and different information. Van Map (http://www.city.vancouver.bc.ca/vanmap/)represents one example of map services offered by cities. Virtual Slaithwaite(http://www.geog.leeds.ac.uk/papers/998/) is an online PPGIS application that allows atwoway flow of information (Carver et al., 1999). This system allows residents to expresstheir opinions, which builds up a community database. Many PGIS examples are not webbased like BUGIS (Talen, 2000) but allow a small group of residents to describe theirliving environment and, with the help of facilitators, this information is transferred to aGIS.
PPGIS applications often rely technically on expert systems and only a fewmethods are designed for lay persons. These methods have been mainly applicationdrivenand the theoretical basis is often inadequate (Balram and Dragi evi , 2006). Sieber (2003)has commented that if conventional GIS technology remains a core component of PPGIS itmay play a restrained role in enabling democratic participation. We nevertheless think thatnew, easytouse internetbased systems can be useful for both residents and for someurban planners who find conventional GIS applications hard to use.

According to O’Sullivan (2006), the breadth and depth of the work done in thePGIS realm cannot be exaggerated, as is the case in the PSS realm. In Figure 19.6, we haveclassified the various, participative GIS applications according to the level of information,the application uses and the level of openness or accessibility of the application. In thiscontext, data, information and knowledge represent the levels of information that can beeither official, registerbased geographical information or knowledge produced by laypersons. Another level of the differentiation depends on whether the systems arepermanently webbased, only parttime in the web or only PCbased.
Figure 19.6: The existing participative GIS applications
The softGIS methods represented so far are questionnaires available onlytemporarily on the web which gather knowledge produced by residents. More developmentwork is needed for softGIS to become a proper twoway channel of continuouscommunication between residents and planners. To enhance the role of PSS and PGIS inthe future, the common development interests should be recognized (Klosterman, 2005;Jiang et al., 2003).
19.4.3 Formulating softGIS knowledge for planners
One of the most crucial questions is how to analyze and present the experiential knowledgein planning practice in sufficiently digestible ways. If this task does not succeed, theexperiential dimensions are unlikely to become embedded in design and planning practice(Thwaites and Simkins, 2007). When transferring new information to urban planningpractice, we should be aware that the planners are already struggling with a huge

information overload. Visualization plays a key role in this challenging task, not leastbecause urban planning is graphical by its very nature. Owing to more effective GIScapabilities, the role of mapping has changed from the endproduct to a tool that is activelyused in all the phases of the process. In this sense, visualization and mapmaking can beseen as a bridge between research and design. In addition to the traditional focus onavailable statistical or registerbased information, information produced by different actorsis also needed (Laurini, 2001). Van Hertzele (2004) calls for new ‘interpretativeframeworks’ that should be available for planners to help them better understand thedifferent forms of nonexpert knowledge and views. We agree with McCall and Minang(2005) that this kind of knowledge must be seen to be as legitimate as experts’ knowledge.In participation planning GIS can be an important enabling tool (Horelli, 2002).
We created a small web questionnaire for politicians and urban planners andasked about current participation possibilities and the perceived value of the data gatheredwith softGIS methods. Respondents thought that the current participation procedure isadequate but the experiential, localized data could offer a useful addition to the knowledgeavailable. The contexts where softGIS data could be utilized varied from town and generalplanning projects to development projects in buildup areas and new residential areas.Traffic planning was also perceived as a potential user of softGIS knowledge, for example,concerning the location of basic services.
Visualizations of softGIS data aimed at helping planners can be, for example,experiential knowledge of the green environment presented on top of the map of the greenstructure of the town. Similarly, trafficrelated positive and negative comments can beshown on the traffic network map (Figure 19.7). Naturally, the planners of our partnermunicipalities have received research reports of the softGIS projects and also some locateddata in a CDrom to be utilized in their GIS programs. At the moment, we are building awebbased online tool, for the interactive analysis of the data from the children’s softGISproject. With the help of this softGISview tool, urban planners and all other interestedparties have the chance to explore the data.

Figure 19.7: Positive and negative comments shown on the traffic network map fromthe city centre of Järvenpää
The success and impact of the softGIS approach in the planning processes willeventually depend on the willingness of the planners and decisionmakers to use theproduced experiential knowledge and the new methods in their work. In the near future wewill study in what form and in what part of the process different actors are ready to use theexperiential knowledge produced by the softGIS methods.

19.5 The theoretical and analytical challenges of GISbased individualdata
19.5.1 The theoretical basis of experiential knowledge gathered with softGIS
The theoretical background of the softGIS methods lies in the humanistic geography,environmental psychology and urban planning theory that emphasize the experientialapproach to planning (Thwaites and Simkins, 2007). In these traditions we have looked fortransactional approaches where the personenvironment relationship is seen as a dynamic,interactive system. The transactional approach stresses the active role of both parties in thisinteractive relationship. People are active agents in their environments and can influencetheir environments and change them. In the same way, the material, social and culturalenvironment actively influences human beings by providing prerequisites for certainfunctions or by facilitating social encounters (Altman and Rogoff, 1987).
There is a long ‘mentalist’ tradition in environmental psychology and socialsciences of ignoring the physical environment itself, even in peopleenvironment studies.Consequently there is a lot of theoretical and empirical research within humanisticgeography and environmental psychology concerning, for example, cognitiverepresentations, cognitive maps or mental maps of the environment without reference to thephysical features of the environment that they try to represent. Existing studies onperceived environmental quality share the same essential flaw (Bonnes and Bonaiuto,1995; Skjaeveland and Gärling, 1997). In social sciences, too, the material world has longbeen disregarded. The ‘new wave’ of humanistic geography and social scientific studiesaims at a better understanding of the relationship between the material and the social(Thrift, 1996; Gieryn, 2000; Latour, 2002).
As a whole, the dissolution of the dualism between the mental, experiential worldand the physical world has presented a challenge. The few nondualistic approaches thataim to bring the material environment ‘back’ to the manenvironment research offer arelevant basis for our work. An example of a truly transactional, nondualistic theoreticalconcept, that does not create dualism between a person and his/her environment, is thenotion of affordances that is used in ecological perceptual psychology (Gibson, 1979). Theterm ‘affordances’ has traditionally referred to the perceived opportunities and restrictionsconcerning a person’s actions in a given environment. This concept can be expanded toinclude the emotional, social and sociocultural opportunities and restrictions that anenvironment offers (Gibson, 1979; Kyttä, 2003; Heft, 2001). The concept of affordancesbreaks the subjectobject dichotomy; an affordance is not a characteristic of theenvironment, nor a characteristic of the individual, but rather it is something between them.When the concept of affordances is applied, the transactional relationship between theperson and the environment can be operationalized. That is exactly what we have attemptedto do in softGIS methodology.
SoftGIS attempts to capture both the experiential knowledge of the inhabitantsand the information about behavior in the environment as well as the use of the

infrastructure of everyday life (Horelli, 2002). On the other hand, GIS offers a uniquepossibility to operationalize the depiction of the physical environment, although GIS is notan objective representation of the environment. Still, it is so far the most useful descriptionof the physical qualities of the settings that we trace from the point of view of everyday lifeand individual experiences (Figure 19.8). We strive to link the human experience withspatial expression in ways that are relevant to design and planning decisionmaking. This isone of the crucial tasks, if we aim to build a bridge between the planning practice andexperiential knowledge.
Figure 19.8: The various layers representing the experienced, lived and physicalenvironment

19.5.2 Processing the softGIS data
The personally meaningful affordances of different user groups (adults, children) in varioustypes of urban and rural settings are distinguished and located in softGIS. The actualizationand the accessibility of these affordances are studied, together with the characteristics ofthe physical environments. The construction of the softGIS methods and the analysis of thedata produced by the residents are based on scientific principles concerning the validity andreliability of the data. With the help of GIS techniques, the perceptions of the residents arecombined and analyzed along with the information concerning the physical structure of thecity, for example, the density, the type of land use, the amount and quality of the greenareas, the connectivity of urban structures etc. Experiential knowledge is also thoroughlyanalyzed both with qualitative and statistical quantitative methods.
The softGIS methods allow the construction of a database that contains a rich setof background information and both located and nonlocated experiential knowledge. Thedatabase can be transferred to various statistical and GIS programs. In GIS analysis, thegeographically imprecise and fuzzy softGIS data are challenging, which has to be takeninto account when the results are interpreted. Often the GIS data are assumed to be‘perfect’ and only technical problems receive major attention. Nevertheless, GIS data,including softGIS data, are not free from social and human influences (Taylor andJohnston, 1995).
The map material that is used in the softGIS applications affects the residents’opportunities to read and orientate on the maps. It also affects the accuracy of the gatheredinformation. In our applications we have used aerial photographs, address maps andgeocoded axonometric projections. So far we know that the softGIS respondents findaddress maps generally easier to orientate and use than aerial photographs. On that basisthe use of aerial photographs are problematic, although we have manipulated thephotographs by highlighting roads and adding street names. Originally we thought that theaerial photographs could work well in the mapping of experiential knowledge, because it ispossible to zoom even to the yards, locate trees, etc. There is certainly a lot of room forfurther research in this area. The map tool is especially difficult for the oldest and theyoungest respondents. In the softGISchildren method, a technical mapping aid is used tohelp children to orientate themselves (Figure 19.9). In the future, we will studysystematically the usability of different types of maps and the mapreading skills ofdifferent user groups.

Figure 19.9: The softGISchildren application actively aids a child to orientate in themap
In the earliest softGIS applications it was only possible to locate pointinformation. Respondents, nevertheless, would have preferred to locate their experiencesareally. Technically, and in the analysis phase, this type of localized information ischallenging. In the softGISchildren and softGISsafety applications also it has been possibleto locate route information (Figure 19.10). Some inhabitants found the routedrawing toolquite difficult to use. In the softGISchildren application, where a Flash Player is applied inthe user interface, the routedrawing tool is more userfriendly. Maybe the most relevantway to locate the soft fuzzy knowledge would be the spraycan tool used, for example, tomap the high crime areas in the city of Leeds (Waters and Evans, 2003).

Figure 19.10: The pleasant (left) and unpleasant (right) routes can be located in thesoftGISsafety method
Compared with the traditional ‘hard’ GIS data, all our softGIS data are qualitativeby nature because they are based on the residents’ experiences and behavior (cf. Kwan,2000, 2004; Pavlovskaya, 2005). Nevertheless, from the point of view of social sciences,part of our ‘qualitative’ softGIS data can be analyzed quantitatively (the classified, closedquestions) and another part qualitatively (stories that the residents attach to theirmeaningful places). Although it may be tempting only to collect qualitative informationwith softGIS methods, the analysis of these argumentation maps (Rinner, 2001) is quitelaborious. We seek to combine the ‘soft’ and ‘hard’ data in our softGIS data analysis, sothe quantitative analysis of soft data is, in general, more useful for that purpose.
The rich, multidimensional and imprecise softGIS data challenge the spatial GISanalysis. The visual exploration of softGIS data on the various types of maps is the basicstep in the analysis. Maps that show how the affordances cluster and what kinds of hotspotscan be traced allow visual datamining and further considerations of the following analysis(Figure 19.11). These maps tell us ‘stories’ in visual format about the deeperunderstandings of the living environment. In this sense, maps can be used in the analysisprocess, and not only as endproducts, and visualization should be used especially becauseit has been proven to be an effective way to deliver knowledge (Wood, 1992).

Figure 19.11: Visualisation of positive quality factors (left) located on a map ofJärvenpää and (right) on an aerial photo clipped from the city centre of Järvenpää
The buffering technique was utilized to analyze the physical qualities of therespondents’ immediate surroundings and the degree of urban density: the amount of greenspace was calculated within the buffers surrounding respondents’ homes and a sufficientlysensitive measure for the physical qualities of individual surroundings was found. Ourresults showed a significant negative correlation between urban density and perceivedoverall quality of the living environment (Kyttä and Kahila, 2006). The distances betweenlocalized affordances and respondents’ homes were also calculated and the individualquality networks compared in different neighborhoods. Spatial interpolation and thematicmapping were used to study, for example, the strength of the clustering of the positive andnegative affordances.
19.6 SoftGIS and society/political GIS
In a democracy, the possibilities for public participation form an important cornerstone. Inurban planning cultures, the communicative or collaborative turn denotes the types ofplanning practice whose emphasis is on interaction and communication between variousstakeholders. According to Horelli (2002), enabling tools refer to any techniques thatenhance the transaction and knowledgecreation of the stakeholders during the differentphases of planning. Horelli distinguishes a number of different enabling tools that can beclassified as diagnostic, expressive, organizing and political. Though researchers havedeveloped and studied a lot of different participation tools, they are rarely implemented inurban planning practices. In Finland, public hearings are the most common participationmethods. The collection of softGIS methods can be seen as a methodological package thatis best suited to the evaluation phase of the planning process where diagnostic tools andtraditional research methods should dominate. In the future, softGIS can also become acontinuous method for monitoring during the whole planning process from initiation toplanning, implementation, evaluation and maintenance.
As current participation methods inadequately support democratic participationpossibilities (Healey, 1997; Kingston, 2007), webbased methods can make participationmore democratic, because they free participation from the limits of time and place and theycan potentially reach large numbers of inhabitants anonymously. Facetoface meetings andconversations are certainly needed, but internetbased methods have an increasinglyimportant role in the communicative planning processes (e.g. Kangas and Store, 2003; Yehand Webster, 2004).
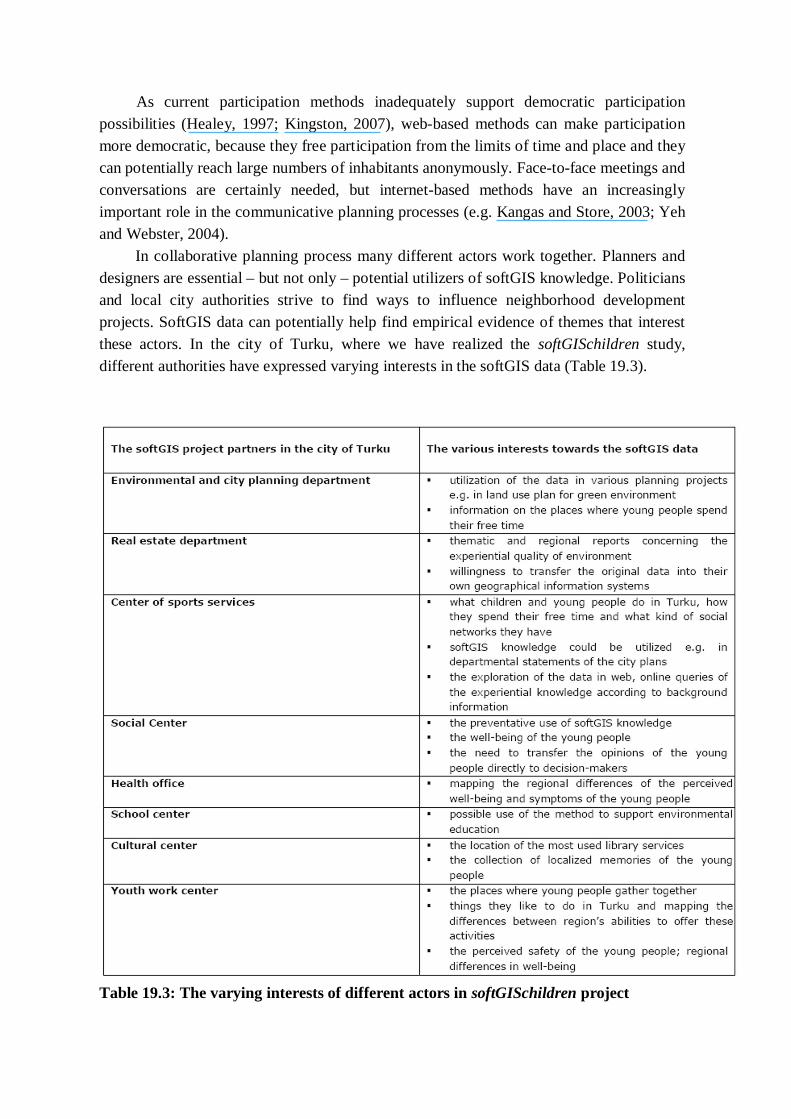
In collaborative planning process many different actors work together. Planners anddesigners are essential – but not only – potential utilizers of softGIS knowledge. Politiciansand local city authorities strive to find ways to influence neighborhood developmentprojects. SoftGIS data can potentially help find empirical evidence of themes that interestthese actors. In the city of Turku, where we have realized the softGISchildren study,different authorities have expressed varying interests in the softGIS data (Table 19.3).
Table 19.3: The varying interests of different actors in softGISchildren project

It is obvious that the digital divide can weaken equality between different users. InFinland, the readiness to adopt webbased participation methods is quite pleasing, becausethe majority of households have access to the internet and every school and public libraryoffers access to the web. On the whole, reviews and comparisons between web andtraditional surveys show significant differences in neither the characteristics of therespondents (Gosling et al., 2004) nor in the results of the surveys (Rittel et al., 2004).According to our experience, softGIS is able to reach those inhabitants that areunderrepresented in traditional participation gatherings. While older people dominate inpublic hearings, middleaged, busy inhabitants are the majority of softGIS respondents. Wehave found little evidence of repeated answering or result manipulation in softGIS studies.There are also effective ways to reduce that threat (Gosling et al., 2004).
In the collection of large databases an important ethical issue is the protection ofprivacy. The confidentiality of GISbased individual data collected on the internet isespecially vulnerable. The privacy questions do not apply only to the data collection phaseof the softGIS surveys, but also to the analysis, storage and delivery of the data. Data areusually always aggregated, so that individual respondents cannot be identified, the captureddata are stored carefully and for urban planners only a part of the raw data can betransferred. Visualization requires special care in order not to stigmatize certain areas.Because residents need to be convinced of privacy protection, information concerningethical issues can always be found in the softGIS web pages (Figure 19.12).

Figure 19.12: Picture of the infopages in the softGISchildren application
19.7 Conclusion
Webbased GIS services have a lot of potential to become established informationframeworks for city authorities, urban planners and lay persons in the future. At themoment, many good practices in the field remain diverse and dispersed. While theutilization of the web more effectively has huge capacity, the dangers and challenges ofwebbased GIS services should be recognized. One challenge relates to the informationoverload that is a result of the improving possibilities of knowledge production (Curry,1998). Although many useful services are already developed, most of them are notestablished practices. Further ICT and GIS technology innovations are needed but they arenot enough: social and societal innovations are also required. Development work musttherefore be transdisciplinary, and the practical knowledge of different actors of urbanplanning must be applied therein.
If successfully developed, the softGIS method, among other participatory GISmethods, has the potential for extensive application in the future in environmentalmanagement and in traffic and community planning. In the future the collection of varioussoftGIS methods could form a methodology that provides a new platform for participatoryplanning. To guarantee the usability of the methods and the quality of the information they

produce, serious development of the methods and their theoretical basis is needed. SoftGIScan form a bridge between participative GIS methods and planning support systems,between research and practice, and above all between planning practices and inhabitants’experiences of everyday life.
Acknowledgments
The development work of the softGIS methodology has been realized through variousresearch projects financed by the Finnish Ministry of the Environment, the NationalTechnology Agency of Finland, the Finnish Cultural Foundation, the graduate schoolKIRSU and the cities of Järvenpää, Mäntsälä, Kerava, Nurmijärvi, Tampere and Turku.The authors are grateful to all the financial backers and the researchers involved in theseprojects. Special thanks belong to Liisa Horelli, Ari Jolma, Timo Heikkinen, Jenni Kuoppaand Anna Broberg for valuable critical comments.
References
Altman, I. and Rogoff, B. (1987) World views in psychology: trait, transactional,organismic and transactional perspectives, in Stokols, D. and Altman, I. (eds.)Handbook of Environmental Psychology, Volume 1, Wiley, New York, pp. 740.
Balram, S. and Dragi evi , S. (2006) Collaborative geographic information systems:origins, boundaries, and structures, in Balram, S. and Dragi evi , S. (eds.)Collaborative Geographic Information Systems, Idea Group Publishing, UK, pp. 122.
Beresford, P. and Hoban, M. (2005) Participation in Antipoverty and Regeneration Workand Research. Overcoming Barriers and Creating Opportunities, Joseph RowntreeFoundation, York. Retrieved October 9, 2007, fromhttp://www.jrf.org.uk/bookshop/eBooks/1859353738.pdf
Bonnes, M. and Bonaiuto, M. (1995) Expert and layperson evaluation of urbanenvironmental quality: the ‘natural’ versus the ‘built’ environment, in Guerriei, Y.,Alexander, N., Chase, J. and O’Brien, M. (eds.) Values and the Environment. A SocialScience Perspective, John Wiley & Sons, Chichester.
Building and Land Use Act (Maankäyttö ja rakennuslaki) (1999) Finlex, valtionsäädöstietopankki. Retrieved October 12, 2007, from http://www.fi nlex.fi /fi/laki/ajantasa/1999/19990132.
Carver, S., Evans, A., Kingston, R. and Turton, I. (1999) Virtual Slaithwaite: A Web BasedPublic Participation ‘Planning for Real System’, Virtual Slaithwaite Case StudyReport. Retrieved October 18, 2007, from http://www.geog.leeds.ac.uk/papers/998/.

Curry, M.R. (1998) Digital Places. Living with Geographic Information Technologies,Routledge, London.
Dunn, C.E. (2007) Participatory GIS – a people’s GIS, Progress in Human Geography,31(5): 616637.
Ewing, R., Schmid, T., Killingsworth, R., Zlot, A. and Raudenbush, S. (2003) Relationshipbetween urban sprawl and physical activity, obesity and morbidity, American Journalof Health Promotion, 18(1): 47–57.
Forester, J. (1989) Planning in the Face of Power, University of California Press, Berkeleyand Los Angeles.
Friedmann, J. (1998) The new political economy of planning: the rise of the civil society,in Douglass, M. and Friedmann, J. (eds.) Cities for Citizens, John Wiley & Sons,Chichester.
Geertman, S. and Stillwell, J. (2004) Planning support systems: an inventory of currentpractice, Computers, Environment and Urban Systems, 28: 291310.
Gibson, J.J. (1979) The Ecological Approach to Visual Perception, Houghton Mifflin,London.
Gieryn, T. F. (2000) A space for place in sociology, Annual Review of Sociology, 26: 463495.
Gosling, S.D., Vazire, S., Srivastava, S. and John, O.P. (2004) Should we trust webbasedstudies? A comparative analysis of six preconceptions about internet questionnaires,American Psychologist, 59(2): 93104.
Healey, P. (1997) Collaborative Planning. Shaping Places in Fragmented Societies,McMillan Press Limited, Hampshire and London.
Heft, H. (2001) Ecological Psychology in Context: James Gibson, Roger Barker, and theLegacy of William James’s Radical Empiricism, Lawrence Erlbaum Associates,Publishers Mahwah, New Jersey, London
Horelli, L. (2002) A methodology of participatory planning, in Bechtel, R. and Churchman,A. (eds.) Handbook of Environmental Psychology, John Wiley, New York, pp. 607628.

Innes, J. E. and Booher, D. E. (1999) Consensus building and complex adaptive systems. Aframework for evaluating collaborative planning, APA Journal, 65(4): 412423.
Jiang, B., Huang, B. and Vasek, V. (2003) Geovisualisation for planning support systems,in Geertman, S. and Stillwell, J. (eds.) Planning Support Systems in Practice, Springer,Berlin, pp. 177191.
Kangas, J. and Store, R. (2003) Internet and teledemocracy in participatory planning ofnatural resources management, Landscape and Urban Planning, 62: 89101.
Kingston, R. (2007) Public participation in local policy decisionmaking: the role of webbased mapping, The Cartographic Journal, ICA Special Issue, 44(2): 138144.
Klosterman, R.E. (1999) The What if? collaborative planning support system, Environmentand Planning B, 26: 317320.
Klosterman, R.E. (2005) Guest Editorial, Environment and Planning B, 32: 477484.
Kwan, MP. (2000) Analysis of human spatial behavior in a GIS environment: recentdevelopments and future prospects, Journal of Geographic Systems, 2: 8590.
Kwan, MP. (2004) Beyond difference: from canonical geography to hybrid geographies,Annals of Association of American Geographers, 94: 756763.
Kyttä, M. (2003) Children in outdoor contexts. Affordances and independent mobility inthe assessment of environmental child friendliness, Yhdyskuntasuunnittelun tutkimus jakoulutuskeskuksen julkaisuja A 28. Otamedia, Espoo. Retrieved September 18, 2007, fromhttp://lib.tkk.fi/Diss/2003/isbn9512268736/isbn9512268736.pdf.
Kyttä, M., Kaaja, M. and Horelli, L. (2003) An internetbased design game as a mediator ofchildren’s environmental visions, Environment & Behavior, 1: 127151.
Kyttä, M. and Kahila, M. (2006) PehmoGIS – elinympäristön koetun laadun kartoittajana,Yhdyskuntasuunnittelun tutkimus ja koulutuskeskuksen julkaisuja B 90, Otamedia,Espoo. English summary: http://opus.tkk.fi/softgis/documents/IAPS%202006.pdf
Latour, B. (2002) Morality and technology. The end of the means, Theory, Culture &Society, 19(5/6): 247260.
Laurini, R. (2001) Information Systems for Urban Planning. A Hypermedia CooperativeApproach, Taylor & Francis, London and New York.

Manzo, C.L. (2003) Beyond house and haven: toward a revisioning of emotionalrelationships with places, Journal of Environmental Psychology, 23: 4761.
McCall, M.K. and Minang, P. (2005) Assessing participatory GIS for communitybasednatural resource management: claiming community forests in Cameroon, GeographicalJournal, 171: 340356.
NedovicBudic, Z. (2000) Geographic information science implications for urban andregional planning, URISA Journal, 12(2): 8193.
O’Sullivan, D. (2006) Geographical information science: critical GIS, Progress in HumanGeography, 30(6): 783791.
Pavlovskaya, M. (2005) Theorizing with GIS: a tool for critical geographies? Environmentand Planning A, 38(11): 20032020.
Puustinen, S. (2006) Suomalainen kaavoittajaprofessio ja suunnittelun kommunikatiivisenkäänteen haaste, Yhdyskuntasuunnittelun tutkimus ja koulutuskeskuksen julkaisuja A34, Frenckellin kirjapaino Oy, Espoo.
Rantanen, H. and Kahila, M. (2008) The SoftGIS approach to local knowledge, acceptedfor publication in Journal of Environmental Management, Special Issue onCollaborative GIS: Perspectives on decision support and visualization.
Rinner, C. (2001) Argumentation maps: GISbased discussion support for online planning,Environment and Planning B, 28(6): 847863.
Rittel, P., Lorig, K., Laurent, D. and Matthews, K. (2004) Internet versus mailedquestionnaires: a randomized comparison, Journal of Medical Internet Research, 6(3).Retrieved June 9, 2006, from http://www.jmir.org/2004/3/e29/.
Sieber, R.E. (2003) Public Participation geographic information systems across borders,The Canadian Geographer, 47: 5061.
Skjaeveland, O. and Gärling, T. (1997) Effects in interactional space on neighbouring,Journal of Environmental Psychology, 17: 181198.
Staffans, A. (2004) Vaikuttavat asukkaat, Yhdyskuntasuunnittelun tutkimus jakoulutuskeskuksen julkaisuja A 29, Yliopistopaino, Helsinki.

Talen, E. (2000) Bottomup GIS. A new tool for individual and group expression inparticipatory planning, Journal of the American Planning Association, 66: 279294.
Taylor, N. (1998) Urban Planning Theory Since 1945, Sage Publications Ltd, London.
Taylor, P.J. and Johnston, R.J. (1995) GIS and geography, in Pickles, J. (ed.) GroundTruth. The Social Implications of Geographic Information Systems, The Guilford Press,New York, pp. 5167.
Thrift, N. (1996) Spatial Formations, Sage Publications Ltd, London.
Thwaites, K. and Simkins, I. (2007) Experiential Landscape. An Approach to People,Place and Space, Routledge, UK.
Tulloch, D.L. (2007) Many, many maps: empowerment and online participatory mapping,First Monday, 12(2). Retrieved February 16, 2007, fromhttp://www.firstmonday.org/issues/issue12_2/tulloch/.
Van Herzele, A. (2004) Local knowledge in action. Valuing nonprofessional reasoning inthe planning process, Journal of Planning Education and Research, 24: 197212.
Waters, T. and Evans, A.J. (2003) Tools for webbased GIS mapping of a “fuzzy”vernacular geography. Retrieved September 10, 2007, fromhttp://www.geocomputation.org/2003/Papers/Waters_Paper.pdf.
Wood, D. (1992) The Power of Maps, Guilford Press, New York.
Yeh A. G. and Webster C. (2004) Planning, government, information, and the Internet,(editorial), Environment and Planning B, 31(2): 163165.