SOCIAL SURVEY METHODS AND THE DESIGN OF SURVEY INSTRUMENTS FOR SOCIAL AND ENVIRONMENTAL SCIENCES
26
SOCIAL SURVEY METHODS AND THE DESIGN OF SURVEY INSTRUMENTS FOR SOCIAL AND ENVIRONMENTAL SCIENCES By Owolabi, Babatunde Oluwaseyi Department of Urban and Regional Planning, University of Ibadan, Nigeria Email: [email protected] Telephone: +2348056362930 1.0 INTRODUCTION AND DEFINITION OF TERMS In order for us to get a clear understanding of the topic of this paper it is necessary to explain or define the key words therein; these are social, survey, methods, design and instrument. It is obvious however that the most important word in the topic is ‘survey’, and greater attention shall be focused on it. 1.1 SOCIAL The term "social" is used in many different senses. In one sense, it refers to attitudes, orientations or behaviours which take the interests, intentions or needs of other people into account. In another sense, it means the interactive systems in communities of animal or insect populations, or any living organisms. It also means membership of a group of people or inclusion or belonging to a community of people. Never the less, underlying the different senses of its use, is the fact that it refers to human society, its organisation and interactions. 1.2 METHOD Method refers to a means or manner of procedure, especially regular and systematic steps or way of accomplishing a task or attaining a goal. Method implies a detailed logically ordered plan for achieving a particular task. The methodical approach is applicable to and employed in all disciplines. Social science inquiry employs the scientific method. This refers to the body of
-
Upload
independent -
Category
Documents
-
view
3 -
download
0
Transcript of SOCIAL SURVEY METHODS AND THE DESIGN OF SURVEY INSTRUMENTS FOR SOCIAL AND ENVIRONMENTAL SCIENCES
SOCIAL SURVEY METHODS AND THE DESIGN OF SURVEYINSTRUMENTS FOR SOCIAL AND ENVIRONMENTAL SCIENCES
ByOwolabi, Babatunde Oluwaseyi
Department of Urban and Regional Planning,
University of Ibadan, NigeriaEmail: [email protected]: +2348056362930
1.0 INTRODUCTION AND DEFINITION OF TERMSIn order for us to get a clear understanding of the topic ofthis paper it is necessary to explain or define the keywords therein; these are social, survey, methods, design andinstrument. It is obvious however that the most importantword in the topic is ‘survey’, and greater attention shallbe focused on it.
1.1 SOCIAL The term "social" is used in many different senses. In
one sense, it refers to attitudes, orientations or behaviours which take the interests, intentions or needs of other people into account. In another sense, it means the interactive systems in communities of animal or insect populations, or any living organisms. It also means membership of a group of people or inclusion or belonging to a community of people. Never the less,underlying the different senses of its use, is the fact that it refers to human society, its organisation and interactions.
1.2 METHOD Method refers to a means or manner of procedure, especiallyregular and systematic steps or way of accomplishing a task orattaining a goal. Method implies a detailed logically orderedplan for achieving a particular task. The methodical approach isapplicable to and employed in all disciplines. Social scienceinquiry employs the scientific method. This refers to the body of
techniques for investigating phenomena, acquiring new knowledge,or correcting and integrating previous knowledge. It is based ongathering observable, empirical and measurable evidencesubject to specific principles of reasoning. A scientific methodconsists of the collection of data through observation andexperimentation, and the formulation and testing of hypotheses.
Although procedures for inquiry may vary from one field ofknowledge to another, however what distinguishes scientificinquiry from others is that scientific inquiry proposehypotheses to explain observed patterns or occurrences. Itgoes further to design experimental studies to test thesehypotheses. These steps must be repeatable in order topredict dependably any future results. The process must beobjective so as to reduce element of bias in theinterpretation of the results that are obtained. Scientificinquiry is also characterised by painstaking keeping ofrecords and making data and methodology of a particular testor experiment available to other researchers in order toallow verification and validity of the results earlierobtained and the inferences derived from them. Thisprocedure often leads to the formulation of new hypotheses.This practice which, Williams (1994) calls ‘fulldisclosure’, also allows statistical measures of thereliability of these data to be established.
A hypothesis is a statement which suggests an explanation ofan observed event. It is a reasoned proposal of a possiblecorrelation between or among a set of events. A hypothesistherefore is not a statement of fact since it has not beentested to determine its validity. A hypothesis is a fishingexpedition in the dark. It is thus not borne out ofempirical investigation.
Depending on the field of study or phenomenon ofinvestigation, a hypothesis can be formulated either as amathematical model or as an existential statement. Anexistential statement usually suggests that some particularinstance of the event being investigated has somepeculiarities and causal explanations, which can begeneralised or is applicable to the wider world.
2
The utility of a hypothesis lies essentially not only in itspotential to displace existing notions or ideas but also inits ability “to stimulate the research that will illuminate… bald suppositions and areas of vagueness”.
The cycle of statement of initial hypothesis, testing,obtaining result and deriving inferences, verification andformulation of new hypothesis will resemble the followingcycle described below,
i. Define the question unambiguouslyii. Formulate clear and testable hypothesisiii. Perform experiment and collect dataiv. Analyse the data and obtain resultv. Interpret result and draw conclusions (which may serve
as starting point for new hypothesis)vi. Document the procedure and publish the resultvii. Verify or retest the entire procedure (usually engaged
in by other researchers)
1.3 SURVEYThe word "survey" was derived from the Latin words surmeaning ‘over’ and videre meaning ‘to see’ or simply oversee.Survey involves the systematic collection of data aboutpopulations especially large or widely dispersed groups ofpeople. It could mean a close or systematic study,inspection or investigation or, a general or comprehensiveview or treatment of anything. It involves analysis,examination, inspection, investigation and, review.
Survey means different things to different disciplines andtherefore differs in terms of purpose, subject matter,coverage, and source of information. In the field ofepidemiology, surveys have been used to study among others,the history of the health of populations, diagnosis ofcommunity health, the working of health services, search forthe cause of health and disease. In the behavioural orsocial sciences, survey is used most commonly to gatherinformation about the beliefs, attitudes, and values ofindividuals. In land management survey
3
Survey can be classified broadly into descriptive survey andanalytical survey. In descriptive survey the objective is toobtain certain information about large groups. In analyticalsurvey, comparisons are made between different subgroups ofthe population in order to discover whether differencesexist among them that may enable researchers to form or testhypotheses about the forces at work in the population.
Survey may be general such as in census surveys or limitedsuch as in sample surveys. Surveys take many forms, butoften use questionnaires and interviews.
1.3.1. Census A census is the process of obtaining
information about every member of a population of interest(not necessarily a human population; e.g. housing censusesand traffic). However the term is mostly used in connectionwith the systematic and complete enumeration of all thepeople of a nation or a registration region, usually on aspecific date. It is a method used for accumulatingstatistical data, for research, business marketing and,planning purposes A census is an
1.3.2. SamplingSampling is the process whereby information is obtained fromthe analysis of selected but significant representativepercentage parts of an entity (population) chosen randomly,with the aim of making general statements that apply to theentity as a whole, or an identifiable part of it. This issometimes necessary since due to practical and logisticconsiderations it may be difficult or out rightly impossibleto, for instance interview every person in a State orcountry.
The sampling process consists of 7 simple stages;
Definition of population of concern Specification of a sampling frame, a set of items or
events that it is possible to measure Specification of sampling method for selecting items or
events from the frame Determination of the sample size
4

Implementation of the sampling plan Sampling and data collection Review of sampling process
Sampling has among several advantages considerable savingsin time and money. It also allows more resources to bedevoted to a much smaller population and thereby generateinformation that is often more accurate “as greater effortcan be expended on the training of interviewers, moresophisticated and expensive measurement devices can be used,repeated measurements can be taken, and more detailedquestions can be posed”.
The process of drawing conclusions about the larger entitybased on the information contained in a sample is known asstatistical inference.
In surveys, various terminologies are used to describe thecomponent parts of the survey process. These include "targetpopulation”, "sampling unit" and, "sampling frame".
1.3.2.1. Target population is commonly used to refer tothe group of people or entities (the "universe") to whichthe findings of the sample are to be generalised. More oftenthan not we are interested in understanding process orphenomenon with reference to a population and seek tointervene. However and as we had earlier observed, theimpracticability of studying the entire population makes itnecessary that we select representative samples of thepopulation. It goes without saying therefore that oursamples will be influenced to a very large extent by oursubject population. Sometimes also, we seek knowledge aboutthe cause system of which the population is an outcome; forexample, when a researcher performs an experiment on ratswith the intention of gaining insights into biochemistrythat can be applied for the benefit of humans. There is thusa need to carefully and precisely define the population ofinterest. Time spent in making the population of concernprecise is often well spent, because it raises many issues,ambiguities and questions that would otherwise have been
5

overlooked at this stage and which if not addressed willaffect the result and the inferences derived from the study.
1.3.2.2. Sampling Unit is the basic unit (e.g., person,household,) around which a sampling procedure is planned.
1.3.2.3. The Sampling Frame is any list of all thesampling units in the target population. Alphabeticallistings of residents in a community, telephone directory orvoters register are examples of sampling frames. Thesampling frame must be representative of the population andthis is a question outside the scope of statistical theorydemanding the judgment of experts in the particular subjectmatter being studied. All the above frames will definitelyomit some people who will vote at the next election andcontain some people who will not. People not in the framehave no prospect of being sampled. Statistical theory tellsus about the uncertainties in extrapolating from a sample tothe frame. In extrapolating from frame to population itsrole is motivational and suggestive. In defining the frame,practical, economic, ethical and technical issues need to beaddressed. The need to obtain timely results may preventextending the frame far into the future. The difficultiescan be extreme when the population and frame are disjoint.This is a particular problem in forecasting where inferencesabout the future are made from historical data.
There is however, a strong division of views about theacceptability of representative sampling across differentdomains of study. To the philosopher, representativesampling procedure has no justification whatsoever becauseit is not how truth is pursued in philosophy. 'To thescientist, however, representative sampling is the onlyjustified procedure for choosing individual objects for useas the basis of generalisation, and is therefore usually theonly acceptable basis for ascertaining truth' (Marino1994?).
6
1.3.2.4. The Sample size is the amount of sample largeenough to be representative of the target population. It isderived from the sampling frame. In other words, it istaking a sample group that matches the survey category andis easy to survey.
1.3.3. Sampling Methods In sample surveys, different methods of sampling
are employed to obtain the required information. These areprobability sampling methods and non-probability samplingmethod.
1.3.3.1 Probability Sampling Methods In probability sampling methods, each
method attempts to select samples such that each has adefinable probability of being chosen. This approachincludes, random sampling (simple, systematic and stratifiedrandom sampling) and, cluster sampling.
The procedures used to select a sample under thisprobability sampling methods, require that the sampler hassome prior knowledge of the target population. This assistsin the determination of the size of the sample needed toachieve a reasonable estimate (with accepted precision andaccuracy) of the characteristics of the population. Thegeneral goal of all sampling methods is to obtain a samplethat is representative of the target population. In otherwords, apart from random error, the information derived fromthe sample is expected to be the same had a complete censusof the target population been carried out.
A random sample is one where every person (or unit) in thepopulation from which the sample is taken has equal chanceof being included in it. Ideally, the selections that makeup the sample are made independently; that is, the choice toselect one unit will not affect the chance of another unitbeing selected.
1.3.3.1.1Simple Random Sampling This is the simplest way of selecting sampling units whereeach unit has an equal probability of being chosen.
7
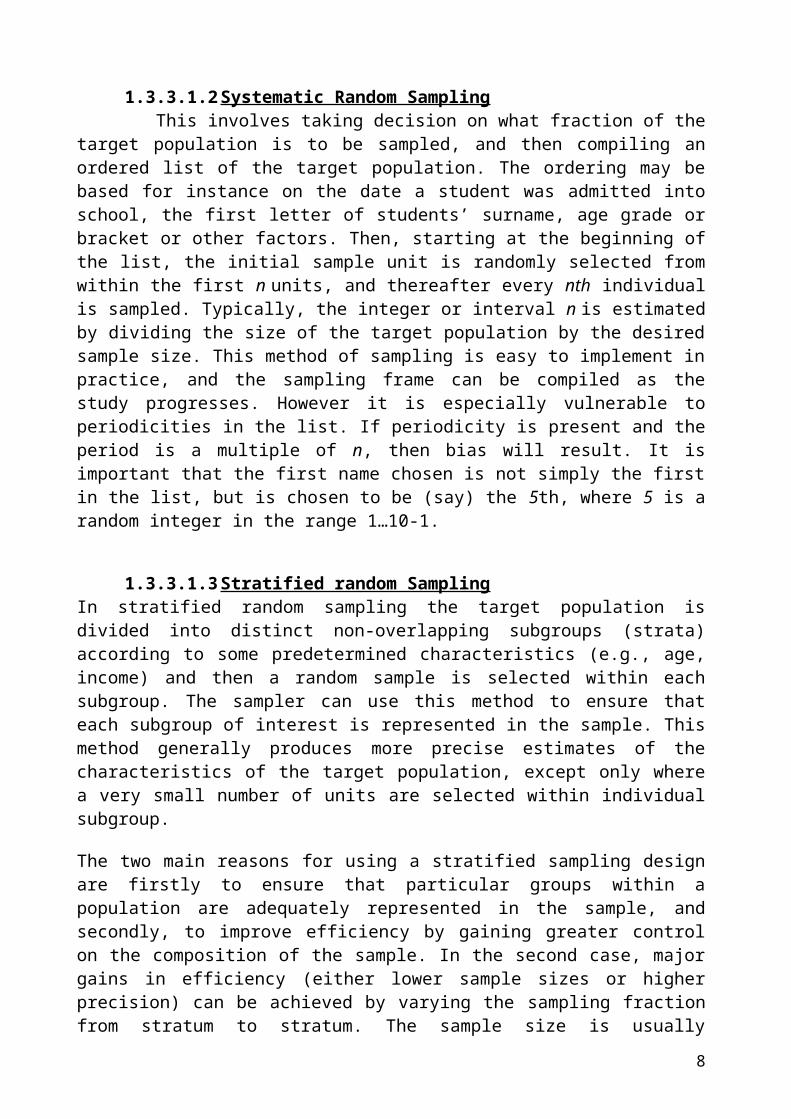
1.3.3.1.2Systematic Random Sampling This involves taking decision on what fraction of the
target population is to be sampled, and then compiling anordered list of the target population. The ordering may bebased for instance on the date a student was admitted intoschool, the first letter of students’ surname, age grade orbracket or other factors. Then, starting at the beginning ofthe list, the initial sample unit is randomly selected fromwithin the first n units, and thereafter every nth individualis sampled. Typically, the integer or interval n is estimatedby dividing the size of the target population by the desiredsample size. This method of sampling is easy to implement inpractice, and the sampling frame can be compiled as thestudy progresses. However it is especially vulnerable toperiodicities in the list. If periodicity is present and theperiod is a multiple of n, then bias will result. It isimportant that the first name chosen is not simply the firstin the list, but is chosen to be (say) the 5th, where 5 is arandom integer in the range 1…10-1.
1.3.3.1.3Stratified random SamplingIn stratified random sampling the target population isdivided into distinct non-overlapping subgroups (strata)according to some predetermined characteristics (e.g., age,income) and then a random sample is selected within eachsubgroup. The sampler can use this method to ensure thateach subgroup of interest is represented in the sample. Thismethod generally produces more precise estimates of thecharacteristics of the target population, except only wherea very small number of units are selected within individualsubgroup.
The two main reasons for using a stratified sampling designare firstly to ensure that particular groups within apopulation are adequately represented in the sample, andsecondly, to improve efficiency by gaining greater controlon the composition of the sample. In the second case, majorgains in efficiency (either lower sample sizes or higherprecision) can be achieved by varying the sampling fractionfrom stratum to stratum. The sample size is usually
8
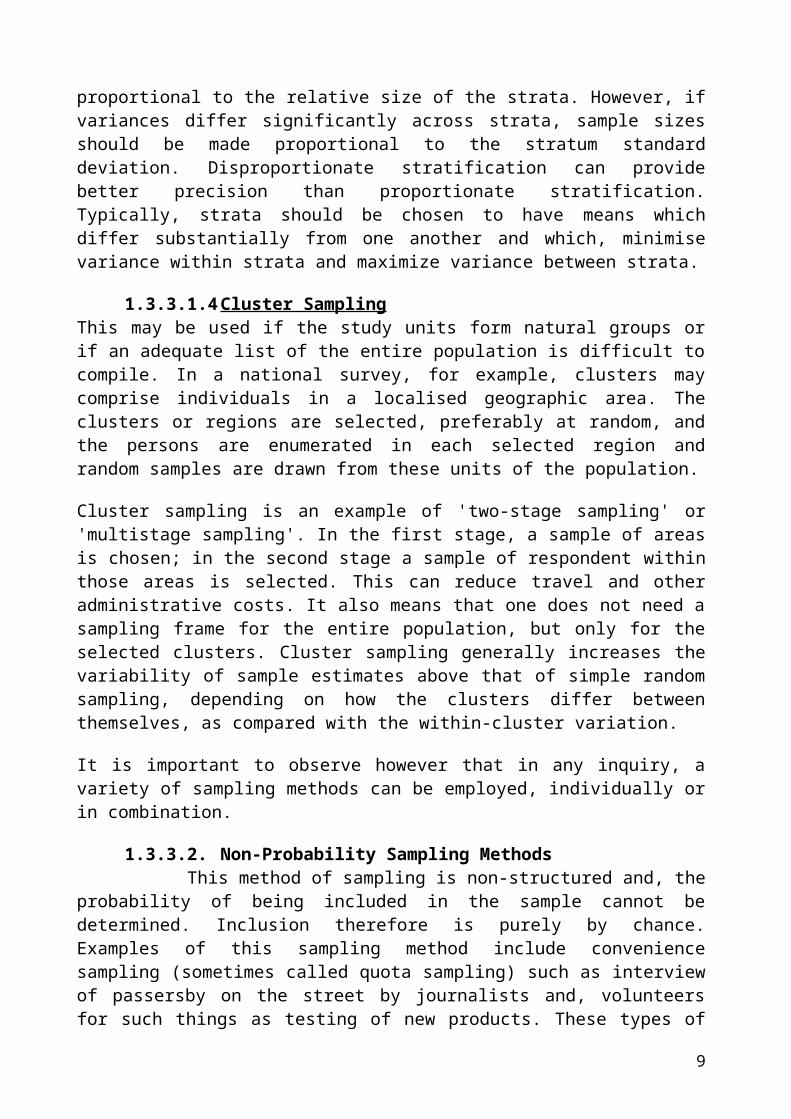
proportional to the relative size of the strata. However, ifvariances differ significantly across strata, sample sizesshould be made proportional to the stratum standarddeviation. Disproportionate stratification can providebetter precision than proportionate stratification.Typically, strata should be chosen to have means whichdiffer substantially from one another and which, minimisevariance within strata and maximize variance between strata.
1.3.3.1.4Cluster Sampling This may be used if the study units form natural groups orif an adequate list of the entire population is difficult tocompile. In a national survey, for example, clusters maycomprise individuals in a localised geographic area. Theclusters or regions are selected, preferably at random, andthe persons are enumerated in each selected region andrandom samples are drawn from these units of the population.
Cluster sampling is an example of 'two-stage sampling' or'multistage sampling'. In the first stage, a sample of areasis chosen; in the second stage a sample of respondent withinthose areas is selected. This can reduce travel and otheradministrative costs. It also means that one does not need asampling frame for the entire population, but only for theselected clusters. Cluster sampling generally increases thevariability of sample estimates above that of simple randomsampling, depending on how the clusters differ betweenthemselves, as compared with the within-cluster variation.
It is important to observe however that in any inquiry, avariety of sampling methods can be employed, individually orin combination.
1.3.3.2. Non-Probability Sampling Methods This method of sampling is non-structured and, the
probability of being included in the sample cannot bedetermined. Inclusion therefore is purely by chance.Examples of this sampling method include conveniencesampling (sometimes called quota sampling) such as interviewof passersby on the street by journalists and, volunteersfor such things as testing of new products. These types of
9
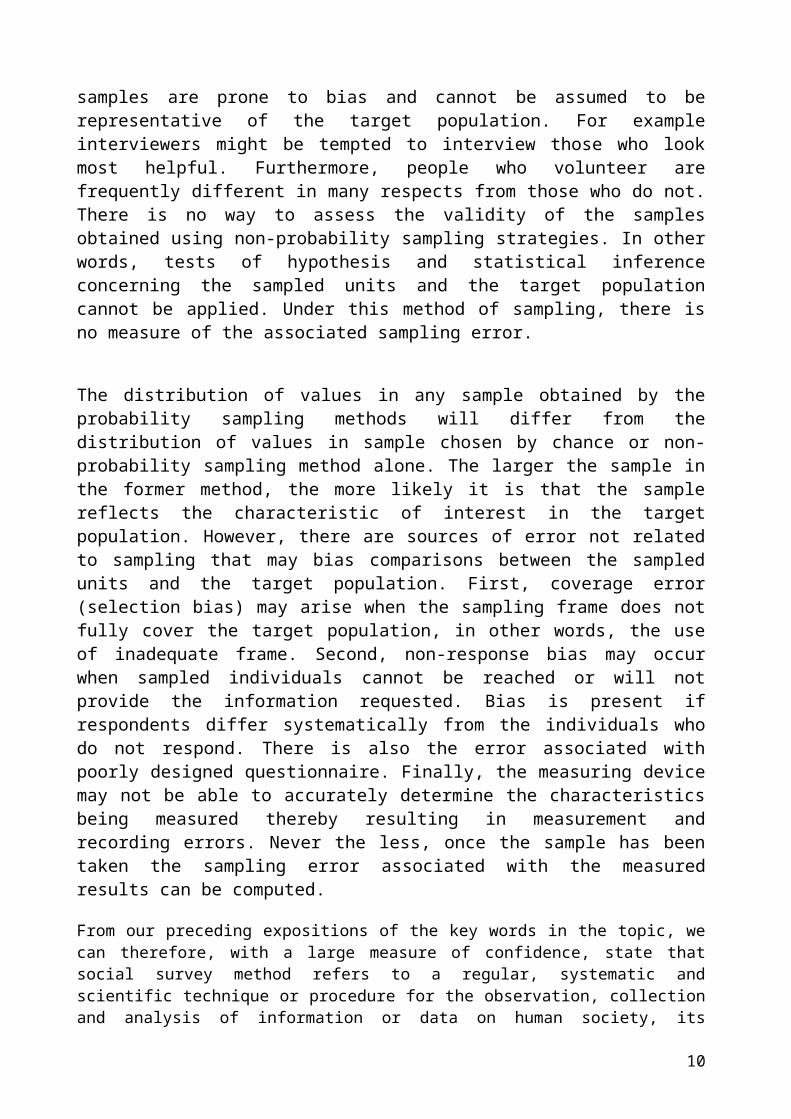
samples are prone to bias and cannot be assumed to berepresentative of the target population. For exampleinterviewers might be tempted to interview those who lookmost helpful. Furthermore, people who volunteer arefrequently different in many respects from those who do not.There is no way to assess the validity of the samplesobtained using non-probability sampling strategies. In otherwords, tests of hypothesis and statistical inferenceconcerning the sampled units and the target populationcannot be applied. Under this method of sampling, there isno measure of the associated sampling error.
The distribution of values in any sample obtained by theprobability sampling methods will differ from thedistribution of values in sample chosen by chance or non-probability sampling method alone. The larger the sample inthe former method, the more likely it is that the samplereflects the characteristic of interest in the targetpopulation. However, there are sources of error not relatedto sampling that may bias comparisons between the sampledunits and the target population. First, coverage error(selection bias) may arise when the sampling frame does notfully cover the target population, in other words, the useof inadequate frame. Second, non-response bias may occurwhen sampled individuals cannot be reached or will notprovide the information requested. Bias is present ifrespondents differ systematically from the individuals whodo not respond. There is also the error associated withpoorly designed questionnaire. Finally, the measuring devicemay not be able to accurately determine the characteristicsbeing measured thereby resulting in measurement andrecording errors. Never the less, once the sample has beentaken the sampling error associated with the measuredresults can be computed.
From our preceding expositions of the key words in the topic, wecan therefore, with a large measure of confidence, state thatsocial survey method refers to a regular, systematic andscientific technique or procedure for the observation, collectionand analysis of information or data on human society, its
10
organisation and interaction for the purpose of understandingphenomena, predicting occurrences and intervening to promote orarrest the further happenings of the phenomenon.
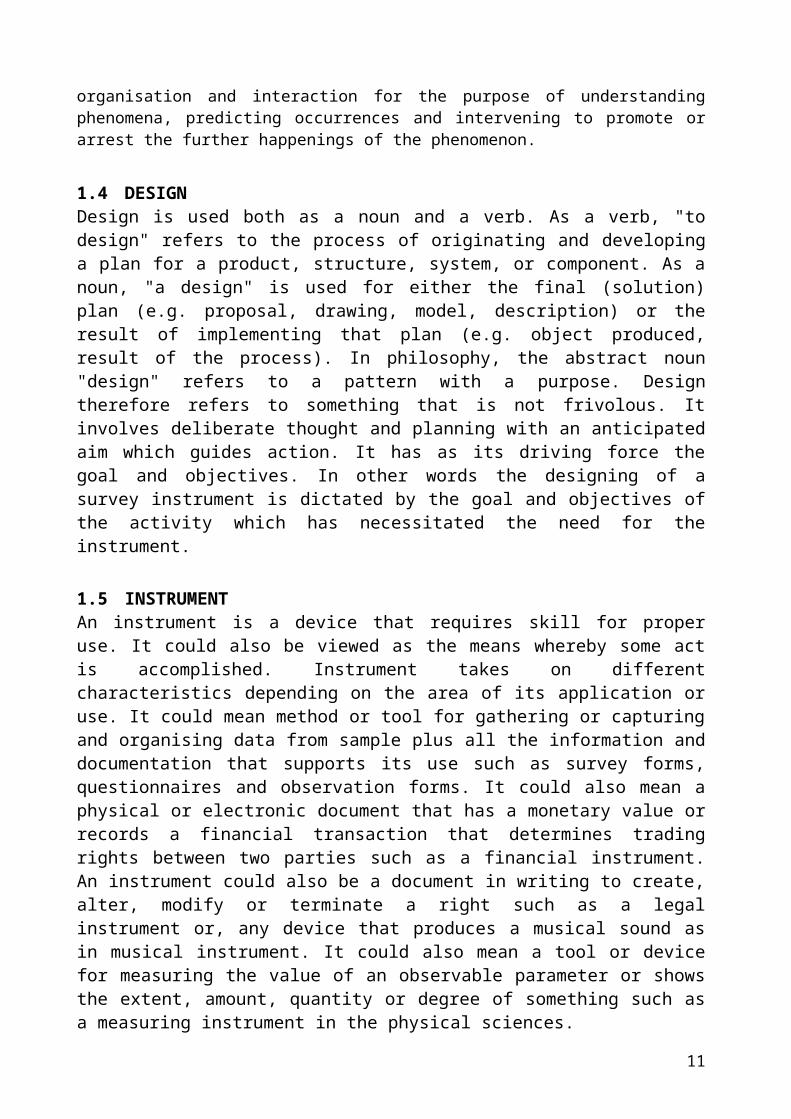
1.4 DESIGN Design is used both as a noun and a verb. As a verb, "todesign" refers to the process of originating and developinga plan for a product, structure, system, or component. As anoun, "a design" is used for either the final (solution)plan (e.g. proposal, drawing, model, description) or theresult of implementing that plan (e.g. object produced,result of the process). In philosophy, the abstract noun"design" refers to a pattern with a purpose. Designtherefore refers to something that is not frivolous. Itinvolves deliberate thought and planning with an anticipatedaim which guides action. It has as its driving force thegoal and objectives. In other words the designing of asurvey instrument is dictated by the goal and objectives ofthe activity which has necessitated the need for theinstrument.
1.5 INSTRUMENTAn instrument is a device that requires skill for properuse. It could also be viewed as the means whereby some actis accomplished. Instrument takes on differentcharacteristics depending on the area of its application oruse. It could mean method or tool for gathering or capturingand organising data from sample plus all the information anddocumentation that supports its use such as survey forms,questionnaires and observation forms. It could also mean aphysical or electronic document that has a monetary value orrecords a financial transaction that determines tradingrights between two parties such as a financial instrument.An instrument could also be a document in writing to create,alter, modify or terminate a right such as a legalinstrument or, any device that produces a musical sound asin musical instrument. It could also mean a tool or devicefor measuring the value of an observable parameter or showsthe extent, amount, quantity or degree of something such asa measuring instrument in the physical sciences.
11

12
2.0 DESIGN OF SURVEY INSTRUMENT
Generally in research, four types of research designs areemployed. These are Experimental Research Design, Quasi-Experimental Research Design, Survey Research Design and,Case Study Research Design.
In experimental research design, two groups are used. Theseare the Experimental or Target Group and the Control orCheck Group. For example if a particular text book is themajor reference for a particular subject, a researcher maybe interested in investigating the influence of the use ofthe book on students’ performance level in that subject. Inorder to do this, the researcher uses the book to teach theexperimental group, while the control group is taught withevery other book but the reference text book. Before thecommencement of the experiment, a pretest in the subject isconducted on the two groups. The two groups are then keptvery far apart from each other, say, in different towns toprevent contact. Again after the experiment a post test isconducted on the two groups. If the experimental groupperforms better in the post test, then it is a proof thatthe reference book has an impact on performance in thesubject. However if there is no difference in theperformance of the groups when post tested, then we canconclude that the book does not really influenceperformance. This is called Significance.
Quasi-experimental research design is similar to theexperimental but here, the barrier between the two groups isrelaxed, that is, they are not as kept far apart. Surveyresearch design has been dealt with in-depth elsewhere inthis paper and, there is no need for a repetition. Sufficeto add however, that surveys may be cross sectional wherethe respondent is interviewed only once and, longitudinalwhere the respondent is interviewed more than once. Casestudy research design is similar to survey and, is used forin-depth research study where results can be generalised.
13
As earlier observed, surveys take many forms, but often usequestionnaires and interviews. Our focus in this sectiontherefore is on the design of the various forms of socialsurvey instruments including questionnaires, checklist and,interviews but more on questionnaires. The various forms ofinstruments are for purposes of generating data from anentity of interest. It is therefore necessary to considerthe types of data that can be generated in a researchenterprise.
2.1 Types of dataThere are two types of data or random variables; categoricaland numerical. Categorical random variables yield specificresponses such as 'yes' or 'no'. However it is possible forcategorical variables to yield more than two possibleresponses. For example in response to the question, 'Onwhich day of the week are you most likely to wash clothes?'a respondent may mention more than one day in the week.Compared to the question, ‘do you wash clothes on Sunday?’which will yield a categorical ‘yes’ or ‘no’ answer.
Numerical random variables yield numerical responses, suchas the question, ‘what is your height in centimeters?’Numerical variables are of two types – discrete andcontinuous. Discrete numerical random variables producenumerical responses from a counting process such as in thequestion 'how many times do you visit dentist in a typicalmonth?' Continuous numerical random variables produceresponses from a measuring process. Height is an example ofa continuous numerical random variable because the responsetakes on a value from an interval.
2.2 Sampling and Data Collection Good data collection involves,
Following the defined sampling process Keeping the data in time order Noting comments and other contextual events Recording non-responses
14
2.3 Review of Sampling ProcessAfter sampling, it is advisable that a review of the exactprocess followed in the sampling, rather than that intendedis held, in order to study any effects that any divergencesmight have on subsequent analysis. A particular problem isthat of non-responses. Non response in survey sampling refersto a situation in which many of the individuals earlieridentified as part of the sampling frame might have changedtheir minds from participating or may have indeed relocatedfrom the target population. This leads to selection bias inconclusions.
The problem of non-participation is solved by follow-upattempt to contact the unresponsive and to characterisetheir similarities and differences with the rest of theframe. However for the samples that have relocated, thisposes some problems which, may be surmounted by substitutingthe quantum of non-responses in the sampling frame with newsamples selected through the same sampling method.
2.4 Design of Surveys Instruments and Survey ManagementIn social surveys generally, where the sampling units areusually human beings, the main methods of collectinginformation (survey instrument) are,
Face-to-face interviewing Postal surveys Telephone surveys Direct observation The Internet
To these may be added ‘enumeration’ since social surveys mayalso involve the counting of objects such as vehicles androads or the numbering of social and economic facilitiessuch as houses, hospitals, markets, schools and the like.
Face-to-face Interview – This is a method of survey in whichthe interviewer is in direct physical contact with therespondent. Here the administrator holds a questionnairefrom where questions are fielded to the respondent and theadministrator gets his answers on the spot. This method of
15
interview has the advantage of allowing the interviewee anopportunity to observe the respondent’s demeanour orreaction to questions asked. It also provides opportunityfor clarification of questions and answers. Answers obtainedfrom this method have a high level of accuracy and non-response is virtually eliminated. However it has thedisadvantage of either the respondent playing to the galleryin the answers or the interviewer influencing the responsetowards a desired direction. It is therefore easy tointroduce bias into the whole process which will bringerrors and affect the result.
Postal Surveys – This involves mailing of questionnaires torespondents who are then required to mail back theirresponses. This method has the advantage of a wider reach asthe sample population can be covered quickly. It however hasthe disadvantage of very large non-response. A way out ofthis is for the interviewer to prepay the return mail andfollow up with telephone contact. This makes the this methodmore expensive than the other methods
Telephone Surveys – This is similar to face-to-faceinterviewing except that the both interviewer and respondentare not in direct physical contact. The questions-and-answers session is conducted over the telephone. This methodhas advantages similar to that in face-to-face interviewing.It also has the added advantage that the respondent will bemore relaxed and less inhibited to answer questions. Themethod also has disadvantages similar to those in face-to-face interviewing. It however has the added disadvantage ofthe respondent being distracted by other things which theinterviewer cannot see, breaking off the interviewmidstream, high cost of long telephone conversation or thetelephone itself losing clarity thereby distorting thequestions and answers with the inevitable undesired result.
Direct Observation – This is usually the method of surveyemployed in the physical sciences and medicine. It involvesthe physical observation of the subject and the taking ofreadings or measurements which are sometimes compared withsome set parameters and from which results are extrapolated.
16

However this method is also employed in the social sciencessuch as in the measurement of weather and climaticparameters, in sociology and social psychology.
Internet – This is the latest in methods of survey. Theinternet is the technological super highway which provides atreasure trove of information on virtually all subjectsunder the sun.
Enumeration – This is a survey method in which simplearithmetical counting and tallying of results are used togenerate information which are then analysed, resultobtained and inferences deduced. This method is usuallyemployed in the survey of objects and when properly planned,errors are reduced to the barest minimum as they are leastinfluenced by the vagaries of the human emotions.
Before choosing and embarking on the design of a surveyinstrument, it is important for the researcher to askhimself or herself the following main questions,
What is the purpose of the survey? What kinds of questions would the survey be developed to
answer? What does the researcher intend to do with the results
obtained from the analysis of the data generated by thesurvey?
Whatever the method of survey chosen, a clear resolution ofeach of these questions will enable the researcher todetermine what method of survey to use and this will in turninform the structure or design of the survey instrument. Awrong or inadequate diagnosis of the purpose of the surveywill obviously lead to the framing of inappropriatequestions and, the receipt of faulty answers. This will inturn affect the result obtained from the analysis of theanswers and, thus the deductions from such results. Whilethis may not lead to serious negative consequences in socialscience enquiries, the result may be catastrophic in the
17
area of epidemiology and medicine in which human lives areinvolved.
For the purpose of our topic, we have chosen to undertake anin-depth discussion of the questionnaire survey instrument.The choice is deliberate because experience has shown thatthis is the most commonly employed method of generatinginformation in sample surveys in social research.Questionnaires are a series of structured questions designedto elicit the desired response from the respondents or thesurveyed.
In designing the questionnaire, it is desirable andadvisable to observe the following steps,
Step 1: Planning Questionnaire Research Consider the advantages and disadvantages of using
questionnaires. Prepare written objectives for the research. Have your objectives reviewed by others. Review the literature related to the objectives. Determine the feasibility of administering your
questionnaire to the population of interest. Prepare a time-line.
Step 2: Conducting Item Try-Outs and an Item Analysis Have your items reviewed by others. Conduct "think-aloud" with several people. Carefully select individuals for think-aloud. Consider asking about ten individuals to write detailed
responses on a draft of your questionnaire. Ask some respondents to respond to the questionnaire for
an item analysis. In the first stage of an itemanalysis, tally the number of respondents who selectedeach choice. In the second stage, compare the responsesof high and low groups on individual items.
Step 3: Preparing a Questionnaire for Administration Write a descriptive title for the questionnaire. Write an introduction to the questionnaire.
18
Group the items by content, and provide a subtitle foreach group. Within each group of items, place items with the sameformat together.
At the end of the questionnaire, indicate whatrespondents should do next.
Prepare an informed consent form, if needed. If the questionnaire will be mailed to respondents,
Avoid having your correspondence look like junk mail. Consider including a token reward. Write a follow-up letter.
If the questionnaire will be administered in person,consider preparing written instructions for theadministrators.
Step 4: Selecting a Sample of Respondents Identify the accessible population. Avoid using samples of convenience.
Simple random sampling is a desirable method ofsampling.
Systematic sampling is an acceptable method ofsampling.
Stratification may reduce sampling errors. Consider using random cluster sampling when every
member of a population belongs to a group. Consider using multistage sampling to select
respondents from large populations. Consider the importance of getting precise results when
determining sample size. Remember that using a large sample does not compensate
for a bias in sampling. Consider follow up sampling of non respondents to get
information on the nature of a bias. Remember that using a large sample does not compensate
for a bias in sampling. Consider sampling non-respondents to get information on
the nature of a bias. The bias in the mean is thedifference of the population means for respondents and
19
non respondents multiplied by the population non-response rate.
Step 5: Preparing Statistical Tables and Figures Prepare a table of frequencies. Consider calculating percentages and arranging them in a
table with the frequencies. For nominal data, consider constructing a bar graph. Consider preparing a histogram to display a distribution
of scores. Consider preparing polygons if distributions of scores
are to be compared.
Step 6: Describing Averages and Variability Use the median as the average for ordinal data. Consider using the mean as the average for equal
interval data. Use the median as the average for highly skewed, equal
interval data. Use the range very sparingly as the measure of
variability. If the median has been selected as the average, use the
inter-quartile range as the measure of variability. If the mean has been selected as the average, use the
standard deviation as the measure of variability. Keep in mind that the standard deviation has a special
relationship to the normal curve that helps in itsinterpretation.
For moderately asymmetrical distributions the mode,median and mean satisfy the formula: mode=3*median-2*mean.
Step 7: Describing Relationships For the relationship between two nominal variables,
prepare a contingency table. When groups have unequal numbers of respondents, include
percentages in contingency tables. For the relationship between two equal interval
variables, compute a correlation coefficient.
20

Interpret a Pearson r using the coefficient ofdetermination.
For the relationship between a nominal variable and anequal interval variable, examine differences amongaverages.
Step 8: Estimating Margins of ErrorIt is extremely difficult, and often impossible, to evaluatethe effects of a bias in sampling. However the followingshould be noted;
When evaluating a percentage, consider the standarderror of a percentage.
When evaluating a mean, consider the standard error ofthe mean.
When evaluating a median, consider the standard error ofthe median.
Consider building confidence intervals, especially whencomparing two or more groups
Step 9: Writing Reports of Questionnaire Research Use the median as the average for ordinal data. Consider using the mean as the average for equal
interval data. Use the median as the average for highly skewed, equal
interval data. Use the range very sparingly as the measure of
variability. If the median has been selected as the average, use the
inter-quartile range as the measure of variability. If the mean has been selected as the average, use the
standard deviation as the measure of variability. Keep in mind that the standard deviation has a special
relationship to the normal curve that helps in itsinterpretation.
For moderately asymmetrical distributions the mode,median and mean satisfy the formula: mode=3*median-2*mean.
2.5 Questionnaires Administration
21
When using the questionnaire whether in the face-to-faceinterview or mailed (postal) method, it is important to makethe respondent feel at home when answering the questions ifthe right answers are to be obtained. In designing thequestionnaire therefore the following tips come in handy,
As much as possible, assure people that the surveys areanonymous
Explain to the respondent the reasons for asking thequestions,
Make response categories as broad as possible. Word the question in a non-judgmental style that avoids
the appearance of censure, or, if possible, make thebehavior in question appear to be socially acceptable.
Present the request as factual matter as possible. Guarantee confidentiality or anonymity Make sure the respondent knows the information will not
be used in any threatening way. Explain how the information will be handled Avoid cross classification that will allow for
pinpointing responses.
3.0 STATISTICAL METHODS The following are some of the statistical methods employedin the analysis of data obtained from surveys;
1. The mode is the most frequently occurring score in adata set. Example: In the following data set 3, 12, 14,16, 17, 18, 19, 22, 22, 22, 22, the mode is 22.
2. The median is the score that divides a data set in two(the score in the middle). Half the scores are higherthan the median, and half are lower than the median.Example: In the data set, 3, 12, 14, 16, 17, 18, 19, 22,22, 22, 22, the median is18. When there is an evennumber of scores in a data set, the median is halfwaybetween the two middle numbers.
22
3. The mean is the arithmetic average obtained by addingthe numerical values of all the scores in a data set anddividing that sum by the number of scores in the dataset. Example: In the data set, 3, 12, 14, 16, 17, 18,19, 22, 22, 22, 22, the mean is equal to (3 + 12 + 14 +16 + 17 + 18 + 19 + 22 + 22 +22 + 22)/11 = 187/11 =17.It therefore means that an extreme score can change themean radically, possibly making it less representativeof the data.
4. The range is a measure of variability computed bysubtracting the lowest score from the highest score in adata set. The range is affected by extreme scores.Example: In the data set 2, 3, 4, 5, 5, 5, 6, 7, 8, 100,the range is 100 - 2 = 98. If the extreme score (100) isdropped, the range is 8 - 2 = 6. Extreme scores cantherefore radically affect the range of a data set.
5. The standard deviation is also a measure of variability.It reflects the average distance between each score andthe mean of a data set. The standard deviation shows howdifferent the scores in a data set are from the mean.Example: Following are two data sets; 1st Set: 1, 2, 3,4, 5, 6, 7, 8, 9and, the 2nd Set: 4, 4, 4, 4, 5, 6, 6,6, 6. the mean of both data sets is 5. However, thescores in the 1st set are a greater distance from themean. In other words, they are more different from themean than the scores in the 2nd set. Therefore, thestandard deviation (SD) in the 1st set is larger thanthe SD for the 2nd set.
6. A correlation is an indication of the relationshipbetween two variables (x and y). As x decreases orincreases so does y correspondingly decreases orincreases. In other words x could negatively orpositively correlate with y. However correlations do notindicate causation.
23
7. The correlation coefficient (r), a number between -1.00and +1.00, is a mathematical representation of thestrength and direction of a correlation. The higher theabsolute value of r is, the stronger the relationshipis. A perfect correlation, whether positive or negative(where r equals + or -1.00), describes a perfectrelationship; knowing the value of x allows the certainprediction of y. A positive correlation (where r variesfrom 0 to +1.00) describes two variables that change inthe same direction: as x increases, so does y (and viceversa). A negative correlation (where r varies from -1.00 to 0) describes an inverse relationship: as xincreases, y decreases (and vice versa).
8. Inferential statistics are used to judge the meaning ofdata. Inferential statistics assess how likely it isthat group differences or correlations would exist inthe population rather than occurring only due tovariables associated with the chosen sample.
9. Statistically significant, refers to a situation instatistics which indicates that the group differences orcorrelation is larger than would occur by chance.Example: If the difference between the means of twogroups of data is statistically significant, aresearcher would conclude that the difference mostlikely exists in the population of interest. If thedifference is not statistically significant, aresearcher would conclude that the difference occurredby chance, possibly because of an unrepresentativesample or the presence of confounding variables.
24
REFERENCES
Bartlett J.E., Kotrlik J.W. and Higgins C. (2001),Organisational Research: Determining Appropriate Sample Sizein Survey Research. Journal of Information Technology,Learning, and Performance, 19(1) 43-50
Bradburn, N. M., and Sudman, S. (1988). Polls and Surveys:Understanding What They Tell Us. San Francisco: Jossey-BassPublishers.
Brown, K.W., Cozby, P.C., Kee, D.W., & Worden, P.E. (1999).Research Methods in Human Development, 2d ed. Mountain View,California : Mayfield. ISBN 1-55934-875-5
Crawford S, Stucki L (1990), "Peer Review and the ChangingResearch Record", "Journal of American Social InformationScience", vol. 41, pp 223-228
Encyclopedia of Public Health, The Gale Group, Inc.
Festinger, L., and Katz, D., (eds). (1966). Research Methodsin the Behavioral Sciences. New York: Holt, Rinehart andWinston.
Glen,William (ed.), The Mass-Extinction Debates: How ScienceWorks in a Crisis, Stanford University Press, Stanford, CA,1994
Kelsey, J. L.; Thompson, W. D.; and Evans, A. S. (1986).Methods in Observational Epidemiology. New York: OxfordUniversity Press.
25
Morris, J. N. (1975). Uses of Epidemiology, 3rd edition.London: Churchill Livingston.
Moser, C. A., and Kalton, G. (1989). Survey Methods inSocial Investigation, 2nd edition. Aldershot, UK: GowerPublishing Company.
Pagano, M., and Gauvreau, K. (2000). Principles ofBiostatistics, 2nd edition. Pacific Grove, CA: Duxbury.
The American Heritage Dictionary of the English Language,Fourth Edition 2007, 2000, Houghton Mifflin Company.
The Concise Oxford Dictionary of Archaeology. 2002, 2003Oxford University Press.
The Veterinary Dictionary, 2007, Elsevier Publishers.
US General Accounting Office book, "Developing and UsingQuestionnaires" (Oct 1983) chapter 9,
26