Social Networks of Researchers in Business To Business Marketing: A Case Study of the IMP Group...
41
Paper No. 116 Social Networks of Researchers in Business To Business Marketing: A Case Study of the IMP Group 1984-1999 Piera Morlacchi*, Ian F. Wilkinson** and Louise Young*** (*SPRU, **University of New South Wales, ***University of Technology Sydney) May 2004 The Freeman Centre, University of Sussex, Falmer, Brighton BN1 9QE, UK Tel: +44 (0) 1273 877974 E-mail: [email protected] http://www.sussex.ac.uk/spru/ SPRU Electronic Working Paper Series
Transcript of Social Networks of Researchers in Business To Business Marketing: A Case Study of the IMP Group...

SPRU Electronic Working Paper Series
Paper No. 116
Social Networks of Researchers in Business ToBusiness Marketing:
A Case Study of the IMP Group 1984-1999
Piera Morlacchi*, Ian F. Wilkinson** and Louise Young***(*SPRU, **University of New South Wales, ***University of Technology Sydney)
May 2004
The Freeman Centre, University of Sussex,Falmer, Brighton BN1 9QE, UK
Tel: +44 (0) 1273 877974E-mail: [email protected]
http://www.sussex.ac.uk/spru/

1
Social Networks of Researchers in Business To Business Marketing:
A Case Study of the IMP Group 1984-1999
Piera Morlacchi*
SPRU - Science and Technology Policy Research, University of [email protected]
Ian F. Wilkinson
School of Marketing, University of New South [email protected]
Louise Young
School of Marketing, University of Technology [email protected]
(Revised for SEWPS March 2003)
Forthcoming in the Journal of Business-to-Business Marketing
Acknowledgements
We would like to thank Hans Georg Gemunden and his collaborators for supplying theoriginal database on conference attendance from 1984 to 1996 that we updated; ananonymous reviewer for helpful comments; and Cynthia Webster for advice on aspects ofnetwork analysis. The paper is in part based on a paper presented at the IMP Conference in2000.
Special thanks to Ed Steinmueller, who provided comments on the revision of the paper forthe SEWPS website.
*Corresponding author

2
Social Networks of Researchers in Business To Business Marketing:
A Case Study of the IMP Group 1984-1999
Abstract
Science is a social process that functions through social networks of researchers that form
invisible colleges. Analysis of these social networks provides a means for examining the
structure of relations among researchers. The Industrial Marketing and Purchasing (IMP)
group, “an informal international group of scholars concerned with developing concepts and
knowledge in the field of business-to-business marketing and purchasing,” is used as a case
study of a network of researchers because it has been responsible for considerable research
over the last decades in the area of business-to-business marketing, yet its structure remains
hidden because of its informal network characteristics. The results of a social network
analysis of the IMP group is described based on the pattern of co-authorship at annual IMP
conferences. The results reveal a power law distribution of paper co-authorship and a small
world network that conforms to the results of studies of other types of social networks. A
core network of 57 researchers is identified and its network properties are described,
including how it has evolved over time. The study provides the basis for further studies of
the social networks of marketing and business researchers.
Introduction
Science emerged as a better way of advancing knowledge through the development of the
scientific method (Chalmers, 1999). But science is also a social process involving interaction
and collaboration among people as the research of Latour (1987) and Galison (1997) has
shown. The social institutions of science include both formally-constituted organisations,
3
such as the various academies of science, and specialist organisations, such as the American
Marketing Association, European Marketing Academy or Australia-New Zealand Marketing
Academy. In addition, there are more informal networks within which researchers
communicate, compete and collaborate with each other.
The objective of this paper is to use Social Network Analysis to analyse research
collaboration within a specific academic group over time. In particular, we seek to describe
the network of relations among members of the Industrial Marketing and Purchasing (IMP)
group, which has been responsible for a considerable amount of research in the area of
business to business marketing over the last 30 years or so. In this way our research may be
seen as a contribution to the sociology of knowledge, concerning the social structure of the
scientific process, as it manifests itself in a particular context i.e. the study of business
markets. It is thus in the tradition of prior research by Latour (1987) and Galison (1997) who
studied the social processes of science in other scientific contexts and more recent studies of
social networks of other scientists (Barabási et al., forthcoming; Newman, 2001). It also
contributes to a growing literature in areas of science that examines the nature and
characteristics of complex adaptive systems in which network structures play a fundamental
role (Barabási, 2002; Easton et al., 1997). Lastly, it provides the basis for further studies of
networks of researchers in marketing and business areas.
The IMP Group has made a sustained and significant contribution to the development of
theory and practice in the areas of business marketing. Their work extends from the original
research study (IMP1) of international and domestic supplier-customer relations in Europe, to
the later (IMP2) study of connected business relations and networks as well as to a multitude
of other research projects on various aspects of business marketing (Wilkinson, 2001). The
results of their research have been published in the leading journals in the field (e.g.

4
Anderson et al 1994; Blankenburg-Holm et al., 1996; Hallen et al., 1991). Many books and
articles have been published detailing their work, including the development of their
interaction approach and network models of industrial markets (Axelsson and Easton, 1992;
Ford, 1990, 1997; Ford et al., 1998; Ford et al., 2002; Hakansson, 1982, 1987, 1989;
Hakansson and Snehota, 1995; Turnbull and Valla, 1986). The development of the IMP
research group and its philosophy has also been described in various recent papers (e.g.
Hakansson and Snehota, 2000; McLoughlin and Horan, 2002; Turnbull et al., 1996;
Wilkinson, 2001, Young, 2002).
From the foregoing we may conclude that the IMP Group is a major intellectual force in the
study of business markets and has shaped the way many of us view, research and teach
business marketing. Therefore it is a worthwhile case study to examine. But the structure
and operation of the IMP Group is somewhat of an enigma. The IMP Group describes itself
as an informal international group of scholars concerned with developing concepts and
knowledge in the field of business-to-business marketing and purchasing. It has no journal,
no university home base, until 2002 no website (which is now to be found at
www.impgroup.org ), and no clear membership criteria. What it does have is a philosophy
and an annual conference, held in September, which has been taking place since 1984 and is
now arguably the largest international conference in the world focusing on business-to-
business marketing. It has also spawned a number of associated conferences, workshops,
doctoral consortia and seminars that have been held in various parts of the world and is linked
in various ways to other groups of researchers focusing on relationships and networks in
marketing and business.
In this paper we analyse the nature and structure of the IMP Group using social network
analysis. We adopt this methodology because the IMP Group is itself a network of

5
interrelated scholars, linked in terms of their ideas, as well as in terms of various types of
professional and social relationships and patterns of interaction, including joint research,
teaching and publication activities, inter-university visits, IMP and other related conference
attendance, as well as various forms of social interaction.
The contributions of the IMP Group have arisen through research collaboration, in just the
same way as any intellectual innovation, as a result of research collaboration undertaken by a
community of practice (Leonard-Barton, 1995; Turati et al., 1998; Wenger, 1998). The
production of knowledge is, as we have already noted, a social process involving interactions
among people and organisations with different backgrounds, resources, predispositions and
insights. The members of such a community interact and develop and exchange new
knowledge and through these processes shape their community over time (Nonaka, 1994;
Tushman and Rosenkopf, 1992). This applies to the process of science as much as it does to
the development of knowledge in business and elsewhere, as has been noted by many
scholars (e.g. Brown and Duguid, 2000; Galison and Stump, 1996; Latour, 1987; Nonaka and
Takeuchi, 1995; Wilkinson and Young, 2002). Indeed, one of the contributions of IMP
researchers has been to emphasise the role and importance of interactions, relationships and
networks in the production and diffusion of knowledge and technology (Hakansson, 1989;
Hakansson and Snehota, 1995; Lundgren, 1995).
We view the IMP group as a form of invisible college (Crane, 1972) and our focus is on the
communication flows of the community, which comprise a mix of formal and informal
mechanisms that enable both face to face and mediated communication, including visiting
researchers (exchange of people); interpersonal communication patterns (e-mail and other
forms of exchange of papers and methodologies); and collaboration on research and writing

6
(co-authorship). This invisible college gives momentum to the network, allowing intellectual
innovation and refinement of the technology.
Invisible Colleges are usually investigated through ‘co-citation analysis’, in which the links
are established through the way authors refer to each others’ research and publications (e.g.
Cote and Leong, 1991; Culnan, 1987; Goldman, 1979; Lin, 1995; Robinson and Adier,
1981). Here we adopt a different approach based on Social Network methods. We focus on
the people relationships inside the IMP group as expressed through their co-authorship of
articles, rather than the development and diffusion of ideas per se. Our conjecture is that this
more directly reflects the nature and structure of research communities stemming from
various types of links among researchers such as professor-student, common institution,
propinquity, research interests and methods used. An account of the development of IMP
thinking is contained in the accounts of its development cited already and in an analysis of
topics covered in IMP annual conferences (Gemunden, 1997).
Co-authorship (i.e. collaboration in writing an article) is used as the means for defining
researcher relationships. Our unit of analysis is therefore the ‘article’ and the assumption is
that each article is a contribution to knowledge and is a part of the process of technology
development within the community. More specifically, we define relationships based on co-
authorships reported in the proceedings of the annual IMP Conferences. There have been
few studies to date that have examined patterns of co-authorship (Barabási et al.,
forthcoming; Lotka, 1926; Newman, 2001) and these were unknown to us when we began
our research. These other studies serve to reinforce our contention that this is a valuable way
to investigate the structure and evolution of social networks and also provide some points of
comparison for our own results. A further point is that co-authorship links overcome some of
the deficiencies of fieldwork studies of social networks, as Newman (2001) has pointed out.

7
For example, when two or more people co-author a paper we may assume they have had
some form of social interaction, whereas field studies of friendship and communication links
suffer from the problem of different respondent perceptions and definitions of the language
used in questions and answers.
Research Objectives
The research questions we seek answers to are the following:
• To what is extent is research in the IMP group dominated by a few key researchers?
• What is the importance of cross national research collaborations in a research group
comprising researchers from many nations in Europe, Asia, Australia and America?
• What is the subgroup structure of the IMP group and the role and importance of
particular individuals in these subgroups in linking otherwise disconnected subgroups
of researchers?
• How stable is the structure of relations and how vulnerable is it to the departure of key
researchers?
Our paper is designed also to stimulate fruitful discussion among IMP and related scholars
about the nature and performance of the group, how this has changed over time and the
challenges facing the group in the future as some of the founding fathers approach retirement.
The paper is organised in the following way. First, we briefly review related research that
underpins our study. We then describe the way the database used as the basis of analysis was
developed. The results of our social network analysis are then reported and discussed. The
final section considers areas for future development of this type of research.

8
Related Research
There are two streams of literature that support the ideas of this paper.
The first concerns research collaboration. In the last 20 years there has been increasing
collaboration in research and it is widely assumed that this should be encouraged and
extended in various ways, i.e. international collaboration, across sectors, between university
and industry, between science and technology, across scientific disciplines, and at individual
and institutional levels (Katz and Martin, 1997). Early studies on research collaboration are
more than 30 years old and are generally referred to as the Sociology of Knowledge and
Sociology of Science (de Solla Price, 1963; Zuckerman, 1967; Crane, 1972). Researchers use
quantitative methods to measure research collaboration through co-citation and co-authored
publications. The most cited studies are by Derek Price and Diane Crane, who introduced and
developed the concept of Invisible Colleges, the focus of our article. Diane Crane (1972)
presented the idea of ‘Invisible Colleges’ as informal communication networks with some
form of social organisation. She highlighted the importance of key individuals in the
dissemination of information throughout the field and how these individuals are members of
‘a highly elite invisible college.’ Invisible Colleges, or networks of the most productive
authors, are an important aspect in the social organisation of a research area because they
tend to link separate groups of collaborators and promote the development of a field.
One of her results is that
‘…in each of these areas a sizeable core of individuals were connected with one another…. In
each case, one large network of individuals linked directly or indirectly emerged…Analysis of
the networks showed that anyone choosing even one of the most productive members of each
research area studied by the author could have been in contact with a large network of
individuals. In other words, the high proportion of choices directed toward these individuals
meant that members of these groups were not so much linked to each other directly but were

9
linked to each other indirectly through these highly influential members …’ (Crane, 1972, pp.
45)
These ideas have been developed and tested in various later studies. For example, much work
has been done on the link between research productivity and research collaboration. It seems
that more prolific authors collaborate more frequently and authors at all levels of productivity
tend to collaborate more with highly productive authors (Katz and Martin, 1997). Other
studies focused on patterns of spatial proximity and scientific interaction at regional and
country levels. Structural researchers fostering research collaboration have been investigated,
not only in terms of research on the Sociology of Knowledge and Sociology of Science, but
also in policy and technology oriented studies (e.g. Hakansson, 1987; Rothwell, 1994; Welch
et al., 1998).
A gap in studies of research collaboration stems from the general approach adopted. Usually
a macro perspective is adopted rather than a micro one focusing on the roles of individuals in
the collaboration network (Melin, 2000). There is a lack of studies adopting a relational
approach.
The second stream of research underpinning our research is Network Theory. We use
methods and tools derived in the cross-disciplinary field of network studies. Network
Analysis is a potentially powerful tool that can be used to study a variety of phenomena
(Borgatti and Everett, 1999; Burt, 1992; Carley, 1999; Hummon and Carley, 1993; Lundgren,
1995; Morlacchi, 2002; Padgett and Ansell, 1993; Wasserman and Faust, 1994). More
recently, there has been increased interest in using this methodology in business to analyse
the nature and role of informal relations between people in formal organisations (Cross et al.,
2002; Cross and Pusak, 2002) and work examining the co-authorship of scientific papers, as
already mentioned (Barabási et al., forthcoming; Newman, 2001).

10
The study of networks is becoming a focus of attention throughout science as this form of
organisation is seen to play an important role in the material, biological and social sciences.
Methodology
Our data set consists of structural and individual attributes of the nodes in our network. The
nodes are co-authors and the relations are the number of papers jointly authored (with or
without additional authors). The primary unit of analysis is ‘the article or research paper,”
which is regarded as the outcome of a process of research collaboration. Hence the type of
relation analysed (sometimes referred to as a “tie”) is ‘co-authorship’.
The population of interest comprises all people presenting a joint paper at IMP annual
conferences from its beginning in 1984 to 1999, as indicated in the conference proceedings.
Altogether, there are 1163 papers, but only 670 of them are by 2 or more authors. Our
universe is therefore the 989 authors involved in these 670 joint papers.
The omission of people that tend to publish single authored papers is an obvious weakness of
this approach. The ideas of particular sole authors may play an important role in shaping the
intellectual directions of the group and their role will tend to be under-represented. For
example, two authors who have attended many IMP conferences and yet do not appear in our
sample are Keith Blois and Jim Anderson. Both of these have had an important impact on
IMP thinking. This limitation suggests the need for additional research looking at co-citation
among IMP conference papers and co-authorship and co-citation in other types of
publications. It is interesting to note that, as a consequence of an early version of this article
being presented at the 2000 IMP conference, one IMP researcher, Malcom Cunningham, one
of the “old men” of IMP, was moved to write a rejoinder for the next conference
(Cunningham, 2001). In this he bemoaned, somewhat tongue in cheek it has to be said, the
relegation to lesser ranks of some IMP researchers because of their non-inclusion in our

11
database. This seems to us to be yet another indication of the social process of science, as
well as of the spirit of the IMP group.
We used the following criterion to select our sample: we considered only authors who have
attended 3 or more IMP annual conference and who therefore are involved in 3 or more
papers. This results in a sample of 171 people, which is summarised in the appendix. The
reasons for restricting analysis to these 171 are twofold. First, because we are trying to draw
a picture of the IMP community and it is reasonable to focus on more active members, people
who regularly attend the annual conference and present papers that contribute to the
production of new knowledge in the focal research area of industrial marketing and
purchasing. The second is a technical constraint related to the UCINET V software used to
implement the analysis.
Results
Frequency Distribution of Co-Authored Papers
One of the surprising results is that the distribution of number of co-authored papers is not a
normal or bell shaped distribution with but has a characteristic power law distribution, in
which a few authors contribute a large number of co-authored papers and there is a long tail
involving many authors contributing a small number of co-authored papers. Thus, there is no
characteristic scale in terms of number of co-authored papers as reflected in a mean, which is
5.97. The power law distribution is shown in Figure 1, which shows frequency and the log-
log plot of the number of co-authored papers. The log-log plot shows the characteristic
straight line pattern with a correlation of 0.98 with a slope close to -1 (Barabási, 2002). The
power law distribution conforms to the much earlier results of Lotka (1926) and to the more
recent studies carried out by Newman (2001) and Barabási et al. (forthcoming) and is a

12
hallmark of complex adaptive, self organising systems such as social networks like the IMP
group (Barabási, 2002).
(a) Frequency of Co-Authored IMP Papers
0
5
10
15
20
25
0 50 100 150
(b) Log-Log Plot
1
10
100
1 10 100 1000
Figures 1a and 1b - Power Law Distribution of Number of Co-authored IMP Conference Papers(N=171 minimum 3 papers)
Figure 2 shows the composition of the sample in terms of country of the author’s university.
This is based on their affiliation at the time of their first IMP conference paper though some
authors have moved institution and country during the period under consideration. This
shows the strong dominance of Europe in the make-up of the IMP Group, particularly the

13
UK, Sweden and Finland. Finland was not part of the IMP1 or IMP2 cross-national business
relationship and network studies yet it is well represented in terms of conference
participation. This in part reflects the research focus of many Finnish researchers and the
number of doctoral students who attend the conference each year, writing papers with senior
researchers.
0 10 20 30 40 50
UKSwedenFinland
NetherlandsAustraliaDenmark
ItalyUSA
FranceGermany
NorwayCanadaBelgiumHungary
IrelandPortugal
Peru
An analysis of individual researchers’ attributes in terms of the number of papers presented,
their first year of participation, the number of years of participation, their home country and
home institution shows that existence of three main sub-groups:
� Highly Productive people: a group of highly productive people in terms of the number of
papers presented
� Long Serving Participants: a group of people who have participated in many IMP
conferences and
� Early Starters: a group of people who have attended the conference right from the
beginning (i.e. 1984 or 1985).
Figure 2 - Number of Co-
authored IMP Conference
Papers in Sample By
Country of Author
(N=171)

14
A comparison of these groups reveals a limited degree of overlap as shown in Figure 3.
Groups have been defined by taking as fixed the dimension of the 1984-1985 group of 32
authors and selecting those ranked among the top in the other two sub-groups.
Figure 3 - Major IMP Subgroups Based on Individual Attributes
The overall pattern of researcher-to-researcher connections is shown in Figure 4. A line
linking two researchers means they have co-authored at least one IMP conference paper, the
number of such co-authorships is not used as part of this or subsequent analysis. The figure
shows the existence of a large or giant component of the network comprising a set of
interconnected researchers covering a large part of the network (Newman 2001). It also
shows the existence of isolated individuals and subgroups. Some of the isolates may be
indirectly connected to the main component of the network through co-authorship links they
have with people not included. This is because our sample includes only those researchers
who have been to 3 or more conferences and therefore published 3 or more papers.
Therefore, some isolates may have co-authored papers with researchers not included in the
AL, BN, CM, EG, GLE, FD,HH, JJ, JW, MLG, SR, SD,
TP, WI
AH, CB, FLR, FP,DA, GHG GP, HV,,NP, PJ, SA, SPR,
TJA, WK, YLDS, HS, HEP, KDJ,
MP, PAC, RS
MT SI
BF, CN, HL, PS, RES,
TG, LGA TM, VJP,
HUS, LU, MV, BS,
FR, RP, SM
Early Starters
Long Servings
HighlyProductive

15
sample, through whom they may be connected to the main component. But Figure 4
describes the dominant structure of the network and is used as the basis for further analysis.
Figure 4 - Connectivity of 171 IMP Co-authors
Ego Networks
Table 1 summarises some of the main characteristics of the ego networks1 of the 171
researchers included in our sample. Size, is the number of other researchers (alters) with
whom a researcher (node) has co-authored an IMP conference paper. Ties, is the total
number of co-authorship links among the researchers with whom a focal researcher has co-
authored papers, excluding the focal researcher. Pairs, is the total number of potential ties
among researchers with whom a focal researcher has co-authored a paper. For example, if a

16
researcher has co-authored papers with 4 others in the sample, the size of their ego network is
4. Some of these 4 other researchers may have co-authored papers with each other, which is
the number of ties. Lastly, among n people there are n(n-1)/2 potential ties, which for 4
people is 6 and is termed the number of pairs.
The ratio of ties to pairs measures the extent to which a researcher links together other
researchers in a non-redundant manner. This has been referred to as the clustering coefficient
by Watts and Strogatz (1998) and shows how close-knit the co-authors are. The less close-
knit a researcher’s co-authors are, the more a researcher connects researchers that are not
otherwise connected, which is the concept of structural wholes proposed by Burt (1992).
Researchers occupying structural wholes, or non-redundant connections, play a potentially
important role in connecting different parts of the network and in stimulating knowledge
sharing and development through their role in bringing together researchers that would
otherwise not be linked.
1An ego-network ‘…consists of a focal actor, termed ego, a set of alters who have ties to ego, and
measurements on the ties among these alters…’ (Wasserman and Faust, 1994, pp. 42).

17
Table 1- IMP Group Co-authorship Ego-Network Measures (N=171)
SizeMean 1.82StDev 2.08Min 0Max 11 (HH)M+3σ 8.06People outside range (M+3σ) EG, HH, HV, WI, WDT
TiesMean 1.43StDev 3.14Min 0Max 18 (HV)M+3σ 10.87People outside range (M+3σ) DA, GLE, HH, HAL, HV, SA, WI
PairsMean 5.8St Dev 14.96Min 0Max 110
The results indicate that the network of researchers shows many of the small world properties
of social networks discovered in previous research. The network is highly clustered, rather
than a random set of connections, and some researchers have extensive collaboration
networks and play a key hub role in linking different parts of the network. Once again, a
power law distribution of ego-network scores is evident with some researchers, the hubs in
the network, having scores more than three standard deviations above the mean, i.e. HH, HV,
WI, SA, HAL, DA, WDT, GLE, EG. Comparison of these results with the studies of
physicists (Newman, 2001) mathematicians and neuro-scientists are not meaningful because
they cover a greater range of types of publications and time periods.
A commonly used measure describing the connectivity of a network is the minimum distance
linking two researchers, which is the length of the shortest path between them (Barabási,
2002). A distance of 1 means that two authors have co-authored a paper with each other and
a distance of 2 between researcher A and B means that A has co-authored a paper with

18
someone who has co-authored a paper with B. This type of measure has been used in various
situations to provide an index of how closely two researchers, actors or people are connected
(Barabási, 2002). Similar indices could be conducted in terms of distance from particular
IMP researchers, such as one or more of the founders, but we have not computed that here.
Instead, in the following section we examine the role of particular researchers and the pattern
of co-authorship links they have. It should be noted that not all researchers will have distance
scores to all other researchers in the network because some are isolates and hence not
connected to other parts of the network. Because of this, an average distance score for a
network such as that shown in Figure 4 cannot be calculated.
The Core Network
The pattern of network connections shown in Figure 4 suggests the presence of a
‘core/periphery structure’. Furthermore, cluster analysis confirms this type of structure exists.
We used an n-cliques analysis to detect the presence of isolated nodes and sub-groups and
this provided clear evidence of the existence of a core network. This core-periphery structure
of a network has been discussed by Borgatti and Everett (1999) and Everett and Borgatti
(1999) and we used their models of networks to identify a core group of 57 members or a
cohesive subset. Hereafter, we will call this network the ‘57Core Net’ and it is depicted in
Figure 5.

19
Figure 5 - The Core Network of 57 Researchers
BN
HH
WIGLE
MLG
HV
JJ
SM
AK
HL
WDT
TJ
HM
TJA
NPBR
HCP
TP
MOK
AH
HAL
HB
PAC
APH
SA
SD
EG
DA
MDR
FD
FLR
WL
WD
YL
MKDS
MLD
MS AL
SI
MF CB
SPR
PRJ
CALSRFP
GP
RT
GHG HEP
FW
MP
MT
WK
JN
BP

20
Within this core network there is a large sub-net composed of 40 researchers together with
other smaller structures i.e. dyads, triads and small groups. The large sub-net is structured
around some key researchers and quite different roles can be detected. Table 2 (in Appendix
1) shows several key ego network measures for this core group. Size and pairs have been
defined already. Two-step reach is percentage of other researchers in the core network linked
directly, i.e. having a distance score of 1, or at a distance of 2 to a focal researcher.
“Structural Holeness” is measured in terms of the effective size of a researcher’s co-
authorship group, i.e. the number of co-authors minus the average number of links between
them, not counting ties to the focal researcher (Burt, 1992). It indicates how important a
researcher’s role is in linking together researchers of the network. This measure is analogous
to the concept of a clustering coefficient used by Watts and Strogatz (1998). See Table 3 in
Appendix 2.
The results help clarify the key hub role of certain researchers and this may be illustrated by
examining parts of the 57CoreNet network centred around key researchers. For example,
Figure 6 shows a portion of the network including researchers positioned 2 steps from one of
the founders of the IMP Group, Hakan Hakansson (HH). This figure shows how the network
appears from the perspective of one key researcher and the kinds of researchers influencing
and being influenced by this researcher.

21
Figure 6 - Researchers With a Hakan Hakansson Index of 1 or 2
shows the important hub role Jan Johanson plays in the network, as a gatekeeper or broker
situated in a structural hole (Burt, 1992). DWT also appears to play a critical role in linking
various researchers into the inner core and WI links various Australian based researchers into
the core. These researchers occupy structural holes in the network, as their high score on this
ego network measure indicates.
BN
HH
WIGLE
MLG
HV
JJ
SM
HL
AH
HAL
HB
PAC
APH
SA
SD
EG
DA
MDR
FD
FLR
WL
WD
YL
AL
SI

22
Figure 7 - The Core Network in the Absence of Jan Johansson
The network also reveals some geographic groupings of researchers. For example, there is a
group of French and Portuguese researchers that tend to write papers with each other, as
indicated by the disconnected group in the bottom left of the figure, as well as a tight group
of three German researchers (RT, GHG and HEP).
Figure 8 summarises the core network in terms of researchers grouped by country.
Researchers are grouped together if they are directly or indirectly connected to each other and
if they are from the same country. Thus some countries have more than one grouping. The
number of researchers in each group (N) and the number of researchers in that group who
connect their country to other countries (C) are shown. This shows the important role of
Swedish researchers in the network, linking researchers from many other countries.
BN
HH
WIGL
MLG
HV
AH
HAL
HB
PAC
APH
SA
EG
DA
MDR
FD
FL
WL
W
YL
MKDS
ML
MS AL
SI

23
Figure 8 - Core network in terms of researchers grouped by country
BR
BN
HH
WIGLE
MLG
HV
JJ
SM
AK
HL
WDT
TJ
HM
TJA
NP
HCP
TP
MOK
AH
HAL
HB
PAC
APH
SA
SD
EG
DA
MDR
FD
FLR
WL
WD
YL
MKDS
MLD
MS AL
SI
MF CB
SPR
PRJ
CALSRFP
GP
RT
GHG HEP
FW
MP
MT
WK
JN
BP
AUSTRALIAN=9; C=2
BRITAIN-1N=4; C=2
BRITAIN-2N=6, C=2
SWEDENN=12; C=7
USAN&C=1
FINLAND-1N=5; C=1
GERMANYN=3; C=0
FRANCE-1N=6; C=0
FRANCE-2 N=1,C=0
NORWAYN&C=1
FIN-LAND-2N&C=2
BEL-GUIMN=2
DENMARK-1N&C=1
BRITAIN-3; N=2;C=0
NETHER-LANDSN=1,C=0 DENMARK-
2; N=2, C=0

24
This includes linking groups of researchers from the same country, such as the two groups of
UK based researchers that are indirectly linked through Swedes. This is not unexpected
given the central role that Swedish researchers have played in the development of the IMP
group and serves to show the importance of third parties in linking together researchers that
are otherwise not connected. In other words the Swedes as a whole occupy an important
structural hole in the network.
To some extent Scandinavia could be considered as a single grouping unit. For example
there is considerable intra-regional linkage on the right-hand section of the Swedish group –
in particular through HV – to other Scandinavians who are not Swedish. Also, dense patterns
of connections are observed within but not between other countries.
Table 4 summarises the pattern of inter-country connections depicted in Figure 8. If Sweden,
Norway, Denmark and Finland are considered together, they represent more than half of the
researchers in the main component of the network. The inter-group connectivity also changes
when Scandinavia is considered as one group. 52% of Swedish collaborations are with other
Swedes, and intra-Scandinavian co-authorships account for 76% of total Scandinavian co-
authorships – due mainly to the inclusion of the Finns.
Table 4 - Connectedness of Core Network by Country and Region
Country orRegion
Numberof
Authors
TotalExternal
Links
ExternalLinks Per
Author
TotalInternalLinks
Total LinksPercent ofInternalLinks
Total LinksPer Author
Finland-1 5 1 0.20 5 6 83% 1.2Sweden 12 7 0.58 14 27 52% 2.25
Scandinavia 23 7 0.30 29 38 76% 1.65Britain-1+2 10 4 0.40 7 14 50% 1.40
Australia 9 2 0.22 12 18 67% 2.00USA 1 1 1.00 0 3 0 3.00
Total 43 14 0.33 48 73 0.66 1.70

25
It is Britain rather than Scandinavia that has the highest proportion of inter-region
connections with 40% of those in the main UK clusters (i.e. excluding Britain-3) connected to
researchers in another country. Both Britain and Australia have higher average numbers of
inter-regional co-authorships per researcher than does Scandinavia.
Evolution of the Network
Using the first year of publication of each researcher in the network, we mapped the
development of the 171 sample and of 57CoreNet. Four periods may be distinguished, i.e. I:
1984-1985; II: 1986-1990; III: 1991-1993; IV: after 1993, and people may be characterised in
terms of their first year of publication as shown in Table 5. No data exists for the final two
years as researchers first publishing in those years would have been excluded from our
sample as having less than three years conference attendance.
Table 5 - Development of the IMP Network Over Time
1984 1985 1986 1988 1989 1990 1991 1992 1993 1994 1995 1996 1997 1998 1999
57 Core 10 15 15 19 21 25 32 36 39 46 52 57 - - -
171 21 32 36 51 60 71 83 104 117 133 147 161 171
Table 6 shows that people like MOK, HV and YL joined the IMP Group later on. However,
the previous analysis shows that they are part of the core network. This suggests interesting
issues to follow up in order to understand how such people were able to enter the network at a
later stage and to quickly become core researchers. Some of the obvious reasons are the
entry of significant researchers later in the evolution of the IMP group. These people brought
with them connected others, had links with one or more of the core group and formed a

26
distinct subpart of the network. For example, IW had a paper at the first IMP conference but
did not publish another until 1991. But since then he has co-authored many papers with
newer researchers, as well as with established members of the core group. Moreover, some
of these newer researchers subsequently co-authored papers with members of the earlier core
group and, in this way, the core group has grown.
Table 6 - Researchers grouped by year of first publication at IMP
I:1984-1985
II:1986-1990
III:1991-1993
IV:after 1993
AL CB AH AKBN GHG DA APHEG HAL FLR BPFD HEP FP BR
GLE MF GP CALHH MOK HV DSHL NP HB FWJJ SA HCP JN
MLG SPR MT MDRSR TJA SI MLDSM WL MKSD WK MSTP YL PACWI PRJ
WDT RTTJ
WD
Another issue is the departure of researchers from the network. Is this due to retirement, to
change in research direction or could it be an inability to form productive research ties with
established IMP researchers? More generally, models of network evolution based on co-
authorship data are only beginning to be developed (Barabási et al., forthcoming) and suggest
interesting possibilities for further research using the IMP co-authorship network as well as
other data bases of marketing and business publications, which we are currently examining.

27
Discussion and Conclusions
The paper paints a picture of a social network of researchers and reveals some dimensions of
the social process of science. In particular, our case study analysis has shown that there is an
invisible college inside the IMP Group. Beyond expected national and institutional
cooperation on research, there is an informal network of collaboration that connects different
subgroups located in many parts of the world.
An interesting finding is that the pattern of co-authorship corresponds to a power law
distribution, which conforms to the results of studies of co-authorship in other discipline
areas. This supports the view that the IMP group is a kind of living complex adaptive system
- a self-organising social organism of interacting researchers – that exhibits the same
characteristics as other complex adaptive systems.
To summarise our results we return to the research questions described above.
To what is extent is research in the IMP group dominated by a few key researchers?
The collaboration network based on co-authorship is quite centralised and based on key
researchers who play important bridging or hub roles. The role and importance of the
founding fathers (and they are all men) is obvious from the results. As of 1999, they were
still very active researchers with a wide range of research collaborators located around the
world. There is also an indication of a second generation of IMP researchers, who joined and
became active later and brought with them particular research collaborators who also joined
the group. In this way groups of researchers from different regions, such as Australia, came
to play a significant role and became part of the core network.

28
What is the importance of cross-national research collaborations in a research group
comprising researchers from many nations in Europe, Asia, Australasia and America?
There is considerable international collaboration among IMP researchers but distinctive
groups based on country or region of origin also exist. Within the Scandinavian countries
there is much cross-national collaboration, in part due to established traditions of research
cooperation and associated regional research forums. This result also reflects the strong
influence of Swedish researchers in the founding of the IMP group and in taking the lead (if
that is possible in IMP!) in some of the key collaborative empirical studies carried out by the
IMP group.
What is the subgroup structure of the IMP group and the role and importance of particular
individuals in these subgroups in linking otherwise disconnected subgroups of researchers?
Much of this is covered in the answer to the foregoing questions. Some individuals do seem
to play an important bridging or hub role, linking researchers from different parts of the
world and perhaps different research traditions, to the core group. However, there are also
more isolated subgroups that publish with each other but not with other IMP researchers. The
Finns and the French, and to some extent the Germans, seem to be more isolated subgroups,
which may be in part due to language barriers or to different research and publication
traditions in these countries.
How stable is the structure of relations and how vulnerable is it to the departure of key
researchers?
The retirement of key researchers such as HH, JJ, DW or IW, who act as important bridges
connecting different parts of the network, could have significant impact on the functioning of
the IMP group. The issues of its future direction and problems of transition beyond the

29
original founders have been discussed at IMP conferences, most recently in a plenary session
at the 2002 conference. There appears to be some hope for the future because, as Young
(2002) describes in her review of the discussion that took place at this session, a new
generation of younger researchers is emerging, who are not as closely linked to the original
“old men,” and who sometimes are not even aware of who they are! This, as she says, bodes
well for the future as this new generation makes their mark on research directions and
conferences.
There are obviously limitations to our analysis. First of all, we consider only one aspect of
research collaboration, i.e. co-authorship, and a simple indicator of this. We make no attempt
to examine the importance of the co-authored papers, to categorise them by subject area or to
include co-authorships outside of the conference proceedings. Second, as already noted,
single-authored papers are not included in our database and this will tend to undervalue the
role of some researchers who have contributed important papers to IMP conferences. Third,
we do not consider the significance to individual researchers of their IMP-related co-authored
papers. For some researchers, particularly those from North America, their main research
agenda is outside the domain of the IMP group, yet they play an important role at conferences
in interacting and sharing ideas with other IMP researchers and in collaborating on other, but
related, research projects. Fourth, we do not consider co-authorship of non-IMP conference
papers in the form of journal articles and books. The latter in particular have been an
important means of joint publication of IMP ideas. Despite these limitations, we believe the
broad patterns reported are representative of the structure of the IMP group and how it has
changed over time. Most researchers tend to trial a paper at the conference before later
journal publication and the conference is the main meeting place for IMP researchers. A
further limitation is the time frame analysed. Although our data spans 1984-1999, we
effectively only consider data up to 1996 because of the way we selected our sample i.e.

30
people attending the conference for 3 or more years. We believe that history matters, but in
network terms the history of our community is quite short.
There are many opportunities to further develop the type of research described here,
including extending it to non-IMP contexts. First, the analysis can be extended to include
papers from additional conferences, such as specialist IMP and related conferences in
addition to the main annual IMP conference. For example, several conferences and
workshops have taken place in Scandinavia, Australia and Asia. Business network tracks also
form part of other business and marketing conferences. Consideration of these would allow
us to see how far the IMP group of researchers interacts with other researchers in the area of
business markets.
Second, our analysis can be extended to examine more fully the associations between a
researcher’s personal characteristics and the characteristics of their ego networks, such as the
number and type of their co-authors, the subgroups they belong to, and their degree of
connectivity. Third, alternative measures of links between researchers can be used, such as
co-citation, surveys of communication links and grant applications, in order to see how the
network picture differs.
Fourth, and important is the extension of this research approach to other parts of the
marketing and business disciplines. The same kind of analysis can be used to examine co-
authorship networks in other areas of marketing and business research, including conferences
such as the American Marketing Association Summer and Winter Educator conferences, or
the European Marketing Academy conferences and the Australia-New Zealand Marketing
Academy conferences.
Lastly, the study of the evolution of social networks, including co-authorship networks, is an
area of increasing interest and importance (Barabási et al., forthcoming). Not only are

31
existing patterns of collaboration relevant but also how they have developed over time. More
generally, the study of complex adaptive systems, of which social networks are but one
example, has led to the development of methodologies that enable us to improve our
understanding of the way in which our social networks and knowledge evolve (e.g. Easton et
al., 1997; Kauffman, 1995). These developments present many opportunities for future
research that are only beginning to be exploited.

32
References
Anderson, J.C., Hakansson, H. and Johanson, J. (1994), “Dyadic business relationshipswithin a business network context.” Journal of Marketing, 58, (October), 1-15.
Axelsson, B and Easton, G. (eds) (1992) Industrial Networks: A New View of Reality,Routledge, London.
Barabási, A.L. (2002) Linked: The New Science of Networks, Perseus Publishing, Cambridge,MA.
Barabasi, A.L., Jeong, H., Neda, Z., Ravasz, E., Schubert, A., Vicsek, T. (forthcoming)“Evolution of the social network of scientific collaborations” Condensed Matter,http://xxx.lanl.gov/abs/cond-mat/0104162.
Blankenburg-Holm, D., Eriksson, K. and Johanson, J. (1996) “Business networks andcooperation in international business relationships", Journal of International BusinessStudies, 27 (5), 1033-1053.
Borgatti, S.P. and Everett, M.G. (1999) “Models of core/periphery structures”, SocialNetworks, 21, 375-395.
Brown, J.S. and Duguid, P. (2000) The Social Life of Information, Harvard Business SchoolPress, Boston, MA.
Burt, R. (1992) Structural Holes: The Social Structure of Competition, Harvard UniversityPress, Cambridge, MA.
Carley, K.M. (1999) “On the evolution of Social and Organizational Networks”, inBacharach, S.B., Andrews, S.B. and Knoke, D. (eds) (1999) Networks in and aroundOrganizations, Research in the Sociology of Organizations, JAI Press, Stanford.
Chalmers, A. (1999) What is this Thing Called Science? (3rd ed.) University of Sydney Press,Sydney.
Cote, J.A. & Leong, S.M.(1991) “Assessing the influence of journal of consumer research: Acitation analysis”, Journal of Consumer Research, 18, 402-410.
Crane, D. (1972) The Invisible Colleges: Diffusion of Knowledge in Scientific Communities,University of Chicago Press, Chicago, IL.
Cross, R., Borgatti, S.P. and Parker, A. (2002) “Making the invisible visible: using socialnetwork analysis to support strategic collaboration”, California Management Review,44 (Winter), 25-46.
Cross, R. and Pusak, L. (2002) “The people who make organizations go – or stop”, HarvardBusiness Review, (June), 5-12.
Culnan, M. (1987) "Mapping the intellectual structural of MIS 1980-1985: a co-citationanalysis", MIS Quarterly, 13 (2), 221-229.

33
Cunningham, M. (2001) “The aetiology and treatment of network inferiority and conferenceinsecurity syndrome”, Paper presented at Industrial Marketing and PurchasingConference, BI, Oslo. (http://web.bi.no/IMP2001 ).
De Solla Price, D.J. (1963) Little Science, Big Science…and Beyond, Columbia UniversityPress, New York.
Easton, G., Wilkinson, I.F. and Georgieva, C. (1997) “On the edge of chaos: towardsevolutionary models of industrial networks” in Gemunden, H.G. and Ritter, T. (eds).Relationships and Networks in International Markets, Elsevier, Amsterdam.
Everett, M.G. and Borgatti, S.P. (1999) “Peripheries of cohesive subsets”, Social Networks,21, 397-407.
Ford, D. (ed.) (1990 and 1997) Understanding Business Markets, Dryden Press, London.
Ford, D., Berthon. P., Brown, S., Gadde, L.E., Hakansson, H., Naude, P., Ritter, T., Snehota,I. (2002) The Business Marketing Course: Managing in Complex Networks, JohnWiley and Sons, Chichester.
Ford, D.I, Gadde, L.E., Hakansson, H., Lundgren, A., Snehota, I., Turnbull, P., Wilson, D.(1998) Managing Business Relationships, Wiley, Chichester.
Galison, P.L. (1997) Image and Logic: A Material Culture of Microphysics, University ofChicago Press, Chicago, IL.
Galison, P.L. and Stump, D.J. (1996) The Disunity of Science: Boundaries, Contexts, andPower, Stanford University Press, Stanford.
Gemunden, H.G. (1997) “The development of IMP - an analysis of conference proceedings1984-1996” in Gemunden, H.G., Ritter, T. and Walter, A. (eds) Relationships andNetworks in International Markets, Pergamon, Oxford.
Goldman, A. (1979) “Publishing activity in marketing as an indicator of its structure anddisciplinary boundaries”, Journal of Marketing Research, 16, 485-494.
Hakansson, H. (1982) International Marketing and Purchasing of Industrial Goods, AnInteraction Approach, John Wiley, Chichester.
Hakansson, H. (ed) (1987) Industrial Technological Development – A Network Approach,Croom Helm, Beckenham, Kent.
Hakansson, H. (1989) Corporate Technological Behaviour, Co-operation and Networks,Routledge, New York.
Hakansson, H. and Snehota, I. (1995) Developing Relationships in Business Networks.Routledge, London.
Hakansson, H. and Snehota, I. (2000) “IMP Perspective on Relationship Marketing” in Sheth,J. and Parvatyar, A. (eds). Handbook of Relationship Marketing, Sage Publications,Thousand Oaks, CA.

34
Hallen, L., Johanson, J., Seyed Mohamed, N. (1991) “Interfirm adaptation in businessrelationships”, Journal of Marketing, 55 (April), 29-37.
Hummon, N.P. and Carley, K. (1993) “Social networks as normal science”, Social Networks,15:71-106.
Katz, S.J. and Martin, B.R. (1997) “What is research collaboration?” Research Policy, 26, 1-18.
Latour, B. (1987) Science in Action, Harvard University Press, Boston, MA.
Leonard-Barton, D. (1995) Wellsprings of Knowledge: Building and Sustaining the Sourcesof Innovation, Harvard Business School Press, Boston, MA.
Lin, C.H. (1995) “The cross-citation analysis of selected marketing journals” Journal ofManagement, 12 (3), 465-489.
Lotka, A.J. (1926) “The frequency distribution of scientific production” Journal of theWashington Academy of Science, 16, 317-323.
Lundgren, A. (1995) Technological Innovation and Network Evolution, Routledge, London.
McLoughlin, D. and Horan, C. (2002) “Notes on a unique understanding”, Journal ofBusiness Research, 55 (July), 535-543.
Melin, G. (2000) “Pragmatism and self-organization. Research collaboration on theindividual level”, Research Policy, 29, 31-40.
Merton, R. (1973) The Sociology of Science, University of Chicago Press, Chicago, IL.
Morlacchi, P. (2002) How new technologies become legitimated: the co-evolution oftechnologies and networks in the cardiac implantable device field, Unpublished PhDThesis, School of Management, University of Bath, UK.
Newman, M.E.J. (2001) “Who is the best connected scientist? A study of scientificcoauthorship networks”, Physics Review, E 64, 016131.
Nonaka, I. (1994) “A dynamic theory of organizational knowledge creation”, OrganizationScience, 5, 14-37.
Nonaka, I. and Takeuchi, H. (1995) The Knowledge Creating Company, Oxford UniversityPress, Oxford.
Padgett, J.F. and Ansell, C.K. (1993) “Robust action and the rise of the Medici, 1400-1434”,American Journal of Sociology, 98 (6), 1259-1319.
Robinson, L.M. & Adier, R. (1981) “Measuring the impact of marketing scholars andinstitutions: an analysis of citation frequency”, Journal of the Academy of MarketingScience, 9,147-162.

35
Rothwell, R. (1994) “Industrial innovation: success, strategy, trends” in Handbook ofIndustrial Innovation, Dodgson, M. and Rothwell, R. (eds), Edward Elgar Publishing,Aldershot.
Turati, C., Usai, A. and Ravagnani, R. (1998) “Antecedents of co-ordination in academicinternational project research”, Journal of Managerial Psychology, 13 (3-4), 188-198.
Turnbull, P., Ford, D.I. and Cunningham, M. (1996) “Interaction, relationships and networksin business markets: an evolving perspective”, Journal of Business and IndustrialMarketing, 11 (3/4), 44-62.
Turnbull, P. and Valla, J.P. (eds) (1986) Strategies for International Industrial Marketing,Croom Helm, London.
Tushman, M. and Rosenkopf, L. (1992) “On the organizational determinants of technologicalchange: toward a sociology of technological evolution”, in Staw, B. and Cummings,L. (eds) Research in Organizational Behavior, JAI Press, Stanford, 14, 311-347.
Wasserman, S. and Faust, K. (1994) Social Network Analysis. Methods and Applications,Cambridge University Press, Cambridge.
Watts, D.J. and Strogatz, S.H. (1998) “Collective dynamics of ‘small world’ networks”,Nature, 393, 440-442.
Welch, D., Welch, L. Wilkinson, I.F. and Young, L. (1998) “The importance of networks inexport promotion: policy issues”, Journal of International Marketing, 6 (4), 66-82.
Wenger, E. (1998) Communities of Practice: Learning, Meaning, and Identity, CambridgeUniversity Press, Cambridge.
Wilkinson, I.F. (2001) “A history of channels and network thinking in marketing in the 20th
century”, Australasian Marketing Journal, 9 (2), 23-53.
Wilkinson, I.F. and Young, L.C. (2002) “Scientific method and marketing: an analyticalframework” in Cadeaux, J. and Pecotich, A. (eds) Macromarketing in the Asia PacificCentury: Proc. of the 27th Annual Macromarketing Conference, UNSW, Sydney,June, 161-169.
Young, L. (2002) “Whither IMP? Or is it wither IMP? A commentary on the Plenary Sessionfor the 18th IMP Conference”, Journal of Customer Behaviour, 1, 85-92.
Zuckerman, H. (1967) “Nobel laureates in Science: patterns of productivity, collaborationand authorship”, American Sociological Review, 32 (3), 391-403.

36
Appendix 1: Table 2 - Ego Network Measures of Individuals in the Core Group (N=57)
Size Pairs 2 Step Reach Struct.Holes1 WI 10 90 HH 44.640 WI 8.6002 HH 9 72 WI 42.860 HH 7.4443 HV 8 56 HV 41.070 JJ 6.1434 JJ 7 42 MLG 41.070 HV 5.7505 YL 5 20 JJ 33.930 MLG 4.0006 GLE 5 20 HB 32.140 GLE 3.8007 SA 5 20 EG 26.790 EG 3.5008 APH 4 12 GLE 25.000 MOK 3.5009 AH 4 12 FD 25.000 AL 3.500
10 HAL 4 12 DA 23.210 SR 3.50011 MOK 4 12 PAC 23.210 YL 3.40012 MLG 4 12 YL 21.430 WDT 3.00013 EG 4 12 WD 21.430 TP 3.00014 AL 4 12 WL 21.430 SA 2.60015 SR 4 12 APH 16.070 FD 2.33316 WD 3 6 AH 16.070 SM 2.33317 WL 3 6 HAL 16.070 NP 2.00018 SM 3 6 HL 14.290 MF 2.00019 WDT 3 6 MOK 12.500 CB 2.00020 TP 3 6 SD 12.500 SPR 2.00021 FD 3 6 AK 7.140 TJA 2.00022 DA 3 6 TJ 7.140 HB 1.66723 HB 3 6 CAL 7.140 DA 1.66724 CB 2 2 PRJ 7.140 PAC 1.00025 SPR 2 2 NP 7.140 WD 1.00026 MF 2 2 MLD 7.140 WL 1.00027 HL 2 2 MS 7.140 APH 1.00028 PAC 2 2 MF 5.360 AH 1.00029 SI 2 2 MDR 5.360 HAL 1.00030 BN 2 2 BR 5.360 HL 1.00031 FLR 2 2 GHG 3.570 SD 1.00032 DS 2 2 HEP 3.570 AK 1.00033 MK 2 2 RT 3.570 TJ 1.00034 AK 2 2 HM 3.570 CAL 1.00035 TJ 2 2 HCP 3.570 PRJ 1.00036 CAL 2 2 SI 0.836 MLD 1.00037 PRJ 2 2 SA 0.768 MS 1.00038 GHG 2 2 SM 0.768 MDR 1.00039 HEP 2 2 WDT 0.768 BR 1.00040 RT 2 2 BN 0.768 GHG 1.00041 TJA 2 2 FLR 0.768 HEP 1.00042 NP 2 2 AL 0.760 RT 1.00043 SD 1 0 TP 0.465 HM 1.00044 MDR 1 0 SR 0.397 HCP 1.000

37
Size Pairs 2 Step Reach Struct.Holes45 MLD 1 0 CB 0.397 SI 1.00046 MS 1 0 SPR 0.397 BN 1.00047 BR 1 0 DS 0.397 FLR 1.00048 HM 1 0 MK 0.397 DS 1.00049 HCP 1 0 TJA 0.397 MK 1.00050 FW 1 0 FW 0.096 FW 1.00051 FP 1 0 FP 0.096 FP 1.00052 JN 1 0 JN 0.096 JN 1.00053 MP 1 0 MP 0.096 MP 1.00054 MT 1 0 MT 0.096 MT 1.00055 WK 1 0 WK 0.096 WK 1.00056 BP 0 0 BP 0.000 BP 0.00057 GP 0 0 GP 0.000 GP 0.000

38
Appendix 2: Table 3 - Attributes of 171 Samples
Name Code Total First Total Country Institution1 Alajoutsijarvi, Kimmo AK 3 1995 7 Finland Oulu Uni2 Andersen, Poul APH 4 1994 5 Denmark Aalborg3 Anderson, Helen AH 8 1991 10 Sweden Linkoping4 Anderson, Ulf AU 3 1992 3 Sweden Uppsala5 Araujo, Luis AL 14 1984 18 UK Lancaster6 Bangens, Lennart BL 4 1992 5 Sweden Chalmers7 Barrett, Nigel J. BN 9 1984 9 Australia UTS8 Barreyre, Pierre BPY 3 1990 3 France Grenoble9 Beije, Paul R. BP 3 1996 4 The Netherlands Rotterdam10 Benson-Rea, Maureen BRM 4 1995 4 New Zealand Auckland11 Biemans, Wim G. BW 5 1988 6 The Netherlands Eindhoven12 Blois, Keith J. BK 3 1995 3 UK Oxford13 Bonaccorsi, Andrea BA 3 1989 4 Italy Pisa14 Bradley, M. Frank. BF 4 1984 4 Ireland Dublin15 Brand, Maryse J. BM 4 1989 4 Netherlands Groningen16 Brege, Steffan BS 5 1985 7 Sweden Linkoping17 Brennan, Ross BR 5 1995 6 UK Manchester18 Bridgewater, Susan BRS 3 1994 3 UK Warwick19 Brito, Carlos BC 4 1992 4 UK Lancaster20 Burt, David N. BD 3 1990 4 USA San Diego21 Campbell, Alexandra CA 5 1992 5 Canada York22 Campbell, Nigel C. G. CN 5 1984 5 UK Manchester23 Canning, Louise E. CL 3 1996 3 UK UWE24 Castro, Luis M CAL 4 1994 4 Portugal Oporto25 Connor, Sandra CS 3 1992 3 UK Paisley26 Cova, Bernard CB 10 1988 12 France Paris27 Cunningham, Malcolm CM 7 1984 8 UK Manchester28 Damgaard, Torben DT 3 1992 3 Denmark Southern DK29 de Burca, Sean DBS 6 1994 8 Ireland Dublin30 Deans, Kenneth R. DK 3 1989 3 New Zealand Otago31 Denize, Sara DS 5 1994 6 Australia UTS32 Dubois, Anna DA 8 1992 10 Sweden Gothenburg33 Easton, Geoff EG 14 1985 22 UK Lancaster34 Eggert, Andreas EA 3 1997 3 Germany Kauserlautern35 Elfferich, P. C. EPC 3 1991 3 The Netherlands36 Eriksson, Paivi EP 3 1997 3 Finland Tampere37 Faes, Wouter FW 3 1996 6 Belgium Limburg38 Fang, Tony FT 3 1995 3 Sweden Linkoping39 Fiocca, Renato FR 3 1985 3 Italy Bocconi40 Fletcher, Richard FLR 8 1992 8 Australia UTS41 Ford, David FD 13 1985 18 UK Bath42 Frear, Carl R. FC 4 1988 4 USA Thunderbird43 Freytag, Per V FP 8 1992 9 Denmark Southern DK44 Gadde, Lars-Erik GLE 10 1984 12 Sweden Gothenburg45 Gemünden, Hans Georg GHG 10 1988 20 Germany Karlsruhe46 Ghauri, Pervez N. GP 8 1991 8 The Netherlands Groningen47 Gressetvold, Espen GE 3 1997 3 Norway Trondheim48 Hadjikhani, Amjad HA 5 1992 5 Sweden Uppsala49 Hakansson, Hakan HH 14 1984 21 Sweden Uppsala50 Halinen, Aino HAL 4 1989 5 Finland Turku51 Hallén, Lars HL 6 1984 6 Sweden Uppsala52 Hanmer-Lloyd Stuart HLS 5 1993 5 UK UWE53 Harris, Phil HP 4 1993 5 UK Manchester M54 Harrison, Debbie HD 3 1997 3 UK Lancaster55 Havila, Virpi HV 9 1991 11 Sweden Uppsala56 Hedaa, Laurids HEL 4 1992 5 Denmark Copenhagen57 Helfert, Gabi HG 3 1996 4 Germany Karlsruhe58 Hertz, Susanne HS 6 1989 8 Sweden Stockholm59 Heydebreck, Peter HEP 6 1990 8 Germany Karlsruhe
Hibbert, Brynn HB 3 1991 4 Australia UNSW61 Holden, Nigel J. HN 5 1988 5 UK Manchester62 Holland, Christopher P. HCP 6 1991 7 UK Manchester63 Holmen, Elsebeth HE 4 1994 6 Denmark Southern DK64 Holmlund, Maria HM 5 1993 7 Finland Helsinki65 Homburg, Christian HC 4 1993 5 Germany Koblenz66 Huemer, Lars HUL 3 1994 3 Sweden Umea67 Hultén, Staffan HUS 3 1985 3 Sweden Stockholm68 Järvelin, Anne-Mari JA 4 1995 4 Finland Tampere69 Johanson, Jan JJ 7 1984 12 Sweden Uppsala70 Johanson, Martin JM 4 1992 5 Sweden Uppsala71 Johnston, Wesley J. JW 9 1984 12 USA Georgia State72 Jorgensen, Niels JN 6 1994 6 Denmark Southern DK73 Kamann, Dirk-Jan F. KDJ 5 1993 8 The Netherlands Groningen74 Kavanagh, Donnacha KD 3 1992 3 Ireland Cork75 Kemp, Ron G.M. KR 4 1994 4 The Netherlands Groningen76 Kempeners, Marion A. KM 3 1995 3 The Netherlands Eindhoven
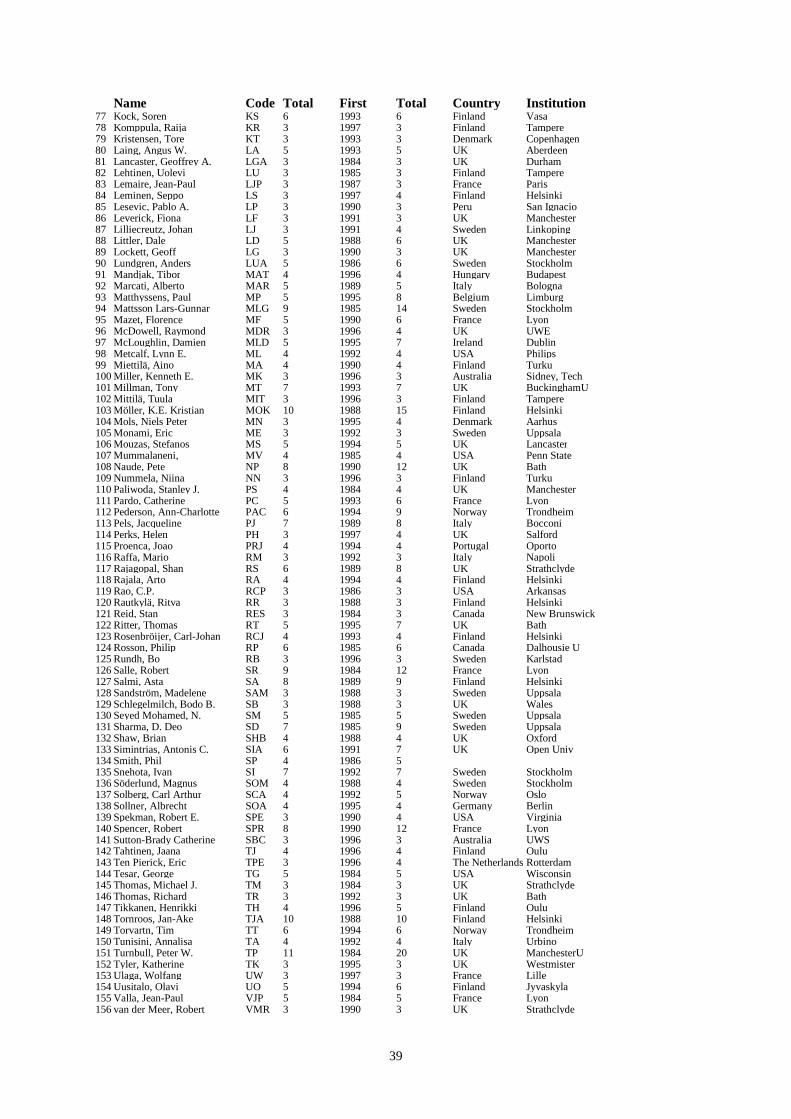
39
Name Code Total First Total Country Institution77 Kock, Soren KS 6 1993 6 Finland Vasa78 Komppula, Raija KR 3 1997 3 Finland Tampere79 Kristensen, Tore KT 3 1993 3 Denmark Copenhagen80 Laing, Angus W. LA 5 1993 5 UK Aberdeen81 Lancaster, Geoffrey A. LGA 3 1984 3 UK Durham82 Lehtinen, Uolevi LU 3 1985 3 Finland Tampere83 Lemaire, Jean-Paul LJP 3 1987 3 France Paris84 Leminen, Seppo LS 3 1997 4 Finland Helsinki85 Lesevic, Pablo A. LP 3 1990 3 Peru San Ignacio86 Leverick, Fiona LF 3 1991 3 UK Manchester87 Lilliecreutz, Johan LJ 3 1991 4 Sweden Linkoping88 Littler, Dale LD 5 1988 6 UK Manchester89 Lockett, Geoff LG 3 1990 3 UK Manchester90 Lundgren, Anders LUA 5 1986 6 Sweden Stockholm91 Mandjak, Tibor MAT 4 1996 4 Hungary Budapest92 Marcati, Alberto MAR 5 1989 5 Italy Bologna93 Matthyssens, Paul MP 5 1995 8 Belgium Limburg94 Mattsson Lars-Gunnar MLG 9 1985 14 Sweden Stockholm95 Mazet, Florence MF 5 1990 6 France Lyon96 McDowell, Raymond MDR 3 1996 4 UK UWE97 McLoughlin, Damien MLD 5 1995 7 Ireland Dublin98 Metcalf, Lynn E. ML 4 1992 4 USA Philips99 Miettilä, Aino MA 4 1990 4 Finland Turku100 Miller, Kenneth E. MK 3 1996 3 Australia Sidney, Tech101 Millman, Tony MT 7 1993 7 UK BuckinghamU102 Mittilä, Tuula MIT 3 1996 3 Finland Tampere103 Möller, K.E. Kristian MOK 10 1988 15 Finland Helsinki104 Mols, Niels Peter MN 3 1995 4 Denmark Aarhus105 Monami, Eric ME 3 1992 3 Sweden Uppsala106 Mouzas, Stefanos MS 5 1994 5 UK Lancaster107 Mummalaneni, MV 4 1985 4 USA Penn State108 Naude, Pete NP 8 1990 12 UK Bath109 Nummela, Niina NN 3 1996 3 Finland Turku110 Paliwoda, Stanley J. PS 4 1984 4 UK Manchester111 Pardo, Catherine PC 5 1993 6 France Lyon112 Pederson, Ann-Charlotte PAC 6 1994 9 Norway Trondheim113 Pels, Jacqueline PJ 7 1989 8 Italy Bocconi114 Perks, Helen PH 3 1997 4 UK Salford115 Proenca, Joao PRJ 4 1994 4 Portugal Oporto116 Raffa, Mario RM 3 1992 3 Italy Napoli117 Rajagopal, Shan RS 6 1989 8 UK Strathclyde118 Rajala, Arto RA 4 1994 4 Finland Helsinki119 Rao, C.P. RCP 3 1986 3 USA Arkansas120 Rautkylä, Ritva RR 3 1988 3 Finland Helsinki121 Reid, Stan RES 3 1984 3 Canada New Brunswick122 Ritter, Thomas RT 5 1995 7 UK Bath123 Rosenbröijer, Carl-Johan RCJ 4 1993 4 Finland Helsinki124 Rosson, Philip RP 6 1985 6 Canada Dalhousie U125 Rundh, Bo RB 3 1996 3 Sweden Karlstad126 Salle, Robert SR 9 1984 12 France Lyon127 Salmi, Asta SA 8 1989 9 Finland Helsinki128 Sandström, Madelene SAM 3 1988 3 Sweden Uppsala129 Schlegelmilch, Bodo B. SB 3 1988 3 UK Wales130 Seyed Mohamed, N. SM 5 1985 5 Sweden Uppsala131 Sharma, D. Deo SD 7 1985 9 Sweden Uppsala132 Shaw, Brian SHB 4 1988 4 UK Oxford133 Simintrias, Antonis C. SIA 6 1991 7 UK Open Univ134 Smith, Phil SP 4 1986 5135 Snehota, Ivan SI 7 1992 7 Sweden Stockholm136 Söderlund, Magnus SOM 4 1988 4 Sweden Stockholm137 Solberg, Carl Arthur SCA 4 1992 5 Norway Oslo138 Sollner, Albrecht SOA 4 1995 4 Germany Berlin139 Spekman, Robert E. SPE 3 1990 4 USA Virginia140 Spencer, Robert SPR 8 1990 12 France Lyon141 Sutton-Brady Catherine SBC 3 1996 3 Australia UWS142 Tahtinen, Jaana TJ 4 1996 4 Finland Oulu143 Ten Pierick, Eric TPE 3 1996 4 The Netherlands Rotterdam144 Tesar, George TG 5 1984 5 USA Wisconsin145 Thomas, Michael J. TM 3 1984 3 UK Strathclyde146 Thomas, Richard TR 3 1992 3 UK Bath147 Tikkanen, Henrikki TH 4 1996 5 Finland Oulu148 Tornroos, Jan-Ake TJA 10 1988 10 Finland Helsinki149 Torvartn, Tim TT 6 1994 6 Norway Trondheim150 Tunisini, Annalisa TA 4 1992 4 Italy Urbino151 Turnbull, Peter W. TP 11 1984 20 UK ManchesterU152 Tyler, Katherine TK 3 1995 3 UK Westmister153 Ulaga, Wolfang UW 3 1997 3 France Lille154 Uusitalo, Olavi UO 5 1994 6 Finland Jyvaskyla155 Valla, Jean-Paul VJP 5 1984 5 France Lyon156 van der Meer, Robert VMR 3 1990 3 UK Strathclyde

40
Name Code Total First Total Country Institution157 Venetis, Karin A. VK 3 1994 3 The Netherlands Maastricht158 Veres, Zoltan VZ 3 1997 3 Hungary Budapest159 Walter, Achim WA 4 1992 4 Germany Karlsruhe160 Waluszewski, Alexandra WAA 4 1986 4 Sweden Uppsala161 Welch, Denice E. WD 3 1991 3 Australia Monash162 Welch, Lawrence S. WL 3 1991 5 Australia Monash163 Wensley, Robin WR 3 1988 3 UK Warrick164 Wilke, Ricky WIR 3 1993 4 Denmark Copenhagen165 Wilkinson, Ian F. WI 9 1984 20 Australia UNSW166 Wilson, David T. WDT 13 1984 17 USA PennState167 Wilson, Kevin WK 7 1993 8 UK Southampton168 Yorke, David A. YD 7 1984 7 UK ManchesterU169 Young, Louise C. YL 8 1991 14 Australia UTS170 Zolkiewski, Judy M ZJ 3 1995 3 UK Manchester171 Zollo, Giuseppe ZG 3 1992 3 Italy Napoli
Note: Country and affiliation is based on earliest conference paper