Social Networks and Social Capital: An Outsider’s View
47
[outsiderpics.doc] Social Networks and Social Capital: An Outsider’s View Edmund Chattoe-Brown Department of Sociology University of Leicester University Road Leicester LE1 7RH [email protected] http://www.le.ac.uk/sociology/staff/ecb18.html Version 0: 02.01.2008 15838 words [DRAFT: PLEASE DO NOT QUOTE WITHOUT PERMISSION.] Abstract This paper explores the relationship between Social Network Analysis (SNA) and attempts to quantify and understand social capital. The first main section of the paper presents the quantitative approach to SNA and demonstrates its general utility. The second main section considers the qualitative approach, reflects on what phenomena we might be trying to “get at” when we talk about social capital and compares these with the kind of information produced by quantitative SNA. As well as specific concerns, this comparison raises a general problem with linking micro (ethnographic) and macro (statistical) accounts of social capital in a way that both identifies social regularities and explains them effectively. By the use of examples, the third section suggests that computer simulation may be an important tool in bridging this gap between the two levels of description. 1. Introduction 1
Transcript of Social Networks and Social Capital: An Outsider’s View
[outsiderpics.doc]
Social Networks and Social Capital: An Outsider’sView
Edmund Chattoe-BrownDepartment of SociologyUniversity of Leicester
University RoadLeicesterLE1 7RH
[email protected]://www.le.ac.uk/sociology/staff/ecb18.html
Version 0: 02.01.2008
15838 words
[DRAFT: PLEASE DO NOT QUOTE WITHOUT PERMISSION.]
Abstract
This paper explores the relationship between SocialNetwork Analysis (SNA) and attempts to quantify andunderstand social capital. The first main sectionof the paper presents the quantitative approach toSNA and demonstrates its general utility. Thesecond main section considers the qualitativeapproach, reflects on what phenomena we might betrying to “get at” when we talk about socialcapital and compares these with the kind ofinformation produced by quantitative SNA. As wellas specific concerns, this comparison raises ageneral problem with linking micro (ethnographic)and macro (statistical) accounts of social capitalin a way that both identifies social regularitiesand explains them effectively. By the use ofexamples, the third section suggests that computersimulation may be an important tool in bridgingthis gap between the two levels of description.
1. Introduction
1

[outsiderpics.doc]
In this paper, I reflect on the relationship between socialnetwork analysis (SNA) and attempts to quantify and understandsocial capital. As someone who did not study sociologyformally, but has spent significant time as an economist andcomputer scientist, I intend to offer a critical (but I hopeconstructive) perspective that comes from “outside” thetraditional sociological divisions of qualitative/quantitativeand interactionist/structuralist. The first main section ofthe paper describes and analyses the quantitative approach toSNA drawing attention to its strengths and offering somecritical comments relevant to what follows. The second mainsection considers the qualitative approach, reflects on whatphenomena we might be trying to “get at” when we talk aboutsocial capital and compares these phenomena with what can belearned using quantitative SNA. This comparison raises ageneral problem with linking micro (ethnographic) and macro(statistical) accounts of social capital in a way that bothidentifies social regularities and explains them. By the useof examples, the third section suggests that computersimulation may be an important tool in bridging this gapbetween the two levels of description as well as elucidatingthe underlying social mechanisms which explain observednetwork structures. The final section concludes with asynthetic statement about the role of SNA in understandingsocial capital.
2. The Quantitative Approach
There is a (nonetheless very useful) sense in which the basicingredients of SNA are purely formal or representational.1 Inthis instance, trying to understand the connections betweensets of individuals, a picture (or at least some form ofrepresentation2) really is worth a thousand words. In thisformal sense, a network is defined as a set of “nodes” and
1 This section is a non-technical attempt to present the ideas behind kindof material found in many SNA textbooks like Knoke and Kuklinski (1986),Degenne and Forsé (1999) and Scott (2000) and and, in a more comprehensivetreatment, Wasserman and Faust (1994). However, the conceptual outlineoffered here does not follow any particular author. It is a deliberatecomposite designed to facilitate non-technical understanding. It is hopedthat the discussion presented here will make the technical textbooks easierto digest and facilitate their critical evaluation.
2

[outsiderpics.doc]
corresponding “relations” between them. For example, the setof nodes might be “all the people in this seminar”. On thiswell-defined set, we can measure any number of relations, eachof which then defines a network. Some of the people in thisroom might be friends, enemies, acquaintances, colleagues atthe same university, former lovers and so on. There is clearlya qualitative dimension to these relationships (to which Ishall return) but for now, I shall follow the quantitativestrand of SNA in explaining how they are identified andmeasured. For example, suppose I were to hand all theattendees a list of the names of people at the seminar and askthem to place a tick by the ones for which they agree with thestatement “I know x”. I could then use the set of responses toconstruct the “knows” network for seminar attendees. Thus, asstated already, a set of nodes and one (or more) relationsdefine a network.
Two things immediately become clear. Firstly, this is a verybroad representation or approach.3 Instead of individuals inthis seminar, the nodes could be the set of MPs in the Britishparliament, members of Al-Qaeda (or the Cosa Nostra), childrenin a classroom, trading nations, web pages, computers and soon. The relations can be similarly diverse: “has paired with”or “has been on a committee with” (for MPs), “sits with” or“discusses work with” (for school children), “trades with”(for nations) and so on. This generality leads to the greatstrength of the approach but also suggests the second issuewhich is that when we talk about social networks, we are dealingwith nodes that are intentional “actors” and thus relationsthat are maintained by those actors from “within” the network.This might be contrasted in two ways with the design of acomputer network: the set of wiring and routers is specifiedby the builders of the network to meet their instrumental goals ofcost, efficiency, robustness and so on. Computers do notdecide how they shall be connected. It is the university ITstaff or users who make this decision and set the goals for
2 In fact, much of the formal strength of SNA is based on matrix algebrabut representation of graphs is also an important tool for humanunderstanding.3 There are discussions within SNA about whether it is a method, a theoryor a representation. In fact, as I shall show, it is all these thingscombined with varying success.
3
[outsiderpics.doc]
the design of the network as a whole.4 Thus social networks aredistinctive both in the intentional nature of their nodes andin the absence of any system level goals imposed “fromwithout”. I shall consider the issue about what we can learnfrom different types of networks later.
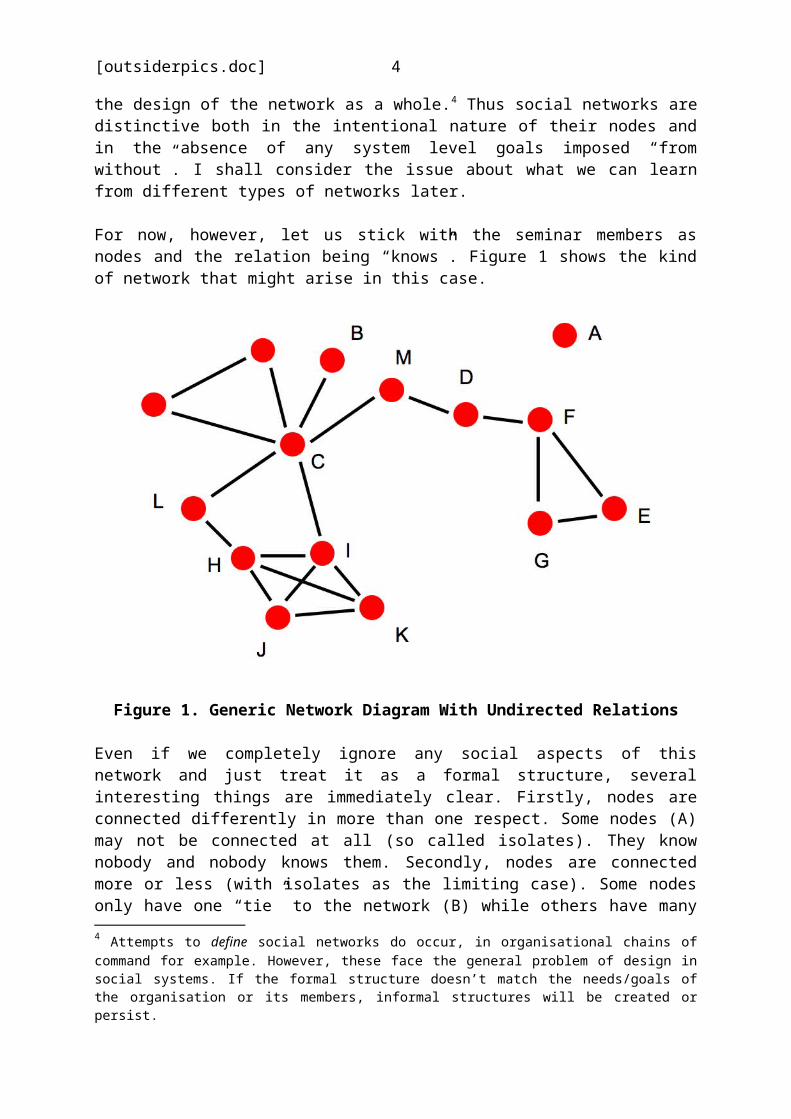
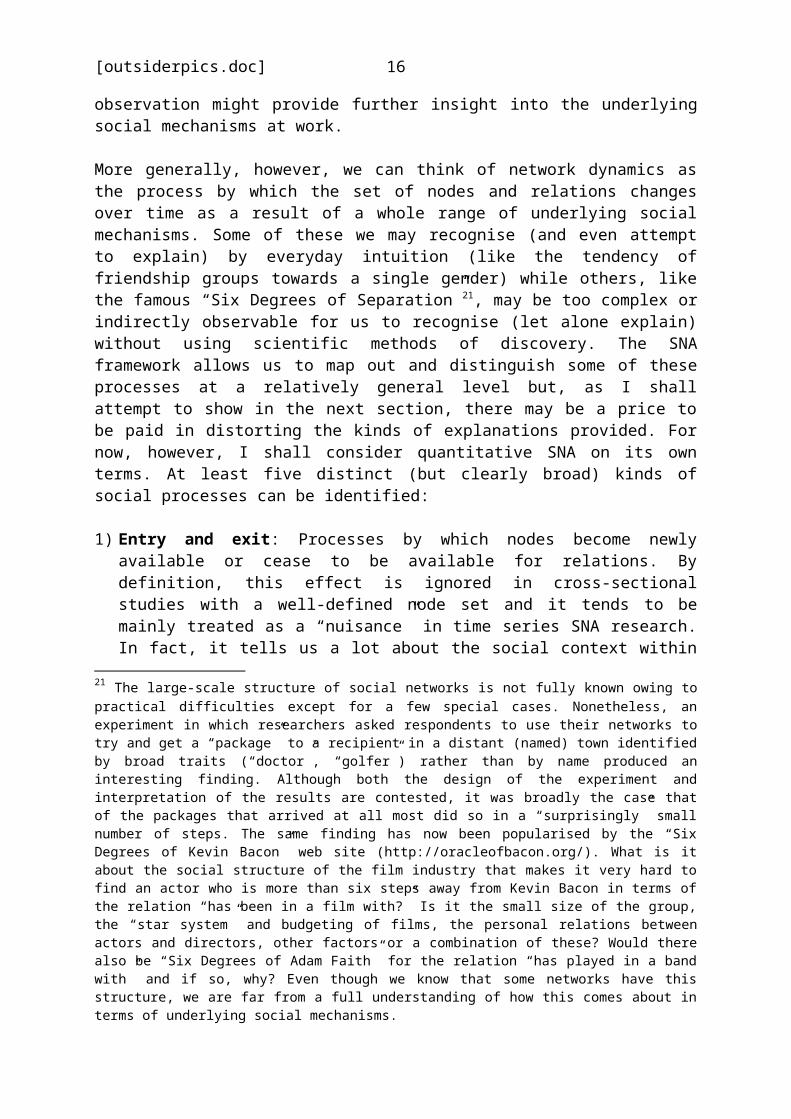
For now, however, let us stick with the seminar members asnodes and the relation being “knows”. Figure 1 shows the kindof network that might arise in this case.
Figure 1. Generic Network Diagram With Undirected Relations
Even if we completely ignore any social aspects of thisnetwork and just treat it as a formal structure, severalinteresting things are immediately clear. Firstly, nodes areconnected differently in more than one respect. Some nodes (A)may not be connected at all (so called isolates). They knownobody and nobody knows them. Secondly, nodes are connectedmore or less (with isolates as the limiting case). Some nodesonly have one “tie” to the network (B) while others have many4 Attempts to define social networks do occur, in organisational chains ofcommand for example. However, these face the general problem of design insocial systems. If the formal structure doesn’t match the needs/goals ofthe organisation or its members, informal structures will be created orpersist.
4
[outsiderpics.doc]
ties (C). Thirdly, although nodes with a single tie can beconnected in only one way (what we might informally call a“twig”), nodes with two ties can be connected in twodistinctive ways and the more ties a node has, the moredistinctively different ways it may be connected. For twoties, the distinctive connection patterns might be called the“chain” and the “triangle” (although they have more formalnames and associated concepts in SNA). In the chainarrangement, a node (D) “bridges” two other nodes (which willthen be connected to other nodes in turn).5 In thisarrangement, if the node we are considering were removed fromthe network (as with the arrest and imprisonment of aterrorist), the rest of the network would be split into twoparts (or sub networks). By contrast, the node underconsideration (E) might be connected to two other nodes thatwere also connected to each other (and to other nodes as wellperhaps). In this case, removing the node under considerationdoes not split the network in two. However, this aspect of thetriangle arrangement also draws attention to another relevantdifference from the chain configuration. Suppose thatsomething “flows” in this network as a result of the structureof nodes and relations: information, money or weapons forexample. Chains only allow a single route from one specifiednode to another (B to F) while triangles allow multiple routes(D to E via F or G). In physical networks, this property isoften known as redundancy and is clearly important in ensuringthat messages are transmitted successfully despite breakdownsand errors (Chattoe and Hamill 2005).6
Even without any consideration of what the nodes and relations“mean”, we have been able to say some interesting things aboutthe structure of the network but once we consider the socialnature of the nodes and relations we can say more. From theperspective of social capital, it is very clear that node C is“better placed” than node B in at least two different ways. Ifanything is flowing through the network (gossip or usefulinformation) it is far more likely to flow via C than B even5 In SNA, it is a common simplifying piece of terminology to refer to thenode you are considering as Ego and connected nodes as one of more“Alters”. Here we could say that Ego “bridges” two Alters.6 To take an everyday example, the UK rail network now has very littleredundancy which makes advice to “use an alternative route” particularlyirritating.
5

[outsiderpics.doc]
if it is not intended for them.7 Secondly, if C were to need a“favour”, it would have six people it could ask directly whencompared with B’s single option. Furthermore, if we consider atypical “search” process for favours, that your friend mayalso ask their friends on your behalf, C clearly reaches thosenodes at one, two, three or more “steps” away quicker than Bdoes with, presumably, more chance of success. (The longer thechain, the more likely individuals are to lose interest in“pursuing” the favour on behalf of an ever more distanceacquaintance or that the final target will no longer have anyinterest in carrying it out for the same reasons.)
Before leaving the simplest possible case, there is one moresituation to consider. What I referred to informally as atriangle is actually called a three-person clique in SNA. Aclique is defined as any set of nodes (EFG) where all possibleties exist (fully connected).8 A four-person clique can also beseen in nodes HIJK. Note however that CIHL is not a clique buta simple tie and a bridge (the CH and IL ties necessary forclique status are missing). Cliques are important boththeoretically and empirically. Theoretically, the existence ofall possible ties means that information moves fast (and bymany alternative routes) within cliques and the pressures ofsocial conformity may be strong in the relative absence ofrole models and information from outside. (In the clique EFG,only F is susceptible to and serves as gatekeeper for anyexternal information or influence.) This has clear links toideas of differential association and deviant subcultures aswell as casting light on things like families (which arealmost invariably cliques).9 Empirically, cliques are importantbecause there is some evidence that “cliques and ties”actually describe the large-scale structure of social
7 The obverse of this is that C is clearly the node to “remove” to break upa terrorist organisation.8 It is possible for a whole network to be fully connected but cliques areusually identified as structures in a larger network as they are in Figure1.9 Some feminist arguments about male power in the family could be recast bysaying that the man active in the labour market is also the gatekeeper forinformation into the family clique. In the limit, he may even keep thelevel of his wages secret from an extremely isolated wife. The analysis ofnon-overlapping circles of friendship based on gender is associated withBott (1957).
6

[outsiderpics.doc]
networks. By this I mean that most individuals are members offriendship or family cliques (usually of fairly small size)while there are relatively few individuals who bridge betweencliques. 10 Famously, Granovetter (1973) has argued that it isthese “bridging” weak ties that are tremendously important inthe long distance spread of information. In a broadly similarvein, Burt (2002) has considered the possibility thatcreativity occurs at the boundaries between organisations andgroups that evolve, through rapid communication and socialpressure, particular ways of doing things.11
Be that as it may, and I will return to the issue of collectednetwork data and inferences from it, I shall now turn toextensions to the basic idea of SNA and the kind of analysisthat derives from them. The test of a good theory is theability to generate a lot more ideas and insight with only afew more refinements and I hope to show that SNA meets thatcriterion.
The first thing we can do is deconstruct the idea of relationspresented so far. The “knows” relation contains an implicitassumption that has been incorporated into Figure 1. If Aknows B then it seems, under one everyday interpretation, thatB must know A. In this context, “knows” would appear to meansomething like “has met to talk to” or “has been introducedto” rather than “knows of”. Even if I have forgotten myconversation with Dr Jones, it is likely that if someone asksme if I know her, I will be reminded and give the correctanswer. This deconstruction draws attention to the possibilitythat relations are not reciprocal (as “knows” appears to beunder a standard interpretation). A may name B as a friendwithout B naming A. Everyone may know of the eminent ProfessorSmith by reputation while, of course, she does not know of allher admirers. This addition to the theoretical armoury has twoconsequences, one immediate and one more distant (which willbe tackled later in the section). The immediate implicationcan be seen in Figure 2.10 This can almost be seen as a matter of definition but not quite. Ifcliques are defined as fully connected subsets of nodes in a network theneither the network is a single clique or else the density of ties betweencliques must be lower than that within. However, the conception of the“cliques and ties” network is that this density is “significantly” lower.11 This also has disadvantages, as in the case of “groupthink” (Janis 1982).
7
[outsiderpics.doc]
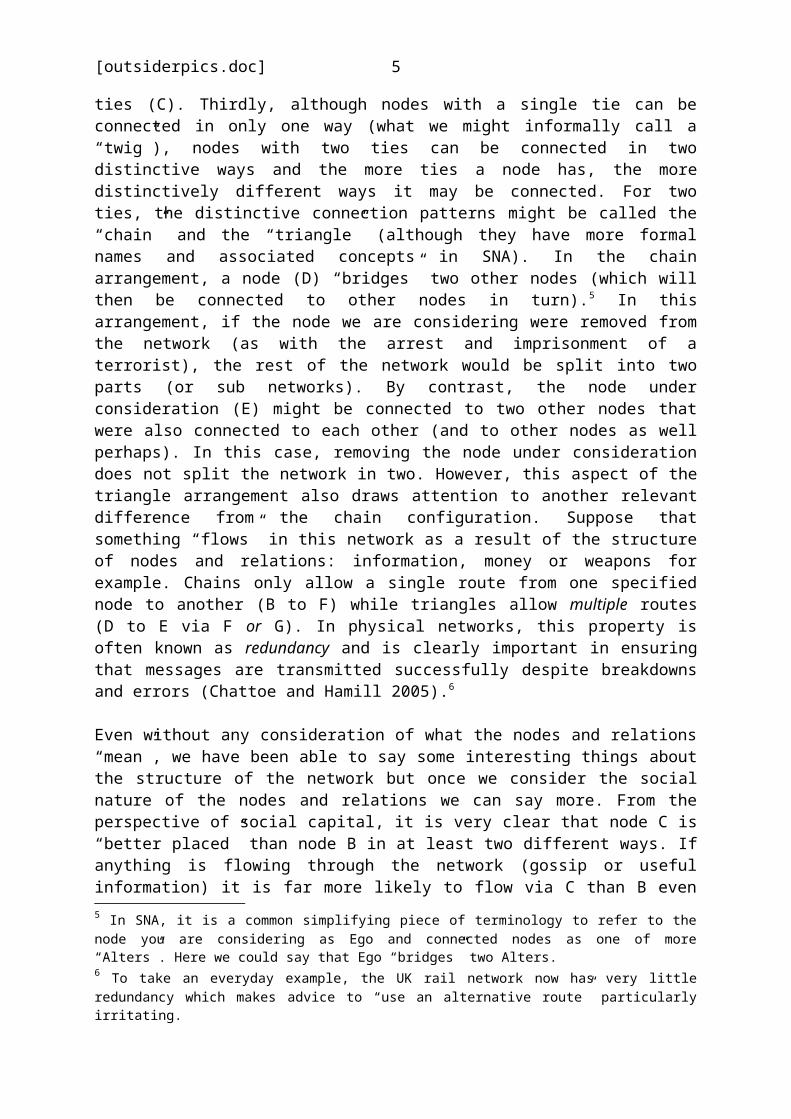
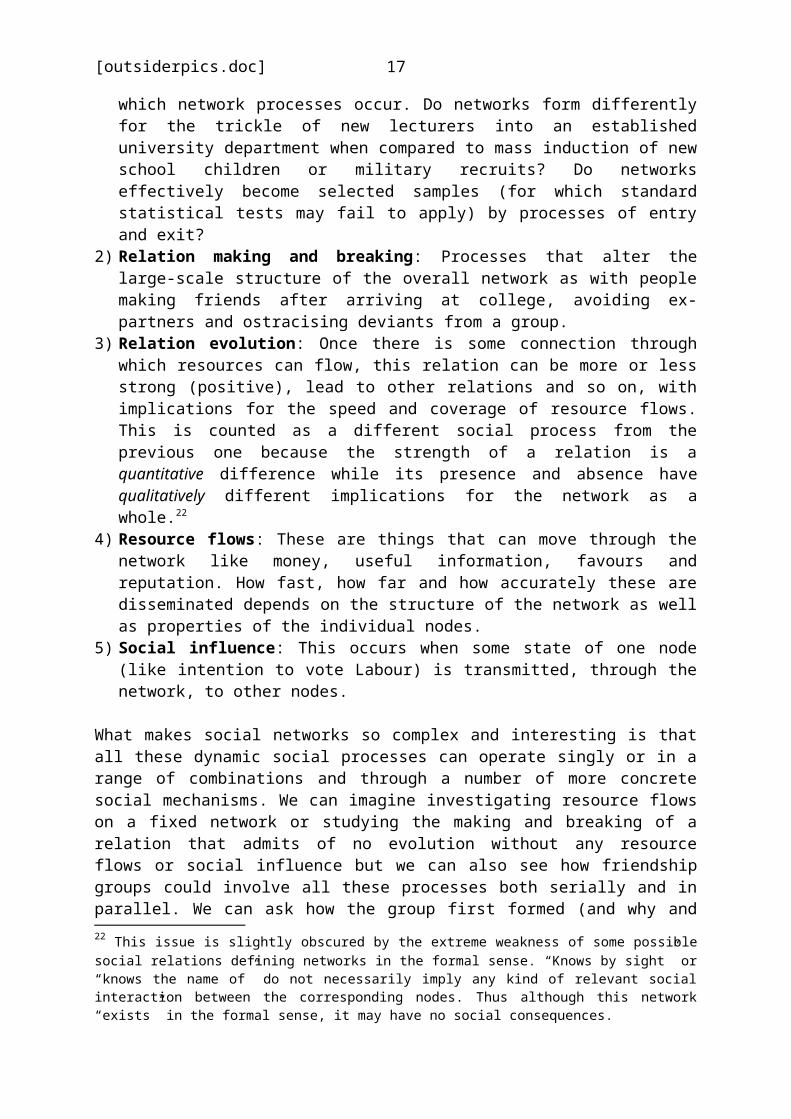
Figure 2. Generic Network Diagram With Directed Relations
In this diagram we consider the effect of a directed relationlike “is friends with”. This relation is often (but notinvariably) reciprocated and this turns out to have importantconsequences. For node L, for example, nodes C and H are namedas friends but neither is reciprocated. The result is that, asfar as any flows in the network go, C has now become even more“important” or “powerful” because that node effectively actsas gatekeeper for all relations between HIJKL and the rest ofthe network. This is an interesting sociological insight. By“withholding” friendship from L (whether deliberately oraccidentally), C enhances its own structural importance! Thissuggests how knowledge of, and actions within, networks can beextremely Machiavellian in a way we recognise only too wellfrom “office politics”. The other non-reciprocal friendship isbetween D and M and because D is a bridging node, informationcan flow from DEFG to the rest of the network but not viceversa. A “personal affair” between D and M turns out to haveimportant ramifications for events in the network as a whole.12
12 Another set of refinements that can be added and understood relativelystraightforwardly are signed relations or those measuring intensity. We canask “How much do you like x on a scale from 1 to 5?” or “How much do you
8

[outsiderpics.doc]
This is again a sociologically interesting conclusion, linkingindividual traits and macro-structural outcomes (people in the“wrong” half of the network being disadvantaged in job searchfor example) in a novel way. It is this kind of insight thatjustifies the claim by SNA that it really is a distinctivemethod and way of looking at the social world.
The second thing we can do is to introduce multiple relations(multiplexity). Again, we will have to consider the fullramifications of this in the discussion of the qualitativeapproach and later in this section but for now let us followthe relatively standard quantitative treatment. Consider tworelations “knows” and “would discuss politics with” which bothdefine networks on the same set of nodes and where the secondrelation is expected to measure closer intimacy andfamiliarity. We would be reasonably confident, given what weknow about the social world and the meanings of the terms thatthe second relation would be a strict subset of the first. (Inorder to discuss politics you have to know someone but you donot discuss politics with everyone you know.) By contrast, ifwe were to define the relations “loves” and “hates”, leavingaside some interesting cases for psychotherapy, we wouldexpect these relations to be completely disjoint.13 (If Egodisplays one relation with Alter, it does not display theother.) With multiple relations, we can ask a whole new set ofquestions about the mappings between different networks(subset, disjoint or random: no apparent pattern) which tellus something, although not perhaps all that we would like,about the underlying social processes. I shall return to thispoint.
The third thing we can do is deconstruct the notion of nodes.Clearly, the people in this seminar have a number ofrecognisably “relational” attributes (like knowing orcolleague status in departments) but they also have what are
like x on a scale from -2 to +2?” In these cases, we might assume thatinformation or favours were more likely to flow from stronger positiverelations (rather than all or nothing) and that negative relations mightimpede the flow of helpful information probabilistically (rather than stopit completely). However, the actual mechanisms involved would need to beexplored empirically. I shall return to this point.13 There is also a design question. Would this be a sensible way to measurerelations rather than the approach used in the previous footnote?
9
[outsiderpics.doc]
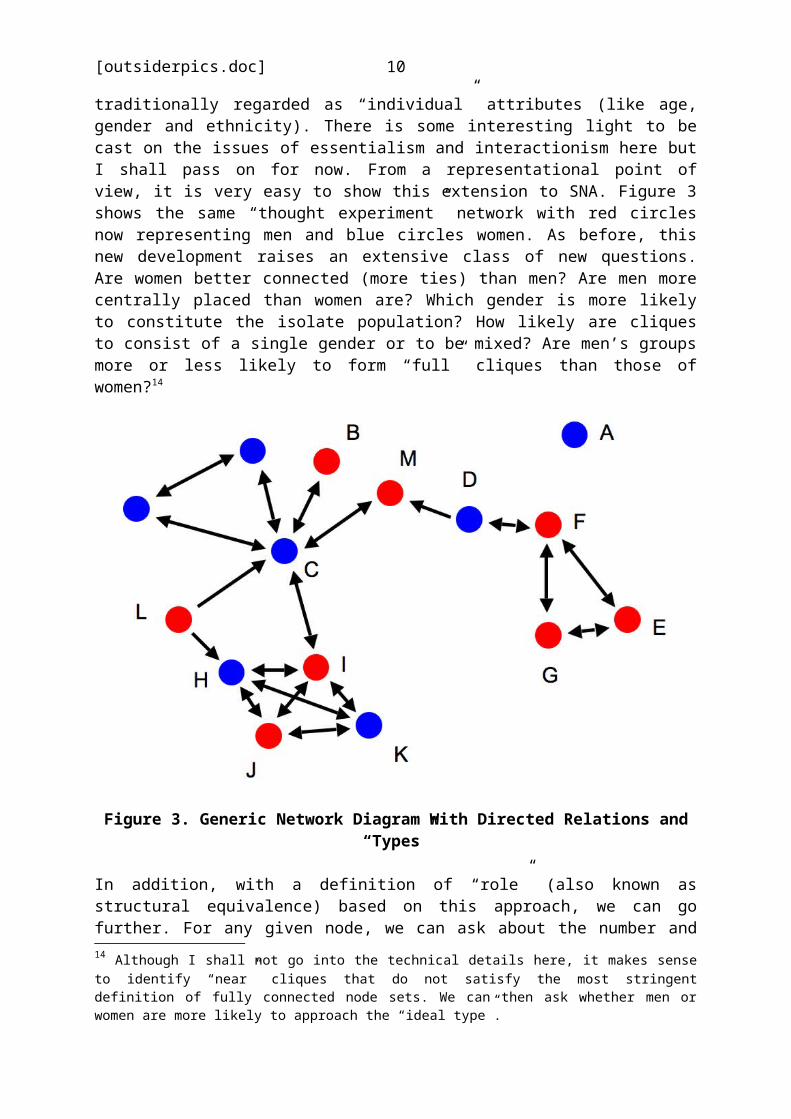
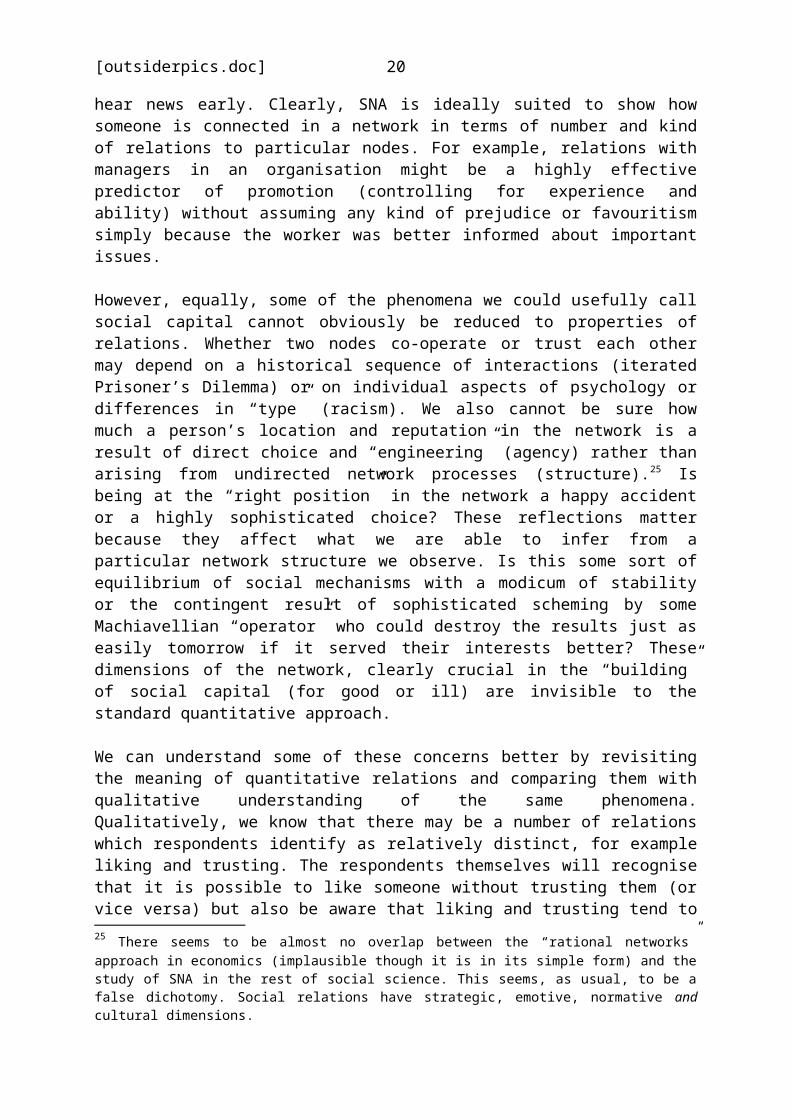
traditionally regarded as “individual” attributes (like age,gender and ethnicity). There is some interesting light to becast on the issues of essentialism and interactionism here butI shall pass on for now. From a representational point ofview, it is very easy to show this extension to SNA. Figure 3shows the same “thought experiment” network with red circlesnow representing men and blue circles women. As before, thisnew development raises an extensive class of new questions.Are women better connected (more ties) than men? Are men morecentrally placed than women are? Which gender is more likelyto constitute the isolate population? How likely are cliquesto consist of a single gender or to be mixed? Are men’s groupsmore or less likely to form “full” cliques than those ofwomen?14
Figure 3. Generic Network Diagram With Directed Relations and“Types”
In addition, with a definition of “role” (also known asstructural equivalence) based on this approach, we can gofurther. For any given node, we can ask about the number and14 Although I shall not go into the technical details here, it makes senseto identify “near” cliques that do not satisfy the most stringentdefinition of fully connected node sets. We can then ask whether men orwomen are more likely to approach the “ideal type”.
10
[outsiderpics.doc]
nature of its ties and the nature of the nodes those tiesconnect. For example, E (as a man) has two “knows” ties andthese are both to men. D (who is a woman) also has two “knows”ties both to men. Does having this kind of “role” (orstructurally equivalent position) in the network impact on theindividual? How many unique positions exist in the networkthat may influence the similarity of otherwise distinctindividuals? To take an extreme example, we can see howmilitary ranks offer highly standardised roles. All sergeantsmay have the same number of privates under their command andbe accountable to an officer of the same rank (if not actuallythe same person). Does this fact about the military hierarchygo any way to explaining a “sergeant point of view” or“sergeant culture” if such exists? Could this approach be usedto make more concrete such research issues as the “sharedclass interest” across superficially different productionworkers and the choice that women in the police face aboutwhether to join or resist the “macho cop culture” based ontheir network positions in the organisation? Another test ofthe quality of a theory is its ability to suggest interestingresearch questions and SNA would appear to pass.
Role is thus important in drawing our attention to thepossibility both of structural (as opposed to individual)similarity and its differing degrees. At one extreme, in anarmy of highly disciplined automata, it might be role that wasa major determining factor. In a “cliques and ties” friendshipnetwork, it could be argued that it is not just individualdifferences but the scarcity of recognisable roles (girl“mascot” in a group of rowdy boys?) that explains therelatively unique nature of personal experience.15 In fact,Figure 3 identifies relatively few distinct roles. G and E arestructurally equivalent, as are their female equivalents inthe other three-person clique. However, there are nostructurally equivalent positions in the four-person clique(despite its gender balance) because all four members areeither differently connected to the rest of the network ordiffer in the gender distribution of those they are connected
15 The well known Belbin personality test is based on the idea that groupsmay be more effective when based on types with a mix of individual attributesi. e. “plant” or “completer-finisher”.
11
[outsiderpics.doc]
to. Apart from that (and taking into account non-reciprocatedfriendships) all other nodes are structurally unique.
This leads us to an important conceptual issue about thedistinctive methodological status of SNA. We typically definesuch things as roles and “bridges” in relatively local terms.In saying that two people occupy the same role, we areinitially looking only at their direct connections. But,clearly, the wider we “cast the net” in terms of similarity,the less likely we are to find it. In the limit, bydefinition, every position is structurally unique in thenetwork taken as a whole. Similarly, in saying that M is a“bridge”, we are saying more than just that that node has twoconnections to Alters not connected to each other. We are alsousing knowledge of the whole network to support the claim thatif node M were removed, the network would be split into twosub networks. If K and G were linked, M would no longer be abridge in the strict sense but it would still be “morebridgey”16 than B. However, this intuitive sense of“bridgeyness” is harder to operationalise as a static measureon the network because the existence of a connection between Gand K has no local implications for the structure round M andD. It is a “distant” or “non local” phenomenon.17 The lesson tocarry away from this is that there is a tension betweencharacteristics of networks that can be defined in relativelylocal terms (like cliques) and those that rely implicitly orexplicitly on data about the structure of the whole network.This tension does not just manifest itself in definingeffective measures of network structure but also in how we goabout explaining structural phenomena. Whether “local” measurescan tell us anything useful about the state of the individual16 I am deliberately avoiding both the technical vocabulary of SNA and anyformal sounding terminology here to reflect my emphasis on intuitionsrather than methods.17 By contrast, it would be much more persuasive to measure “bridgeyness”using a dynamic measure. If messages were started at random points in thenetwork and allowed to travel (also at random), deletion of different nodeswould have different effects on their likelihood of reaching any givendestination node. Some “aggregate” of these effects over the whole set oforigins, destinations and deletions would characterise how “bridgey” a nodewas. It is presumed that local static measures can be effective proxies forthis dynamic approach. In the case of “distant” effects such as thatdescribed, I would question this assumption (and simulation would give usthe tool to test it explicitly).
12

[outsiderpics.doc]
may depend on how the whole network is connected up and whatthe mechanisms of influence are. For example, standardstatistical analysis sometimes makes use of the ego network asan explanatory variable just like class and gender. One canjust “count ties” when trying to explain things like mentalhealth problems arising through lack of social support.However, this measurement scheme contains an implicit claimabout what the mechanism of social support is (“the more themerrier”) and other mechanisms are also plausible: “When Ifall out with my close friends, I need a different point ofview to give perspective”. Thus, there is a deep questionabout the extent to which local measures of network propertiescan tell us something about the network structure as a wholeand this question is fundamental to understanding how networksactually “work” as social mechanisms. This brings me to thefinal point in this section, about the dynamics of networks.
Although I hope I have shown that various additions to the SNAapproach discussed so far raise different (and interesting)questions directly relevant to social science, I have had tobe somewhat selective in my presentation in the interests ofclarity. The final extension to the model is simultaneouslythe one that draws all these ideas together and is in dangerof making the whole edifice of formal SNA collapse. In theremainder of this section I shall consider the positive sideof this development, postponing the critical appraisal untilthe next section.
So far, I have presented social network data in the way thatthey are usually collected: as cross-sections. In addition,but much more rarely owing to technical and practicaldifficulties, time series data is collected repeatedly atweekly, monthly or yearly intervals. For now, however, let uslimit consideration to cross-sectional data. The importantthing to realise is that we are seeing a snap shot of anunderlying dynamic social process. The patterns of nodes andrelations we observe at any moment in time are outcomes ofsocial interactions, environmental pressures, organisationalmemberships, formal roles, geography and so on. We can easilysee this by revisiting the developments to the basicpresentation of SNA that we have already considered.
13
[outsiderpics.doc]
Beginning with the nature of relations and the possibility ofmultiplexity we can see how, for example, non-reciprocalrelations are likely to break down or only to survive inparticular structural contexts. If I name someone as a friendand they don’t name me then, assuming I have any choice in thematter, I will either spend more time with those who do alreadyreciprocate my friendship or seek out those who might do so.This will strengthen the reciprocated relations and weaken thenon-reciprocated ones other things being equal. We would thusexpect unbalanced friendships to exist when people have fewerties (“new kid” or “only friend” effects), when they need tomaintain relations for other reasons (“useful person to know”,“don’t get on the wrong side of him”) or when the structure ofa clique (or other social structure) indirectly enforces it.(If I don’t “rub along with” B and C, even though I reallyonly like D and E, I am likely to find myself out of thegroup.) The idea of multiplexity develops this insightfurther. If we see multiple relations as potentially capturingincreasing degrees of closeness or intimacy between nodes, wecan regard one relation as “generating” (or potentiallyinhibiting) another.18 Two people currently in the “knows”relation to each other are much more likely to achieve the(more intimate) “would discuss politics” relation at somepoint in the future than two people who aren’t. Conversely,and this links to the discussion of mappings between networksabove, the “is married to” relation typically ought to inhibitthe formation of “has had sex with” relation with other nodesat any point after the marriage. However, the probabilisticnature of this insight (underlain by a sequence of socialinteractions) introduces path dependence and complexity intothe dynamics of the network.19 I may find myself involuntarily18 This is a simplified view. It seems quite plausible that there might beone or more “independent” kinds of relation underlying those measured bySNA for example, trust and liking. I shall return to this point.19 This raises an interesting theoretical question. Suppose we have a set ofunderlying social mechanisms generating a network. Under what circumstancesdoes this set of social mechanisms generate an identical network (samenodes in same relations to each other), a measurably similar network (moreor less similar aggregate network properties but resulting from somepermutation of nodes and or relations) and arbitrarily different networks(random versus cliques and ties). The relevance of this question arises inthe context of data collection. If we compare the social networks in twoapparently similar law firms (or, equally, the same law firm after a twoyear gap) and find them different, what have we learned? Is this the
14

[outsiderpics.doc]
in a kinship relation to a number of people I loathe whileloving someone my family regards as unsuitable. In thesecircumstances, which set of nodes and relations willultimately shape the outcome? Will I sever ties with my familyand start a new life or will social pressure I feel I cannot“dodge” cause me to give up the relationship? This may welldepend quite precisely on the structure, multiplexity andspecific relations within my network, made up of friends,family and others. Can my family not only disapprove but cutoff my access to information and financial resources if Idon’t do what they want? Can my friends substitute these tosupport me both personally and emotionally? What is thesequence of meetings, bargains, threats, recriminations andother interactions which generates the outcome we observe? Itis clear that this social process is a lot more complex andcontingent than the kind of “ethnicity causes educationaldisadvantage” accounts often provided in quantitativeresearch.
Similar insights arise when we consider the implications oftypes for network dynamics. What we observe may be that singlesex cliques and equally balanced ones are relatively commonwhile unbalanced ones are relatively rare. We can easilyhypothesise (for example) that men and women like to talkabout different things and spend their leisure time indifferent ways and it is this that might break ties inunbalanced groups and remake them in a single sex form.20
Equally, we could imagine that evenly balanced mixed sexgroups might have their own advantages and activities thathelped to stabilise them with neither gender norm “dominating”the organisation of the group. However, it would also beinteresting if, for example, balanced mixed sex groups werecommoner amongst those not in long term relationships and this
unfolding of an stable underlying social process or not? In evolutionarybiology, this debate is referred to as the question about what happens ifyou “rerun the tape” of evolution. Do you get the same animals, or the sameniches filled (carnivores and herbivores) or what?20 Interestingly, this is a kind of traditional functionalist account ofclique formation. The hypothesised pressures that reconfigure mixed sexcliques are absent from single sex cliques and these are, therefore, theobserved dominant form. In this account, single sex cliques are neither adeliberate goal of individuals nor in any way “morally” superior. They arejust more robust in the same way that successful animal species are.
15
[outsiderpics.doc]
observation might provide further insight into the underlyingsocial mechanisms at work.
More generally, however, we can think of network dynamics asthe process by which the set of nodes and relations changesover time as a result of a whole range of underlying socialmechanisms. Some of these we may recognise (and even attemptto explain) by everyday intuition (like the tendency offriendship groups towards a single gender) while others, likethe famous “Six Degrees of Separation”21, may be too complex orindirectly observable for us to recognise (let alone explain)without using scientific methods of discovery. The SNAframework allows us to map out and distinguish some of theseprocesses at a relatively general level but, as I shallattempt to show in the next section, there may be a price tobe paid in distorting the kinds of explanations provided. Fornow, however, I shall consider quantitative SNA on its ownterms. At least five distinct (but clearly broad) kinds ofsocial processes can be identified:
1) Entry and exit: Processes by which nodes become newlyavailable or cease to be available for relations. Bydefinition, this effect is ignored in cross-sectionalstudies with a well-defined node set and it tends to bemainly treated as a “nuisance” in time series SNA research.In fact, it tells us a lot about the social context within
21 The large-scale structure of social networks is not fully known owing topractical difficulties except for a few special cases. Nonetheless, anexperiment in which researchers asked respondents to use their networks totry and get a “package” to a recipient in a distant (named) town identifiedby broad traits (“doctor”, “golfer”) rather than by name produced aninteresting finding. Although both the design of the experiment andinterpretation of the results are contested, it was broadly the case thatof the packages that arrived at all most did so in a “surprisingly” smallnumber of steps. The same finding has now been popularised by the “SixDegrees of Kevin Bacon” web site (http://oracleofbacon.org/). What is itabout the social structure of the film industry that makes it very hard tofind an actor who is more than six steps away from Kevin Bacon in terms ofthe relation “has been in a film with?” Is it the small size of the group,the “star system” and budgeting of films, the personal relations betweenactors and directors, other factors or a combination of these? Would therealso be “Six Degrees of Adam Faith” for the relation “has played in a bandwith” and if so, why? Even though we know that some networks have thisstructure, we are far from a full understanding of how this comes about interms of underlying social mechanisms.
16
[outsiderpics.doc]
which network processes occur. Do networks form differentlyfor the trickle of new lecturers into an establisheduniversity department when compared to mass induction of newschool children or military recruits? Do networkseffectively become selected samples (for which standardstatistical tests may fail to apply) by processes of entryand exit?
2) Relation making and breaking: Processes that alter thelarge-scale structure of the overall network as with peoplemaking friends after arriving at college, avoiding ex-partners and ostracising deviants from a group.
3) Relation evolution: Once there is some connection throughwhich resources can flow, this relation can be more or lessstrong (positive), lead to other relations and so on, withimplications for the speed and coverage of resource flows.This is counted as a different social process from theprevious one because the strength of a relation is aquantitative difference while its presence and absence havequalitatively different implications for the network as awhole.22
4) Resource flows: These are things that can move through thenetwork like money, useful information, favours andreputation. How fast, how far and how accurately these aredisseminated depends on the structure of the network as wellas properties of the individual nodes.
5) Social influence: This occurs when some state of one node(like intention to vote Labour) is transmitted, through thenetwork, to other nodes.
What makes social networks so complex and interesting is thatall these dynamic social processes can operate singly or in arange of combinations and through a number of more concretesocial mechanisms. We can imagine investigating resource flowson a fixed network or studying the making and breaking of arelation that admits of no evolution without any resourceflows or social influence but we can also see how friendshipgroups could involve all these processes both serially and inparallel. We can ask how the group first formed (and why and22 This issue is slightly obscured by the extreme weakness of some possiblesocial relations defining networks in the formal sense. “Knows by sight” or“knows the name of” do not necessarily imply any kind of relevant socialinteraction between the corresponding nodes. Thus although this network“exists” in the formal sense, it may have no social consequences.
17

[outsiderpics.doc]
when members left), how strength of feeling between membersebbs and flows and why, what effects group membership has ongood and bad events23 and how membership of the group impactson congruence of attitudes and behaviour. We can also attempt,as Kirke (2004) does, to identify the relative strength ofdifferent effects in particular contexts. Do adolescentsmokers and non-smokers tend to occupy different cliquesprimarily because social influence turns non-smokers intosmokers or because smokers tend to leave cliques dominated bynon-smokers and perhaps vice versa?
I shall return to the issues raised by the existence ofmultiple social mechanisms that create the cross-sectionalpatterns we observe in the next section. However, in thissection, I have tried to make two claims that are importantfor what follows. Firstly, that SNA is a distinctive andheuristically fertile way of looking at the world that cannotsimply be disregarded for any conceptual or methodologicalweaknesses from which it suffers. Secondly, that there may bechallenges in linking the kind of data typically collected inSNA to the kinds of explanations which should be sought insocial science. The next section is focussed around the secondconcern.
3. The Qualitative Approach
In this section I shall consider three linked questions. Whatset of phenomena are we referring to when we talk about socialcapital? What is it that SNA measures and to what extent doesthis capture the phenomena we can usefully call socialcapital? What do we have to do before we can reasonably claimto have “explained” the existence of social capital and itsapparent desirability? I shall tackle the questions in thatorder, which seems to me to involve dealing with the easiestone first.
Without too much difficulty we can think of several distinctways in which a person may be well (or poorly) placed in asocial network based on the kinds of things we might observein an ethnographic setting with some help from the conceptualframework outlined above. Our paragon of social capital has
23 For example, finding a job or getting help when you are sick.
18

[outsiderpics.doc]
always heard the latest news or gossip. She always has the“right” contacts to deal with any impending problem or realiseany forthcoming opportunity. Not only are her direct contactspleasant and useful to her but she also seems to be in theright place with respect to the wider network. She is able toput appropriate people in contact to their advantage or pleasureand not just her own, thus winning popularity. In addition,most people are disposed to speak well of her and to trust hereven if they don’t know her directly and this is clearly whatwe mean by having a good reputation. When others attempt toquestion that reputation (even based on honest reporting ofdirect experience), their views may be disregarded or, on theassumption that they are negatively predisposed, will be takento reflect more on them than on her.24
In a highly confusing literature, each of these accounts (andalmost all the possible combinations of them) has been putforward as “the” definition of social capital. Some accountsfocus mainly on network structures, other on the ability ofconnected individuals to exchange favours or engage incollective activities, still others on “brokerage” orprivileged access to information and yet others on generallevels of beneficial norms like co-operation or trust in thenetwork as a whole. All of these relatively conceptuallydistinct (but nonetheless potentially connected) phenomena areinteresting and worthy of study within the remit of “socialcapital” but I should like to argue that trying to establishthe meaning of social capital by definition is doomed both tofailure and to unhelpfulness. Before I do this (in response tothe last question posed above), I would like to tackle thesecond question. How well does SNA capture the kinds ofphenomena described above as “qualitative” aspects of socialcapital?
As I have already suggested, subject to some concerns aboutstatic measures and “whole network” effects, we would hopethat SNA measures like centrality would capture the ability to24 This raises an interesting possibility. Is truth a structural property?Do some kinds of social networks allow accurate information to propagateand replace inaccurate information while others inhibit this process? Weaspire to the former in the “invisible college” networks of academics(Crane 1972) but how would we recognise the latter, dysfunctional,networks?
19
[outsiderpics.doc]
hear news early. Clearly, SNA is ideally suited to show howsomeone is connected in a network in terms of number and kindof relations to particular nodes. For example, relations withmanagers in an organisation might be a highly effectivepredictor of promotion (controlling for experience andability) without assuming any kind of prejudice or favouritismsimply because the worker was better informed about importantissues.
However, equally, some of the phenomena we could usefully callsocial capital cannot obviously be reduced to properties ofrelations. Whether two nodes co-operate or trust each othermay depend on a historical sequence of interactions (iteratedPrisoner’s Dilemma) or on individual aspects of psychology ordifferences in “type” (racism). We also cannot be sure howmuch a person’s location and reputation in the network is aresult of direct choice and “engineering” (agency) rather thanarising from undirected network processes (structure).25 Isbeing at the “right position” in the network a happy accidentor a highly sophisticated choice? These reflections matterbecause they affect what we are able to infer from aparticular network structure we observe. Is this some sort ofequilibrium of social mechanisms with a modicum of stabilityor the contingent result of sophisticated scheming by someMachiavellian “operator” who could destroy the results just aseasily tomorrow if it served their interests better? Thesedimensions of the network, clearly crucial in the “building”of social capital (for good or ill) are invisible to thestandard quantitative approach.
We can understand some of these concerns better by revisitingthe meaning of quantitative relations and comparing them withqualitative understanding of the same phenomena.Qualitatively, we know that there may be a number of relationswhich respondents identify as relatively distinct, for exampleliking and trusting. The respondents themselves will recognisethat it is possible to like someone without trusting them (orvice versa) but also be aware that liking and trusting tend to25 There seems to be almost no overlap between the “rational networks”approach in economics (implausible though it is in its simple form) and thestudy of SNA in the rest of social science. This seems, as usual, to be afalse dichotomy. Social relations have strategic, emotive, normative andcultural dimensions.
20
[outsiderpics.doc]
influence each other positively. How (and why) individuals putothers into different trust and liking categories26 may be acomplex and nuanced process. Ask yourself whether you can sayif you trust one good friend more than another and, if so,why? Quantitative SNA faces at least two problems in thisregard. The first, which is general to all quantitative datacollection for potentially “qualitative” phenomena, is how todesign and ask questions that “tap into” the relevantrelations and categories as defined by respondents.27 Can we ask oneperson how much they like (or trust) someone else effectivelyand, if so, what do we make of the results? Is there a dangerthat a question which “sounds like” it should be about trustto the researcher is actually tapping into liking as far asthe respondent is concerned? How would we tell that this“mistake” had occurred?28 The second problem, which is moredifficult still, is how to ask a set of questions that mightconstitute an effective “scale” for a relation. If we areinterested in trust, what three (or ten) questions do we askthat capture the full range of the phenomenon from a vaguebenevolent disposition to a willingness to die at the word ofanother?29 Quantitative SNA apparently gains something inobjectivity from focusing on relations defined by relativelyunambiguous questions but there is a price to be paid inlinking the answers to these questions both to each other (inthe case of multiplexity) and to the underlying phenomenawhich we aspire to measure.30
26 These may or may not form something like a scale.27 Effective quantitative research solves this problem in several ways.Sometimes it simply admits its own inadequacy: “How many children do youhave?” is a suitable quantitative question. “What is your identity?” isnot. On other occasions, a question can be made effective by carefulwording. Compare “How many children do you have?” with “How many childrenhave you helped to bring up and shared a home with for a year or more?” 28 In particular, could we then tell whether our theory was correct but ourdata collection was faulty rather than vice versa?29 Or is it feasible to ask explicitly for a scaled response to such a relatively subtle question?30 It appears to be believed in SNA that “Do you know Jones?” is lessproblematic than “Is Jones your friend?” as a “quantitative” question. Froma qualitative perspective, however, it may be that a willingness to callsomeone your friend has more explanatory bite and less variation in meaningafter all.
21
[outsiderpics.doc]
This issue can usefully be illustrated using the example offavours which is directly relevant to social capital. Asregards the issue of measurement, should we ask people whetherthey would do favours for each other or whether they have? Theformer faces the standard difficulty that intentions don’tseem to predict outcomes very well. The latter may concealimportant historical detail. I may be perfectly happy to lendmoney to Jones as far as my disposition towards him goes butonly once he happens to have repaid the money he already owesme. What could we safely conclude from these questions, eithertaken together or separately about the underlying state of therelationship? Would we have any sensible intuitions about therelationship between the two networks on the same set ofnodes? Does this attempt at quantification – as qualitativeresearchers often argue – actually defeat itself as a piece ofmeasurement? As regards the issue of scaling, what do we sayabout the offer of a lift to work, a day of child care, apiece of helpful advice, the loan of £10 (or a lawnmower), theemail address of a useful friend or a month crashing on thesofa? Taken in isolation, a network defined by a singlerelation on a set of nodes may appear both relativelyunproblematic and encouragingly “objective” but consideringthe relations between relations (as it were) and betweenrelations and underlying social processes casts at least somedoubt on this initial impression.
There are two issues here, one relatively straightforward andone much more problematic. The straightforward issue is havingsome idea how “complicated” a social phenomenon is beforedeciding whether it is appropriate to try and measure itquantitatively and expect to find out anything useful.Although much social science pays lip service to the idea ofqualitative research as (if nothing else) a useful preamble toeffective questionnaire design, in practice, qualitativeresearch is either ignored or treated as the only possibleapproach on largely ideological grounds. Quantitative SNAseems to give rather little attention to validation ofpotential scales or qualitative research that might call itscategories into question (or help refine them).31
31 A subsidiary difficulty may be the relative absence of psychologists inSNA. Effective tools for measuring mental states (if they exist at all) aredifferent from the kinds of questions typically asked in social survey
22
[outsiderpics.doc]
The more problematic issue is how we offer any sort ofconvincing explanation in the social sciences and thisdifficulty (based as it is on competing paradigms ormethodologies) cannot be resolved but only considered.
For large scale quantitative research based on survey data,the focus is on identifying patterns conditional on aparticular system of measurement. For example, the tendency ofclasses (however they are defined) to self recruit isinstantly recognisable in a mobility table where the elementsin the leading diagonal are significantly larger than the nullhypothesis of random allocation would suggest. However, theactual social mechanisms by which this occurs usually cannotbe read from the resulting pattern without further research.For example, are all individuals aspiring to higher classesbut largely kept out by the incumbents or is the majordeterminant of self recruitment the ability of parents toinstil their own preference ordering over the class system intheir children? Perhaps many other combinations of socialmechanisms would produce this observed pattern (or one ratherlike it given the noise in the data) and if so, how do wedecide which combination is actually operating in a particularsetting? (What other distinctive patterns should we look forto differentiate competing theories?32 The observed pattern maynot offer any help in this regard.33) Furthermore, this concernaffects the interpretation of parameters within the model. Ifwe find that the relative social mobility from working classand salariat into salariat has a particular numerical value,
research even when investigating “attitudes”. It could be argued that SNAis trying to do one task using tools developed for another.32 For example, if all classes aspire to upward mobility but are blocked, itmay be the pattern of relatively scarce long range mobility thatdifferentiates this hypothesis from the one stating that parents try toshape the preferences of their children. “The higher the better” impliesthat at least some individuals will manage to get all the way to the “top”since they want to while “my class right or wrong” might suggest that, atmost, children end up one class away from their parents and simplydisregard all other classes. However, data on long range mobility willrequire a large sample and a “rich” class schema. A three way mobilitytable simply destroys the evidence needed to differentiate these competinghypotheses.33 Another way of putting this is to say that there is no sensible butsimple null hypothesis against which other hypotheses can be compared.
23
[outsiderpics.doc]
what do we make of that? Is this some sort of stable socialfact and if so, how stable? Is it just a contingent outcome oflots of social mechanisms operating in parallel that will bedifferent next month or next year and therefore not a greatdeal of use? Are we, in fact, looking for the regularities insociety in the correct places or confusing the model withreality and reifying parameters which actually have nounderlying social existence?
As is well known, qualitative research takes a very differentstand on all these issues, arguing that the details andvariability of social interaction are not simply “noise”overlaying the large patterns in society (like socialmobility) but, instead, are precisely what shapes it. Theregularities in society do exist in the culture and patterns ofinteraction in individuals, groups and organisations. It isthese interaction processes which cause the patterns weobserve statistically, not the parameters of a simplifiedmodel which simply measure it. Unfortunately, just asmechanisms cannot be read off from large scale patterns, it isalso the case that large scale patterns cannot be read offsimply from mechanisms. If law firms tend to be organised justso, what are the implications concerning the aggregate demandfor lawyers? An ethnographer typically cannot say and,interestingly (unlike statisticians), most ethnographersnowadays do not even try to produce middle range theories thatgeneralise from their observation of specific settings.
SNA finds itself awkwardly placed between these two approachesto explanation. Quantitative SNA (like survey research) triesto summarise social mechanisms by parameters which, as aresult, are likely to be unstable, failing as they do toreflect “real” social regularities in practice and culture.(It is not the fact of knowing Jones in 1985 that “causes”loving his daughter in 1988. Instead, these are just twowidely separated measurements of the underlying sequence ofstructured interactions that connect the two events.)Qualitative SNA recognises the difficulty of measuringrelations like trust but often, in the process, disablesitself from using all but the most basic descriptive measuresdeveloped by quantitative SNA in analysing the kind of data itcollects. At the same time, it is unable to show how the
24
[outsiderpics.doc]
“large scale” structure of networks (like “cliques and ties”or “six degrees”) might arise from individual interactions.34
A further awkwardness results from the level of description atwhich quantitative SNA operates. For all its failings,quantitative survey research is able to argue that it isidentifying (if only questionably explaining) the largestscale patterns in society using relatively economicalstatistical models. In contrast by modelling relationformation at the individual level in terms of parameters,there is a real danger that SNA neither captures patternseconomically (since the number of parameters is in danger ofequalling or even exceeding the numbers of nodes andrelations) nor accurately reflects plausible ethnographicinsights into social causality: It is people (rather thanparameters) that “do things” (like making and breaking tiesaccording to identifiable social practices which they canthemselves sometimes articulate and present as causal).
This leaves us with something of a problem. We recognise boththat quantitative SNA offers interesting insights and isdeveloping rigorous tools while trying to understand dynamicprocesses using only snapshots and that qualitative researchhas useful things to say about what we ought to mean (and howwe ought to measure) social capital (including aspects ofsocial mechanisms and dynamics) but neither approach, takenalone, seems up to the task of both identifying patterns andexplaining them as we might wish. In order to deal with thisproblem and thus resolve the apparent impasse in explanation(while also making a further contribution to the conceptualframework for linking social capital and networks), I willargue that we need a novel method and it to this I turn in thelast section.
4. A Possible Solution: Agent Based Simulation
The reason for the problem discussed in the last section isvery simple. Humans are very bad at reasoning about the
34 As such, qualitative SNA is less highly regarded because it appears toraise problems without really offering solutions. Whatever the weaknessesof quantitative SNA, it is empirical and methodologically coherent in a waythat its qualitative critics sometimes are not.
25

[outsiderpics.doc]
aggregate consequences of even quite simple individual rulesfor interacting agents.35 This is why social science is sochallenging and appears to be an inherent limitation in ourabilities in the same way that our eyes do not allow us to seeinfra-red or objects the size of a virus. In consequence,social research has fallen into paths that play to ourcognitive strengths. Ethnography makes use of our ability toobserve, remember and organise disparate facts, spot patternsand create narratives from them. Survey research makes use ofour ability to create (simple) symbolic representations thatreveal patterns in data (like the mobility table or themedian). However, neither approach allows us to directly “see”social complexity (social mechanisms unfolding dynamically) inthe way that a microscope allows us to “see” small objects andtheir operations. This is what agent-based simulation can dofor us as the example below shows.36
Thomas Schelling (1971) proposed an extremely simple model toexplain residential segregation on ethnic grounds. Supposethere are two types of people (called “red” and “green”) andthey live on a regular grid (like a chess board or an Americancity). This gives each person eight potential neighbours.Suppose further than each person only feels comfortable ifthey have a certain fraction of neighbours of their own type.This could be 0 if the person was extremely tolerant (orcosmopolitan) and 1 if the person was extremely xenophobic.Suppose we now populate the grid with individuals of each
35 A network example is provided by Six Degrees of Separation. If you askpeople how many “steps” there are likely to be between a baker in Utah anda banker in Boston, they will think of spatial and social distance and say“many”. This reflects two limitations of reasoning. The first is failure todraw on something they already know implicitly, that bankers and Bostoniansare better connected as groups than the “general public” so that once thebanker or Bostonian “circles” are reached far fewer steps are likely to beneeded. The second is a quite reasonable inability to translate thisqualitative insight (assuming it is recognised) into even an approximatequantitative judgement. If moving from baker circles to banker circles orfrom Utah circles to Boston circles is enough to reduce the number of stepsfrom “very many” to “fairly many”, does the combined effect remain at“fairly many” or actually “rather few” as the data actually suggests?36 In this paper I shall not discuss how computer simulation is achieved,only what it can do. This is equivalent to reporting the results ofanalysis in SPSS without deriving the statistical results on which theprogramme is based or explaining how the SPSS software package works.
26

[outsiderpics.doc]
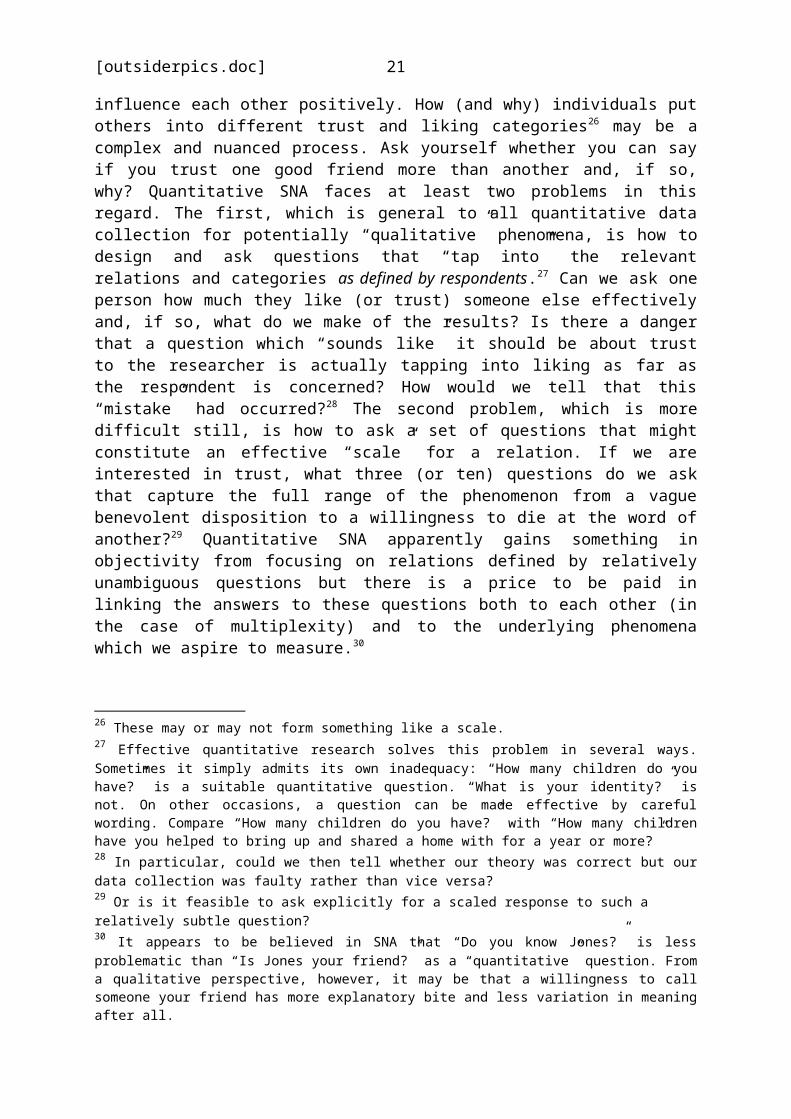
type, randomly assigned to sites on the grid, and leave someempty spaces.37 Figure 4 illustrates this situation.38
Figure 4. Initialised Grid for Schelling Segregation Model
Now we propose an extremely simple migration rule. If anindividual is comfortable with their existing balance ofneighbours, they stay where they are. Otherwise they migrateto a randomly selected empty site. Each individual gets one“go” at deciding whether to move in each time period and theorder in which individuals are allowed to decide whether tomove is randomised.39 The simulation carries out the task ofimplementing these rules for a sequence of time periods andthe whole population of social actors and producing a “map” ofthe results. A typical example after roughly 100 time periodsis shown in figure 5.
37 The reason fractions are used rather than numbers is so empty sites canbe disregarded as socially “neutral”.38 The simulations presented here are written in NetLogo and are freelyavailable for non-commercial training purposes in the models library ofthat software package. The author fully credits Uri Wilensky for producingand documenting them for this purpose and is only responsible for thediscussion of the simulation outputs. NetLogo can be downloaded for freefrom <http://ccl.northwestern.edu/netlogo/> and runs on both Windows andMacOS.39 This is done for technical reasons. Non-random updating leads toartefacts (non robust results highly dependent on updating order) which areextremely unlikely to have analogues in real social systems.
27
[outsiderpics.doc]
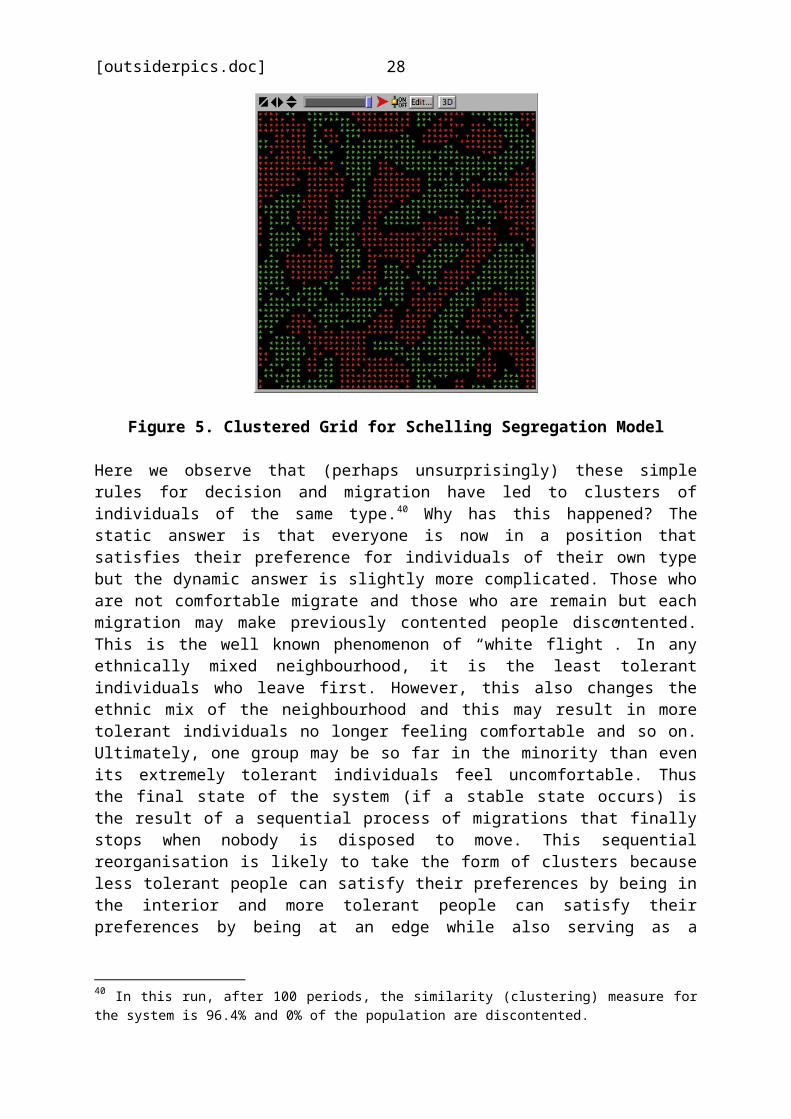
Figure 5. Clustered Grid for Schelling Segregation Model
Here we observe that (perhaps unsurprisingly) these simplerules for decision and migration have led to clusters ofindividuals of the same type.40 Why has this happened? Thestatic answer is that everyone is now in a position thatsatisfies their preference for individuals of their own typebut the dynamic answer is slightly more complicated. Those whoare not comfortable migrate and those who are remain but eachmigration may make previously contented people discontented.This is the well known phenomenon of “white flight”. In anyethnically mixed neighbourhood, it is the least tolerantindividuals who leave first. However, this also changes theethnic mix of the neighbourhood and this may result in moretolerant individuals no longer feeling comfortable and so on.Ultimately, one group may be so far in the minority than evenits extremely tolerant individuals feel uncomfortable. Thusthe final state of the system (if a stable state occurs) isthe result of a sequential process of migrations that finallystops when nobody is disposed to move. This sequentialreorganisation is likely to take the form of clusters becauseless tolerant people can satisfy their preferences by being inthe interior and more tolerant people can satisfy theirpreferences by being at an edge while also serving as a
40 In this run, after 100 periods, the similarity (clustering) measure forthe system is 96.4% and 0% of the population are discontented.
28
[outsiderpics.doc]
“buffer” for their less tolerant peers.41 At the same time, wecan also see how “tight” clusters (containing no empty sitesbut perhaps surrounded by them) might be more socially robustthan “loose” clusters (either containing empty sites ordirectly in contact with clusters of the other type). Anymovement into an empty site within a cluster might cause acascade (assuming that the least tolerant are at the centre)while movements into “buffer areas” do not have this effect.Better then, apparently, that empty sites should surroundclusters than occur within them. This is conceptuallyinteresting because it suggests the movement of “holes” ratherthan of people in the same way as the idea of vacancy chains(Chase 1991).
A number of important lessons can be gleaned from this simpleexample which was chosen primarily for its simplicity ratherthan its direct relevance. Firstly, as claimed at the start ofthe section, intuition fails people even for pretty simplesystems. Most people who are asked what proportion of sametype individuals must be preferred to generate clusters orwhat happens when agents are totally xenophobic give the wronganswer.42 Secondly, we can situate existing research methodswithin this framework as a way of recognising their strengthsand limitations. In order to make this simulation moreplausible we would have to do two things. The first would berecognisably ethnographic. We would have to go to realneighbourhoods and observe them, talk to people about how theyviewed the place where they lived, whether they would like tomove, why and where they would go. This would contribute tothe realism of the “agent models” and definition of41 Interestingly, this is the exact opposite of the “contact hypothesis” inpsychology (Allport 1954). People are nor more tolerant because of exposureto others. Instead they are exposed to others because they are moretolerant!42 Recognisable clustering occurs when people only require a fraction of 0.3of their own type around them i. e. they do not need to be xenophobic. Ifall agents are totally xenophobic, no clustering occurs because it isimpossible for anyone to be content in a dynamically stable way. (Everyonewants to be in the middle of a cluster and nobody is content at the edge.This set of preferences is globally inconsistent.) The reason nobodyanticipates this is because the phenomenon is non-linear. Greater andgreater degrees of xenophobia do produce progressively tighter clustersuntil suddenly preferences become globally inconsistent and clusteringbreaks down very fast.
29
[outsiderpics.doc]
“neighbours” and “neighbourhood” used in the simulation. Thesecond would be recognisably quantitative. We would need toassess real patterns of residential segregation and comparethese with the kinds of data produced by the simulation. Thiswould serve as a test for the claim that the simulation wasgenerating “plausible” aggregate data as an output and hadthus captured some insight into the relevant social setting.Either kind of traditional research, conducted alone and inthe absence of simulation to “bridge the gap” would clearlynot be adequate as already suggested. Ethnography would lackthe empirical test at a different level of description andquantitative research the grounded explanation.43 This raisesthe third lesson about discriminating tests for competinghypotheses. The basic Schelling model is not only too simplebecause it involves plainly implausible assumptions about howpeople make decisions and migrate but because it only reallyhas two states (clustered and random). As such, it fails todiscriminate between a very large set of competing hypothesesabout how spatial segregation arises. (Very many ratherdifferent sets of individual behaviour have been shown toproduce clusters in such a simple system.) By contrast, aSchelling model with three types produces at least three quitedistinct states (random, separated clusters and various kindsof nested clusters44) which ought to go some way to narrowingthe field of competing hypotheses. Thus in its ability to“handle” and display complexity, simulation is also capable(at least in principle) of creating more effective tests forcompeting hypotheses. As with the previous example of mobilitytables, simple models offered by traditional approaches areappealing but may not be adequately discriminating.
In addition to these methodological lessons, simulation alsoallows us to refine our definition of a social mechanism tosharpen points previously made about quantitative SNA.45 In
43 Each side has been known to “fake” what they cannot really offer.Ethnographers sometimes draw ungrounded general conclusions from theirdomain specific expertise while statisticians (and particularly economists)try to claim that their “armchair theorising” about mechanisms is actuallygrounded in real behaviour.44 We might also try to distinguish tight and loose clusters as well astouching and non touching ones.45 Upto now, it could be argued that I had simply claimed that there suchthings as social mechanisms and that they had the consequences I claimed
30

[outsiderpics.doc]
this case, there is a decision – or perhaps psychological –mechanism (count your neighbours and compare them with yourtarget to see if you are content or not46), a psychologicalmechanism (if you are discontented then it motivates you tomove) and a migration mechanism (wander at random till youfind an empty site).47 As it happens, each agent in thesimplified simulation operates on the same mechanisms anddiffers only in their type and target but clearly this neednot be true from a technical point of view. In the limit (andprovided we could get enough data) each simulated agent mighthave a unique decision process and set of behaviours. However,if the real social world were like this (as some extremerelativists contend) then, firstly, it would be impossible tooperate within it as social actors could observe no patternson which to base their behaviour and, secondly, social sciencewould be pointless as there would be no social regularities tofind by any method. At best, social science would beindistinguishable from biography or descriptive journalism.Thus it is important to distinguish simplifications carriedout for technical reasons (we cannot make this statisticalmodel more complicated without needing an impossibly largesupply of data) and simplifications on empirical grounds (thismodel produces the same outcomes as a more complicated one,this particular social setting just is rather simple). Unlikestatistical modelling, simulation is capable with dealing withany level of social complexity but there may be soundtheoretical and empirical reasons for starting with simplermodels. However, this is an empirically guided choice forsimulation and not a technical requirement.
This discussion is a slight detour from social capital and SNAbut the lessons learned can easily be translated into relevantfor them. Within the framework of simulation I can do better than this.46 This might be a conscious or unconscious process.47 This understanding of mechanisms is also important to regular SNA. It issometimes the case that insights from rather specialised networks (likedating web sites) are generalised to other networks that may have verydifferent underlying social mechanisms (time consuming face to face versuseasy anonymous “chat”) simply because the data are more freely available.In the same vein, Putnam using organisational membership as a proxy forsocial capital entirely begs questions about the function of organisationsand relations within them which require knowledge of underlying socialmechanisms. Whether joint membership of organisations creates socialcapital and how it does so is exactly what we want to know.
31

[outsiderpics.doc]
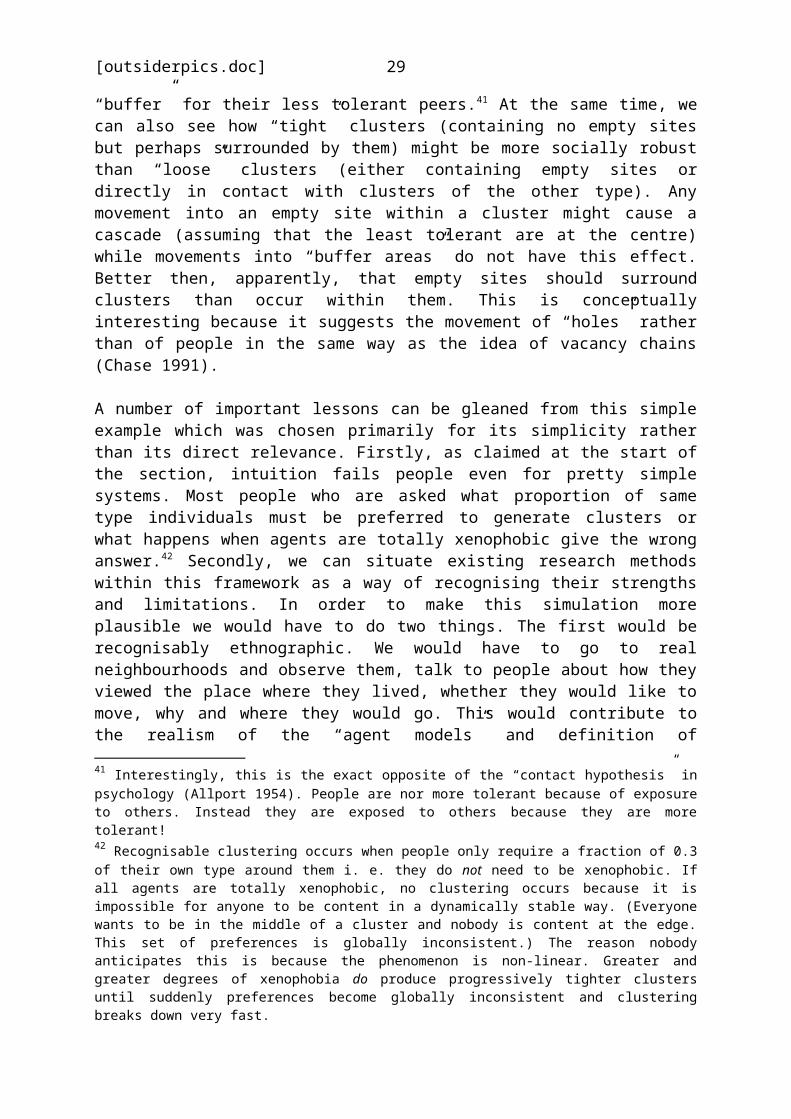
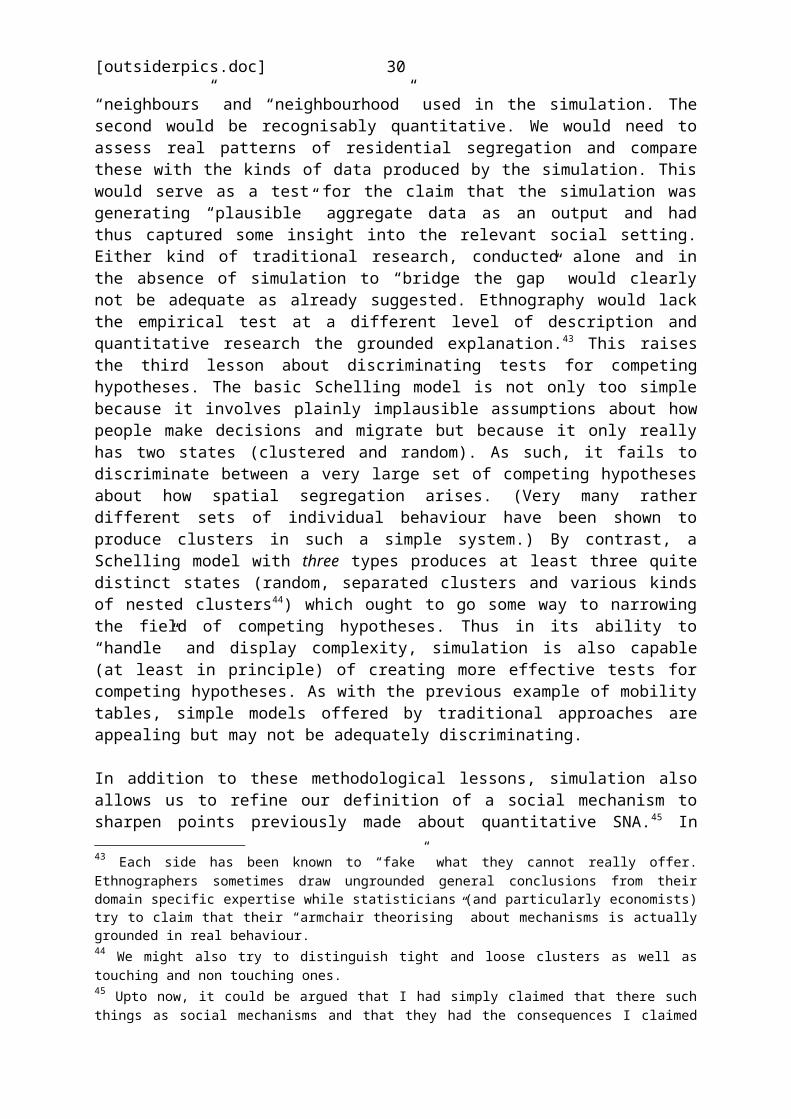
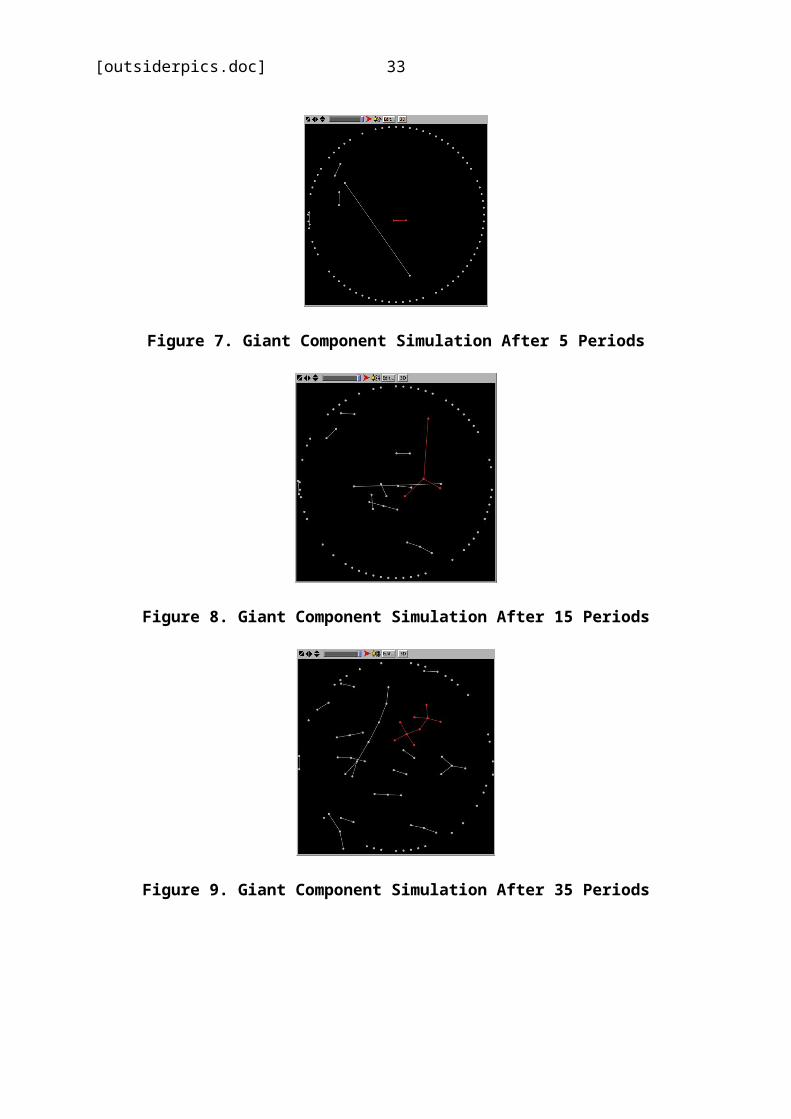
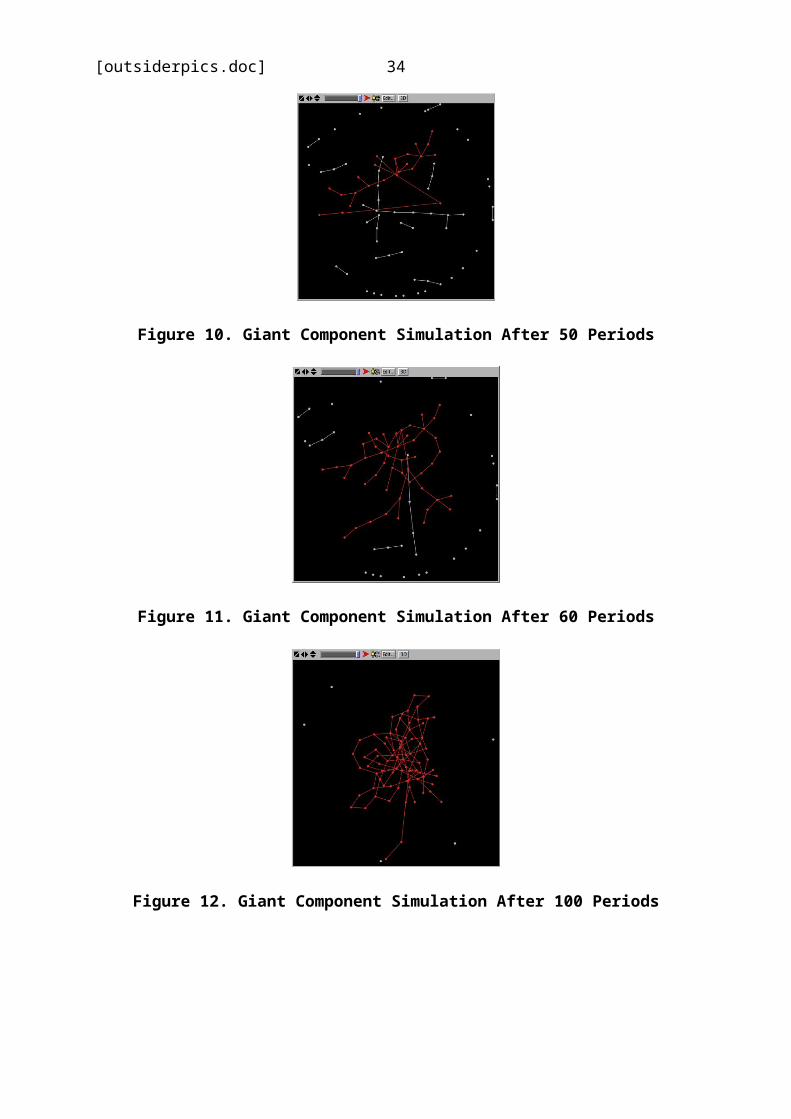
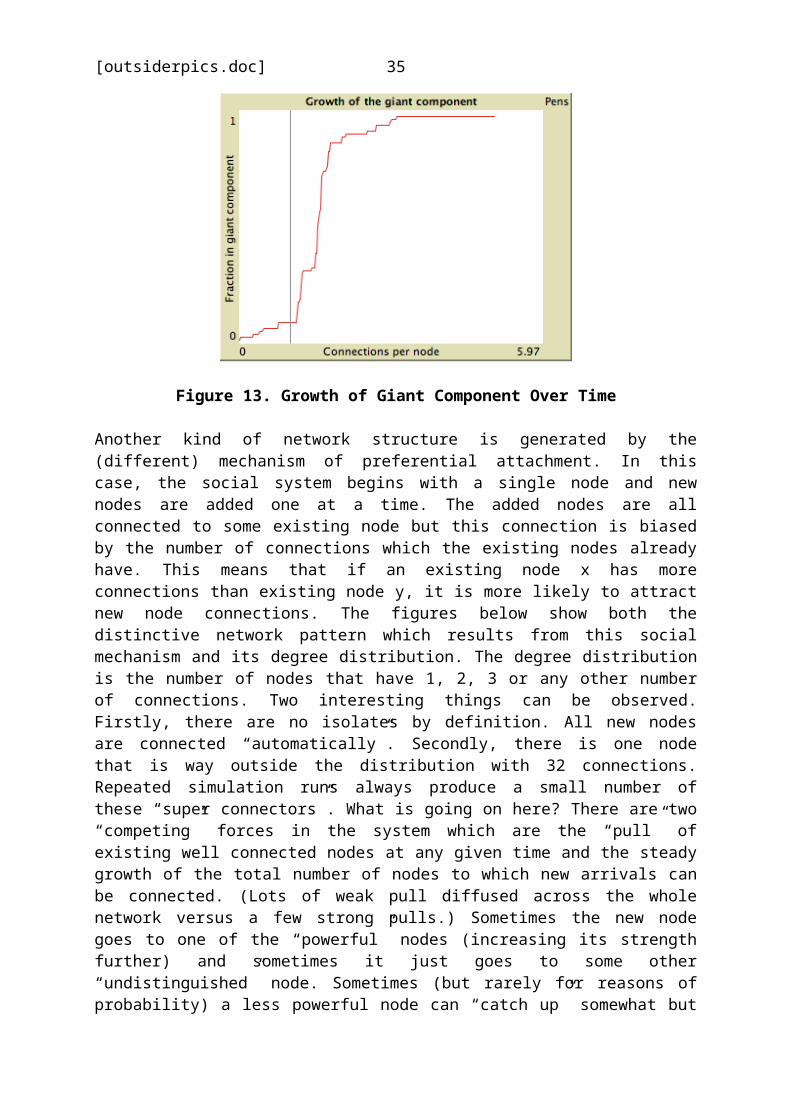
examples of NetLogo simulations for networks. The firstillustrates the potentially counter-intuitive “giantcomponent” that results from a particular mechanism of networkformation. Suppose we start with a number of isolated nodes,pick two at random and then link them. Then we repeat thisprocess, choosing the nodes randomly from the full set eachtime. What will happen? Initially, the result will be mostlytwo person “cliques” constructed from previously isolatednodes. Sometimes these will join together if two nodes inexisting components are chosen but this will be relativelyrare as the fraction of nodes in cliques is initially small.Over time, the number of components will increase and thenumber of isolates decline. However, at the same time, thecomponents will be more likely to merge as the proportion ofnodes “taken up” in components increases. The invariableresult (but after a somewhat variable time) will be a singlegiant component. The figures below show snap shots from asimulation of this process and the fraction of nodes in thelargest component over time. As can be seen the growth of thisfraction is rather sharply non linear, identifying two“stages” in the process, an initial phase where many smallcomponents form independently and a relatively short phase inwhich these join up to produce a giant component. A finalphase involves this giant component “swallowing” any survivingisolates which are much less likely to form small componentsbefore this happens.48
Figure 6. Initial State of Giant Component Simulation48 This has an interesting parallel with a recognised empirical phenomenonin industrial organisation where new industries generate firms rapidly andthen experience a dramatic “shake out” to a much smaller number of dominantfirms. Explanations offered for this phenomenon are often economic orstrategic but this example suggests that they might be structural.
32
[outsiderpics.doc]
Figure 7. Giant Component Simulation After 5 Periods
Figure 8. Giant Component Simulation After 15 Periods
Figure 9. Giant Component Simulation After 35 Periods
33
[outsiderpics.doc]
Figure 10. Giant Component Simulation After 50 Periods
Figure 11. Giant Component Simulation After 60 Periods
Figure 12. Giant Component Simulation After 100 Periods
34
[outsiderpics.doc]
Figure 13. Growth of Giant Component Over Time
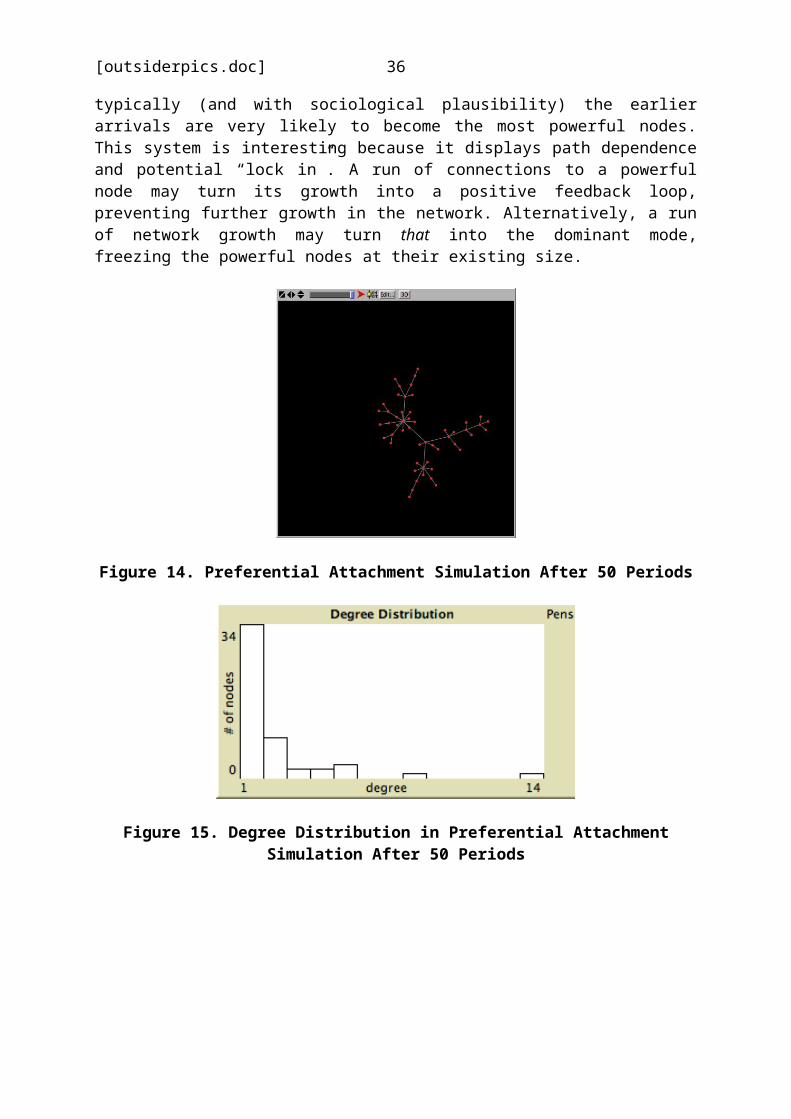
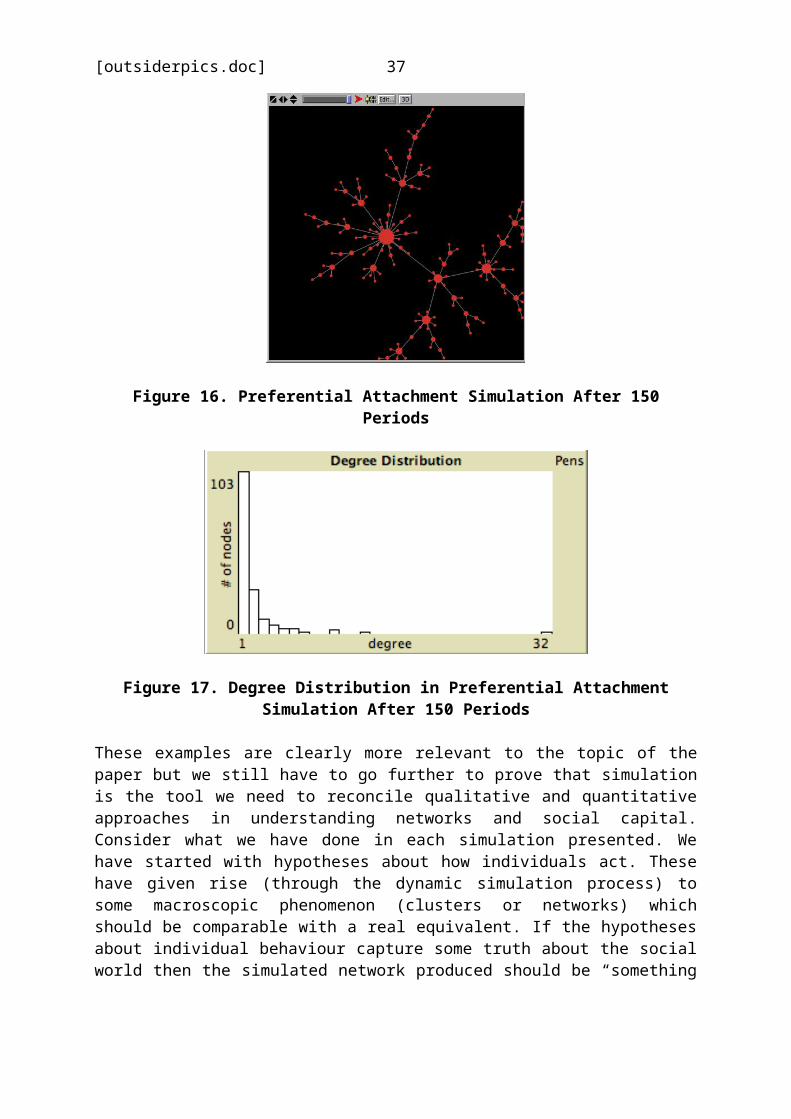
Another kind of network structure is generated by the(different) mechanism of preferential attachment. In thiscase, the social system begins with a single node and newnodes are added one at a time. The added nodes are allconnected to some existing node but this connection is biasedby the number of connections which the existing nodes alreadyhave. This means that if an existing node x has moreconnections than existing node y, it is more likely to attractnew node connections. The figures below show both thedistinctive network pattern which results from this socialmechanism and its degree distribution. The degree distributionis the number of nodes that have 1, 2, 3 or any other numberof connections. Two interesting things can be observed.Firstly, there are no isolates by definition. All new nodesare connected “automatically”. Secondly, there is one nodethat is way outside the distribution with 32 connections.Repeated simulation runs always produce a small number ofthese “super connectors”. What is going on here? There are two“competing” forces in the system which are the “pull” ofexisting well connected nodes at any given time and the steadygrowth of the total number of nodes to which new arrivals canbe connected. (Lots of weak pull diffused across the wholenetwork versus a few strong pulls.) Sometimes the new nodegoes to one of the “powerful” nodes (increasing its strengthfurther) and sometimes it just goes to some other“undistinguished” node. Sometimes (but rarely for reasons ofprobability) a less powerful node can “catch up” somewhat but
35
[outsiderpics.doc]
typically (and with sociological plausibility) the earlierarrivals are very likely to become the most powerful nodes.This system is interesting because it displays path dependenceand potential “lock in”. A run of connections to a powerfulnode may turn its growth into a positive feedback loop,preventing further growth in the network. Alternatively, a runof network growth may turn that into the dominant mode,freezing the powerful nodes at their existing size.
Figure 14. Preferential Attachment Simulation After 50 Periods
Figure 15. Degree Distribution in Preferential AttachmentSimulation After 50 Periods
36
[outsiderpics.doc]
Figure 16. Preferential Attachment Simulation After 150Periods
Figure 17. Degree Distribution in Preferential AttachmentSimulation After 150 Periods
These examples are clearly more relevant to the topic of thepaper but we still have to go further to prove that simulationis the tool we need to reconcile qualitative and quantitativeapproaches in understanding networks and social capital.Consider what we have done in each simulation presented. Wehave started with hypotheses about how individuals act. Thesehave given rise (through the dynamic simulation process) tosome macroscopic phenomenon (clusters or networks) whichshould be comparable with a real equivalent. If the hypothesesabout individual behaviour capture some truth about the socialworld then the simulated network produced should be “something
37

[outsiderpics.doc]
like” the real network observed.49 However, we can’t stopthere. Firstly, there are different degrees of likeness. Canwe predict how long it will take for the giant component toform or just that it will do so?50 Can we predict that thesystem will cluster in some way or that it will form nestedclusters? How well have we done in getting our simulation tomirror the part of the social world we are interested in?Secondly, could the observed similarity be the result of morethan one social mechanism or combination of these and if so,which one actually occurs in the real world?
The network examples above are plainly trivial but the ways inwhich they are trivial are sociologically revealing andtheoretically helpful for the argument of this paper. Firstlythey both start with odd conditions (a population of isolatesor a single node) and/or have odd entry/exit processes (noentry/exit or entry at a fixed very low rate with no exit). Inpractice, we will mostly want to understand systems wherethere is a pre-existing network structure (measured at aninitial time) and subsequent change with irregular entry andexit. Secondly, each simulation is based on a single ratherimplausible social mechanism and this allows the resultingnetworks to be falsified very easily against even “stylised”knowledge of real network structures.51 Neither thepreferential attachment nor giant component networks containisolates or significant numbers of cliques.52 Thirdly, theseexamples appear to go against the earlier claim thatsimulation (unlike statistical modelling) doesn’t rely on“parameters” with their corresponding limitations.
This last point is important and requires some discussion. Thefirst thing we must do is distinguish between model parametersin the usual sense and the individual cognitive constructs ofsocial actors.53 If my decision process for budgeting involves49 This methodology is discussed in more detail in Gilbert and Troitzsch(2005, pp. 16-18).50 It might be possible to prove the latter result analytically without theuse of simulation as it seems in some sense “probabilistically inevitable”.51 This is not an argument against the simulation approach, just another illustration of GIGO!52 In fact, the preferential attachment network contains no cliques at all.53 Matters are complicated by the fact that model parameters are cognitiveconstructs but in the heads of researchers. However, it clearly does not
38
[outsiderpics.doc]
taking the money I have left in the bank and dividing by thenumber of weeks until payday then it is true that I amreasoning numerically but these numbers are empiricallyaccessible and clearly and causally located in the head of anindividual. They are thus part of what an ethnographer mightcall culture. This is in sharp contrast with the status of atypical model parameter (“each year of education after 18 adds£52,650 to lifetime salary on average”) which describes orsummarises a phenomenon (like a simple average does) withoutexplaining why it comes about. (I spent £47 last week becausemy budgetary strategy is to take what I have left in my bankaccount and divide by the number of weeks before payday.) Evenif this point is not accepted and it still seems fair to treatcognitive constructs as “parameters” (mysterious andpotentially problematic numbers), there is no technicalrequirement that simulations involve any numbers at all.54 Forexample, my strategy on greeting someone may be “If he raiseshand then raise my hand. If he nods then nod back. If he doesneither, then smile.” These condition-action rules involve nonumbers and are clearly compatible with the description ofcertain (admittedly simple and routinised) cultural practicesand interaction sequences. Thus, the initial impression thatsimulation does not “escape” from the problem of parameters iswrong on at least two independent counts.
Four other important points should be noted about the networksimulations presented here. Firstly, unlike statisticalmodels, it is possible to “interrogate” a simulated system inmore than one way. (We are attempting to “reproduce” thesocial system in a simulation not summarise it as one does ina model.55) Because the agents do what they do according to
follow that because a researcher finds that saving is typically 20% ofmonthly income that each social actor is explicitly deciding to put away20% each month. This confusion between actor models andtheoretical/researcher models particularly besets economics where a wholeapproach (Rational Expectations) is based on the bizarre supposition thathighly technical economic models and everyday decision processes coincide.54 This ignores the irrelevant objection that, at a lower level ofdescription, all computing constructs are instantiated as strings of 1s and0s.55 This is actually a rather deep point which there isn’t space to explorehere. Both simulations and statistical models are necessarily abstractionsbut they are different kinds of abstractions. Simulations try to reduce thecomplexity of social systems in some ways but not by reducing the number of
39

[outsiderpics.doc]
certain rules, the patterns we seek at the aggregate level canvary (as they do when measuring real systems in differentways). For example, in the preferential attachment model, wecould very easily plot node age against degree to explore howlikely the earliest agents were to become the most powerful.We could also investigate the “super connector” phenomenon by,for example, identifying features in particular simulationruns which led to single or multiple super connectors andseeing whether there were any runs in which they werecompletely absent. Perhaps, for example, multiple superconnectors can only persist if the “first” super connectorisn’t “too” large. Thus the ability to collect different datafrom the simulated system and alter the way it works (changingthe set of mechanisms or their details of operation) providean experimental or heuristic approach to understanding howsocial systems work. If we don’t understand what thesimulation is doing we can ask it different questions and useit in different ways to facilitate that understanding and then(perhaps) make use of this enhanced understanding in studyingthe real world. This contrasts with the limited control we arepractically and ethically able to exercise directly on realsocial systems.
The second point to consider is how these examples link to theearlier discussion of mechanisms and data collection methods.The simple mechanisms proposed above are very easy to falsifyon almost any network data. However, what we would ideally bedoing is getting our understanding of mechanismsethnographically (and perhaps by other techniques such asexperiments) building the simulation and seeing how “like”real data the outputs were. As with real networks, thesimulated network might be rather “like” in some respects(degree distribution) but rather “unlike” in others (fractionof nodes in cliques). These findings might go some way tosuggesting where the weaknesses of the simulation lay but alsowhere more evidence was needed and even what form it mighttake.
social actors and kinds of interaction involved. The hope is that thiskeeps more of what “really matters” about the complexity of social systems.Not all methods of abstraction are equally artificial or unhelpful as issometimes implied.
40
[outsiderpics.doc]
For example, suppose that the simulation was generating “toofew” cliques. This would suggest a focus on existing cliquesin the field setting. How did they come about? How were allthe members introduced? Who left and why? In this way,additional mechanisms or refinements to mechanisms could beimplemented for a specific context thus adding to oursociological knowledge as well as the quality of thesimulation. It is well known that people often meet eachother’s friends at social events (giving rise to thewidespread phenomenon of transitivity in networks: if A knowsB and B knows C it is rather likely that A and C will come toknow each other) but we actually know more than that. Suchinvitations may not be extended (or required) depending on thenature of the social setting. The pub is a public place but mycorner booth is not. I will often extend an “open” invitationto “bring friends” to a bottle party but only to close friendsor partners (or not at all) for a sit down dinner party. Inthis way, how people spend their leisure time is likely toshape how likely their friendship circle is to constitute aclique. Thus we approach the issue of identifying the correctmicro level mechanisms from two directions. We can weed outany “theoretical” (arm chair) sets of mechanisms that areplainly incompatible with the observed macro-phenomena while,at the same time trying to identify the “actual” mechanisms(or their combinations) using appropriate qualitativemethods.56
The third point is that the simulation approach clearlyillustrates the concerns raised earlier about social dynamicsand social networks as snap shots. It is clear that while boththe giant component and preferential attachment simulationsare based on constant underlying social mechanisms (byspecification), some properties of the resulting networksremain relatively invariant (like degree distribution) whileothers do not (like connectedness). Thus even repeated samplesof the network (let alone single snap shots at an unknown timeafter the “start” of the process) may not give us as much
56 One problem is that very few single mechanisms are self-evidently“wrong”. However, they may be of limited application and/or usually foundin combination. In either case, the “theoretical” approach of exploringsingle mechanisms analytically is unlikely to tell us what we need toknow.
41

[outsiderpics.doc]
insight into the underlying social mechanisms (or even whetherthese are constant or not) as we might hope.
Finally, even if the points about parameters are accepted, itmight be argued that these simulations are still a “fudge”when it comes to representing real social processes. What dowe mean socially when we say that two nodes are chosen“randomly” in each time period? Doesn’t this go against theearlier claim that what makes social networks social is theoperation of intentional nodes maintaining relations “fromwithin” the network? This is an important challenge butsimulation is equal to it in principle (though sometimes poorexamples are not). It might mean, for example, that all thesocial actors were wandering round randomly on a flat “plain”at the same speed and had the same likelihood of forming arelation on encountering each other. This is clearlydesperately unrealistic as a model of social behaviour but itshows that random matching need not involve any appeal to adeus ex machina as the description of the giant componentsimulation might suggest.
Thus although we have had to cover a lot of ground, all theingredients of a relationship between SNA and social capitalare now in place with simulation offering a “bridge” betweentraditional qualitative and quantitative approaches. Infocusing on the quantitative properties of networks, SNAallows us to make a wide range of effective comparisonsbetween real and simulated networks to test claims that wehave understood the underlying social mechanisms. By contrastthe task of ethnographic approaches is to understand socialmechanisms and the context within which they operate so thattheir aggregate results can be established through simulation.In the final section I shall explicitly present this approachin the context of the earlier discussion of the range ofphenomena referred to as social capital.
5. Discussion and Conclusions
In the three previous major sections, I developed the elementsI needed for the main argument of this paper. In the first Ishowed that quantitative SNA was an empirical and coherentapproach to data collection and analysis but raised concerns
42
[outsiderpics.doc]
both about the adequacy of local measures of network phenomenaand about the existing paradigm of quantitative SNA fordealing with network dynamics underpinned by socialmechanisms. In the second, I showed that some aspects ofsocial capital identified qualitatively (like the role ofagency in network formation and histories of socialinteraction influencing behaviour) were less suitable formeasurement and analysis by quantitative SNA than others andthat quite a range of (actually rather diverse) data wereidentified as “the” phenomenon of social capital. In the thirdsection I showed how simulation could potentially bridge thegap between micro and macro levels of explanation but alsothat the method required the existing skills of bothethnography and quantitative analysis to do this effectively.It is now possible to tie things together.
Let us suppose that a whole set of agents need to play a game(as in game theory) repeatedly. The key feature of such games(of which the Prisoner’s Dilemma is the paradigm case) is thatmy actions affect your outcomes and, as a result, there is atension between self-interest and the collective benefit.Starting with isolated agents (or a random network structure)we can imagine agents meeting, playing this game and recordingthe outcomes. In addition, we can imagine (at least insimplified form) the standard mechanisms of social networkformation being incorporated into the simulation. (Forexample, as a very simple approximation to shared activity,agents might move together for a certain number of periodsafter first meeting depending on how they played the gametogether. In this case, two agents, B and C, both known to A,might come to know each other if A happened to be travellingwith one when it encountered the other.) In addition, networkstructures would be strongly influenced by “choice andrefusal”. On meeting, agents might decide to play (or not)depending on past behaviour. This would change the structureof the network. Furthermore, repeated plays might strengthenthe disposition to play again (or travel jointly), thusrecognising the distinction above between mechanisms thatqualitatively change the network and those that do soquantitatively. The flow of information in this network wouldbe about reputations. Who had played selfishly (or refused toplay) with whom. Those central in the resulting networks would
43
[outsiderpics.doc]
be better informed than those who were peripheral and thusable to make more effective responses in particular contexts.Furthermore, those who played the game “ineffectively” mightbe removed from the network by absence of the resourceinvolved (bankruptcy in the case of money or death in the caseof or “food”) while others entered with no knowledge of thesystem and were thus potentially exploitable. Finally socialinfluence (or learning) might operate on the way that agentschose to play the game, travel together and so on. Forexample, agents who were well disposed to each other mightalso impart the information that it was more beneficial to be“open handed” with unknowns (and thus have a chance for co-operation) than it was to be “mean” to avoid exploitation.This kind of “cultural” behaviour would depend on a learnedaggregate evaluation of how much selfishness existed in thesystem.
This simulation can be criticised on several counts. It may beethnographically naïve and involve precisely the kind ofarmchair theorising I have criticised elsewhere. Furthermore,it is only a sketch at this stage and may prove to beincoherent when any attempt is made to turn it into a fullyfledged computer programme. However, it does have twodeliberate advantages. Firstly, it contains all five differenttypes of social process outlined above for network formationand is thus a relatively complex social system with a fairlysimple description. This means that there is at least a chancethat it will not evolve social network structures that areself-evidently wrong as the extremely simplified examplesabove did. If so, it forms at least a first basis for asensible “theory” that might explain patterns of socialcapital in real systems and justify further qualitative andquantitative research. Secondly, it puts into sharp focus theearlier concerns I raised about both the definition andmeasurement of social capital.57
As a simulated system, it is possible to measure all thethings that have been “put forward” as defining socialcapital: the overall structure of the network, the position
57 A third advantage is that a system like this might be simple enough tostudy experimentally using volunteers facing strategic choices andcommunicating between computers (in a “lab” for example).
44

[outsiderpics.doc]
and relative success of individuals within it, the system widelevel of beneficial attributes of co-operation and so on. Asalready suggested, we can then compare these measurements withthose taken in real systems to test the model. However, we canalso do another important thing which is to see whether thesepostulated “measures” of social capital track each other evenin the simulated system and without reference to real data. Itis no use making network structure “the measure” of socialcapital if it is possible to have a particular structurewhich, at the same time, produces extremely low levels ofsystem-wide co-operation. If this is social capital, it isclearly not the desirable thing we assumed it to be. In thesame vein, social network structure cannot be an effectivemeasure if the underlying social mechanisms produce astructure that has one form on one period and another verydifferent one a year hence. What we are really interested inis whether (and why) we find associations between somefeatures of the system (structure – including structuralstability) and others we consider normatively desirable (earlywarning in gossip). Simulation may help us to understand thisand choose suitable measures for real systems but our muchricher understanding of the complexity of networks (supportedby the simulation approach) makes it rather unlikely that wewill carry on seeking one “true” definition of social capital.
Thus we can identify the following work programme linkingsocial capital and SNA. Existing ethnography informs a firstdesign for social network simulations and these are comparedwith real data from experimental or “live” social settings ifthey exist. Quantitative methods are used to collect this data(where it does not exist) and establish how like or unlike thesimulated and real data are along several dimensions. Thefailures of “version 0” are then used to structure furtherqualitative work (directed ethography, changed experimentaldesign) and refined data collection for further comparison.The process repeats in a systematic and incremental fashion.When a reasonable congruence exists between the simulated andreal data along specified dimensions, an “acid” test can beapplied which is the collection or derivation of new networkdata in a real system to see if the simulated system alsotracks previously unmeasured dimensions. Passing this verytough test would imply that the simulation had really
45
[outsiderpics.doc]
“explained” the social system rather than simply summarisingsome properties of its known dimensions.58
6. References
Allport, Gordon (1954) The Nature of Prejudice (Reading, MA:Addison-Wesley).Bott, Elizabeth (1957) Family and Social Network: Roles, Norms, andExternal Relationships in Ordinary Urban Families (London: TavistockPublications).Burt, Ronald S. (2002) ‘Bridge Decay’, Social Networks, 24(4),October, pp. 333-363.Chase, Ivan D. (1991) ‘Vacancy Chains’, Annual Review of Sociology,17, pp. 133-154.Chattoe, Edmund and Hamill, Heather (2005) ‘It’s Not Who YouKnow – It’s What You Know About People You Don’t Know ThatCounts: Extending the Analysis of Crime Groups as SocialNetworks’, British Journal of Criminology, 45(6), November, pp. 860-876.Crane, Diana (1972) Invisible Colleges: Diffusion of Knowledge in ScientificCommunities (Chicago, IL: University of Chicago Press).Degenne, Alain and Forsé, Michel (1999) Introducing Social Networks,Introducing Statistical Methods Series (London: SagePublications).Gilbert, Nigel and Troitzsch, Klaus G. (2005) Simulation for theSocial Scientist, second edition (Maidenhead: Open UniversityPress).Granovetter, Mark S. (1973) ‘The Strength of Weak Ties’,American Journal of Sociology, 78(6), May, pp. 1360-1380.Janis, Irving L. (1982) Groupthink: Psychological Studies of Policy Decisionsand Fiascoes, second edition (New York, NY: Houghton Mifflin).Kirke, Deirdre M. (2004) ‘Chain Reactions in Adolescents’Cigarette, Alcohol and Drug Use: Similarity Through Peer58 This tough test recognises two important and connected concepts, one fromcomputer science and one from physical science. In computer science reallearning is only taken to have taken place if a system can generalise toexamples not originally in the training set. Failure to do this means thesystem may just be a “look up table” rather than a real learner. Inphysical science, to avoid this problem with theories (which are alsosupposed to be generalised knowledge), the best possible thing a theory cando is suggest a result or phenomenon that has not previously been measured.For example, strong support for the theories of gravitation and planetarymotion were provided by their ability to indicate outer planets that weresubsequently discovered (like Pluto).
46

[outsiderpics.doc]
Influence or the Patterning of Ties in Peer Networks?’, SocialNetworks, 26(1), January, pp. 3-28.Knoke, David and Kuklinski, James H. (1986) Network Analysis,Quantitative Applications in the Social Sciences, SeriesNumber 07-028, third edition (Newbury Park, CA: SagePublications).Schelling, Thomas C. (1971) ‘Dynamic Models of Segregation’,Journal of Mathematical Sociology, 1(2), xx, pp. 143-186.Scott, John (2000) Social Network Analysis: A Handbook, second edition(London: Sage Publications).Wasserman, Stanley and Faust, Katherine (1994) Social NetworkAnalysis: Methods and Applications, Structural Analysis in the SocialSciences Volume 8 (Cambridge: Cambridge University Press).
47