MEASURING SOCIAL CAPITAL IN THE BASQUE COUNTRY
239
1 2018 International PhD Thesis MEASURING SOCIAL CAPITAL IN THE BASQUE COUNTRY: AN ECLECTIC APPROACH Igor Etxabe Iruretagoiena Supervisors: Jon Barrutia Guenaga (UPV/EHU) Jesús M. Valdaliso Gago (UPV/EHU) PhD Programme: Business Management, Knowledge and Innovation Department of Financial Economics II
-
Upload
khangminh22 -
Category
Documents
-
view
0 -
download
0
Transcript of MEASURING SOCIAL CAPITAL IN THE BASQUE COUNTRY
1
2018 International PhD Thesis
MEASURING SOCIAL CAPITAL IN THE BASQUE COUNTRY: AN ECLECTIC APPROACH
Igor Etxabe Iruretagoiena
Supervisors: Jon Barrutia Guenaga (UPV/EHU) Jesús M. Valdaliso Gago (UPV/EHU)
PhD Programme: Business Management, Knowledge and Innovation
Department of Financial Economics II
(c)2018 IGOR ETXABE_IRURETAGOIENA


It is not what you know,
but who you know (Baker, 2000)
and how you know them (Plickert et al., 2007).
Nor‐nori‐nork.
(Basque expression)


I
ACKNOWLEDGMENTS Writing a dissertation is not an easy task. There are moments when you feel blocked or simply pessimistic
about the ongoing work. Therefore, I would like briefly to mention those who have supported me all the
way through.
My first and sincere appreciation goes to my supervisors, Jesús M. Valdaliso and Jon Barrutia. I owe
particular thanks to Jesús M., who kindly opened the door of his office every time I knocked on it, and
always answered my e‐mails very quickly. I have also been very lucky to have Jon as a co‐director for
proposing simple and effective solutions for the various issues that arose with regard to my PhD thesis.
This recognition is extended to the members of the Economic History and Institutions department at the
University of the Basque Country. This project would not have developed without their valuable advice
about how to overcome certain problems and, notably, their collaboration in covering some lectures
assigned to me. I hope to be able to return the favour in future.
I would also like to thank all the employees of LEREPS (Laboratoire d’Etude et de Recherche sur l’Economie,
les Politiques et les Systèmes sociaux) at University Toulouse I Capitole, for their generous welcome and
smart guidance about how to upgrade my work. In addition, I would like to recognise the assistance
provided by José Manuel Gaete, from the University of Salamanca. Had your e‐mail of 11 February 2017
not arrived, maybe this thesis would not have been completed. I am grateful also for the technical support
from Mariluz Congosto, a researcher at Universidad Carlos III in Madrid.
Obtaining data was another major challenge, and in that context I am deeply indebted to many people:
Mikel Lizarralde and Josu Azpillaga, from Codesyntax, for opening the API door on Twitter for me; Jokin
Garatea and Itziar Vidorreta, from GAIA, for all the interviews and precious data; Miren Estensoro, from
Orkestra, for helping to disentangle the complex map of governance in the Basque Country; José Luis
Novoa, from Armeria Eskola, Edurne Bilbao, from IMH, and Mª Asun Larrañaga, from Meka Lanbide
Eskola, for all the information about former students; and Pello Arrieta, Pedro Mari Andonegi and Jesus
Mari Astigarraga, hobbyists of the machine tool history in Elgoibar, for all the material they provided.
Thanks also to the fantastic staff at the Commercial Office of Gipuzkoa: Ana, Angel, Desampa, Enrique,
Gonzalo, Ignacio, Kike, Lucía, Marijo, Marisol, Mayi, Miguel and Silvia. It was thanks to your granting of
authorisation that I was able to collect the data about investors in the Deba Valley, and I am very aware
that you could easily have denied my request. Although it might sound like a cliché, allow me to add that
you made me feel like another member of the team in your office right from the very beginning.
Besides, I would like to express a sincere gratitude to all my interviewees in Eibar: Nerea Alustiza (former
council), Jon Arregi (SD Eibar), Mikel Aseginolaza (Casino Artista Eibarrés), Marina Barrena (Gunsmithing
Museum), Iñaki Ciarán (Armeria Eskola), Oihane Crucelaegui (Club Ciclista Eibarrés), Imanol Gaztelu
(Kerizpe), Jose Luis Gorostegi (Etakitto!), Leire Illarramendi (Asociación de Antiguos Alumnos from Armeria
Eskola), Jaime López de Guereñu (Peña Taurina Pedrucho Eibarresa), Javi Martín (javitxooo.blogspot.com),
Iñaki Osoro (Club Deportivo de Eibar), Miguel Tudanca (Club de Tiro de Arrate), Isabel Vidarte (Aspe),
Lorenzo Zabala (Motobic) and Danel Zenarruzabeitia (Industrias DEJ). An especial mention out of the list
is deserved by Iñaki Alberdi, who was always receptive towards my queries, and Yolanda Ruiz, for the
information she provided and, especially, her psychological aid.

II
Furthermore, I gratefully acknowledge the financial support I received from the Ministry of Economy,
Industry and Competitiveness through MINECO HAR2012‐30948 and HAR2016‐76198‐P (AEI/FEDER, UE),
as well as two research projects promoted by the Basque government (Grupo Consolidado del Sistema
Vasco IT807‐13 and IT897‐16). This funding allowed me to attend some conferences and courses that were
crucial for my learning process. Nevertheless, the views expressed here are entirely my own.
Last but not least, I owe my greatest tribute to my family. Mum and Dad, I sometimes thought you would
never see me finish this work. Nagore, Iñigo, Ur and Lizar: your table has withstood a second thesis! Felipe,
Izarra, Lea and Xan: Uncle Igor has finished his thick task! And Goizane and Zelai, my dears, what can I
say… I am so sorry for having had to spend less time with you than I wanted. The journey has been tough
but we finally overcame all the difficulties and now, when I look back, I feel the process was worthwhile.
Thank you very much for your patience and sustenance.

III
PREFACE
This work is part of the research project The historical origins of clusters in the Basque Country and their
legacy for the competitiveness of the region, led by Jesús M. Valdaliso, started in 2007 with funding from
Orkestra‐Basque Institute of Competitiveness and Eusko‐Ikaskuntza, which, since 2009, has obtained
funding through several research projects of the National R&D&I Plan (MICINN HAR2009‐09264 and
MINECO HAR2012‐30948). It examines the specific historic factors which led to the creation of the
clusters, the evolution they have gradually experienced and the factors on which their competitive
advantage is based. This analysis aims to understand the clusters’ current competitive advantages and to
assess the extent to which these advantages can be sustainable over time. Currently, this project has
become embedded into another, broader one that aims at explaining the driving factors of path
dependence and change in institutions, organizations and territories (MINECO HAR2016‐76198‐P
AEI/FEDER, UE).
The first case studies on some clusters showed that their competitive advantages were due not only to
hard factors such as labor and capital costs, factor productivity or investment in R&D, but also to others
more soft and difficult to measure such as knowledge spillovers or social capital generated in collaboration
dynamics promoted by cluster associations and other mechanisms and institutions (Valdaliso et al., 2010;
Valdaliso et al., 2011; Valdaliso et al., 2012). Besides, there were other studies on cluster associations that
took this approach, (see for example, Aragón et al., 2014). These publications emphasise the critical
importance of social capital as one of the explanatory factors of the competitiveness of clusters, but also
the difficulty of measuring and contrasting it.
In this context, it was increasingly evident the need to carry out a monographic research, in depth, about
social capital. This dissertation is the result of that initiative. Actually, the first idea for the thesis was to
study cluster associations as drivers of social capital in the Basque Country, but finally the project derived
into a multiscalar analysis that starts at the regional level and ends with the case study of a municipality
in the long term.

1
INDEX ABSTRACT ..................................................................................................................................................................... 3
LIST OF TABLES ............................................................................................................................................................. 4
LIST OF FIGURES ........................................................................................................................................................... 5
LIST OF APPENDIXES ..................................................................................................................................................... 6
LIST OF ACRONYMS ...................................................................................................................................................... 7
CHAPTER 1: INTRODUCTION ......................................................................................................................................... 9
1.1. Context of investigation ...................................................................................................................................... 11
1.2. Focus of analysis .................................................................................................................................................. 11
1.3. Research problems and gaps ............................................................................................................................... 13
1.4. Contribution......................................................................................................................................................... 15
1.5. Motivation ........................................................................................................................................................... 16
1.6. Preliminary remarks ............................................................................................................................................ 17
1.7. Outline ................................................................................................................................................................. 18
CHAPTER 2: SOCIAL CAPITAL: THE CONCEPT .............................................................................................................. 21
2.1. Introduction ......................................................................................................................................................... 23
2.2. History.................................................................................................................................................................. 24
2.3. Conceptualisation ................................................................................................................................................ 25
2.4. Levels of social aggregation ................................................................................................................................. 29
2.5. Dimensions of social capital ................................................................................................................................ 32
2.6. Bonding, bridging and linking social capital ........................................................................................................ 35
2.7. Theory of individual social capital ....................................................................................................................... 38
2.8. From individual social capital to corporate social capital ................................................................................... 43
2.9. Regional social capital.......................................................................................................................................... 45
2.10. Criticism ............................................................................................................................................................. 47
CHAPTER 3: METHODOLOGY ...................................................................................................................................... 51
3.1. Introduction ......................................................................................................................................................... 53
3.2. The measurement of social capital ...................................................................................................................... 53
3.3. Data collection for empirical research ................................................................................................................ 55
3.4. Methods for social capital analysis ...................................................................................................................... 60
3.5. Social Network Analysis (SNA) ............................................................................................................................. 62
3.6. Further research considerations ......................................................................................................................... 66
CHAPTER 4: SOCIAL CAPITAL IN THE BASQUE COUNTRY ........................................................................................... 69
4.1. Introduction ......................................................................................................................................................... 71
4.2. Actors and networks of economic governance ................................................................................................... 71
4.3. Stock of social capital in Spanish regions ............................................................................................................ 75
4.4. Stock of social capital in the Basque Country ...................................................................................................... 78
4.5. Social capital in Gipuzkoa .................................................................................................................................... 84

2
4.6. Social capital in a formation centre: IMH ........................................................................................................... 85
4.7. Understanding the paradox ................................................................................................................................ 86
4.8. Conclusion ........................................................................................................................................................... 90
4.9. My research proposal ......................................................................................................................................... 91
CHAPTER 5: MEASURING STRUCTURAL SOCIAL CAPITAL IN A CLUSTER POLICY NETWORK: INSIGHTS FROM THE BASQUE COUNTRY ..................................................................................................................................................... 95
5.1. Introduction ........................................................................................................................................................ 97
5.2. Theoretical discussion ........................................................................................................................................ 98
5.3. The Basque Country: a complex RIS ................................................................................................................. 100
5.4. Methodology and data collection ..................................................................................................................... 101
5.5. Empirical evidence and data analysis ............................................................................................................... 102
5.6. Discussion ......................................................................................................................................................... 106
5.7. Conclusions ....................................................................................................................................................... 109
CHAPTER 6: MEASURING SOCIAL CAPITAL WITH TWITTER WITHIN THE ELECTRONICS AND ICT CLUSTER OF THE BASQUE COUNTRY ................................................................................................................................................... 113
6.1. Introduction ...................................................................................................................................................... 115
6.2. Theoretical discussion ...................................................................................................................................... 116
6.3. Cluster initiatives and social capital .................................................................................................................. 118
6.4. History of GAIA ................................................................................................................................................. 119
6.5. Methodology and data analysis ........................................................................................................................ 121
6.6. Discussion ......................................................................................................................................................... 126
6.7. Conclusions ....................................................................................................................................................... 127
CHAPTER 7: SOCIAL CAPITAL IN EIBAR, 1886‐1985: DIMENSIONS, INSTITUTIONS AND OUTCOMES ..................... 131
7.1. Introduction ...................................................................................................................................................... 133
7.2. Dimensions of social capital.............................................................................................................................. 134
7.3. Informal interaction .......................................................................................................................................... 136
7.4. Methodology .................................................................................................................................................... 137
7.5. Eibar: a short history of a smart town .............................................................................................................. 139
7.6. Analysis of social capital in Eibar ...................................................................................................................... 142
7.7. Conclusions ....................................................................................................................................................... 164
CHAPTER 8: CONCLUSIONS ...................................................................................................................................... 169
i. REFERENCES .......................................................................................................................................................... 179
ii. APPENDIXES ......................................................................................................................................................... 201

3
ABSTRACT
In the last decades, the literature of social capital has comprised a growing number of contributions in
fields as diverse as the theory of organisation, education, health, sociology and economics. In the
economic sphere, the influence of social capital is acknowledged on account of its key role for innovation
since it is a process that highly depends on social action. Simply put, good social relations facilitate
communication, and a network of actors based on trust and common cognitive elements is seen as an
optimal space to share resources that can result in interactive learning.
Social capital is, however, a controversial concept, primarily due to its ambiguity and the subsequent
difficulties for measurement. In order to overcome these limitations, this dissertation introduces an
eclectic approach, involving a set of indicators regarding different dimensions (structural, relational and
cognitive), levels (micro, meso and macro), scales (region and city), agents (cluster‐associations, firms and
individuals), time‐frames (static, short‐term and long‐term) and disciplines (economic history, economics,
evolutionary economic geography, network theory, etc.).
This PhD thesis provides interesting policy implications for public authorities of the Basque Country. First,
it suggests the need for much more rigorous and frequent diagnoses of the cluster structural organisation
conducive to repair the network’s imperfections and monitor the position and role of the actors at
different scales. At the same time, institutions should be aware of informal networking as an alternative
way of bringing regional actors together. Opportunities for casual encounters (online but especially
offline) should be granted and equally measured to ensure the cooperation between companies and
institutions. To this end, the (hi)story of Eibar may be a good mirror to look at.

4
LIST OF TABLES Table 1: Publications that refer to social capital ........................................................................................................23
Table 2: Historical background of the concept of social capital .................................................................................24
Table 3: Key conceptual characteristics of social capital ............................................................................................28
Table 4: Definitions of social capital according to the perspective ............................................................................31
Table 5: Social capital: dimensions, indicators and outcomes ...................................................................................34
Table 6: Main features of bonding, bridging and linking social capital ......................................................................35
Table 7: Other pairs of terms in the dispute between bonding and bridging ............................................................38
Table 8: Minimum requirements for an acceptable measurement tool (SOCAT) ......................................................53
Table 9: Degree of relations with relatives, friends and neighbours (%) 1989‐2014 .................................................79
Table 10: Trust in institutions .....................................................................................................................................80
Table 11: Average social time 1993‐2013 (hours, minutes) .......................................................................................82
Table 12: Happiness and health according to age and social class ............................................................................83
Table 13: Summary of the empirical chapters ............................................................................................................92
Table 14: Descriptive statistics of Figure 8 .............................................................................................................. 102
Table 15: Structural characteristics of Figures 9 and 10 .......................................................................................... 104
Table 16: Structural characteristics of Figure 11 ..................................................................................................... 105
Table 17: NC and PL in regular, small world and random networks ....................................................................... 106
Table 18: Members of cliques and their affiliation to CAs ...................................................................................... 107
Table 19. Survey conducted on affiliates of CAs (questions 17 and 18) .................................................................. 109
Table 20: Most repeated hashtags and words (in italics, hashtags and words in Spanish) .................................... 126
Table 21: Pearson correlation coefficient ................................................................................................................ 127
Table 22: Number and % of ties at the Deba Valley ................................................................................................ 142
Table 23: Mayors of Eibar (1912‐1973) ................................................................................................................... 152
Table 24: Family relations intra and inter firms ...................................................................................................... 153
Table 25: Associations in Eibar ................................................................................................................................ 155
Table 26: Structural and relational indicators ......................................................................................................... 157
Table 27: Connectivity of governing teams in 1918 and 1958 ................................................................................ 158

5
LIST OF FIGURES Figure 1: Origins of SNA .............................................................................................................................................. 63
Figure 2: Social capital per capita in Spanish provinces (2005) .................................................................................. 77
Figure 3: Social capital volume index per capita (year 1983 = 100) ........................................................................... 78
Figure 4: Received aid by provided aid (2012) ........................................................................................................... 81
Figure 5: Model of social capital based on values ...................................................................................................... 84
Figure 6: Main social capital indicators (0‐10) ............................................................................................................ 87
Figure 7: Participation in voluntary activities (formal and informal) in EU‐28 countries (%) .................................... 89
Figure 8: Network of organisations that belong to more than one CA .................................................................... 103
Figure 9: Network of CAs .......................................................................................................................................... 103
Figure 10: Network of CAs ........................................................................................................................................ 104
Figure 11: Network of organisations that share at least 2 memberships in CAs, and have been co‐members in at least one BoDs and one BCP ..................................................................................................................................... 105
Figure 12: Types of network structures .................................................................................................................... 106
Figure 13: Network of following‐followers ............................................................................................................... 123
Figure 14: Network of interaction through mentions (last 3,200 tweets of each user) .......................................... 124
Figure 15: Network of interaction through mentions (April‐August 2016) .............................................................. 125
Figure 16: Contextualising centrality in Twitter ....................................................................................................... 126
Figure 17: Main towns in the Deba Valley ................................................................................................................ 140
Figure 18: Industrial taxpayers by economic activity ............................................................................................... 141
Figure 19: Co‐ownership ties in the Deba Valley ...................................................................................................... 142
Figure 20: Co‐ownership ties in Eibar (1886‐1985) .................................................................................................. 144
Figure 21. Population of Eibar (1842‐2015) ............................................................................................................. 146
Figure 22: Evolution of firm creation in Eibar (c. 1886‐1985) .................................................................................. 147
Figure 23: Students entering at the Gunsmithing School (1913‐2012) .................................................................... 148
Figure 24: Network of entrepreneurs originated from the Gunsmithing School ..................................................... 149
Figure 25: Members of Ezkuadra Zarra with Fermin Calbeton (23 July 1911) ......................................................... 154
Figure 26: The first share of Kerizpe Club issued in 1948 ......................................................................................... 156
Figure 27: Mayor’s firm reachability in one degree of separation (1918) ............................................................... 158
Figure 28: Mayor’s firm reachability in one degree of separation (1958) ............................................................... 159
Figure 29: Origin of investments in companies in Eibar (1886‐1986) ...................................................................... 162

6
LIST OF APPENDIXES Appendix 1: Power distribution in the Basque Country .......................................................................................... 203
Appendix 2: Social capital index in Spanish regions ................................................................................................ 204
Appendix 3: Social capital volume index per capita (year 1983 = 100) ................................................................... 205
Appendix 4: Social capital in the Basque Country in 2012 (0‐10 scale) ................................................................... 206
Appendix 5: Social capital indicators in EU‐28 and some other countries (%) ........................................................ 207
Appendix 6: Social capital survey among former students of IMH ......................................................................... 208
Appendix 7: Cluster, year founded, name of CA and links of websites used to collect data (March 2013) ........... 210
Appendix 8: Top organisations that belong to more than one CA .......................................................................... 211
Appendix 9: Top 19 organisations that (have) belong(ed) to more than one BoDs ................................................ 213
Appendix 10: Top 21 organisations that belong that more than two BCPs ............................................................ 214
Appendix 11: Social capital in cluster associations of the Basque Country (summarised) ..................................... 215
Appendix 12: Top 50 connected GAIA usernames (sorted by Degree GAIA) .......................................................... 217
Appendix 13: Top 50 ranked GAIA usernames in mentions, sorted by Degree GAIA (sample 1) ........................... 218
Appendix 14: Top 50 ranked GAIA usernames in mentions, sorted by Degree GAIA (sample 2) ........................... 219
Appendix 15: Top 50 non GAIA usernames in received mentions by GAIA members (sorted by received and diversity of mentions, respectively) ........................................................................................................................ 220
Appendix 16: Top 50 non GAIA usernames in written mentions to GAIA members (sorted by written and diversity of mentions, respectively) ....................................................................................................................................... 221
Appendix 17: Top 50 ranked hashtags and words ................................................................................................... 222
Appendix 18: The evolution of the machine tool industry in Elgoibar (1914‐2014) ............................................... 223
Appendix 19: Board of Directors at the Gunsmithing School (1912) ...................................................................... 224
Appendix 20: Board of directors of the AAA (1972) ................................................................................................ 224
Appendix 21: Representatives of the Town Council (1938) .................................................................................... 225
Appendix 22: Top 25 of most repeated surnames in registered firms: ................................................................... 225
Appendix 23: Members of “Ezkuadra Zarra” (1911) ............................................................................................... 226
Appendix 24: Cuadrilla Kurdin ................................................................................................................................. 227
Appendix 25: Board of directors of the Casino Artista Eibarres (1919) .................................................................. 227
Appendix 26: Governing team with some health professionals (1955) .................................................................. 228

7
LIST OF ACRONYMS AAA Asociación de Antiguos Alumnos (Alumni of the Gunsmithing School) AFM Advanced Manufacturing Technologies AIEPV Asociación de Industrias de la Electrónica del País Vasco (Association of Electronic industries of the Basque Country) API Application Programming Interface BBVA Banco Bilbao Vizcaya Argentaria BCP Basque Contact Point BERC Basque Excellence Research Centre BoDs Board of Directors CA Cluster Association CEO Chief Executive Officer CES Consejo Económico y Social Vasco (Basque Economic and Social Council) CIC Centro de Investigación Cooperativa (Cooperative Research Centre) CMC Computer Mediated Communication CNAE Clasificación Nacional de Actividades Económicas (National Classification of Economic Activities) EB Eurobarometer EC European Commission ECS Encuesta de Capital Social (Social Capital Survey) ECV Encuesta de Condiciones de Vida (Life Conditions Survey) EPT Encuesta de Presupuestos del Tiempo (Time Budget Survey) ESS European Social Survey EU‐28 28 member states of the European Union Eurostat Statistical Office of the European Union Eustat Euskal Estatistika Institutua ‐ Instituto Vasco de Estadística (Basque Statistic Institute) EVS European Values Study FP Framework Programme GAIA The Association of Industries of Electronics and ICT of the Basque Country Garapen The Basque Association of Local Development Agencies ICT Information and Communication Technonogies Ikerbasque The Basque Science Foundation IMH Instituto de Máquina Herramienta ‐ Makina Herramintaren Institutua (Machine Tool Institute) INE Instituto Nacional de Estadística (National Statistics Institution) Innobasque The Basque Agency for Innovation IVIE Instituto Valenciano de Investigaciones Económicas (Valencian Institute of Economic Research) MICINN The Science and Innovation Ministry of the Spanish Government MINECO The Economy and Competitiveness Ministry of the Spanish Government NGO Non Governmental Organisation NUTS Nomenclature of Territorial Units of Analysis OECD Organisation for Economic Co‐operation and Development PCTI Science, Technology and Innovation Plan PNV Partido Nacionalista Vasco (Basque Nationalist Party) REDES Revista Hispana para el Analisis de Redes Sociales REST Representational State Transfer RIS Regional Innovation System SME Small and Medium Enterprise SNA Social Network Analysis SNS Social Network Site SOCAT Social Capital Assessment Tool SPRI Society for the Promotion of Industry STI Science, Technology and Innovation UNIDO United Nations Industrial Development Organisation UPV/EHU University of the Basque Country WVS World Values Survey


Introduction
CHAPTER 1


Introduction 11
CHAPTER 1: INTRODUCTION
1.1. Context of investigation
In the global knowledge economy, no single actor possesses all the necessary knowledge, but is to some
extent dependent on interaction with others. Between 25 and 30 years ago, the traditional approaches of
innovation systems concentrated strongly on the components within the structure, that is, organisations
(i.e. universities, private firms, regional agencies, etc.) and institutions (Lundvall, 1992). Now, we know
that their interactions are important determinants of innovation processes (Asheim and Coenen, 2006;
Westlund, 2006; Edquist, 2011) and innovation policy should not only focus on the actors of the systems,
but also on the relations between them.
Institutions have an important role in facilitating connectivity, too. If organisations are not operating
smoothly enough, their interaction should be enhanced by means of policy. The state may, for example,
support collaborative centres and programmes, remove barriers to cooperation, and promote the
mobility of skilled personnel between different organisations. Moreover, recent proposals based on
innovative proceedings have opened a new framework, giving rise to the social innovation approach.
According to Moulaert and Nussbaumer (2008) it is not possible to consider the value of economic
development processes without understanding the social and spatial reality in which they take place. In
this vein, a wide range of innovative institutional arrangements have emerged, which differ from
traditional centralist policy‐making and result in new governance modes beyond the state (Swyngedouw,
2005). This means that vertically directed interventions from the public sectors are transiting towards
more flexible and multidimensional modes where the state and regional public administration is one
among other actors (Estensoro and Zurbano, 2010). Thus, learning is now understood much more as an
informal and bottom‐up process, diffused across a wider range of actors (Muthusamy and White, 2005).
Nevertheless, several analyses of Regional Innovation System (RIS) processes stress the limited
involvement of firms and civil society in the early phases of RIS3, and the strong leadership of governments
(for example, see Aranguren et al., 2016 about the case of the Basque Country). These studies underline
the necessity of participative mechanisms that engage and connect the different agents of the quadruple
helix (government, firms, formation centres and the civil society). Accordingly, in the framework of the
Europe 2020 strategy, academic research is needed in order to design appropriate methodological tools
facilitating the assessment of RISs and their connectivity. Improved procedures could bring up more
precise diagnoses guiding the specialisation processes of different European territories (OECD, 2011).
Similarly, this assessment can also be helpful for the orchestration of less favoured regions towards unique
paths of regional advantage (Asheim and Parrilli, 2012).
1.2. Focus of analysis
The spatial concentration of innovation and actors has been one of the main concerns of economic
geography literature. The cost of interaction decreases with accessibility, which is a function of distance,
transport mode, communication alternatives and other preconditions for communication (e.g. language
barriers, education, administrative barriers, time differences, etc.). This way, interaction among actors
within a region tends to be higher than interaction among actors from different regions. Additionally, for
conventional theories, co‐location may provide internal scale economies and, particularly important,
agglomeration externalities of different nature (Fujita et al., 2001). Alfred Marshall (1890, in Martin and
Sunley, 2003) identified three types of externalities: localised knowledge spillovers, proximity to
supporting trading partners, and specialised labour pooling. Since then, the literature in this field has
grown exponentially, resulting in the proliferation of approaches and conceptualisation (sometimes
overlapping) to describe and understand this phenomenon (Alberti et al., 2008): innovative milieux
(Maillat, 1995; Capello, 1999); industrial district (Piore and Sabel, 1984; Becattini, 1990); entrepreneurial

12 CHAPTER 1
system (Spilling, 1996); regional/national innovation system (Cooke, 2001; Lundvall et al., 2002; Edquist,
2005); industrial cluster (Porter, 1998) or learning region (Asheim, 1996).
As further explained in section 1.5, this dissertation basically follows the cluster conceptualisation due to
the fact that it mainly targets the cluster policy applied by the Basque Government since the 1990s.
Clusters are said to boost productivity, innovation, employment and growth (Porter, 1998; Maskell and
Malmberg, 1999; Giuliani and Bell, 2005), and consequently they have come to occupy a prominent
position in policy agendas during the last three decades. In addition, OECD (1999, 2007) reports to
promote the development of cluster policies and the Lisbon Strategy considers clusters as one of the main
instruments to convert European economy in the most competitive and dynamic knowledge‐based
economy in the world (Sölvell et al., 2009).
Although geographical proximity eases interaction, it is neither a necessary nor a sufficient condition for
knowledge flows (Boschma, 2005). Innovation and knowledge are chiefly associated historically with the
local context, but agglomeration and clustering per se do not guarantee interaction and learning (Oinas,
2002). In this line, there is an increasing awareness that (different kinds of) networks enhance knowledge
diffusion and innovation. A fundamental addition to localised learning is the so‐called dispersed learning
(Amin and Cohendet, 1999). As firms spread out their borderlines to incorporate a broader set of sources
of knowledge, they ought to embrace both sources in close proximity and those situated anywhere else
(Woolcock, 1998). This need for both local “buzz” and “pipelines” to global knowledge has also been
underlined by Bathelt et al. (2004). In effect, access to knowledge and technology locked up in other
locations is especially hard to acquire (Malmberg et al., 1996) and to achieve that, it is essential to
“anchor” projects, that is, to create a milieu that is both locally autonomous and capable of existing within
a network of distant interactions (Crevoisier and Jeannerat, 2009).
Additionally, there is another circumstance that makes networking even more important: networks no
longer have to be physical but can be created online, and digital ecosystems have formed a new scenario
on the socioeconomic panorama worldwide (Barrutia et al., 2016). Since the Internet Revolution,
Computer Mediated Communication (CMC) provides another way to get in touch and platforms such as
Facebook, WhatsApp, Twitter, Youtube and Instagram have become very popular lately. There is still an
open debate about the effects of these applications, but the truth is that, if used accurately, they offer
cheap access to a broader network that we would not be able to contact otherwise (Donath and Boyd,
2004). With the rise of this relational approach, many studies have focused mainly on ties and network
structure and have largely ignored the quality of these ties. The norms and values affecting interaction
are characteristics of communities that shape the professional and social environment of people (Florida,
2002) but they have remained unexplored until quite recently. Depending on the kind of shared identity
they nurture, they constitute a conducive or a detrimental atmosphere for learning (Inglehart and Baker,
2000). In sum, taking a relational perspective on the Knowledge Economy 2.0 demands closer
consideration of the spatial reach of networks and the nature of the links (Benneworth et al., 2014).
In this context, there is a concept, originally from Sociology, which has been discussed recently in a large
number of academic disciplines related to the space‐and‐learning literature: social capital. There is a
broad set of definitions around this term, but simply put, if capital is defined as a store of value that
facilitates action, then social capital is the value of relationships (Coleman, 1988; Baker, 1990). While
human capital encompasses individual ability, social capital deals with opportunity. Social capital may
operate at the level of an individual, a team, an organisation, an industry, a community, a nation, or an
entire economy (e.g., Coleman, 1988; Putnam, 1993). Whatever the focal subject is, the social capital
theory suggests that players gain access to various resources that accrue to them by virtue of their
engagement in various kinds of relationships (Gabbay and Leenders, 1999). Individuals with more social

Introduction 13
capital get higher returns on their human capital because they are positioned to identify and develop
more rewarding opportunities. At the firm level, strategy theorists have described the role of social capital
in developing intellectual capital (Nahapiet and Ghoshal, 1998) and in giving access to resources otherwise
unavailable to the firm (e.g., Starr and MacMillan, 1990; Uzzi, 1999). And at the macro level, societies may
benefit from social capital since it can enhance values such as solidarity, trust or associationism (Putnam,
1993).
Generally speaking, the main thesis of this PdD work is that social capital inheres in personal relations and
is a productive asset facilitating some forms of social action while inhibiting others. In particular, this
dissertation aims to accomplish a longitudinal study of the connectivity in different agglomerated
situations at the macro, meso and micro level, and to see if it can be a relevant factor in explaining the
past and present economic performance.
The field work has been carried out in the Basque Country, an Autonomous Community of northern Spain.
It includes three Historical Territories or Basque Provinces: Bizkaia, Gipuzkoa and Araba. It has almost 2.2
million inhabitants representing about 4.7% of the total Spanish population (INE, 2017a) and is currently
one of the wealthiest regions in Spain, with GDP per capita 32.7% higher than the Spanish average (INE,
2017b) and 9.7% above the EU‐28 average (Eurostat, 2017). Since the 1980s, its regional government has
taken responsibility for various important areas of policy and has had the highest degree of financial
autonomy in the EU (Aranguren et al., 2012; Morgan, 2013). Under the current regulations, the Basque
Government is wholly responsible for education, public health, justice, pensions and policing, and as such
it has extensive tax‐raising powers. To compensate for the areas of provison that are still funded from
Madrid, the Basque Country must make an annual payment to the Spanish government equivalent to
6.24% of State spending, approximately the proportion of Spanish GDP that the Basque Country accounts
for (Zubiri, 2010).
1.3. Research problems and gaps
In the last years, the term of social capital has become the focus of surveys and policy initiatives and has
been discussed in numerous studies. Nonetheless, intellectual and academic success does not come
without some controversy and, in my opinion, the idea of social capital presents basically two main
problems: its theoretical conceptualisation and its measurement.
Social capital is quite a complex and fuzzy concept and academics do not agree when delimiting its
meaning. One question that often causes some confusion is the multilevel nature of social capital and the
way in which mechanisms intertwine at different levels. This breakdown is relevant because social capital
as an individual resource opposes social capital as a collective attribute of communities and societies.
While the micro perspective focuses on the relational structure of the focal subject and the resources the
individual can access and is able to mobilise, the macro highlights certain attributes that have the potential
to favour the smooth functioning of the economy and society. Another debate discusses whether the
resources derived from a network should also be considered part of the concept, or if social capital is only
reduced to the structure of relationships. On top of that, this ambiguity is multiplied by the inaccurate use
of some terms that, occasionally, have a different meaning depending on the author who has coined them
or the context where they are used.
The second problem concerns the way in which social capital is measured. Its abstract nature hampers
the identification of proxies that can approach the concept and, even when they are selected, researchers

14 CHAPTER 1
sometimes dispute about how they should be used and interpreted. This fact has arisen an open criticism
questioning the empirical rigor of some papers.
This dissertation intends to address these questions by setting a clear framework of study. The empirical
part comprises 3 papers that tackle the macro, meso and micro perspective, respectively. At the same
time, social capital theory is accurately split into the three dimensions (structural, relational and cognitive)
introduced by Nahapiet and Ghoshal (1998) and, additionally, each one of these dimensions is approached
by different measuring techniques. The structural dimension is gauged through Social Network Analysis
(SNA), a method for investigating social structures through the use of networks and graph theory.
Relational elements like trust, reciprocity and feelings of unity have been tackled by accessing primary
and secondary data sources. And third, cognitive data have been mainly compiled through personal
interviews and a hard documentary work involving archival sources.
Further investigation gaps have been detected in the revision of the literature about social capital. First
of all, studies of social capital have traditionally focused on the individual as the unit of analysis, and it
was only in the 1990s when, in the context of business networks, emphasis was placed on the social capital
of corporations and of the private and public organisations that support them. Since then, hundreds of
papers have targeted this issue but unfortunalely, social capital is too often used as a mere metaphor
instead of really disentangling the interaction patterns established between the actors (Burt, 2001; Sobel,
2002; Lamikiz, 2017). Similarly, I have identified another research weakness related to Economic
Geography: much is written about the proximity effect of clusters or other policies that seek to create a
collaborative environment, but, in my opinion, it is striking that only a small number of academic works
have attempted to integrate their structures, either locally, regionally, nationally and even internationally.
In this sense, the social capital perspective and the network theory can help to capture the cooperation
processes and the governing dynamics among clustered organisations and institutions.
In order to go deeper in the analysis of relationships at the firm level, the economic context needs to be
clearly established and in my view, that requires studying the specifities of the terrain in the long term.
History matters and path dependency is relevant in explaining the type of activities firms undertake, the
strategies they follow and the opportunities they perceive (Boschma, 2004). In this respect, evolutionary
approaches have emphasised the importance of incorporating a longitudinal perspective into research
strategies, but regrettably we economic historians still find far too many papers that ignore the cumulative
processes of the past and lack a correct interpretation of the territory.
Academic research on cognitive components is surprisingly scarce, too. Social and cultural aspects such
as language, ethnicity or identity have proved to be key elements both for the development of formal and
informal relations (Malecki, 2012), and an investigation into social capital should pay more attention to
this dimension because it may explain the mechanisms through which tacit knowledge is spread and
innovative routines are developed over time.
Finally, the technologies related to the Internet are another interesting field to be analysed. They offer
new spaces for interaction and a comprehensive study of social capital should consider the numerous
social networking websites and software applications that have come into being in the last ten years or
so. Understanding the patterns of virtual communication can shed light upon the architecture of affinities
on the net and, more importantly, the potential relationships that can be built based on values like trust,
reciprocity and solidarity. These epigenetic dynamics are said to be important for adaptation to turbulent
environments (Gómez Uranga et al., 2016).

Introduction 15
1.4. Contribution
It is not easy to frame this dissertation in the context of the most recent discussions about social capital
in Spain, because in Spanish the translation of the term (capital social) is also the translation of “share
capital” (British English) or “capital stock” (US English). Therefore the results of an Internet search using
capital social as a keyword inevitably reflect this dual meaning, making it difficult to gauge, at least at first
glance, the scope of the works that deal with the socioeconomic rather than financial concept.
Nevertheless, there are some contributions that indisputably deserve recognition. The Autonomous
University of Barcelona (UAB) and the University of Seville has published the journal REDES (Revista
Hispana para el Análisis de Redes Sociales) ever since 2002, in which several interesting studies have
appeared, mainly concerning research on social networks. From this structuralist standpoint, one should
also note the remarkable work done by several scholars at the University of Granada, identifying business
and financial networks from a longitudinal perspective. Similarly, the BBVA Foundation and IVIE (Instituto
Valenciano de Investigaciones Económicas) have done a great job estimating historical series of social
capital. Concerning values and attitudes related to social capital, there are a number of university
departments that have investigated the political and social participation in Spain. Most of them aim to
measure participation itself, and perhaps the work of Mota and Subirats (2000) should be highlighted for
their interpretation in terms of social capital.
At the regional level, Eustat (the Basque Institute of Statistics) has carried out, since 2007, a survey that
is specifically focused on social capital, in tandem with other polls that indirectly provide rich information
about values and norms. To tell the truth, it is an absolute priviledge to have a statitical institute in charge
of regular analysis of public opinion. The same applies to Orkestra (the Basque Institute of
Competitiveness), which investigates the orchestration of public and private agents in favour of economic
development. And finally, the University of the Basque Country, University of Deusto and Mondragon
University have also published several manuscripts approaching economic relationships from the supply
side.
In the context of this background, this thesis makes a number of conceptual, methodological and empirical
contributions. First, regarding the theoretical framework, I present an interpretative scheme (Table 5)
that conflates the structural, relational and cognitive dimensions of social capital distinguished by
Nahapiet and Ghoshal (1998) together with a list of indicators that may be employed to approach the
different facets comprised in each one of these three dimensions. As previously stated, this construction
is a contribution towards clarifying the conceptualisation and operationalisation of social capital and sets
the basis for the subsequent manuscripts in the empirical part.
Second, regarding the methodological setting, I combine the evolutionary approach of economic
geography with network theory. Innovation is a cumulative process, (Storper and Venables, 2004), path‐
and place‐dependent (Staber, 2007, Valdaliso et al., 2014), chiefly localised and associated historically to
the local context. It must be recognised, however, that the tacit nature of knowledge and routines implies
that spillovers do not occur automatically (“in the air”) but rely on transfer mechanisms, such as inter‐
firm collaborations, professional networks and labour mobility (Capello, 1999; Giuliani and Bell, 2005).
Therefore, with the application of SNA to clusters, we can visualise the dynamic of interactions among
clustered (and nonclustered) actors and measure the structural properties of the network topologies over
time.
Furthermore, my analysis introduces numerous indicators to estimate social capital in its different
dimensions. Some of them have already been used by other authors (i.e. co‐ownership ties,

16 CHAPTER 1
associationism, etc.), but I also dare to use several original proxies such as tweets, mayors’ egonets, old
photographs and evidences to support local stories and beliefs.
And third, the empirical analysis attempts to make several advances concerning the connectivity of agents
at different levels. At the regional scale, I present, for the first time, the configuration of the most
connected actors in the cluster policy network in the Basque Country. Within the case analysis of a
particular cluster, I examine the role played by the cluster association and other companies and
stakeholders. And the last empirical paper aims to study the influence of informal networks in a given
territory in (i) supporting the relationships between top managers, (ii) preserving the local entrepreneurial
spirit and (iii) enhancing cooperative values. These results may have some implications for policy‐makers
in order to design policies conducive to the generation of spaces of collaboration that might complement
public initiatives.
In sum, this dissertation is based on an eclectic approach forged in a theoretical synthesis that includes
various facets of social capital. As it is further explained in chapters 3 and 4, the thesis comprises different
levels, scales, agents, time frames, dimensions and disciplines. By means of the pertaining combination of
these perspectives, a specific investigation context is established, seeking the best approximation to the
research objectives that are pursued in each one of the empirical papers.
1.5. Motivation
This work is mainly inspired by the cluster policy implemented by the regional government about twenty
years ago. As stated above, the Basque Country is a special entity within Spain and the EU, enjoying a
broad autonomy when it comes to taxation and the design of its industrial and innovation policies (Parrilli,
2013). In the late 80s and early 90s, the Basque Country was immersed in a recession as a result of the
loss of their traditional competitive advantages. Its industry mostly competed on cost, and it was
necessary to develop new advantages and sustainable differentials in order to compete in the
international market and meet the significant challenges that lay ahead, among which was the impending
consolidation of a common European market. Thus, in the 1990s, regional policy‐makers designed a
Porterian cluster policy adapted to the region‘s industrial footprint and heading towards its specialisation.
The specified aim of the new strategy was the improvement of the competitiveness of firms through
cooperation in strategic projects related to three main areas: technology, quality management and
internationalisation. The operationalisation of these practices was led by several cluster associations
financed by a mix of public and private sources: respectively the Department of Industry, Trade and
Tourism (DITT), and the membership fees proportionated to the firm’s size (Aranguren, 2010). In 2016,
the firms formally affiliated with cluster associations accounted for 1.28% of all Basque companies but
32.23% of total employment (Eustat, 2016; Orkestra, 2017).
Cluster associations have had a significant impact in recent decades. With only a relatively small financial
investment of around 2.5 million Euros (Orkestra, 2017), the Basque Cluster Policy generates valuable
mechanisms for dialogue and cooperation among distinct public and private agents, giving rise to a better
adaptation of the public policies to the needs of the private companies and a better acknowledgement of
the policies by the latter (Aranguren, 2010). But despite these important achievements, cross‐clusterprojects fostering related variety are still scarce and, so far, there is little evidence of inter‐cluster
collaboration in the Basque Country. Therefore, several sectors are likely to confront risky positions
originated by lock‐in situations (Martin and Trippl, 2014; Morgan, 2013).

Introduction 17
Against this backdrop, academic research is motivated by the need to design appropriate methodological
tools facilitating the assessment of RISs and their connectivity. An imperative starting point is the
identification and assessment of systemic imperfections that might slow down or even block interactive
learning and other activities that are crucial parts of innovation processes. Thus, these macro‐category
problems could constitute a cornerstone for designing and legitimising regional innovation policy
intervention (Tödtling and Trippl, 2005; Edquist, 2011). A second procedure assesses the presence (or
absence) of intermediary organisations and monitors their activity, tapping into the system problems
presented before. And third, innovation management studies describe the lack of capabilities of managers
and executives when it comes to operating private organisations and external networks (Burt, 1992;
Saxenian, 1996). As a consequence of their limited size and/or resources, and/or their location, companies
often lack the knowledge, the capabilities and also the networks necessary in order for them to make
correct managerial decisions.
The aggregation of these categories allows the construction of a cross‐cutting tool that involves different
actors and perspectives. In fact, the empirical part of this thesis is structured in this way. First, a general
analysis of the connectivity within the cluster policy is performed. The central agents of the network are
mapped and I attempt to explain the reasons for their centrality and the roles that they play. In the next
step, I concentrate on one particular cluster to see how affiliates interact on Twitter, a new means for
getting in touch that is increasingly popular. And third, after a contemporary and pioneering analysis, I
delve into the history of a given territory in order to study the formal and informal relationships between
top corporate leaders over the past 100 years.
There are other key decisions I made during the course of this thesis that deserve a further explanation
so that the readers can understand better some choices that, in principle, may seem made at random. In
chapter 6, GAIA (the electronics and ICT cluster) was selected for being one of the most mature, advanced
and dynamic association within the cluster policy of the Basque Country. In a previous article released by
the research group, Valdaliso et al. (2011) found social capital to be a key element to increase the
absorptive capacity of a cluster, but at the same they acknowledged the difficulty to measure social
networks, especially those of informal nature. This chapter therefore constitutes an original tentative to
overcome this obstacle and map social networks within GAIA.
Finally, the industrial district of Eibar has been chosen as the basis for chapter 7 due to multiple reasons.
First of all, I wanted to include a historical analysis in my dissertation because I am a member of the
Economic History and Institutions department at the University of the Basque Country and I am very
interested in longitudinal and diachronic economic processes. In this sense, Eibar offers a unique
opportunity to explore the (hi)story of a municipality with a long industrial tradition and a very special
entrepreneurial identity. Additionally, in 2004 I worked for Danobat, a machine tool manufacturer in the
nearby town of Elgoibar, and I live now in Mutriku, a little village on the coast of the Deba Valley, so I am
familiar with the industrial heritage of the area. Furthermore, my closeness to Eibar and San Sebastian
has been helpful when performing the data collection.
1.6. Preliminary remarks
As introduced so far, this is a multidisciplinary study that covers several research areas (social capital,
network theory, economic geography, sociology, management…) and I acknowledge that, even though I
try to keep the highest coherence with various conceptualisations derived form these fields, I sometimes
do not apply the most precise refinement of those concepts because it could further complicate an already
complex analysis. For example, it is the case of the “three Cs of Togetherness”: coordination, cooperation

18 CHAPTER 1
and collaboration. I distinguish the coordination and the other two concepts since I see it as an initial
process prior to making something together. Additionally, I am aware that “co‐operating” and “co‐
elaborating” do not mean the same (the first concept suggests sharing while the second comprises a
marked notion of creating something new) but I employ them indiscriminately since social capital is said
to facilitate both knowledge exchange and innovation.
SNA is another arena that is detailed with precision in the academic literature. Some terms have been
defined very specifically but they have not been echoed sufficiently (or, conversely, have been applied
only in certain fields) to establish a universaly accepted meaning in academia, which has led to some
overlapping conceptualisations. It is the case with the five types of brokers identified by Gould and
Fernandez (1989): liaison, itinerant, coordinator, gatekeeper and representative. Hanneman and Riddle
(2005) introduce two further bridges: cosmopolitans and boundary spanners. It goes without saying that
I have not paid attention to every single characteristic of each one of these cases. Instead, I have mainly
named bridging nodes as gatekeeper or brokers. A similar situation can be found when referring to subsets
of points in a graph. Wasserman and Faust (1994: 249 et seq.) list up to eight different notions (social
groups, subgroups, cliques, n‐cliques, n‐clans, n‐clubs, k‐plexes and k‐cores) but I just use the first three
terms with the same meaning: a strongly connected group of nodes. Equally, inter‐firm contacts have also
been dissected in three categories (links, ties or relationships) depending on whether the nodes are
mediated by firms or humans (Pennings and Lee, 1999: 50). Again, I simply use these concepts as synonims
of “connection”. And finally, I make no distinction between “indicator” and “proxy”. There is really a wide
interpretation of what proxy means: according to Unicef1, it is an indirect indicator, but Stone (2001: see
page 58 in this dissertation) defines it as a direct indicator. Thus, away from this disparity, I have employed
them as equivalent notions.
The vocabulary in economics and management can be very sensitive, too. Business, company, firm,
enterprise… one term might work better than another depending on the context but I make use of all of
them interchangeably. Likewise, there are different ways to denote a collective grouping. Here,
“organisation” is understood in the broadest sense of the term and can include other types of
collectivities: institutions, that is, local, regional, national or supra national authorities with public
responsabilities; associations, ergo, groups of individuals (members) who voluntarily enter into an
agreement to accomplish a purpose; companies or equivalent concepts mentined above; and other
entities such as universities, technology centres, etc. which are best referred to by their precise names.
Finally, as I specify in the section above, I have deliberately chosen not to embark on a lengthy discussion
of the various forms of economic agglomerations created through geographic proximity. Literature on this
topic is so extensive that, after noting the different concepts introduced by some scholars, I simply limit
the scope of this dissertation to study clusters, as this is the term most frequently used in the Basque
Country.
1.7. Outline
My PhD thesis is structured as a compendium of 3 publications (chapters 5, 6 and 7), which form the core
of this dissertation. The first paper was written together with my supervisor Jesús M. Valdaliso, and the
other two are single authored.
1 www.ceecis.org/remf/Service3/unicef_eng/.../2‐3‐1_indicators.doc (last seen: 19/01/2018).
Introduction 19
In chapter 2, fefore the empirical part, I offer a theoretical reflexion on social capital literature. I refer to
the multifaceted nature of the concept and I highlight different levels, dimensions and degrees in which
social capital may operate. A model of social capital is then introduced in order to explain how social
capital works at the individual and organisational level, and later on, the role of social capital in regional
economic development is underlined. I conclude by clarifying and giving my opinion about some common
criticisms frequently directed towards the concept of social capital.
Chapter 3 introduces the methodological aspects that should be taken into account when measuring
social capital. Seminal studies have become increasingly diverse and several methods for data collection
and analysis are presented. Later on, SNA is introduced as a fairly new option to explain the causal relation
between the sources and resources of social capital. Finally, I end up making some comments based on
previous methodological procedures.
Chapter 4 examines the state of the art in Spain and the Basque Country and basically aims to display the
stock of social capital in the region. Firstly, the dense administrative structure is disentangled at the
regional, territorial and local scale, highlighting the most relevant actors and the networks in which they
are involved. Later on, the relational and cognitive dimensions of social capital are approached through
secondary data collected from official statistics websites. This information confirms some hypotheses
advanced in the literature about RIS and establishes the basis for the following empirical part. It is at that
point that I present my research proposal.
In chapter 5, I and my supervisor Jesús M. Valdaliso set out to provide a glimpse of the structure and
connectivity of the Basque cluster policy network from a macro perspective. To do so, we examine the
firm affiliation among 12 strategic clusters. In this static research carried out in 2014, we intend to study
the topology of the network and see if there are structural holes that obstruct communication within the
system. Similarly, we aim to identify the central agents, uncover the reasons for their centrality and,
moreover, explain the role that they play.
Once the general picture is drawn, chapter 6 is devoted to study social capital within one particular cluster
in a very original way: analysing the interaction between affiliated firms on Twitter. The messages (tweets)
were collected in two different moments, the objective being to identify basic mechanisms of network
change and how they affect the structural properties of that net. In addition, this publication seeks to
explore the correlation between intention and interaction, or to put it another way, between structural
and relational social capital. Furthermore, the paper includes a qualitative analysis of the most
commented words and hashtags.
The last empirical chapter has a totally different setting. The objective is to study the prosopography of a
territory in a longitudinal perspective. The paper focuses on the Deba Valley in Gipuzkoa, and more
specifically, in Eibar, an old industrial town. The latter is known for its socialist values and strong
collaborative ethos, and my hypothesis is that the informal networking channels and the sharp
cooperative and entrepreneurial spirit were determinant factors for the success of the local industry
throughout a large part of the 20th century.
Finally, in chapter 8 I put forward the main conclusions from my PhD work and the implications for policy‐
makers. I finish by suggesting possible paths for further research in the near future.


Social capital: the concept
CHAPTER 2


Social capital: the concept 23
CHAPTER 2: SOCIAL CAPITAL: THE CONCEPT
2.1. Introduction In the last decades, the theory of social capital has been widely studied in scientific articles, essays,
monographs and doctoral theses. If we check the core collection of the Web of Science2, there were
15,140 references to the topic “social capital” up to 2017 – falling into categories such as Sociology (1,915),
Management (1,832), Economics (1,634), Business (1,447) and Public Environmental Occupational Health
(1,437) – and the number of publications on the subject has grown exponentially since 1991.
Table 1: Publications that refer to social capital
Source: Elaborated by the author with data from the Web of Science.
The potential importance of social capital for the economic development and growth has been a major
reason for the increased interest (Woolcock, 2001). Social capital is a concept that raises the issue of
embeddedness, that is to say, the contribution the social dimension makes to the economy. This problem
underlies one of the classic academic debates and the work of Karl Polanyi (1944) is a point of reference
when it comes to framing economic fact within social reality. For Polanyi, all economic life is intertwined
in a cloud through which social institutions and networks flow. The American sociologist Mark Granovetter
(1985), for its part, was concerned with the extent to which economic action influences (and is influenced
by) the structures of social relations. In both their works, economic and social processes are mixed in such
a way that it is impossible to separate them. In the same vein, the theory of social capital proposes that
economic action is situated in the social field and should never be explained solely in terms of individual
motivations. Individuals are social beings, and therefore their economic actions are undertaken within a
network of relationships of differing types and intensities.
As in the work of Grootaert (2001: 9), for example, the natural, physical and human capital have
traditionally been taken as the basis for the economic development. In the last decades, however, it has
become evident that there is another factor at work, not explained by the empirical results from those
others forms of capital, and this “missing link” would appear to be social capital. Actors and institutions
are linked through different kinds of relations explicit in structures or in organisation charts. But there is
another unwritten reality where people and institutions are embedded. This has been of great importance
in understanding why regions, communities, cities, certain social groups or individuals with comparable
resources and attributes attain different outcomes, even undertaking similar initiatives. The explanation
lies in culture, social relations, norms and trust, which are components of social capital.
2 https://webofknowledge.com (last seen: 03/02/2018).
0
200
400
600
800
1000
1200
1400
1600
1800
1991
1992
1993
1994
1995
1996
1997
1998
1999
2000
2001
2002
2003
2004
2005
2006
2007
2008
2009
2010
2011
2012
2013
2014
2015
2016
2017

24 CHAPTER 2
Two side effects can arise from the flexible and expanding nature of social capital. One effect promotes
its theorisation and measurement, but the other can make the concept walk on a tightrope due to its
catch‐all frame (Staber, 2007). In this sense, a concern often expressed in much of the research into social
capital is that a lack of a solid theoretical basis might cast a shadow over the concept, eventually making
it appear “faddish” or almost “trivial” (Lin and Erickson, 2008: 2).
2.2. History As shown in Table 2 below, social capital is a general concept linked with the work of academics such as
Tocqueville (associative activity), Marx (social class), Tonnies (community value), Durkheim (forms of
solidarity), Dewey (educational asset), Simmel (group identity) and Weber (hierarchy and power) (Portes
and Sensenbrenner 1993; Putnam, 1995; Knack, 2002). However, Lyda Judson Hanifan‘s idea of social
capital can be considered the earliest and the closest in meaning to the present‐day concept, sharing most
of its components (Putnam, 2003: 11). Hanifan‘s view of social capital was based in positive externalities
that assets like goodwill and social interchange produce in helping to satisfy community needs and
fostering development. More specifically, inspired by the work School and Society written by the
philosopher and educator John Dewey, she pursued a civic dream that could place education at the centre
of public life so as to compensate for the lack of social capital in the rural districts (Farr, 2004: 12).
More recently, Jane Jacobs (1961) and economist Glen Loury (1977) were the first authors to attribute to
social capital the features that have since been accepted by the main researchers in the field, even though
the concept still seemed to require a more systematic elaboration. Jacobs, an urban planner, used the
term to emphasise that residential community’s social capital played a significant role deterring crime,
and she underlined that the effect was spontaneous, unplanned and unintentional. And in the 1970s,
Loury used this concept to refer to resources that are linked to family relationships and are used for the
cognitive and social development of young people during their childhood and adolescence.
Table 2: Historical background of the concept of social capital
CHRONOLOGY AUTHOR(S) CONTRIBUTION
1832 Tocqueville Analysis of American dynamic association life on how citizens‘ active participation can contribute to democracy.
1867 Marx Study of the social classes in order to explain the strength or weakness of solidarity among the oppressed.
1887 Tönnies Relevance of types of social relations assigned respectively to the community (Gemeinschaft) and society (Gesellchatft).
1897 Durkheim Description of mechanical solidarity and organic solidarity, both rooted in different types of norms, obligations and structure.
1899 Dewey Educational proposal for social progress.
1908 Simmel Forms of social interaction in order to find a possible frame for the study of associations.
1916 Hanifan Benefits and advantages that the community and individuals derive from each other.
1922 Weber Long‐term market advantages by virtue of group membership.
1944 Polanyi Relationships between economic systems and how individuals relate to one another.
1961 Jacobs Value of informal networks in the modern metropolis.
1977 Loury Systematic analysis of social capital as an explanatory factor in inequality and racial exclusion.
Source: Author’s compilation based on Portes and Sensenbrener (1993), Putnam (1995), Knack (2002) and Farr (2004).

Social capital: the concept 25
The 1980s saw the concept of social capital emerge more clearly, with a solid analytical basis, and this was
when the authors covering the subject began to proliferate, followed by others who made a more
systematic contribution to the concept. As a result, social capital has become a broad concept that can
lead to misspecification and confusion. Therefore, any discussion should start with the conceptualisation
of the term, usually traced by the seminal contributions of Pierre Bourdieu, James Coleman, and Robert
Putnam.
2.3. Conceptualisation
The contributions of these three scholars are reviewed thoroughly in the next below, followed by a critical
review of common tenets and the main diverging points of their underlying ideologies.
2.3.1. Pierre Bourdieu
Pierre Bourdieu offered a first hint to the term in what he called provisional notes‖on social capital (1980).
From a sociological perspective, Bourdieu stated that societies’ economic capital is made up of wealth,
cultural capital (education level etc.) and, finally, social capital that he refers to as relations (Bourdieu,
1980: 2). Later, in the paper The forms of Capital‖(1986), his analysis on the concept adopted a more
sketched form where he initiated the transition of the concept from the economy theory. As he titled on
his paper, social capital is another inseparable form of the different kinds of capitals that he distinguished
in order to clarify the dynamic of the social reproductions of inequality. More specifically, for Bourdieu,
social capital is “the aggregate of the actual or potential resources which are linked to possession of a
durable network of more or less institutionalised relationships of mutual acquaintance and recognition”
(Bourdieu, 1986: 248). The idea of social capital offered an explanation of why two people with similar
amounts of economic or cultural capital could achieve differing outcomes. These differences derive from
what might commonly be thought of as influence or relationships, which is the ability of individuals to
mobilise the rich capital of a more or less institutionalised group and exert control over the future of
oneself or other individuals.
According to Bourdieu’s definition (1986) there are three essential elements that need to be specified in
order to understand the scope of his proposal: the membership of a group, the existence within it of
material and symbolic exchange relationships and the degree to which the group is institutionalised. First,
Bourdieu considers membership of a group or a network of relationships an indispensable requirement
for the existence of social capital. Unlike the economic and cultural capital that an individual may possess,
accessing social capital requires the existence of a group or a lasting network of social relations. For
Bourdieu, the distinguishing characteristics of such groups included their relative stability and
permanence (that is, their institutionalisation); their relatively precise boundaries (which distinguish them
from other groups and which their members are keen to preserve); and, above all, their possible link with
broader social differences so as to incorporate the profit sought by those individuals or social classes.
It should be pointed out that Bourdieu conceived social capital as an element that generates returns. In his definition, social groups in possession of social capital are not merely a broad network of
acquaintances or neighbours, for whom the rules of courtesy require some reciprocal treatment. Instead,
they are constituted and maintained by self‐sustaining acts of exchange and in order for social capital to
play its role, a network must be able to mobilise resources. As for the question of what kinds of resources
are involved, he distinguishes two benefits (material and symbolic) but neither is precisely defined. More
broadly, he points out that material benefits may be "all the types of services accruing from useful
relationships", while symbolic benefits might be "those derived from association with a rare, prestigious

26 CHAPTER 2
group" which enhances mutual knowledge and recognition among its members and establishes the
boundaries of the group (Ibid: 250). Such exchange takes the form of a seemingly disinterested, gratuitous
and voluntary give‐and‐take which, in reality, generates a series of lasting obligations that rely either on
“durable obligations subjectively felt (feelings of gratitude, respect, friendship, etc.) or institutionally
guaranteed (rights)” (Ibid: 250).
As highlighted before, Bourdieu regards institutionalisation as a major feature of social capital. Diffuse
social relations, motivated by physical or social proximity, would not be sufficient to generate social
capital, and nor would the simple sociability among acquaintances that other authors have considered to
be part of social capital (e.g., Putnam, 2002). The dynamics of such relations of exchange require, and at
the same time produce, a certain institutionalisation of the group, which comes about through the
"application of a common name" or by "a whole set of instituting acts" (Ibid: 248). For Bourdieu, for such
relations to be transformed into capital relations, they should be based on “the reacknowledgment of a
minimum of homogeneity" (Bourdieu, 1986: 248‐249) among those involved, articulated by exchange
relations so as to create a more or less institutionalised group.
2.3.2. James Coleman
Coleman came up with a systematic formulation of the concept of social capital in a paper published in
1988 in the American Journal of Sociology and returned to it in his 1990 book Foundations of Social Theory.
His concept of social capital offered two theoretical possibilities: a vertical and horizontal explanation.
The former derives from his approach of the micro‐macro problem, where social capital is defined by its
function. “It is not a single entity but a variety of different entities, with two elements in common: they
all consist of some aspect of social structures, and facilitate the realisation of certain actions for the actors
(whether individuals or corporate actors) within the structure" (Coleman, 1988: 98). The horizontal
explanation, on the other hand, depicts the distinguishing feature of social capital in its instrumental
character. Accordingly, social capital exists where any aspect of social structure contributes to the
achievement of the goals of the actor. To illustrate the existence of social capital, Coleman introduces the
example of the sales networks in a market of Cairo, which allow the customer to transmit any demand for
a good to any seller (Ibid.: 100).
Despite the broad explanatory power that Coleman attributes to the concept, he introduces certain
dimensions of its scope. While accepting that every relationship and structure of social life can generate
social capital, there are certain facilitators of action that perform this function better than others. In his
1988 article, he distinguishes between three main forms of social capital: a) obligations and expectations;
b) information channels; c) norms and effective sanctions (Ibid.: 101). The first form of social capital arises
in contexts of exchange. Coleman describes a hypothetical situation in which, if an actor does a favour for
another, (s)he may come to expect a reciprocal favour while the other may feel obliged to reciprocate.
This obligation, for Coleman, can be considered as a "credit slip" acquired by the former to be covered by
the latter and it can be understood as social capital. Their existence, however, is affected by two factors:
how trustworthy the social environment is and to what extent the obligations are contracted (Ibid.: 102).
The second form of social capital is the information potential inherent in social relations. Coleman argues
about the benefits for actors in order to reach their goals simply by accessing the information in
possession of their contacts and social relations, without necessarily establishing relations of reciprocity
in terms of obligations and expectations (Ibid.: 104). The third form of social capital consists of effective
rules and sanctions. Rules restrict certain actions and stimulate others. For example, norms that inhibit
crime facilitate walking on the street at night; norms that recognise high school performance promote, in
turn, the educational task (Ibid.: 104). In his work of 1990, Coleman adds three more forms of social
capital. He suggests that authority relations might be considered a source of social capital because an

Social capital: the concept 27
actor may transfer the control rights over certain actions (these control rights are social capital that is
available to the actor who receives them). Finally, social organisations can also be understood as social
capital, both intentional (such as business organisations where it is invested with an expectation of profit)
or associative experiences whose accumulated organisational resources are useful for undertaking other
purposes (Coleman, 1990: 311).
One of the clearest contributions of Coleman is the notion of closure, that is, the property of the social
structure that implies the existence of sufficient ties between a certain number of people to guarantee
the observance of norms and promotion of trustworthiness that can result in the proliferation of
obligations and expectations. He recognizes the application of social capital to broader contexts, but he is
more interested in the cohesive value of social capital against the instrumentality of new and
contemporary social organizations. There is also one other aspect of Coleman's theory that must be
considered: his view that social capital can be created, maintained or destroyed. In general, social capital
diminishes if it is not subject to constant maintenance, just like any other kind of capital: "social relations
die out if not maintained; expectations and obligations wither over time; and norms depend on regular
communication" (Ibid.: 321). Coleman argued that the main factors influencing this dynamic might be the
closure of social relations, the stability of social structures, and ideology.
2.3.3. Robert Putnam
Putnam incorporated the concept of social capital into his book Making Democracy Work (1993). As he
put it in the introduction, he aimed to establish "what are the conditions for creating strong, responsive,
effective representative institutions" (Ibid.: 6). He wanted to understand the factors that influence the
performance of democratic institutions and, more especifically, to explain "why some democratic
governments succeed and others fail" (Ibid.: 3). In Italy, Putnam found that the geographical distribution
of successful regional governments was not random. Roughly speaking, the most successful governments
were in the north of the country and the most inefficient in the south, coinciding in part with the
traditional difference between the prosperous, industrialised north and the less developed, less
integrated south. According to conventional explanations from the realm of political science, different
socioeconomic conditions would be sufficient to explain the divergences in institutional performance, but
for Putnam this thesis was incomplete because it neglected the hybrid cases: successful governments in
regions that were not so socioeconomically advanced, and governments in relatively wealthy areas whose
performance were less efficient. To understand these phenomena, Putnam believed that a new variable
must be employed: the civic community (Ibid.: 86).
He characterised the civic community as one in which citizens have a high civic commitment, assume and
act equally in political terms, possess a high degree of solidarity, trust and tolerance levels and place
significant emphasis on associationism in public life (Ibid.: 86 et seq.). However, at the end of the book he
makes an unexpected step and connects his notion of "civility" with Coleman's idea of social capital,
although his appropriation is selective and adds new elements. Putnam defines social capital as “features
of social organization such as networks, norms and social trust that facilitate coordination and
cooperation for mutual benefit” (Putnam, 1995: 67). For him, the core of social capital is to be found in
civic engagement and participation in both horizontal and vertical associations. In communities with
strong social networks and associations, citizens are involved in public affairs and play an active role in
the political sphere. Mutual trust is thereby built up, and the extent to which laws are obeyed is also
significant.
Putnam's central idea in terms of capital is simple and clear: social networks are vital and have value,
especially for those who are in them. Through relationships, individuals form bonds of relationships that

28 CHAPTER 2
serve their own interests and also benefit the community they belong to. Social networks are therefore
links that people create and maintain in response to private and collective needs. As noted above, in
addition to a private background, social capital also has a public face through which individuals can obtain
benefits due to the fact of living in a community with good links (Putnam, 2000).
Putnam’s work has shown that community networks (clubs, churches, parents’ associations, literary
circles, choral groups or football teams) support the strong rules of reciprocity, and that associations have
the potential to generate and spread collaborative behaviour. Trust is an essential component for that
purpose, (Putnam, 1993: 170) and its importance is illustrated by credit systems; in such systems, people
provide fixed amounts of money periodically that are given out in turn to each one of them. Although it
is possible that an individual might abandon the system once they have received their share, this does not
usually happen. Risks are minimised by the existence of trust, strong rules and networks of reciprocal
commitment that result in obligations being fulfilled.
The differences between Italian regions in terms of institutional performance and economic development
are then partially explained by their differing endowments of social capital. According to Putnam, civic
life, based on high doses of trust, reciprocity and networks of commitment, is a factor strongly associated
with economic prosperity. Contrary to some theses that assert that associationism and social self‐
organisation reduce the effectiveness of government and impede economic development, Putnam’s
research shows that “norms and networks of civic engagement have fostered economic growth, not
inhibited it” (Ibid.: 176).
2.3.4. One concept, different perspectives
As it can be perceived in the previous approaches, the theoretical specifications of social capital have
progressed to a stage of recognising different perspectives that focus on several featuring elements and,
at the same time, stress particular effects derived from social interaction. In order to clarify the principal
interpretations, Table 3 provides a summary of some conceptual characteristics underlined by Bourdieu,
Coleman and Putnam. More specifically, their contributions are compared in relation to how they define
social capital, the social scale at which they analyse the concept and the purpose for which they employ
it.
Table 3: Key conceptual characteristics of social capital
Definition Analysis Purpose
Bourdieu Resources that provide access to institutionalised outcomes
Individuals from different classes
To ensure economic and cultural capital
Coleman Aspects of social structure that facilitate certain actions
Individuals within families and communities
To ensure human capital
Putnam Features of social organisation that facilitate cooperation
Regions within a nation To ensure social democracy and economic development
Source: self‐elaboration.
Actually, there are some general overlapping perceptions in the respective visions of Bourdieu, Coleman
and Putnam. They refer to similar social processes and by no means should be regarded as contradictory
definitions. For example, the assertion that social relations created among people can provide valuable
resources for the achievement of certain purposes is a common premise for all three authors. Bourdieu
believes that these relations arise as a result of reciprocal acts of exchange between people, while
Coleman (with his analysis of obligations and expectations) and Putnam (with his focus on the norms of

Social capital: the concept 29
generalised reciprocity) echo that idea. It is also the case that the three authors share a dynamic view of
social capital, as a set of resources that can be created, maintained or destroyed.
Nevertheless, these similarities are outweighed by profound differences in perspective when it comes to
the characterisation of social capital and its alleged effects. First and foremost, there is a difference in the
scale of observation: the starting point of the theory in both Bourdieu and Coleman is the actor, meaning
that social capital comprises advantages that an individual extracts or mobilises according to his/her
interests. With Putnam, on the other hand, the focus of observation is on broader social aggregates and
although social capital may lead to individual benefits, it is more understood as a collective advantage of
the community.
One should also note a remarkable divergence when it comes to sustain a conceptualisation of social
capital. Bourdieu’s notion is always adhered to resources that come from the group to which that person
belongs, which rightly give social capital the character of capital. In Coleman's view, it is about features of
the social structure that the actor uses to achieve personal purposes. Finally, the definition of Putnam
oscillates between the idea of resources (or derived benefits) and factors that could be considered more
properly as constitutive of social capital (such as networks, trust, norms, etc.). This distinction divides
“structuralists” and “interactionists” (Rutten et al., 2010: 863). The former believe that a person with
many connections has more social capital because these connections provide access to resources and
opportunities. In addition, since connections are a characteristic of people, individuals can “own” social
capital. Interactionists, on the other hand, emphasise that individuals cannot own social capital because
it is the outcome of social interaction. The interactionist view therefore draws attention to norms, values,
trust, etc., that shape social interactions.
Another interesting difference lies in the purposive economic action associated to the concept. In
Bourdieu’s vision, social capital is presented as a multiplier that would account for differences in economic
or cultural capital. For Putnam, social capital manages to elucidate why certain communities reach higher
levels of economic and democratic development than others. In contrast, Coleman saw social capital as a
key explanatory factor of social mobility that, by the way, could help to understand why some students
would perform better at school than what should be expected from their socio‐economic background.
Therefore, Coleman focuses mainly on the use of social capital for educational purposes and economic
outcomes are not cited (at least directly) in his idea.
Lastly, Ramírez (2005) highlights the differing valorative meanings comprised in the three approaches. In
Coleman and Putnam, the concept takes a clear positive connotation. Coleman recognises that an
individual may accumulate control rights over certain actions of others and thus, the social capital held by
one actor could be comparatively higher than that possessed by another. In the society level concept of
Putnam, differences in social capital within a group or between groups are shadowed by a large‐scale
comparative vision of an entire community where social capital cannot be a good distributed unevenly
among its members. Bourdieu was more careful than Coleman and Putnam in assigning some sense of
value to his notion and he maintained the idea of social capital as an analytical tool to account for broader
processes linked to the dynamics of social classes and power.
2.4. Levels of social aggregation
The above theoretical formulations of Bourdieu, Coleman and Putnam are characterised by definitions at
varying social scales: respectively the individual level, community level and national context. This

30 CHAPTER 2
breakdown is relevant and leads to the first major classification in the theory of social capital, according
to the level of social aggregation that is taken into account.
The scope ranges from the micro‐ and meso‐ levels to the macro‐level, as reviewed by Grootaert and van
Bastelaer (2001). The micro perspective, also known as the individual or network approach, is generally
classified as an aggregation of personal involvement in voluntary associations. As stated in section 2.3.1,
the most outstanding reference within this expository line is Pierre Bourdieu, but social capital as an
individual resource is reflected in many other definitions that rest on two identifiable elements: the
individual as the main subject of the benefit and the social network as the entity that extracts the benefit.
However, in this interpretation, several authors differ when it comes to defining precisely what social
capital is, since some identify it with the extent of the networks previously constructed by the person that
facilitates the access to a pool of resources (Boxman et al., 1991; Burt, 1992; Belliveau et. al, 1996), while
for others social capital consists of resources that the individual obtains from such networks (Bourdieu,
1986; Baker, 1990; Nahapiet and Ghoshal, 1998; Lin, 2001). Therefore, we can speak of networks or
resources as key elements, depending on the vision.
The social capital approach at the meso level highlights the benefit that it generates in the community,
compared to the previous one that conceives it as merely an individual resource. It refers to groups in a
given community such as clubs, associations and civic groups and its axis of study is the social organisation,
in which a set of resources not only serves the individual subject but also favours cooperation and the
global operation. Apart from the definition of social capital provided by James Coleman, which fits this
meso perspective, other authors have proposed definitions that also match the idea of social capital as a
"community resource": Paldam (2000: 635) defines social capital as "ease for cooperation"; for Uphoff
(2000: 232) social capital is a "social infrastructure" that makes it possible to achive common goals in
groups and organisations; Fukuyama (1995) identifies social capital as “the ability of people to work
together for common purposes”; Woolcock (1998) and Bowles and Gintis (2002) believe that it consists
of information, trust and norms of reciprocity that are inherent in the social network that favours
cooperation; and Brehm and Rahn (1997: 999) talk about the "web of cooperative relationships".
Finally, macro‐level social capital perceives it as a resource that benefits the broad socio‐economic
aggregate. Without abandoning the benefits that it generates at the individual and group levels, it also
conceives it as a "macrosocial" and "macroinstitutional" asset (Woolcock, 2001, and Van Deth, 2008). In
this sense, this proposal argues that social capital is important for democracy, institutional performance,
market articulation and economic development. Putnam is an exponent of this approach, but there are
also other authors who have defined social capital at the macro level. They all highlight certain attributes
of social capital that have the potential to favour the smooth functioning of the economy and society,
such as its marked cultural character (Inglehart, 1997), its capacity to act as a glue (Serageldin, 1996;
Dasgupta and Serageldin, 1999) or the ways in which it can promote citizenship and exchanges in a society
(Knack and Keefer, 1997; Grootaert and Van Bastelaer, 2002).
Despite the general agreement in the literature when identifying three levels of analysis, Leana and Van
Buren (1999) emphasise that the difference between the meso and macro levels is insignificant.
Consequently, they propose another classification with only two levels: the micro level, on the one hand,
and the meso/macro level, on the other, which groups all those works that focus on the social unit,
whether groups, communities, countries, regions or states. Whichever the criteria for classification is, any
investigation into social capital must clearly establish the range of analysis, and additionally must clarify
the mechanisms that intertwine at different levels, since social relations generate effects both at the
general level of society as a whole and at the individual level (Pena and Sánchez, 2013).

Social capital: the concept 31
In the last two decades there have been significant attempts towards a consensual orthodoxy in social
capital theory, with an increasing general consensus among scholars backed by significant empirical
efforts (Portes, 2000; Woolcock, 2001; Lin and Erickson, 2008). In order to facilitate later the discussion
of the multifaceted and multidimensional nature of social capital, it is appropriate to introduce the work
of some other significant writers on the subject. Table 4 below briefly classifies these authors in
accordance with their level of analysis:
Table 4: Definitions of social capital according to the perspective
PERSPECTIVE AUTHOR DEFINITION OF SOCIAL CAPITAL
MICRO
Baker “A resource that actors derive from specific social structures and then use to pursue their interests” (1990: 619).
Belliveau, O’Reilly and Wade
“An individual’s personal network and elite institutional affiliations” (1996: 1572).
Boxman, De Graaf and Flap
“The number of people who can be expected to provide support, and the resources those people have at their disposal” (1991: 52).
Burt “Friends, colleagues, and more general contacts through whom you receive opportunities to use your financial and human capital” (1992: 58).
Knoke “The process by which actors create and mobilize their network connections within and between organisations to gain access to other social actors’ resources” (1999: 18).
Lin “The resources embedded in a social structure that are accessed and/or mobilised in purposive actions” (2001: 29).
Nahapiet and Ghosal
“The sum of the actual and potential resources embedded within, available through and derived from the network of relationships possessed by an individual or social unit” (1998: 243).
Portes “The ability of actors to secure benefits by virtue of membership in social networks or other social structures” (1998: 6).
Rose “The stock of formal or informal social networks that individuals use to produce or allocate goods and services” (1998: 3).
MESO
Bowles and Gintis
“Trust, concern for ones associates, a willingness to live by the norms of one’s community and to punish those who do not” (2002: 420).
Brehm and Rahn
“The web of cooperative relationships between citizens that facilitates resolution of collection action problems” (1997: 999).
Fukuyama “The ability of people to work together for common purposes in groups and organisations” (1995: 10).
Paldam “The ability to work voluntarily together with others for a common purpose in groups and organisations” (2000: 635).
Portes and Sensenbrenner
"Those expectations for action within a collectivity that affect the economic goals and goal‐seeking behaviour of its members” (1999: 1323).
Schiff “Set of elements of the social structure that affects relations among people and are inputs or arguments of the production and/or utility function” (1992: 160).
Uphoff “An accumulation of various types of social, psychological, cultural, cognitive, institutional, and related assets that increase the amount (or probability) of mutually beneficial cooperative behaviour” (2000: 216).
Woolcock “The information, trust and norms of reciprocity inhering in one’s social networks” (1998: 153).
MACRO
Grootaert and Van Bastelaer
“Institutions, relationships, attitudes and values that govern interactions among people and contribute to economic and social development” (2002: 2).
Inglehart “A culture of trust and tolerance, in which extensive networks of voluntary associations emerge” (1997: 188).

32 CHAPTER 2
Knack and Keefer
“The level of trust in a society” (1997: 1256).
Serageldin “The “glue” that holds societies together” (1996: 196).
World Bank “Institutions, relationships, and norms that shape the quality and quantity of a society’s social interactions… Social capital is not just the sum of the institutions which underpin a society – it is the glue that holds them together” (2007)3.
Thomas "Those voluntary means and processes developed within civil society which promote development for the collective whole" (1996: 11).
Source: author’s compilation.
2.5. Dimensions of social capital Although there is no consensus among the above authors when it comes to a precise definition of social capital, they do agree it comprises a network of relationships and the actual or potential resources that may be mobilised through that network. Basically this conceptualisation makes a distinction between structural aspects (that is, connections between people or networks) and cultural components (obligations, social norms and values, trust etc.), but in practice this dichotomy proves to be a broad characterisation because available models rely on distinct indicators and several authors emphasise certain components more than others. On top of all that, there is a lack of consensus in the use of terms, which can lead to confusion. For example, Grootaert and van Bastelaer (2002) employ the cognitive dimension to refer to shared norms, values, attitudes, beliefs and trust, attributes that belong to the cultural field. Meanwhile, some other authors add a third dimension (relational social capital), which incorporates trust and trustfulness (Nahapiet and Ghosal, 1998; Liao and Welsch, 2005). As a result, it is a high research priority to clarify the dimensions of social capital in order to guarantee a mutual understanding and a minimum basis of consensus for empirical studies in this area. Among the most widely adopted is the typology of Nahapiet and Ghoshal (1998), who, based on
Granovetter’s (1992) discussion of structural and relational embeddedness, propose three dimensions for
social capital: a structural dimension, a relational dimension and a cognitive dimension.
Structural dimension: This dimension reflects the overall pattern of connections between actors
(network ties and configuration, appropriable organisation), that is, the extent to which the individuals
in an organisation are connected to each other and are able to access the social capital of others. This
aspect of social capital refers to the role played by networks among the members of an organisation,
i.e. with whom and how often the members of an organisation share information and resources
(Coleman, 1990). The types of relationship existing in an organisation influence access to information
and knowledge (Nahapiet and Ghoshal, 1998), as well as access to aid/assistance from other members
of the organisation (Walker et al., 1997).
Relational dimension: This dimension refers to the kind of personal relationships people have
developed with each other through a history of interactions (trust, norms, obligations, identification).
It reflects how relations, like a whole series of interactions, are characterised by trust, reciprocity and
emotional intensity (Bolino et al., 2002; Moran, 2005). One of the main attributes of this dimension is
the level of trust existing among the individuals of an organisation in the organisation itself and in
members that make up the organisation (Leana and Van Buren, 1999; Nahapiet and Ghoshal, 1998).
Generally speaking, organisations with a high level of social capital exhibit high levels of widespread
trust; there are high levels of trust among peers, and even among individuals who are only indirectly
3 This definition has been removed from the website of the World Bank.

Social capital: the concept 33
related to each other (Leana and Van Buren, 1999). Members of organisations with high levels of social
capital trust the rules established by the organisation and the behaviour of its members (Putnam,
1993).
Cognitive dimension: This is related to the common context shared by members of an organisation,
such as common language, a common narrative, etc. (Moran, 2005). This dimension depends on the
features of the organisation that facilitate the adoption of collective goals and the subordination of
personal interests to those of the organisation (Tsai and Ghoshal, 1998). Thus, when the members of
an organisation share such elements, the transfer of ideas and knowledge among its members will be
more effective.
Structural, relational and cultural dimensions are not simply conceptualised as different features of social
capital, but as highly (causally) interdependent characteristics. The link between the structural dimension
and the relational dimension is a two‐way relationship. Tsai and Ghoshal (1998) found that the structural
dimension of social capital affected the relational dimension inside a large firm. An actor occupying a
central location in the firm’s network was likely to be perceived as trustworthy by other actors in the
network. They also found that the shared vision, the major manifestation of cognitive social capital,
positively influenced trust and trustworthiness. Later, Tsai (2000) found that relational social capital
breeds structural social capital. A trustworthy member may be able to create links more quickly with
other, strategically related units because trust reduces appropriation concerns and fosters cooperation.
Nevertheless, not all dimensions of social capital are mutually reinforcing. For instance, an efficient
network in structural terms (e.g. an online network) may not be the best way to develop the strong
relational or cognitive social capital that may be necessary to ensure the effective operation of such
networks (Nahapiet and Ghosal, 1998).
For the sake of clarity of exposition, I consider, in the following analysis, the impact of each dimension of
social capital independently of the other dimensions. The main argument of this work is that social capital
resides in the relations between and among persons and is a productive asset that facilitates some forms
of social action and inhibits others. Table 5 summarises the main outcomes that can be reached by each
one of the three dimensions, and the principal agents and institutions involved. The effects and benefits
(or handicaps) of social capital are further deepened in sections 2.7, 2.8 and 2.9, where the theory of
social capital is introduced.
The structural dimension is associated with various forms of mutually beneficial collective action (inter‐
firm business relationships, online interaction between individual, etc.) which is the stream of benefits
that results from social capital (Uphoff, 2000: 218). The structural dimension especially helps in accessing
necessary resources for multiple purposes. Without ties and interaction, an actor is not able to access
resources located beyond their normal boundaries. An interesting concept is also that of network
morphology, which describes the density, hierarchy and connectivity of the linkages. Focusing on this
dimension could reveal whether network ties are present between units, and what the network
configuration is like. Thirdly, the ability to use ties created in one context in another context enhances the
creation of intellectual capital.
The relational dimension refers to motivation to combine and exchange. It is evident in patterns of
behaviour, e.g., trust, willingness to cooperate and in its maximum expression, the habit of contributing
to a common effort even if no one is watching. For example, two companies may have a similar position
in the network, but they may differ in the degree to which they trust their network partners, and therefore
also in their willingness to share knowledge and other resources. In general, the greater the amount of
relational assets built into dyadic relationships, the greater will be the dyadic absorptive capacity, and the

34 CHAPTER 2
greater the amount of learning and knowledge acquisition that is likely to occur (Dyer and Singh, 1998).
Trust is a mediator, a dynamic agglutinative factor that leads to the ultimate goal of collaboration. Norms
may also create a general attitude or expectation about the behaviour of individual in a social system that
can promote networking. Nahapiet and Ghoshal (1998) likewise mention that obligations and
expectations, as well as identity and identification are prominent facets for reciprocity and mutual
support.
Table 5: Social capital: dimensions, indicators and outcomes
Dimensions Facets Indicators Main positive outcomes
Structural Network ties Inter‐firm relations (businesslike) (1), (2), (3), (4), (5)
1. Information exchange (lower information and
transaction costs)
Structural Network ties Interlocking directorates, contacts in online social networks
(1), (2), (4)
2. Easier access to resources
Structural Network ties Local authorities and educational centres (1), (2), (3)
Structural Network ties Labour mobility, spin‐offs (1), (4), (5)
3. Collective action and collaboration
Structural Configuration Cliques, Small Worlds (1), (2), (4)
Structural Appropriable organisations
Schooling relationships (1), (2), (6)
Relational Trust Family ties (4), (5), (7)
Relational Trust Friendship ties, associability, interaction in online social networks (4), (5)
4. Interactive learning and (codified) knowledge
creation
Relational Norms Collective adoption of manufacturing norms and standards
(1), (3), (4) 5. Absorptive capacity
(imitation)
Relational Obligations and expectations
Mutual commitment (7), (8) 6. Transfer of resources,
group coordination Relational Identification Joint values and spirit (7), (8)
Cognitive Shared codes Common base of knowledge, knowledge communities, communities of practice
(4), (9) 7. Specific reciprocity
Cognitive Shared language
Shared conceptual apparatus (9)
8. Institutional security and support
Cognitive Shared narratives
Beliefs, stories and metaphors (9)
9. Interactive learning and (tacit) knowledge creation
Source: self‐elaboration, based on Nahapiet and Ghosal (1998: 251).
Finally, cognitive social capital facilitates a common understanding of collective goals and of proper ways
to interact with one another. A joint vision allows parties to see the potential value of combining their
resources, and it further helps them to cooperate better by creating more opportunities to exchange
knowledge and making it easier to avoid possible misunderstandings. Having a shared language and
narratives may also be helpful when it comes to transferring knowledge and thus increasing the
intellectual capacity of the actors.

Social capital: the concept 35
2.6. Bonding, bridging and linking social capital
There is a third classification that separates bonding social capital, bridging social capital (Gittel and Vidal,
1998: 10) and linking social capital (Woolcock, 2001: 13‐14). This classification concerns the differing
degrees of intensity, reciprocity and formality in interpersonal relationships (Lin, 2008) and is useful in
order to understand the differentiated functions developed by each category of social capital. Table 6
displays their principal features:
Table 6: Main features of bonding, bridging and linking social capital
Characteristics of attributes among nodes
Type of tiesDensity of the
relation
Variety of shared
resources
Cost of maintenance
Bonding social capital
Homogeneity Strong Very high Very low Very low
Bridging social capital
Heterogeneity Weak Low High High
Linking social capital
Heterogeneity (power differential)
Very weak Very low Very high Very high
Source: self‐elaboration. Bonding social capital is a relational framework based on the micro level and featured in the category of
informal interaction, which refers to the social ties that exist outside the context of formal organisations.
It is characterised by the homogeneity of nodes that are linked and the strong bonds created as a result,
normally in primary groups such as family and intimate friendship. The cost of maintaining these relations
is low since the attributes among nodes are similar, but it turn the variety of shared resources is low.
(Granovetter, 1973; Lin, 2008). Given the social proximity of actors, bonding ties are very often associated
with frequent interpersonal relationships, which can lead to confusion. To belong to the same group or
to be homogeneous in certain aspects does not necessarily imply a high interaction frequency. Any
reference to bonding social capital should therefore pay attention to the nature of the ties rather than
the actors who are connected.
There are two main ways of approaching this concept. Some researchers point out that bonding social
capital refers to the resources people can obtain from relationships within their group (Adler and Kwon,
2002). On the other hand, bonding social capital as a social network can be interpreted in various forms:
the internal ties within collectivities (Adler and Kwon, 2002: 19); the social circle (Lin, 2008: 60);
interactions with you own kind (Uslaner, 2008: 104); inwark‐looking and exclusive groups of similar people
(Warren, 2008: 133); close ties in small cohesive communities (Wolleb, 2008: 374), etc.
An additional distinction can be made within the concept of bonding. Nan Lin (2008) separates between
binding social capital (very strong, familiar and confident bonds) and bonding social capital (a mixture of
strong and weak bonds). Nevertheless, it is more common, however, to employ the latter term to cover
both meanings.
Bridging social capital consists of social links that are formed at the intergroup level between individuals
and collectivities that are outside our closest social environment. For this reason, this type of social capital
is taken to be indicative of weak ties. As in bonding, those links can be diverse: relationships with less
intimate acquaintances, associates and colleagues (Woolcock, 2002, in Foschi, 2008: 473); people across
diverse social cleavages (Warren, 2008: 133), etc. Due to the lower social proximity, the relations
characterised by affection, altruism and quasi‐unconditional reciprocity are less problable. In contrast, the

36 CHAPTER 2
resouces provided by the network of relationships are more heterogeneous, and bridging relations stress
the opportunities for social mobility, collective action, access to information, the dissemination of
knowledge and the promotion of social cohesion.
Finally, linking social capital is a term introduced by Michael Woolcock to refer to the relationship between
individuals and/or groups of individuals such as the government, banks, insurance agencies and the court
(Woolcock, 2001: 13)4. The element that characterises linking social capital is the more formal background
where this type of connections may operate, and their hierarchical structure (Castiglione, 2008b: 563).
Linking social capital has been assigned the capacity to obtain a very high variety of resources, ideas and
information from actors that are outside the community, and may be helpful for the inclusion of
marginalised groups in decision making and service delivery (Lowndes and Pratchett, 2008: 685). Overall,
this vision rightly proposes a relational framework at the macrosocial level that covers the space occupied
by bonding and bridging social capital at the micro and meso‐levels.
2.6.1. The dilemma: bonding or bridging?
As stated above, there is a dilemma when referring to the horizontal dimension of social capital, with
authors taking differing approaches to the question of whether to stress the use value of bonding social
capital or bridging social capital.
There is one significant approach that presents social capital as a cohesion force, and another that depicts
it as an integration process in the community. In the initial systematic treatment of the concept by
Bourdieu and Coleman, there is a clear focus of those tight relations emerging traditionally in small social
groups, such as in family and small communities. Nevertheless, in recent decades, the successors to
Bourdieu and Coleman have equally stressed the effective role played by looser social relations, not
presumably for social control purposes or for the maintenance of group cohesion but for the expansion
of social opportunities in broad contexts. Granovetter (1973: 1378) points out that weak ties are
nevertheless important when it comes to an individual’s career advancement or their integration into
society more generally. Acquaintances provide direct opportunities for mobility within a stratified society
and generally these weak ties act like bridges between separated networks. In the same way, Burt (1992:
65) coins the expression “structural holes” to refer to those weak connections between groups in the
structure of networks of friends, colleagues or acquaintances that at certain moments can provide
individuals with opportunities for advancement. Society is like a market and these structural holes are like
relational advantages that confer upon individuals or actors better competitive abilities as they have
access to other distant groups and they can broker the flow of information between them (Burt, 2001:
34‐35). These authors demonstrated how loose social networks, characterised by weak ties of obligations
and expectations, are an important means of achieving resources, what is more or less what social capital
is all about. These contributions claim a bridging social capital in which social relations tend to be distant,
less frequent or not embedded in tight ties of obligations, where actors probably do not share many of
the characteristics that they would in a family or any relatively small homogenous social group.
There are identical antagonisms among other pair of terms that stress this dispute between bonding and
bridging (see Table 7). Adler and Kwon (2002: 19) differentiate external and internal linkages of a focal
actor, depending on whether the focus is primarily on (i) the relations an actor maintains with other actors
or (ii) the structure of relations among actors within a collectivity. A focus on external relations (which is
the counterpart of bridging social capital) foregrounds social capital as a resource that inheres in the social
network tying a focal actor to other actors. From this viewpoint, the actions of individuals and groups can
4 Authors such as Szreter (2002) identify it as a type of bridging social capital, but of a more vertical nature.

Social capital: the concept 37
be greatly facilitated by their direct and indirect links to other actors in social networks, and this can help
explain the differing degrees of success enjoyed by individuals and firms in their competitive rivalry. In
contrast, in accordance with the focus on internal ties within collectivities (equivalent to bonding forms
of social capital), the social capital of a collectivity is in its internal structure, namely in the linkages among
individuals or groups within the collectivity and, specifically, in those features that give the collectivity
cohesiveness and thereby facilitate the pursuit of collective goals (Ibid.: 21).
The concept of dense versus tenuous social capital highlights the different degrees of interaction that can
exist between people who share the same social space. There is greater capital density when the networks
linking a certain group of people are narrower and more varied. Conversely, tenuous social capital
comprises occasional contacts between people, limited to a certain purpose and context (Lin, 2001: 67).
The dichotomy between intragroup social capital and intergroup social capital (Granovetter, 1973;
Sánchez and Pena, 2005; Durlauf, 2008; Uslaner, 2008) unequivocally approximates two different versions
for interpersonal interactions. Intragroup interactions address the internal influences generated by the
groups and the resources that members can derive from them, without taking into account their relation
with foreign people and communities (Durlauf, 2008: 598). On the other hand, intergroup interactions are
cooperative relationships that link several groups or collectivities. For example, in the case of a company,
its intra‐group social capital can be studied, observing its structural and cognitive elements (relations
among employees, trust and internal cooperation, codes of conduct, norms...), and equally its intergroup
social capital can also be analyzed: the links with other firms, suppliers and customers, and the trust
established with such agents.
At the firm level, Fürst et al. (2001: 47) distinguish between two patterns of social capital according to
indicators like centrality, cliques or betweenness. There are regional actors with a “mobile social capital”,
that is, they mostly have globally oriented relationships in a very flexible and spatially sparse network
structure with low levels of trust. By contrast, those regional actors with a noticeable inward integration
have a “stationary social capital” that implies higher level of interpersonal trust and reciprocity. For these
authors the most effective regional actors are those that possess mobile social capital and are able to
make it stationary.
The differentiation of homophily and heterophily relations tends also to coincide with the distinction
between strong ties more present in the core of the network structure and the weak ties dispersed in the
periphery. Homophily means that people who are similar in certain sociodemographic aspects (gender,
social class, profession, ethnic group, nationality, etc.) are more likely to relate to each other (Lazarsfeld
and Merton, 1954, in Lozares and Verd, 2011: 31‐32). In the context of emerging interpersonal relations,
in general we do not consciously choose whom to interact with and yet we are driven to relate to people
like us, creating homogeneous social groups. By contrast, people more different from us are more socially
distanced from these socio‐spatial communities; this phenomenon is heterophily, the prominence of
alters with different attributes to the ego. For Popielarz (1999) the basic understanding of heterophily is
that people meet different people through organisational participation and the major source of turnover
in the organisational networks are the weak ties. Thus, an organisation comprising diverse people or
collectives enhances the opportunities for individuals to interact with others who are socially distant from
them. Equally, the greater the number of organisations to which an individual belongs, the higher level of
heterophility (s)he has in his/her personal network.
There is another classification that relies essentially on an understanding of the fundamental networking
principles of bonding and bridging relations. It has to do with two different purposes or goals that social
capital can serve: instrumental and expressive (Lin, 2001: 58 et seq.). In instrumental action, the purpose
is to obtain additional or new resources (e.g. getting a better job, a promotion, or building a new school

38 CHAPTER 2
or clinic). In expressive action, the purpose is to maintain and preserve existing resources (e.g. to preserve
one's marriage, or to keep the neighbourhood safe). The network strategy for expressive action is easily
understood: to bind with others who share similar resources, who are sympathetic to one's needs to
preserve resources, and who are prepared to provide support or help. Therefore, the expectation is that
binding and bonding relations should be useful for accessing and mobilising necessary resources for
expressive actions (Lin and Ensel, 1989). The network strategy for instrumental action, however, is more
complex. For some, the ties among intimate relations in the inner layer are rich in resources; for others,
the resources are poor. For inner layers with embedded rich resources, then binding and bonding relations
should also enhance instrumental actions. For others, resources in such layers may be poor or insufficient
to achieve instrumental goals. In such cases, bridging relations or networks with linkages to the outer
layers of the networks offer possible routes to acquiring different and better resources.
Finally, a very problematic distinction is the conceptualisation proposed by Anderson and Jack (2002: 193)
of social capital as both the glue and the lubricant of social interaction (the former in the sense that social
capital has a structural component that unites individuals, and the latter in the sense that the possession
of social capital would lead to richer relationships). This perception may have opposing elements: how
can a glue which binds become a relational artefact? If it is a glue, it is to be anticipated as fixed rather
than fluid; static rather than process; a bond rather than a conduit. Yet, the literature suggests that social
capital fulfils both roles, contending that once the social structure is formed, social capital flows within it.
It could be therefore hypothesised that, somehow, social capital metamorphoses from a thing (bond) into
an agent (catalyst or friction reducer) of interaction and exchange.
Table 7: Other pairs of terms in the dispute between bonding and bridging
AUTHOR BONDING BRIDGING
Granovetter (1973) Strong ties Weak ties
Burt (2000) Network closure Structural holes
Adler and Kwon (2002) Internal External
Lin (2001) Dense Tenuous
Foley and Edwards (2001) Within group (intra) Between group (inter)
Fürst et al. (2001) Stationary Mobile
Lazarsfeld and Merton (1954) Homophily Heterophily
Lin (2001) Expressive Instrumental
Anderson and Jack (2002) Glue Lubricant
Source: self‐elaboration.
All these perspectives of social capital comprise two different visons of social capital that are not
contradictory but complementary. Thus, the decision to concentrate on bonding or bridging social capital
lies basically in the context and the purposive actions in which the networks are embedded. For example,
if it is aimed to avoid the exclusion of an individual from their basic social group of reference, then dense
networks such as family members or lifelong friends are potentially the most effective. Conversely, if the
goal is to integrate newcomers into a group of homogenous natives, attention should be paid to all the
ways in which weak ties can be fostered between these different social groups.
2.7. Theory of individual social capital
Due to the multifaceted nature of social capital, as presented in the previous sections, the literature has
a crucial shortcoming when it comes to specify a general model that explains how social capital works
from different angles. One of the most popular scholars in this field is Nan Lin (2001), who formulated a
theoretical proposition for identifying (1) the sources of social capital, (2) accessing and mobilising it, and

Social capital: the concept 39
(3) its effects. He defines social capital as “resources embedded in one’s social networks, resources that
can be accessed or mobilised through ties in the networks (Lin, 2001: 29). This definition differentiates
between sources and effects, as well as the notion of access and use of resources. In addition, he situates
the analysis of social capital in a meso‐level as resources are possessed by individuals and also by the
network. Nevertheless, Lin (1999) argues that the operability of social capital must be analysed primarily
at the micro level, i.e. in the social network of the individual and its associated resources, before later
approaching the macrosocial aspects. The underlying reason is that social capital as a factor of
development (general trust, social cohesion, civility) is fuelled by micro cognitive and structural factors
such as education, the prosociality of the values instilled, the family environment, the experiences lived
and in general the interactions within the personal networks (Adler and Kwon, 2002, Uslaner, 2008). Or
to put it another way, the meso/macro levels must keep a clear relationship with micro factors.
Lin’s model constitutes the basis for explaining the theory of social capital that I introduce below. It
essentially establishes the three main pillars of my proposal, but at the same time I insert the contributions
of other scholars in order to clarify or develop certain concepts.
2.7.1. Sources of social capital
Nan Lin identifies two principal sources of social capital: (i) the social structure and context in which the
individual is inserted, and (ii) the position that the individual adopts in that structure. Regarding the social
structure, Hooghe and Stolle (2003) enumerate three factors that exert an influence over social
interactions: the family, the civil society (centred chiefly on voluntary associations) and political
institutions.
The family is a potential source for social capital formation. The family background is the most influential
determinant of how trusting an individual becomes, with the role of the parents especially important as
they may influence the attitudes and norms of their children in three major ways:
1) First, children who are provided with a trusting and open parental environment and who are
socialised in a self‐respecting and tolerant atmosphere are more likely to be trusting and to want
to reciprocate.
2) Second, parents teach their children how to judge others, and with whom to cooperate.
3) Third, families function as actual arenas of learning where children experience first‐hand episodes
of cooperation or affection. In addition, parents’ attitudes regarding openness toward strangers
are transmitted to the child.
Voluntary associations and other social interactions that comprise the civil society are important for
building the attitudinal aspects of social capital, such as trust and cooperation. Most empirical studies on
the effect of voluntary associations showed that members of organisations and associations exhibit more
democratic and civic attitudes as well as more active forms of political participation. In later research,
Verba and his colleagues found that members of voluntary associations learn self‐respect, group identity
and public skills (Verba et al., 1995). Membership of associations should also facilitate the learning of
cooperative attitudes and behaviour, including reciprocity. In particular, membership in voluntary
associations should increase face‐to‐face interactions between people and create a setting for the
development of trust. In this way, the operation of voluntary groups and associations contributes to the
building of a society in which there is cooperation between people for all sorts of purposes. The claim is
that in areas with stronger, dense, horizontal, and more cross‐cutting networks, there is a spillover from
membership in organisations to the cooperative values and norms that citizens develop.

40 CHAPTER 2
Nevertheless, not all types of social interaction have similar effects. First and foremost, face‐to‐face
interactions tend to be more productive and help to build trust and credibility. And second, the group
experiences might be even more pronounced in their impact when the members of the group are diverse
and from different backgrounds. The reason is that relationships within vertical networks, because of their
asymmetry, are not able to create experiences of mutuality and reciprocity to the same extent as
relationships in horizontal networks. The problem is the endogenicity, that is to say, the possibility that
people self‐select into association groups, depending on their original levels of generalised trust and
reciprocity. Such groups have been found to be relatively homogeneous by some researchers (Popielarz,
1999).
Lin also sees collective assets at the macro level as exogenous variables that influence the acquisition of
individual social capital5. In this line, the norms and values of government, and its networks that
incorporate other actors, are factors that exert important impacts on the performance of regions.
Democracy has been clearly identified as being related to social capital (Inglehart, 1997). Even stronger is
the relationship between social capital and the extent of political rights and civil liberties in a given country
(Sides, 1999). In fact, social capital is most developed in strong welfare states. Fortunately, the progressive
institutionalisation of trade unions and political parties since the end of the nineteenth century has led to
the creation of a new type of linking social capital in which citizen representatives maintain a more fluid
relationship with governmental organisations. A more determined identification of individuals with their
leaders (implicit link) facilitates the implementation of public policies (Raiser, 2008) plus the participation
in the political process (co‐governance). And ultimately, good experiences from contact with the
government can be generalised to strangers, which may have a direct impact on interaction and
networking (Stolle, 2004).
Furthermore, the theory proposes that network location is a key element for social capital. According to
Lin (1999: 35), access to and use of social resources are in part determined by positions in the hierarchical
structure (the strength of position proposition) and by the use of weaker ties (the strength of tie
proposition). Burt's work (1992) typifies this approach by identifying the locations of individual nodes. He
states that the proximity of the node to a strategic location (such as a bridge) can determine the quantity,
quality and diversity of the information available to it. Strength of ties (Granovetter 1973) is also a well‐
known conceptually argued network location measurement of a bridge's usefulness. Other location
measures are readily available in the literature, such as density, size, closeness, betweenness, and
eigenvector.
In short, the network of relations of the focal subject is conditioned both by collective assets and by the
type of structure in which the subject is situated and also by the position (s)he occupies in it. There is a bi‐
directional interaction between the two levels: collective assets, of macrosocial nature, influence the
social network's disposition of the subject. In this way, various elements that are usually identified with
social capital in its macro conception (trust, norms, values, cohesion...) are influencing micro social capital.
Conversely, one of the outputs of individual social capital is the impact on general social capital, in
particular on social trust, which is one of its main indicators. In addition, individual and general social
capital are conditioned by contextual and cultural factors (the local identity, geographic and climatic
conditions, the religion, lifestyles, mass‐media, etc.) that are very relevant questions to clarify in the
theory of social capital (Membiela, 2016).
5 I look more closely at the macro factors in chapter 2.9.

Social capital: the concept 41
2.7.2. Access and mobilisation of social capital
The second block of the model addresses the way in which individuals capture the resources embedded
in their network of relationships with the purpose of reaching certain objectives (Lin, 1999). Lin insists on
the need to differentiate between accessibility and mobilisation: an individual may occupy a certain
position in the social structure and have access to a set of nodes present in his/her network, and yet may
or may not have mobilisation capacity. Mobilisation should therefore focus on the resources effectively
mobilised.
Accessed social capital estimates the degree of availability to the actor, through the networks, of a
potential pool of resources capable of generating returns (Lin, 2008). As mentioned before, Burt (1992)
postulates that certain network positions (structural holes and structural constraints) help individuals to
attain better positions or rewards in organisations. To do so, actors need absorptive capacity, that is to
say, the ability to recognise the value of new, external information and assimilate it (Cohen and Levinthal,
1990: 128). Additionally, economic geography stresses the importance of the “proximity” literature to
explain knowledge acquisition (Rallet and Torre, 1999). There is a strong claim that geographical proximity
is a prime mover of network formation despite globalisation, implying that a great deal of interaction still
takes place between agents that are geographically proximate (see e.g. Boschma and Ter Wal, 2007; Suire
and Vicente, 2009). Relationships based on friendship, kinship and experience can also carry strategic
information, tacit knowledge and trust, and thereby, social proximity may increase the probability to
engage in creative networks. Lastly, the capacity of actors to absorb new knowledge requires cognitive
proximity, namely a degree of similarity of the knowledge bases of the involved bodies (Nooteboom,
2000).
On the other hand, mobilised social capital reflects the actual use of a particular social tie and its resources
for a purposive goal. For example, using a particular contact with certain resources (e.g. his/her wealth,
power, or status) in a job‐search process may indicate a mobilised social capital (Lin, 2008). Mobilisation
requires certain social skills, as well as the possibility of a deferred payment or return for the resource
provided (Durston, 2000). Variables such as education, work activity, income and even urban habitat are
clearly related to mobilisation. Moreover, values, morality and reputation play a decisive role in inducing
expectations of commitment, along with the social context, social trust, cultural norms and institutions
(Membiela, 2016). For this reason, contextual‐cultural factors mentioned as sources of social capital also
affect the assimilation and use of social resources.
2.7.3. Effects of social capital
The third part of the model encompasses the effects of social capital. As highlighted in section 2.6.1, Lin
distinguishes between expressive and instrumental effects. Family support is depicted as one of the most
significant expressive manifestations of social capital (Portes, 1998). It can take a material and monetary
form, embodied in various ways such as the provision of food and shelter, informal loans or payment for
studies. However, Adler and Kwon (2002: 18) allude to the moral support provided by strong ties and
similarly, Nan Lin (2008: 59‐60) writes that sharing support and feelings is the main characteristic of social
capital at the family level.
The literature also describes the important role of the transmission of links carried out by families through
networks that are transferred from generation to generation (Hoffman et al., 2006: 136). Wintrobe (1995,
in Dasgupta, 2005: 15‐16) considers that parents invest in relationships that they later transmit to their
children in return for security in old age, and the inheritance of these links implies a reduction in the cost
of creation and maintenance of social channels (Bubolz, 2001: 130‐131). Furthermore, Coleman (1988)

42 CHAPTER 2
indicates the importance of the family in moulding the personality of the children and Bourdieu (1986)
claims the decisive influence of the family world on the transmission of cultural capital, which is
transmitted through socialisation.
Finally, there is a consensus in the literature when it comes to the influence of social capital on other
expressive returns related to welfare and happiness. People with more personal ties tend to be healthier
and report greater life satisfaction (Putnam, 2000: 27; Castiglione et al., 2008: 5; Warren, 2008: 122‐123).
So far I have stressed the positive effects that are achieved in a variety of fields with the purpose of
preserving existing resources. But as Putnam noted in Bowling Alone (2000: 21‐22), "networks and
associated norms of reciprocity are generally good for those who are inside the network, but the external
effects of social capital are by no means always positive." In that sense, the literature often emphasises
the role of bridging social capital in extending the individual's social ties and how bonding can inhibit a
person's links with the outside (Portes, 1998; Woolcock, 2001; Lin, 2008). Nevertheless, several
researchers promote analytical bias; they enhance the risks of bonding social capital while emphasising
the benefits of bridging, and they do not take into account that the former is responsible for a multitude
of irreplaceable socio‐economic functions, as highlighted before.
The first risk associated with expressive effects is that of exclusivity. Usually, the family and other strong
communities are insufficient per se to provide the individuals with a range of information and potential
opportunities that are found outside (Granovetter, 1973). This closure to the external also diminishes
collective action and may undermine generalised trust because the latter is dependent on the level of
social interaction (Ahn and Ostrom, 2008). Lastly, authors such as Putnam (2000: 22), Dasgupta (2005:
12), Castiglione et al. (2008: 2) and Warren (2008: 127) also link the so‐called bad social capital with strong
ties and cite the cases of the Ku Klux Klan and the Mafia. And Pena and Sánchez (2009) associate the
particularistic confidence of bonding social capital to the phenomenon of corruption and other antisocial
purposes.
For its part, a good part of the instrumental effects are related to the paradigm of collective action, directly
or indirectly based on the principle of cooperation attributed to bridging social capital. Individuals contact
other actors who possess different characteristics and have a wider and potentially beneficial pool of
resources, emanating from the network of the interpersonal relationships (Lin, 2008: 61). In this line, Mark
S. Granovetter in his article "The strength of weak ties" (1973) emphasised the role of weak ties in the
diffusion of influence and non‐redundant information, and in the opportunities for social mobility.
Similarly, in the economic sphere, business cooperation and the consequent reduction of transaction
costs is a reason often found in studies of social capital. Ties with other groups promote the diffusion of
technology and knowledge, ideas, innovations and know‐how sharing (Wolleb, 2008: 382). And at the
macro level, Castiglione et al. (2008: 3) point out that societies solve their problems through collective
action, since the achievement of certain objectives requires social participation.
Bridging social capital contains its own set of risks, which have been popularised to a lesser extent. For
example, Adler and Kwon (2002: 31) point out the potential negative externalities that can lead to
undesirable purposes such as unethical behaviour and conspiracy. A dominant group may use its social
capital to enhance considerably its dominance and exclude subordinate categories from information,
influence, and solidarity benefits. In a similar vein, Foschi (2008: 473) warns that negative impacts can
arise in the process of alleviating poverty, entailing discrimination of some individuals and groups needing
microfinance assistance. Finally, Warren (2008: 138) reflects on political corruption in Italy, where it is not
only mediated by strong ties but also by the relations between the civil service and the business
community.

Social capital: the concept 43
2.8. From individual social capital to corporate social capital
While studies of social capital have traditionally focused on the individual as the unit of analysis, the work
of Burt (1992) has been influential in suggesting the organisation as a context for social capital research.
Since the publication of his book Structural Holes, much research has been carried out into networks in
organisations. Burt (Ibid.: 9) pointed out that “the social capital of people aggregates into the social capital
of the organisation”, and therefore the social capital of the organisation is to some extent tied up in the
individuals they employ.
It is problematic to move from the individual to the organisational level of analysis, because the distinction
between the two is essentially in the eye of the beholder. Since many relationships between organisations
are played out or mediated by individuals, there is some merit to the argument that such
interorganisational networks should be placed at the individual level rather than at the organisational
level. For example, a business transaction between the individual representatives of firm A and B can be
seen in two ways: as a result of the personal relationships between these two individuals, or as simply a
transaction between the companies themselves. Most business transactions are still carried out between
individuals and are based on interpersonal trust. However, this does not mean that these transactions
should necessarily be categorised as a function of the network at the individual level. As Gabbay and Stein
(1999) point out, the business tie between firms A and B may still exist long after the two individuals who
originally forged the tie have ceased to be employees. Social capital is often “depersonalised” or is
couched in multiplex forms, and when links become multiplex, they are no longer dependent on
individuals who act as brokers and interorganisational links established through individuals might begin
to lead a life of their own.
The issue then oscillates between two frames: do individuals as agents or officeholders connect
organisations and other human aggregates, or are organisations themselves actors embedded in a social
structure? Much of the organisational social capital literature has an individual slant, with the attributes
of firms examined as an individual manifestation. Notwithstanding, in the book Corporate Social Capital
and Liability, Leenders and Gabbay (1999) suggest that organisations enjoy the benefits and suffer from
the obstacles that the social structure brings. The term, corporate social capital, is employed and defined
as “the set of resources, tangible or virtual, that accrue to a corporate player through the player’s social
relationships, facilitating the attainment of goals” (Gabbay and Leenders, 1999: 3). According to this
definition, “corporate players” refers to organisations and their members. When the social structure
benefits corporate players in the attainment of their goals, it is said to convey “corporate social capital”.
When it obstructs, then social structure brings “corporate social liability”.
The theory of individual social capital formulated in the previous section can be redefined according to
the organisational perspective. The social structure and context in which the firm is inserted will be a
principal source of social capital. If we view organisations as human aggregates, we might attribute to that
organisational social capital virtues of the aggregate social capital of its members. Moreover, externally
contracted employees such as accountants, lawyers, and consultants carry with them a significant amount
of social capital. When firms are able to hire them, their fruitful relationships also (to some extent)
become part of the firm’s network; in other words, the social ties of the individual now yield social capital
at the firm level. The associability of the firm will also be a key determinant of the stock of social capital.
Just as individuals may benefit from voluntary associations, firms may be tied to other firms through
alliances such as trade associations, business groups, consortia, cartels, joint ventures and interlocking
directorates. The accumulated associability and trust of those members of the global business network
facilitates the functioning of the relationship and generates unique competitive capabilities for the firm
in its global network (Bolino et al., 2002). Equally, the social relations that an organisation has developed

44 CHAPTER 2
with regulatory bodies charged with allocating resources ultimately exert an influence upon the firm
performance.
The position of the firm in the social structure will be critical for social capital formation, too. Companies
central to the social structure have timely access to resources held by others. This then draws other firms
to collaborate with the central player, in order to gain potential access to these resources (and status).
The firm, in turn, becomes even more central in the social structure. Nevertheless, the advantages that
accrue are not necessarily in the creation of a large bundle of ties, but in the creation and maintenance
of relations that provide access to new technologies, resources and legitimacy. According to the
structural‐hole approach, the creation of an optimal structure in terms of corporate social capital requires
the network configuration to be configured in such a way that it has plenty of contacts but they are spread
out thinly across many diverse firms.
So as to be able to acquire resources and then exploit them, an organisation needs absorptive capacity,
ergo, the ability to recognise and assimilate valuable information from a particular partner. Dyer and Singh
(1998) proposed that absorptive capacity is a function of (1) the extent to which the partners have
developed overlapping knowledge bases and (2) the extent to which the partners have developed routines
that maximise the frequency and intensity of their interaction. The former condition makes clear that
cognitive proximity between firms would be helpful, whereas the second emphasises the importance of
other types of proximity (geographical, organisational and social proximity, the latter being at the
individual level, between the representatives of the firms). Cohen and Levinthal (1990: 136) suggested
that the organisation’s absorptive capacity tends to develop cumulatively, and if the firm does not invest
in absorptive capacity, it may not recognise new opportunities when they arise. Social capital is therefore
crucial in bringing together intangible assets and providing the absorptive capacity to merge proprietary
knowledge with other kinds of expertise. And curiously, several scholars have argued that social capital is
also path‐dependent in the sense that prior linkages determine the formation of future linkages (e.g.,
Gulati, 1995; Walker et al., 1997).
Several studies have focused on the effects of corporate social capital. According to Nahapiet and Ghoshal
(1998), social relations are a vehicle for accessing and disseminating information. It decreases search costs
as information on resources is available from network partners (Granovetter 1985; Burt, 1992) and
additionally can be an important source of timely, non‐routine and informal data (Birley et al., 1991).
Social capital could also help the firm in providing access to technology, especially related to innovations
and tacit knowledge (Stuart, 1999), financial resources (Freeman, 1999) and human resources (DiMaggio,
1992). Stuart et al. (1999) proved that, in addition to conveying resources, social‐exchange relationships
also transferred reputations, especially important when the resource providers value early‐stage
technology companies. Social capital is also a means of enforcing norms of behaviour among individuals
or corporate actors, and therefore acts as a constraint as well as a resource. It contributes to patterns of
behaviour in terms of the trust, willingness and capacity to cooperate and coordinate, and the habit of
contributing to a common effort. Moreover, common third parties serve as an incentive to display a
cooperative image and as an effective deterrent to opportunistic behaviour (Gulati, 1995). Actors linked
through ties embedded in third‐party relationships are more likely to conform to the norms of reciprocity.
The benefits of corporate social capital seem beyond doubt; less obvious, perhaps, are the costs of social
liability. Social embeddedness endangers a firm’s appropriability regime, and might also wrap the firm too
tightly in a web of ties that it stifles its ability to change or blunts its innovative capability. While network
relationships are often viewed as conferring various benefits, their undesirable consequences should also
be examined.

Social capital: the concept 45
2.9. Regional social capital
In Putnam’s groundbreaking study (1993), social capital at the macro level was mainly seen as a feature
of civil society. However, with the expansion of social capital research in a large number of disciplines, the
concept has come to be seen as having a much greater impact on regional development than was ever
suggested by Putnam’s civic society variables. Just like firms, territories have different features when it
comes to dealing with knowledge transfer. Intangible assets, such as social capital, decide how effectively
innovation networks function and differences in regional social capital thus help explain regional
differences in economic development (Rutten and Boekema, 2007). This regional role of social capital has
not featured prominently in the social capital literature, but it is increasingly being recognised.
In consonance with social capital at other agglomeration scales, regional social capital is a two‐sided
concept. On the one hand, it originates from the embeddedness of actors in regional webs of social
relations. A city or a region does not possess one uniform kind of social capital but a number of partly
disparate, partly competing social capitals, formed, carried and reproduced by various groups in that
localisation (Westlund and Larsson, 2016). These group‐based social capitals have more or less common
denominators, which form the base for the necessary bridging links between them and are crucial for
regional development. One example is the connections between the actors in academia and other
sections of society, which are highlighted in the theories of innovation systems, “Mode 2” and triple‐helix
(Ljunggren, 2016). Social capital, however, does not develop automatically from interactions. Instead, it
takes time for trust to develop (Mackinnon et al., 2004) and the norms, values and customs of a region
play an important role in building mutual credibility. Yet, trust and reciprocity may strengthen cooperation
and facilitate a richer set of relationships, which enhance the volume, diversity and richness of
information exchanged (Koka and Prescott, 2002). Furthermore, as stated by Beugelsdijk and Van Schaik
(2005: 1057) “cooperation itself breeds trust”, and if this is the case then cooperation and trust, as
mutually supporting factors, may create a particularly productive virtuous circle.
Particularly noteworthy in this context is the concept of generalised reciprocity. Research inspired by
Putnam (1995, 2000) and Knack and Keefer (1997) has focused on macro‐scale and society‐wide
conditions, using survey data on trust and cultural characteristics. Here, a problem arises when translating
across spatial scales, and not all scholars agree on how such trust between actors in the business and
economic sphere is related to generalised trust within larger populations (Westlund and Adam, 2010).
Nevertheless, numerous studies mention collective assets at the macro level as exogenous variables that
affect social capital. For example, van der Meer (2003) finds that in regions with higher associational
density, citizens who are not even involved in associations have developed more trust in others and in
political institutions. Equally, trustworthy institutions can uphold generalised trust, which in turn may
have a direct impact on interaction and networking (Stolle, 2004). In this vein, the role of the state and
political institutions has recently been introduced into the discussion about the sources of generalised
values. Some authors rightly have pointed out that the capacity of a society to ensure cooperation among
its citizens is determined by its historical experience and is strongly path dependent (Putnam, 1993;
Fukuyama, 1995), but there are policy options available to stimulate the development of social capital.
Research has shown, for example, that income equality is positively related to social capital, particularly
social participation and trust (Verba et al., 1978), because citizens who see their fellow citizens as equals
and as “one of their own” are more likely to make a leap of faith and trust people who are not known
directly to them. The literature on social capital also emphasises the role of linking social capital as a
source of social control or, similarly, its capacity to promote the observance of norms (Portes, 1998).
Effective rules constitute a powerful form of social capital, both because they facilitate certain actions and
because they restrict others.

46 CHAPTER 2
Territories can also play an important role in enhancing the absorptive capacity of the firms in a region.
The European Union has evolved into a space of places, and with the emergence of collaborative networks
and the re‐territorialisation challenges exposed by globalisation, trans‐regional (and trans‐national)
cooperation instruments are of great interest for cross‐border flows and interrelationships (González‐
Gómez and Gualda, 2017). In this scenario, the absorptive capacity of a region is a function of its intra‐
and extra‐knowledge system where firms act as mutual exchangers or technological gatekeepers,
transferring knowledge from external sources to local firms (Giuliani and Bell, 2005; Morrison, 2008). For
Fürst et al. (2001), the most effective regional actors are those capable both of mobilising social capital
and to making it stationary, and regional bridging social capital is particularly significant because it helps
in the acquisition of diverse knowledge (Kallio et al., 2010). As a result, gatekeepers or brokers may fill
structural holes in the regional network, provide links to new ideas and encourage creativity (Burt, 2000).
Organisational bonding social capital in the form of highly bonded trust‐based relationships will therefore
be crucial in producing the necessary glue between regional actors that will allow fruitful exchanges to
take place (Malecki, 2012; Aranguren and Larrea, 2015).
To a large extent, learning and innovation are the main outcomes of regional social capital. Learning is
promoted both within a region and beyond, and in that process, relevant knowledge is found, assembled
and absorbed from many sources to create new combinations of production factors (Edquist, 2005).
However, innovations or changes in existing products do not come about through variations in the
quantities of factors but through the setting up of new production functions (Schumpeter, 1912, in
Maskell and Malmberg, 1999). And it is through regional innovation networks that technology is
transformed into prosperity and it is regional social capital that determines how effectively this
transformation evolves. In other words, regional social capital is what transforms technology into regional
economic development through regional innovation networks (Rutten and Boekema, 2007).
Regional social capital is a crucial element for entrepreneurship as well, both as a glue and lubricant of
social interaction. First, entrepreneurial structures are formed and bound by social capital, and once the
relationships are established, they often become “sticky” and productive. Yet, social capital also facilitates
the interactions and flows within the structure (Anderson and Jack, 2002), providing access to useful,
reliable, exclusive, less redundant information (Brüderl and Preisendörfer, 1998).
Social capital is likely to produce other forms of innovation, such as social innovation. This concept is less
reliant upon the generation of new ideas as a source of innovation. Instead, it consists of new institutions
or ways of working that tackle social problems. The literature on social innovation depicts it as having
both formal and informal aspects. For instance, some consider social innovation to be predominantly a
public sector phenomenon, whereas others see social innovation supported by third‐sector organisations
(Mulgan, 2006). These relationships may themselves be relatively “hidden” compared to the relative
transparency of more bridging relationships but can be relevant for the region’s innovation processes
because few (if any) regions have sufficient top‐down power to create knowledge and innovation
capabilities by decree.
The conventional view of the various factors deemed to contribute to regional development is “the more,
the better” (for example when it comes to natural resources, capital or labour). The early interpretations
of the role of social capital followed this approach but the concept of regional social capital, as originally
interpreted, not only includes positive features but also some more negative elements from a societal
point of view. Though there are hardly any agents or networks that might genuinely be seen as
representing a “dark side” of social capital, it is nevertheless the case that some are more beneficial to
regional development than others. Similarly, while there are many arguments in support of the notion
that it is positive for the development of a region when actors have trust in most people around them, it

Social capital: the concept 47
is quite another thing to suppose that trust is always good and that everyone should be trusted. Or to put
it another way, when it comes to trust, a certain balance is needed if optimum regional development is
to be achieved.
2.10. Criticism
Intellectual and academic prominence does not come without a certain degree of controversy, and there
are numerous elements to the concept of social capital that have generated disagreements. Such disputes
are to be expected during the rise of any new theory and should not be regarded as an indication of
theoretical or conceptual weakness but instead as one of the ways in which scientific discourse proceeds.
Indeed, criticisms are an inevitable part of the displacement of previous approaches and the emergence
of new perspectives and fields of research.
In what follows I will review the most common criticisms of the concept of social capital. As Castiglione
(2008a) points out, in the case of social capital, theoretical disagreements are neither more nor less
frequent than those in other social sciences, so there is nothing unusual in that regard. Nevertheless, a
brief analysis of the nature and possible causes of such disagreements may help us to clarify some of the
conceptual issues involved in social capital research.
1) Controversy about its categorisation as “social” and “capital” Some authors believe that the “social” element of social capital is supplementary because it is essentially
an economic concept. Haynes (2009: 6) states that social capital is an example of “the colonisation of
sociological territory by fundamentally economic notions”. Similarly, there is a significant current of
opinion among economists that rejects the idea that social capital can be called capital at all. Social capital,
they maintain, has none of the main conceptual and operational characteristics that would allow it be
analysed in a similar way to economic capital. In other words, it is no so clear that social capital can be
described as durable, cumulative, productive, fungible and measurable (Arrow, 2000).
Nevertheless, many other authors point out that those who criticise the inclusion of social capital as a
type of capital have failed at least partially in their arguments. Robison et al. (2003: 60), for example, state
that social capital is indeed a form of capital as it meets all the requirements to be considered as such.
First of all, social capital requires the identification of a temporal dimension (a “present sacrifice” so as to
achive a future benefit) and its effects may be lasting (we can have friends for long periods of time).
Equally, the mechanisms by which it is accumulated and depreciated are clearly established because it is
evident that the loss of relationality leads to the weakening of the link and the social network.
Furthermore, it is productive (it has the potential to provide services), partially fungible (we can ask a
friend to help another friend of ours whom he/she does not know) and valuable (we value the approval
and interest of our friends).
2) Social capital is an ambiguous concept
Some authors point out that there is a lot of marketing around the concept of social capital. They allege
that there is little "substance" behind it, or assert that it is merely a fashionable word. Its connection with
"economic imperialism" has also been mentioned, and it has even been said to be a "Western concept
with little relevance to other regions" (Woolcock, 2001: 72‐76).
On the other hand, it has frequently been argued that social capital is an umbrella concept (Sobel, 2002:
145) or a black‐box mechanism (Castiglione, 2008a: 15) because it brings together aspects as diverse as
norms and values, rules, social networks and trust. The idea may seem seductive, but this catch‐all frame

48 CHAPTER 2
can make the concept difficult to determine, which is one of the reasons why it is has been criticised so
fiercely by those who do not recognise it as having its own distinct personality. It has been called "a
wonderfully elastic term" (Lappé and Du Bois, 1997: 119), "vague and imprecise concept" (Roche, 2004:
107), "ambiguous if not incoherent and yet analytically selective" (Fine, 1999: 9), a notion that “means
different things to different people" (Dasgupta and Serageldin, 1999: X) and that has taken on "a circus‐
tent quality" (De Souza Briggs, 1997: 111).
The ambiguity is justified and has much to do with broad and complex entity. However, this peculiarity
does not detract from its relevance in the economic sphere and the analysis should deepen on the validity
of the empirical measurement (as I highlight later), even though the multifaceted nature of the concept
makes it difficult to have a system of consolidated indicators.
3) The definitions are circular and the causality direction is not clear
One of the essential issues underlying social capital is that many approaches tend to be circular and even
tautological, because social capital is often both a means and an end. For example, within a policy planning
process, social capital may act as an input when aiming to achieve certain some objectives or as a policy
objective in itself. This problem of circularity and self‐referentiality is transferred to the study of the
sources of social capital, and there is a so‐called “chicken or egg dilemma” when it comes to the causality
direction between structural and cognitive dimensions of social capital. Which comes first, the community
network or trust? There is a similar discussion between the micro‐macro levels: various elements that are
usually identified with social capital in its macro conception (trust, norms, values...) have an influence
upon micro social capital. Conversely, one of the outputs of individual social capital is the impact on
general social capital, in particular on social trust. This is a matter for further discussion that essentially
lies outside the scope of this work, but in any case I will analyse social capital in its different facets and I
will refer to the interrelated nature of this phenomenon.
4) The dark side of social capital
The unclear functionality of the concept is another reason discussed in the literature. As highlighted in
section 2.7.3, the social network can provide resources and stability to individual and groups, but it can
also restrict their mobility and, more generally, constitute a brake on social change and innovation
(Dasgupta, 2005; Sánchez and Pena, 2005). In these circumstances, the network providing social capital
would no longer be an asset but rather a liability that obstructs successful action (Gargiulo and Benassi,
1999: 299). This duality sometimes makes it difficult to analyse the functionality of this concept but it does
not block its operationalisation. Despite the fact that social capital may have negative aspects, researchers
ought to study each one of its components normatively and consider the total contribution of this
construct in the actions and behaviours of individuals and groups.
5) Lack of empirical rigor
Finally, the problem of conceptual delimitation raises a new difficulty: it undermines the scientific rigour
of the concept of social capital (Lin, 2008: 50). As the definitions are so varied, it is not entirely clear what
should be measured, and how (Dasgupta and Serageldin, 1999; Dasgupta, 2005: 1, Castiglione et al., 2008:
5; Van Deth, 2008: 153). In fact, those who criticise the various conceptual approaches also object to their
parallel, analogue, measurement systems. This is demonstrated by Knack and Keefer's (1997) criticism of
the measurement of social capital in terms of the number and density of associations (an instrument used
by Robert Putnam), noting that they do not find any correlation between associationism and social trust.
It is true that social capital cannot be solely treated as a black‐box macro‐instrument producing social
goods. The operationalisation and the measurement of social capital require a more precise
understanding of the way in which social capital operates at all levels. More specific micro‐mechanisms

Social capital: the concept 49
need to be identified in order to support the causal chain that goes from the dynamics of social relations
to social cohesion or to other social goods. On the other hand, proofs of the causal link require a more
stringent operationalisation of social capital in order to demonstrate that social capital actually makes a
difference for individuals and/or the collectivity. So the multidimensionality of the construct and the fact
that it can be approached from different perspectives does not imply a lack of empirical rigor per se.
Indeed, in chapter 3 I will try to delve further into this issue and build a rigorous empirical foundation to
support the oncoming research attempts.


Methodology
CHAPTER 3


Methodology 53
CHAPTER 3: METHODOLOGY
3.1. Introduction
Seminal studies on social capital have become increasingly diverse. At first sight, it would seem unlikely
for a concept with such broad usage to be used successfully in empirical research, but the investigation of
social capital has profited from its conceptual flexibility and has been operationalised in numerous
different approaches, thus favouring exchanges, collaboration, and debates across disciplines in ways that
are often unusual.
Yet, the very concept of social capital is the subject of ongoing debates and operative building, which
lends to the measurement of social capital an inherent uncertainty. On one hand, it is assumed that the
greater the amount of empirical research into social capital, more refined the concept will become.
However, the measurement of social capital has become in an exploratory exercise, undermining any
agreement about how it should actually be done (Pérez García et al., 2005, Castiglione et al., 2008, Van
Deth, 2008). In this terrain, the methodological research has come to face a double challenge. First,
scholars have to clarify the operative terms, using the most appropriate methods, and finding a valid
relation between the conceptual contents. At the same time, the measurement of social capital seeks the
fairest approximation to the theoretical underpinnings. Notably the empirical studies have failed to
connect the measures and indicators of social capital to the theoretical definition and its traditional
aspects such as norms, trust and networks. That is why many academics have stressed a need for further
research (Paxton, 1999; Portes, 2000; Grootaert, 2001; Stone, 2001; Van Deth, 2008; etc.).
3.2. The measurement of social capital
In recent years, there has been a debate about how best measure social capital. There have been different
proposals: the Social Capital Assessment Tool (SOCAT) (Krishna and Schrader, 1999), the Adapted Social
Capital Assessment Tool (A‐SCAT) (Harpham et al., 2002), the UK Social Capital Measurement Framework
(Harper and Kelly, 2003), or the Social Capital Measurement Tool (SCMT) (Kitchen et al., 2012), just to cite
some. For this section I have selected the first of these because it is a widely accepted tool, employed by
the World Bank and many other reputable entities.
In a sort of summarising work, Krishna and Schrader (2002: 23) set out four minimum criteria for
measuring social capital within the SOCAT:
Table 8: Minimum requirements for an acceptable measurement tool (SOCAT)
N. REQUERIMENT
1. It must recognise and be sensitive to cultural variation while at the same time provide a unifying conceptual framework.
2. It must take account of the structural as well as the cognitive dimensions of social capital. Both networks and norms must be assessed to obtain a valid estimate of the aggregate potential for mutually beneficial collective action.
3. It must build primarily on those activities local people consider appropriate for collective execution.
4. It should be constructed using both qualitative and quantitative methods.
Source: Krishna and Schrader (2002: 23).
Especially important, in my opinion, are points 2 and 4. The second observation stresses that structural
and cognitive elements must be combined to constitute the beneficial collective action that we recognise
as social capital. The structural dimension refers to the networks and organisations to which the actors
belong and is investigated with data about past experience, present practice, and future expectations

54 CHAPTER 3
regarding collective action and mutual support. Triangulating information in this manner enables the
investigating team to derive more reliable assessments of the structural aspects of social capital. Likewise,
the cognitive dimension of social capital assesses norms, values, attitudes, and beliefs related to solidarity,
trust, and reciprocity. Because these dimensions cannot be observed directly (people carry them inside
their heads) researchers probe indirectly, asking questions about hypothetical situations that people in a
community might typically face.
A measure that uses purely structural elements might prove quite reliable in some contexts, as Putnam
(1993) found for the Italian case. In other contexts, such as rural India and rural Panama (Krishna and
Shrader, 2000), predominantly cognitive elements might figure in the measurement of social capital.
However, the distinction between structural and cognitive elements is mostly of an analytical nature, and
in practice there will usually be some degree of overlap and intermixing. The more people trust each other
and the higher the degree of solidarity in a community, for instance, the more people will associate with
local organisations and their expectations regarding future collective action will also be higher. Similarly,
the smaller the extent of exclusion within a community, the more widespread is the network of mutual
obligations and reciprocity among community members. All in all, the structural and the cognitive provide
two different perspectives for observing social capital in practical situations, and both should be taken
into account, adjusting their respective contributions from one context to another.
To understand the separate importance of norms and networks, consider the following example (Krishna
and Shrader, 2002: 20): let’s imagine that a house burns down and then the neighbours come together to
help the affected family rebuild it. Two alternative situations can be envisioned: it is possible that there is
a well‐recognised leader who directs villagers to gather at the site; or alternatively, no clear roles for
organising such action may exist in the neighbourhood, but people gather spontaneously to help with the
rebuilding, influenced by norms of appropriate conduct. The same cooperative outcome can therefore be
achieved in two different ways. In the first case the structural dimensions of social capital (roles, rules,
networks) facilitate cooperation, whereas in the second case the neighbourhood response is based on
norms and beliefs. To be valid and accurate, an instrument for measuring social capital must rely on
structural and cognitive dimensions. Considering only networks neglects the cognitive basis of collective
action. And if we contemplate only norms, social capital is underestimated by ignoring its structural
dimensions. Both networks and norms must be assessed, representing the aggregate potential for
mutually beneficial collective action.
The other important requirement is to integrate quantitative and qualitative methodologies. Increasingly,
social science research, including economic research, combines both methods in the quest for research
designs best suited for assessing complex issues and concepts. Integration of complementary
methodologies is a fruitful strategy for several reasons: to confirm and corroborate results via
triangulation, to elaborate or develop analysis, to provide richer detail, and to initiate new lines of thinking
through attention to surprises or paradoxes (Rossman and Wilson, 1994). Plus, it is even more important
to combine quantitative and qualitative techniques when trying to analyse a complex and innovative
concept such as social capital. Together with results from validated data, quantitative and qualitative
indicators can provide a deeper understanding of what individuals regard as social capital and a broad
overview of the institutional framework in a particular region.
There is another relevant point that the SOCAT suggests in the third precondition but does not mention
explicitly: the multilevel nature of social capital. As it has been explained in section 2.4, social capital can
be considered at different levels: at the micro/meso level, social capital relates to attributes and
propensities that facilitate mutually beneficial collective action among members of a community.
However, since the theoretical leap forward that Putnam made in regarding social capital as a feature of

Methodology 55
regions and nations, social capital is gauged on the basis of attitudinal and membership data at this level
and an increasing number of international surveys have made possible the cross‐country comparisons.
Additionally, social capital can be assessed with reference to the institutional context in which individuals
and organisations operate (North, 1990), in terms of formal relationships and structures, such as rule of
law, legal framework, openness of political regime, level of decentralisation, and extent of participation
in the policy formulation process (Bain and Hicks, 1998).
Instead of concentrating on just one scale, several authors have developed multilevel models, especially
to study the impact of factors at the micro‐level as compared to contextual factors. To mention only a few
examples: Brehm and Rahn (1997) analyse the developments of social capital in the US, Bühlmann and
Freitag (2004) study the impact of Swiss cantons on membership in voluntary associations, and Costa and
Kahn (2001) combine individual and community characteristics in their explanation of the decline in social
engagement in the US since the early 1950s. In general these studies provide important information about
the interdependencies between various forms of social capital and the position of individuals in different
contexts. They underline the need to distinguish carefully between social capital at the micro at macro
level, because collective social capital cannot be measured simply as the sum of individual indicators
ascribed to social capital. Indeed, in much empirical research, though social capital is understood as a
community characteristic or property, in practice the measurement is carried out through the collection
of individual data. Surveys obtain information from individuals according to their subjective perceptions,
and later on the conclusions for explaining social capital in the society result from the agglomeration of
all these individual answers. It is then an analysis based on attributes collected at the individual level, not
a study performed at the macro operational level6. And as Portes and Landolt (1996) point out, macro‐
indicators and aggregated individual data must not be mixed.
Accordingly, some scholars suggested that the empirical research seems to be in an “immature period”,
or in its “infancy” (Cote and Healy, 2001), not yet capable of tackling a rather complex concept. More
recently, however, there have been attempts to go beyond the limits of the conventional research and
create the most integrative measure of all the recognised and agreed aspects of social capital (Stone,
2001; Grootaert and Van Bastelaer, 2002; Van Deth, 2008). First, multilevel methods have become
increasingly popular to investigate the interdependencies between the micro and macro contexts. At the
same time, conscious of the quantitative limitations, it is assumed that qualitative methods probably
contribute to an understanding of how social capital really works, though few studies genuinely achieve
this ideal (Van Deth, 2008). Finally, the framework for measuring social capital takes for granted that the
concept is composed fundamentally of norms and networks, but the empirical discussion has not refined
yet how this relation operates. Besides, this conception is also provocative as it reproduces the chicken‐
egg problem, namely the question of whether networks shape trust, or whether social relations, in order
to emerge and be maintained, depend on shared norms of trust and reciprocity. And so the debate about
the optimal measurement of social capital rumbles on (Inkeles, 2000; Cote and Healy, 2001; Stone, 2001;
Woolcock, 2001; Harpham et al., 2002; Roche, 2004; Castiglione et al., 2008).
3.3. Data collection for empirical research
The empirical research strategies differ when it comes to the three attributes mentioned in the previous
section: (i) the main study variable (structural or cognitive); (ii) the type of study (quantitative or
6 For instance, Paxton’s (2007) theoretical model of social capital proposes to study social capital in an aggregate manner. Trust is measured by the aggregate of individual responses to questions about trust and associations, and social relations are estimated by the aggregation of formal membership and informal relations indicators.

56 CHAPTER 3
qualitative), and (iii) the level of analysis (micro, meso or macro). These attributes and their potential
combinations open the door to a wide variety of forms of operationalising social capital. In the following
lines I will introduce some data collection methods according to the way information is gathered and
afterwards, in section 3.4., I will refer to some qualitative and quantitative methods for social capital
analysis.
3.3.1. Primary data
Primary data refers to the first hand data collected by the researcher specifically for a concrete
investigation purpose. It normally takes more time and money to gather raw data, and low response rates
may restrict its implementation. In constrast, primary sources are more reliable and accurate as compared
to the secondary sources.
The methods for collecting primary data vary in their degree of openness. In close‐ended methods, the
question can be answered by a simple "yes" or "no”, or alternatively, the respondent is given a roster or
a list of options and (s)he has to select the corresponding answer. Semi‐directive methods may provide a
list with a final open option (“others”), or similarly, they may ask the interviewees to recall some actors
that are not in the list. Finally, open questions require a deeper and longer answer and are helpful for
finding out more about a person or a situation. In fact, they are designed to allow respondents to
articulate their concerns free from researchers’ assumptions, and they are likely to be exposed to new
discoveries and/or unexpected findings.
Interviews and surveys are the most common and dominant methods, especially to analyse the extent of
the network of the focal person and the resources mobilised. Lin (2008: 54‐56) points to two methods:
the "name generator" and the "position generator". In the first method, a question is posed (for example,
“Whom do you usually discuss work problems with?”) and a sampled respondent is asked to provide a list
of names. In the position generating methodology, a list of socially useful positions is presented to an
individual and then (s)he is asked about the first individual who could give access to that resource,
additionally considering the level of relationship between them (family, friend, acquaintance). There is a
third alternative called the “resource generator”, which measures an individual’s access to social
resources within their social network (Van der Gaag and Snijders, 2005). It bears more similarity to the
position generator, but information directly refers to accessed social resources instead of occupational
prestige. That is, the position generator can be useful in instrumental actions, whereas the information
retrieved by the resource generator can more clearly refer to expressive actions.
Among some recent studies that have followed each methodology, Crespo et al. (2014) analysed cheese
producers in Aculco (Mexico) through several name generator questions. They asked 35 prominent
respondents to name other cheese producers and consequently they constructed their database. Later,
they disentangled the opposite and ambivalent effects of social capital on the ability of a community to
engage in collective action. As for the position generator methodology, Pena and Sánchez (2013: 29) also
opted for this method to determine the dimension of personal networks. They found that accessibility is
explained by social capital, human capital and variables of status. In addition, the amplitude of the
network explained instrumental (income and education) and expressive (life satisfaction, health...) effects
of social capital. The resource generator has been used so far in quite a few studies. In one of the
pioneering works, Van der Gaag and Snijders (2005) carried out a survey on the networks of the Dutch
and they concluded that the range of resources embbedded in a network is very broad and especially
covers those linked to family and work, both material (money loan) and immaterial (information,
influence, affection...).

Methodology 57
The three methods have advantages and disadvantages. Lin (2008) points out that the name‐generator
method is appropriate for testing the depth of homophilous relations, but misses data on potential
weaker links to other parts of the social structure. Additionally, the number of names generated typically
ranges from three to five and therefore, the reconstructed network is of limited range and scope. The
position generator facilitates the study of the individual's access to the different levels of the social
hierarchy (e.g. different occupations and stratification in the society) and presents high degrees of validity
and reliability. However, this relational structure‐based methodology is less developed, as well as
providing less precise information about strong ties (Lin, 2008; Van der Gagg et al., 2008). Finally, the
resource generator measures access to specific resources from any part of the network, including people
who do not have an occupation. However, it requires the researcher to know in advance the useful kinds
of resources to ask about in that specific context (Lin and Erickson, 2008: 13).
Surveys and polls are also broadly used to address cognitive aspects, fundamentally for obtaining
information on norms and values, trust, and civic orientation. At the micro/meso level, there are systems
that are primarily aimed at measuring civic capital. This is the case of Guiso et al. (2011: 430) who focus
on those values and beliefs that foster cooperative behaviour. Respondents are asked their opinion on
issues such as paying taxes, abuse of public assets or some negative actions (queue‐jumping, dirtying the
streets and other, similar behaviour) and scores range from 1 = never justifiable to 10 = always justifiable.
The authors suggest that these items can be good indicators of the prevalence of moral actions and the
strength of people’s desire to embody the common good. In a similar way, Knack and Keefer (1997: 1256),
who equate social capital with "civism", suggest that the force of norms and civic cooperation can be
evaluated by the degree to which the following acts are deemed to be acceptable (justified, somewhat
justified, or never justified: a) claiming government benefits without proper entitlement, b) avoiding
paying the fare on public transport, c) submitting false information on a tax return, d) keeping money that
you found in the street, and e) not taking responsibility for damage you accidentally did to a parked
vehicle. This degree of ternary justification has the advantage of the concentration of responses and the
ease with which the results can subsequently be analysed and interpreted. However, these measures are
not exempt from limitations, for example in that respondents are probably reluctant to admit their poor
behaviour. That is why "trap" questions are often used so as to try to gauge the truthfulness of the the
participants’ responses.
On the subject of surveys, it should be noted that online versions have recently become an essential
research tool in a variety of fields because they offer several advantages over the traditional paper‐and‐
pencil formats:
1. They are faster and the entire data collection is significantly shortened, as all data can be collected
and processed in relatively short period of time.
2. They are cheaper, because users can save money otherwise invested in paper, transport or phone
calls. There are some software tools (SurveyMonkey, Encuestafacil, etc.) that allow launching free
online questionnaires (albeit with limited features, the basic plans normally allowing only a certain
number of questions/responses for each survey) or more sophisticated versions that have to be
paid for but are generally inexpensive.
3. They can be trusted. Other studies have found overall that web and face‐to‐face surveys tend to
be more or less equally reliable, whereas the findings from telephone surveys cannot be trusted
to the same degree (Revilla, 2012).
Finally, several projects and experiments aim directly to observe the ways in which social capital displays
one of its expected facets. A well‐known experiment is the so‐called "portfolio test" (Knack and Keefer,
1997: 1257, Paldam, 2000, Van Deth, 2008: 164). An experiment is performed in which a certain number
of portfolios containing money are deliberately lost in various cities, and the number subsequently
58 CHAPTER 3
returned by the people who find them is used as an indicator of the level of trust and civic capital in each
city, and provides information on the social capital perceived as a collective good. Knack and Keefer (1997:
1257) point out that, in their study, the measure of lost wallets correlates by 0.67 with the level of social
trust. Experiments are often carried out with the intention of analysing values and beliefs as well as the
level of trust and reliability (e.g., sharing money with strangers) (Van Deth, 2008; Guiso et al., 2011).
3.3.2. Secondary data
Secondary data implies second‐hand information which has been collected by a third person or entity. In
general, it is easier to access, saves time and cost and comes in a refined form. On the other hand, as the
information is normally gathered for other objectives, data usefulness may be limited.
At the macro level, the measurement of social capital is carried out using confidence as a basic indicator.
Among the most popular surveys conducted in social capital research are the World Values Survey (WVS),
the European Social Survey (ESS), the General Social Survey (GSS) and the Eurobarometer (EB). The
questions asked in this type of research might include: "Do you think that the majority of the people would
take advantage of you if they could?" (item for studying the perception of probability of opportunism)
and "Would you rely on most people?" (item to measure social trust‐distrust). The indicator (trust) is the
percentage of respondents who state that most people can be trusted (Knack and Keefer, 1997: 1256;
Paldam, 2000). Statistical indicators and official statistics are also used to conceptualise social capital in
its different collective manifestations, making it possible to collect information in a wide range of aspects.
Voting turnout, associational density or blood donations can be interpreted as indicators of social capital
in a group o society. Statistical data also sometimes serve as "reverse indicators" of social capital,
indicating where there is a lack of it. Examples include high crime rates and a scarcity of voluntary
associations (Fukuyama, 1995; Van Deth, 2008).
Generally, these datasets are characterised by the use of two types of indicators: proxy indicators and
distal indicators, that is, direct or indirect indicators. The proxy indicators are outcomes of social capital
which are related to the key components of networks, trust and reciprocity (Stone, 2001: 5). Other types
of indicators used for measuring social capital are distal indicators. They are mostly related to the
population (e.g. life expectancy, unemployment rates, rent per capita, distribution of households, etc.),
aspects of political organisation, or social exclusion and disintegration. As an example, Putnam (1993)
employs as a tool the density of voluntary organisations. He estimates civic commitment by calculating
the number per capita of groups and associations (church groups, trade unions, sports clubs, academic or
professional societies and political groups) to which the residents of each region or country belong.
Several authors have criticised Putnam’s use of this instrument, however. For Paldam (2000) there are
three main problems: the definition of voluntary organisation, the intensity of contacts and the problem
of the weight of benignity (for example, criminal and racist associations). Glaeser et al. (2002: 445) criticise
the failure to take into account the size of the network within the organisation and the sociability of the
network. Grootaert (2001) goes further and he states that these indicators should not be included in the
empirical measurement as they contribute to the tautological conclusions about social capital.
Archival data has a great methodological potential as a secondary source, too. For instance, the Company
Registry Office (or a similar entity) provides multiple possibilities for economic historians at the
longitudinal time‐line since it offers the possibility of exhaustive (though not complete) and homogeneous
information of companies, entrepreneurs and invested capital in a given region. Some authors use it to
outline the productive structure of a region and the relative weight of the different economic sectors.
Others perform a more financial analysis, studying origins/destinations and fluctuations in investments.
Finally, another group of scholars seek to determine the factors of location of economic activity and

Methodology 59
identify the existence of industrial districts and/or business groups (Garrués and Rubio, 2011). In addition,
this research line overlaps with the extent literature on interlocking directorates, and many examples can
be cited that use interlocks as indicators of network embeddedness (see Mizruchi, 1996).
Another trend is the application of patent data as relational data. Patents contain information about the
people who possess them and who were involved in establishing them, as well as several citations to
previous patents or scientific work. For the purpose of building a network, particularly the information
about the patent applicant and the inventors is valuable. An alternative approach in patent‐based network
studies is taking the firm as the node in the network. The basic assumption is that a link between two
patent applicants exists in the case of co‐patenting, or in the case of multi‐applicant inventorship. In
providing empirical evidence, Breschi and Lissoni (2004) were among the first to use patent citations to
trace knowledge spillovers and examine their geographical distribution. At this point, Ter Wal and
Boschma (2009) warn that universities and research institutes may be underrepresented in patent data
since their aim is to spread rather than protect the generated knowledge. That is why some network
studies use co‐publication data to reconstruct inter‐organisational networks in which universities and
other research institutes will play a bigger role (Binz et al., 2006).
Other sources of secondary network data are also exploited in the literature, such as strategic alliance or
joint‐venture databases (Stuart, 1998), European Framework Programmes (e.g. Maggioni et al., 2007)
and, especially, Internet flows. Studies based on virtual data find out how many linkages individuals have
on Social Network Sites (SNSs) and later map the structure of the network, together with some analytical
data. The existing research into the relationships between SNSs and social capital tends to be limited, but
literature on general Internet use is wide enough to enough to accommodate competing paradigms and
illuminate the discussion. Echoing Putnam’s (2000) “time displacement hypothesis”, Nie (2001) found that
Internet users had fewer face‐to‐face interactions, as is the case with people who spend a particularly
large amount of time watching television (see also Kraut et al., 1998). Subsequent research found that
online communications might in fact have a positive effect on individuals’ participation in community life
(Kavanaugh et al., 2005; Kobayashi et al., 2006; Räsänen and Kouvo, 2007). The intellectual battle between
cyberpessimists and cyberoptimists still continues and each group underlines its arguments of greater or
lesser relevance. In order to clarify this debate, Williams (2006) states that the problem with the “time
displacement hypothesis” is that it ignores the differences between traditional, mass media and new,
interactive media. When watching television, people cannot communicate with each other. With e‐mail,
chat services and SNSs, however, people can engage in interpersonal contact. So when researchers
operationalise Internet use as time spent with the technology, they ignore the multiple audiences,
motives, and experiences that the medium allows and tend to find a negative effect on individual‐level
production of social capital (e.g., Nie and Hillygus, 2002). On the other hand, when researchers recognise
the different uses of the Internet (e.g., informational, recreational, communicative, entertainment, etc.),
they tend to find a positive link between certain motives for Internet use and social capital (see Shah et
al., 2001; Beaudoin, 2008; Raacke and Bonds‐Raacke, 2008). In short, it is clear that the positive and
negative effects of the Internet on social capital are contingent upon the way scholars conceptualise the
medium (Williams, 2006) and how people use it (Shah et al., 2001; Kwak et al., 2004; Ji‐Young, 2006).
However, the general assumption is that Internet use related to information acquisition and community
building (e.g., online news, political blogs, virtual communities) is positively associated with epigenetic
dynamics both at the individual and organisational level (Gómez Uranga et al., 2016). In contrast, patterns
of use related merely to entertainment (e.g. games and online movies) are negatively associated with
social capital (Norris and Jones, 1998; Wellman et al., 2001; Shah et al., 2002).
Extending this rationale to SNSs, we could say that their impact on social capital should be contingent
upon the specific uses and gratifications sought by users. However, recent research assumes that online

60 CHAPTER 3
networking has been shown to strengthen and maintain offline social ties, but has less of a benefit for
meeting new people (Acquisti and Gross, 2006). This suggests that social networking via the Internet is
good at investing in existing relations, but not at investing in new linkages. In addition, Donath and Boyd
(2004) speculate that SNSs could largely increment the number of weak ties a user could create, because
the technology is well‐suited to maintaining these ties cheaply and easily. Therefore, using Putnam’s
(2000) concepts of bonding and bridging social capital, the latter might be especially increased by such
sites which support loose and latent social ties, enabling users to form and retain larger, diffuse networks
of relationships that broaden the information and opportunities available to them (Wellman et al., 2001).
In this respect, Backstrom et al. (2012) proved that, using the entire Facebook network of active users,
the average distange between any two persons in the world is 4.74, improving the previous
measurements of Karinthy (six friendship links) and Milgram (between 4.4 and 5.7 intermediaries).
3.4. Methods for social capital analysis
Most social science researchers acknowledge the importance of using a range of methods to assess any
given phenomenon. In practice, however, the distinctive skill sets associated with each approach, plus
limited time and resources, mean that only one approach tends to be adopted for a specific study. This
practice is especially unfortunate in the case of complex issues such as social capital, and in order to
adequately establish a firm basis for investigation, data that offer both context‐specific “depth” (usually
obtained via qualitative methods) and generalisable “breadth” (usually obtained via quantitative
methods) are required (Bamberger, 2000; Rao and Woolcock, 2003), as noted in section 3.2.
Quantitative methods characteristically refer to objective measurements in the form of statistical,
mathematical or numerical analysis. These methods allow the results to be considered representative
(research is usually based on a broad study, involving a great number of subjects), comparable
(correlations may be sought between given variables, and the original findings may be validated by
replicating the analysis), generalisable (summaries of data support generalisations to a wider population)
and accurate (if methodological standards are apllied correctly). A very well‐known quantitative tool is
descriptive statistics, which summarises the information that has been collected. Some measures that are
commonly used to describe datasets deal with the central tendency (e.g., the mean, median and mode),
variability or dispersion (the standard deviation, the minimum and maximum, etc.), position (percentile
and quartile ranks) and frequency. As some scholars have pointed out, every time a large set of
observations is described with only a single indicator, there is a risk of distorting the original data or
overlooking important details. Despite this limitation, descriptive statistics provide a powerful summary
that enables comparisons to be made between people or other subjects.
Descriptive statistics are typically distinguished from inferential statistics in that the former summarise a
sample whereas the latter use the data to learn about the population that the sample is thought to
represent. Descriptive statistics are usually used as a preliminary step before more formal inferences are
drawn, where a set of assumptions concerning the observed data are tested. Given the difficulty in
specifying exact distributions of sample statistics, many methods have been developed. With finite
samples, approximation results measure how close a limiting distribution approaches the statistic's
sample distribution. With indefinitely large samples, generalised estimating models, which are popular in
econometrics and biostatistics, are used for limiting results.
Econometric analysis is also operated in varied fields of applied economics when we want to test a
relationship that might be relevant for business decisions or policy assessment. The first step, like in any
empirical analysis, is the careful formulation of the analysis model. Economic reasoning (based on
Methodology 61
common sense or intuition) is used for choosing the independent variables that will explain the dependent
variable. For example, a generic econometric model could be the following one:
Social capital = β0 + β1Variable 1 + β2Variable 2 + β3Variable 3 + … + µ
Various hypotheses of interest can thereby be stated in terms of the unknown parameters. After data on
the relevant variables have been gathered, econometric methods are used to estimate the parameters
and to verify the importance of the explanatory variables on the explainved variable (in this case, social
capital). This is, in fact, one of the big advantages of quantitative methods: they are especially well suited
to measuring changes in impacts and are also suitable for drawing inferences from observed statistical
relations between these impacts and other covariates. Furthermore, by maintaining a greater distance
from individuals from whom the data is obtained, and by analysing the data in numerical form,
quantitative methods are intended to uphold empirically rigorous, impartial, and objective research
standards. The strengths of quantitative research can, however, also be weaknesses. Many important
characteristics of people and communities (for example identities, perceptions, and beliefs) cannot be
meaningfully reduced to numbers or adequately understood without reference to the local context in
which people live. In addition, most proceedings are designed far from the places where they will be
administered, so the parameters of research tend to reflect the preconceptions and biases of the
researcher. Besides, quantitative techniques are in general less effective in understanding processes or
series of events instigated by a particular intervention. For example, consider an entrepreneurial project
driven by the city council that provides it with funding. A quantitative impact evaluation would typically
employ quantitative outcome indicators, such as the number of start‐ups created or how well benefits
were targeted so as to enhance social capital. Nevertheless, quantitative analysis does not have the
capacity to describe the complex deliberations of local politics that would have launched the investments,
and these concerns can be crucial to understanding impact as opposed to simply measuring it.
Qualitative methods typically refer to a range of techniques which analyse textual data. Common methods
including ethnography, life histories and prosopographies have long been used to elucidate the values,
perceptions, attitudes and opinions of individuals, providing especially the cognitive aspects of social
capital. Focus group research and public observations are also carried out. These social representations
are particularly suitable for identifying and evaluating relationships, behaviours and the nature of trust
that exists in communities. Moreover, qualitative methods allow for more in‐depth analysis of social,
political, and economic processes (Hentschel, 1999; Krishna and Shrader, 2000) and they are particularly
effective in delving deeper into complex issues of causality and context. Venn diagrams, genograms,
seasonality maps, institution mapping, causal flow diagrams and priority rankings often illustrate, on a
single page, complex interrelationships that are difficult to capture in pages of text (Miles and Huberman,
1994; Watts and Shrader, 1998).
But just as quantitative approaches have their limitations, so do qualitative methods. First, it is more
difficult to extrapolate qualitative findings to the wider population because the samples tend to be small
and selected in an idiosyncratic manner (e.g. a decision on the part of the lead investigator) or upon the
recommendation of other participants (as in “snowball” sampling procedures, in which one respondent
agrees to provide access to another respondent). And second, the analysis of qualitative data demands
interpretation of the research, and two researchers looking at the same data may arrive at somewhat
different conclusions. Therefore it is difficult (though not impossible) to make compelling claims regarding
causality on the basis of qualitative data alone.
Lately, an increasing number of scholars have attempted to measure social capital through SNA, a
promising qualitative and quantitative tool for empirically investigating the structure and evolution of

62 CHAPTER 3
inter‐organisational interaction and knowledge flows within and across regions (Ter Wal and Boschma,
2009). The next section will introduce the main features of this methodological approach.
3.5. Social Network Analysis (SNA)
The empirical approach to social relations has progressively evolved into an organised paradigm of
research defined as SNA. Freeman (2004: 3) characterises SNA as an approach that involves four defining
properties: (1) links among social actors are important; (2) systematic empirical data is collected to analyse
social relations; (3) graphic imagery displays the patterning of the links; and (4) mathematical and
computational models are used to describe and explain those patterns. Furthermore, Wasserman and
Faust (1994: 4) state that SNA is a distinct research perspective within the social and behavioural sciences
because it is based on the importance of relationships among interacting agents. According to them, SNA
relies on the principle that actors and their actions are not exactly autonomous units but interdependent,
and these relational linkages act as facilitators (or constraints) of a flow of resources, both material and
not material.
With this structural and relational paradigm is possible to represent the whole social structure. The basic
idea for SNA is that society is a huge network that can be analysed through multiple pairs of actors
embedded in that social structure at many different level: states, companies, institutions, social groups or
individuals (Requena, 2008). The simplest unit of analysis is the dyadic relation between two actors, but
actors are not linked only through dyads since they are also immersed into multiple patterns of ties
(Wellman, 1988). The data from those relations makes it possible to analyse the existence of groups, the
positions of certain actors in the social structure, those actors who are better positioned, etc. According
to the picture of the social structure that is created, it is possible to understand these actors’ opinions and
their position within it. How they act is influenced by their position within the structure, and at the same
time, the actor may influence in the patterns of the networks and consequently affect others actors‘
behaviour. From this point emerges the vision of the network as a dynamic set of ties with a core‐
periphery structure (Morgan et al., 1996). The core network members are those with dense and relatively
stable relations, and the peripheral members are those whose ties are less reported and contacted, and
who have looser relations both with the ego and between themselves.
As mentioned before, in SNA the unit of analysis are not social groups or individuals but relations among
them. However, it does not mean that attributes of the nodes are not relevant, as the relations have
attributes and are influenced by the attributes of the social actors. The main question in SNA concerns
the quantity and quality of the relations that different social actors maintain. For instance, in the case of
several institutions working together through projects (which are the links between them) the attributes
of those projects are the attributes of the relations. Equally, the attributes on each institution might also
exert an influence on the structure of relations. And so SNA does not only describe the social structure,
but also interprets the influence in actors‘ behaviour originated by the relations and the position within
that social structure (Marsden, 1990).
3.5.1. History of SNA
In the history of SNA there are very diverse strands that have intersected with one another at various
times. Nevertheless, according to Scott (1991), a clear lineage for the mainstream of SNA can be
constructed, highlighting three main lines: the sociometric analysts, the Harvard researchers, and the
Manchester anthropologists (see Figure 1).

Methodology 63
The sociometry and graph theories were developed during the 1920s and 30s by German scholars who
migrated to the United States. Their work, influenced by Wolfgang Köhler’s “Gestalt” theory, emphasised
that human thoughts and behaviours are structured according to organised patterns located in group
organisation. Among them the most important were Moreno (1934) and Lewin (1936), as cited by Scott
(1991). Moreno investigated social relations among small groups of individuals, analysing the structure of
those relations, their properties and also the roles played by specific actors, such as those who were
leaders or so‐called “stars”. He described this approach as “sociometry” and developed “sociograms”,
with points and lines, as a means of visually representing social networks (Wasserman and Faust, 1994).
His contribution is considered the first refined structural approximation to modern SNA (Carrington and
Scott, 2011).
Figure 1: Origins of SNA Gestalt theory Structural – functional anthropology Sociometry Mayo, Warner Gluckman Group dynamics Graph theory Mitchell
Harvard structuralist SNA Source: adapted from Scott (1991).
Lewin developed the structural perspective in the field of social psychology and created a social network
research group that included different universities in USA (Iowa University in 1936, Massachusetts
Institute of Technology in 1945 and the University of Michigan in 1947). After his sudden death in 1947, a
large number of graduate students and postdoc researchers who had worked with him (Cartwright,
Festinger, and Harary, for example) contributed to the development of mathematical models for network
analysis.
Simultaneously, anthropologists and sociologists at Harvard University were working on some ideas of the
British social anthropologist Radcliffe‐Brown regarding the interdependence of the structural elements in
social systems. In the study of workers’ productivity in an electrical company of Chicago, Mayo (1933, in
Scott, 1991) detected the relevance of non‐rational elements and informal relations among workers. At
the same time, Warner depicted an informal network structure parallel to the formal organisation of
workers and detected the existence of subgroups of people besides those such as family or associations,
coined “cliques”. The clique referred to an informal association of people among whom there is a degree
of group feeling and intimacy and in which certain group norms of behaviour have been established
(Warner and Lunt, 1941: 32, in Scott, 1987: 21). Through these cliques, it was possible to represent not
only the relations among individuals but also among groups and, thus, gain an understanding of the entire
community.
In Britain, a school of social anthropologists, based principally at Manchester University, applied these
ideas to the study of African tribal societies and, a little later, to rural and small towns. Gluckman, who

64 CHAPTER 3
led the Rhodes‐Livingstone Institute at Zambia University, was concerned with social structural change in
former African colonies and the role of conflict and power in the social structure. His later move to
Manchester confined clearly the interest of other researchers in this field and some exemplary studies
were carried out in different ex‐colonies. This work on African communities was subsequently reported
by Mitchell (1969, in Freeman, 2004) in one of the earliest summaries of a formal social network
methodology. He pointed out that it was necessary to delimit the total network into partial networks in
order to carry out operative research. This could be done on the basis of an individual’s egocentred
network or particular aspects or areas of the whole network. Additionally, the graph theory made it
possible to study the texture of social relations through new concepts such as density and reachability.
These initial contributions to future network analysis made considerable advances in allying mathematics
with substantive social theory, but the first well‐developed systematic framework was designed back at
Harvard in the 1970s, mainly through the work of Harrison C. White. His initial PhD in physics gave him
insights into the refinement of mathematical tools that he then applied to social networks in his later PhD
in sociology, creating a unique synthesis which was developed and enlarged by a whole generation of
students whom he trained, including Granovetter, Breiger, Erickson and Wellman. This background made
it possible to analyse data using rigorous and precise techniques, giving rise to a group of scholars whose
extensive work backed up their theoretical studies with an empirical basis. Without this mathematical
approach, the social network paradigm would have been mired in the same problems of scientific
precision that blighted other traditional concepts in sociology (Freeman, 2004).
Since the late 1970s there has been a huge increase in technical contributions to social network
methodology, and in its application. An important area of application has been the investigation of
interlocking directorships, community structure, policy networks, criminality and terrorism, economics,
geography and many other topics (Carrington and Scott, 2011). Network theories have also been
developed, including the strength of weak ties theory (Granovetter, 1973) and the small world theory
(Watts and Strogatz, 1998). Additionally, social network analysts have developed a number of software
applications to analyse social network data, the most commonly used being Pajek, UCINet, MultiNet,
SIENA, R, ORA and Node XL (Huisman and van Duijn, 2011).
Today, SNA is a scientific community with a recognisable intellectual lineage of researchers linked by
cross‐cutting collaborations and inter‐citations (Freeman, 2004). It has an association (INSNA, the
International Network for Social Network Analysis) and various dedicated journals in English (Social
Networks, Journal of Social Structure and Connections). In Spain, one particular annual meeting of INSNA
held in Sitges in 1998 launched efforts to bring together scholars from Latin America, Spain and Portugal
which finally resulted in the foundation of the journal REDES (Revista Hispana para el Analisis de Redes
Sociales), especially for the Ibero‐American public and mainly published in Spanish.
3.5.2. SNA as a methodology
SNA is a set of concepts and analytical and methodological procedures (Lozares, 1996). Conceptually, the
network is set of points linked through lines that can be represented in a matrix and displayed visually in
a graph. Both the points and the lines can subsequently be measured using quantitative and qualitative
techniques.
The quantitative analysis of networks is developed in SNA through statistical measures based on
mathematics and graph theory. Measures of cohesion such as distance, reachability and density analyse
the interconnectedness between actors and make it possible to describe general structural features of
the network. Centrality measures are related to power distribution in the network and the capacity of

Methodology 65
certain actors to influence others. Finally, another important aspect to analyse in the network is the
existence of subgroups. By analysing the existence of dyads or triads between actors in a network, we
approach the analysis from a bottom‐up perspective. In this level of analysis the measuring of different
subgroups serves to explain why certain actors tend to relate to each other and form groups that are
denser than certain other groups in the same network.
SNA is also a descriptive tool, rich in qualitative details. The nodes may be tuned according to the different
attributes of the actors. It is very common to change the symbol, the size and/or the colour of the point
depending, for example, on the degree or the betweenness centrality. Equally, the width of the lines may
also indicate the strength of the tie, which is to say the number of times that two actors have interacted
with each other. This combination of quantitative and qualitative approaches is in line with the integrative
characteristic recommended for analytical models and really makes SNA an ideal tool for network analysis.
SNA has also solved the historically troubled relationship between micro and macro analysis. At the micro
level the analysis focuses on the relations of individual actors. In personal network analysis the research
interest is the person’s world, his/her relations, and how this relational structure affects their personal
behaviour. That is, what kind of people are related to the ego, the nature of these relations, what kind of
resources flow through them, and how they are related one to another (Wellman, 2007). Drawn from the
study of interpersonal networks, institutions and organisations can also benefit from their formal and
informal relations with their counterparts, and the structure of the organisational network is important
in order to understand the form taken by collective action, the actors’ capacity for operation and the
limitations they face.
At the macro level, network analysis can also explain the network configuration and actor’s location within
the whole social structure. One of the principal uses of network analysis in sociology and anthropology
has been to uncover the social structures of a wider system, where it is also vital to observe the positions
of certain actors and the specific pattern of relations between them (Requena, 1989). In that sense the
use of SNA to study organisational environments is a plausible methodological step forward in
interorganisational theory. Social networks emerged as a distinctive and alternative approach, superior in
explanatory capacity to the old atomist approaches and hierarchical perspectives in the study of
organisations (Borgatti and Foster, 2003). The introduction of SNA to the study of interorganisation makes
it possible to consider different types of network such as joint ventures, strategic alliances, business
groups and outsourcing agreements. Equally, it has also revived the study of governance in the private
and public management of organisations.
According to Requena (2008), SNA also entails another advantage. It offers a more complete view of
society because it shows the fluidity of social relations across all types of formal and informal social
divisions. There are institutions that are built upon established formal membership criteria, with a rigid
formal structure or organisational structure (organigram), but all of them are based on flexible and
informal relations, and analysing them can offer a totally different view. And paradoxically in response to
the traditional difficulty of measuring social capital, SNA uses statistical analysis to measure social
relations and shows how they are arranged.
Despite this maturity in terms of methodology and theoretical frame, the paradigm seems not to have a
solid basis in sociological tradition. For Scott (1987), SNA has created a certain reluctance on the part of
sociologists and needs to make its mathematical methods more accessible, bringing them closer to
traditional research. For others it is necessary to overcome the excessive descriptive methodological
approach to social relations and to work more towards a deductive and coherent theory (Lozares, 1996:
123). In general this claim suggests a lack of balance in SNA between the forms systematically captured

66 CHAPTER 3
through mathematical techniques, and the substance. For others, however, SNA at the end of the
twentieth century has fully established itself in the social sciences (Freeman, 2004). For Hummon and
Carley (1993), the evolution of citation pattern, the concentration of publications in a specific journal, and
the high density of citations among scholars, are indicators of a consistent convergence towards the
pattern of scientific development labeled “normal science”. Future advances in the research into social
networks, its application to an increasing number of other fields of research, and the importance of
networks in twenty‐first‐century societies are all contributing in this direction.
3.6. Further research considerations
So far I have underlined the basic requirements when it comes to measuring social capital, concluding
that we need to adopt a multidimensional and a multilevel perspective that integrates quantitative and
qualitative methods. A rich palette of data collection and analysis techniques has also been introduced,
which reflects the progress of empirical research at various spatial levels. Having said that, there are
further issues that need to be taken into account for a representative and reliable analysis, and often little
effort is made to establish the validity and quality of studies. In this vein Westlund and Adam (2010)
analysed 65 studies that addressed the relationship between social capital and economic performance,
and they detected divergent and even contradictory findings that call into question the selective research
strategies employed on the basis of secondary data analysis. They therefore proposed that further
research would be necessary into the economic impact of social capital.
One of the principal concerns was related to the supply side of measuring indicators. A lot of proxies
measure employees’ and consumers’ views through surveys (WVS, EVS, EB, ESS, etc.), covering the
demand side of the economy. They are of course important, but they might give a one‐sided view of the
aspects that influence economic development. This problem has not been explicitly discussed in the
literature, and even though there are examples of some studies pertaining to the economy’s supply side,
they merely constitute a few isolated examples that illustrate certain attitudes. The appropriate
conclusion is that greater attention must be given to supply‐side measures in future studies, and that will
clearly be one of the cornerstones of my contribution since, in one way or another, my research deals
with companies and, ultimately, with manufacturers or business owners.
These authors also present some interesting reflections about trust and associational involvement, by far
the most frequently used indicators in the 65 studies. They do not question the importance of these
measures but they do question the circumstances in which they are applied. Trust, for example, is context‐
dependent since it varies between different scales of society. Local trust is not the trust being measured
in national surveys, so just as social capital at the individual level may not always determine social capital
at the regional/national level, the disaggregation of measures from higher spatial level to lower levels
creates heterogeneous results. That is why I do not merely rely on trust measured by Eustat for the Basque
Country as a whole, but instead try to estimate the relational dimension through additional evidence that
better suits each different level of analysis.
A similar conclusion can be applied to associational activity: it is basically local and therefore may not be
an indication of conditions all around the region or nation. In addition, human networks and the
interaction that takes place within them consist of much more than the number of formal associations
and their members. Human actors take part in an infinite number of informal but unregistered networks,
many of which are flexible and loosely organised. Many of them are related to professional activities and
are thus directly connected to economic variables such as production, productivity and innovation, but
these networks are not registered or measured. Accordingly, I have made a special effort to incorporate

Methodology 67
other proxies that may account for a wider share of actors’ network interactions. Sections 5 is a clear
example of that.
Westlund and Adam also conclude that other important norms and values are frequently missing from
the attempts made to measure social capital. There are a number of values, norms and attitudes (e.g.
entrepreneurial attitudes, creativity, tolerance, co‐operation, sharing of knowledge) that have an impact
on economic factors but have seldom been included among the explanatory variables. In this respect
Staber (2007) calls for contextual research to observe the organising principles and governance modes
that will provide insights about the specific circumstances in which actors operate. Personally I believe
this is a general weakness of the social capital literature, and therefore I have tried to compensate for this
lopsided selection of variables by testing supplementary measures such as online interaction (section 6)
or entrepreneurship, knowledge spillovers or institutional performance (section 7).
Finally, a final academic remark points out that the country‐specific semantic and cultural attributes are
not systematically considered and analysed. Regions always differ with regard to their internal
interactions over time and their positions in inter‐regional systems, which has contributed to differences
emerging between the cultures and the social capital of different regions. Consequently, in some cases
the question remains open as to whether some oscillations can be attributed to cultural‐semantic issues.
In that sense, in section 7 I dare to study ethnic, cultural and other types of local characteristics, and to
estimate their contribution to the economic development of a municipality.


Social capital in the Basque Country
CHAPTER 4


Social capital in the Basque Country 71
CHAPTER 4: SOCIAL CAPITAL IN THE BASQUE COUNTRY
4.1. Introduction
This section aims to display the state of the art in the Basque Country, that is, what has been investigated
so far about social capital at the national and regional level. This revision will be helpful to assimilate the
contribution of other approaches and stress the pertinence of the research problem.
Traditional economic research generally considers nations instead of regions. Moreover, usually only
economic aspects are taken into account while the social, geographical and historical processes are
ignored (Semitiel, 2006). From this research perspective, it is particularly important to estimate the whole
set of related actors constituting diverse networking structures at the regional level. And this task is even
more relevant when a given territory has undergone significant political changes in the last decades, as it
is the case of the Basque Country. Indeed, the Statute of Autonomy, promulgated on 18 December 1979,
welcomed a new institutional panorama that had nothing to do with the previous centralised governance
of the Franco regime. For this reason, estimating the stock of social capital from time to time has recently
turned one of the objectives of the Basque authorities and Eustat (the Basque Statistics Institute) is
charged to carry out a survey every 5 years. The results are later included in the socioeconomic report
published by the Basque Economic and Social Council (CES in Spanish: Consejo Económico y Social Vasco).
When studying networks, the sets of their related interdependent complex components constitute
structures inside structures, and the research should focus on different stages, considering different micro
and macro scales. In the Basque Country, the public administration is structured in three levels: the
general Basque Government, the Provincial Councils of Bizkaia, Gipuzkoa and Alava, and the municipalities
(see Appendix 1). The Basque Government is a strong administrative unit and its Industry Ministry is in
charge of general industrial policy frameworks and concrete support programmes (like the cluster policy
set up in the 90s). The three Provincial Councils have financial power, as they are responsible for the
collection of the general income and corporate taxes. Each of the three provinces has its own tax regime,
and they subsequently transfer part of these funds to the Spanish central government, the Regional
Government and the municipalities (Zubiri, 2010). Furthermore, they are responsible for the urban
development and infrastructure, and have also deployed important industrial policy programmes,
supporting the internationalisation and training of SMEs, and notably, promoting the provincial
Technology Parks. Finally, the remaining levels of public administration (counties and the municipalities)
do not receive important policy prerogatives but they lately display a growing “bottom‐up” dynamism,
especially due to the local development agencies that have emerged in some valleys or groups of
municipalities (Aranguren et al., 2012).
4.2. Actors and networks of economic governance
In the last decade of the 20th century, the Basque Country launched a new phase of development coined
as the “Second economic transformation”. The first economic transformation coincided with Spain’s entry
into the European Union in 1986, and the Basque Country transited from a steel‐dominated economy
based on the domestic market and old technology, to a diversified industrial economy focused on the
penetration of international markets, quality, and technological innovation. The second transformation
has moved the Basque Country towards a modern information society with knowledge‐based activities
throughout the economy, where innovation has been the key driver. In this context, there has been a
change in the administrative framework towards new modes of governance, and several networks of
public‐private participation have been set up (Aranguren et al., 2010b; Aranguren et al., 2012). In the
study of these networks we must consider, in addition to the structure, the process of cooperation
between the agents that determine the learning process and the exchange of knowledge among them.

72 CHAPTER 4
Hereunder I introduce some experiences, starting from the regional level and then reaching the provincial
and local levels.
4.2.1. Regional scale
The policies and plans implemented have been oriented to create a RIS. Above all, it is worth mentioning
the cluster policy developed at the regional level by the Basque Government in the early 1990s. Cluster
associations are an example of public‐private participation and collaboration where proximity between
agents enables the generation of scenarios for a new model of multilevel governance based on the same
value chain. I deepen in the analysis of these entities in chapter 5, devoted to study the role of Cluster
Associations in regional competitiveness.
The second big step was the creation and subsequent evolution of the Basque Science, Technology and
Innovation Network, which aimed to foster relations of collaboration and coordination among the
technological research entities. On April 29 1997, the Basque Government defined the characteristics that
candidates had to fulfil and all accepted agents were grouped into seven distinct categories. Shortly
thereafter, members of this network created Saretek, a separate private and non‐profit association, which
brought together all types of actors (without any distinction of categories). Therefore, we can speak of
two aspects of the same reality: the institutional network regulated by the government, and the private
one, represented by the association Saretek.
The experience showed that this map did not cover the expected spectrum of multiple actors involved in
innovation processes, but only those with an explicit scientific and technological function. Technology
centres played a key role, opposed to the secondary position of other actors who did not have their own
space in this network. From the recognition of this relational deficit between innovative agents, a series
of new intervention instruments were introduced in the PCTI 2007‐2010 (Science, Technology and
Innovation Plan). Among others, Saretek transformed into Innobasque7 (Basque Agency for Innovation)
for coordinating and promoting innovation in the Basque Country in all its areas, fostering
entrepreneurship and creativity. Since its creation in 2007, this agency has expanded the perimeter of
participants, and is formed, in addition to agents belonging to Saretek, by private companies, Basque
public administration, business and trade union organisations and other entities linked to innovation
(Valdaliso, 2018).
Innobasque is a unique experience of collaboration between institutional and social agents, and
has become one of the central initiatives of development policies in the Basque Country. It establishes
the guidelines of the collective economic development projects, showing innovative and transformational
elements in comparison with the previously existing hierarchical model, such as the participation of
multiple agents of diverse backgrounds8 or the conception of workgroups and their wide autonomy to
arrange their internal activity. All these aspects make possible the multiplication of collaborative relations
between agents, giving an extra impulse to the regional social capital.
Another change introduced in 2007 was the creation of Ikerbasque9 (the Basque Science Foundation) to
strengthen the Basque Science System through programs to attract and consolidate research talent, as
well as actions to stimulate research. The government also created new research centres: cooperative
7 http://www.innobasque.eus/?lang=es (last seen: 30/11/2017). 8 There were more than one thousand participating partners in 2016 (Innobasque, 2017). 9 http://www.ikerbasque.net/en (last seen: 30/11/2017).

Social capital in the Basque Country 73
research centres (CICs) for applied research and Basque Excellence Research Centres (BERCs) for basic
research. Taken together, these changes signal a determined effort to create a RIS.
With the creation of Innobasque and Ikerbasque, also in 2007, the so called "Basque trident of innovation"
was completed with the Basque Council for Science, Technology and Innovation. It is the highest body for
participation, advice and policy leadership around science, technology, research and innovation in the
Basque Country. The Council is composed of representatives of the Basque Government, the Provincial
Councils, the three Basque universities (UPV/EHU, Deusto and Mondragon), Innobasque and Ikerbasque,
the two main technological centres (Tecnalia Foundation and IK4 Technological Alliance), as well as
Jakiunde (the Academy of Sciences, Arts and Letters) and, since 2014, four Basque tractor companies with
high private investment in R&D such as Sener, Siemens Gamesa, Mondragon Corporation and Gestamp.
The Competitiveness Forum is an additional tool that the Basque Government launches from time to time
in order to rethink the lines and plans introduced by the government in terms of competitiveness. This
process of reflection aims to co‐generate new knowledge through the interaction of the participating
actors (belonging to both the public and the private sector), and later on, the public institutions are in
charge of implementing the proposed improvements. The last Forum was called in July 2015 to assess the
2014‐2016 Industry plan and agree the main challenges of this sector in the future10.
Another structure expanded throughout the territory is Garapen11, the Basque Association of Local
Development Agencies, made up of 33 agencies that provide services to 187 municipalities, whose
population amounts to 1,897,008 inhabitants, representing 86.64% of the total population of the Basque
Country (Garapen, 2016). Its role is twofold: to generate bottom‐up processes and social capital at the
local level and, besides, to activate local resources that facilitate the reduction of the gap between local
agents and agents belonging to the innovation system (Larrea et al., 2007).
4.2.2. Provincial level
The three provinces of the Basque Country present several processes to promote new scenarios for
governance. It is in the territory of Gipuzkoa where a greater number of experiences and programs have
been operationalised in the last decade. In 2008, the Provincial Council launched a strategic reflection
process called G+20, which aimed to be a common space for debating about challenges that the society
was facing in the future (more exactly within the period 2020‐2030). During 3 years, open meetings were
organised and local administrations, the educational community (universities and training centres) and
the civil society (through various associations) took part actively. Similarly, the Provincial Council and
Innobasque impulsed the creation of Gipuzkoa Berritzen in 2007. It was an association that promoted
innovation in cooperation to lead the transformation into an innovative and cohesive society. Currently,
Gipuzkoa Sarean12 is an example of shared leadership to drive major strategic challenges in the territory.
To this end, it is intended to stimulate public‐private collaboration, integrating leaders of different sectors
considered key to social and economic development. KoopFabrika13 is another programme that is
attracting a growing interest. Supported by a multi‐agent community, it strives to promote socio‐
economic initiatives and cooperative activities.
10 http://www.irekia.euskadi.eus/es/news/27761‐tapia‐reune‐foro‐competitividad‐reafirma‐papel‐decisivo‐industria‐para‐futuro‐euskadi (last seen: 30/11/2017). 11 http://www.garapen.net/public_home/ctrl_home.php (last seen: 30/11/2017). 12 Now integrated in the programme Etorkizuna Eraikiz: https://www.gipuzkoa.eus/es/web/etorkizunaeraikiz (last seen: 30/11/2017). 13 http://koopfabrika.eus (last seen: 30/11/2017).

74 CHAPTER 4
In Bizkaia, a new project called Bizkaia Orekan is to emerge guided by the Provincial Council, Orkestra and
local actors that pretends to enhance the networking culture and set a new governing model in Bizkaia.
Particularly, it is aimed to build a competitive and balanced territory, adapted to the different realities of
Bizkaia through the formation of specific work teams in each county. To this end, a process of
identification of challenges related to competitiveness was first carried out by local agents. After that,
four working groups have been created which correspond to different areas of Bizkaia distinguished in
the project:
‐ North: Txorierri, Mungialdea, Uribekosta and the right bank of the Nervion river.
‐ East: Busturia, Lea‐Artibai and Durangaldea.
‐ South: Nerbioi‐Ibaizabal and Arratia.
‐ West: Ezkerraldea, Meatzaldea and Enkarterri.
The working groups have defined actions to respond to common challenges of companies, sectors and
clusters and the business environment, and are now working on their implementation. In addition, they
seek to identify new business opportunities and generate jobs.
In Alava, the Provincial Council started a new project in 2016: Agora14. It is a collaborative forum for the
economic, social and cultural revitalisation of the territory. More than 300 agents have participated in the
diagnosis phase and five initiatives have emerged from the forum's collaborative work:
1. Agora 4.0.: in this initiative, the university, formation centres, companies, research centres and other
institutions participate to position Alava at the forefront of Industry 4.0, characterised by the
digitalisation of production processes. One of the first conclusions reached by this initiative is the need
to achieve a top training program in the province to fulfil the demands of the industry. To this end, a
specialisation course has been launched in the field of dual formation. The Aeronautical Technology
Centre in Miñano, the University of the Basque Country and Aernnova will soon introduce a training
program for PhDs in aeronautics, too.
2. Cross‐mentoring program: it is an initiative to create links between different companies and their
managers.
3. Natura 2000 Network Spaces: it will develop a strategy to convert the natural parks into a key piece
for the generation of market niches and the attraction of investment towards the rural milieu.
4. Social Innovation Forum: a social innovation strategy is being implemented through the mapping of
agents and social innovation projects.
5. Agora TeknoCamp: it is an educational project to awaken interest in science and technology in a playful
way among young people, promoting skills that favor innovation.
4.2.3. Local level
As pointed before, the governance map in the Basque Country presents a vast amount of Local
Development Agencies, which hold a great potential for mobilising civil society around proximity
scenarios. Although their context, reality, identity and characteristics are very diverse, they share an
attitude towards processes that facilitate the development of new models of local governance created
recently in several counties. Thus, the traditional model of the agencies (that is, simply transfer and apply
the measures and programs defined by institutions of higher administrative status) begins to be reversed.
Instead, the perceptions of local actors are now transferred within a bottom‐up process, which constitutes
an essential step both for the efficiency of the programs and the transformation of public policies.
The support to the local business fabric is one of the most important pillars of their work. This traditionally
14 http://www.agora.araba.eus (last seen: 30/11/2017).

Social capital in the Basque Country 75
individualised task has been reformulated due to the generation of these type of networks where
participating agents have a clear decision‐making capacity when defining the action plans to be
developed. This new working model based on cooperation facilitates the involvement of all agents and
strengthens the collective sense, due to the proximity between partners and, consequently, their greater
degree of confidence. Thus, Local Development Agencies may be considered as self‐organising learning
processes where social capital is fostered through the dynamisation of local networks.
The extent of these agencies in the Basque Country is considerable. Most of them have been developed
in Gipuzkoa, a territory that, in comparison to Bizkaia and Alava, presents a map of valleys consolidated
in time, which in turn affects the existing local identity and derives in a specific spatial structuring. In
addition to the trajectory of Ezagutza Gunea in Middle Urola (Larrea, 2003), the counties of Tolosaldea
(Lehiberri project15), Low Deba (Deba Business Forum) and Goierri (Goierri Valley16), among others, have
developed networks that have resulted in action plans as a result of that interaction (Estensoro and
Zurbano, 2010). In Bizkaia, the districts of Lea Artibai (Azaro17) and Durangaldea (Polo de Competitividad)
also present some collective experiences, but in general, their formation is not directly linked to the
initiative of the corresponding development agency or Behargintza. And in Alava, the pronounced tractor
effect of Vitoria‐Gasteiz produces a centralisation inertia around the capital city, and thereby, the local
identity is diffuse or pops up in specific cases, such as the experiences launched in Aiara (Gaindegia, 2017).
Some medium and large sized municipalities have also attempted to create ecosystems for collaboration.
In Bilbao, for example, the City Council and 14 local agents founded Wikitoki18 in 2014, a laboratory for
collaborative practices This association works around concepts such as co‐creation, hybridisation, P2P,
commons, entrepreneurship and social economy, open company, artistic practices, social technologies or
digital narratives. In addition, Wikitoki promotes the Space Exchange network, a proposal to share
resources between agents, groups, companies, associations and individuals that have a physical space in
the neighbourhoods of Bilbao la Vieja, San Francisco and Zabala.
Similarly, Bilbao Berrikuntza Faktoria19 is a pioneering project for learning, innovation and
entrepreneurship. It brings together university students (those who are studying the Degree of
Entrepreneurial Leadership and Innovation at the University of Mondragon) and a community of people
who drive innovative business initiatives (30 companies), generating the necessary conditions so that
learning, creativity and collaboration between them takes place in a "natural" way.
4.3. Stock of social capital in Spanish regions
The most empirical work measuring social capital has been implemented at the national level, and few
studies offer an analytical view at the regional level in Spain. Even though it was conducted almost two
decades ago, the analysis of Mota and Subirats (2000) remains to date the most comprehensive and
detailed study. These authors followed Putnam’s (1993) social capital investigation and applied its
methodological approach to the Spanish case, creating a social capital index based on three
measurements: level of citizen engagement, level of membership in associations oriented toward the
creation of public and private goods (per 10,000 inhabitants), and membership in twelve types of
associations that have more general social aims (see Appendix 2).
15 https://www.lehiberri.eus/es (last seen: 30/11/2017). 16 http://www.goierrivalley.com (last seen: 30/11/2017). 17 http://www.azarofundazioa.com/en (last seen: 30/11/2017). 18 http://wikitoki.org/en (last seen: 30/11/2017). 19 http://bbfaktoria.com/eu (last seen: 30/11/2017).

76 CHAPTER 4
The first measurement attempts to capture each region’s civic attitudes and behaviour by tapping its
citizens’ active participation in public affairs. As Putnam (1993) warns, a structure with high social capital
is characterised by the active participation of individuals in social and political affairs. In his opinion,
citizens are not necessarily altruistic; they also seek their own interest, but in a way they are open to the
interest of others, which should be revealed in the search for information about collective issues. In this
line, Mota and Subirats constructed an index of citizen engagement across regions using three indicators:
(i) the proportion of citizens with high interest in regional politics; (ii) the percentage of daily press readers
in each region, and (iii) the proportion of citizens informed about their regional government’s activities.
The high scorers on the index were the Basque Country, Navarra, La Rioja and Catalonia (ibid: 139).
Apart from the individual attitudes committed to public affairs, the associative life is a relevant indicator
of civic sociability. As Alexis de Tocqueville (1832, in Hooghe, 2008) said about the American society, the
core of the civic commitment lies in participation in voluntary associations through which individuals
develop the capacity for cooperation and a common responsibility in collective affairs. Similarly, Mota and
Subirats distinguish associations that produce public and private goods. The former can be enjoyed by any
individual in the community and generate a form of social capital stronger than the latter, which only
produce goods for those who participate in creating them. Similarly, while the associations that produce
private goods involve coordination, those that produce public goods involve cooperation, given the
context of strong incentives not to contribute to the production of a public good. The results display that
the Basque Country and Navarre are situated in the "collectivist" extreme containing the largest extension
of philanthropic and welfare associations, which appears to be correlated to the greater degree of interest
and information around public affairs referred above.
However, it should be noted that the value of civic engagement networks does not lie so much in the
number of associations as in the proportion of citizens involved in voluntary organisations. Thus, by taking
into account participation in twelve different types of associations, Mota and Subirats arrive at an
assessment of the density of associational life in each region. In general, the results of 1998 show that the
level of participation is very low in all the regions and in all type of associations, being the Basque Country,
La Rioja and Navarre the autonomous communities with the highest participation rates.
Using these three measurements, Mota and Subirats create a social capital index for Spain’s seventeen
autonomous communities (NUTS2). The findings identify eight regions with positive values in the index:
the Basque Country, Navarre, La Rioja, the Valencian Community, Madrid, Aragon, Balearic Islands and
Catalonia. It is remarkable that the Basque Country has by far the highest score and, additionally, is ranked
in the first position in all the measurements.
The BBVA Foundation and IVIE (Valencian Institute of Economic Research) have also made a great effort
to develop an index that estimates the volume of social capital among the OECD countries and especially
in Spain, where they disaggregate by autonomous communities and provinces (NUTS3). It is an index
based on a key principle: economic relations are an essential channel in the generation of social capital,
which is the result of a process of accumulation of costly investments that generate economic returns.
The most important differences between this approach and other indicators most commonly used in the
literature are twofold. First of all, there is a recognised role of economic relationships in the generation
of cooperation experiences. In various studies, social capital is regarded as a result of experiences of
cooperation in non‐economic spheres, such as the family, voluntary associations or citizens’ movements.
However, Pérez García et al. (2005) consider that the economic sphere is also a medium that can foster
the accumulation of social capital, particularly when individuals personally experience sustained
economic growth and can therefore benefit from the improvements this growth brings.

Social capital in the Basque Country 77
The second difference lies in the procedure used to measure the stock of social capital, which is similar to
that used by economists to estimate other types of capital. According to this approach, the value of assets
is based on the flow of expected future payments that possession of these assets will yield, once the
associated costs to obtain them have been deducted. Social capital is therefore evaluated in the same
way as any other type of economic activity: according to its expected future profitability. The proxies used
to represent the behaviour of investors in social capital are per capita income level and employment
probability (determinants of the probability of obtaining a certain level of income), inequality (relevant
for assessing the risk of non‐participation or social exclusion), educational level (for its influence on
reducing the cost of cooperating with other people) and access to credit (as a proxy for the probability of
being trustworthy).
In general, the analysis of this index (see Appendix 2) shows that until 2008, confidence in economic
relations as well as in politics and collective institutions stimulated a sustained growth in the volume of
social capital in Spain. However, since the Great Recession, there have been significant changes in many
of the index's variables (income stagnation, job loss, increasing inequality or greater difficulty in accessing
credit), returning to levels back at the beginning of the century. By territories, the northeast part of Spain
hosted most of the regions with high social capital in 2005 (see Figure 2) and, according to the newest
data from 2012, the Basque Country had the second highest score after Navarre. And among the three
Basque provinces, Alava and especially Gipuzkoa are doing better than Bizkaia, the biggest and most
populated territory in the region (Figure 3).
Figure 2: Social capital per capita in Spanish provinces (2005)
Source: Peiró and Tortosa (2012).
In sum, these two researches reflect the strong relative position of the Basque Country in comparison to
other Spanish regions, but they may have important shortcomings. First, the work of Mota and Subirats
is based on data compiled almost 20 years ago and should be updated to provide a more accurate

78 CHAPTER 4
perspective. And second, even though the economy affects confidence and therefore social capital, it
seems to me that method of BBVA Foundation and IVIE has a significant economic bias that over‐
conditions the sign and magnitude of the index. For this reason, a correct interpretation of the situation
in the Basque Country should incorporate other indicators of social and collective action that may provide
a more precise and detailed picture of the region.
Figure 3: Social capital volume index per capita (year 1983 = 100)
Source: Fernández de Guevara et al. (2015).
4.4. Stock of social capital in the Basque Country
Eustat, the Basque Statistics Institute, publishes regularly several studies that tackle the measurement of
social capital, directly or indirectly. Especially important is the Encuesta de Capital Social (Eustat, 2012a),
a survey that is performed every 5 years since 2007. Data commented here correspond to the second
sample elaborated in 2012 (from now on ECS‐12). A third survey has already been carried out in spring
2017, but findings will be published during the first semester of 2018 and even though I contacted Eustat
personally, I was not allowed to get the preliminary results.
4.4.1. Size and characteristics of social networks
As pointed out so far, the concept of social capital refers primarily to the participation of individuals in
networks of social relations. Having a minimum base of social network is a necessary (but not sufficient)
condition for the generation of social capital. In fact, as we will see later, the size of social networks is
associated with important dimensions of social capital.
On average, Basque citizens have 22.24 people (including the respondent) at the broad network,
constituted by family and friends with whom regular communication is maintained. The composition of
this group is the following: there are 11 relatives (1.9 sharing the household and 9 living somewhere else)
although the relationship is close only with 6.3 of them. The rest of the group is formed by friends (10.3),
where only 4.3 are considered “close”. It is also observed that people hardly keep mates who are or have
been neighbours (0.7 out of the 10.3) or co‐workers (0.8). School or university colleagues represent 1.6,
a bit more than the previous. In that line, respondents had not contacted their broad network (excepting
those who live with them) very frequently in the last month before the survey (4.27 in a 0‐10 scale) and
0,00
200,00
400,00
600,00
800,00
1000,00
1200,00
1400,00
1600,00
1800,00
1983 1985 1987 1989 1991 1993 1995 1997 1999 2001 2003 2005 2007 2009 2011
Alava
Gipuzkoa
Bizkaia
Basque Country
Spain

Social capital in the Basque Country 79
face‐to‐face relationships are far above relationships through the Internet and other virtual networks
(1.91), although this value increases among students (3.65).
The size of the networks appears to be clearly associated with other facets of social capital considered by
the survey. The larger the size, the greater the supply and reception of aid (in the closest network), access
to different types of aid, reciprocity and cooperation, trust, happiness, participation, etc. Therefore, the
size of the networks is really a "capital" that individuals possess and can activate for both their own profit
(help, happiness, personal independence) and for the benefit of the community (trust, participation).
Unfortunately, ECS is the only research of this type carried out so far in the Basque Country, and the lack
of a temporal perspective prevents us from considering social relations in diachronic terms. Other surveys
carried out by Eustat in different years, such as Life Conditions Survey (Encuesta de Condiciones de Vida,
ECV) may allow an indirect approach to some issues addressed by ECS‐12, providing a more longitudinal
insight into the evolution of family and social relationships in the Basque Country over 25 years (Table 9).
Table 9: Degree of relations with relatives, friends and neighbours (%) 1989‐2014
1989 1994 1999 2004 2009 2014
With the closest family 100 100 100 100 100 100
Intense 69,1 75,0 82,1 88,0 87,7 85,5
Frequent 19,9 18,5 12,6 6,3 6,2 7,8
Sporadic 6,6 3,8 1,9 1,1 1,7 1,7
None 4,4 2,6 3,4 4,7 4,4 5,0
With other relatives 100 100 100 100 100 100
Intense 14,6 17,3 21,8 26,6 28,4 27,3
Frequent 28,7 29,1 33,8 33,7 31,9 28,9
Sporadic 38,3 35,5 32,1 25,2 22,2 25,3
None 18,4 18,1 12,4 14,4 17,5 18,6
With friends 100 100 100 100 100 100
Intense 51,5 51,7 68,5 64,1 71,8 69,9
Frequent 26,8 25,3 21,0 18,9 15,7 14,4
Sporadic 10,5 12,0 7,1 6,7 4,1 6,5
None 11,2 11,0 3,4 10,3 8,4 9,1
With neighbours 100 100 100 100 100 100
Intense 80,8 84,9 85,7 85,0 79,7 75,5
Frequent 4,9 4,3 6,6 5,1 3,7 4,5
Sporadic 1,7 0,8 1,5 1,1 1,2 1,3
None 12,6 10,0 6,2 8,8 15,5 18,7
Source: Eustat, 2014.
As noted, the importance of family relationships in the Basque Country is high: 95% of the respondents
maintain some kind of contact with the closest family in 2014. Interaction with other relatives is also quite
significant and the percentage of families with deep relationships has increased almost 13 points in the
last 25 years. Even more changes have occurred in relationships with friends: intense relationships have
increased 18 points between 1989 and 2014. Finally, as far as relations with neighbours are concerned,
although there are not very substantial changes during the two decades studies by the ECV, it is
noteworthy that the percentage of families declaring no neighbourhood relationships has increased by
more than 12 points since 1999, after having experienced a strong decline in the 90s.
The homogeneity (or heterogeneity) of the network of friends has been also considered in the survey. For
the population as a whole, homogeneity takes an average value of 6.34, which means that almost two
thirds of people only have friends that are equal to them in terms of religious beliefs, nationality, social

80 CHAPTER 4
position or political trend. Pensioners (7.95), workers who carry out household tasks (7.79) and people
with primary or lower education (7.53) have the most homogenous networks, whereas residents born
abroad (4.5), managers and professionals (5.17) and university students (5.23) have mainly more
heterogeneous friends. Homogeneity is positively associated with dimensions such as reciprocity,
cooperation, social cohesion, trust in institutions, security or personal influence, and negatively with the
size of networks, aid in their different expressions (both borrowed and received and related to various
circumstances), general trust, personal independence, social and political participation, use of the
Internet and the feeling of happiness and health.
4.4.2. Trust and corruption
Trust is an essential element for the creation of social networks that generate social capital. Together,
both dimensions, social networks and trust would be considered by many authors as the two key
components of social capital (Nahapiet and Ghoshal, 1998; Putnam, 2000). From a political economy and
community development perspective, trust as a form of social capital is a key contributor to civil society,
a factor granting legitimacy to governments and political institutions, and an indicator of social cohesion
(Woolcock, 1998).
Measured broadly, the average score of trust expressed by Basque population is 5.64. This figure varies
depending on whether it is about institutions (4.46), professions (5.20), general population (5.83) or family
and friendship networks (7.07). Excepting the latter, the other values are around 5, which indicates that
people sometimes trust and other times do not. On average, especially low is trust in institutions, even
though it changes considerably, from a minimum of 2.63 points for political parties or 3.02 for the banks
up to 5.60 points for Ertzaintza (Basque police), 6.09 for charity organisations and 6.20 points for non‐
governmental organisations. Regarding the Public Administration, the greatest trust is for councils (5.14),
and later come the Basque Government (4.99), international institutions (4.75), European institutions
(4.07) and the Spanish Government (3.22).
Table 10: Trust in institutions
2007 2012 Variation
Political parties 3,11 2,63 ‐0,48
Banks 4,01 3,02 ‐0,99
Spanish Government 4,16 3,22 ‐0,94
Army 3,39 3,64 0,25
Catholic Church 4,19 3,91 ‐0,28
Trade unions 4,55 4,01 ‐0,54
European institutions 4,69 4,07 ‐0,62
National Police and Civil Guards 4,31 4,54 0,23
Courts 4,72 4,55 ‐0,17
International institutions 4,83 4,75 ‐0,08
Mass Media 4,75 4,98 0,23
Basque Government 5,42 4,99 ‐0,43
Council 5,07 5,14 0,07
Basque Police (Ertzaintza) 5,64 5,60 ‐0,04
Charity organisations like Cáritas 5,52 6,09 0,57
NGOs like Greenpeace, Médicos Sin Fronteras, etc. 6,10 6,20 0,10
TOTAL 4,65 4,46 ‐0,19
Source: Eustat, 2012a.

Social capital in the Basque Country 81
It is interesting to observe that the image of some institutions seems to have been harmed by the
economic crisis or corruption cases, partly loosing people's confidence. The overall variation (‐0.19) is
mainly the result of very important drops of trust in the banking sector (‐0.99 point), the Spanish
Government (‐0.94), European institutions (‐0.62), trade unions (‐0.54) and political parties (‐0.48).
Meanwhile, the advance of Caritas, with the highest score among charities, could also be the result of the
economic crisis, apparently for having dealt with it correctly and with a social orientation.
The influence of corruption is just the opposite of what it has been said about trust: it is negatively
associated with reciprocity, cooperation, trust in its different expressions, social cohesion, security,
happiness and personal influence and independence. By sociodemographic characteristics, the average
score for corruption is 6.3320 but people in lower social classes have a worse perception (6.70).
4.4.3. Aid, cooperation and reciprocity
From the perspective of social capital, an essential function of social networks is to serve as a resource for
obtaining help in different adverse circumstances. When asked about the possibility of having provided
or received aid in the six months prior to the survey, in general terms, the level of assisting others (3.32)
is bigger than receiving aid (1.96). Age is shown as the most discriminating variable in both aspects.
Students give and receive clearly more help (4.67 and 3.70) than people above 65 (1.93 and 1.26
respectively).
Specifically, ECS‐12 distinguishes three areas: economy (financial aid), health (help in case of illness) and
emotions (affective support). In 2012, the survey indicates that approximately 30% did not provide any
aid or contributed with one or two types of aid, while 10% furnished assistance for the three types
indicated above. On the other hand, 61% did not receive any, 22% received aid of one type, 11% of two
and a little less than 5% received all three types. Moreover, it is noticed that it is generally easier to request
and receive help in the event of a health problem (6.11) than in the case of needing emotional help (5.85)
or financial aid (4.99). As expected, people born abroad have lower access to aid indicators in all cases, as
well as persons over 65, widowed, separated and divorced persons, those who live alone and residents
who have a lower level of education.
Figure 4: Received aid by provided aid (2012)
Source: Eustat, 2012a.
20 0 means there is no corruption and 10 means that corruption is generalised.
0,00%
10,00%
20,00%
30,00%
40,00%
50,00%
60,00%
70,00%
80,00%
None 1 type 2 types 3 types
Received aid
Provided aid
None
1 type
2 types
3 types

82 CHAPTER 4
In terms of reciprocity, it reaches an average value of 6.12. As Figure 4 displays, there is only a moderate
correlation between giving and receiving help, because people perceive that they receive less help than
what they give others. Anyway, it is very clear that if you do not help, it is very probable that you will not
be repaid; likewise, the more you assist others, the more likely it is that you will receive help.
In general, the Basque population has a rather cooperative vision of the society, with a mean that reaches
6.76 points. This viewpoint is somewhat lower among younger people (with a mean of 6.37 among those
aged 15‐34) but increases to 7.26 among those aged 65 or over.
4.4.4. Social and political participation and associationism
Basque people are relatively interested in socio‐political issues (5.45 on average) and moderately
informed about public affairs (5.30 points), despite the abundance of sources of information of different
territorial scope (7.15) and the large use of the media (6.69). More precisely, people stay up‐to‐date on
issues that are close to them, preferably from their neighbourhood, municipality or autonomous
community (more than a third consider their level of information high), while they acknowledge to be less
informed about Spain (just 25% declare to have a high level of information) and, above all, in Europe (little
more than 15% have a lot of information).
This explicit expression of interest about regional and national topics may explain the high electoral
participation, with an average value of 7.19, which would assume that they voted in 3 of the last 4
elections prior to the study. However, beyond this regular electoral participation, the reality is that the
feeling of personal influence is low (4.08) and people do not generally believe that their vote or
participation plays a key role to make decisions. Maybe that is the reason why the contribution of the
majority is reduced to the “traditional” custom of voting from time to time, because, otherwise, the social
and political participation of the Basque population is very low (1.22 points on average). For instance, less
than 25% participated in strikes and demonstrations in the previous year, and only 20% collaborated in
campaigns to collect signatures.
In this line, another point that draws attention is the almost null voluntary participation in associations
(0.39). This rating is improved when other less active forms of participation (such as financial contributions
or a simple membership) are considered. This way, sport associations exceed 15% and charities approach
10% of the population, while trade unions, cultural groups and development aid associations recruit
around 7%. Anyway, these participation rates are very poor and it arises one of the most discussed issues
among social capital analysts: is this weak social participation a sign of weakening of social capital in the
Basque Country? We can not dwell on this important question since we do not have a time series that
allows a diachronic analysis, but the Time Budget Survey (Encuesta de Presupuestos del Tiempo)
elaborated by Eustat points in that way. Indeed, in the last twenty years the average time spent by the
Basque population on “social life” has decreased in 26 minutes, from 1 hour and 10 minutes in 1993 to 44
minutes in 2013 (Table 11). Time invested in visiting acquaintances, going out and chatting has slumped
severely, as well as civic and religious participation.
Table 11: Average social time 1993‐2013 (hours, minutes)
1993 1998 2003 2008 2013
Physiological needs 11:25 11:34 11:50 11:41 11:56
Work and training 3:09 3:21 3:23 3:23 2:48
Domestic work 2:40 2:25 2:23 2:24 2:24
Home Care 0:19 0:20 0:21 0:28 0:29

Social capital in the Basque Country 83
Social life 1:10 1:03 0:58 0:38 0:44
Active leisure and sports 1:10 1:12 1:17 1:21 1:28
Passive leisure 3:06 2:54 2:39 2:58 2:58
Journeys 0:58 1:10 1:08 1:06 1:13
TOTAL 23:57 23:59 23:59 23:59 24:00
Source: Eustat, 2013.
Besides, the proportion of the population who perform these activities has also diminished; in 2013, only
42.6% of the people took time to drop by and talk with friends from Monday to Thursday, 46.7% on
Fridays, 56.8% on Saturdays and 60.3% on Sundays.
4.4.5. Well‐being
Social capital is said to be a major factor for the well‐being of the population (Putnam, 2000). In ECS‐12,
the average score for happiness and health is 7.16 points. Age and social class are the most relevant
sociodemographic variables to explain variations in happiness and health: as age increases, the perception
of happiness and health decreases. Additionally, people from high and medium‐high class feel happy and
healthy, while respondents in the low social class have a lower score (6.09). Therefore, it confirms what
many investigations state: money alone does not provide happiness, but economic well‐being is strongly
related to happiness, although, evidently, from a certain level of wealth this influence loses strength or
even disappears (Diaz et al., 2011).
Table 12: Happiness and health according to age and social class
Happiness and health Low Medium High Average (0‐10)
Age
15‐24 0.7% 24.5% 74.9% 7.62
25‐34 1.2% 26.6% 72.2% 7.43
35‐49 1.9% 29.3% 68.8% 7.34
50‐64 3.9% 33.9% 62.2% 7.08
Over 65 4.7% 47.8% 47.6% 6.63
Social class
High and medium‐high 0.3% 20.6% 79.2% 7.82
Medium 1.6% 29.2% 69.2% 7.33
Medium‐low 5.7% 49.2% 45.1% 6.55
Low 11.3% 56.2% 32.5% 6.09
Source: Eustat, 2012a.
Security, personal independence and social cohesion are other items highly associated to well‐being.
The sensation of security is very high, reaching 8.12 points on average. People aged 15‐24 (7.75) and 25‐
34 (7.82) are somewhat less secure, while highest values of security are among the retired (8.39). Personal
independence (to what extent people can make decisions over daily activities) is equally significant (7.75),
especially amid single households and entrepreneurs. Finally, social cohesion, combining proximity,
conflict and acceptance of differences, reaches 6.30 points. The lowest levels of social cohesion are found
among the youngest population (5.95). Further, particularly meaningful is the difference in the awareness
of social cohesion between those who have answered the survey in Basque language (6.68) or Spanish
(6.28).

84 CHAPTER 4
4.5. Social capital in Gipuzkoa
As stated before, there are still few attempts that dare to measure social capital in the Basque Country,
and even though it focuses just one territory, the project Gipuzkoa Sarean (2011, 2015) is worth to be
mentioned. Two years after its foundation, in 2011, a sharp analysis of social capital and values in
Gipuzkoa was published, assessing the recorded track and drawing strategic lines of action for the future.
Basically, the analysis is built on the model of Grootaert and Bastelaer (2001: 20) that stresses two angles
of social capital: the level of action (micro, meso, macro) and the forms of social capital (structural and
cognitive). The junction of these axes creates four quadrants: (i) institutions of the state, (ii) local
institutions, (iii) governance and (iv) trust and local norms. Drawn from that, the authors re‐design this
framework focusing on values that can be approached through some proxy indicators. Hence, the vertical
axis comprises macro (competitiveness, democracy, social cohesion) and micro (well‐being, happiness)
values, whereas the horizontal axis involves objective and subjective relationships that correspond to the
structural and cognitive dimensions, respectively (see Figure 5):
Figure 5: Model of social capital based on values
Source: Grootaert and Bastelaer, 2001.
Local governance is studied in two parts: institutional governance (the network between public and
private institutions) and social governance (citizen participation in institutions and organisations). The
results of this research carried out in Gipuzkoa suggest that there is weak institutional governance.
Citizens and institutional leaders themselves perceive an absence of values associated with dialogue and
tolerance, in particular, attributed to political leaders. The results also highlight a low connectivity level
of the territorial organisations involved in the innovation system, especially between universities and
public administration, universities and companies, companies and social organisations (such as trade
unions) or between different levels of the public administration. However, if institutional governance is
weak, so it is social governance, too. In fact, data show that the participation of the population in social
and political activities is extremely low (only 0.3% of the population has a high social and political
participation). This condition is perhaps more critical in the case of young respondents expressing a very
MACRO
COGNITIVE STRUCTURAL
MICRO

Social capital in the Basque Country 85
low interest in social and political problems, which is consistent with their low participation in voluntary
activities. Some people blame the lack of spaces of participation, but people over 50 declare a very high
prevalence of individualistic values, maybe because they have known other times when cooperation was
much more deeply rooted in the Basque society.
Social networks form the second quadrant of the conceptual model. The analysis of the data obtained by
the investigators suggests that homogeneous bonds predominate in Gipuzkoa. People are more
interested in bonding networks and issues associated with hedonism, and simultaneously, they are losing
the concern for community life. This can be seen, for example, in the high attention paid by young people
to family and friends and the little interest shown about social and political issues (their neighbourhood,
city or the world). Interviews with leaders from the socio‐cultural, business and research spheres
corroborate a high ethnocentrism and a growing social confinement in close relations as a consequence
of an individualistic culture.
Social trust takes the third quadrant explored in the model. Secondary sources referring to social capital
in Gipuzkoa suggest a high specific trust and relatively lower general trust. In a society where close
networks predominate, it is reasonable to rely on family and friends rather than abstract groups. Equally,
as long as the level of social and political participation of the population is very poor, general trust will
also be low. Accordingly, participation is seen as an opportunity to develop key values of social capital
such as tolerance, dialogue and cooperation. And, as several interviewed actors state, the strength of the
cooperative culture in Gipuzkoa can play an important role to encounter different people and promote
interaction with strangers.
Institutional trust is the fourth and last quadrant of the value‐based social capital model. Survey and
interview data show a clear scenario of distrust in political parties and in public institutions such as the
Provincial Councils and municipalities, although the latters generate greater confidence than the previous.
In general, people miss values such as honesty and closeness to citizens. Particularly, young people have
a critical view of politicians (as individuals who defend their own interests rather than those of the
community), which clearly contrasts with the opinion of politicians who assure that they are concerned
about the collective interest and, apparently, it is the media that do not differentiate those who work
fairly from those who do not. The perception about companies, universities and civil organisations is
better. They are seen as efficient and effective, but little committed to the interests of citizens.
4.6. Social capital in a formation centre: IMH
After having described social capital at the national, regional and provincial level, in this section I aim to
show a particular case of a formation centre. Obviously, it is not representative of the reality in all
educational centres and their related companies, but may serve to give a glance to complement previous
information and see if it is in line with broader data. Furthermore, this case analysis will be useful to
contrast whether schooling is really a source of social capital or not, and additionally, if it has some
economical effects.
The selected centre, IMH (Machine Tool Institute), is located in Elgoibar (Gipuzkoa) and provides
specialised training and innovation services for the advanced manufacturing sector. It was inaugurated in
1991 to upgrade the profile of undergraduates working at local companies in the Deba Valley. Since then,
the IMH trains over 2000 students annually in a wide range of programmes which are adjusted to the
needs of the manufacturing sector for highly qualified staff. For example, they implement the dual

86 CHAPTER 4
engineering grades together with the University of the Basque Country, and offer an integrated
programme of occasional training courses.
The opinion of former students was compiled between 2 May and 25 June 2014. They were contacted by
e‐mail and were asked to answer a survey online. Altogether, 147 persons started the questionary but
some of them did not answer all the questions. To tell the truth, the sample is not very large but IMH only
had the e‐mails of few students (belonging to the most recent schoolyears) and, additionally, some e‐mail
addresses were not active any more, so it resulted a handicap for data collection.
The answers provided (see Appendix 6) reveal that IMH, as an educational centre, had a positive effect to
seek work. Respondents are not so contundent when asked if the contacts gained there played a role
when getting a job: 48.12% say that they were irrelevant, but 47.37% state that they were useful,
especially its staff and the representatives of the intership company. Once employed, the economic
usefulness of contacts seems to reduce: they may lead to new employment opportunities (18.46%) or
internal promotion (9.23%), but the majority think that it consists in only being friends. More than 82% of
the former students get still in contact with schoolmates, the majority with a reduced number of
colleagues (less than 10). They normally contact personally face to face (61.68%), virtually (47.66%) or by
phone (42.99%), once a month (32.71%) or once per quarter (22.43%), and these interactions are quite
trustworthy: as an average, the degree of trust with these contacts is scored 6.81% in a 0‐10 range.
As for the companies where they work, respondents believe that, in general, they are open to collaborate
as they consider that networking is quite important (43%) or very important (24%). They have agreements
with a wide range of actors: other companies, universities, public agencies, technology centres, etc. Only
10% say that their firm collaborates with a cluster association.
4.7. Understanding the paradox
There is an extended idea that the Basque Country is a community oriented society, well organised and
with good social capital ratios. In general, available data at the national level confirm that the Basque
Country scores very high in associationism and civic engagement, and economic proxies also emphasise
an accumulation of social capital that may lead to greater cooperation experiences. Nevertheless, if we
zoom to the regional scale, this perception clashes with another reality (see Figure 6). On average, Basque
people do not trust very much in institutions, and even though they seem to be interested in socio‐political
issues and vote regularly, they rarely participate in associations and perceive that their vote is not very
influential. The cooperative spirit is still in the DNA of the people, but in practice there is a low awareness
of reciprocity (Basques assist seldom and are corresponded even less frequently) and a remarkable
homogeneity of the personal networks. In general, respondents rather rely on bonding relationships and
feel happy, safe and independent in a reduced network where virtual relations count for little. Moreover,
apparently, this trend has been strengthened in the last 5 years.
First of all, I acknowledge that, when I contrast studies at the national and regional scale, I am comparing
two different sets of data with different units of observation, levels of analysis, time periods and,
primarily, items that are measured in varying ways. Nonetheless, I still believe that both pictures should
not differ that much and this situation requires a deeper analysis and a more precise interpretation. How
can we understand this paradox?

Social capital in the Basque Country 87
Figure 6: Main social capital indicators (0‐10)
Source: self‐elaboration, based on ECS‐12.
In relative terms, social capital in the Basque Country is high with regard to other regions in Spain, but the
viewpoint changes if compared with some European countries. Unfortunately there is no publication
concerning social capital that contrasts directly Basque figures with EU‐28 averages, but some studies
point that the Basque Country may be well below the mean in some relevant indicators. The most precise
analysis of social capital at the EU level so far was conducted by the European Commission in 2004 (and
published in 2005), where Spain stands out for its low associational activity and political disaffection. A
more recent study performed by Eurostat in 2015 about social participation (see Appendix 5 and Figure
7) shows that Spain is doing well in getting together with bonding ties and online communication, but is
clearly below the EU‐28 average in formal and informal participation. Therefore, the Basque Country may
be the rat’s head but the lion’s tail, or to put it another way, a relative good position in Spanish studies
should not guide to overestimate the real stock of social capital.
Yet, the particularly low participation of Basque citizens in voluntary associations needs a further
explanation and the role of public institutions may give us a clue to understand what is going on. In this
line, Herreros (2004: 101) stresses that the state is crucial in the generation and perpetuation of the
virtuous circle of social capital generation. In his view, governments have a number of tools at their
disposal to nurture the emergence of social trust as by‐product of people’s participation in associational
life. Moreover, he states that differences in social capital are historically rooted in civic attitude as well as
in political and institutional traditions. In this sense, Montero and Torcal (1990) observed a decrease in
political participation and a growing perception of mistrust as a consequence of authoritarian politics
practiced by Franco under four decades of dictatorship. After his death in 1975, Spain faced extraordinary
political changes during the process of democratic consolidation, and despite the observed improvement
of social capital since the transition to democracy, research on social capital in Spain demonstrates a
scarce development of social capital as compared to other European countries. In fact, the above
mentioned authors reveal moderate supportive attitudes towards democratic principles, together with
0,00
1,00
2,00
3,00
4,00
5,00
6,00
7,00
8,00
Trust in institutions
Interest in socio‐politicalissues
Social and politicalparticipation
Personal influence
Cooperation
Received aid
Provided aid
Homogeneity of friends'network
Personal relationships inthe broad network
Happiness and health
Personal independence
Use of Internet and virtualnetworks
2007 2012
88 CHAPTER 4
low levels of social trust and limited political participation. And on top of that, there are more and more
evidences demonstrating that individualism gains terrain to communitarianism, auzolan or community
work is very sporadic and participation in social movements tends today to be less intense and more
occasional.
Currently, Basque institutions are perceived with skepticism. Surveys place political parties among the
least valued institutions and citizens systematically fail almost all their political leaders21. This democratic
disaffection is a two‐sided coin. On the one hand, political parties exhibit, in general terms, a strong
resistance in relation to citizen participation due to the bidimensional space of political competition in the
Basque Country: apart from the single left‐right dimension, the existence of the nationalist cleavage
acquires much larger dimension in the region as a result of the bitter confrontation between Basque
nationalists and non‐Basque nationalists, and between moderate Basque nationalists and radical Basque
nationalists (Kriesi et al., 2007). The alignment of some citizen associations with interests of specific
parties nurtures the fear that citizen participation can be instrumentalised against the power. In other
words, politicians are afraid that participation can be used by certain socio‐political sectors to undermine
government action and discredit its leaders. This scenario of confrontation tinges with distrust any
initiative that goes beyond the usual management of municipal affairs.
On the other hand, citizens also have motives for distrust. Citizenship, both individual and organised,
requires participation, but not any participation. As a result of negative previous experiences, many of the
associations and groups most interested in deepening democracy through participatory processes
maintain a notable distrust in institutional policy. Frequently, they do not believe that local institutions
really want to assume the commitments that derive from citizen participation; they interpret the
implementation of mechanisms or experiences of participation as a public marketing operation without
an explicit scope and, sometimes, as a means to deactivate or neutralise the ongoing social mobilisation
(Ajangiz, 2007).
Consequently, it is necessary to recover the civic virtues of the past, and to do so, both parts ought to
contribute. Citizens must be concerned by public affairs and show a clearer social commitment with the
society, considering their own interests but also the community’s. Although not all forms of participation
necessarily contribute positively to the production of capital from a civic perspective (Posner and Boix,
2000) various comparative studies conclude that at the individual level, participation in some type of
volunteering associations is a consistent predictor of generalised trust (Paxton, 2007). This, in turn, should
improve the quality of democracy, the transparency of politicians, the effectiveness of institutions and,
ultimately, their capacity to be trusted.
Besides, institutions should allow a shared management between different public and private actors:
more subsidiary, complementary, cooperative than holistic or governing. In this line, Lowndes et al. (2006)
point that institutions should follow the CLEAR tool, assuming that public policies are more effective
when: a) citizens CAN do, that is, have the necessary skills and abilities to participate; b) citizens LIKE to
participate, feel involved, motivated, concerned by the common interest of the community or place; c)
citizens are ENABLED to participate and have means and spaces for that; d) citizens are ASKED to
participate, individually or collectively, in those spaces; and e) citizens are RESPONDED, that means, they
verify that their participation has been taken into account and has served to change or improve things.
21 According to a recent survey, the president of the Basque Government Iñigo Urkullu (PNV) is the only head politician that passes, with a score of 5,5 out of 10 (Gobierno Vasco, 2017).

Social capital in the Basque Country 89
Figure 7: Participation in voluntary activities (formal and informal) in EU‐28 countries (%)
Source: Eurostat, 2015.

90 CHAPTER 4
4.8. Conclusion
Knowing the stock of social capital is an operation of enormous interest, both methodologically and
substantially. It is fundamental to design a tool that comprises quantitative and qualitative indicators that
best fit the territory to be analysed and will give an accurate photography of the past and present
networking patterns. In addition, it is key for policy making to be able to measure the dynamics of
interaction and the shared resources.
Traditionally, institutions counted for little in innovation, but there is a growing consensus that socio‐
institutional factors act as key determinant of cooperation dynamics at different levels that may lead to
relevant learning processes (Aranguren and Larrea, 2015). In increasingly decentralised systems, regional
governments provide incentives and platforms for the formation of linkages between businesses,
universities and other social players, where the degree of social trust determines the density of
interactions, the costs of transaction, and the capacity to absorb external knowledge. (Westlund and
Nilsson, 2005). These, in turn, result in faster innovation processes, a higher quality of innovations and
increased innovation potential (Koka and Prescott, 2002). In addition to the mainline institutions, we
should not forget the wide array of intermediate institutions (like cluster associations), which can function
as learning laboratories for their respective firms and industries. A good stock of social capital could, if
well‐developed, facilitate collaboration between firms and the science base or between industry and
finance, for instance (Morgan, 1997).
The Basque Country has a long history of successful autonomous STI policy making that has been a model
for many OECD regions. This is due in part to the significant level of resources at regional level (relative to
other regions in Spain or many in the OECD) as well as strategic choices to fill needed gaps in policies from
higher levels of government adapted to the region‘s industrial structure and innovation system actors.
The political administration presents an important degree of self‐government distributed in three main
levels. This system of multiple layers of governance has the benefit of experimentation with adaption to
local needs as well as the detection of failings at Basque Country level that provinces and localities may
address. Beyond the Basque STI Council, different forums for practitioners (Innobasque and other actors)
provide these regular opportunities for discussion and common action to promote greater
complementarity or alignment in programmes at different levels within the region. At the provincial level,
some initiatives have flourished recently to boost participation and cooperation (especially in Gipuzkoa)
and they really have been cornerstones to promote new scenarios for governance. And locally, a great
number of experiences have been operationalised in the last decade and the traditional model of
administration begins to be reversed. Local Development Agencies and other bottom‐up processes
facilitate the involvement of varying agents and the creation of social capital.
Analysis of the data compiled indicates that, generally speaking, the stock of social capital in the Basque
Country is high, especially in comparison with other regions in Spain. However, this result must be
interpreted in the light of numerous studies that highlight the low stock of social capital in Spain as
compared to other European countries. In addition, if we mind the most recent data about social capital
in the Basque Country, the picture is not as attractive as previous comparative research among Spanish
regions may indicate. Several hypothesis are highlighted to explain this divergence, namely: (i) a more
pronounced public intervention since the Civil War; (ii) the nationalist cleavage that divides the political
arena in two; (iii) the prevalence of representative democracy over other forms of decision and public
management; and (iv) recent corruption scandals that have severely damaged the image of institutions.
Inevitably, the result is an undesirable scenario of tense relationships between citizenship and public
authorities. Participation is especially low, and so is general trust, notably institutional trust. A

Social capital in the Basque Country 91
deliberative‐consultative model of citizen participation dominates the political panorama and this is not
the most appropriate version to enhance social capital and really solve the political disaffection that
affects the Basque society. In this vein, bridging social capital urges to be promoted with the
establishment of plural and integrating participatory spaces which favour the community feeling and
discourage the sectorisation that characterises the current Basque society. Additionally, the intervention
of public institutions seems necessary, with a clear enabling function and adjusted to the still reasonably
good social capital of the country. The objective should be to strengthen the existing capital and lay the
foundations so that it can expand and reproduce itself.
The new context of governance can bring multiple added values to the efficiency and effectiveness of
public policies. The growing complexity of public affairs is best solved between all parts involved, (i)
improving the quality of information, (ii) the diagnostic capacity, (iii) the identification of alternatives, (iv)
methods and ways to put them into practice and, what is even more interesting, (v) the co‐responsibility
of citizens in the implementation of public policies and the sustainability of the Welfare State.
These suggestions are based on 2014 (or older) data and some of the gaps have already been approached
in the last years. The new edition of the Social Capital Survey 2017 (to be published during the first
semester of 2018) and other forthcoming information sources will provide new insights about the social
and economic context in the Basque Country, and especially, the degree of compliance of two challenges
identified by the European Commission: enhancing the effectiveness of the RIS and improving the
connectivity of the different actors within the innovation system (Magro, 2014).
4.9. My research proposal
Both in chapters 3 and 4, devoted to methodology and the state of the art respectively, I identify
numerous gaps and research possibilities that could enhance what has been investigated so far about
social capital. Nevertheless, a couple of PhD thesis would be necessary to consider all the formulated
suggestions and therefore, I have selected some priorities that have guided my papers.
The primary concern has been to cover the three levels of analysis at different geographical scales. Hence,
in the first empirical document, the companies belonging to the Basque Cluster Policy are the unit of
analysis (macro); the second study comprises the virtual community of firms afilliated in a cluster (meso)
and finally, in the last paper I investigate entrepreneurs and their associative life in a town (micro).
Similarly, the second objective has been to include all the dimensions of social capital. There is a strong
structuralist orientation in the literature, perhaps because it is the most precise and less abstract of the
dimensions, and that is why I have made a big effort to propose some relational and cognitive indicators.
And the third basic target has dealt with the implementation of analysis techniques. In section 3.1 I have
introduced the benefits of combining qualitative and quantitative methods and consecuently, I have tried
to integrate both approaches in all the studies.
Apart from this basis, my dissertation is built on other criteria that have modelled the output remarkably.
Foremost, the ambition of this thesis is to unveil new ways of measuring social capital rather than
improving other proxies that had been previously used. The new spaces for collaboration that have been
promoted recently in the Basque country and the new means of communication launched in the Internet
have been the staple of my inspiration. Thus, I dare to explore some virgin aspects that require an extra
cost for data collection and, moreover, might involve a higher risk in terms of research suitability, but in
return, it is my hope to introduce original evidencies that may contribute for a better understanding of
interaction patterns in the Basque Country.

92 CHAPTER 4
Another big motivation was to portray the supply side of social capital, unfortunally reduced to very
testimonial cases in the literature. In the Basque Country, alike, Eustat is lately doing a great job to depict
the perception of citizenships but there is still a huge gap in measuring and assessing the contribution of
those actors that supply goods and services. Accordingly, this thesis is mainly about entrepreneurs and
companies, and claims to underline the role of these agents as crucial stakeholders in networking and
knowledge sharing. The aim is twofold: on the one hand, I map the network of the main economic nodes
within the Cluster Policy but, on the other hand, I attempt to introduce the historical background of
entrepreneurship and firm creation at the micro level, disentangling a complex system of interaction and
highlighting the importance of certain norms and values to model a unique scenario in the Deba Valley.
In sum, being social capital a composite concept, I propose a multidimensional, multilevel and multiscalar
research that integrates quantitative and qualitative analysis techniques, both with a current and
longitudinal vision and centred in economic actors involved directly or indirectly in the Cluster Policy.
Table 13 summarises the main features of the three empirical studies presented in this dissertation.
Table 13: Summary of the empirical chapters
Chapter Scale Level Dimension Main data collection sources Analysis
5 Region Macro Structural Online survey, cluster data, research info
SNA
6 Cluster Meso Structural and relational
Virtual Social Network (Twitter), online survey GAIA
SNA, statistics
7 Town Micro/Meso Structural, relational and cognitive
Company Registry Office, Archival data, interviews
SNA, qualitative data, historical approach
The first paper is conceived at the macro level and aims to measure the structural social capital among
the participants of the cluster policy in the Basque Country. To do so, affiliation data was collected in the
principal clusters and an online survey was launched to get some more quantitative and qualitative
information. Afterwards, the most remarkable findings were outlined using SNA. The second article is a
case study focused on one of the Basque cluster associations that, according to former studies, outstood
by its high levels of social capital (Valdaliso et al., 2011 and 2012). I analyse how affiliated companies
interact with each other in Twitter at the structural and relational dimension of social capital, and I
conclude with some substantial remarks based on visual illustrations and statistic evidence. Finally, the
third manuscript is a longitudinal analysis of company networking in a town. Historical personal
relationships of investors have been brought to light via a large collection of information at the Company
Registry Office and archival data of several associations. Herewith, ownership‐based linkages, family ties
and other relationships have been elucidated and measured with SNA. Additionally, the cognitive
dimension of social capital has been assessed through a series of interviews with local authorities and
residents.


Measuring structural social capital
in a cluster policy network:
insights from the Basque Country
CHAPTER 5

96 CHAPTER 5
CHAPTER 5: MEASURING STRUCTURAL SOCIAL CAPITAL IN A CLUSTER POLICY NETWORK: INSIGHTS FROM THE BASQUE COUNTRY This chapter is based on a paper co‐authored with Jesús M. Valdaliso and published in European Planning
Studies. To cite this article:
Etxabe, I. and Valdaliso, J. M. (2016). Measuring structural social capital in a cluster policy network:
insights from the Basque Country. European Planning Studies 24(5), 884‐903.
Abstract:
Cluster Associations (CAs) seek to promote competitiveness through inter‐firm collaboration, and are
generally seen as drivers of social capital formation in the region. We map in this paper, by using Social
Network Analysis (SNA), the cluster policy network of the Basque Country in 2013, which may be
considered a proxy of the structural dimension of social capital in the region. Besides, we identify the
central agents of this network and attempt to explain the reasons for their centrality and the roles that
they play. We take the affiliation of an organisation to at least two CAs as a first indicator of the overall
pattern of connections within the cluster policy network. Later on, we filter it with data about the Boards
of Directors of CAs, and the Basque Contact Points created to concur with the Seventh Framework
Programme for Research launched by the European Commission during 2007‐2013. We contend that
those organisations that are present in these three networks form a “small world” that numerous studies
have shown to be favourable for creative output, where they might play a dual role of gatekeepers of
knowledge and innovation within and between clusters and drivers of bridging social capital formation in
the Basque Country.

Measuring structural social capital in a cluster policy network: insights from the Basque Country 97
5.1. Introduction
Social capital is generally seen as a key factor in regional prosperity due to its positive effects on
knowledge creation and diffusion within and between firms and organisations (Westlund, 2006; Malecki,
2012). In the context of clusters, social capital in the form of trust, collaboration and social‐civic exchange
is key to cluster development and firms within clusters benefit from many elements associated with social
capital: efficiency of action (Nahapiet and Ghoshal, 1998) and of information diffusion (Burt, 1992), lower
costs of monitoring processes and transactions, and better co‐ordination because of direct contacts and
often trust‐based relations among economic agents.
Social capital has three interrelated dimensions: structural, relational and cognitive (Nahapiet and
Ghoshal, 1998). Structural social capital refers to the overall pattern of connections that enable agents to
identify others, and constitutes a valuable source of knowledge creation and diffusion within and between
organisations. It is the dimension more amenable to quantification, something that, following other works
(Boschma and Ter Wal, 2007; Giuliani, 2007; Ter Wal and Boschma, 2009) we try to do through SNA.
Our study targets the Basque Country, an old industrial region that pioneered in Europe a cluster policy
in the early 1990s that has long been maintained until now (Ketels, 2004). One of its pillars was the
creation of several cluster associations (CAs, henceforth), institutions for collaboration aimed at
promoting competitiveness through cooperation among their affiliated members and key agents of the
industrial and innovation policies of the Basque government (Aranguren and Navarro, 2003; Aranguren
et al., 2010a). These CAs, together with the main agents of the Basque Network of Science and Technology
(government agencies and departments, technology centres, R&D units and universities), and other
private and public agents, form the core of what could be named the regional policy network, in which
the Basque government plays a leading role (Magro et al., 2014). Although the first attempts to evaluate
the impact of CA membership on the affiliated firms do not offer conclusive results (Aranguren et al.,
2014), there is a wide agreement about the beneficial aspects of these CAs on innovation, human capital
formation and internationalisation of their affiliates, and on soft outcomes such as the creation and
development of trust and social capital conducive to competitiveness and economic growth (Valdaliso et
al., 2011; Aranguren et al., 2014).
Our aim is twofold: first to map the relationships between all associates (almost 1,200) that belong to the
12 CAs regarded as strategic by the Basque government; and second, to offer through this mapping
exercise a proxy to the structural dimension of social capital. We assume that the most networked
organisations not only will exhibit a higher propensity to collaborate but will be better positioned within
the overall policy network (Giuliani and Pietrobelli, 2011).
More particularly, this paper focuses on two research questions. (i) Who are the most networked
organisations within the overall population of Basque CAs’ affiliates? (ii) And what are the reasons that
account for their centrality in the cluster policy network? From the total population of organisations
affiliated to the main 12 CAs, we have selected those affiliated to more than one CA and we have traced
the map of linkages by using SNA. Afterwards, we have completed the SNA analysis with information
about the Board of Directors (BoDs) of the aforementioned CAs and the Basque Contact Points (BCPs)
built as a result of the FP7 of the European Commission. Furthermore, we have complemented the
analysis with qualitative information taken from a survey sent to CAs’ affiliates, a few semi‐structured
interviews with some of the most networked actors and other sources.
The paper is structured as follows. The second section provides the theoretical background on social
capital and introduces our research questions. The third section then outlines the basis of science,

98 CHAPTER 5
technology and innovation (STI) policies and the particular performance of the Basque Country. Sections
four and five deal with the methodology and data analysis, respectively. The sixth section is dedicated to
a contextual discussion where the most meaningful results of the analysis are presented. Finally, we offer
the main conclusions of our analysis and our research lines for the near future.
5.2. Theoretical discussion
Social capital is said to be a key factor in regional development (Malecki, 2012). It can be defined as a set
of networks and intangible factors (such as values, norms, attitudes or confidence), which are located
within a community that facilitate coordination and cooperation for mutual benefit (Putnam, 1993;
Westlund, 2006). As Malmberg and Maskell (2002) have indicated, social capital reduces transaction costs
and opportunism in social and market relations and may foster entrepreneurship, inter‐firm cooperation
in R&D activities, human capital formation and internationalisation. However, it may also be a source of
regional path dependence and even lock‐in. Too close networks may make actors extremely dependent
on each other and isolated from foreign sources of knowledge, inhibiting innovation and
entrepreneurship (Martin and Sunley, 2006; Westlund, 2006). Hence, social capital is a self‐reinforcing
process and must be constantly renewed with new actors and knowledge from outside (Anderson and
Jack, 2002; Westlund, 2006; Staber, 2007; Valdaliso et al., 2011).
The most comprehensive definitions of social capital are multidimensional (Putnam, 1995; Nahapiet and
Ghoshal, 1998; Anderson and Jack, 2002), incorporating certain elements that have been given different
emphasis depending on the perspective of each author (Adler and Kwon, 2002; Lorenzen, 2007). Thereby,
social capital is not a single subject but a variety of different issues with two characteristics in common:
some aspects of social structure and the capacity to facilitate certain interactions of agents within that
structure (Nahapiet and Ghoshal, 1998: 244; Anderson and Jack, 2002: 193). Social capital is embedded
in a social context of relationships (e.g., networks) among individuals and organisations, being both a glue
and a lubricant (Anderson and Jack, 2002: 205), and it spreads over different levels of aggregation
(Westlund, 2006; Staber, 2007).
According to Nahapiet and Ghoshal (1998: 244), structural social capital refers to the overall pattern of
connections that enable agents to identify others, and constitutes a valuable source of knowledge
creation and diffusion within and between firms and organisations. Anderson and Jack (2002: 197) define
it as “the sum of relationships within a social structure”. Social capital is “generated within the interaction,
but as a by‐product of the association” (Anderson and Jack, 2002: 201). Therefore, the sheer presence of
networks (such as the one analysed here) is important to the creation and development of social capital
(the “glue” dimension), although once created they facilitate the interactions and flows (the “lubricant”
dimension) (Anderson and Jack, 2002: 205‐6).
Some authors have attempted to measure this pattern of connections between agents within a network
through SNA. They have found a small group of agents very well positioned that play a key role as
gatekeepers of knowledge and information (Giuliani and Bell, 2005; Boschma and Ter Wal, 2007; Giuliani,
2007; Ter Wal and Boschma, 2009). Gatekeepers provide each of the agents with a connectivity function
that enables them to avoid the cost of maintaining side‐by‐side relations (Rychen and Zimmermann,
2008). They have a strong absorptive capacity (Zahra and George, 2002) and a high level of relational
capital.
Anderson and Jack (2002: 207) describe the structural element of social capital as one of building up
bridges among the different actors of the network. Several authors point out the importance of bridging

Measuring structural social capital in a cluster policy network: insights from the Basque Country 99
social capital for companies to gain competitive advantages (Adler and Kwon, 2002; Capaldo, 2007),
especially when located in a cluster (Kallio et al., 2010). This bridging dimension is based on the
relationships that companies establish with agents outside the cluster, forming dispersed networks in
which new information is obtained through weak ties (Granovetter, 1973) and structural holes (Burt,
1992). Thus, agents better positioned in the network (e.g., most networked organisations in our study)
have an advantage to absorb and monitor non‐redundant knowledge and information (Burt, 2001) and
thanks to their position they act as bridge builders among the less connected nodes that may eventually
result in a higher level of social capital (Anderson and Jack, 2002: 205‐6).
There is a broad agreement in cluster literature on the importance of social capital in knowledge creation
and diffusion within and across clusters (Malmberg and Maskell, 2002; Capello and Faggian, 2005; Staber,
2007; Valdaliso et al., 2011). “Soft” attributes such as the atmosphere of the cluster or the level of social
capital are important intangible assets that facilitate collaboration and trust among cluster members,
promoting joint activities (Fromhold‐Eisebith and Eisebith, 2008). In this sense, cluster policies attempt
to set a social infrastructure with a high presence or creation of social capital, to promote a general
atmosphere conducive to cooperative relationships between agents (Uyarra and Ramlogan, 2012;
Aranguren et al., 2014). The majority of cluster policies provide financial, infrastructural and/or technical
support for the formalisation of cooperative relationships in some form of association or network. Indeed,
many clusters are built around institutions whose main objective is to improve each cluster’s
competitiveness by facilitating and fostering cooperation among their members. Such institutions are, of
course, not only associated with cluster policies; some have long been present in the form of trade
associations, entrepreneurial networks, industry associations, etc. (Aranguren et al., 2014). Different
empirical studies have pointed to these institutions for collaboration as drivers and enablers of social
capital formation in their respective regions (Carbonara, 2002; Giuliani and Bell, 2005; Aranguren et al.,
2010a; Valdaliso et al., 2011; Aragón et al., 2014; Aranguren et al., 2014). However, regardless who is
behind every cluster initiative, their success depends on the active role of all agents in collaborating and
searching common objectives (Sölvell et al., 2003; Ahedo, 2004; Fromhold‐Eisebith and Eisebith, 2005,
2008; Aranguren et al., 2010a).
Building on the aforementioned literature on social capital, we take the overall pattern of connections
between organisations that belong to the (cluster) policy network of the Basque Country as a first
indicator of structural social capital. Structural because we map a network of affiliated organisations to
the CAs supported by the regional government, assuming that (voluntary) affiliation indicates, first, a
common interest to be in and, secondly, that clustered organisations will show a higher probability to
contact each other. At this stage, we do not have any other information about the kind of relations
between them. However, affiliation to this policy network indicates, on the one hand, a higher level of
“associability”, an additional characteristic of social capital that shows elements of trust, ability to act
socially with others and a certain willingness to subordinate individual desires to group objectives
(Anderson and Jack, 2002: 198); and, on the other, a willingness to explore affinities and identify
communality, initial steps in the process of social capital formation (Anderson and Jack, 2002: 206).
Then, and following previous works, we focus on the most networked organisations and put forward the
first research question as follows:
RQ#1: Who are the most networked organisations within the overall population of affiliates to Basque
CAs?
We assume, according to previous works on entrepreneurial networks (Giuliani and Bell, 2005; Giuliani,
2005 and 2007), that some organisations show a higher propensity of engaging in interactions within and

100 CHAPTER 5
across clusters, and that appears to be a positive correlation between the strength of a firm’s knowledge
base and their interactions. This multi‐affiliation can indicate a higher degree of associability too. Thereby,
we wonder what factors may explain the fact that some organisations (and not others) take central
positions in the network. Thus, our second research question is:
RQ#2: What are the reasons that lie behind the centrality of leading actors in the cluster policy network?
Taking for granted that multi‐affiliation may indicate a higher degree of associability and a stronger
commitment to the common objectives of this policy network, but also considering that it may be the
result of larger size of the organisation’s knowledge base, we believe that there are strong reasons to
suggest that these central agents in the cluster policy network may play a dual role of, on the one hand,
gatekeepers of knowledge and information and, on the other, drivers of bridging social capital. However,
this hypothesis should have to be tested in future works with more qualitative information than that we
offer here.
5.3. The Basque Country: a complex RIS
The Basque Country is an old industrial region located in the North coast of Spain that successfully
managed to escape from a severe industrial crisis in the 1970s and 1980s and to transform its economy,
achieving in the 2000s per capita income and productivity levels much higher than those of Spain and
above the EU average (OECD, 2011). Since the 1980s, its regional government enjoys important policy
competences and the highest degree of financial autonomy in the EU (Aranguren et al., 2012; Morgan,
2013; Magro, 2014). It is also one of the few European regions that can be considered a truly RIS (Cooke
et al., 2000).
The STI policy applied in the region over the last 30 years may be depicted as a combination of continuity
and small and incremental changes. In the 1980s it focused on the technological upgrading of the existing
industries, creating a dense network of technology centres and technology parks and giving a strong public
support to business‐led R&D and innovation activities. In the 1990s, although still heavily focused on
applied R&D and with the technology centres as its main agents, it attempted to promote industrial
diversification into new high tech sectors, such as aeronautics and telecommunications. From 2001
onwards, the STI policy tried to strengthen the scientific base of the country and to promote basic research
and a new industrial diversification into science and knowledge‐based sectors. The Basque government
introduced new agents in the RIS, such as the universities, new research centres (CICs and BERCs) and
new organisations such as Ikerbasque or Innobasque (Navarro, 2010; OECD, 2011; Morgan, 2013).
Currently, regional government efforts are focused on improving the connectivity of the different actors
within this RIS (Magro, 2014).
The region also pioneered in Europe in the early 1990s a cluster policy that has long been maintained until
today. One of its pillars was the creation and support of CAs, institutions for collaboration whose main
objective was to improve each cluster’s competitiveness by facilitating cooperation among their members
including firms, technology centres and universities, government agencies and other organisations. The
CAs formed as a result were based both on traditional sectors of the Basque industry (e.g. machine tools,
appliances, port of Bilbao, energy, automotive, maritime industries, papermaking) and emerging sectors
that boosted recently (e.g., aeronautics, telecommunications, environment, audiovisual). Most CAs had
small staffs of 5 employees or less, with half of their budget financed by the Basque Government, and the
other by the fees of their affiliates and by other sources of income (Aranguren and Navarro, 2003; Ahedo,
2004; Aranguren et al., 2010a).

Measuring structural social capital in a cluster policy network: insights from the Basque Country 101
From 2005 on, CAs started to focus their efforts on consolidating their structure, promoting firm
cooperation (particularly in R&D activities), improving the cluster business environment and
strengthening the innovative capacity of member firms. They assisted the internationalisation process
through presence at international fairs, joint commercial missions to emerging markets, and creation of
export consortia. In 2006, the firms formally affiliated with CAs accounted for 28% of Basque employment
and 32% of the gross value added of industry (Orkestra, 2009). Today, there are twelve strategic CAs
supported by the Basque Government (Appendix 7). They form the core of the cluster policy network of
the region.
5.4. Methodology and data collection
Networks have received a growing attention in regional economics and economic geography since the
1990s (Grabher, 2006) and they are an appropriate conceptualisation of inter‐organisational interaction
and knowledge flows within and across clusters and regions (Borgatti et al., 2009; Ter Wal and Boschma,
2009). SNA techniques have been recently used in order to examine the structure of interaction in regions
and geographical clusters. SNA has the potential to help in understanding micro‐macro linkages in
organisations and simultaneously takes into account relational structures and attributes of individual
actors (Kilduff and Tsai, 2003).
SNA is not only a simple methodological approach, but a different way of envisaging the society and the
economy, and it is based on the assumption that relationships among interacting actors are important to
explain their nature, behaviour and outputs (Wasserman and Faust, 1994; Giuliani and Pietrobelli, 2011).
Apart from being a descriptive tool, rich in qualitative details, SNA has also a very important role to play
in impact assessment analysis as it generates highly valuable quantitative network indicators both at the
level of the firm (or other relevant unit of analysis) as well as at the cluster level, which can be used in
econometric estimations (Giuliani and Pietrobelli, 2011).
In this paper we make a map of relations within a significant part of the Basque RIS, the overall population
of organisations affiliated to CAs. In each case, the charts shown are based on three types of data and
information: (i) the nodes that represent the organisations being studied; (ii) the ties that represent the
different relationships among the nodes; and (iii) the attributes that make up the different characteristics
of the actors (Serrat, 2010). Once the illustrations are made, key measurements are applied for the
interpretations: the nature of ties (density, distance...); the make‐up of its various subgroups (which can
develop their own subcultures and negative attitudes toward other groups); and the centrality of the
social network analysed, among others. With this rigorous quantitative analysis, we intend to neutralise
the subjective bias when interpreting graphs, which is said to be one of the potential weaknesses of SNA.
We adopt a static perspective, depicting the network at a certain point in time. Data collection was made
in March 2013, using the information acquired from the websites of the 12 CAs regarded as strategic by
the Basque government (ACEDE, ACICAE, ACLIMA, AFM, ENERGY CLUSTER, BASQUE PAPER CLUSTER, FMV,
GAIA, HEGAN, UNIPORT, EIKEN and MLC ITS). The links for the above mentioned websites are provided in
Appendix 7.
As clearly stated so far, we consider the affiliation of an organisation (e.g., firms, technology centres,
universities, government agencies…) as a first indicator of the pattern of connections within the cluster
policy network. Since the objective of our first research question is to map the most connected agents,
from the total population of more than 1,100 organisations, we selected those affiliated to more than one
CA and then we traced the map of linkages by using SNA. In this streamlining step, we assume a partial

102 CHAPTER 5
loss of information and resources in the simplified network, due to the fact that less connected agents are
not taken into account in this paper any more.
In a second stage, we split this network in two (one for organisations and other for the CAs) and hereafter
the analysis was concentrated on organisations, which were filtered further with data about BoDs of the
CAs, obtained directly from them per e‐mail. Again, we abandon the study of CA‐CA relationships at this
point because it is not in the scope of this article.
Finally, the resulting network was criss‐crossed with information about Basque Contact Points (BCPs),
available at the website of the Basque Government (Eurobulegoa, 2006). BCPs are collaborative working
groups that aim to foster the presence of Basque companies in the European R+D+I system. The primary
function of the BCPs is to work on opportunities offered by each European call (especially ERANET projects
and Joint Technology Initiatives), so that all members of the BCP know the possibilities to participate in
incubation of project ideas or establishment of consortia, for instance.
This statistical analysis was complemented with qualitative information taken from three sources: a
survey sent by email to all CAs’ affiliates22; in depth semi‐structured interviews conducted in 2013 and
2014 with five of the most networked firms in our sample, the manager of one CA and one executive post
of the regional government agency (SPRI); and other studies and previous literature on this issue.23 This
qualitative information has helped us understand the reasons that lie behind the affiliation and multi‐
affiliation of firms and other organisations to the CAs (Anderson and Jack, 2002; Valdaliso et al., 2011).
5.5. Empirical evidence and data analysis
There are 1,186 Basque firms and organisations associated to at least one of the 12 CAs considered for
this study. Since we are interested in analysing not only intra but also inter cluster interactions, in Figure
8 we show directly the list of firms that belong to more than one CA and have been taken into account in
this paper (firms and other organisations displayed in red, CAs in dark blue).
The network is reduced to 106 agents: 94 organisations (78 firms, 7 governmental institutions, 5
technology centres and universities, and 4 more that we classify in others) and 12 CAs. Like it is highlighted
in Table 14, the interpretation of both type of nodes is quite different; while the degree centrality of
organisations is quite homogeneous, there are far different realities among CAs, with ENERGY (37), GAIA
(37) and MLC ITS (33) having the highest amount of linkages, and PAPER just one.
Table 14: Descriptive statistics of Figure 8
Organisations CAs
Number of nodes 94 Number of nodes 12
Number of CAs per organisation 2.40 Number of organisations per CA 18.83
Standard error 1.07 Standard error 13.92
Minimum 2 Minimum 1
Maximum 8 Maximum 37
22 Based on Mujika et al. (2010), a questionnaire was designed with indicators for measuring social capital within the 12 CAs considered in this paper. Data was collected during April‐July 2014 and 171 agents participated of the total population of 1,186 (with an answer rate of 14.42%).
23 These interviews were originally conceived to undertake a case study on the Basque energy cluster and dealt with different questions, but all of them dedicated one section to the evaluation of Basque cluster policy and the role of CAs.

Measuring structural social capital in a cluster policy network: insights from the Basque Country 103
Figure 8: Network of organisations that belong to more than one CA
Source: authors’ elaboration, using UCINET 624. The oncoming graphs of this paper have been designed alike.
As we realise, two‐mode data offer some very interesting analytic possibilities for gaining greater
understanding of "macro‐micro" relations. However, due to the fact that the analysis of such networks is
complex and the study techniques available are limited, a very common and useful approach to two‐mode
data is to convert it into two one‐mode data sets, and examine relations within each mode separately.
Thus, we create a data set of firm‐by‐firm ties, measuring the existence of a tie between each pair of
actors checking if they share the membership in a CA at least once. Operating similarly, we also generate
a one‐mode data set of CA‐by‐CA ties, testing whether CAs have a firm in common or not. Both figures
are represented below:
Figure 9: Network of CAs
24 Borgatti et al. (2002). The graphs were created using Netdraw (Borgatti, 2002).
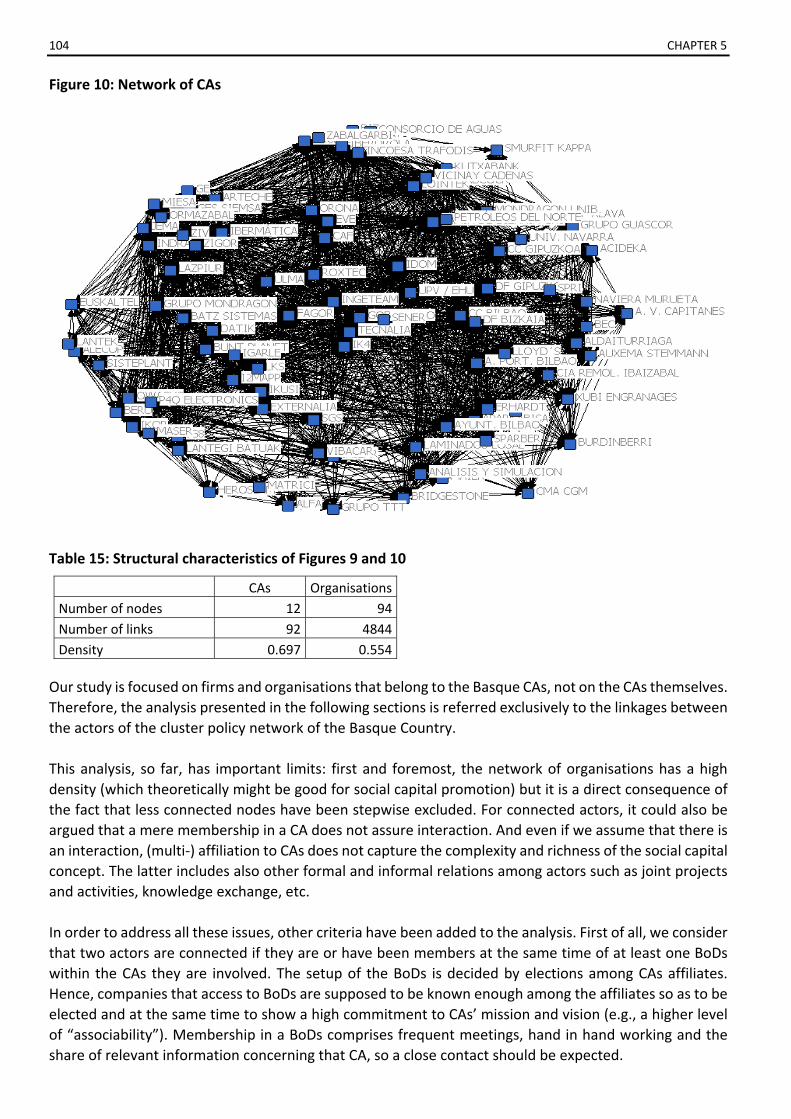
104 CHAPTER 5
Figure 10: Network of CAs
Table 15: Structural characteristics of Figures 9 and 10
CAs Organisations
Number of nodes 12 94
Number of links 92 4844
Density 0.697 0.554
Our study is focused on firms and organisations that belong to the Basque CAs, not on the CAs themselves.
Therefore, the analysis presented in the following sections is referred exclusively to the linkages between
the actors of the cluster policy network of the Basque Country.
This analysis, so far, has important limits: first and foremost, the network of organisations has a high
density (which theoretically might be good for social capital promotion) but it is a direct consequence of
the fact that less connected nodes have been stepwise excluded. For connected actors, it could also be
argued that a mere membership in a CA does not assure interaction. And even if we assume that there is
an interaction, (multi‐) affiliation to CAs does not capture the complexity and richness of the social capital
concept. The latter includes also other formal and informal relations among actors such as joint projects
and activities, knowledge exchange, etc.
In order to address all these issues, other criteria have been added to the analysis. First of all, we consider
that two actors are connected if they are or have been members at the same time of at least one BoDs
within the CAs they are involved. The setup of the BoDs is decided by elections among CAs affiliates.
Hence, companies that access to BoDs are supposed to be known enough among the affiliates so as to be
elected and at the same time to show a high commitment to CAs’ mission and vision (e.g., a higher level
of “associability”). Membership in a BoDs comprises frequent meetings, hand in hand working and the
share of relevant information concerning that CA, so a close contact should be expected.

Measuring structural social capital in a cluster policy network: insights from the Basque Country 105
Enrolment in a CA’s BoDs can be a way to access intra‐cluster data, but information concerning other
actors and other knowledge types may be shared in the network, too. For instance, according to the FP7
launched by the European Commission for 2007‐2013, 20 BCPs were created where some of these multi‐
affiliated organisations took part. Successive FPs have tried to promote collaborative research among
European firms, higher education institutions and public research organisations, encouraging joint
participation in technological platforms where organisations share knowledge and resources on specific
research projects (Breschi et al., 2009). Consequently, we infer that some type of knowledge about each
particular research area of the BCP will flow within interactions of group members.
Combining all criteria, this would be the network of the multi‐affiliated organisations that not only
concurred in the management of at least one CA, but also joined together one or more BCPs:
Figure 11: Network of organisations that share at least 2 memberships in CAs, and have been co‐members in at least one BoDs and one BCP
Symbols: Table 16: Structural characteristics of Figure 11
Down triangle = engineering and high‐technology firms Square = public institutions25 Diamond = technology centres Circle = large companies Up triangle = MCC group’s cooperatives Darkness and node and label size = degree centrality
25 Actually, the Port Authority of Bilbao is a mix of public and private initiative.
Organisations
Number of nodes 31
Number of links 162
Density 0.174
Cliques 19

106 CHAPTER 5
Overall, the network shows the properties of a “small world”. Watts (1999) demonstrated that two
theoretical concepts define a small world network: high neighbouring and short overall separation26. The
neighbouring coefficient (NC) is calculated as the average fraction of an actor’s collaborators who are also
collaborators with one another, while the overall separation is quantified by the average path length (PL),
which measures the average number of intermediaries between all pairs of actors in the network (Holland
and Leinhardt, 1971; Feld, 1981).
Figure 12: Types of network structures
Source: Watts and Strogratz (1998).
Table 17: NC and PL in regular, small world and random networks
Regular Small world Random
Neighbouring (NC) Very high High Low
Overall separation (PL) High Low Very low
Source: authors’ elaboration.
To verify whether a network is a small world, Watts’s model compares the actual network’s neighbouring
coefficient and the path length to a random graph of the same size, where random graphs have both low
neighbouring and very low path lengths. Particularly, the more the NC ratio exceeds 1.0 (NC of the actual
network/NC of the random graph comparison) and the closer the PL ratio is to 1.0 (PL of the actual
network/PL of a random graph comparison), or merely the larger the small world quotient (Q), which is
NC ratio/PL ratio, the greater the network’s small world nature (Uzzi and Spiro, 2005).
Q = (NCact /NCrand)/(PLact /PLrand) = (0.544/0.204)/(2.161/2.145) = 2.667/1.007 = 2.647
In our case, the neighbouring coefficient of the actual network is more than double of the random
network, so we can say that we have the neighbouring property of regular networks. Additionally, the PL
ratio is 1.007, which means that our network has the short path length property of random networks.
5.6. Discussion
Our data analysis conducted in the previous section points to 26 firms, 2 technology centres and 3
government organisations as the most significant actors in the Basque cluster policy network. These multi‐
connected nodes are better positioned in accessing information: the higher the number of direct ties an
actor has with others in the network, the higher its opportunities for learning and accumulating
26 The original terms used by the author are local clustering and global separation, respectively, but we have adapted them to avoid misunderstandings with the Porterian cluster approach and local/global interpretations.

Measuring structural social capital in a cluster policy network: insights from the Basque Country 107
knowledge, experience and skills. At the same time, and considering their central position in the network,
and the relatively low average distance to all organisations; and taking their multi‐affiliation as an
indicator of higher “sociability” and willingness to collaborate, these central actors seem to play a vital
role building bridges that connect the whole community of affiliates. Moreover, we have demonstrated
the existence of a small world network, a particular structure that has been found in several fields and
numerous studies have shown to be favourable for innovation (Fleming et al., 2007). This network is
characterised by (i) the presence of cliques inside the system and (ii) a sufficient number of ties that allow
joining different subgroups.
This finding partially agrees with what we already know about the composition of the Basque Network of
Science and Technology, containing a high presence of engineering and high‐technology firms with a
strong base of knowledge (Ingeteam, ZIV, Guascor, Arteche, Ormazabal, Sener), the Basque government
and its most important development agency (SPRI), the technology centres, very large companies
(Iberdrola, General Electric, Euskaltel, Ibermatica) and the cooperatives of the MCC Group (Aranguren et
al., 2010a; Navarro, 2010; OECD, 2011). Our analysis also concurs with other studies on cluster networks,
which have stressed the central role of big private firms, research centres and business associations as
gatekeepers of knowledge within and between clusters (Giuliani and Bell, 2005; Giuliani, 2007; Alberti and
Pizzurno, 2015).
Additionally, small worlds have a second property: each organisation is embedded in a tightly connected
subgroup. In Table 18 we show all the cliques of the network, i.e., subgroups of actors who have all
possible ties present among themselves:
Table 18: Members of cliques and their affiliation to CAs
CLIQUES27 ACED
E
ACICAE
ACLIMA
AFM
ENER
GY
PAPER
FMV
GAIA
HEG
AN
UNIPORT
EIKEN
MLC ITS
ARTECHE, GUASCOR, IBERDROLA, INGETEAM, ORMAZABAL, ZIV X X X X X
ARTECHE, IBERDROLA, INGETEAM, ORMAZABAL, TECNALIA, ZIV X X X X X X X
ARTECHE, INGETEAM, JEMA, ZIV X X X X X
BERU, GE, INGETEAM, ZIGOR, ZIV X X X X X X
GOB. VASCO, IK4, INGETEAM, TECNALIA X X X X X X X X X
GOB. VASCO, INGETEAM, SENER, TECNALIA X X X X X X X X
GOB. VASCO, IBERDROLA, INGETEAM, TECNALIA X X X X X X X X
GOB. VASCO, IKUSI, INGETEAM X X X X X X
GOB. VASCO, INGETEAM, SENER, SPRI X X X X X X X
IGARLE, INGETEAM, P4Q X X X X X
GE, IK4, INGETEAM, ZIGOR X X X X X X X X
GUASCOR, INGETEAM, SENER, SPRI X X X X X X X
GUASCOR, INGETEAM, SPRI, VICINAY X X X X X X
DF BIZKAIA, GOB. VASCO, SPRI X X X X X
ARTECHE, FAGOR, GUASCOR, IBERDROLA, ORMAZABAL, ZIV X X X X X X X
ARTECHE, FAGOR, JEMA, ZIV X X X X X X
GOB. VASCO, IDOM, SENER, TECNALIA X X X X X X X X
GOB. VASCO, IK4, TECNALIA, ULMA X X X X X X X X X
GOB. VASCO, IKUSI, ULMA X X X X X X
TOTAL 2 7 16 2 18 0 18 19 9 13 7 17
27 In this paper, we consider cliques of 3 or more members.

108 CHAPTER 5
These cliques connect firms, technology centres and, sometimes, government agencies (or the regional
government itself) that, by the way, collaborate in several research projects funded by the Basque
Government and/or the EU, some of them promoted by the CAs themselves such as those on marine
energies, smart grids or electrical vehicle, among others (ACE‐Europraxis, 2010; Valdaliso, 2015). The
emergence of this small world topology should be interpreted as a bottom‐up phenomenon, initially due
to the common interests of firms and technology centres, although in a second stage, may have led CAs
and the sheer regional government to initiate processes of inter‐cluster collaboration. It should also be
stressed that CAs most represented in this table (GAIA, Energy, FMV, ACLIMA) are the ones more involved
in projects of inter‐cluster collaboration.
The second research question asks the reasons that lie behind the centrality of these 31 organisations in
the cluster policy network. The answers may differ depending on the type of organisation. The significant
presence of government departments and agencies in the network may be explained on account of its
leading role in the creation and development of the STI and competitiveness policy of the Basque Country.
As to the technology centres and universities, its central role can be explained due to two factors: on the
one hand, their strong base of knowledge and R&D capabilities and their relations with big and medium
private firms (Olazarán et al., 2009); on the other, they have been privileged actors of the Basque STI
policy (the technology centres since the 1980s, the universities from the 2000s) (Navarro, 2010; OECD,
2011). Additionally, the privileged position of big private companies and small and medium engineering
and high technology firms in the network might be the result of their wide base of knowledge and their
strong absorptive capacity. Several authors have tested a positive correlation between the strength of a
firm’s knowledge base and its propensity to inter‐exchange knowledge with other agents within a given
network and outside (Giuliani, 2005, 2007; Giuliani and Bell, 2005), and this argument has also been
proved for the relationship between firms and technology centres in the Basque Country (Zubiaurre, 2002)
and for the GAIA CA (Valdaliso et al., 2011). Moreover, both the technology centres and the companies
detected in our analysis stand out for their high level of internationalisation. Therefore, they can also act
as technological gatekeepers of foreign knowledge into the clusters to which they belong.
Morrison (2008) states that technological gatekeepers must have a high level of absorptive capacity but
of relational capital, too. Tsai and Ghoshal (1998) hold that trust and trustworthiness (elements of this
relational dimension of social capital) are assets firmly rooted in social interactions. In our case study,
due to the central role of some firms and organisations in this network, it is highly probable that they also
become drivers of relational social capital (e.g., through repeated interactions, such as BoDs meetings or
joint participation in research projects and platforms, among others, a higher level of trust can be
developed).
Although the different studies conducted on cluster policy evaluation in the Basque Country have, so far,
not delivered conclusive results, all of them suggest a moderate positive influence of CAs (Aranguren et
al., 2010a and 2014; Valdaliso et al., 2011; Aragón et al., 2014). The answers that we collected from a
survey carried out among affiliates of CAs reinforce this proposition: a large part of the sample state that
CAs have high (or very high) impact on trustworthy relationships. CAs are seen by their affiliates to have
an overall positive impact on innovation and, to a lesser degree on internationalisation, although with
more contested views, whereas its impact of the rest of the vectors has been very limited (see Table 19).
As to their reasons for being affiliates of CAs, networking and share of information, knowledge and
experience were the three most widely stated, akin to those pointed out in other networks (Anderson
and Jack, 2002: 203). These advantages, along with other reasons such as their commitment to the region,
the contribution of CAs to the development of a shared vision and to fostering entrepreneurial discovery
processes among their affiliates, likewise came out of the semi‐structured interviews performed with five
out of the 31 firms represented in Figure 11.

Measuring structural social capital in a cluster policy network: insights from the Basque Country 109
Table 19. Survey conducted on affiliates of CAs (questions 17 and 18)
Regarding your company, what is the impact of this CA on the following competitive vectors? Very low Low High Very high TOTAL
Trust relationships 7 21 76 30 134
Innovation 14 39 69 12 134
Internationalisation 25 37 58 14 134
Training 18 53 58 5 134
Quality 21 57 53 3 134
Access to finance 58 51 24 1 134
Regulatory framework for labor relations 57 52 24 1 134
Current taxation 57 57 19 1 134
What are the main reasons for belonging to the CA?
TotallyDisagree
Partially Disagree
Partially Agree
Totally Agree TOTAL
To build a network of contacts 2 5 72 55 134
To share information 2 8 86 38 134
To share knowledge and experience 2 11 71 50 134
To cooperate in operational projects 4 19 62 49 134
To have access to institutional relations 4 20 78 32 134
To tackle new projects 3 22 65 44 134
To promote a shared culture 2 24 71 37 134
To build an environment of trust 3 27 73 31 134
To change the way to see and do things 3 32 68 31 134
Not to be out 19 33 50 32 134
Source: authors’ elaboration.
5.7. Conclusions This paper has illustrated the pattern of connections between firms and other organisations affiliated to
more than one CA in the Basque Country. Additionally, we have filtered this network with data about CA’s
BoDs and BCPs, and complemented this statistical exercise with qualitative information taken from a
general survey and from a few semi‐structured interviews with some of those organisations. From the
total population, we have highlighted 31 organisations that are the most connected ones (those that fulfil
the 3 criteria of analysis) and besides, form a small world because the average distance among them is
relatively low and, at the same time, they are embedded in a tightly connected subgroup. This structure
is considered to be optimal both for the creation (high cliquishness) and the dissemination (low distance)
of knowledge. We also suggest the existence of a positive relationship between the degree centrality in
this structural dimension of social capital and its relational dimension: the more connected an
organisation is in a network, the bigger chances are for the creation of relational social capital with other
actors of the network. According to what previous works have shown and to the exploratory evidence of
our qualitative information, we put forward that these central actors might play a dual role: as
gatekeepers of knowledge and information, and as drivers of bridging social capital promotion in the
region. Nevertheless, this is, so far, a hypothesis that would have to be tested in future works and is in
line with further lines of our research.
Our analysis contributes to the literature on social capital and cluster policies in two different ways. First,
in the theoretical discussion on social capital, and building on previous works (Valdaliso et al., 2011) we
propose a new indicator of structural social capital in a region and measure it by means of SNA. Second,
we have identified and portrayed, for the first time, the map of actors that form the core of the cluster
policy network of the Basque Country. Our findings agree with those of other studies, carried out with the

110 CHAPTER 5
same methodology, on cluster networks in other places (Giuliani and Bell, 2005; Giuliani, 2007; Morrison,
2008; Ter Wal and Boschma, 2009).
By measuring social capital through SNA, we take a static perspective akin to that adopted by other
quantitative studies. However, we are at pains to recognise that social capital formation and development
is a cumulative process, path‐ and place‐dependent, that co‐evolves with cluster and regional
development (Staber, 2007). In any case, a great deal of further research is needed on how the structure
of networks evolves over time and space (Ter Wal and Boschma, 2009). After all, “social capital is not a
thing, but a process” (Anderson and Jack, 2002: 207).
Other limitations of this study include that actors belonging to less than 2 CAs have been excluded of the
empirical analysis. As Granovetter (1973) states, distant links provide access to new information or
resources, and power may result more from weak ties than from strong ties. Therefore, we acknowledge
that our findings might have ignored some less connected agents playing a significant role in the regional
cluster network. Additionally, it goes without saying that this study does not measure the impact of social
capital on the performance of the clusters (and CAs) considered. We know that the effects of social capital
in clusters are, according to Staber (2007: 507), “highly variable and difficult to predict”. This aspect should
have to be addressed in forthcoming works. Finally, another future research line should tackle the
challenge to estimate the relational and cognitive dimension of social capital that this paper does not
approach.
The results may have some implications for policy‐makers and in particular for the design and evaluation
of cluster policies and cluster development programs, and are broadly in line with those of Giuliani and
Pietrobelli (2011). Given that policy‐makers seem to be highly interested in the creation of networks, to
know who are the most relevant and better positioned agents within the overall regional policy network
in a certain date can be a first step to improve the connectivity of the actors and of the whole system, one
of the challenges identified by several assessments of the Basque STI policy (Navarro, 2010; OECD, 2011;
Aranguren et al., 2012). In particular, this map may help the Basque Government in its efforts to improve
the connectivity of the different agents of its innovation system (Magro, 2014) and to foster inter‐cluster
and inter‐industry collaboration, one of the lines of its on‐going Industrialisation Plan (Gobierno Vasco,
2014: 41). Basque policy‐makers could either work more closely with the identified agents, or try to
reinforce the central role or the connectivity of some of them (such as the technology centres and
universities, for example) and/or decide to make extra efforts to incorporate other actors to central
positions in order to reduce the risk of lock‐ins and re‐orient the network towards more productive
research areas.


Measuring social capital with Twitter
within the electronics and ICT cluster
of the Basque Country
CHAPTER 6

114 CHAPTER 6
CHAPTER 6: MEASURING SOCIAL CAPITAL WITH TWITTER WITHIN THE ELECTRONICS AND ICT CLUSTER OF THE BASQUE COUNTRY The following chapter is based on a single authored paper accepted at City and Community and awaiting
its publication. This is the provisional citation:
Etxabe, I. (2018). Measuring social capital with Twitter within the electronics and ICT cluster of the Basque
Country. City and Community (forthcoming), https://doi.org/10.1111/cico.12297
Abstract:
Social network sites like Twitter enable the creation of virtual environments where online communities
are formed around specific topics. Lately, due to their increasing success, these platforms are turning out
to be effective for electronic word‐of‐mouth communication since they can be used as another means to
spread information and build a network of contacts.
In this paper, Twitter is used as a proxy to measure social capital in the electronics and ICT cluster, one of
the 22 clusters integrated in the Basque cluster policy. Tweets were extracted through REST and
Streaming API and later on studied using Social Network AnaIysis, both from the static and dynamic
perspective. Above all, I highlight a strong correlation at the structural and relational level, intra and inter
dimensionally. The social and organisational proximity may explain the tighter relationships among
affiliates, where the association that rules the cluster and other firms play an important role.

Measuring social capital with Twitter within the electronics and ICT cluster of the Basque Country 115
6.1. Introduction
The influence of social capital in regional prosperity is acknowledged both in academic reflections and
public policies on account of its presence in interactive learning (Lundvall et al., 2002; Westlund, 2006).
Innovation is a process that highly depends on communication, since actors operate in a context in which
the resources they need to mobilise are shared with others and actually change (Lundvall and Christensen,
2004), and this interaction demands reliance on social capital, via formal or informal networks (Schuller,
2006).
In the background of clusters, modern literature contends that social capital is key to cluster development
and if lock‐in situations are avoided, firms within clusters may benefit from many factors related with
social capital: efficiency of action and information diffusion (Burt, 1992), lower costs of monitoring
processes and transactions (Malmberg et al., 1996), plus a better co‐ordination because of direct contacts
and often trust‐based relations among economic agents (Porter, 1998). In this respect, Rosenfeld (2003)
states that social capital in clusters leads you to the “know‐who” that allows you to build the “know‐how”.
According to Nahapiet and Ghosal (1998), social capital has three interrelated dimensions: structural,
relational and cognitive. Following other works (Boschma and Ter Wal, 2007; Giuliani, 2007; Ter Wal and
Boschma, 2009) this paper constitutes an attempt to measure social capital through Social Network
Analysis (SNA) in order to map the linkages both at the structural and relational dimension, and
understand the nature of these ties at bonding, bridging and linking level.
This study targets the cluster association (CA, henceforth) of industries for electronics and ICT of the
Basque Country28, one of the twelve CAs regarded as strategic by the regional government. The latter
pioneered a cluster policy in the early 1990s that has long been maintained until now (Ketels, 2004), and
one of its pillars was the creation of several CAs, institutions for collaboration whose objective was to
improve each cluster’s competitiveness by facilitating cooperation among their affiliated members and
key agents of the industrial and innovation policies of the region (Aranguren and Navarro, 2003;
Aranguren et al., 2010a). Even though the first efforts to assess the influence of CAs do not provide
conclusive evidences (Aranguren et al., 2014), there is a broad agreement about the positive effects of
these CAs on innovation, human capital formation and internationalisation of their affiliates, and on soft
outcomes such as the creation and promotion of social capital and trust‐based relationships favourable
for competitiveness and economic growth (Valdaliso et al., 2011; Aragón et al., 2014; Aranguren et al.,
2014).
In the Internet era, social network sites (SNSs) can be used as another means to spread information and
build a network of contacts. These computer‐mediated communication (CMC) platforms allow individuals
to introduce themselves, articulate their social networks, and establish or maintain connections with
others. Although exceptions exist, the available research suggests that most SNSs primarily support pre‐
existing social relations. The online social network application analysed in this article, Twitter, is a real‐
time information network that connects users to the latest information about what they find interesting,
using micro‐blogs (messages which contain a maximum of a 140 characters29). The service presents itself
as a new application for moving and finding information at an extremely rapid pace, and it is said to be a
more and more important tool for electronic word‐of‐mouth communication (eWOM) (Jansen et al.,
2009).
28 This CA is more known as GAIA. For further information: http://www.gaia.es (last seen: 25/11/2016). 29 This limit was expanded to 280 characters in November 2017.

116 CHAPTER 6
This paper focuses on three research questions. The first and second aim to verify if Twitter might be used
in order to explain structural and relational social capital in clusters, respectively. Likewise, the third
question attempts to infer the information shared among the affiliates and check if it matches with the
main issues accomplished in the cluster. From the total population of organisations that belong to GAIA,
I have identified 160 that have an active Twitter account and a map of relationships has been made
depending on who is following who and who is followed by whom. Afterwards, Twitter’s openness and
flexibility allowed us to develop an application programming interface (API) to extract almost 263,000
tweets related to these 160 users and finally an analysis was performed elaborating quantitative data.
Data collection was performed in two moments: February and August 2016. Sources of the CA were also
contacted on 19 September 2016 within an interview conducive to obtain some more evidences that have
upgraded the investigation.
The paper is structured as follows: the second section provides the theoretical background on social
capital and explains how the Internet is converted as a new means to promote social capital. The third
section introduces cluster initiatives as drivers of social capital and the particular performance of GAIA.
The fourth section presents the methodology and data and later on the empirical study is carried out. The
fifth section is dedicated to a contextual discussion where the most meaningful interpretations are
emphasised. Finally, the main conclusions of my research are mentioned in the sixth section.
6.2. Theoretical discussion
Social capital
Many researchers affirm that network relationships among co‐located firms play a key role in supporting
innovation and competitiveness (Porter, 1998; Schmitz and Nadvi, 1999; Eisingerich et al., 2010). For
example, the impact of cluster initiatives on the performance of firms is based theoretically on collective
dynamics and relationships that spur innovation or learning (Aragón et al., 2014). Accordingly, “soft”
attributes such as the atmosphere of the cluster are important assets that facilitate collaboration and
trust among cluster members, promoting joint activities (Fromhold‐Eisebith and Eisebith, 2008). In this
sense, network policies attempt more and more to set a social infrastructure with a high presence or
creation of social capital.
Although social capital seems to be a key factor in regional development (Malecki, 2012), there is little
consensus around what should be understood with it (Inkeles, 2000). The most comprehensive definitions
of social capital are multidimensional (Putnam, 1995; Nahapiet and Ghoshal, 1998), incorporating certain
elements that have been given different emphasis depending on the perspective of each author (Adler
and Kwon, 2002; Lorenzen, 2007). The literature offers three main interpretations:
a) From an individualistic viewpoint, social capital is an individual resource found in networks of
relationships of a person and his/her associated expressive and instrumental means (Bourdieu, 1986).
b) A second perspective considers social capital as a community resource, a set of attributes and
properties present in the social structure (i.e. shared norms and values, personal trust) that facilitate
operation and collective action (Coleman, 1988).
c) Finally, for the macro approach, social capital is a macro‐social and macro‐institutional resource that,
built upon issues such as citizenship, general confidence and social cohesion, lubricates the economy
and the society (Putnam, 1993).
The disparity of attributes encompassed by social capital, its presence in the micro and macro spheres
and the wide range of effects that it generates, result in a complex and discussed concept often criticised

Measuring social capital with Twitter within the electronics and ICT cluster of the Basque Country 117
for its ambiguity. Given the need to refine this notion, some authors dared to identify two characteristics
that all perspectives have in common: some aspects of social structure (Aragón et al., 2014), and the
capacity to facilitate certain interactions of agents within that structure (Coleman, 1988)30. In this line,
Nahapiet and Ghoshal (1998) stated that social capital is the result of complex interrelations and
interdependencies between the structural (overall pattern of connections), relational (personal
relationships) and cognitive (common context) dimensions. Further, Woolcock (2001) mentioned three
types of relational assets that people have access to: bonding social capital (immediate family, friends,
and neighbours), bridging social capital (more distant colleagues and associates) and linking social capital
(connections to people in positions of authority).
In this paper, I employ a wide concept of social capital that considers all the elements constituting a
resource to achieve cooperative outcomes. More particularly, due to my interest in social capital as both
an underlying foundation for clustering policies and an outcome of such policies, my goal is to analyse
relations among associated actors within a network and the features that give cohesiveness and help to
reach collective objectives.
Social Capital and Internet
The development of digital ecosystems has created new ways to exchange information, creating a new
industrial revolution (Barrutia et al., 2016). Since the Internet Revolution, researchers have started to
explore the possibilities of CMC to build social capital among users. For example, Nie (2001), contended
that Internet use reduces face‐to‐face time with others, which may decrease an individual’s social capital.
Nonetheless, this viewpoint has been heavily criticised and some researchers have argued that online
communication might supplement or replace personal interactions, diminishing any loss due to the time
spent online (Wellman et al., 2001). Moreover, communication over the Internet appears to be a
complement to face‐to‐face social interactions rather than a substitute for it. Research in this vein has
investigated how online interactions interface with offline ones, and studies of communities supported
by virtual networks, such as the Blacksburg Electronic Village or the Netville community in Toronto,
concluded that CMC had a positive repercussion on community involvement and social capital (Hampton
and Wellman, 2003).
SNSs are social communities of the web, connected via electronic mail and networking applications that
are hosted in websites. These tools allow individuals to present themselves, articulate their social
networks, and establish or maintain connections with others (Ellison et al., 2007). They can be oriented
towards work‐related contexts (e.g., LinkedIn.com), romantic relationship initiation (e.g., Meetic.com,
Badoo.com), microblogging (e.g. Twitter), some particular fields such as music (e.g., MySpace.com,
Bandcamp.com) or the college student population (the original goal of Facebook.com).
What makes SNSs unique is not that they enable users to meet new people, but rather that they allow
individuals to maintain existing offline relationships. On many of the large SNSs, participants are not
necessarily “networking” or looking to meet strangers; instead, they are primarily communicating with
people who are already a part of their extended social network. To emphasise this articulated social
network as a critical organising feature of these sites, Boyd and Ellison (2007) label them “social network
sites”. This is one of the main aspects that differentiate SNSs from earlier forms of public CMC (Ellison et
al., 2007).
30 Lozares et al. (2011: 3) make a similar distinction and talk about the formal and substantive components of social capital.

118 CHAPTER 6
Researchers have emphasised the importance of Internet‐based linkages for the formation of weak ties,
which serve as the foundation of bridging social capital. Resnick (2001), for example, suggests that new
forms of social capital and relationship building will arise in SNSs because online relationships may be
supported by technologies like distribution lists, photo directories, and search capabilities. Donath and
Boyd (2004) speculate that SNSs could largely increment the number of weak ties a user could create,
because the technology is well‐suited to maintaining these ties cheaply and easily. Thus, bridging social
capital might be increased by such sites which support loose and latent social ties, enabling users to form
and retain larger, diffuse networks of relationships (Wellman et al., 2001).
In an article written on the electronics and ICT cluster of the Basque Country, Valdaliso et al. (2011)
suggest that social networks may promote the creation and diffusion of intra‐cluster knowledge linkages,
but at the same they acknowledge the difficulty to measure this indicator due to the intangible nature of
these formal and informal networks. This paper constitutes an original attempt to overcome this obstacle
and dares to map social networks within GAIA at the structural and relational dimension.
The combination of a growing interest concerning this particular subject together with the existence of
some limitations of previous research mentioned above allowed me to propose three research questions
that will be addressed in the following sections of this paper:
RQ#1: Can Twitter be used to reflect the existence of structural social capital in clusters? If so, which are
the underlying patterns of connections among the overall population of affiliates to GAIA, and who are
the most networked (following + followers) organisations?
RQ#2: Can Twitter be used to understand relational social capital in clusters? In that case, which is the
relational embeddedness that associates have developed with each other through a history of real
interactions, and who are the most active organisations?
RQ#3: Can Twitter be a trustful tool to identify the information that is shared in the cluster? In such event,
what is flowing among the connections of that network’s relevant actors and to what extent differs from
the main topics addressed in the cluster?
6.3. Cluster initiatives and social capital
Cluster policies aimed at nurturing and supporting cooperative relationships among economic agents
have been increasingly employed in Europe during the last two decades. They are a classic example of a
“soft policy”; instead of dealing with subsidies for specific production‐ or innovation‐related activities,
they try to promote a general atmosphere conducive to cooperative relationships between agents
(Aranguren et al., 2014).
The majority of these cluster policies provide financial, infrastructural and/or technical support for the
formalisation of cooperative relationships between agents in some form of association or network.
Indeed, many clusters are built around institutions whose main objective is to improve each cluster’s
competitiveness by facilitating and fostering cooperation/collaboration among their members, including
firms, research centres, universities, government, and so on. Such institutions are, of course, not only
associated with cluster policies; some have long been present in the form of trade associations,
entrepreneurial networks, industry associations, etc. (Aranguren et al., 2014). Actually, cluster initiatives,
or CAs, can be started by companies, universities, or government agencies, but research shows that this
fact is not so relevant. Their success depends on the active role of all agents in collaborating and searching
Measuring social capital with Twitter within the electronics and ICT cluster of the Basque Country 119
common objectives (Sölvell et al., 2003; Ahedo, 2004; Fromhold‐Eisebith and Eisebith, 2008; Aranguren
et al., 2010a). In this sense, different empirical studies have pointed to cluster and trade associations, and
other institutions for collaboration as drivers and enablers of social capital formation in their respective
regions (Carbonara, 2002; Giuliani and Bell, 2005; Aranguren et al., 2010a; Valdaliso et al., 2011; Aragón
et al., 2014; Aranguren et al., 2014).
Cluster Associations in the Basque Country
The Basque Country is an old industrial region located in the North coast of Spain that transformed its
economy during the 1970s and 1980s, achieving in the 2000s per capita income and productivity levels
much higher than those of Spain and above the EU average (OECD, 2011). From the 1980s on, its regional
government owns important policy competences and the highest degree of financial autonomy in the EU
(Morgan, 2013; Magro, 2014). In the early 1990s, the Basque Country pioneered in Europe a cluster policy
that has long been maintained until today. One of the vital elements of that cluster policy was the creation
and support of CAs, institutions that focus their efforts on promoting firm cooperation (particularly in
research activities), improving the cluster business environment and strengthening the innovative
capacity of member firms. They also assist the internationalisation process through presence at
international fairs, joint commercial missions to emerging markets, and creation of export consortia. In
2006, the firms formally affiliated to CAs accounted for 28% of Basque employment and 32% of the gross
value added of industry (Orkestra, 2009). Today, there are twelve strategic CAs supported by the Basque
Government and they form the core of the cluster policy network of the region.
GAIA, the CA that is studied in this paper, is the Association of industries for electronics and ICT of the
Basque Country. It is a non‐profit, private and professional entity, currently integrated by more than 260
companies, that pursues the assimilation and efficient usage of the sector’s technologies with the aim of
collaborating in the development of the Information and Knowledge Society. It was established in 1983
when the regional government sponsored the creation of AIEPV31, an industry association which
promoted networking and inter‐firm cooperation in three fields: labour formation, research activities and
internationalisation. AIEPV transformed into a Cluster Association of electronics and ICT industries in
1996. This change was the outcome of the sheer technological convergence among electronics, software
and telecommunication technologies, on the one hand, and of the efforts of regional government to
promote an ICT cluster in the Basque Country, on the other. In the last 20 years, the electronics and ICT
cluster of the Basque Country has experienced a remarkable growth in terms of number of firms,
employment and turnover. In 2015, the GAIA firms’ turnover accounted for near 5% of Basque GDP and
19% of regional industrial product, when 30 years before the respective figures were 0.7 and 1.9% (GAIA,
Eustat)32. The performance of GAIA firms in terms of research intensity, employment qualifications and
internationalisation is better than that of non‐associated ones (Valdaliso et al., 2011).
6.4. History of GAIA
The origins of the electronics industry date back to the mid 20th century, due to the demand from two
industries: electrical equipment was needed for the production and distribution of electricity, and iron
and steel metalworking urged instruments for controlling and programming the industrial machinery. The
early genesis of the sector was path dependent and idiosyncratic (Valdaliso et al., 2011: 713, citing to
Feldman et al., 2005), very linked to the initivative of a small group of founding entrepreneurs who had
31 AIEPV stands for “Asociación de Industrias de la Electrónica del País Vasco” and was the first association prior to GAIA. 32 See http://www.gaia.es/turnover.html and http://en.eustat.eus (last seen: 10/10/2016).

120 CHAPTER 6
access to skilled labour and created the first firms to manufacture products for a protected domestic
market. Some relevant engineering companies (e.g. Sener, Idom…) were also created at that time (López
et al., 2008: 109), but the sector was far from presenting a solid structure given the small size of the
businesses related to these technologies.
Since the very beginning, the firms attempted to import technology and develop technical solutions for
their products. To do so, they invested heavily in R&D and cooperated to create technology centres under
the initiative of the Ministry of Education, Science and Industry, which transferred the experience of
research associations in the UK where companies could participate and improve their R&D. This project
soon welcomed interaction with industry associations and universities that led to relationships of cluster
type but without forming an association at all (Ibid.: 109).
The expansion of the sector started from 1970 onwards. A strategic response of the oil crisis required to
increase productivity and international trade. A new generation of materials (silicon, fiber and advanced
composites) and the transition from analogue to digital era accelerated the technological change, but the
sudden entry of microelectronics started a revolution, as microchips increased storage capacity and the
speed of information transmission and reduced costs significantly (see chapter 9 in Valdaliso and López,
2007). Without any doubt, part of its remarkable growth is related to the technological regime and life
cycle of the industry: science and knowledge intensive, young industry with low barriers of entry, a
growing market and a lot of business opportunities (Valdaliso et al., 2011: 716, citing to Malerba, 2006).
The timing is also important because the microelectronics industry in the Basque Country started hand in
hand with the most advanced countries and it benefited from a “new technological and market
opportunity” that had not already been exploited (Ibid.: 717, citing to Martin and Sunley, 2006).
From the mid‐seventies on, the Basque companies in this sub‐sector strengthened their presence in the
national market and began to export. They benefited from the first graduates specialising in ICTs and a
strong capital venturing sector which, besides representing an important demand for services, provided
financing to industry. Simultaneously, a small group of companies that invested in R&D in the sixties
developed a wide range of innovative products, services and solutions which went above and beyond the
initial demanding sectors. This laid the foundations for an extension of the fields of activity with new
product lines and new companies (López et al., 2008: 110). Finally, a series of government measures
started by the Spanish government, in particular the PIE33, led to closer collaboration among the large
electricity‐generation and distribution companies and the power electronics, measuring and control
companies (Ibid.: 45).
In the 1980s, the existence of a sophisticated local market that demanded new products and the
availability of related industries and services helped the industry. As a result, new firms appeared, created
by university graduates (start‐ups) and technicians and engineers that exited from old established firms
(spin‐offs). Apart from the growth of the sector, it is remarkable in this period the constitution of AIEPV
in 1983, the first institution that formally promoted a strategy of collaboration. It was created by six
companies of the electronics subsector (Electrotécnica Arteche, Jema, Radio Industria Bilbaína, Ekain,
Nafar Elektrónika y Bihar), along with the strong support of the regional government (SPRI) (Valdaliso and
López, 2008: 21). The cooperation strategy was strengthened by the universities, which extended and
updated their offer of ICT‐related degrees, and a progressive localisation of many companies and
technology centres in the technology and business parks34. Nevertheless, these collaboration dynamics
33 Programa de Investigación y Desarrollo Electrotécnico (PIE), which forced the electricity companies to invest at least 0.3% of their turnover in R&D (López et al., 2008: 111). 34 In 1988, the first technology park of Spain was created in Zamudio (Bizkaia). In 1990s two more parks were inaugurated: Miñano in Alava (1993) and Miramon in Gipuzkoa (1995).

Measuring social capital with Twitter within the electronics and ICT cluster of the Basque Country 121
did not prevent the high level of business rivalry from continuing, due to the creative destruction process
in the sector (high business birth and death rate). Yet, this situation fostered innovation as companies
made strong investments in R&D (around 10% of sales) and employed highly qualified human capital (in
some firms, more than half of the workforce with higher education) (López et al., 2008: 119‐120).
In the 1990s, the Basque government made another step to improve the regional competitiveness with
the implementation of a cluster policy. In this context, in 1996, AIEPV transformed into GAIA, the Cluster
Association of electronics and ICT industries, and brought about new firms to the Cluster Association
(López et al., 2008; Valdaliso and López, 2008). The incorporation of new sectors strengthened the
cluster’s diversity, but required a greater coordination and collaboration effort among the companies of
the electronics sector, with a more industrialist profile, and those of the new sectors, which were more
services‐oriented. The Cluster’s companies continued to collaborate in R&D activities, labour training
programmes and internationalisation; in this period, GAIA promoted the beginning of a collaboration
strategy with other regional clusters, which led to varied results. At the same time, competitive rivalry
was sustained, due to the creation of new companies and spin‐offs and the pressures derived from the
progressive and unstoppable internationalisation of the sector.
In a European context, the Basque electronics and ICT cluster resembles those located in the “European
banana” (Valdaliso eta al., 2011: 715, citing to Koski, Rouvinen, and Ylä‐Anttila, 2002). Although smaller
in size, technological centres are drivers of collaborative R&D activities like in Dutch and German cases,
and it does not have any outstanding multinational with a decisive role within the cluster. However, the
largest firms have lately created bigger business groups following a strategy of vertical integration and/or
horizontal diversification, product upgrading and internationalisation. For this purpose, they had the
support of governments, particularly the Basque Government, and an already consolidated research
infrastructure (universities, technology centres and parks). In some cases, the internationalisation of
Basque companies has gone together with other engineering companies or electricity and construction
companies. The increasing capital demand arosen as a result has led to a call for external financial banking,
provided in some cases by financial institutions located in the region (banks, savings banks and venture
capital companies).
6.5. Methodology and data analysis
Starting in the 1990s, networks have acquired a great attention in regional economics and economic
geography (Grabher, 2006). Only lately, SNA techniques have been used in order to examine the structure
of interaction in regions and geographical clusters. Thus, more and more scholars attempt to measure
social capital through SNA, a promising qualitative and quantitative tool for empirically investigating the
structure and evolution of inter‐organisational interaction and knowledge flows within and across regions
(Ter Wal and Boschma, 2009).
In general terms, SNA is considered to be something more than a simple methodological approach. It is a
different way of envisaging the society and the economy, and it is based on the assumption that
relationships among interacting actors are important to explain their nature, behaviour and outputs
(Giuliani and Pietrobelli, 2011). Nevertheless, SNA is not only a visualisation, descriptive or exploratory
tool. While rich in qualitative details, SNA has also a very important role to play in impact assessment
analysis as it generates highly valuable quantitative network indicators both at the level of the firm (or
other relevant unit of research) as well as at the cluster level.

122 CHAPTER 6
Moreover, SNA has the potential to contribute further to the investigation of RIS (Cooke, 2001). With
social network methodology, they can be studied more systematically by mapping the network relations
of leading agents with other agents (like research institutes, educational facilities and capital suppliers)
within and outside the region. Thereby, relevant information is gathered on how well these major
organisations are connected, and at what spatial levels (Ter Wal and Boschma, 2009).
Twitter as a proxy of the GAIA network
Twitter is an online social networking service that has been described as "the SMS of the Internet” because
it enables users to send and read short 140‐character messages called "tweets". It was created in March
2006 by Jack Dorsey, Evan Williams, Biz Stone and Noah Glass and the service rapidly gained worldwide
popularity. According to Wikipedia, in 2013 Twitter was one of the ten most‐visited websites and as of
May 2015 it had more than 500 million users, out of which more than 302 million were active users.
In a research performed about word‐of‐mouth communication on Twitter, Jansen et al. (2009) found that
around 19% of the posts mentioned the name of a brand, product or service and over 50% of them were
positive tweets (only one third were negative). More than half of the people who log in to Twitter each
day do not tweet themselves, but simply sign in to read about what is happening in their world, and this
can influence consumer attitude and behaviour. Indeed, companies are so involved in social media
because this new form of electronic word‐of‐mouth is approximately 20 times more effective than
marketing events and 30 times more effective than media appearances (Trusov et al., 2009).
The popularity and success of Twitter has lead many researchers to analyse the rich dataset created by
messages posted to this microblogging system. The early works were mainly quantitative studies and
focused on the properties relating to the domains of user and message, and little by little a new set of
papers included linguistic and semantic analysis of tweets (as I do in this paper). After a decade from its
foundation, there are more than one thousand research publications that rest on Twitter, in areas such
as politics and government, business, education, health community and journalism (Williams et al., 2013).
The reason to choose Twitter for this paper is based on several assumptions. To start off, I think that
measuring social capital in GAIA with Twitter would have sense due to the fact that companies affiliated
to this association are involved in electronics and ICT, and thus they might be familiar with the use of this
application. In fact, almost 63% of GAIA associates are logged in Twitter and therefore the way they
interact in this platform might be representative to map their network of connections.
But why Twitter and not another SNS tool? Firstly, because unlike Facebook or LinkedIn, the default
setting for tweets is public, which permits people to follow others and read each other’s tweets without
giving mutual permission. Additionally, the Twitter application program interface (API) is easier to access
since it allows the integration of Twitter with other web services and applications. And finally, I concluded
that Twitter is more suitable to study businesses; while LinkedIn can be more oriented towards individual
work‐related contexts and Facebook might focus on friends and family, Twitter is a very popular service
for businesses to enter the social media arena and one of the best social tools empowering the brand to
connect with customers.
In this paper, Twitter is used as a proxy to measure social capital among GAIA associates in two different
ways: when answering the first research question, the declared intention to follow somebody (and to be
followed by others) is inferred as an indicator for the structural social capital within the electronics and
ICT cluster. Nevertheless, the intention does not guarantee any interaction (somebody may have lots of
following/followers without any communication flow at all), so only analysing the last tweets of all users

Measuring social capital with Twitter within the electronics and ICT cluster of the Basque Country 123
we can have a picture of how they contacted each other via Twitter, which is considered as a magnitude
of relational social capital in the second research question.
To collect the data, I looked for usernames related to GAIA affiliates in the Twitter searching tool and I e‐
mailed those ones that apparently were not Twitter users to kindly inform me if they had an active
account. Finally, I got 160 usernames out of the 254 affiliates registered in GAIA in December 2015
(62.99%).
Data analysis
For the first research question, I opened a new account in Twitter (@vcpetiri) and I clicked the option
“follow” for each one of the above mentioned 160 organisations. After, I visited the profile of all these
users and I checked which other GAIA affiliates they were following (it was quite easy because Twitter
directly shows you this account’s followers from your following list) and with all this information I
elaborated a non symmetric 1 mode matrix. The resulting network is the following one:
Figure 13: Network of following‐followers
Source: author’s elaboration, using UCINET 6 (Borgatti et al., 2002) and NetDraw (Borgatti, 2002). Note: node and label size represent degree centrality (in + out). Figures 14 and 15 have been designed alike.
As it can be seen in Appendix 12, the most connected agent considering GAIA‐GAIA relationships is Cluster
GAIA, the Twitter account of the CA. Despite it has less followings/followers as a whole compared to other
usernames (e.g. Microsoft or Hispavista), it is pretty much concentrated on the GAIA network. In fact, it
is in the first place in terms of betweenness centrality, which indicates that it is the main actor connecting
other GAIA members that will be otherwise disconnected. As a result, it has the highest eigenvector
centrality, which means that Cluster GAIA is the central node of that network. Tecnalia Foundation and
IK4 Technological Alliance, the two principal research centres of the Basque Country, are also remarkable
actors in the GAIA network, together with companies such as Mondragon Corporation, Ikor or Dinycon
Sistemas.

124 CHAPTER 6
For the second research question, I built a REST (Representational State Transfer) API that provides a
programmatic access to read approximately the last 3,200 Twitter posts of each user. This way, 161,568
tweets35 were extracted in February 2016 and downloaded in a database. Later on, some calculations
were made in order to see who the most active users in different fields are.
In Appendix 13, I show GAIA usernames by mentions and retweets36 sorted by total degree (in and out).
As it can be seen, there are several active actors sending and receiving references, some in fact reaching
a wide range of usernames (e.g. Microsoft, Euskaltel or Vodafone). But as far as GAIA network is
concerned, the most connected actor is again Cluster GAIA since it is the main bridge node and the most
influential one, followed by Tecnalia, Virtualware, Ibermatica and IK4. This is the subsequent graph based
on interaction:
Figure 14: Network of interaction through mentions (last 3,200 tweets of each user)
Unlike the following/followers standing, patterns of interaction in Twitter are more dynamic since they
may change quite rapidly, and that requires looking at the network at different moments in time.
Therefore, I ran a Streaming API37 and compiled a second sample of 101,203 tweets between 18 April and
31 August 2016. The results are summarised in Figure 15 (data are shown in Appendix 14).
This is a clearer and smaller nebula, quite good articulated though. Cluster GAIA is once again the central
node, creating up to 12 cliques in collaboration with some well connected actors (Tecnalia, Euskaltel, etc.).
Similarly, there are others that, despite having a low degree, open up new channels to connect the core
with several subgroups in the periphery (i.e. Virtualware, Izertis or Spyro).
35 The first and last tweets of the dataset were written on 11 April 2007 and 19 February 2016, respectively. 36 Users can mention other users writing the “@” sign followed by a username. To repost a message from another Twitter user and share it with one's own followers, a user can click the retweet button within the tweet. In this paper, mentions and retweets have been considered similarly as a means to refer to other usernames. 37 In comparison to REST API, Streaming API enables to collect unlimited input and output data, but is technically a bit more complex to monitor and process.

Measuring social capital with Twitter within the electronics and ICT cluster of the Basque Country 125
Figure 15: Network of interaction through mentions (April‐August 2016)
Yet, even though it is not alluded in the research questions, it must be noted that GAIA members also
contact other users that do not belong to the association but tweet about topics related to electronics
and ICT and hence should be taken into account. In Appendix 15 I present the principal non GAIA actors
in receiving mentions (in quantity and diversity) based on sample 1. The University of Deusto and, to a
lesser extent, the University of the Basque Country are top actors, together with some institutions like
Innobasque (Basque Innovation Agency), Adegi (Association of Entrepreneurs of Gipuzkoa) or SPRI
(Society for the Promotion of Industry of the Basque Government). Mass Media (@ap, @el_pais,
@diariovasco, @expansion, @expansioncom, @elmundoes, @elcorreo_com, @eleconomistaes, @eitb),
online communities (@youtube, @tic, @xataka, @ticbeat, @mkdirecto, @wwwhatsnew,
@puromarketing), individual users related to some companies (@txemafranco from Lantegi Batuak,
@artmonedero from Delirium Studios or @juanliedo from Ibermatica) and some individual users
(@alfredovela, @tuitsdegabriel, @asadapi, @antoniosanto) have been echoed, too.
Furthermore, it might be interesting to find out which non GAIA users are mentioning associates. As seen
in Appendix 16 (which has been built on sample 2), in general, the most active actors are individuals that
mention or retweet exclusively the firm where they are working or even running. If attention is paid on
the diversity of affiliates mentioned, the ranking changes completely and in this case, the majority of
usernames represent organisations such as journals, public institutions, research centres or other cluster
entities.
Finally, to answer the third research question, I present in Appendix 17 the most repeated hashtags38 and
words within the studied tweets. As we can see summarised in Table 20, users mostly talk about
technology, Internet and its applications, cloud computing, big data, innovation, entrepreneurship,
companies, customer service and marketing.
38 A hashtag is a word or a phrase prefixed with a "#" sign that is used to group posts together by topic.

126 CHAPTER 6
Table 20: Most repeated hashtags and words (in italics, hashtags and words in Spanish)
Topic Hashtags Words
Technology #BtMS, #tecnologia, #TI, #TIC tecnología
Internet applications #app(s), #Facebook, #Google, #Oracle, #Android, #internet
app(s), Google, Microsoft, internet, Facebook, Apple, Twitter, aplicaciones, Samsung, movil
Cloud computing, big data
#cloud, #BigData, #IoT, #cloudcomputing, #PostPC web, online, sistema, digital, datos, redes
Innovation, entrepreneurship
#innovacion, #reimaginaeltrabajo, #emprendedor/a nuevo/a, new, proyecto
Company #empresa(s), #pyme(s), #startup empresa(s), business
Customer service, marketing
#ecommerce, #CustomerService,#custserv, #Marketing servicio, service, customer, marketing
Place #Donostia, #Bilbao, #Eibar, #Madrid internacional, España, nacional
Broadcasting #infografia, #infographic, #musica,#music, #videojuego(s) video
Social media #SocialMedia, #SocBiz social
Education, training #educación, #formación, #FP jornada, curso, formación, evento
Security #seguridad seguridad
6.6. Discussion
Centrality in previous figures provides some nodes with certain benefits. Let’s explain them based on a
simple example introduced in Figure 16:
Figure 16: Contextualising centrality in Twitter
At the structural dimension, if A follows B, A can see that B is following C and equally D is following B. This
information can be useful to expand the network of contact for A (A may be interested in C and D and can
start following them). And at the relational dimension, without changing its network of contacts, A will be
informed about every single action B is performing in Twitter, and it is especially important from the
bridging point of view that A will automatically get all retweets of B (in this example, originally written by
C) without following C (and sometimes even not knowing it).
Another finding is that, although Figure 13 and 14 describe different dimensions with distinct
characteristics, central actors are similar in both networks. Indeed, as illustrated in Table 21, having lots
of followers/followings (especially the former) is tightly associated with the number of mentions (in and
out), even if exceptions exist. Thus, there is a sort of relation between the “pipelines” of the GAIA network
and the flow of information and knowledge that share the nodes. Likewise, available data show a positive
correlation between being active in Twitter and receiving some kind of response, both in terms of
structural social capital (the more followers you have, the more followings you have) and relational social
capital (the more mentions you make, the more mentions you receive).

Measuring social capital with Twitter within the electronics and ICT cluster of the Basque Country 127
Table 21: Pearson correlation coefficient39
FOLLOWERS FOLLOWING MENTIONS IN MENTIONS OUT TWEETS Followers Following Mention in Mentions out
FOLLOWERS 1
FOLLOWING 0,9256 1 MENTIONS IN 0,0829 0,0648 1 MENTIONS OUT 0,2633 0,2338 0,7912 1 TWEETS 0,3109 0,3099 0,5643 0,7921 1 Followers 0,1367 0,2599 0,4856 0,3861 0,3999 1 Following 0,0544 0,1518 0,2270 0,2223 0,2733 0,7882 1 Mention in 0,1495 0,2691 0,5791 0,4872 0,4600 0,8879 0,5836 1
Mentions out 0,0046 0,0882 0,5979 0,5817 0,4911 0,7525 0,6948 0,7581 1
The dynamic study of interactions reveals the predominance of some central actors that form the heart
and principal arteries of the system. Nevertheless, it is also noticeable the presence of a changing bunch
of organisations with different features (some of them tweet a lot while others write less tweets but more
diversified) that give cohesion to the network, linking usernames that otherwise would not be connected
and sometimes even creating subgroups in the shape of triads.
Obviously, GAIA network is not isolated and is in contact with the whole Twitter universe. When it comes
to the inputs, data in sample 2 show that there are some individual users that exclusively retweet the
company they belong to, broadening info related to the firm as it were a marketing campaign. Despite
their high amount of tweets, they are not meaningful for the GAIA network. More attention ought to be
placed upon few amateur users that cite a wider variety of associates.
Another big trend is identified in outgoing messages, since GAIA members vastly mention Mass Media
when they publish news related to electronics and ICT. Again, this tendency should not be overestimated
since, generally speaking, it is about trivial information of public interest which is not directly related to
the cluster. From a critical perspective, it is more interesting to observe (i) how users tend to interact with
other users in their bonding area (for example, other firms from the same entrepreneurial groups) or even
the linking sphere (connections with local authorities); and (ii) the more personal content of these tweets.
Lastly, as for the semantic part of the analysis, I contrasted the most repeated hashtags and words listed
in Table 20 with the main topics compiled from the news section in the webpage of GAIA40, and what I
found is that the majority of words and firms are pretty much the same, but not the themes: in Twitter
they talk more on technological issues (BtMS, ecommerce, BigData, etc.) whereas news at the homepage
are more informative. This finding could enhance the role of Twitter as a platform to share explicit
knowledge.
6.7. Conclusions
Getting over some constraints broadly stated in the literature, this paper constitutes an original tentative
to measure social capital within the electronic and ICT cluster in the Basque Country through Twitter, one
of the most popular microblogging services nowadays. 62.99% of the associates owned an active account
39 Variables in capital letters correspond to the relation of GAIA members with the whole Twitter network; lower‐case variables refer to connections of GAIA members exclusively with other GAIA associates. The darkness of the cell indicates the strength of the correlation. 40 http://www.gaia.es/Noticias‐GAIA.html and http://www.gaia.es/Noticias‐de‐asociados.html (last seen: 10/10/2016).

128 CHAPTER 6
in February 2016 so I assume the way they interrelate in Twitter can be representative to map their
network of connections.
The analysis performed at the structural and relational level reveals a strong correlation, intra and inter
dimensionally. Particularly meaningful is the relation between intention and interaction in Twitter use at
the GAIA network (GAIA members vs. GAIA members): the most following/followed GAIA users are the
most active organisations, because there is a positive correspondence between followers and incoming
mentions (very high correlation), and also between followings and sent mentions (high correlation). In
other words, once a GAIA username is followed by another GAIA affiliate, a real contact should be
expected through mentions. These tight relations could be explained thanks to the social and
organisational proximity of the association, but other reasons may be involved as well (their geographical
proximity or simply the interest to share information about electronics and ICT).
As for the nodes, Cluster GAIA is a highlighting actor and, adopting the metaphor of Anderson and Jack
(2002), clearly acts as glue and a lubricant: the glue that binds to create a network plus the lubricant that
eases and energises network interaction. The two principal research centres of the Basque Country
(Tecnalia and IK4) also are relevant actors of the structural and relational social capital, along with some
private companies like Virtualware, Ibermatica, Pulsar Concept or Delirium Studios. Finally, if we have a
broader perspective and consider non GAIA users too, other stakeholders such as universities, institutions,
Mass Media, online communities and several individuals orbit the cluster.
I suggest that the most connected agents play a dual role. Primarily, they act as bridge nodes, helping to
set relations among others who previously did not interact with one another and thus fostering not only
the bridging but also the bonding and linking social capital of the whole cluster. Apart from that role, they
also operate as gatekeepers of knowledge and information (e.g. technology, Internet and its applications,
cloud computing, big data, innovation, entrepreneurship, companies, customer service and marketing)
that is flowing among the relevant actors (Morrison, 2008). Gatekeepers provide each of the agents with
a connectivity function that enables them to avoid the cost of maintaining side‐by‐side relations (Rychen
and Zimmermann, 2008). This requires a high level of absorptive capacity (Zahra and George, 2002) but
on the other hand endows the gatekeepers with a high level of relational capital.
This paper contributes to the literature on social capital in two different ways. First, I present the Twitter
network as a valid proxy to measure social capital, especially for clusters related to Computer Sciences
and Telecommunications. In this sense, I believe that the fact that the main topics listed in Table 20 are
directly related to the activity of the cluster adds some extra value to the representativeness of Twitter
as a proxy of social capital and particularly reinforces the significance of the samples that have been used
in this examination. And second, I give the preliminary results of this empirical exercise conducted on the
Basque Country, mapping for the first time the structural and relational linkages of users that belong to
GAIA, which may be a first step in order to improve the connectivity of the affiliates and the regional
cluster policy itself.
Limitations to this study include that some associates may not be taken into account because they are not
in Twitter. It is well known that some firms do not publicly own an account in this network, but workers
and entrepreneurs (often using an anonymous profile) follow colleagues and competitors. In practice, it
implies a real flow of information but it is almost impossible to track these interactions due to their hidden
status. Apart from Twitter (by far the most used platform according to GAIA sources), there are other
channels of communication in GAIA too, such as an extranet called WikiGAIA, a list of e‐mails or technical
committees for face to face contact, but I could not access to this data since it exceeded the confidentiality

Measuring social capital with Twitter within the electronics and ICT cluster of the Basque Country 129
of the associates. All in all, I suppose that those firms that are not in Twitter will contact other members
in a way or another and therefore will not be as isolated as this paper may suggest.
Another restriction is the fact that REST API only allows the analysis of the last 3,200 tweets and this view
could be too short‐sighted especially in the case of usernames that tweet a lot (for instance, all tweets
captured for Vodafone date from February 2016 and thus do not offer the historical perspective that this
study seeks). Finally, a further future research line might tackle the challenge to estimate the cognitive
dimension of social capital that this paper does not approach.
By measuring social capital by SNA, I have taken a dynamic41 perspective as social capital formation and
development is a cumulative process, path‐ and place‐dependent, that fluctuates with cluster and
regional performance (Staber, 2007). In any case, a great deal of further research is needed on how
networks evolve over time and space (Ter Wal and Boschma, 2009).
41 Dynamic in terms of procedure but quite static in time, since both samples have been collected in 2016.


Social capital in Eibar, 1886‐1985:
dimensions, institutions and outcomes
CHAPTER 7

132 CHAPTER 7
CHAPTER 7: SOCIAL CAPITAL IN EIBAR, 1886‐1985: DIMENSIONS, INSTITUTIONS AND OUTCOMES
This chapter is based mainly on a single authored paper accepted for publication in Investigaciones de
Historia Económica‐Economic History Research. Provisional citation:
Etxabe, I. (2018). Social capital in Eibar, 1886‐1985: dimensions, institutions and outcomes.
Investigaciones de Historia Económica‐Economic History Research (forthcoming),
https://doi.org/10.1016/j.ihe.2018.02.014
The paper, in a reduced version, focuses on the structural and relational dimensions of social capital and
is centred exclusively in Eibar. Here, however, the scope of analysis is broadened to the Deba Valley, and
cognitive elements are also taken into account.
Abstract:
It is widely accepted that the generation of knowledge and its diffusion is a relevant mechanism to
promote innovation and entrepreneurship, but many studies overestimate the importance of spillovers
and do not explain the actual dissemination of know‐how. That requires looking into social capital in order
to analyse the channels of tacit knowledge and the actors involved.
This paper tackles the role of social relationships as facilitators of the industrialisation process in Eibar, an
old industrial town of the Basque Country. From a micro level approach and applying Social Network
Analysis (SNA), co‐ownership linkages, personal relationships due to schooling, voluntary associability or
family ties between firms are investigated. The evidence shows the existence of an informal network that
constitutes a remarkable alternative for official channels of interaction and this finding, together with the
particular Eibar spirit, helps to understand the industrial dynamism of the town.

Social capital in Eibar, 1886‐1985: dimensions, institutions and outcomes 133
7.1. Introduction Making something new, improving the quality and characteristics of existing products or producing things
more cost‐efficiently are three of the ways for economic development (Westlund, 2006), but actually
innovation represents “the high road strategy” in contrast to “the low road strategy” based on relative
cost (Asheim et al., 2011). Change rather than stability is increasingly necessary in a knowledge economy,
and only the territorial production systems which are able to learn how to adapt continuously to the new
conditions remain competitive (Maillat, 2001).
Innovation is a process that highly depends on interaction, where actors operate in a context in which the
resources they need to mobilise are shared with others and actually change (Lundvall and Christensen,
2004). In this process, social links and the norms and codes associated with them play an important role.
The reason is simply that good social relations facilitate communication while absence of relations or bad
relations do not, and a sort of a shared social “capital” is needed for knowledge transfer (Lorenzen, 2007).
Thereby, more and more researchers concentrate on the complex nexus of relations and the common
store of values that provide channels for rapid dissemination of knowledge and grant a basis for co‐
operation leading to a continuous stream of improvements (Malmberg et al., 1996; Casson and Della
Giusta, 2007). Surprisingly, the room left to informal social ties in representing localised knowledge
spillovers appears to be greatly reduced (Visser, 2009), even though this channel has been widely
acknowledged by both economists (Camagni, 1991; Saxenian, 1994; Asheim, 1996; Audretsch and
Feldman, 1996) and scholars of social networks (Granovetter, 1973; Burt, 1992) as a key mechanism for
know‐how sharing. Therefore, in line with other studies that have empirically mapped knowledge
networks in agglomeration economies (Giuliani and Bell, 2005; Boschma and Ter Wal, 2007; Giuliani,
2007; Morrison and Rabelotti, 2009), the main thesis of this work is that social capital inheres in personal
relationships, easing some forms of social action while constraining others.
At the firm level, social interaction of formal and informal nature may increase business opportunities for
investors. On the one hand, business networks formed through interlocking directorates or ownership‐
based strategies are said to facilitate knowledge spillovers as well as reduce uncertainty and cost for
accessing resources (Mizruchi, 1996; Westphal et al., 2006). On the other hand, information transfer may
be redoubled if entrepreneurs make use of social relationships concerning family, friendship, vicinity,
schooling, associationism and so on (Garrués and Rubio, 2011). In this line, the objective of this paper is
triple: as a theoretical contribution, it highlights the web of relations among entrepreneurs as a key
variable to understand the formation and evolution of any economic space. From the methodological
point of view, it emphasises the potential of SNA for studying entrepreneurship in the long‐term, and
several new indicators are introduced to measure social capital. Lastly, the third objective is to verify the
relevance of informal ties as additional channels for information and knowledge dissemination.
The analysis focuses Eibar, an old industrial milieu characterised by its dynamism and capacity to
overcome several economic crises over the 19th and 20th centuries. The social structure of Eibar has been
methodologically constructed upon objective data from the Commercial Registry Office of Gipuzkoa
between 1886 and 1985, creating an extent database of more than 1,400 companies. Afterwards, this
information has been completed with primary sources of the Gunsmithing School, the Town Council and
civil associations, plus a compilation of almost 2,000 old photographs collected from residents and local
journals. For the qualitative part, a series of interviews have been carried out in order to gain information
about the Eibar spirit.
The paper is structured as follows: the second section provides the theoretical background on social
capital and presents a new approach to measure it. The third section introduces informal interaction as

134 CHAPTER 7
an alternative means for knowledge spillovers. The fourth section presents the methodology and later on
a brief history of Eibar is included to set the context of investigation. The sixth section contains the
empirical study and I close the paper highlighting the main conclusions of my research.
7.2. Dimensions of social capital
In the last decades, the theory of social capital has grown exponentially in terms of scientific articles and
its potential value for the economic development is an important reason for the awaken interest
(Woolcock, 2001; Anderson and Jack, 2002; Westlund, 2006; Malecki, 2012). The problem of including the
social perspective in economic methodology has constituted one of the classic debates presented in the
academic world (Swedberg and Granovetter, 1992) and social capital is a concept that serves to
agglutinate the problem of embeddedness, that is to say, the contribution of the social dimension to the
economy. It has become evident that there is something else which is not explained by the empirical
results from others forms of capital, and social capital seems to be the “missing link”. Actors and
institutions are linked through different kinds of relations explicit in structures or in organisation charts,
but there is another unwritten reality where agents are embedded. This has been proved to be crucial at
understanding why regions, communities, cities, certain social groups or individuals with comparable
resources and attributes have different outcomes, even when the same initiatives are carried out. The
answer can be found in culture, social relations, trust and norms, which are all about social capital.
In this line, since the mid‐1990s, a paradigmatic shift is occurring in economic geography toward a
relational economic geography, which is concerned primarily with the ways in which socio‐spatial
relations of actors are intertwined with broader structures and processes of economic change at various
geographical scales. In this relational approach, the interactions of key agents are the central spotlight of
analysis, which are viewed as operating within a context of institutions, norms and rules which condition
their choices and relations. Despite the claims of novelty among most economic geographers who have
taken on such a relational thinking in their geographical analysis, it remains unclear whether this
“relational turn” represents merely a modest reworking of earlier work in economic geography.
Furthermore, there is still little conclusive evidence on the conditions under which social capital produces
a significant difference in the performance of companies or regions (Staber, 2007), due both to the
multidimensional nature of the concept and the methodological complexities inherently involved in the
measuring process (Schmiedeberg, 2010). In any case, this perspective integrates various themes of socio‐
spatial relations that can offer an alternative understanding of major research concerns in contemporary
economic geography.
There are a variety of definitions about social capital in circulation. Three seminal contributions in the
literature provide different interpretations: an individualistic viewpoint (Bourdieu, 1986), a community
perspective (Coleman, 1988) and a macro approach (Putnam, 1993). Similar are the tripartite individual‐
group‐society (Castiglione, 2008b), the distinction of individual and collective social capital (Van Deth,
2008) or the dichotomy relational capital versus system capital (Esser, 2008). Further, other classifications
highlight the structural aspects (connections) and cultural components (norms, trust, etc.); instrumental
purposes of action (e.g. for gaining wealth, power, or reputation) or expressive strategies (e.g. for
maintaining cohesion, solidarity, or well‐being) (Lin, 2001); and the types of relational assets that people
have access to: bonding social capital (immediate family, friends, and neighbours), bridging social capital
(more distant colleagues and associates) and linking social capital (connections to people in positions of

Social capital in Eibar, 1886‐1985: dimensions, institutions and outcomes 135
authority)(Woolcock, 2001)42. These and many other approaches prove that there is a broad
characterisation in the literature and different operationalisations can be discerned as available models
rely on distinct indicators and certain components are emphasised more than others depending on the
analytical focus of the authors. (Anderson and Jack, 2002).
Among the most widely adopted is the typology of Nahapiet and Ghoshal (1998), who propose three
dimensions for social capital: structural, relational and cognitive. The structural dimension refers to the
role played by networks, i.e. with whom and how often information and resources are shared (Coleman,
1990; Moran, 2005). The skeleton of linkages, businesslike or at the personal level, may ease (or hamper)
access to resources and information exchange. A dense network can result in collective action while a
loose rapport is very likely to stop collaboration and codified knowledge transfer. The second dimension
comprises the kind of personal relationships people have built through a history of interactions. It reflects
how relations are characterised by trust and emotional intensity (Bolino et al., 2002; Moran, 2005) and is
a key factor for absorptive capacity and interactive learning. Finally, the cognitive dimension is related to
the common context quoted by individuals, such as shared language and narratives. This dimension
depends on the characteristics of the collectivity that enhance the assimilation of aggregate goals and the
subordination of personal interests to those of the group (Tsai and Ghoshal, 1998). If such a moral
harmony is reached, that can result in general reciprocity and tacit knowledge creation.
The above mentioned dimensions are not simply different features of social capital, but highly (causally)
interdependent characteristics that can act as a medium and a product of social interaction. For example,
particular structural configurations have consistently been shown to be associated with relational facets
such as interpersonal trust (Granovetter, 1985) and in the same way, a series of repeated relationships
may shape the actor’s network. Similarly, researchers have highlighted the often‐complex interrelation
between social identification and shared vocabulary and language (Mael and Ashforth, 1995). At this
point, the typical chicken‐egg discussion may arise and for the sake of clarity of exposition, I consider, in
the following analysis, the impact of each dimension of social capital independently of the other
dimensions.
Referring the issue of geographical scale, the relational economic geography privileges the local scale
because it is the most effective site in general for the coordination of socio‐economic activity and it is
where these interactions most frequently and intensely lead to innovation. Conceptually, local proximity
enables the pooling of resources, generating cost‐savings through facility sharing, optimal capacity
utilisation and reduced search costs. Not only does this proximity increase the chance of knowledge
spillovers, it also enables the formation of local conventions and institutions which further reduce the
costs of information and enhance trust (Boggs and Rantisi, 2003), as highlighted in the next section.
This proposal is in line with new schemes of work suggested lately in Spain that stress the importance of
moving from the regional vision to a more local territorial dimension, building a complementary
framework that enables a better understanding of the industrialisation process in a historical perspective.
According to Parejo (2006), cities or local productive systems are the most primary disaggregation of
available data and deserve more attention as subjects that may alleviate, even minimally, some
deficiencies and pending responses that supra‐municipal approaches do not fully address. Similarly, Rubio
and Garrués (2017) state that the regional development is led by territories of progress, as they are often
pioneers absorbing new technological, organisational and commercial patterns.
42 Lozares et al. (2011) further specify that bonding and bridging relations are horizontal (the former inwards and the latter outwards). Linking relations are also outwards, but vertical (they link nodes of different hierarchy levels).

136 CHAPTER 7
7.3. Informal interaction
In a local milieu, firms are linked to other firms and typically maintain close linkages to local research and
education facilities, governmental bodies and other important actors. These connections provide
channels for localised knowledge spillovers by means of different channels: more formal, such as
interaction between firms, suppliers and customers, collaborative research projects (between firms,
technological centres and universities), contracts of technical assistance and support, etc.; or informal or
buzz43, such as knowledge communities, social networks, transfer of graduates from universities and
technological centres to the firms, spin‐offs and labour mobility.
Being knowledge in agglomeration economies prevalently tacit, translation and socialisation processes
require close proximity and personal relationships (Kogut and Zander, 1993). Tacit knowledge is difficult
to express through codified language and therefore needs direct interaction to be transferred (Giuliani,
2005). These interactions occur in a rather unstructured, unplanned and unintentional way but are key
mechanisms for know‐how transmission (Malmberg, 2003). For example, the success of the industrial
districts in the Third Italy (Becattini, 1990) or Jutland (Kristensen, 1992) or of the high tech clusters of the
Silicon Valley (Saxenian, 1994) may primarily be a consequence of trust and diffusion of information and
knowledge associated to informal networks. Saxenian (1994) describes the formation of a technical
community in Silicon Valley, formed by technician entrepreneurs with high collective identity, as a critical
element to generate an environment of informal socialisation that boosts innovation. Some other studies
indicate that informal and oral information sources provide most key communications about the market
opportunities and technological possibilities that lead to innovation (Casson and Della Giusta, 2007).
According to Utterback (1974), the unanticipated, or unplanned personal encounters often turn out to be
most valuable. In response to a survey question asking if informal forms of communication (word of
mouth/gossip) are important as sources of information for business development, the overwhelming
majority of firms, 86.5%, indicated that this was the case.
Not all academics agree with this point of view. Breschi and Lissoni (2009) cast some doubts on
conventional wisdom that assigns great importance to more informal, non‐market related knowledge
exchanges such as those originating from kinship, friendship and social gatherings. Tödtling et al. (2009)
compared the knowledge networks associated with radical and incremental innovations, and they
concluded that the effect of informal ties is not evident nor for upgrading the existing products of a given
company, neither for changing significantly the structure of the market. Jenkins and Tallman (2010) argue
that knowledge flows are more effectively conveyed between formal alliance partners, even within a
cluster, as this type of channel is more productive than those between partners based upon informal
interactions. Finally, Morrison (2008) finds that informal contacts are far less pervasive than suggested by
conventional approaches because they mainly serve to exchange generic information rather than know‐
how.
All in all, the truth is that the room left to informal social ties in explaining localised knowledge spillovers
appears to be greatly reduced. Westlund and Adam (2010) collected information about 65 studies of the
relationship between social capital and economic performance, and 30 (46%) intended to measure the
role of informal contacts in one way or another. Nevertheless, the majority infer the effect of association
membership or the entrepreneurs’ social network in growth measures through regressions or correlation
analysis but do not explain the actual dissemination of knowledge. That requires looking into social capital
in order to analyse the channels of knowledge transfer and the participating actors.
43 Buzz refers to the knowledge exchange resulting from a variety of informal local relationships.

Social capital in Eibar, 1886‐1985: dimensions, institutions and outcomes 137
Lately, interlocking directorates have been the object of numerous studies and academic papers. In Eibar,
however, SMEs predominate and firms have not normally interacted by appointing a leader from a firm
to serve on the focal board. Instead, CEOs have usually shared the ownership of several companies,
contacting each other through formal and informal linkages that, in many cases, have led to strong
relationships implying trust. In that vein, this investigation is initially based on the fundamental premise
that co‐investors have common objectives and a certain degree of social interaction that can positively
impact on knowledge dissemination and business creation. This idea has inevitably nurtured the need of
illustrating the local business network in a longitudinal perspective, similar to what has been done in the
vicinity town of Elgoibar by Andonegi and Arrieta in 2014 (see Appendix 18)44. Therefore, the first research
question dwells on it:
RQ#1: Can co‐ownership ties be used to reflect the existence of structural social capital in Eibar? In
particular, which is the historical pattern of joint partnership and who are the most relevant actors?
A further challenge tackled in this study arises as a result of the previous question. Apart from ownership‐
based linkages, there are other mechanisms by which the corporate elite is integrated or by which
information spreads among firms. The second research question then aims to approach this issue,
formulated as follows:
RQ#2: What other personal relationships have been developed in Eibar among top executives? And to
what extent do joint ownerships actually reproduce this deeper set of social relations?
Finally, people in Eibar are known to have a special character that may engage them in tight relationships
that influence in their ability to create intellectual capital. Accordingly, it would be appropriate to analyse
the shared cognition of Eibar and identify the facets through which cognitive social capital is promoted.
Ergo, the third research question is:
RQ#3: Which elements of the cognitive dimension explain the industrial dynamism of Eibar?
7.4. Methodology
As stated so far, this study involves a study in 3 different dimensions. In the structural analysis, joint
shareholders have been studied with data from the Commercial Registry Office in San Sebastian.
Economic historians generally agree that this is an appropriate source for measuring capital formation
and investment prospects in a particular geographic area (Jiménez Araya, 1974). Indeed, the creation of
companies is a great proxy of the entrepreneurship in a community, because it demands not only the
prior establishment of a relationship, but also other factors such as recognising a business opportunity,
trying to solve the possible technical limitations, achieving funding, and, finally, starting the organisation
and running the new project (Garrués and Rubio, 2011). In that respect, the province of Gipuzkoa was,
along with Bizkaia, one of the most dynamic provinces in Spain regarding the creation of public limited
companies during the period of study (Valdaliso, 1988, Catalán et al., 2017).
The fact that the industry in the Deba Valley has very few large corporate structures discourages the
option to use boards of directors as isolated elements to determine the degree of business cohesion.
44 Elgoibar, located 5 kilometres away from Eibar, celebrated in 2014 the 100 anniversary of the machine tool industry in the town and a group of history fans traced the network of local actors (companies, council, school, banks, associations…) that have contributed to uphold the sector.

138 CHAPTER 7
Notwithstanding, the predominance of limited and family partnerships suggests the opportunity to study
the business links among associates that are registered in the Commercial Registry Office as co‐founders
of a company.
In an effort to systematise the analysis, several prior constraints were implemented for data collection.
First, I only considered companies that were located in 7 municipalities of the Deba Valley: Mutriku, Deba,
Mendaro, Elgoibar, Eibar, Placencia, Bergara and Mondragon. Second, the longitudinal analysis comprises
a century and begins in 1886, when the first companies were registered in the Commercial Registry Office
of San Sebastian after the promulgation of the new Code of Commerce in 1885 (Herrero Pascual and
Montojo, 2002). And third, firms are only tied through individuals that participate in more than one
company, excluding subsidiaries or blood relations that may exist among a particular associate and other
relatives. The subsequent dataset has been completed with information of the Registry of Cooperatives
of the Basque Government. Cooperativism is a phenomenon that is very rooted in the Basque Country
(especially in Mondragon and its surroundings) and a study of these characteristics could not ignore this
source of information. On the contrary, the great amounts of self‐employed labourers of the valley have
not been considered in this study for simplifying the research process. That means that, from now on, any
time that I mention a firm, I am referring to a registered firm.
In total, I obtained information about 1,437 companies for the period 1886‐1985. Once the empirical basis
was set, I undertook the process of homogenisation of the data, eliminating the effects of variations in
the naming or legal form of companies to avoid duplications. Later on, the companies were classified
according to their activity, following the CNAE, that is, the National Classification of Economic Activities (2
digits)45. Due to the empirical complexities of investigating such a big sample corresponding to the Deba
Valley, and at the same time, considering the special case of Eibar as a historical industrial milieu, I decided
to concentrate my study on this town from this point on, leaving the final number of companies in 537. I
acknowledge that this decision entails the loss of a general perspective of the whole valley, but on the
other hand, it facilitates the identification, visualisation and explanation of linkages and actors in the local
knowledge system in Eibar.
The second part of the analysis is devoted to study other type of informal networks in Eibar. To this end,
I contacted various educational and civil associations in the town and collected historical membership
data in various forms (a sequence of Boards of Directors, a list of members in a given moment, etc.).
Finally, I crisscrossed this information with the dataset extracted from the Commercial Registry Office and
I managed to find out if any of the participants in these associations were/had been entrepreneurs. At
this point, it should be noted the difficulties for the identification of each individual, a key aspect for
establishing the corporate relationships between them. Apart from transcription errors or the typical
problems of indiscriminate use of b/v or i/y (depending on if the referent language was Basque or Spanish,
respectively), there are some common surnames that could lead to confusion, like Echevarria or
Echeverria (written with a in Bizkaia and e in Gipuzkoa). Besides, there are many double surnames that
sometimes appear fully (Arizmendiarrieta) and some other times shortened (Arizmendi). Therefore, to
avoid matching errors, I have tried to work with 2 surnames as far as possible, and in case of doubt, I have
sought to obtain extra information to clarify the identity of the corresponding person.
All linkages of the civil society, as well as the ownership‐based connections mentioned before, have been
mapped through SNA, a discipline that explores the patterning of relations among social actors (Breiger,
2004). From the data of those relations is possible to analyse the positions of certain actors and the
45 To check the list, see http://www.cnae.com.es/lista‐actividades.php (last seen: 11/03/2017). There are quite a lot of similar subsectors that I have grouped together for this study. The final classification is displayed in the caption of Figure 20.

Social capital in Eibar, 1886‐1985: dimensions, institutions and outcomes 139
existence of groups, leading to a better understanding of that social structure and highlighting the links
through which occurs a constant flow of resources. In short, SNA will allow us to visualise linkages and to
shed light on the different roles actors play in the local knowledge system, and the findings that we can
obtain may be an excellent proxy of the existing social capital in Eibar during the period of analysis.
For the cognitive part, I first met Nerea Alustiza, ex councillor at the Town Council in Eibar and one of the
authors of “Eibar: ciudad taller – tailer hiria”, a book that combines texts and photographs of 84 old
factories that are still standing in Eibar. Later on, I interviewed Danel Zenarruzabeitia (89, co‐founder of
Industrias DEJ) and Lorenzo Zabala (90, former corporate manager at Motobic) who kindly provided me
with precise information about stories they have heard and multiple experienced they have lived. Finally,
I performed an exhausting bibliographic revision to complete a deep analysis of the so‐called “Eibar spirit”.
I then combined all this information with other documentation and testimonies gathered while I
contacted several associations for my fieldwork.
7.5. Eibar: a short history of a smart town
The historical process of modernisation of the Basque Country began in the mid‐nineteenth century in
the two maritime provinces (Bizkaia and Gipuzkoa), with a great diversity of trajectories. In Bizkaia, the
Bilbao area became a major industrial metropolis. This industrialisation was linked to the basic sectors of
the new industrial capitalism such as the iron and steel industry, a strong financial sector and services.
The interests of the Basque and Spanish capitalism converged with capital from Europe, especially the UK,
and they invested mostly in large public limited companies. Simultaneously, a few kilometres further,
another industrialisation model emerged in the eastern part of Bizkaia and the province of Gipuzkoa.
Here, contemporary industry began in scattered towns that were transformed into small and medium‐
sized industrial cities. In some production branches, there was a pre‐capitalist artisan tradition that helped
to familiarise the workforce with manufacturing activities. Additionally, innovations from England were
gradually incorporated into economic domain, thanks to a certain accumulation of capital. From these
bases flourished the oncoming small and medium industrial enterprises, the real motors that made the
industrialisation of this part of the Basque Country happen (Valdaliso, 2003 and 2006).
In Gipuzkoa, the Deba Valley is one of the important industrial areas of the twentieth century, specialised
mainly in metallurgical activities. It is located at the west side of the province of Gipuzkoa and is based on
the Deba river basin (hence its name), which is 55 kilometres long. It is divided into two regions: High
Deba, bordering south with Alava and with Mondragon and Bergara as the main municipalities, and Low
Deba, the lower part of the river until its ending in the Bay of Biscay, where Eibar is the head town.
The availability of natural resources played an important role in the progress of the valley. The hydraulic
force of the Deba river welcomed forges located along its banks since ancient times, and the rugged and
mountainous terrain allowed access to plenty of wood and minerals (iron and coal). Besides, the route
drawn by the old stream for centuries facilitates the presence of a road network linking Vitoria with the
coast of Gipuzkoa, and in spite of its narrowness, the valley is well connected with its surroundings. The
relative earliness of railway construction projects was significant in the evolution and modernisation of
the valley, too. In 1882 the Bilbao‐Durango line was put into operation, five years later the railway network
between Durango and Zumarraga opened, and finally, in 1897, the construction of the branch Maltzaga‐
San Sebastian was completed, heading to the capital of the province. This allowed the Deba Valley to act
as a link between the other two industrial basins in Gipuzkoa (the Oria, specialised in paper and
metallurgy, and Urola, furniture) and the Estuary of Bilbao, the other Basque industrial axis.

140 CHAPTER 7
After the first industrialisation attempt, a clear specialisation was established in terms of the geographical
location of the valley: in High Deba, Mondragon and its surrounding specialised in locking industry and
the area of Bergara in textile manufacturing, while the metallurgical industry remained strong in Low
Deba, especially in Eibar and Elgoibar. On the coast, canning industry prospered in Mutriku and new
shipyards opened in Deba. Additionally, it must be pointed the strengthening of the tourism sector related
to the sea baths and hot springs.
Figure 17: Main towns in the Deba Valley
Source: www.gipuzkoa.net and self‐elaboration.
Eibar, the most populated town in the Deba Valley, has based its main economic activity on iron
manufacturing since ancient times, which eventually derived into a strong fire‐arming industry. After the
War against the Convention (1793‐94), the Crown decided to move away the manufacture of arms from
the French border, creating a new factory in Trubia (Oviedo) that gradually assumed most of the orders
of the State. As a result, the Royal Factory in Soraluze‐Placencia de las Armas, which had a monopoly in
the manufacture of weapons, was finally closed in 1865 (Goñi, 2010). Simultaneously, a new law declared
the freedom of weapon manufacture in 1859, contributing to the elimination of the guild system
prevailing in the sector, which significantly lowered the barriers to entry and multiplied the number of
firearming companies in the town.
Bergara
Mondragon
Mutriku Deba
Elgoibar
EIBAR
Mendaro
Placencia
GIPUZKOA

Social capital in Eibar, 1886‐1985: dimensions, institutions and outcomes 141
This first stage of the industrialisation process in the second half of the 19th century was characterised by
the necessary and gradual replacement of old pre‐industrial manufacturing structures by the new
industry. The traditional model of steelmaking was exhausted and many firms in Eibar moved from sectors
producing consumer goods towards intermediate goods and the equipment needed to manufacture
them. The local bourgeoisie and foreign investors actively promoted the implementation of the factory
system. Later on, capital flows coming from Bizkaia increased, but industrialisation was achieved without
a dominant presence of banks nor large industrial corporations.
Ever since, this industrial growth has been compatible with small sized businesses, but the reduce volume
of capital did not prevent firms in Eibar from manufacturing innovative outputs, especially due to “know‐
how” imports. Technicians and workers from France, Catalonia or other European countries introduced
new methods of production designed in central capitalist countries. The relatively accelerated process of
electrification that experienced the valley in the 1890s had also a decisive influence on this takeoff,
reducing significant limitations on the supply side. Finally, during the period between the so‐called "Great
Depression" and World War I, the firearms industry found a favourable moment to expansion,
experiencing one of the rare cases of "export‐led growth" at that time. In fact, in 1900 it exported more
than 90 percent of output (Catalán, 1990). The main markets were in Latin America, especially in Mexico,
but it also exported to Greece, Turkey, Russia and the USA.
Peace and the consequent slump in demand by the conflicting powers evidenced the need for
diversification, and Eibar proved its capacity to discover and exploit new domains and technologies that
eventually have resulted in new sectors and new firms. As Figure 18 shows, the number of gunsmiths
decreased massively and was replaced by an emerging equipment industry producing small home
appliances, sewing machines and bikes before the Spanish Civil War. From the 1940s on, the advent of
the machine tool industry both strengthened the machinery demand and boosted a hardware sector
manufacturing automotive parts and all type of ironmongery items (Urdangarín and Aldabaldetrecu,
1982).
Figure 18: Industrial taxpayers by economic activity
Source: self‐elaboration based on Industrial Licence data obtained from the Municipal Archive of Eibar and the Provincial Archive of Gipuzkoa.
0
50
100
150
200
250
300
350
1904 1914 1924 1934 1944 1954 1964
Firearming
Iron and steel industry
Ironmongery and screws
Equipment

142 CHAPTER 7
Eibar nowadays keeps a significant industrial activity (33% of occupied population was employed in
industry in 2011, according to Eustat46) and hosts one of the main technology centres of the Basque
Country: Tekniker‐IK4. It has recently been awarded the title of City of Science and Innovation by the
Spanish Ministry of Science and Technology in 2010.
7.6. Analysis of social capital in Eibar
7.6.1. Structural analysis
7.6.1.1. Co‐ownership ties
The first research question points to co‐partnership since social interaction among co‐investors may have
positively impacted on knowledge dissemination and business creation. For that purpose, the next graph
encompasses investments performed in companies at the Deba Valley between 1886 and 1985. The
underlying idea is: if a given person invests in two companies, these are tied. In order to detect easier the
existent co‐ownership ties in the valley, companies have been grouped by their corresponding
municipality and, at the same time, municipalities have been placed according to their location47.
Figure 19: Co‐ownership ties in the Deba Valley
Generally speaking, local investment prevails in almost all cases. Between municipalities, the spatial proximity plays an important role and there is a tendency to co‐invest in companies located nearby. In this sense, the axis Deba‐Elgoibar‐Eibar‐Placencia‐Bergara (situated in the centre of the valley) highlights above others, with Eibar as the main integrating element. In fact, as in can be seen in Table 22, 54.71% of the co‐ownership ties in the Deba Valley have to do with Eibar, and 44.41% of the links represent Eibar‐Eibar relationships (an Eibar citizen investing in Eibar). Actually, this figure suggests a deeper analysis of
46 See: http://www.eustat.eus/udalekoa/pxweb/es/udalekoa/‐/PX_Eibar_c.px#axzz4kcLpsnQj (last seen: 21/06/2017). 47 The case of Mutriku and Mondragon is an exception. They are aside in Figure 19 but actually are situated at the north and south corner of the valley, respectively.
Bergara
Mondragon
Mutriku
Deba Elgoibar
EIBAR
Mendaro
Placencia
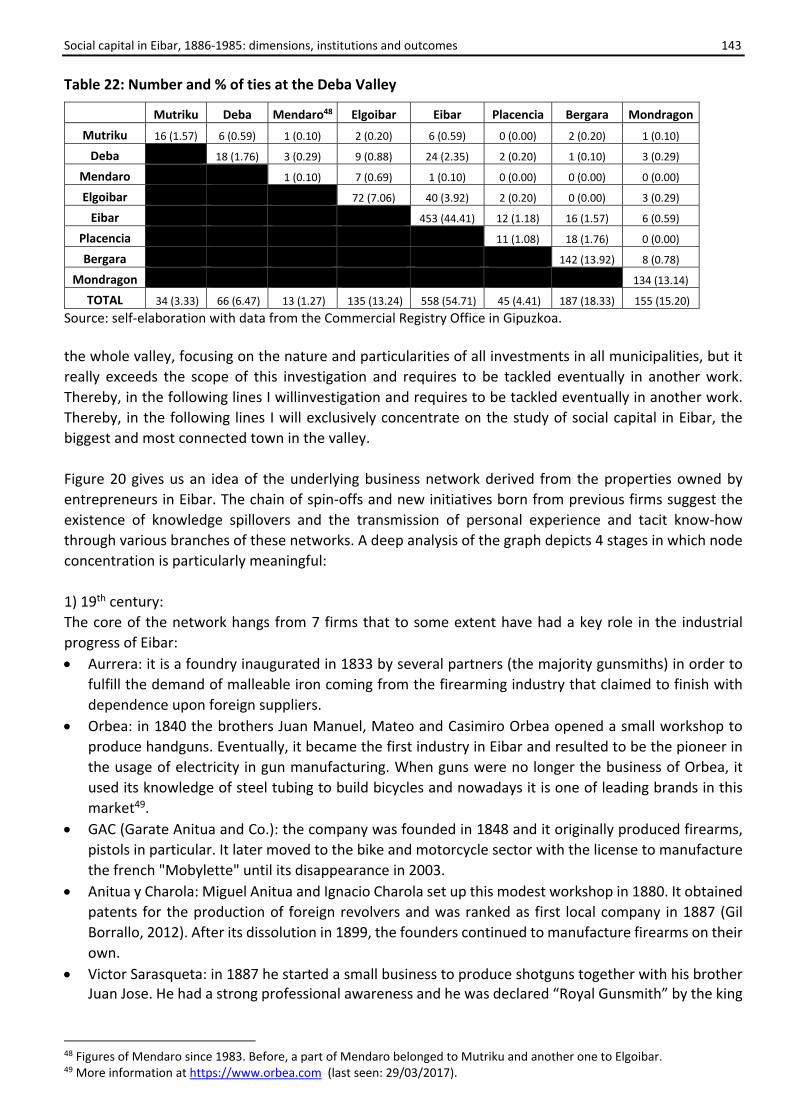
Social capital in Eibar, 1886‐1985: dimensions, institutions and outcomes 143
Table 22: Number and % of ties at the Deba Valley
Source: self‐elaboration with data from the Commercial Registry Office in Gipuzkoa.
the whole valley, focusing on the nature and particularities of all investments in all municipalities, but it
really exceeds the scope of this investigation and requires to be tackled eventually in another work.
Thereby, in the following lines I willinvestigation and requires to be tackled eventually in another work.
Thereby, in the following lines I will exclusively concentrate on the study of social capital in Eibar, the
biggest and most connected town in the valley.
Figure 20 gives us an idea of the underlying business network derived from the properties owned by
entrepreneurs in Eibar. The chain of spin‐offs and new initiatives born from previous firms suggest the
existence of knowledge spillovers and the transmission of personal experience and tacit know‐how
through various branches of these networks. A deep analysis of the graph depicts 4 stages in which node
concentration is particularly meaningful:
1) 19th century:
The core of the network hangs from 7 firms that to some extent have had a key role in the industrial
progress of Eibar:
Aurrera: it is a foundry inaugurated in 1833 by several partners (the majority gunsmiths) in order to
fulfill the demand of malleable iron coming from the firearming industry that claimed to finish with
dependence upon foreign suppliers.
Orbea: in 1840 the brothers Juan Manuel, Mateo and Casimiro Orbea opened a small workshop to
produce handguns. Eventually, it became the first industry in Eibar and resulted to be the pioneer in
the usage of electricity in gun manufacturing. When guns were no longer the business of Orbea, it
used its knowledge of steel tubing to build bicycles and nowadays it is one of leading brands in this
market49.
GAC (Garate Anitua and Co.): the company was founded in 1848 and it originally produced firearms,
pistols in particular. It later moved to the bike and motorcycle sector with the license to manufacture
the french "Mobylette" until its disappearance in 2003.
Anitua y Charola: Miguel Anitua and Ignacio Charola set up this modest workshop in 1880. It obtained
patents for the production of foreign revolvers and was ranked as first local company in 1887 (Gil
Borrallo, 2012). After its dissolution in 1899, the founders continued to manufacture firearms on their
own.
Victor Sarasqueta: in 1887 he started a small business to produce shotguns together with his brother Juan Jose. He had a strong professional awareness and he was declared “Royal Gunsmith” by the king
48 Figures of Mendaro since 1983. Before, a part of Mendaro belonged to Mutriku and another one to Elgoibar. 49 More information at https://www.orbea.com (last seen: 29/03/2017).
Mutriku Deba Mendaro48 Elgoibar Eibar Placencia Bergara Mondragon
Mutriku 16 (1.57) 6 (0.59) 1 (0.10) 2 (0.20) 6 (0.59) 0 (0.00) 2 (0.20) 1 (0.10)
Deba 18 (1.76) 3 (0.29) 9 (0.88) 24 (2.35) 2 (0.20) 1 (0.10) 3 (0.29)
Mendaro 1 (0.10) 7 (0.69) 1 (0.10) 0 (0.00) 0 (0.00) 0 (0.00)
Elgoibar 72 (7.06) 40 (3.92) 2 (0.20) 0 (0.00) 3 (0.29)
Eibar 453 (44.41) 12 (1.18) 16 (1.57) 6 (0.59)
Placencia 11 (1.08) 18 (1.76) 0 (0.00)
Bergara 142 (13.92) 8 (0.78)
Mondragon 134 (13.14)
TOTAL 34 (3.33) 66 (6.47) 13 (1.27) 135 (13.24) 558 (54.71) 45 (4.41) 187 (18.33) 155 (15.20)

144 CHAPTER 7
Figure 20: Co‐ownership ties in Eibar (1886‐1985)
Source: self‐elaboration with data from the Commercial Registry Office in Gipuzkoa. Notes: ‐ Line strength indicates number of people investing in the companies tied. ‐ Size of nodes represents degree centrality. ‐ Isolated nodes, dyads and triads have been removed to facilitate visualisation. ‐ The different colours refer to the following economic activities:
Intermediary services Hotels, discos, bars
Leisure activities Food and drinks
Merchandising Painting and decoration
Construction Textiles and dyeing
Firearms Iron and steel industry
Ironmongery and Lighting and fueling
Machinery and Transport
Furniture, carpentry Others
Alfonso XIII due to the high quality of his products. After the Civil War, his son continued with the
company until its closure in 1992.
Jose Cruz Echeverria e hijo y Badiola: Jose Cruz Echeverria and Vitoriano Badiola started this firearming
company in 1892. The son of the former (Bonifacio) later created a firm called Star which
manufactured small arms and eventually turned one of the most renowned ambassadors of the
industry in Eibar. It closed in 1997.
La Eibarresa: in 1893, 114 partners (mainly gunsmiths) promoted the creation of this public limited
company with the intention of manufacturing shotgun barrels that were previously purchased abroad.
It faced several co‐ordinating problems and its activity lasted a few months (Bustinduy, 1894).
As it can be seen, all these tractor companies belong to the firearming industry (the unique exception is
Aurrera, but it produces iron for gunsmiths) and that proves the importance of this sector in Eibar during
the 19th century. Another worth mentioning feature is the high number of members of several
companies, and subsequently, the large list of owners that some of them shared (as indicated by the
thickness of the arrow, there were many investors who were partners of Aurrera and La Eibarresa at the
1886
1985

Social capital in Eibar, 1886‐1985: dimensions, institutions and outcomes 145
same time). This might be due to the central interest of some investments or the difficulty of individuals
for the accumulation of financial capital by themselves.
2) Post World War I era:
If we go down in the Y axis, a bunch of actors stands out around 1920, coinciding with the end of World
War I. Like it has been commented so far, the cease of the conflict had negative consequences for the
economy in Eibar and that provoked the related diversification of some key companies or the naissance
of spin‐offs oriented mainly to the equipment industry or ironmongering, where many ancient gunsmiths
invested. Bit by bit, companies began to create new industrial activities that went beyond the
manufacture of pistols, revolvers or rifles and this process crystallised in many local companies directing
towards the manufacture of new products such as bicycles (Orbea, GAC and BH) or razor blades
(Artamendi). On the other hand, many firms that decided to stay in the firearming sector pursued an
economic specialisation of their activity. For instance, Victor Sarasqueta opted to manufacture high
quality hunting shotguns while Star preferred to produce pistols for the army and the police.
Paralelly, particularly meaningful is the emergence of the first cooperatives in this period: Cooperativa
Electrica Eibarresa (1918) for supplying electricity to the associated firms, and especially Sociedad
Anonima Cooperativa de Producción de Armas de Fuego Alfa (1920), the first industrial cooperative in the
Basque Country which initially produced firearms but soon changed into sewing machines with huge
success. Eventually, Alfa became the most important company of Eibar but it preserved its cooperative
and social character. This fact converted Alfa more than a workplace: it turned almost a symbol of a way
of being and understanding the labor and social relations for a whole generation of people in Eibar.
3) The period after the Spanish Civil War:
Despite the economic autarky set up by Franco, new industrial sectors emerged in Eibar during the 40s,
such as the manufacture of machine tools. In general terms, the development of these new sectors was
based on a number of common factors: the existence of related industries and sectors that provided the
required entrepreneurship, qualified labor and skills, and the emergence development of a new market
or business in an economy like Spain protected from abroad and with a large potential for growth. The
first machine tool manufacturers had emerged in the Basque Country in the first decades of the century,
copying German and American models of machines used in the manufacture of weapons, but it will be
from the 1940s onwards that the growth and consolidation of the sector will begin. Companies like ABC
(a former firearming firm) or Industrias AGME in Eibar, together with other producers in the vicinity
(especially in Elgoibar) converted Gipuzkoa the main producer region in Spain since more than 35% of the
companies in the sector were located there in the 1960s (Urdangarín and Aldabaldetrecu, 1982).
Starting in the 1950s, the Basque economy experienced a strong economic growth led particularly by the
sectors of the previous industrialisation (iron and steel, products and metal processing, construction of
machinery and transport material, chemistry and paper) which maintained or increased their importance
in the industry as a whole and contributed to the emergence and development of new related sectors.
For instance, the auxiliary automotive industry experienced a rapid development and in Eibar, some
companies in the metal processing sector took advantage of their resources and capabilities in this sector
to specialise in the manufacture of parts and components for an automotive industry (Norma, Amaya
Telleria, etc.). Simultaneously, an industry for the manufacture of household appliances was forged in an
identical way as companies benefited from the existence of external economies derived from past
industrial development and an increasing internal demand. Well‐known brands like Solac or Ufesa were
born in Eibar at this stage.

146 CHAPTER 7
4) Sixties and seventies
After the Stabilisation Plan set up by the Franco regime in 1959, Eibar welcomed a period of
industrialisation and prosperity. New business opportunities arose and some investors moved into related
activities like the machine‐tool industry or screwing. Unrelated diversification attempts were also
performed to enter in the leisure or transport sector.
The relatively abundant, cheap and qualified labour force is one of the explanatory factors of the industrial
development of this period. Between 1960 and 1975 the Basque Country was the region, along with
Madrid, which experienced a higher population growth, motivated by the arrival of immigrant population
and strong natural growth (Fundación BBVA, 1997). Eibar was one of the most striking cases of this
exponential increase of the population as can be seen in the following chart:
Figure 21. Population of Eibar (1842‐2015)
Source: self‐elaboration from INE (https://www.ine.es) and Eustat (https://eustat.eus).
This demographic boom was stopped in the 70s by the petroleum crisis that hit the local economy but
especially by the industrial exodus. The demand for house construction left no room for the growth
expectations of some companies and many abandoned the congested area in Eibar to search of abundant
and cheap industrial land in nearby locations. Camas Astaburuaga first moved to Vitoria in 1948 and it
was followed by BH in 1959. The eastern part of Bizkaia, from Ermua to Durango, absorbed almost 50%
of the migrating workplaces (Carbureibar and GAC settled down in Abadiño, Orbea went to Mallabia, and
so on), while some other firms preferred to locate in other provinces (Simes in Navarra, Nicolas Correa in
Burgos, Bueno Hermanos in La Rioja, and so on) (Zabala, 2011).
There is another concentration of nodes in late 70s and early 80s, coinciding with the death of Franco in
1975 and the establishment of a regional government that promoted business creation. The new cabinet
devoted to helping the region’s businesses to survive and assisting mergers to grow. Meanwhile, the
Agency for the Promotion and Restructuring of Industry (SPRI) focused on pushing Basque exports,
internationalisation, and entrepreneurship and it especially concentrated on fields like machine and hand
tools, metal products, firearms, and papermaking, all heavily comprised of small and medium enterprises.
As the economy gradually began to recover and integrate into European markets, a bunch of new start‐
ups were settled down in Eibar and business creation reached levels unknown since early in the century
(see Figure 22). On the other hand, the collapse of the Soresko project (later denominated Diarm) resulted
the biggest downside for the town. It grouped several firearming companies in 1982 in order to
0
5000
10000
15000
20000
25000
30000
35000
40000
1842 1857 1860 1877 1887 1897 1900 1910 1920 1930 1940 1950 1960 1970 1980 1990 2000 2010 2015

Social capital in Eibar, 1886‐1985: dimensions, institutions and outcomes 147
restructure the industry but it did not succeed, strengthening the slump of the sector (Urdangarín, 1986;
Velasco and Zabalo, 1987).
7.6.1.2. Other structural networks
a) The Gunsmithing School
When speaking about the industrialisation process in Eibar, there are many examples of citizen
participation but the creation and performance of the Gunsmithing School is, without any doubt, the best
example to illustrate it. At the beginning of the 20th century, young workers used to enter in the factories
in order to learn the skills of a certain craft and remained there non‐paid as trainees up to four years.
Figure 22: Evolution of firm creation in Eibar (c. 1886‐1985)
Source: self‐elaboration with data of the Commercial Registry Office of Gipuzkoa.
Aware of the technical handicaps of these workers when they entered the factories, in 1910, a group of
manufacturers and other entrepreneurs called Ezkuadra Zarra50 proposed to the council the creation of
a school for some traditional jobs and specialties of the industry in Eibar. The idea was to combine this
practical training with technical and theoretical education, acquiring pieces of knowledge that went far
beyond the abilities that could be obtained simply serving as apprentices and thus familiarise them with
the most modern production methods.
In order to look for a specific model, Pedro Goenaga, armourer and councillor at the Town Council, visited
several schools of craft in Spain and Europe. On 7 June 1911, during a congress of Proof Houses in Liege,
he stopped by the "Ecole d'Armerie" where he found what he was looking for. He then collected the
corresponding information and began to make the necessary steps for fundraising. The first financial aids
came soon: the provincial government announced an annual grant of 3,500 pesetas and the Senate
donated 12,000 pesetas (Revista Eibar, #28951).
On 1 July 1912 the council of Eibar approved the proposal of Pedro Goenaga to open a School of
Gunsmithing, Drawing, Arts and Crafts, and a permanent exhibition of local fire‐arming products in a
museum. On 1 October 1912, the Statutes and Regulations were agreed and its future construction was
50 More information about this group is compiled in section Friendship. 51 https://egoibarra.eus/es/publicaciones/revista‐eibar/II_87_feb_289 (last seen: 24/03/2017).
0
20
40
60
80
100
120

148 CHAPTER 7
determined. On 6 January 1913 the first school year started in a space enabled at the old fronton while
the first stone of the new building was put in its definitive location. The first director of the centre was
Jose Carnicero, still provisionally, and on 24 June 1914 Julian Echeverria officially inaugurated the school.
The property of the school was municipal and its character purely popular. All councillors and
representatives of the local Proof House as well as several businessmen of major local companies were
included in the first governing board (see Appendix 19). The Executive Committee comprised four
delegates of the council, two members representing the employers and one standing for the workers.
Successive compositions of this committee keep the diversity of representatives participating in this
board, even during Franco's regime. It is noteworthy that, when he accessed to power in 1936, these sort
of civil participating organs were abolished but exceptionally, the Gunsmithing School was allowed to
reconstruct its direction and preserve its municipal nature.
The Gunsmithing School soon became a success story. It was the first professional school where learning
a profession was combined with theoretical education and as its reputation grew, it attracted students
not only from Eibar but also from other provinces in Spain.
Figure 23: Students entering at the Gunsmithing School (1913‐2012)
Source: self‐elaboration with data provided by the Gunsmithing School.
There are various examples that define the Gunsmithing School as the authentic motor of the industry in
the region of Eibar. In 1962, when celebrating the 50th anniversary of the school, several entrepreneurs
(the majority former students) wrote dedications with similar mentions in a special issue published on
this occasion. Here I show some examples:
ARIZAGA, BASTARRICA Y CIA (ABC)
Efusivamente a la madre de la Industria Eibarresa.
Effusively to the mother of the industry in Eibar.
TOWN COUNCIL OF EIBAR
A nuestra veterana Escuela de Armería, pionera de la formación profesional española, vivero de maestros y
capitanes de empresa, clave del progreso técnico‐industrial de la zona armera y legítimo orgullo de la Ciudad de
Eibar […].
To our veteran Gunsmithing School, pioneer among Spanish professional training schools, nursery of company
managers and entrepreneurs, key in the technical‐industrial progress of the fire‐arming zone and legitimate pride
of Eibar.
0
50
100
150
200
250
300
350
400
450
500
1913
1916
1919
1922
1925
1927
1930
1933
1938
1941
1944
1947
1950
1953
1956
1959
1962
1965
1968
1971
1974
1977
1980
1983
1986
1989
1992
1995
1998
2001
2004
2007
2010

Social capital in Eibar, 1886‐1985: dimensions, institutions and outcomes 149
EGASCA
A la Escuela de Armería que ha ejercido una influencia definitiva y permanente sobre la industria de Eibar,
capacitando sus dirigentes y productores con una preparación técnica, cultural y moral que se refleja en la vida de
nuestro pueblo.
To the Gunsmithing School that has exerted a definitive and permanent influence on the industry of Eibar,
training its leaders and producers with a technical, cultural and moral preparation that is reflected in the life of
our town.
In 1963, in an article published in the bulletin (#30)52 of the former students of the Gunsmithing School,
Manuel Guisasola, a former student of the school and co‐founder of the local firm “Ereña y Guisasola”,
cites a short list of some of the most relevant local companies published in the journal “Eibar” (#42)53, and
he blames to the school the creation of these and other 500 companies in the region.
The role of the school is not restricted exclusively to its technical contribution since it has been a channel
for multiple interactions among local companies. In Figure 24 I show connections among entrepreneurs
originated from the Gunsmithing School, that is to say, alumni that have started a business registered in
Eibar.
Figure 24: Network of entrepreneurs originated from the Gunsmithing School
Source: self‐elaboration with data from the Commercial Registry Office of Gipuzkoa and the Gunsmithing School.
If 2 persons (identified with name and 2 surnames) belong to the same school year at the Gunsmithing
School and later on they appear to be members of different companies (according to data available at the
Commercial Registry Office), these ones are tied. In total, 190 firms are tied (35.38% of all registered firms
in Eibar) in 813 ties. As an average, a former student of the Armeria Eskola is registered at the Commercial
Registry Office 27 years after finishing school, so that means that, in general terms, it takes almost 3
decades to get enough resources (knowledge, funding, contacts...) to start a business.
52 http://hedatuz.euskomedia.org/7680/1/0030.pdf (last seen: 12/04/2017). 53 http://egoibarra.eus/es/publicaciones/revista‐eibar/ii_61_mayo‐jul_42.pdf (last seen: 07/05/2017).
Equipment
Construction
Ironmongery
Firearms
Iron and steel
industry
Commercial

150 CHAPTER 7
These interactions among schoolmates boosted with the creation of the Association of Alumni54
(Asociación de Antiguos Alumnos, AAA henceforth). Paradoxically, the organisation of funerals on the
occasion of the death of one of the most beloved teachers (Pío Zulaica) definitively propelled the creation
of the association with an official character. A committee was set up to initiate the first proceedings of
constitution, formed by Julio Anitua Alberdi, Jose Iriondo Vildosola, Alberto Mendiguren Eguiguren,
Enrique Franco Albizuri, Javier Echeverria Eguren and Jose Maria Cruceta Alberdi, all of them alumni and
entrepreneurs of influential companies of the time. On May 3, 1951, a general meeting was held where
the association was definitively constituted in order to "strengthen the ties of friendship among former
students, defend the interests of the School and improve the Professional Training" (Article 2 of the AAA
Statutes). They decided to set a monthly fee of 3 pesetas, create a bulletin, establish a mutual insurance
and name the first Board of Directors (BoDs). This and the successive governing committees of the
association have grouped representatives of the Gunsmithing School and entrepreneurs of the region. As
an example, I list in Appendix 20 the members of the BoDs of the AAA in 1972, who belong to 18 different
companies.
Since its foundation, AAA has organised various activities for its associates. One of the main lines of action
was the technical support offered to alumni through courses, conferences, exhibitions or trips to fairs that
aimed to solve technological problems that old students found in their daily tasks at work. Equally, in the
mid‐sixties, a library service of the association was started which included the option to borrow books and
journals for a maximum period of 45 days. And finally, the newsletter of the association regularly
published many monographs of the latest technical advances of the market. It should be noted that it had
a section called "What would you like to know?" where the alumni sent technical queries that were
responded in later issues of the magazine, either by the editors or by an associate sending a contribution
to the newsletter. Given the interest raised by this section, there was a period when a competition was
organised with a prize for the best answer.
Beyond this accurate technical support, the AAA has also supported its partners in commercial and labour
functions. A very important job has been the intermediary role that the association played with foreign
companies wishing to enter the Spanish market in the search of customers and/or suppliers. At the same
time, AAA has made a great effort to facilitate the day‐to‐day administration of the companies by dealing
with job offers/demands or arranging courses on commercial topics (discounting bills of exchange, quotas
for imports, etc.) and company running (new manufacturing systems, human resources management,
etc.).
A third area of operation involves sport competitions (e. g., a pelota championship coordinated together
with Kerizpe), recreational activities (pigeon shooting in the shooting club of Arrate, etc.), the organisation
of literary awards about the history of the school or the industry of the region, the screening of cultural
films, the implementation of a mutual service (a system to pay for the funerals of deceased members)
and of course, the organisation of the Annual Meeting of Alumni and the subsequent meal of the
associates.
Apart from the associates, the AAA has always targeted the Gunsmithing School and the region of Eibar.
In the mid‐sixties, the association was a great supporter of the opening of the school laboratory so that
industrialists in general (alumni or not) could solve their technical problems in Eibar instead of sending
samples to other populations. In addition, it has organised numerous artistic exhibitions, concerts and
social acts of benevolence.
54 More information at http://www.armeriaeskola.eus/es/antiguos‐alumnos/ (last seen: 26/06/2017).

Social capital in Eibar, 1886‐1985: dimensions, institutions and outcomes 151
An ex‐student explains the influence that the AAA has had on him (bulletin num. 106):
“La ASOCIACION DE ANTIGUOS ALUMNOS, auténtica madre técnica de ex‐alumnos, cuenta para la solución de los
problemas planteados con una serie de ventajas a saber.
1.‐La existencia de un equipo directivo elegido a base a tener una auténtica representatividad en todos los estratos
técnicos y humanos de la industria. Este equipo en perfecto equilibrio con la dirección del Centro incorpora a su vez
los valores técnicos y humanos del mismo.
2.‐ La existencia de ex‐alumnos en los puestos clave de la industria lo que crea una extensa red de información
importante para todo sondeo o consulta sobre un tema concreto. Es un hecho comprobado que a llamada de la
Asociación, el ex‐alumno, cuanto más veterano mejor, responde con una diligencia cálida y profunda como
respuesta quizás a lo que en lo más íntimo de su ser guarda de su siempre añorada época de estudiante.
3.‐La presencia de comisiones de trabajo especificas que se han consolidado en base a unas necesidades perentorias
y acuciantes cuales son:
a) La necesidad de una puesta al día técnico. Hecho totalmente necesario para evitar la obsolescencia técnica que
se iba comprobando al ser de un ritmo vertiginoso la evolución técnica del mundo industrial. El ex‐alumno inmerso
en su quehacer diario se ve imposibilitado de acceder al mismo. La ASOCIACION le brinda esa posibilidad a través
de unos cursos de reciclaje o bien una serie de cursillos técnicos al más alto nivel, con los cuales y sin perder ritmo
industrial sigue en la línea de la más alta eficacia técnica.”
To sum up, the Gunsmithing School (in its different forms) had a significant role in explaining the creation
of informal ties in Eibar. In total, 233 different companies (43.39%) are involved in 2.760 ties.
b) Town Council
The Town Council is the main executive body that is responsible for the administration in a local
government area, formed by a mayor and several councillors. In Spain, these councillors are elected
among the inhabitants by direct vote, and after being elected, they meet each other in a special plenary
session to determine who will be elected as a mayor. In the following days, the mayor chooses some
councillors to set up the executive governing body that will rule the town until the next elections take
place, and the other councillors form the opposition that will oversee mayor's governance.
In Table 23 I show the mayors of Eibar from 1912 (the year when the Gunthsmithing School was created)
until 1973 (the last corporation before the death of Franco). As it can be observed, the elections did not
follow a fixed period of time as they do now (every 4 years) and governing teams were normally elected
in accordance with other supraregional criteria.
Accessible information reveals that the Town Council, apart from playing a key role in the promotion of
the economic performance of Eibar, has been a meeting point for local entrepreneurs and other interest
groups. Popular businessmen like Nemesio Astaburuaga (GAC), Benjamin Villabella (manufacturer of files
and rasps), Ignacio Anitua (Anitua y Charola), Jose Gonzalez Orbea and Esteban Orbea (Orbea) or Luis
Palacios (Azpiri, Aranceta y Palacios) have been mayors of Eibar, and a large list of other top managers
have been councillors. As an example, in Appendix 21 I enclose the information of the representatives of
the Town Council in 1938, where there are 9 industrialists (6 belong to registered firms and 3 more own
small businesses in the town) plus a professor at the Gunthsmithig School, a pharmacist, a doctor and a
painter, all relatively important characters of the post Civil War in Eibar. Overall, 74 companies are
represented in the whole series.

152 CHAPTER 7
Table 23: Mayors of Eibar (1912‐1973)
Companies Investors
Year Mayor represented Investors Councillors %
1912 Nemesio Astaburuaga 7 7 14 50%
1914 Santiago Astigarraga 11 10 16 63%
1916 Nemesio Astaburuaga 14 12 17 71%
1918 Jose Ramon Iriondo 17 11 17 65%
1920 Alejandro Telleria 4 3 11 27%
1922 Benjamin Villabella 15 8 15 53%
1923 Remigio Guimon 5 2 16 13%
1924 Jose Gonzalez Orbea 22 11 21 52%
1926 Pedro Roman Uncetabarrenechea 18 11 19 58%
1927 Ignacio Anitua 19 12 20 60%
1931 Alejandro Telleria 4 3 12 25%
1934 Domingo Cortazar 4 4 16 25%
1938 Jose Gonzalez Orbea 9 6 13 46%
1942 Justo Oria 3 2 9 22%
1949 Esteban Orbea 8 4 13 31%
1955 Luis Palacios 11 5 12 42%
1958 Javier Eguren 1 1 11 9%
1962 Jose Hernando 7 5 17 29%
1967 Jose Maria Echeverria 5 4 13 31%
1973 Antonio Maria Iraolagoitia 4 3 16 19%
Source: self‐elaboration with data of the Municipal Archive of Eibar.
7.6.2. Relational analysis: c) Family ties Studies often underline the role of bridging social capital as a promoter of the extension of the individual's
social ties and also emphasise that bonding can lead to closure and exclusivity (Portes, 1998; Woolcock,
2001; Lin, 2008). However, these works do not fully recognise the socialisation part of the family, since
attitudes developed in family and in the community become part of external relations, reinforcing
citizenship and social virtues (Bubolz, 2001; Hooghe, 2008). The family is considered the "primary
socialising agent" because it recreates the process by which elementary notions of justice, obligations and
rights, linguistic elocution, motivations, and behaviour models are sought and tested (Alesina and
Giuliano, 2010). Literature further collects the relevant role in link transmission carried out by the family
through the inherited nexus that are transferred from generation to generation (Hoffman et al., 2006).
Similarly, Dasgupta (2005) considers that parents invest in social channels that they later transmit to their
children and the inheritance of networks of relationships implies a reduction in the cost of creation and
maintenance of social channels.
In Eibar, as shown in Table 24, family relations (at least two people with the same two surnames) are
perceived in 149 companies (27.75%)55. Historically, family businesses have been very typical since it was
very common to start a firm among brothers or between the father and a son. Furthermore, in cases
where the main entrepreneur died, direct descendants normally continued with the company. As a
reference, in Eibar there are 12 companies that incorporate the word “viuda” (widow) in the official name,
53 include the word “hermanos” (brothers) and 65 mention the word “hijos” (sons, children). Not only
55 In Appendix 22 I provide more information about the most repeated surnames in registered firms in Eibar.

Social capital in Eibar, 1886‐1985: dimensions, institutions and outcomes 153
does the family serve for intra interaction but also for inter relations between firms. In fact, it binds 203
different companies (37.80%) registered in Eibar, which constitutes a significant channel for information
and value sharing.
Table 24: Family relations intra and inter firms
INTRA INTER
P. Company Repeated P. Company Links
1 Orbea y Cia 23 1 Panificadora Urquizu 15
2 Mendiguren y Zarraua 10 2 La Eibarresa 10
3 Panificadora Urquizu 10 3 Astillero del Deva 9
4 Aramberri Hermanos 9 4 Cooperativa Electrica Eibarresa 7
5 Valentin Arizmendi 9 5 Martin Errasti y Compañia 6
6 Acha Hermanos 7 6 Cines y Teatros 4
7 Crucelegui Hermanos 7 7 Hijos de Valenciaga 4
8 Francisco Anitua 7 8 Inmobiliaria Arrate 4
9 La Eibarresa 7 9 Lorenzo Telleria 4
10 Otola 7 10 Orbea y Cia 4
Average (repeated) 3,27 Average (linked) 1,71
Standard deviation 2,34 Standard deviation 1,56
Companies with intra relation 149 Companies with inter relation 203
% of total 27.75% % of total 37.80%
Source: the Commercial Registry Office of Gipuzkoa.
d) Group of friends or cuadrillas The informal group called "cuadrilla" plays an important role in Basque social life. It refers to a group of
friends very strongly linked since childhood and whose friendship is generally maintained during
adulthood. This is a phenomenon that has been studied from a sociological point of view due to its
potential to mobilise human resources, its power of cohesion and the information capacity it possesses.
It is also an important mediator between the individual and the family, institutions and other actors of
the community and helps revitalising the ethnic awareness of the Basque society (Ramírez, 1984).
As mentioned before in the section devoted to the Gunsmithing School, a cuadrilla called Ezkuadra Zarra
was one of the main promoters of the school at the beginning of the 19th century. It is a group of friends
that brings together the most selected actors of the town in the early twentieth century (see Appendix
23). In the list there are several important gunsmiths of that time, along with representatives of the
council (including the mayor), doctors, the municipal judge, the journalist of the republican newspaper La
voz de Guipúzcoa, the photographer of the town and few artists (a pianist, a tenor and a dance teacher),
among others.
Convinced that the industry needed a boost to advance, they held a series of meetings with Fermin
Calbeton (a Basque lawyer and politician, born in San Sebastian, who had been named Minister of Public
Works at the Spanish Government) in order to persuade him about the need to build a professional school
in the town. Here is a picture of a meal organised in 1911 for this purpose in the fields of Olarreaga in
Eibar:

154 CHAPTER 7
Figure 25: Members of Ezkuadra Zarra with Fermin Calbeton (23 July 1911)
Source: Armeria Eskola (2013).
In the post Civil War era, there is another group of friends worth mentioning: Kurdin. As far as I have been
able to investigate, most of them were birth in the 1910s decade and eventually became relevant
businessmen in Eibar. In fact, this cuadrilla constitutes a selected team that represents at least 20 top
companies of the town (see Appendix 24 for further information). Some years later, in 1948, they were
the basis for the foundation of Kerizpe, the first private gastronomy club in Eibar (see section f). Kurdin
members formed exclusively the first BoDs and took initially the responsibility (and power) for
administration during the first years.
e) Civil associations
In close connection to social capital, the broader concept of civil society is used to refer to individuals and
organisations which are independent of the government. This occupies the middle ground between the
administration and the private sectors and is characterised as being “public without being coercive,
voluntary without being privatised” (Barber, 1995: 281). The claims made about the benevolent
consequences of civil associations are various: according to Maloney (2008: 304) they are seen as doing
much more than providing demand‐side solutions (aggregating pre‐existing voiceless concerns). More
importantly, they might be supply‐side manufacturers of concerns and generators of social capital that
lubricates the “proper” functioning of societies, engendering trust, reciprocity and civic value. The
networks created from voluntary associations seem to be relevant because they facilitate the
development of trust and norms of reciprocity. In turn, the diffusion of these cognitive aspects might
establish another stimulus for engagement. Nevertheless, since the great majority of associations are of
a bonding kind, one cannot make a blank assumption that voluntary associations in general are benign.
Negative associationism may also flourish that can lead to under‐representation of certain interests,
clientelism, economic inefficiencies or even organised crime (Warren, 2008).
The truth is that, if we look at figures from the late nineteenth century, Eibar and its geographical area
did not have especially significant rates of associationism. In 1895, the Basque Country occupies the tenth
place in the ranking of the autonomous communities, and compared to Bizkaia, Gipuzkoa presents worse

Social capital in Eibar, 1886‐1985: dimensions, institutions and outcomes 155
indicators regarding both absolute and relative figures (GEAS, 1998). Nevertheless, there is an increase of
the associative movement starting in the second half of the 1900 decade, reaching its peak in 1919 in the
pre Civil War era. Something similar can be said about Eibar, since in 1930 it was in the 10th place in the
classification among the 89 municipalities of Gipuzkoa (Aizpuru, 2003). In Eibar 104 societies were created
between 1887 and 1936, with a sociability index of 123.78 (one society per 123.78 inhabitants, based on
the 1930 census). Thus, if the development of the associative world is a sign of the modernity of a territory
(given that societies are based on the voluntary adherence of their members, in contrast with the more
"natural loyalty" of the social bonds in traditional entities such as the family, neighbours, work, religion),
the Eibar of the republican years can be described without hesitation as a modern society.
Table 25 displays the range of associations included and the period of study. To a greater or lesser extent,
they all are represented by industrials. For instance, if we analyse the BoDs of the Casino Artista Eibarres
in 1919 (see Appendix 25), the 11 participants cover 14 companies registered in Eibar. Other associations
have equally concentrated many industrialist, not only in BoDs but also in member lists: Club Deportivo
Eibar, in its almost 100 years of existence, has brought together many residents and it is still the largest
association in Gipuzkoa after the two main football clubs of the province (Real Sociedad and SD Eibar);
Club Ciclista Eibarres has been strongly tied with bike manufacturers; pelota games held in Astelena have
met enthusiastic supporters of this traditional Basque sport; the local bullfighting club was the largest one
in Spain in early 1960s; and shooting was the preferred hobby for many gunsmiths and they met each
other frequently at the shooting club in Arrate.
Table 25: Associations in Eibar
NAME ACTIVITY YEAR(S) STUDIED COMPANIES*
Casino Artista Eibarres Billiards, chess, card games 1912‐29, 1955‐85 14 (in 1919)
Club Deportivo Eibar Sport activities (except football) 1924‐85 10 (in 1924)
Club Ciclista Eibarres Cycling 1927 8
Fronton Astelena56 Pelota 1942 10
Sociedad Deportiva Eibar Football 1948 7
Peña Taurina Pedrucho Eibarresa Bullfighting 1949 7
Club de Tiro Eibar Shooting 1956 15
Asociación Cultural Arrate Cultural activities 1959 7
Source: self elaboration. *Note: companies represented in the BoDs.
f) Private gastronomy clubs or txokos As I mentioned before, these kinds of clubs are very popular in the Basque Country. Their basic function
is to offer recreation and rest to its associates, based on gastronomy. They operate like a self‐service and
the facilities (the kitchen, wine cellar and a dining room as fundamental elements) are freely used by the
members. Apart from this self‐service option, the most peculiar feature of gastronomic societies is the
fact that the payment is done without any upper control, only based on the commitment of the member.
Another sign of mutual trust between partners is the key for the entrance door. All members have their
own key so they can access to the club whenever they want, without any time limitation. Since the system
is based on trustful relationships, the entry of new members is controlled rigorously. Usually, they must
be introduced by other partners and the proposal has to be fully accepted by other members in the annual
meeting.
56 Fronton Astelena is actually a private company, and processed data correspond to its shareholders in 1942.

156 CHAPTER 7
According to a compilation performed by the local association “Eta kitto!”, in 1996 there were 60 private
gastronomy clubs in Eibar comprising in total more than 2,000 associates of 216 different firms. As the
popular chef Karlos Arguiñano states in the introduction of that book (Ibid.: 7), these txokos are perfect
places where, before and after the meal, attendants usually talk about work, hobbies or other topics, so
it goes without saying that they have witnessed for sure multiple conversations about the local industry
in Eibar. A similar statement was collected by the project Gipuzkoa Sarean (2011: 164), where an
interviewee asserted that “there are informal contact points where trust is generated. […] I think that
gastronomy clubs are a clear example, […] especially in the interior of Gipuzkoa. […] There was an
exchange between people who were friends of the same cuadrilla, who generated new companies from
that interaction”.
In Eibar, if there is a gastronomy club that excels among others, this is Kerizpe. In 1948, the 24 men that
belonged to Kurdin founded this club, the first of this typology in the town. They kept 99 shares, each one
worthing 250 pesetas (see Figure 26), and the rest were bought by relatives and acquaintances to preserve
a trustful atmosphere in the club, creating a network of 42 companies represented among the
shareholders, along with other minor workshops and individual entrepreneurs. Nowadays, Kerizpe still
remains as a place where part of the elite of the society in Eibar is gathered, and a proof of that is the fact
that it is the only gastronomy club that has its own chef that cooks for the associates (consequently, the
monthly fee is quite expensive). However, it keeps its popular character and continues in close contact
with different initiatives organised in the municipality, especially related to sport competitions and
cultural activities.
Figure 26: The first share of Kerizpe Club issued in 1948
Source: Kerizpe Club.
g) Old photographs
Last but not least, I have decided to collect historical photographs of Eibar. It is true that it may be the
weakest proxy of the analysis since, even though a photo assures that some people met each other in a
determined time and space, it does not guarantee any (good) interaction among them. Anyway, some
residents interrogated during the data collection described Eibar as a liberal oasis where, unlike other
municipalities in the vicinity, it was usual to see competing executives having a drink together after work
or even sharing the same group of friends57. Thus, within this small, social and sympathetic atmosphere,
it is probable that the entrepreneurs captured in old photos knew each other and had a kind of
relationship strong enough to share some information.
57 Iparragirre (2008) has also compiled some episodes in this line.

Social capital in Eibar, 1886‐1985: dimensions, institutions and outcomes 157
To collect the photographs, I have mainly used three sources: first, a local journal called Eibar58 has, ever
since 1994, a section where they encourage readers to send ancient photos, adding, if possible, some
information about the protagonists, year and place. Second, the website GureGipuzkoa,59 which is a
project runned by the Provincial Council of Gipuzkoa that aims to share the graphic material available by
that entity. And third, a blog of Javi Martin60 who, from time to time, hangs some photos of Eibar. Apart
from that, I have also compiled some pictures from people that I have interviewed or contacted and who
kindly were ready to share their material with me. All in all, after having viewed more that 3,000 pictures,
I managed to identify 156 commented photos from 1914 until 1984 that captured at least 2
entrepreneurs. Altogether, 150 companies were involved (27.93%) in 465 ties.
7.6.3. Some evidences about networking
The data analysis conducted in the previous sections dispenses significant findings about social capital in
Eibar. Regarding the structural element of social capital, I have represented the network of fellow
shareholders from a longitudinal perspective, first in the Deba Valley and later on in Eibar, the most
connected town. The latter presents a broad network of co‐ownership ties where firearming firms form
the core initially, but until the Civil War there are many attempts of related diversification to move
towards other businesses within the iron and steel industry, and afterwards it even evolves to non related
activities like construction, transport or services. So far, this is a simplified (and expected) story about
Eibar, but here raises the question whether this network really is representative of the informal
interactions set up among the citizens. Co‐partnership affects 57.91% of the companies, but are there
other patterns of connection that facilitate personal interaction? For that reason, I have contrasted the
board ties with a set of other informal networks created in Eibar. The results are shown in the following
table:
Table 26: Structural and relational indicators
Co‐
ownership School Council Family Friends Civil Ass. G. Clubs Photos
N. companies 311 233 74 203 43 47 216 150
% total Eibar 57.91% 43.39% 13.78% 37.80% 8.01% 8.75% 40.22% 27.93%
N. aggregated 233 263 338 347 348 401 417
Aggregated (%) 43.39% 48.98% 62.94% 64.62% 64.80% 74.67% 77.65%
Ties 421 1,380 655 190 579 255 1,287 465
Aggregated ties ‐ 1,380 1,904 2,036 2,531 2,706 3,918 4,261
Replicated co‐own. 248 154 152 84 74 162 28
% total co‐ownership 29.45% 18.29% 18.05% 9.98% 8.79% 19.24% 3.33%
Aggregated co‐own. 248 314 372 408 420 504 506
Aggregated (%) 29.45% 37.29% 44.18% 48.46% 49.88% 59.86% 60.10%
7 categories have been proposed involving 77.65% of the registered companies in Eibar, and as an
aggregate, they replicate the 60.10% of all joint ownerships, which somewhat suggests (i) the existence
of alternative means of social interaction and (ii) the relative representativeness of co‐partnership
phenomena. Disaggregating, the Gunsmithing School, private gastronomy clubs and the governing teams
of the town council appear to be the most important alternative channels at the informal sphere. Available
58 http://egoibarra.eus/es/publicaciones/revista‐eibar?b_start:int=0 (last seen: 26/06/2017). 59 http://www.guregipuzkoa.eus/?s=&sf‐mun=eibar (last seen: 26/06/2017). 60 http://javitxooo.blogspot.com.es (last seen: 26/06/2017).

158 CHAPTER 7
data also shows the relevant role of family ties not only to strengthen internal communication in firms
but as a bridging factor. And finally, we ought to mention friends, civil associations and other spontaneous
encounters as important explaining factors, too.
Apart from aggregated information, there are real evidences that show the subsistence of parallel
channels out of the official business domain. Table 27 gathers 2 cases (before and after the Spanish Civil
War) that illustrate the presence of networks that hinge on the Town Council. In the first example, in 1918,
the local governing team (integrated by the mayor Nemesio Astaburuaga and 16 councillors more) could
reach directly up to 131 people, including 62 investors of 32 different firms (the 45.71% of the companies
registered in 1918)61. The mayor himself was one of the co‐owners of Garate Anitua and Cia and member
of the Ezkuadra Zarra, which provided him access to investors in 18 companies. Besides, his brother Angel
was the manager of Angel Astaburuaga y Cia, an electricity generating company. Other 11 councillors
were industrials too (representing renowned firms such as Hijos de Valenciaga or Martin Errasti y Cia) and
6 councillors had a brother running a company that was not the one of the family. In sum, the result is a
dense network that could certainly approximate a small world phenomenon where firms can be reached
from every other firm by a small number of hops or steps.
Table 27: Connectivity of governing teams in 1918 and 1958
Year Councillors Contacts Industrials Companies
1918 17 131 (8.17 pp) 62/131 (47.33%) 32/70 (45.71%)
1958 12 284 (23.67 pp) 96/284 (33.80%) 94/256 (35.72%)
Figure 27: Mayor’s firm reachability in one degree of separation (1918)
Forty years later, in 195862, the council kept its capacity to attain a significant amount of firms registered
in the town. Indeed, the mayor Luis Palacios and the rest of councillors could potentially access personally
to 94 companies, or in other words, the mayor could reach the 35.72% of the local firms in one degree of
61 I have not checked whether any of the contactable people deceased before 1918. In that case, the figures would be slightly lower. 62 I show one photograph of this governing team in Appendix 26.

Social capital in Eibar, 1886‐1985: dimensions, institutions and outcomes 159
separation. He owned 4 businesses together with other 12 investors, he belonged to the BoDs of the
Gunsmithing School as a mayor since 1955 (meeting 10 more people from time to time) and personally,
he was a member of the Casino which reported him the chance to approach 27 businessmen. Additionally,
if we take into account the egonets of the other councillors, 284 people could be contacted, 33.80% of
them industrials.
Figure 28: Mayor’s firm reachability in one degree of separation (1958)
We cannot draw broad conclusions from these preceding networks because, at the end, we are talking
about two particular cases that have been deliberately chosen because of their extraordinary
connectivity. Notwithstanding, they highlight some important features that directly or indirectly have
been mentioned in previous sections so far: the outstanding number of councillors that are industrials,
the basic axis formed by the Town Council and the Gunsmithing School in its different versions (BoDs,
alumni and AAA), the remarkable role of the family (in general more noticeable before the Civil War) and
the growing networking contribution of civil associations as regulation established by Franco for
associationism smoothed especially from 1950 on, which partially explains the higher amount of people
contacted by each councillor.
7.6.4. Cognitive analysis
The third dimension of social capital refers to those resources providing shared representations,
interpretations and systems of meaning within the community. Although scholars widely recognise that
innovation generally occurs through combining different knowledge and experience, meaningful
communication (an essential part of social exchange and combination processes) requires at least some
sharing of context between the parties to such exchange. In that sense, several facets of social capital,
particularly those pertaining to the cognitive dimension, have a direct influence on the ability of
individuals to combine knowledge in the creation of intellectual capital. Following Nahapiet and Ghoshal,
one of the cognitive facets is made up of shared narratives. Beliefs, stories and metaphors provide
powerful means in communities for creating, exchanging and preserving rich sets of meanings. In that
line, Orr (1990) demonstrates how shared narratives, full of seemingly insignificant details, enable the

160 CHAPTER 7
creation and transfer of new interpretations of events, doing so in a way that facilitate the exchanging of
practice and tacit experience.
The history and origin of the Basque community is full of myths and legends. In the economical sphere,
much has been written about the entrepreneurial spirit inserted in the Basque DNA. According to Otazu
and Diaz de Durana (2008), Basque people began to act as an organised society a long time ago, with a
singular entrepreneurial attitude that could be attributable to several reasons. First, they had lived for
centuries in the same region and the natural isolation created by the surrounding mountains helped to
preserve the Basque identity and a strong sense of self‐government. Second, they were situated in a
strategic location, with water and land facilities that allowed them to develop a strong maritime and
mining tradition. Third, the highly homogeneous population base and the existence of local institutions
(mainly commercial and religious) created a social cohesion with more equal opportunities for the
inhabitants. Fourth, as Porter et al. (2013) highlight, the policy of no tariffs encouraged free trade and the
traffic involving northern Spain was concentrated in the Basque ports of Bilbao and San Sebastian. And
last, some historical happenings (such as the discovery of America in the last decade of the fifteenth
century) started a Basque emigration which turned to be a massive entrepreneurial initiative that
benefited the entire community. Yet, it is commonly used the expression “Amerikak egin” in Basque or
“hacer las Americas” in Spanish to refer to those people that cross the Atlantic Ocean to make business.
A popular Basque song describes the words of somebody that undertook this venture:
Ameriketara joan nintzen I went to America xentimorik gabe with no money handik etorri nintzen maitea I came back sweetheart bost miloiren jabe owning 5 millions Txin, txin, txin, txin Txin, txin, txin, txin diruaren hotsa the sound of the money haretxek ematen dit maitea that gives me my darling bihotzean poza happiness in my heart
The industrious spirit of Eibar began to manifest very soon, too. The very first industrial precedents are
related to the ironworks of the XV‐XVI centuries, where iron ore was produced. Since then, the tradition
has been continuously nurtured by the craft and manufacturing know‐how, applied notably in the
production of weapons, and this is the reason why residents are usually referred metaphorically as
armeros (gunsmiths). This industrial enthusiasm is also said to be in close relation with the sacrifice and
vitality to move forward, as it is witnessed in various ancient texts. For example, in the context of the
Exhibition of Arts and Industries hold in Eibar on 20 August 1908, Pedro Sarasketa (2000: 58) proudly
concluded that “Eibar es un pueblo de luchadores, trabaja y vence. Gloria al Trabajo y a sus hijos” (Eibar
is a town of fighters, works and wins. Glory to Work and its sons). The lyrics of a traditional song of the
town called “Himno a Eibar” echo a similar message:
HIMNO A EIBAR
Lyrics: Barragan (teacher of the Gunsmithing School); Music: Miguel Oñate.
En euskaro rincón escondido In a Basque hidden corner hay un pueblo olvidado tal vez there is a forgotten town, perhaps donde impera por ley el trabajo where the work prevails by law y es orgullo sin ser altivez. and is pride without any arrogance.
Sus blasones son feudos castillos Their coats of arms are fief castles son sus industrias que existen doquier are its industries that exist everywhere es el lema de un pueblo is the slogan of a town que los pueblos debieran tener. which others should have.

Social capital in Eibar, 1886‐1985: dimensions, institutions and outcomes 161
No detengas tu paso ¡adelante! Do not stop your step, go forward! postergado quizá por error postponed maybe by mistake con tu santo trabajo mantienes with your holy work you hold que en la lucha te sobra valor that in the fight your courage exceeds
Esto es Eibar. Esto es Eibar. This is Eibar. This is Eibar. sus preclaros hijos its illustrious citizens enaltecen su plácido hogar, extol their placid home, y en amor que a su suelo demuestran and the love they demonstrate to their land, Eibar viva ¡viva! les hace exclamar. up Eibar up! makes them exclaim.
Source: Otzerinjauregi and Sangroniz (2001). English translation accomplished by the author.
This song also mentions the special urban microcosm that is found in Eibar. The long, narrow shape of the
valley had its effect both on the shaping of the urban layout and the subsequent economical space. Some
industries were able to locate on the scarce plots of industrial land at the edges of the town, but a
significant part of Eibar's industry was located and developed within the historical centre. There, small
auxiliary workshops placed on bottom floors and in semi‐basement areas of residential buildings, and
overcoming these space limitations, they have been the driving force for many businesses of
acknowledged prestige. From the economical viewpoint, the co‐existence of industrial and residential
buildings derived into a geographical proximity among firms that might have been important for
economical development63. Additionally, people in Eibar proudly say that these handicaps (lack of land
and difficulties for accessibility) are nothing but features to forge the character of the town. As Marisol
Guisasola states in an article published in a local journal, Eibar cannot boast attractive architecture,
monuments or panoramic views, but can presume of people with great initiative and self‐esteem (Revista
Eibar, #9964).
There are other stories that underline the dedication and effort of local workers. For instance, one of the
industrial parks in the periphery of Eibar is called Azitain that may derive from the union of the Basque
words “hasi” (start) and “egin” (do). As far as I have been able to find out, this is more a play on words
rather than a real formulation of that name, but it is in line with the ambitious venture of local firms and
helps to nurture the myth of Eibar. A clearer example is the opinion of Tecnigraf, a printing company from
San Sebastian that printed the special issue of the 50th anniversary of the Gunsmithing School. They wrote
the following dedication at the end of the book:
IMPRENTA OFFSET NAVARRO – TECNIGRAF
En nuestra colaboración con los dirigentes de la Escuela de Armería de Eibar hemos podido descubrir el secreto de
sus éxitos: su inteligente laboriosidad, su dinámico entusiasmo y esa fe capaz de mover montañas.
In our collaboration representatives of the Gunsmithing School we have been able to discover the secret of their
success: their intelligent industriousness, their dynamic enthusiasm and a faith that is able to move mountains.
In a way or another, these shared narratives have helped to cultivate a common language about life and
work in Eibar. Here, I do not refer to language only in the restrictive meaning as a system of words for
communication, but as a common conceptual apparatus. It is true that Euskara (Basque language) was
widely spoken in the past and it served as an internal binder, external credential and secret code in trade
negotiations, but it has progressively lost its ancient role, especially in the business arena. In contrast,
values such as the commitment, dedication, effort, initiative, innovation, generosity and humility have
63 Eibar has been often named a “hive town” (Luengo, 1999: 78). Still in 2016, the demographic density in Eibar is 1,105.78 inhabitants per square kilometre, well above the average of the Low Deba region (306.48), the Basque Country (300.19) or even the European Union (116) (Eustat, 2017). 64 See http://egoibarra.eus/es/publicaciones/revista‐eibar/eibar_2011_01.pdf (last seen: 26/06/2017).

162 CHAPTER 7
survived as basic assets of the “Made in Eibar” brand. For example, the slogan of the Gunsmithing School
in its recent 100th anniversary was "Gure gero‐gura gara" which could be the driving idea of all professional
and social projects in the municipality: we are our desire to remain. And to the extent that people share
a common language, they gain consciousness about living and working styles in Eibar and it facilitates
access to people and their information.
In this vein, a key issue of the economical progress in Eibar relies on its organisational proximity. The
sound of different buzzers65 coming from the biggest companies (i.e., Orbea and GAC at the beginning or
Alfa later in the past century) set the rhythm of the town, and when they rang, floods of crowd moved up
and down the street at the same time, facilitating personal interaction among employees and thus
tightening the organisational proximity among different factories66. As García Manrique (1961: 200)
summarised, “Eibar, actualmente, es un gran taller” (Eibar, nowadays, is a great workshop).
Additionally, there was a high degree of personal acquaintance within the firms. As shown in Figure 29, it
can be said that, following the general pattern of the towns in the Basque Country, the majority of
companies were ruled by investors that worked and lived in Eibar, creating a very local atmosphere
(Valdaliso, 2003). Moreover, bosses and staff members used to work hand in hand in small companies
and it was very common to see them sharing their leisure time after work (even they could be part of the
same cuadrilla or group of friends)67. In fact, some workers preferred to use the word employer (ugazaba,
in Basque) rather than boss (nagusia) to refer to the owner of the business; the former concept meant “a
person that looks after my family, providing me a job” while the latter could transmit a rougher idea of
“the person that commands me”. This social proximity allowed, for example, the introduction of a
"pragmatic" socialism among workers especially during the last decades of the 19th century, raising less
labour conflicts in comparison with the neighbouring Bizkaia, where strikes were constant (Goñi, 2010:
115–117).
Figure 29: Origin of investments in companies in Eibar (1886‐1986)
As stated so far, these samples of shared narratives and language provide a common context, but in order
to combine the information gained through social exchange, the different parties must have some overlap
65 At the beginning of the century, the usual working hours were from 6:30 to 8:00; from 8:30 to 12:00 and 13:00 to 18:30, i.e. 10 hours of work (Valdour, 2000). 66 Yet, they keep the tradition to sound the buzzer of the company Alfa when the local football team scores a goal. 67 Valdour (2000: 98) states that “almost all employers have preserved the ideas and ways of life of their employees; they treat them familiarly, and sometimes join them to drink a coffee.”
82,14%
2,63%
1,85%
1,65%
1,35% 1,28%1,99%
7,11% Eibar
Ermua
Bilbao
San Sebastian
Placencia
Elgoibar
Others Deba Valley
Others

Social capital in Eibar, 1886‐1985: dimensions, institutions and outcomes 163
in knowledge and in Eibar, the cognitive proximity played an important role to root the Eibar spirit. Before
the World War I, 80% of the workers were residents (Eguiguren, 1994) and the great industrial
development was mainly driven by local workforce. This has quite a simple explanation: the expertise
needed for the job (either for damascening or in the arms industry) made it difficult to hire unskilled
labour since there were no educational centres where hypothetical candidates could be trained, and the
only way to learn a craft was almost reduced to the help of relatives or people in the bonding sphere. Only
a few workers came from the surrounding villages, waiving their majorat or birthright of their farms and
signing a traineeship contract with a firearming company for 2, 3 or 4 years, depending on the job position
(Echevarria, 1968: 20). This situation only changed with the inauguration of the Gunsmithing School in
1913, opening new opportunities for people coming from other provinces that soon integrated the
peculiarity of the local spirit and enhanced the strong qualified labour force in the town.
The expansion of the arms industry took place with a dual industrial structure: the vast majority of firms
were small, but few large companies controlled a big portion of the market. For example, the participation
of the three factories (Orbea, G.A.C. and Trocaola, Aranzabal y Cia) in the total production was 55 percent
(Catalán, 1990), and they occupied almost half of the workforce in the sector. The rest of the output was
produced by a set of tiny workshops where skilled workers timidly began to work on their own and
gradually increased capital and machinery. They elaborated only one part of the weapon, serving a more
powerful industry that accomplished the complete product, and this division of labour enhanced the
creation of strong knowledge community in the town, characterised by standards of manufacturing that
needed to fulfil very stringent requirements (Goñi, 2010). In this line, Castells (1993: 218) states that “the
firearming industry did not look like an individual company, but as a collective heritage that belonged to
all the town of Eibar that everyone should care about”68. Furthermore, Echevarria (1968: 42) cites a
doctrine that proclaimed the traditional gunsmithing industry to be a common good of the people. It is
referred as a historical capital which had been largely supported by the population, and the unscrupulous
employers had no right to discredit it with deficient products, in order to save costs at the expense of
quality.
Some of the business initiatives that emerged during the period of study also responded to that collective
spirit. The first industrial cooperative of the Basque Country was founded in Eibar in 1919 (Iza‐Goñola,
2005), and it was actually called Danok‐Bat, which means “all together” in Basque, referring to its
collaborative essence. This company eventually played a critical role for the creation in 1920 of the most
famous cooperative in Eibar: Cooperativa de Producción de Armas de Fuego Alfa. Additionally, there were
other firms that were registered as public limited companies but could be considered as cooperatives due
to the relatively high number of partners and the modest and equal individual capital contributions69.
In sum, there are multiple resources in Eibar that constitute facets of shared cognition that not only
facilitate the creation of intellectual capital but also engage residents in arduous relationships that
influence in their behaviour and fulfil social motives as sociability and attachment. Apart from trust and
trustworthiness, a common context developed through a history of interactions may lead to norms and
obligations with fellow workers and personal bonds. For instance, contacted senior entrepreneurs have
acknowledged a basic norm that prevailed in business relations in the Basque Country, quoting a popular
68 Gil Borrallo (2012:165) states that the often mentioned collaborative spirit of the past could not be applied in all cases. As examples of the high competition existing in this sector he cites the demand for patent encroachment issued by Anitua y Charola against Orbea in 1883 or the failed attempt to create a gunsmithing company that would integrate all the workshops of the area, similar to the Belgian FN. 69 In the sportive context, a more recent example is the use of the expression “Eibarpool” to refer to the local football club, making a clear parallelism with Liverpool FC and its popular song “You’ll Never Walk Alone”. For more information, see http://www.eibarpool.com (last seen 25/01/2017).

164 CHAPTER 7
expression: “hitza legea zen lehen”, that is to say, a promise was formerly a law. A similar message of
reciprocity may be extracted from the very peculiar usage of the Basque word "biharra". This term, in its
most used sense, means necessity, obligation, duty, but in Eibar and nearby towns it is most commonly
used to refer to work or a task (they usually say “Biharrera noia”, which could be translated into English
as “I go to my duty” instead of simply saying “I go to work”) so one could understand that working in Eibar
is a duty which contains a hidden moral that everyone should perform a task as an obligation for being a
citizen in Eibar.
7.7. Conclusions
This article tackles the process of industrialisation of Eibar since the end of the 19th century. In contrast
with the metropolitan area in Bilbao, the Deba Valley and the province of Gipuzkoa followed a very
different path based on small and medium‐sized industrial cities with a strong pre‐capitalist artisan
tradition that helped to familiarise the workforce with manufacturing activities.
A bottom‐up industrial network led by firms, formation centres and the civil society helps explaining the
economic growth and diversification of the Deba Valley over more than a century. In particular, Eibar has
proved many times its capacity to discover and exploit new domains and technologies that, eventually,
have resulted in new sectors (small home appliances, sewing machines and bikes, machine tools and
automotive parts) and all that was channelled by different spaces of collaboration, constantly facing all
type of constraints and overcoming many troublesome challenges with very little help of the government
as an institution.
Social capital, created and developed through informal networks, has played a key role in this process.
Metaphorically, its three dimensions (structural, relational and cognitive) have co‐operated as the
skeleton, heart and brain of the process, respectively, creating an indivisible corpus that has fuelled many
positive outcomes such as information exchange, interactive learning and a strong identification with the
Eibar spirit that have fostered even more the innovative capacity and entrepreneurship of the local
productive system.
As shown in the analytical part, multiple co‐ownership ties have been developed in the valley, more than
half of them comprising companies of Eibar. And if we have a look of the internal picture of this town, a
dense network of ownership‐based linkages is highlighted through the presence of some key firms
gathering dozens of partners and/or some people investing in several small companies which may have
conducted to intense information sharing among local entrepreneurs and avoided the risk of insularity
and lock‐in through the inflow of foreign know‐how.
Additionally, another finding is the relevant extension that informal networking has reached in Eibar. In
answering the second research question, the combination of 7 categories replicates more than 60% of the
co‐partnerships existed among companies and if both sources are merged, 86.59% of the registered
companies are covered, which constitutes a remarkable alternative for official channels of interaction.
The case of the Gunsmithing School is a clear example to illustrate the role of citizens in the creation and
development of this formation centre: it was created in 1913 by a group of friends (Ezkuadra Zarra),
governed by a municipal patronage even during the Franco regime and finally introduced in the
contemporary industry by the AAA. And on top of that, it laid the first stone from which Tekniker span off,
converted in one of the most important technology centres of the Basque Country.

Social capital in Eibar, 1886‐1985: dimensions, institutions and outcomes 165
All these achievements have been possible thanks to the famous Eibar spirit that has been proudly
transmitted from generation to generation, promoting a shared vision of the town that has evolved into
a strong sense of identity. Throughout the history, the industry in Eibar has opened a path that has given
extraordinary results to the extent that residents have assimilated this way of doing things and the
associated values have been transmitted from generation to generation. Starting from its peculiar
architecture, the social mix, the cooperative soul, the sacrificed character and the entrepreneurial
energy... they are all about the Eibar spirit.
These findings are in line with some recommendations provided by the OECD (2011) that underlined the
importance to include other formal and informal networks in the leadership of the STI policy in the Basque
Country. In a paper published recently, Valdaliso and I (2016) proved the high connectivity across clusters
that could potentially diminish the coordination failure detected in the Basque Council for Science and
Technology. More precisely, Magro et al. (2014) stressed that, according to the information provided by
regional representatives, many issues are handled through informal networks such as personal meetings
and phone calls that seem to be more effective than the formal ones. Similarly, Ahedo (2003) points out
the case of ACEDE (the Basque Cluster Association of the Home Appliance Industry) where, in spite of the
fact of being few members and most of them companies of the Mondragon group, the directors and
representatives of the companies acknowledge that they came to know each other more substantively in
informal meetings and meals organised by the cluster‐association. Or myself, in a forthcoming
publication70, have analysed the tweets of companies affiliated in the electronic and ICT cluster in the
Basque Country, and I argue that this informal channel represents a valid proxy to map the activity of the
cluster.
Theoretically, this paper contributes to the literature by introducing a methodology to analyse and
measure social capital in a local space. Based on a previous work of Nahapiet and Ghosal (1998), several
indicators have been proposed for each one of the facets, and afterwards they have been associated to
some positive outcomes that may lead to entrepreneurship and innovation. In the empirical part, the
ownership‐based business network of Eibar (1886‐1986) has been drawn for the first time and, in
comparison with other similar works cited in this paper, nodes have been sorted according to their date
of registry displayed in the Y axis, which constitutes a new graphical improvement that facilitates the
visualisation and the understanding of the historical evolution. Equally, filling the gap of other precedent
studies, I have dared to measure the extent to which other informal networks can replicate mutual
partnerships as CEO, and moreover, in the particular case of Eibar, some key associations have been
highlighted as both meeting points to share information about ongoing business activities and
entrepreneurial labs for future start‐ups or spin‐offs. Finally, several evidences have been listed in order
to form a wide academic background that justifies the existence of a local proximity effect regarding the
cognitive dimension.
A fundamental recommendation can be drawn for the future from this experience: governments should
prevent the too easy temptation of doing myself initiatives in order to speed up the process, and rely
instead on these latent formal and informal networks. Alternatively, if they do not exist, authorities should
develop policy measures and programs conducive to the generation of spaces for dialogue and
collaboration that complement top‐down initiatives. The history has shown that, although it takes longer
time and it does not per se guarantee economic success, local branching initiatives may host a hidden
potential to buzz innovation and foster the competitive position of the region.
70 See chapter 6 of this dissertation.

166 CHAPTER 7
Limitations to this study include that only registered companies (and investors) have been taken into
account. Self‐employed are not required to list at the Commercial Registry Office and even though they
have been approached through industrial and commercial taxation, I declined to use this information in
the network analysis because they enlarged the database significantly, with the consequent loss of
research clarity. Workers at registered companies have not been considered either; in this case, the major
problem was to create longitudinal series of employees. It goes without saying that both freelances and
staff members in Eibar have been important means of knowledge diffusion and they represent a research
line that a further paper may tackle.


Conclusions
CHAPTER 8


Conclusions 171
CHAPTER 8: CONCLUSIONS
In recent years, the literature on social capital has evolved into an important academic trend that has
revitalised the understanding of current social phenomena through key inputs such as networks, trust and
norms. The comprehension that networks are social spaces that allow access to resources for individual
and collective benefit has shown its potential to explain, sometimes in a controversial way, the role of
social capital in education, economic development, crime, immigration and political participation. In the
economic sphere, social capital inheres in relations among economic actors and facilitates some form of
social action, based on a certain degree of trust and in the context of some chief values and norms shared
by all involved parties. That, in turn, can produce multiple benefits: it reduces monitoring processes and
opportunism and hence transaction costs (Malmberg and Maskell, 2002), leads to efficiency in
information diffusion (Burt, 1992), promotes co‐ordination and inter‐firm cooperation (Porter, 1998) and
fosters entrepreneurship (Casson and Della Giusta, 2007), with a positive impact on the innovation
system. Accordingly, different amounts and compsitions of social social capital help to explain divergences
in regional economic development (Rutten and Boekema, 2007; Malecki, 2012).
Given that the spatial concentration of actors eases accessibility and thus interaction, social capital is often
referred to in publications that deal with economic geography. But as Boschma (2005) rightly points out,
geographical proximity alone does not guarantee any relationship, and the focus is shifted to networks
(local or global, formal or informal) as a means for knowledge‐sharing and adaptation to very rapid
changing environments (Gómez Uranga et al., 2016). In addition, the Internet boom and the emergence
of various sites for social networking have opened up a new channel of communication that has attracted
the interest of many scholars (Barrutia et al., 2016). Despite this growth in academic production, social
capital still faces two main problems that form the core of most criticism: its conceptual delimitation and
its measurement. In order to overcome these obstacles, this dissertation proposes an eclectic approach
regarding the different elements of social capital. First, after a profound revision of the literature, it
establishes a specific theoretical framework for investigating the structural, relational and cognitive
dimensions of social capital identified by Nahapiet and Ghoshal (1998). The structural dimension
principally seeks to make it possible easily to visualise network relations and how they are configured.
Mapping social capital can help with a critical analysis of the various intersecting systems, and guide
interventions aimed at improving the connectivity of the participating actors. The relational dimension
targets the nature of the relations, e.g. trust, reciprocity and other patterns of behaviour that influence
the willingness of actors to share knowledge and other resources. The cognitive dimension, in turn, tackles
shared codes and narratives that facilitate a common understanding between the actors and the creation
of a better setting for collaboration.
Second, regarding the three levels of social capital (micro/meso/macro) presented by Bourdieu (1986),
Coleman (1988) and Putnam (1993) respectively, I have adopted a hybrid perspective where the main unit
of analysis is the firm, interpreted as an “individual” actor (sustained by its employees) that belongs to a
community (cluster association, industrial district…) and is of benefit to society. Notwithstanding, I
actually incorporate other agents into the analysis as the study also refers to other organisations (e.g. the
entity that manages the cluster association, research centres, universities) and even public institutions.
Furthermore, I sometimes concentrate on individuals (investors) since they are the linkages that connect
the organisations they own. In summary, I present a multilevel and multi‐agent study that sets out to
satisfy a broad demand in the literature to include the supply side in the analysis of social capital.
This thesis also embraces a multiscalar perspective. An exclusive focus on the evolution of firms can result
in a rather impoverished treatment of space, and risks ignoring the evolutionary vision of economic actors
inserted in a specific context. And even a better conceptualisation in terms of economic geography
inevitably leads to a multiscalar analysis since the performance at one geographical scale is linked and
influenced by other scales (Tödtling et al., 2013). This study then provides a generic eyesight of some of

172 CHAPTER 8
the empirical work implemented at the national level, and thereafter zooms in on the Basque Country,
which constitutes the real fieldwork for analysis. Nevertheless, a new exploration trend suggests the
importance of moving from the regional vision to a more local scope and building a complementary
framework that enables a better understanding of cities or local productive systems (Parejo, 2006). In line
with this research claim, this dissertation also targets the pattern of connections of several firms affiliated
to a cluster association and the analysis of an industrial district from a longitudinal perspective. Overall I
present a multidisciplinary study situated somewhere between regional studies, economic history and
evolutionary economic geography.
Regarding the measurement of social capital, I have tried to be as accurate as possible when it comes to
methodological issues. All three papers are based on primary data (online surveys, personal interviews,
e‐mailing…) or secondary data gathered and processed by myself through the API proceedings or the
exploration of archival sources. It goes without saying that this has entailed extra work but I am confident
that I have reliable and rigorous data, specifically adapted to the needs of the investigation. Likewise, as
mentioned earlier, special emphasis has been given to an analysis of social capital in the long term. The
first two papers are based on current data, therefore, while the third is a historical investigation of the
economic performance of a municipality over the course of a century. In addition, I have tried as far as
possible to give a dynamic vision to my work, gathering the available information at different moments
and analysing social capital as a process (Anderson and Jack, 2002). Furthermore, in order to capture the
essence of social capital as broadly as possible, I have used both offline and online data sources.
The second choice for a precise measurement has been to design a set of indicators that, fulfilling the
theoretical underpinnings, provide the fairest approximation of the social reality. Notably, empirical
studies have broadly used indicators related to associativity and trust (Westlund and Adam, 2010) and my
intention was, for each analytical scale, to include proxies that make it possible to test new fields. For
example I believe that the use of BCP data is well suited to mapping the inter‐cluster network. The same
applies to Twitter as a means to portray virtual interaction among GAIA members. And in a local setting,
such as Eibar, I employ two new indicators that are very much rooted in Basque culture (cuadrillas and
private gastronomy clubs) or a novel source of information unexplored so far: historical photographs.
Finally, the third pillar for the purpose of rigorous measuring is an appropriate analysis of collected data.
In that sense I have combined network theory with the evolutionary approach of economic geography.
With the application of SNA I have shown the dynamics of the interactions among clustered and non‐
clustered actors, and measured the structural properties of the network topologies over time, identifying
information‐ and knowledge‐transfer mechanisms such as inter‐firm collaborations, professional
networks and informal networks. Nevertheless, social capital is a cumulative process (Storper and
Venables, 2004), path‐ and place‐dependent (Staber, 2007, Valdaliso et al., 2014) and strongly associated
with its local context, and therefore I have gone backwards in time to unearth business networks,
evidence of informal interaction, norms, local identities and other cognitive elements.
The thesis is rooted in the Basque Country, and inspired particularly by the Cluster Policy initiated in the
1990s. In Spain, several authors have pointed to the Basque Country as an outstanding region in terms of
social capital. For example, in the social capital index drawn up by Mota and Subirats (2000), it is in first
place, leading in all the subcategories: citizen engagement, coordination‐cooperation and associative
participation. Or if we consider the analysis of IVIE and the BBVA Foundation, the Basque Country has the
second best record (just behind the neighbouring region of Navarra) in terms of per capita social capital
between 1983 and 2012. In fact the region’s social capital is estimated to have increased almost 500%
over that period (Fernández de Guevara et al., 2015). In spite of this exceptional performance at the
national scale, region‐specific research has unveiled a darker scenario of endogamic relations,

Conclusions 173
institutional distrust and low participation. And in the economic sphere, despite the remarkable guiding
role on the part of the Basque Government via different plans and programmes, several publications
highlight that further steps are needed to improve the connectivity of the different actors within the
innovation system (e.g. Magro, 2014). In order to tackle this gap, the first paper analyses inter‐cluster
networks at the regional scale, and the main finding, after analysing the most active members in CAs and
BCPs, is that the resulting network has the properties of a small world, namely a high neighbouring and a
short overall separation among the cliques. That means there is an informal clustering above clusters
created by casual decisions by firms to join the above‐mentioned platforms. Besides, I identify the top 31
actors (26 firms, 2 technology centres and 3 government organisations) that are best positioned for
accessing information and bridging unconnected nodes.
The main strongpoint of the second paper is that it enters into the virtual universe. In an ever‐more digital
era, a vast amount of people are (also) connected by Internet, and analysing the pattern of online
connections is already a must for any diagnosis that intends to be integral. Moreover, in this paper I make
a step forward and show a web of real interaction (relations that are not merely assumed to exist but
actually revealed). Equally, we have the opportunity to observe the role of an entity that rules the cluster
(cluster GAIA), which is one of the key actors on Twitter. Finally, a hashtag analysis provides the chance
to see what affiliates are talking about. With the rise of the relational approach, many studies have
focused mainly on ties and network structure, and have largely ignored the quality of these ties. The
content shared by means of Twitter messages, therefore, is of great importance.
The third publication has two main strengths. First, it identifies a dense structure of informal networks
from a historical perspective. This finding is relevant because some studies indicate that informal and oral
information sources provide most key communications about the market opportunities and technological
possibilities that lead to innovation (Casson and Della Giusta, 2007). Additionally, tacit knowledge is
embodied in people and difficult to express through codified language, and it needs face‐to‐face contact
and direct interaction in order to be transmitted (Giuliani, 2005). Therefore the formal and informal
interaction channels identified in Eibar between 1886 and 1985 may have been crucial for sharing
knowledge, absorbing the latest technological innovations, internationalisation, and ultimately success
for local industry during that period.
The other important contribution of paper three is that it deals with cognitive data. Surprisingly, academic
research on cognitive components is scarce and territory‐specific social and cultural attributes have not
been systematically considered (Westlund and Adam, 2010). Aspects such as language, ethnicity or
identity have proved to be key elements for the development of both formal and informal relations
(Malecki, 2012), because they may explain the mechanisms through which tacit knowledge is spread and
certain innovative processes developed over time. Therefore I have tried to prove that in the late
nineteenth and through most of the twentieth century, Eibar was a hive of economic activity based on a
dense web of relationships and a strong entrepreneurial spirit. Moreover, semantic issues such as the
words people used to refer to work (biharra) or a boss (ugazaba) suggest that there was a special
atmosphere in Eibar for sharing codes of conduct, relevant pieces of information, and so on.
In sum, the three research chapters contain both methodological novelties and meaningful outcomes that
may have interesting policy implications, not to create an assessment tool as such but to complement
already existing instruments or inspire new ones. As various studies have pointed out, the development
of a methodological tool for formal network analysis is needed, at different scales, in the Basque Country
(Magro et al., 2014; Aranguren et al., 2016). First, structural holes and other imperfections should be
repaired. The performance of structures is sometimes hampered by the persistent absence of certain
links. Second, the position and role of actors should be monitored. In this sense this dissertation suggests

174 CHAPTER 8
a need for much more accurate interventions based on frequent diagnoses of the cluster structural
organisation. Policy‐makers have usually focused on univocal actions to increase density, but policies
boosting the creation of relations in an undifferentiated way may result in the reinforcement of the
existing non‐performing structures. Consequently, I contend that policy efficiency gains can be obtained
with more rigorous and concrete interventions. And to eliminate all signs of scepticism, the (hi)story of
Eibar shows that successful economic performance can be achieved on the basis of bottom‐up processes
and very little mediation of regional and local institutions.
Public organisations should also keep an eye on informal networking as an alternative way of contact
among regional actors. Spaces for casual encounters (online but especially offline) should be provided,
where companies and institutions could interact and strengthen their cooperation. Such occasions could
also be important in reversing the current institutional distrust and promoting a clearer social
commitment that can lead us towards a more participatory democracy. But for this new model of
participation to succeed, all involved parties should abandon previous preconceptions and engage with
genuine goodwill (not just so as to appear in the group photo). The objective is to find a boomerang win‐
win effect that will relaunch a new culture of cooperation. Similarly, some other values and norms should
also be reinforced. The longitudinal study conducted in Eibar has unveiled several important cognitive
elements that may in fact extend over the whole of Basque society. Sacrifice, entrepreneurship, social
cohesion, reciprocity, solidarity: they were all key ingredients in the successful economic performance of
Eibar, and should not be disregarded.
This thesis has obtained promising results, but it has also encountered different obstacles. First of all,
there are some procedural restraints that condition the results and should be taken into account. For
example, the methodological design of the three empirical studies has entailed the exclusion of some
actors due to various reasons (simplicity, clarity…), inevitably altering the final output. Data
representativeness is another factor that researchers are normally dissatisfied with. In my case I would
rather collect more than 3,200 tweets per username, but this is the maximum that can be collected
through API methods. In addition I am not happy with the scaling employed in the survey in paper 5. The
format of a typical five‐level Likert item (strongly disagree, disagree, neither agree nor disagree, agree,
strongly agree) tends to have a central tendency bias as respondents are inclined to avoid the extreme
categories so as not to be perceived as having radical views. That is why I eliminated the middle option,
but the resulting scale of only four choices was perhaps too narrow to capture the diversity of opinions.
Additionally, Likert items are not very easy to compare with each other, especially in combination with
other questions with numerical answers. As a result I think it would have been better to go for a 0‐10
scoring from the very beginning. This decision may lead to a more pronounced acquiescence bias, that is,
respondents may have a higher tendency to agree with the postulated questions, but on the other hand
it has two positive points: it leaves room for all sensibilities and, more importantly, it is the scaling used
by Eustat and would therefore allow me to compare my information with their data.
As a more general comment, I would like to acknowledge the difficulty of dealing with personal
information or confidential data from companies. When studying social capital, requests for information
often come quite close to infringing on the privacy of people and organisations, and this has been a
constant limitation on data collection and presentation. For data processing and analysing, in turn, the
biggest challenge was the unequivocal identification of entrepreneurs and firms. The DNI71 was first
introduced in 1944 and the use of the CIF72 was clearly extended from 1990 onwards. That means that, in
the prosopography of Eibar, the proper identification of focal subjects was a tough task in many cases.
71 Documento Nacional de Identidad, the Spanish ID number. 72 Código de Identificación Fiscal, similar to the VAT identification number.

Conclusions 175
This is not a trivial issue since data consistency and reliability are imperative ingredients for robust
research. In my view, therefore, collaboration on the part of the local authorities is essential in order to
facilitate the accurate collection of information.
Looking ahead, this dissertation suggests multiple lines of research for the future, which together might
serve to complete this investigation. For example, further assessments at the Basque Country level can
be carried out so that the research evidence is genuinely dynamic. As pointed out throughout the thesis,
the stock of social capital varies continuously and RISs require frequent photographs in order to know the
real status of the connectivity of regional actors. The same principle could be applied at the cluster level:
I think that social capital urges to be re‐assessed from time to time. In this respect, my impression is that
cluster managers are very interested in information of a more informal character. They do normally know
who attends the meetings, which firms are participating in a given project, etc., but they are unaware of
how associates interact outside these formal channels and I think this might constitute a rich arena for
future investigation. And lastly, at the micro scale, the historical analysis performed in Eibar can be
upgraded and extended to other municipalities. In section 4.2 I listed some counties and towns with new
models of local governance, and these could be perfect candidates for a longitudinal study, introducing
flashbacks that enable a better understanding of their trajectories in the long term. In addition, I believe
that the world‐famous cooperativism of Arrasate and Mondragon Corporation concentrates its narrative
mainly at the firm level, describing the creation of a vast network of companies in diverse sectors, but I
personally think this story might have room for a broader analysis, incorporating other key actors in civil
society.
Equally, my idea is to delve deeper into the analysis and refinement of certain methodological procedures.
Needless to say, virtual interactions constitute a very promising field for research as SNSs contain a lot of
information and data collection is cheap and fast. Certainly, as long as it remains possible to see who is
following to whom, it seems to me that Twitter will be the most appropriate application for the study of
online communication. Also Twitter has now doubled the length of messages from 140 to 280 characters,
which apart from offering additional information will, in my opinion, encourage yet more people to use
the app. LinkedIn is another platform to watch, principally because of its work orientation. Unfortunately
it does not make it possible to check the profiles of individuals who are two (or more) degrees of
separation apart, which is a significant drawback. Only users with a broad ego‐network can know whether
or not third parties are in contact with each other, which means LinkedIn might be more suitable for
institutions rather than for single, external researchers.
From the historical perspective, despite the drawbacks mentioned above, I am eager to continue working
at the individual level, investigating relationships among workers. In Eibar, numerous spin‐offs were
created by employees who exited other companies, which suggests that this level of analysis is important
for entrepreneurship and knowledge spillovers. Apart from the archival sources, I am confident that I will
be able to further exploit the available information about gastronomy clubs as I have an increasing amount
of evidence showing that they have played a significant role as private spaces for social interaction.
Obituaries might constitute another type of fertile ground for social capital analysis. From death notices
published in old newspapers it is possible to obtain information about a person’s place of work, group of
friends and family, so my idea is to upgrade the work in Eibar with this additional information. Clearly the
main drawback with this modus operandi is that even though many old newspapers can be now accessed
online, the information of ego’s has to be compiled individually, which is very time‐consuming. But again,
this is something economic historians are familiar with.
Another research line for the future is to contrast the impacts of social capital on economic
competitiveness at the three scales of analysis. To do so, evidence of social capital would need to be

176 CHAPTER 8
compiled to form a dataset, and then compared with certain economic indicators. A quantitative analysis
(e.g. an econometric analysis) would be very helpful for that purpose. Moreover, the hypothesis that
central actors in networks operate with more resources would also need to be empirically verified. For
that purpose, qualitative data collection techniques such as personal interviews or individual surveys
would seem more suitable. An analysis of virtual interaction on SNSs might also be interesting, for example
computing the number and importance of the hashtags used by actors with a high degree of centrality.


REFERENCES i


References 181
REFERENCES
ACE‐Europraxis (2010). Plan Estratégico 2010‐2013 de la Asociación Cluster de Energía del País Vasco (ACE). Bilbao: ACE.
Acquisti, A. and Gross, R. (2006). Imagined communities: Awareness, information sharing, and privacy on the Facebook. In Danezis, G. and Golle, P. (Eds.) 6th International workshop on privacy enhancing technologies (pp. 36‐58). Berlin and Heidelberg: Springer.
Adler, P. S. and Kwon, S. (2002). Social Capital: prospects for a new concept. Academy of Management Review 27(1), 17‐40.
Ahedo, M. (2003). Las Asociaciones‐Cluster de la Comunidad Autónoma del País Vasco (1986‐2002): tradición, interacción y aprendizaje en la colaboración Gobierno‐Industria. Ekonomiaz 53 (2o cuatrimestre), 114‐137.
Ahedo, M. (2004). Cluster Policy in the Basque Country (1991‐2002): Constructing “Industry‐Government” Collaboration through Cluster‐associations. European Planning Studies 12(8), 1097‐1113.
Ahn, T. K. and Ostrom, E. (2008). Social capital and collective action. In Castiglione, D., Van Deth, J. W. and Wolleb, G. (Eds.) The Handbook of Social Capital (pp. 70‐100). New York: Oxford University Press.
Aizpuru, M. (2003). Gipuzkoako elkarteen azterketa kuantitatiboa, 1887‐1936. Vasconia 33, 29‐48.
Ajangiz, R. (2007). Participación ciudadana y capital social en el País Vasco. In Ibarra P. and Ahedo I. (Eds.) Democracia participativa y desarrollo humano (pp. 283‐297). Madrid: Dykinson.
Alberti, F. G., Sciascia, S., Tripodi, C. and Visconti, F. (2008). Entrepreneurial growth in industrial districts: Four italian cases. Cheltenham, UK: Edward Elgar.
Alberti, F. G. and Pizzurno, E. (2015). Knowledge exchanges in innovation networks: evidences from an Italian aerospace cluster. Competitiveness Review 25(3), 258‐287.
Alesina, A. and Giuliano, P. (2010). The power of the family. Journal of Economic Growth 15(2), 93‐125.
Amin, A. and Cohendet, P. (1999). Learning and Adaptation in Decentralised Business Networks. Environment and Planning D: Society and Space 17, 87‐104.
Anderson, A. R. and Jack, S. L. (2002). The articulation of social capital in entrepreneurial networks: a glue or a lubricant?. Entrepreneurship and Regional Development 14(3), 193‐210.
Andonegi, P. and Arrieta, P. (2014). Elgoibar: breve historia de la Máquina Herramienta, 1346‐1914‐2014. Elgoibar: AFM and Elgoibarko Udala.
Aragón, C., Aranguren, M. J., Iturrioz, C. and Wilson, J. R. (2014). A social capital approach for network policy learning: the case of an established cluster initiative. European Urban and Regional Studies 21(2), 128‐145.
Aranguren, M. J. (2010). Política clúster del País Vasco: lecciones aprendidas y retos. Revista EAN 68, 86‐99.
Aranguren, M. J. and Navarro, I. (2003). La política de clusters en la Comunidad Autónoma del País Vasco: una primera valoración. Ekonomiaz 53(2), 90‐113.
Aranguren, M. J., De La Maza, X., Parrilli, M. D. and Wilson, J. R. (2010a). Asociaciones Clúster: Competitividad de la CAPV a través de la cooperación. San Sebastián: Orkestra.
Aranguren, M. J., Larrea, M. and Wilson, J. R. (2010b). Trayectorias de cambio en la gobernanza: experiencias en asociaciones 'cluster' y redes comarcales en el País Vasco. Ekonomiaz 74, 160‐177.
Aranguren, M. J., Magro, E., Navarro, M. and Valdaliso, J. M. (2012). Estrategias para la construcción de ventajas competitivas regionales. El caso del País Vasco. Madrid: Marcial Pons.
Aranguren, M. J., De la Maza, X., Parrilli, M. D., Vendrell‐Herrero, F. and Wilson, J. R. (2014). Nested Methodological Approaches for Cluster Policy Evaluation: An Application to the Basque Country. Regional Studies 48(9), 1547‐1562.
Aranguren, M. J. and Larrea, M. (2015). Territorial strategy. Deepening in the ‘how’. In Valdaliso, J. M. and Wilson, J. R. (Eds.) Strategies for shaping territorial competitiveness (pp. 55‐72). London: Routledge.
Aranguren, M. J., Morgan, K. and Wilson, J. R. (2016). Implementing RIS3. The Case of the Basque Country. Cuadernos Orkestra 2016/17. San Sebastian: Orkestra.
Armeria Eskola (2013). Mendeurrena ‐ Centenario (1912‐2012). Eibar: Armeria Eskola.

182 CHAPTER i
Arrow, K. J. (2000). Observations on social capital. In Dasgupta, P. and Serageldin, I. (Eds.) Social capital: a multifaceted perspective (pp. 3‐5). Washington DC: World Bank.
Asheim, B. T. (1996). Industrial districts as ‘learning regions’: a condition for prosperity. European Planning Studies 4(4), 379‐400.
Asheim, B. T. and Coenen, L. (2006). Contextualising regional innovation systems in a globalising learning economy: On knowledge bases and institutional frameworks. Journal of Technology Transfer 31, 163‐173.
Asheim, B. T., Moodysson, J. and Tödtling, F. (2011). Constructing Regional Advantage: Towards State‐of‐the‐Art Regional Innovation System Policies in Europe? European Planning Studies 19(7), 1133‐1139.
Asheim, B. T. and Parrilli, M. D. (2012). Introduction: Learning and Interaction — Drivers for Innovation in Current Competitive Markets. In Asheim, B. T. and Parrilli, M. D. (Eds.) Interactive Learning for Innovation (pp. 1‐29). Basingstoke and New York: Palgrave Macmillan.
Audretsch, D. B. and Feldman, M. P. (1996). R&D Spillovers and the Geography of Innovation and Production. The American Economic Review 86(3), 630‐640.
Backstrom, L., Boldi, P., Rosa, M., Ugander, J. and Vigna, S. (2012). Four Degrees of Separation. In Proceedings of the 4th Annual ACM Web Science Conference (pp. 33‐42). New York: ACM.
Bain, K. and Hicks, N. (1998). Building social capital and reaching out to excluded groups: the challenge of partnerships. World Bank 15(1), 13‐25.
Baker, W. E. (1990). Market networks and corporate behavior. American Journal of Sociology 96(3), 589‐625.
Baker, W. E. (2000). Achieving Success Through Social Capital. Tapping the Hidden Resources in Your Personal and Business Networks. San Francisco: Jossey‐Bass.
Bamberger, M. (2000). Integrating Quantitative and Qualitative Research in Development Projects. Washington DC: World Bank.
Barber, B. R. (1995). Jihad versus McWorld: How globalism and tribalism are reshaping the world. New York: Ballantine Books.
Barrutia, J., Zabala‐Iturriagagoitia, J. M. and Gómez Uranga, M. (2016). Scope and Limitations of the Epigenetic Analogy: An Application to the Digital World. In Gómez Uranga, M., Zabala‐Iturriagagoitia, J. M. and Barrutia, J. (Eds.) Dynamics of Big Internet Industry Groups and Future Trends (pp. 243‐254). Bilbao: Springer.
Bathelt, H., Malmberg, A., and Maskell, P. (2004). Clusters and knowledge: local buzz, global pipelines and the process of knowledge creation. Progress in Human Geography 28(1), 31‐56.
Beaudoin, C. E. (2008). Explaining the relationship between internet use and interpersonal trust: Taking into account motivation and information overload. Journal of Computer‐Mediated Communication 13(3), 550‐568.
Becattini, G. (1990). The Marshallian industrial districts as a socio‐economic notion. In Pyke, F. (Ed.) Industrial Districts and Inter‐Firm Co‐Operation in Italy (pp. 37‐51). Geneva: International Institute for Labour Studies.
Belliveau, M. A., O'Reilly, C. A. and Wade, J. B. (1996). Social capital at the top: Effects of social similarity and status on CEO compensation. Academy of Management Journal 39(6), 1568‐1593.
Benneworth, P., Irawati, D., Rutten, R. and Boekema, F. (2014). The social dynamics of innovation networks: from learning region to learning in socio‐spatial context. In Rutten, R., Benneworth, P., Irawati, D., and Boekema, F. (Eds.) The social dynamics of innovation networks (pp. 3‐20). Abingdon and New York: Routledge.
Beugelsdijk, S. and Van Schaik, T. (2005). Differences in social capital between 54 Western European regions, Regional Studies 39(8), 1053‐1064.
Binz, C., Truffer B. and Coenen, L. (2014). Why space matters in technological innovation systems—Mapping global knowledge dynamics of membrane bioreactor technology. Research Policy 43, 138‐155.
Birley, S., Cromie, S. and Myers, A. (1991). Entrepreneurial Networks: Their Emergence in Ireland and Overseas. International Small Business Journal 9, 56‐74.
Boggs, J. S. and Rantisi, M. (2003). The ‘relational turn’ in economic geography. Journal of Economic Geography 3(2), 109‐116.

References 183
Bolino, M. C., Turnley, W. H. y Bloodgood, J. M. (2002). Citizenship Behavior and the Creation of Social Capital in Organizations. Academy of Management Review 22(4), 505‐522.
Borgatti, S. P. (2002). Netdraw Network Visualization. Harvard, MA: Analytic Technologies.
Borgatti, S. P., Everett, M. G. and Freeman, L. C. (2002). Ucinet for windows: Software for social network analysis. Harvard, MA: Analytic Technologies.
Borgatti, S. P. and Foster, P. C. (2003). The network paradigm in organizational research: A review and typology. Journal of Management 29(6), 991‐1013.
Borgatti, S. P., Mehra, A., Brass, D. J. and Labianca, G. (2009). Network analysis in the social sciences. Science 323, 892‐895.
Boschma, R. A. (2004). Competitiveness of Regions from an Evolutionary Perspective. Regional Studies 38(9), 1001‐1014.
Boschma, R. A. (2005). Proximity and innovation: a critical assessment. Regional Studies 39(1), 61‐74.
Boschma, R. A. and Ter Wal, A. L. J. (2007). Knowledge Networks and Innovative Performance in an Industrial District: The Case of a Footwear District in the South of Italy. Industry and Innovation 14(2), 177‐199.
Bourdieu, P. (1980). Le capital social. Notes provisoires. Actes de la recherché en sciences sociales 31, 2‐3.
Bourdieu, P. (1986). The forms of capital. In Richardson, J. G. (Ed.) Handbook of theory and research for the sociology of education (pp. 241‐258). New York: Greenwood.
Bowles, S. and Gintis, H. (2002). Social capital and community governance. The Economic Journal 112, 419‐436.
Boxman, E. A., De Graaf, P. M. and Flap, H. D. (1991). The impact of social and human capital on the income attainment of Dutch managers. Social Networks 13(1), 51‐73.
Boyd, D. M., and Ellison, N. B. (2007). Social Network Sites: Definition, History, and Scholarship. Journal of Computer‐Mediated Communication 13, 210‐230.
Brehm, J. and Rahn, W. (1997). Individual‐level evidence for the causes and consequences of social capital. American Journal of Political Science, 999‐1023.
Breiger, R. L. (2004). The Analysis of Social Networks. In Hardy, M. and Bryman, A. (Eds.) Handbook of Data Analysis (pp. 505‐526). London: SAGE Publications.
Breschi, S. and Lissoni, F. (2004). Knowledge networks from patent data: methodological issues and research targets. In Moed, H. F., Glänzel, W. and Schmoch, U. (Eds.) Handbook of quantitative science and technology research: the use of publication and patent statistics in studies on S&T systems (pp. 613‐643). Berlin, Heidelberg, New York: Springer.
Breschi, S. and Lissoni, F. (2009). Mobility of skilled workers and co‐invention networks: an anatomy of localized knowledge flows. Journal of Economic Geography 9(4), 439‐468.
Breschi, S., Lorenzo, C., Malerba, F. and Vonortas, S. V. (2009). European policy favouring networks in ICT. In Malerba, F. and Vonortas S. V. (Eds.) Innovation networks in Industries (pp. 195‐225). Cheltenham: Edward Elgar.
Brüderl, J. and Preisendörfer, P. (1998). Network support and the success of newly founded businesses. Small Business Economics 10, 213‐225.
Bubolz, M. M. (2001). Family as source, user, and builder of social capital. The Journal of socio‐economics 30(2), 129‐131.
Bühlmann, M. and Freitag, M. (2004). Individuelle und kontextuelle Determinanten der Teilhabe an Sozialkapital. KZfSS Kölner Zeitschrift für Soziologie und Sozialpsychologie 56(2), 326‐349.
Burt, R. S. (1992). The Social Structure of Competition. In Burt, R. S. (Ed.) Structural Holes: The Social Structure of Competition (pp. 57‐91). Cambridge: Harvard University Press.
Burt. R. S. (2000). The network structure of social capital. In Sutton, R. I. and Staw, B. M. (Eds.) Research in Organizational Behavior (pp. 345‐423). Greenwich, CT: JAI Press.
Burt, R. S. (2001). Structural Holes versus Network Closure as Social Capital. In Lin, N., Cook, K., and Burt, R.S. (Eds) Social Capital. Theory and Research (pp. 31‐56). New Brunswich, New Jersey: Aldine Transaction.

184 CHAPTER i
Bustinduy, N. (1894). La Industria guipuzcoana en fin de siglo: reseña de las industrias fabriles más importantes. San Sebastián: La Unión Vascongada.
Camagni, R. (1991). Innovation Networks: Spatial Perspectives. London and New York: Belhaven Press.
Capaldo A. (2007). Network structure and innovation: The leveraging of a dual network as a distinctive relational capability. Strategic Management Journal 28, 585‐608.
Capello, R. (1999). Spatial transfer of knowledge in high technology milieux: learning versus collective learning processes. Regional Studies 33(4), 353‐365.
Capello, R. and Faggian, A. (2005). Collective Learning and Relational Capital in Local Innovation Processes. Regional Studies 39(1), 75‐87.
Carbonara, N. (2002). New models of inter‐firm networks within industrial districts. Entrepreneurship and Regional Development 14, 229‐246.
Carrington, P. J. and Scott, J. (2011). Introduction. In Scott J. and Carrington P. J. (Eds.), The SAGE Handbook of Social Network Analysis (pp. 1‐8). London: SAGE Publications.
Casson, M. and Della Giusta, M. (2007). Entrepreneurship and Social Capital. Analysing the Impact of social Networks on Entrepreneurial Activity from a Rational Action Perspective. International Small Business Journal 25(3), 220‐244.
Castells, L. (1993). Los trabajadores en el País Vasco (1876‐1923). Madrid: Siglo XXI de España Editores.
Castiglione, D. (2008a). Introduction: Conceptual Issues in Social Capital Theory. In Castiglione, D., Van Deth, J.W. and Wolleb, G. (Eds.) The Handbook of Social Capital (pp. 13‐21). New York: Oxford University Press.
Castiglione, D. (2008b). Introduction: Social Capital between Community and Society. In Castiglione, D., Van Deth, J.W. and Wolleb, G. (Eds.) The Handbook of Social Capital (pp. 555‐567). New York: Oxford University Press.
Castiglione, D., Van Deth, J. W. and Wolleb, G. (2008). Social capital's fortune: An introduction. In Castiglione, D., Van Deth, J.W. and Wolleb, G. (Eds.) The Handbook of Social Capital (pp. 1‐10). New York: Oxford University Press.
Catalán, J. (1990). Capitales modestos y dinamismo industrial: orígenes del sistema de fábrica en los valles guipuzcoanos, 1841‐1918. In Nadal, J., and Carreras, A. (Dir.) Pautas regionales de la industrialización española (siglos XIX y XX) (pp. 125‐158). Barcelona: Ariel.
Catalán, E., Goñi, I. and Mugartegui, I. (2017). Business networks and social capital in Basque industrialization. Journal of Evolutionary Studies in Business 2(1), 88‐127.
Cohen, W. M. and Levinthal, D. A. (1990). Absorptive capacity: A new perspective on learning and innovation. Administrative Science Quarterly 35(1), 128‐152.
Coleman, J. S. (1988). Social capital in the creation of human capital. American Journal of Sociology 94, S95‐S120.
Coleman, J. S. (1990). Foundations of social theory. Cabridge: Harvard University Press.
Cooke, P. (2001). Regional Innovation Systems, Clusters, and the Knowledge Economy. Industrial and Corporate Change 10(4), 945‐974.
Cooke, P., Boekholt, P. and Tödtling, F. (2000). The governance of innovation in Europe. London: Pinter.
Costa, D. L., and Kahn, M. E. (2001). Understanding the decline in social capital, 1952‐1998 (Working Paper No. 8295). Cambridge, MA: National Bureau of Economic Research.
Cote, S., and Healy, T. (2001). The well‐being of nations. The role of human and social capital. Paris: Organisation for Economic Co‐operation and Development.
Crespo, J., Réquier‐Desjardins D. and Vicente J. (2014). Why can collective action fail in Local Agri‐food Systems? A social network analysis of cheese producers in Aculco, Mexico. Food Policy 46, 165‐177.
Crevoisier, O. and Jeannerat, H. (2009). Territorial knowledge dynamics: from the proximity paradigm to multi‐location milieus. European Planning Studies 17(8), 1223‐1241.
Dasgupta, P. (2005). Economics of social capital. The Economic Record 81(255), S2 2‐21.
Dasgupta, P. and Serageldin, I. (1999). Social capital: a multifaceted perspective. Washington DC: World Bank.

References 185
De Souza Briggs, X. (1997). Social capital and the cities: Advice to change agents. National Civic Review 86(2), 111‐117.
Díaz, R., Portela, M. and Neira, I. (2011). Bienestar y felicidad: relación con la renta y el capital social en países europeos. Revista Galega de Economía 20(n. extra.), 1‐29.
DiMaggio, P. (1992). Nadel’s Paradox Revisited: Relational and Cultural Aspects of Organizational Structure. In Nohria, N. and Eccles, R. G. (Eds.). Networks and Organizations: Structure, Form and Action (pp. 118‐142). Boston, MA: Harvard Business School Press.
Donath, J. and Boyd, D. (2004). Public displays of connection. BT Technology Journal, 22(4), 71‐82.
Durlauf, S. N. (2008). Membership and inequality. In Castiglione D., Van Deth J .W. and Wolleb G. (Eds.) The Handbook of Social Capital (pp. 594‐623). New York: Oxford University Press.
Durston, J. W. (2000). ¿Qué es el capital social comunitario? SERIE Políticas Sociales n. 38. Santiago de Chile: CEPAL ‐ División de Desarrollo Social.
Dyer J. H. and Singh, H. (1998). The Relational View: Cooperative Strategy and Sources of Interorganizational Competitive Advantage. The Academy of Management Review 23(4), 660‐679.
Echevarria, T. (1968). Viaje por el país de los recuerdos. Mexico: Impresiones Modernas.
Edquist, C. (2005). Systems of innovation: technologies, institutions, and organizations. Abingdon: Routledge.
Edquist, C. (2011). Design of innovation policy through diagnostic analysis: identification of systemic problems (or failures). Industrial and Corporate Change 20(6), 1725‐1753.
Eguiguren, J. (1994). El socialismo y la izquierda vasca, 1886‐1994. Madrid: Editorial Pablo Iglesias.
Eisingerich, A. B., Bell, S. J. and Tracey, P. (2010). How can clusters sustain performance? The role of network strength, network openness, and environmental uncertainty. Research Policy 39(2), 239‐253.
Ellison, N. B., Steinfield, C. and Lampe, C. (2007). The benefits of Facebook ‘‘friends’’: Exploring the relationship between college students’ use of online social networks and social capital. Journal of Computer‐Mediated Communication 12(4), 1143‐1168.
Esser, H. (2008). The two meanings of Social Capital. In Castiglione, D., Van Deth, J.W. and Wolleb, G. (Eds.) The Handbook of Social Capital (pp. 22‐49). New York: Oxford University Press.
Estensoro, M. and Zurbano, M. (2010). Innovación social en la gobernanza territorial. Los casos de Innobasque y de las redes comarcales de la Comunidad Autónoma del País Vasco. Ekonomiaz 74, 131‐159.
Eta Kitto! (1996). Eibarko Elkarte Gastronomikoak. Eibar: Eta Kitto Euskara Elkartea.
Etxabe, I. (2018). Measuring social capital with Twitter within the electronics and ICT cluster of the Basque Country. City and Community (forthcoming), https://doi.org/10.1111/cico.12297
Etxabe, I. (2018). Social Capital in Eibar, 1886‐1985: dimensions, institutions and outcomes. Investigaciones de Historia Económica – Economic History Research (forthcoming), https://doi.org/10.1016/j.ihe.2018.02.014
Etxabe, I. and Valdaliso, J. M. (2016). Measuring structural social capital in a cluster policy network: insights from the Basque Country. European Planning Studies 24(5), 884‐903.
Eurobulegoa (2006). Cuaderno estratégico de la I+D+i vasca en Europa. Vitoria: Gobierno Vasco. Available at: http://www.euskadi.net/r33‐2288/es/contenidos/noticia/inves_euskadi_08/es_in_desa/adjuntos/cuaderno.pdf (last seen: 30/11/2016).
European Commission (2005). Social Capital. Special Eurobarometer 223.
Eurostat (2015). Social participation in the European Union. Statistics on Income and Living Conditions (SILC). Available at: http://ec.europa.eu/eurostat/statistics‐explained/index.php/Social_participation_and_integration_statistics
Eurostat (2017). Purchasing power parities (PPPs), price level indices and real expenditures for ESA 2010 aggregates. Available at: http://appsso.eurostat.ec.europa.eu/nui/submitViewTableAction.do (last seen: 29/10/2017).

186 CHAPTER i
Eustat (2012a). Encuesta de Capital Social. Available at: http://www.eustat.eus/estadisticas/tema_362/opt_0/tipo_1/ti_Capital_social/temas.html (last seen: 18/10/2017).
Eustat (2013). Encuesta de Presupuestos de Tiempo. Available at: http://www.eustat.eus/estadisticas/tema_76/opt_1/ti_Encuesta_de_condiciones_de_vida/temas.html (last seen: 18/10/2017).
Eustat (2014). Encuesta de Condiciones de Vida. Available at: http://www.eustat.eus/estadisticas/tema_77/opt_1/graficos.html (last seen: 18/10/2017).
Eustat (2016). Empresas y personas empleadas en la C.A. de Euskadi por estrato de personas empleadas según territorio de sede social. Available at: http://www.eustat.eus/elementos/ele0005800/Empresas_y_personas_empleadas_en_la_CA_de_Euskadi_por_estrato_de_personas_empleadas_segun_territorio_de_sede_social/tbl0005844_c.html (last seen: 09/11/2017).
Farr, J. (2004). Social capital: A conceptual history. Political theory 32(1), 6‐33.
Feld, S. (1981). The Focused Organization of Social Ties. American Journal of Sociology 86, 1015‐35.
Fernández de Guevara, J., Pérez García, F. and Serrano, L. (2015). Crisis Económica, confianza y capital social. Bilbao: Fundación BBVA.
Fine, B. (1999). The developmental state is dead—Long live social capital? Development and Change 30(1), 1‐19.
Fleming, L., King, C and Juda, A. I. (2007). Small worlds and regional innovation. Organization Science 18(6), 938‐954.
Florida, R. (2002). The rise of the creative class. And how it's transforming work, leisure and everyday life. New York: Basic Books.
Foley, M. W. and Edwards, B. (2001). Much Ado about Social Capital. Contemporary Sociology 30 (3), 227‐230.
Foschi, L. (2008). Microfinance and social capital. In Castiglione D., Van Deth J.W. and Wolleb G. (Eds.) The Handbook of Social Capital (pp. 467‐490). New York: Oxford University Press.
Freeman, J. (1999). Venture Capital as an Economy of Time. In Leenders R. T. A. J. and Gabbay S. M. (Eds.). Corporate Social Capital and Liability (pp. 460‐479). Boston, MA: Springer.
Freeman, L. (2004). The development of Social Network Analysis. Vancouver: Empirical Press.
Fromhold‐Eisebith, M. and Eisebith, G. (2005). How to institutionalize innovative clusters? Comparing explicit top‐down and implicit bottom‐up approaches. Research Policy 34(8), 1250‐1268.
Fromhold‐Eisebith, M. and Eisebith, G. (2008). Looking Behind Facades: Evaluating Effects of (Automotive) Cluster Promotion. Regional Studies 42(10), 1343‐1356.
Fujita, M., Krugman, P. R. and Venables, A. J. (1999). The spatial economy: cities, regions and international trade. Cambridge, MA: MIT Press.
Fukuyama, F. (1995). Trust: The social virtues and the creation of prosperity. New York: Touchstone.
Fundación BBVA (1997). Capitalización y crecimiento de la economía vasca, 1955‐1995. Bilbao: Fundación BBVA.
Fürst, D., Schubert, H., Rudolph, A. and Spieckermann, H. (2001). Regional Actors Networks between Social Capital and Regional Governance. Connections 24 (1), 42‐67.
Gabbay, S. M. and Leenders, R. T. A. J. (1999). CSC: The structure of advantage and disadvantage. In Leenders, R. T. A. J. and Gabbay, S. M. (Eds.) Corporate Social Capital and Liability (pp. 1‐14). Boston, MA: Springer.
Gabbay, S. M. and Stein, A. J. (1999). Embedding social structure in technological infrastructure: Constructing regional social capital for a sustainable peace in the Middle East. In Wright J. (Ed.) The political economy of Middle East Peace (pp. 154‐180). Boston and London: Routledge.
García Manrique, E. (1961). Eibar, Inmigración y Desarrollo Urbano e Industrial. Zaragoza: Editorial Librería General de Zaragoza.

References 187
Gaindegia (2017). Arabako kuadrillak: lurralde iraunkortasunerako diagnostikoa. Available at: http://www.gaindegia.eus/sites/gaindegia.eus/files/2017‐araba_kuadrillak‐diagnostikoa‐gaindegia.pdf (last seen: 13/10/2017).
Garapen (2016). Memoria 2016. Available at: http://www.garapen.net/documentos/ficheros/documentacion_eu/2016ko_Agentzien_Memoria.pdf (last seen: 18/10/2017).
Gargiulo, M. and Benassi, M. (1999). The dark side of social capital. In Leenders, R. T. A. J. and Gabbay, S. M. (Eds.) Corporate Social Capital and Liability (pp. 298‐322). Boston, MA: Springer.
Garrués, J. and Rubio, J. A. (2011). Redes empresariales e integración económica regional en perspectiva histórica: El caso de Andalucía. FEG‐WP 4/11. Granada: University of Granada.
GEAS ‐ Grupo de Estudios de Asociacionismo y Sociabilidad (1998). España en sociedad. Las asociaciones a finales del siglo XIX. Cuenca: Ediciones de la Universidad de Castilla‐La Mancha.
Gil Borrallo, G. (2012). Evolución del arma corta en España. Badajoz. Available at: https://books.google.es/books?id=kU1yBgAAQBAJ&printsec=frontcover&redir_esc=y#v=onepage&q&f=false (last seem: 30‐11‐2017).
Gipuzkoa Sarean (2011). Capital Social y valores en Gipuzkoa. Balance y líneas estratégicas de actuación. San Sebastián: Diputación Foral de Gipuzkoa.
Gipuzkoa Sarean (2015). Gipuzkoa Sarean, Bidean. San Sebastián: Gipuzkoako Foru Aldundia.
Gittell, R. and Vidal, A. (1998). Community organizing: Building social capital as a development strategy. Thousand Oaks, London and New Delhi: SAGE Publications.
Giuliani, E. (2005). Cluster Absorptive Capacity: Why do Some Clusters Forge Ahead and Others Lag Behind? European Urban and Regional Studies 12(3), 269‐288.
Giuliani, E. (2007). The selective nature of knowledge networks in clusters: evidence from the wine industry. Journal of Economic Geography 7(2), 139‐168.
Giuliani, E. and Bell, M. (2005). The micro‐determinants of meso‐level learning and innovation: evidence from a Chilean wine cluster. Research Policy 34(1), 47‐68.
Giuliani, E. and Pietrobelli, C. (2011). Social Network Analysis methodologies for the evaluation of Cluster Development Programs. Washington, DC: Inter‐American Development Bank.
Glaeser, E. L., Laibson, D. and Sacerdote, B. (2002). An economic approach to social capital. The Economic Journal 112, 437‐458.
Gobierno Vasco (2014). Plan de Industrialización 2014‐2016. Vitoria: Gobierno Vasco.
Gobierno Vasco (2017). Sociómetro Vasco 63 ‐ Nuevo Gobierno Vasco. Vitoria: Gobierno Vasco. Available at: http://www.euskadi.eus/contenidos/documentacion/sociometro_vasco_63/es_def/adjuntos/17sv63.pdf (last seen: 11/03/2018).
Gómez Uranga, M., Zabala‐Iturriagagoitia, J. M. and Barrutia, J. (2016). Introducing an Epigenetic Approach for the Study of Internet Industry Groups. In Gómez Uranga, M., Zabala‐Iturriagagoitia, J. M. and Barrutia, J. (Eds.) Dynamics of Big Internet Industry Groups and Future Trends (pp. 13‐52). Bilbao: Springer.
Goñi, I. (2010). Eibar y la industria armera: evidencias de un distrito industrial. Investigaciones de Historia Económica 16, 101‐133.
González‐Gómez, T. and Gualda, E. (2017). Disclosing the Relational Structure of Institutional Cross‐border Cooperation in two Cross‐borders Regions in Europe. Journal of Borderlands Studies (published online), https://doi.org/10.1080/08865655.2017.1399810 (last seen: 10/02/2017).
Gould, R. V. and Fernandez, R. M. (1989). Structures of mediation: A formal approach to brokerage in transaction networks. Sociological Methodology 19, 89‐126.
Grabher, G. (2006). Trading routes, bypasses, and risky intersections: mapping the travels of “networks” between economic sociology and economic geography. Progress in Human Geography 30(2), 163‐189.
Granovetter, M. S. (1973). The strength of weak ties. American Journal of Sociology 78(6), 1360‐1380.

188 CHAPTER i
Granovetter, M. S. (1985). Economic action and social structure: The problem of embeddedness. American Journal of Sociology 91(3), 481‐510.
Granovetter, M. S. (1992). Economic Institutions as Social Constructions: A Framework for Analysis. Acta Sociologica 35, 3‐11.
Grootaert, C. (2001). Social capital. The Missing Link? In Dekker, P. and Uslaner, E.M. (Eds.) Social Capital and Participation in Everyday life (pp. 9‐29). London: Routledge/ECPR Studies in European Political Sciences.
Grootaert, C. and Bastelaer, T. V. (2001). Understanding and Measuring Social Capital: A Synthesis of Findings from the Social Capital Initiative. Social Capital Initiative, Working Paper N. 24. Washington DC: The World Bank.
Grootaert, C. and Bastelaer, T. V. (Eds.) (2002). Understanding and measuring social capital. A multidisciplinary tool for practitioners. Washington, D.C.: The World Bank.
Guiso, L., Sapienza, P. and Zingales, L. (2011). Civic capital as the missing link. In Benhabib, J., Bisin, A. and Jackson, M.O. (Eds.) Handbook of Social Economics, vol. 1A (pp. 417‐480). San Diego: Elsevier.
Gulati, R. (1995). Social structure and alliance formation patterns: A longitudinal analysis. Administrative Science Quarterly 40, 619‐652.
Hampton, K., and Wellman, B. (2003). Neighboring in Netville: How the Internet supports community and social capital in a wired suburb. City and Community 2(4), 277‐311.
Hanneman, R. A. and Riddle, M. (2005). Introduction to Social Network Methods. Riverside, CA: University of California.
Harper, R. and Kelly, M. (2003). Measuring social capital in the United Kingdom. London: Office for National Statistics (ONS).
Harpham, T., Grant, E. and Thomas, E. (2002). Measuring social capital within health surveys: key issues. Health Policy and Planning 17(1), 106‐111.
Haynes, P. (2009). Before going any further with social capital: Eight key criticisms to address. Working Paper Series, 2. Valencia: Ingenio (CSIC‐UPV).
Hentschel, J. (1999). Contextuality and data collection methods: A framework and application for health service utilization. The Journal of Development Studies 35(4), 64‐94.
Herrero Pascual, A. M. and Montojo, V. M. (2002). El Registro Mercantil, fuente para la Historia Económica: la documentación del Archivo Histórico Provincial de Murcia. Tabula: Revista de archivos de Castilla y León 5, 233‐244.
Herreros, F. (2004). The problem of Forming Social Capital. Why Trust?. Nueva York: Palgrave.
Hoffman, J., Hoelscher, M. and Sorenson, R. (2006). Achieving sustained competitive advantage: A family capital theory. Family Business Review 19(2), 135‐145.
Holland, P. W. and Leinhardt, S. (1971). Transitivity in Structural Models of Small Groups. Comparative Groups Studies 2, 107‐24.
Hooghe, M. (2008). Voluntary Associations and socialization. In Castiglione, D., Van Deth, J.W. and Wolleb, G. (Eds.) The Handbook of Social Capital (pp. 568‐593). New York: Oxford University Press.
Hooghe, M. and Stolle, D. (2003). Generating social capital. New York: Palgrave Macmillan.
Huisman, M. and van Duijn, M. A. J. (2011). A Reader's Guide to SNA Software. In Scott J. and Carrington P. J. (Eds.) The SAGE Handbook of Social Network Analysis (pp. 578‐600). London: SAGE Publications.
Hummon, N. P. and Carley, K. (1993). Social networks as normal science. Social Networks 15(1), 71‐106.
INE ‐ Instituto Nacional de Estadística (2017a). Población residente por fecha, sexo y edad. Available at: http://www.ine.es/jaxiT3/Datos.htm?t=9681 (last seen: 29/10/2017)
INE ‐ Instituto Nacional de Estadística (2017b). España en cifras 2017. Available at: http://www.ine.es/prodyser/espa_cifras/2017/index.html#30/z (last seen: 29/10/2017)
Inglehart, R. (1997). Modernization and post‐modernization: Cultural, economic and political change in 43 societies. Princeton, NJ: Princeton University Press.
References 189
Inglehart, R. and Baker, W. E. (2000). Modernization, cultural change, and the persistence of traditional values. American Sociological Review 65(1), 19‐51.
Inkeles, A. (2000). Measuring Social Capital and its Consequences. Policy Sciences 33, 245‐268.
Innobasque (2017). Berrikuntza Gara Núm. 1. Zamudio: Innobasque.
Iparragirre, G. (2008). Debarroko oasi liberala. Eibar: UEU.
Iza‐Goñola, F. J. (2005). ALFA S.A. Motor social y económico de la vida eibarresa. Eibar: Ayuntamiento de Eibar.
Jacobs, J. (1961). The Death and Life of Great American Cities. New York: Vintage Books.
Jansen, B. J., Zhang, M., Sobel, K. and Chowdury, A. (2009). Twitter Power: Tweets as Electronic Word of Mouth. Journal of the American Society for Information Science and Technology 60(11), 2169‐2188.
Jenkins, M., and Tallman, S. (2010). The shifting geography of competitive advantage: Clusters, networks and firms. Journal of Economic Geography 10(4), 599‐618.
Jiménez Araya, T. (1974). Formación de capital y fluctuaciones económicas. Materiales para el estudio de un indicador: creación de Sociedades Mercantiles en España entre 1886 y 1970. Hacienda Pública Española 27, 137‐185.
Ji‐Young, K. (2006). The impact of Internet use patterns on political engagement: A focus on online deliberation and virtual social capital. Information Polity 11(1), 35‐49.
Kallio, A., Harmaakorpi, V. and Pihkala, T. (2010). Absorptive Capacity and Social Capital in Regional Innovation Systems: The Case of the Lahti Region in Finland. Urban Studies 47(2), 303‐319.
Kavanaugh, A. L., Reese, D. D., Carroll, J. M. and Rosson, M. B. (2005). Weak ties in networked communities. The Information Society 21(2), 119‐131.
Ketels, C. H. M. (2004). European Clusters. In Structural Change in Europe 3 ‐ Innovative City and Business Regions. Boston: Harvard Business School.
Kilduff, M. and Tsai, W. (2003). Social networks and organizations. London: SAGE publications.
Kitchen, P., Williams, A. and Simone, D. (2012). Measuring social capital in Hamilton, Ontario. Social Indicators Research 108(2), 215‐238.
Knack, S. (2002). Social capital and the quality of government: Evidence from the States. American Journal of Political Science 46(4), 772‐785.
Knack, S., and Keefer, P. (1997). Does social capital have an economic payoff? A cross‐country investigation. The Quarterly Journal of Economics 112(4), 1251‐1288.
Knoke, D. (1999). Organizational networks and corporate social capital. In Leenders, R. T. A. J. and Gabbay, S. M. (Eds.) Corporate Social Capital and Liability (pp. 17‐42). Boston, MA: Springer.
Kobayashi, T., Ikeda, K. I. and Miyata, K. (2006). Social capital online: Collective use of the Internet and reciprocity as lubricants of democracy. Information, Community and Society 9(5), 582‐611.
Kogut, B. and Zander, U. (1993). Knowledge of the firm and the evolutionary theory of the multinational corporation. Journal of International Business Studies 24(4), 625‐645.
Koka B. R. and Prescott, J. E. (2002). Strategic alliances as social capital: a multidimensional view. Strategic Management Journal 23, 795‐816.
Kraut, R., Patterson, M., Lundmark, V., Kiesler, S., Mukophadhyay, T. and Scherlis, W. (1998). Internet paradox: A social technology that reduces social involvement and psychological well‐being? American Psychologist 53(9), 1017‐1031.
Kriesi, H., Morales, L. and Walter‐Rogg, M. (2007). The political and cultural context of associational life. In Maloney W. A. and Rossteutscher, S. (Eds.) Social Capital and Associations in European Democracies. A comparative analysis (pp. 244‐267). London and New Tork: Routledge.
Krishna, A. and Shrader, E. (1999). Social Capital Assessment Tool. Conference on social capital and poverty reduction. Washington, DC: The World Bank.
Krishna, A. and Shrader, E. (2000). Cross‐cultural measures of Social Capital: a tools and results from India and Panama. Washington, DC: The World Bank.
190 CHAPTER i
Krishna, A. and Shrader, E. (2002). The Social Capital Assessment Tool: Design and Implementation. In Grootaert, C. and Bastelaer, T. V. (Eds.) Understanding and measuring social capital. A multidisciplinary tool for practitioners. Washington, DC: The World Bank.
Kristensen, P. H. (1992). Industrial districts in West Jutland, Denmark. In Pyke, F. and Sengenberger, W. (Eds.) Industrial Districts and Local Economic Regeneration (pp. 122‐173). Geneva: ILO.
Kwak, N., Shah, D. V. and Holbert, R. L. (2004). Connecting, trusting, and participating: The direct and interactive effects of social associations. Political Research Quarterly 57(4), 643‐652.
Lamikiz, X. (2017). Social capital, networks and trust in early modern long‐distance trade. In Herrero Sánchez, M. and Kaps, K. (Eds.) Merchants and Trade Networks in the Atlantic and the Mediterranean, 1550‐1800: Connectors of commercial maritime systems (pp. 39‐61). London: Routledge.
Lappé, F. M. and Du Bois, P. M. (1997). Building social capital without looking backward. National Civic Review 86(2), 119‐128.
Larrea, M. (2003). Clusters y territorio: retos del desarrollo local en la Comunidad Autónoma del País Vasco. Ekonomiaz 53, 138‐159.
Larrea, M., Aranguren, M. J. and Parrilli, M. D. (2007). El papel de los procesos de aprendizaje comarcales en las políticas regionales de competitividad e innovación. In Mujika, A. (Coord.) Regiones Iberoamericanas del Conocimiento (pp. 105‐148). San Sebastián: Universidad de Deusto.
Leana, C. R., and Van Buren, H. J. (1999). Organizational social capital and employment practices. Academy of Management Review 24(3), 538‐555.
Leenders, R. T. A. J. and Gabbay, S. M. (1999). CSC: An Agenda for the future. In Leenders, R. T. A. J. and Gabbay, S. M. (Eds.) Corporate Social Capital and Liability (pp. 483‐494). Boston, MA: Springer.
Liao, J. and Welsch, H. (2005). Roles of social capital in venture creation: Key dimensions and research implications. Journal of Small Business Management 43(4), 345‐362.
Lin, N. (1999). Building a network theory of social capital. Connections 22(1), 28‐51.
Lin, N. (2001). Social Capital. A Theory of Social Structure and Action. Cambridge: Cambridge University Press.
Lin, N. (2008). A network theory of Social Capital. In Castiglione, D., Van Deth, J.W. and Wolleb, G. (Eds.) The Handbook of Social Capital (pp. 50‐69). New York: Oxford University Press.
Lin, N. and Ensel, W. M. (1989). Life Stress and Health: Stressors and resources. American Sociological Review 54 (3), 382‐399.
Lin, N. and Erickson, B. H. (2008). Theory, Measurement, and the Research Enterprise on Social Capital. In Lin, N. and Erickson, B. H. (Eds.) Social capital: An International Research Program (pp. 1‐24). New York: Oxford University Press.
Ljunggren, M. (2016). Researcher's role in regional development: collaboration and social capital in Swedish higher education institutions. In Westlund, H. and Larsson, J. P. (Eds.) Handbook of Social Capital and Regional Development (pp. 520‐537). Cheltenham: Edward Elgar Publishing.
López, S., Elola, A., Valdaliso, J. M. and Aranguren, M. J. (2008). Los orígenes históricos del clúster de electrónica, informática y telecomunicaciones en el País Vasco y su legado para el presente. San Sebastián: Eusko Ikaskuntza and Orkestra.
Lorenzen, M. (2007). Social Capital and Localised Learning: Proximity and Place in Technological and Institutional Dynamics. Urban Studies 44(4), 799‐817.
Loury, F. (1977). A dynamic theory of racial income differences. In Wallace, P. A. and LaMond, A. (Eds.) Women, minorities and employment discrimination (pp. 153‐186). Lexington, MA: Lexington Books.
Lowndes, V., Pratchett, L. and Stoker, G. (2006). Diagnosing and remedying the failings of official participation schemes: the CLEAR framework. Social Policy and Society 5(2), 281‐291.
Lowndes, V. and Pratchett, L. (2008). Public policy and social capital. In Castiglione, D., Van Deth, J.W. and Wolleb, G. (Eds.) The Handbook of Social Capital (pp. 677‐707). New York: Oxford University Press.
Lozares, C. (1996). La teoría de redes sociales. Papers ‐ Revista de Sociología 48, 103‐126.

References 191
Lozares, C., López Roldán, P., Verd, J. M. and Martí, J. (2011). Cohesión, Vinculación e Integración sociales en el marco del Capital Social. REDES ‐ Revista hispana para el análisis de redes sociales 20, 1‐28.
Lozares, C. and Verd, J. M. (2011). De la Homofilia a la Cohesión social y viceversa. REDES ‐ Revista hispana para el análisis de redes sociales 20, 29‐50.
Luengo, F. (1999). De cómo describía a los obreros de Eibar y del País Vasco un extranjero a principios de siglo. In Barrena, E., Urrutikoetxea, J., Iparragirre, G., Luengo, F. and Miranda, P. (Eds.) Eibar 1346‐1996. Ekarpen historikoak. Aportaciones históricas. San Sebastián: Eusko Ikaskuntza‐Sociedad de Estudios Vascos.
Lundvall, B.‐Å. (1992). National Systems of Innovation: Towards a Theory of Innovation and Interactive Learning. London: Pinter.
Lundvall, B.‐Å., Johnson, B., Andersen, E. S. and Dalum, B. (2002). National systems of production, innovation and competence building. Research Policy 31(2), 213‐231.
Lundvall, B.‐Å. and Christensen, J. L. (2004). Introduction: Product innovation ‐ on why and how it matters for firms and the economy. In Burgelman, R. A. and Chesbrough, H. (Eds.) Product Innovation, Interactive Learning and Economic Performance (pp 1‐18). Amsterdam: Elsevier.
Mackinnon, D., Chapman, K. and Cumbers, A. (2004). Networking, trust and embeddedness amongst SMEs in the Aberdeen oil complex. Entrepreneurship and Regional Development 16, 87‐106.
Mael, F. A. and Ashforth, B. E. (1995). Loyal from day one: Biodata, organizational identification, and turnover among newcomers. Personnel Psychology 48(2), 309‐333.
Maggioni, M. A., Nosvelli, M. and Uberti, T. E. (2007). Space versus networks in the geography of innovation: a European analysis. Papers in Regional Studies 86(3), 471‐493.
Magro, E. (2014). Regional Innovation Monitor Plus. Regional Innovation Report (Basque Region). Brussels: Technopolis Group.
Magro, E., Navarro, M. and Zabala‐Iturriagagoitia, J. M. (2014). Coordination‐Mix: The Hidden Face of STI Policy. Review of Policy Research 31(5), 367‐389.
Maillat, D. (1995). Territorial dynamic, innovative milieus and regional policy. Entrepreneurship and Regional Development 7(2), 157‐165.
Maillat, D. (2001). Territory and innovation: the role of the milieu. In Sweeney, G. (Ed.) Innovation, Economic Progress and the Quality of Life (pp. 137‐143). Cheltenham: Edward Elgar.
Malecki, E. J. (2012). Regional Social Capital: Why it Matters. Regional Studies 46(8), 1023‐1039.
Malmberg, A. (2003). Beyond the cluster‐local milieus and global connections. In Peck, J. and Yeung, H.W‐C. (Eds.) Remaking the Global Economy: Economic Geographical Perspective (pp. 145‐159). London: SAGE Publications.
Malmberg, A., Sölvell, Ö. and Zander, I. (1996). Spatial clustering, local accumulation of knowledge and firm competitiveness. Geografiska Annaler, Series B, Human Geography 78(2) 85‐97.
Malmberg, A. and Maskell, P. (2002). The elusive concept of localization economies: towards a knowledge‐based theory of spatial clustering. Environment and Planning A: Economy and Space 34(3), 429‐449.
Maloney, W. A. (2008). Interest groups, social capital and democratic politics. In Castiglione, D., Van Deth, J.W. and Wolleb, G. (Eds.) The Handbook of Social Capital (pp. 303‐326). New York: Oxford University Press.
Marsden, P. V. (1990). Network data and measurement. Annual Review of Sociology 16(1), 435‐463.
Martin, R. and Sunley, P. (2003). Deconstructing Clusters: Chaotic Concept or Policy Panacea? Journal of Economic Geography 3(1), 5‐35.
Martin, R. and Trippl, M. (2014). System failures, knowledge bases and regional innovation policies. disP ‐ The Planning Review 50(1), 24‐32.
Maskell, P. and Malmberg, A. (1999). Localised learning and industrial competitiveness. Cambridge Journal of Economics 23(2), 167‐185.
Membiela, M. (2016). La teoría del Capital Social. La Coruña: Camiño do Faro.

192 CHAPTER i
Miles, M. B. and Huberman, A. M. (1994). Qualitative data analysis: An expanded sourcebook. Thousand Oaks, London and New Delhi, SAGE Publications.
Mizruchi, M. S. (1996). What Do Interlocks Do? An Analysis, Critique, and Assessment of Research on Interlocking Directorates. Annual Review of Sociology 22, 271‐298.
Montero, J. R. and Torcal, M. (1990). La cultura política de los españoles: pautas de continuidad y cambio. Sistema. Revista de Ciencias Sociales (99), 39‐74.
Moran, P. (2005). Structural vs. Relational Embeddedness: Social Capital a Managerial Performance. Strategic Management Journal 26, 1129‐1151.
Morgan, K. (1997). The learning region: institutions, innovation and regional renewal. Regional Studies 31, 491‐503.
Morgan, K. (2013). The regional state in the era of Smart Specialisation. Ekonomiaz 83(2), 103‐125.
Morgan, D. L., Neal, M. B. and Carder, P. (1996). The Stability of Core and Peripheral networks over time. Social Networks 19 (1), 9‐25.
Morrison, A. (2008). Gatekeepers of Knowledge within Industrial Districts: Who They Are, How They Interact. Regional Studies 42(6), 817‐835.
Morrison, A. and Rabellotti, R. (2009). Knowledge and information networks in an Italian wine cluster. European Planning Studies 17(7), 983‐1006.
Mota, F. and Subirats, J. (2000). El quinto elemento: el capital social de las comunidades autónomas. Su impacto sobre el funcionamiento del sistema político autonómico. Revista Española de Ciencia Política (2), 123‐158.
Moulaert, F. and Nussbaumer, J. (2008). La logique sociale du développement territorial. Québec: Presses de l’Université du Québec.
Mujika, A., Ayerbe, M., Ayerbe, O., Elola, A. and Navarro, I. (2010). Manual para la autoevaluación del capital social en las organizaciones. San Sebastián: Orkestra.
Mulgan, G. (2006). The process of social innovation. Innovations 1(2), 145‐162.
Muthusamy, S. K. and White, M. A. (2005). Learning and knowledge transfer in strategic alliances: a social exchange view. Organization Studies 26(3), 415‐441.
Nahapiet, J. and Ghoshal, S. (1998). Social Capital, Intellectual Capital, and the Organizational Advantage. Academy of Management Review 23(2), 242‐266.
Narbaiza, A. (2008). Muguruza aita‐semeak. Los Muguruza de Eibar. Eibar: Ego Ibarra Batzordea.
Navarro, M. (2010). Retos para el País Vasco, tras tres décadas de desarrollo del sistema y de las políticas de innovación. Ekonomiaz 25 Anniv.(3), 136‐183.
Nie, N. H. (2001). Sociability, interpersonal relations, and the Internet: Reconciling conflicting findings. American Behavioral Scientist 45(3), 420‐435.
Nie, N. H. and Hillygus, D. S. (2002). The impact of Internet use on sociability: Time‐diary findings. IT and Society 1(1), 1‐20.
Nooteboom, B. (2000). Learning and Innovation in Organizations and Economies. Oxford: Oxford University Press.
Norris, P. and Jones, D. (1998). Virtual democracy. The International Journal of Press/Politics 3(2), 1‐4.
North, D. (1990). Institutions, Institutional Change and Economic Performance. New York: Cambridge University Press.
OECD (1999). Boosting innovation. The cluster approach. OECD proceedings. Paris: OECD Publications Service.
OECD (2007). Clusters, innovation and entrepreneurship. OECD Publishing.
OECD (2011). OECD Reviews of Regional Innovation: Basque Country, Spain. OECD Publishing.
Oinas, P. (2002). Competition and collaboration in interconnected places: towards a research agenda. Geografiska Annaler: Series B, Human Geography 84(2), 65‐76.
Olazarán, M., Albizu, E. and Otero, B. (2009). Technology Transfer between Technology Centres and SMEs: Evidence from the Basque Country. European Planning Studies 17(3), 345‐363.
References 193
Orkestra (2009). II Informe de Competitividad del País Vasco: hacia el estadio competitivo de la innovación. San Sebastián: Orkestra.
Orkestra (2017). Informe de Competitividad del País Vasco 2017. ¿Y mañana?. San Sebastián: Fundación Deusto.
Orr, J. E. (1990). Sharing knowledge, celebrating identity: Community memory in a service culture. In D. Middleton & D. Edwards (Eds.) Inquiries in social construction. Collective remembering (pp. 169‐189). Thousand Oaks: SAGE Publications.
Otazu, A., and Díaz de Durana, J. R. (2008). El espíritu emprendedor de los vascos. Madrid: Silex Ediciones.
Otzerinjauregi, M. and Sangroniz, M. (2001). Eibar kantuz kantu. Eibar: Comisión Ego Ibarra.
Paldam, M. (2000). Social capital: one or many? Definition and measurement. Journal of Economic Surveys 14(5), 629‐653.
Parejo, A. (2006). De la región a la ciudad. Hacia un nuevo enfoque de la historia industrial española contemporánea. Revista de Historia Industrial 30, 53‐101.
Parrilli, M. D. (2013). Unveiling the Black‐Box of Innovation: A Methodological Tool for the Analysis of Efficiency of Regional Innovation Systems. Journal of Strategic Management Education, 9(1). Available at: http://senatehall.com/strategic‐management?article=461 (last seen: 30/11/2017).
Paxton, P. (1999). Is Social Capital Declining in the United States? A Multifaceted Indicator Assessment. The American Journal of Sociology 105 (1), 88‐127.
Paxton, P. (2007). Association Memberships and Generalized Trust: A Multilevel Model Across 31. Social Forces 86 (1), 47‐76.
Peiró, P. J. and Tortosa, E. (2012). Social Capital, Investment and Economic Growth. Evidence for Spanish Provinces. Documentos de trabajo 14. Bilbao: Fundación BBVA.
Pena, J. A. and Sánchez, J. M. (2009). La dotación de capital social como factor determinante de la corrupción. Revista de Economía Mundial (22), 197‐219.
Pena, J. A. and Sánchez, J. M. (2013). El capital social individual: lo micro y lo macro en las relaciones sociales. In Veira, J. L. (Coord.) Desigualdad y Capital Social en España (pp. 11‐31). Oleiros: Netbiblo.
Pennings, J. M. and Lee, K. (1999). Social Capital of Organization: Conceptualization, Level of Analysis, and Performance Implications. In Leenders, R. T. A. J. and Gabbay, S. M. (Eds.) Corporate Social Capital and Liability (pp. 43‐67). Boston, MA: Springer.
Pérez García, F., Montesinos, V., Serrano L. and Fernández de Guevara, J. (2005). La medición del capital social: una aproximación económica. Bilbao: Fundación BBVA.
Piore, M. and Sabel, C. (1984). The Second Industrial Divide: Possibilities for Prosperity. New York: Basic Books.
Plickert, G., Côté, R. R. and Wellman, B. (2007). It's not who you know, it's how you know them: Who exchanges what with whom? Social Networks 29(3), 405‐429.
Polanyi, K. (1944) [2001]. The Great Transformation. The Political and Economic Origins of Our Time. Boston: Beacon Press.
Popielarz, P. A. (1999). Organizational constraints on personal network formation. Research in the Sociology of Organizations 16, 263‐281.
Porter, M. E. (1998). Clusters and competition: New agenda for companies, governments and institutions. In Porter, M. E. (Ed.) On competition (pp. 197‐288). Boston, MA: Harvard Business School Press.
Porter, M. E., Ketels, C. H. M. and Valdaliso, J. M. (2013). The Basque Country: Strategy for Economic Development. Harvard: Harvard Business School.
Portes, A. (1998). Social capital: Its origins and applications in modern sociology. Annual Review of Sociology 24(1), 1‐24.
Portes, A. (2000). The two meanings of social capital. Sociological Forum 15 (1), 1‐12.
Portes, A. and Sensenbrenner, J. (1993). Embeddedness and immigration: Notes on the social determinants of economic action. American Journal of Sociology 98(6), 1320‐1350.
Portes, A. and Landolt, P. (1996). The downside of social capital. The American Prospect 26(1), 18‐21.

194 CHAPTER i
Posner, D. and Boix, C. (2000). Capital social y democracia. Revista Española de ciencia política 2, 159‐186.
Putnam, R. D. (1993). Making Democracy Work: Civic Traditions in Modern Italy. New Jersey: Princeton University Press.
Putnam, R. D. (1995). Bowling alone: America's declining social capital. Journal of Democracy 6(1), 65‐78.
Putnam, R. D. (2000). Bowling alone: The collapse and revival of American community. New York: Simon and Schuster.
Putnam, R. D. (2002). Democracies in flux: The evolution of social capital in contemporary society. New York: Oxford University Press.
Putnam, R. D. (2003). El declive del capital social. Un estudio internacional sobre las sociedades y el sentido comunitario. Barcelona: Galaxia Gutemberg.
Raacke, J. and Bonds‐Raacke, J. (2008). MySpace and Facebook: Applying the uses and gratifications theory to exploring friend‐networking sites. Cyberpsychology and behavior 11(2), 169‐174.
Ramírez, J. (2005). Tres visiones sobre capital social: Bourdieu, Coleman y Putnam. Acta Republicana: Política y Sociedad 4(4), 21‐36.
Raiser, M. (2008). Social capital in transition economies. In Castiglione D., Van Deth J. W. and Wolleb G. (Eds.) The Handbook of Social Capital (pp. 491‐519). New York: Oxford University Press.
Rallet, A. and Torre, A. (1999). Is geographical proximity necessary in the innovation networks in the era of global economy? GeoJournal 49(4), 373‐380.
Ramírez, E. (1984). Cuadrillas en el País Vasco: Identidad Local y revitalización étnica. Revista Española de Investigaciones Sociológicas 25, 213‐222.
Rao, V. and Woolcock, M. (2003). Integrating qualitative and quantitative approaches in program evaluation. In Bourguignon, F. and Pereira da Silva, L. A. (Eds.) The impact of economic policies on poverty and income distribution: Evaluation techniques and tools (pp. 165‐190). Washington, DC: The World Bank and Oxford University Press.
Räsänen, P. and Kouvo, A. (2007). Linked or divided by the web? Internet use and sociability in four European countries. Information, Community and Society 10(2), 219‐241.
Requena, F. (1989). El concepto de red social. Revista Española de Investigaciones Sociológicas 48, 137‐152.
Requena, F. (2008). Redes sociales y sociedad civil. Madrid: Centro de Investigaciones Sociológicas.
Resnick, P. (2001). Beyond bowling together: Sociotechnical capital. In Carroll, J. M. (Ed.) HCI in the New Millennium (pp. 247‐272). Boston, MA: Addison‐Wesley.
Revilla, M. A. (2012). Measurement invariance and quality of composite scores in a face‐to‐face and a web survey. Survey Research Methods 7(1), 17‐28.
Robison, L. J., Siles, M. and Schmid, A. (2003). El capital social y la reducción de la pobreza: hacia un paradigma maduro. In Atria, R., Siles, M., Arriagada, I., Robison, L. J. and Whiteford, S. (Eds.) Capital social y reducción de la pobreza en América Latina y el Caribe: en busca de un nuevo paradigma (pp. 51‐113). Santiago de Chile: CEPAL and Michigan State University.
Roche, M. (2004). Social Policy and Social Capital: A Clear Case of Putting Merit before Method? Social Policy and Society 3 (2), 97‐111.
Rose, R. (1998). Getting things done in an anti‐modern society: Social capital networks in Russia (Vol. 6). Washington, DC: World Bank.
Rosenfeld, S. A. (2003). Expanding Opportunities: Cluster Strategies That Reach More People and More Places 1. European Planning Studies 11(4), 359‐377.
Rossman, G. B. and Wilson, B. L. (1994). Numbers and words revisited: Being “shamelessly eclectic”. Quality & Quantity 28(3), 315‐327.
Rubio, J. A. and Garrués, J. (2017). Sistemas empresariales locales y territorios de progreso en Andalucía, 1886‐1959. Revista de Historia Industrial 68, 81‐117.
Rutten, R. and Boekema, F. (2007). The learning region: foundations, state of the art, future. London: Routledge.

References 195
Rutten, R., Westlund, H. and Boekema, F. (2010). The Spatial Dimension of Social Capital. European Planning Studies 18(6), 863‐871.
Rychen, F. and Zimmermann, J.‐B. (2008). Clusters in the Global Knowledge‐based Economy: Knowledge Gatekeepers and Temporary Proximity. Regional Studies 42(6), 767‐776.
Sánchez, J. M. and Pena, J. A. (2005). Actividad asociativa, confianza y generación de capital social: evidencia empírica. Ekonomiaz 59(2), 136‐159.
Sarasketa, P. (2000). Eibar: Monografía descriptiva de esta noble y leal villa Guipuzcoana. Eibar: Ego Ibarra.
Saxenian, A. (1994). Regional Advantage. Cambridge, MA: Harvard University Press.
Saxenian, A. (1996). Inside‐out: regional networks and industrial adaptation in Silicon Valley and Route 128. Cityscape 2(2), 41‐60.
Schiff, M. (1992). Social capital, labor mobility, and welfare: The impact of uniting states. Rationality and Society, 4(2), 157‐175.
Schmiedeberg, C. (2010). Evaluation of Cluster Policy: A Methodological Overview. Evaluation 16(4), 389‐412.
Schmitz, H. and Nadvi, K. (1999). Clustering and Industrialization: Introduction. World Development 27(9), 1503‐1514.
Schuller, T. (2006). Social capital, networks, and communities of knowledge. In Kahin, B. and Foray, D. (Eds.) Advancing Knowledge and the Knowledge Economy (pp. 75‐89). Cambridge: MIT Press.
Scott, J. (1987). Social Networks Analysis. London: Sage Publications.
Scott, J. (1991). Social network analysis: A handbook. Newbury Park, CA: Sage Publications.
Semitiel, M. (2006). Social Capital, Networks and Economic Development. An Analysis of Regional Productive Systems. Cheltenham: Edward Elgar Publishing.
Serageldin, I. (1996). Sustainability as opportunity and the problem of social capital. The Brown Journal of World Affairs 3(2), 187‐203.
Serrat, O. (2010). Social Network Analysis. Washington, DC: Asian Development Bank.
Shah, D. V., Kwak, N. and Holbert R. L. (2001). 'Connecting' and 'disconnecting' with civic life: Patterns of Internet use and the production of social capital. Political Communication 18(2), 141‐162.
Shah, D. V., Schmierbach, M., Hawkins, J., Espino, R. and Donavan, J. (2002). Nonrecursive models of Internet use and community engagement: Questioning whether time spent online erodes social capital. Journalism and Mass Communication Quarterly 79(4), 964‐987.
Sides, J. (1999). It takes two: The reciprocal relationship between Social Capital and Democracy. WP99‐11. Berkeley, CA: Institute of Governmental Studies.
Sobel, J. (2002). Can we trust social capital?. Journal of Economic Literature 40(1), 139‐154.
Sölvell, Ö., Lindqvist, G. and Ketels, C. (2003). The Cluster Initiative Greenbook. Stockholm: Ivory Tower AB.
Sölvell, Ö., Ketels, C. and Lindqvist, G. (2009). EU cluster mapping and strengthening clusters in Europe. Luxembourg: The European Cluster Observatory, Center for Strategy and Competitiveness.
Spilling, O. R. (1996). The entrepreneurial system: On entrepreneurship in the context of a mega‐event. Journal of Business Research 36(1), 91‐103.
Staber, U. (2007). Contextualizing Research on Social Capital in Regional Clusters. International Journal of Urban and Regional Research 31(3), 505‐521.
Starr, J. A. and MacMillan, I. C. (1990). Resource cooptation via social contracting: Resource acquisition strategies for new ventures. Strategic Management Journal 11 (Special Issue), 79‐92.
Stolle, D. (2004). Communities, Social Capital and Local Government: Generalized Trust in Regional Settings. In S. Prakash, S. and Selle, P. (Eds.) Investigating social capital: Comparative perspectives on civil society, participation and governance (pp. 184‐206). New Delhi: SAGE.
Stone, W. (2001). Measuring Social Capital. Towards a Theoretically Informed Measurement Framework for Researching Social Capital in Family and Community Life. Research Paper 24, 1‐38.

196 CHAPTER i
Storper, M. and Venables, A. J. (2004). Buzz: face‐to‐face contact and the urban economy. Journal of Economic Geography 4(4), 351‐370.
Stuart, T. E. (1998). Network positions and propensities to collaborate: an investigation of strategic alliance formation in a high‐technology industry. Administrative Science Quarterly 43(3), 668‐698.
Stuart, T. E. (1999). Technological Prestige and the Accumulation of Alliance Capital. In Leenders R. T. A. J. and Gabbay S. M. (Eds.) Corporate Social Capital and Liability (pp. 376‐389). Boston, MA: Springer.
Stuart, T. E., Hoang, H. and Hybels, R. C. (1999). Interorganizational Endorsements and the Performance of Entrepreneurial Ventures. Administrative Science Quarterly 44, 315‐349.
Suire, R. and Vicente, J. (2009). Why do some places succeed when others decline? A social interaction model of cluster viability. Journal of Economic Geography 9(3), 381‐404.
Swedberg R. and Granovetter, M. (1992). Introduction. In Granovetter, M. and Swedberg, R. (Eds.) The Sociology of Economic Life (pp. 1‐19). Oxford: Westview.
Swyngedouw, E. (2005). Governance innovation and the citizen: the Janus face of governance‐beyond‐the‐state. Urban Studies 42(11), 1991‐2006.
Szreter, S. (2002). The state of social capital: Bringing back in power, politics, and history. Theory and Society 31(5), 573‐621.
Ter Wal, A. L. J. and Boschma, R. A. (2009). Applying social network analysis in economic geography: framing some key analytic issues. The Annals of Regional Science 43(3), 739‐756.
Thomas, C. Y. (1996). Capital markets, financial markets and social capital. Social and Economic Studies 45(2/3), 1‐23.
Tödtling, F. and Trippl, M. (2005). One size fits all? Towards a differentiated regional innovation policy approach. Research Policy 34(8), 1203‐1219.
Tödtling, F., Lehner, P. and Kaufmann, A. (2009). Do different types of innovation rely on specific kinds of knowledge interactions? Technovation 29(1), 59‐71.
Tödtling, F., Asheim, B. and Boschma, R. (2013). Knowledge sourcing, innovation and constructing advantage in regions of Europe. European Urban and Regional Studies 20 (2), 161‐169.
Trusov, M., Bucklin, R. E. and Pauwels, K. (2009). Effects of word‐of‐mouth versus traditional marketing: Findings from an Internet social networking Site. Journal of Marketing 73(5), 90‐102.
Tsai, W. (2000). Social Capital, Strategic Relatedness and the Formation of Intraorganizational Linkages. Strategic Management Journal 21(9), 925‐939.
Tsai, W. and Ghoshal, S. (1998). Social Capital and Value Creation: The Role of Intrafirm Networks. The Academy of Management Journal 41(4), 464‐476.
Uphoff, N. (2000). Understanding social capital: learning from the analysis and experience of participation. In Dasgupta, P. and Serageldin, I. (Eds.) Social capital: a multifaceted perspective (pp. 215‐249). Washington DC: World Bank.
Urdangarín, C. (1986). La reestructuración industrial de la Comunidad Autónoma del País Vasco. Ekonomiaz 3(2), 77‐90.
Urdangarín, C. and Aldabaldetrecu, F. (1982). Historia técnica y económica de la máquina‐herramienta. San Sebastián: Caja de Ahorros Provincial de Guipúzcoa.
Uslaner, E. M. (2008). Trust as a moral value. In Castiglione, D., Van Deth, J. W. and Wolleb, G. (Eds.) The Handbook of Social Capital (pp. 101‐121). New York: Oxford University Press.
Utterback, J. (1974). Innovation in industry and the diffusion of technology. Science 183, 620‐626.
Uyarra, E. and Ramlogan, R. (2012). The Effects of Cluster Policy on Innovation. Nesta Working Paper 12/05. London: National Endowment for Science, Technology and the Arts (NESTA).
Uzzi, B. (1999). Embeddedness in the making of financial capital: How social relations and networks benefit firms seeking financing. American Sociological Review 64(4), 481‐505.

References 197
Uzzi, B. and Spiro, J. (2005). Collaboration and Creativity: The Small World Problem. American Journal of Sociology 111(2), 447‐504.
Valdaliso, J. M. (1988). Grupos empresariales e inversión de capital en Vizcaya, 1886‐1913. Revista de Historia Económica 6(1), 11‐40.
Valdaliso, J. M. (2003). El factor empresarial y la industrialización del País Vasco (1841‐1914). In Capistegui, F. J. and Larraza, M. (Eds.) Modernización, desarrollo económico y transformación social en el País Vasco y Navarra (pp. 31‐63). Pamplona: Ediciones Eunate.
Valdaliso, J. M. (2006). El factor empresarial y el desarrollo económico de España en los siglos XIX y XX: algunas reflexiones derivadas de la producción historiográfica de los últimos veinte años. In Barciela López, C., Chastagnaret, C. and Escudero Gutierrez, A. (Eds.) La historia económica en España y Francia (siglos XIX y XX) (pp. 235‐286). San Vicente del Raspeig: Universidad de Alicante.
Valdaliso, J. M., Elola, A., Aranguren, M. J. and López, S. (2010). Social capital, knowledge and competitiveness: the case of clusters of paper and the TEICs of the CAPV. In Parrilli, M. D. (coord.) Innovation and learning: lessons for policy design (pp. 352‐375). Zamudio: Innobasque and Orkestra.
Valdaliso, J. M. (2015). Presentación general del clúster de la energía de la CAPV. In Cuadernos del Informe de Competitividad del País Vasco 2015. Número 3: Sectores y clústeres (pp. 99‐115). San Sebastián: Deusto Publicaciones.
Valdaliso, J. M. and López, S. (2007). Historia económica de la empresa. Barcelona: Crítica.
Valdaliso, J. M. and López, S. (2008). Personas innovando. La industria de las tecnologías electrónicas y de la información en el País Vasco, GAIA (1983‐2008). San Sebastián: GAIA‐SPRI.
Valdaliso, J. M., Elola, A., Aranguren, M. J. and López, S. (2011). Social capital, internationalization and absorptive capacity: The electronics and ICT cluster of the Basque Country. Entrepreneurship and Regional Development: An International Journal 23(9‐10), 707‐733.
Valdaliso, J. M., Elola, A., Aranguren, M. J. and López, S. (2012). Social Capital, Knowledge, and Competitiveness: The Cases of the Basque Paper and Electronics/ICT Clusters. In Asheim, B. T. and Parrilli, M. D. (Eds.) Interactive Learning for Innovation (pp. 161‐180). Palgrave Macmillan, London.
Valdaliso, J. M., Magro, E., Navarro, M., Aranguren, M.J. and Wilson, J. R. (2014). Path dependence in policies supporting smart specialisation strategies. European Journal of Innovation Management 17(4), 390‐408.
Valdaliso, J. M. (2018). Innobasque 2007‐2017: ten years driving innovation in the Basque Country. Bilbao: Innobasque.
Valdour, J. (2000). El obrero español. Experiencias vividas (el País Vasco). Bilbao: Servicio Editorial de la Universidad del País Vasco.
Van der Gaag, M. and Snijders, T. A. (2005). The Resource Generator: social capital quantification with concrete items. Social Networks 27(1), 1‐29.
Van der Gaag, M., Snijders, T. A. and Flap, H. D. (2008). Position generator measures and their relationship to other social capital measures. In Lin, N. and Erickson, B. (Eds.) Social capital: An International Research Program (pp. 27‐49). New York: Oxford University Press.
Van der Meer, J. (2003). Rain or Fog? An Empirical Examination of Social Capital's Rainmaker Effects. In Hooghe, M. and Stolle, D. (Eds.) Generating Social Capital. Civil Society and Institutions in Comparative Perspective (pp. 133‐151). New York: Palgrave Macmillan.
Van Deth, J. W. (2008). Measuring Social Capital. In Castiglione, D., Van Deth, J. W. and Wolleb, G. (Eds.) The Handbook of Social Capital (pp. 150‐176). New York: Oxford University Press.
Velasco, R. and Zabalo, F. (1987). Crisis económica y localización industrial: el caso de la Comunidad Autónoma del País Vasco. Ekonomiaz 7‐8, 99‐128.
Verba, S., Nie, N. and Kim, J.‐O. (1978). Participation and Political Equality. New York: Cambridge University Press.
Verba, S., Schlozman, K. and Brady, H. (1995). Voice and Equality: Civic Volunteerism in American Politics. Cambridge: Harvard University Press.

198 CHAPTER i
Visser, E‐J. (1999). A Comparison of Clustered and Dispersed Firms in the Small‐scale Clothing Industry of Lima. World Development 27, 1553‐1570.
Walker, G., Kogut, B. and Shan, W. (1997). Social capital, structural holes and the formation of an industry network. Organization Science 8(2), 109‐125.
Warren, M. E. (2008). The nature and logic of bad social capital. In Castiglione, D., Van Deth, J. W. and Wolleb, G. (Eds.) The Handbook of Social Capital (pp. 122‐149). New York: Oxford University Press.
Wasserman, S. and Faust, K. (1994). Social Network Analysis. Methods and Applications. Cambridge: Cambridge University Press.
Watts, D. (1999). Networks, dynamics, and the small‐world phenomenon. American Journal of Sociology 105(2), 493‐527.
Watts, C. and Shrader, E. (1998). How to do (or not to do)… The genogram: a new research tool to document patterns of decision‐making, conflict and vulnerability within households. Health Policy and Planning 13(4), 459‐464.
Watts, D. and Strogratz, S. (1998). Collective dynamics of ‘small world’ networks. Nature 393, 440‐442.
Wellman, B. (1988). Structural Analysis: from Method and Metaphor to Theory and Substance. In Wellman, B., and Berkowitz, S.D. (Eds.) Social Structure. A Networks Approach (pp. 19‐60). Cambridge: Cambridge University Press.
Wellman, B. (2007). Challenges in Collecting Personal Network Data: The Nature of personal Network Analysis. Field Methods 19, 111‐115.
Wellman, B., Haase, A. Q., Witte, J. and Hampton, K. (2001). Does the Internet increase, decrease, or supplement social capital? Social networks, participation, and community commitment. American Behavioral Scientist, 45(3), 436‐455.
Westlund, H. (2006). Social capital in the knowledge economy: Theory and empirics. New York: Springer.
Westlund, H. and Nilsson, E. (2005). Measuring enterprises’ investments in social capital: a pilot study. Regional Studies 39, 1079‐1094.
Westlund, H. and Adam, F. (2010). Social Capital and Economic Performance: a Meta‐Analysis of 65 Studies. European Planning Studies 18(6), 896‐919.
Westlund, H. and Larsson, J. P. (2016). Handbook of Social Capital and Regional Development. Cheltenham: Edward Elgar Publishing.
Westphal, J. D., Boivie, S. and Chng, D. H. M. (2006). The strategic impetus for social network ties: reconstituting broken CEO friendship ties. Strategic Management Journal 27, 425‐445.
Williams, D. (2006). On and off the ’Net: Scales for social capital in an online era. Journal of Computer‐Mediated Communication 11(2), 593‐628.
Williams, S. A., Terras, M. and Warwick, C. (2013). What do people study when they study Twitter? Classifying Twitter related academic papers. Journal of Documentation 69(3), 384‐410.
Wolleb, G. (2008) Introduction: social capital and economic development. In Castiglione, D., Van Deth, J. W. and Wolleb, G. (Eds.) The Handbook of Social Capital (pp. 373‐384). New York: Oxford University Press.
Woolcock, M. (1998). Social capital and economic development: Toward a theoretical synthesis and policy framework. Theory and Society 27(2), 151‐208.
Woolcock, M. (2001). The place of social capital in understanding social and economic outcomes. Canadian Journal of Policy Research 2(1), 11‐17.
World Bank (2007). Overview of Social Capital. Available at: http://go.worldbank.org/C0QTRW4QF0 (last seen: 22‐05‐2013).
Zabala, L. (2011). Éxodo y cierre de las empresas industriales de Eibar (1940‐2011). Eibar: Obra Social La Caixa.
Zahra, S.A. and George, G. (2002). Absorptive Capacity: A Review, Reconceptualization, and Extension. Academy of Management Review 27(2), 185‐203.

References 199
Zubiaurre, A. (2002). Cooperación entre empresas y centros tecnológicos en la política tecnológica vasca. Economía Industrial 346(4), 115‐126.
Zubiri, I. (2010). The Economic Agreement between the Basque Country and Spain: principles, characteristics and economic implications. Bilbao: Ad Concordiam.


APPENDIXES ii


Appendixes 203
APPENDIXES
Appendix 1: Power distribution in the Basque Country
Level of Government Powers
European Union Development (structural funds)
Monetary Policy
Tariffs and currency
Economic Regulation (environment, etc.)
Common Agricultural Policy
Spanish Government Defense and Foreign Policy
Economic Regulation (education, labour relations, energy, financial system…)
Social security (retirement pensions) and unemployment subsidies
Large transport infrastructures (highways, airports, ports, railways)
Payments to EU administration
Customs, Prisons
Basque Government Health
Education and training
Public safety, law and police
Social assistance and welfare
Economic promotion and development (agriculture and fishing, industry, commerce and tourism, transport, environment)
R&D (in coordination with the Spanish Government)
Labour and employment, lifelong training
Railways (regional), underground system and small ports
Housing and urbanism
Culture
Provincial Councils Treasury and tax collection
Roads, transport and hydraulic infrastructures
Economic promotion and development
Agriculture and forestry
Social assistance and welfare
Urbanism
Culture
Municipalities Sports and culture
Housing and urbanism
Public health
Public safety
Urban transport
Social services
Source: Porter et al., (2013).

204 CHAPTER ii
Appendix 2: Social capital index in Spanish regions
REGION Interest in
regional politics
Daily press reading population over 14 (%)
Degree of political inform
ation about the Regional Governmen
t
INDEX
OF CITIZEN
ENGAGEM
ENT (factor score)
Economic and professional associations
Philanthropic and assistance associations
CONTINUUM COORDINATION‐COOPER
ATION (factor score)
INDEX
OF ASSOCIATIVE PARTICIPATION (factor score)
SOCIAL CAPITAL INDEX
The Basque Country 47 57 36 2,0110 2,2 3,6 2,234 1,4858 2,258
Navarre 42 61 34 1,7136 2,2 3,1 1,601 1,1650 1,793
La Rioja 46 49 27 1,0480 2,7 2,4 0,256 1,4299 1,232
Valencian Community 36 36 26 0,1684 2,2 1,7 ‐0,113 0,6547 0,354
Madrid 42 34 27 0,4934 4,3 2,2 ‐1,466 1,0048 0,294
Aragon 38 39 22 0,0224 3,4 2,0 ‐0,935 0,9619 0,201
Balearic Islands 38 47 20 0,1100 2,6 2,2 0,592 0,1398 0,133
Catalonia 40 44 30 0,8386 3,8 2,0 ‐1,228 0,0190 0,073
Andalusia 33 29 23 ‐0,3758 1,8 2,0 0,620 ‐0,4112 ‐0,196
Galicia 39 36 22 0,0147 2,1 1,6 ‐0,169 ‐0,6169 ‐0,329
Castile‐La Mancha 24 22 18 ‐1,3966 1,8 2,1 0,699 0,0074 ‐0,455
Asturias 17 49 23 ‐0,3758 2,2 1,3 ‐0,644 ‐0,0652 ‐0,456
Castile and Leon 17 57 13 ‐1,1121 3,4 2,2 ‐0,716 ‐0,6718 ‐0,611
Murcia 23 29 17 ‐1,3350 2,3 2,4 0,647 ‐0,8771 ‐0,855
Canary Islands 37 38 22 ‐0,0399 3,1 1,6 ‐1,186 ‐1,0856 ‐0,857
Extremadura 27 31 17 ‐1,0650 1,8 1,8 0,404 ‐1,3225 ‐1,005
Cantabria 17 57 13 ‐1,1121 3,4 2,2 ‐0,716 ‐1,8180 ‐1,572
Source: self‐elaboration, based on Mota and Subirats (2000).
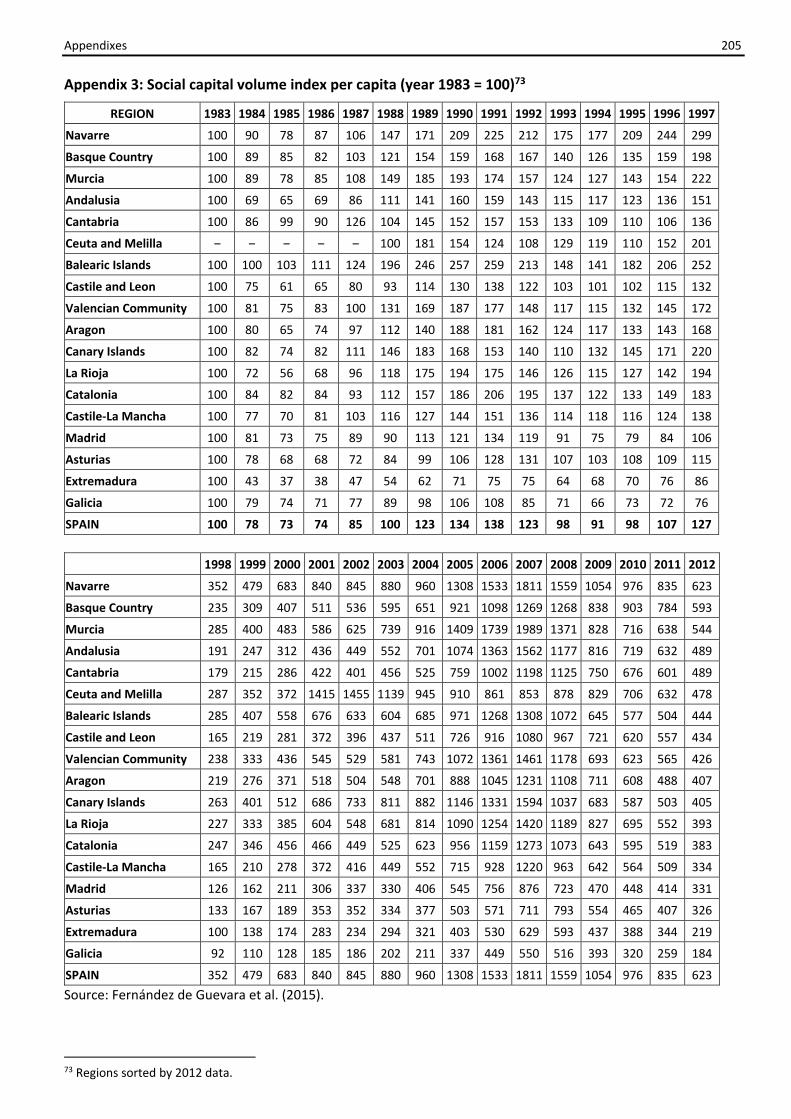
Appendixes 205
Appendix 3: Social capital volume index per capita (year 1983 = 100)73
REGION 1983 1984 1985 1986 1987 1988 1989 1990 1991 1992 1993 1994 1995 1996 1997
Navarre 100 90 78 87 106 147 171 209 225 212 175 177 209 244 299
Basque Country 100 89 85 82 103 121 154 159 168 167 140 126 135 159 198
Murcia 100 89 78 85 108 149 185 193 174 157 124 127 143 154 222
Andalusia 100 69 65 69 86 111 141 160 159 143 115 117 123 136 151
Cantabria 100 86 99 90 126 104 145 152 157 153 133 109 110 106 136
Ceuta and Melilla ‒ ‒ ‒ ‒ ‒ 100 181 154 124 108 129 119 110 152 201
Balearic Islands 100 100 103 111 124 196 246 257 259 213 148 141 182 206 252
Castile and Leon 100 75 61 65 80 93 114 130 138 122 103 101 102 115 132
Valencian Community 100 81 75 83 100 131 169 187 177 148 117 115 132 145 172
Aragon 100 80 65 74 97 112 140 188 181 162 124 117 133 143 168
Canary Islands 100 82 74 82 111 146 183 168 153 140 110 132 145 171 220
La Rioja 100 72 56 68 96 118 175 194 175 146 126 115 127 142 194
Catalonia 100 84 82 84 93 112 157 186 206 195 137 122 133 149 183
Castile‐La Mancha 100 77 70 81 103 116 127 144 151 136 114 118 116 124 138
Madrid 100 81 73 75 89 90 113 121 134 119 91 75 79 84 106
Asturias 100 78 68 68 72 84 99 106 128 131 107 103 108 109 115
Extremadura 100 43 37 38 47 54 62 71 75 75 64 68 70 76 86
Galicia 100 79 74 71 77 89 98 106 108 85 71 66 73 72 76
SPAIN 100 78 73 74 85 100 123 134 138 123 98 91 98 107 127
1998 1999 2000 2001 2002 2003 2004 2005 2006 2007 2008 2009 2010 2011 2012
Navarre 352 479 683 840 845 880 960 1308 1533 1811 1559 1054 976 835 623
Basque Country 235 309 407 511 536 595 651 921 1098 1269 1268 838 903 784 593
Murcia 285 400 483 586 625 739 916 1409 1739 1989 1371 828 716 638 544
Andalusia 191 247 312 436 449 552 701 1074 1363 1562 1177 816 719 632 489
Cantabria 179 215 286 422 401 456 525 759 1002 1198 1125 750 676 601 489
Ceuta and Melilla 287 352 372 1415 1455 1139 945 910 861 853 878 829 706 632 478
Balearic Islands 285 407 558 676 633 604 685 971 1268 1308 1072 645 577 504 444
Castile and Leon 165 219 281 372 396 437 511 726 916 1080 967 721 620 557 434
Valencian Community 238 333 436 545 529 581 743 1072 1361 1461 1178 693 623 565 426
Aragon 219 276 371 518 504 548 701 888 1045 1231 1108 711 608 488 407
Canary Islands 263 401 512 686 733 811 882 1146 1331 1594 1037 683 587 503 405
La Rioja 227 333 385 604 548 681 814 1090 1254 1420 1189 827 695 552 393
Catalonia 247 346 456 466 449 525 623 956 1159 1273 1073 643 595 519 383
Castile‐La Mancha 165 210 278 372 416 449 552 715 928 1220 963 642 564 509 334
Madrid 126 162 211 306 337 330 406 545 756 876 723 470 448 414 331
Asturias 133 167 189 353 352 334 377 503 571 711 793 554 465 407 326
Extremadura 100 138 174 283 234 294 321 403 530 629 593 437 388 344 219
Galicia 92 110 128 185 186 202 211 337 449 550 516 393 320 259 184
SPAIN 352 479 683 840 845 880 960 1308 1533 1811 1559 1054 976 835 623
Source: Fernández de Guevara et al. (2015).
73 Regions sorted by 2012 data.

206 CHAPTER ii
Appendix 4: Social capital in the Basque Country in 2012 (0‐10 scale)
2012 2007
Indicator Alava Bizkaia Gipuzkoa Mean Mean Variation
Size and characteristics of social networks
Size of the broad network* 21,58 22,15 22,70 22,24 22,47 ‐0,23
Size of the close network* 10,08 10,58 10,72 10,55 12,54 ‐1,99
Personal relationships in the broad network 4,40 4,28 4,19 4,27 4,21 0,06
Use of Internet and virtual networks 2,02 1,92 1,83 1,91 1,60 0,31
Homogeneity of friends' network 6,47 6,31 6,35 6,34 6,04 0,30
Trust and corruption
General trust 5,95 5,75 5,91 5,83 5,83 0,00
Trust in institutions 4,51 4,55 4,29 4,46 4,66 ‐0,20
Trust in professionals 5,20 5,23 5,15 5,20 5,11 0,09
Trust in networks 6,99 7,05 7,15 7,07 6,86 0,21
Corruption 6,50 6,28 6,34 6,33 5,90 0,43
Aid, cooperation and reciprocity
Provided aid 3,16 3,37 3,32 3,32 4,60 ‐1,28
Received aid 1,88 2,02 1,91 1,96 2,83 ‐0,87
Access to financial aid 4,99 4,95 5,05 4,99 5,49 ‐0,50
Access to health assistance 6,05 6,08 6,21 6,11 6,70 ‐0,59
Access to emotional aid 5,79 5,85 5,87 5,85 6,31 ‐0,46
Reciprocity 6,44 6,08 6,02 6,12 6,16 ‐0,04
Cooperation 6,79 6,74 6,79 6,76 6,81 ‐0,05
Social and political participation and associationism
Interest in socio‐political issues 5,58 5,46 5,36 5,45 5,75 ‐0,30
Information on socio‐political issues 5,42 5,24 5,32 5,30 5,17 0,13
Variety of information sources 6,82 7,23 7,18 7,15 7,54 ‐0,39
Access to Mass Media 6,88 6,60 6,76 6,69 6,69 0,00
Electoral participation 7,07 7,31 7,04 7,19 7,55 ‐0,36
Personal influence 4,29 4,16 3,85 4,08 4,41 ‐0,33
Social and political participation 1,15 1,27 1,18 1,22 1,22 0,00
Participation in associations 0,31 0,39 0,41 0,39 0,80 ‐0,41
Social cohesion, security, happiness and health
Happiness and health 7,18 7,10 7,25 7,16 7,07 0,09
Security 7,87 8,13 8,21 8,12 7,84 0,28
Personal independence 7,80 7,70 7,80 7,75 7,35 0,40
Social cohesion 6,13 6,28 6,41 6,30 6,10 0,20
Source: Eustat, 2012a. * Note: Item measured in number of people.

Appendixes 207
Appendix 5: Social capital indicators in EU‐28 and some other countries (%)
REGION Participation in
form
al
voluntary activities
Participation in
inform
al
voluntary activities
Active citizenship
Getting together with fam
ily
and relatives every day
Communicating via social
media every day
European Union (28 countries) 19.3 22.2 12.8 16.7 26.2
Belgium 20.4 20.8 4.9 18.6 35.2
Bulgaria 5.2 6.3 3.7 21.9 30.7
Czech Republic 12.2 16.6 4.2 14.3 22.8
Denmark 38.7 41.8 9.5 3.1 40.7
Germany 28.6 11.4 13.9 14.3 23.2
Estonia 16.4 25.5 8.7 4.3 27.4
Ireland 29.0 37.6 13.0 19.2 41.8
Greece 11.7 14.4 8.4 35.7 28.8
Spain 10.7 10.6 7.9 22.3 30.9
France 23.0 23.3 24.8 13.7 20.2
Croatia 9.7 17.2 5.7 29.7 24.8
Italy 12.0 11.2 6.3 22.4 23.8
Cyprus 7.2 2.6 2.1 45.4 40.6
Latvia 7.3 28.3 5.6 4.3 19.5
Lithuania 16.3 16.3 6.3 3.1 18.6
Luxembourg 36.7 30.3 17.2 14.7 36.9
Hungary 6.9 7.8 4.7 16.5 24.0
Malta 8.8 0.9 9.7 34.7 42.6
Netherlands 40.3 82.5 25.3 5.9 39.2
Austria 28.3 28.3 11.9 7.4 32.8
Poland 13.8 50.6 7.3 6.3 17.6
Portugal 9.0 20.5 9.9 32.6 24.8
Romania 3.2 3.2 3.6 25.3 17.3
Slovenia 30.4 54.6 9.8 10.6 21.5
Slovakia 8.3 18.8 2.8 36.3 31.5
Finland 34.1 74.2 24.2 10.0 35.5
Sweden 35.5 70.4 31.3 5.5 41.2
United Kingdom 23.3 19.2 20.2 15.5 35.1
Iceland 32.8 64.8 24.9 6.5 34.6
Norway 48.0 74.5 16.2 11.8 45.5
Switzerland 36.5 48.2 26.9 9.3 24.0
Macedonia 11.2 21.9 9.8 85.8 37.7
Serbia 5.2 12.4 4.0 25.0 21.5
Source: self‐elaboration, based on Eurostat 2015.

208 CHAPTER ii
Appendix 6: Social capital survey among former students of IMH (2014) 1. Are you working currently?
Yes 105 77.78%
No 30 22.22%
Collected answers: 135
2. Are you working now in the company where you performed the internship?
Yes 28 27.18%
No 75 72.82%
Collected answers: 103
3. Is this the first company in which you are working after the internship company?
Yes 30 40.00%
No 45 60.00%
Collected answers: 75
4. If you are working or have worked, did it have a positive effect to find a job being a former student of IMH (and not another centre)?
Yes 87 64.93%
No 41 30.60%
I have never had a job 6 4.48%
Collected answers: 134
5. If you are working or have worked, were the IMH contacts useful to find a job?
Yes 63 47.37%
No 64 48.12%
I have never had a job 6 4.51%
Collected answers: 133
6. These contact of IMH, of what kind were they? Select the corresponding answer(s):
Classmates of IMH 9 15.79%
Friends of IMH 4 7.02%
Teachers and other employees of IMH 31 54.39%
Workers and managers of the internship company 16 28.07%
Other 10 17.54%
Collected answers: 57
7. Do you keep the relationship with the people you met in IMH?
No 23 17.69%
Yes, with 1‐5 people 65 50.00%
Yes, with 6‐10 people 21 16.15%
Yes, with 11‐20 people 15 11.54%
Yes, with more than 20 people 6 4.62%
Collected answers: 130
8. What is the most used way of contact? Select the corresponding answer(s):
Phone (calls, SMS...) 46 42.99%
Internet (e‐mail, social networks...) 51 47.66%
Work relationship (workmate, customer, supplier...) 26 24.30%
Direct personal relationship 66 61.68%
Other 2 1.87%
Collected answers: 107

Appendixes 209
9. What is the average frequency of interaction with these contacts?
Almost daily 12 11.21%
Once weekly 14 13.08%
Once per month 35 32.71%
Once per quarter 24 22.43%
Once per semester 11 10.28%
Once a year 11 10.28%
Collected answers: 107
10. What is the average degree of trust with these contacts, from 0 to 10?
0 0 0.00%
1‐2 2 1.87%
3‐4 7 6.54%
5‐6 28 26.17%
7‐8 59 55.14%
9‐10 11 10.28%
Collected answers: 107
11. What could be the use of contacts? Select the corresponding answer(s):
They do not have any use 17 13.08%Maintain friendly relations 102 78.46%Improve opportunities for promotion within the company where you work 5 3.85%Strengthen the competitive position of the company in which you work 12 9.23%Find new employment opportunities in (other) companies 24 18.46%Create a new company 5 3.85%Other 4 3.08%
Collected answers: 130
12. Does your company give importance to networks and collaboration with other companies and agents?
Very little 8 8.00%
A little bit 25 25.00%
Pretty much 43 43.00%
A lot 24 24.00%
Collected answers: 100
13. How would you define the opening degree of your company to collaborate in a network?
Very closed 7 7.07%
Closed 21 21.21%
Open 57 57.58%
Very open 14 14.14%
Collected answers: 99
14. Do you know if your company has agreements with the following agents? Select the corresponding answer(s):
Cluster Associations 10 10.20%Technology Centres 40 40.82%Other companies 59 60.20%Other agents (universities, government agencies...) 46 46.94%
Collected answers: 98
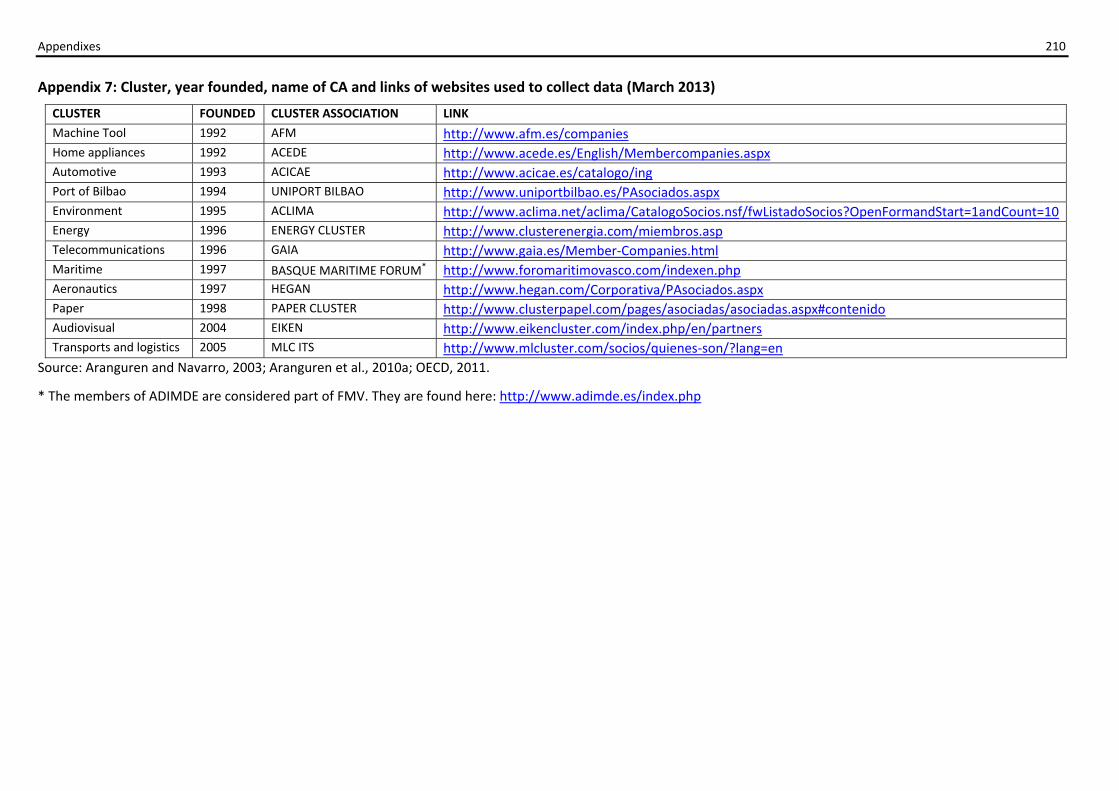
Appendixes 210
210
Appendix 7: Cluster, year founded, name of CA and links of websites used to collect data (March 2013)
CLUSTER FOUNDED CLUSTER ASSOCIATION LINK
Machine Tool 1992 AFM http://www.afm.es/companies Home appliances 1992 ACEDE http://www.acede.es/English/Membercompanies.aspx Automotive 1993 ACICAE http://www.acicae.es/catalogo/ing Port of Bilbao 1994 UNIPORT BILBAO http://www.uniportbilbao.es/PAsociados.aspx Environment 1995 ACLIMA http://www.aclima.net/aclima/CatalogoSocios.nsf/fwListadoSocios?OpenFormandStart=1andCount=10 Energy 1996 ENERGY CLUSTER http://www.clusterenergia.com/miembros.asp Telecommunications 1996 GAIA http://www.gaia.es/Member‐Companies.html Maritime 1997 BASQUE MARITIME FORUM* http://www.foromaritimovasco.com/indexen.php Aeronautics 1997 HEGAN http://www.hegan.com/Corporativa/PAsociados.aspx Paper 1998 PAPER CLUSTER http://www.clusterpapel.com/pages/asociadas/asociadas.aspx#contenido Audiovisual 2004 EIKEN http://www.eikencluster.com/index.php/en/partners Transports and logistics 2005 MLC ITS http://www.mlcluster.com/socios/quienes‐son/?lang=en
Source: Aranguren and Navarro, 2003; Aranguren et al., 2010a; OECD, 2011.
* The members of ADIMDE are considered part of FMV. They are found here: http://www.adimde.es/index.php

Appendixes 211
211
Appendix 8: Top organisations that belong to more than one CA
N. ORGANISATION ACEDE ACICAE ACLIMA AFM ENERGY PAPER FMV GAIA HEGAN UNIPORT EIKEN MLC ITS
8 IK4 X X X X X X X X
7 TECNALIA X X X X X X X
6 FAGOR X X X X X X
5 GOB. VASCO X X X X X
5 UPV / EHU X X X X X
4 CC BILBAO X X X X
4 DF BIZKAIA X X X X
4 IDOM X X X X
4 INGETEAM X X X X
4 SENER X X X X
3 A. PORT. BILBAO X X X
3 DF GIPUZKOA X X X
3 LAZPIUR X X X
3 MAIER X X X
3 ROXTEC X X X
3 SPRI X X X
3 ULMA X X X
2 A. V. CAPITANES M. M. X X
2 ACIDEKA X X
2 ALDAITURRIAGA X X
2 ALECOP X X
2 ALFA X X
2 ANALISIS Y SIMULACION X X
2 APARKABISA X X
2 ARCELORMITTAL X X
2 ARTECHE X X
2 AUXEMA STEMMANN X X
2 AYUNT. BILBAO X X
2 BABCOCK X X
2 BAHIA DE BIZKAIA GAS X X
2 BATZ SISTEMAS X X
2 BEC X X
2 BERU X X
2 BIZKAIA ENERGIA X X
2 BRIDGESTONE X X
2 BUNT PLANET X X
2 BURDINBERRI X X
2 CAF X X
2 CC GIPUZKOA X X
2 CMA CGM X X
2 CIA REMOL. IBAIZABAL X X
2 CONSORCIO DE AGUAS X X
2 DATIK X X
2 DF ALAVA X X
2 DHL X X
2 ERHARDT X X
2 EUSKALTEL X X
2 EVE X X

212 CHAPTER ii
2 EXTERNALIA X X
2 GE X X
2 GES SIEMSA X X
2 GRUPO GUASCOR X X
2 GRUPO MONDRAGON X X
2 GRUPO TTT X X
2 HEROSLAM X X
2 I2MAPP X X
2 IBERDROLA X X
2 IBERMÁTICA X X
2 IG8 X X
2 IGARLE X X
2 IKOR X X
2 IKUSI X X
2 INCOESA TRAFODIS X X
2 INDRA X X
2 IRIZAR X X
2 JEMA X X
2 KUTXABANK X X
2 LAMINADOS LOSAL X X
2 LANTEGI BATUAK X X
2 LANTEK X X
2 LKS X X
2 LLOYD´S X X
2 LOINTEK X X
2 MASER X X
2 MATRICI X X
2 MIESA X X
2 MONDRAGON UNIB. X X
2 NAVIERA MURUETA X X
2 ORMAZABAL X X
2 ORONA X X
2 OWASYS X X
2 P4Q ELECTRONICS X X
2 PETRÓLEOS DEL NORTE X X
2 SGS X X
2 SISTEPLANT X X
2 SMURFIT KAPPA X X
2 SPARBER X X
2 UNIV. NAVARRA X X
2 VIBACAR X X
2 VICINAY CADENAS X X
2 XUBI ENGRANAGES X X
2 ZABALGARBI X X
2 ZIGOR X X
2 ZIV X X

Appendixes 213
Appendix 9: Top 19 organisations that (have) belong(ed) to more than one BoDs
N. ORGANISATION ACEDE ACICAE ACLIMA AFM ENERGY PAPER FMV GAIA HEGAN UNIPORT EIKEN MLC ITS
7 GOB. VASCO X X X X X X X
5 FAGOR X X X X X
3 DF BIZKAIA X X X
3 GAMESA X X X
3 IK4 X X X
3 INGETEAM X X X
3 SENER X X X
3 SPRI X X X
2 TECNALIA X X X
2 ARTECHE X X
2 EUSKALTEL X X
2 GUASCOR X X
2 IBERDROLA X X
2 IDOM X X
2 MAIER X X
2 P4Q X X
2 TUBACEX X X
2 ULMA X X
2 ZIV X X

214 CHAPTER ii
Appendix 10: Top 21 organisations that belong to more than two BCPs
Health
Food
Nanoelectronics
Embeb
bed
systems
E‐mobility
Transport
Software and services
Manufacturing
Nanomat
Construction
Electrical networks and
distributed energy
Photovoltaic en
ergy
H2 and fuel cells
Environmen
t
Aeronautics
Automotion
Train
Sea transport
Social and human
sciences
Safety
N. ORGANISATION BCP1 BCP2 BCP3 BCP4 BCP5 BCP6 BCP7 BCP8 BCP9 BCP10 BCP11 BCP12 BCP13 BCP14 BCP15 BCP16 BCP17 BCP18 BCP19 BCP20
20 IK4 X X X X X X X X X X X X X X X X X X X X
20 TECNALIA X X X X X X X X X X X X X X X X X X X X
15 UPV/EHU X X X X X X X X X X X X X X X
6 CIE AUTOMOTIVE X X X X X X
6 GAIA X X X X X X
6 MCC X X X X X X
5 INGETEAM X X X X X
5 SENER X X X X X
5 USYSCOM X X X X X
4 FAGOR X X X X
4 GAMESA X X X X
4 GOBIERNO VASCO X X X X
4 GUASCOR X X X X
4 IKUSI X X X X
4 ZIV X X X X
3 GESTAMP X X X
3 IBERDROLA X X X
3 IBERMATICA X X X
3 JEMA X X X
3 SOFTEC X X X
3 THAUMAT X X X
Source: Eurobulegoa, 2006.

Appendixes 215
Appendix 11: Social capital in CAs of the Basque Country (summarised)
SCORE
TRUST LEVEL TD73 PD PA TA Total 7,68
I feel identified with this CA. 2 16 81 51 150
1,33% 10,67% 54,00% 34,00% 100,00% 7,36
The people responsible of this CA have credibility. 1 5 68 76 150
0,67% 3,33% 45,33% 50,67% 100,00% 8,20
I trust in institutions, organisations, etc. that are related to this CA. 3 6 91 49 149
2,01% 4,03% 61,07% 32,89% 100,00% 7,49 ORGANISATIONAL CULTURE TD PD PA TA Total 6,93
In this CA we have team awareness. 2 32 78 36 148
1,35% 21,62% 52,70% 24,32% 100,00% 6,67
I share attitudes and business philosophy with the rest 2 30 90 26 148
of the members of the CA. 1,35% 20,27% 60,81% 17,57% 100,00% 6,49
The organisational culture of this CA promotes cooperation. 4 14 65 65 148
2,70% 9,46% 43,92% 43,92% 100,00% 7,64 COOPERATION TD PD PA TA Total 7,71
I am reluctant to cooperate with other people in this CA. 57 66 13 5 141
40,43% 46,81% 9,22% 3,55% 100,00% 2,53
The cooperation between the members of this CA would improve our 2 6 73 60 141
competitiveness. 1,42% 4,26% 51,77% 42,55% 100,00% 7,85
I think this CA would be enriched with the addition of new members. 1 14 75 51 141
0,71% 9,93% 53,19% 36,17% 100,00% 7,49
More partnerships with government, universities, research institutes, 1 6 69 65 141
customers and suppliers should be promoted. 0,71% 4,26% 48,94% 46,10% 100,00% 8,01 PARTICIPATION TD PD PA TA Total 6,19
The people belonging to this CA go beyond what is required and 1 36 76 28 141
participate intensely. 0,71% 25,53% 53,90% 19,86% 100,00% 6,43
In this CA, it is encouraged the involvement and participation of all 1 15 91 34 141
stakeholders. 0,71% 10,64% 64,54% 24,11% 100,00% 7,07
My company shares its problems to analyze in the association and 8 45 76 12 141
propose a collective solution. 5,67% 31,91% 53,90% 8,51% 100,00% 5,51
In my company, there is an explicit recognition of the work of people 9 44 65 23 141
who are engaged in this CA. 6,38% 31,21% 46,10% 16,31% 100,00% 5,74
73 TD: totally disagree (0 points); PD: partially disagree (3,33 points); PA: partially agree (6,67 points); TA: totally agree (10 points).

216 CHAPTER ii
Has your company participated in this CA Boards? Never 1 mandate +1 mandate Total
91 17 33 141
64,54% 12,06% 23,40% 100,00% LEVEL OF ASSOCIATION 0 1‐2 3‐5 6‐10 +10 Total
Number of CAs or other institutions for collaboration where your 6 59 47 9 15 136
company participates. 4,41% 43,38% 34,56% 6,62% 11,03% 100,00% RECIPROCITY TD PD PA TA Total 5,86
This CA motivates us in our professional performance. 3 28 86 18 135
2,22% 20,74% 63,70% 13,33% 100,00% 6,27
This CA provides maturity and personal development to employees of 3 54 66 12 135
our company. 2,22% 40,00% 48,89% 8,89% 100,00% 5,48
This CA provides us with new friends. 2 21 93 19 135
1,48% 15,56% 68,89% 14,07% 100,00% 6,52
This CA provides us the ability to show a greater sense of solidarity 4 38 73 20 135
with the community. 2,96% 28,15% 54,07% 14,81% 100,00% 6,02
This CA improves our economic performance. 9 55 66 5 135
6,67% 40,74% 48,89% 3,70% 100,00% 4,99 QUALITY OF RELATIONS Very low Quite low Quite high Very high Total
Degree of confidence with people of this CA. 3 22 82 31 138
2,17% 15,94% 59,42% 22,46% 100,00% QUANTITY OF RELATIONS 0 1‐2 3‐5 6‐10 +10 Total
Number of people in this CA with whom you interact. 4 25 39 21 49 138
2,90% 18,12% 28,26% 15,22% 35,51% 100,00% FREQUENCY OF RELATIONS +1/week 1/week 1/month 1/trimester 1/semester 1/year Total
Frequency of personal relationships with individuals of this CA. 9 19 52 40 10 7 137
6,57% 13,87% 37,96% 29,20% 7,30% 5,11% 100,00%

Appendixes 217
Appendix 12: Top 50 connected GAIA usernames (sorted by Degree GAIA)
GAIA
P. Username Total
Followers
GAIA
Followers
Following
Total
Following
GAIA
Degree
GAIA
Betweenness
Centrality
Eigenvector
Centrality
1 @ClusterGaia 2,352 69 1,575 75 144 26.2696 53.2189
2 @esMONDRAGON 19,700 38 15,100 33 71 6.5649 40.2120
3 @tecnalia 1,920 53 12,100 13 66 9.8019 44.4424
4 @DinyconSistemas 474 14 1,572 20 34 1.1641 25.7703
5 @TelecosEuskadi 595 8 2,003 25 33 1.8841 24.8416
6 @IKORGrupo 697 12 948 21 33 3.3976 26.3448
7 @NextelSA 814 10 579 22 32 1.9013 22.8317
8 @EuskoData_SA 424 6 1,053 25 31 1.8450 22.4046
9 @HispaVista 7,918 11 5,966 20 31 2.3918 21.1600
10 @AlianzaIK4 3,136 24 170 6 30 1.3479 28.4267
11 @comymedia 1,533 10 1,890 19 29 2.3076 15.6918
12 @virtualware 1,974 13 828 14 27 1.4537 14.5262
13 @MicrosoftES 28,300 18 3,087 8 26 3.0246 9.2251
14 @grupogureak 1,037 14 447 9 23 0.5698 21.8734
15 @ibermaticagrupo 2,160 14 2,370 9 23 0.8784 16.8481
16 @SpyroERP 437 8 911 14 22 1.3792 19.0365
17 @DeustoResearch 2,259 14 1,179 8 22 0.5473 19.4361
18 @PulsarConcept 790 11 308 10 21 1.5942 11.3317
19 @ArmeriaEskola 999 8 952 12 20 0.1096 18.5058
20 @IbermaticaSB 1,812 8 630 11 19 0.5583 16.6342
21 @IgarleSL 114 9 132 9 18 0.2824 16.3225
22 @ikusi_global 588 10 469 8 18 0.2712 15.2582
23 @TRIDENTESTUDIO 379 6 780 12 18 1.9790 10.4258
24 @PandaComunica 21,900 10 3,106 7 17 0.9238 9.0440
25 @IpartekF 437 7 483 9 16 0.1097 12.2151
26 @lotura 479 6 323 10 16 0.3859 13.7173
27 @BinarySftw 363 4 628 11 15 0.8898 13.0212
28 @Elhuyar 4,221 12 206 3 15 0.2625 20.0791
29 @euskaltel_sa 5,722 6 608 9 15 0.1207 15.4906
30 @everis 13,300 11 995 4 15 1.3132 11.4683
31 @Maser_Mic 67 5 166 10 15 0.2970 13.9034
32 @SageSpain 28,100 11 1,157 4 15 1.3217 8.5785
33 @senddo 489 8 340 7 15 0.1710 8.3399
34 @CEBANC 614 6 487 8 14 0.2102 11.8174
35 @DigiPenBilbao 735 8 464 6 14 0.1961 4.9026
36 @RevistaFSGamer 7,265 9 2,291 5 14 0.4186 4.5263
37 @todologic 357 4 921 10 14 1.6803 7.3198
38 @IZERTIS 2,770 6 802 8 14 0.1525 12.0022
39 @nazaretzentroa 929 7 584 7 14 0.0555 14.3127
40 @DeliriumStudios 2,513 10 40 3 13 0.0598 4.5983
41 @automation_es 462 8 113 5 13 0.1586 12.3915
42 @ingeteam 1,379 9 247 4 13 0.1275 17.7342
43 @lantegibatuak 1,884 8 739 4 12 0.0775 10.3802
44 @oracle_es 2,587 8 538 4 12 0.1674 4.9571
45 @Gestionet_es 522 0 294 11 11 0.6298 10.3395
46 @SareinSistemas 99 4 66 7 11 0.3546 11.5439
47 @SolmicroMKR 425 4 632 7 11 0.2654 10.3525
48 @WiMi_5 1,597 9 1,268 2 11 0.7543 8.7355
49 @Akting_ 199 5 81 5 10 0.1961 8.9002
50 @anbotogroup 1,515 5 1,939 5 10 0.0464 6.0425

218 CHAPTER ii
Appendix 13: Top 50 ranked GAIA usernames in mentions, sorted by Degree GAIA (sample 1)
GAIA
P. Username Received
mentions
GAIA
usernames
mentioning
Writen
tweets
Mentions
made
Mentioned
GAIA
usernames
DEGREE
GAIA
Betweenness
Centrality
Eigenvector
Centrality
1 @clustergaia 484 43 903 978 32 75 14.8764 51.5791
2 @tecnalia 736 54 3,222 2,719 18 72 15.6720 54.8024
3 @virtualware 708 17 3,214 5,446 20 37 1.9812 30.0590
4 @ibermaticagrupo 447 13 3,007 3,068 23 36 5.5804 27.8893
5 @alianzaik4 418 19 3,252 2,925 17 36 2.2264 31.4299
6 @pulsarconcept 221 15 979 1,790 18 33 2.6222 21.0705
7 @esmondragon 149 18 2,764 1,794 10 28 2.9448 23.1641
8 @deliriumstudios 848 14 2,493 5,051 13 27 1.5286 17.5092
9 @microsoftes 556 17 3,262 4,611 8 25 2.7857 13.1628
10 @wattiocorp 338 12 2,104 2,274 11 23 0.6289 17.8484
11 @wimi_5 401 10 1,271 1,735 12 22 0.9426 16.3166
12 @grupogureak 755 10 1,355 2,499 10 20 1.4886 16.7393
13 @dinyconsistemas 235 9 1,016 1,355 11 20 0.3852 18.4341
14 @nextelsa 214 6 2,121 2,056 14 20 1.1693 17.9772
15 @pymapp 196 11 3,230 1,359 9 20 0.3991 16.5623
16 @coitpv 36 4 854 955 16 20 1.8083 23.9871
17 @elhuyar 1,066 8 2,692 4,104 10 18 0.6859 18.6071
18 @lantegibatuak 742 7 2,037 4,557 11 18 0.6514 16.9709
19 @euskaltel_sa 55 15 3,226 2,796 3 18 1.0884 22.5365
20 @everis 1,377 10 3,257 4,819 7 17 1.0226 14.1599
21 @lotura 116 5 1,690 1,516 12 17 0.3568 17.9667
22 @armeriaeskola 298 7 2,241 2,642 9 16 0.4487 14.7763
23 @izertis 233 9 2,322 1,720 7 16 1.9255 10.5647
24 @oracle_es 358 9 2,340 2,108 6 15 0.3602 6.3105
25 @deustoresearch 145 7 3,259 4,767 8 15 0.5758 21.2207
26 @gestionet_es 124 8 3,222 588 7 15 0.5316 13.9418
27 @domoalert 47 5 891 350 10 15 1.1966 11.0384
28 @comymedia 39 4 1,379 1,057 10 14 0.9616 13.0721
29 @cyctweet 396 6 3,244 5,582 7 13 0.2534 14.8263
30 @nazaretzentroa 278 3 2,666 3,160 10 13 0.2554 14.4046
31 @bilbomatica 80 10 179 194 3 13 0.1785 18.4621
32 @igarlesl 29 6 150 111 7 13 0.2931 9.7381
33 @ingeteam 620 6 744 1,175 6 12 0.0302 15.9457
34 @ikorgrupo 53 4 2,433 2,026 8 12 0.0816 14.7711
35 @digipenbilbao 131 7 1,019 708 4 11 0.0053 7.7557
36 @jokoga_int 34 5 47 121 6 11 0.0526 6.4076
37 @ludei 356 8 1,618 2,014 2 10 0.2362 6.5308
38 @ibermaticasb 230 4 3,255 2,596 6 10 0.3125 8.7266
39 @ibercom 218 4 2,154 1,856 6 10 0.8686 9.7244
40 @dualia 164 4 1,811 2,233 6 10 0.0336 12.3363
41 @mrjamcmm 97 4 3,250 484 6 10 0.0219 9.7512
42 @ikusi_global 19 5 280 302 5 10 0.0291 11.4624
43 @ikasplay 18 6 104 146 4 10 0.1156 11.6113
44 @cebanc 247 4 1,499 1,260 5 9 0.9491 9.3701
45 @campus2b 125 5 3,215 4,062 4 9 0.6157 7.8939
46 @akting_ 82 4 309 455 5 9 0.0082 8.6363
47 @sisteplant 63 6 163 166 3 9 0.0933 12.2748
48 @fagorhealthcare 53 5 1,771 1,568 4 9 0.9104 10.1925
49 @vodafone_es 21 8 3,238 3,197 1 9 1.1790 6.1220
50 @pandacomunica 164 5 3,243 1,498 3 8 0.0382 6.7416

Appendixes 219
Appendix 14: Top 50 ranked GAIA usernames in mentions, sorted by Degree GAIA (sample 2)
GAIA
P. Username
Received
mentios
(total)
Received
mentions
GAIA
GAIA
usernames
mentioning
Writen
tweets
Mentions
made
Mentioned
GAIA
usernames
DEGREE GAIA Cliques
1 @ClusterGaia 275 85 16 319 416 20 36 12
2 @tecnalia 1,027 88 11 610 457 2 13 8
3 @virtualware 345 87 3 265 495 8 11 2
4 @euskaltel_sa 2,163 67 7 2,663 2,440 4 11 2
5 @TelecosEuskadi 156 38 4 183 233 6 10 3
6 @AlianzaIK4 141 24 6 184 150 3 9 2
7 @SpyroERP 18 6 3 60 58 5 8 2
8 @IgarleSL 8 5 3 14 23 4 7 3
9 @RevistaFSGamer 551 84 3 538 381 4 7 1
10 @esMONDRAGON 303 27 3 214 203 4 7 0
11 @MicrosoftES 2,661 85 5 595 676 2 7 0
12 @Sisteplant 27 9 3 17 21 3 6 2
13 @ibermaticagrupo 157 43 3 277 142 3 6 1
14 @ArmeriaEskola 89 20 4 49 107 2 6 0
15 @grupogureak 220 48 3 96 218 3 6 0
16 @lantegibatuak 555 99 2 235 482 4 6 1
17 @IZERTIS 194 20 2 78 117 4 6 1
18 @everis 1,099 105 4 342 338 2 6 0
19 @oracle_es 637 34 3 251 229 3 6 0
20 @Webalianza 5 3 3 1 2 2 5 1
21 @ingeteam 317 62 2 90 166 3 5 1
22 @DeliriumStudios 211 40 3 156 298 2 5 1
23 @ikusi_global 97 16 3 80 100 2 5 1
24 @entelgy 522 29 2 510 451 3 5 1
25 @ULMA_Embedded 20 10 2 13 23 2 4 0
26 @NextelSA 25 11 2 29 48 2 4 0
27 @arininnovation 28 9 2 284 318 2 4 0
28 @Elhuyar 406 107 2 240 450 2 4 0
29 @deustosistemas 24 6 2 24 22 2 4 0
30 @GFI_Informatica 624 53 2 456 332 2 4 0
31 @nazaretzentroa 139 9 3 71 75 1 4 0
32 @BuntPlanet 66 4 2 49 53 2 4 0
33 @Sarenet 259 13 1 791 775 3 4 0
34 @IKORGrupo 84 2 1 424 266 3 4 0
35 @SageSpain 3,280 19 3 843 878 1 4 0
36 @Maser_Mic 8 4 1 30 16 2 3 0
37 @DigiPenBilbao 67 30 2 105 56 1 3 0
38 @SolmicroMKR 30 7 2 20 19 1 3 0
39 @_Enigmedia_ 154 33 1 147 157 2 3 0
40 @DeustoResearch 134 22 1 299 528 2 3 0
41 @HispaVista 46 6 2 15 20 1 3 0
42 @TAKLearning 16 2 2 44 61 1 3 0
43 @Tecnipesa_ID 46 5 1 313 373 2 3 0
44 @Gestionet_es 29 3 2 261 25 1 3 0
45 @IbermaticaSB 29 3 2 156 19 1 3 0
46 @Dualia 27 2 1 27 36 2 3 0
47 @Inycom 1,106 79 1 607 660 2 3 0
48 @comymedia 15 1 1 114 66 2 3 0
49 @PandaComunica 1,414 69 1 547 253 2 3 0
50 @vodafone_es 32,253 43 2 32,135 31,938 1 3 0

220 CHAPTER ii
Appendix 15: Top 50 non GAIA usernames in received mentions by GAIA members (sorted by received and diversity of mentions, respectively)
P. Username
Received
mentions
from GAIA
GAIA
usernames
mentioning
P. Username
Received
mentions
from GAIA
GAIA
usernames
mentioning
1 @deusto 1,479 46 1 @ap 806 75
2 @microsoft 1,067 32 2 @youtube 525 71
3 @oracle 994 15 3 @el_pais 481 60
4 @ap 806 75 4 @innobasque 565 57
5 @puromarketing 599 29 5 @expansion 316 56
6 @alfredovela 599 14 6 @expansioncom 285 54
7 @xataka 578 37 7 @elmundoes 199 54
8 @innobasque 565 57 8 @diariovasco 449 51
9 @youtube 525 71 9 @tic 406 51
10 @el_pais 481 60 10 @grupospri 307 47
11 @diariovasco 449 51 11 @deusto 1,479 46
12 @ik4_tekniker 441 16 12 @eitb 200 46
13 @mkdirecto 436 31 13 @eleconomistaes 237 45
14 @upvehu 418 34 14 @euskadinnova 146 45
15 @tic 406 51 15 @fundaci 293 43
16 @microsoftayuda 402 3 16 @abc_es 148 41
17 @funandserious 381 15 17 @adegi 288 39
18 @lanbideejgv 367 12 18 @elcorreo_com 224 39
19 @tuitsdegabriel 364 1 19 @xataka 578 37
20 @ideko_ik4 355 9 20 @ticbeat 259 37
21 @orkestra 343 21 21 @cincodiascom 170 36
22 @txemafranco 328 4 22 @google 124 36
23 @negociosyempren 318 3 23 @pau 89 35
24 @expansion 316 56 24 @upvehu 418 34
25 @vetustamorla 309 8 25 @beaz_bizkaia 243 34
26 @grupospri 307 47 26 @iker 171 33
27 @artmonedero 297 8 27 @rtve 83 33
28 @gorabide 297 5 28 @microsoft 1,067 32
29 @asadapi 295 14 29 @deia_bizkaia 125 32
30 @fundaci 293 43 30 @mkdirecto 436 31
31 @adegi 288 39 31 @eitbcom 82 31
32 @expansioncom 285 54 32 @wwwhatsnew 203 30
33 @antoniosanto 274 6 33 @upvehu 197 30
34 @ticbeat 259 37 34 @puromarketing 599 29
35 @vadejuegos 256 9 35 @inc 118 29
36 @xatakamovil 249 11 36 @redpuntoes 68 29
37 @beaz_bizkaia 243 34 37 @konekta20 125 28
38 @eleconomistaes 237 45 38 @intel 66 28
39 @computingbps 229 19 39 @radioeuskadi 65 27
40 @fomentoss 227 21 40 @sharethis 80 26
41 @elcorreo_com 224 39 41 @elconfidencial 70 26
42 @xbox 220 5 42 @eroski 178 25
43 @juanliedo 216 3 43 @arantxa_tapia 105 25
44 @atzegi 209 3 44 @notgip 101 24
45 @xbox_spain 208 4 45 @tecnologiavasca 99 24
46 @deustodbs 207 14 46 @portaltic 142 22
47 @ceit_ik4 206 17 47 @cisco 116 22
48 @wwwhatsnew 203 30 48 @orkestra 343 21
49 @eitb 200 46 49 @fomentoss 227 21
50 @lumia 200 1 50 @muycomputer 136 21

Appendixes 221
Appendix 16: Top 50 non GAIA usernames in written mentions to GAIA members (sorted by written and diversity of mentions, respectively)
P. Username
Written
mentions
to GAIA
GAIA
usernames
mentioned
Working at P. Username
Written
mentions
to GAIA
GAIA
usernames
mentioned
1 @vllanteng 438 1 1 @DJacomeNorato 105 11
2 @jlromolastra 313 1 Sage Spain 2 @BigDataTweetBot 26 9
3 @cirogalante 214 1 Vodafone 3 @_Cloud_I_ 9 9
4 @JBenito01 200 1 Sage Spain 4 @Innobasque 28 8
5 @knario47 199 1 5 @inigoladronm 11 8
6 @SoniaUrr 163 1 6 @Byte_TI 10 8
7 @InnoTecSystem 146 3 Entelgy Group 7 @carlosfdezgomez 10 8
8 @asturkonuka 140 1 8 @JulenZaballa 31 7
9 @porelmovil 133 1 9 @economiadehoyes 13 7
10 @pyme_emprende 113 1 10 @BEC_BIEMH 28 6
11 @luispardo1 113 1 Sage Spain 11 @JRMelara 26 6
12 @DJacomeNorato 105 11 12 @miquelag72 18 6
13 @SantiMayoralas 103 1 Panda Security 13 @frankInnovacion 17 6
14 @guiller_palacio 101 2 14 @ThinkupLKS 16 6
15 @Leireaguero 98 1 Tecnalia 15 @ADEGI 9 6
16 @Morillas_JA 96 1 Vodafone 16 @albertobokos 7 6
17 @Robertofr63 95 1 17 @descargar_mspy 6 6
18 @RecursosyTecnlg 93 1 18 @FuturEnviro 16 5
19 @gabrielbv74 89 1 Inycom 19 @andres_mleal 9 5
20 @jmaguiar70 88 1 20 @omegamx1a 7 5
21 @UCZ443 87 1 21 @PrecoBaixoAgora 6 5
22 @NAtutxa 85 2 Euskaltel 22 @GEZKI_ 39 4
23 @carmenurbano 85 1 Inycom 23 @AzuMingarro 30 4
24 @German_robles_r 79 1 24 @FuturEnergy_ 24 4
25 @virtualgarry 75 2 Virtualware 25 @ITUser_es 22 4
26 @txemafranco 75 3 Lantegi Batuak 26 @psasigain 20 4
27 @Miguel_SBD 74 1 Sage Spain 27 @ClusterTICAstur 18 4
28 @handresmartin 69 1 28 @Gtzl 18 4
29 @NaiaraRRHH 67 1 CYC 29 @djjacomenorato 17 4
30 @JeanHBeaufort 65 1 30 @AranchaAsenjo 14 4
31 @Alberbonar 62 1 Sage Spain 31 @H_Enea 14 4
32 @davidgaga5000 60 1 32 @mrguezpasarin 14 4
33 @SocialMediaMFF 59 1 33 @ITReseller_es 13 4
34 @mubielau 56 1 Sage Spain 34 @SisteplantPR 11 4
35 @MireiaBonafe 56 2 GFI Spain 35 @Beaz_Bizkaia 10 4
36 @VictorVidalGime 55 2 Inycom 36 @ituser_digital 10 4
37 @juanlu_rc 55 1 Sage Spain 37 @metalindustri 9 4
38 @DjGhost512 55 1 38 @WalkOnProject 9 4
39 @albertomtnezper 55 1 39 @Director_TIC 8 4
40 @EiderLecumberri 54 1 Ingeteam 40 @FomentoSS 8 4
41 @dmihala 54 1 Oracle 41 @grupospri 8 4
42 @gemavillaher 52 1 42 @orkestra 8 4
43 @psantia13 51 1 Vodafone 43 @elmundoempresa 7 4
44 @merceditasmar 51 2 44 @empresaexterior 7 4
45 @EvilTwinattack 50 1 45 @KursaalDonostia 7 4
46 @IraiZb 49 1 Lantegi Batuak 46 @mongemalo 7 4
47 @Herkken 49 1 47 @EuskalValley 6 4
48 @annasanzgimeno 49 1 Inycom 48 @FPeuskadi 6 4
49 @TinoJovani 48 1 Sage Spain 49 @sbarturen1 6 4
50 @sojagu 48 1 CYC 50 @mlcluster 5 4

222 CHAPTER ii
Appendix 17: Top 50 ranked hashtags and words
P. Hashtags Count % P. Words Count %
1 #app(s) 1,998 1.53% 1 empresa(s) 2,437 0.30%
2 #BtMS 1,825 1.40% 2 nuevo/a(s) 1,915 0.23%
3 #tecnologia 1,471 1.13% 3 app(s) 1,554 0.19%
4 #Donostia 1,368 1.05% 4 social 1,174 0.14%
5 #empleo 1,354 1.04% 5 Google 1,109 0.14%
6 #ecommerce 1,133 0.87% 6 new 1,061 0.13%
7 #cloud 1,102 0.85% 7 video 1,017 0.12%
8 #innovacion 1,087 0.83% 8 internacional 966 0.12%
9 #empresa(s) 1,021 0.78% 9 jornada 948 0.12%
10 #BigData 984 0.76% 10 mejor(es) 942 0.11%
11 #pyme(s) 969 0.74% 11 servicio 823 0.10%
12 #GFI 962 0.74% 12 proyecto 814 0.10%
13 #seguridad 900 0.69% 13 España 721 0.09%
14 #infografia 852 0.65% 14 customer 676 0.08%
15 #TI 786 0.60% 15 web 644 0.08%
16 #SocialMedia 775 0.60% 16 entrevista 612 0.07%
17 #TIC 770 0.59% 17 marketing 576 0.07%
18 #CustomerService 750 0.58% 18 Microsoft 572 0.07%
19 #videojuego(s) 748 0.57% 19 curso 569 0.07%
20 #emprendedor/a 642 0.49% 20 internet 555 0.07%
21 #reimaginaeltrabajo 625 0.48% 21 Facebook 554 0.07%
22 #FF 609 0.47% 22 tecnologia 546 0.07%
23 #HTML5 605 0.46% 23 Apple 536 0.07%
24 #Marketing 596 0.46% 24 online 534 0.07%
25 #Bilbao 595 0.46% 25 consejos 532 0.06%
26 #Facebook 548 0.42% 26 business 524 0.06%
27 #custserv 539 0.41% 27 presentacion 507 0.06%
28 #musica 534 0.41% 28 claves 500 0.06%
29 #infographic 530 0.41% 29 sistema 466 0.06%
30 #NazaretZentroa 526 0.40% 30 Twitter 458 0.06%
31 #educacion 496 0.38% 31 gestión 454 0.06%
32 #Eibar 486 0.37% 32 service 452 0.06%
33 #IoT 474 0.36% 33 deportes 443 0.05%
34 #SocBiz 463 0.36% 34 digital 436 0.05%
35 #Google 414 0.32% 35 Sage 425 0.05%
36 #music 411 0.32% 36 premio 424 0.05%
37 #Madrid 405 0.31% 37 datos 423 0.05%
38 #Oracle 401 0.31% 38 tecnico/a 421 0.05%
39 #Android 395 0.30% 39 futuro 420 0.05%
40 #trabajo 395 0.30% 40 nacional 415 0.05%
41 #SPD 385 0.30% 41 red(es) 414 0.05%
42 #cloudcomputing 369 0.28% 42 noticia 402 0.05%
43 #formación 359 0.28% 43 aplicaciones 398 0.05%
44 #SeriousGames 351 0.27% 44 compañeros 390 0.05%
45 #discapacidad 342 0.26% 45 Samsung 385 0.05%
46 #internet 338 0.26% 46 evento 379 0.05%
47 #startup 328 0.25% 47 movil 370 0.05%
48 #FP 325 0.25% 48 director 369 0.04%
49 #100armeriaeskola 315 0.24% 49 seguridad 359 0.04%
50 #PostPC 301 0.23% 50 formacion 347 0.04%

Appendixes 223
232
Appendix 18: The evolution of the machine tool industry in Elgoibar (1914‐2014)
Source: Andonegi and Arrieta (2014: 40‐41).

224 CHAPTER ii
Appendix 19: Board of Directors at the Gunsmithing School (1912)
N. Name and first
surname Responsability Occupation
1 Valentin Orbea President Orbea y Cia, Industrias Bakelan, Panificadora Urquizu
2 Pedro Goenaga Vice‐president F. Arizmendi y Goenaga
3 Fernando Irusta Secretary Industrias Bakelan, Irusta Hermanos, Trocaola Aranzabal y Cia
4 Victor Sarasqueta Member Victor Sarasqueta, La Eibarresa, Cooperativa Electrica Eibarresa
5 Tomas Garate Member GAC
6 Jose Ramon Iriondo Member Municipal judge, fire‐arms workshop
7 Martin Erquiaga Member Erquiaga Muguruza y Cia
8 Santiago Astigarraga Member Mayor of the town and ox‐herder, Martin Errasti y Cia
9 Aquilino Amuategui Member Politician of the Socialist Party, Coop. Elect. Eibarresa
10 Martin Setien Member Worker at Esperanza y Unceta
11 Ignacio Josue Member Engraver
12 Julian Aramberri Member Hijos de V. Aramberri y Cia, La Eibarresa, Coop. Elect. Eibarresa
13 Domingo Elorza Member Larrañaga y Elorza
Source: Archival data of the Gunsmithing School and the Commercial Registry Office of Gipuzkoa.
Appendix 20: Board of directors of the AAA (1972)
N. Name and first surname Responsability Company
1 Enrique Franco President Industrias DEJ
2 Julio Larrea Vice‐president Norma
3 Gerardo Acha Secretary Esteban Acha
4 Enrique Ereña Treasurer Metronic
5 Jesus Mª Larrañaga Full Member Gunsmithing School
6 Benjamin Villabella Member Gunsmithing School
7 Ramon Arizmendi
Laboratory
Norberto Arizmendi
8 J. Manuel Cengotita Timoteo Sarasqueta
9 J. Larzaguren Alfa
10 Isaac Ochandiano Ochandiano
11 Jesus Mª Alberdi
Associates 12 Jose Mª Elcoro Elcoro Hermanos
13 Luis Mª Aristegui Francisco Arana
14 Pedro Mª Ormaechea
Courses, exhibitions and screenings
Soraluce
15 Roberto Ruiz V. Berrizbeitia
16 Jacinto Irazola Victoriano Irazola
17 Miguel A. Urcola
18 Iñaki Echeverria Industrias ELE
19 Iñaki Garmendia
Newsletter and library
Electrociclos
20 Antonio Urreta ABC
21 Jose Mª Salbide
22 Jaime Lejardi ABC
23 Nestor Bustinduy IDESA
24 Jose Mª Dorado Hijos de Valenciaga
Source: Newsletter of the AAA, n. 77 (1972).

Appendixes 225
Appendix 21: Representatives of the Town Council (1938)
N. Name and first surname Responsability Occupation
1 Jose Gonzalez Orbea Mayor Orbea y Cia
2 Juan Berraondo Deputy Mayor Aurrera
3 Felix Errasti Councillor Industrias Arpes
4 Manuel Artamendi Councillor Artamendi y Cia
5 Adriano Bacaicoa Councillor Pharmacist
6 Heraclio Echeverria Councillor Heraclio Echeverria y Cia
7 Pedro Urizar Councillor Professor Gunsmithing School
8 Justo Oria Councillor Echaluce y Cia
9 Juan Urizar Councillor Irusta, Arrillaga y Cia
10 Julian Aristondo Councillor Engraver
11 Ciriaco Anitua Councillor Doctor
12 Candido Astaburuaga Councillor Camas Astaburuaga
13 Jesus Baglietto Councillor Painter
Source: Municipal archive of Eibar and the Commercial Registry Office of Gipuzkoa.
Appendix 22: Top 25 of most repeated surnames in registered firms
N. First surname Repeated N. Second surname Repeated
1 Echeverria 37 1 Alberdi 49
2 Alberdi 36 2 Guisasola 46
3 Garate 35 3 Echeverria 41
4 Guisasola 35 4 Larrañaga 40
5 Orbea 33 5 Zubizarreta 22
6 Acha 30 6 Elorza 21
7 Arizaga 30 7 Perez 21
8 Sarasqueta 29 8 Acha 18
9 Aguirre 25 9 Aranzabal 17
10 Aramberri 25 10 Garate 17
11 Arizmendiarrieta 25 11 Gonzalez 17
12 Anitua 23 12 Arana 16
13 Fernandez 23 13 Arrizabalaga 16
14 Gonzalez 23 14 Gallastegui 16
15 Iriondo 21 15 Ibarzabal 16
16 Telleria 21 16 Iriondo 16
17 Bascaran 20 17 Suinaga 16
18 Arrizabalaga 19 18 Aguirre 15
19 Churruca 19 19 Arrieta 15
20 Gabilondo 19 20 Sarasqueta 15
21 Sarasua 19 21 Ugarteburu 15
22 Errasti 17 22 Zabaleta 15
23 Aldazabal 16 23 Arizmendi 14
24 Larrañaga 16 24 Aguirregomezcorta 13
25 Mendizabal 16 25 Iturrioz 13
Source: Commercial Registry Office of Gipuzkoa.

226 CHAPTER ii
Appendix 23: Members of “Ezkuadra Zarra” (1911)
N. Name and first surname Occupation
1 Adolfo Zubia Dance professor
2 Indalecio Ojanguren Photographer
3 Ignacio Vildosola Otaola y Vildosola
4 Ciriaco Aguirre Doctor, Iceta y Cia
5 Bonifacio Echeverria Star, J. Cruz Echeverria e hijo y Badiola, Orozco y Echeverria
6 Pedro Matauco
7 Francisco Alberdi Francisco Alberdi, La Eibarresa
8 Ramon Iriondo Representative of the Town Council
9 Nemesio Astaburuaga GAC
10 Facundo Iturrioz Politician of the Basque Nationalist Party
11 Francisco Muñoz La Eibarresa
12 Arturo Pertegas
13 Tomas Echaluce Journalist of La Voz de Guipúzcoa
14 Eladio Larrañaga La Eibarresa
15 Ildefonso Irusta Irusta Hermanos Anitua y Letamendia
16 Vicente Villar Doctor
17 Jose Antonio Astigarraga Tenor
18 Feliciano Astaburuaga
19 Segundo Mayora Teacher and pianist, La Eibarresa, La Taurina Eibarresa
20 Leonardo Aranzabal Aguirre y Aranzabal
21 Julian Aramberri Hijos de V. Aramberri y Cia, La Eibarresa, Coop. Elect. Eibarresa
22 Jose Francisco Anitua Aurrera, Irusta Hermanos y Cia, GAC
23 Antonio Labaca
24 Narciso Alberdi Aurrera, La Eibarresa
25 Jose Ramon Iriondo Municipal judge
26 Tomas Irusta Irusta Hermanos y Cia
27 Ramon Gomez
28 Daniel Arrate Aurrera, La Eibarresa
29 Jose Azpiri Azpiri y Zabala
30 Pedro Guisasola La Eibarresa
31 Fernando Irusta Industrias Bakelan, Irusta Hermanos y Cia, Trocaola Aranzabal y Cia
32 Santiago Astigarraga Mayor of the town and ox‐herder, Martin Errasti y Cia
33 Victor Sarasqueta Victor Sarasqueta, La Eibarresa, Cooperativa Electrica Eibarresa
34 Martin Antonio Bascaran Aurrera, La Eibarresa
Source: Archival data of the Gunsmithing School and the Commercial Registry Office of Gipuzkoa.

Appendixes 227
Appendix 24: Cuadrilla Kurdin
N. Name and first surname Occupation
1 Romulo Alvarez
2 Gregorio Anitua Almacenes Anitua, Comercial Arrate
3 Casto Aristondo Hijos de D. Aristondo
4 Francisco Bolumburu Dental technician, Lambretta
5 Jose Antonio Charola Industrias Mendizabal, CITESA
6 Juan Echeverria
7 Lazaro Echeverria
8 Martin Errasti Martin Errasti y Cia
9 Jose Maria Gomez Lorry driver
10 Bonifacio Guisasola Star, Inmobiliaria Arrate, CITESA
11 Jose Iceta Hairdresser, Alfa
12 Pedro Irusta Sales representative
13 Vicente Marcaide Damascening artisan
14 Vicente Olave Alfa
15 Esteban Orbea Orbea y Cia, Espectaculos Taurinos Eibarreses
16 Manuel Otaola Otaola y Vildosola
17 Jose Salgado Rodisa
18 Victor Sarasqueta (son) Victor Sarasqueta, Inmobiliaria Arrate
19 Angel Treviño Treviño y Arrieta, Simes
20 Pedro Trocaola Ayra‐Durex
21 Gerardo Uriona Alfa
22 Enrique Valenciaga Hijos de Valenciaga
23 Bonifacio Villabella Viuda e Hijos de B. Villabella
24 Manuel Zubia Star, barman
Source: Archival data of Kerizpe Club and the Commercial Registry Office of Gipuzkoa.
Appendix 25: Board of directors of the Casino Artista Eibarres (1919)
N. Name and first surname Responsability Company
1 Francisco Arizmendiarrieta President F. Arizmendi y Goenaga, Ind. Bakelan, C. Elec. Eibarresa
2 Victor Sarasqueta Vice‐president Victor Sarasqueta, La Eibarresa, Coop. Elec. Eibarresa
3 Teodoro Elcoro Treasurer Teodoro Elcoro, Coop. Elec. Eibarresa
4 Ciriaco Mendizabal Secretary Mendizabal y Barranco, Industrias Mendizabal
5 Marciano Aramburu Member Larrañaga y Briet
6 Benito Bereciartua Member Gunsmith
7 Eulogio Garate Member GAC
8 Felipe Unzueta Member Pelota player
9 Casimiro Orbea Member Orbea y Cia
10 Juan Aramburu Member
11 Isidro Gaztañaga Member Isidro Gaztañaga, Ind. Bakelan, Ayra‐Durex, Ast. Deva
Source: Archival data of the Casino Artista Eibarres and the Commercial Registry Office of Gipuzkoa.

228 CHAPTER ii
Appendix 26: Governing team with some health professionals (1955)
Source: Narbaiza (2008)
1. Gregorio Esparza2. Martiniano Larrañaga3. Cristino Zulaica4. Juan Salaverria5. Jesus Alberdi6. Jacinto Zuloaga7. Timoteo Larreategui8. Luis Palacios (mayor)9. Angel Artamendi10. Angel Loyola
1 2 3 4 5
6 7 8
9
10