Social Media Modeling and Computing
29
-
Upload
khangminh22 -
Category
Documents
-
view
2 -
download
0
Transcript of Social Media Modeling and Computing


Social Media Modeling and Computing

Steven C.H. Hoi � Jiebo Luo � Susanne Boll �
Dong Xu � Rong Jin � Irwin KingEditors
Social MediaModelingand Computing

EditorsAsst. Prof. Steven C.H. HoiNanyang Technological UniversitySchool of Computer EngineeringSingapore, [email protected]
Dr. Jiebo LuoKodak Research LaboratoriesLake Avenue 199914650 Rochester, [email protected]
Prof. Susanne BollUniversity of OldenburgMedia Informatics and Multimedia SystemsEscherweg 226121 [email protected]
Asst. Prof. Dong XuNanyang Technological UniversitySchool of Computer EngineeringSingapore, [email protected]
Assoc. Prof. Rong JinMichigan State UniversityDept. Computer Science and EngineeringEngineering Building 311548824 East Lansing, [email protected]
Prof. Irwin KingAT&T Labs ResearchSan FranciscoUSAandThe Chinese University of Hong KongDept. Computer Science and EngineeringShatinHong Kong [email protected]
ISBN 978-0-85729-435-7 e-ISBN 978-0-85729-436-4DOI 10.1007/978-0-85729-436-4Springer London Dordrecht Heidelberg New York
British Library Cataloguing in Publication DataA catalogue record for this book is available from the British Library
Library of Congress Control Number: 2011923787
© Springer-Verlag London Limited 2011Apart from any fair dealing for the purposes of research or private study, or criticism or review, as per-mitted under the Copyright, Designs and Patents Act 1988, this publication may only be reproduced,stored or transmitted, in any form or by any means, with the prior permission in writing of the publish-ers, or in the case of reprographic reproduction in accordance with the terms of licenses issued by theCopyright Licensing Agency. Enquiries concerning reproduction outside those terms should be sent tothe publishers.The use of registered names, trademarks, etc., in this publication does not imply, even in the absence of aspecific statement, that such names are exempt from the relevant laws and regulations and therefore freefor general use.The publisher makes no representation, express or implied, with regard to the accuracy of the informationcontained in this book and cannot accept any legal responsibility or liability for any errors or omissionsthat may be made.
Cover design: deblik
Printed on acid-free paper
Springer is part of Springer Science+Business Media (www.springer.com)

Preface
Recent years have witnessed a growing number of user-centric multimedia applica-tions, especially with the popularity of web 2.0. Examples include Flickr, YouTube,Facebook, Twitter, MySpace, etc. The emerging applications on social web and so-cial networks have produced a new type of multimedia content, termed as “socialmedia” here, as it is created by people using highly accessible and scalable pub-lishing technologies for sharing via the web. With social media technology, images,videos and audios are generally accompanied by rich contextual information, suchas tags, categories, title, metadata, comments, and ratings, etc. Massive emerging so-cial media data offer new opportunities for solving some long-standing challenges inmultimedia understanding and management, such as the semantic gap issue. Thesenew media also introduce a number of new and challenging research problems andmany exciting real-world applications.
This book presents recent advances on several aspects of emerging social mediamodeling and social media computing research. It is designed for practitioners andfor researchers of all levels of expertise, from novice to expert. It targets variousgroups of people who need information on social media modeling and social mediacomputing. They include:
• People who need a general understanding of social media. They are high-levelmanagers and professional engineers who are interested in emerging social mediamodeling and computing technologies.
• Software developers who apply social media modeling and computing tech-niques. It also includes practitioners in related disciplines such as multimediacontent management, information retrieval, web search, data mining, and ma-chine learning.
• Researchers and students who are working on social media, multimedia, websearch, data mining, and machine learning, and related disciplines, as well asanyone who wants a deep understanding of techniques for social media modelingand computing.
Regarding the contents and organization, this book consists of 12 chapters thatpresent a variety of emerging technologies on social media modeling and comput-
v

vi Preface
ing. In particular, these book chapters can be summarized in the following threemajor aspects:
• Social media content analysis: The first part of the book is related to the ap-plication of multimedia content analysis techniques to the emerging social me-dia data. It includes social image tag analysis (chapter “Quantifying Visual-Representativeness of Social Image Tags using Image Tag Clarity”), social im-age tag ranking (chapter “Tag-Based Social Image Search: Towards Relevant andDiverse Results”), and tag-based social image search (chapter “Social Image TagRanking by Two-View Learning”), social media content analysis by combiningmultimodal features (chapter “Combining Multimodal Features for Social MediaAnalysis”), and multi-label social image annotation by exploring group structures(chapter “Multi-label Image Annotation by Structural Grouping Sparsity”).
• Social media system design and analysis: The second part of the book is de-voted to social media system design and analysis. It includes the design of effec-tive social media mechanism for incentivizing social media contributions (chapter“Mechanism Design for Incentivizing Social Media Contributions”), the designof efficient access control for privacy and security issues in multimedia social net-works (chapter “Efficient Access Control in Multimedia Social Networks”), theanalysis of users and their online behaviors in social video sharing portals (chap-ter “Call Me Guru: User Categories and Large-Scale Behavior in YouTube”), andvisual analytic tools for social event analysis (chapter “Social Media Visual Ana-lytics for Events”).
• Social media applications: The last part of the book is related to the developmentof emerging social media applications by exploring emerging user-contributedsocial media data. It includes the application of social media information to mu-sic recommendation (chapter “Using Rich Social Media Information for MusicRecommendation via Hypergraph Model”), the application of user-contributedGeotag information to automatic image annotation (chapter “Using Geotags toDerive Rich Tagclouds for Image Annotation”), and the application of social me-dia techniques to analyze and improve real-world photobooks (chapter “SocialAspects of Photobooks: Improving Photobook Authoring from Large-scale Mul-timedia Analysis”).
Each of the above book chapters can be considered as a compact, self-containedmini-book in its own right under its title. They are, however, organized and pre-sented in relation to the basic principles and practice of social media modeling andcomputing. We also note that this book can be used as advanced materials by grad-uate students of information technology related subjects, such as computer science,computer engineering, and information systems, either in a classroom or for self-study.
Finally, this book was first initialized during the organization of the first interna-tional workshop on social media (WSM2009). It was later developed by solicitingcontributions from a number of international experts on social media modeling andcomputing to present their best knowledge and practice on specific social mediarelated topics. Some chapters of this book were originated from recent studies in in-

Preface vii
ternational conferences and workshops, including the SIGMM international Work-shop on Social Media (WSM), and ACM International Conference on Multimedia(ACM Multimedia), and ACM International conference on Web Search and DataMining (WSDM). As co-editors of this book, we would like to thank all the authorsof the book chapters for their great efforts in providing the high quality contents tothis book, and our colleagues who helped us during the organization of the WSMworkshops and the book editing process.
Steven C.H. HoiJiebo Luo
Susanne BollDong XuRong Jin
Irwin King
SingaporeUSAGermanySingaporeUSAUSA

Contents
Part I Social Media Content Analysis
Quantifying Visual-Representativeness of Social Image Tags UsingImage Tag Clarity . . . . . . . . . . . . . . . . . . . . . . . . . . . . 3Aixin Sun and Sourav S. Bhowmick
Tag-Based Social Image Search: Toward Relevant and Diverse Results . . 25Kuiyuan Yang, Meng Wang, Xian-Sheng Hua, and Hong-Jiang Zhang
Social Image Tag Ranking by Two-View Learning . . . . . . . . . . . . . 47Jinfeng Zhuang and Steven C.H. Hoi
Combining Multi-modal Features for Social Media Analysis . . . . . . . . 71Spiros Nikolopoulos, Eirini Giannakidou, Ioannis Kompatsiaris, IoannisPatras, and Athena Vakali
Multi-label Image Annotation by Structural Grouping Sparsity . . . . . . 97Yahong Han, Fei Wu, and Yueting Zhuang
Part II Social Media System Design and Analysis
Mechanism Design for Incentivizing Social Media Contributions . . . . . 121Vivek K. Singh, Ramesh Jain, and Mohan Kankanhalli
Efficient Access Control in Multimedia Social Networks . . . . . . . . . . 145Amit Sachan and Sabu Emmanuel
Call Me Guru: User Categories and Large-Scale Behavior in YouTube . . 167Joan-Isaac Biel and Daniel Gatica-Perez
Social Media Visual Analytics for Events . . . . . . . . . . . . . . . . . . 189Nicholas Diakopoulos, Mor Naaman, Tayebeh Yazdani, and FundaKivran-Swaine
ix

x Contents
Part III Social Media Applications
Using Rich Social Media Information for Music Recommendationvia Hypergraph Model . . . . . . . . . . . . . . . . . . . . . . . . . . 213Shulong Tan, Jiajun Bu, Chun Chen, and Xiaofei He
Using Geotags to Derive Rich Tag-Clouds for Image Annotation . . . . . 239Dhiraj Joshi, Jiebo Luo, Jie Yu, Phoury Lei, and Andrew Gallagher
Social Aspects of Photobooks: Improving Photobook Authoringfrom Large-Scale Multimedia Analysis . . . . . . . . . . . . . . . . . 257Philipp Sandhaus and Susanne Boll
Index . . . . . . . . . . . . . . . . . . . . . . . . . . . . . . . . . . . . . . 279

Contributors
Sourav S. Bhowmick School of Computer Engineering, Nanyang TechnologicalUniversity, Singapore, Singapore, [email protected]
Joan-Isaac Biel Idiap Research Institute, Ecole Polytechnique Fédérale de Lau-sanne (EPFL), Lausanne, Switzerland, [email protected]
Susanne Boll University of Oldenburg, Oldenburg, Germany,[email protected]
Jiajun Bu Zhejiang Key Laboratory of Service Robot, College of Computer Sci-ence, Zhejiang University, Hangzhou 310027, China, [email protected]
Chun Chen Zhejiang Key Laboratory of Service Robot, College of Computer Sci-ence, Zhejiang University, Hangzhou 310027, China, [email protected]
Nicholas Diakopoulos School of Communication and Information, Rutgers Uni-versity, 4 Huntington St., New Brunswick, NJ 08901, USA,[email protected]
Sabu Emmanuel School of Computer Engineering, Nanyang Technological Uni-versity, Singapore, Singapore, [email protected]
Andrew Gallagher Corporate Research and Engineering, Eastman Kodak Com-pany, Rochester, USA
Daniel Gatica-Perez Idiap Research Institute, Ecole Polytechnique Fédérale deLausanne (EPFL), Lausanne, Switzerland, [email protected]
Eirini Giannakidou Informatics & Telematics Institute, Thermi, Thessaloniki,Greece, [email protected]; Department of Computer Science, Aristotle University ofThessaloniki, Thessaloniki, Greece
Yahong Han College of Computer Science, Zhejiang University, Hangzhou,China, [email protected]
xi

xii Contributors
Xiaofei He State Key Laboratory of CAD&CG, College of Computer Science, Zhe-jiang University, Hangzhou 310027, China, [email protected]
Steven C.H. Hoi School of Computer Engineering, Nanyang Technological Uni-versity, Singapore, Singapore, [email protected]
Xian-Sheng Hua Media Computing Group, Microsoft Research Asia, Beijing100080, China, [email protected]
Ramesh Jain University of California, Irvine, Irvine, USA, [email protected]
Dhiraj Joshi Corporate Research and Engineering, Eastman Kodak Company,Rochester, USA, [email protected]
Mohan Kankanhalli National University of Singapore, Singapore, Singapore,[email protected]
Funda Kivran-Swaine School of Communication and Information, Rutgers Uni-versity, 4 Huntington St., New Brunswick, NJ 08901, USA
Ioannis Kompatsiaris Informatics & Telematics Institute, Thermi, Thessaloniki,Greece, [email protected]
Phoury Lei Corporate Research and Engineering, Eastman Kodak Company,Rochester, USA
Jiebo Luo Corporate Research and Engineering, Eastman Kodak Company,Rochester, USA
Mor Naaman School of Communication and Information, Rutgers University,4 Huntington St., New Brunswick, NJ 08901, USA
Spiros Nikolopoulos Informatics & Telematics Institute, Thermi, Thessaloniki,Greece, [email protected]; School of Electronic Engineering and Computer Science,Queen Mary University of London, E1 4NS, London, UK
Ioannis Patras School of Electronic Engineering and Computer Science, QueenMary University of London, E1 4NS, London, UK, [email protected]
Amit Sachan School of Computer Engineering, Nanyang Technological Univer-sity, Singapore, Singapore, [email protected]
Philipp Sandhaus OFFIS – Institute for Information Science, Oldenburg, Ger-many, [email protected]
Vivek K. Singh University of California, Irvine, Irvine, USA, [email protected]
Aixin Sun School of Computer Engineering, Nanyang Technological University,Singapore, Singapore, [email protected]
Shulong Tan Zhejiang Key Laboratory of Service Robot, College of ComputerScience, Zhejiang University, Hangzhou 310027, China, [email protected]
Athena Vakali Department of Computer Science, Aristotle University of Thessa-loniki, Thessaloniki, Greece, [email protected]

Contributors xiii
Meng Wang AKiiRA Media Systems Inc, Palo Alto, CA 94301, USA,[email protected]
Fei Wu College of Computer Science, Zhejiang University, Hangzhou, China,[email protected]
Kuiyuan Yang Department of Automation, The University of Science and Tech-nology of China, Hefei, Anhui 230027, China, [email protected]
Tayebeh Yazdani School of Communication and Information, Rutgers University,4 Huntington St., New Brunswick, NJ 08901, USA
Jie Yu Corporate Research and Engineering, Eastman Kodak Company, Rochester,USA
Hong-Jiang Zhang Microsoft Advanced Technology Center, Beijing 100080,China, [email protected]
Jinfeng Zhuang School of Computer Engineering, Nanyang Technological Uni-versity, Singapore, Singapore, [email protected]
Yueting Zhuang College of Computer Science, Zhejiang University, Hangzhou,China, [email protected]

Part ISocial Media Content Analysis

Quantifying Visual-Representativeness of SocialImage Tags Using Image Tag Clarity
Aixin Sun and Sourav S. Bhowmick
Abstract Tags associated with images in various social media sharing web sitesare valuable information source for superior image retrieval experiences. Due to thenature of tagging, many tags associated with images are not visually descriptive.In this chapter, we propose Image Tag Clarity to evaluate the effectiveness of a tagin describing the visual content of its annotated images, which is also known asthe image tag visual-representativeness. It is measured by computing the zero-meannormalized distance between the tag language model estimated from the imagesannotated by the tag and the collection language model. The tag/collection languagemodels are derived from the bag of visual-word local content features of the images.The visual-representative tags that are commonly used to annotate visually similarimages are given high tag clarity scores. Evaluated on a large real-world datasetcontaining more than 269K images and their associated tags, we show that the imagetag clarity score can effectively identify the visual-representative tags from all tagscontributed by users. Based on the tag clarity scores, we have made a few interestingobservations that could be used to support many tag-based applications.
1 Introduction
With the advances in digital photography (e.g., digital cameras and mobile phones)and social media sharing web sites, a huge number of multimedia content is nowavailable online. Most of these sites enable users to annotate web objects includingimages with free tags (e.g., aircraft, lake, sky). For instance, most imagesaccessible through Flickr1 are annotated with tags from their uploaders as well as
1http://www.flickr.com.
This chapter is an extended version of the paper [11] presented at the first ACM SIGMMWorkshop on Social Media (WSM), held in conjunction with ACM Multimedia, 2009.
A. Sun (�) · S.S. BhowmickSchool of Computer Engineering, Nanyang Technological University, Singapore, Singaporee-mail: [email protected]
S.S. Bhowmicke-mail: [email protected]
S.C.H. Hoi et al. (eds.), Social Media Modeling and Computing,DOI 10.1007/978-0-85729-436-4_1, © Springer-Verlag London Limited 2011
3

4 A. Sun and S.S. Bhowmick
other users. A key consequence of the availability of such tags as meta-data is that ithas significantly facilitated web image search and organization as this rich collectionof tags provides more information than we can possibly extract from content-basedalgorithms.
Due to the popularity of tags, there have been increasing research efforts to betterunderstand and exploit tag usage patterns for information retrieval and other relatedtasks. One such effort is to make better use of the tags associated with images forsuperior image retrieval experiences. However, this is still a challenging researchproblem, as it is well known that tags are noisy and imprecise [1]. As discussedin [4], tags are created by users more for their personal use than for others’ benefit.Consequently, two similar images may be associated with significantly different setsof tags from different users, especially when images can only be annotated by userswith tagging permissions (e.g., in Flickr, only the uploader and his/her contacts cantag an image). Further, tags associated with an image may describe the image fromsignificantly different perspectives. For example, consider a photo uploaded by Sallywhich she took using her Canon 40D camera at Sentosa when she traveled to Singa-pore in 2008. This image may be annotated by different tags such as Canon, 40D,2008, Singapore, travel, beach, Sentosa, and many others. Notice thattags like 2008 and Canon do not effectively describe the visual content of the im-age, but more on providing contextual information about the image. Consequently,these tags maybe considered as noise in many applications (e.g., content-based tagrecommendation). As the presence of such noise may reduce the usefulness of tagsin image retrieval, “de-noising” tags has been recently identified as one of the keyresearch challenges in [1]. Such de-noising of tags also enables us to build moreeffective tag ranking and recommendation services [8].
In this chapter, we take a step toward addressing the above challenge. We focuson identifying and quantifying visual-representative tags from all tags assigned toimages so that less visually representative tags can be eliminated. Intuitively, a tagis visual-representative if it effectively describes the visual content of the images.A visual-representative tag (such as sky, sunset, and tiger) easily suggests thescene or object that an image may describe even before the image is presented toa user. On the other hand, tags like 2008 and Asia often fail to suggest anythingmeaningful with respect to the visual content of the annotated image as any imagetaken in 2008 or in Asia could be annotated by the two tags.
We propose the notion of image tag clarity to identify visual-representative tags.It is inspired by the clarity score proposed for query performance prediction in ad-hoc information retrieval for textual documents [2]. Note that clarity score cannot bedirectly applied to annotated images as keywords of a query literally appears in theretrieved text documents whereas the tags associated with an image do not explicitlyappear in it. Informally, the image tag clarity is computed by the Kullback–Leibler(KL) divergence between the tag language model and collection language modeland further normalized with zero-mean normalization. The tag/collection languagemodels are derived from the local content features (i.e., bag of visual-words) of theimages. Our experimental study with the NUS-WIDE dataset [1], containing 269,648images from Flickr, demonstrates that the proposed clarity score measure can effec-tively identify the visually representative tags.

Quantifying Visual-Representativeness of Social Image Tags Using Image Tag Clarity 5
Based on the experimental results, we further investigated the relationships be-tween tag visual-representativeness and tag frequency. Our study revealed that theyare weakly correlated. That is, frequently used tags are more likely to be visuallyrepresentative. We also observed that for images having three to 16 tags, the per-centage of visually representative tags increases with the increase in number of tags.Furthermore, the visual-representativeness of a tag and its position with respect toother tags for a given image are correlated. That is, the first few tags assigned to animage are more likely to be visually representative compared to tags assigned later.This probably reflects the phenomenon that users tend to first tag an image based onits visual content and later add other tags to describe it from different perspectives.Lastly, the visually (resp. non-visually) representative tags have higher chance ofco-occurring strongly with other visually (resp. non-visually) representative tags.These interesting observations could be very useful in supporting a wide range oftag-based applications such as tag recommendation and social image retrieval.
The rest of the chapter is organized as follows. In Sect. 2, we review the relatedwork with emphasis on clarity score for query performance prediction as well asimage tagging. Section 3 discusses the notion of image tag clarity. The details ofthe dataset and experimental results are reported in Sect. 4. The observations arepresented in Sect. 5 and we conclude this chapter in Sect. 6.
2 Related Work
Recall that our proposed image tag clarity measure is inspired by the notion ofclarity score proposed for query performance prediction in ad-hoc retrieval. Hence,we begin by reviewing the clarity score measure. Next, we discuss relevant researchefforts in annotating web objects with tags.
2.1 Clarity Score
Query performance prediction is to predict the effectiveness of a keyword query inretrieving relevance documents from a document collection [2]. The prediction en-ables a search engine to answer poorly performing queries more effectively throughalternative retrieval strategies (e.g., query expansion) [5, 15, 19, 20]. Depending onwhether documents need to be retrieved for the query, the query performance pre-diction algorithms can be classified into two types: pre-retrieval and post-retrievalalgorithms. Pre-retrieval algorithms rely on the statistics of the words in both thequery and the collection. For instance, queries consisting of words with low docu-ment frequencies in the collection tend to perform better than queries with high doc-ument frequency words. Post-retrieval algorithms predict query performance basedon the properties of the retrieved documents from the collection using the query.Among various post-retrieval algorithms, one significant contribution is the clarityscore [2].

6 A. Sun and S.S. Bhowmick
The clarity score of a query is computed as the distance between the query lan-guage model and the collection language model. If a query is effective in retrievingtopically cohesive documents, then the query language model contains unusuallylarge probabilities of words specific to the topic covered by the retrieved documents.Consequently, the distance between the query and the collection language modelsis large. If a query is ambiguous, then the documents covering various topics arelikely to be retrieved. That is, the retrieved set of documents is similar to a set ofdocuments through random sampling. As the word distribution in the retrieved doc-uments is similar to that in the collection, the distance between them is small.
Formally, let Q be a query consisting of one or more query words {q|q ∈ Q} andR be the set of top-K documents retrieved by Q from the collection D . The value ofK is predefined and set to 500 in [2]. Let w be an arbitrary word in the vocabulary.Then, the query language model P(w|Q) is estimated by Eq. (1), where P(d|Q) isestimated using Bayes’ theorem as shown in Eq. (2).
P(w|Q) =∑
d∈R
P (w|d)P (d|Q), (1)
P(Q|d) =∏
q∈Q
P(q|d). (2)
Observe that in both Eqs. (1) and (2), P(w|d) (resp. P(q|d)) is the relative fre-quency of word w (resp. q) in the document d linearly smoothed by w’s relativefrequency in the collection. The collection language model, P(w|D), is estimatedby the relative frequency of w in D . Then, the clarity score of Q is the Kullback–Leibler (KL) divergence between P(w|Q) and P(w|D), and is given by the follow-ing equation.
KL(Q‖D) =∑
w
P (w|Q) log2P(w|Q)
P (w|D). (3)
Tagging is a popular technique for annotating objects on the web. In our previouswork [13], we introduced the notion of tag clarity in the context of user behaviorstudy in self-tagging systems, i.e., blogs. The clarity score of a tag is defined by theKL divergence between the tag language model (estimated from the blog posts asso-ciated with the tag) and the collection language model estimated from all blog posts.As blogs are self-tagging, i.e., only the blogger could annotate his/her blog posts,the tag clarity was proposed to study whether users implicitly develop consensus onthe semantic of the tags. We observed that frequently used tags are topic discrim-inative. This finding is partially consistent with the findings in this proposed workalthough the object (text vs. image) of annotation and tagging rights (self-taggingvs. permission-based tagging) are different.
2.2 Tagging Images
Recent years have witnessed increasing research efforts to study images annotatedwith tags in social media sharing web sites like Flickr. Tag recommendation, tag
Quantifying Visual-Representativeness of Social Image Tags Using Image Tag Clarity 7
ranking, and tag-based classification are identified as key research tasks in this con-text [1]. Only few works exploit the relationship between a tag to the content of itsannotated images. For a given image and its annotated tags, the relevance betweenthe image and each tag is estimated through kernel density estimation in [8] andthrough k-nearest neighbor voting in [7]. In simple words, a tag is relevant to animage I if the tag has been used to annotate many images similar to I . The rele-vance score for a tag is therefore image-specific, whereas in our case the tag clarityscore is global. For a given tag, the score reflects its effectiveness in visually de-scribing all its annotated images. In this context, our work is also related to [10]where the main focus is on searching for high-level concepts (e.g., sunset) withlittle semantic gaps with respect to image representation in visual space. In [10], fora given image I , its confidence score is derived based on the coherence degree of itsnearest neighbors in both visual and textual spaces, assuming that each image is sur-rounded by textual descriptions. The high-level concepts are then derived throughclustering those images with high confidence scores. In contrast, our work differsin the following ways: (i) the computation of clarity score of a tag is purely basedon its annotated images represented in visual space only; (ii) our task is to measurethe visual-representativeness of a tag (i.e., a given concept) and not to mine con-cepts from textual descriptions; and (iii) our work does not rely on neighborhoodrelationships between images.
Very recently, Flickr distance was proposed to model two tags’ similarity basedon their annotated images [17]. For each tag, a visual language model is constructedfrom 1000 images annotated with the tag and the Flickr distance between the twotags is computed using the Jensen–Shannon divergence. Our work is significantlydifferent from [17] in three aspects. First, our main research objective is to mea-sure the visual-representativeness of a single tag and not the relationship betweentag pairs. Second, the language models are estimated from different image repre-sentations. Our language models are estimated on top of the widely adopted bag ofvisual-words representation [9] while visual language model has its own definitionin [17]. Third, we analyze the impact of tag frequency on its language modeling.In their work, a fixed number (i.e., 1000) of images for each tag were sampled forestimating its language model.
In [16], a probabilistic framework was proposed to resolve tag ambiguity inFlickr by suggesting semantic-orthogonal tags from those tags that co-occurred withthe given set of tags. Although tag ambiguity is highly related to tag clarity, theapproach in [16] was purely based on tag co-occurrence without considering thecontent of annotated images.
3 Image Tag Clarity
Intuitively, a tag is visually representative if all the images annotated with the tagare visually similar to each other. In this sense, we heuristically consider the as-signment of a tag t to an image I as a sampling process. We assume that a usersamples images from a large collection and decides whether t shall be assigned to

8 A. Sun and S.S. Bhowmick
some images. Based on this setting, if all users have an implicit common under-standing on the sampling process with respect to the visual content of the images,then the assignment of the visual-representative tags is a biased sampling processsuch that only those images that contain certain visual concepts (e.g., sunset scene)will be assigned as a visual-representative tag (e.g. sunset). On the other hand,the assignment of a non-visually representative tag is an unbiased sampling pro-cess to images regardless of their visual content. Most contextual tags describingthe time and location in general (e.g., the country where the photo was taken) be-long to the latter case. For instance, any image taken in Singapore during year 2008can be tagged by Singapore and 2008 and either tag hardly describes the vi-sual content of the tagged images. Based on this heuristic, for a given tag t , we canconsider the set of images It annotated by t and compare this set to a randomlydrawn set of images of similar size, denoted by I ′
t (|It | � |I ′t |), where t ′ denotes a
dummy tag randomly assigned to images. If It is similar to any I ′t , randomly drawn
from a large collection of images in terms of visual content, then t is unlikely todescribe any specific visual concepts. Otherwise, if It is significantly different fromI ′t , demonstrating common visual content features, then we consider t to be visually
representative. In the following, we present image tag clarity measure to quantifytag visual-representativeness.
The image tag clarity score is based on the following framework. We considera tag to be a keyword query and the set of images annotated with the tag are theretrieved documents based on a boolean retrieval model (returns an image as longas the image is annotated with the tag with equal relevance score). Then the clarityscore proposed for query performance prediction can be adopted to measure tagclarity if the visual content of the images can be represented by “word” vectorssimilar to that for representing textual documents. That is, if all images associatedwith the tag are visually similar, then the language model estimated from the setof retrieved images (or the tag language model) shall contain some “words” withunusually high probabilities specific to the tag making the distance between the tagand the collection language models large. Among the various low-level features thatare commonly used to represent images, the bag of visual-words feature representsimages very much like textual documents [9]. In the sequel, we assume that a bagof visual-words has been extracted to represent each image.2 We also use “image”and “document” interchangeably due to this representation.
3.1 Image Tag Clarity Score
Let It be the set of images annotated by a tag t and I be the image collection. Basedon the clarity score definition in Eq. (3), the image tag clarity score of t , denotedby τ(t), is defined as the KL divergence between the tag language model (P(w|It ))
2Nevertheless, we believe that the image tag clarity score is generic and can be computed usingother feature representations.

Quantifying Visual-Representativeness of Social Image Tags Using Image Tag Clarity 9
and the collection language model (p(w|I )), where w denotes a visual-word. It isexpressed by the following equation.
τ(t) = KL(It‖I ) =∑
w
P (w|It ) log2P(w|It )
P (w|I ). (4)
As a collection language model is often estimated by the relative word frequencyin the collection, our main focus in this section is to estimate the tag language modelP(w|It ). This is a challenging issue for the following reason. In textual documents,keywords in a query Q literally appear in the retrieved documents. Hence, the degreeof relevance between a document d and query Q (i.e., P(d|Q)) can be estimatedusing Eq. (2). However, in a bag of visual-words representation, the tag and thewords are from two different feature spaces. As a tag does not literally appear inimages, the degree of relevance of an image to a tag is unknown. That is, P(d|Q) inEq. (1) (or P(I |It ) in our setting) has to be estimated differently, as Eq. (2) cannotbe directly applied.
Intuitively, there are at least two approaches to estimate the tag language model.First, we can simply treat all images equally representative of a tag t , so all theimages annotated with t have uniform probability to be sampled. Second, we canestimate the representativeness of images based on their distances to It ’s centroid.Images that are more close to the centroid of It are considered more representativeand shall contribute more to the estimation of the tag language model.
• The first approach estimates the tag language model as the average relative visual-word frequency in the images with equal importance 1
|It | . Hence, the tag languagemodel, denoted by Ps(w|It ), is given by the following equation.
Ps(w|It ) =∑
I∈It
1
|It |Pml(w|I ). (5)
Observe that it is consistent with the small document model used in [3] for blogfeed search. Similar approach has also been used in modeling blog tag clarity inour earlier work [13].
• In the second approach, also known as the centrality document model, the taglanguage model Pc(w|It ) is estimated using Eq. (6), where P(I |It ) reflects therelative closeness of the image I to It ’s centroid defined in Eq. (7).
Pc(w|It ) =∑
I∈It
Pml(w|I )P (I |It ), (6)
P(I |It ) = ϕ(I, It )∑I∈It
ϕ(I, It ), (7)
ϕ(I, It ) =∏
w∈I
Ps(w|It )Pml(w|I ). (8)
In Eq. (7), ϕ(I, It ) is a centrality function which defines the similarity betweenan image I to the tagged collection It . Let Ps(w|It ) be the tag language modelestimated with small document model in Eq. (5) and Pml(w|I ) be the relative

10 A. Sun and S.S. Bhowmick
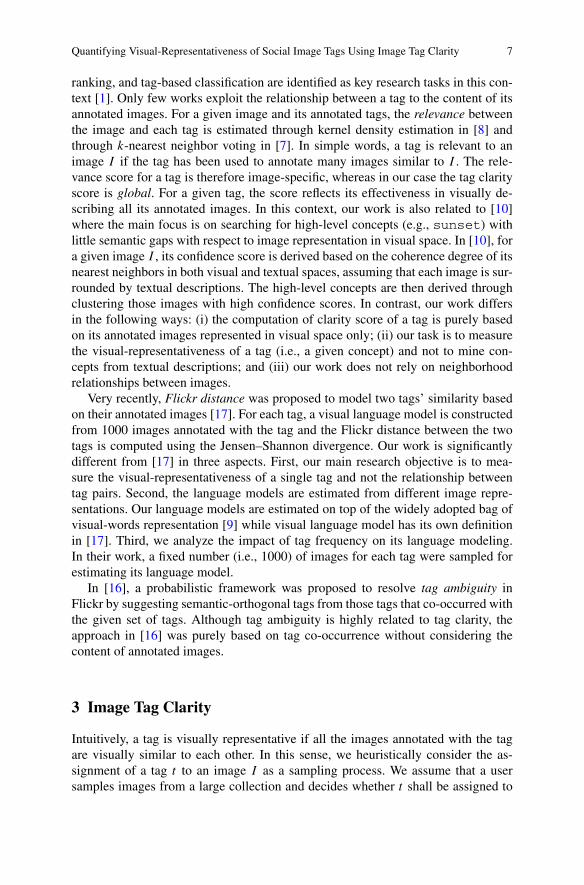
Fig. 1 Tag language modelsagainst collection languagemodel. The x-axis is thevisual-words orderedaccording to P (w|I ) indescending order, and they-axis shows the P (w|It ) andP (w|I ) for each tag
visual-word frequency of w in image I . Then based on [3], ϕ(I, It ) is defined tobe the weighted geometric mean of word generation probabilities in It as shownin Eq. (8). The weight of each visual-word is its likelihood in image I .
The estimated tag language model is further smoothed using the Jelinek–Mercersmoothing with λ = 0.99.
Psmoothed(w|It ) = λPc(w|It ) + (1 − λ)P (w|I ). (9)
Intuitively the centrality document model better simulates the clarity score com-pared to the small document model. However, the distance between an image I tothe tagged collection It is an estimation which may not necessarily reflect the rel-evance between the image I and the tag t . Our experimental study revealed thatthe two models deliver nearly identical results. Hence in this chapter, we report theresults based on the small document model due to its simplicity.
Figure 1 illustrates four example tag language models against the collection lan-guage model derived from the NUS-WIDE dataset (see Sect. 4). The x-axis is thevisual-words ordered according to P(w|I ) in descending order; and the y-axisshows the P(w|It ) and P(w|I ), respectively. Clearly, the tag language modelsfor Sunset and Zebra are significantly different from the collection languagemodel, while the models for Asia and 2008 are very similar to that of the col-lection model. That is, the images tagged by either Asia or 2008 are similar to arandomly sampled set of images from the collection. For either Sunset or Zebra,one may expect the annotated image contains or describes the scene or object ex-pressed by the semantic of the tag, making these images similar to each other anddistinctive from the entire collection. Table 1 reports the tag clarity scores of thesefour tags. Observe that τ(Sunset) and τ(Zebra) are much larger than τ(Asia) andτ(2008).

Quantifying Visual-Representativeness of Social Image Tags Using Image Tag Clarity 11
Table 1 Clarity scores, normalized clarity scores and tag frequencies for the four example tags
Tag Tag clarity τ(t) Normalized tag clarity τz(t) Tag frequency |It |
Sunset 0.294 285.3 10962
Zebra 0.412 97.9 627
Asia 0.004 −2.5 3878
2008 0.005 −1.9 4388
3.2 Normalized Image Tag Clarity Score
The aforementioned example demonstrates that Sunset and Zebra are more visu-ally representative than Asia and 2008. However, it is hard to determine a thresh-old for tag clarity τ(t) such that if a tag t has its clarity score above the thresholdvalue then it is considered visually representative. Recall from Sect. 2.1, the querylanguage model is estimated from a fix number of top-K documents (e.g., K = 500in [2]). The clarity scores for all queries are therefore computed based on the samenumber of documents. However in tagging, the tag distribution follows power-lawdistribution where a small set of tags are much more frequently used than other tags(see Sect. 4). The sizes of the It for different tags can therefore be significantlydifferent. We address this issue by normalizing the image tag clarity score.
Reconsider the task of assigning a tag to an image as a sampling process ofpicking up images from a large collection (i.e., I ). If the sampling is unbiased(i.e., uniform sampling), then the language model of the sampled images P(w|It )
naturally gets closer to P(w|I ) as It gets larger. Hence, the distance KL(It‖I )
becomes smaller. Therefore, KL(It‖I ) may not accurately reflect the clarity of atag as it is expected that KL(It1‖I ) < KL(It2‖I ) if |It1| > |It2| when both t1 andt2 are uniformly sampled, i.e., not visually representative.
To determine whether a tag t is visually representative, its tag clarity score τ(t)
is compared with the clarity score of a dummy tag t ′ which is randomly assignedto images in I such that t and t ′ have the same tag frequency. That is, if a tagt is visually representative, then its image tag clarity score τ(t) is expected to besignificantly larger than τ(t ′) where t ′ is a dummy tag randomly assigned to thesame number of images as of t (or |It ′ | = |It |).3 In our experiments, we observed thatτ(t ′) follows a normal distribution for all dummy tags having the same tag frequency|It ′ |. Hence we apply zero-mean normalization and the normalized image tag clarityscore τz(t) is given in Eq. (10), where μ(t ′) and σ(t ′) are the expected tag clarityscore and its standard deviation derived from multiple dummy tags, respectively.
τz(t) = τ(t) − μ(t ′)σ (t ′)
. (10)
3Recall that both τ(t) and τ(t ′) are computed purely from visual content features of their taggedimages.

12 A. Sun and S.S. Bhowmick
Fig. 2 The expected tagclarity scores and theirstandard deviations derivedfrom 500 dummy tags withrespect to the tag frequencyon the x-axis. The fourexample tags are also plottedwith their frequencies andclarity scores
The normalized image tag clarity score is the number of standard deviations atag is observed with respect to a randomly assigned dummy tag with the same tagfrequency. Note that tag frequency is an important measure here as both μ(t ′) andσ(t ′) are heavily affected by it. As discussed earlier, the larger is |It ′ | the closerits language model to the collection model. This is illustrated by Fig. 2, which re-ports the expected tag clarity scores and their standard deviations derived from 500dummy tags with respect to the tag frequencies on the x-axis. The four exampletags are also plotted with their frequencies and clarity scores. Observe that althoughτ(Sunset) < τ(Zebra), τz(Sunset) > τz(Zebra) after the normalization process (Ta-ble 1).
3.3 Time Complexity
The proposed tag language model can be estimated in O(N) time for a tag associ-ated with N images. Note that the expected tag clarity scores and standard deviationneed to be computed only once for all tags with tag frequency N in a given dataset.Moreover, the computation of expected tag clarity scores and standard deviation canbe further reduced by binning the tag frequencies and computing the expected tagclarity scores and standard deviations for each frequency bin.
In our experiments, we are interested in the tags that have been used to tag at least100 images. We set our first frequency bin to cover tag frequency from b0 = 100 tob1 = 110. Subsequently, we set bn+1 = (1 + 10%) × bn (n ≥ 0) until the last bincovers the tag with highest tag frequency in our dataset. For each bin starting withbn, 500 dummy tags with tag frequency randomly generated within [bn, bn+1) areused to derive the expected tag clarity and standard deviation (shown in Fig. 2).A given tag clarity score is then normalized by μ(bn) and σ(bn) where bn is the bin|It | belongs to. Observe that in this setting every tag is normalized using dummytags generated with frequencies within 10% of its frequency.4
4Note that the way we bin the tag frequencies and the number of dummy tags used for estimationof the expected tag clarity scores and their standard deviations are different from that in [11]. Thisleads to differences in the normalized tag clarity scores reported in Sects. 4 and 5.

Quantifying Visual-Representativeness of Social Image Tags Using Image Tag Clarity 13
4 Performance Evaluation
Evaluation of the techniques for quantifying tag visual-representativeness is a chal-lenging research issue for two reasons. Firstly, there is a lack of widely adopted met-ric for the performance evaluation. Secondly, there is a lack of benchmark data forthe evaluation. In the following, we present a summary of the evaluations conductedin our earlier work [12] and then report the observations from the experimental re-sults. The technical details of the evaluation can be found in [12].
We used the NUS-WIDE dataset5 containing 269,648 images from Flickr [1].The images are assigned with zero, one or more categories (or concepts) from apre-defined list of 81 categories. The dataset provides six types of low-level fea-tures including both global features (e.g., color histogram, edge direction histogram,wavelet texture features and others) and local features (500-D bag of visual-words).The normalized image tag clarity score discussed in this chapter is also known asSClarL method in [12] and the method is compared against another six methodsfor quantifying image tag visual-representativeness using either global features orlocal features. In our evaluation, we formulate the task of quantifying tag visual-representativeness as a classification task to distinguish visual-representative tags(i.e., positive tags) from non-visual-representative tags (i.e., negative tags).
Two sets of labeled tags were used in the experiments. In the first set of labeledtags, the 81 categories (which also appear as tags) in the NUS-WIDE dataset wereused as positive tags and another 78 frequently used tags in the dataset were identi-fied as negative tags. These 78 tags include 17 tags related to time (e.g., 2004–2008,January–December) and 61 location tags related to continent and country names(e.g., Europe, Japan). In the second set of labeled tags, 1576 frequently used tagswere manually labeled including 814 positive tags (for object, scene, activity, color,and picture type) and 762 negative tags (for location, self-reference, opinion, cameramodel, and time).
The experimental evaluation adopted three performance metrics, namely, Aver-age Precision, Precision@N , and Coverage@N . Among the seven methods eval-uated, image tag clarity performed very well, with very good precision and fairlygood coverage. In particular, the average precisions for the first and second setsof labeled tags were 0.89 and 0.74, respectively. The detailed results are reportedin [12].
5 Observations Related to Image Tag Clarity Scores
In the NUS-WIDE dataset, there are more than 420K distinct tags that appear atleast once. The tag distribution is reported in Fig. 3. Similar to statistics relatedto many studies on user-generated content, the tag frequency distribution follows apower-law distribution. Among the 420K distinct tags, 5981 tags have been used
5http://lms.comp.nus.edu.sg/research/NUS-WIDE.htm Accessed June 2009.

14 A. Sun and S.S. Bhowmick
Fig. 3 Tag frequencydistribution
Fig. 4 Normalized image tagscore distribution. Tags arebinned by floor(τz(t)) shownon the x-axis and the y-axisplots the correspondingnumber of tags in each bin
to annotate at least 100 images each.6 We consider these tags as popular tags andreport the observations made on their image tag clarity scores. In the sequel, all tagclarity scores refer to the normalized scores.
5.1 Image Tag Clarity Score Distribution
We first report the image tag clarity score distribution as well as the top-25 most andleast visual-representative tags identified through our experiments.
The relationship between the number of tags (tags are binned by floor(τz(t)))with their image tag clarity scores is shown in Fig. 4. Observe that among 5981popular tags, 2950 tags (or about 49.3%) have tag clarity scores greater than 3. Re-call that the normalized image tag clarity score is the number of standard deviationsa tag is observed with respect to a randomly assigned dummy tag with the same tagfrequency. If τ(t) ≥ μ(t ′) + 3σ(t ′), then the chance of t being randomly assigned
6The number reported here is slightly different from that reported in [1] probably due to differentpre-processing. Nevertheless, the tag distribution remains similar.

Quantifying Visual-Representativeness of Social Image Tags Using Image Tag Clarity 15
Table 2 The top-25 mostand least visual-representativetags with their image tagclarity scores τz(t) andfrequency percentile Pf (t).The tags that match thecategory labels in theNUS-WIDE dataset are shownin bold
Tag τz(t) Pf (t) Tag τz(t) Pf (t)
1 sunset 285.3 100 people −2.8 100
2 fog 215.4 97 brown −2.7 97
3 sky 206.4 100 asia −2.5 98
4 silhouette 178.5 98 japan −2.4 98
5 sunrise 160.3 98 france −2.1 98
6 charts 153.4 78 washington −2.1 97
7 sun 138.3 99 2008 −1.9 99
8 mist 137.4 95 china −1.8 97
9 sea 134.2 100 photograph −1.6 89
10 clouds 122.3 100 july −1.6 86
11 lightning 118.4 74 picture −1.5 92
12 beach 118.3 99 virginia −1.5 87
13 landscape 114.7 100 religion −1.3 95
14 minimalism 111.4 78 india −1.3 97
15 dunes 110.0 83 ohio −1.3 87
16 blue 109.9 100 august −1.2 80
17 dawn 108.8 91 photographers −1.2 86
18 horizon 102.0 92 royal −1.2 73
19 moon 99.1 95 finepix −1.2 65
20 ocean 98.7 99 pic −1.2 59
21 zebra 97.9 82 smorgasbord −1.2 61
22 storm 97.5 96 world −1.2 95
23 sketches 95.7 82 may −1.2 84
24 lake 94.4 99 global −1.1 66
25 windmills 93.7 76 2005 −1.1 96
to the images (independent of their visual content) is less than 0.1%, and we con-sider t to be visually representative. Here, we use three standard deviations as thethreshold as it is often used as threshold to determine outliers statistically for normaldistributions [6]. Nevertheless, this threshold value is only used in this chapter foranalysis and can be adjusted according to a specific application. For brevity, we referto tags that are visually representative (e.g., τz(t) ≥ 3) as visual tags and others asnon-visual tags. There are 2950 visual tags and 3031 non-visual tags, respectively.
The top-25 most and least visual-representative tags are listed in Table 2 togetherwith their normalized tag clarity score τz(t) and frequency percentiles (denoted byPf (t)). Observe that many of the top-25 most visual-representative tags describecommon scenes (e.g., sunset, lightning, sea, and sky) or objects (e.g., ze-bra and moon). As these are commonly used words, most users could easily usethem to describe images containing the scenes or objects. Consequently, it createsstrong connection between the user-specified tags and the images demonstrating the

16 A. Sun and S.S. Bhowmick
Fig. 5 Images returned by Flickr for search tags people and sunset
aforementioned scenes and objects, making these tags highly visual-representative.Further, the frequency percentile values associated with the tags suggest that a largeuser group indeed develops consensus implicitly to use a relatively small set of com-mon tags to describe a large number of images. Specifically, among the top 25 mostvisually representative tags, 18 tags have frequency percentile above 90, indicatingthat these are extremely popular tags.
Observe that most of the least visual-representative tags are locations (e.g.,asia, washington, japan, france, china), or temporal such as 2008,july, august, may, or high-level descriptions including pic, photograph,picture. All these tags do not convey much information related to the visual con-tent of the images. For instance, images accompanied with the asia tag are verydiverse and can range from the busy street scenes in Bangkok to images of Gobidesert in Mongolia. Such results show that the proposed image clarity score seemsto be a good measure reflecting the semantic relationship of an assigned tag to thevisual content of the image.
An interesting observation is that people is rated as a least visually representa-tive tag. A tag search of people on Flickr showed that most of the returned imagesindeed contained people in their visual content (see Fig. 5(a)). However, the im-ages demonstrated a great variety especially with respect to the background settings.Hence the proposed technique may wrongly identify the tags that are indeed relatedto some visual content as non-visual tags when the visual pattern is not clear fromthe feature representation. That is, such visual pattern may require a certain high-level recognition. This calls for further study on how to detect visual tags relatedto complicated visual patterns like people. On the other hand, images returned inresponse to the tag sunset indeed show similar visual scenes (see Fig. 5(b)).
5.2 Tag Usage Pattern
5.2.1 Tag Visual-Representativeness vs. Tag Frequency
It is often assumed that extremely popular tags, like stop-words in textual docu-ments, contain little information in image tagging [18]. However, as demonstrated

Quantifying Visual-Representativeness of Social Image Tags Using Image Tag Clarity 17
Fig. 6 Ratio of visual tagsagainst the tag frequency attop N percent indicated alongthe x-axis
in our empirical study, many of the highly representative tags (e.g., the top-25 mostrepresentative tags) have frequency percentile above 90. One example is sky whichis the third most popular tag in the dataset. It is also the third most visually repre-sentative tag and been used as a category label in the NUS-WIDE dataset. Using thenotion of image tag clarity, we aim to have a deeper understanding on the relation-ship between tag clarity and its frequency.
Our study showed that the 2950 visual tags are used 2,225,239 times to annotateimages in the dataset7; while the 3031 non-visual tags are used 997,014 times only.That is, the visual tags are 2.23 times more frequently used than the non-visual tags.In other words, users are more likely to annotate images using tags related to thevisual content of the images.
To further study the relationship between tag visual-representativeness and tagfrequency, we sorted 5981 tags of interests according to their tag frequency in de-scending order. Figure 6 plots the ratio of visual tags among the top N% most fre-quent tags (1 ≤ N ≤ 100). The figure clearly indicates that the highly frequentlyused tags are more likely to be visual tags. For instance, more than 90% of the 60-most frequently used tags (or 1% of the 5981 tags) are visual tags. This is consistentwith that listed in Table 2, where many of the most visually representative tags havehigh frequency percentiles. The Pearson’s correlation coefficient between tag fre-quency and tag clarity score is 0.35. That is, they are weakly correlated and morefrequent tags are in general more likely to be visually representative. This is notsurprising as tags are in general considered resource annotations and the resourcein this setting is images. The aforementioned observation also supports tag-basedapproach for social image retrieval as most frequently used tags are indeed visualtags.
5.2.2 Visual Tags vs. Non-visual Tags
In this section, we study the distribution of visual and non-visual tags with respectto the number of tags associated with images as well as their positions. We first plotthe tag distribution among images in the dataset in Fig. 7(a). In this plot, the x-axisis the number of tags per image and y-axis plots the number of images having that
7One image may be annotated by multiple visual or non-visual tags, respectively.

18 A. Sun and S.S. Bhowmick
Fig. 7 Tag usage patternsbetween tagvisual-representativeness, tagfrequency and tag position
number of tags. Among the 269K images in the dataset, nearly 74% of images areassociated with three to 16 tags (from the domain of 5981 tags of interest). Fewerthan 5% of images have more than 30 tags each. Hence, we only focus on thoseimages with no more than 30 tags for the study of tag position distribution.
Figure 7(b) plots the average ratio of visual tags among each image having K tags(1 ≤ K ≤ 30). The ratio of visual tags gradually increases from 0.64 to 0.72 withthe increase of the number of tags from three to 16. Subsequently, the ratio remainsrelatively stable for images having 17 to 25 tags each. Figure 7(b) shows that thechance of an image being annotated by visual tags increases with the number oftags received. As many tags are received from the contacts of the image uploader inFlickr, these users may not know much about the image other than its visual content.The tags contributed by these users are more likely to be visual tags. Overall, theresults also show that in general more visual tags are associated with images thannon-visual tags with the ratio of visual tags well above 0.6. This is consistent with