Social Isolation and Lethal Violence Across the Metro/Nonmetro Divide: The Effects of Socioeconomic...
25
Social Isolation and Lethal Violence Across the Metro/Nonmetro Divide: The Effects of Socioeconomic Disadvantage and Poverty Concentration on Homicide* Matthew R. Lee Department of Sociology, Anthropology, and Social Work Mississippi State University Michael O. Maume Department of Sociology and Criminal Justice University of North Carolina at Wilmington Graham C. Ousey Department of Sociology University of Kentucky Abstract This study extends the macro-level criminological research tradi- tion by examining the links between socioeconomic disadvantage, poverty con- centration, and homicide in metropolitan and nonmetropolitan U.S. counties. Most research in this tradition has tested structural theories using urban areas as the unit of analysis. This “urban bias” has resulted in a limited understanding of the social forces driving violence in nonmetropolitan areas. To partially ad- dress this problem, we link the literature on the spatial and social organization of nonmetropolitan communities with the social isolation perspective from the urban poverty literature. We hypothesize that the spatial concentration of poverty drives up rates of homicide in both metropolitan and nonmetropolitan areas regardless of levels of socioeconomic disadvantage. Negative binomial re- gression for 1,746 nonmetropolitan and 778 metropolitan counties suggest that both socioeconomic disadvantage and poverty concentration elevate homicide in metropolitan areas. However, in nonmetropolitan counties only socioeco- nomic disadvantage has a significant impact. We conclude by discussing the im- plications of these differential findings for the social isolation perspective. Introduction One of the most venerable ideas in macro-level criminology is the be- lief that crime rates vary with levels of economic disadvantage. This no- tion dates to antiquity (McDonald 1976) and is first documented in the works of the 19th century moral statisticians (e.g., Guerry 1833) who Rural Sociology 68(1), 2003, pp. 107–131 Copyright © 2003 by the Rural Sociological Society * Authors are listed alphabetically; contributions are equal. Direct correspondence to Matthew R. Lee; Dept. of Sociology, Anthropology, and Social Work; Mississippi State Uni- versity; P.O. Box C; Miss. State, MS 39762. Email: <[email protected]>. An earlier version of this paper was presented at the 2000 meeting of the Southern Sociological Society, New Orleans, LA. This publication made possible in part by grant number 4 D1A RH 00005-01- 01 from the Office of Rural Health Policy of the Department of Health and Human Services through the Rural Health, Safety and Security Institute, Social Science Research Center, Mississippi State University. Its contents are solely the responsibility of the authors and do not necessarily represent the official views of the Office of Rural Health Policy.
Transcript of Social Isolation and Lethal Violence Across the Metro/Nonmetro Divide: The Effects of Socioeconomic...
Social Isolation and Lethal Violence Across theMetro/Nonmetro Divide: The Effects of SocioeconomicDisadvantage and Poverty Concentration on Homicide*
Matthew R. LeeDepartment of Sociology, Anthropology, and Social WorkMississippi State University
Michael O. MaumeDepartment of Sociology and Criminal JusticeUniversity of North Carolina at Wilmington
Graham C. OuseyDepartment of SociologyUniversity of Kentucky
Abstract This study extends the macro-level criminological research tradi-tion by examining the links between socioeconomic disadvantage, poverty con-centration, and homicide in metropolitan and nonmetropolitan U.S. counties.Most research in this tradition has tested structural theories using urban areasas the unit of analysis. This “urban bias” has resulted in a limited understandingof the social forces driving violence in nonmetropolitan areas. To partially ad-dress this problem, we link the literature on the spatial and social organizationof nonmetropolitan communities with the social isolation perspective from theurban poverty literature. We hypothesize that the spatial concentration ofpoverty drives up rates of homicide in both metropolitan and nonmetropolitanareas regardless of levels of socioeconomic disadvantage. Negative binomial re-gression for 1,746 nonmetropolitan and 778 metropolitan counties suggest thatboth socioeconomic disadvantage and poverty concentration elevate homicidein metropolitan areas. However, in nonmetropolitan counties only socioeco-nomic disadvantage has a significant impact. We conclude by discussing the im-plications of these differential findings for the social isolation perspective.
Introduction
One of the most venerable ideas in macro-level criminology is the be-lief that crime rates vary with levels of economic disadvantage. This no-tion dates to antiquity (McDonald 1976) and is first documented in theworks of the 19th century moral statisticians (e.g., Guerry 1833) who
Rural Sociology 68(1), 2003, pp. 107–131Copyright © 2003 by the Rural Sociological Society
* Authors are listed alphabetically; contributions are equal. Direct correspondence toMatthew R. Lee; Dept. of Sociology, Anthropology, and Social Work; Mississippi State Uni-versity; P.O. Box C; Miss. State, MS 39762. Email: <[email protected]>. An earlier versionof this paper was presented at the 2000 meeting of the Southern Sociological Society, NewOrleans, LA. This publication made possible in part by grant number 4 D1A RH 00005-01-01 from the Office of Rural Health Policy of the Department of Health and HumanServices through the Rural Health, Safety and Security Institute, Social Science ResearchCenter, Mississippi State University. Its contents are solely the responsibility of the authorsand do not necessarily represent the official views of the Office of Rural Health Policy.
Used Mac Distiller 5.0.x Job Options
This report was created automatically with help of the Adobe Acrobat Distiller addition "Distiller Secrets v1.0.5" from IMPRESSED GmbH. You can download this startup file for Distiller versions 4.0.5 and 5.0.x for free from http://www.impressed.de. GENERAL ---------------------------------------- File Options: Compatibility: PDF 1.2 Optimize For Fast Web View: Yes Embed Thumbnails: No Auto-Rotate Pages: No Distill From Page: 1 Distill To Page: All Pages Binding: Left Resolution: [ 600 600 ] dpi Paper Size: [ 432 648 ] Point COMPRESSION ---------------------------------------- Color Images: Downsampling: Yes Downsample Type: Bicubic Downsampling Downsample Resolution: 151 dpi Downsampling For Images Above: 227 dpi Compression: Yes Automatic Selection of Compression Type: Yes JPEG Quality: Medium Bits Per Pixel: As Original Bit Grayscale Images: Downsampling: Yes Downsample Type: Bicubic Downsampling Downsample Resolution: 300 dpi Downsampling For Images Above: 450 dpi Compression: Yes Automatic Selection of Compression Type: Yes JPEG Quality: Medium Bits Per Pixel: As Original Bit Monochrome Images: Downsampling: Yes Downsample Type: Bicubic Downsampling Downsample Resolution: 600 dpi Downsampling For Images Above: 900 dpi Compression: Yes Compression Type: CCITT CCITT Group: 4 Anti-Alias To Gray: No Compress Text and Line Art: Yes FONTS ---------------------------------------- Embed All Fonts: Yes Subset Embedded Fonts: Yes Subset When Percent Of Characters Used is Less: 100 % When Embedding Fails: Cancel Job Embedding: Always Embed: [ ] Never Embed: [ ] COLOR ---------------------------------------- Color Management Policies: Color Conversion Strategy: Leave Color Unchanged Intent: Default Device-Dependent Data: Preserve Overprint Settings: No Preserve Under Color Removal and Black Generation: No Transfer Functions: Preserve Preserve Halftone Information: No ADVANCED ---------------------------------------- Options: Use Prologue.ps and Epilogue.ps: No Allow PostScript File To Override Job Options: No Preserve Level 2 copypage Semantics: No Save Portable Job Ticket Inside PDF File: No Illustrator Overprint Mode: No Convert Gradients To Smooth Shades: Yes ASCII Format: No Document Structuring Conventions (DSC): Process DSC Comments: No OTHERS ---------------------------------------- Distiller Core Version: 5000 Use ZIP Compression: Yes Deactivate Optimization: No Image Memory: 524288 Byte Anti-Alias Color Images: No Anti-Alias Grayscale Images: No Convert Images (< 257 Colors) To Indexed Color Space: Yes sRGB ICC Profile: sRGB IEC61966-2.1 END OF REPORT ---------------------------------------- IMPRESSED GmbH Bahrenfelder Chaussee 49 22761 Hamburg, Germany Tel. +49 40 897189-0 Fax +49 40 897189-71 Email: [email protected] Web: www.impressed.de
Adobe Acrobat Distiller 5.0.x Job Option File
<< /ColorSettingsFile () /LockDistillerParams true /DetectBlends true /DoThumbnails false /AntiAliasMonoImages false /MonoImageDownsampleType /Bicubic /GrayImageDownsampleType /Bicubic /MaxSubsetPct 100 /MonoImageFilter /CCITTFaxEncode /ColorImageDownsampleThreshold 1.5 /GrayImageFilter /DCTEncode /ColorConversionStrategy /LeaveColorUnchanged /CalGrayProfile (Gray Gamma 2.2) /ColorImageResolution 151 /UsePrologue false /MonoImageResolution 600 /ColorImageDepth -1 /sRGBProfile (sRGB IEC61966-2.1) /PreserveOverprintSettings false /CompatibilityLevel 1.2 /UCRandBGInfo /Remove /EmitDSCWarnings false /CreateJobTicket false /DownsampleMonoImages true /DownsampleColorImages true /MonoImageDict << /K -1 >> /ColorImageDownsampleType /Bicubic /GrayImageDict << /HSamples [ 2 1 1 2 ] /VSamples [ 2 1 1 2 ] /Blend 1 /QFactor 0.9 >> /CalCMYKProfile (U.S. Web Coated (SWOP) v2) /ParseDSCComments false /PreserveEPSInfo false /MonoImageDepth -1 /AutoFilterGrayImages true /SubsetFonts true /GrayACSImageDict << /VSamples [ 2 1 1 2 ] /HSamples [ 2 1 1 2 ] /Blend 1 /QFactor 0.76 /ColorTransform 1 >> /ColorImageFilter /DCTEncode /AutoRotatePages /None /PreserveCopyPage false /EncodeMonoImages true /ASCII85EncodePages false /PreserveOPIComments false /NeverEmbed [ ] /ColorImageDict << /HSamples [ 2 1 1 2 ] /VSamples [ 2 1 1 2 ] /Blend 1 /QFactor 0.9 >> /AntiAliasGrayImages false /GrayImageDepth -1 /CannotEmbedFontPolicy /Error /EndPage -1 /TransferFunctionInfo /Preserve /CalRGBProfile (sRGB IEC61966-2.1) /EncodeColorImages true /EncodeGrayImages true /ColorACSImageDict << /VSamples [ 2 1 1 2 ] /HSamples [ 2 1 1 2 ] /Blend 1 /QFactor 0.76 /ColorTransform 1 >> /Optimize true /ParseDSCCommentsForDocInfo true /GrayImageDownsampleThreshold 1.5 /MonoImageDownsampleThreshold 1.5 /AutoPositionEPSFiles false /GrayImageResolution 300 /AutoFilterColorImages true /AlwaysEmbed [ ] /ImageMemory 524288 /OPM 0 /DefaultRenderingIntent /Default /EmbedAllFonts true /StartPage 1 /DownsampleGrayImages true /AntiAliasColorImages false /ConvertImagesToIndexed true /PreserveHalftoneInfo false /CompressPages true /Binding /Left >> setdistillerparams << /PageSize [ 576.0 792.0 ] /HWResolution [ 600 600 ] >> setpagedevice
showed a systematic relationship between levels of crime and the so-cioeconomic characteristics of particular geographic areas. Despite itsage, this thesis remains prominent in contemporary research litera-ture, as evidenced by the recent publication of numerous studies thatinvestigate the association between homicide and various indicators ofsocioeconomic disadvantage (Fowles and Merva 1996; Land, McCall,and Cohen 1990; Lee 2000; Messner and Golden 1992; Ousey 1999;Parker and McCall 1999).
In spite of the extensive history of research on this issue, prior stud-ies have focused nearly exclusively on metropolitan localities. Conse-quently, there is a serious shortage of knowledge about the structuralcovariates of homicide in nonmetropolitan areas. Yet there are a num-ber of reasons why the nonmetropolitan connection between socioe-conomic disadvantage and homicide should be considered by re-searchers. First, like the urban areas that have long intrigued crimescholars, many nonmetropolitan areas are characterized by relativelyhigh rates of socioeconomic disadvantage. For example, in 1990 thepoverty rate of nonmetropolitan counties was 1.5 times the povertyrate of metropolitan counties. Second, despite the common view ofhomicide as an urban phenomenon, homicide rates in many non-metropolitan communities exceed those observed in traditionally highcrime urban communities. In fact, based upon an average of homiciderates for the 1990–1992 period, five nonmetropolitan counties hadhigher homicide rates than Washington, D.C., which ranked firstamong metropolitan counties (or cities). Third, a number of theprominent structural theories (e.g., social disorganization theory) wereoriginally developed to explain rising crime in rural as well as urbancommunities (Osgood and Chambers 2000; Thomas and Znaniecki1958 [1927]). And because several of these theories are “general” ex-planations of crime, it is important for empirical research to examineif these explanations are generalizable to nonmetropolitan localities(Weisheit and Wells 1996). In light of these points, we believe there islittle justification for limiting the scope of aggregate homicide researchto urban localities.
While the urban bias evident in prior macro-level studies of the so-cioeconomic disadvantage-homicide link is a major shortcoming, thisliterature is also limited by the fact that nearly all of the existing stud-ies focus only on the lethal consequences of levels of socioeconomicdisadvantage. Yet recent contributions in urban sociology and crimi-nology (e.g., Lee 2000; Sampson and Wilson 1995; Wilson 1987) sug-gest that, net of the level of disadvantage, serious crime rates also maybe affected by the spatial concentration of disadvantage. Indeed, Wilson’s
108 Rural Sociology, Vol. 68, No. 1, March 2003
(1987) work on the urban underclass details how the geographic con-centration of economic disadvantage decreases the likelihood thatmembers of socioeconomically disadvantaged communities will haveregular and sustained contact with mainstream middle-class institutionsand normative codes. Consequently, their communities face difficultiesin accumulating social capital and develop few links to parochial andpublic levels of social control (Bursik and Grasmick 1993), thereby in-creasing the probability that illicit behavior will flourish.
In light of the shortcomings noted above, the present paper at-tempts to advance the aggregate-level homicide literature in severalways. First, given the glaring shortage of research on homicide in non-metropolitan communities, we examine whether socioeconomic disad-vantage is associated with homicide in nonmetro, as well as metro, coun-ties. Second, drawing upon Wilson (1987), we test the efficacy of theidea that the spatial segregation of the poor from the non-poor (i.e.,poverty concentration) is an important correlate of aggregate homi-cide rates, net of the level of socioeconomic disadvantage. Third, wetest the generalizability of socioeconomic disadvantage explanations ofhomicide by examining whether the impact of the level and the spatialconcentration of socioeconomic disadvantage varies across metropoli-tan and nonmetropolitan counties. Finally, we extend previous homi-cide studies by utilizing negative binomial regression methods to esti-mate our multivariate models. As we discuss later, this estimationstrategy is more appropriate than ordinary least squares regressionwhen the dependent variable of interest is a count (or rate) of a rareevent, like homicide.
The paper is organized into several sections. The next section re-views the theoretical background and empirical literature that serve asthe framework for our paper. We follow that with discussions of ourcentral hypotheses and the data, measures and methods used to testthese hypotheses. Then we present results from our univariate andmultivariate data analyses. Finally, we end the paper with a brief sum-mary of our main findings and a discussion of the implications of ourresults for theory and research on aggregate-level homicide.
BackgroundSocioeconomic Disadvantage and Homicide
The belief that crime is associated with economic conditions is evidentin scientific studies old (Guerry 1833; Shaw and McKay 1942) and new(e.g., Lee 2000; Ousey 1999; Parker and McCall 1999). Throughoutthis literature, three theoretical models provide the foundation for theexpectation that homicide rates will be higher in areas with greater so-
Social Isolation and Homicide — Lee et al. 109
cioeconomic disadvantage. The first draws heavily upon strain theory(Merton 1938) and suggests that socioeconomic disadvantage causesindividuals to experience tension and frustration, which may motivateviolent offending (Blau and Blau 1982). In other words, disadvantageis seen as having deleterious effects on individual psychological well-being, thereby increasing the probability that a person will react ag-gressively when faced with contentious situations (Williams andFlewelling 1988). Thus, based on this perspective, higher homiciderates are more likely in areas where a disproportionate number of dis-advantaged individuals reside.
A second, more structural line of theorizing also makes a direct con-nection between economic deprivation and crime. Closely related tothe strain tradition, and partially derived from critical and Marxist per-spectives on crime, the link between crime and socioeconomic disad-vantage is predicated on social changes due to industrial restructuring(or deindustrialization). This results in increased crime rates acrossmacrostructural units (including states, counties, and cities) via highunemployment rates (Carlson and Michalowski 1997; Grant and Mar-tinez 1997) or more general economic deprivation (Shihadeh andOusey 1998). A consistent theme in this literature is the “fragmenta-tion” and “isolation” of many U.S. communities due to deindustrializa-tion (more on this below). Much of the work using this macroeco-nomic perspective adopts the position that the deprivation-crimerelationship is historically contingent (see e.g., Carlson and Michal-owski 1997)—thus viewing it in cyclical or epidemic terms. However, aswith Mertonian anomie, the “macroeconomic” perspective also seesthe U.S. economy as an endemic force contributing to criminality(Currie 1997; Messner and Rosenfeld 1997).
The third theoretical model follows from the work of Emile Durkheim(1951[1897]) and is well represented in Shaw and McKay’s (1942) socialdisorganization theory. This viewpoint suggests that the impact of so-cioeconomic disadvantage on crime is indirect; high levels of socioeco-nomic disadvantage reduce the community’s ability to establish a nor-mative consensus, achieve common goals, and regulate criminalbehavior (Bursik and Grasmick 1993). According to social disorganiza-tion theorists, this occurs because economic disadvantage engenderspopulation turnover and racial heterogeneity, which impede the for-mation of the social ties necessary for effective informal social controlwithin a community (Bursik and Grasmick 1993; Kornhauser 1978). Insum, this third model posits that socioeconomic deprivation affectshomicide by reducing the social control capacity of the community.
Despite their differences, the above perspectives uniformly predict asignificant positive association between socioeconomic disadvantage
110 Rural Sociology, Vol. 68, No. 1, March 2003
and homicide. Nonetheless, evidence from existing empirical researchis somewhat inconsistent. For example, although a number of studiesreport that poverty and homicide are related in the predicted manner(Balkwell 1990; Fowles and Merva, 1996; Messner 1983a; Sampson1985), others report a null (Blau and Blau 1982) or negative (Messner1982) association between these two variables. Still others find that thehypothesized positive association between poverty and homicide de-pends largely upon region (Blau and Golden 1986; Messner 1983b)and race (Harer and Steffensmeier 1992; Messner and Golden 1992;Ousey 1999; Smith 1992). In accordance with these mixed patterns offindings, evidence on the link between homicide and other indicatorsof socioeconomic disadvantage is also inconsistent. This is especiallyevident in the aggregate level research linking homicide with unem-ployment rates (cf., Crutchfield, Geerken and Gove 1982; Land, Mc-Call and Cohen 1990; Rosenfeld 1986; Sampson 1985), although themacroeconomic perspective described above points out that unem-ployment and crime are more likely to be positively associated duringperiods when the proximate causes of unemployment are structural,rather than frictional (Carlson and Michalowski 1997).
Concentration Effects: The Emergence of a Multidimensional Index of Disadvantage
According to Land, McCall and Cohen (1990), the inconsistent evi-dence reviewed above is the result of different model specificationsand high levels of multicollinearity among the regressors used in priorstudies. They suggest that because relatively high correlations exist be-tween poverty and other commonly used indicators of structural dis-advantage (e.g., family structure, median income, percent black), theeffects of any one of these variables is sensitive to other variables con-trolled for in the analysis. And the simultaneous inclusion of two ormore of these measures creates a partialling problem that makes it dif-ficult to get reliable estimates of their unique effects on aggregatehomicide rates.
To alleviate the above problems, Land et al. (1990) use principalcomponents analysis. This procedure simplifies the regressor set in theanalysis by identifying several components. Most important for the cur-rent study, Land et al. identify a “resource deprivation/affluence com-ponent” that consists of poverty, percent black, family structure, andseveral other measures of socioeconomic disadvantage. After replacingthe separate indicators of disadvantage with the multi-dimensional re-source deprivation index in their regression models, Land et al. reportstrong support for the hypothesis that socioeconomic disadvantage is asignificant positive predictor of homicide rates. In fact, they find that
Social Isolation and Homicide — Lee et al. 111

this association holds across several levels of geographic aggregation(city, SMSA, state), and at three different time points (1960, 1970, 1980).
While the data reduction approach used by Land et al. largely pre-vents researchers from being able to directly resolve some of the long-standing controversies in criminology (such as the debate over the com-parative importance of absolute and relative deprivation), it advancesthe literature in important ways. Most notably, it links aggregate-level so-cioeconomic disadvantage homicide research to seminal research on theurban underclass (Wilson 1987). Indeed, the resource deprivation/af-fluence index identified by Land et al. accords well with Wilson’s (1987)notion of “concentration effects.” Wilson refers to the fact that in recentdecades, multiple forms of socioeconomic disadvantage have convergedupon particular urban communities and have turned them into severelydisorganized “hyper-ghettos” where chances for social mobility are lowand drug use, violence, and other illicit activities are prevalent.
Social Isolation Across the Metro/Nonmetro Divide
Compounding the negative impact of the convergence of multiplestructural disadvantages is the fact that during the past few decades, so-cioeconomic disadvantage increasingly has become spatially concen-trated in many urban communities. As a result, there is now little ver-tical integration of social classes, leaving the poor socially and spatiallyisolated from the middle-class mainstream (Wilson 1987). As concep-tualized in urban settings, social isolation has a devastating impact onthe community because it reduces labor force attachment, decreasespolitical participation and increases the likelihood of cultural adapta-tions that perpetuate marginality by reducing the ignominy of failurein conventional institutions (Shihadeh and Flynn 1996).
One especially devastating cultural adaptation that may accompanysocial isolation is the emergence of pro-violence values and norms. In-deed, in the most impoverished and isolated localities, violence oftenbecomes an accepted response to a range of social situations. It is in-stitutionalized and learned early by young people. For example, An-derson (1999) observed that parents in extremely disadvantaged com-munities in Philadelphia often use corporal punishment with littleprovocation and with even less explanation. As a result, kids learn thatviolence is a preferred method for solving any problem that may becausing them aggravation. Moreover, the pro-violence lessons learnedin the home are reinforced on the street. Beginning during adoles-cence (if not earlier), youths who lack access to conventional statusroutes (education, money) learn that presenting a facade of extremetoughness and a constant readiness to physically confront those who
112 Rural Sociology, Vol. 68, No. 1, March 2003
offend them is a source of status among street peers (Anderson 1999).Ultimately, this cultural adaptation creates a vicious cycle: pro-violencenorms (and associated behavior) place disadvantaged individuals atgreater odds with middle class culture, which further inhibits theirchance of success in mainstream social institutions. Consequently, theybecome further enmeshed in this oppositional culture and theirchances of becoming involved in serious violent crime escalate.
At first glance it may seem that the harsh realities attributed to socialisolation have no application outside of the metropolis. After all, non-metropolitan communities are typically viewed as having high levels ofintegration—what Durkheim (1947 [1893]) referred to as mechanicalsolidarity. Yet rural sociologists have noted that the effects of deindus-trialization, and the concomitant changes in the economic opportunitystructure, have played out across space as well as time. As Tickamyerand Duncan (1990:69) note: “the idea that the rural economy, culture,and lifestyle differ significantly from urban environments often arisesfrom a nostalgic romanticization of agrarian society that ignores ruralpoverty.” They go on to point out that the social isolation in urban com-munities described by Wilson (1987) is also experienced in many ruralcommunities, and in many places the latter may be more distressed:
Initial attention to the spatial dimension of restructuringfocused on the internationalization of the division oflabor. . . . However, the aftermath of the recessions of theearly 1980s made it increasingly apparent that there was animportant urban and rural dimension as well. While manyurban areas had renewed growth in income and employ-ment and a significant drop in poverty rates, unemploy-ment remained high in rural areas, and there was littlereduction in poverty through the end of the decade. . . .Less diverse rural economies have been hard hit by re-structuring and slow to recover [emphasis added]. (Tick-amyer and Duncan 1990:78).
An extensive literature documents that the average level of eco-nomic well-being is lower in nonmetropolitan than metropolitan areas.As an example, O’Hare (1997) reports that the nonmetropolitanpoverty rate was 47 percent higher than the rate for metropolitan areasin 1986. This is a figure that has been increasing since the mid-1970s,primarily due to the lack of well-paying industrial jobs outside of cities.Some nonmetropolitan areas (e.g., Appalachia and the MississippiDelta) are characterized by what can only be termed endemic, or per-sistent, poverty. Indeed, the low economic status of many nonmetro-politan areas has been viewed as the culprit for numerous social prob-
Social Isolation and Homicide — Lee et al. 113
lems, including divorce, suicide, and, of course, interpersonal violence(Wilkinson 1984a).
In sum, the social isolation perspective discussed above suggests thatthe spatial concentration of socioeconomic disadvantage segregates thepoor from middle-class values, job networks, and social institutions.Consequently, their communities become increasingly transitional, in-formal social control mechanisms break down, oppositional culturesemerge, and the probability of serious violent crime increases. Al-though this perspective is related to well-established theories that viewlevels of socioeconomic disadvantage as the primary factor explainingcrime rates, it extends these perspectives by acknowledging that thespatial distribution of disadvantage may vary within metropolitan andnonmetropolitan areas even when levels of disadvantage are constant.Related to the latter, our understanding of the nature of nonmetro-politan social and economic organization leads us to believe that, al-though nonmetropolitan areas are less dense than metropolitan areas,their poor populations are, in many cases, spatially segregated fromthe non-poor. Thus, there is a low probability that the nonmetropoli-tan poor will regularly interact with those who are non-poor. And fol-lowing the logic of the social isolation argument popularized by Wil-son (1987), this class-based social isolation should lead to variousdeleterious outcomes, including elevated rates of lethal violence.
Research on Social Isolation and Homicide
Recent studies have begun to examine the empirical relationship be-tween social isolation and rates of violence among urban blacks (e.g.,Lee 2000; Parker and Pruitt 2000; Peterson and Krivo 1993; Shihadehand Flynn 1996). Although these studies support the basic tenets of thesocial isolation-homicide argument, they are limited in at least twoways. First, most do not directly tap class-based social isolation. Rather,they either employ measures of racial segregation to approximate seg-regation of the poor (see Peterson and Krivo 1993; Shihadeh andFlynn 1996), or they use a measure of an extreme level of disadvantageto tap poverty concentration.1 These strategies are problematic be-cause economic and racial segregation are theoretically and empiri-cally distinct concepts ( Jargowsky 1996) and areas with similarly highlevels of economic disadvantage may differ widely in the degree to
114 Rural Sociology, Vol. 68, No. 1, March 2003
1 Although the term “concentrated” is often used to describe extreme levels of povertyin an area, it actually reflects a different situation. Indeed, two geographic units withequally high levels of poverty can differ tremendously in terms of how that poverty is spa-tially distributed (for an illustration of this, see Lee 2000). Our concern centers on thelethal violence implications of the spatial distribution of poverty, net of the level of socio-economic disadvantage, an issue that has received little attention in the extant literature.
which that disadvantage is spatially concentrated (Lee 2000). Second, likemany other studies in the aggregate-level homicide research literature,these works are limited by an exclusive focus on violent crime in metro-politan localities. Thus, they say nothing about whether the level or spa-tial concentration of disadvantage is an important correlate of homicidein nonmetropolitan communities. Yet many nonmetropolitan areas ex-hibit rates of socioeconomic disadvantage and lethal violence that typ-ify large urban localities. Moreover, in many cases, the various forms ofstructural disadvantage exist in distinct homogeneous “pockets” thatare far removed from more wealthy communities (i.e., disadvantage isspatially concentrated and little class integration exists). Consequently,there is good reason to suspect that high rates of nonmetropolitanhomicide may be a product of both the level and concentration of so-cioeconomic disadvantage that characterizes these areas.
As noted above, relatively little research has been done on the struc-tural predictors of homicide outside the metropolis. Those studies thathave included measures of poverty or deprivation levels have producedcontradictory results. For example, Kposowa and Breault (1993) reportthat the percentage of the population living in poverty has a positiverelationship with homicide rates in 1,469 rural counties (defined asthose with a population of less than or equal to 20,000). But Osgoodand Chambers (2000) report no evidence of a significant associationbetween poverty and juvenile homicide in a sample of 264 countiesfrom four states.
Several studies have also included “rurality” as a variable to testwhether or not the relationship between it and homicide is spuriousonce structural covariates (such as poverty) are added to a multivariateprediction model. Again, one observes contradictory findings, withone study finding a positive relationship between rurality (a county-level property) and homicide (Wilkinson 1984b) and another findingan inverse relationship (Kowalski and Duffield 1990).
In addition, many of the studies examining homicide outside themetropolis are regionally bounded in the South (Arthur 1991;Bankston and Allen 1980; Mencken and Barnett 1999), with a few ex-ceptions (Osgood and Chambers 2000; Wilkinson 1984b). In light ofthe contradictory findings noted above and the overall dearth of re-search on homicide in nonmetropolitan localities, it is clear that addi-tional aggregate-level research is needed.
Hypotheses
To begin addressing the gaps in the existing homicide literature, thecurrent study examines the impact of the level and spatial concentra-tion of socioeconomic disadvantage on homicide rates in metropolitan
Social Isolation and Homicide — Lee et al. 115
and nonmetropolitan communities. The analysis is guided by threecentral hypotheses:
Hypothesis 1: Rates of homicide will be positively associated with levels of so-cioeconomic disadvantage.
As discussed earlier, this prediction is derived from three long-standingmodels in criminology. The first of these asserts that the experience ofsocioeconomic disadvantage creates frustration and aggression, whichincreases the probability of violent behavior. The second suggests amore structural interpretation, in that industrial restructuring isposited to lead to high rates of violence indirectly via socioeconomicdisadvantage. Closely related to the first perspective, this second modelargues that deprivation leads to homicide by limiting opportunitystructures, thus necessitating the creation of illegitimate opportunitystructures to survive in a market-based economy. The third model, basedon social disorganization theory, posits that deprivation reduces infor-mal social control mechanisms, leaving illicit behavior unregulated.
Hypothesis 2: Rates of homicide will be positively associated with the degree ofspatial concentration of disadvantage, net of the level of socioeconomic disad-vantage.
This hypothesis draws from recent work on the urban underclass (e.g.,Wilson 1987), which posits that socioeconomic disadvantage is likely tohave its most deleterious impact on community social organization andsocial control when it is spatially configured in such a way that the im-poverished are socially and spatially isolated from the middle and up-per classes. Thus, controlling for the impact of the level of socioeco-nomic disadvantage, this perspective suggests that higher spatialconcentrations of disadvantage will hamper informal social controland, thereby, elevate rates of lethal violence.
Hypothesis 3: The impact of the level and spatial concentration of disadvan-tage on homicide will not differ significantly in metropolitan and nonmetropoli-tan counties.
Although most socioeconomic disadvantage perspectives predomi-nantly have been applied to the explanation of urban homicide, theirbasic theoretical assumptions do not appear to warrant such restric-tions. Thus, we surmise that the underlying causal processes by whichsocioeconomic disadvantage affects homicide operate equally in met-ropolitan and nonmetropolitan localities.
Methods
To overcome the myopic focus on metropolitan or urban ecologicalunits in prior macro-level homicide research, this study examines struc-
116 Rural Sociology, Vol. 68, No. 1, March 2003
tural predictors of homicide in both metropolitan and nonmetropoli-tan localities. The units of analysis are U.S. counties in 1990. However,to facilitate comparisons of the effect of socioeconomic disadvantagevariables across the metropolitan/nonmetropolitan divide, we split thecounties into metropolitan and nonmetropolitan samples, on the basis ofrural-urban continuum codes (see Butler and Beale 1994).2 After list-wise deletion of observations with missing data, the metropolitan sam-ple consists of 778 counties contained within metropolitan areas; thenonmetropolitan sample consists of 1,746 counties not containedwithin metropolitan areas.3 These 2,524 counties represent 80% of allU.S. counties. Of the excluded counties, almost 60% were left out dueto missing data on the index of dissimilarity (due to the fact that manyrural counties outside of the South have no Blacks), and the remain-ing counties were lost to non-reporting in the Uniform Crime Reports(UCR) crime data described below.
Dependent Variable
The dependent variable of interest is the homicide offense rate in eachcounty. To calculate this variable, we average 1990–1992 homicide datafrom the UCR compiled by the Federal Bureau of Investigation. Athree-year average is used because rates of rare events in ecologicalunits often fluctuate substantially from year to year. Taking an averageover multiple years helps to soften the impact of such a large randomfluctuation and, therefore, provides a more reliable estimate of thecounty homicide rate circa 1990. We depart here from what has becomeconvention in the literature by averaging our data from 1990–1992 in-stead of the period surrounding the census year (1989–1991). This pro-cedure is justified because the 1989 UCR data employ 1980 census defi-nitions of counties, and some of these changed between 1980 and 1990.
The problems associated with UCR data are well known and sum-marized in Gove, Hughes, and Geerken (1985), among others. In short,the use of homicide as the outcome of interest circumvents many of the
Social Isolation and Homicide — Lee et al. 117
2 Metropolitan counties are defined as central counties of metropolitan areas in which1 million or more people reside, fringe counties of metropolitan areas with populationsof 1 million or more, counties in metropolitan areas of 250,000 to 1 million in popula-tion, and counties in metropolitan areas with fewer than 250,000 people. Nonmetropol-itan counties are essentially all others. This classification scheme is widely employed andis consistent with prior research (e.g., Lyson and Tolbert 1996).
3 Counties within the nonmetropolitan category vary considerably in terms of totalpopulation, as well as the size of the “urban” population contained in each county. Thus,we considered using a finer-grained classification scheme to avoid masking importantvariation across nonmetropolitan counties. However, preliminary results revealed onlyminor differences across the counties within the nometropolitan category. Consequently,we use the dichotomous metropolitan/nonmetropolitan scheme.
concerns associated with the use of official statistics. It is the most seri-ous crime; and, therefore, a higher proportion of homicides are re-ported to police than for any other crime. Overall, out of all of the in-dex crimes, homicide data are considered the most reliable.
Independent Variables
Two independent variables are of central interest in the current re-search. The disadvantage index taps the level of socioeconomic disad-vantage in a county. It consists of five related items that measure dif-ferent dimensions of socioeconomic disadvantage: percentage offamilies living in poverty, percentage of the population over the age of25 that are high school dropouts, the percentage of families that arefemale headed, the civilian unemployment rate, and the percentage ofthe population that is black. These items are combined into an indexby taking the average of their z-scores.
Poverty concentration measures the degree of social isolation or spatialsegregation of the poor (from the nonpoor). This variable makes useof the isolation index (see Massey and Denton 1988) and is calculatedusing block group level data (in keeping with Farley and Frey 1994) inthe following formula:
nxP * x = Σ [xi/X][xi / t i]
i=1
where xi refers to the number of poor that live in block group i, X isthe total number of poor living in the county, and ti refers to the totalpopulation of block group i. For each county, this index gives theprobability that a randomly drawn poor person shares a neighborhoodwith another randomly drawn poor person. The index varies from 0 to1, with higher values indicating higher levels of poverty concentration orclass-based social isolation. The block group-level data used to constructthis index were taken from Summary Tape File 3A of the 1990 Census.
Control Variables
In addition to the two primary predictor variables described above, wecontrol for the effects of several variables shown to be related to homi-cide in previous research (see Parker, McCall, and Land 1999 for athorough review). All of the control variables are drawn from Sum-mary Tape File 3C of the U.S. census. First, because homicide offend-ing rates tend to peak during the period between the late teens andlate twenties, we control for the percent age 15–29. Presumably, homi-cide rates will be higher in counties where a larger share of the popu-lation is in this violence-prone age group. Second, we control for the
118 Rural Sociology, Vol. 68, No. 1, March 2003
ratio of males to females (i.e., sex ratio) because this may affect familystructure and informal social control within a community (Messnerand Sampson 1991).
A common measure of racial segregation and racial heterogeneity,the index of dissimilarity, is also constructed from block group level data(see Massey and Denton 1988 for details). The index is intended tocontrol for the level of unevenness between Blacks and Whites in theresidential make-up of counties.
The percent divorced is believed to be an important indicator of socialdisintegration within a given geographic area. Prior studies suggestthat this variable has a significant positive association with homiciderates (see Land et al. 1990). Since more densely populated areas mayincrease anonymity and the opportunity for interpersonal conflict, wecontrol for both population density (measured as the population persquare mile) and county population.4
Given the relatively high correlations between population densityand county population in metropolitan and nonmetropolitan counties(r ’s of .67 and .74, respectively), we followed prior aggregate homicideresearchers (Land et al. 1990; Lee 2000) and combined them into apopulation structure index. The index is the average of the sum of thestandardized scores of the logged population density and the loggedpopulation size.
According to social disorganization theory, frequent populationturnover disrupts the social control capacity of a community, resultingin elevated rates of crime. To capture this potential effect in our analy-sis, we include the mover rate, measured as the percentage of personsnot living in the same house in 1985 and 1990.
Finally, because previous studies suggest that a subculture of violencemay be responsible for the South’s traditionally high homicide rates,(e.g., Gastil 1971; Huff-Corzine, Corzine, and Moore 1986), we includethe indicator variable South in our regression models.
Analytic Method
Traditionally, studies of macro-level variation in homicide employ or-dinary least squares (OLS) regression methods. However, because theoutcome of interest is rare relative to population size, its distribution isskewed and rather discrete. Consequently, errors from OLS analysesare generally non-normal and heteroscedastic, thereby violating twocentral assumptions of the OLS model.
Social Isolation and Homicide — Lee et al. 119
4 Both of these variables are highly skewed and appear to have a slightly curvilinear re-lationship with the outcome. Therefore, both are transformed to their natural logarithm.
An alternate approach to modeling rare event data is a class of Pois-son-based regression estimators. Typically, these methods are used topredict counts of rare events. However, when interest is in the rate,rather than the count, of such events, the usual Poisson model can bestandardized by including the log of the county population at risk onthe right hand side of the equation, with a fixed coefficient of 1. Thisresults in a model in which the log of the rate is predicted by a speci-fied set of independent variables (see Gardner, Mulvey, and Shaw,1995; Osgood 2000; Osgood and Chambers 2000).
One limitation of the standard Poisson model is an assumption thatall of the systematic variation in the homicide rate is explained by themodel (i.e., there is no error term in the equation). Frequently, this as-sumption does not hold because variation in the dependent variable isgreater than the model predicts. When this condition (called overdis-persion) occurs, the Poisson model is likely to produce erroneousstandard errors, test-statistics, and p-values. To avoid the difficultiescaused by overdispersion, an extension of the Poisson model, callednegative binomial regression, can be used. This model relaxes the as-sumption that the variance of the dependent variable equals the meanby adding a disturbance term to the standard Poisson model (for de-tails on the use of Poisson and Negative Binomial models in crimino-logical research, see Osgood 2000). The results presented below makeuse of this latter model.
Multicollinearity
A common concern in aggregate level studies of crime is multicollinear-ity. As discussed earlier, the presence of excessively high intercorrela-tions between two or more of the independent variables can create mul-tiple problems, including inflated standard errors, wildly shiftingparameter estimates and mathematical signs, and difficulties in deter-mining the unique partial effect of each variable (see Land, McCall, andCohen 1990 for an extensive discussion of this problem). Thus, we re-estimated each of the models presented below with OLS to obtaincollinearity diagnostics. The highest variance inflation factor (VIF) inthe metropolitan model was 1.66, and in the nonmetropolitan modelthe highest factor was 2.08. Given Allison’s (1999) suggestion that VIF’sexceeding 2.5 may be problematic, we conclude that there are no prob-lems with excessive intercorrelations among our independent variables.
ResultsDescriptive Statistics
As a first step in our analysis, we review descriptive statistics for coun-ties in our metropolitan and nonmetropolitan samples. These are re-
120 Rural Sociology, Vol. 68, No. 1, March 2003
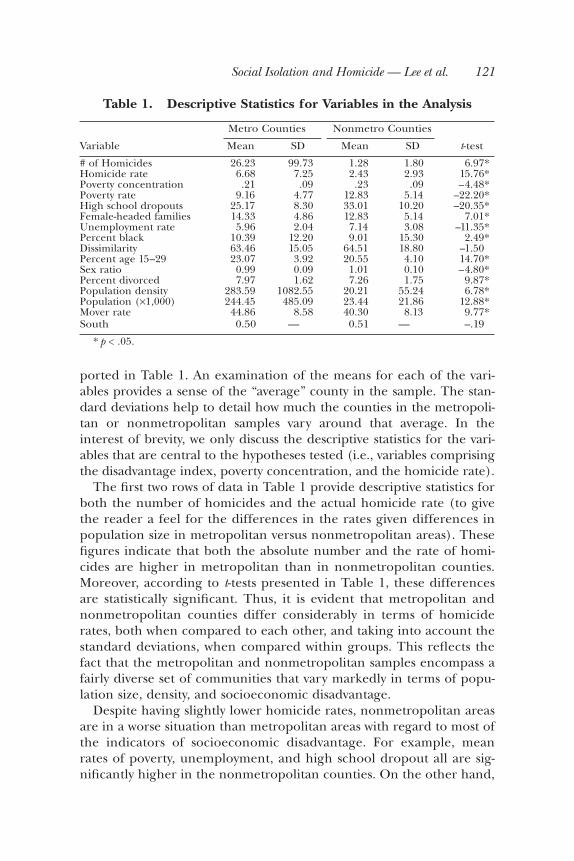
ported in Table 1. An examination of the means for each of the vari-ables provides a sense of the “average” county in the sample. The stan-dard deviations help to detail how much the counties in the metropoli-tan or nonmetropolitan samples vary around that average. In theinterest of brevity, we only discuss the descriptive statistics for the vari-ables that are central to the hypotheses tested (i.e., variables comprisingthe disadvantage index, poverty concentration, and the homicide rate).
The first two rows of data in Table 1 provide descriptive statistics forboth the number of homicides and the actual homicide rate (to givethe reader a feel for the differences in the rates given differences inpopulation size in metropolitan versus nonmetropolitan areas). Thesefigures indicate that both the absolute number and the rate of homi-cides are higher in metropolitan than in nonmetropolitan counties.Moreover, according to t-tests presented in Table 1, these differencesare statistically significant. Thus, it is evident that metropolitan andnonmetropolitan counties differ considerably in terms of homiciderates, both when compared to each other, and taking into account thestandard deviations, when compared within groups. This reflects thefact that the metropolitan and nonmetropolitan samples encompass afairly diverse set of communities that vary markedly in terms of popu-lation size, density, and socioeconomic disadvantage.
Despite having slightly lower homicide rates, nonmetropolitan areasare in a worse situation than metropolitan areas with regard to most ofthe indicators of socioeconomic disadvantage. For example, meanrates of poverty, unemployment, and high school dropout all are sig-nificantly higher in the nonmetropolitan counties. On the other hand,
Social Isolation and Homicide — Lee et al. 121
Table 1. Descriptive Statistics for Variables in the Analysis
Metro Counties Nonmetro Counties
Variable Mean SD Mean SD t-test
# of Homicides 26.23 99.73 1.28 1.80 6.97*Homicide rate 6.68 7.25 2.43 2.93 15.76*Poverty concentration .21 .09 .23 .09 –4.48*Poverty rate 9.16 4.77 12.83 5.14 –22.20*High school dropouts 25.17 8.30 33.01 10.20 –20.35*Female-headed families 14.33 4.86 12.83 5.14 7.01*Unemployment rate 5.96 2.04 7.14 3.08 –11.35*Percent black 10.39 12.20 9.01 15.30 2.49*Dissimilarity 63.46 15.05 64.51 18.80 –1.50Percent age 15–29 23.07 3.92 20.55 4.10 14.70*Sex ratio 0.99 0.09 1.01 0.10 –4.80*Percent divorced 7.97 1.62 7.26 1.75 9.87*Population density 283.59 1082.55 20.21 55.24 6.78*Population (×1,000) 244.45 485.09 23.44 21.86 12.88*Mover rate 44.86 8.58 40.30 8.13 9.77*South 0.50 — 0.51 — –.19
* p < .05.
the prevalence of female-headed families is significantly higher in met-ropolitan locations, and black population concentration is slightlyhigher in metropolitan areas. Interestingly, poverty concentration,which has predominantly been considered a characteristic associatedwith the proliferation of the urban underclass, is slightly higher in non-metropolitan counties. Indeed, in nonmetropolitan counties the aver-age probability that a randomly drawn poor person shares a block-group with another poor person is .23, slightly above the averageprobability in metropolitan counties (.21). In other words, class-basedsegregation is just as evident in nonmetropolitan counties as it is inmetropolitan counties.
In the next section, we explore whether county-level differences in thelevel and spatial concentration of disadvantage can help explain the variationin metropolitan and nonmetropolitan homicide rates discussed above. Toaccomplish this, we compute separate negative binomial regression mod-els for the metropolitan and nonmetropolitan county samples.
Negative Binomial Regression Models
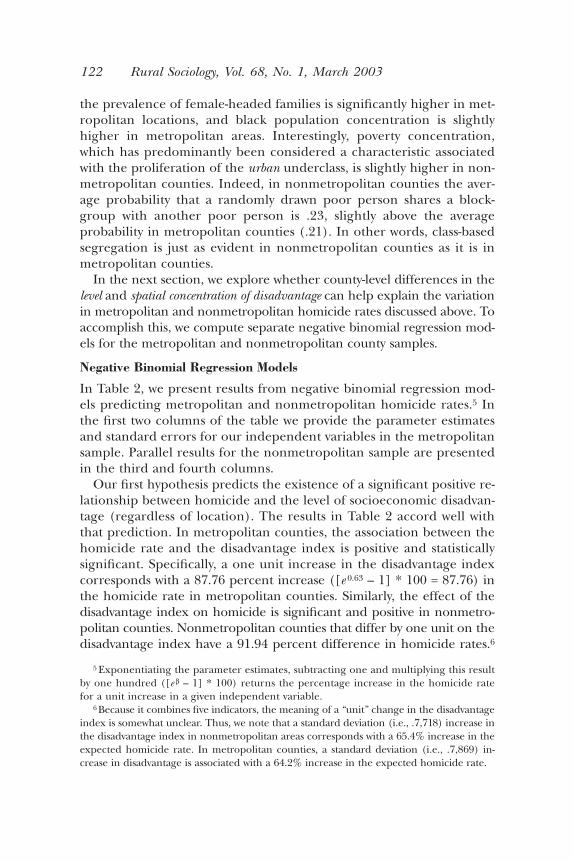
In Table 2, we present results from negative binomial regression mod-els predicting metropolitan and nonmetropolitan homicide rates.5 Inthe first two columns of the table we provide the parameter estimatesand standard errors for our independent variables in the metropolitansample. Parallel results for the nonmetropolitan sample are presentedin the third and fourth columns.
Our first hypothesis predicts the existence of a significant positive re-lationship between homicide and the level of socioeconomic disadvan-tage (regardless of location). The results in Table 2 accord well withthat prediction. In metropolitan counties, the association between thehomicide rate and the disadvantage index is positive and statisticallysignificant. Specifically, a one unit increase in the disadvantage indexcorresponds with a 87.76 percent increase ([e 0.63 – 1] * 100 = 87.76) inthe homicide rate in metropolitan counties. Similarly, the effect of thedisadvantage index on homicide is significant and positive in nonmetro-politan counties. Nonmetropolitan counties that differ by one unit on thedisadvantage index have a 91.94 percent difference in homicide rates.6
122 Rural Sociology, Vol. 68, No. 1, March 2003
5 Exponentiating the parameter estimates, subtracting one and multiplying this resultby one hundred ([e β – 1] * 100) returns the percentage increase in the homicide ratefor a unit increase in a given independent variable.
6 Because it combines five indicators, the meaning of a “unit” change in the disadvantageindex is somewhat unclear. Thus, we note that a standard deviation (i.e., .7,718) increase inthe disadvantage index in nonmetropolitan areas corresponds with a 65.4% increase in theexpected homicide rate. In metropolitan counties, a standard deviation (i.e., .7,869) in-crease in disadvantage is associated with a 64.2% increase in the expected homicide rate.
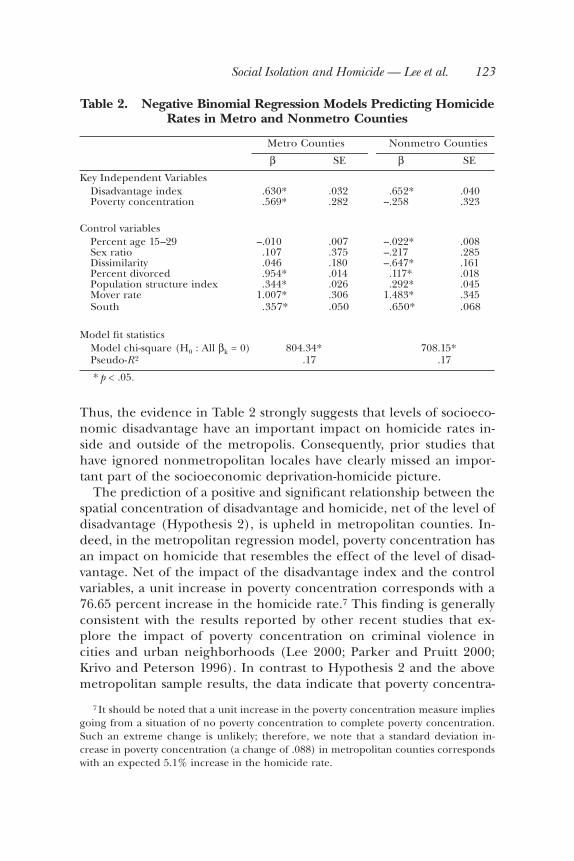
Thus, the evidence in Table 2 strongly suggests that levels of socioeco-nomic disadvantage have an important impact on homicide rates in-side and outside of the metropolis. Consequently, prior studies thathave ignored nonmetropolitan locales have clearly missed an impor-tant part of the socioeconomic deprivation-homicide picture.
The prediction of a positive and significant relationship between thespatial concentration of disadvantage and homicide, net of the level ofdisadvantage (Hypothesis 2), is upheld in metropolitan counties. In-deed, in the metropolitan regression model, poverty concentration hasan impact on homicide that resembles the effect of the level of disad-vantage. Net of the impact of the disadvantage index and the controlvariables, a unit increase in poverty concentration corresponds with a76.65 percent increase in the homicide rate.7 This finding is generallyconsistent with the results reported by other recent studies that ex-plore the impact of poverty concentration on criminal violence incities and urban neighborhoods (Lee 2000; Parker and Pruitt 2000;Krivo and Peterson 1996). In contrast to Hypothesis 2 and the abovemetropolitan sample results, the data indicate that poverty concentra-
Social Isolation and Homicide — Lee et al. 123
Table 2. Negative Binomial Regression Models Predicting HomicideRates in Metro and Nonmetro Counties
Metro Counties Nonmetro Counties
β SE β SE
Key Independent VariablesDisadvantage index .630* .032 .652* .040Poverty concentration .569* .282 –.258 .323
Control variablesPercent age 15–29 –.010 .007 –.022* .008Sex ratio .107 .375 –.217 .285Dissimilarity .046 .180 –.647* .161Percent divorced .954* .014 .117* .018Population structure index .344* .026 .292* .045Mover rate 1.007* .306 1.483* .345South .357* .050 .650* .068
Model fit statisticsModel chi-square (H0 : All βk = 0) 804.34* 708.15*Pseudo-R 2 .17 .17
* p < .05.
7 It should be noted that a unit increase in the poverty concentration measure impliesgoing from a situation of no poverty concentration to complete poverty concentration.Such an extreme change is unlikely; therefore, we note that a standard deviation in-crease in poverty concentration (a change of .088) in metropolitan counties correspondswith an expected 5.1% increase in the homicide rate.
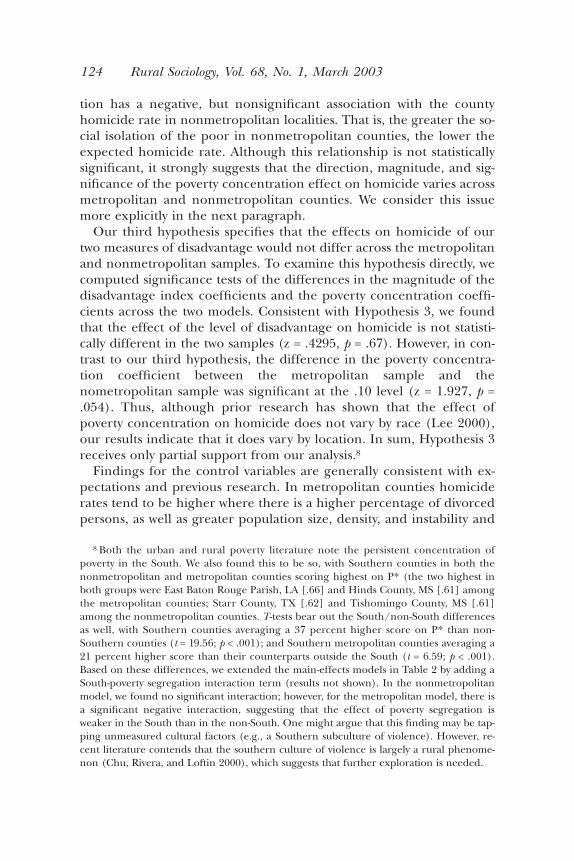
tion has a negative, but nonsignificant association with the countyhomicide rate in nonmetropolitan localities. That is, the greater the so-cial isolation of the poor in nonmetropolitan counties, the lower theexpected homicide rate. Although this relationship is not statisticallysignificant, it strongly suggests that the direction, magnitude, and sig-nificance of the poverty concentration effect on homicide varies acrossmetropolitan and nonmetropolitan counties. We consider this issuemore explicitly in the next paragraph.
Our third hypothesis specifies that the effects on homicide of ourtwo measures of disadvantage would not differ across the metropolitanand nonmetropolitan samples. To examine this hypothesis directly, wecomputed significance tests of the differences in the magnitude of thedisadvantage index coefficients and the poverty concentration coeffi-cients across the two models. Consistent with Hypothesis 3, we foundthat the effect of the level of disadvantage on homicide is not statisti-cally different in the two samples (z = .4295, p = .67). However, in con-trast to our third hypothesis, the difference in the poverty concentra-tion coefficient between the metropolitan sample and thenometropolitan sample was significant at the .10 level (z = 1.927, p =.054). Thus, although prior research has shown that the effect ofpoverty concentration on homicide does not vary by race (Lee 2000),our results indicate that it does vary by location. In sum, Hypothesis 3receives only partial support from our analysis.8
Findings for the control variables are generally consistent with ex-pectations and previous research. In metropolitan counties homiciderates tend to be higher where there is a higher percentage of divorcedpersons, as well as greater population size, density, and instability and
124 Rural Sociology, Vol. 68, No. 1, March 2003
8 Both the urban and rural poverty literature note the persistent concentration ofpoverty in the South. We also found this to be so, with Southern counties in both thenonmetropolitan and metropolitan counties scoring highest on P* (the two highest inboth groups were East Baton Rouge Parish, LA [.66] and Hinds County, MS [.61] amongthe metropolitan counties; Starr County, TX [.62] and Tishomingo County, MS [.61]among the nonmetropolitan counties. T-tests bear out the South/non-South differencesas well, with Southern counties averaging a 37 percent higher score on P* than non-Southern counties (t = 19.56; p < .001); and Southern metropolitan counties averaging a21 percent higher score than their counterparts outside the South (t = 6.59; p < .001).Based on these differences, we extended the main-effects models in Table 2 by adding aSouth-poverty segregation interaction term (results not shown). In the nonmetropolitanmodel, we found no significant interaction; however, for the metropolitan model, there isa significant negative interaction, suggesting that the effect of poverty segregation isweaker in the South than in the non-South. One might argue that this finding may be tap-ping unmeasured cultural factors (e.g., a Southern subculture of violence). However, re-cent literature contends that the southern culture of violence is largely a rural phenome-non (Chu, Rivera, and Loftin 2000), which suggests that further exploration is needed.

in counties of the South. Strikingly, the pattern of findings in non-metropolitan counties is substantively similar, with the exceptions thatboth the percentage of young people and residential segregation havesignificant negative effects on homicide outside of the metropolis.
Table 2 also presents a pseudo-R2 measure of predicted efficacy. Thismeasure is computed as (1 – [L1/L0]), in which L0 is the log-likelihoodfrom the constant-only model and L1 is the log-likelihood for the fullmodel with all covariates added. This essentially gives the proportionatereduction in the log-likelihood with the addition of the covariates of in-terest, which is logically similar to the proportionate reduction in errorconveyed by the usual R 2 of OLS regression. Although this measure issample specific, it appears that, in general, the predictive efficacy ofthe regression model is similar across the rural-urban continuum.
Discussion
Most macrostructural research on homicide has focused solely on ur-ban geographic/political units. This “urban bias” has resulted in a lim-ited understanding of the social forces driving violence in nonmetro-politan areas. The purpose of this study was to extend the research onthe structural sources of homicide to metropolitan and nonmetropoli-tan areas. In this study, we focused on two related phenomena hypoth-esized to predict geographic variation in homicide: the level of socioe-conomic disadvantage and the degree of spatial isolation of the poorfrom the non-poor (i.e., poverty concentration). The discussion belowsummarizes our key findings regarding these two factors.
With regard to socioeconomic disadvantage, we hypothesized thathigher levels of socioeconomic disadvantage would be associated withhigher rates of homicide in metropolitan and nonmetropolitan areas. Re-sults of our multivariate negative binomial models support this predic-tion. In particular, we found a significant, positive association betweendisadvantage and homicide in both the metropolitan and nonmetropoli-tan samples. And consistent with our third hypothesis, the magnitude ofthis effect was not significantly different across the samples (t = .4295, p =.67). Thus, in keeping with other recent research (e.g., Barnett andMencken 2000; Osgood and Chambers 2000), our analysis suggests thatprominent structural covariates of urban crime also are quite useful inexplaining variations in illicit behavior in rural settings.
In contrast to above, our hypothesis that the social and spatial isola-tion of the poor from the non-poor (i.e., poverty concentration) wouldaffect homicide rates similarly in metropolitan and nonmetropolitanlocations was not supported by our analysis. Although we find the ex-pected significant, positive relationship between poverty concentration
Social Isolation and Homicide — Lee et al. 125
and homicide in metropolitan counties, this relationship is negativeand not statistically significant in the nonmetropolitan county sample.9
We offer several possible explanations for the disparate findings forpoverty concentration in metropolitan and nonmetropolitan counties.One argument is that the differing effects of poverty concentration inthese two contexts emanate from differences in the types of informaleconomic activities that the poor in metropolitan and nonmetropoli-tan counties engage in. Although both urban and rural sociologistshave argued that the poor are likely to turn to the informal economyto provide economic resources (Anderson 1999; Tickamyer and Wood1998), the informal economy of the nonmetropolitan poor may bedominated more by licit activities such as hunting, fishing, sellinghome-grown vegetables, and repairing farm machinery, than by illicitactivities such as fencing stolen goods or selling illegal drugs. In con-trast, the poor in urban counties may have few licit options to choosefrom and, therefore, may be more inclined to engage in informal ac-tivities that are illegal. To the extent these differences in the informaleconomy exist, it seems likely that the isolated poor in urban areas aremore apt to be involved in illicit market activities that are associatedwith violence. As Anderson (1999) notes:
Deindustrialization and the growth of the global economyhave led to a steady loss of the unskilled and semiskilledmanufacturing jobs that, with mixed results, had sustainedthe urban working class since the start of the industrial rev-olution. . . . For the most desperate people, many of whomare not effectively adjusting to these changes . . . the un-derground economy of drugs and crime often emerges to
126 Rural Sociology, Vol. 68, No. 1, March 2003
9 Based on the comments of reviewers, several additional analyses were undertaken withrespect to concentrated poverty. First, as one reviewer noted, it may be the case that theconcentrated poverty measure and the disadvantage index interact with one another if con-centrated poverty only elevates crime in the presence of widespread disadvantage. Our testof this hypothesis with a product term between these two variables failed to reveal a signifi-cant interaction effect. In addition, it may be the case that the link between concentratedpoverty and homicide varies according to whether the nature of concentrated poverty is sta-ble or transitional. To probe for this potential phenomenon, we examined an interactionbetween our concentrated poverty measure and the mover rate. This interaction effect wasnot significant, but this issue may deserve further exploration. Finally, another reviewernoted that the processes of deindustrialization and concomitant out-migration have alteredthe age structure of rural communities, resulting in older populations that are trapped inpoverty in rural areas. We therefore conducted auxiliary analyses adding variables tappingthe percentage of the population over the age of 55 and over the age of 65 (in separatemodels) and combined these with our concentrated poverty measure in a set of interactionterms. Neither of these interaction terms was statistically significant, but like the mobility is-sue mentioned above, we suggest that this issue may deserve further exploration.
pick up the slack. To be sure, the active participants in thiseconomy are at serious risk of violence, death, and incar-ceration. Equally important, those living near drug dealersand other hustlers are often victimized. (p. 108)
The implication is that lethal violence arises not just from a criticalmass of frustrated individuals, but also because of the availability of il-legitimate opportunity structures in which violence is instrumental.Therefore, the lower prevalence of the illicit economic activities inrural areas means the probability of instrumental violence is reducedas well.10 Consistent with this interpretation, evidence suggests that therate of participation in informal economic activities is similar amongthe poor in metropolitan and nonmetropolitan localities (Tickamyerand Wood 1998), but illegal markets (and, by extension, participationin them) are much more prevalent in urban areas (Weisheit and Wells1996). However, quantitative data on participation in illegitimate oreven semi-legitimate markets is not readily available; and, therefore, atrue test of this hypothesis awaits such data collection efforts.
An alternative explanation is that poverty concentration is counter-productive in metropolitan areas because the isolation of a criticalmass of poor people creates a dense “situation of company” (Crutch-field 1989; see also the next explanation, below). In this situation, ar-eas “have higher crime rates, not because they are composed of poorpeople, but because of the relatively large number of persons who haveunstable employment and perhaps weak bonds to society throughwork” (Crutchfield 1989:491). One hallmark of urban areas is their ex-treme density. Wirth (1938) argued that dense population settlementfacilitates a transition from primary networks as the dominant form ofinteraction to secondary networks—which are more likely to be rela-tively anonymous and transient in nature—and hence less salient forthe solidarity of the social group.
Following Wirth’s argument, then, the lower density in nonmetro-politan communities may result in a situation that is less conducive to
Social Isolation and Homicide — Lee et al. 127
10 It is important to note here that this logical linkage does not necessarily lead only toinstrumental, stranger-on-stranger homicides, but may have an impact on a wide rangeof homicides across offender-victim relationship types. We also wish to exercise somecaution in how far to extend this argument, lest we conflate informal economic activityin urban areas—which can consist of many of the same activities as in rural areas (Liv-ermore, Hurlbert, and Tolbert 2000; Tickamyer and Wood 1998)—with the quality-of-lifebehaviors associated with social disorder and the “broken windows” hypothesis. Doing soruns the risk of fallaciously linking the informal economy directly to street crime. Forexample, among the street vendors he studied in New York City, Duneier (1999) ob-served that a modicum of informal social control existed that served to quell regular en-gagement in deviant behavior.
crime because although the poor are spatially isolated from the non-poor, kinship and friendship networks have not undergone the frag-mentation that urbanity seems to engender. Consequently, the poor innonmetropolitan counties may be better able to weather their eco-nomic crises than the poor in metropolitan areas because they have ac-cess to a more vast and effective social support network.
A third explanation for the differing effects of poverty concentrationin metropolitan and nonmetropolitan areas may simply be measure-ment problems. For example, in our data, nonmetropolitan countiescontain fewer block groups (sample mean = 27) than metropolitancounties (sample mean = 197); and by extension, these block groupscover a larger amount of territory. This suggests that although a met-ropolitan county and a nonmetropolitan county may have equal scoreson the isolation index, poor residents in the nonmetropolitan countymay have to travel farther to interact with non-poor residents thanpoor residents. However, to the extent that the concept of social isola-tion implies both a spatial separation of the poor and non-poor and aparticular density of poor residents in a circumscribed geographicspace, then for an equal score on the isolation index, social isolation(in reality) is greater for the poor residents in the metropolitan county.Although this interpretation is somewhat speculative, the importantpoint is that similar scores on the poverty concentration measure mayreflect somewhat different situations in metropolitan and nonmetro-politan counties. This is clearly an empirical matter, and future re-search may consider adjusting the formulation of the class-based P* in-dex to address this issue.
Finally, it bears repeating that despite the unexpected difference be-tween metropolitan and nonmetropolitan areas with respect to povertyconcentration’s relationship to homicide, the similarities between thetwo prediction models are prominent (see also Laub 1983; Osgoodand Chambers 2000). For six of the nine predictors in the models pre-sented in Table 2 the direction, or sign, of coefficients is the same.Among the other three variables, only poverty concentration and dis-similarity are substantively and statistically opposite in their relationshipto homicide. Although prior theory and research on crime has beenheavily focused on urban areas, we conclude that there is little justifi-cation for this urban bias. While it is correct that murder rates on av-erage are lower in nonmetropolitan communities, there is substantialvariation in lethal violence across the metro/nonmetro divide. Indeed,it appears that at least some sociological theories of crime have greatrelevance for explaining crime outside of the metropolis.
128 Rural Sociology, Vol. 68, No. 1, March 2003
ReferencesAllison, P.D. 1999. Multiple Regression: A Primer. Thousand Oaks, CA: Pine Forge.Anderson, E. 1999. Code of the Street: Decency, Violence, and the Moral Life of the Inner City.
New York: W.W. Norton.Arthur, J.A. 1991. “Socioeconomic Predictors of Crime in Rural Georgia.” Criminal Jus-
tice Review 16:29–41.Balkwell, J.W. 1990. “Ethnic Inequality and the Rate of Homicide.” Social Forces 69:53–70.Bankston, W.B. and H.D. Allen. 1980. “Rural Social Areas and Patterns of Homicide: An
Analysis of Lethal Violence in Louisiana.” Rural Sociology 45:223–37.Barnett, C. and F.C. Mencken. 2000. “Population Change and the Contextual Nature of
Crime in Nonmetropolitan Counties.” Paper presented at the annual meeting of theRural Sociological Society, Washington, DC.
Blau, J.R. and P.M. Blau. 1982. “The Cost of Inequality: Metropolitan Structure and Vi-olent Crime.” American Sociological Review 47:114–29.
Blau, P.M. and R.M. Golden. 1986. “Metropolitan Structure and Criminal Violence.” So-ciological Quarterly 27:15–26.
Bursik, R.J., Jr. and H.G. Grasmick. 1993. Neighborhoods and Crime: The Dimensions of Ef-fective Community Control. New York: Lexington.
Butler, M.A. and C.L. Beale. 1994. Rural-Urban Continuum Codes for Metro and Nonmetro Coun-ties, 1993. Staff Report No. 9425. Washington, DC: U.S. Department of Agriculture.
Carlson, S.M. and R.J. Michalowski. 1997. “Crime, Unemployment, and Social Struc-tures of Accumulation: An Inquiry Into Historical Contingency.” Justice Quarterly14:209–41.
Chu, R., C. Rivera, and C. Loftin. 2000. “Herding and Homicide: An Examination ofthe Nisbett-Reaves Hypothesis.” Social Forces 78:971–87.
Crutchfield, R.D. 1989. “Labor Stratification and Violent Crime.” Social Forces68:489–512.
Crutchfield, R.D., M.R. Geerken, and W.R. Gove. 1982. “Crime Rate and Social Integra-tion: The Impact of Metropolitan Mobility.” Criminology 20:467–78.
Currie, E. 1997. “Market, Crime and Community: Toward a Mid-Range Theory of Post-Industrial Violence.” Theoretical Criminology 1:147–72.
Duneier, M. 1999. Sidewalk. New York: Farrar, Straus and Giroux.Durkheim, E. 1947 [1893]. The Division of Labor in Society. Glencoe, IL: Free Press.———. 1951 [1897]. Suicide. New York: Free Press.Farley, R. and F.H. Frey. 1994. “Changes in the Segregation of Whites from Blacks in the
1980s: Small Steps Toward a More Integrated Society.” American Sociological Review59:23–45.
Fowles, R. and M. Merva. 1996. “Wage Inequality and Criminal Activity: An ExtremeBounds Analysis for the United States, 1975–1990.” Criminology 34:163–82.
Gardner, W., E.P. Mulvey, and E.C. Shaw. 1995. “Regression Analyses of Counts andRates: Poisson, Overdispersed Poisson, and Negative Binomial Models.” PsychologicalBulletin 118:392–404.
Gastil, R.D. 1971. “Homicide and a Regional Culture of Violence.” American SociologicalReview 36:412–27.
Gove, W. R., M. Hughes, and M. Geerken. 1985. “Are Uniform Crime Reports a ValidIndicator of the Index Crimes? An Affirmative Answer with Minor Qualifications.”Criminology 23:451–501.
Grant, D.S., II and R. Martinez, Jr. 1997. “Crime and the Restructuring of the U.S. Econ-omy: A Reconsideration of the Class Linkages.” Social Forces 75:769–98.
Social Isolation and Homicide — Lee et al. 129
Guerry, A.-M. 1833. Essai Sur la Statistique Morale de la France. Paris: Crochard.Harer, M.D. and D. Steffensmeier. 1992. “The Differing Effects of Economic Inequality
on Black and White Rates of Violence.” Social Forces 70:1035–54.Huff-Corzine, L., J. Corzine, and D.C. Moore. 1986. “Southern Exposure: Deciphering
the South’s Influence on Homicide Rates.” Social Forces 64:906–24.Jargowsky, P.A. 1996. “Take the Money and Run: Economic Segregation in U.S. Metro-
politan Areas.” American Sociological Review 61:984–98.Kornhauser, R.R. 1978. Social Sources of Delinquency: An Appraisal of Analytic Models.
Chicago: University of Chicago Press.Kowalski, G.S. and D. Duffield. 1990. “The Impact of the Rural Population Component
on Homicide Rates in the United States: A County-Level Analysis.” Rural Sociology55:76–90.
Kposowa, A.J. and K.D. Breault. 1993. “Reassessing the Structural Covariates of U.S.Homicide Rates: A County Level Study.” Sociological Focus 26:27–46.
Krivo, L.J. and R.D. Peterson. 1996. “Extremely Disadvantaged Neighborhoods and Ur-ban Crime.” Social Forces 75:619–48.
Land, K.C., P.L. McCall, and L.E. Cohen. 1990. “Structural Covariates of HomicideRates: Are There any Invariances Across Time and Social Space?” American Journal ofSociology 95:922–63.
Laub, J. 1983. “Urbanism, Race, and Crime.” Journal of Research in Crime and Delinquency20:183–198
Lee, M.R. 2000. “Concentrated Poverty, Race, and Homicide.” Sociological Quarterly41:189–206.
Livermore, M., J. Hurlbert, and C. Tolbert II. 2000. “Social Isolation and the InformalEconomy.” Paper presented at the annual meeting of the Southern Sociological So-ciety, New Orleans, LA.
Lyson, T.A. and C.M. Tolbert. 1996. “Small Manufacturing and Nonmetropolitan So-cioeconomic Well-being.” Environment and Planning A 28:1779–1794.
Massey, D.S. and N.A. Denton. 1988. “The Dimensions of Residential Segregation.” So-cial Forces 67:281–315.
McDonald, L. 1976. The Sociology of Law and Order. London: Faber & Faber.Mencken, F.C. and C. Barnett. 1999. “Murder, Nonnegligent Manslaughter, and Spatial
Autocorrelation in Mid-South Counties.” Journal of Quantitative Criminology15:407–22.
Merton, R. 1938. “Social Structure and Anomie.” American Sociological Review 3:672–82.Messner, S.F. 1982. “Poverty, Inequality, and the Urban Homicide Rate.” Criminology
20:103–14.———. 1983a. “Regional Differences in the Economic Correlates of the Urban Homi-
cide Rate: Some Evidence on the Importance of Cultural Context.” Criminology21:477–88.
———. 1983b. “Regional and Racial Effects on the Urban Homicide Rate: The Subcul-ture of Violence Revisited.” American Journal of Sociology 88:997–1007.
Messner, S.F. and R.M. Golden. 1992. “Racial Inequality and Racially DisaggregatedHomicide Rates: An Assessment of Alternative Theoretical Explanations.” Criminol-ogy 30:421–45.
Messner, S.F. and R. Rosenfeld. 1997. Crime and the American Dream. Second Edition. Bel-mont, CA: Wadsworth.
Messner, S.F. and R.J. Sampson. 1991. “The Sex Ratio, Family Disruption, and Rates ofViolent Crime: The Paradox of Demographic Structure.” Social Forces 69:693–713.
Osgood, D.W. 2000. “Poisson-Based Regression Analysis of Aggregate Crime Rates.”Journal of Quantitative Criminology 16:21–43.
130 Rural Sociology, Vol. 68, No. 1, March 2003

Osgood, D.W. and J.M. Chambers. 2000. “Social Disorganization Outside the Metropo-lis: An Analysis of Rural Youth Violence.” Criminology 38:81–116.
Ousey, G.C. 1999. “Homicide, Structural Factors, and the Racial Invariance Assump-tion.” Criminology 37:405–26.
O’Hare, W.P. 1997. “The Poor in Nonmetropolitan America.” Pp. 33–45 in ChangingRural Social Systems: Adaptation and Survival, edited by N.E. Johnson and C. Wang.East Lansing: Michigan State University Press.
Parker, K.F. and P.L. McCall. 1999. “Structural Conditions and Racial Homicide Pat-terns: A Look at the Multiple Disadvantages in Urban Areas.” Criminology 37:447–77.
Parker, K.F., P.L. McCall, and K.C. Land. 1999. “Determining Social Structural Predic-tors of Homicide: Unit of Analysis and Other Methodological Concerns.” Pp.107–24 in Homicide: A Sourcebook of Social Research, edited by M.D. Smith and M.A.Zahn. Thousand Oaks, CA: SAGE.
Parker, K.F. and M.V. Pruitt. 2000. “How the West Was One: Explaining the Similaritiesin Race-Specific Homicide Rates in the West and South.” Social Forces 78:1483–508.
Peterson, R.D. and L.J. Krivo. 1993. “Racial Segregation and Black Urban Homicide.”Social Forces 71:1001–26.
Rosenfeld, R. 1986. “Urban Crime Rates: Effects of Inequality, Welfare Dependency, Re-gion, and Race.” Pp. 116–30 in The Social Ecology of Crime, edited by J.M. Byrne andR.J. Sampson. New York: Springer-Verlag.
Sampson, R.J. 1985. “Race and Criminal Violence: A Demographically DisaggregatedAnalysis of Urban Homicide.” Crime and Delinquency 31:47–82.
Sampson, R.J. and W.J. Wilson. 1995. “Toward a Theory of Race, Crime, and Urban In-equality.” Pp. 37–53 in Crime and Inequality, edited by J Hagan and R.D. Peterson.Stanford: Stanford University Press.
Shaw, C.R. and H.D. McKay. 1942. Juvenile Delinquency and Urban Areas. Chicago: Uni-versity of Chicago Press.
Shihadeh, E.S. and N. Flynn. 1996. “Segregation and Crime: The Effect of Black SocialIsolation on the Rates of Black Urban Violence.” Social Forces 74:1325–52.
Shihadeh, E.S. and G.C. Ousey. 1998. “Industrial Restructuring and Violence: The LinkBetween Entry-Level Jobs, Economic Deprivation, and Black and White Homicide.”Social Forces 77:185–206.
Smith, M.D. 1992. “Variations in Correlates of Race-Specific Urban Homicide Rates.”Journal of Contemporary Criminal Justice 8:137–49.
Thomas, W.I. and F. Znaniecki. 1958 [1927]. The Polish Peasant in Europe and America.New York: A.A. Knopf.
Tickamyer, A.R. and C.M. Duncan. 1990. “Poverty and Opportunity Structure in RuralAmerica.” Annual Review of Sociology 16:67–86.
Tickamyer, A. R. and T.A. Wood. 1998. “Identifying Participation in the Informal Econ-omy Using Survey Research Methods.” Rural Sociology 63:323–339.
Weisheit, R.A. and L.E. Wells. 1996. “Rural Crime and Justice: Implications for Theoryand Research.” Crime and Delinquency 42:379–97.
Wilkinson, K.P. 1984a. “Rurality and Patterns of Social Disruption.” Rural Sociology49:23–36.
———. 1984b. “A Research Note on Homicide and Rurality.” Social Forces 63:445–52.Williams, K.R. and R.L. Flewelling. 1988. “The Social Production of Criminal Homicide:
A Comparative Study of Disaggregated Rates in American Cities.” American Sociolog-ical Review 53:421–31.
Wilson, W.J. 1987. The Truly Disadvantaged: The Inner City, the Underclass, and Public Policy.Chicago: University of Chicago Press.
Wirth, L. 1938. Urbanism as a Way of Life. Chicago: University of Chicago Press.
Social Isolation and Homicide — Lee et al. 131