SOCIAL, HUMAN AND ADMINISTRATIVE SCIENCES - II
403
Edtor : ASSIST. PROF. DR. HASAN SELİM KIROĞLU ACADEMIC STUDIES IN SOCIAL, HUMAN AND ADMINISTRATIVE SCIENCES - II Volume 1
-
Upload
khangminh22 -
Category
Documents
-
view
5 -
download
0
Transcript of SOCIAL, HUMAN AND ADMINISTRATIVE SCIENCES - II
Edtor : ASSIST. PROF. DR. HASAN SELİM KIROĞLU
ACADEMIC STUDIES IN SOCIAL, HUMAN AND
ADMINISTRATIVESCIENCES - II
Volume 1
İmtiyaz Sahibi / Publisher • Yaşar HızGenel Yayın Yönetmeni / Editor in Chief • Eda Altunel
Editör / Edıtor • Dr. Öğr. Üyesi Hasan Selim KıroğluKapak & İç Tasarım / Cover & Interior Design • Karaf Ajans
Birinci Basım / First Edition • © Haziran 2020
ISBN • 978-625-7884-62-4
© copyright Bu kitabın yayın hakkı Gece Kitaplığı’na aittir. Kaynak gösterilmeden alıntı yapılamaz, izin
almadan hiçbir yolla çoğaltılamaz.
The right to publish this book belongs to Gece Kitaplığı. Citation can not be shown without the source, reproduced in any way
without permission.
Gece Kitaplığı / Gece PublishingTürkiye Adres / Turkey Address: Kızılay Mah. Fevzi Çakmak 1. Sokak
Ümit Apt. No: 22/A Çankaya / Ankara / TRTelefon / Phone: +90 312 384 80 40
web: www.gecekitapligi.come-mail: [email protected]
Baskı & Cilt / Printing & VolumeSertifika / Certificate No: 47083
Academic Studies in Social, Human and
Administrative Sciences - II
Volume 1
Editor Asts. Prof. Hasan Selim Kıroğlu

TABLE OF CONTENTS
Chapter 1ESTIMATING STATURE OF ANATOLIAN POPULATIONS FROM NEO-LITHIC PERIOD TO OTTOMAN PERIODAhmet İhsan AYTEK ....................................................................................... 1
Chapter 2FINANCIAL AWARENESS IN QATARI SOCIETY: A STUDY FROM THE PERSPECTIVE OF SOCIAL WORKBana Mohammed AL-GHANIM ..................................................................... 19
Chapter 3THE INTEGRATION OF ERP AND BLOCKCHAIN:DIFFERENCES BETWEEN E-LEDGER AND DISTRIBUTED LEDGERBetül Şeyma ALKAN ....................................................................................... 37
Chapter 4PUBLIC DEBT AND ECONOMIC GROWTH NEXUS: THE CASE OF EMERGING MARKET AND DEVELOPING ECONOMIESGozde GURGUN , Bilge CANBALOGLU ...................................................... 53
Chapter 5RETHINKING THE NEXUS BETWEEN POLLUTANT EMISSION, FI-NANCIAL DEVELOPMENT, RENEWABLE ENERGY CONSUMPTION AND ECONOMIC GROWTH IN G7 COUNTRIESFestus Victor BEKUN, Bright Akwasi GYAMFI ............................................. 73
Chapter 6A REVIEW OF THE COMPLAINTS IN THE TRAVEL WEBSITES ABOUT HOSPITALITY ENTERPRISESFiliz ASLAN ÇETİN, Nezefet Havva KADİROĞLU ...................................... 83
Chapter 7USE VALUE OF PATARA ANCIENT CITY: AN APPLICATION OF TRAVEL COST METHODFırat YILMAZ ................................................................................................... 99
Chapter 8ANALYSING TOURISM PRODUCT RELATED BEHAVIORS OF DISABLED TOURISTS:AN IMPLICATION IN FLORIDA-USAFunda ODUNCUOĞLU ................................................................................... 127
Chapter 9IN-SERVICE TRAINING IN HEALTH ORGANIZATIONSGülay TAMER .................................................................................................. 155
Chapter 10MIGRATION AND INTERSECTIONALITY: POOR SYRIAN MIGRANTSHıdır APAK ....................................................................................................... 177
Chapter 11SMART-DARK FACTORIES AND LEAN ACCOUNTINGİlkay Ejder ERTURAN ..................................................................................... 193
Chapter 12SOCIAL MEDIA ADDICTION AND CONTROLLING SOCIAL MEDIA USE: AN EXTENSIVE STUDYImran ASLAN ................................................................................................... 209
Chapter 13CHINESE SOCIAL MEDIA PLATFORMS AS AN ALTERNATIVE SO-CIAL MEDIA TO THE NEW WORLDMihalis (Michael) KUYUCU ........................................................................... 247
Chapter 14SOURCES OF ENERGY AND THE SIGNIFICANCE OF OILNazife Özge BEŞER, Serdar ÖZTÜRK, ......................................................... 265
Chapter 15ACADEMIC PROCRASTINATION AND SELF-HANDICAPPING AS MEDIATORS FOR THE EFFECT OF PERFECTIONISM ON ACADEMIC ACHIEVEMENTNur TALUY ..................................................................................................... 281
Chapter 16EFFECTS OF SOCIAL MEDIA ON VOTERS IN ELECTIONS CAMPAIGN: “EXAMPLE MALATYA OF GENERAL ELECTIONS OF NOVEMBER 2015”Nural İMİK TANYILDIZI ,Taha Yasin ATEŞ ................................................. 311

Chapter 17VIRAL MARKETING AS A MEANS OF PROMOTING LIVE QUIZ SHOW “HADI LIVE”Nural İMİK TANYILDIZI, Ayşe Şebnem YOLCU ........................................ 325
Chapter 18EVALUATION OF EFFICIENCY AND TOTAL FACTOR PRODUCTIVITY OF SELECTED TEXTILE COMPANIES IN TURKEYSaeid HAJIHASSANIASL, Göktürk KALKAN .............................................. 345
Chapter 19ROLE OF MANAGEMENT INFORMATION SYSTEMS INCLUDING AC-COUNTING INFORMATION SYSTEM IN FACING TOURISM CRISIS; AN EMPRICIAL STUDY IN ADEN HOTELSSemih BUYUKKIPEKCI , Yazeed Sultan Saeed AHMED .............................. 371

Chapter 1ESTIMATING STATURE OF ANATOLIAN
POPULATIONS FROM NEOLITHIC PERIOD TO OTTOMAN PERIOD
Ahmet İhsan AYTEK1
1 Doktor Öğretim Üyesi, Burdur Mehmet Akif Ersoy University, Faculty of Arts and Science, Deparment of Anthropology, [email protected]

3Academic Studies in Social, Human and Administrative Sciences - II 3
IntroductionAnatolia has been settled by a lot of different civilizations due to its
geographic position. It has been hosting humans for at least 1.2 million years and different parts of it has been populated by different groups. The early attempts to work on these ancient populations go back to early 30’s by the first biological anthropologists in Turkey (Günay and Şarbak, 2015). From these first studies up to today, the number of anthropology depart-ments and biological anthropologists has been increasing day by day and thus the osteological studies as well.
In the last 90 years (from 1930 to 2019), numerous studies focused on anthropological analyses of skeletal material of ancient populations. Although the early studies just focused on the fundamental data such as age and sex of the individuals, later studies reveal much more data from the skeletal material. One of these data is estimation of stature. It is one of important characteristic feature of individual and very important for paleo-anthropological and forensic anthropological studies. Numerous methods have been proposed but the most commons are Pearson (1899) and Trot-ter and Glesers’s (1952) methods. Turkish studies generally focused on these two methods. Furthermore, another method, which was proposed by a Turkish scholar, has been used (Sağır, 2000) in some of Turkish studies.
Although a lot of studies involve stature information about the rel-evant ancient populations, just two studies focused on review of stature data from ancient periods. Güleç (1989a) examined the stature of ancient Anatolian individuals from 60 different studies. She presented the results in two tables, one for Pearson formula and one for Trotter and Gleser for-mula. After taking the average of these two tables, the average stature is calculated as; 169.8 (male) and 157.3 (female) for Neolithic period, 165.6 (male) and 154.1 (female) for Chalcolithic period, 165.9 (male) and 158.8 (female) for Bronze period, 167.9 (male) and 154.3 (female) for Iron pe-riod, 162.3 (male) and 157 (female) for Hellenistic-Roman period, 168.9 (male) and 157.1 (female) for Byzantine period and 167.7 (male) and 158.5 (female) for Ottoman period in Güleç’s study.
Another study also focused on the stature estimation of 34 different ancient Anatolian populations and they also used the stature data of living Anatolian individuals (Koca Özer et al., 2011). This study is just focused on the stature estimations which are taken from Trotter and Gleser for-mula. In this study, the average stature is calculated as; 170.9 (male) and 156 (female) for Neolithic period, 165.8 (male) and 154.8 (female) for Chalcolithic period, 165.6 (male) and 157.2 (female) for Bronze period, 170 (male) and 158.4 (female) for Iron period, 165.3 (male) and 155.7 (female) for Hellenistic-Roman period, 169.5 (male) and 158 (female) for Byzantine period.
Ahmet İhsan AYTEK4
Our aim is to expose the stature of ancient Anatolian inhabitants after an extensive literature examination. Although Güleç’s and Koca Özer’s studies revealed important results on this theme, much more detailed lit-erature examination is conducted in this study and thus it is likely to give more precise results because of high number of sample size.
Material and Methods
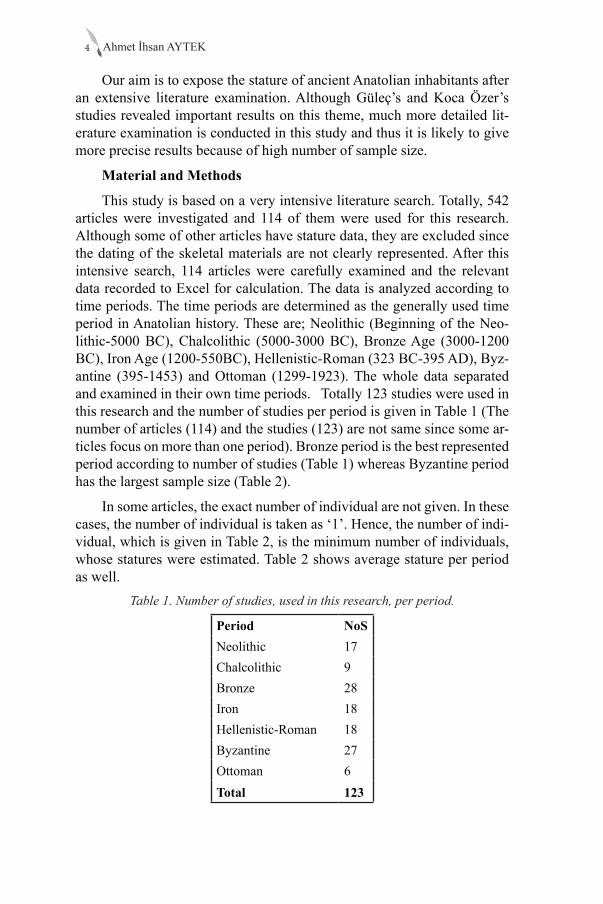
This study is based on a very intensive literature search. Totally, 542 articles were investigated and 114 of them were used for this research. Although some of other articles have stature data, they are excluded since the dating of the skeletal materials are not clearly represented. After this intensive search, 114 articles were carefully examined and the relevant data recorded to Excel for calculation. The data is analyzed according to time periods. The time periods are determined as the generally used time period in Anatolian history. These are; Neolithic (Beginning of the Neo-lithic-5000 BC), Chalcolithic (5000-3000 BC), Bronze Age (3000-1200 BC), Iron Age (1200-550BC), Hellenistic-Roman (323 BC-395 AD), Byz-antine (395-1453) and Ottoman (1299-1923). The whole data separated and examined in their own time periods. Totally 123 studies were used in this research and the number of studies per period is given in Table 1 (The number of articles (114) and the studies (123) are not same since some ar-ticles focus on more than one period). Bronze period is the best represented period according to number of studies (Table 1) whereas Byzantine period has the largest sample size (Table 2).
In some articles, the exact number of individual are not given. In these cases, the number of individual is taken as ‘1’. Hence, the number of indi-vidual, which is given in Table 2, is the minimum number of individuals, whose statures were estimated. Table 2 shows average stature per period as well.
Table 1. Number of studies, used in this research, per period.
Period NoSNeolithic 17Chalcolithic 9Bronze 28Iron 18Hellenistic-Roman 18Byzantine 27Ottoman 6Total 123

5Academic Studies in Social, Human and Administrative Sciences - II 5
Results
- Neolithic: 17 different studies from 10 different archaeological sites were analysed (Alpaslan Roodenberg, 2001, 2002a, 2008, 2011; Al-paslan Roodenberg and Maat 1999; Alpaslan Roodenberg et al., 2013; Al-paslan-Roodenberg and Roodenberg, 2020; Ferembach, 1970; Molleson et al., 1996; Molleson et al., 2005; Özbek, 1988, 1992, 1998, 2000; Sevim Erol et al. 2011; Şenyürek,1958). The average stature is for males 165,5 (n:117) and for females 155 (n:136).
- Chalcolithic: 9 different studies from 6 different archaeological sites were analysed (Alpaslan Roodenberg, 2011; Erdal and Erdal, 2017; Kansu, 1937a; Roodenberg et al., 2008; Şenyürek, 1949, 1950, 1954, 1955; Şenyürek and Tunakan, 1951). The average stature is for males 165 (n:14) and for females 153,7 (n:11).
- Bronze: 28 different studies from 26 different archaeological sites were analysed (Açıkkol, 2000; Açıkkol et al., 2003; Açıkkol Yıldırım et al., 2014; Alpaslan Roodenberg, 2002b; Angel, 1970, 1986; Başoğlu and Erkman, 2015; Başoğlu and Şener, 2015; Çiner, 1963, 1964, 1965a, 1967; Kansu, 1937b, 1939; Kansu and Atasayan, 1939; Kansu and Ünsal, 1952; Özer et al., 2012; Sağır et al., 2011; Satar et al., 2009; Sevim et al., 2004; Surul et al., 2012; Şenyürek, 1952; Tunakan, 1965; Kansu and Tunakan, 1946; Üstündağ, 2015; Wittwer Backofen, 1986, 1987; Yaşar et al., 2012). The average stature is for males 166,1 (n: 121) and for females 157 (n: 110).
- Iron: 18 different studies from 14 different archaeological sites were analysed (Açıkkol Yıldırım et al., 2014; Angel, 1951, 1973; Çiner, 1965b; Gözlük, 2003, 2005; Güleç, 1986, 1989b; Güleç et al., 1998; Güleç et al., 2005; Kansu and Tunakan, 1948; Sağır et al., 2004; Sevim et al., 2007; Sevim et al., 2007; Tunakan, 1964; Yılmaz et al., 2009; Yiğit et al., 2005; Yiğit et al., 2008). The average stature is for males 166,4 (n: 79) and for females 157,1 (n: 73).
- Hellenistic-Roman: 18 different studies from 17 different archaeo-logical sites were analysed (Akbacak and Gözlük Kırmızıoğlu, 2018; An-gel 1951; Başoğlu et al., 2011; Çırak, 2015; Çiner, 1971a, 1972; Gözlük Kırmızıoğlu et al., 2009; Güleç, 1990; Güleç et al., 2006; Güleç et al., 2009; Özbek, 2006; Özbek and Erdal,, 2000; Özer et al., 2012; Sağır et al., 2013; Sevim, 1996, 2006; Şahin et al., 2015; Wittwer Bakcofen, 1987). The aver-age stature is for males 165,8 (n: 67) and for females 157,3 (n: 44).
- Byzantine: 27 different studies from 24 different archaeological sites were analysed (Alkan et al., 2014; Alpagut, 1980; Alpaslan Rooden-berg, 2009; Başoğlu et al., 2012; Çiner, 1963, 1969, 1971b; Demirel, 2016;
Ahmet İhsan AYTEK6
Erdal, 1991, 2000; Gözlük et al., 2006; Gözlük Kırmızıoğlu et al., 2009; Güleç and Özer, 2009; Kansu and Çiner, 1968; Kaya, 2020; Nalbantoğlu et al., 2000; Özbek, 1984; Özer, and Sağır, 2012; Özer et al., 1999; Özer et al., 2016; Sevim et al., 2005; Sevim et al., 2007; Sevim et al., 2011; Stead-man et al., 2015; Üstündağ and Demirel, 2008; Yılmaz and Acar, 2018; Yiğit et al., 2008). The average stature is for males 168,1 (n: 405) and for females 154,9 (n: 262).
- Ottoman: 6 different studies from 5 different archaeological sites were analysed (Alpagut, 2001, 2002; Erdal, 2011; Güleç, 1989c; Köroğlu and Gözlük Kırmızıoğlu, 2017; Yiğit et al., 2010). The average stature is for males 164,2 (n:43) and for females 155,8 (n: 41).
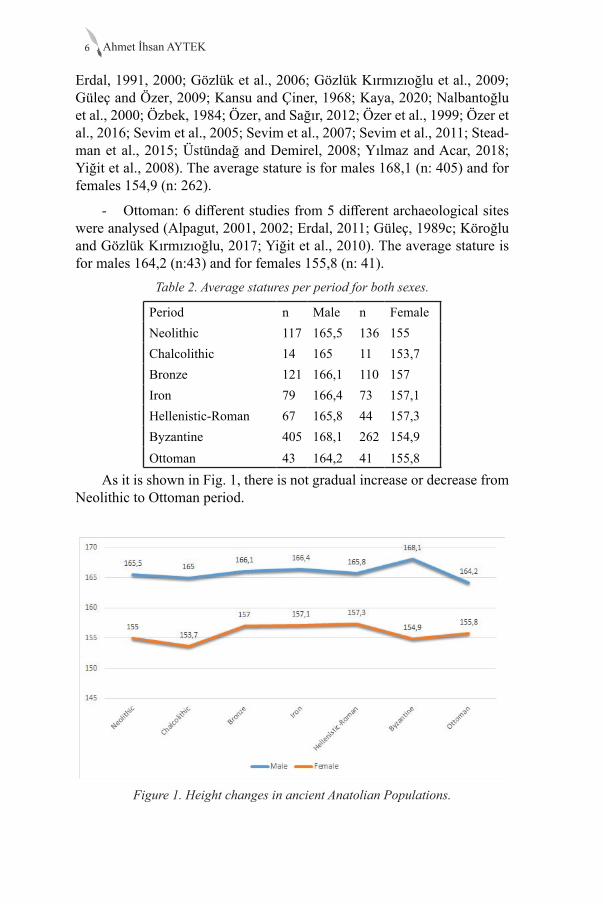
Table 2. Average statures per period for both sexes.
Period n Male n FemaleNeolithic 117 165,5 136 155Chalcolithic 14 165 11 153,7Bronze 121 166,1 110 157Iron 79 166,4 73 157,1Hellenistic-Roman 67 165,8 44 157,3Byzantine 405 168,1 262 154,9Ottoman 43 164,2 41 155,8
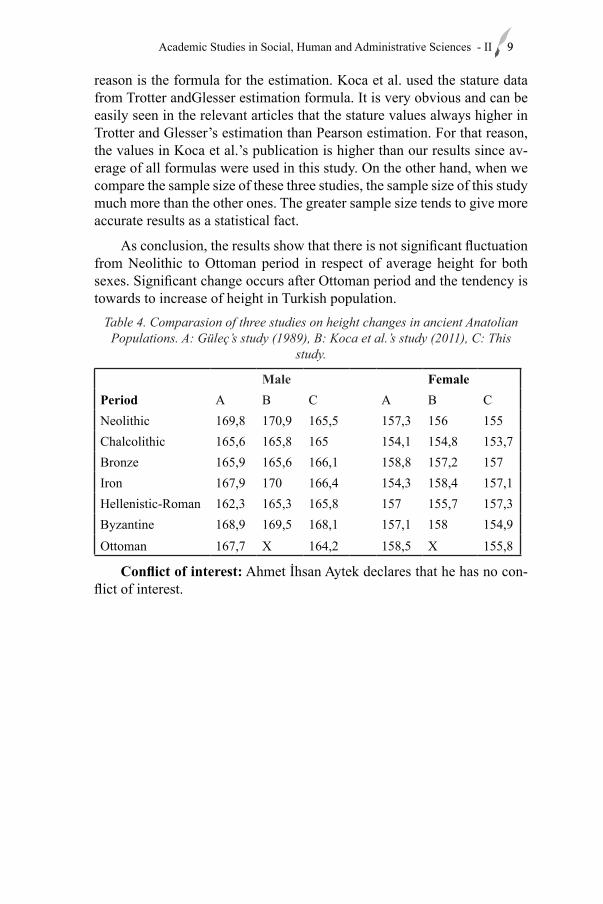
As it is shown in Fig. 1, there is not gradual increase or decrease from Neolithic to Ottoman period.
Figure 1. Height changes in ancient Anatolian Populations.
7Academic Studies in Social, Human and Administrative Sciences - II 7
Sexual dimorphism is 10,5 cm for Neolithic, 11,3 cm for Chalcolithic, for 9,1 cm Bronze, 9,3 cm for Iron, 8,5 cm for Hellenistic-Roman, 13,2 cm for Byzantine, 8,4 cm for Ottoman (Table 2) and the average is 10.04 cm for total sample.
Discussion
Estimating the stature of individual is one of the key concepts of bi-ological anthropology studies. After estimating the individual’s stature, average stature of the populations or periods can be calculated and thus, secular changes can be determined throughout history. It is also very im-portant to make a profile of victim in forensic investigations. Modern day Turkey has been populated at least 1.2 million years by different groups. Especially with the beginning of the Neolithic, the population of Anatolia increased very fast and reached up 83 million people today. Nowadays, the demographic data, as well as average stature, of Turkish population is evaluated via Turkey Health Interview Survey by Turkish Statistical Insti-tute. Today, average stature is 173,2 cm for males and 161,4 cm for females (turkstat.gov.tr, last data from 2016).
There are very clear evidences that the average stature has been in-creasing over the years in all over the world. The situation is same in Tur-key as well and the results of Turkey Health Interview Survey clearly point out it (Table 3). Although our results do not show a gradual increase from older period to younger one in stature, it is important to remember that stature values depend on just skeletal material represent the individuals whose long bones were preserved. Another important fact, which has to be mentioned, is the effects of aging on bones. It is known that the average stature decreases with age (0.06 per year after 30 years; Trotter and Gless-er, 1951). When we combine this information together with the fact that average age is much lower than today in ancient populations, it would not be wrong to say that difference between ancient Anatolian population and present day Turkish populations would be higher.
Ahmet İhsan AYTEK8
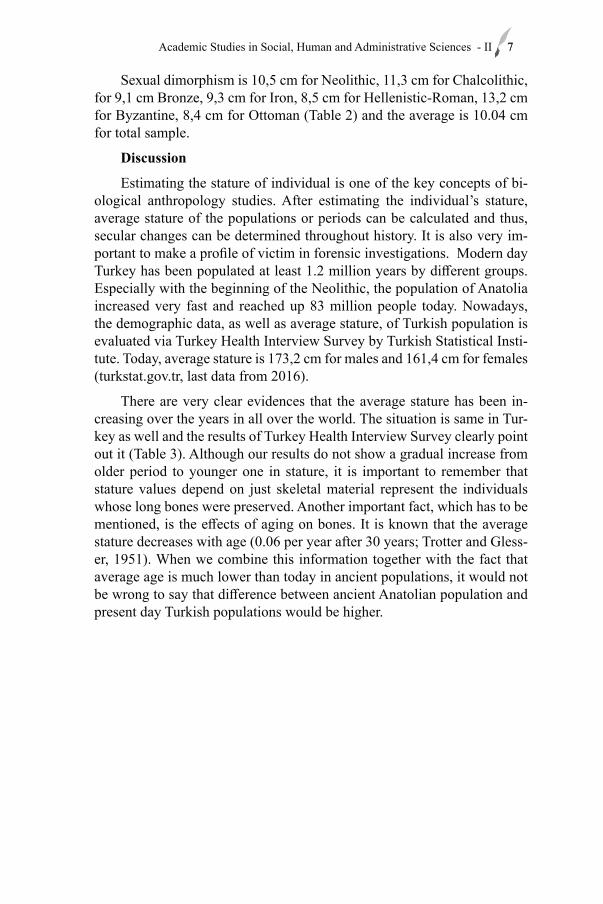
Table 3. Turkey Health Interview Survey results, T: Total average, M: Male, F: Female (adapted from turkstat.gov.tr, 03.01.2020).
2008 2010 2012Age T M F T M F T M FTotal 167,2 172,4 161,5 167,2 172,6 161,4 167,6 173,1 161,815-24 167,8 173,2 162,4 167,5 172,7 162,1 168,2 173,5 162,825-34 168,7 174,1 162,7 168,8 174,7 162,5 169,1 175,0 162,835-44 167,4 172,7 161,5 167,8 173,2 161,7 168,0 173,5 162,145-54 166,3 170,9 160,7 166,4 171,3 160,8 166,9 171,9 161,455-64 165,8 170,5 160,3 165,1 170,1 159,6 165,9 171,2 160,265-74 164,5 169,7 159,0 164,9 170,4 159,6 164,7 169,9 159,475+ 162,7 168,8 157,2 163,0 167,9 157,8 162,5 168,6 157,5 2014 2016Age T M F T M FTotal 166,9 173,0 161,0 167,2 173,2 161,415-24 168,2 174,3 162,2 168,4 173,9 162,725-34 168,7 175,2 162,3 169,1 175,5 162,835-44 167,5 173,8 161,2 168,1 173,9 162,245-54 166,2 171,5 160,8 166,5 172,2 160,755-64 165,1 170,8 159,5 165,5 171,2 160,065-74 163,6 169,3 158,9 164,1 170,1 158,975+ 161,6 168,9 156,8 161,3 168,3 156,7
When we compare actual data with the data from Neolithic period, it can be seen that average stature has been increased 7,7 cm for males and 6,4 for females in last 12.000 years. Actually, if we remember that the there is no big change in average stature from Neolithic to Ottoman period, it can be realized that this increase (7,7 cm for males and 6,4 for females) took place after Ottoman period.
Another result of this study is about sexual dimorphism. The average difference between the sexes calculated 10.04 cm for whole sample. Ac-cording to Turkstat data, it is 11.8 cm in actual Turkish population. This value is higher than all periods except Byzantine (13.2 cm in Byzantine period). So it would not be wrong to say that sexual dimorphism has a tendency towards increase over the periods.
Before this study, two other studies demonstrated the stature infor-mation of ancient Anatolian populations (Güleç, 1989; Koca Özer et al., 2011). When we compare the whole data, it can be seen that the results of this study are lower than the other two studies (Table 4) and Koca et al.’s values are the higher ones, especially in Neolithic period. One possible
9Academic Studies in Social, Human and Administrative Sciences - II 9
reason is the formula for the estimation. Koca et al. used the stature data from Trotter andGlesser estimation formula. It is very obvious and can be easily seen in the relevant articles that the stature values always higher in Trotter and Glesser’s estimation than Pearson estimation. For that reason, the values in Koca et al.’s publication is higher than our results since av-erage of all formulas were used in this study. On the other hand, when we compare the sample size of these three studies, the sample size of this study much more than the other ones. The greater sample size tends to give more accurate results as a statistical fact.
As conclusion, the results show that there is not significant fluctuation from Neolithic to Ottoman period in respect of average height for both sexes. Significant change occurs after Ottoman period and the tendency is towards to increase of height in Turkish population.
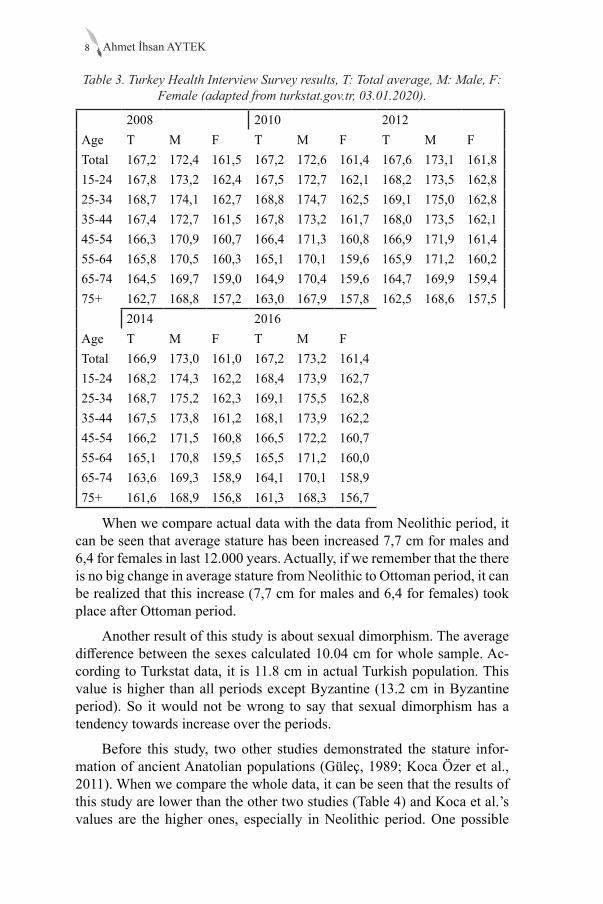
Table 4. Comparasion of three studies on height changes in ancient Anatolian Populations. A: Güleç’s study (1989), B: Koca et al.’s study (2011), C: This
study.
Male Female Period A B C A B CNeolithic 169,8 170,9 165,5 157,3 156 155Chalcolithic 165,6 165,8 165 154,1 154,8 153,7Bronze 165,9 165,6 166,1 158,8 157,2 157Iron 167,9 170 166,4 154,3 158,4 157,1Hellenistic-Roman 162,3 165,3 165,8 157 155,7 157,3Byzantine 168,9 169,5 168,1 157,1 158 154,9Ottoman 167,7 X 164,2 158,5 X 155,8
Conflict of interest: Ahmet İhsan Aytek declares that he has no con-flict of interest.
Ahmet İhsan AYTEK10
References1. Açıkkol A. 2000. Küçükhöyük Eski Tunç Çağı insanlarının
Paleoantropolojik açıdan incelenmesi. Ankara Üniversitesi Sosyal Bilimler Enstitisü. Ms Thesis.
2. Açıkkol, A., Yılmaz, H., Baykara, İ. and Şahin, S. (2003). Kütahya Ağızören Hitit İskeletlerinin PaleoAntropolojik Analizi ve Tunç Çağı Anadolu Halkları Arasındaki Yeri. Antropoloji, 17, 1- 26.
3. Açıkkol Yıldırım, A., Gözlük Kırmızıoğlu, P. and Genç, E. (2014). Kuriki Höyük İskeletleri. 29. Arkeometri Sonuçları Toplantısı Kitabı, ss. 203-215.
4. Akbacak, H. and Gözlük Kırmızıoğlu, P. (2018). Amasya Roma Dönemi İnsanları. Hitit Üniversitesi Sosyal Bilimler Enstitüsü Dergisi ANARSAN Sempozyumu Özel Sayısı, 11(2), 1631-1650. doi: 10.17218/hititsosbil.460421
5. Alkan, Y., Erkman, A.C. and Kaplan, İ. (2014). Çiçekdağı İskeletlerinin PaleoAntropolojik Analizi. 29. Arkeometri Sonuçları Toplantısı Kitabı, ss. 77-82.
6. Alpagut, A. (2001). Ankara Roma Hamamı 2000 yılı Kurtarma Kazısından Çıkarılan İskeletlerin Antropolojik Analizi. Anadolu Medeniyetler Müzesi 2001 Yıllığı, ss. 57-83.
7. Alpagut, A. (2002). Ankara Roma Hamamı 2001 Kurtarma Kazısından Çıkarılan iskeletlerin paleoAntropolojik analizi. Anadolu Medeniyetler Müzesi 2001 Yıllığı, ss. 82-105.
8. Alpagut, B. (1980). The Human Skeletal Remains From Beyköy (Afyon Anatolia). Antropoloji,, 12, 299-316.
9. Alpaslan Roodenberg, S. (2001). Newly Found Human Remians from Menteşe in the Yenişehir Plain. Anatolica, 27, 1- 14. doi: 10.2143/ANA.27.0.2015500
10. Alpaslan Roodenberg, S. (2002a). Death in Neolithic Ilıpınar. Gatsov I, Schwarzberg H. (Ed.), In Aegean – Marmara – Black Sea, The Present State of Research on the Early Neolithic (pp. 47- 57). Langenweissbach: Beier&Beran.
11. Alpaslan Roodenberg, S. (2002b). Preliminary Report on the Human Remains from Early Bronze Age Cemetery at Ilıpınar- Hacılartepe. Anatolica, 28, 91- 107. doi: 10.2143/ANA.28.0.2011762
12. Alpaslan Roodenberg, S. (2008). Chapter 2, The Neolithic Cemetery, The Anthropological View. Roodenberg J, Alpaslan Roodenberg S (Ed.), In Life and Death in a Prehistoric Settlement in Northwest Anatolia, The Ilıpınar Excavations , Volume III with contributions on Hacılartepe and Menteşe (pp. 35-68). Belgium: Nederlands Instituut Voor Het Nabije Oosten.
13. Alpaslan Roodenberg, S. (2009). Demographic Data from the
11Academic Studies in Social, Human and Administrative Sciences - II 11
Byzantine Graveyard of Barcın. Roodenberg JJ, Vorderstrasse T (Ed.), In Archaeology of the Countryside in Medieval Anatolia (pp. 169-175). Leiden: The Netherlands Institute for the Near East.
14. Alpaslan Roodenberg, S. (2011). A Preliminary Study of the Burials from Late Neolithic-Early Chalcolithic Aktopraklık. Anatolica, 37, 17-43. doi: 10.2143/ANA.37.0.2073783
15. Alpaslan Roodenberg, S. and Maat G.J.R. (1999). Human Skeletons from Meneteşe Höyük near Yenişehir. Anatolica, 25, 37-51.doi: 10.2143/ANA.25.0.2015484
16. Alpaslan Roodenberg, S., Gerritsen, F.A. and Özbal, R. (2013). Neolithic Burials from Barcın Höyük. Anatolica, 39, 93-111. doi: 10.2143/ANA.39.0.2990785
17. Alpaslan-Roodenberg, M.S. & Roodenberg, J. (2020). In the light of new data: The Population of the first farming communitiesin the eastern Marmara region. Praehistorische Zeitschrift, aop, 15.05.2020.
18. Angel, J.L. (1951). Troy, The Human Remains. Princeton, N.Y.: Princeton University Press for the University of Cincinnati.
19. Angel, J.L. (1970). Human Skeletal Remains at Karataş. Excavations at Karataş Semahöyük and Elmalı Lycia 1969. American Journal of Archaeology Appendix, Mellink JM (Ed.), 74, 253-259.
20. Angel, J.L. (1973). Skeletal Fragments of Classical Lycians. In Excavations at Karataş Semahöyük and Elmalı Lycia1972. American Journal of Archaeology Appendix, Mellink MJ (Ed.), 77, 303-307.
21. Angel, J.L. (1986). The Physical Identity of the Trojan. Mellink MJ. (Ed.), In Troy and the Trojan War. A Symposium Held at Bryn Mawr College (pp. 63-76). Bryn Mawr: Bryn Mawr College Press.
22. Başoğlu, O. and Erkman, A.C. (2015). Diyarbakır/Salat Tepe Orta Tunç Çağı İnsanları, Antropolojik Bir İnceleme. Hitit Üniversitesi Sosyal Bilimler Enstitüsü Dergisi, 8(1), 25-38. doi: 10.17218/husbed.65491
23. Başoğlu, O. and Şener, T. (2015). Ovaören Erken Tunç Çağı İnsanları, Antropolojik Bir İnceleme. Hitit Üniversitesi Sosyal Bilimler Enstitüsü Dergisi, 8(2), 455-476. doi: 10.17218/husbed.15692
24. Başoğlu, O., Şenyurt, Y., Şener, T. and Sönmez, Ç. (2011). Nevşehir/Camihöyük İskeletlerinin Paleoantropolojik Açıdan Değerlendirilmesi. Adli Bilimler Dergisi, 10(2), 7-15.
25. Başoğlu, O., Şener, T. and Gökkoyun, S. (2012). Olba İskeletleri. Adli Bilimler Dergisi, 11(2), 12-18.
26. Çırak, M.T. (2015). Antik Dönemde Orbital Selülit, Cide/Türbetepe Tümülüsü’nden Bir Örnek. Hitit Üniversitesi Sosyal Bilimler Enstitüsü Dergisi, 8(1), 143-152. doi: 10.17218/husbed.03455
27. Çiner, R. (1963). Evdi Tepesi ve Civarından Çıkarılan İskelet Kalıntılarının Tetkiki. Antropoloji, 1, 78-98.
28. Çiner, R. (1964). Bodrum-Müskebi Kazısı İskelet Kalıntılarının
Ahmet İhsan AYTEK12
Tetkiki. Antropoloji, 2, 56-79.29. Çiner, R. (1965a). Acemhüyük İskeleti. DTCF Dergisi, 23(1.2), 1-23.30. Çiner, R. (1965b). Altıntepe (Urartu) İskeletlerine Ait Kalıntıların
Tetkiki (4 resimle birlikte). Belleten, 29(114), 225- 243.31. Çiner, R. (1967). Ilıca-Ayaş İskelet Kalıntılarının Tetkiki. Antropoloji,
4, 195-237.32. Çiner, R. (1969). İstanbul Kocamustafapaşa’da Çıkan İskelet
Kalıntılarının Tetkiki. Antropoloji, 5, 171-201.33. Çiner, R. (1971a). Gordion Roma Halkı Femür ve Tibialarının Tetkiki.
A.Ü. D.T.C.F. Yayını. Yayın No. 194.34. Çiner, R. (1971b). Yarımburgaz (Küçükçekmece-İstanbul)
Mağarasında Çıkan İskelet Kalıntılarının Tetkiki. In Cumhuriyetin 50. Yıldönümü Anma Kitabı (pp. 475-500). Ankara Üniversitesi Dil ve Tarih Coğrafya Fakültesi Yayınları No, 239, Ankara.
35. Çiner, R. (1972). İstanbul’da (Çemberlitaş) Darüşşafaka Sitesi Temel Kazılarında Çıkarılan İmparator Tiberius Zamanına (M.S. 14-37) Ait İskelet Kalıntılarının Tetkiki. Antropoloji, 7, 107-163.
36. Demirel, F.A. (2016). Analysis of Human Remains from Heraklia Perinthos. S. Westphalen (Ed.), In: Die Basilika am Kalekapı in Herakleia Perinthos Bericht über die Ausgrabungen von 1992-2010 in Marmara Ereğlisi (pp. 130-144). Tübingen: Ernst Wasmuth Verlag.
37. Erdal, Y.S. (1991). İznik Geç Bizans Dönemi iskeletlerinin paleoAntropolojik açıdan incelenmesi. Hacettepe Üniversitesi Sosyal Bilimler Enstitisü. Ms Thesis.
38. Erdal, Y.S. (2000). Hagios Aberkios Kilisesi İskelet Topluluğunun Antropolojik Açıdan İncelenmesi (8 resim ile birlikte). Belleten, 64(239), 23-41.
39. Erdal, Y.S. (2011). Tasmasor Yakınçağ Nekropolü ve İskeletlerinin Antropolojik Analizi. Şenyurt SY (Ed.), In Tasmasor (pp. 255-359). Ankara: Bilgin Kültür Sanat Yayınları.
40. Erdal,, Y.S. ve Erdal,, Ö.D. (2017). Anthropological analysis of the skeletal remains from the Acropolis of Perge. W. Martini ve N. Eschbach (Ed.), In: Die Akropolis Von Perge Die Ergebnisse der Grabungen 1998-2004 und 2008 (pp.341-347). Antalya: Adalya Ekyayın Dizisi 16.
41. Ferembach, D. (1970). Les Hommes du Gisement Neolithique de Çatal Höyük. VII. Türk Tarih Kongresi, ss. 13-21.
42. Gözlük, P. (2005). Klazomenai Toplumunda Boy Uzunluğu ve Anadolu’daki Yeri. Antropoloji, 20, 47-74.
43. Gözlük, P., Yılmaz, Hç, Yiğit, A., Açıkkol, A. and Sevim A. (2003). Hakkari Erken Demir Çağı İskeletlerinin Paleoantropolojik Açıdan İncelenmesi. 18. Arkeometri Sonuçları Toplantısı Kitabı, ss. 31-40.
44. Gözlük, P., Durgunlu, Ö., Özdemir, S., Taşlıalan, M. and Sevim, A.
13Academic Studies in Social, Human and Administrative Sciences - II 13
(2006). Symrna Agorası İskeletlerinin Paleoantropolojik Analizi. 21. Arkeometri Sonuçları Toplantıs Kitabı, ss. 125-140.
45. Gözlük Kırmızıoğlu, P., Yiğit, A., Sevim Erol,, A., Yaşar, Z.F. (2009). Kyzikos İnsan İskeletlerinin Antropolojik Açıdan Değerlendirilmesi. Uluslararası İnsan Bilimleri Dergisi, 6(2), 451-466.
46. Güleç, E. (1986). Van Dilkaya İskeletlerinin PaleoAntropolojik İncelenmesi. 4. Araştırma Sonuçları Toplantısı Kitabı, ss. 369-380.
47. Güleç, E. (1989a). Paleoantropolojik Verilere Göre Eski Anadolu Bireylerinin Boy Açısından İncelenmesi. V. Arkeometri Sonuçları Toplantısı Kitabı, ss. 147-160.
48. Güleç, E. (1989b). Klazomenai İskeletlerinin PaleoAntropolojik Açıdan Değerlendirilmesi (12 resim ile birlikte). Belleten, 53(207-208), 565-582.
49. Güleç, E. (1989c). Panaztepe İskeletlerinin Paleodemografik ve Paleopatolojik İncelenmesi. Türk Arkeoloji Dergisi, 28, 73-96.
50. Güleç, E. (1990). Yalacık Tümülüsü İskelet Buluntuları. Anadolu Medeniyetleri Müzesi 1989 Yıllığı, ss. 105-115.
51. Güleç, E, Özer, İ. (2009). Dilkaya Ortaçağ İskeletlerinin Paleoantropolojik Analizi. Sağlamtimur H, Abay E, Derin Z, Erdem AÜ, Batmaz A, Dedeoğlu F, Erdal,kıran M, Baştürk MB, Konakçı E. (Ed.), In Altan Çilingiroğlu’na Armağan, Yukarı Denizin Kıyısında Urartu Krallığı’na Adanmış Bir Hayat (pp. 294-303). İstanbul: Arkeoloji ve Sanat Yayınları.
52. Güleç, E., Sevim, A., Özer, İ. and Sağır, M. (1998). Klazomenai’de Yaşamış İnsanların Sağlık Sorunları. XIII. Arkeometri Sonuçları Toplantısı Kitabı, ss. 133-160.
53. Güleç, E., Sağır, M., Özer, İ. and Satar, Z. (2005). 2003 Yılı Börükçü Kazısı İskeletlerinin Paleoantropolojik İncelenmesi. 20. Arkeometri Sonuçları Toplantısı Kitabı, ss.167-172.
54. Güleç, E., Özer, İ., Sağır, M. and Satar, Z. (2006). Lagina Kazısı İskeletlerinin Paleoantropolojik Açıdan İncelenmesi. 21. Arkeometri Sonuçları Toplantısı Kitabı, ss. 21-28.
55. Güleç, E., Satar, Z., Sağır., M. and Özer, İ. (2009). Kendirci Mevkii Kurtarma Kazısı İskeletlerinin Paleoantropolojik Analizi. 24. Arkeometri Sonuçları Toplantısı Kitabı, ss. 79-86.
56. Günay, I. and Şarbak, A. (2015). Bibliography of Human Osteology Studies in Turkey (1930-2104). Scholars Journal of Arts, Humanities and Social Sciences, 3(5A), 1003-1026.
57. Kansu, Ş.A. and Atasayan, M. (1939). Afyonkarahisar Civarında Kusura Hafriyatında Meydana Çıkarılan Bakırçağı ve Eti Devrine Ait İskeletler Üzerinde Tetkikler. Türk Antropoloji, Mecmuası, 19-22, 272-313.
58. Kansu, ŞA. and Tunakan, S. (1946). Alaca-Höyük 1943-1945
Ahmet İhsan AYTEK14
Kazılarından Çıkarılan Kalkolitik, Bakır ve Tunç Çağlarına Ait Halkın Antropolojisi. Belleten, 10(40), 539-553.
59. Kansu, Ş.A. and Tunakan, S. (1948). Karaoğlan Höyüğünden Çıkarılan Eti, Frik ve Klasik Devir İskeletlerinin Antropolojik İncelemesi. Belleten, 12(48), 759- 774.
60. Kansu, Ş.A. and Ünsal, M. (1952). Tilki Tepe (Şamramaltı, Van) Kazısından Çıkarılan İskeletlerin Antropolojisi. IV. Türk Tarih Kongresi (10-14 Kasım 1948) Bildirileri.
61. Kansu, Ş.A. and Çiner, R. (1968). Korkuteli Tefenni İskeletine Ait Kalıntıların Tetkiki (1 resimle birlikte). Belleten, 32(127), 301-313.
62. Kansu, ŞA. (1937a). Kumtepe Neolitik Kemikleri Üzerinde Antropolojik Tetkik. Belleten, 1(2), 557-590.
63. Kansu, ŞA. (1937b). Alacahöyük’te Bulunan İnsan İskeletlerinin Antropolojik Tetkiki. Belleten, 1(1), 180-209.
64. Kansu, ŞA. (1939). Ahlatlıbel İnsan Kemikleri Üzerinde Tetkikler (Türkçe ve Fransızca. Türk Antropoloji, Mecmuası, 19-22, 22-35.
65. Kaya, E.H. (2020). Stratonikeia Antik Kenti Batı Cadde Kilise İskeletlerinin Antropolojik Analizi. Aydın Adnan Menderes Üniversitesi, Sosyal Bilimler Enstitüsü, Arkeoloji Anabilim Dalı, Msc Thesis.
66. Koca Özer, B., Sağır, M. and Özer, İ. (2011). Secular Changes in the Height of the Inhabitants of Anatolia (Turkey) from the 10th Millennium B.C. to the 20th Century A.D. Economics and Human Biology, 9(2), 211-219. doi: 10.1016/j.ehb.2010.12.003
67. Köroğlu, T. and Gözlük Kırmızıoğlu, P. (2017). Tokat/Niksar Yakınçağ İskeletlerinin Antropolojik Analizi. Akademik Sosyal Araştırmalar Dergisi, 5(62),1-14. doi: 10.16992/ASOS.13219
68. Molleson, T., Boz, B., Nudd., K. and Alpagut, B. (1996). Dietary Indications in the Dentitions from Çatal Höyük. 11. Arkeometri Sonuçları Toplantısı Kitabı, ss.141-150.
69. Molleson, T., Andrews, P. and Boz, B. (2005). Chapter 12, Reconstruction of the Neolithic People of Çatalhöyük. Hodder I (Ed.), In Inhabiting Çatalhöyük, Reports from the 1995-1999 Seasons (pp. 279-300). Ankara: Çatalhöyük Research Project Volume 4, McDonald Institute Monographs, British Institute of Archaeology at Ankara.
70. Nalbantoğlu. E, Türk, H. and Nalbantoğlu, C. (2000). 1996 Yılı Yortanlı Nekropolis Kazısı İskelet Popülasyonu Üzerinde Paleoantropolojik Çalışmalar. Türk Arkeoloji ve Etnografya Dergisi, 1, 27-36.
71. Özbek, M. (1984). Roma Açık Hava Tiyatrosu’ndan (İznik) Çıkarılan Bizans İskeletleri. H.Ü. Edebiyat Fakültesi Dergisi, 2(1), 81-89.
72. Özbek, M. (1988). Çayönü İnsanları ve Sağlık Sorunları. IV. Arkeometri Sonuçları Toplantısı Kitabı, ss. 121-152.
73. Özbek, M. (1992). Aşıklı Höyük Neolitik İnsanları. VII. Arkeometri
15Academic Studies in Social, Human and Administrative Sciences - II 15
Sonuçları Toplantısı Kitabı, ss. 145-160.74. Özbek, M. (1998). Musular Neolitik İnsanı. XIII. Arkeometri Sonuçları
Toplantısı Kitabı, ss. 161-173.75. Özbek, M. (2000). Öküzini İnsanlarının Antropolojik Analizi. 15.
Arkeometri Sonuçları Toplantısı Kitabı, ss. 127-144.76. Özbek, M. (2006). Skeletal Pathology of a High Ranking Official
from Thrace (last quarter of the 4th century). International Journal of Osteoarchaleology, 15(3), 216-225. doi: 10.1002/oa.777
77. Özbek, M. and Erdal, Y.S. (2000). Harekattepe Tümülüsü’nden Çıkarılan Kral İskeleti. 15. Arkeometri Sonuçları Toplantısı Kitabı, ss. 77-91.
78. Özer, İ. and Sağır, M. (2012). Eski Ahlat Şehri Kazısı İskeletlerinin Paleoantropolojik Analizi. 27. Arkeometri Sonuçları Toplantısı Kitabı, ss. 209-220.
79. Özer, İ., Sevim, A., Pehlevan, C., Arman, O., Gözlük, P. and Güleç, E. (1999). Karagündüz Kazısı’ndan Çıkarılan İskeletlerin Paleoantropolojik Analizi. 14. Arkeometri Sonuçları Toplantısı Kitabı, ss. 75-96.
80. Özer, İ., Sağır, M., Satar, Z. and Güleç, E. (2012). Gümüşlük (Milas) İskeletleri ve Anadolu Klasik-Helenistik Dönem Toplumlarının Sağlık Profili. DTCF Dergisi, 52 (1), 29-42.
81. Özer, İ., Sağır, M., Koca Özer, B., Karatufan, A. and Şahin, S. (2016). Havuzdere Ortaçağ İskeletlerinin PaleoAntropolojik Analizi. Ankara Üniversitesi Sosyal Bilimler Dergisi, 2, 47-57. doi: 10.1501/sbeder_0000000123
82. Pearson K. (1899). Mathematical Contrubition on The Theory of Evolution, On The Reconstruction of The Stature of Prehistoric Races. Philosophical Transactions of The Royal Society, 192, 169-244. doi: 10.1098/rsta.1899.0004
83. Roodenberg, J., Van Asi, A. and Alpaslan Roodenberg, S. (2008). Barcın Hüyük in the Plain of Yenişehir (2005-2006), A Preliminary Note on the Fieldwork, Pottery and Human Remains of the Prehistorik Levels. Anatolica, 34, 53-66. doi: 10.2143/ANA.34.0.2031564
84. Sağır, M. (2000). Uzun Kemik Radyografilerinden Boy Formülü Hesaplaması. Ankara Üniversitesi Sosyal Bilimler Enstitüsü, PhD Thesis.
85. Sağır, M., Özer, İ., Satar, Z. and Güleç, E. (2004). Börükçü İskeletlerinin Paleoantropolojik İncelenmesi. 19. Arkeometri Sonuçları Toplantısı Kitabı, ss. 27-40.
86. Sağır, M., Satar, Z., Özer, İ. and Güleç, E. (2011). Birecik Barajı İlk Tunç Çağı İskeletlerinin Paleoantropolojik Analizi. 26. Arkeometri Sonuçları Toplantısı Kitabı, ss. 257- 262.
87. Sağır, M., Özer, İ., Satar, Z. and Savaş Güleç, E. (2013). Stratonikeia
Ahmet İhsan AYTEK16
İskeletlerinin Paleoantropoloj,k Analizi. 28. Arkeometri Sonuçları Toplantısı Kitabı, ss. 59-68.
88. Satar, Z., Günay, I. and Güleç, E. (2009). Dede Mezarı İskeletlerinin Osteolojik Analizi. 24. Arkeometri Sonuçları Toplantısı Kitabı, ss. 299-306.
89. Sevim, A. (1996). Datça/Burgaz İskeletlerinin Paleoantropolojik Değerlendirilmesi. XI. Arkeometri Sonuçları Toplantısı Kitabı, ss. 1-18.
90. Sevim, A. (2006). Yüceören İskeletlerinin PaleoAntropolojik Açıdan Değerlendirilmesi. S. Y. Şenyurt, A. Akçay ve Y. Kamış (Ed.), In Yüceören Doğu Kilikya’da Bir Helenistik-Roma Nekropolü (pp. 243-280). Ankara: Bakü-Tiflis-Ceyhan Ham Petrol Boru Hattı Projesi Arkeolojik Kurtarma Kazıları Yayınları, 1, Gazi Üniversitesi Arkeolojik Çevre Değerleri Araştırma Merkezi.
91. Sevim, A., Yılmaz, H. and Açıkkol, A. (2004). Çavlum İskeletlerinin PaleoAntropolojik Analizi. I. Uluslararası Dünden Bugüne Eskişehir Sempozyumu (12-15 Mayıs 2013) Bildirileri, ss. 337-355.
92. Sevim, A, Günay, I. and Satar, Z. (2005). Mersin Kız Kalesi İskeletlerinin Paleoantropolojik Açıdan İncelenmesi. 20. Arkeometri Sonuçları Toplantısı Kitabı, ss. 67-78.
93. Sevim, A, Gözlük Kırmızıoğlu, P., Yiğit, A., Özdemir, S. and Durgunlu, Ö. (2007). Erzurum/Güllüdere İskeletlerinin Paleoantropolojik Açıdan İncelenmesi. 22. Arkeometri Sonuçları Toplantısı Kitabı, ss. 141-160.
94. Sevim, A., Yiğit, A., Gözlük Kırmızıoğlu, P., Durgunlu, Ö. and Özdemir S. (2007). Erzurum/Tetikom Demir Çağı İskeletlerinin Paleoantropolojik Açıdan Değerlendirilmesi. 22. Arkeometri Sonuçları Toplantısı Kitabı, ss. 177-192.
95. Sevim Erol, A., Yaşar, Z.F., Özdemir, S. and Yavuz, A.Y. (2011). Hasankeyf İnsanlarının Antropolojik Analizi. 26. Arkeometri Sonuçları Toplantıs Kitabı, ss. 201-218.
96. Steadman, S.R., McMahon, G., Ross, J.C., Cassis, M., Şerifoğlu, T.E., Arbuckle, B.S., Adcock, S.E., Alpaslan Roodenberg, S., von Baeyer, M. and Lauricella, A.J. (2015). The 2013 and 2014 Excavations Seasons at Çadır Höyük on the Anatolian North Central Plateau. Anatolica, 16, 87-123.
97. Surul, Ö., Erkman, A.C., Türktüzün, M., Alkan, Y., Sağır, S. and Şimşek, Ö. (2012). Çiledir Höyük ve Tokul Köyü Şapel Kazısı İskeletlerinin Paleoantropolojik Açıdan Değerlendirilmesi. 27. Arkeometri Sonuçları Toplantısı Kitabı, ss.179-190.
98. Şahin, S., Özbulut, Z., Özer, İ., Sağır,, M. and Güleç, E. (2015). Pınarkent Roma Dönemi İskeletlerinin PaleoAntropolojik Analizi. Ankara Üniversitesi Sosyal Bilimler Dergisi, 6(1), 57-70. doi: 10.1501/sbeder_0000000091
17Academic Studies in Social, Human and Administrative Sciences - II 17
99. Şenyürek, M.S. (1949). Truva Civarında Kumtepe’de Bulunmuş Olan İskeletlere Dair Bir Not. DTCF Dergisi, 7(2), 295-299.
100. Şenyürek, M.S. (1950). Büyük Güllücek’de Bulunan Kalkolitik Çağa Ait bir Muhabirin İskeletinin Tetkiki. DTCF Dergisi, 8(3), 269-310.
101. Şenyürek, M.S. (1952). A Study of the Human Skeletons from Kültepe, Excavated Under the Auspices of the Turkish Historical Society. Belleten, 16(63), 323-343.
102. Şenyürek, M.S. (1954). A Note on the Long Bones of Chalcolithic Age from Yümüktepe. Belleten, 18(72), 519- 522.
103. Şenyürek, M.S. (1955). A Note on the Long Bones of Chalcolithic Age from Şeyh Höyük. Belleten, 19(74), 247-270.
104. Şenyürek, M.S. (1958). Antalya Vilayetinde Öküzini’nde Bulunan Bir İnsan İskeletinin Tetkiki (10 resimle birlikte). Belleten, 22(88), 465-490.
105. Şenyürek, M.S. and Tunakan S. (1951). Şeyh Höyük İskeletleri. Belleten, 15(60), 431-438.
106. Trotter, M. and Gleser, G. (1951). The effect of aging on stature. American Journal of Physical Anthropology, 9(3),311-324. doi: 10.1002/ajpa.1330090307
107. Trotter, M. and Glesser, G. (1952). Estimation of stature from long bones of American Whites and Negroes. American Journal Physical Anthropology ,10, 463–514. doi: 10.1002/ajpa.1330100407
108. Tunakan, S. (1964). Bodrum-Dirmil Kazısı İskeletleri (7 resimle birlikte). Belleten, 28(111), 361-372.
109. Tunakan, S. (1965). Türk Tarih Kurumu Adına 1964 Yılında, Alaca-Höyük’te Yapılan Kazıda Çıkarılan İki Eski Bronz Çağı İskeletinin İncelenmesi (5 resimle birlikte). Belleten, 29(116), 571-584.
110. Üstündağ H. 2014. Human Remains from Kültepe-Kanesh, Preliminary Results of the Old Assyrian Burials from the 2005-2008 Excavations. Atıcı L, Barjamovic G, Fairbairn A, Kulaklıoğlu F (Ed.), In Current Research at Kultepe/Kanesh, An Interdisciplinary and Integrative Approach to Trade Networks, Internationalism and Identity (Journal of Cuneiform Studies Supplemental Series, Book 4) (pp. 157-176). Atlanta: Lockwood Press.
111. Üstündağ, H. and Demirel, F.A. (2008). Alanya Kalesi Kazılarında Bulunan İnsan İskelet Kalıntılarının Osteolojik Analizi. Türk Arkeoloji ve Etnografya Dergisi, 8,79-90.
112. Wittwer Backofen, U. (1986). Antropologische Untersuchungen Der Necropole İkiztepe/Samsun. 3 Araştırma Sonuçları Toplantısı Kitabı, ss. 421-428.
113. Wittwer Backofen, U. (1987). Anthropological Study of the Skeleton Material from Lidar. 5. Araştırma Sonuçları Toplantısı Kitabı, ss. 191-201.

Ahmet İhsan AYTEK18
114. Yaşar, Z.F., Demirel, F.A. and Çankaya, A. (2012). Burdur/Kızılin Mağarası İskeletlerinin Antropolojik Açıdan Değerlendirilmesi. Ç.Ü. Sosyal Bilimler Enstitüsü Dergisi, 21(2), 129-142.
115. Yılmaz, A. and Acar, E. (2018). Parion Antik Kenti Roma Hamamı Mezarları Ve İskeletlerin Osteoarkeolojik Değerlendirilmesi. Hitit Üniversitesi Sosyal Bilimler Enstitüsü Dergisi ANARSAN Sempozyumu Özel Sayısı, 11(2), 1403-1428. doi: 10.17218/hititsosbil.460349
116. Yılmaz, H., Çavuşoğlu, R., Baykara, İ. and Gökçe, B. (2009). Van Kalecik (Urartu) Toplumunun Paleoantropolojik Analizi 24. Arkeometri Sonuçları Toplantısı, ss. 29-48.
117. Yiğit, A., Gözlük, P., Erkman, A.C., Çırak, A. and Şimşek, N. (2005). Altıntepe Urartu İskeletlerinin PaleoAntropolojik Açıdan İncelenmesi. 20. Arkeometri Sonuçları Toplantısı Kitabı, ss. 79-90.
118. Yiğit, A., Gözlük Kırmızıoğlu, P., Durgunlu, Ö., Özdemir, S. and Sevim Erol, A. (2008). Kahramanmaraş/Minnetpınarı İskeletlerinin PaleoAntropolojik Açından Değerlendirilmesi. 23. Arkeometri Sonuçları Toplantısı Kitabı, ss. 91-110.
119. Yiğit, A., Gözlük Kırmızıoğlu, P. and Yavuz, A.Y. (2008). Nif (Olympos) Dağ Kazısı. 23. Arkeometri Sonuçları Toplantısı Kitabı, ss. 111-126.
120. Yiğit, A., Gözlük Kırmızıoğlu, P., İbiş, R. and Sevim Erol, A. (2011). Çankırı Salur Erken Tunç Dönemi İnsanları. 26. Arkeometri Sonuçları Toplantısı Kitabı, ss. 273-290.
121. Yiğit, A., Salihoğlu, Y.N., Gözlük Kırmızıoğlu, P., Yaşar, Z.F., Kesikçiler, B. and Sevim Erol, A. (2010). Trabzon Kızlar Manastırı İnsan İskeletlerinin Antropolojik Açıdan Değerlendirilmesi. 25. Arkeometri Sonuçları Toplantısı Kitabı, ss. 105-126.
122. www.turkstat.gov.tr, 03.01.2020
Chapter 2FINANCIAL AWARENESS IN QATARI
SOCIETY: A STUDY FROM THE PERSPECTIVE OF SOCIAL WORK
Bana Mohammed AL-GHANIM1
1 Teaching Assistant, Department of Social Sciences, College of Arts and Science - Qatar University, [email protected]

21Academic Studies in Social, Human and Administrative Sciences - II 21
IntroductionThe interest in financial knowledge, economics, and financial educa-
tion is one of the essential things that individuals must be familiar with to have a decent life. In the recent period, the lack of financial awareness, poor planning, income management, and ignorance of financial products has been widespread among some members of the society. That led to the emergence of irrational behaviors in consuming, purchasing, and invest-ing, which led to the deterioration of their economic situation. Hence, it caused them to take an advance or debt from other individuals or banks, which results in many social and economic problems that may lead to a deterioration in their mental health.
Awareness in this regard is defined as “the level of information avail-able to consumers about a particular commodity” (Federation of Arab Se-curities Authorities, 2018). It also identifies as a set of necessary knowledge and skills that enable informed decisions to be taken regarding financial matters. That is to say, the ability to select and understand appropriate op-tions related to financial affairs management, compliance with credit con-ditions, and familiarity with credit standing. (Emirates Banks Association)
Financial knowledge plays a fundamental role in the lives of individu-als, families, and the community in general. Knowledge of financial affairs and awareness in them contribute to building an economically coherent society, which leads to provide a decent life for its individuals and reach a level of social welfare. To reach this, international attention has increased to reach the level of financial inclusion that seeks to enable companies and individuals to access beneficial and affordable financial services and products that meet the needs of individuals in securing credit, savings, payments, and transactions and present them sustainably and responsibly (World Bank, 2019).
Nearly 60 countries have taken the initiative to develop national fi-nancial inclusion strategies, and some of them have put in place legislation to help organize the strategy creation process. About 122 global financial institutions have joined the Global Financial Inclusion Alliance, and about 47 developing countries have committed to promoting financial inclusion. In order to achieve financial inclusion, there are several things that must be developed, such as financial education, which is one of the main elements contributing to attain financial inclusion (Arab Monetary Fund, 2015).
Although the Arab countries have made significant progress in terms of financial education and financial inclusion initiatives thanks to the joint efforts between governments, non-profit organizations, central banks, and banks, however, Arabic countries are still lagging behind other regions. Statistics show that only 30% of the adult Arab world population has ap-
Bana Mohammed AL-GHANIM22
propriate financial knowledge. Statistics also indicate a gap between fe-males and males about financial awareness in the Arab countries, where males reached an average of 33.5% in financial knowledge compared to 27.7% among women (Federation of Arab Banks, 2017).
Many Arab studies did not address the issue of financial awareness previously. So, there are not many old statistics that can determine the extent of the problem in the Arabic region. That is prompted some Arabic researchers to do some research on this topic, where (Al-Sayegh, 2017) conducted a study entitled “Measuring Financial Awareness: A Study of a Sample of Iraqi and Arabic Universities.” Financial awareness is assessed by a measure of the curriculum in the Banking and Financial Sciences departments and the number of hours it has in ten Arab universities, and it’s revealed that there is a malfunction in the financial awareness of the sample members.
Social Work plays a significant role in solving problems resulting from the lack of financial awareness and developing the economic and financial capabilities of individuals. In this research, the Financial Social Work will be highlighted, as many books and studies, especially Arabic ones, did not cover it also, because it is considered as the best field for solving the problem of the absence of financial awareness among members of society, which will be covered in this research.
Since social workers regularly work with individuals who face finan-cial difficulties, they can build the financial capabilities of their clients well. There are indications that there is a growing interest in social work in ex-erting efforts, researching, and teaching about the issue of financial ability. The University of Maryland School of Social Work launched an Initiative in 2009 to offer a certified program in Financial Social Work, describing it as preparing a social worker to “enhance economic stability and financial well-being for individuals, families, and communities, with special atten-tion to the vulnerable population.” To enhance the financial capacity of low-income earners, the Commission for Sustainable Development has ad-opted a multidisciplinary approach. Since the committee’s inception, it has worked with psychologists, sociologists, anthropologists, and economists to conceptualize and implement asset policies. Social workers participated in this program in providing credit counseling services and financial edu-cation. Despite the large number of evidence indicating the participation of social workers in building and developing financial capacity, many of them lack the skills to enable them to do so. This is due to the few schools of social work that offer content related to personal finance. However, there are studies that prove the competence of social workers in building the financial capabilities of clients by employing social work methods for that. (Despard & Chowa, 2010)
23Academic Studies in Social, Human and Administrative Sciences - II 23
Components and basics of financial, social work
Financial Social Work is an approach like other approaches and theo-ries, as it is based on elements and foundations that help the social worker that adopting this approach in identifying the problem and determining ways to deal with it at all levels of professional intervention.
• Psychosocial aspects of money: Ideas, feelings, and attitudes to-ward money are essential, explaining how a person relates to his money often. Where his unconscious and conscious thoughts, his feelings and at-titudes toward money are reflected in all his financial decisions and on how to spend, save or not save. Most of the individual’s financial atti-tude is shaped in childhood through messages that come from role models. Insighting into why, when, where and how an individual’s feelings and thoughts have become rooted in their belief system, helping them to make financial choices that will enhance their financial future.
• The relationship with money: the individual’s relationship with their money is deferent from their financial circumstance, but there is a correlation effect between them. An unhealthy relationship with money leads to unhealthy financial circumstances.
• Financial Behavior: the relationship with money drives financial behavior and financial conditions. So, the knowledge of an individual’s relationship with money is important, and it reveals where and how he can start controlling his money and his life. Fear of financing, for example, avoids money management behavior that has negative consequences.
• Financial information and knowledge: One of the reasons why people struggle financially is the lack of financial information and knowl-edge. (Hassan, 2015)
This research paper addressed a descriptive study of financial aware-ness among a sample of 43 Qatari individuals who receive financial aid from Qatar Red Crescent. The study also sought to uncover the relation-ship between social media and the absence of financial awareness. Many studies have proven a relationship between social media and consumer behavior, which is an integral part of financial awareness. For instance, “The Impact of Social Media Ads on the Purchasing Behavior of Kuwaiti Consumers: An Empirical Study on Kuwaiti Society” (Muhammad, 2016). Also, a study entitled “The social media role in the consumption behavior of the family in the city of Riyadh” (Al-Enezi, 2017). A study entitled “Teenagers’ use of E-shopping pages on Facebook and its relationship to their purchasing behavior” by (Nasr, Badr Al-Din and Aqeeli, 2017). This study also sought to shed light on the role of social work in facing these problems.
Bana Mohammed AL-GHANIM24
Importance of this study
• The research deals with an important social and economic problem that affects the lives of some members of society, which is the absence of financial awareness.
• This study attempts to show the role of social work in contributing to reduce this problem.
• This research shows the importance of spreading financial aware-ness, especially among youths in society, in order to have a youth power capable of managing its matters rationally, which contributes to the com-munity’s advancement.
• This research deals with the issue of financial awareness, which is one of the problems that have not been dealt with much by social research-ers before, which gives it particular importance.
Study hypotheses
• There is a statistically significant relationship between the high standard of living and the absence of financial awareness.
• There is a statistically significant relationship between the use of social media and the absence of financial awareness.
• There is a statistically significant relationship between demo-graphic variables (gender, age, education, work, social status, number of family members) in the extent of financial awareness.
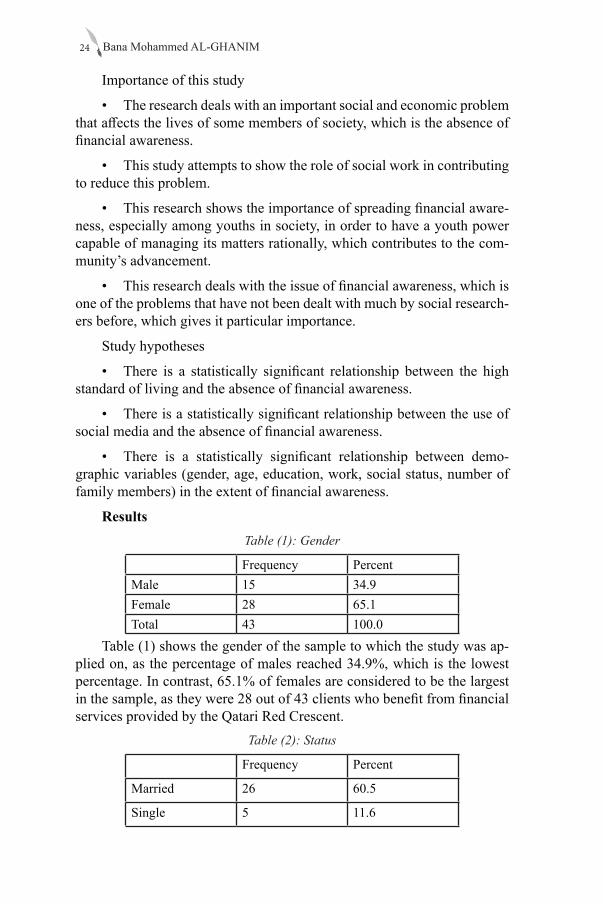
ResultsTable (1): Gender
Frequency PercentMale 15 34.9Female 28 65.1Total 43 100.0
Table (1) shows the gender of the sample to which the study was ap-plied on, as the percentage of males reached 34.9%, which is the lowest percentage. In contrast, 65.1% of females are considered to be the largest in the sample, as they were 28 out of 43 clients who benefit from financial services provided by the Qatari Red Crescent.
Table (2): Status
Frequency Percent
Married 26 60.5
Single 5 11.6
25Academic Studies in Social, Human and Administrative Sciences - II 25
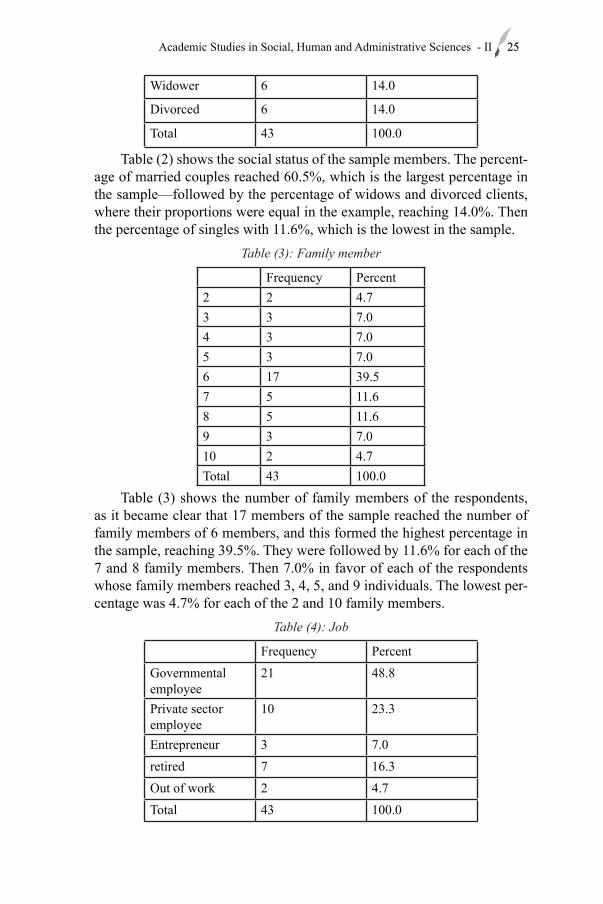
Widower 6 14.0
Divorced 6 14.0
Total 43 100.0
Table (2) shows the social status of the sample members. The percent-age of married couples reached 60.5%, which is the largest percentage in the sample—followed by the percentage of widows and divorced clients, where their proportions were equal in the example, reaching 14.0%. Then the percentage of singles with 11.6%, which is the lowest in the sample.
Table (3): Family member
Frequency Percent2 2 4.73 3 7.04 3 7.05 3 7.06 17 39.57 5 11.68 5 11.69 3 7.010 2 4.7Total 43 100.0
Table (3) shows the number of family members of the respondents, as it became clear that 17 members of the sample reached the number of family members of 6 members, and this formed the highest percentage in the sample, reaching 39.5%. They were followed by 11.6% for each of the 7 and 8 family members. Then 7.0% in favor of each of the respondents whose family members reached 3, 4, 5, and 9 individuals. The lowest per-centage was 4.7% for each of the 2 and 10 family members.
Table (4): Job
Frequency PercentGovernmental employee
21 48.8
Private sector employee
10 23.3
Entrepreneur 3 7.0retired 7 16.3Out of work 2 4.7Total 43 100.0
Bana Mohammed AL-GHANIM26
Table (4) shows the job status of the respondents, as it is clear that employees in the government sector are the largest percentage in the sam-ple, reaching 48.8%. They are followed by the proportion of employees in the private sector, where they amount to 23.3%, and by the proportion of retirees, who accounted for 16.3% of respondents. Then, the percentage of self-employed owners is 7.0%, and unemployed which constitute the lowest percentage of the sample, with a rate of 4.7%.
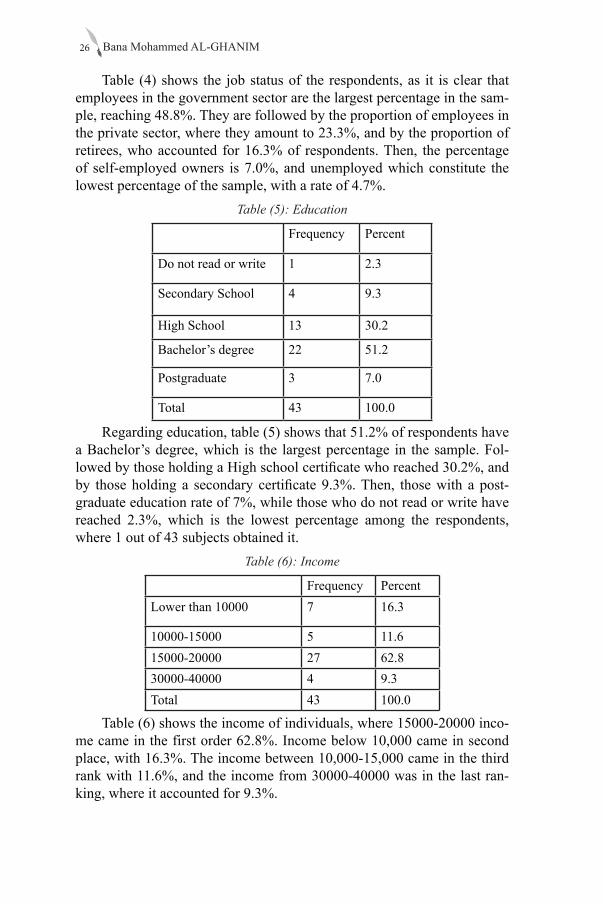
Table (5): Education
Frequency Percent
Do not read or write 1 2.3
Secondary School 4 9.3
High School 13 30.2
Bachelor’s degree 22 51.2
Postgraduate 3 7.0
Total 43 100.0
Regarding education, table (5) shows that 51.2% of respondents have a Bachelor’s degree, which is the largest percentage in the sample. Fol-lowed by those holding a High school certificate who reached 30.2%, and by those holding a secondary certificate 9.3%. Then, those with a post-graduate education rate of 7%, while those who do not read or write have reached 2.3%, which is the lowest percentage among the respondents, where 1 out of 43 subjects obtained it.
Table (6): Income
Frequency PercentLower than 10000 7 16.3
10000-15000 5 11.615000-20000 27 62.830000-40000 4 9.3Total 43 100.0
Table (6) shows the income of individuals, where 15000-20000 inco-me came in the first order 62.8%. Income below 10,000 came in second place, with 16.3%. The income between 10,000-15,000 came in the third rank with 11.6%, and the income from 30000-40000 was in the last ran-king, where it accounted for 9.3%.
27Academic Studies in Social, Human and Administrative Sciences - II 27
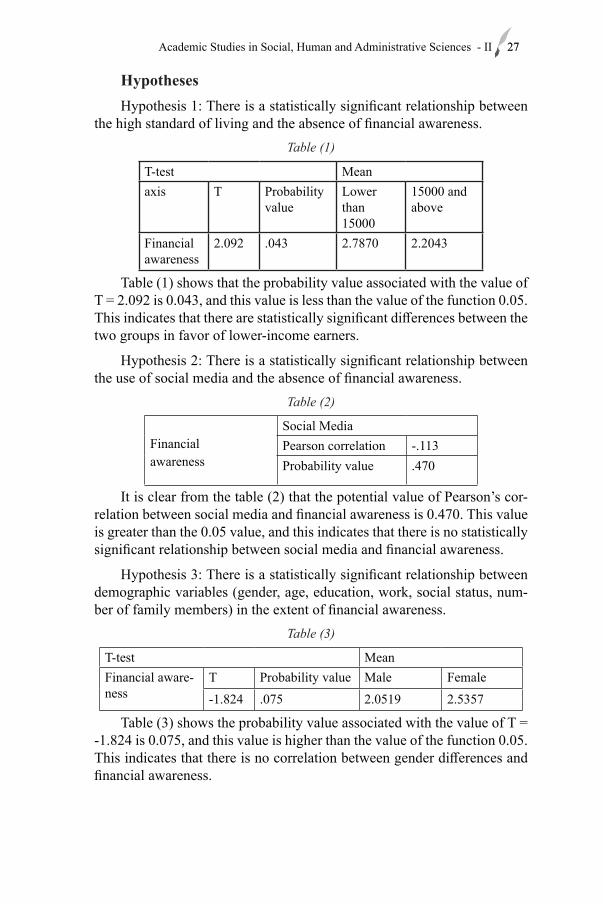
HypothesesHypothesis 1: There is a statistically significant relationship between
the high standard of living and the absence of financial awareness.Table (1)
T-test Meanaxis T Probability
valueLower than 15000
15000 and above
Financial awareness
2.092 .043 2.7870 2.2043
Table (1) shows that the probability value associated with the value of T = 2.092 is 0.043, and this value is less than the value of the function 0.05. This indicates that there are statistically significant differences between the two groups in favor of lower-income earners.
Hypothesis 2: There is a statistically significant relationship between the use of social media and the absence of financial awareness.
Table (2)
Financialawareness
Social MediaPearson correlation -.113Probability value .470
It is clear from the table (2) that the potential value of Pearson’s cor-relation between social media and financial awareness is 0.470. This value is greater than the 0.05 value, and this indicates that there is no statistically significant relationship between social media and financial awareness.
Hypothesis 3: There is a statistically significant relationship between demographic variables (gender, age, education, work, social status, num-ber of family members) in the extent of financial awareness.
Table (3)
T-test MeanFinancial aware-ness
T Probability value Male Female-1.824 .075 2.0519 2.5357
Table (3) shows the probability value associated with the value of T = -1.824 is 0.075, and this value is higher than the value of the function 0.05. This indicates that there is no correlation between gender differences and financial awareness.
Bana Mohammed AL-GHANIM28
Table (4)
Financial awareness
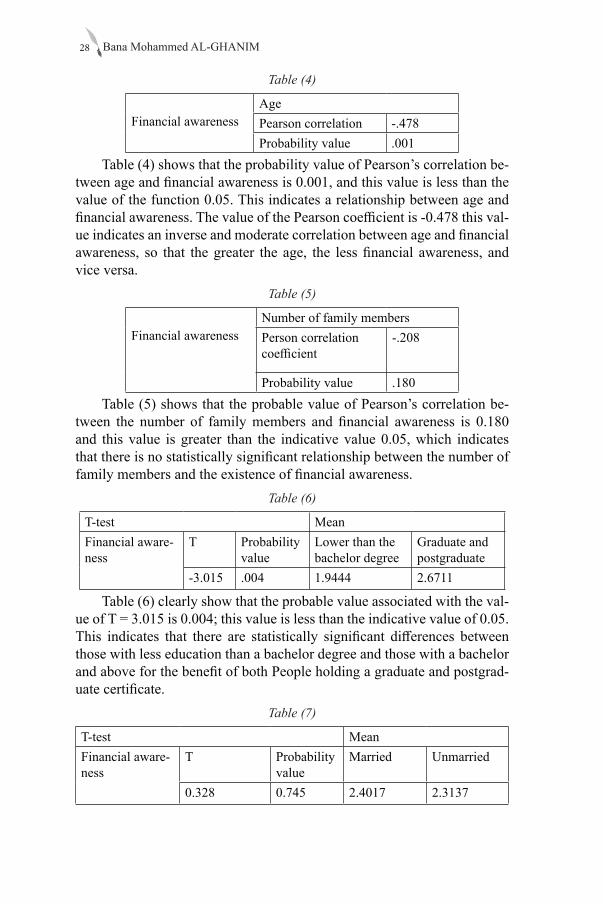
AgePearson correlation -.478Probability value .001
Table (4) shows that the probability value of Pearson’s correlation be-tween age and financial awareness is 0.001, and this value is less than the value of the function 0.05. This indicates a relationship between age and financial awareness. The value of the Pearson coefficient is -0.478 this val-ue indicates an inverse and moderate correlation between age and financial awareness, so that the greater the age, the less financial awareness, and vice versa.
Table (5)
Financial awareness Number of family membersPerson correlation coefficient
-.208
Probability value .180Table (5) shows that the probable value of Pearson’s correlation be-
tween the number of family members and financial awareness is 0.180 and this value is greater than the indicative value 0.05, which indicates that there is no statistically significant relationship between the number of family members and the existence of financial awareness.
Table (6)
T-test MeanFinancial aware-ness
T Probability value
Lower than the bachelor degree
Graduate and postgraduate
-3.015 .004 1.9444 2.6711
Table (6) clearly show that the probable value associated with the val-ue of T = 3.015 is 0.004; this value is less than the indicative value of 0.05. This indicates that there are statistically significant differences between those with less education than a bachelor degree and those with a bachelor and above for the benefit of both People holding a graduate and postgrad-uate certificate.
Table (7)
T-test MeanFinancial aware-ness
T Probability value
Married Unmarried
0.328 0.745 2.4017 2.3137
29Academic Studies in Social, Human and Administrative Sciences - II 29
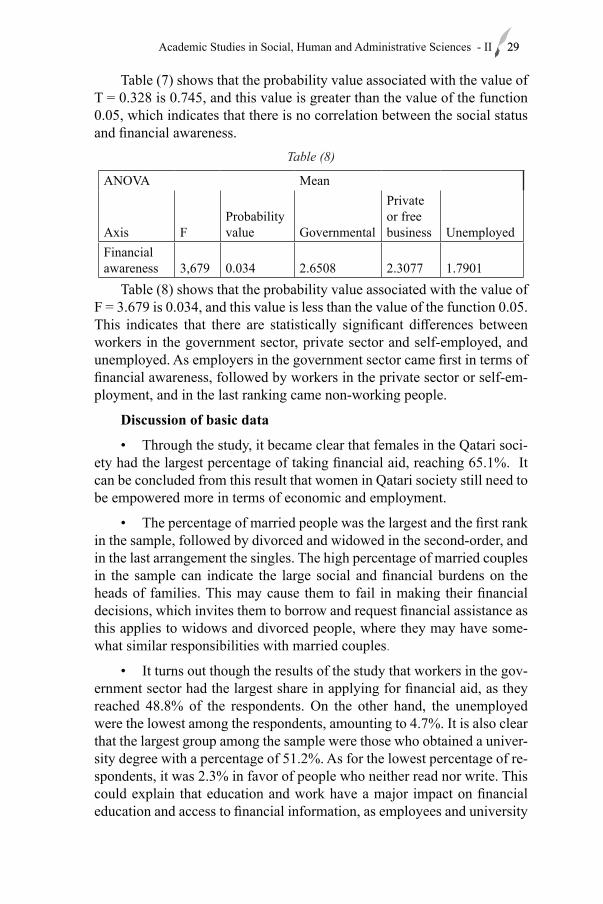
Table (7) shows that the probability value associated with the value of T = 0.328 is 0.745, and this value is greater than the value of the function 0.05, which indicates that there is no correlation between the social status and financial awareness.
Table (8)
ANOVA Mean
Axis FProbability value Governmental
Private or free business Unemployed
Financial awareness 3,679 0.034 2.6508 2.3077 1.7901
Table (8) shows that the probability value associated with the value of F = 3.679 is 0.034, and this value is less than the value of the function 0.05. This indicates that there are statistically significant differences between workers in the government sector, private sector and self-employed, and unemployed. As employers in the government sector came first in terms of financial awareness, followed by workers in the private sector or self-em-ployment, and in the last ranking came non-working people.
Discussion of basic data
• Through the study, it became clear that females in the Qatari soci-ety had the largest percentage of taking financial aid, reaching 65.1%. It can be concluded from this result that women in Qatari society still need to be empowered more in terms of economic and employment.
• The percentage of married people was the largest and the first rank in the sample, followed by divorced and widowed in the second-order, and in the last arrangement the singles. The high percentage of married couples in the sample can indicate the large social and financial burdens on the heads of families. This may cause them to fail in making their financial decisions, which invites them to borrow and request financial assistance as this applies to widows and divorced people, where they may have some-what similar responsibilities with married couples.
• It turns out though the results of the study that workers in the gov-ernment sector had the largest share in applying for financial aid, as they reached 48.8% of the respondents. On the other hand, the unemployed were the lowest among the respondents, amounting to 4.7%. It is also clear that the largest group among the sample were those who obtained a univer-sity degree with a percentage of 51.2%. As for the lowest percentage of re-spondents, it was 2.3% in favor of people who neither read nor write. This could explain that education and work have a major impact on financial education and access to financial information, as employees and university
Bana Mohammed AL-GHANIM30
students have access to services that can help in overcoming the financial crisis they are going through.
• By looking at the data collected from the sample, it became clear that most applicants for financial assistance are individuals who have an income ranging between 15000-20000 Qatari riyals at 62.8%, and this is often the salary of the employee with a university degree in the govern-ment sector. This could clarify that graduate students lack financial plan-ning, which considered as a character of financial awareness, where 83.7% of respondents stated that their salary is not sufficient for them and that 74.4% of them have debts.
Discussion of the hypotheses
Hypothesis 1: There is a statistically significant relationship between the high standard of living and the absence of financial awareness.
• It is clear from the analysis data that people with less than 15,000 income have a higher financial awareness than people with an income of more than 15,000 income. This contrasts with the results of the study of [Al-Qabbani (2014), Badir and Ragheb (2012), Yusri (2011), Al-Habashi (2011), and Ahmad (2009)] that concluded that the higher the level of in-come, the more planning, and management of personal income. It also dif-fered with the results of the study [Al-Dahyan (2014) and Rayhan (2009)], which resulted in no significant relationship between a high level of in-come, and planning and income management.
• This result can be explained by the fact that low income can gener-ate a feeling of economic or financial insecurity, which makes individuals more careful while making their financial decisions, and more aware of the importance of planning and managing personal expenses.
• This can also be explained in light of Behavioral Financial The-ory, where we can say that an increased sense of confidence about the financial future and the abundance of money for individuals can result in irrational behaviors about financial matters, Such as reckless disbursement or risking investing in projects that have not been proven useful due to the confidence that what was spent will be compensated in the coming month.
Hypothesis 2: There is a statistically significant relationship between the use of social media and the absence of financial awareness.
• It turns out though the results that there is no relationship that con-firms the impact of social media on financial awareness. This result contra-dicts the results of the study of [Muhammad (2016), Al-Enezi (2017), and Nasr (2017)], whose results demonstrated the impact of social media on consumer and purchasing behavior.
31Academic Studies in Social, Human and Administrative Sciences - II 31
This result can be attributed to the age of most of the sample and their lack of interest in following social media.
Hypothesis 3: There is a statistically significant relationship between demographic variables (gender, age, education, work, social status, num-ber of family members) in the extent of financial awareness.
• Through reviewing the results, it is clear that there are no statisti-cally significant differences between the difference in gender and the ex-tent of financial awareness.
• As it became clear, the difference in age has an effect on financial awareness, as the results showed that the younger the sample members, the greater their financial awareness. This result differs from the results of the study [Yusef and Farhat (2012), and Ahmad (2009)], which resulted that getting older had an effect in increasing planning and income man-agement. Also, a study by [Yusri (2011) and Rayhan (2009)] resulted in no statistically significant relationship between age, income management, and financial planning.
The explanation for this result can be due to the fact that as individuals age, they become more adherent to some habits and things they are accus-tomed to. That may lead to them not keeping pace with the developments in the financial markets of goods, services, and financial products that can contribute to improving their financial conditions.
• The results of the study showed that there is no statistically sig-nificant relationship between the number of family members and financial awareness, and this result is consistent with Rayhan’s (2009) study.
• The results of the study revealed that those with university edu-cation and postgraduate education have a higher level of financial aware-ness than others with a lower educational level than the university. This result was consistent with the results of the study [Al-Qabbani, Bakhit and Zidan (2014), Badir and Ragheb (2012), Youssef and Farhat (2012), and Al-Habashi (2011)].
This indicates that education and going through the university life experience has a major impact on expanding the perceptions of individu-als and develop their awareness. Also, their abilities to manage, plan and arrange their needs and priorities regarding their financial and economic matters.
• Concerning the social status of the sample members, the results of the study showed the absence of a statistically significant relationship between it and financial awareness.
• The results of the study revealed the presence of statistically signif-
Bana Mohammed AL-GHANIM32
icant differences between job status and financial awareness. As it became clear that workers in the government sector are more aware than workers in the private sector and entrepreneurs in financial matters, And workers in the private sector and entrepreneurship are more aware financially than the unemployed. This result was consistent with Badir and Ragheb’s (2012) study, whose results revealed that employers in the government sector have a higher level of income management planning than workers in the private sector. It also agreed with the result of the study of [Al-Qabbani, Bakhit, and Zaidan (2014)] that women employees are more capable than others of unemployed in managing financial income.
This result can be explained by saying that the effort of individuals and their fatigue during their work makes them more aware of financial mat-ters. This effort makes them more sense of the value of money and more aware that they would not obtain it without effort, which makes their in-vestment, consumption, and purchasing behavior more rational than others who did not experience the trouble of obtaining a living. It can be said that an individual’s pursuit of a job is one of the most important characteristics of financial awareness, as they are aware that work is one of the most im-portant financial products for individuals.
Interview result discussion
• The most common problem that brings clients to the Qatari Red Crescent is the debt problem, as this study shows that 74.4% of the sample stated that they have debts.
• 80% of financial service recipients are in their forties. This ex-plains the result of the second hypothesis.
• Most beneficiaries have a less than graduated level. This is the opposite of the results of this research. The reason for this can be due to the time when the study took place, as the study period was short and did not accurately reflect the diversity of clients.
• The clarity of the client’s problem, having family, and papers prov-ing his status is one of the most important conditions for obtaining finan-cial assistance services. This explains the Qatar Red Crescent’s keenness not to waste the rights of those in need to obtain assistance that ensures that they can have a decent life, and this is an essential part of its ethical commitment to clients and society.
• The Qatar Red Crescent offers two programs to develop financial awareness among beneficiaries, namely the ‘’Financial Awareness Ratio-nalization and Consumption Program’’, and the ‘’Housekeeping Program’’. This indicates that the institution seeks to develop its social workers to not
33Academic Studies in Social, Human and Administrative Sciences - II 33
only extend financial assistance but to solve this problem at all levels of treatment, preventive, and development as well.
• The Red Crescent Society has four social workers, and this num-ber is not enough.
• The Qatari Red Crescent does not have specific professional strat-egies and techniques to deal with the absence of financial awareness.
Conclusion
In conclusion, it is clear that there is a significant relationship between the high level of income and the absence of financial awareness, which in-dicates that financial awareness avoids individuals at all economic levels in falling into economic problems that call them to seek financial assistance. Despite the fact that many studies have revealed a relationship between the absence of awareness and social media, this study did not prove the valid-ity of this hypothesis. This may be due to the characteristics of the sample members. This study also showed that there is a relationship between some demographic variables of the sample such as age, education, and work in the absence of financial awareness.
Through the interview, it is clear that the role of social service in dealing with clients applying for financial aid is good but still needs to be developed, and it needs to develop clear strategies for dealing with and em-powering clients. It turns out that the problem of lack of financial aware-ness requires greater intervention by social workers and greater knowledge of what is the financial, social work to develop plans at all levels of treat-ment, preventive and development to reduce this problem, which in turn affects human dignity and limits access to the level of social welfare.
Last but not least, it is recommended that such a study be applied to a different sample from the one used in this study - those who benefit from financial aid services provided by the Qatar Red Crescent- such as youths, teenagers, and those with high incomes. It is also proposed to re-apply the study to a larger sample than the one used in this study in a period of more than two weeks. It is also proposed to provide the Social Work Program at Qatar University with a Financial Social Work course, or to add it to one of the courses of study as a General Practice with Individuals and Families course, which contributes to developing the capabilities of social workers to reduce this problem.
Bana Mohammed AL-GHANIM34
References1- Ahmed, Iman Shaban. (2009). “Family Resource Management for a
Working Wife at Menopause and its Relationship with Social Support”, Fourth Annual Arab International Conference - First International: Academic Accreditation for Specific Higher Education Institutions and Programs in Egypt and the Arab World - and the desired reality, Mansoura University, pp.1382, 1411.
2- Al Fayez, Shaza. (2018). “The Impact of Social Media on Adolescent Behavior.” The Arab Journal of Social Sciences (13), pp.1-24.
3- Al-Anzi, Modi. (2017). “The Role of Social Networks in the Consumption Behavior of the Family in the City of Riyadh.” Social Affairs (136), pp.145-193.
4- Al-Dahyan, Munira Saleh. (2014). “Managing Personal Expenses and its Relationship to Future Anxiety Among University Students”, Alexandria Journal of Scientific Exchange (4), pp.434-474.
5- Al-Habashi, Mayasa Muhammad Ahmed. (2011). “The Effect of Social and Economic Factors on Strategic Planning of Financial Income for Retirement Stage and its Relationship to Life Satisfaction”, Journal of Specific Education Research (22), pp.474-516.
6- Almunir, Randa Abdel-Alim. (2011). “The Role of Educational Games in Financial Education for Kindergarten Children”, Arab Studies in Education and Psychology (3), pp.231-278.
7- Al-Qabbani, Gilan and Bakhit, Fatima and others. (2014). “Family Resources Management for the Mother of the Autistic child, and its Relationship with Some Social and Economic Variables”, Journal of Specific Education Research (33), pp.778-798.
8- Alsaegh, Nameer. (2017). Measuring Financial Awareness: A Study of a sample from Iraqi and Arabic Universities. Tikrit Journal of Administrative and Economic Sciences (38), pp.375-389.
9- Arab Monetary Fund, Regional Task Force to Promote Financial Inclusion (2015). Requirements for adopting a comprehensive national strategy to enhance financial inclusion in Arab countries. Retrieved from https://www.amf.org.ae
10- Badir, Enas Maher Al-Husseini. (2012). “Strategic Planning for Family’s Financial Income and Its Reflection on the Wife’s Consumption Pattern in Light of the Repercussions of the Economic Crisis,” Journal of Science and Arts-Studies and Research (4), pp.251-275.
11- Bazile, Anthony. (2014). Making the Dough and Knowing How to Spend it: Students’ Understanding of Personal Finance. In BSU Honors Program Theses and Projects. Bridgewater, Massachusetts. Item 45. Available at https://vc.bridgew.edu/honors_proj/45/

35Academic Studies in Social, Human and Administrative Sciences - II 35
12- Bhushan, p. (2014). Relationship Between Financial Literacy and Investment Behavior of Salaried Individuals. Journal of Business Management & Social Sciences Research, 5. 82-87.
13- Burbn, Miriam & Leao, Luciana & Legovini, Arianna & others. (2013). The Empact of High School Financial Education. The World Bank Development Research Group. Retrieved from http://www.worldbank.org/en/research/dime/brief/Legovini-Financial-Literacy
14- Cambridge Dictionary. Retrieved from https://dictionary.cambridge.org/dictionary/english/social-media
15- Chowa, Gina & Despard, Mathieu. (2010). ‘’ Social Workers’ Interest in Building Individuals’ Financial Capabilities’’. Journal of Financial Therapy, pp.1, 22-41.
16- Dictionary of Meanings, Retrieved from www.almaany.com17- Hassan, Gaber. (2015). ‘’ Financial Social Work’’. Journal of Social
Work, pp.54, 489-513.18- Ibn Zayer, Mubarak and Abdel Wahab, bin Zayer. (2017). ‘’Behavioral
Finance Theory vs. Theory of Financial Market Efficiency’’. Al-Bashaer Economic Journal (8), pp.86-97.
19- Mahmoud, Yasser and Gerges, Jasim. (2017). Marketing Information Services Through Social Media: an Analytical Study of the Reality of Use in Public Libraries in the United Arab Emirates. International Journal of Library and Information Science (4), pp.110-140.
20- Muhammad, Imad. (2016). “The Impact of Social Media Ads on the Purchasing Behavior of the Kuwaiti Consumer: an applied study on Kuwaiti society.” The Journal of Social Sciences (4), pp.93-135.
21- Muhammad, Safaa Ahmed. (2016). “Using Dramatic Play Strategies to Develop Financial Awareness for a Kindergarten Child”, Studies in Curricula and Teaching Methods (211), pp.139-180.
22- Nasr, Mohamed and Badr El Din, Faten and Aqili Hoda. (2017). “Teenagers’ use of Facebook E-shopping Pages and its Relationship to their Purchasing Behavior.” Childhood Studies (75), pp.215-220.
23- Rashwan, Bahjat. (2017). Introduction to Individual Social Work. Amman, Jordan: Al Masirah House for Publishing, Distribution and Printing.
24- Rayhan, Al-Husseini Rajab Bilal. (2009). “The Family Style in Managing Financial Income and its Relationship with Some Variables”, The First Annual Scientific Conference - The Fourth Arab - The First International: Academic Accreditation for Specific Higher Education Institutions and Programs in Egypt and the Arab World - Real and Expected, Mansoura University, pp.2472-2493.
25- Seddiki, Safia and Souici, Houari and Zergoune, Mohamad. (2015). “Building Financil Portfolio Within Behavioral finance: An application to the companies listed in CAC40 of Paris stock exchange for the
Bana Mohammed AL-GHANIM36
period of 2007-2010 “. Journal of Economic Insights (8), pp.69-88.26- Sotkin, Joan. (2006). Build your Money Muscles. Translated by Mazen
Alaatar. Ksa, Alriyadh. Obeikan Publisher.27- The World Bank (2019). Financial Inclusion is a key Factor in
Reducing Poverty and Promoting Prosperity. Retrieved from https://www.albankaldawli.org/ar/topic/financialinclusion/overview#1
28- UAE Banks Federation. Financial Awareness for Small and Medium Enterprises. Retrieved from https://uaebf.ae/Arabic/UBF_SMEs-report_AR_f1_DIGITAL.pdf
29- Union of Arab Banks (2017). Financial literacy in the Arab world: a prerequisite for achieving financial inclusion. Retrieved from http://www.uabonline.org/en/research/finacial/ 15751604157916021575160115771575160416051575160416/47718/0
30- Union of Arab Securities Authorities (2018). Dictionary of Financial Terms Most Commonly Used in Financial Markets. Retrieved from https://www.qfma.org.qa/Arabic/Pages/default.aspx
31- Wiktionary. Retrieved from https://en.wiktionary.org/wiki/social_media
32- Yousry, Afnan Muhammad. (2011). “The Role of the Family in Choosing Children’s Games and its Relationship to Financial Income Management”, Journal of Specific Education Research (21), pp.267-291.
33- Youssef, Hanan and Farhat, Sherine. (2012). “The Role of the Housewife in Managing Financial Income and its Relationship to Marital Harmony,” the Fourth Annual Scientific Conference: Knowledge Management and Intellectual Capital Management in Higher Education Institutions in Egypt and the Arab World, Mansoura University, pp.1675-1692.
34- Zaher, Fatima. (2018). “Media and Communication and their Impact on Social Behavior of Children.” Arab Journal of Media and Culture (1), pp.30-56.

Chapter 3THE INTEGRATION OF ERP AND
BLOCKCHAIN:DIFFERENCES BETWEEN E-LEDGER AND
DISTRIBUTED LEDGER
Betül Şeyma ALKAN1
1 Asst. Prof. Dr., İzmir Bakırçay University, Faculty of Economics and Administrative Scien-ces, Department of Business Administration, [email protected]

39Academic Studies in Social, Human and Administrative Sciences - II 39
1.INTRODUCTIONIn today’s business world, organizations are continuously in search of
new ways to optimize their business processes and improve their financial indicators in terms of information technologies. The effectiveness of an organization is associated with the objective and timely financial infor-mation provided by the accounting system whose main goal is to collect, record and report information about the transactions or events that have an economic effect on the organization (Kundeliene, 2011, p.66). Accord-ingly, accounting information system is important in terms of providing reliable, relevant and useful information to the organization. Accounting information systems aim at transmitting the useful information to internal and external stakeholders during the process of collecting, reporting and analyzing the financial data of organizations.
Phillips (2012), divides the development of information production into three separate categories in terms of accounting software. During the 90s, with the use of the first accounting software programs, only basic accounting transactions were supported. In the 2000s, the concepts of “in-tegration” and “SaaS” (Software as a Service) gained currency. In this way, in addition to the programs that support complex accounting applications, simultaneous access to files and programs was became possible. The 2010s is the period of real-time accounting, financial dashboards and other mo-bile applications that supported financial reporting.
Today, access to simultaneous data sharing is enabled through the plat-forms provided by the cloud technology. Since the data are managed by a dedicated third party via virtual platforms in cloud technology, its cost to organizations is significantly lower. Since the platform allows for multi-threading, it splits fixed infrastructure costs among organizations.
Traditional accounting practices focus on bookkeeping and financial reporting, and prepare and present financial statements as a final goal. To achieve this objective, simple systems were used to support reporting. In these systems, collection of documents, processing of data, consolidation and final reporting operations were carried out. The audit of the related transactions was also carried out through manual controls or reconcilia-tions. This was because the system did not have an infrastructure to com-municate with automatic interfaces. With the emergence of ERP systems defined as software packages, it has become possible to provide informa-tion from all functional areas in organizations through a single database that allows full integration of information flow. It is possible to access to all functional areas in organizations through a single database, unified in-terface and communication channel.
ERP systems have started to be used widely in organizations with
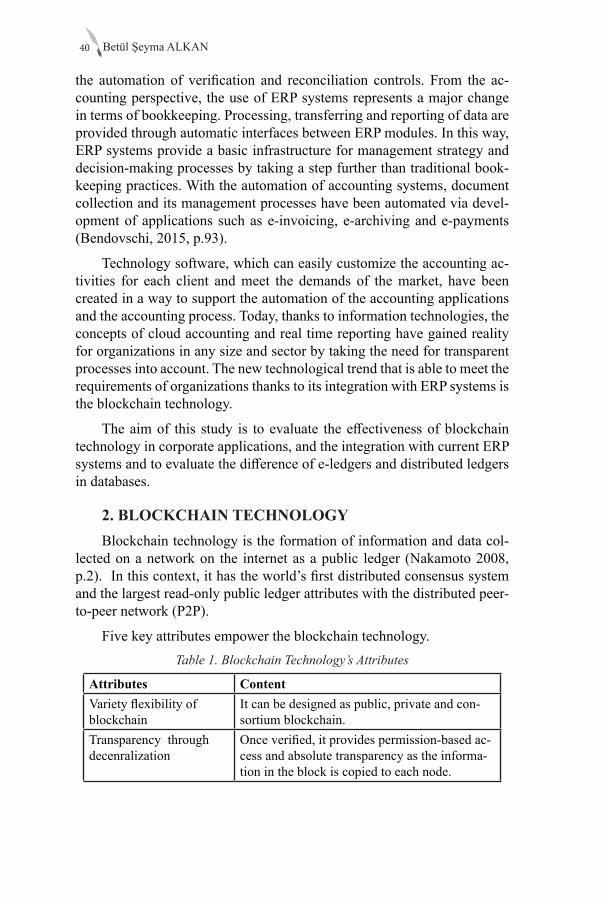
Betül Şeyma ALKAN40
the automation of verification and reconciliation controls. From the ac-counting perspective, the use of ERP systems represents a major change in terms of bookkeeping. Processing, transferring and reporting of data are provided through automatic interfaces between ERP modules. In this way, ERP systems provide a basic infrastructure for management strategy and decision-making processes by taking a step further than traditional book-keeping practices. With the automation of accounting systems, document collection and its management processes have been automated via devel-opment of applications such as e-invoicing, e-archiving and e-payments (Bendovschi, 2015, p.93).
Technology software, which can easily customize the accounting ac-tivities for each client and meet the demands of the market, have been created in a way to support the automation of the accounting applications and the accounting process. Today, thanks to information technologies, the concepts of cloud accounting and real time reporting have gained reality for organizations in any size and sector by taking the need for transparent processes into account. The new technological trend that is able to meet the requirements of organizations thanks to its integration with ERP systems is the blockchain technology.
The aim of this study is to evaluate the effectiveness of blockchain technology in corporate applications, and the integration with current ERP systems and to evaluate the difference of e-ledgers and distributed ledgers in databases.
2. BLOCKCHAIN TECHNOLOGYBlockchain technology is the formation of information and data col-
lected on a network on the internet as a public ledger (Nakamoto 2008, p.2). In this context, it has the world’s first distributed consensus system and the largest read-only public ledger attributes with the distributed peer-to-peer network (P2P).
Five key attributes empower the blockchain technology.Table 1. Blockchain Technology’s Attributes
Attributes ContentVariety flexibility of blockchain
It can be designed as public, private and con-sortium blockchain.
Transparency through decenralization
Once verified, it provides permission-based ac-cess and absolute transparency as the informa-tion in the block is copied to each node.
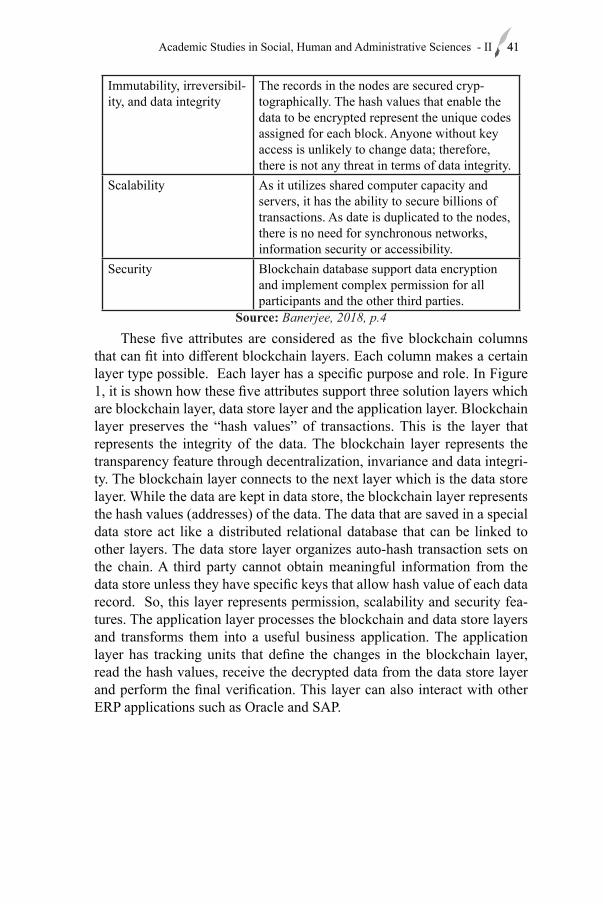
41Academic Studies in Social, Human and Administrative Sciences - II 41
Immutability, irreversibil-ity, and data integrity
The records in the nodes are secured cryp-tographically. The hash values that enable the data to be encrypted represent the unique codes assigned for each block. Anyone without key access is unlikely to change data; therefore, there is not any threat in terms of data integrity.
Scalability As it utilizes shared computer capacity and servers, it has the ability to secure billions of transactions. As date is duplicated to the nodes, there is no need for synchronous networks, information security or accessibility.
Security Blockchain database support data encryption and implement complex permission for all participants and the other third parties.
Source: Banerjee, 2018, p.4These five attributes are considered as the five blockchain columns
that can fit into different blockchain layers. Each column makes a certain layer type possible. Each layer has a specific purpose and role. In Figure 1, it is shown how these five attributes support three solution layers which are blockchain layer, data store layer and the application layer. Blockchain layer preserves the “hash values” of transactions. This is the layer that represents the integrity of the data. The blockchain layer represents the transparency feature through decentralization, invariance and data integri-ty. The blockchain layer connects to the next layer which is the data store layer. While the data are kept in data store, the blockchain layer represents the hash values (addresses) of the data. The data that are saved in a special data store act like a distributed relational database that can be linked to other layers. The data store layer organizes auto-hash transaction sets on the chain. A third party cannot obtain meaningful information from the data store unless they have specific keys that allow hash value of each data record. So, this layer represents permission, scalability and security fea-tures. The application layer processes the blockchain and data store layers and transforms them into a useful business application. The application layer has tracking units that define the changes in the blockchain layer, read the hash values, receive the decrypted data from the data store layer and perform the final verification. This layer can also interact with other ERP applications such as Oracle and SAP.
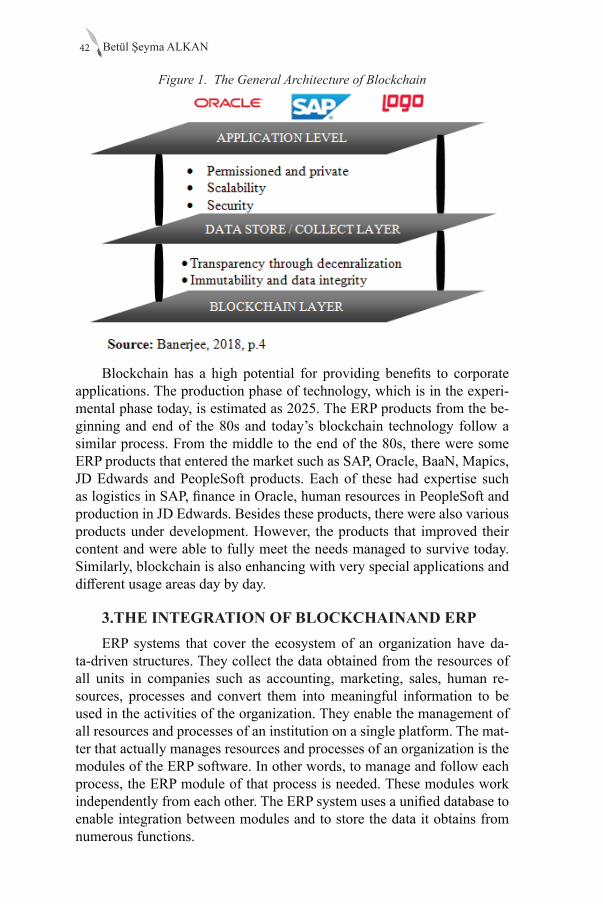
Betül Şeyma ALKAN42
Figure 1. The General Architecture of Blockchain
Blockchain has a high potential for providing benefits to corporate applications. The production phase of technology, which is in the experi-mental phase today, is estimated as 2025. The ERP products from the be-ginning and end of the 80s and today’s blockchain technology follow a similar process. From the middle to the end of the 80s, there were some ERP products that entered the market such as SAP, Oracle, BaaN, Mapics, JD Edwards and PeopleSoft products. Each of these had expertise such as logistics in SAP, finance in Oracle, human resources in PeopleSoft and production in JD Edwards. Besides these products, there were also various products under development. However, the products that improved their content and were able to fully meet the needs managed to survive today. Similarly, blockchain is also enhancing with very special applications and different usage areas day by day.
3.THE INTEGRATION OF BLOCKCHAINAND ERP ERP systems that cover the ecosystem of an organization have da-
ta-driven structures. They collect the data obtained from the resources of all units in companies such as accounting, marketing, sales, human re-sources, processes and convert them into meaningful information to be used in the activities of the organization. They enable the management of all resources and processes of an institution on a single platform. The mat-ter that actually manages resources and processes of an organization is the modules of the ERP software. In other words, to manage and follow each process, the ERP module of that process is needed. These modules work independently from each other. The ERP system uses a unified database to enable integration between modules and to store the data it obtains from numerous functions.
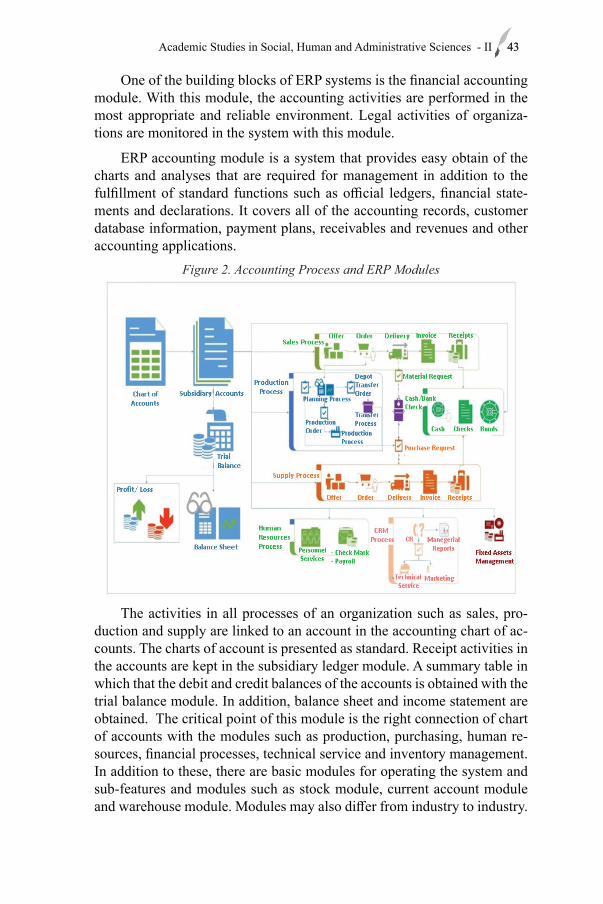
43Academic Studies in Social, Human and Administrative Sciences - II 43
One of the building blocks of ERP systems is the financial accounting module. With this module, the accounting activities are performed in the most appropriate and reliable environment. Legal activities of organiza-tions are monitored in the system with this module.
ERP accounting module is a system that provides easy obtain of the charts and analyses that are required for management in addition to the fulfillment of standard functions such as official ledgers, financial state-ments and declarations. It covers all of the accounting records, customer database information, payment plans, receivables and revenues and other accounting applications.
Figure 2. Accounting Process and ERP Modules
The activities in all processes of an organization such as sales, pro-duction and supply are linked to an account in the accounting chart of ac-counts. The charts of account is presented as standard. Receipt activities in the accounts are kept in the subsidiary ledger module. A summary table in which that the debit and credit balances of the accounts is obtained with the trial balance module. In addition, balance sheet and income statement are obtained. The critical point of this module is the right connection of chart of accounts with the modules such as production, purchasing, human re-sources, financial processes, technical service and inventory management. In addition to these, there are basic modules for operating the system and sub-features and modules such as stock module, current account module and warehouse module. Modules may also differ from industry to industry.
Betül Şeyma ALKAN44
ERP systems, which host many modules, still have limitations that can be solved with the help of blockchain (Agrawal, 2019, p.6). However, this does not mean that blockchain will replace ERP software. Blockchain is an additive technology that can work with ERP to strengthen the peer to peer operation and the follow-up of all processes. There is a need for an open, standard and interoperable system in which blockchain and ERP systems can be integrated and connected with each other. In this context, it is highly important that the chain is connected with various business application systems such as Enterprise Resource Planning (ERP), Cus-tomer Celationship Management (CRM), Warehouse Management System (WMS) and Manufacturing Execution Systems (MES). These systems in-tegrate with blockchain when building, tracking, purchasing and shipping products. They provide a copy of these information into the network which is immutable and indelible and can be tracked and used as a proof for any purpose at any time (Banerjee, 2018, p.6).
The integration of ERP systems with blockchain can help organiza-tions to standardize the data and create transparent consortium with better security and authentication procedures. In particular, this integration will make financial transactions transparent and reliable. Integration with ERP, WMS and MES systems will also reduce disputes related with invoices, shipments, returns and purchases. The origins of the products, departure points and locations can be monitored transparently.
The advantage of integrating ERP with blockchain has two sides. The first one is that it brings transparency, while the second one is that it significantly reduces the cost of monitoring and reporting considering the multi-staged supply chains. It can also automate the business processes of the parties in different geographies, categories and business lines through smart contracts. In addition, there will be a single center data store of terms and conditions accessible by all business partners. Therefore, blockchain can function as an additional layer between trading partners and their ERPs. Even if the data is continuously transmitted to the blockchain digi-tal ledger, the ERP system continues to be used. The blockchain layer will increase the trust and the agility in the transaction and minimize disputes.
4. THE DIFFERENCES BETWEEN OF E-LEDGER AND DISTRIBUTED LEDGER
4.1. E-LEDGER
The e-ledger application is a system that allows the journals and gen-eral ledgers, which have to be kept by organizations legally, to be stored on the digital platform and declared with digital signatures defined to them. The ‘Summary Declaration’ file contains the original signature data of the
45Academic Studies in Social, Human and Administrative Sciences - II 45
e-ledger and a summary of the main account items for financial reporting.
With the time stamp, all transaction flows are verified by the electronic signature or financial seal in order to determine the time when the data are produced, changed, sent, received or recorded (Özer, 2015, p.65). The pur-pose of the digital stamp as the security mechanism is to verify the faithful and true of a digital document signed by the company. It also maintains the integrity of the stamped data. Summary declaration files are created and signed for stamped data. The checked files are transferred to the legal authority via the web service. Thus, the approved and signed summary declarations are stored in the database.
It is possible to record and report according to different accounting principles with e-ledger integrated into the financial accounting module of ERP systems. The accounting records that are kept electronically, are converted into files using an international standard called XBRL (eXten-sible Business Reporting Language), signed and submitted electronically. In other words, XBRL constitutes the technological infrastructure of e-led-gers (Acar and Öksüz, 2013, p.85).
XBRL, which is the business reporting language, is essentially a way of expressing an information for users. In this context, the ledgers are prepared on the basis of XBRL by updating the ERP systems according to e-ledger format. Accordingly, the e-ledger application, which is also called on-line accounting record system, provides the advantage of accelerating the financial reporting processes and saving on time.
The most important function in ensuring the reliability of e-ledger in-formation belongs to accounting or ERP software. This function can be provided by the software having some features such as preventing unau-thorized access, providing data to the user in a short time and storing of the changes made in the records with a certain history.
With e-ledger applications, all transaction history can be monitored, and deletions of records are prevented. Thus, it reduces the field of mo-tion in order to prevent informality. In this context, it provides a transpar-ent, fast, effective and reliable communication network between govern-ment-business (G2B: Government to Business).
Besides the advantages of e-ledger application to users, there are also disadvantages. First of all, within the scope of e-ledger application, only journals and general ledgers are kept electronically. In addition, the appli-cation is necessary only for organizations of certain size. Also the security concerns and tax privacy violations are important details for the ledgers kept electronically (Gökçen and Özdemir, 2016, p.151).
Another problem with the e-ledger application is that file sizes are
Betül Şeyma ALKAN46
very large; therefore, it is difficult to process these ledgers. For example, in Turkey, it is requested to exceed the 200MB size of the ledgers in XBRL format. Accordingly, the ledgers are supposed to be split, and the parts should be named respectively. The other problem at this stage is that the length of free text fields varies on company basis, although the ledger areas are fixed. The segmented ledgers have to contain period information. The opening date of the second ledger that follow each other must be the same or one day later as the closing date of the first ledger. Various software are developed to overcome these problems.
In ERP systems where e-ledger applications are integrated, only trans-action owners have the access right to the information. However, block-chain technology offers a system infrastructure that collects the transaction processes that different parties follow on different platforms in a common and distributed ledger. Cryptographic transaction tracking is provided on this distributed database which contains a transparent structure for the buy-er and seller.
Blockchain is a distributed ledger technology (DLT). It is a multilat-eral system where participants agree on shared data and their validity in a distributed network without a central coordinator. It is defined as an um-brella term to identify multilateral systems operating in an environment without a central operator or an authority. In other words, blockchain tech-nology is a custom type of DLT that uses cryptographic techniques to save and synchronize data.
The effective implementation of blockchain in the accounting ecosys-tem has the potential to improve the quality of the information included in the financial reporting process (McComb and Smalt, 2018, p.2). It allows transactions to be published in a distributed ledger on a network, rather than keeping information in a central authority.
This technology solves two important problems in the accounting eco-system. Firstly, it improves the accuracy of the information by verifying and checking the entries via multiple parties. Secondly, the entries provide audit evidence that can be used as a part of an approval contract.
4.2. DISTRIBUTED LEDGER
A distributed ledger is defined as a verifiable, auditable and search-able blockchain accounting system, where organizations publish all their business transactions and make them accessible to regulatory authorities, managers and stakeholders (Potekhina and Riumkin, 2017, p.13). In this context, a distributed ledger is a distributed database that allows data shar-ing of different communication networks and different institutions and or-ganizations in different geographies. Any data that can be digitized can be
47Academic Studies in Social, Human and Administrative Sciences - II 47
saved in a distributed ledger (Hancock and Vaizey, 2016, p.5). A consensus mechanism is required for peer-to-peer network in the distributed ledger and for sending and receiving data between participants involved on this network (Scardovi, 2016, p.36). If the consensus mechanism allows, all participants of the peer-to-peer network can have a duplicate copy of the database. The changes in the data stored in the distributed ledger are up-dated by transmitting them to all peers within a few minutes (Hancock and Vaizey, 2016, p.5).
One of the key attributes in the distributed ledger technology ecosys-tem is the decentralization. DLT system can have various degrees of decen-tralization on each of its layers. In DLT systems that are open to the public and do not require permission, a single party cannot close the system, ma-nipulate the ledgers or perform censorship operations. This situation also increases the flexibility. It ensures that the system is always alive all the time regardless of the loss of network participants.
Today, existing data management systems consist of software and hardware components that require large IT investments in a central struc-ture. Network and communication systems are also included in this struc-ture to enable the transmission and sharing of the data. However, this sys-tem has a significant weakness: The system may become inoperable as a result of cyber attacks or hardware failures due to the storage of data at one point. However, the blockchain is inherently difficult to be affected by cyber attacks; because the data are not stored at one point and the database has large number of identical copies shared from multiple points. The re-liability and security of the blockchain are also the result of its distributed structure. Databases are connected to each other through a peer-to-peer network. When a new data reaches one of the peers through this network, all databases are updated. In order for an attack to be successful on block-chain, the access of all databases must be blocked simultaneously. There-fore, the increase in the number of peers in the blockchain network makes the blockchain network more reliable (Doğan and Ertugay, 2019, p.1657).
In the traditional system, the parties of commercial transactions record the transactions in their own ledgers by using the double-entry accounting system. The distributed ledger structure which verifies the records in the accounting system based on blockchain technology participates in the reg-istration process as a third party. In this way, instead of keeping separate accounting records in each organization, a registration system is created with the participation and approval of all parties, which allows the record of transactions directly in a common ledger without any doubt about the accuracy and completeness of the data. For this reason, this recording sys-tem is called “triple-entry accounting system” by some researchers (Po-tekhina and Riumkin, 2017, p.13). As the records are cryptographically

Betül Şeyma ALKAN48
signed and distributed to the all peers, it becomes almost impossible to hide transactions, falsify or destroy records.
The double-entry accounting system is expanded with a third block-chain layer embedded in it. Debit/credit accounts in the double-entry ac-counting system are recorded as cryptographic transfers in this third ledger. In that, each blockchain account is connected to its corresponding double entry account in an ERP system, including an interlocking recording sys-tem. The third blockchain layer is more like a third internal ledger built on a “decentralized” blockchain database rather than the traditional “cen-tral” ERP database. Blockchain framework does not recommend replacing of the ERP system; instead, they suggest adding an additional blockchain based system over the ERP system (Dai and Vasarhelyi, 2017, p.7).
“Instead of keeping separate records based on transaction receipts, companies can write their transactions directly into a joint register, cre-ating an interlocking system of enduring accounting records” (Deloitte, 2016, p.3).
A purchasing transaction for the triple entry accounting system is shown in Figure 3.
Figure 3. Purchasing Transaction in Triple Entry System
Source: McComb and Smalt, 2018, p.6
A private blockchain can be created for A&B companies to keep a joint ledger to verify and record Accounts Receivable for Company A and Accounts Payable for Company B. Upon approval of a sales transaction according to the identified accounting principles, the “smart contract” attri-
49Academic Studies in Social, Human and Administrative Sciences - II 49
butes initiates the recording of daily entries to reflect the transaction’s im-pact on the financial statement. Through smart contracts, the system moves by itself according to pre-determined conditions, it performs the process of sending information, recording information and executing transactions automatically (Potekhina and Riumkin, 2017, p. 20). In this regard, there will be no need to audit and reconcile with others such as banks and the counterparty of this transaction, if all transactions are recorded in such a third public ledger.
5. CONCLUSION AND DISCUSSIONBlockchain is a chronological database that runs on a distributed net-
work of multiple nodes or computers that track data transactions. Infor-mation about a certain number of transactions are organized and encrypted into ‘blocks’. Each new block is confirmed when it reaches a consensus over their nodes or computers network. Blockchain technology is a unique combination of technologies such as peer-to-peer networks, cryptographic techniques, reconciliation protocols and distributed data storages. Block-chain is a technology that securely enables the independent circulation of digital data between parties in a decentralized way, without a third party or intermediaries. In this context, the blockchain technology offers a solution to cope with errors and frauds so that the only recorder of commercial transactions are not companies. As a third party, simultaneous and cryp-tographically secure entries of transactions in the blockchain is provided.
The accounting systems on the basis of blockchain technology with the distributed ledger attribute will not be in substitution for ERP, but it will be a complementary function by moving to the blockchain database via an integrated operation. Integration of the blockchain technology into ERP systems will create a highly secured collaboration platform where the recording system can be shared freely with trusted parties. Thus, the integration of the blockchain and ERP will provide a non-labor-intensive system with the accessibility to decentralized and distributed data. This system will prevent unauthorized data changes. In this context, control mechanisms will be structured through smart contracts, and this will en-sure the protection of company data against cyber attacks.
A standard in XML format is based on e-ledger applications that are integrated into ERP systems. Although the potential importance and the use areas of blockchain technology are addressed in the literature, there are also opposing view. Blockchain technology is compared to XML tech-nology. At the annual technology roundtable meeting of the Journal of Ac-countancy, J. Carlton Collins compared the potential impact of blockchain technology on the accounting profession to the application of XML tech-nology that developed several years ago. Drew (2017) stated that XML
Betül Şeyma ALKAN50
technology was used much less than promised that it was a technology that could transform accounting.
However, it is clear that the blockchain technology will become an inseparable part of the information technology ecosystem. It has an inte-grated solution feature with the combination of many different approaches such as guarantee of its invariance through serial signatures cryptograph-ically and the need of verification tools to control data invariance. Thus, a real transparency will be provided, and a quick dataflow will be realized between regulatory institutions, accountants and auditors.
Although a full-scale adoption and implementation of the use areas of blockchain technology has not been realized yet, it will certainly be con-sidered for organizations which try to improve the timeliness, quality and accuracy of their accounting information.
REFERENCESAcar, V. and Öksüz, Ö. (2013), Finansal Bilgilerin Elektronik Ortamda
Paylaşımı ve E-Defter Uygulamaları (Financial Information Sharing Electronically and Elektronic Ledger Applications) Journal of Academic Researches and Studies, 5(8), 62-89.
Agrawal, A. (2019). Blockchain and Erp: Impact On Supply Chain, International Journal of Research in Applied Management, Science
and Technology, 4(2). Banerjee, A. (2018). Integrating Blockchain With ERP for a Transparent
Supply Chain, External Document - Infosys Limited, Retrieved from https://www.infosys.com/oracle/whitepapers/documents/integrating-blockchain-erp.pdf
Banerjee, A. (2018). Blockchain Technology: Supply Chain Insights from ERP, Advances in Computer, Elsevier. Doi: 10.1016/bs.adcom.2018.03.007
Bendovschi, A. C. ( 2015). The Evolution of Accounting Information Systems, SEA - Practical Application of Science, 3(1).
Dai, J. and Vasarheli, M. A. (2017). Toward Blockchain-Based Acconting and Assurance. Journal of Information Systems, 5- 21.
Deloitte (2016).Blockchain:A game changer for audit processes? Retrieved from https://www2.deloitte.com/mt/en/pages/audit/articles/mt-blockchain-a-game-changer-foraudit.
Doğan, M. and Ertugay, E. (2019). Blokzinciri ve Muhasebe Alanındaki Uygulamaları [Blockchain and Applications in Accounting], Third Sector Social Economic Review, 54(4), 1654-1670.
Gökçen, G. and Özdemir, M. (2016). Türkiye’de Muhasebe Uygulamalarından E-Defter ve E-Fatura Uygulaması [E-Book and E-Invoıcıng Practices From Accountıng Practıces in Turkey] Marmara
51Academic Studies in Social, Human and Administrative Sciences - II 51
University, Öneri Journal, 12(46), 137-154.Hancock M., and E. Vaizey (2016). Distributed Ledger Technology:
Beyond Block Chain, UK Government Office for Science.Kundeliene, K. (2011). Business Processes Accounting Quality Attributes
Assessment: Empirical Research in Lithuanian Organizations, Economics and Management, 16, 66-72.
McComb, J.M. and Smalt, S.W. (2018). The rise of blockchain technology and its potential for improving the quality of accounting information, Journal of Finance and Accountancy, 23.
Nakamoto S. (2009). Bitcoin: A Peer-to-Peer Electronic Cash System, Retrieved from https://bitcoin.org/bitcoin.pdf
Özer, E. (2015). Vergi İncelemesinde Yeni Dönem: E-Defter [A New Period in Tax Audit: E-Book], Vergi Sorunları Journal, 322, 65-69.
Phillips, B. A. (2012). How cloud computing will change accounting forever, Retrieved from https://docplayer.net/2537016-How-the-cloud-will-change-accounting-forever.html
Potekhina A., and I. Riumkin (2017). Blockchain – A New Accounting Paradigm, Umeå School of Business and Economics.
Scardovi C. (2016). Restructuring and Innovation in Banking, Springer, ISBN: 9783319402048.

Chapter 4PUBLIC DEBT AND ECONOMIC GROWTH
NEXUS: THE CASE OF EMERGING MARKET AND DEVELOPING ECONOMIES
Gozde GURGUN1 , Bilge CANBALOGLU2
1 Communications and Foreign Relations Department, Central Bank of the Republic of Turkey, [email protected] Orcid ID: 0000-0001-8844-14302 Dr. Öğretim Üyesi , Department of International Trade and Business, Business School, Ankara Yıldırım Beyazıt University, [email protected] Orcid ID: 0000-0001-6352-0079

55Academic Studies in Social, Human and Administrative Sciences - II 55
1 IntroductionThere has been a renewed interest to the relationship between debt and
growth since 2008 global financial crisis (GFC). This can be attributable to increasing debt levels all over the world in the aftermath of the GFC. Public debt has an important share in the rise in global debt, reflecting the economic downturn and the corresponding policy response following the GFC, as well as the effects of fall in commodity prices and rapidly increas-ing spending in emerging markets and low-income developing countries (IMF, 2018a).
Public debt can potentially impact economic growth through sever-al channels. According to the conventional view, fiscal deficits (or higher public debt) can raise aggregate demand and output in the short run but reduce capital stock and output in the long run (Mankiw and Elmendorf, 1999). High public debt can also derail growth through higher future dis-tortionary taxation (Barro, 1979; Greiner, 2012), larger primary surpluses (Lo and Rogoff, 2015) and greater uncertainty about macroeconomic en-vironment (Sutherland and Hoeller, 2012). On the other hand, public debt may positively impact growth subject to the type of public goods financed with debt, such that if public spending finances public infrastructure in-vestment, then higher debt can increase growth rates in transition to the steady state (Aizenman et al., 2007). There are also channels running from growth to public debt. Sluggish growth can lead to a rise in debt and vice versa. When the economic activity weakens, debt level rises due to the im-pact of economic stabilizers and decrease in tax revenues (Puente-Ajovín and Sanso-Navarro, 2015).
The rise in public debt has provided the motivation to revisit the relation-ship between debt and economic growth from the perspective of emerging end developing economies (EMDEs). This study contributes to the literature in several aspects. Firstly, the causality between public debt and economic growth for a large data set comprised of 95 EMDEs is explored for the period of 2001-2016. To our knowledge, causality relation between public debt and growth is mostly investigated for advanced economies in the existing lit-erature. Panel vector autoregressive (panel-VAR) technique of Abrigo and Love (2016) is followed in order to examine the dynamic relationship be-tween public debt and economic growth. Secondly, the public debt and economic growth linkage according to income levels is analysed. To this end, the data set is divided into two groups as low and lower-middle in-come (LLMI) and upper-middle and high income (UMHI) countries ac-cording to the World Bank’s country classification by income level. This division may partly diminish the sources of heterogeneity in the empirical model. Thirdly, the public debt and economic growth linkage with respect to debt levels is also examined. In doing so, as categorized in Reinhart and
Gozde GURGUN , Bilge CANBALOGLU56
Rogoff (2010), countries are split into four according to their public debt/GDP ratios as low debt (LD, below 30%), medium debt (MD, 30% - 60%), high debt (HD, 60%–90%), and very high debt (VHD, above 90%). A flaw in this categorization is that the values of the thresholds are arbitrary. How-ever, there is no consensus that any econometric model will provide a more appropriate threshold for the underlying data. The related literature is in-conclusive in this regard.
The paper is organized as follows. Section 2 reviews the literature. Section 3 presents the data set, the methodology and the empirical find-ings. Section 4 discusses the key findings and concludes.
2 Literature ReviewThe relation between public debt and economic growth has been sub-
ject of many empirical studies in the recent literature. The studies on the topic have gained pace following the influential paper by Reinhart and Rogoff (2010). They show that for a sample of 44 countries the growth rate dramatically decreases for both advanced and emerging country groups when the public debt level exceeds the 90% of GDP. However, Herndon et al., (2013) replicate the study of Reinhart and Rogoff (2010) and come up with revised results by fixing the problems related to coding errors, ex-clusion of some of the available data and weighting of summary statistics. Their results suggest that the average GDP growth at the level of public debt to GDP ratio exceeding 90% is not noticeably different at the level when this ratio is below 90%. Egert (2015) applies a nonlinear threshold model, with a variant of Reinhart and Rogoff (2010)’s dataset and confirms the presence of a negative nonlinear relationship between public debt and growth in the very rare cases where the negative correlation starts at very low levels of public debt (between 20% and 60% of GDP).
Cecchetti et al., (2011) examine the threshold value for government debt for 18 OECD countries from 1980 to 2010. They show that when pub-lic debt is around 85% of GDP, further increases in debt may begin to have a significant effect on growth such that a further 10 percentage point in-crease reduces trend growth by more than one tenth of 1 percentage point. In the same vein, Woo and Kumar (2015) present findings about the in-verse relationship between debt and long-run economic growth for a large panel of developed and emerging economies over almost 4 decades. They show that a 10 percentage point rise in the initial debt to GDP ratio leads to a slowdown in per capita GDP growth of around 0.2 percentage points on average per year, with the effect being smaller in advanced economies. They also present some evidence of the non-linearity with higher levels of initial debt (above around 90% of GDP) having more significantly nega-tive impacts on growth.
57Academic Studies in Social, Human and Administrative Sciences - II 57
In a related strand of literature, Checherita-Westphal and Rother (2012) examine the relationship between debt to GDP ratio and growth rate of GDP per capita for 12 countries in the euro area over the years 1970–2008. They find a nonlinear relationship between growth and government debt such that when the debt reaches 90-100 % of GDP, the debt ratio impairs the long-term growth. Moreover, the negative impact of the government debt on the growth starts when debt to GDP ratio reaches 70-80 % levels. In a following paper, Baum et al., (2013) investigate the non-linear impact of public debt on GDP growth for the same country sample over the years 1990–2010 using dynamic threshold panel methodology. Their findings indicate that public debt has positive and significant impact on economic activity until public debt to GDP ratio reaches 67 % in the short-term, but decreases to close to zero and loses significance beyond public debt to GDP ratios of 67%. They also show that in the case of high debt ratios (above 95%) additional debt has a negative impact on economic activity.
Gnegne and Jawadi (2013) also employ nonlinear tests under thresh-old models for US and UK in order to investigate the public debt dynam-ics over more than four decades. They show that the public debts of both countries show asymmetric and nonlinear patterns. Moreover, public debt dynamics are influenced by various regimes such as economic downturns, financial and other crises and can have various thresholds depending on the regimes.
Afonso and Jalles (2013) inspect the linkage between fiscal policy de-velopments and economic growth for 155 countries over the years 1970-2008. They show that the growth effect of a 10% increase in the debt ratio is -0.2 % for countries with debt ratios above 90% of GDP and 0.1 % for countries that maintained an average debt ratio below 30%. They also find the threshold debt to GDP ratio as 59 % for the full sample, 58% for the Euro area, and 79% for emerging countries. Furthermore, Afonso and Alves (2015) explore the impact of government debt on economic growth for 14 European countries for time span of 1970-2012 by taking into con-sideration interactions of debt ratio with monetary, macroeconomic, public and institutional variables. Their results indicate that 1% increase in public debt leads to 0.04% decline in annual growth rate in the euro-area. Addi-tionally, they find that the threshold value of debt to GDP ratio is around 75%. When the interactions of debt with other variables are regarded, the banking crisis has the most detrimental effects on growth in the euro-area.
Globan and Matosec (2016) investigate the determinants of public debt and relative importance of fiscal consolidation and economic growth on the debt to GDP ratio in 13 EU new member states over the time period of 2000-2015. Their panel data analysis suggests that the achievements in the budget balance and increases in economic growth result in decreases in
Gozde GURGUN , Bilge CANBALOGLU58
public debt-to-GDP ratio. However, the impact of improvements in budget balance is smaller than the effect of economic growth. On the other hand, Kourtellos et al., (2013) employ a structural threshold regression meth-odology to examine the relationship between public debt and economic activity by considering the various factors related to quality of countries’ institutions. They find that if a country’s institutions are low quality or the country is under low-democracy regime, large public debt results in lower economic performance.
Eberhardt and Presbitero (2015) study the relationship between pub-lic debt and long-run growth in a panel of 118 countries and find some evidence for the negative effect of public debt on the long-run growth per-formance across countries, but no evidence for a common debt threshold within countries. More recently Jacobo and Jalile (2017) seek the threshold value for government debt to GDP ratio for 16 Latin American countries from the years 1960 to 2015. Their findings indicate that the short-run gov-ernment debt has positive impact on economic growth until the debt ratio reaches 64 – 71%, but beyond these values, this positive impact approach-es to zero.
Caner et al., (2010) analyse the thresholds in long-term average public debt to GDP ratios for 101 countries (75 developing and 26 developed) for the period of 1980–2008 and the impact of debt on long-term GDP. Their main findings point out that the threshold level of the average long-run public debt to GDP ratio on GDP growth is 77% for the full sample and 64% for the subsample of developing countries. The difference between the threshold for the full sample and the threshold for developing countries suggests that developing countries face growth rate problems at a lower debt to GDP level. Furthermore, Dinca and Dinca (2015) examine the link between public debt and economic growth for 10 former Communist and European countries over the period of 1999-2000. Their empirical findings suggest economic growth can deteriorate when public debt to GDP ratio exceeds 50%.There also exist studies exploring the causal relationship between debt and economic growth. Puente-Ajovín and Sanso-Navarro (2015) examine the Granger-causality between debt and economic growth for a panel of 16 OECD countries for the period of 1980–2008. Their study does not support the existence of causality running from public debt to growth, whereas they find a number of causal relationships running from growth to debt. Furthermore, Lof and Malinen (2014) construct a pan-el-VAR analysis for 20 and 10 developed countries over two sub-periods of 1954–2008 and 1905–2008, respectively by considering the endogenous relationship between sovereign debt and economic growth. They offer no evidence of significant impact of debt on growth even if the debt ratio is high, while they present negative effect of growth on debt implying that as
59Academic Studies in Social, Human and Administrative Sciences - II 59
economy improves the sovereign debt tends to decline. Panizza and Pres-bitero (2014) use an instrumental variable approach to explore the causal link between public debt and economic growth in a panel of OECD coun-tries. The results are consistent with the existing studies that have found a negative correlation between debt and growth. However, the link between debt and growth vanishes once the endogeneity is corrected, suggesting that a causal link may not exist.
The existing empirical literature on the public debt and economic growth nexus could be summarized as follows: (i) Many papers find an inverse relation between debt and economic growth. (ii) The findings on the threshold level are mixed, depending on the economies included in the panel, data frequency and the time period under review. (iii) In general, the turning point beyond which an increase in public debt has a negative impact on growth is found to be higher for advanced economies. However, strong policy recommendations should be avoided as these models may raise endogeneity issues whereby low growth leads to higher debt. (iv) The studies that examine the causality between public debt and growth are relatively scarce and mostly focus on advanced economies. Current studies reveal different results regarding the existence and direction of causality. (v) The causality relationship between debt and growth needs to be further investigated, particularly for emerging and developing countries.
3 Data, Methodology and Empirical Findings
3.1 The Data and the Methodology
The data set includes economic growth (EG) and public debt (PD) indicators for 95 EMDEs over the period of 2001-2016. The EG is gauged by annual real GDP per capita growth and retrieved from World Develop-ment Indicators (WDI) database of the World Bank. On the other hand, PD is measured by the general government gross debt as a percentage of GDP and obtained from World Economic Outlook (WEO) database of the IMF. According to Levin-Lin-Cu (2002) ve Im-Pesaran-Shin (2003) panel unit root test results, the EG variable is stationary at level, whereas PD variable is stationary at first-difference level according to Im-Pesaran-Shin (2003) test results for both country groups. Hence, the first-difference series of PD variable is used. The list of countries is given in Table A1. Analysis are performed for both income and debt categorizations to account for the heterogeneity across countries.
Panel-VAR technique of Abrigo and Love (2016) is utilized. This methodology not only treats all the variables as endogenous variables in the system but also allows existence of the unobserved individual hetero-geneity as fixed effects (Love and Zicchino, 2006). Hence, panel-VAR
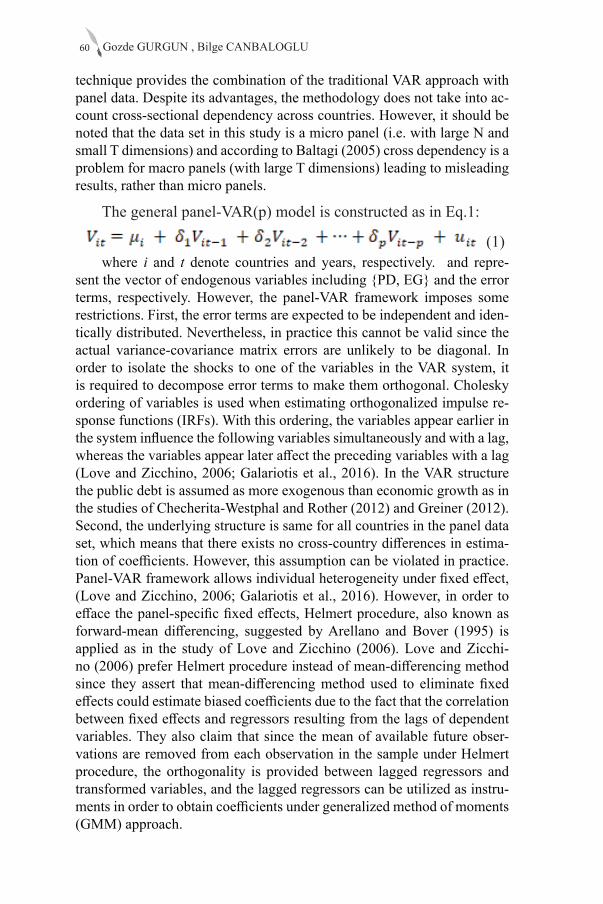
Gozde GURGUN , Bilge CANBALOGLU60
technique provides the combination of the traditional VAR approach with panel data. Despite its advantages, the methodology does not take into ac-count cross-sectional dependency across countries. However, it should be noted that the data set in this study is a micro panel (i.e. with large N and small T dimensions) and according to Baltagi (2005) cross dependency is a problem for macro panels (with large T dimensions) leading to misleading results, rather than micro panels.
The general panel-VAR(p) model is constructed as in Eq.1:
(1) where i and t denote countries and years, respectively. and repre-
sent the vector of endogenous variables including {PD, EG} and the error terms, respectively. However, the panel-VAR framework imposes some restrictions. First, the error terms are expected to be independent and iden-tically distributed. Nevertheless, in practice this cannot be valid since the actual variance-covariance matrix errors are unlikely to be diagonal. In order to isolate the shocks to one of the variables in the VAR system, it is required to decompose error terms to make them orthogonal. Cholesky ordering of variables is used when estimating orthogonalized impulse re-sponse functions (IRFs). With this ordering, the variables appear earlier in the system influence the following variables simultaneously and with a lag, whereas the variables appear later affect the preceding variables with a lag (Love and Zicchino, 2006; Galariotis et al., 2016). In the VAR structure the public debt is assumed as more exogenous than economic growth as in the studies of Checherita-Westphal and Rother (2012) and Greiner (2012). Second, the underlying structure is same for all countries in the panel data set, which means that there exists no cross-country differences in estima-tion of coefficients. However, this assumption can be violated in practice. Panel-VAR framework allows individual heterogeneity under fixed effect, (Love and Zicchino, 2006; Galariotis et al., 2016). However, in order to efface the panel-specific fixed effects, Helmert procedure, also known as forward-mean differencing, suggested by Arellano and Bover (1995) is applied as in the study of Love and Zicchino (2006). Love and Zicchi-no (2006) prefer Helmert procedure instead of mean-differencing method since they assert that mean-differencing method used to eliminate fixed effects could estimate biased coefficients due to the fact that the correlation between fixed effects and regressors resulting from the lags of dependent variables. They also claim that since the mean of available future obser-vations are removed from each observation in the sample under Helmert procedure, the orthogonality is provided between lagged regressors and transformed variables, and the lagged regressors can be utilized as instru-ments in order to obtain coefficients under generalized method of moments (GMM) approach.
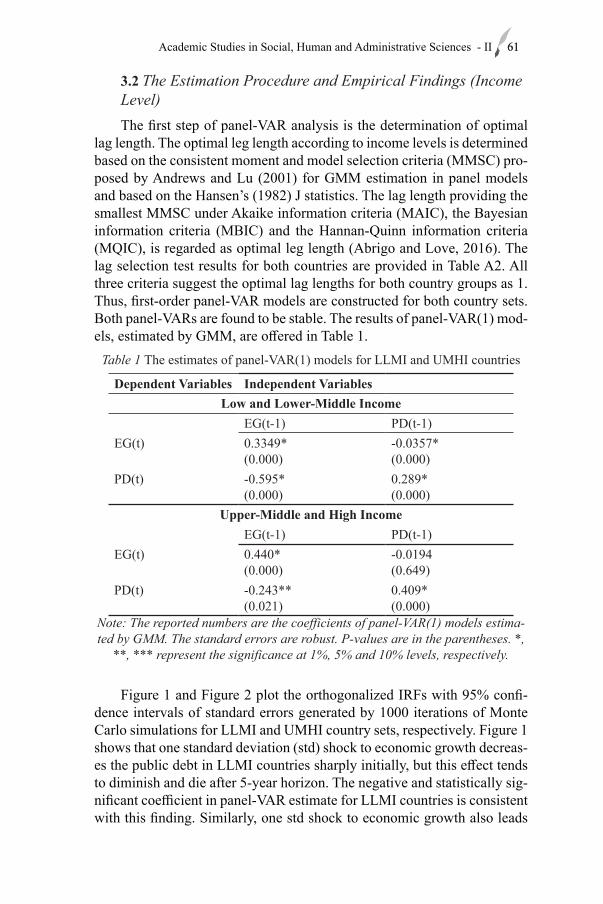
61Academic Studies in Social, Human and Administrative Sciences - II 61
3.2 The Estimation Procedure and Empirical Findings (Income Level)The first step of panel-VAR analysis is the determination of optimal
lag length. The optimal leg length according to income levels is determined based on the consistent moment and model selection criteria (MMSC) pro-posed by Andrews and Lu (2001) for GMM estimation in panel models and based on the Hansen’s (1982) J statistics. The lag length providing the smallest MMSC under Akaike information criteria (MAIC), the Bayesian information criteria (MBIC) and the Hannan-Quinn information criteria (MQIC), is regarded as optimal leg length (Abrigo and Love, 2016). The lag selection test results for both countries are provided in Table A2. All three criteria suggest the optimal lag lengths for both country groups as 1. Thus, first-order panel-VAR models are constructed for both country sets. Both panel-VARs are found to be stable. The results of panel-VAR(1) mod-els, estimated by GMM, are offered in Table 1.
Table 1 The estimates of panel-VAR(1) models for LLMI and UMHI countries
Dependent Variables Independent Variables Low and Lower-Middle Income
EG(t-1) PD(t-1)EG(t) 0.3349*
(0.000)-0.0357*(0.000)
PD(t) -0.595*(0.000)
0.289*(0.000)
Upper-Middle and High Income EG(t-1) PD(t-1)
EG(t) 0.440* (0.000)
-0.0194(0.649)
PD(t) -0.243**(0.021)
0.409*(0.000)
Note: The reported numbers are the coefficients of panel-VAR(1) models estima-ted by GMM. The standard errors are robust. P-values are in the parentheses. *,
**, *** represent the significance at 1%, 5% and 10% levels, respectively.
Figure 1 and Figure 2 plot the orthogonalized IRFs with 95% confi-dence intervals of standard errors generated by 1000 iterations of Monte Carlo simulations for LLMI and UMHI country sets, respectively. Figure 1 shows that one standard deviation (std) shock to economic growth decreas-es the public debt in LLMI countries sharply initially, but this effect tends to diminish and die after 5-year horizon. The negative and statistically sig-nificant coefficient in panel-VAR estimate for LLMI countries is consistent with this finding. Similarly, one std shock to economic growth also leads
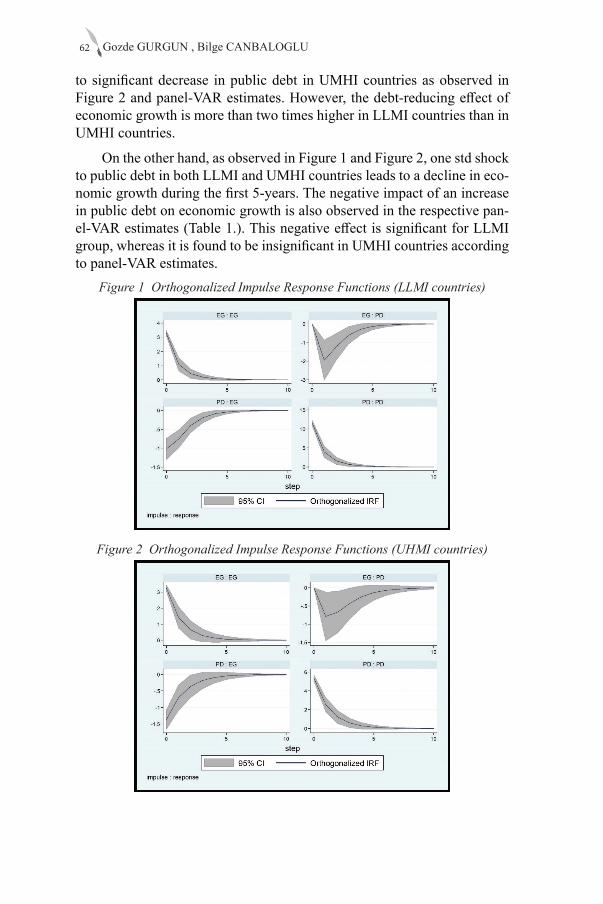
Gozde GURGUN , Bilge CANBALOGLU62
to significant decrease in public debt in UMHI countries as observed in Figure 2 and panel-VAR estimates. However, the debt-reducing effect of economic growth is more than two times higher in LLMI countries than in UMHI countries.
On the other hand, as observed in Figure 1 and Figure 2, one std shock to public debt in both LLMI and UMHI countries leads to a decline in eco-nomic growth during the first 5-years. The negative impact of an increase in public debt on economic growth is also observed in the respective pan-el-VAR estimates (Table 1.). This negative effect is significant for LLMI group, whereas it is found to be insignificant in UMHI countries according to panel-VAR estimates.
Figure 1 Orthogonalized Impulse Response Functions (LLMI countries)
Figure 2 Orthogonalized Impulse Response Functions (UHMI countries)
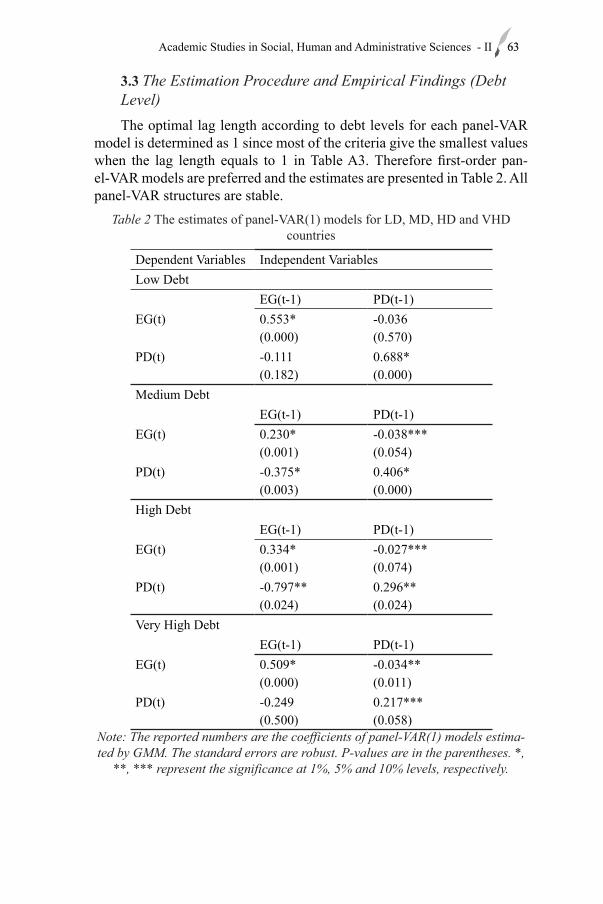
63Academic Studies in Social, Human and Administrative Sciences - II 63
3.3 The Estimation Procedure and Empirical Findings (Debt Level)The optimal lag length according to debt levels for each panel-VAR
model is determined as 1 since most of the criteria give the smallest values when the lag length equals to 1 in Table A3. Therefore first-order pan-el-VAR models are preferred and the estimates are presented in Table 2. All panel-VAR structures are stable.
Table 2 The estimates of panel-VAR(1) models for LD, MD, HD and VHD countries
Dependent Variables Independent Variables Low Debt
EG(t-1) PD(t-1)EG(t) 0.553*
(0.000)-0.036 (0.570)
PD(t) -0.111 (0.182)
0.688* (0.000)
Medium DebtEG(t-1) PD(t-1)
EG(t) 0.230*(0.001)
-0.038*** (0.054)
PD(t) -0.375* (0.003)
0.406* (0.000)
High DebtEG(t-1) PD(t-1)
EG(t) 0.334*(0.001)
-0.027*** (0.074)
PD(t) -0.797** (0.024)
0.296** (0.024)
Very High Debt EG(t-1) PD(t-1)
EG(t) 0.509* (0.000)
-0.034**(0.011)
PD(t) -0.249 (0.500)
0.217*** (0.058)
Note: The reported numbers are the coefficients of panel-VAR(1) models estima-ted by GMM. The standard errors are robust. P-values are in the parentheses. *,
**, *** represent the significance at 1%, 5% and 10% levels, respectively.
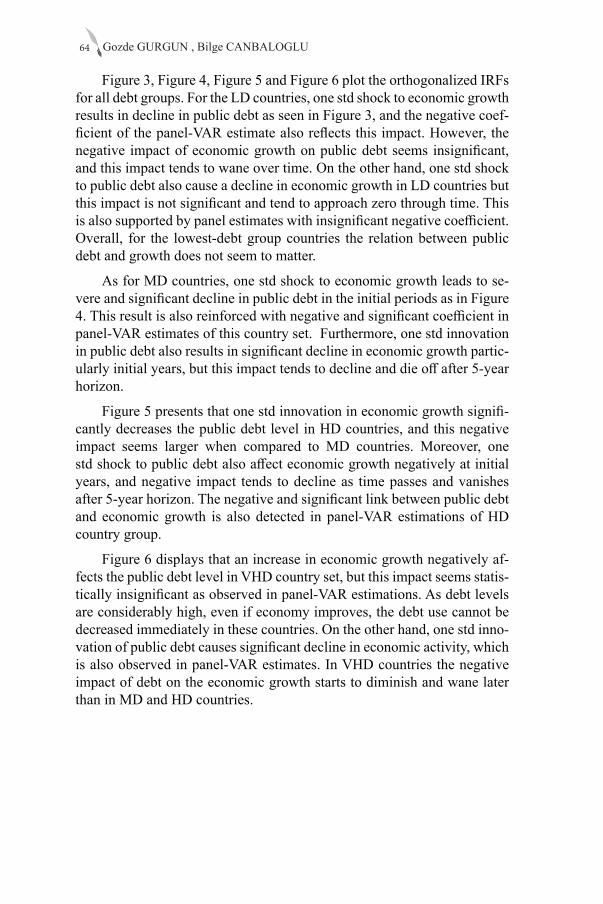
Gozde GURGUN , Bilge CANBALOGLU64
Figure 3, Figure 4, Figure 5 and Figure 6 plot the orthogonalized IRFs for all debt groups. For the LD countries, one std shock to economic growth results in decline in public debt as seen in Figure 3, and the negative coef-ficient of the panel-VAR estimate also reflects this impact. However, the negative impact of economic growth on public debt seems insignificant, and this impact tends to wane over time. On the other hand, one std shock to public debt also cause a decline in economic growth in LD countries but this impact is not significant and tend to approach zero through time. This is also supported by panel estimates with insignificant negative coefficient. Overall, for the lowest-debt group countries the relation between public debt and growth does not seem to matter.
As for MD countries, one std shock to economic growth leads to se-vere and significant decline in public debt in the initial periods as in Figure 4. This result is also reinforced with negative and significant coefficient in panel-VAR estimates of this country set. Furthermore, one std innovation in public debt also results in significant decline in economic growth partic-ularly initial years, but this impact tends to decline and die off after 5-year horizon.
Figure 5 presents that one std innovation in economic growth signifi-cantly decreases the public debt level in HD countries, and this negative impact seems larger when compared to MD countries. Moreover, one std shock to public debt also affect economic growth negatively at initial years, and negative impact tends to decline as time passes and vanishes after 5-year horizon. The negative and significant link between public debt and economic growth is also detected in panel-VAR estimations of HD country group.
Figure 6 displays that an increase in economic growth negatively af-fects the public debt level in VHD country set, but this impact seems statis-tically insignificant as observed in panel-VAR estimations. As debt levels are considerably high, even if economy improves, the debt use cannot be decreased immediately in these countries. On the other hand, one std inno-vation of public debt causes significant decline in economic activity, which is also observed in panel-VAR estimates. In VHD countries the negative impact of debt on the economic growth starts to diminish and wane later than in MD and HD countries.
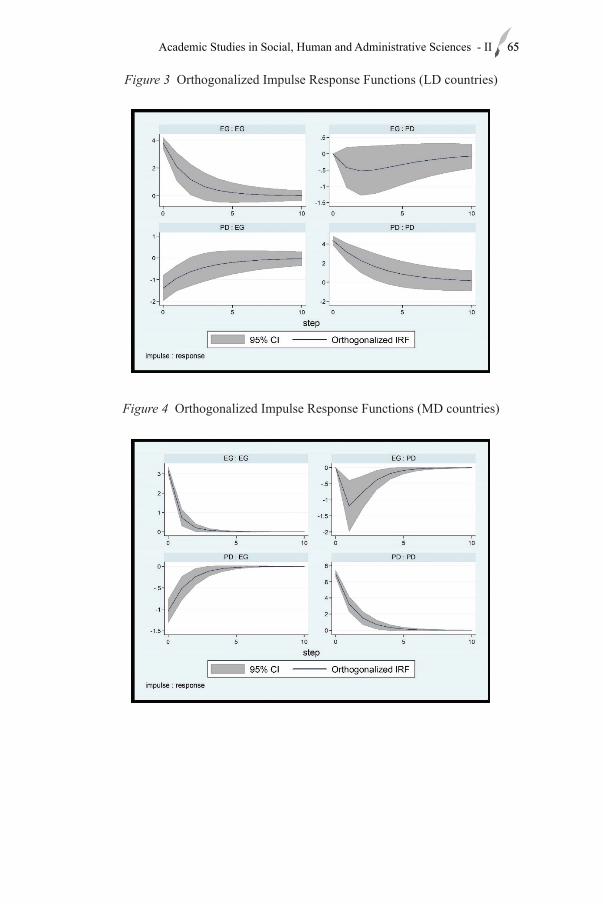
65Academic Studies in Social, Human and Administrative Sciences - II 65
Figure 3 Orthogonalized Impulse Response Functions (LD countries)
Figure 4 Orthogonalized Impulse Response Functions (MD countries)
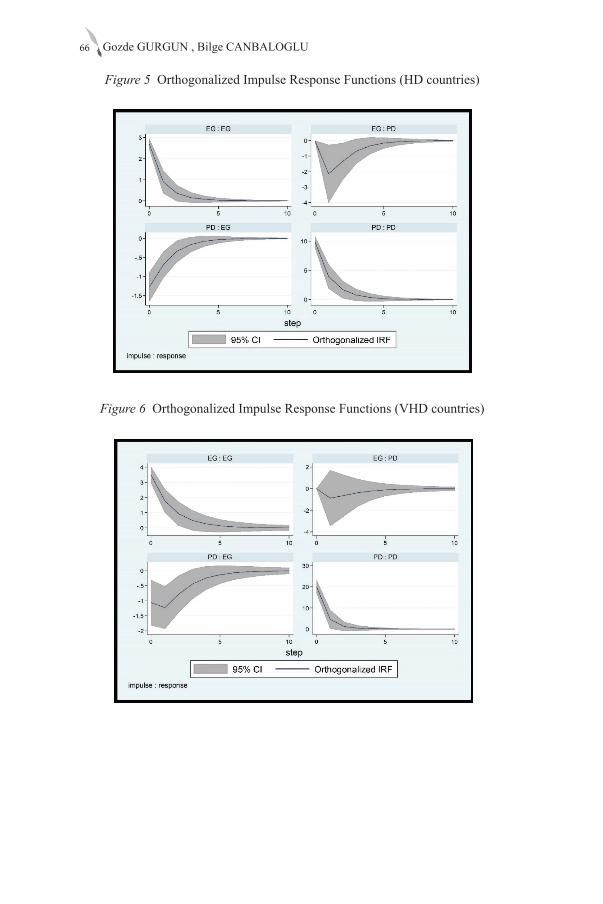
Gozde GURGUN , Bilge CANBALOGLU66
Figure 5 Orthogonalized Impulse Response Functions (HD countries)
Figure 6 Orthogonalized Impulse Response Functions (VHD countries)
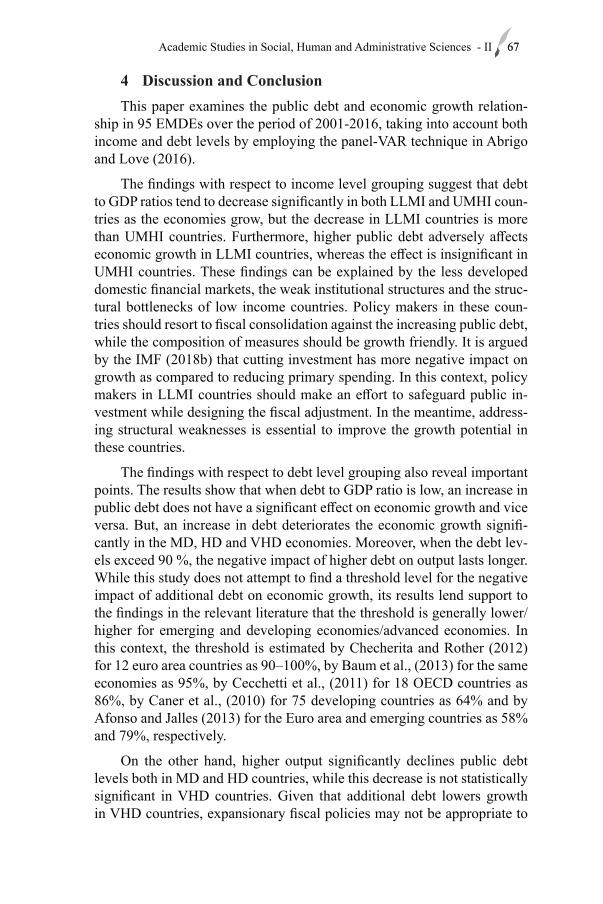
67Academic Studies in Social, Human and Administrative Sciences - II 67
4 Discussion and ConclusionThis paper examines the public debt and economic growth relation-
ship in 95 EMDEs over the period of 2001-2016, taking into account both income and debt levels by employing the panel-VAR technique in Abrigo and Love (2016).
The findings with respect to income level grouping suggest that debt to GDP ratios tend to decrease significantly in both LLMI and UMHI coun-tries as the economies grow, but the decrease in LLMI countries is more than UMHI countries. Furthermore, higher public debt adversely affects economic growth in LLMI countries, whereas the effect is insignificant in UMHI countries. These findings can be explained by the less developed domestic financial markets, the weak institutional structures and the struc-tural bottlenecks of low income countries. Policy makers in these coun-tries should resort to fiscal consolidation against the increasing public debt, while the composition of measures should be growth friendly. It is argued by the IMF (2018b) that cutting investment has more negative impact on growth as compared to reducing primary spending. In this context, policy makers in LLMI countries should make an effort to safeguard public in-vestment while designing the fiscal adjustment. In the meantime, address-ing structural weaknesses is essential to improve the growth potential in these countries.
The findings with respect to debt level grouping also reveal important points. The results show that when debt to GDP ratio is low, an increase in public debt does not have a significant effect on economic growth and vice versa. But, an increase in debt deteriorates the economic growth signifi-cantly in the MD, HD and VHD economies. Moreover, when the debt lev-els exceed 90 %, the negative impact of higher debt on output lasts longer. While this study does not attempt to find a threshold level for the negative impact of additional debt on economic growth, its results lend support to the findings in the relevant literature that the threshold is generally lower/higher for emerging and developing economies/advanced economies. In this context, the threshold is estimated by Checherita and Rother (2012) for 12 euro area countries as 90–100%, by Baum et al., (2013) for the same economies as 95%, by Cecchetti et al., (2011) for 18 OECD countries as 86%, by Caner et al., (2010) for 75 developing countries as 64% and by Afonso and Jalles (2013) for the Euro area and emerging countries as 58% and 79%, respectively.
On the other hand, higher output significantly declines public debt levels both in MD and HD countries, while this decrease is not statistically significant in VHD countries. Given that additional debt lowers growth in VHD countries, expansionary fiscal policies may not be appropriate to
Gozde GURGUN , Bilge CANBALOGLU68
stimulate growth in these countries. Policymakers should focus on other policy measures to achieve higher growth rates rather than fiscal stimulus.
Overall, there is no one-size fits all answer to the direction of causality between public debt and economic growth. The findings suggest that the relation between debt and growth is complex and differs across countries, therefore caution is needed when making policy recommendations. A pol-icy that is appropriate for one country may be irrelevant or misleading for the other.
ReferencesAbrigo, M. and Love, I. (2016) ‘Estimation of panel vector autoregression
in Stata: a package of programs’, University of Hawaii at Manoa Department of Economics Working Papers, 201602.
Afonso, A. and Alves, J. (2015) ‘The Role of Government Debt in Economic Growth’, Review of Public Economics, 215 (4), pp. 9-26.
Afonso, A. and Jalles, J. T. (2013) ‘Growth and productivity: The role of government debt’, International Review of Economics and Finance, 25 pp. 384–407.
Aizenman, J., Kletzer, K. and Pinto, B. (2007) ‘Economic Growth with Constraints on Tax Revenues and Public Debt: Implications for Fiscal Policy and Cross-Country Differences’, NBER Working Paper, 12750.
Andrews, D.W.K. and Lu, B. (2001) ‘Consistent model and moment selection procedures for GMM estimation with application to dynamic panel data models’, Journal of Econometrics, 101(1), pp. 123-164.
Arellano, M. and Bover, O. (1995) ‘Another look at the instrumental variable estimation of error-components model’, Journal of Econometrics, 68(1), pp. 29-51.
Baltagi, B. H. (2005). ‘Econometric Analysis of Panel Data’, 3rd ed., John Wiley & Sons Ltd., England.
Barro, R. J. (1979) ‘On the determination of the public debt’, Journal of Political Economy, 87(5), pp. 940-971.
Baum, A., Checherita-Westphal, C. and Rother, P. (2013) ‘Debt and growth: New evidence for the euro area’, Journal of International Money and Finance, 32, pp. 809–821.
Caner, M., Grennes, T. and Koehler-Geib, F. (2010) ‘Finding the Tipping Point: When Sovereign Debt Turns Bad’, World Bank Policy Research Working Paper Series, 5391.
Cecchetti, S.G., Mohanty M. S. and Zampolli, F. (2011) ‘The Real Effects of Debt’, Bank for International Settlements (BIS) Working Papers, 352.
Checherita-Westphal, C. and Rother, P. (2012) ‘The impact of high
69Academic Studies in Social, Human and Administrative Sciences - II 69
government debt on economic growth and its channels: An empirical investigation for the euro area’, European Economic Review, 56 (7), pp. 1392–1405.
Dinca, G. and Dinca, M.S. (2015) ‘Public Debt and Economic Growth in the EU Post-Communist Countries’, Romanian Journal of Economic Forecasting, XVIII(2), pp. 119-132.
Eberhardt, M. and Presbitero, A.F. (2015) ‘Public debt and growth: Heterogeneity and non-linearity’, Journal of International Economics, 97, pp. 45–58.
Egert, B. (2015) ‘Public debt, economic growth and nonlinear effects: Myth or reality?’, Journal of Macroeconomics, 43, pp. 226–238.
Galariotis, E., Makrichoriti, P. and Spyrou. S. (2016) ‘Sovereign CDS spread determinants and spill-over effects during financial crisis: A panel VAR approach’, Journal of Financial Stability, 26, pp.62-77.
Globan, T. and Matosec, M. (2016) ‘Public Debt-to-GDP Ratio in New EU Member States: Cut the Numerator or Increase the Denominator?’, Romanian Journal of Economic Forecasting, XIX(3), pp. 57-72.
Gnegne, Y. and Jawadi, F. (2013) ‘Boundedness and nonlinearities in public debt dynamics: A TAR assessment’, Economic Modelling, 34, pp.154-160.
Greiner, A. (2012) ‘Public debt in a basic endogenous growth model’, Economic Modelling, 29 (4), pp. 1344 – 1348.
Herndon, T., Ash, M. and Pollin, R. (2013) ‘Does high public debt consistently stifle economic growth?: A critique of Reinhart and Rogoff’, Political Economy Research Institute Working Paper, 322.
Im K.S., Pesaran, M.H. and Shin, Y. (2003) ‘Testing for unit roots in heterogeneous panels’, Journal of Econometrics, 115, pp. 53–74.
International Monetary Fund (IMF). (2018a) Fiscal Monitor: Capitalizing on Good Times. [online] Available at: <https://www.imf.org/en/Publications/FM/Issues /2018/04/06/fiscal-monitor-april-2018> (Accessed in June 2018).
International Monetary Fund (IMF). (2018b) Regional Economic Outlook Western Hemisphere: Seizing the Momentum. [online] Available at: <https://www.imf.org/en/Publications/REO/WH/Issues/2018/05/09/wreo0518> (Accessed in June 2018).
Jacobo, A. D. and Jalile, I.R. (2017) ‘The Impact of Government Debt on Economic Growth: An Overview for Latin America’, Department of Economics University of Perugia Working Paper, 28.
Kourtellos, A., Stengos, T. and Tan, C. M. (2013) ‘The effect of public debt on growth in multiple regimes’, Journal of Macroeconomics, 38, pp. 35-43.
Levin, A., Lin, C.F. and Chu, C.S.J. (2002) ‘Unit root tests in panel data: Asymptotic and finite sample properties’, Journal of Econometrics,108,
Gozde GURGUN , Bilge CANBALOGLU70
pp. 1–24.Lo, S. and Rogoff, K. (2015) ‘Secular stagnation, debt overhang and other
rationales for sluggish growth, six years’, Bank for International Settlements (BIS) Working Papers, 482.
Lof, M. and Malinen, T. (2014) ‘Does sovereign debt weaken economic growth? A panel VAR analysis’, Economics Letters, 122, pp. 03–407.
Love I., and Zicchino, L. (2006) ‘Financial development and dynamic investment behaviour: Evidence from panel VAR’, The Quarterly Review of Economics and Finance 46, pp. 190-210.
Mankiw N.G. and Elmendorf, D. (1999) Government Debt. In: J.B. Taylor and Woodford, M., ed.1999. Handbook of Macroeconomics Vol 1C. Amsterdam: Elsevier North Holland. pp. 1615 – 1669.
Panizza, U. and Presbitero, A. F. (2014) ‘Public debt and economic growth: Is there a causal effect?’, Journal of Macroeconomics, 41, pp. 21-41.
Puente-Ajovín, M. and Sanso-Navarro, M. (2015) ‘Granger causality between debt and growth: Evidence from OECD countries’, International Review of Economics and Finance, 35, pp. 66 – 77.
Reinhart, C. and Rogoff. K. (2010) ‘Growth in a time of debt’, The American Economic Review, 100(2), pp. 573–578.
Sutherland, D. and Hoeller. P. (2012) ‘Debt and Macroeconomic Stability: An Overview of the Literature and Some Empirics’, OECD Economics Department Working Paper, 1006.
Woo, J. and Kumar, M.S. (2015) ‘Public Debt and Growth’, Economica, 28(328), pp. 705 –739.
Notes1. All panel-VAR stability condition test results are available upon
request.
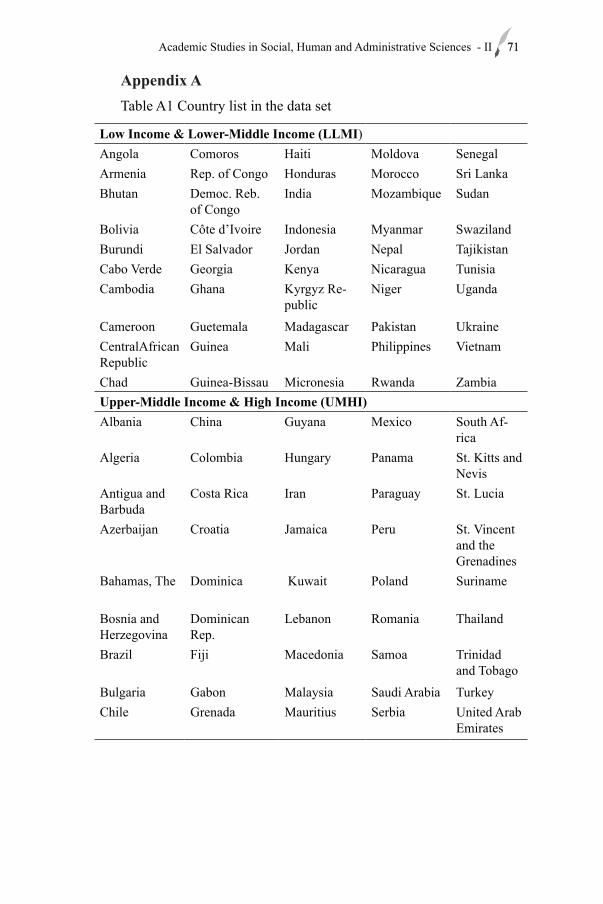
71Academic Studies in Social, Human and Administrative Sciences - II 71
Appendix ATable A1 Country list in the data set
Low Income & Lower-Middle Income (LLMI)Angola Comoros Haiti Moldova SenegalArmenia Rep. of Congo Honduras Morocco Sri LankaBhutan Democ. Reb.
of CongoIndia Mozambique Sudan
Bolivia Côte d’Ivoire Indonesia Myanmar SwazilandBurundi El Salvador Jordan Nepal Tajikistan Cabo Verde Georgia Kenya Nicaragua TunisiaCambodia Ghana Kyrgyz Re-
publicNiger Uganda
Cameroon Guetemala Madagascar Pakistan UkraineCentralAfrican Republic
Guinea Mali Philippines Vietnam
Chad Guinea-Bissau Micronesia Rwanda ZambiaUpper-Middle Income & High Income (UMHI)Albania China Guyana Mexico South Af-
ricaAlgeria Colombia Hungary Panama St. Kitts and
NevisAntigua and Barbuda
Costa Rica Iran Paraguay St. Lucia
Azerbaijan Croatia Jamaica Peru St. Vincent and the Grenadines
Bahamas, The Dominica Kuwait Poland Suriname
Bosnia and Herzegovina
Dominican Rep.
Lebanon Romania Thailand
Brazil Fiji Macedonia Samoa Trinidad and Tobago
Bulgaria Gabon Malaysia Saudi Arabia TurkeyChile Grenada Mauritius Serbia United Arab
Emirates
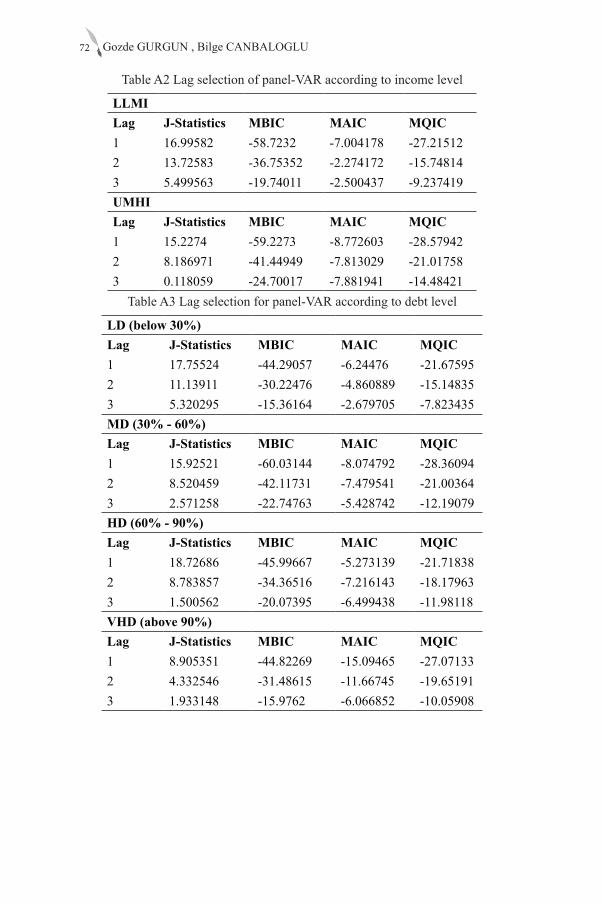
Gozde GURGUN , Bilge CANBALOGLU72
Table A2 Lag selection of panel-VAR according to income level
LLMILag J-Statistics MBIC MAIC MQIC1 16.99582 -58.7232 -7.004178 -27.215122 13.72583 -36.75352 -2.274172 -15.748143 5.499563 -19.74011 -2.500437 -9.237419UMHILag J-Statistics MBIC MAIC MQIC1 15.2274 -59.2273 -8.772603 -28.579422 8.186971 -41.44949 -7.813029 -21.017583 0.118059 -24.70017 -7.881941 -14.48421
Table A3 Lag selection for panel-VAR according to debt level
LD (below 30%)Lag J-Statistics MBIC MAIC MQIC1 17.75524 -44.29057 -6.24476 -21.675952 11.13911 -30.22476 -4.860889 -15.148353 5.320295 -15.36164 -2.679705 -7.823435MD (30% - 60%)Lag J-Statistics MBIC MAIC MQIC1 15.92521 -60.03144 -8.074792 -28.360942 8.520459 -42.11731 -7.479541 -21.003643 2.571258 -22.74763 -5.428742 -12.19079HD (60% - 90%)Lag J-Statistics MBIC MAIC MQIC1 18.72686 -45.99667 -5.273139 -21.718382 8.783857 -34.36516 -7.216143 -18.179633 1.500562 -20.07395 -6.499438 -11.98118VHD (above 90%)Lag J-Statistics MBIC MAIC MQIC1 8.905351 -44.82269 -15.09465 -27.071332 4.332546 -31.48615 -11.66745 -19.651913 1.933148 -15.9762 -6.066852 -10.05908
Chapter 5RETHINKING THE NEXUS BETWEEN POLLUTANT EMISSION, FINANCIAL
DEVELOPMENT, RENEWABLE ENERGY CONSUMPTION AND ECONOMIC GROWTH
IN G7 COUNTRIES
Festus Victor BEKUN1, Bright Akwasi GYAMFI2
1 Dr. Öğretim Üyesi, Faculty of Economics Administrative and Social Sciences, Istanbul Geli-sim University, Department of Accounting, Analysis and Audit, School of Economics and Man-agement South Ural State University, [email protected] Faculty of Economics and Administrative Sciences, Cyprus International University, [email protected]

75Academic Studies in Social, Human and Administrative Sciences - II 75
1. IntroductionThe United Nations has named the era 2014-2024 as the Period of
Clean power for everyone (SE4All, 2015). Achieving balance in power usage is expected to lead to a sustainable atmosphere, better exposure to voltage, enhanced energy quality with little pollutant sources in addition to increased innovation in green technologies. In the international sense, there is a growing use of green infrastructure that aims to tackle green-house pollution and to expand accessibility to electricity for billions of citizens who are now in the deprivation pit. An unprecedented 19.1 per-cent of international total power demand was generated by renewable in 2013. The rapid increase in the voltage market is powered by wind, sun Panels and hydropower. The increase in warming efficiency is at a constant rate, then the development of biofuels for travel has lately risen after a fall in 2011 through 2012. Under a more ambitious forecast established by the International Energy Agency (IEA), the sustainable portion of power production may grow around 18.3% throughout 2002 towards 39% around 2050. Renewable energy sources may play a crucial function in minimiz-ing the long-term average international warming increase below the range around 2.0 to 2.40C (IEA, 2009) to cut overall CO2 pollution through 50% mostly by 2050.
Renewable production in previous times has largely propelled by gov-ernment-supported policies via grants, levy benefits and additional oppor-tunities. It play a part growing the cost-effectiveness of clean technology supplies. For many other nations, renewable are largely compatible with traditional power supplies. Together with Europe in addition to the United States, current policies happening green power emerged in nations in Asia, Africa and Latin America. It has produced global suppliers and installa-tions of clean energy technology beyond Europe and the United States. The discourse on power consumption-economic development has become extensively studied (see Wolde- 2009; Costantini & Martini , 2010; Bhat-tacharya, Rafiq, & Bhattacharya, 2015; Ozturk, & Bicimveren, ,2018; Bekun et al.,2019a; bekun et al.,2019b; Adedoyin et al.,2020)3 but findings on clean power are nevertheless scarce. The increasing value of sustain-ability as a supply of electricity has given rise to a great deal of concern from both scholars and electricity policy observers.
In a way to minimize environmental pollution from the rising demand of energy, this study considered the degree to which renewable energy sup-ply from the G7 countries adds to the development of CO2 emissions and proposed measures to mitigate it. Furthermore, this study adds a control
3 For the want of space, the energy-growth literature holds fours hypothesis namely. (i) Growth literature (ii) conservative hypothesis (iii) feedback hypothesis and (iv) neutrality hypothesis (see Ozturk, 2010)
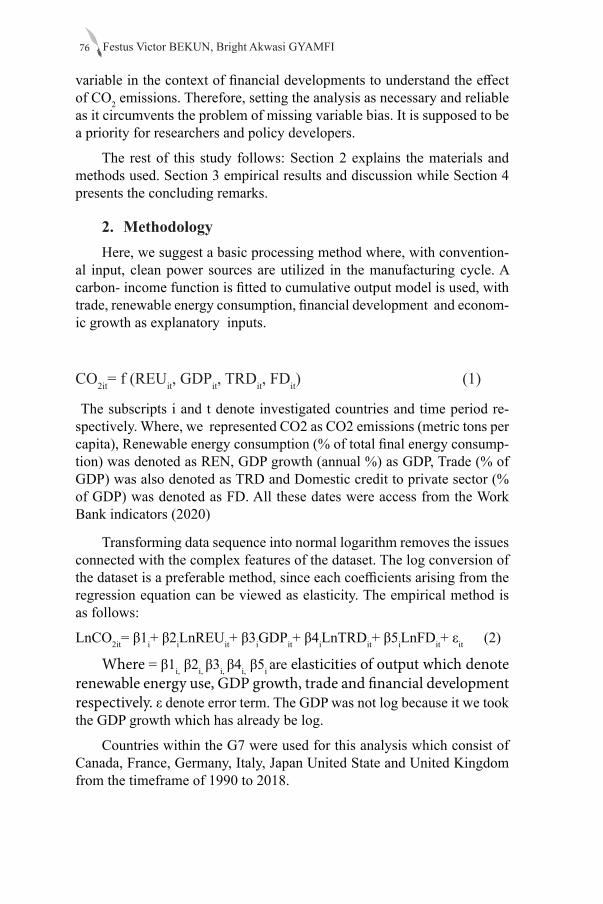
Festus Victor BEKUN, Bright Akwasi GYAMFI76
variable in the context of financial developments to understand the effect of CO2 emissions. Therefore, setting the analysis as necessary and reliable as it circumvents the problem of missing variable bias. It is supposed to be a priority for researchers and policy developers.
The rest of this study follows: Section 2 explains the materials and methods used. Section 3 empirical results and discussion while Section 4 presents the concluding remarks.
2. MethodologyHere, we suggest a basic processing method where, with convention-
al input, clean power sources are utilized in the manufacturing cycle. A carbon- income function is fitted to cumulative output model is used, with trade, renewable energy consumption, financial development and econom-ic growth as explanatory inputs.
CO2it= f (REUit, GDPit, TRDit, FDit) (1)
The subscripts i and t denote investigated countries and time period re-spectively. Where, we represented CO2 as CO2 emissions (metric tons per capita), Renewable energy consumption (% of total final energy consump-tion) was denoted as REN, GDP growth (annual %) as GDP, Trade (% of GDP) was also denoted as TRD and Domestic credit to private sector (% of GDP) was denoted as FD. All these dates were access from the Work Bank indicators (2020)
Transforming data sequence into normal logarithm removes the issues connected with the complex features of the dataset. The log conversion of the dataset is a preferable method, since each coefficients arising from the regression equation can be viewed as elasticity. The empirical method is as follows:
LnCO2it= β1i+ β2iLnREUit+ β3iGDPit+ β4iLnTRDit+ β5iLnFDit+ εit (2)
Where = β1i, β2i, β3i, β4i, β5i are elasticities of output which denote renewable energy use, GDP growth, trade and financial development respectively. ε denote error term. The GDP was not log because it we took the GDP growth which has already be log.
Countries within the G7 were used for this analysis which consist of Canada, France, Germany, Italy, Japan United State and United Kingdom from the timeframe of 1990 to 2018.
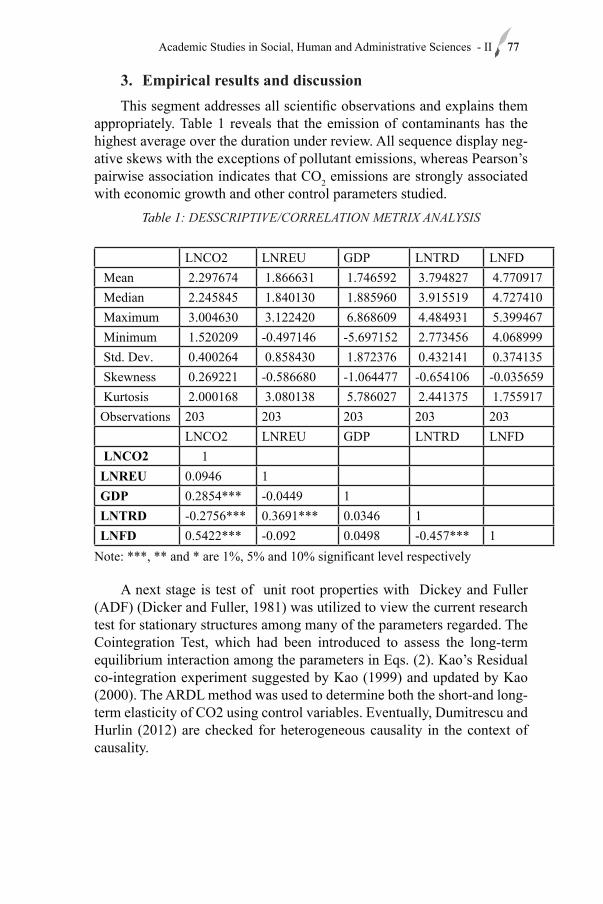
77Academic Studies in Social, Human and Administrative Sciences - II 77
3. Empirical results and discussionThis segment addresses all scientific observations and explains them
appropriately. Table 1 reveals that the emission of contaminants has the highest average over the duration under review. All sequence display neg-ative skews with the exceptions of pollutant emissions, whereas Pearson’s pairwise association indicates that CO2 emissions are strongly associated with economic growth and other control parameters studied.
Table 1: DESSCRIPTIVE/CORRELATION METRIX ANALYSIS
LNCO2 LNREU GDP LNTRD LNFD Mean 2.297674 1.866631 1.746592 3.794827 4.770917 Median 2.245845 1.840130 1.885960 3.915519 4.727410 Maximum 3.004630 3.122420 6.868609 4.484931 5.399467 Minimum 1.520209 -0.497146 -5.697152 2.773456 4.068999 Std. Dev. 0.400264 0.858430 1.872376 0.432141 0.374135 Skewness 0.269221 -0.586680 -1.064477 -0.654106 -0.035659 Kurtosis 2.000168 3.080138 5.786027 2.441375 1.755917Observations 203 203 203 203 203
LNCO2 LNREU GDP LNTRD LNFD LNCO2 1LNREU 0.0946 1GDP 0.2854*** -0.0449 1LNTRD -0.2756*** 0.3691*** 0.0346 1LNFD 0.5422*** -0.092 0.0498 -0.457*** 1
Note: ***, ** and * are 1%, 5% and 10% significant level respectively
A next stage is test of unit root properties with Dickey and Fuller (ADF) (Dicker and Fuller, 1981) was utilized to view the current research test for stationary structures among many of the parameters regarded. The Cointegration Test, which had been introduced to assess the long-term equilibrium interaction among the parameters in Eqs. (2). Kao’s Residual co-integration experiment suggested by Kao (1999) and updated by Kao (2000). The ARDL method was used to determine both the short-and long-term elasticity of CO2 using control variables. Eventually, Dumitrescu and Hurlin (2012) are checked for heterogeneous causality in the context of causality.
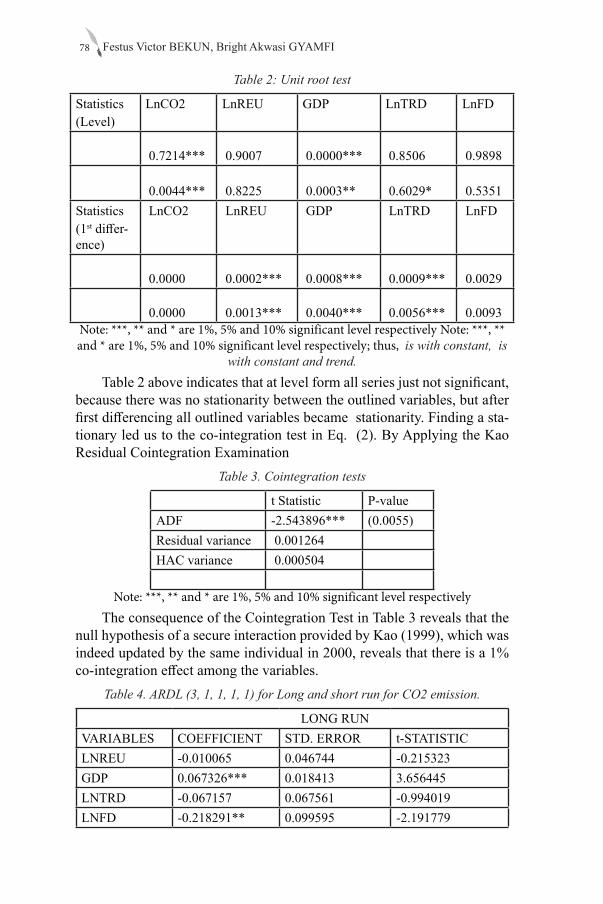
Festus Victor BEKUN, Bright Akwasi GYAMFI78
Table 2: Unit root test
Statistics (Level)
LnCO2 LnREU GDP LnTRD LnFD
0.7214*** 0.9007 0.0000*** 0.8506 0.9898
0.0044*** 0.8225 0.0003** 0.6029* 0.5351Statistics (1st differ-ence)
LnCO2 LnREU GDP LnTRD LnFD
0.0000 0.0002*** 0.0008*** 0.0009*** 0.0029
0.0000 0.0013*** 0.0040*** 0.0056*** 0.0093Note: ***, ** and * are 1%, 5% and 10% significant level respectively Note: ***, ** and * are 1%, 5% and 10% significant level respectively; thus, is with constant, is
with constant and trend.Table 2 above indicates that at level form all series just not significant,
because there was no stationarity between the outlined variables, but after first differencing all outlined variables became stationarity. Finding a sta-tionary led us to the co-integration test in Eq. (2). By Applying the Kao Residual Cointegration Examination
Table 3. Cointegration tests
t Statistic P-valueADF -2.543896*** (0.0055)Residual variance 0.001264HAC variance 0.000504
Note: ***, ** and * are 1%, 5% and 10% significant level respectivelyThe consequence of the Cointegration Test in Table 3 reveals that the
null hypothesis of a secure interaction provided by Kao (1999), which was indeed updated by the same individual in 2000, reveals that there is a 1% co-integration effect among the variables.
Table 4. ARDL (3, 1, 1, 1, 1) for Long and short run for CO2 emission.
LONG RUN VARIABLES COEFFICIENT STD. ERROR t-STATISTICLNREU -0.010065 0.046744 -0.215323GDP 0.067326*** 0.018413 3.656445LNTRD -0.067157 0.067561 -0.994019LNFD -0.218291** 0.099595 -2.191779
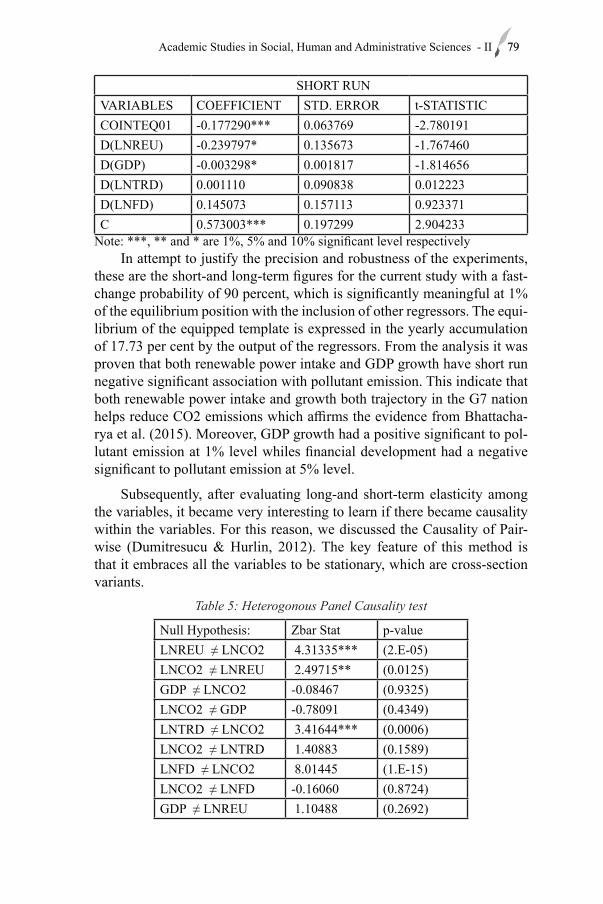
79Academic Studies in Social, Human and Administrative Sciences - II 79
SHORT RUN VARIABLES COEFFICIENT STD. ERROR t-STATISTICCOINTEQ01 -0.177290*** 0.063769 -2.780191D(LNREU) -0.239797* 0.135673 -1.767460D(GDP) -0.003298* 0.001817 -1.814656D(LNTRD) 0.001110 0.090838 0.012223D(LNFD) 0.145073 0.157113 0.923371C 0.573003*** 0.197299 2.904233
Note: ***, ** and * are 1%, 5% and 10% significant level respectivelyIn attempt to justify the precision and robustness of the experiments,
these are the short-and long-term figures for the current study with a fast-change probability of 90 percent, which is significantly meaningful at 1% of the equilibrium position with the inclusion of other regressors. The equi-librium of the equipped template is expressed in the yearly accumulation of 17.73 per cent by the output of the regressors. From the analysis it was proven that both renewable power intake and GDP growth have short run negative significant association with pollutant emission. This indicate that both renewable power intake and growth both trajectory in the G7 nation helps reduce CO2 emissions which affirms the evidence from Bhattacha-rya et al. (2015). Moreover, GDP growth had a positive significant to pol-lutant emission at 1% level whiles financial development had a negative significant to pollutant emission at 5% level.
Subsequently, after evaluating long-and short-term elasticity among the variables, it became very interesting to learn if there became causality within the variables. For this reason, we discussed the Causality of Pair-wise (Dumitresucu & Hurlin, 2012). The key feature of this method is that it embraces all the variables to be stationary, which are cross-section variants.
Table 5: Heterogonous Panel Causality test
Null Hypothesis: Zbar Stat p-valueLNREU ≠ LNCO2 4.31335*** (2.E-05)LNCO2 ≠ LNREU 2.49715** (0.0125)GDP ≠ LNCO2 -0.08467 (0.9325)LNCO2 ≠ GDP -0.78091 (0.4349)LNTRD ≠ LNCO2 3.41644*** (0.0006)LNCO2 ≠ LNTRD 1.40883 (0.1589)LNFD ≠ LNCO2 8.01445 (1.E-15)LNCO2 ≠ LNFD -0.16060 (0.8724)GDP ≠ LNREU 1.10488 (0.2692)
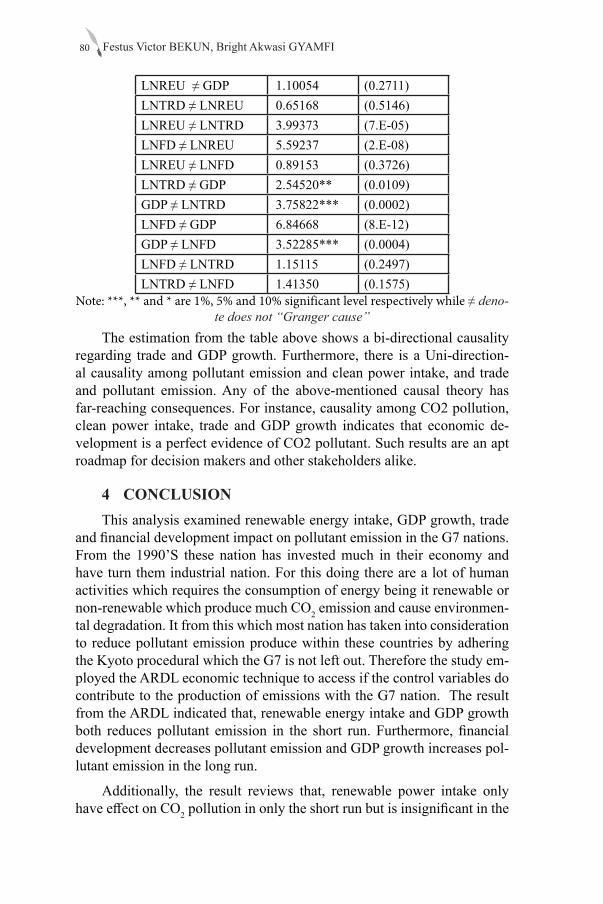
Festus Victor BEKUN, Bright Akwasi GYAMFI80
LNREU ≠ GDP 1.10054 (0.2711)LNTRD ≠ LNREU 0.65168 (0.5146)LNREU ≠ LNTRD 3.99373 (7.E-05)LNFD ≠ LNREU 5.59237 (2.E-08)LNREU ≠ LNFD 0.89153 (0.3726)LNTRD ≠ GDP 2.54520** (0.0109)GDP ≠ LNTRD 3.75822*** (0.0002)LNFD ≠ GDP 6.84668 (8.E-12)GDP ≠ LNFD 3.52285*** (0.0004)LNFD ≠ LNTRD 1.15115 (0.2497)LNTRD ≠ LNFD 1.41350 (0.1575)
Note: ***, ** and * are 1%, 5% and 10% significant level respectively while ≠ deno-te does not “Granger cause”
The estimation from the table above shows a bi-directional causality regarding trade and GDP growth. Furthermore, there is a Uni-direction-al causality among pollutant emission and clean power intake, and trade and pollutant emission. Any of the above-mentioned causal theory has far-reaching consequences. For instance, causality among CO2 pollution, clean power intake, trade and GDP growth indicates that economic de-velopment is a perfect evidence of CO2 pollutant. Such results are an apt roadmap for decision makers and other stakeholders alike.
4 CONCLUSIONThis analysis examined renewable energy intake, GDP growth, trade
and financial development impact on pollutant emission in the G7 nations. From the 1990’S these nation has invested much in their economy and have turn them industrial nation. For this doing there are a lot of human activities which requires the consumption of energy being it renewable or non-renewable which produce much CO2 emission and cause environmen-tal degradation. It from this which most nation has taken into consideration to reduce pollutant emission produce within these countries by adhering the Kyoto procedural which the G7 is not left out. Therefore the study em-ployed the ARDL economic technique to access if the control variables do contribute to the production of emissions with the G7 nation. The result from the ARDL indicated that, renewable energy intake and GDP growth both reduces pollutant emission in the short run. Furthermore, financial development decreases pollutant emission and GDP growth increases pol-lutant emission in the long run.
Additionally, the result reviews that, renewable power intake only have effect on CO2 pollution in only the short run but is insignificant in the
81Academic Studies in Social, Human and Administrative Sciences - II 81
long-run. It therefor advisable to the policymakers within these nations to continually support policies like subsidies for infrastructure insulations, tax benefits and financial assistance to the firms which produce these in-frastructures. Furthermore, the government should support research and development (R&D) in energy innovations and the adoption of renewable energy techologies, which are reputed to be more environmentally friendly.
REFERENCES
Adedoyin, F. F., Gumede, M. I., Bekun, F. V., Etokakpan, M. U., & Balsalobre-lorente, D. (2020). Modelling coal rent, economic growth and CO2 emissions: Does regulatory quality matter in BRICS economies?. Science of the Total Environment, 710, 136284.
Bekun, F. V., Alola, A. A., & Sarkodie, S. A. (2019a). Toward a sustainable environment: Nexus between CO2 emissions, resource rent, renewable and nonrenewable energy in 16-EU countries. Science of the Total Environment, 657, 1023-1029.
Bekun, F. V., Emir, F., & Sarkodie, S. A. (2019b). Another look at the relationship between energy consumption, carbon dioxide emissions, and economic growth in South Africa. Science of the Total Environment, 655, 759-765.
Bhattacharya M, Rafiq S, Bhattacharya S. (2015).The role of technology on the dynamics of coal consumption-economic growth: new evidence from China. Appl Energy; 154:686–95.
Bhattacharya, M., Paramati, S. R., Ozturk, I., & Bhattacharya, S. (2016). The effect of renewable energy consumption on economic growth: Evidence from top 38 countries. Applied Energy, 162, 733-741.
Costantini V, Martini C. (2010).The causality between energy consumption and economic growth: a multi-sectoral analysis using non-stationary Cointegrated panel data. Energy Econ ; 32:591–603.
Dickey, D. A., & Fuller, W. A. (1981). Likelihood ratio statistics for autoregressive time series with a unit root. Econometrica: journal of the Econometric Society, 1057-1072.
Dumitrescu E-I, Hurlin C. 2012.Testing for Granger non-causality in heterogeneous panels. Economic Modelling; 29:1450–60.
IEA (2009), World Energy Outlook. OECD/IEA, Paris.Kao-Chihwa (1999) Spurious Regression and Residual-Based Tests for
Cointegration in Panel Data. Journal of Econometrics 90; 1-44. Kao-Chihwa (2000) On the Estimation and Inference of a Cointegrated
Regression in Panel Data. Advances of Econometrics. 15; 7-51.Ozturk, I. (2010). A literature survey on energy–growth nexus. Energy

Festus Victor BEKUN, Bright Akwasi GYAMFI82
policy, 38(1), 340-349.Ozturk, S., & Bicimveren, L. (2018). Determination of the effect of
information and communication technologies (ICTs) to unit labour cost: G7 countries examples. New Trends and Issues Proceedings on Humanities and Social Sciences, 5(2), 121-129.
Sustaınable Energy for All (2015), at <http://www.se4all.org/> [accessed December, 2019].
Wolde-Rufael Y. (2009) Energy consumption and economic growth: the experience of African countries revisited. Energy Econ; 31:217–24.
World Bank (2019) World Development Indicators, http://databank. worldbank.org/data/reports.aspx?source=world-developmentindicators (Reached on February 2 2020)
Chapter 6A REVIEW OF THE COMPLAINTS IN THE
TRAVEL WEBSITES ABOUT HOSPITALITY ENTERPRISES
Filiz ASLAN ÇETİN1, Nezefet Havva KADİROĞLU2
1 Assist. Prof., Kafkas University, Faculty of Economics and Administrative Sciences, Depart-ment of Business, [email protected] PhD Student, Kafkas University, Institute of Social Sciences, Department of Business, [email protected].

85Academic Studies in Social, Human and Administrative Sciences - II 85
IntroductionAs the proportion of the service sector within the economy increases,
the competition among the enterprises in this sector also increases. There-fore, the customer satisfaction has increasingly gained importance. It is ob-served that the share of the hospitality enterprises within the service sector also increases. In this context, it is a very sensitive issue for the managers of the hospitality enterprises to be able to reach customers complaints. In service enterprises, customer complaints are generally emerged from cer-tain factors concerning employees, customers, and products. Some other complaints emerge from prices and distribution.
In the past, reaching customer complaints for the hospitality enterpris-es was only possible through satisfaction surveys applied to customers. But the reliability of these surveys was not as high as customer reviews posted on internet travel websites. That’s why enterprises are now able to access the unbiased feedbacks of customers thanks to the customer reviews on travel websites. If the enterprise has an effective complaint management system and a high rate of responsiveness to the reviews, customer loyalty is likely to be high.
For these reasons, the aim of this study was to categorize the com-plaints in reviews posted on Tripadvisor travel website about hospitality enterprises operating in Kars and to identify the factors that the customers particularly complained about. It is significant that this study will fill the gap in the literature since there is no previous study conducted on assess-ment of hospitality enterprises in Kars province.
Literature ReviewIt was determined that this study is in parallel to the following pre-
vious studies in the related literature; Alrawadieh and Demirkol (2015), Güzel (2014), Kılıç and Ok (2012), Şahin et al., (2017), Aylan et al. (2016), Kılıç et al., (2013) and Unur et al. (2010).
In the study conducted by Alrawadieh and Demirkol (2015), the com-plaints were examined that were posted about 10 highest-priced five-star hotels in Istanbul. As a result of the study, it was observed that the prob-lems receiving the highest number of complaints were the price and the physical environment, which included the quality and cleanliness of the hospitality enterprises.
In the study conducted by Güzel (2014), complaints were examined about a hotel with brand value, ultimately revealing that the mostly com-plained issues for this hotel were the behaviors of other customers in the hotel and themes concerning the physical environment.
Filiz ASLAN ÇETİN, Nezefet Havva KADİROĞLU86
Kılıç and Ok (2012) conducted a study at a five-star hotel in Istanbul to determine customer complaints through the survey method. In the study, it was concluded that price was the second important element.
In the study conducted by Şahin et al., (2017), the reviews posted on travel websites for hospitality enterprises in Bishkek were examined and the most complained issue was determined to be product-related factors.
In the study conducted by Aylan et al., (2016), it was intended to de-termine the complaint categories of customers who received service from thermal hotel enterprises, and to identify to what extent thermal hotel en-terprises responded to these complaints. The study concluded that the pric-es and advertising campaigns had the highest number of complaints from the customers of the thermal hotels.
In another study conducted by Kılıç et al., (2013), the effects of positive attitudes and behaviors, which were displayed by the employees to solve the service quality complaints of the customers, on the perception of service quality were examined. As a result of the study, it was observed that the cus-tomers, who received positive responses to their complaints, displayed both behavioral and attitudinal dimensions of loyalty such as using the service again and recommending that enterprise to friends and relatives.
In the study conducted by Unur et al., (2010), it was aimed to explain the relationship between the concepts of customer satisfaction and custom-er complaint. The study focused on the complaints encountered in package tours organized by travel agencies and the frequency of these complaints. In order to determine the extent of the complaints, the content analysis was conducted for 123 complaints posted on “www.sikayetvar.com.tr” website about package tours. As a result of the analysis, it was determined that trav-el agencies received the highest number of complaints about the behavior of agency officials and employees as well as about prices.
Importance of Customer Satisfaction for Hospitality EnterprisesUnderstanding the importance of customer satisfaction for hospitality
enterprises depend primarily on understanding the concept of customer satisfaction. Satisfaction can be treated as the response of the customer for the service (Bulut, 2011: 390).
There are numerous definitions for the concept of customer satisfac-tion. Duman (2003: 47) described customer satisfaction as “the cognitive and emotional response to the service that results from the comparison of the expectations and experiences of customers concerning the service.” According to another definition, customer satisfaction is a psychological
87Academic Studies in Social, Human and Administrative Sciences - II 87
concept that expresses the good feeling or satisfaction for gaining what the customer expects from a product or service (Pizam and Ellis, 1999: 327).
The most frequently used tool for measuring customer satisfaction in hospitality enterprises is “review documents for the guests” (Su, 2004). Initially, these documents were left in the guest rooms in an attempt to gain feedbacks, whereby only the managers of the hotels could benefit from the information obtained through this traditional method; however, today, travelers also have access to this information through various platforms such as Tripadvisor (Stringam and Gerdes Jr, 2010).
In fact, the implementation of complaint management begins with the inspection of all instruments that have a direct impact on customer satis-faction. Problem areas are identified and an action plan is developed. This action plan consists of strategic applications for complaint management (Çeltek, 2013: 70).
On the other hand, customer complaints are a reality of the organi-zational life. Customers are dissatisfied when they receive lower perfor-mances from the enterprises and enterprise employees compared to what they expected, or when they believe they are being treated unfairly (Ang and Buttle, 2012: 1021). In this context, customer satisfaction is vital for hospitality enterprises. Therefore, the owners of the hospitality enterprise should keep track of whether the customers are satisfied with the service they receive and whether they are doing well in managing complaints.
In the study, the problems that cause dissatisfaction of the customers were examined within four clusters: product-related, price-related, cus-tomer-related and distribution problems.
Product-Related Problems Hotel enterprises are service producing businesses. The most basic
feature of service is that it is abstract. For this reason, hotel customers often evaluate the service they receive based on the tangible features they encounter. For instance, from the moment the customer first enters the ho-tel, the interior and decoration of the hotel shape the first impressions about the quality of the service. In addition, food and beverage services, facili-ties offered and additional activities and opportunities such as a pool, gym and restaurant are also visible physical assets that the customer can easily perceive and be influenced in terms of customer satisfaction. Customer satisfaction can be measured in parallel to their level of benefit when using the mentioned physical evidence (Yılmaz and Çemrek, 2016: 185).
Filiz ASLAN ÇETİN, Nezefet Havva KADİROĞLU88
Price-Related ProblemsIn the hospitality sector, where competition is very high, it is very
difficult for enterprises to profit and ensure continuity of this profit. There-fore, when determining their prices, hospitality enterprises aim to achieve both profit and continuity of customer satisfaction. Hospitality activities should not only be seen as a day-to-day gain, but rather as a continuous activity (Kozak, 2007: 148).
Customer-Related ProblemsDissatisfaction occurs when customer expectations exceed the exist-
ing product and service performance; on the contrary, if product and ser-vice performance meets customer expectations, satisfaction occurs. How-ever, the problems experienced in hospitality enterprises are not always caused by the enterprises, and sometimes customers can be the cause of problems as well. For example, there may be problems caused by the regret that customers experience when they act with hearsay without having full knowledge of the business. Another example is the problems arising from the fact that customers don’t know the channels to solve the problems they face (Mil, 2014: 32).
Distribution ProblemsWith the improvements in technology, new distribution channels have
also emerged in recent years. These include social media tools or travel web-sites through which booking can be made online. Inconsistent information posted on these distribution channels may lead to distribution problems. For example, a tourist, who relies on the information in a brochure showing the spectacular sea view together with the greenery of a holiday village, the well-arranged beach view, the gleaming room photos and the quality of ser-vice features with all kinds of equipment, can ultimately encounter a dirty environment, a stony beach, bad showers etc. (Hayta, 2008: 45).
Method
Aim and Significance of the ResearchThe hospitality enterprises that serve in the tourism sector, which is
one of the sectors with an intense competition, have to exercise due dil-igence to customer satisfaction in order to maintain their presence and improve the quality of their services. Therefore, following the travel web-sites, where customers share their experiences, evaluating the complaints, suggestions and recommendations and responding immediately will both increase customer satisfaction and help the hospitality enterprise to recog-nize its own shortcomings.
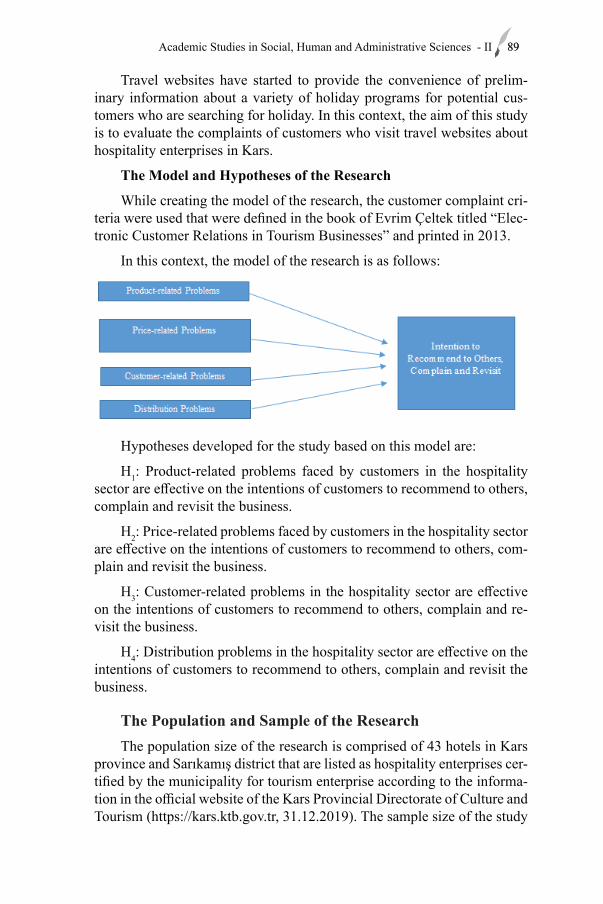
89Academic Studies in Social, Human and Administrative Sciences - II 89
Travel websites have started to provide the convenience of prelim-inary information about a variety of holiday programs for potential cus-tomers who are searching for holiday. In this context, the aim of this study is to evaluate the complaints of customers who visit travel websites about hospitality enterprises in Kars.
The Model and Hypotheses of the Research
While creating the model of the research, the customer complaint cri-teria were used that were defined in the book of Evrim Çeltek titled “Elec-tronic Customer Relations in Tourism Businesses” and printed in 2013.
In this context, the model of the research is as follows:
Hypotheses developed for the study based on this model are:
H1: Product-related problems faced by customers in the hospitality sector are effective on the intentions of customers to recommend to others, complain and revisit the business.
H2: Price-related problems faced by customers in the hospitality sector are effective on the intentions of customers to recommend to others, com-plain and revisit the business.
H3: Customer-related problems in the hospitality sector are effective on the intentions of customers to recommend to others, complain and re-visit the business.
H4: Distribution problems in the hospitality sector are effective on the intentions of customers to recommend to others, complain and revisit the business.
The Population and Sample of the ResearchThe population size of the research is comprised of 43 hotels in Kars
province and Sarıkamış district that are listed as hospitality enterprises cer-tified by the municipality for tourism enterprise according to the informa-tion in the official website of the Kars Provincial Directorate of Culture and Tourism (https://kars.ktb.gov.tr, 31.12.2019). The sample size of the study
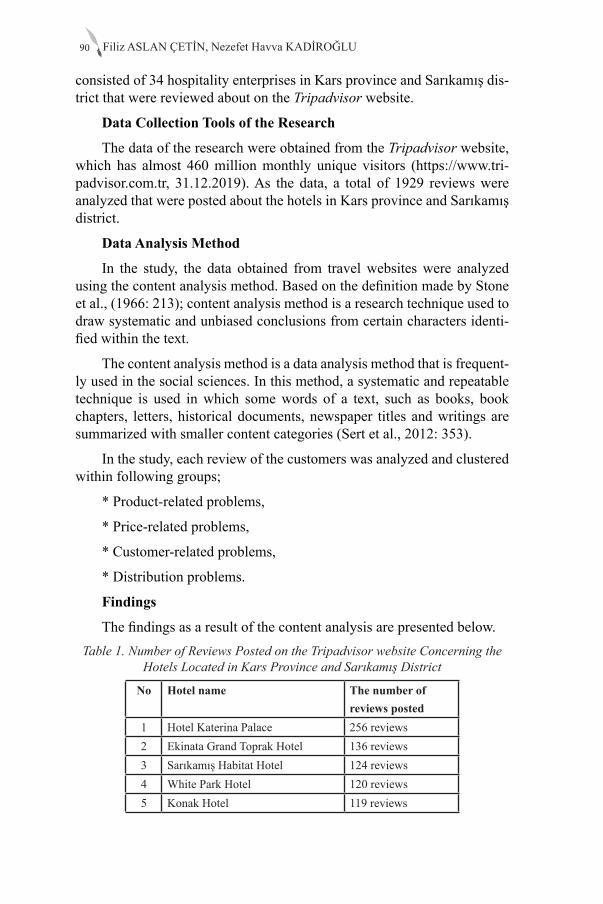
Filiz ASLAN ÇETİN, Nezefet Havva KADİROĞLU90
consisted of 34 hospitality enterprises in Kars province and Sarıkamış dis-trict that were reviewed about on the Tripadvisor website.
Data Collection Tools of the Research
The data of the research were obtained from the Tripadvisor website, which has almost 460 million monthly unique visitors (https://www.tri-padvisor.com.tr, 31.12.2019). As the data, a total of 1929 reviews were analyzed that were posted about the hotels in Kars province and Sarıkamış district.
Data Analysis Method
In the study, the data obtained from travel websites were analyzed using the content analysis method. Based on the definition made by Stone et al., (1966: 213); content analysis method is a research technique used to draw systematic and unbiased conclusions from certain characters identi-fied within the text.
The content analysis method is a data analysis method that is frequent-ly used in the social sciences. In this method, a systematic and repeatable technique is used in which some words of a text, such as books, book chapters, letters, historical documents, newspaper titles and writings are summarized with smaller content categories (Sert et al., 2012: 353).
In the study, each review of the customers was analyzed and clustered within following groups;
* Product-related problems,
* Price-related problems,
* Customer-related problems,
* Distribution problems.
Findings
The findings as a result of the content analysis are presented below.Table 1. Number of Reviews Posted on the Tripadvisor website Concerning the
Hotels Located in Kars Province and Sarıkamış District
No Hotel name The number of reviews posted
1 Hotel Katerina Palace 256 reviews2 Ekinata Grand Toprak Hotel 136 reviews3 Sarıkamış Habitat Hotel 124 reviews4 White Park Hotel 120 reviews5 Konak Hotel 119 reviews
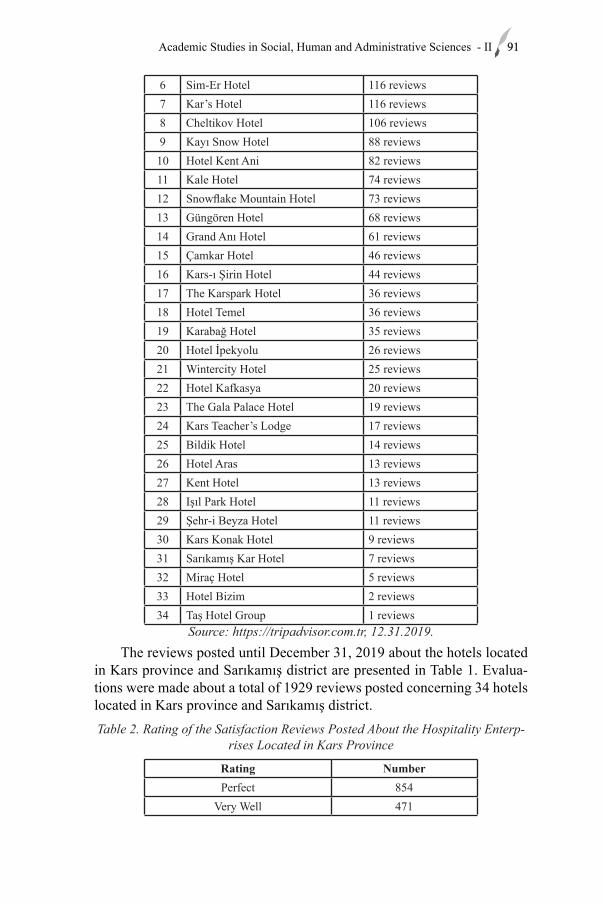
91Academic Studies in Social, Human and Administrative Sciences - II 91
6 Sim-Er Hotel 116 reviews7 Kar’s Hotel 116 reviews8 Cheltikov Hotel 106 reviews9 Kayı Snow Hotel 88 reviews10 Hotel Kent Ani 82 reviews11 Kale Hotel 74 reviews12 Snowflake Mountain Hotel 73 reviews13 Güngören Hotel 68 reviews14 Grand Anı Hotel 61 reviews15 Çamkar Hotel 46 reviews16 Kars-ı Şirin Hotel 44 reviews17 The Karspark Hotel 36 reviews18 Hotel Temel 36 reviews19 Karabağ Hotel 35 reviews20 Hotel İpekyolu 26 reviews21 Wintercity Hotel 25 reviews22 Hotel Kafkasya 20 reviews23 The Gala Palace Hotel 19 reviews24 Kars Teacher’s Lodge 17 reviews25 Bildik Hotel 14 reviews26 Hotel Aras 13 reviews27 Kent Hotel 13 reviews28 Işıl Park Hotel 11 reviews29 Şehr-i Beyza Hotel 11 reviews30 Kars Konak Hotel 9 reviews31 Sarıkamış Kar Hotel 7 reviews32 Miraç Hotel 5 reviews33 Hotel Bizim 2 reviews34 Taş Hotel Group 1 reviews
Source: https://tripadvisor.com.tr, 12.31.2019.The reviews posted until December 31, 2019 about the hotels located
in Kars province and Sarıkamış district are presented in Table 1. Evalua-tions were made about a total of 1929 reviews posted concerning 34 hotels located in Kars province and Sarıkamış district. Table 2. Rating of the Satisfaction Reviews Posted About the Hospitality Enterp-
rises Located in Kars Province
Rating NumberPerfect 854
Very Well 471
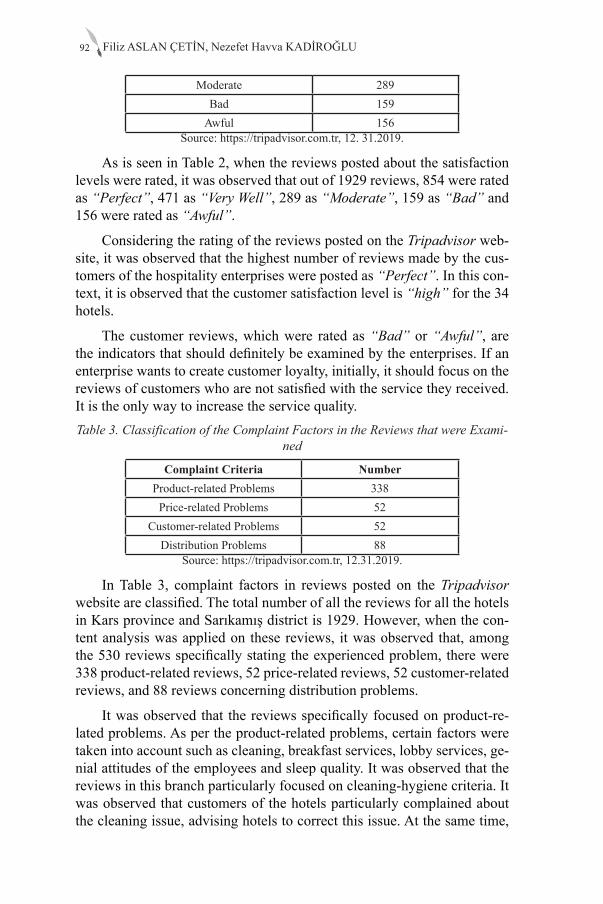
Filiz ASLAN ÇETİN, Nezefet Havva KADİROĞLU92
Moderate 289Bad 159
Awful 156Source: https://tripadvisor.com.tr, 12. 31.2019.
As is seen in Table 2, when the reviews posted about the satisfaction levels were rated, it was observed that out of 1929 reviews, 854 were rated as “Perfect”, 471 as “Very Well”, 289 as “Moderate”, 159 as “Bad” and 156 were rated as “Awful”.
Considering the rating of the reviews posted on the Tripadvisor web-site, it was observed that the highest number of reviews made by the cus-tomers of the hospitality enterprises were posted as “Perfect”. In this con-text, it is observed that the customer satisfaction level is “high” for the 34 hotels.
The customer reviews, which were rated as “Bad” or “Awful”, are the indicators that should definitely be examined by the enterprises. If an enterprise wants to create customer loyalty, initially, it should focus on the reviews of customers who are not satisfied with the service they received. It is the only way to increase the service quality. Table 3. Classification of the Complaint Factors in the Reviews that were Exami-
ned
Complaint Criteria NumberProduct-related Problems 338
Price-related Problems 52Customer-related Problems 52
Distribution Problems 88Source: https://tripadvisor.com.tr, 12.31.2019.
In Table 3, complaint factors in reviews posted on the Tripadvisor website are classified. The total number of all the reviews for all the hotels in Kars province and Sarıkamış district is 1929. However, when the con-tent analysis was applied on these reviews, it was observed that, among the 530 reviews specifically stating the experienced problem, there were 338 product-related reviews, 52 price-related reviews, 52 customer-related reviews, and 88 reviews concerning distribution problems.
It was observed that the reviews specifically focused on product-re-lated problems. As per the product-related problems, certain factors were taken into account such as cleaning, breakfast services, lobby services, ge-nial attitudes of the employees and sleep quality. It was observed that the reviews in this branch particularly focused on cleaning-hygiene criteria. It was observed that customers of the hotels particularly complained about the cleaning issue, advising hotels to correct this issue. At the same time,
93Academic Studies in Social, Human and Administrative Sciences - II 93
other frequently mentioned issues were about the design and usefulness of the items in the room, the comfort of the beds, and the functionality of the Wi-Fi service. It was complained that the intense smells of the meals are even felt in the rooms. It was also found that certain criteria were evaluated such as the adequacy of restaurant services provided, and adequacy, vari-ety and quality of meals and breakfasts. Furthermore, the distance of the hotel to the city center and to the historical sites was also evaluated.
Second, concerning the distribution problems criterion, certain re-views were taken into consideration in which the customers purchasing the service through the distribution channels realized during the consump-tion of the service that the information they acquired through these chan-nels was incorrect or incomplete and expressed regret about this situation. In these reviews, it was particularly emphasized that reservations made through the internet were more expensive than those made over telephone; in such cases, it is considered that the enterprise is not a reliable enterprise. Another factor that was complained about in the reviews was that when the customer arrived at the hotel they were told that there was no such reserva-tion, even though the reservation was transacted over the internet.
It was observed that particularly the price-performance criterion was taken into consideration for the price-related problems. In the reviews of the customers, they explained that the service was not sufficient in ex-change for what they paid. Hospitality enterprises offer their customers different pricing options such as full board or half board. However, it was observed that it was not the case in the practice. It was observed in the reviews that customers were charged extra payments for drinks services offered in the lobby despite booking full board. Similarly, despite booking for “breakfasts included”, customers complained about the lack of service offered in terms of variety or quantity. Another criterion complained by the customers was about the restaurant services particularly for dinners that remained far below their expectations in the hotels which they preferred for being “5-star” or “4-star”. Therefore, it is observed that there is a deep gap between the price paid by the customers and the performance of the hospitality enterprise.
It was realized that the customer-related complaints are including re-gretful statements of the customers. It was often mentioned that customers had to stay in other hotels because there was no room. In addition, custom-ers expressed their regrets when they encountered a service that was far below their expectations particularly in the hotels that they preferred with high expectations due to the positive reviews made on travel websites.
In this context, when the results of the hypotheses developed for the study were examined, it was observed that all four basic hypotheses were accepted.
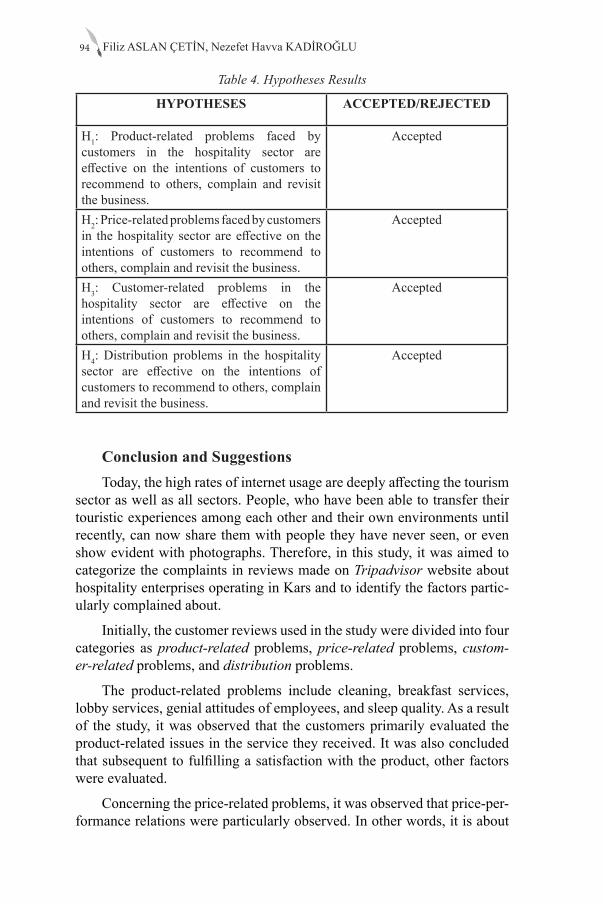
Filiz ASLAN ÇETİN, Nezefet Havva KADİROĞLU94
Table 4. Hypotheses Results
HYPOTHESES ACCEPTED/REJECTED
H1: Product-related problems faced by customers in the hospitality sector are effective on the intentions of customers to recommend to others, complain and revisit the business.
Accepted
H2: Price-related problems faced by customers in the hospitality sector are effective on the intentions of customers to recommend to others, complain and revisit the business.
Accepted
H3: Customer-related problems in the hospitality sector are effective on the intentions of customers to recommend to others, complain and revisit the business.
Accepted
H4: Distribution problems in the hospitality sector are effective on the intentions of customers to recommend to others, complain and revisit the business.
Accepted
Conclusion and Suggestions Today, the high rates of internet usage are deeply affecting the tourism
sector as well as all sectors. People, who have been able to transfer their touristic experiences among each other and their own environments until recently, can now share them with people they have never seen, or even show evident with photographs. Therefore, in this study, it was aimed to categorize the complaints in reviews made on Tripadvisor website about hospitality enterprises operating in Kars and to identify the factors partic-ularly complained about.
Initially, the customer reviews used in the study were divided into four categories as product-related problems, price-related problems, custom-er-related problems, and distribution problems.
The product-related problems include cleaning, breakfast services, lobby services, genial attitudes of employees, and sleep quality. As a result of the study, it was observed that the customers primarily evaluated the product-related issues in the service they received. It was also concluded that subsequent to fulfilling a satisfaction with the product, other factors were evaluated.
Concerning the price-related problems, it was observed that price-per-formance relations were particularly observed. In other words, it is about
95Academic Studies in Social, Human and Administrative Sciences - II 95
whether the customers are satisfied enough with the product they receive in exchange for the money they pay. The reviews indicated that the customers were satisfied with the hotels located in Kars concerning the price-perfor-mance relationship, but not for the hotels located in Sarıkamış. Customers find the hotels in Sarıkamış expensive without providing the promised ser-vice.
In the reviews, it was evaluated that the regretful statements of cus-tomers were about customer-related problems. Customers were affected by the reviews made on websites of the hospitality enterprises and expressed regret that they preferred them but received a service that was below their expectations. Among the reviews examined, 52 reviews clearly identified customer-related problems. In order to eliminate the shortcomings of the businesses, the enterprise owners should also evaluate such reviews in an attempt to increase the service to the expected level.
Distribution problems represent the issues that customers experience as a result of incomplete information they obtain from distribution chan-nels such as social media tools, hospitality websites and travel websites. Enterprises should carefully monitor their websites, social media channels and reviews of their enterprises on travel websites. In particular, it is rec-ommended that the price policy applied in the enterprise should be consis-tent among the distribution channels.
Due to the time and travel website limitation applied in the study, it was conducted within a specific date range and over a single travel web-site. Therefore, it is suggested that further studies should be conducted on different travel websites and in a different date range.
As the conclusion of the study, which was conducted on hotels in Kars province and Sarıkamış district, it was observed that the responsiveness rates of these hotels were low for the customer reviews posted on travel websites. Therefore, it is recommended that hospitality enterprises located in Kars province and Sarıkamış district should not only use travel websites more actively but also respond more to the customer reviews.
Filiz ASLAN ÇETİN, Nezefet Havva KADİROĞLU96
ReferencesAlrawadieh, Z., & Demirkol, Ş. (2015). Konaklama İşletmelerinde
E-Şikâyet Yönetimi: İstanbul’daki Beş Yıldızlı Oteller Üzerinde Bir Çalışma. Nişantaşı Üniversitesi Sosyal Bilimler Dergisi, 3 (1), 132-151.
Ang, L. & Buttle, F. (2012). Complaints-Handling Processes and Organisational Benefits: An ISO 10002-Based Investigation. Journal of Marketing Management, 28 (9-10), 1021-1042.
Aylan, S., Arpacı, Ö. & Celiloğlu, F. K. (2016). Bir İnternet Şikâyet Forumundaki Termal Otellere Yönelik Şikâyetlerin İncelenmesi. Çankırı Karatekin Üniversitesi Sosyal Bilimler Enstitüsü Dergisi, 7 (1), 49-68.
Bulut, Y. (2011). Otellerde Müşteri Memnuniyeti ve Bir Uygulama (Samsun Örneği). Uluslararası Sosyal Araştırmalar Dergisi, 4 (18), 390-403.
Çeltek, E. (2013). Turizm İşletmelerinde Elektronik Müşteri İlişkileri (E-MİY). Ankara: Detay Yayıncılık.
Duman, T. (2003). Richard Oliver’s Perspectives on Consumer Satisfaction And Consumer Value: A Theoretical Cross Examination. Dokuz Eylül Üniversitesi Sosyal Bilimler Enstitüsü Dergisi, 5 (2), 45-56.
Güzel, F. Ö. (2014). Marka İtibarını Korumada Şikâyet Takibi: Çevrimiçi Seyahat 2.0 Bilgi Kanallarında Bir Uygulama. İnternet Uygulamaları ve Yönetimi Dergisi, 5 (1), 5-19.
Hayta, A. B. (2008). Turizm Pazarlamasında Tüketici Satın Alma Süreci ve Karşılaşılan Sorunlar. Kastamonu Eğitim Dergisi, 16 (1), 31-48.
https://www.tripadvisor.com.tr/hotels/KarsHotels. (31.12.2019).Kılıç, B. & Ok, S. (2012). Otel İşletmelerinde Müşteri Şikayetleri ve
Şikayetlerin Değerlendirilmesi. Journal of Yasar University, 25 (7), 4189-4202.
Kılıç, B., Ok, S. & Sop, S. A. (2013). Otel İşletmelerinde Müşteri Şikayetlerinin Değerlendirilmesi ve Hizmet Kalitesi Algısının Müşteri Sadakati Üzerine Etkisi. Gaziantep University Journal of Social Sciences, 12 (4), 817-836.
Kozak, M. (2007). Turizm Sektöründe Tüketicilerin Şikâyetlerini Bildirme Eğilimleri. Yönetim ve Ekonomi: Celal Bayar Üniversitesi İktisadi ve İdari Bilimler Fakültesi Dergisi, 14 (1), 137-151.
Mil, Z. (2014). Konaklama İşletmelerinde Teknoloji Kullanımının Müşteri Tatminine Etkileri. Yüksek Lisans Tezi. Adnan Menderes Üniversitesi Sosyal Bilimler Enstitüsü.
Pizam, A. & Ellis, T. (1999). Customer Satisfaction and Its Measurement in Hospitality Enterprises. International Journal of Contemporary Hospitality Management, 11 (7), 326-339.

97Academic Studies in Social, Human and Administrative Sciences - II 97
Sert, G., Kurtoğlu, M., Akıncı, A., & Seferoğlu, S. S. (2012). Öğretmenlerin Teknoloji Kullanma Durumlarını İnceleyen Araştırmalara Bir Bakış: Bir İçerik Analizi Çalışması. Akademik Bilişim, 1 (3), 1-8.
Stone, P. J., Dunphy, D. C., & Smith, M. S. (1966). The General İnquirer: A Computer Approach to Content Analysis. M.I.T. Press.
Stringam, B. B., & Gerdes Jr, J. (2010). An Analysis of Word-Of-Mouse Ratings and Guest Reviews Of Online Hotel Distribution Sites. Journal of Hospitality Marketing & Management, 19 (7), 773-796.
Su, A. Y. L. (2004). Customer Satisfaction Measurement Practice in Taiwan Hotels. International Journal of Hospitality Management, 23 (4), 397-408.
Şahin, B., Kazaoğlu, İ. H., & Sönmez, B. (2017). Konaklama İşletmelerine Yönelik Seyahat Sitelerinde Yer Alan Şikayetler Üzerine Bir İnceleme: Bişkek Örneği. MANAS Sosyal Araştırmalar Dergisi, 6 (5), 163-177.
Unur, K., Çakıcı, C. & Taştan, H. (2010). Paket Turlardaki Müşteri Şikayetleri ve Seyahat Acentelerinin Bu Şikayetlerle Karşılaşma Sıklıkları Üzerine Bir Araştırma. Çukurova Üniversitesi Sosyal Bilimler Enstitüsü Dergisi, 19 (3), 391-408.
Yılmaz, H. & Çemrek, F. (2016). Termal Otel İşletmelerinde Kullanılan Mobilya Tasarımları Hakkında Müşteri Memnuniyetinin Belirlenmesine Yönelik Bir Araştırma. The Journal of Operations Research, Statistics, Econometrics and Management Information Systems, 4 (2), 183-204.

Chapter 7USE VALUE OF PATARA ANCIENT CITY: AN APPLICATION OF TRAVEL COST METHOD
Fırat YILMAZ1
1 Araştırma Görevlisi , Department of Economics, Antalya Bilim University, [email protected]


101Academic Studies in Social, Human and Administrative Sciences - II 101
Anneme
IntroductionEcosystems provide a flow of goods and services that society benefits.
Policy changes or individual actions may affect this process so that costs and benefits occur. Assessing these costs and benefits is the core for eval-uation of the projects concerning the environment. Without taking account of monetary valuation such decisions would be unreliable. However, stan-dard economic tools fail to deal with this issue since environmental goods and services show public good characteristics and are usually not bought and sold in the markets. For this purpose, non-market valuation techniques have been developed by economists (Carson, 2000, Throsby 2012, Free-man et. al., 2014).
Cultural heritage goods also have public good attributes. Even though these goods may vary in their levels of non-excludability and non-rivalry, they are still subject to socially optimal level of provision. In order to be able to make trade-offs, economic theory states that the marginal cost of the good should be equal to its marginal benefit. For cultural goods, it can be transformed so that the optimal number of heritage sites could be achieved when marginal cost of protecting one site is equal to the marginal benefit from it (Navrud and Ready, 2002).
Non-market valuation techniques can be categorized as revealed and stated preference approaches (Carson and Czajkowski, 2014). Re-vealed preference (RP) approach uses observed behavior of individuals todetermine the (ex-post) willingness to pay (WTP) for different kinds of non-market goods. In contrast, stated preferences (SP) aim to measure the (ex-ante) WTP and construct hypothetical markets in which consumers are asked to evaluate or choose between various scenarios (Whitehead et. al., 2008). Fig. 1 shows a detailed classification of both approaches.
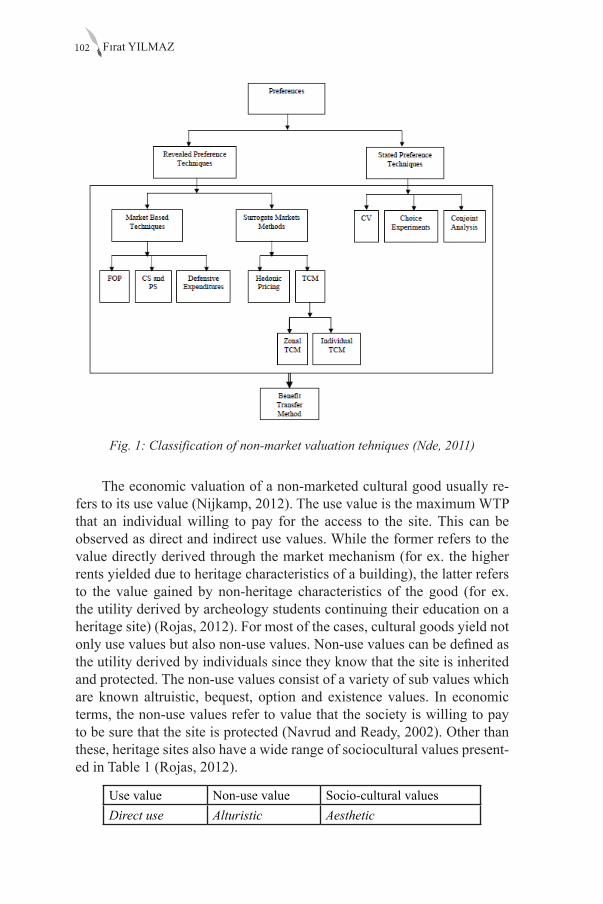
Fırat YILMAZ102
Fig. 1: Classification of non-market valuation tehniques (Nde, 2011)
The economic valuation of a non-marketed cultural good usually re-fers to its use value (Nijkamp, 2012). The use value is the maximum WTP that an individual willing to pay for the access to the site. This can be observed as direct and indirect use values. While the former refers to the value directly derived through the market mechanism (for ex. the higher rents yielded due to heritage characteristics of a building), the latter refers to the value gained by non-heritage characteristics of the good (for ex. the utility derived by archeology students continuing their education on a heritage site) (Rojas, 2012). For most of the cases, cultural goods yield not only use values but also non-use values. Non-use values can be defined as the utility derived by individuals since they know that the site is inherited and protected. The non-use values consist of a variety of sub values which are known altruistic, bequest, option and existence values. In economic terms, the non-use values refer to value that the society is willing to pay to be sure that the site is protected (Navrud and Ready, 2002). Other than these, heritage sites also have a wide range of sociocultural values present-ed in Table 1 (Rojas, 2012).
Use value Non-use value Socio-cultural valuesDirect use Alturistic Aesthetic
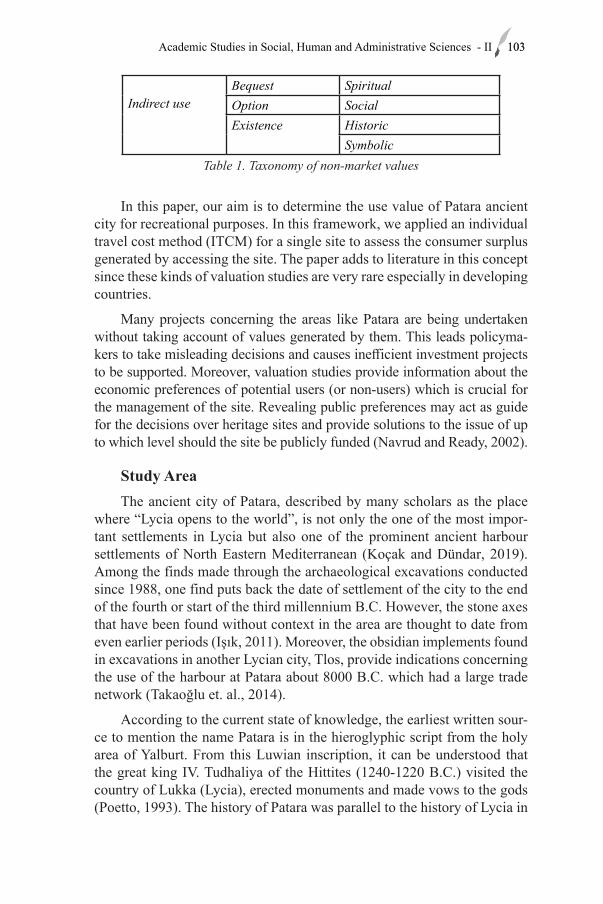
103Academic Studies in Social, Human and Administrative Sciences - II 103
Indirect useBequest SpiritualOption SocialExistence Historic
SymbolicTable 1. Taxonomy of non-market values
In this paper, our aim is to determine the use value of Patara ancient city for recreational purposes. In this framework, we applied an individual travel cost method (ITCM) for a single site to assess the consumer surplus generated by accessing the site. The paper adds to literature in this concept since these kinds of valuation studies are very rare especially in developing countries.
Many projects concerning the areas like Patara are being undertaken without taking account of values generated by them. This leads policyma-kers to take misleading decisions and causes inefficient investment projects to be supported. Moreover, valuation studies provide information about the economic preferences of potential users (or non-users) which is crucial for the management of the site. Revealing public preferences may act as guide for the decisions over heritage sites and provide solutions to the issue of up to which level should the site be publicly funded (Navrud and Ready, 2002).
Study AreaThe ancient city of Patara, described by many scholars as the place
where “Lycia opens to the world”, is not only the one of the most impor-tant settlements in Lycia but also one of the prominent ancient harbour settlements of North Eastern Mediterranean (Koçak and Dündar, 2019). Among the finds made through the archaeological excavations conducted since 1988, one find puts back the date of settlement of the city to the end of the fourth or start of the third millennium B.C. However, the stone axes that have been found without context in the area are thought to date from even earlier periods (Işık, 2011). Moreover, the obsidian implements found in excavations in another Lycian city, Tlos, provide indications concerning the use of the harbour at Patara about 8000 B.C. which had a large trade network (Takaoğlu et. al., 2014).
According to the current state of knowledge, the earliest written sour-ce to mention the name Patara is in the hieroglyphic script from the holy area of Yalburt. From this Luwian inscription, it can be understood that the great king IV. Tudhaliya of the Hittites (1240-1220 B.C.) visited the country of Lukka (Lycia), erected monuments and made vows to the gods (Poetto, 1993). The history of Patara was parallel to the history of Lycia in

Fırat YILMAZ104
classical times (Schüler, 2019). In this understanding, the important histo-rical facts are: the sovereignty of the Persians around 450 B.C.; that Patara was an autonomous city which can be determined by the coins with the Patara legend minted by I. Vekhssere (450-430/425 B.C.) and by II. Vekh-ssere (430/20-410/400 B.C.); that a large garrison was established by the Hecatomnids in the 4th century B.C.; the conquest of Patara and the whole of Lycia by Alexander the Great in 334/333 B.C. by attacking this garrison; followed by the formation of a new garrison by the Ptolemaic Dynasty in 280 B.C. after the death of Alexander the Great; and the renaming of the city as Arsione for the length of a century (Dündar and Rauh, 2017).
Fig. 2: The Arch
Patara in the 2nd century B.C. was defined as “caput gentis Lyciae” by the Roman historian Livius, meaning, “Head of Lycian Nation”, in other words “the capital city of Lycia”. This capital status was maintained in the province of Lycia founded by the Roman Emperor Claudius in 43 A.D. and in the joint province of Lycia et Pampylia founded in 72 A.D. by Emper-or Vespasian (Zimmerman, 2019). The latest historical information is that Cem Sultan, a son of Fatih Sultan Mehmet, sent an envoy from Patara in 1478 to the Knights of St. John (Işık, 2011).
With its still standing theatre, harbour street, harbour temple, harbour storehouse, the early settlement of Tepecik, the double city walls construc-ted in different periods, the aqueduct of Delikkemer, five public baths, ten churches, ten temple graves, the Roads Monument/Monumentum Pataren-se, esteemed as the epigraphic monumental find of the century and other numerous buildings, Patara is regarded as one of the most magnificent ci-ties in Anatolia (İşkan, 2016a). The Lycian League, described by Mon-
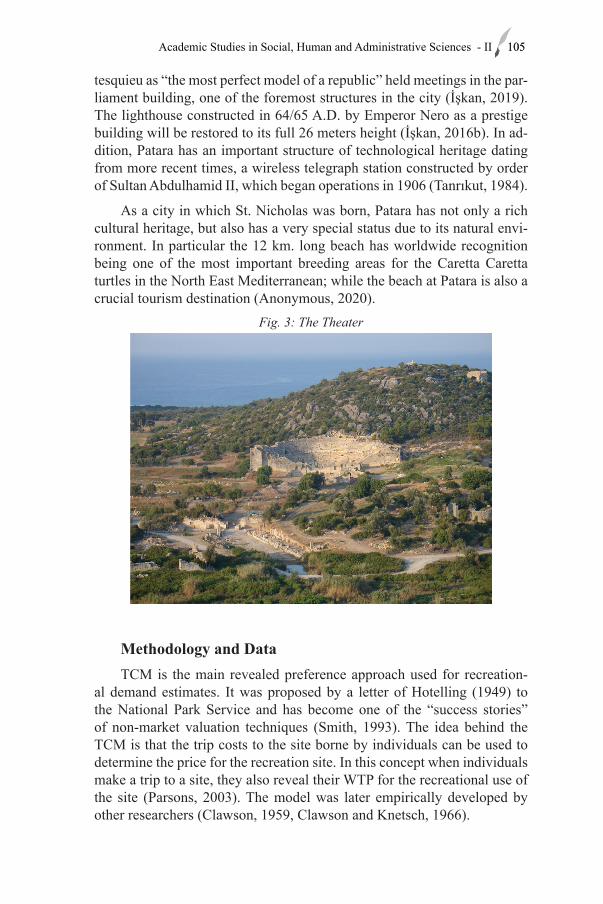
105Academic Studies in Social, Human and Administrative Sciences - II 105
tesquieu as “the most perfect model of a republic” held meetings in the par-liament building, one of the foremost structures in the city (İşkan, 2019). The lighthouse constructed in 64/65 A.D. by Emperor Nero as a prestige building will be restored to its full 26 meters height (İşkan, 2016b). In ad-dition, Patara has an important structure of technological heritage dating from more recent times, a wireless telegraph station constructed by order of Sultan Abdulhamid II, which began operations in 1906 (Tanrıkut, 1984).
As a city in which St. Nicholas was born, Patara has not only a rich cultural heritage, but also has a very special status due to its natural envi-ronment. In particular the 12 km. long beach has worldwide recognition being one of the most important breeding areas for the Caretta Caretta turtles in the North East Mediterranean; while the beach at Patara is also a crucial tourism destination (Anonymous, 2020).
Fig. 3: The Theater
Methodology and DataTCM is the main revealed preference approach used for recreation-
al demand estimates. It was proposed by a letter of Hotelling (1949) to the National Park Service and has become one of the “success stories” of non-market valuation techniques (Smith, 1993). The idea behind the TCM is that the trip costs to the site borne by individuals can be used to determine the price for the recreation site. In this concept when individuals make a trip to a site, they also reveal their WTP for the recreational use of the site (Parsons, 2003). The model was later empirically developed by other researchers (Clawson, 1959, Clawson and Knetsch, 1966).
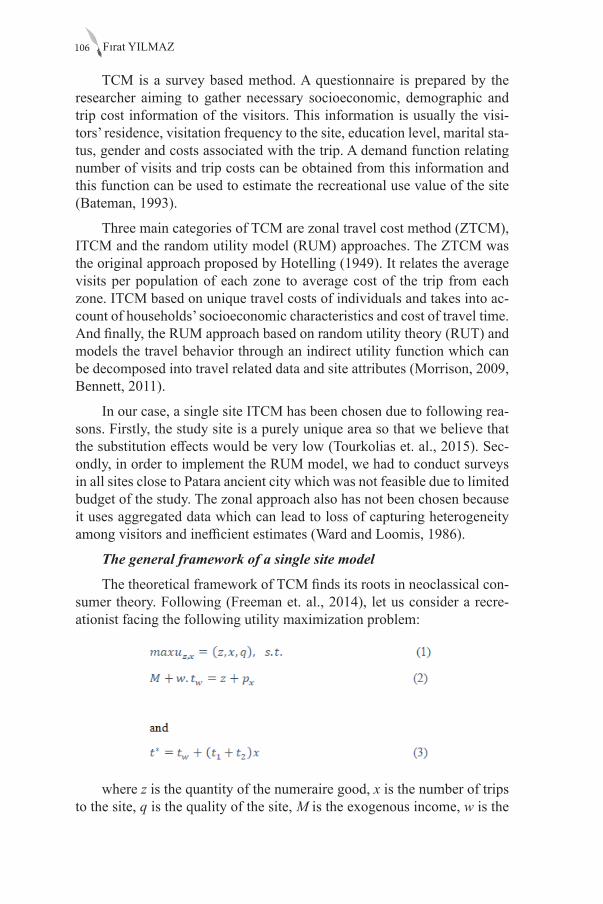
Fırat YILMAZ106
TCM is a survey based method. A questionnaire is prepared by the researcher aiming to gather necessary socioeconomic, demographic and trip cost information of the visitors. This information is usually the visi-tors’ residence, visitation frequency to the site, education level, marital sta-tus, gender and costs associated with the trip. A demand function relating number of visits and trip costs can be obtained from this information and this function can be used to estimate the recreational use value of the site (Bateman, 1993).
Three main categories of TCM are zonal travel cost method (ZTCM), ITCM and the random utility model (RUM) approaches. The ZTCM was the original approach proposed by Hotelling (1949). It relates the average visits per population of each zone to average cost of the trip from each zone. ITCM based on unique travel costs of individuals and takes into ac-count of households’ socioeconomic characteristics and cost of travel time. And finally, the RUM approach based on random utility theory (RUT) and models the travel behavior through an indirect utility function which can be decomposed into travel related data and site attributes (Morrison, 2009, Bennett, 2011).
In our case, a single site ITCM has been chosen due to following rea-sons. Firstly, the study site is a purely unique area so that we believe that the substitution effects would be very low (Tourkolias et. al., 2015). Sec-ondly, in order to implement the RUM model, we had to conduct surveys in all sites close to Patara ancient city which was not feasible due to limited budget of the study. The zonal approach also has not been chosen because it uses aggregated data which can lead to loss of capturing heterogeneity among visitors and inefficient estimates (Ward and Loomis, 1986).
The general framework of a single site model
The theoretical framework of TCM finds its roots in neoclassical con-sumer theory. Following (Freeman et. al., 2014), let us consider a recre-ationist facing the following utility maximization problem:
where z is the quantity of the numeraire good, x is the number of trips to the site, q is the quality of the site, M is the exogenous income, w is the
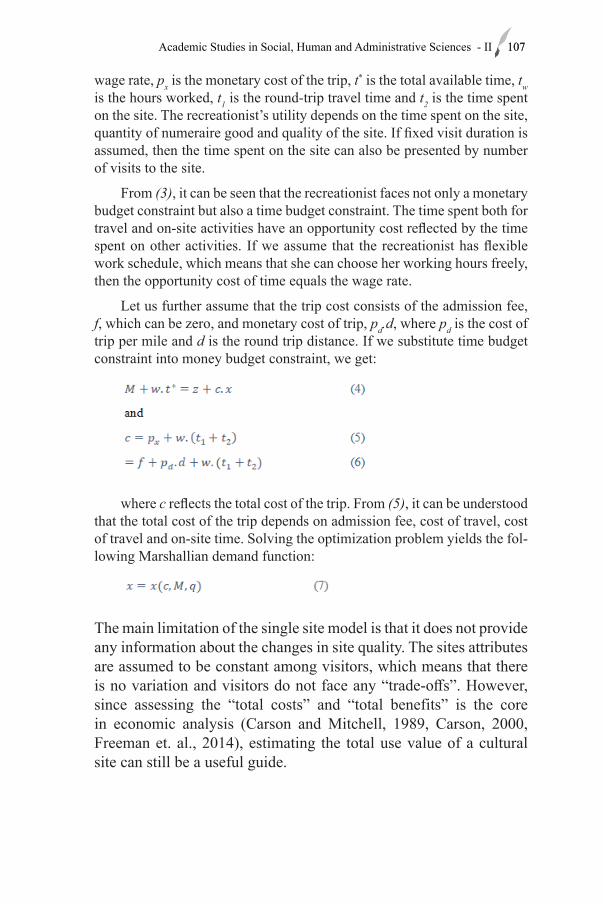
107Academic Studies in Social, Human and Administrative Sciences - II 107
wage rate, px is the monetary cost of the trip, t* is the total available time, tw is the hours worked, t1 is the round-trip travel time and t2 is the time spent on the site. The recreationist’s utility depends on the time spent on the site, quantity of numeraire good and quality of the site. If fixed visit duration is assumed, then the time spent on the site can also be presented by number of visits to the site.
From (3), it can be seen that the recreationist faces not only a monetary budget constraint but also a time budget constraint. The time spent both for travel and on-site activities have an opportunity cost reflected by the time spent on other activities. If we assume that the recreationist has flexible work schedule, which means that she can choose her working hours freely, then the opportunity cost of time equals the wage rate.
Let us further assume that the trip cost consists of the admission fee, f, which can be zero, and monetary cost of trip, pd.d, where pd is the cost of trip per mile and d is the round trip distance. If we substitute time budget constraint into money budget constraint, we get:
where c reflects the total cost of the trip. From (5), it can be understood that the total cost of the trip depends on admission fee, cost of travel, cost of travel and on-site time. Solving the optimization problem yields the fol-lowing Marshallian demand function:
The main limitation of the single site model is that it does not provide any information about the changes in site quality. The sites attributes are assumed to be constant among visitors, which means that there is no variation and visitors do not face any “trade-offs”. However, since assessing the “total costs” and “total benefits” is the core in economic analysis (Carson and Mitchell, 1989, Carson, 2000, Freeman et. al., 2014), estimating the total use value of a cultural site can still be a useful guide.
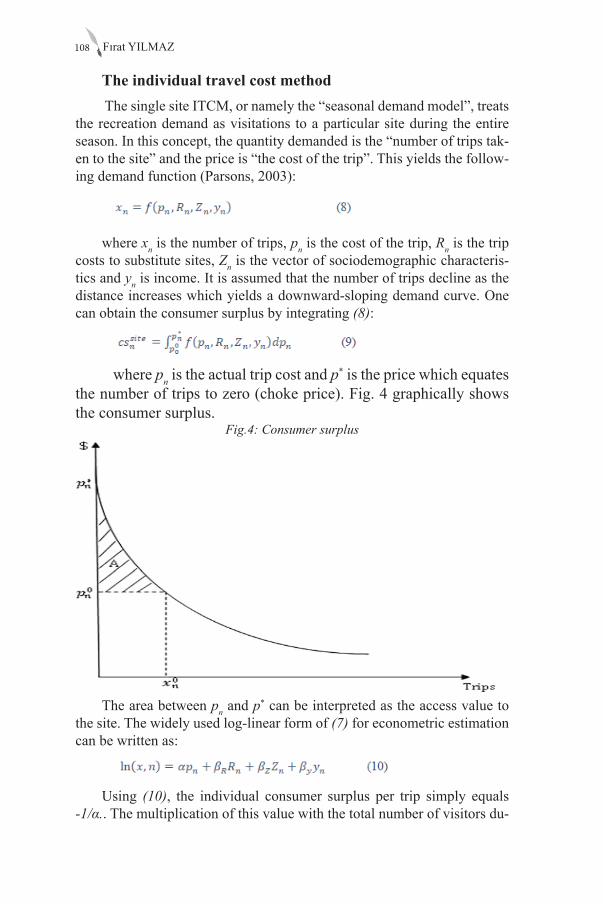
Fırat YILMAZ108
The individual travel cost method The single site ITCM, or namely the “seasonal demand model”, treats
the recreation demand as visitations to a particular site during the entire season. In this concept, the quantity demanded is the “number of trips tak-en to the site” and the price is “the cost of the trip”. This yields the follow-ing demand function (Parsons, 2003):
where xn is the number of trips, pn is the cost of the trip, Rn is the trip costs to substitute sites, Zn is the vector of sociodemographic characteris-tics and yn is income. It is assumed that the number of trips decline as the distance increases which yields a downward-sloping demand curve. One can obtain the consumer surplus by integrating (8):
where pn is the actual trip cost and p* is the price which equates the number of trips to zero (choke price). Fig. 4 graphically shows the consumer surplus.
Fig.4: Consumer surplus
The area between pn and p* can be interpreted as the access value to the site. The widely used log-linear form of (7) for econometric estimation can be written as:
Using (10), the individual consumer surplus per trip simply equals -1/α.. The multiplication of this value with the total number of visitors du-
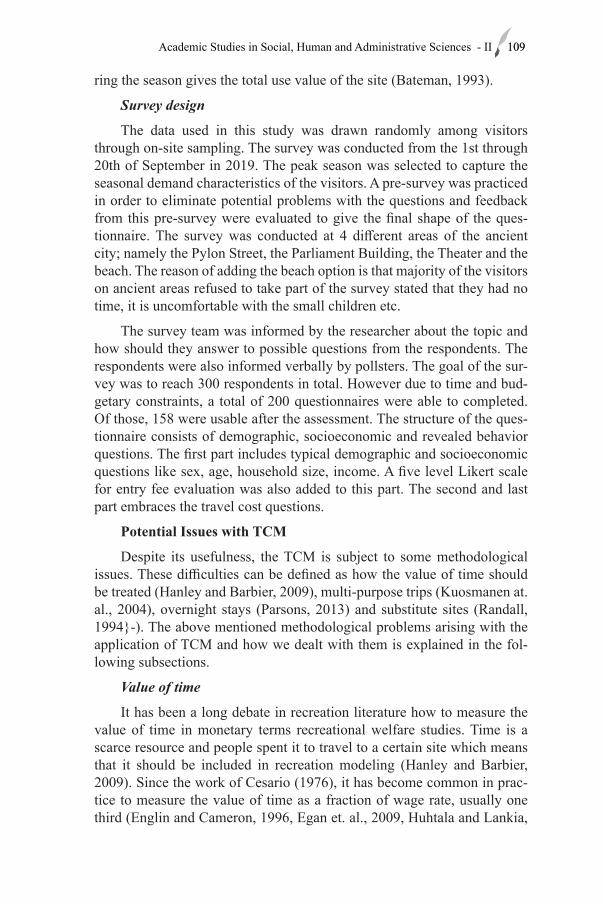
109Academic Studies in Social, Human and Administrative Sciences - II 109
ring the season gives the total use value of the site (Bateman, 1993).
Survey design
The data used in this study was drawn randomly among visitors through on-site sampling. The survey was conducted from the 1st through 20th of September in 2019. The peak season was selected to capture the seasonal demand characteristics of the visitors. A pre-survey was practiced in order to eliminate potential problems with the questions and feedback from this pre-survey were evaluated to give the final shape of the ques-tionnaire. The survey was conducted at 4 different areas of the ancient city; namely the Pylon Street, the Parliament Building, the Theater and the beach. The reason of adding the beach option is that majority of the visitors on ancient areas refused to take part of the survey stated that they had no time, it is uncomfortable with the small children etc.
The survey team was informed by the researcher about the topic and how should they answer to possible questions from the respondents. The respondents were also informed verbally by pollsters. The goal of the sur-vey was to reach 300 respondents in total. However due to time and bud-getary constraints, a total of 200 questionnaires were able to completed. Of those, 158 were usable after the assessment. The structure of the ques-tionnaire consists of demographic, socioeconomic and revealed behavior questions. The first part includes typical demographic and socioeconomic questions like sex, age, household size, income. A five level Likert scale for entry fee evaluation was also added to this part. The second and last part embraces the travel cost questions.
Potential Issues with TCM
Despite its usefulness, the TCM is subject to some methodological issues. These difficulties can be defined as how the value of time should be treated (Hanley and Barbier, 2009), multi-purpose trips (Kuosmanen at. al., 2004), overnight stays (Parsons, 2013) and substitute sites (Randall, 1994}-). The above mentioned methodological problems arising with the application of TCM and how we dealt with them is explained in the fol-lowing subsections.
Value of time
It has been a long debate in recreation literature how to measure the value of time in monetary terms recreational welfare studies. Time is a scarce resource and people spent it to travel to a certain site which means that it should be included in recreation modeling (Hanley and Barbier, 2009). Since the work of Cesario (1976), it has become common in prac-tice to measure the value of time as a fraction of wage rate, usually one third (Englin and Cameron, 1996, Egan et. al., 2009, Huhtala and Lankia,
Fırat YILMAZ110
2012). Even though the opportunity cost of time was found to have signifi-cant impacts on consumer welfare estimates (Smith et. al.,1983, Bockstael et. al., 1987, McKean et. al., 1995), the literature still lacks a common way of how to measure it and incorporate into analysis (Randall, 1994, Larson, 1993, Czajkowski et. al., 2015).
Another important distinction is between the on-site time and the val-ue of travel time. The value of on site time is assumed to be endogenous to the recreationist while the latter is exogenous unless the visitor is able to make choices between different routes and modes of transport. In empirical literature, it has been common to ignore the on-site time while for the value of travel time researchers applied different methods (McConnell, 1992).
In this study we focus on the value of travel time and assumed that visitors are “out of the market” for the time spent on site. For this purpose, we estimated three models. In model 1, we assumed zero opportunity cost for the travel time. Then we conservatively applied the 1/3 fraction of the hourly wage rate as the cost of travel time. In model 3, we followed (Mc-Connell and Strand, 1981) and let the fraction of the wage rate to be deter-mined in the regression.
Multi-purpose trips
The trip to a particular site may sometimes be a part of a more general trip. This is usually referred to “multi-purpose” or “multiple site trips” in recreation demand literature. If this is the case, the trip generates more than one recreation and the theory of TCM is violated (Parsons, 2013). Ignoring or treating multi-purpose trips like single trips may lead biases in consum-er surplus estimates (Kuosmanen at. al., 2004).
Possible treatments of multi-purpose trips in the literature are as fol-lows: using only the part of the cost associated with the site (Bedate et. al., 2004); evaluating costs occurred from each trip as some fraction of total cost and estimating separate demand curves for each (Haspel and Johnson, 1982) and defining a combination of sites where visitors of a particular site frequently stop and treat them as additional sites (Mendelsohn et. al., 1992).
In this study, we follow the first approach and limited the trip only from the last stop to the site. Visitors were asked “How much did you pay in total (fuel, bus fare, flight ticket etc.) to get this ancient city? (Please consider your LAST location)”. They were also reminded verbally by the survey team.
Overnight stays
Including overnight stays needs careful treatment of the model. First-ly, total costs will increase. Secondly, the visitors may visit and lodge in
111Academic Studies in Social, Human and Administrative Sciences - II 111
all possible sites which means the accommodation expenses made in the visited site should be distinguished. Finally, many overnight trips tend to have multi-purpose trip characteristics. It has become a common practice that assuming the trip costs are only associated with the distance. In this case accommodation costs are ignored (Parsons, 2003). Another practice is estimating demand curves for day and overnight trips separately (Bin et. al., 2005).
In our case, more or less \%70 of visits were day trips. Moreover, for the rest of the visits indicating overnight stays, we constrained the analysis to lodging only in the area; in the village called Gelemis. We stated this in the questionnaire by asking “How many days do you plan to stay in this ancient city?”. Respondents were provided two answers, day trip or an open-ended option for their length of stay. If the respondent specified her length of stay, she was asked “How much did you pay for accommodation? (Please answer this question only if you lodge in Gelemis village)”.
Substitute sites
Although difficult to handle (Willis et. al., 2012), substitute sites are expected to affect the recreation demand through visit price, entrance fee and environmental quality. However, additional surveys are required to be conducted in order to add these variables to the estimation. They are in practice rarely included to analyses due to high survey costs. If the effects of substitute sites are fully desired to be captured, surveys should be con-ducted on each possible site (Bateman, 1993).
For cultural goods, it is still in debate that substitute sites really exist. Since these goods show truly unique characteristics, it is questionable that they face a competition (Bedate et. al., 2004). One solution might be to include the nearest site with similar attributes to analysis (Freeman et. al., 2014).
Nevertheless, in this study we adopt the view that Patara Ancient City is a truly unique site and thus the substitution effect would be very low (Prayaga et. al., 2006, Tourkolias et. al., 2015, Ortega et. al., 2018). More-over, if sites are clustered, which is the case in our study, studies showed that adding the substitution effect would yield biases in consumer surplus estimates (Bateman, 1993).
Previous Literature
Since its first introduction, a wide body of literature applying TCM has come into existence. Studies show great variation from forests (Ber-tram and Larondelle, 2017, Borzykowski et. al., 2017), beaches (Rolfe and Gregg, 2012, Windle and Rolfe, 2013, Zhang et. al., 2015, Zambra-no-Monserrate et. al., 2018), rivers (Kaoru et. al., 1995, Gillespie et. al.,

Fırat YILMAZ112
2017, Grilli et. al., 2018), lakes (Fleming and Cook, 2008), bird sanctuaries (Czajkowski et. al., 2014) to fishing areas (Curtis and Stanley, 2016, Curtis and Breen, 2017). For cultural field, studies also vary among tangible and intangible goods. Poor and Smith (2004) conducted a ZTCM to elicit the use value of Historic St. Mary City in Maryland, United Kingdom. They measured the consumer surplus between 75,492$ and 176,550$. Melstrom (2014) estimated ITCM for three different American Civilwar Battlefields. His results show that the consumer surplus varies between 8$ and 25$ per individual. Tourkolias et al. (2015) implemented a ZTCM for Poseidon Temple in Sounio, Greece. Their analysis indicates that the use value is in range of 1.5€-24.5€ million per year. Ortega et al. (2018) applied both ZTCM and ITCM for National Museum and Research Center in Almira, Spain. The results of their study showed that the total surplus varies be-tween 4.75€ and 8€ million per year. Studies concerning the use value of intangible cultural assets also exist in the literature. In their study, Prayaga et al. (2006) carried out a ZTCM in order to determine the use value of ’Gemfest’ in Queensland, Australia. They conducted two surveys in years 1998 and 2002. According to their results, the value of the fest was 1.5$ million in 1998 and 0.81$ million in 2002, showing a significant variation.
In the context of this study, we carried out an ITCM to evaluate the use value of Patara ancient city. Our study site is one of the most important an-cient cities in Turkey and capital of the Lykia Region. This paper is one of the very few studies in Turkey applying non-market valuation techniques to a cultural heritage site and therefore contributes to literature. According to our best knowledge, this study is the first applying non-market valua-tion techniques to an ancient capital city showing global importance and uniqueness.
Econometric Approach
The earlier estimates of TCM assumed continuous probability distri-bution for the dependent variable. Count data models became later popular allowing the dependent variable to be only non-negative integer. The abi-lity of dealing with truncation, excess zeros and heterogeneity made them widely used among researchers in recreation demand estimation (Parsons, 2003).
The probability density of basic count data model, Poisson, can be written as (Haab and McConnell, 2002):
Since λ.>0 is the necessary condition, the exponential function beco-mes,
113Academic Studies in Social, Human and Administrative Sciences - II 113
The sample likelihood function then can be written as,
and the log-likelihood function is,
The main characteristic of the Poisson distribution imposes that the conditional mean and conditional variance of the dependent should be equal. However, it may not always be the case. When the variance exceeds the mean, the model suffers from overdispersion. In this case, the negative binomial model (NBM) can be preferred relaxing this assumption (Haab and McConnell, 1996, Greene, 2003).
Truncation and endogenous stratification
One faces two issues with an on-site sampling: truncation and endog-enous stratification. Since the sampling is on-site, only the visitors are in-cluded leading to truncation of the number of visits at zero. The sample is also endogenously stratified because the probability of a person being sam-pled increases with the frequency of her visits (Creel and Loomis, 1990, Englin and Shonkwiler, 1995, Haab and McConnell, 1996).
The two above mentioned issues should be corrected in order to elim-inate the biases in analysis. As Shaw (1988) suggested, these biases could be corrected by simply abstracting one from the number of visits (n). Thus, the corrected on-site density function becomes,
Overdispersion
The inequality between the mean and variance of a Poisson regression model (PRM) is known as overdispersion. It usually occurs due to posi-tive correlation between the response variables or when data is clustered. Possible outcome of overdisperison is biased estimation of standard errors resulting a variable to be significant in fact it would not have been (Hilbe, 2011).
Our data shows significant evidence of overdispersion. The fit of ob-served-predicted values also addresses that the Negative Binomial Model performs better especially for the excess zeros. So, the NBM has been selected as the main estimation method.
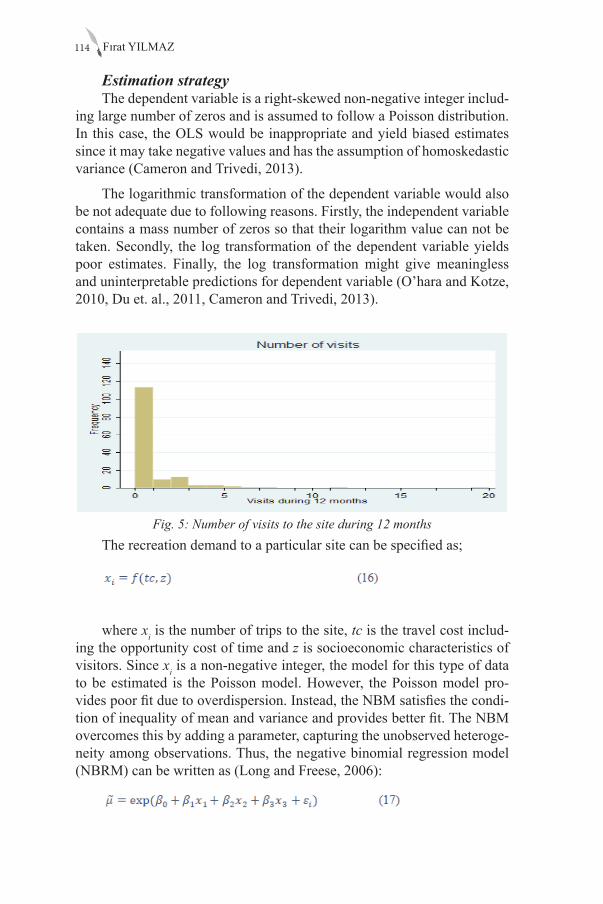
Fırat YILMAZ114
Estimation strategyThe dependent variable is a right-skewed non-negative integer includ-
ing large number of zeros and is assumed to follow a Poisson distribution. In this case, the OLS would be inappropriate and yield biased estimates since it may take negative values and has the assumption of homoskedastic variance (Cameron and Trivedi, 2013).
The logarithmic transformation of the dependent variable would also be not adequate due to following reasons. Firstly, the independent variable contains a mass number of zeros so that their logarithm value can not be taken. Secondly, the log transformation of the dependent variable yields poor estimates. Finally, the log transformation might give meaningless and uninterpretable predictions for dependent variable (O’hara and Kotze, 2010, Du et. al., 2011, Cameron and Trivedi, 2013).
Fig. 5: Number of visits to the site during 12 months
The recreation demand to a particular site can be specified as;
where xi is the number of trips to the site, tc is the travel cost includ-ing the opportunity cost of time and z is socioeconomic characteristics of visitors. Since xi is a non-negative integer, the model for this type of data to be estimated is the Poisson model. However, the Poisson model pro-vides poor fit due to overdispersion. Instead, the NBM satisfies the condi-tion of inequality of mean and variance and provides better fit. The NBM overcomes this by adding a parameter, capturing the unobserved heteroge-neity among observations. Thus, the negative binomial regression model (NBRM) can be written as (Long and Freese, 2006):
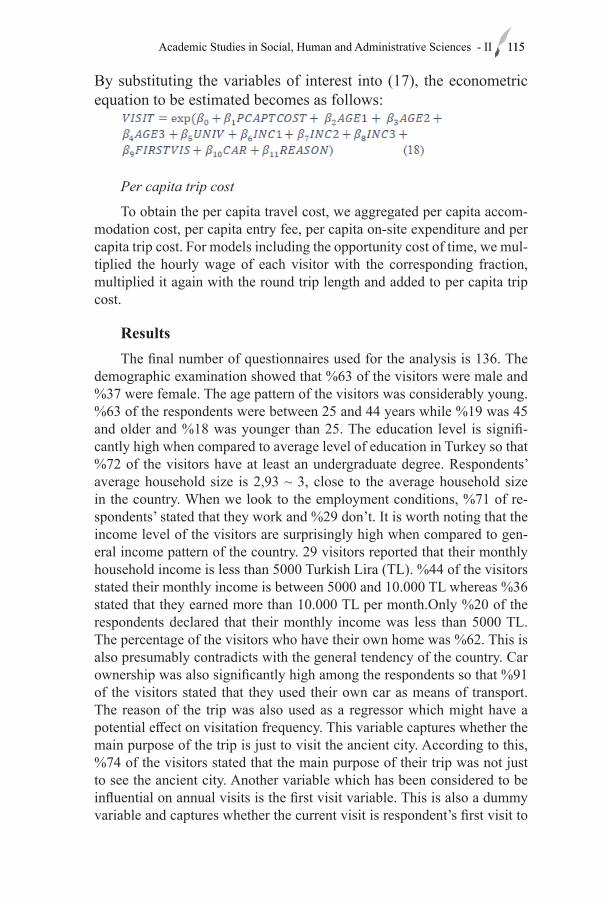
115Academic Studies in Social, Human and Administrative Sciences - II 115
By substituting the variables of interest into (17), the econometric equation to be estimated becomes as follows:
Per capita trip cost
To obtain the per capita travel cost, we aggregated per capita accom-modation cost, per capita entry fee, per capita on-site expenditure and per capita trip cost. For models including the opportunity cost of time, we mul-tiplied the hourly wage of each visitor with the corresponding fraction, multiplied it again with the round trip length and added to per capita trip cost.
ResultsThe final number of questionnaires used for the analysis is 136. The
demographic examination showed that %63 of the visitors were male and %37 were female. The age pattern of the visitors was considerably young. %63 of the respondents were between 25 and 44 years while %19 was 45 and older and %18 was younger than 25. The education level is signifi-cantly high when compared to average level of education in Turkey so that %72 of the visitors have at least an undergraduate degree. Respondents’ average household size is 2,93 ~ 3, close to the average household size in the country. When we look to the employment conditions, %71 of re-spondents’ stated that they work and %29 don’t. It is worth noting that the income level of the visitors are surprisingly high when compared to gen-eral income pattern of the country. 29 visitors reported that their monthly household income is less than 5000 Turkish Lira (TL). %44 of the visitors stated their monthly income is between 5000 and 10.000 TL whereas %36 stated that they earned more than 10.000 TL per month.Only %20 of the respondents declared that their monthly income was less than 5000 TL. The percentage of the visitors who have their own home was %62. This is also presumably contradicts with the general tendency of the country. Car ownership was also significantly high among the respondents so that %91 of the visitors stated that they used their own car as means of transport. The reason of the trip was also used as a regressor which might have a potential effect on visitation frequency. This variable captures whether the main purpose of the trip is just to visit the ancient city. According to this, %74 of the visitors stated that the main purpose of their trip was not just to see the ancient city. Another variable which has been considered to be influential on annual visits is the first visit variable. This is also a dummy variable and captures whether the current visit is respondent’s first visit to
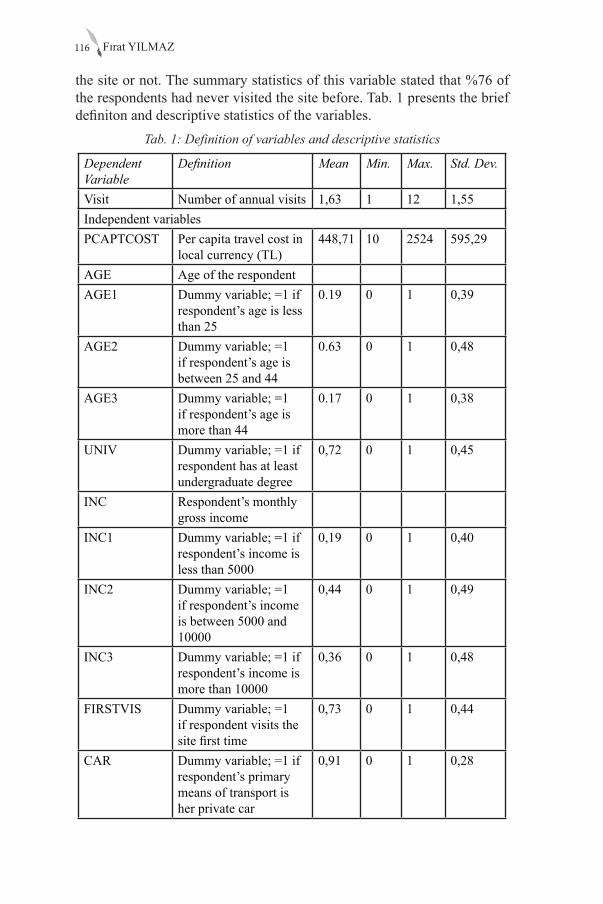
Fırat YILMAZ116
the site or not. The summary statistics of this variable stated that %76 of the respondents had never visited the site before. Tab. 1 presents the brief definiton and descriptive statistics of the variables.
Tab. 1: Definition of variables and descriptive statistics
Dependent Variable
Definition Mean Min. Max. Std. Dev.
Visit Number of annual visits 1,63 1 12 1,55Independent variablesPCAPTCOST Per capita travel cost in
local currency (TL)448,71 10 2524 595,29
AGE Age of the respondentAGE1 Dummy variable; =1 if
respondent’s age is less than 25
0.19 0 1 0,39
AGE2 Dummy variable; =1 if respondent’s age is between 25 and 44
0.63 0 1 0,48
AGE3 Dummy variable; =1 if respondent’s age is more than 44
0.17 0 1 0,38
UNIV Dummy variable; =1 if respondent has at least undergraduate degree
0,72 0 1 0,45
INC Respondent’s monthly gross income
INC1 Dummy variable; =1 if respondent’s income is less than 5000
0,19 0 1 0,40
INC2 Dummy variable; =1 if respondent’s income is between 5000 and 10000
0,44 0 1 0,49
INC3 Dummy variable; =1 if respondent’s income is more than 10000
0,36 0 1 0,48
FIRSTVIS Dummy variable; =1 if respondent visits the site first time
0,73 0 1 0,44
CAR Dummy variable; =1 if respondent’s primary means of transport is her private car
0,91 0 1 0,28
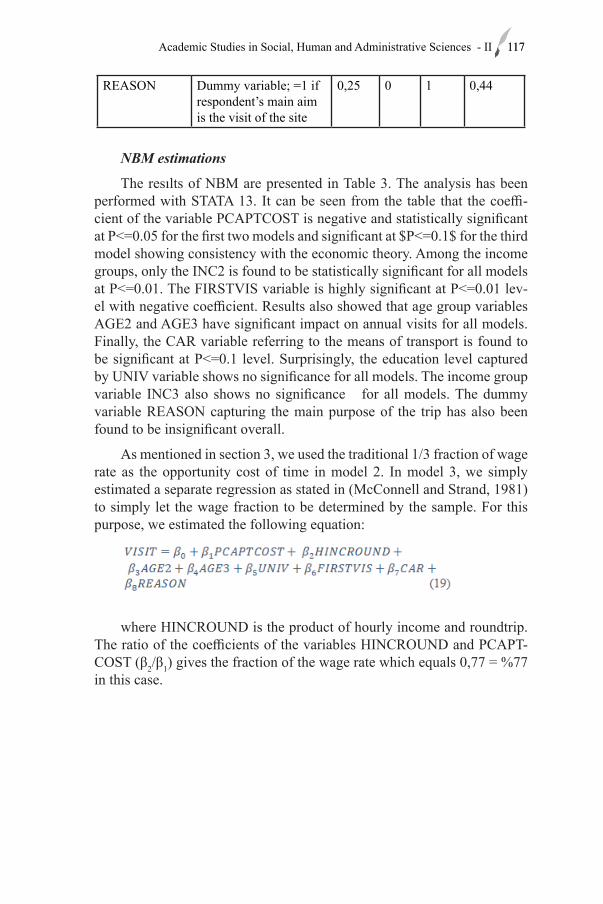
117Academic Studies in Social, Human and Administrative Sciences - II 117
REASON Dummy variable; =1 if respondent’s main aim is the visit of the site
0,25 0 1 0,44
NBM estimations
The resılts of NBM are presented in Table 3. The analysis has been performed with STATA 13. It can be seen from the table that the coeffi-cient of the variable PCAPTCOST is negative and statistically significant at P<=0.05 for the first two models and significant at $P<=0.1$ for the third model showing consistency with the economic theory. Among the income groups, only the INC2 is found to be statistically significant for all models at P<=0.01. The FIRSTVIS variable is highly significant at P<=0.01 lev-el with negative coefficient. Results also showed that age group variables AGE2 and AGE3 have significant impact on annual visits for all models. Finally, the CAR variable referring to the means of transport is found to be significant at P<=0.1 level. Surprisingly, the education level captured by UNIV variable shows no significance for all models. The income group variable INC3 also shows no significance for all models. The dummy variable REASON capturing the main purpose of the trip has also been found to be insignificant overall.
As mentioned in section 3, we used the traditional 1/3 fraction of wage rate as the opportunity cost of time in model 2. In model 3, we simply estimated a separate regression as stated in (McConnell and Strand, 1981) to simply let the wage fraction to be determined by the sample. For this purpose, we estimated the following equation:
where HINCROUND is the product of hourly income and roundtrip. The ratio of the coefficients of the variables HINCROUND and PCAPT-COST (β2/β1) gives the fraction of the wage rate which equals 0,77 = %77 in this case.
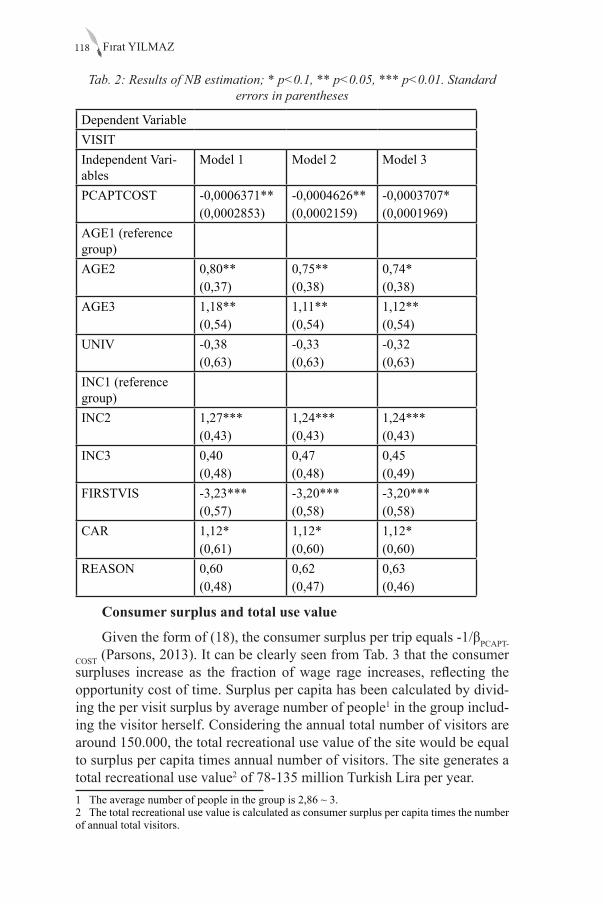
Fırat YILMAZ118
Tab. 2: Results of NB estimation; * p<0.1, ** p<0.05, *** p<0.01. Standard errors in parentheses
Dependent VariableVISITIndependent Vari-ables
Model 1 Model 2 Model 3
PCAPTCOST -0,0006371**(0,0002853)
-0,0004626**(0,0002159)
-0,0003707*(0,0001969)
AGE1 (reference group)AGE2 0,80**
(0,37)0,75**(0,38)
0,74*(0,38)
AGE3 1,18**(0,54)
1,11**(0,54)
1,12**(0,54)
UNIV -0,38(0,63)
-0,33(0,63)
-0,32(0,63)
INC1 (reference group)INC2 1,27***
(0,43)1,24***(0,43)
1,24***(0,43)
INC3 0,40(0,48)
0,47(0,48)
0,45(0,49)
FIRSTVIS -3,23***(0,57)
-3,20***(0,58)
-3,20***(0,58)
CAR 1,12*(0,61)
1,12*(0,60)
1,12*(0,60)
REASON 0,60(0,48)
0,62(0,47)
0,63(0,46)
Consumer surplus and total use value
Given the form of (18), the consumer surplus per trip equals -1/βPCAPT-
COST (Parsons, 2013). It can be clearly seen from Tab. 3 that the consumer surpluses increase as the fraction of wage rage increases, reflecting the opportunity cost of time. Surplus per capita has been calculated by divid-ing the per visit surplus by average number of people1 in the group includ-ing the visitor herself. Considering the annual total number of visitors are around 150.000, the total recreational use value of the site would be equal to surplus per capita times annual number of visitors. The site generates a total recreational use value2 of 78-135 million Turkish Lira per year. 1 The average number of people in the group is 2,86 ~ 3. 2 The total recreational use value is calculated as consumer surplus per capita times the number of annual total visitors.
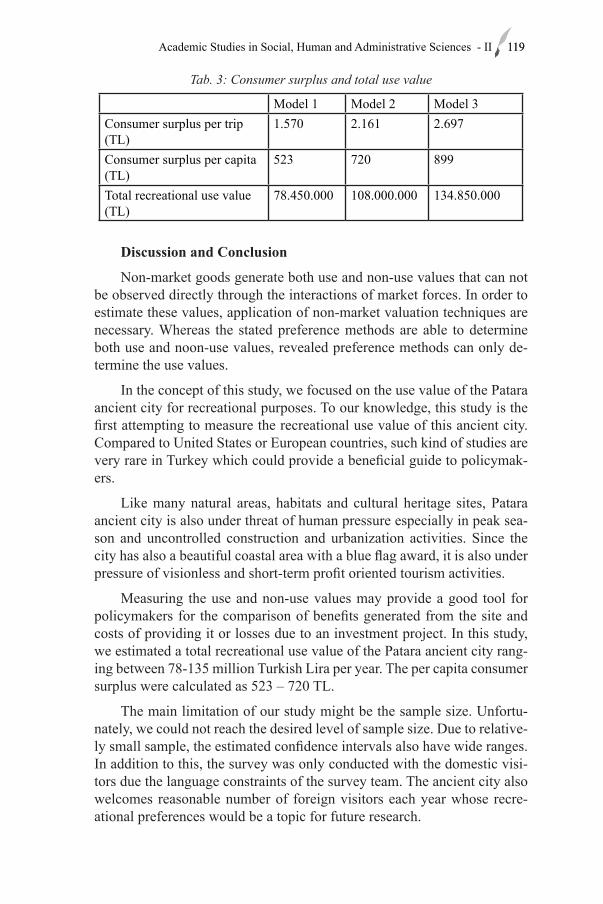
119Academic Studies in Social, Human and Administrative Sciences - II 119
Tab. 3: Consumer surplus and total use value
Model 1 Model 2 Model 3Consumer surplus per trip (TL)
1.570 2.161 2.697
Consumer surplus per capita (TL)
523 720 899
Total recreational use value (TL)
78.450.000 108.000.000 134.850.000
Discussion and Conclusion
Non-market goods generate both use and non-use values that can not be observed directly through the interactions of market forces. In order to estimate these values, application of non-market valuation techniques are necessary. Whereas the stated preference methods are able to determine both use and noon-use values, revealed preference methods can only de-termine the use values.
In the concept of this study, we focused on the use value of the Patara ancient city for recreational purposes. To our knowledge, this study is the first attempting to measure the recreational use value of this ancient city. Compared to United States or European countries, such kind of studies are very rare in Turkey which could provide a beneficial guide to policymak-ers.
Like many natural areas, habitats and cultural heritage sites, Patara ancient city is also under threat of human pressure especially in peak sea-son and uncontrolled construction and urbanization activities. Since the city has also a beautiful coastal area with a blue flag award, it is also under pressure of visionless and short-term profit oriented tourism activities.
Measuring the use and non-use values may provide a good tool for policymakers for the comparison of benefits generated from the site and costs of providing it or losses due to an investment project. In this study, we estimated a total recreational use value of the Patara ancient city rang-ing between 78-135 million Turkish Lira per year. The per capita consumer surplus were calculated as 523 – 720 TL.
The main limitation of our study might be the sample size. Unfortu-nately, we could not reach the desired level of sample size. Due to relative-ly small sample, the estimated confidence intervals also have wide ranges. In addition to this, the survey was only conducted with the domestic visi-tors due the language constraints of the survey team. The ancient city also welcomes reasonable number of foreign visitors each year whose recre-ational preferences would be a topic for future research.
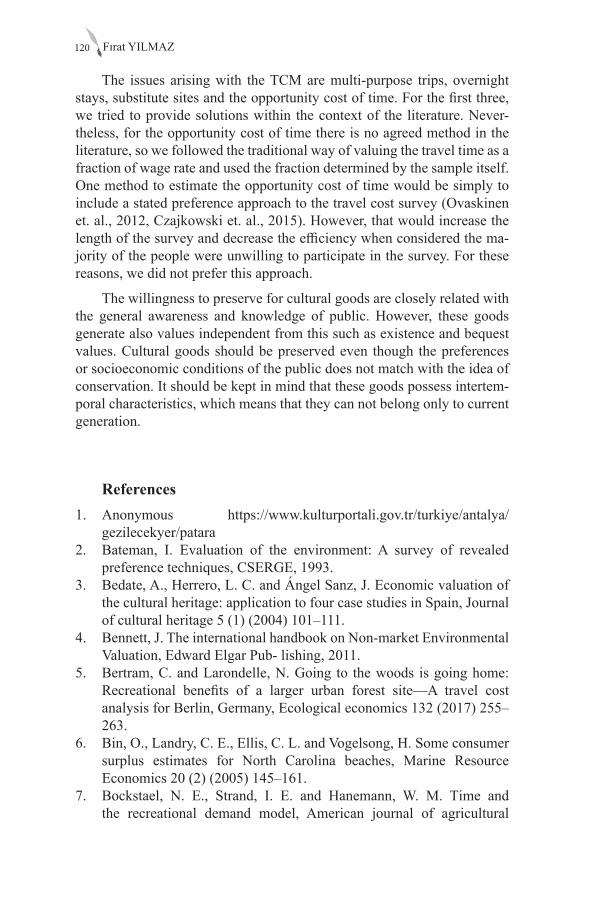
Fırat YILMAZ120
The issues arising with the TCM are multi-purpose trips, overnight stays, substitute sites and the opportunity cost of time. For the first three, we tried to provide solutions within the context of the literature. Never-theless, for the opportunity cost of time there is no agreed method in the literature, so we followed the traditional way of valuing the travel time as a fraction of wage rate and used the fraction determined by the sample itself. One method to estimate the opportunity cost of time would be simply to include a stated preference approach to the travel cost survey (Ovaskinen et. al., 2012, Czajkowski et. al., 2015). However, that would increase the length of the survey and decrease the efficiency when considered the ma-jority of the people were unwilling to participate in the survey. For these reasons, we did not prefer this approach.
The willingness to preserve for cultural goods are closely related with the general awareness and knowledge of public. However, these goods generate also values independent from this such as existence and bequest values. Cultural goods should be preserved even though the preferences or socioeconomic conditions of the public does not match with the idea of conservation. It should be kept in mind that these goods possess intertem-poral characteristics, which means that they can not belong only to current generation.
References1. Anonymous https://www.kulturportali.gov.tr/turkiye/antalya/
gezilecekyer/patara2. Bateman, I. Evaluation of the environment: A survey of revealed
preference techniques, CSERGE, 1993. 3. Bedate, A., Herrero, L. C. and Ángel Sanz, J. Economic valuation of
the cultural heritage: application to four case studies in Spain, Journal of cultural heritage 5 (1) (2004) 101–111.
4. Bennett, J. The international handbook on Non-market Environmental Valuation, Edward Elgar Pub- lishing, 2011.
5. Bertram, C. and Larondelle, N. Going to the woods is going home: Recreational benefits of a larger urban forest site—A travel cost analysis for Berlin, Germany, Ecological economics 132 (2017) 255–263.
6. Bin, O., Landry, C. E., Ellis, C. L. and Vogelsong, H. Some consumer surplus estimates for North Carolina beaches, Marine Resource Economics 20 (2) (2005) 145–161.
7. Bockstael, N. E., Strand, I. E. and Hanemann, W. M. Time and the recreational demand model, American journal of agricultural
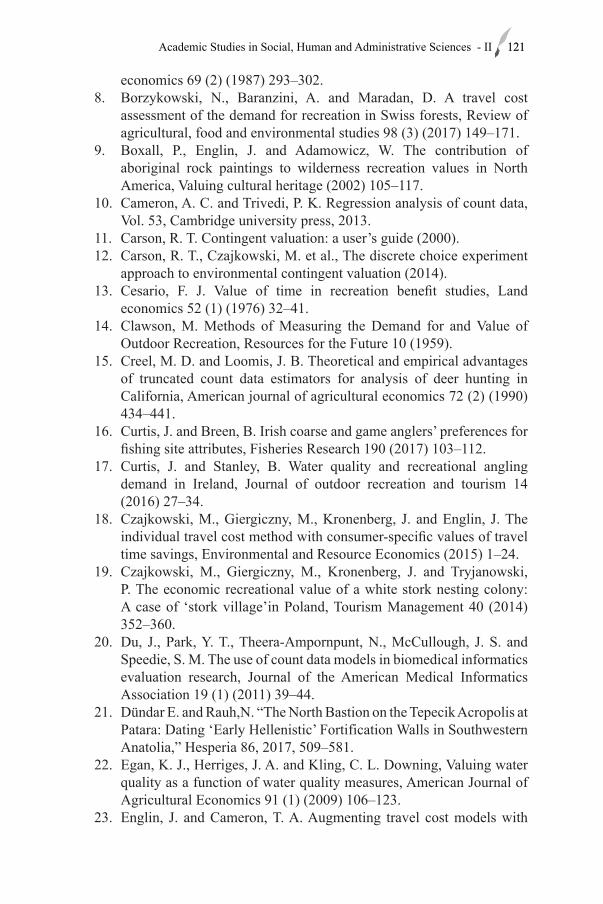
121Academic Studies in Social, Human and Administrative Sciences - II 121
economics 69 (2) (1987) 293–302. 8. Borzykowski, N., Baranzini, A. and Maradan, D. A travel cost
assessment of the demand for recreation in Swiss forests, Review of agricultural, food and environmental studies 98 (3) (2017) 149–171.
9. Boxall, P., Englin, J. and Adamowicz, W. The contribution of aboriginal rock paintings to wilderness recreation values in North America, Valuing cultural heritage (2002) 105–117.
10. Cameron, A. C. and Trivedi, P. K. Regression analysis of count data, Vol. 53, Cambridge university press, 2013.
11. Carson, R. T. Contingent valuation: a user’s guide (2000). 12. Carson, R. T., Czajkowski, M. et al., The discrete choice experiment
approach to environmental contingent valuation (2014). 13. Cesario, F. J. Value of time in recreation benefit studies, Land
economics 52 (1) (1976) 32–41. 14. Clawson, M. Methods of Measuring the Demand for and Value of
Outdoor Recreation, Resources for the Future 10 (1959). 15. Creel, M. D. and Loomis, J. B. Theoretical and empirical advantages
of truncated count data estimators for analysis of deer hunting in California, American journal of agricultural economics 72 (2) (1990) 434–441.
16. Curtis, J. and Breen, B. Irish coarse and game anglers’ preferences for fishing site attributes, Fisheries Research 190 (2017) 103–112.
17. Curtis, J. and Stanley, B. Water quality and recreational angling demand in Ireland, Journal of outdoor recreation and tourism 14 (2016) 27–34.
18. Czajkowski, M., Giergiczny, M., Kronenberg, J. and Englin, J. The individual travel cost method with consumer-specific values of travel time savings, Environmental and Resource Economics (2015) 1–24.
19. Czajkowski, M., Giergiczny, M., Kronenberg, J. and Tryjanowski, P. The economic recreational value of a white stork nesting colony: A case of ‘stork village’in Poland, Tourism Management 40 (2014) 352–360.
20. Du, J., Park, Y. T., Theera-Ampornpunt, N., McCullough, J. S. and Speedie, S. M. The use of count data models in biomedical informatics evaluation research, Journal of the American Medical Informatics Association 19 (1) (2011) 39–44.
21. Dündar E. and Rauh,N. “The North Bastion on the Tepecik Acropolis at Patara: Dating ‘Early Hellenistic’ Fortification Walls in Southwestern Anatolia,” Hesperia 86, 2017, 509–581.
22. Egan, K. J., Herriges, J. A. and Kling, C. L. Downing, Valuing water quality as a function of water quality measures, American Journal of Agricultural Economics 91 (1) (2009) 106–123.
23. Englin, J. and Cameron, T. A. Augmenting travel cost models with
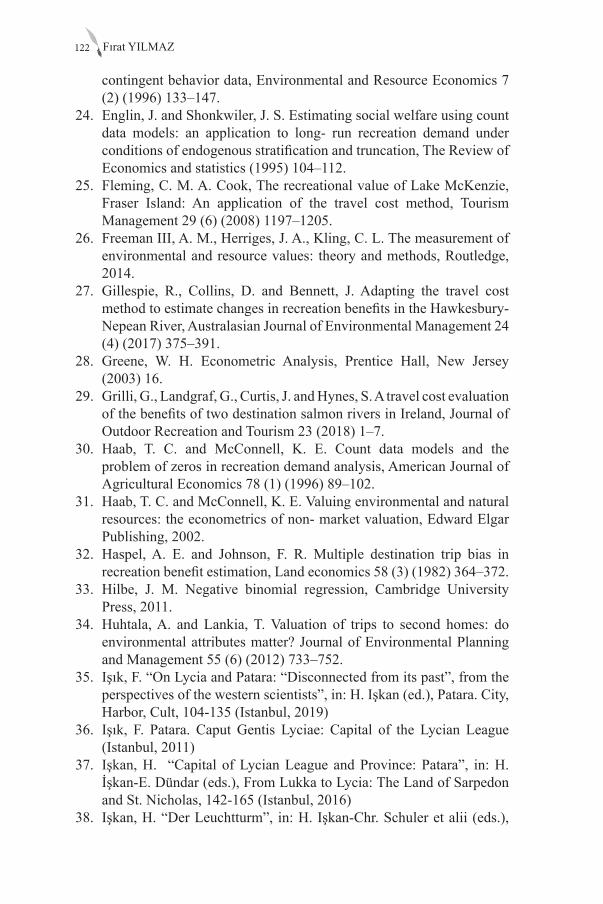
Fırat YILMAZ122
contingent behavior data, Environmental and Resource Economics 7 (2) (1996) 133–147.
24. Englin, J. and Shonkwiler, J. S. Estimating social welfare using count data models: an application to long- run recreation demand under conditions of endogenous stratification and truncation, The Review of Economics and statistics (1995) 104–112.
25. Fleming, C. M. A. Cook, The recreational value of Lake McKenzie, Fraser Island: An application of the travel cost method, Tourism Management 29 (6) (2008) 1197–1205.
26. Freeman III, A. M., Herriges, J. A., Kling, C. L. The measurement of environmental and resource values: theory and methods, Routledge, 2014.
27. Gillespie, R., Collins, D. and Bennett, J. Adapting the travel cost method to estimate changes in recreation benefits in the Hawkesbury-Nepean River, Australasian Journal of Environmental Management 24 (4) (2017) 375–391.
28. Greene, W. H. Econometric Analysis, Prentice Hall, New Jersey (2003) 16.
29. Grilli, G., Landgraf, G., Curtis, J. and Hynes, S. A travel cost evaluation of the benefits of two destination salmon rivers in Ireland, Journal of Outdoor Recreation and Tourism 23 (2018) 1–7.
30. Haab, T. C. and McConnell, K. E. Count data models and the problem of zeros in recreation demand analysis, American Journal of Agricultural Economics 78 (1) (1996) 89–102.
31. Haab, T. C. and McConnell, K. E. Valuing environmental and natural resources: the econometrics of non- market valuation, Edward Elgar Publishing, 2002.
32. Haspel, A. E. and Johnson, F. R. Multiple destination trip bias in recreation benefit estimation, Land economics 58 (3) (1982) 364–372.
33. Hilbe, J. M. Negative binomial regression, Cambridge University Press, 2011.
34. Huhtala, A. and Lankia, T. Valuation of trips to second homes: do environmental attributes matter? Journal of Environmental Planning and Management 55 (6) (2012) 733–752.
35. Işık, F. “On Lycia and Patara: “Disconnected from its past”, from the perspectives of the western scientists”, in: H. Işkan (ed.), Patara. City, Harbor, Cult, 104-135 (Istanbul, 2019)
36. Işık, F. Patara. Caput Gentis Lyciae: Capital of the Lycian League (Istanbul, 2011)
37. Işkan, H. “Capital of Lycian League and Province: Patara”, in: H. İşkan-E. Dündar (eds.), From Lukka to Lycia: The Land of Sarpedon and St. Nicholas, 142-165 (Istanbul, 2016)
38. Işkan, H. “Der Leuchtturm”, in: H. Işkan-Chr. Schuler et alii (eds.),
123Academic Studies in Social, Human and Administrative Sciences - II 123
Patara. Lykiens Tor zur römischen Welt, 83-86, (Darmstadt, 2016)39. Işkan, H. “The Bouleuterion. First steps of Democracy”, in: H. Işkan
(ed.), Patara. City, Harbor, Cult, 68-83 (Istanbul, 2019)40. Kaoru, Y., Smith, V. K. and Liu, J. L. Using random utility models
to estimate the recreational value of estuarine resources, American Journal of Agricultural Economics 77 (1) (1995) 141–151.
41. Koçak, M. and Dündar, E. “West Lycia’s gate to the sea: Patara Harbor”, in: H. Işkan (ed.), Patara. City, Harbor, Cult, 286-298 (Istanbul, 2019)
42. Kuosmanen, T., Nillesen, E. and Wesseler, J. Does ignoring multidestination trips in the travel cost method cause a systematic bias?, Australian Journal of Agricultural and Resource Economics 48 (4) (2004) 629–651.
43. Larson, D. M. Joint recreation choices and implied values of time, Land Economics (1993) 270–286.
44. Long, J. S. and Freese, J. Regression models for categorical dependent variables using Stata, Stata press, 2006.
45. M. Clawson, M. and Knetsch, J. L. Economics of Outdoor Recreation (1966).
46. McConnell, K. E. On-site time in the demand for recreation, American journal of agricultural economics 74 (4) (1992) 918–925.
47. McKean, J. R., Johnson, D. M. and Walsh, R. G. Valuing time in travel cost demand analysis: An empirical investigation, Land Economics (1995) 96–105.
48. Melstrom, R. T. Valuing historic battlefields: an application of the travel cost method to three American Civil War battlefields, Journal of Cultural Economics 38 (3) (2014) 223–236.
49. Mendelsohn, R., Hof, J., Peterson, G. and Johnson, R. Measuring recreation values with multiple destination trips, American Journal of Agricultural Economics 74 (4) (1992) 926–933.
50. Mitchell, R. C. and Carson, R. T. Using Surveys to Value Public Goods: The Contingent Valuation Method, Resources for the Future, 1989.
51. Morrison, M. A guide for estimating the non-market values associated with improved fire management, Report prepared for the Bushfire Co-operative Research Centre (2009).
52. N. Hanley, N., Barbier, E. B. and Barbier, E. Pricing nature: cost-benefit analysis and environmental policy, Edward Elgar Publishing, 2009.
53. Navrud, S., Ready, R. C. Valuing cultural heritage: Applying environmental valuation techniques to historic buildings, monuments and artifacts, Edward Elgar Publishing, 2002.
54. Nde, T. P. Non-market valuation of beach recreation using the Travel
Fırat YILMAZ124
Cost Method (TCM) in the context of the developing world: An application to visitors of the Ngoé Beach in Kribi, Cameroon, Second cycle, A2E. Uppsala: SLU, Dept. of Economics (2011).
55. Nijkamp, P. Economic valuation of cultural heritage, The economics of uniqueness (2012).
56. O’hara, R. B. and Kotze, D. J. Do not log-transform count data, Methods in ecology and Evolution 1 (2) (2010) 118–122.
57. Ovaskainen, V., Neuvonen, M. and Pouta, E. Modelling recreation demand with respondent-reported driving cost and stated cost of travel time: A Finnish case, Journal of Forest Economics 18 (4) (2012) 303–317.
58. Parsons, G. R. The travel cost model (2003). 59. Parsons, G. R. Travel cost methods (2013). 60. Patara Antik Kenti-Antalya, Access date: 06.10.2019. URL https://
www.kulturportali.gov.tr/turkiye/antalya/gezilecekyer/patara 61. Poetto, M. L’iscrizione luvio-geroglifica di Yalburt, StMed 8 (Pavia,
1998).62. Poor, P. J. and Smith, J. M. Travel cost analysis of a cultural heritage
site: The case of historic St. Mary’s City of Maryland, Journal of cultural economics 28 (3) (2004) 217–229.
63. Prayaga, P., Rolfe, J. and Sinden, J. A travel cost analysis of the value of special events: Gemfest in Central Queensland, Tourism Economics 12 (3) (2006) 403–420.
64. Randall, A. A difficulty with the travel cost method, Land economics (1994) 88–96.
65. Rojas, E. Governance in historic city core regeneration projects, (The Economics of Uniqueness) (2012) 143.
66. Rolfe, J. and Gregg, D. Valuing beach recreation across a regional area: The Great Barrier Reef in Australia, Ocean & Coastal Management 69 (2012) 282–290.
67. Schuler, C. “History of the City from the classical Period until the establishment of the Province of Lycia”, in: H. Işkan (ed.), Patara. City, Harbor, Cult, 68-83 (Istanbul, 2019)
68. Segerson, K. Valuing environmental goods and services: an economic perspective (2017).
69. Shaw, D. On-site samples’ regression: Problems of non-negative integers, truncation, and endogenous stratification, Journal of Econometrics 37 (2) (1988) 211–223.
70. Shrestha, R. K., Seidl, A. F. and Moraes, A. S. Value of recreational fishing in the Brazilian Pantanal: a travel cost analysis using count data models, Ecological economics 42 (1-2) (2002) 289–299.
71. Smith, V. K. Nonmarket valuation of environmental resources: an interpretive appraisal, Land Eco- nomics (1993) 1–26.
125Academic Studies in Social, Human and Administrative Sciences - II 125
72. Smith, V. K., Desvousges, W. H. and McGivney, M.P. The opportunity cost of travel time in recreation demand models, Land economics 59 (3) (1983) 259–278.
73. Takaoğlu, T, Işın, G. and Korkut, T. Archaeological evidence for 9th and 8th millennia BC at Girmeler Cave near Tlos in SW Turkey, Documenta Praehistorica 41, (2014) 111-118
74. Tanrikut, A. Türkiye Posta ve Telgraf ve Telefon Tarihi ve Teşkilat ve Mevzuatı, Bd. II, 689-693 (Ankara 1968)
75. Throsby, D. Heritage economics: a conceptual framework, The Economics of Uniqueness (2012) 45.
76. Torres-Ortega, S., Pérez-Álvarez, R., Díaz-Simal, R. P., Luis-Ruiz, J. and Piña-García, F. Economic Valuation of Cultural Heritage: Application of Travel Cost Method to the National Museum and Research Center of Altamira, Sustainability 10 (7) (2018) 2550.
77. Tourkolias, C., Skiada, T., Mirasgedis, S. and Diakoulaki, D. Application of the travel cost method for the valuation of the Poseidon temple in Sounio, Greece, Journal of Cultural Heritage 16 (4) (2015) 567–574.
78. Tourkolias, C., Skiada, T., Mirasgedis, S. and Diakoulaki, D. Application of the travel cost method for the valuation of the Poseidon temple in Sounio, Greece, Journal of Cultural Heritage 16 (4) (2015) 567–574.
79. Ward, F. A. and Loomis, J. B. The travel cost demand model as an environmental policy assessment tool: a review of literature, Western Journal of Agricultural Economics 11 (1836-2016-150908) (1986) 164–178.
80. Whitehead, J. C., Pattanayak, S. K., Houtven, G. L. V., Gelso, B. R. Combining revealed and stated preference data to estimate the nonmarket value of ecological services: an assessment of the state of the science, Journal of Economic Surveys 22 (5) (2008) 872–908.
81. Willis, K. G., Snowball, J. D., Wymer, C. and Grisolía, J. A count data travel cost model of theatre demand using aggregate theatre booking data, Journal of Cultural Economics 36 (2) (2012) 91–112.
82. Windle and Rolfe, J. Estimating nonmarket values of Brisbane (state capital) residents for state based beach recreation, Ocean & coastal management 85 (2013) 103–111.
83. Zambrano-Monserrate, M. A., Silva-Zambrano, C. A. and Ruano, M. A. The economic value of natural protected areas in Ecuador: A case of Villamil Beach National Recreation Area, Ocean & coastal management 157 (2018) 193–202.
84. Zhang, F., Wang, X. H., Nunes, P. A. and C., Ma. The recreational value of gold coast beaches, Australia: An application of the travel cost method, Ecosystem Services 11 (2015) 106–114.

Fırat YILMAZ126
85. Zimmermann, K. “Lycia under the Roman Empire an in Late Antiquity”, in: H. Işkan (ed.), Patara. City, Harbor, Cult, 84-100 (Istanbul, 2019)
86. Zimmermann, M. “Die Landschaft Lykien – Patara im Xanthos-Tal”, in: H. Işkan-Chr. Schuler et alii (eds.), Patara. Lykiens Tor zur römischen Welt, 8-16, (Darmstadt, 2016)
Chapter 8ANALYSING TOURISM PRODUCT RELATED
BEHAVIORS OF DISABLED TOURISTS:AN IMPLICATION IN FLORIDA-USA
Funda ODUNCUOĞLU1
1 Dr. Öğretı̇m Üyesı̇, Aydin Adnan Menderes Ünı̇verı̇stesı̇ Söke İşletme Fakültesi, [email protected]

129Academic Studies in Social, Human and Administrative Sciences - II 129
1. IntroductionAs a defination; “persons with disabilities” includes all persons who
owing to the environment being encountered, suffer a limitation in their relational ability and have special needs during travel, in accommodations, and other tourism services, particularly individuals with physical, sensory and intellectual disabilities or other medical conditions requiring special care, such as elderly persons and others in need of temporary assistance.(World Tourism Organisation [WTO], 2001). Beside this defination, a ty-pology of impairments is identified including mobility, sensory and com-munication impairments to intellectual/ mental disorders as well as hidden impairments in the form of health problems (Buhalis et al; 2005: 63). Ac-cording to activists in the disability movement, it is important to distin-guish between ‘impairment’ and ‘disability’. They claim that impairment refers to physical or cognitive limitations that an individual may have, such as the inability to walk or speak. In contrast, disability refers to socially imposed restrictions, that is, the system of social constraints that are im-posed on those with impairments by the discriminatory practices of society (Burnett and Baker, 2001: 8).
Beside the definations, two major models of disability exist: the med-ical and the social model. The medical model positions disability as be-ing the ‘problem’ of the individual. Health is a multifaceted phenomenon, encompassing physical health, emotional well-being and social cohesion (Shaw and Coles,2003: 398). This alternative approach is often called the social model. It stresses that disability should not be regarded as a deviance but as a normal aspect of life and it is the society that should build appro-priate structures to cater for people’s needs (Buhalis et al., 2005; Aitchison, 2003 ). Within this approach the focus is placed on providing necessary services in order to remove or minimise social and environmental barriers to full social, physical and leisure participation (Aitchison, 2009; McKer-cher et al, 2003; Shaw and Coles, 2004)
Depend on the ageing populations and the higher risk of disability in older people as well as the global increase in chronic health conditions, the disabled population’s increasing rate will be a greater concern in the next decades (Buhalis et al., 2005; WHO and WB, 2011; Europen Com-mission 2010; ITB,2012; ENAT,2012). Based on 2010 global population estimates that more than one billion people in the world live with some form of disability (WHO and WB, 2011), of whom nearly 200 million experience considerable difficulties in functioning (WHO and WB, 2011) and the disabled population constitutes approximately 8% of its population (UNESCAP, 2000). This is higher than previous World Health Organiza-tion estimates, which date from the 1970s and suggested around 10% ( WHO and WB, 2011). 56.7 million people, 19% percent of the population
Funda ODUNCUOĞLU130
and it means nearly 1 in 5 people have a disability in the United States (Americans with Disabilities Report, 2010), the number of people with disabilities is expected to double to around 100 million people by the year 2030 (Lach, 1999; Burnet and Baker 2001; Var et al, 2008). In Europe alone, there are 80 million people with disabilities, according to research. When including travel companions, the potential size of the “accessible tourism” market is estimated at 133 million people. These figures mean that roughly 10% of the population needs “barrier free” or “accessible” travel in the world.(ITB 2012; ENAT,2012). In fact, this figure is even greater, taking into considerations that all citizens need some degree of accessibility for their general comfort and quality when travelling (Buhalis et al., 2005: 65). According to the research, it could be clearly seen that the total population of disabled people create a significant market segment (Murray and Sproats, 1990; Vignuda, 2001; McKercher et al., 2003; Ray and Ryder, 2003 ).
Both national and local, especially governments, and also private or-ganizations are becoming more sensitive about the disabled people and their travel rights because of the significant proportion of disabled people within the world’s population (Burnett and Baker, 2001: 7). At the same time, national and local government agencies responsible for tourism de-velopment have also been charged with widening access to tourism oppor-tunities, most recently as part of a social justice agenda which recognizes tourism participation as a right of citizenship (Richards et al, 2010: 1098). The size of the disabled market is suggested to be one main motive for such studies (Huh and Singh, 2007; Kaufman and Scarborough, 1998). Also, efforts to better understand people with disabilities may be based on recent legislative endeavors rooted in US law and subsequently enacted in Europe and elsewhere.
Some countries have introduced legislation designed to make it com-pulsory for tourism suppliers to create an environment that is accessible to disabled people. The American Disabilities Act (Part III passed in 1990) and the Disability Discrimination Act (Part 3 passed in 1995) symbolize a new stage with regard to the civil rights of people with disabilities. These laws were further modified (for example, the ADA Amendments Act of 2008) and serve as models for protecting the civil rights of people with dis-abilities. Other countries such as, Bermuda (Forbes, 2009), Scotland and Northern Ireland relied on the DDA and the ADA (SAIF, 2009) to establish their own codes of practice. Other countries such as Israel and Canada es-tablished country specific codes of practice and regulations based on civil rights and equal opportunity laws relating to access to accommodation. The impact of the ADA and the DDA is also evident in hotel chains and associations (e.g. Hotel Association of India, 2009), many of which estab-

131Academic Studies in Social, Human and Administrative Sciences - II 131
lished specific practice codes. Such codes relate primarily to hotel rooms and public areas (British Standards, 2008), almost exclusively focusing on the physical aspects of the environment and the mobility considerations of people with disabilities (Poria et al, 2011:577).
The main purposes of the acts are to promote, protect and ensure the full and equal enjoyment of all human rights and fundamental freedoms by all persons with disabilities, and to promote respect for their inherent dig-nity. The Acts gather persons with disabilities who have long-term physi-cal, mental, intellectual or sensory impairments which in interaction with various barriers may hinder their full and effective participation in society on an equal basis with others. However, the introduction of specific legisla-tion aimed at people with disabilities (e.g. the Americans with Disabilities Act, 1990) does not guarantee that disability discrimination will not occur or that industry sectors will proactively address disability access require-ments (Grady and Ohlin, 2009: 163).
Although, to take advantage of this potential niche market will depend on how the tourism sector as a whole and the tourism industry in particular will address the issue of tourism accessibility for people with disabilities. Indeed good access will benefit not only people with disabilities, but also many other members of the community, especially senior citizens. Several tourism entities throughout the world have been conducting or funding on a regular basis travel projects that are designed to provide baseline in-formation about travelers and to develop appropriate marketing strategies and management actions (Uysal et al, 2000: 91). Indeed, destination tour-ism officials need to know more about the nature of visitor characteristics and how actual and potential visitors perceive destinations. Because, un-secured information adversely affects the trust of individuals towards the institutions and organizations, which may lead to tangible and intangible losses (Yağcı et al., 2019: 262).This type of information is primarily uti-lized in positioning or repositioning a given place in the tourism market place. In addition, such information allows destination marketers and man-agers to better position themselves so that increased demand for visitation may be generated to their respective destinations(Uysal et al., 2000: 92).To maintain or capture a significant population, marketing firms are often challenged to create positive product perceptions. Some service providers may need to augment supply resources to match demand and meet tourist expectations, and thus to create an enhanced perception of the existing resources ( Uysal et al., 2000: 92).
Gilbert (1990:27) articulated that tourism establishments should pro-mote themselves using the distinct attributes to entice demand. Based on the literature, an assessment of tourist’s perceptions helps marketers po-sition their products and services more effectively (Uysal et al., 2000: 93).
Funda ODUNCUOĞLU132
It should therefore be the first priority of tourism planners to develop strategies to promote accessible tourism by taking into account the primary benefits sought by potential customers. The accessibility market will only become a profitable market for the tourism industry if it is properly posi-tioned and subgroups within this segment are well understood. Given the spectrum of people requiring accessibility, it can be seen that the market for accessibility is not homogenous but multifaceted and wide-ranging(Buha-lis et al., 2005: 76). A service offering reliable information on accessibility supports thereby a variety of target customers. Some people might acquire a greater level of accessibility needs for a limited period of time (preg-nancy, broken limbs, etc.), whereas others have accessibility requirements during their whole life. Everyone has specific individual requirements due to different abilities. Thus, it is a heterogeneous market which entails a series of different sub-markets.(Buhalis et al., 2005: 76)
By looking specifically at people with impairments as well as the el-derly population, 7 main clusters can be identified:
1) mobility impaired individuals (with varying levels of mobility)
2) blind or partially sighted individuals
3) deaf or partially hearing individuals
4) speech impaired individuals
5) mental/ intellectually impaired individuals
6) travellers with hidden individuals
7) elderly individuals (which often suffer from one or more of the above disabilities)
All these target customers might travel alone or in company of able-bodied assistants, friends or family member, illustrating the real mar-ket size for accessibility. The need for inclusive design on the one hand and good market segmentation on the other can support organisations to deliv-er adequate tourism products and services to these groups. Dividing the market into distinct groups of people with similar needs and wants allows tourism planners and managers to understand what really matters for con-sumers and to create unique product offerings. By targeting these groups, they have the chance to achieve competitive advantages through differenti-ation (Buhalis et al., 2005: 77). Further, the establishment of well-defined demand types has profound implications in the marketing and positioning of destinations and organisations. The higher the access requirements, the more attention has to be paid to certain accessibility criteria. Individuals with the highest accessibility requirement might therefore be better served by specialized providers that have a profound knowledge of their high
133Academic Studies in Social, Human and Administrative Sciences - II 133
needs. Other people with more moderate needs should be served by main-stream providers who have utilised inclusive design in their facilities.
This is mainly due to two reasons: First, many people who suffer from a temporary disability do not often see themselves in need of special ser-vices and hence purchase tourism products from mainstream providers. Secondly, disabled people with moderate or low access needs do not feel that they should be using specialised facilities that may stigmatise them and argue for an inclusive design and service. Increasing legislative and social responsibility will enable mainstream players to adapt their offering to all types and grades of disability. So, tourism facility developers need to appreciate different types and levels of accessibility requirements in order to address them accordingly (Buhalis et al., 2005: 64).
Despite the large number of persons with disabilities around the world and the new business opportunities acknowledged for the tourism indus-try (Bi et al, 2007; Daniels et al, 2005; Darcy et al, 2010), disability is still a relatively neglected subject within tourism research (Bizjak et al, 2011; Richards et al., 2010). In fact, literature dealing with tourism and disability(ies), although stressing the frequent exclusion of persons with disabilities and emphasizing the potential benefits related to tourism activ-ities (Haukeland, 1990; Yau et al, 2004) seems to neglect the diversity of disabilities. However, as Figueiredo et al. (2012:533) recently pointed out, persons with disabilities are a quite diverse group from the point of view of experiences, views and needs and nature of the disability.
Changes to legal and social environments have contributed to the expansion of the disabled tourism market. However, despite this growth, within tourism there is a distinct lack of research of this nichemarket, and in particular of the barriers which impede or prevent those with disabil-ities from participatingin tourism (Lee et al., 2012: 571).Existing litera-ture tends to suggest that people with disabilities face a number of barriers to participation tourism activities (Yau et al., 2004, Murray and Sproats, 1990). Nevertheless it is widely accepted that desire to travel is the same for persons with or without a disability (Yau et al., 2004: 950). Because of these barriers, they have less opportunities to access tourism than people without disabilities (Turco et al., 1998: 81). It suggests the need to elimi-nate such obstacles so as to increase the participation of disabled people in tourism movements (Israeli, 2002; McKercher et al., 2003).
Tourists with disabilities, today are not content with staying within the confines of a resort hotel compound, being bussed to individual sites and entertained in places that mainly cater to tourists. Instead, tourists with disabilities are increasingly interested in experiencing diversity of holiday environment in all aspects, including its people, culture, nature, architec-
Funda ODUNCUOĞLU134
ture and way of life. This trend will be even more marked as disabled consumers become better informed about options and entitlements, as well as more sophisticated and less willing to accept poor quality facilities and services that entail discomfort and stress. Tourists with disabilities want access to everything that a city or a country has to offer. In view of the changing consumer demand, tourism for all is an increasingly important sales argument in a competitive market. At the same time, it can serve as an effective tool in furthering the human rights of people with disabilities in the destination communities.
Investigating specific travel patterns of disabled people has shown that most needs, preferences, requirements and quality expectations are similar to the able-bodied population(Yau et al., 2004; Paga´n, 2012; Richards et al., 2010). Differences exist only in the travel duration and travels spending as disabled people tend to stay longer than able-bodied and have a high-er disposable income for holidays. Hospitality operators who believe that ‘‘accessibility remains largely an exposure to risk and the minimum action needed for compliance and risk minimization’’,perhaps unwittingly, have adopted a very narrow view of accommodating travelers with disabilities which is focused primarily on the accessibility of the facility itself but which largely ignores the broader service components of accommodating the guest’s unique set of needs (Rice, 2006: 68).
As a priority, to improve performance, service firms must ‘‘provide customers with the services they require in a manner which is acceptable to them ’’ (Gray et al., 2002:190) While one could interpret this as encour-aging the customization of hospitality services, the recommendation can perhaps be more accurately understood as a way to conceptualize service provision in away that ensures that tourists with disabilities and able-bod-ied tourists alike are provided hospitality services in an equivalent man-ner which ensures equal enjoyment of the goods and services provided. ( Grady and Ohlin, 2009: 163).
The question is not whether mainstreaming ‘OR’ specialised is best for the market of people who require accessibility: both are needed. Cus-tomers expect to have the freedom to choose which kind of tourism ac-commodation suits them best in terms of their expectations, the care and services they need, and personal preference. Therefore mainstreaming and specialized tourism should be viewed as complementary(ENAT Report, 2012)
A qualitative research study by NOP consumer on behalf of VisitBrit-ain (2003) revealed that disabled consumers in the UK generally preferred accessible tourism accommodation to be in the mainstream tourism sector and not ‘specialist-disabled’. (ENAT Report, 2012). Results of a recent
135Academic Studies in Social, Human and Administrative Sciences - II 135
study by Vos (2007) partly confirm these findings: If possible, holidays with a special focus on care for persons with high-end access needs should be organised in the mainstream tourism sector, as the majority of families with children prefer to go on holiday with their family and stay in accom-modation which reflects ‘the holiday feeling and atmosphere’. On the other hand, because of the necessity of care and medical treatment and the provi-sion of specific services and facilities for these people with high-end needs, it is not always possible to organise these holidays within the mainstream venues(ENAT Report, 2012).
When the tourism literature is examined, it can be realized that some researchers have advocated that, insufficient research within tourism re-search and allied field has been published examining tourism and disability (Lee et al., 2012; Aitchison, 2009; Burnett and Baker 2001; Darcy, 2002; Richards et al., 2010; Paga´n, 2012 ). According to the Researchers, tour-ism researchers have failed to attribute importance to the disability issues although, the meaningful growth in tourism knowledge over the past half century (Richards et al., 2010; Tribe, 2009) and also tourism research has barely scratched the surface of disability (Tribe,2009: 16). On the other hand, some researchers have supported that, a great deal of research has in-vestigated disabled tourism and there has been a series of well-documented constraints and problems that people with disabilities encounter with espe-cially accessible tourism facilities (Darcy,2010 ; Bi et al, 2007; Daniels et al., 2005; Daruwalla and Darcy, 2005; Tantawy et al., 2004).
A number of researchers mentioned this idea in the late 80’s and early 90’s (Driedger 1987; Murray and Sproats, 1990). Indeed, when the tourism and disabled literature is examined based on both different perspectives, it can be indicated that, after the acts, which were enacted by the goverments for making the disabled people’s life easy and equal as well as the people without disability, the awareness has increased within the years (Darcy and Taylor, 2009; United Nations, 2006; Driedger 1987; Muloin 1992; Murray and Sproats 1990). Since Smith’s (1987) seminal study of tourism and peo-ple with disabilities, academic interest in this field has been growing then this area(Yau et al., 2004; Paga’n, 2012) and in this context, over the years, both quantitative and qualitative remarkable academic research has pub-lished about this subject (Darcy,2010 ; Bi et al., 2007; Daniels et al., 2005; Daruwalla and Darcy, 2005; Tantawy et al., 2004). However, academic researches in this field make sufficient sense for understanding several at-tributes of the people, especially tourists with disabilities, throughout the researches, it is still not enough to see the all picture clearlly for gaining long-term success in this vital market segment.
In this context, as a cumulative result from the examined reserches, it is claimed that disabled tourism is a type of tourism that has its own char-
Funda ODUNCUOĞLU136
acteristics and depending on this reason, many tourism businesses have confusion about the disabled needs which can be distinguished from the regular ones. Therefore, varying disabilities of the disabled individuals cause them to have different needs and requests from the beginning of their vacations to the end (Buhalis et al., 2005: 77). For instance; requiring extra expenditures on ramps, specially fitted rooms, and the loss of prime parking. In fact, the confusion is coming from the stereotypical perspec-tives and having limited knowledge about the disabled essential needs. In this case, disabled tourism market is affected negatively from this situation besides it can’t develop as fast as the other market segments can.
This research tries to take this kind of superficial understanding away and offers new perceptions into the possibilities associated with the dis-abled, including general trends and need sets, furthermore to determine and identify the content of the tourism product-based requirement of the disable tourism.
2- MethodologyThis research aims to contribute to filling the existent gap in literature
regarding the disable tourism subject, by analyzing several forms of being disabled. For this purpose, this research was designed to further the under-standing of the tourists with disabilities vacationing in the United States. As secondary market data are rather scarce for this market segment, prima-ry data collection was necessary to identify and analyze market segments on the basis of tourism product behavior. For this reason, a questionnaire was developed for data collection purposes.
2.1. Questionnaire Development
The questionnaire for this study was a multiple-page, self-adminis-tered instrument, which probed travel patterns, attitudes, tourism product related behaviors and gathered demographic information of tourists with disabilities. The behavioral questions which were related with the tourism product levels and demographic questions were largely for classificatory and profiling purposes. The variables of interest in these two sections of the survey instrument included such variables as frequency of travel, mode of travel, reason for travel, gender, age, and marital status, to name a few. These variables were scaled by closed-ended questions.
In constructing the tourism product related behavior of tourists with disabilities assessment scale, items were derived from the tourism liter-ature (Burnett and Baker, 2001; Daruwalla and Darcy, 2005; Yau et al., 2004; Fleischer and Pizam, 2002) and also marketing studies (Upchurch and Seo, 1996; Uysal et al., 2000 ; Chen and Uysal, 2002). After exam-ining the both literature, 35 items that related with the tourism product
137Academic Studies in Social, Human and Administrative Sciences - II 137
levels were obtained and then, these 35 items were submitted to principal components factor analysis with the Harris-Kaiser Case II oblique rotation (SPSS 1990). This was done to gain a clear understanding of the underly-ing structure of the 35 reasons for tourism product considered.
2.2. Sampling Procedure & Data Collection
Study was implicated in Florida. There are several important reasons for conducting this study in Florida. Florida is the fourth largest state in the nation, with more than 18 million residents currently and it presently has the largest proportion of older adults in the United States. More than18% (approximately 2.7 million) of Florida’s population is 65 and older, and this population is expected to increase by one-third in the next 15 years. On the other hand, this location was selected as a destination that offers a va-riety of travel experiences, including beach vacations, business and meet-ings, art and heritage tourism, leisure and sport activities, medical tourism, and ecotourism. Due to the variety of tourism types developed in Florida, the state also offers a wide selection of different hotel properties, such as leisure/beach hotels, resorts, business/conference hotels, limited service, select service, and full-service properties. Besides these reasons, from transportation options to hotels, to attractions to even getting around the beaches, Florida extends a warm welcome for people with special needs. These all ressons allowed us to collect sufficient and currently responses from the tourists with different kinds of disability.
In this context, survey sample population consisted of the people with disabilities who visited Florida as tourists during the research period. For reaching the respondents, two different methods were used. First is getting in contact with several disability organizations. This was determined to be the first viable method to reach a statewide cross-section of the population of the people with disabilities in sufficient numbers. Two important dis-ability organisations gave positive responses for getting involved to the re-search (SATH (Society for Accessible Travel and Hospitality) and FDOA (Florida Disabled Outdoors Association)). Discussions with these key or-ganizations were held during development process of the questionnaire. Then, questioneires were delivered to the members of the organisations via e-mail by the organisations. They did not allow us to obtain access to organizational e-mail mailing lists. Second used method was sending web-based questioneries to the Florida hotels. For reaching to the contact e-mail address of the hotels, a data-based was bought. After that, questioneries (goggle survey tool was used for giving a standart form to the questionerie and also sending the forms fastly and getting the responses easily) were sent to the contact e-mails.Survey process took three mounths (from the beginning of July 2019 to the end of September 2019).
Funda ODUNCUOĞLU138
Of the 900 actual questionnaires mailed to the hotels based on e-mail data, 637 were returned because of an incorrect address or other deliv-ery problems. 263 questionnaires were returned by respondents who were staying at these hotels, with 112 discarded because of serious omissions. In the end, 151 (16.7%) usable questionnaires were obtained from the Florida hotels. Of the 1000 actual questionaires were mailed to the memebers of the organisations by the officials of the organizations, 418 questionnaires were returned, with 62 discarded because of serious omissions. In the end, 356 (35.6%) usable questionnaires were obtained from the disabled orga-nizations. Totally, 507 usable questionnaires (52.3%) were analyzed. Lim-ited time and difficulties prevented a follow-up mailing. Still, this response rate is considered quite acceptable.
2.3. Hyphothesis and Factor Analysis
The only one difference which distinguishes people with disabilities from the other people is the disabilities that they have. By looking at this idea, it is indicated that the people with disabilities have no differences about their desires for travelling or taking holiday than the other people like the other social facts so this idea can be stated as a back bone for this study. In this context, this study aimed to reveal the tendency and the se-verity of the tourism product related behaviors of the tourists with disabili-ties according to their disability types and profile attributes. As a result, this research is aimed to create a new vision for both tourists and the business and tried to eliminate the prejudices about the disable tourism by gaining better understanding about the desires which are based upon tourism prod-uct levels.
As stated previously, research indicates that the people with disabili-ties will tend to display tourism product behaviors when selecting a holi-day destination. The following hypotheses were tested in the present study:
Hypothesis 1: There is a statistically significant difference between demographic variables in terms of the types of disability.
Hypothesis 2: There is a statistically significant difference between travel behaviors in terms of the types of disability.
Hypothesis 3: There is a statistically significant difference between opinions for the holiday in Florida in terms of the types of disability.
Hypothesis 4: There is a statistically significant difference between opinions for tourism product levels in terms of the types of disability.
Hypothesis 5: A positive relationship exists between tourism product levels and the opinions for the holiday in Florida.
After defining the five hypothesis of the research, analyses were done
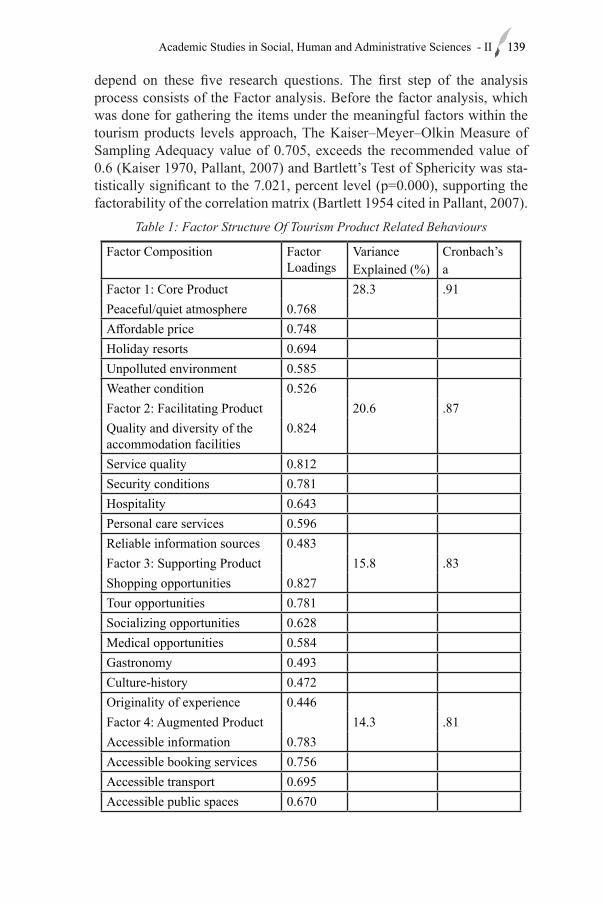
139Academic Studies in Social, Human and Administrative Sciences - II 139
depend on these five research questions. The first step of the analysis process consists of the Factor analysis. Before the factor analysis, which was done for gathering the items under the meaningful factors within the tourism products levels approach, The Kaiser–Meyer–Olkin Measure of Sampling Adequacy value of 0.705, exceeds the recommended value of 0.6 (Kaiser 1970, Pallant, 2007) and Bartlett’s Test of Sphericity was sta-tistically significant to the 7.021, percent level (p=0.000), supporting the factorability of the correlation matrix (Bartlett 1954 cited in Pallant, 2007).
Table 1: Factor Structure Of Tourism Product Related Behaviours
Factor Composition Factor Loadings
VarianceExplained (%)
Cronbach’sa
Factor 1: Core Product 28.3 .91Peaceful/quiet atmosphere 0.768Affordable price 0.748Holiday resorts 0.694Unpolluted environment 0.585Weather condition 0.526Factor 2: Facilitating Product 20.6 .87Quality and diversity of the accommodation facilities
0.824
Service quality 0.812Security conditions 0.781Hospitality 0.643Personal care services 0.596Reliable information sources 0.483Factor 3: Supporting Product 15.8 .83Shopping opportunities 0.827Tour opportunities 0.781Socializing opportunities 0.628Medical opportunities 0.584Gastronomy 0.493Culture-history 0.472Originality of experience 0.446Factor 4: Augmented Product 14.3 .81Accessible information 0.783Accessible booking services 0.756Accessible transport 0.695Accessible public spaces 0.670
Funda ODUNCUOĞLU140
Accessible accommodation facilities
0.636
Accessible restaurants, cafes and bars
0.625
Accessible attractions, museums, cultural venues
0.574
Tour operators with accessible information and offerings
0.510
Well educated and trained staff in disability
0.496
Accessibility of the public restrooms
0.475
Accessible parking lot 0.463Appropriate signage of acces-sibility
0.451
Availability of disability aids 0.429Note: KMO Index =0.705; Bartlett’s test=7,33.326 (significance = 0.000).
Eigenvalues for each factor : Factor 1=7.938, Factor2=6.215, Factor 3 = 3.112 and Factor 4 =2.453, Factor Items shown in table are those with factor loadings
≥ .429.As shown in Table 1, four reasonably pure factors were extracted.
Overall, 31 out of 35 items (four of the items were rejected because of their low communalities in the first rotated solution to improve the fac-tor analysis.) for tourism product related behaviors loaded significantly (a factor loading of at least .429) on one of the four factors. These for factors explain 78% of the variance.
Factor 1 - Core Product: Factor 1 was defined as “Core Product”. It consists of five items. These items respectively are “peaceful/quiet atmo-sphere”, “weather condition”, “unpolluted environment”, “holiday resorts” and “affordable price”. These all five items generate “what the tourists are really buying” so this factor is named as “core” which is the main and also the first part of the tourist product level and all of them should exist in a tourism destination.
Factor 2- Facilitating Product: Factor 2 was defined as “Facilitating Product”. It consists of six items. These items respectively are “quality and diversity of the accommodation facilities”, “service quality”, ”security conditions”, “hospitality” and “ personal care services” and “reliable in-formation sources” Facilitating product is described as “goods or services that must be present for the guest to use the core product” so these items are gathered under it which is the most important supporter of the core product and the second level of the tourist product.
141Academic Studies in Social, Human and Administrative Sciences - II 141
Factor 3- Supporting Product: Factor 3 was defined as “Supporting Product”. It consists of seven items These items respectively are “shopping opportunities”, “tour opportunities”, “socializing opportunities”, “medical opportunities”, “gastronomy”, “culture-history” and “originality of expe-rience”. Supporting product is described as “Extra products offered to add value to the core product and help to differentiate it from the competition” so these items are gathered under the 3th tourism product level.
Factor 4- Augmented Product: Factor 4 was defined as “Augmented Product”. This product level is the most important part of the scale because of the items that it has. It consists of 13 items These items respectively are “accessible information”, “accessible booking services”, “accessible transport”, “accessible public spaces”, “accessible accommodation fa-cilities”, “accessible restaurants, cafes and bars”, “accessible attractions, museums, cultural venues”, “tour operators with accessible information and offerings”, availability of disability aids”, “accessibility of the public restrooms”, “accessible parking lot”, “ appropriate signage of accessibil-ity” and “well educated and trained staff in disability”. The augmented product includes accessibility, atmosphere, customer interaction with the service organization, customer participation, and customers’ interaction with each other. Depend on this definition, all accessible tourism products of the scale are gathered under this level.
3.2. Analysis
Analysis was done with the total number of respondents which was 507. The first part of the analysis began with the segmentation of the re-spondents by types of disability. Results were as follows: mobility, 60,1%; sensory,19,3%; communication,11,2%; mental, 4,1% and other (long-term health condition, asthma / allergy, special diet, travelling with baby / small child) 5,1%. Table 2 summarizes the results for the socio demographic traits across the five disability groups, that is, mobility, sensory, communi-cation, mental and other. Chi-square was employed to assess the likelihood of differences. Because of the small cell size, age, income, marital status, and employment status had to be collapsed into fewer categories.
The analysis by respondents’ socio-demographic profiles indicated there is a difference between disability types and the disabled people’s gen-der (χ2 = 56.78, p = .044), age (χ2 = 70.22, p = .00), annual income (χ2 = 62.16, p = .05), marital status (χ2 = 63.60, p= .00), employment status (χ2 = 81.48, p = .00) and severity of disability (χ2 = 64.38, p = .05). Analysis indicated that the most common type of disability is the mobility within the respondents’ socio-demographic profiles. It can be indicated from the anal-ysis results according to the five different disability types; the most of the respondents were woman. In terms of the aged of the respondents, “more
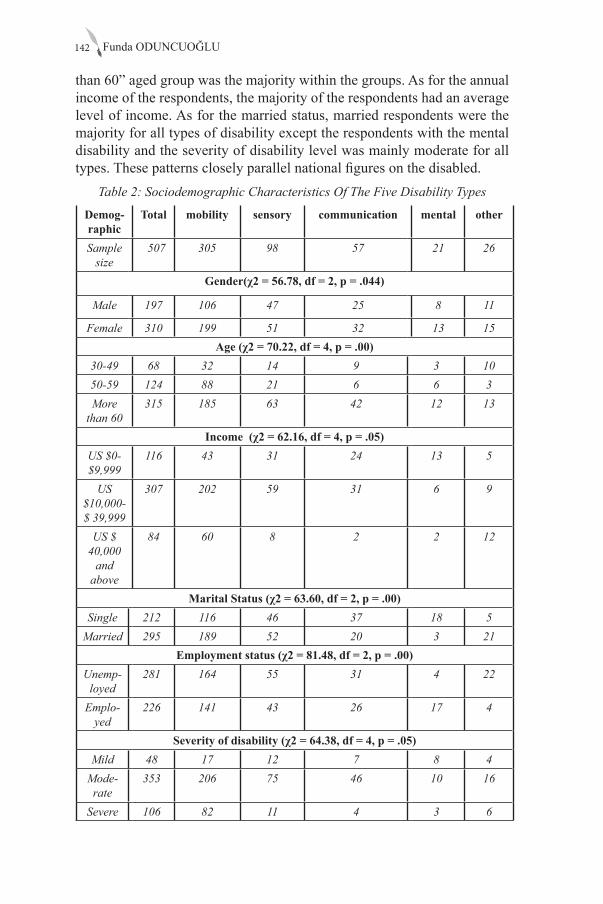
Funda ODUNCUOĞLU142
than 60” aged group was the majority within the groups. As for the annual income of the respondents, the majority of the respondents had an average level of income. As for the married status, married respondents were the majority for all types of disability except the respondents with the mental disability and the severity of disability level was mainly moderate for all types. These patterns closely parallel national figures on the disabled.
Table 2: Sociodemographic Characteristics Of The Five Disability Types
Demog-raphic
Total mobility sensory communication mental other
Sample size
507 305 98 57 21 26
Gender(χ2 = 56.78, df = 2, p = .044)
Male 197 106 47 25 8 11
Female 310 199 51 32 13 15Age (χ2 = 70.22, df = 4, p = .00)
30-49 68 32 14 9 3 1050-59 124 88 21 6 6 3More
than 60315 185 63 42 12 13
Income (χ2 = 62.16, df = 4, p = .05)US $0- $9,999
116 43 31 24 13 5
US $10,000- $ 39,999
307 202 59 31 6 9
US $ 40,000
and above
84 60 8 2 2 12
Marital Status (χ2 = 63.60, df = 2, p = .00)Single 212 116 46 37 18 5
Married 295 189 52 20 3 21Employment status (χ2 = 81.48, df = 2, p = .00)
Unemp-loyed
281 164 55 31 4 22
Emplo-yed
226 141 43 26 17 4
Severity of disability (χ2 = 64.38, df = 4, p = .05)Mild 48 17 12 7 8 4
Mode-rate
353 206 75 46 10 16
Severe 106 82 11 4 3 6
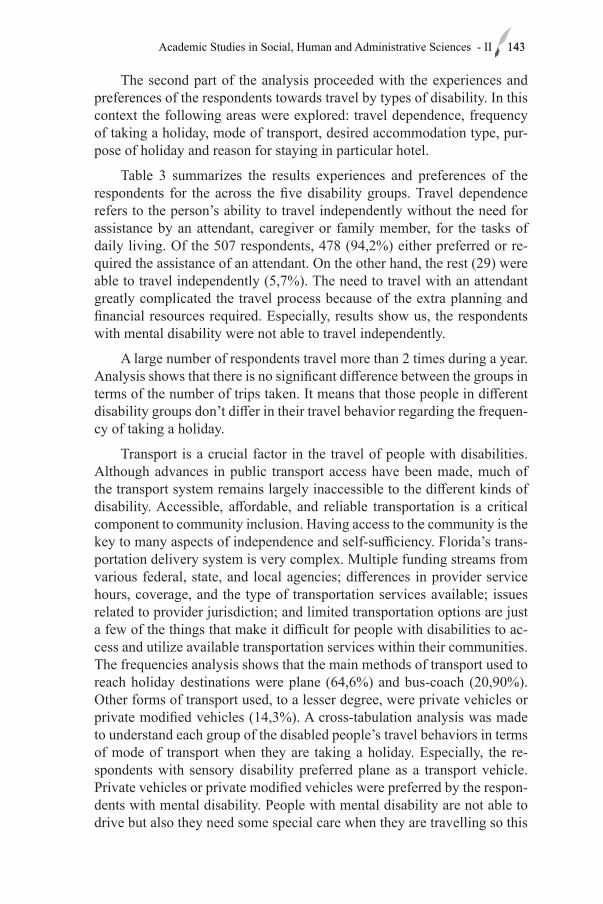
143Academic Studies in Social, Human and Administrative Sciences - II 143
The second part of the analysis proceeded with the experiences and preferences of the respondents towards travel by types of disability. In this context the following areas were explored: travel dependence, frequency of taking a holiday, mode of transport, desired accommodation type, pur-pose of holiday and reason for staying in particular hotel.
Table 3 summarizes the results experiences and preferences of the respondents for the across the five disability groups. Travel dependence refers to the person’s ability to travel independently without the need for assistance by an attendant, caregiver or family member, for the tasks of daily living. Of the 507 respondents, 478 (94,2%) either preferred or re-quired the assistance of an attendant. On the other hand, the rest (29) were able to travel independently (5,7%). The need to travel with an attendant greatly complicated the travel process because of the extra planning and financial resources required. Especially, results show us, the respondents with mental disability were not able to travel independently.
A large number of respondents travel more than 2 times during a year. Analysis shows that there is no significant difference between the groups in terms of the number of trips taken. It means that those people in different disability groups don’t differ in their travel behavior regarding the frequen-cy of taking a holiday.
Transport is a crucial factor in the travel of people with disabilities. Although advances in public transport access have been made, much of the transport system remains largely inaccessible to the different kinds of disability. Accessible, affordable, and reliable transportation is a critical component to community inclusion. Having access to the community is the key to many aspects of independence and self-sufficiency. Florida’s trans-portation delivery system is very complex. Multiple funding streams from various federal, state, and local agencies; differences in provider service hours, coverage, and the type of transportation services available; issues related to provider jurisdiction; and limited transportation options are just a few of the things that make it difficult for people with disabilities to ac-cess and utilize available transportation services within their communities. The frequencies analysis shows that the main methods of transport used to reach holiday destinations were plane (64,6%) and bus-coach (20,90%). Other forms of transport used, to a lesser degree, were private vehicles or private modified vehicles (14,3%). A cross-tabulation analysis was made to understand each group of the disabled people’s travel behaviors in terms of mode of transport when they are taking a holiday. Especially, the re-spondents with sensory disability preferred plane as a transport vehicle. Private vehicles or private modified vehicles were preferred by the respon-dents with mental disability. People with mental disability are not able to drive but also they need some special care when they are travelling so this
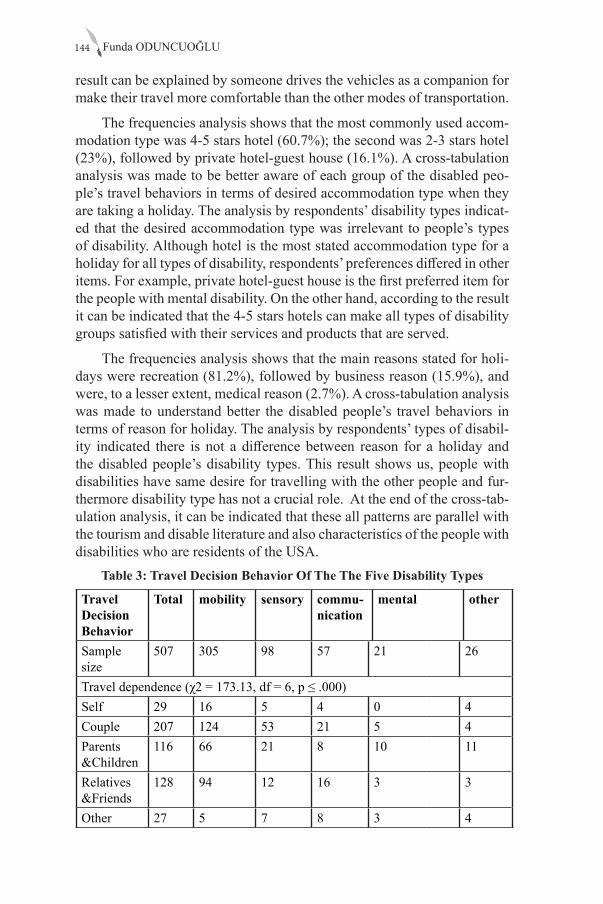
Funda ODUNCUOĞLU144
result can be explained by someone drives the vehicles as a companion for make their travel more comfortable than the other modes of transportation.
The frequencies analysis shows that the most commonly used accom-modation type was 4-5 stars hotel (60.7%); the second was 2-3 stars hotel (23%), followed by private hotel-guest house (16.1%). A cross-tabulation analysis was made to be better aware of each group of the disabled peo-ple’s travel behaviors in terms of desired accommodation type when they are taking a holiday. The analysis by respondents’ disability types indicat-ed that the desired accommodation type was irrelevant to people’s types of disability. Although hotel is the most stated accommodation type for a holiday for all types of disability, respondents’ preferences differed in other items. For example, private hotel-guest house is the first preferred item for the people with mental disability. On the other hand, according to the result it can be indicated that the 4-5 stars hotels can make all types of disability groups satisfied with their services and products that are served.
The frequencies analysis shows that the main reasons stated for holi-days were recreation (81.2%), followed by business reason (15.9%), and were, to a lesser extent, medical reason (2.7%). A cross-tabulation analysis was made to understand better the disabled people’s travel behaviors in terms of reason for holiday. The analysis by respondents’ types of disabil-ity indicated there is not a difference between reason for a holiday and the disabled people’s disability types. This result shows us, people with disabilities have same desire for travelling with the other people and fur-thermore disability type has not a crucial role. At the end of the cross-tab-ulation analysis, it can be indicated that these all patterns are parallel with the tourism and disable literature and also characteristics of the people with disabilities who are residents of the USA.
Table 3: Travel Decision Behavior Of The The Five Disability Types
Travel Decision Behavior
Total mobility sensory commu-nication
mental other
Sample size
507 305 98 57 21 26
Travel dependence (χ2 = 173.13, df = 6, p ≤ .000)Self 29 16 5 4 0 4Couple 207 124 53 21 5 4Parents &Children
116 66 21 8 10 11
Relatives &Friends
128 94 12 16 3 3
Other 27 5 7 8 3 4
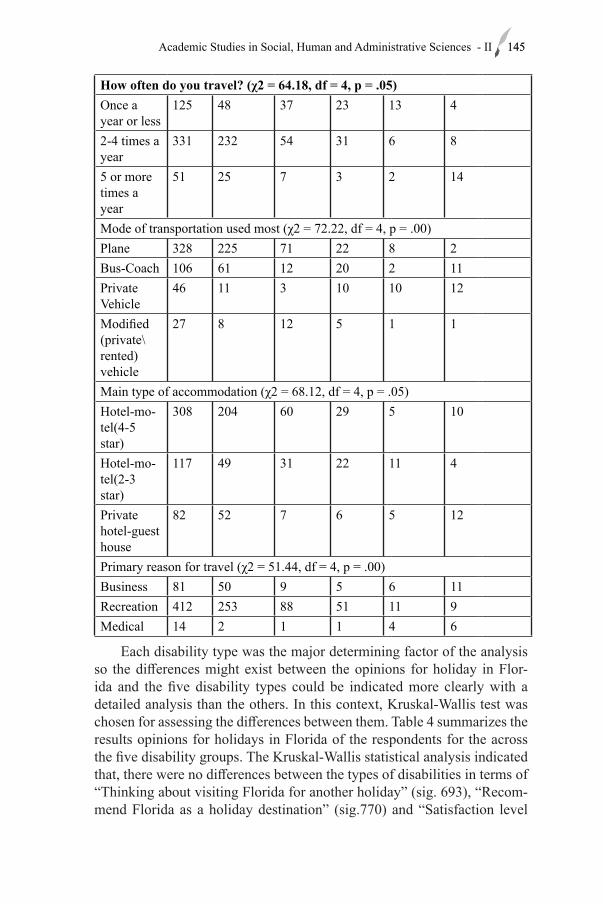
145Academic Studies in Social, Human and Administrative Sciences - II 145
How often do you travel? (χ2 = 64.18, df = 4, p = .05)Once a year or less
125 48 37 23 13 4
2-4 times a year
331 232 54 31 6 8
5 or more times a year
51 25 7 3 2 14
Mode of transportation used most (χ2 = 72.22, df = 4, p = .00)Plane 328 225 71 22 8 2Bus-Coach 106 61 12 20 2 11Private Vehicle
46 11 3 10 10 12
Modified (private\rented) vehicle
27 8 12 5 1 1
Main type of accommodation (χ2 = 68.12, df = 4, p = .05)Hotel-mo-tel(4-5 star)
308 204 60 29 5 10
Hotel-mo-tel(2-3 star)
117 49 31 22 11 4
Private hotel-guest house
82 52 7 6 5 12
Primary reason for travel (χ2 = 51.44, df = 4, p = .00)Business 81 50 9 5 6 11Recreation 412 253 88 51 11 9Medical 14 2 1 1 4 6
Each disability type was the major determining factor of the analysis so the differences might exist between the opinions for holiday in Flor-ida and the five disability types could be indicated more clearly with a detailed analysis than the others. In this context, Kruskal-Wallis test was chosen for assessing the differences between them. Table 4 summarizes the results opinions for holidays in Florida of the respondents for the across the five disability groups. The Kruskal-Wallis statistical analysis indicated that, there were no differences between the types of disabilities in terms of “Thinking about visiting Florida for another holiday” (sig. 693), “Recom-mend Florida as a holiday destination” (sig.770) and “Satisfaction level
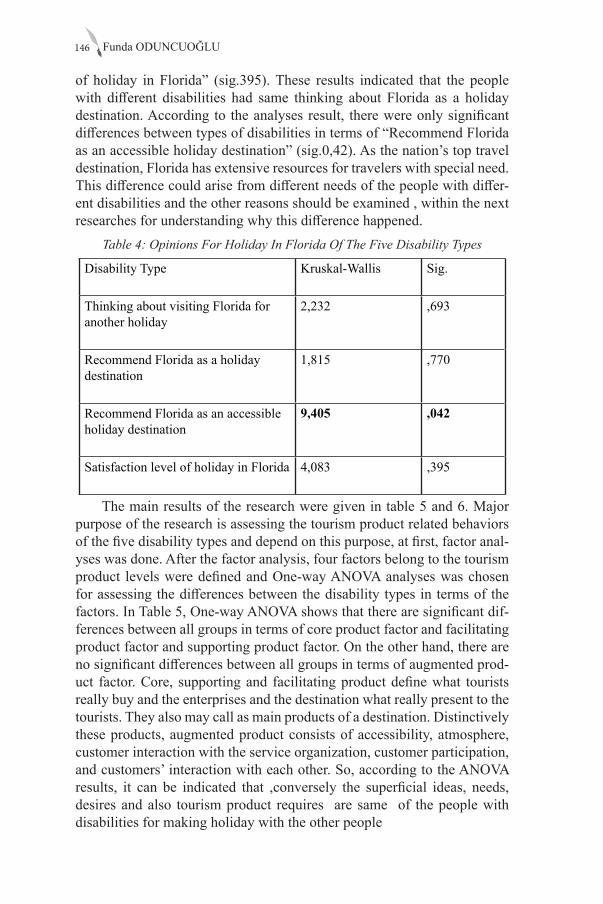
Funda ODUNCUOĞLU146
of holiday in Florida” (sig.395). These results indicated that the people with different disabilities had same thinking about Florida as a holiday destination. According to the analyses result, there were only significant differences between types of disabilities in terms of “Recommend Florida as an accessible holiday destination” (sig.0,42). As the nation’s top travel destination, Florida has extensive resources for travelers with special need. This difference could arise from different needs of the people with differ-ent disabilities and the other reasons should be examined , within the next researches for understanding why this difference happened.
Table 4: Opinions For Holiday In Florida Of The Five Disability Types
Disability Type Kruskal-Wallis Sig.
Thinking about visiting Florida for another holiday
2,232 ,693
Recommend Florida as a holiday destination
1,815 ,770
Recommend Florida as an accessible holiday destination
9,405 ,042
Satisfaction level of holiday in Florida 4,083 ,395
The main results of the research were given in table 5 and 6. Major purpose of the research is assessing the tourism product related behaviors of the five disability types and depend on this purpose, at first, factor anal-yses was done. After the factor analysis, four factors belong to the tourism product levels were defined and One-way ANOVA analyses was chosen for assessing the differences between the disability types in terms of the factors. In Table 5, One-way ANOVA shows that there are significant dif-ferences between all groups in terms of core product factor and facilitating product factor and supporting product factor. On the other hand, there are no significant differences between all groups in terms of augmented prod-uct factor. Core, supporting and facilitating product define what tourists really buy and the enterprises and the destination what really present to the tourists. They also may call as main products of a destination. Distinctively these products, augmented product consists of accessibility, atmosphere, customer interaction with the service organization, customer participation, and customers’ interaction with each other. So, according to the ANOVA results, it can be indicated that ,conversely the superficial ideas, needs, desires and also tourism product requires are same of the people with disabilities for making holiday with the other people
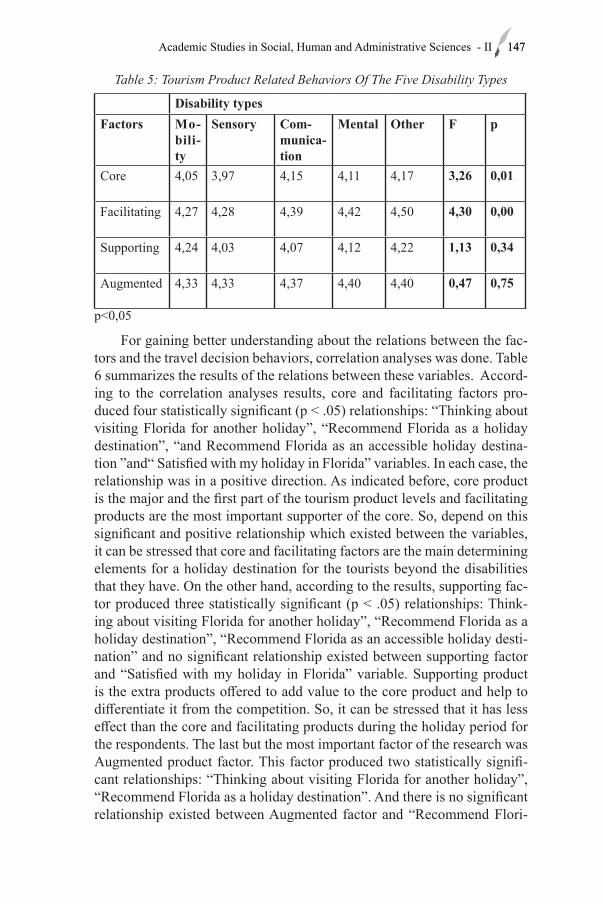
147Academic Studies in Social, Human and Administrative Sciences - II 147
Table 5: Tourism Product Related Behaviors Of The Five Disability Types
Disability typesFactors Mo-
bili-ty
Sensory Com-munica-tion
Mental Other F p
Core 4,05 3,97 4,15 4,11 4,17 3,26 0,01
Facilitating 4,27 4,28 4,39 4,42 4,50 4,30 0,00
Supporting 4,24 4,03 4,07 4,12 4,22 1,13 0,34
Augmented 4,33 4,33 4,37 4,40 4,40 0,47 0,75
p<0,05
For gaining better understanding about the relations between the fac-tors and the travel decision behaviors, correlation analyses was done. Table 6 summarizes the results of the relations between these variables. Accord-ing to the correlation analyses results, core and facilitating factors pro-duced four statistically significant (p < .05) relationships: “Thinking about visiting Florida for another holiday”, “Recommend Florida as a holiday destination”, “and Recommend Florida as an accessible holiday destina-tion ”and“ Satisfied with my holiday in Florida” variables. In each case, the relationship was in a positive direction. As indicated before, core product is the major and the first part of the tourism product levels and facilitating products are the most important supporter of the core. So, depend on this significant and positive relationship which existed between the variables, it can be stressed that core and facilitating factors are the main determining elements for a holiday destination for the tourists beyond the disabilities that they have. On the other hand, according to the results, supporting fac-tor produced three statistically significant (p < .05) relationships: Think-ing about visiting Florida for another holiday”, “Recommend Florida as a holiday destination”, “Recommend Florida as an accessible holiday desti-nation” and no significant relationship existed between supporting factor and “Satisfied with my holiday in Florida” variable. Supporting product is the extra products offered to add value to the core product and help to differentiate it from the competition. So, it can be stressed that it has less effect than the core and facilitating products during the holiday period for the respondents. The last but the most important factor of the research was Augmented product factor. This factor produced two statistically signifi-cant relationships: “Thinking about visiting Florida for another holiday”, “Recommend Florida as a holiday destination”. And there is no significant relationship existed between Augmented factor and “Recommend Flori-
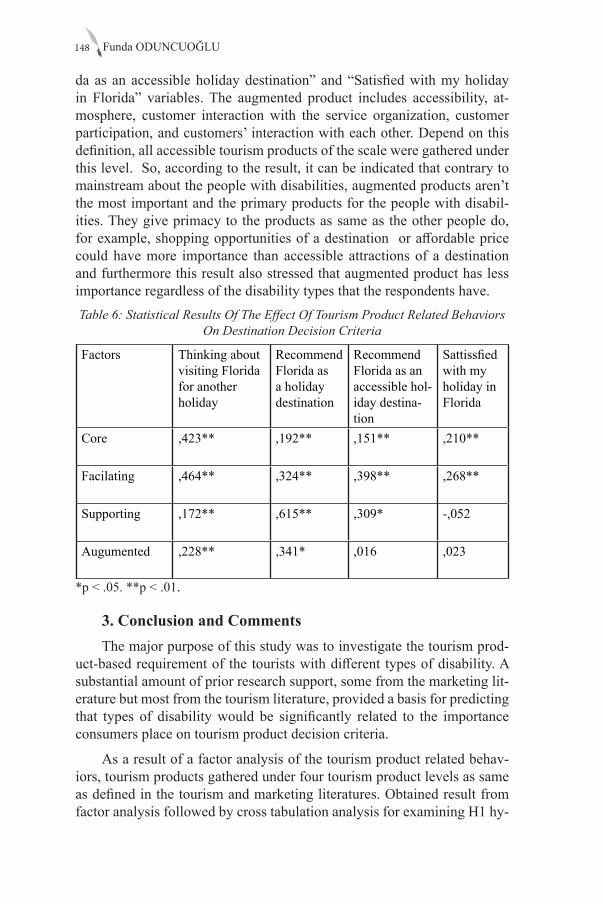
Funda ODUNCUOĞLU148
da as an accessible holiday destination” and “Satisfied with my holiday in Florida” variables. The augmented product includes accessibility, at-mosphere, customer interaction with the service organization, customer participation, and customers’ interaction with each other. Depend on this definition, all accessible tourism products of the scale were gathered under this level. So, according to the result, it can be indicated that contrary to mainstream about the people with disabilities, augmented products aren’t the most important and the primary products for the people with disabil-ities. They give primacy to the products as same as the other people do, for example, shopping opportunities of a destination or affordable price could have more importance than accessible attractions of a destination and furthermore this result also stressed that augmented product has less importance regardless of the disability types that the respondents have. Table 6: Statistical Results Of The Effect Of Tourism Product Related Behaviors
On Destination Decision Criteria
Factors Thinking about visiting Florida for another holiday
Recommend Florida as a holiday destination
Recommend Florida as an accessible hol-iday destina-tion
Sattissfied with my holiday in Florida
Core ,423** ,192** ,151** ,210**
Facilating ,464** ,324** ,398** ,268**
Supporting ,172** ,615** ,309* -,052
Augumented ,228** ,341* ,016 ,023
*p < .05. **p < .01.
3. Conclusion and Comments The major purpose of this study was to investigate the tourism prod-
uct-based requirement of the tourists with different types of disability. A substantial amount of prior research support, some from the marketing lit-erature but most from the tourism literature, provided a basis for predicting that types of disability would be significantly related to the importance consumers place on tourism product decision criteria.
As a result of a factor analysis of the tourism product related behav-iors, tourism products gathered under four tourism product levels as same as defined in the tourism and marketing literatures. Obtained result from factor analysis followed by cross tabulation analysis for examining H1 hy-
149Academic Studies in Social, Human and Administrative Sciences - II 149
pothesis. As a developed hypothesis “There is a statistically significant difference between demographic variables in terms of the types of dis-ability” was tried to examine. Obtained result from the analysis revealed that there is not a statistically significant difference between demographic variables in terms of the types. This result could derive from the scarcity of the adequate responses for each type of disability. It could be indicated that is the most important limitation of the research. If we had could reach the sufficient numbers for each type of disability, the result could be different than now. Especially, people with communication and mental disabilities were not enough to compare to people with mobility disability. So it can be suggested that the future research can enrich both variety and also numbers of the responses.
For examining the H2 hypothesis to be proceeded another cross tab-ulation analysis. The second part of the analysis proceeded with the ex-periences and preferences of the respondents towards travel by types of disability. According to the results; the majority of the responses either prefer or require the assistance of an attendant, they travel more than 2 times during a year, the main methods of transport used to reach holiday destinations were plane, the most commonly used accommodation type was 4-5 stars hotel and the main reasons stated for holidays were recre-ation. Obtained result showed us that the people with disabilities have same desire for travelling without take into account their disability types and furthermore disability type has not a crucial role for travelling.
H3 hypothesis was examined by Kruskal-Wallis Test. The third re-search question was “there was a statistically significant difference between opinions for the holiday in Florida in terms of the types of disability”. Ac-cording to the Kruskal-Wallis test result, only one difference between types of disabilities in terms of “Recommend Florida as an accessible holiday destination” was stated. This difference could derive from different needs of the people with different disabilities and the other reasons should be examined within the next researches for understanding why this difference happened. Especially this result gives the tourism enterprises a new vision for using the new facilities and marketing strategies for helping to reach this crucial market segment and it shows us the variety of disabilities have an important role in this segment.
For examining the H4 hypothesis, one-way ANOVA analyses was chosen for assessing the differences between the disability types in terms of the factors. According to the ANOVA test result, there are significant differences between all groups in terms of core product factor and facilitat-ing product factor and supporting product factor. On the other hand, there are no significant differences between all groups in terms of augmented product factor. . A significant result was gained by this analysis for explain-
Funda ODUNCUOĞLU150
ing the main purpose of the research. it can be indicated that , besides the superficial ideas, needs, desires and also tourism product requires of the people with disabilities are as same as the others have.
For analyzing the last hypothesis of the research, correlation analy-ses were chosen for examining the relations between the factors and the travel decision behaviors. H5 hypothesis was asked for understanding the positive relationship which may exist between tourism product levels and opinions for the holiday in Florida. According to the result, it can be indi-cated that contrary to mainstream about the people with disabilities, aug-mented products are not the most important and the primary products for the people with disabilities. They give primacy to the products as same as the other people do, for example, shopping opportunities of a destina-tion or affordable price could have more importance than the accessible attractions of a destination and furthermore this result also stressed that augmented product has less importance regardless of the disability types that the respondents have.
Nonetheless, the results do provide some tentative conclusions about the people with different disabilities and their attitudes and behaviors re-lated to tourism product. These results point to possible implications re-garding the development of tourist strategies for the studied group. The findings suggest that the disabled market can be divided into five segments based on types of disability .Those in the communication and the mental categories appear to have different tourism product-related behavior than those in the mobility disability group.
The results have the following implications for those engaged in the management of tourism product-related institutions and activities:
1. The disabled market may be a profitable segment for the trav-el industry to target, if properly positioned. These consumers, while not wealthy, have adequate resources to travel several times per year, especial-ly for the purpose of recreation.
2. There are five sub-segments that deserve special attention. Beside that the mobility disability is the most important sub-segment among the all other sub segments. However all segments are seeking a quiet and peaceful destination that allows them to be independent and that provides easy access, the results show us the tourism products which are classified under the core product level are the most important holiday requirement for the all sub segments. So, depend on this result, primarily tourism en-terprises should focus on the core product level for improving this niche market segment.
3. Destination locations, including hotels and motels should market
151Academic Studies in Social, Human and Administrative Sciences - II 151
to the people with disabilities . Consumers in this market are very loyal to destination institutions that are sensitive to their needs while not being pa-tronizing. This includes not only compliance to ADA, for example, ramps and disability-friendly rooms, but also training employees to serve the dis-abled and anticipating the needs of those attending the disabled. Clearly, the disabled would travel a great deal more often if they could find more disability- friendly destinations.
4. Pricing decisions are important to the all sub segments. Knowing that the majority of the disabled are economy minded should assist mar-keters in developing a price for the experience. This segment’s need for economy should not be confused with the notion that lower-quality ser-vices are acceptable.
REFERENCES
AITCHİSON, C. (2009). “ Exclusive Discourses: Leisure Studies and Disability”, Leisure Studies, 28 (4), 375–386.
BI, Y., CARD, J. A., Cole, S. T. (2007). “Accessibility and Attitudinal Barriers Encountered by Chinese Travellers with Physical Disabilities”. International Journal of Tourism Resesearch, 9, 205–216
BİZJAK, J., LEMMON, M., NGUYEN, T., Journal of Fınancıal Economıcs, June 2011 Vol.100(3) 538-555
BUHALIS, D., EICHHORN,V., MICHOPOULOU, E., MILLER, G. (2005). “OSSATE Accessibility Market and Stakeholder Analysis”, 1-88 [http://www.accessibletourism.org/resources/ossate_market_analysis_public_final.pdf]
BURNETT, J. J., BAKER, H. B. (2001). “Assessing the Travel-Related Behaviors of the Mobility-Disabled Consumer, Journal of Travel Research”, 40(1), 4–11.
DANIELS, M. J., RODGERS, E. B. D., WIGGINS, B. P. (2005). ‘‘Travel tales’’: an Interpretive Analysis of Constraints and Negotiations to Pleasure Travel as Experienced by Persons with Physical Disabilities”, Tourism Management, 26(6), 919–930.
DARCY, S. (2010). “Inherent Complexity: Disability, Accessible Tourism and Accommodation Information Preferences”, Tourism Management, 31(6), 816–826.
DARCY, S., CAMERON, B., PEGG, S. (2010). “Accessible Tourism and Sustainability: A Discussion and Case Study”. Journal of Sustainable Tourism, 18(4), 515–537.
DARCY, S., TAYLOR, T. (2009). “Disability Citizenship: An Australian Human Rights Analysis of the Cultural Industries”. Leisure Studies, 28(4), 419–442.
Funda ODUNCUOĞLU152
DARUWALLA, P., DARCY, S. (2005). “Personal and Societal Attitudes to Disability”. Annals of Tourism Research, 32, 549–570.
DRIEDGER, D. (1987). “Disabled People and International Air Travel”. Journal of Leisurability, 14, 13–21.
ENAT-European Network for Accessible Tourism (2012). The Underestimated Market Potential of Barrier-free Tourism, World Travel Monitor Forum, Pisa. [http://www.accessibletourism.org/resources/enat-the-underestimated-market.pdf]
European Commission (2010) European disability strategy 2010–2020: A renewed commitment to a barrier-free Europe, no. 636 [http://eur-lex.europa.eu/legalcontent/EN/TXT/?uri=URISERV%3Aem0047]
FIGUEIREDO, E., EUSEBIO, C., KASTENHOLZ, E. (2012). “How Diverse are Tourists with Disabilities? A Pilot Study on Accessible Leisure Tourism Experiences in Portugal” Int. J. Tourism Res. 14, 531–550.
GRADY, J., OHLIN, J.B. (2009). “Equal Access to Hospitality Services for Guests with Mobility Impairments under the Americans with Disabilities Act: Implications for the Hospitality Industry”, International Journal of Hospitality Management, 28, 161-169
GRAY, B.J., MATEAR, S., MATHESON, P.K. (2002).” Improving Service Firm Performance”. Journal of Services Marketing, 16 (3), 186–200.
HAUKELAND, J.V. (1990). “ On-travelers: The Flıp Sıde of Motıvatıon”. Annals of Tourısm Research, 17(2), 172-184.
HUH, C., SINGH, A.J. (2007). “Families Travellıng wıth a Dısabled Member: Analysıng the Potentıal of an Emergıng Nıche Market Segment”, Tourısm and Hospıtalıty, 7(3-4), 212-229.
ISRAELI, A. A. (2002). “A preliminary Investigation of the Importance of Site Accessibility Factors for
Disabled Tourists”, Journal of Travel Research, 41(1), 101–104.ITB World Travel Trends Report (2012), ITB Berlin & IPK International
[www.itb-berlin.de/.../itb]KAUFMAN, S. C. (1998).” Retailers’ Perceptıons of the Time Concept:
Contributıons from a Sociological Perspective”, Advances in Consumer Research, 17, 895-901.
LACH, J. (1999). “Disability ≠ Liability.” American Demographics, 2 (June): 21-22.
LEE, B. K., AGARWAI, S., KIM, H. J. (2012). “Influences of Travel Constraints on the People with Disabilities Intention to Travel: an Application of Seligman’s Helplessness Theory”. Tourism Management, 33, 569-579.
MCKERCHER, B., PACKER, T., YAU, M. ve LAM, P. (2003). “Travel Agents: Facilitators or Inhibitors of Travel for People with Disabilities?”, Tourism Management, 24(4), 65–74.
153Academic Studies in Social, Human and Administrative Sciences - II 153
MULOIN, S.(1992). “Wilderness Access for Persons with a Disability”, Ecotourism, Australian Bureau of Research.Cilt sayı sayfa lazım
MURRAY, M., SPROATS, J. (1990). “The Disabled Traveller: Tourism and Disability in Australia”. Journal of Tourism Studies, 1(1), 9-14.
PAGA’N, R. (2012).”Time Allocation In Tourism for People with Disabilities”, Annals of Tourism Research 39 (3),1514–1537.
PORIA, Y., REICHEL, B. Y. (2011). “Dimensions of Hotel Experience of People with Disabilities: An Exploratory Study”, International Journal of Contemporary Hospitality Management, 23(5), 571-591.
RAY, N. M., RYDER, M. E. (2003). “Ebilities Tourism: An Exploratory Discussion of the Travel Needs and Motivations of the Mobility-Disabled”. Tourism Management, 24, 57–72.
RICE, P. ( 2006). “Universal Management: a Proposal to Change the Direction of Accessibility Management in the Australian Tourism Industry to Create Benefits for all Australians and Visitors to Australia”. The Review of Disability Studies: An International Journal, 2 (2), 64–79.
RICHARDS, V., PRICHARD, A., MORGAN N. (2010). “(Re) envisioning Tourism and Visual Impairment”. Annals of Tourism Research 37(4), 1097–1116.
SHAW, G., COLES, T. (2004). “Disability, Holiday Making and the Tourism Industry in the UK: A Preliminary Survey”, Tourism Management, 25, 397–403.
TANTAWY, A., KIM, W. G., SUNGSOO, P. (2004).” Evaluation of Hotels to Accommodate Disabled Visitors”, Journal of Quality Assurance in Hospitality&Tourism, 5(1), 91–101.
TRIBE, J. (2009). “Philosophical Issues in Tourism”, Philosophical Issues in Tourism Bristol: Channel View, 3-22.
TURCO, D. M., STUMBO, N., GARNCARZ, J. (1998). “Tourism Constraints – People with Disabilities”, Parks and Recreation Journal, 33(9), 78–84.
UNESCAP 2000, Conditions to Promote Barrier-free Tourism for People with Disabilities and Older Persons. Economic and Social Commission for Asia and the Pacific (ESCAP). Presentation at the National Workshop on Sustainable Tourism Development in China, Tianjin, China.
United Nations, (2006) http:www.un.org. conventıon_accessıble_pdfUYSAL, M., CHEN, J., WILLIAMS, D. (2000). “Increasing State Market
Share Through a Regional Positioning”, Tourism Management, 21, 89–96.
VAR, T., YEŞİLTAŞ, M., YAYLI, A., ÖZTÜRK, Y. (2011). “A Study on the Travel Patterns of Physically Disabled People “, Asia Pacific Journal of Tourism Research, 16(6), 599-618.
Funda ODUNCUOĞLU154
VIGNUDA, J. (2001). “Promotion of Barrier-Free Tourism for People with Disabilities in the Asian and Pacific Region”, Economic and Social Commission for Asia and the Pacific (ESCAP). Seminar on Sustainable Development of Ecotourism in Pacific Island Countries, Kasim, 17–18, 2001 Suva, Fiji
World Report on Disability, (2011). World Health Organisation & World Bank [ http://www.who.int/disabilities/world_report/2011/report.pdf.
World Tourism Organization (WTO) (2001). Tourism 2020 Vision. Europe. Vol. 4. ISBN: 978 9284403806,
YAU, M., MCKERCHER, B., PACKER, T. (2004). “Traveling With a Disability. More Than an Access Issue”. Annals of Tourism Research, 31(4), 946–960.
YAĞCI, K., AKÇAY, S., EFENDİ, M., ÖZTÜRK, M., H. (2020). Information Security Awareness in Tourism Enterprises: Case of Turkish Manager Opinions, AKBABA, A. and ALTINTAŞ, V., Industrial and Managerial Solutions for Tourism Enterprises (p. 251-267), Hershey PA: IGI Global.

Chapter 9IN-SERVICE TRAINING IN HEALTH
ORGANIZATIONS
Gülay TAMER1
1 Dr.öğretı̇m Üyesı̇, İstanbul Gelı̇şı̇m Ünı̇versitesi, [email protected]

157Academic Studies in Social, Human and Administrative Sciences - II 157
INTRODUCTIONWhile the world is developing rapidly, information and ways of ac-
cess to information change rapidly both qualitatively and quantitatively. Training is a process teaching the behavioral changes necessary for people to utilize their potential in harmony with their interests and abilities at the highest level throughout their lives, and to adapt to the physical and social environment that they live.
From the moment of birth, training of a person starts with planned or unplanned activities within the family, society and school in order to exist first and then to learn social behaviors. With entering the working life, a person continues his/her training by participating in individual and insti-tutional trainings in order to improve personally, to learn the functioning of the institution that he/she works for and the requirements of his/her job (Hacıoğlu, 2019).
Training comes first among the issues in organizations that managers and entrepreneurs attach importance. The importance given to training is increasing day by day in the business environment especially for ensuring the sustainability of competing institutions, increase their success and keep up with the continuous changes (Akgül, 2008). The nature of jobs per-formed in the fields of activity of the organizations is related to the training of employees. Due to effect of conditions within the organization and ex-ternal environment, it is seen that training issue ranks first among business functions gaining importance ever-increasingly in our country. Training of employees constitutes a very important factor for an organization to man-age changes both in the internal and external environment (Bayar, 2009).
1. IN-SERVICE TRAINING CONCEPTIn-service training comprises all trainings that enable individuals and
communities to perform duties that they have undertaken or will under-take in their institutions more effectively, efficiently and successfully; will enhance their professional knowledge levels; will provide positive devel-opment in their knowledge, habits and understanding, perspective, deci-sion-making skills and attitudes, and thus provide total improvement in the individual’s cognitive, affective and behavioral skills (Şenviren, 2014).
All activities designed by businesses to minimize errors and accidents; maximizing profitability, customer satisfaction and savings; achieve effi-cient, high quality production and service; and planned to directly affect the knowledge, skills and behavioral patterns of employees can be evaluat-ed within the scope of in-service training (Aytaç, 2000).
The necessity of in-service training arises when individuals, who have started working life by completing a certain program in educational insti-
Gülay TAMER158
tutions, do not gain enough knowledge, attitudes and skills determined by the institution, and when it is required to train upper-level employees or to adapt to the innovations needed in the production process. In-service training enables an individual to increase his/her potential related to work and for new achievements in order to perform the requirements of the job or profession more efficiently and to follow innovations, from the moment he/she started job until end of the job (Bayar, 2009).
It is important for employees to follow and learn about developments related to their job or profession. This is achieved by continuing educa-tion programs covering in-service training (Hacıoğlu, 2019). By in-service training, the deficiencies in the performance of staff working in institu-tions can be defeated and employees can be equipped with the expected job skills (Schuler, Huber, 1990; Pehlivan, 1993). The aim of in-service training is not only to enhance the general culture of an employee, but also equip him/her as expected by the enterprise (Gül, 2000).
In-service training is a process that starts when employees join the institution and continue until the time that they retire or leave by resigning. It is possible to ensure a high quality in-service training in this long pro-cess by implementing various strategies, methods and techniques through a systematic plan and program (Tan, Koç, 2014).
Setting goals is a mandatory starting point for planned activities. It is difficult to decide on the scope, functioning and evaluation processes of in-service training without clarifying the objectives to be achieved, and the reliability of outcomes will be low.
1. 1. Advantages of In-Service Training
In-service trainings directly contribute to institutional and individual productivity. For achieving the expected productivity by in-service train-ings, it is necessary to evaluate the factors decreasing the productivity in the institution impartially (Hacıalioğlu, 2019). The ways for using in-ser-vice training to eliminate situations that decrease productivity should be organized in a planned and programmed way (Özpulat, 2006). Planning and sustainability of this planning will contribute to gaining various ben-efits for the organization and employees (Baykal and Türkmen, 2018). In-service training contributes to productivity in two ways, with advantag-es for the individual and the organization.
1.1.1. Individual Advantages
The vast majority of in-service trainings organized in institutions aim to provide to an individual the knowledge, skills and attitudes related to the work responsibility. In this respect, in-service training has the nature of
159Academic Studies in Social, Human and Administrative Sciences - II 159
vocational training (Öztürk and Sancak, 2007).
Individual advantages of the in-service training are as follows (Pe-hlivan, 1993; Howard, 1998; Zahoor, Muhammad, Mohammad, 2018; Hacıalioğlu, 2019);
• Ensures development of professional decision making, effective problem solving and creative thinking skills,
• Continuous improvement and progress lead the employees to adopt the idea of taking responsibility for success,
• Increases motivation and productivity by improving self-confi-dence,
• Increases ability of employees to cope with tension, conflict and stress,
• Increases awareness and job satisfaction by enabling the employee to work by knowingly and correctly.
• Supports employees to develop a positive attitude towards them-selves by increasing the communication and social interaction skills,
• Ensures employee satisfaction and provides both individual satis-faction and institutional loyalty.
• Provides an environment for determining a career path and contin-uous development and prepares the individual for a upper level job,
• Improves the ability to adapt to change,
• Ensures institutional adaptation of newly recruited staff.
1.1.2. İnstitutional Advantages
In-service trainings seem to be a cost item for the employer in the short term, while the benefits to be obtained as a result of training will be more determinative for the institutions in the medium and long term.
İnstitutional advantages of the in-service training are as follows (Clardy, 2005; Baykal and Türkmen, 2018; Hacıalioğlu, 2019);
• Facilitates the institution to adapt to innovations and changes,
• Ensures that the tasks are planned and implemented in a shorter time,
• Reduces errors and consequent costs,
• Helps to increase the institutional reputation and ensures a good image of the institution,
Gülay TAMER160
• Saves time and energy by reducing the control burden,
• Helps to resolve conflicts by reducing stress and tension,
• Supports institutional development by ensuring better service and high quality products,
• By increasing job satisfaction of the employee, decreases employ-ee turnover rates,
• Ensures understanding and obeying to institutional policy,
• Improves the superior - subordinate relationship in the institution,
• Increases employee satisfaction and ensures institutional develop-ment by building trust within the organization,
• Prevents loss of time, increases productivity,
• Helps the corporation gain competitive edge by ensuring under-standing and obeying to institutional policy.
1. 2. Objectives of In-Service Training
Since it will be difficult to try to meet requirements of the rapidly changing society and professions by the education received in schools, it becomes a necessity to train employees by in-service training. Institutions should provide in-service training for their employees, give them the op-portunity to learn and succeed, enhance their work experience, review the efficiency of the training provided and encourage the employee through trainings (Hacıalioğlu, 2019). It is important to organize these trainings by using internal resources with low costs in terms of allowing employees to develop their professional competencies quickly and economically in line with the needs of the time being.
In-service trainings should cover all staff working in the institution. Trainings should be planned and implemented in accordance with and to cover from the lowest level employees to the highest level employees. In-stitutional interests should not be observed (Şenviren, 2014; Hacıalioğlu, 2019). Ensuring the continuity in in-service training is critical. Planning of the training programs should be made in accordance with the needs and democratic participation of the staff. The staff will be more enthusiastic about the training programs which are determined and prepared with their own contribution (Selimoğlu and Yılmaz, 2009). The training to be orga-nized should comply with socio-demographic characteristics of the staff, their vocational education and the requirements of the job they perform. Otherwise, it may cause the staff to feel inadequate and this will decrease their motivation and productivity. An encouraging training environment should be prepared for in-service trainings. The environment should be
161Academic Studies in Social, Human and Administrative Sciences - II 161
arranged so as to attract and not to distract the attention of the staff.
It is possible to list objectives of in-service training as follows: (Seli-moğlu and Yılmaz, 2009; Şenviren, 2014; Hacıalioğlu, 2019);
• To ensure the institutional adaptation of the newly recruited staff and to support their professional commitment,
• To increase the motivation of the employee, to adopt the institu-tional culture,
• To gain and develop the professional skills required by the job,
• To provide employees with the necessary competencies to adopt the goals, objectives and policies of the institution,
• While enhancing the professional skills required by the job, deter-mining and perfecting deficiencies of the training,
• To bring the staff working in and outside the institution together in order to meet and communicate effectively,
• To prepare employees in line with their capacities and abilities for jobs requiring higher responsibility,
• To plan supplementary trainings to allow employees to take charge in different units,
• To ensure adaptation of the employee to the changing and devel-oping science, technology, economy and business life,
• To increase the productivity of the service provided by the institu-tion,
• To reduce errors in service delivery,
• To prevent occupational accidents and increase employee safety,
• To provide awareness for time management for ensuring working of employees without need for overtime,
• To develop competencies of the staff for multitasking definitions.
1.3. Limitations of In-Service Training
Individual and institutional benefits are expected via in-service train-ing programs planned and implemented to increase the efficiency of labor force that is an important piece of service delivery. It is possible to express the limitations that prevent achievement of the objectives of in-service training as follows: (Taymaz, 1992; Bayar, 2019);
• Preparation of a program in which needs and goals cannot be de-termined,
Gülay TAMER162
• Lack of the balance between goals and needs of the individual and the institution,
• A training program which is not convenient to basic knowledge and skill level of the employee,
• Reluctant employee who does not believe in the training program,
• In planning of the training program, choosing non proper environ-ment, date, location, duration and method,
• Insufficiency of the staff, who can provide training, in the train-ings,
• In-service training content which is not covering the entire em-ployees, and which is planned for a single area or level,
• Wrong institutional policies,
• Not working in positions suitable for competencies of the employ-ee,
• Not evaluating results of the training programs, not determining the problems that may arise in advance and not producing solutions.
1.4. Types of In-Service Training
In-service trainings can be listed according to the purpose as given below:
1. Orientation Trainings
2. Basic Training
3. Development Trainings
4. Supplementary Trainings
5. Trainings for Specific Fields
6. Promotion Trainings
1.4.1. Orientation Trainings
These are the trainings for a newly recruited employee to know the in-stitutional goals and policies, job descriptions, powers, rights and respon-sibilities (Hacıalioğlu, 2019). Implementation of orientation training will shorten the adaptation process of an employee to the institution and the job, and thereby it contributes to increase of the productivity. If the orien-tation training is planned and implemented as it should be, adaptation of the employee with to the job and institution will be ensured (Tiyek, 2014). Introducing to the newly-started employee the institution, the job and the
163Academic Studies in Social, Human and Administrative Sciences - II 163
colleagues within a program to be determined, teaching the job that he/she will be responsible for and having him/her to get accustomed to the job will be an important beginning and training activity (Bayar, 2019). If the contributions expected from orientation trainings are summarized briefly (Sabuncuoğlu, 2005);
• To give basic information about the institution to the newly re-cruited employee; to enlighten employees on matters such as the institu-tional policies, organizational structure, production areas and processes, social rights and responsibilities,
• To enable the employee to perform the best in his/her job or show his/her talent by making an adjustment between his/her job and competen-cies,
• To ensure social cohesion by preventing institutional and work alienation of the individual.
1.4.2. Basic Training
This is the training for equipping the newly recruited personnel in the institutions with basic professional skills, attitudes and knowledge related to requirements of the job to be performed. The basic training can be giv-en either in the workplace of the employee and in the department he/she works, either personally or in groups, as theoretical or practical, but also in another workplace or in inter-institutional training centers (Bağdu, 2014; Hacıalioğlu, 2019). With the help of this training, the employee recruited as a trainee gains the skills and experiences required for the relevant position within a certain period of time, becomes able to benefit from the tools and other facilities that he/she will utilize while performing the job, and starts to display positive organizational behaviors. Evaluations made as a result of these trainings also help the process of deciding whether or not the employ-ees started to work as trainees will be recruited or not (Yüksel, 2000).
1.4.3. Development Trainings
These are the trainings to improve the skills of employees in an insti-tution by training them about developments and innovations in their fields (Hacıalioğlu, 2019). Based on the factors such as age, education, staffing and promotion, departments or positions of the employees may be changed within the organization. In such cases, supplementary training should be given so that the employees do not experience adaptation difficulties in the institution. In supplementary trainings, it is aimed to relay information to employees about duties, powers and responsibilities required in the new department or job in cases where a department or job change is made for the employees (Bağdu, 2014). In many industries, technological develop-

Gülay TAMER164
ments have an impact on the ways of work. Therefore, this change means that the methods, tools and equipment in the jobs performed may change over time. Development training programs should be planned and imple-mented to prevent employees from becoming distanced to such new infor-mation and to update their knowledge (Kocatürk, 2016).
1.4.4. Supplementary Trainings
Supplementary trainings are programs developed according to nature and qualifications of the new job required by the employees, who have been assigned to any position at home and abroad or whose position is changed. These are organized by the country and central organizational units in order to equip the employee who is assigned to a different posi-tion at the same location or the employee who is appointed to a different location at home or abroad with the qualifications and qualities required by such position or new job (Sarıbaş & Babadağ, 2015; Hacıalioğlu, 2019). The goal of these supplementary trainings is to meet the need for spe-cialized staff for different areas of the institution within a short time, to improve the employee skills and abilities in different areas, and to increase both material and moral satisfaction of the employee (Bayar, 2019).
1.4.5. Trainings for Specific Fields
These are the trainings which are implemented to train and develop employees of the institution in different fields for private services (Demir-taş, 2010). These trainings consist of three steps: specific field basic train-ing, specific field development training and specific field specialization training. The condition for participating in s specific field development training and specific field specialization training is to complete the specific field basic training.
1. Specific field basic training: is organized in order to give the skills and knowledge required by a private service.
2. Specific field development training: is organized in order to learn the innovations and developments arisen in the said field by the employee who has completed the specific field basic training.
3. Specific field specialization training: is the training in which the skills, knowledge and application skills required by a private service are crowned at the expertise level (Bayar, 2019).
1.4.6. Promotion Trainings
These are the trainings given to meet the staffing and promotion needs of the employees. The aim is to prepare and train the employee for the upper level positions in the institution. Employees of the institution should
165Academic Studies in Social, Human and Administrative Sciences - II 165
be evaluated at the end of the duration determined for the training, they should gain competencies of the position they will be promoted and show success. Promotion trainings include an academic type in-service training for formation of the senior staff needed by the institution. It is consid-ered as a training which is highly effective in motivation of employees and which also plays an important role to increase productivity. (Sarıbaş and Babadağ, 2015; Bayar, 2019).
2. ANALYSIS OF THE NEED FOR IN-SERVICE TRAINING The needs analysis is a critical step for an in-service training, which
is suitable for institutional goals with clarified implementation principles. If the training need cannot be determined correctly, the training will be an unnecessary financial burden for the institution. By embracing the conti-nuity of education in principle, the time, staff, scope and teaching methods should be planned and implemented correctly. For achieving an effective result, correct analysis of the training need has priority and is very import-ant (Bağdu, 2014).
Determining the needs is one of the important steps of the program development process (Sabuncuoğlu, 2005; Bağdu, 2014). Determining training needs is a data collection process (Hacıalioğlu, 2019).
Analyzes that institutions can use in the process of determining their training needs are given below (Yüksel, 2000):
• “Organizational Analysis” having the purpose of identifying the points where the organizational structure needs to be supported and the factors that may affect education in this context,
• “Job Analysis” having the purpose of proving what is the job that needs to be accomplished to an acceptable extent by the employees,
• “Person Analysis” having the purpose of revealing the quality of employees who will undertake the necessary tasks to accomplish a partic-ular job.
In addition to these analyzes, techniques like questionnaire, interview, group discussion, observation, consultancy, focus group and nominal group techniques are also used in determining the training needs (Yüksel, 2000).
There are four interrelated stages for determining the training pro-grams.
These are (Hacıalioğlu, 2019);
1- Determining goals of training programs: During determination of the goals, the opinions of the employees should be taken, they should be
Gülay TAMER166
measurable and improvable, they should be understood and adopted by the executives and employees of the institution, and they should have internal consistency.
2- Development of in-service training program: The subject matters of the training to be organized, who will be trained by whom, and the place of training and when will it take place are chosen and determined in this stage.
3- Implementation of in-service training programs: This is the stage where the subject matters prepared by using various teaching tools and materials are relayed to the target audience. While implementing the pro-gram, the presentation, discovery and research strategies, together with all teaching methods and techniques convenient to the strategy can be used by considering characteristics of the target audience. Direct instruction, coop-erative group work, discussion, case study, problem solving, illustration, demonstration, symposium, role play, brainstorming are some of these methods.
4- Evaluation of in-service trainings: The purpose of this stage is to determine at what degree the training has reached its objective.
The points to consider in determining the training need are as follows (Hacıalioğlu, 2019);
• The developments occurring in the structure and functioning of the institution should be followed closely,
• Training needs of the employees should be determined at least once a year by qualitative and or quantitative research methods which are decided as suitable,
• Annual training plans should be prepared according to the training needs of the institution,
• Training budget of the institution should be taken into account in determining the training needs,
• Employees should take active roles in determining the training need,
• If necessary, employee demands should be taken into consider-ation according to the confidentiality principle.
3. EVALUATION OF IN-SERVICE TRAININGFor determining the efficiency of in-service training activities, first
of all, effective measurement and evaluation are required. Failure to go through a multifaceted and impartial evaluation process of training ac-
167Academic Studies in Social, Human and Administrative Sciences - II 167
tivities organized in institutions, and inability to determine the degree of achievement of training practices causes to overlook the problems and de-ficiencies arisen in the practice. Proper evaluation of the in-service training program is as important as planning and implementation of it. Evaluation; is a process that shows the satisfaction of the trainees, how much of the relayed things are learned and how much of the learned is put into practice (Bağdu, 2014; Hacıalioğlu, 2019).
Evaluation can be performed in different stages of education by us-ing various methods. In these evaluations, the levels of objectives to be achieved or anticipated are determined. In-service trainings, many benefits other than certain outcomes intended are achieved. Some evaluations are made to use for increasing the efficiency of in-service training programs implemented, determining their effectiveness and enhancing the programs (Dağlı, 2010):
• Preliminary Evaluation: This is the evaluation performed to deter-mine the starting level of people who will participate in in-service training programs. By preliminary evaluation, the people who will attend the train-ing are grouped. Therefore, the tools, materials and methods to be used in the training can be determined.
• Interim Evaluation: This is the evaluation based on the practices made during the delivery of in-service training programs.
• Final Evaluation: This is the evaluation conducted at the end of the in-service training program to determine the level reached by the individu-al or the training group.
In the evaluation of training; reaction evaluations, learning evaluation, behavioral evaluations and outcome evaluations are carried out. Reactions of the training participants are very important for the continuity of the training, and for enabling changes in the training process. In learning, the changes in attitudes and increase in knowledge and skills achieved by the trainees after the training are observed. If there is change, then the training is succeeded. Certain behavioral changes are expected in the trainees to occur at the end of the training. Demonstrating expected behavior is also considered as an indicator of success (Hacıalioğlu, 2019).
The main measurement means that can be used to evaluate the success of in-service training are (Bağdu, 2014);
• Written tests,
• Oral tests,
• Interviews,
• Work - performance tests.
Gülay TAMER168
Evaluation of the process and use of various measurement means during this process are important in terms of activities, and enable the de-termination of positive and negative outcomes of the activities.
4. LAWS AND PRACTICES RELATED TO IN-SERVICE TRAININGTraining of institutional employees and executive training are becom-
ing more important ever-increasingly all over the world. It is observed that especially developed countries attach much more importance to these train-ings in order to train senior managers, and establish some central training institutions for continuation of in-service training activities (Subaşı, 2019). The rapidly increasing and diversified services and formation of numerous units undertaking such services lead to a complex structuring, and requires specialization of the staff to perform these duties (Kocatürk, 2016).
Pre-service and in-service training in our country is regulated by the Civil Servants Law No. 657, which was adopted in 1965. In articles 214-225 in the seventh chapter of the said law, under the title of “training civil servants”, the principles for institutions to train their civil servants in ser-vice are specified. According to article 214 of the Law, in-service training is implemented for training civil servants, increasing their productivity and preparing them for further duties; this is carried out within the scope of the regulation to be prepared by the State Personnel Administration together with the relevant institutions. According to this article, the main responsi-bility for training the civil servants belongs to the related institutions. Ar-ticles 215 and 216 of the Law relate to the fact that public institutions may give in-service training by establishing a “training unit” and a “training center” within their body. Article 215 explicitly states that a “training unit” will be established in each institution, having the duties of organizing, car-rying out and evaluating the training activities. It is stated that one of the units in institutions, which have more than one unit related to training, will operate as the “Central Training Unit”. Discretion for opening a training center to meet their needs has been granted to the institutions with Article 216 (Peker, 2010; Uyer ve Kocaman, 2016).
5. IN-SERVICE TRAINING PRACTICES IN HEALTH INSTITUTIONSMembers of the profession can ensure continuity of their professional
existence by having the business practicum in line with the necessities of the time, and by reflecting rapid changes and developments to their pro-fessional practices. Training of such members of the profession having this vision will be possible by continuity of trainings in this context (Göçmen, 2004). The knowledge, skills and attitudes gained by in-service training
169Academic Studies in Social, Human and Administrative Sciences - II 169
allow employees to be more productive, more successful and happier in their profession (Atay et al., 2009).
It is critical to train the employees in health institutions in line with the changes of the time. Forgetting the knowledge learned during the vo-cational education period by time, or inadequacy or loss of importance of the existing information with the technological developments or changing of necessary competencies require the healthcare professionals to update their professional knowledge continuously. Within this framework, in-ser-vice training programs aiming to benefit from new researches and studies periodically, to improve professional standards and to increase productiv-ity are an important development opportunity for healthcare professionals (Koç, 2004; Atay et al. 2009).
In-service training affects, directly and indirectly, the quality of ser-vice in health institutions. By the help of these trainings, the staff working in the health services field has the opportunity to learn and succeed, be-sides enhancing their work experience. By review of the trainings conduct-ed through professional processes and supply of feedback over he outputs, continuing training and development are encouraged. In-service training programs organized within the facilities of institutions by taking into con-sideration interests and needs of the staff, and with participation and co-operation of the institution executives; improve individual and institution-al productivity. They prevent work accidents and errors, and improve the professional confidence of employees. They also strengthen the in-house relations (Serbest and Ulupınar, 2010).
Training provided by health institutions is offered to employees, pa-tients and their relatives as a service. Institutions are aware that in order to keep up with recent conditions, it is necessary to make efforts in accor-dance with the changes and relay them to their employees.
By in-service trainings, the newly recruited employee is equipped with the business practicum necessary for the job, while on the other hand, current procedures regarding the job are provided. The employee is devel-oped at professional dimension in this way. With the help of the consultan-cy to be provided to patients and their relatives before, during and after the treatment, it is aimed to allow relatives of patients to participate in the care given, to provide information to them and to increase the service quality in this way (Serbest and Ulupınar, 2010; Buğdaylı and Akyürek, 2017).
Regulations made within the scope of the Health Transformation Pro-gram of the Ministry of Health in our country are as follows (Uyer and Kocaman, 2016);
• In-Service Training Regulation: In the regulation issued on
Gülay TAMER170
11.12.2009, the objectives, principles, planning, implementation-evalua-tion procedures and principles of in-service training to be conducted for employees working in the Ministry of Health are defined.
• Hospital Training Committees: As of 2009, the Ministry of Health has prepared the “Health Service Quality Standards” which covers private and university hospitals, and since then these standards have been used in the evaluation of service quality standards.
• Staff Compliance and In-Service Training: After the amendments made in 2011 with the Decree Law No. 663 on the Organization and Du-ties of the Ministry of Health and Affiliated Institutions, the orientation and in-service trainings of the staff of the Ministry of Health are being carried out under the responsibility of the Directorate General of Health Services, De-partment of Education and Certification Services. According to the Directive on the Duties and Working Procedures and Principles for the Headquarters issued by the Turkey’s Public Hospitals Authority dated 19.03.2014; the re-sponsibility of orientation and in-service trainings of the personnel work-ing in institutions under the Ministry of Health is planned to belong to the “Health Care and Services Department” at provincial level.
• Regulation on Certified Trainings: This is the “Ministry of Health’s Regulation on Certified Trainings” issued on February 4, 2014. In this reg-ulation, the procedures and principles for the certificates to be registered by the Ministry of Health are regulated.
In the literature, the recommended duration for orientation programs is given as six weeks to twelve months depending on the departments to work (Beecroft, Kuzman and Krozek, 2001). Although there is no specific duration determined in Turkey for orientation programs for new graduates, it is known that the duration of orientation programs are not sufficient. Due to the insufficient number of staff working in institutions, newly recruited employees are included to the patient care processes without completing their orientation processes (Uyer and Kocaman, 2016). This process not only has an impact on the motivation and performance of the employee but also poses a risk for patient safety. Additionally, orientation programs which are not planned with right time management will not be successful. It is extremely important that departments responsible for successful exe-cution of orientation programs should work in coordination and in compli-ance with the objectives (Uçkun and Kılınç, 2007).
Planning the orientation programs to be organized for newly recruited employees in health institutions by dividing them into three groups will be helpful. These are (Baykal and Türkmen, 2018);
• General Hospital Orientation Training / İnstitutional Orientation Training: This is the training program in which all hospital employees are
171Academic Studies in Social, Human and Administrative Sciences - II 171
included and informed. While planning this program, it should be noted that each employee should feel himself/herself as a part of the institution and consider themselves as an important key in the success of the institution.
• General Orientation Training: This covers the arrangements to facilitate newly recruited employees to work in their field of work. This should be planned to include the basic principles, skills and critical think-ing process for patient care and follow-up process.
• Clinical Field Orientation Training: This is a training program ad-dressing special training and evaluations related to the department to work.
Some remarkable results have been reached in some researches made on in-service training programs carried out in health institutions (Peker, 1992; Yüksel, 2000; Gürlek and Kanber, 2010; Buğdaylı and Akyürek, 2017; Zahoor, Muhammad, Mohammad, 2018):
In-service training has a direct effect on the performance and moti-vation of healthcare professionals. It stands out in the researches aiming to evaluate in-service trainings that the target audience is mainly nurses. According to the results obtained in researches made on nurses, it is seen that orientation trainings are generally exist on paper and not realized, the trainings carried out by training departments are generally unplanned and not regular, the trainings received are often on issues not needed or do not fully comply with their job duties. On the other hand, according to results of the same studies; the majority of participants also stated that they want-ed to follow the developments related to their profession through training programs, and they did not find themselves enough in terms of professional knowledge. Also in another study conducted on nurses, the participation of nurses in in-service training was analyzed. Accordingly, a significant num-ber of nurses stated that they did not attend any training in the last year, and stated that the time chosen for the training was not suitable as the reason, and a larger group stated that they needed in-service training.
It has been observed that these and similar researches, which have been carried out recently regarding in-service training, are frequently per-formed on nurses, and that other health workers are not covered in the studies. Increasing the researches on this matter to cover all health staff is important in terms of improving and enhancing in-service training pro-grams. Considering the results obtained with the researches;
• For increasing the efficiency of in-service training programs, ori-entation training programs should be prepared for all employees and par-ticipation should be ensured.
• Opinions of the employees should be taken into consideration in preparation of in-service training programs.
Gülay TAMER172
• Training topics should be determined based on the trainings re-quested by the employees or on the deficiencies and problems detected in functioning of the institution, and the program should be designed by creating a team of expert trainers.
• In-service training programs to be realized should be prepared in certain order and these programs should become continuous by organizing in regular periods.
Managers in the institution have great responsibilities in the processes of training and development. It is expected that an appropriate institutional structure will be created to help intensive learning of employees, and en-able them to put into practice the learned knowledge, skills and principles. In order to achieve institutional goals, a separate training and development department is formed in some institutions. The size of departments formed and the number of employees working there may vary institution to insti-tution (Baykal and Türkmen, 2018). The trust and support of institution managers in these processes will be important criteria in achieving success. Within this framework, it is important for managers to approach the em-ployees as their facilitators and mentors who will help them to progress, by developing and succeeding together, and not as their employers or bosses (Uçkun and Kılınç, 2007).
6. CONCLUSIONIn order to respond to the constantly changing and renewed expecta-
tions of the society served, the most important asset of healthcare organiza-tions should be knowledgeable and competent employees. Responsibilities for training and development of employees are increasing gradually. There-fore, each institution should plan and implement training activities in line with the establishment goals, structure and future objectives. These will contribute to the success of the institution (Baykal and Türkmen, 2018).
In-service training programs reduce work-related errors, prevent oc-cupational accidents, increase individual and institutional productivity and play an effective role in increasing the satisfaction rates of employees as well as patients. Institutions should plan and implement in-service training programs for their employees, ensure their efficiency by providing their employees with opportunities to learn and achieve, increase participation by giving information to all employees about training, and support the pro-cess.
173Academic Studies in Social, Human and Administrative Sciences - II 173
REFERENCESAkgül, Ö. (2008). Hizmet İçi Eğitimin İşgücü Verimliliğine Etkisi
(Yayımlanmamış Yüksek Lisans Tezi). Marmara Üniversitesi Sosyal Bilimler Enstitüsü, İstanbul.
Atay, S., Gider, D., Karadere, G., Şenyüz, P. (2009). Hastanede Çalışan Hemşirelerin Hizmet İçi Eğitime Yönelik Görüşleri. Uluslararası İnsan Bilimleri Dergisi, 6, (1): 84-93.
Aytaç, T. (2000). Hizmet İçi Eğitim Kavramı ve Uygulamada Karşılaşılan Sorunlar. Milli Eğitim Dergisi, 147, 1.
Bağdu, M. (2014). Hastane Ve Sağlık Kurumları Yönetimi Bilim Dalı Hemşirelikte Hizmet İçi Eğitim: Nazilli Devlet Hastanesi Örneği (Yüksek Lisans Tezi). Beykent Üniversitesi Sosyal Bilimler Enstitüsü işletme Yönetimi Anabilim Dalı, İstanbul.
Bayar, M. (2019). İnsan Kaynakları Yönetiminde Personelin Hizmet İçi Eğitimi ve Motivasyonun Performans Üzerindeki Etkisinin İncelenmesi: Ankara İlindeki Özel Sağlık Kurumlarında Bir Uygulama (Doktora Tezi). İstanbul Gelişim Üniversitesi Sosyal Bilimler Enstitüsü, İşletme Anabilim Dalı, İstanbul.
Baykal, Ü., Türkmen, E. (2018). Hemşirelik Hizmetleri Yönetimi. İstanbul: Akademi Basın ve Yayıncılık.
Beecroft, C. P., Kuzman, L., Krozek, C. (2001). RN internship: Outcomes of a One-Year Pilot Program. Journal of Nursing Administration, 31:575-582.
Clardy, A. (2005). Reputation, Goodwill, and Loss: Entering the Employee Training Audit Equation. Human Resource Development Review, 4(3), 279–304. https://doi.org/10.1177/1534484305278243
Dağlı, D. (2010), Hemşirelikte Hizmet İçi Eğitimlerin Performansa Etkisi (Yüksek Lisans Tezi). Beykent Üniversitesi Sağlık Bilimleri Yüksekokulu, İstanbul.
Demirtaş, Z. (2010). Öğretmeni Hizmet İçinde Yetiştirmenin Bir Aracı Olarak Denetim. Elektronik Sosyal Bilimler Dergisi, 9(31), 41-52.
Göçmen, Z. (2004). Ameliyathane Hemşirelerinin Ameliyathane Hemşireliği Oryantasyon Programı içeriğine İlişkin Görüşleri. Cumhuriyet Üniversitesi Hemşirelik Yüksekokulu Dergisi, 8(1).
Gül, H. (2000). Türkiye’de Kamu Yönetiminde Hizmet İçi Eğitim. Dokuz Eylül Üniversitesi Sosyal Bilimler Enstitüsü Dergisi, 2:3.
Hacıalioğlu, N. (2019). Hemşirelikte Öğretim Öğrenme ve Eğitim (4. Baskı). İstanbul: Nobel Tıp Kitabevi.
Koç, Z. (2004, Eylül-Ekim). Hastanelerde Çalışan Hemşirelerin Hizmet içi Eğitime Yönelik Düşünce, Beklenti ve Sorunları. Hemşirelik Forumu.
Özpulat, F. (2006). Sağlık Bakanlığı Ankara Dışkapı Eğitim Ve Araştırma Hastanesinde Çalışmakta Olan Sağlık Personelinin Hizmet İçi Eğitime
Gülay TAMER174
İlişkin Görüşlerinin Saptanması (Yüksek Lisans Tezi), Hacettepe Üniversitesi Sağlık Bilimleri Enstitüsü, Ankara.
Öztürk, M., Sancak, S. (2007). Hizmet İçi Eğitim Uygulamalarının Çalışma Hayatına Etkileri. Journal of Yasar University. Erişim Adresi (05.01.2020): https://journal.yasar.edu.tr/wp-content/uploads/2012/05/No_7_vol2_10_ozturk.pdf
Pehlivan, İ. (1993). Hizmet İçi Eğitim-Verimlilik İlişkisi. Ankara Üniversitesi Eğitim Bilimleri Fakültesi Dergisi. 25(1), 251-284.
Pehlivan, İ. (1997). Örgütsel ve Bireysel Gelişme Aracı Olarak Hizmet İçi Eğitim. Amme İdaresi Dergisi (AİD), 30, 4.
Peker, Ö. (1992). Kamu Kuruluşlarında Hizmet İçi Eğitim Yapısı ve İşlevi. Amme İdaresi Dergisi (AİD), 24(4), 72.
Peker, K. (2010). Kamu Kurum ve Kuruluşlarında Hizmet İçi Eğitim ve Yöntemleri. Mevzuat Dergisi. Erişim Adresi (8 Ocak 2020): https://www.mevzuatdergisi.com/2010/12a/02.htm
Sabuncuoğlu, Z. (2005). İnsan Kaynakları Yönetimi. Bursa: Alfa Aktüel Yayınları.
Sarıbaş, S., Babadağ, G. (2015). Temel Eğitimin Temel Sorunları. Anadolu Eğitim Liderliği ve Öğretim Dergisi, 3(1), 18-34.
Schuler, R. S., Huber, V.L. (1990), Staff and Human Resource Management (4th Edition). West Pub.Co.
Selimoğlu, E., Yılmaz, H. (2009). Hizmet İçi Eğitimin Kurum ve Çalışanlar Üzerine Etkileri. PARADOKS Ekonomi, Sosyoloji ve Politika Dergisi. Erişim Adresi (3 Ocak 2020): http://www.paradoks.org, ISSN 1305-7979
Serbest, Ş., Ulupınar, A. S. (2010). Özel Bir Hastane Grubunda Çalışan Hemşirelerin Kurumdaki Hizmet İçi Eğitim Uygulamalarına İlişkin Görüşleri. İstanbul Üniversitesi Florence Nightingale Hemşirelik Yüksekokulu Dergisi, 18(2), 98-105.
Subaşı, M. (2019). Hizmet İçi Eğitimin Çalışanların Performansına Etkisi: Örnek Bir Uygulama Shell (Yüksek Lisans Tezi). T.C. Ufuk Üniversitesi Sosyal Bilimler Enstitüsü İşletme Anabilim Dalı İnsan Kaynakları Yönetimi Programı, Ankara.
Şenviren, B. (2014) Hastane ve Sağlık Kurumları Yönetimi Bilim Dalı Hizmet İçi Eğitim, Türleri ve Sağlık Kurumlarında Hizmet İçi Eğitim (Yüksek Lisans Tezi). Beykent Üniversitesi Sosyal Bilimler Enstitüsü işletme Yönetimi Anabilim Dalı, İstanbul.
Tan, F., Koç, Z. (2014). Karabük Eğitim Araştırma Hastanesi’nde Çalışan Sağlık Personelinin Hizmet İçi Eğitimlere Bakışı. Business and Management Studies: An International Journal, 2(3), 321-347.
Taymaz, H. (1992). Hizmet içi Eğitimde Kavramlar, İlkeler, Yöntemler. Ankara: Sevinç Matbaası.
Uyer, G., Kocaman, G. (2016). Hemşirelik Hizmetleri Yönetimi El Kitabı.

175Academic Studies in Social, Human and Administrative Sciences - II 175
İstanbul: Sanerc Yayınları. İstanbul: Koç Üniversitesi Yayınları.Uçkun, G., Kılınç, İ. (2007). Koçluk ve Mentorluk, Ankara: Ürün Yayınları.Yüksel, Ö. (2000). İnsan Kaynakları Yönetimi (13. Baskı). Ankara: Gazi
Kitabevi.Zahoor, H., Muhammad, G., Mohammad, A. (2018). Impact of Training
and Development on Nursing and Technical Staffs Performance and Motivation a Case of Secondary Health Care Sector at Shamsi Hospital Karachi. Kürşat Çapraz (Ed.). The Second InTraders International Conference on International Trade Conference Book (p.21-40). İstanbul: Hiperlink Yayınları.

Chapter 10MIGRATION AND INTERSECTIONALITY:
POOR SYRIAN MIGRANTS
Hıdır APAK1
1 Dr., Mardin Artuklu University, Faculty of Health Sciences, [email protected]

179Academic Studies in Social, Human and Administrative Sciences - II 179
INTRODUCTION
“We escape the battle, but we are dragged into poverty.”2
Millions of people had to leave their homes and emigrate out of bor-der because of the events and internal turmoil in Syria in 2011. Turkey is among the countries that are the most preferred by individuals who migrate from Syria. According to data for 2020 of Ministry of Interior General
Directorate of Migration Administration3 there are 3 million 600 thousand Syrians under temporary protection in Turkey. This revealed immigration highlights many problems such as social and economic problems espe-cially, people coming from different cultures living together, coping with differences, communicating and adaptation.
These problems arise in the process of the migration of Syrians as seen in all the forced migration events in the world. One of the most important problems is the protection of vulnerable groups such as elderly, children, women, poor or disabled. This is even more important when considered that a significant proportion of Syrian migrants are disadvantaged / vulner-able / sensitive individuals in need of special protection. Migration experts highlight the increasing complexity of migration and migration situations in modern society, which Vertovec (2007) describes as it as super-diversi-ty”. Super-diversity also appears to be among socio-economic and legally differentiated immigrants.
Immigrants are often in vulnerable groups because they are exposed to many inequalities and suffer from many problems such as education, health, employment, economic and social exclusion. However, it can be stated that immigrants are diversified within themselves and not all are similarly disadvantaged. Age, socio-economic level, gender, ethnic / cul-tural background; It directly affects how an immigrant experiences his / her life, disadvantage situations and how to deal with them. Immigration expe-rience may vary according to more risky and more vulnerable/ fragile /dis-advantageous situations such as children, women, disabled, poor, elderly.
In this context, the term “disadvantaged migrants” refers to a group of migrants who live together with various disadvantages such as poor, children, women, the elderly or disability. This situation, which can be expressed as double, dual, multiple or intersectional, is an important point to be examined in the phenomenon of migration.
The concept of intersectionality was first used by Crenshaw to describe the combination of racial and gender disadvantages in the experience of 2 It is quoted from an interview between a researcher and a Syrian immigrant in Turkey.3 https://www.goc.gov.tr/gecici-koruma5638

Hıdır APAK180
being a black woman. The concept of intersectionality, which takes place in the social sciences, has a practical benefit in explaining the existence of different discrimination bases together and at the same time (Kahra-man-Güloğlu, 2019), intersecting categories produce social positions that cannot be clearly separated into their separate elements. These elements simply represent more than the sum of the parts (Giddens & Sutton, 2018).
In a general framework, the beginning of intersectional studies fo-cused on how race, class and gender intertwine and intersect, and how and with each other, and with which relationships. They centred on how race has become sexist, how gender has become racialized, and how the rela-tionship of both ensures that the social class is maintained and transformed (Davis, 2008). Intersectionality attempts to make visible the different “dis-crimination” and “disadvantages that arise in multidimensionality (Erez, Adelman & Gregory, 2009).
In order to fully understand the forced migration, it is important that such studies can be evaluated among those who experience disadvantage among immigrants. However, this situation is generally ignored in migration studies. In general, one of the most neglected points in migration studies is the disadvantage of migration and poverty. It is necessary to discuss the dis-advantage together. In the context of Syrian migrants, the literature on disad-vantaged groups is also insufficient (Yalim & Kim, 2018). Migration studies are generally handled with an approach that does not include disadvantage immigration and disadvantage studies do not include immigration.
In fact, each group is experiencing many negativities in itself. How-ever, if multiple or intersectional disadvantage perspectives are used, the situations of “immigrant and poor’’ individuals with a different cross-sec-tional and different disadvantage than both disadvantaged groups will be indicated and the presence of even more disadvantaged individuals will become clearer. In this study, it will be tried to put forward why the neg-ativity experienced by the individuals who have double or intersectional disadvantage is more than other immigrant individuals and how to deal with this situation. Understanding intersectivity is important not only for migrants, but also for the different aspects of the situation of migrants who experience different disadvantages and whose migration experiences differ.
If various issues such as integration and integration in the context of migration are to be discussed, attention must be paid to intersectional-ity and new social positions emerging in the context of intersectionality. Therefore, in this section, we will try to explain the situation of the Syrian immigrants who experience poverty and what problems they are experi-encing. The main purpose of this study is to examine the hypothetical link between poverty and immigrant status.
181Academic Studies in Social, Human and Administrative Sciences - II 181
RELATION OF MIGRATION AND POVERTYPoverty is one of the most important social problems that every soci-
ety has experienced in different ways from past to present. What is pov-erty? There are many answers to the question. However, despite all the answers, it is pointed out that poverty is difficult to define because of its multifaceted and complex structure. Since poverty affects heterogeneous groups, the concept of poverty is relative to different interest groups and individuals living in poverty (Kotler, Roberto, & Leisner, 2006).
Therefore, when making a definition of poverty, several opinions should be given together. Şenses (2014) briefly described poverty as not having sufficient resources to meet the necessary requirements; Gül and Şen (2018) stated the concept of poverty as the lack of the most basic re-sources, opportunities and chances for people to lead a long, healthy and creative life in accordance with human dignity.’’ Poverty means having to live in many problems and constraints that are not only limited to eco-nomic income or nutrition. Poor; In addition to access to facilities such as schools, health, electricity, food, clean water, shelter are the groups that are at risk to meet basic needs or meet these needs at the lowest level (Şen, 2018). Many poverty studies use monetary poverty indicators, while oth-ers use talent or social exclusion findings for poverty indicators (Kwadzo, 2015). When all these definitions are considered in general; Poverty can be defined as the inability of individuals to meet their physiological and social needs and the lack of income to live humanely.
One of the tools developed by poor individuals as a strategy to combat poverty is to emigrate to prosperous regions and countries. There are many reasons for the phenomenon of migration, and one of the most important reasons for migration is economic, although no single reason can satisfac-torily explain why people have decided to leave their home country and settle in another country (Castles & Miller, 2009). With the expansion of the neoliberal market economy, unemployment and poverty are the most important of the traditional problems in many regions, which are disap-pearing, reducing the social assistance of the state and the social problems it brings with it. Making the injustice between prosperity and living stan-dards visible in different parts of the world with developing communica-tion technologies accelerates the migration process (Danış, 2004).
With globalization, people flock to developed countries with the dream of achieving better living standards. Thus, many people from many countries of the world, especially highly educated and skilled people, go to developed countries. With globalization, not only capital mobility but also human mobility is increasing. However, although the mobility of capital is from North to South and from West to East, human mobility
Hıdır APAK182
and the mobility of low-skilled migrants operate in the opposite direction (Atasü-Topçuoğlu, 2012). The reasons for migration are inseparable from social, economic, cultural and religious reasons that force people to mi-grate. People migrate for different reasons and have to change their set-tlements; they want to live in settlements with better social, economic and cultural opportunities.
Poverty, which is one of the important reasons of migration, emerg-es as an important result even after the migration event. If migrants and families do not have sufficient qualifications to work in the places they migrate, they are excluded from employment opportunities, cannot access basic services and cannot meet their basic needs. Thus, poverty is also a cause and result of migration.
Studies on migration and poverty show that poverty is a positive and important determinant of migration, and that migration can have a signif-icant impact on helping poor people to get away from poverty. However, the option of forced migration can cause people to fall into poverty and increase household poverty. Therefore, the relationship between poverty and migration is unlikely to be unidirectional, since poverty is multifacet-ed and migration is not a homogeneous livelihood strategy (Awumbila, & Ardayfio-Schandorf, 2008). A study attempting to understand the causes of migration from Mexico to the United States revealed that poverty affects migration from Mexico to the United States, but poverty alone cannot fully explain why individuals and families choose to migrate from Mexico to the United States. Researchers have explained this in terms of the fact that the highest poverty rates in Mexico have the lowest immigration rates to the United States (Becerra et al., 2010). Migration may be caused by poverty, but migrants are not always the poorest because of the costs and opportu-nities involved.
In a globalizing world, poverty can lead to migration and migration can lead to poverty. Migrants migrate from their own countries due to pov-erty, and in the countries where they emigrate, they experience social ex-clusion due to the poverty brought by immigration and fall into another form of poverty (Karadağ, 2018). At the same time, it can be stated that individuals who do not live in poverty in their own countries and who migrate on their own can become impoverished with migration. Trying to get along in difficult conditions, lack of social security and being seen as cheap labor can often impoverish immigrant individuals in the new order they come from.
If the relationship between migration and poverty recovers, it can be said that this relationship is multifaceted. Migration can be both a cause of poverty and a result of poverty. In addition, the immigration process can
183Academic Studies in Social, Human and Administrative Sciences - II 183
turn into an advantage for some immigrants to end their poverty, and vice versa for some immigrants, it can turn into a means of impoverishment. In this way, some of the immigrants may be able to rebuild their livelihoods, but some may experience poverty. In the next section, the relationship be-tween migration and poverty will be discussed through the relationship between Syrian migrants.
INTERSECTION OF SYRIAN MIGRATION AND POVERTYEffects of Poverty; it is more intensely and destructively reflected to
vulnerable groups such as migrants (Sheafor, & Horejsi, 2014). Poverty is one of the major problems affecting Syrian migrants. The war in Syria affected millions of people regardless of whether they were women, men, rich or poor. Considering the reasons for the migration of Syrians, a migrant profile emerges from the war, not as a normal immigrant. In this sense, the migration processes of Syrian migrants can reveal the possibility of pov-erty. In addition, it can be stated that the Syrian migrants who have gone through the process of forced migration can become impoverished with the migration when they think that they do not have the opportunity and time to plan the migration process in a way that makes it possible to move the money and assets that can meet their basic human needs. Syrian migrants are generally poor in the regions they migrate. When migrating, they can pick up a small amount of valuable goods, money or goods that take light, little space with them. They also spend a significant portion of their assets in their first settlements to the places they migrated. However, where Syr-ian migrants leave, they have to leave their own assets and cannot benefit from them. In addition, they leave behind their existing professions, titles and jobs. In Syria, as a result of immigration due to compulsory reasons such as war, illnesses, traumas, disability or disability, mourning and loss, disintegration of families, loss of children or unaccompanied minors, may lead to impoverishment or poverty of immigrant individuals. In the pre-mi-gration period, middle-class families suddenly lose most of their economic income with forced migration. Thus, the migration process experienced by economic losses such as loss of assets and income leads individuals to poverty (Hanmer, Arango, Rubiano, Santamaria, & Viollaz, 2018).
Syrian immigrants that left their country were forced to migrate to different countries, like Turkey, Lebanon including Jordan. Studies with Syrian migrants provide important clues to poverty. Studies and reports in-dicate that the majority of Syrians live below the poverty line. Despite the support provided by host governments and humanitarian actors, migrants in the region are becoming increasingly vulnerable.
The majority of Syrian migrants live below the poverty line and have
Hıdır APAK184
difficulty in accessing food, shelter, health and other basic needs (FAO, 2018). According to the United Nations High Commissioner for Refu-gees (UNHCR), more than 85% of Syrian immigrants in Jordan (UNHCR, 2019a) and more than 70% of Syrian immigrants in Lebanon (UNHCR, 2019b) have been found to live below the poverty line. According to a report by UNHCR, the United Nations Children’s Fund (UNICEF) and the United Nations World Food Program (WFP), 88% of Syrian migrants in Lebanon are in debt, 75% do not have access to basic food and shelter, and 58% of them live in extreme poverty, who do not reach the basic needs for survival (World Food Programme, 2019). A study of the living and working condi-tions of Syrian children in Lebanon was investigated in 1902 households. It was found that households where women bear the economic burden are poorer than men whose households are the head of the household. In addi-tion, the average age of employment among children working from poverty is 10.9 years, 74.8% of whom work in agriculture (Habib et al., 2019).
This is also observed a similar process in Turkey. According to the assessments made in 2017 in Turkey, Approximately 67% of Syrian im-migrants live below the limit of the poverty, and it also shows that many of them do not have sufficient water, cleaning and hygiene facilities and they are not protected against insufficient weather conditions (Rohwerder, 2018; UNICEF, 2018). Syrian refugees living in Turkey between poverty and lack of access to a regular income because of the high cost of living is a common problem area (Bellamy, Haysom, Wake, & Barbelet, 2017).
The intersection of poverty and migration in the area of research done on Syrian refugees in Turkey has been demonstrated clearly. In a field study conducted in Mardin in 2014, 45.5% of immigrants stated that they had no income and 64.4% stated that they were unemployed (Apak, 2014). In a field study conducted in Şanlıurfa in 2015, it was found that 30.4% of the Syrian migrants had a monthly income of 501-1000 TL (Karasu, 2016). In a field study conducted in Istanbul in 2016, 30.4% of migrants regard unemployment and 13% poverty as a problem (Kaya & Kıraç, 2016). In a study on the representation of Syrian migrant children on social media, it was found that more than half of the news about Syrian migrant chil-dren were related to negative conditions such as poverty, hunger, violence, abuse, child labor, beggar, and inaccessibility to education (Yurtman, 2016). In another study on the problems and needs of Syrian women living in Konya, it was found out from the income status statements of the women participating in the research that they live below the hunger and poverty line and that they are trying to live below the “hunger and poverty” line. In this study, participants stated that they could not reach basic needs and that they became unemployed and poor due to the war (Afyonoğlu, 2019).
Syrian immigrants face many problems in the intersection of pover-
185Academic Studies in Social, Human and Administrative Sciences - II 185
ty and immigration. In this sense, poverty caused by economic problems; inability to adapt to society, exclusion, ghettoization, child labor, human trafficking, informal employment and cheap labor, access to basic human needs, and so on, it is a much bigger problem in terms of causing prob-lems. Although all migrant individuals are likely to face these problems, it is thought that those who maintain their lives in poverty may experience these problems more deeply. In addition to the traumas involving migra-tion, post-migration poverty; social exclusion, lack of social support mech-anisms make migrants more fragile. Immigrants, who face many violations of rights, have to deal with poverty at the same time.
Each individual, group or category experiencing cross-sectional dis-advantages has unique needs. It is very important that these needs are fully met and supported. The risks faced by defenseless and vulnerable groups of Syrian migrants (elderly people, people with disabilities, migrants with special needs due to poverty, injury or chronic illness, etc.) and discrimi-nation, increase their stress and reinforce their feelings of weakness. It is necessary to draw more attention to the needs of vulnerable and margin-alized migrants and help them regain control over their lives (Al-Qdah & Lacroix, 2017). As shown in many studies on Syrian migrants, it can be stated that Syrians are subject to some degree of exclusion (Kaya, 2017). With the phenomenon of immigration, immigrants may face exclusion due to financial inadequacies. Being financially poor can also lead to social and spatial exclusion and exclusion from public relations. On the one hand, the rights violations brought by immigration, on the other hand, poverty, rein-forces the exclusion and thus the vulnerability of Syrian migrants (Deniz, Ekinci, & Hülür, 2016).
Intersection issues in the context of poverty can also be seen in the sample of Syrian refugees in Turkey. Poverty among Syrian migrants; it leads to the neglect and abuse of women and children, and the transfor-mation of women into sex workers as a result of economic pressures. In addition, poverty causes Syrian migrants to be victims of trafficking, stig-ma, and insufficient access to basic services. About 40% of Syrian children are out of school due to poverty. These children are taken out of school by their parents for child labor and child marriage on the basis of poverty. The prevalence of child marriage has increased primarily due to poverty (Habib et al., 2019).
Due to poverty, many Syrian families resort to negative coping mech-anisms such as living in poor housing, reducing the quality and quantity of food products, and reducing health and education expenditures. These negative coping strategies have a detrimental effect on the well-being of all immigrants, particularly vulnerable children, the elderly and women (FAO, 2018).
Hıdır APAK186
The problems faced by poor Syrian migrants in the countries they mi-grate may also change in the context of the camp and urban life in which they live. Living outside the camps can be more challenging for poor mi-grants in general. This compelling situation may be more likely to meet basic needs such as housing, accommodation and social assistance. In ad-dition, it is easier to identify poor migrants systematically in camp life and better services provided by camp support professionals and charities shows that camp life is more compatible for poor people. The biggest obstacle of the camp life for the poor migrants is the difficulty to be included in the fields of work and labor. Those who maintain their lives in the camp having more difficulty with finding work.
Poverty affects labor, labor and employment issues for many Syrian migrants. In the post-migration period, Syrian migrants face great diffi-culties in finding housing and jobs or have to work for low wages under very poor working conditions (Çelebi, Verkuyten, & Bağcı, 2017). Syri-ans, mostly working in the informal sector and with low income, are trying to earn income in begging, peddling and similar fields. Some Syrians have to consider alternatives such as construction labor, seasonal agricultural work, sex work, labor in small workshops or various jobs in the service sector (Ördek, 2017). According to the results of quantitative and qualita-tive field research conducted by Tümtaş (2018) with the Syrian migrants, migrants are determined in the labor market mainly in terms of wages, working time, working conditions and so on. As a result of encountering unequal practices in terms of issues, they experience the problem of pov-erty more deeply.
Seasonal agricultural labor is one of the areas where Syrian migrants work most intensively. They work as seasonal migrant in Turkey and “the weak negotiating position against the employers and workers mediator” is available in the group. Because Syrian migrants are among the seasonal agricultural labor groups; they represent the most defenseless and vulnera-ble group due to poverty and deprivation, fear of deportation, dependence on labor mediators, language problems, marginalization among different groups of workers, fear of death and violence (Pelek, 2019). Syrian mi-grants are exposed to economic exploitation by business owners without any security in the seasonal agricultural work. This means that poverty, precariousness, and economic abuse are victims of many Syrians in a vi-cious circle (Ördek, 2017).
Another of the problems that the Syrian migrant and seasonal agricul-tural employment in seasonal agricultural work led to the livelihoods of the poorest sections of the population, considering the fact that in Turkey “competition between the poor” is that there may bellows. The competition of the poor can also involve encounters and conflicts of different ethnic,
187Academic Studies in Social, Human and Administrative Sciences - II 187
religious and cultural groups. This is a kind pointing to a new stage in the study of poverty in Turkey that is called “from poverty seizure to Competi-tion of poor” a phenomenon (Dedeoğlu, 2018). This may lead to a negative perception or xenophobia (fear, hate) of Syrian migrants. In one study of ethno-cultural differences and also because immigrants are not cheap labor in Turkey were found to be exposed to discrimination and exclusion by the majority groups (Tümtaş, 2018).
Thus, the desires of Syrian migrants to be included in the work and la-bor areas due to poverty also affect the local poor. The vast majority of the Syrian migrants are poor and they mix among the poor stratas of the cities where they migrate. This group, which is defined as external poor, causes declines / collapses in the economic and social indicators of the poor de-fined as local poor. In this concept “collapse of poverty” shows the change that local poor included (Koçancı, 2016). It can be stated that the local poor are exposed to poverty collapse with the start of the work of Syrian migrants. In a qualitative study with the poor in Turkey has been observed that job opportunities decreased in the marginal sector with the arrival of Syrian migrants to the city, which reduced the current income of the do-mestic poor, which increases the risk of dismissal, an increase of goods and services, housing / shelter due to an increased problem that decreased the level of welfare owned by the local poor (Koçancı, 2016). In addition, although Syrians are more likely to be displaced by the poor in the la-bor market, Syrians add vitality to the economy as consumers and tenants. They also opened businesses and created jobs to help local citizens benefit as employers and sellers. In some border cities, trade balance improved as exports to the Middle East increased (Azevedo, Yang, & Inan, 2016). It is clear that the debate will continue because of the presence of migrants in the host countries, their positive and negative economic consequences, and the immigrants’ burden or potential benefit to the host country’s economy.
As the Syrian migration approaches the end of its eighth year, it is important to consider and meet the physical, psychological, spiritual and social needs of poor immigrants. In order to reduce the effects of the prob-lems experienced by poor migrants during the migration process, it is nec-essary to evaluate the phenomenon of immigration and poverty as multi-ple. In this respect, it is necessary to support the return of the poor migrants to their normal life as soon as possible.
CONCLUSIONSIn this study which sheds light on the relationship between migra-
tion and poverty; a brief overview of some of the main challenges arising from the intersection of poverty and forced migration. In the context of this study, this intersection is tried to be discussed over Syrian migrants.
Hıdır APAK188
Those who are vulnerable from immigrant groups face different problems than other immigrant groups before, during and after migration. When the pre-migration process is examined, it is seen that the poor suffer from many problems caused by poverty. Conversely, some of the immigrants living in poverty in the post-migration process may have a more prosperous life than the pre-migration process. For some immigrants, the migration process can be the continuation of poverty or the end of poverty, and for some immi-grants it can be the zero point where poverty begins. There is no detailed data on the experiences of Syrian migrants experiencing vulnerability and immigration at the same time. The Syrian poor migrant face more prob-lems not only because of their migration but also because they are poor. The real issue is that they experience both problems at the same time and intertwined. For this reason, the problems of individuals with intersection-al disadvantage, including both of these groups, can be shaped according to both the impact of migration and disadvantageous situations. The result of this study is that the majority of the Syrian migrants live in poverty. The fact that Syrians live below the limit of hunger and poverty shows that they need in-kind and cash services. At this point, governments and local associations can play an important role in meeting the basic needs of Syrian migrants. The fact that Syrian migrants have refugee status can also trigger more poverty or be the main cause of poverty. With the clarification of the status of individuals, it can be stated that they have the assurance of UNHCR and that the problems of poverty can be solved more quickly. In this respect, the fact that Syrian immigrants are deeply affected by the poverty problem is statelessness and the uncertainties that come with it. The situation of Syrian migrants is left to the conscience of the countries where they take refuge. That cross-sectional disadvantage over Syrian mi-grants can be made more visible; there is a need for field research in which the situation of poor migrants can be more clearly identified. More local efforts should be made to make the needs of these groups more visible. In addition, legal and social improvements are needed for poor migrants. The social assistance and solidarity fund should primarily provide assistance to children, the elderly and the disabled who are from vulnerable groups. For example, if children do not benefit from this fund, poverty will be exacer-bated with the effect of intersectional disadvantage and increase the risk of poverty shifting to generation. Otherwise, if children are given priority, an opportunity channel will be opened for children in the fight against pover-ty. It is clear that education, health and so on primary and vital assistance will provide children with a way out.
189Academic Studies in Social, Human and Administrative Sciences - II 189
REFERENCESAl-Qdah, T. A. K., & Lacroix, M. (2017). Syrian refugees in Jordan:
Social workers use a Participatory Rapid Appraisal (PRA) methodology for needs assessment, human rights and community development. International Social Work, 60(3), 614-627. https://doi.org/10.1177/0020872816673889
Afyonoğlu, M. F. (2019). Konya’da yaşayan Suriyeli kadınların sorun ve ihtiyaçlarıyla şekillenen şiddet deneyimi: Kesişimsellik perspektifinden bir sosyal çalışma değerlendirmesi. Doktora Tezi, Selçuk Üniversitesi
Apak, H. (2014). Suriyeli göçmenlerin kente uyumları: Mardin örneği. Mukaddime, 5(2), 53-70.
Atasü-Topçuoğlu, R. (2012). Düzensiz göç: Küreselleşmede kısıtlanan insan hareketleri. S. G. Ihlamur-Öner, N. A. Şirin-Öner (Ed.) içinde, Küreselleşme çağında göç: Kavramlar, tartışmalar (s. 501-518). İstanbul: İletişim.
Awumbila, M., & Ardayfio-Schandorf, E. (2008). Gendered poverty, migration and livelihood strategies of female porters in Accra, Ghana. Norwegian Journal of Geography 62(3), 171-179.
Azevedo, J. P, Yang, J. S., Inan, O. K. (2016). What are the impacts of Syrian refugees on host community welfare in Turkey? A subnational poverty analysis. A Subnational Poverty Analysis (January 28, 2016). World Bank Policy Research Working Paper
Becerra, D., Gurrola, M., Ayón, C., Androff, D., Krysik, J. , Gerdes, K., Moya-Salas, L., & Segal, E. (2010) Poverty and other factors affecting migration intentions among adolescents in Mexico. Journal of Poverty 14(1), 1-16.
Bellamy, C., Haysom, S., Wake, C., Barbelet, V. (2017). The lives and livelihoods of Syrian refugees - A study of refugee perspectives and their institutional environment in Turkey and Jordan. HPG Commissioned Report, https://www.odi.org/sites/odi.org.uk/files/resource-documents/11343.pdf, accessed November 2, 2019
Castles S., & Miller M. J. (2009). The age of migration: International population movements in the modern world, 4th edn. Basingstoke: Palgrave MacMillan.
Çelebi, E., Verkuyten, M., & Bağcı, S. C. (2017). Ethnic identification, discrimination, and mental and physical health among Syrian refugees: The moderating role of identity needs. European Journal of Social Psychology, 47(7), 832-843.
Danış, D. (2004). Yeni göç hareketleri ve Türkiye. Birikim Dergisi, 184-185, 216-224.
Davis, K. (2008). Intersectionality as buzzword: A sociology of science
Hıdır APAK190
perspective on what makes a feminist theory successful. Feminist theory, 9(1), 67-85.
Dedeoğlu, S. (2018). Tarımsal üretimde göçmen işçiler: Yoksulluk nöbetinden yoksulların rekabetine. Çalışma ve Toplum, 1, 37-68.
Deniz, A. Ç., Ekinci, Y., & Hülür, A. B. (2016). Suriyeli sığınmacıların karşılaştığı sosyal dışlanma mekanizmaları. Sosyal Bilimler Araştırma Dergisi, 14(1), 17-40.
Erez E., Adelman M., & Gregory, C. (2009). Intersections of immigration and domestic violence: Voices of battered immigrant women. Feminist Criminology, 4(1), 32-56.
FAO. (2018). Turkey - Syrian refugee resilience plan 2018-2019. Food and Agriculture Organisation of the United Nations (FAO), https://reliefweb.int/sites/reliefweb.int/files/resources/Fao-syrian-refugee-plan2018-19.pdf, accessed November 6, 2019.
Giddens, A. & Sutton P. W. (2018). Sosyolojide temel kavramlar. Ankara: Phoenix.
Gül, H., & Şen, B. (2018). Yoksulluk: Tanım, olgu ve yaklaşımlar. B. Şen & M. Ö. Taşkesen (Ed.) içinde, Yoksulluk ve sosyal hizmet (p. 11-29). Konya: Eğitim Yayınevi.
Habib, R. R., Ziadee, M., Abi, Younes E, et al. (2019) Displacement, deprivation and hard work among Syrian refugee children in Lebanon. BMJ Glob Health, 4(1).
Hanmer, L., Arango, D., Rubiano, E., Santamaria, J., & Viollaz, E. (2018). How does poverty differ among refugees? Taking a gender lens to the data on Syrian refugees in Jordan. World Bank Policy Research Working Paper, http://documents.worldbank.org/curated/en/374541539781178899/How-Does-Poverty-Differ-Among-Refugees-Taking-a-Gender-Lens-to-the-Data-on-Syrian-Refugees-in-Jordan
Kahraman-Güloğlu, F. (2019). Uluslararası çalışmaların gündeminde engelli kadın ayrımcılığının ifadesi. Toplum ve Sosyal Hizmet, 30(1), 260-285.
Karadağ, A. K. (2018). Göç, yoksulluk ve insan hakları. İnönü Üniversitesi Hukuk Fakültesi Dergisi, 9(2), 485-498.
Karasu, M. A. (2016). Şanlıurfa’da yaşayan Suriyeli sığınmacıların kentle uyum sorunu. Süleyman Demirel Üniversitesi İktisadi ve İdari Bilimler Fakültesi Dergisi, 21(3), 997-1016.
Kaya, A., & Kıraç, A. (2016). İstanbul’daki Suriyeli mültecilere ilişkin zarar görebilirlik değerlendirme raporu. Hayata Destek Derneği. http://hayatadestek.org/yayinlarimiz/2016_istanbul_rapor.pdf, accessed November 6, 2019.
Kaya, M. (2017). Türkiye’deki savaş mağduru engelli Suriyeli mültecilerin
191Academic Studies in Social, Human and Administrative Sciences - II 191
toplumsal hayata adaptasyon süreçleri özel ve kamusal alan engelleri. Diyalektolog-Ulusal Sosyal Bilimler Dergisi 16, 127-144.
Koçancı, M. (2016). Bir kavramsallaştırma denemesi olarak yoksulluk çökmesi. Manas Sosyal Araştırmalar Dergisi 5(1), 176-202.
Kotler, P., Roberto, N., & Leisner, T. (2006) Alleviating poverty: A macro/micro marketing perspective. Journal of Macromarketing, 26(2), 233-238.
Kwadzo, M. (2015). Choosing concepts and measurements of poverty: A comparison of three major poverty approaches. Journal of Poverty, 19(4), 409-423.
Ördek, K. (2017). Türkiye’de “geçici koruma” altında Suriyeliler ve seks işçiliği raporu. https://www.asylumineurope.org/sites/default/files/resources/sex_workers_-_rapor_turkce_pdf.pdf, accessed November 18, 2019.
Pelek, D. (2019). Syrian refugees as seasonal migrant workers: Re-Construction of unequal power relations in Turkish agriculture. Journal of Refugee Studies, 32(4), 605-629,doi:10.1093/jrs/fey050.
Rohwerder, B. (2018). Syrian refugee women, girls, and people with disabilities in Turkey. The K4D Helpdesk Report. https://reliefweb.int/sites/reliefweb.int/files/resources/Syrian_refugee_women__girls__and_people_with_disabilities_in_Turkey.pdf, accessed November 8, 2019
Sheafor, B. W., & Horejsi, C. J. (2014). Techniques and guidelines for social work practice, 10th edn, New Jersey: Pearson.
Şen, B. (2018). Küreselleşme, yoksulluk ve sosyal hizmet. B. Şen & M. Ö. Taşkesen (Ed.) içinde, Yoksulluk ve sosyal hizmet (p. 31-47). Konya: Eğitim Yayınevi.
Şenses, F. (2014). Küreselleşmenin öteki yüzü yoksulluk. İstanbul: İletişim.Tümtaş, M. S. (2018) Toplumsal dışlanmadan vatandaşlık tartışmalarına
Suriyeli kent mültecileri. Akdeniz İİBF Dergisi, 18(37), 26-47.UNICEF. (2018). Syria crisis January 2018 humanitarian results. https://
reliefweb.int/sites/reliefweb.int/files/resources/UNICEF%20Syria%20Crisis%20Humanitarian%20Situation%20Report%2C%20January%202018.pdf, accessed November 11, 2019
UNHCR. (2019a). https://reliefweb.int/sites/reliefweb.int/files/resources/64114.pdf, accessed November 5, 2019.
UNHCR. (2019b). http://data.unhcr.org/syrianrefugees /regional.php, accessed November 6, 2019.
Vertovec, S. (2007). Super-diversity and its implications. Ethnic and Racial Studies, 30(6), 1024-1054.
World Food Programme. (2019). United Nations Children’s Fund, United Nations High Commissioner for Refugees 2016 Vulnerability assessment of Syrian Refugees in Lebanon. https:// bit. ly/ 2HCDuLG, accessed 19 November 19, 2019.

Hıdır APAK192
Yalim, A. C., & Kim, I. (2018). Mental health and psychosocial needs of Syrian refugees: A literature review and future directions. Advances in Social Work, 18(3), 833-852.
Yurtman, G.A. (2016). Suriyeli mülteci çocukların sosyal medyada temsil biçimleri. 1. International Symposium on Migration & Culture, 01-03 Aralık, 155-164.

Chapter 11SMART-DARK FACTORIES AND LEAN
ACCOUNTING
İlkay Ejder ERTURAN1
1 Dr. Öğr. Üyesi , Düzce Üniversitesi, Çilimli MYO, Muhasebe ve Vergi Bölümü, [email protected]

195Academic Studies in Social, Human and Administrative Sciences - II 195
1. INTRODUCTIONIndustrial developments, increase in production quality, equipment ef-
ficiency and minimum level of work accidents have brought smart and dark factories to the agenda. Robots are much safer to work in jobs where peo-ple who have trouble at working, such as toxic work environments, high temperatures, deadly gases (https://www.automationworld.com/factory/robotics/article/13316849/turning-out-the-lights-on-the-factory-floor). Because the production process and consumer profile have brought the need for technology-intensive companies in the current business circum-stances. Along with changing production methods in businesses; manage-ment styles and workforce features differ and labor force preferences using advanced technology will increase. By concentrating on system design and control, the error rate will be greatly reduced and productivity will be in-creased. Smart companies will increase their market share, management of supply chains and processes will be easier to follow. More intensive infor-mation technology will be used in smart businesses. Major breakthroughs in information technologies in recent years have included smart machines and smart businesses that can communicate with each other. Citizens tend to be e-communities with applications such as e-government, e-tax, e-com-merce. With the birth of a baby, families opening an e-mail address and so-cial media accounts to the baby is an example emphasizing the importance of how people adopt to information technologies. In the first stage of an information-intensive world, there are concepts of Internet of Things and Machine-to-Machine communication.
2. LEAN THINKING CONCEPTThe concept of lean in the industry was first introduced in 1990 in
order to summarize the working approaches and production approach in the automotive industry in Japan (Womack, Jones and Ross 1990, p.47). “Muda” in Japanese language is used to describe any human activity that does not create value, waste and waste resources. Muda corresponds to “waste” in Turkish language. When the word Muda is adapted to the pro-duction area, it can be defined as the production processes that need to be corrected, the stocks that cannot be used in production or sold, and the production that increases the level of unnecessary stocks, the business pro-cesses that are actually unnecessary, the movements and transportation of workers and stocks that do not create added value, and the next business process due to the inability to complete the previous business process, or goods and services that remain far from meeting customer needs (Womack and Jones 2003, p.15). Muda’s basic solution is to think lean. Lean think-ing can be defined as stopping waste, inefficient processes, all business activities that do not offer economic benefits and adding all activities that
İlkay Ejder ERTURAN196
offer added value to the production process by providing benefits (Hicks 2007, p. 236). Womack and Jones (2003, p.29-90) summarized the five basic principles and stages of lean thinking as the definition of the value, determination of the value stream, ensuring continuous flow, the pull sys-tem application, and excellence.
Defining the value is the starting point of lean thinking. The concept of value exists at every stage of lean manufacturing. The value is defined by the customer. Everything that does not create value in customer definition is waste. The party that can define the value in a most realistic way is the end customer. The product that meets the customer’s needs at the right time and at the right price is meaningful in defining the value. Although the val-ue is created by the manufacturer (Womack and Jones 2003, p.29), it can only be defined by the customer. Value is a combination of the properties of the product that the customer is willing to pay (McNair 2006, p.12). It is a waste to produce the right goods and services in an earlier stage be-fore they are ordered as well as to produce the wrong goods or services. In another definition, the value is defined by the customer as the quantity of a particular good (Balcı, 2011). The process of determining the value flow can be defined as the steps to actually create value as perceived by the customer. It is important to plan the value flow process that is created from the beginning of the process to the end until the product reaches the end consumer. At this stage, enterprises rarely focus, it turned out that there was almost always a large amount of waste (Womack and Jones 2003, p.15). The value stream can be defined as the process from the point of sale of the product or service to the realization of the purchase transaction. The flow of value is the sum of all the processes and activities necessary for the goods to reach the final consumer, starting from the customer demand, from the firm’s first order, to the completion of production and delivery to the consumer (Duque and Cadavid 2007, p.72). The purpose of the contin-uous flow of value flow is to reorganize it in a row that allows the product to flow towards the customer, by keeping the value-added steps (Wom-ack and Jones 2003, p.19). It is necessary to create a continuous flow and move the finished and/or semi-finished products from one processing step to the next step by balancing the production and the quantity of production (Rother and Harris 2001). The increase in the speed of the process that turns from raw materials to product is an indication that the “flow” rate of the system is so high.
The success of realizing the value flow occurs by keeping the process speed under control during the pull system application phase. The control of the process speed is possible by defining and removing the waste in the production process. In the lean system, every business process is the inter-nal customer of the previous business process with the aim to produce the
197Academic Studies in Social, Human and Administrative Sciences - II 197
product that meets the needs of the end consumer. Perfection, which is the last principle of the process, emphasizes the necessity of an auto control and analysis process by providing the continuous flow of the defined value in line with the needs of the end consumer Perfection, the last principle of the process, emphasizes the necessity of an auto control and analysis process by not providing the continuous flow of the defined value in line with the wishes of the end consumer. The goal of perfection can only be achieved by continuous learning activities and technological developments (Womack and Jones 2003, p.95).
3. LEAN PRODUCTION AND LEAN ACCOUNTING
Lean production system in lean factories aims to achieve simplicity in all functions of the enterprise. Accounting needs to adopt a lean accounting approach by differentiating from traditional accounting. The basis of lean manufacturing philosophy is to prevent waste at every step in the business. Every process of the production phase should be examined and the unnec-essary steps as well as waste should be reduced to a minimum level. Lean production is defined as a philosophical approach that ensures the satisfac-tion of the consumers to the highest level by producing quality products in the shortest time possible according to the demands of the end consum-er by minimizing the raw material, labor and production overhead costs (Mckellen, 2004). The adoption of the lean manufacturing system offers a different approach where the traditional business approach is turned upside down. Okur (1997) stated that the concept of lean production has emerged as a result of a skeptical understanding that questions the generally ac-cepted principles and rules, and does not characterized by any established belief recognized as an absolute truth.; Lean production can be explained by two important factors according to another view. The first is that each employee carries duties and responsibilities for activities that create value within the business, and the second is to investigate the root cause of this system, which reveals errors more transparently (Cesur, 1997, p.211). Lean accounting can be defined as providing accurate and reliable information in a simple manner that information users will understand in the most ac-curate way. The necessity of lean accounting is stated by Balcı (2011) that there is a contradiction between lean production based on the principle of continuous value adding and the traditional accounting process which is based on the audit approach rather than improving. The way in which traditional accounting is compatible with the new production philosophy is through the change in the understanding of accounting in a business that uses the lean manufacturing approach (Kennedy and Widener 2008, p.302). There are two important goals in lean accounting which are the ap-plication of the lean thinking to the internal accounting processes and the
İlkay Ejder ERTURAN198
support of the lean business management system (Köse, 2018). In order to make sense of lean thinking philosophy, business managers and employees will desire to see the results of the applied lean approach in the financial perspective. The economical results of these improvement efforts may not be observed in the short term, and can often result in financial costs. The reason for this contradiction consists of different priorities of commercial activities and financial processes. In addition, in restructuring periods, fi-nancial expenses increase and the income generation spreads over time. The customer satisfaction and measurement criteria of the employees and finance employees differ in this regard. Operating staff measure customer satisfaction and department success based on shortening delivery time to customers, quality improvement, timely and accurate delivery, optimiza-tion in the workplace and increased stock turnover rate. According to the financial perspective, productivity comes to the fore. A positive change will emerge in the financial statements by reducing costs and, if possible, at the same time raising revenues. While the income level has remained con-stant in the companies that have gone through lean thinking, some low-in-come operations continue. Employee overtime expenses are not under full control and overall production overhead costs will continue in a similar manner, although waste costs have decreased. Operating profits due to the decrease in stocks may decrease and cash flow may be created from the activities due to the decrease in stocks, but no significant change is made in the remaining financial indicators (Köse, 2018). What lean thinking does differently needs to be accurately measured. In order to make this measure-ment, the works that are considered to have no added value, which lean manufacturing philosophy calls waste (Ohno 1988), can be categorized as waste types such as inventories (raw material, semi-finished, finished goods), transportation (raw material, semi-finished), operations do not add value, idle times (operator, workbench, material), unnecessary move-ments (bending, incline extension, turning), faulty poor quality production (scrap, reprocessing), and excessive production (production in excess of demand, high volume batch).
Stocks, which are the mainstay of production, also cause waste in case of excessive stock level. Inadequate inventories cause loss of production and sales, while excessive stock level causes waste and does not create added value due to the storage costs and resources allocated to the inven-tories. Especially during an economic environment where prices do not in-crease, having high level of inventory increase carrying costs and reduces business efficiency. Reactive quality controls occurring after the product is completed are also described as waste. The product is valuable as it has high quality. For this reason, the production of the desired goods must be obtained without error in the first production. Since the transportation of
199Academic Studies in Social, Human and Administrative Sciences - II 199
the product in the production process does not contribute to the production, the transportation process is a waste. Unnecessary transport of equipment, raw materials, semi-finished and finished products from one place to an-other is waste. For this reason, the production area should be designed from the beginning and the transportation processes should be done natu-rally within the production systematic and unnecessary repetitions should be eliminated.
Works that do not create added value in the process and steps that do not create value for the customer are considered as waste. Unneces-sary check points, approvals and certification are examples of this type of waste. Idle production period due to errors in workflow or idle time due to wrong production planning and preparation phase for production is a waste. The unnecessary bending, getting up and turning movements of the operators and employees, which are the result of a poor layout of the enterprise is a waste. Due to these unnecessary movements, workers’ health problems arise ergonomically. Faulty and poor-quality production of the product is also a waste, as it will end up with no sale or mandatory repair expenses. Failure to produce the product at the appropriate quality, as a result of which it is scrapped and reworked, creates waste. Businesses suffer in terms of time and cost. Early stock production despite there is no demand, and production before the time customer desire to receive the goods are another example of wastes. Excess production will cause inven-tory carrying costs as well as idle inventory. The basis of lean production is to avoid waste. Avoiding waste will save cost for the business in the long run. Lean accounting is an accounting approach that aims to produce in-formation that supports lean manufacturing processes (Cunningham 2003, p.85). It is important to create a lean organization and simplify processes in the early stages of lean accounting. Improvements across the business are important. Simplification should also be applied in accounting transac-tions. For example, processes such as month-end closings, monthly pay-ments, receivables, payrolls, cost calculations and expense reports can be improved. There are important reasons to apply lean improvement meth-ods to accounting transactions: the company’s operations become more efficient with the improvement of the processes, achievements to be gained by accounting and finance employees learning lean methods and their ap-plication in lean accounting, diminishing waste and unnecessary business processes will save time for finance officers who will adopt in an easier way in transition to lean accounting practices.
It is not always possible to see the results of this application in the short term. But over time, there will be a considerable improvement in terms of this whole workforce and resource utilization. The new change in the production system with Industry 4.0 has further simplified the produc-
İlkay Ejder ERTURAN200
tion, which surrounds the world, called the new industrial revolution, and it has become possible to achieve the simplification envisaged in accounting with online accounting records.
4. CHANGING THE PRODUCTION SYSTEM: SMART AND DARK FACTORIES Smart and Dark Factories are factories (from the entry of the raw ma-
terial to the factory the exit of the product) that require little or no human intervention especially at the production stage. These factories where the workforce is minimized are called digital (smart) factories. Smart facto-ry is defined as a business consisting of smart machines and equipment use humanoid machines which solve the problems that occur during the process. Smart factories are systems that aim to ensure the perfect flow of data between the physical world and the virtual world. Smart factory that combines product, information and communication technologies in-tegrates into production and supply processes; significantly increases re-source utilization; reduces the storage and distribution cycle of customized products and ensures (Wan & Zhou, 2015). Smart factories, also called Learning Factories as they are in continuous development and learning, are also known as Dark Factories because they require little human labor, ensure that the ever-increasing complexity in production processes which is managed is attractive, sustainable and profitable (Yıldız, 2018).
Dark factories are factories equipped with fully automatic systems that do not need light nor people. These factories can work 24 hours a day through robots. These factories were also safe against work accidents because humans are replaced by robots in the jobs that have risk for dan-ger. The production system, called the dark factories, is an impressive and thought-provoking process. There is no need for light, for social needs such as employees’ needs for lunch, compensation, excuse leave, and job security problems in the dark factories. This system, called as dark-out (lights-out) production, offers a constant production output to the user and does this without the help of any human power. There are no people active-ly working in dark factories. In these factories, production is carried out entirely with robotic systems. For example; when high temperature, high weights, poisonous gases or all other dangerous working conditions are in-cluded during a function to be performed, it will also ensure smooth oper-ation in occupational safety by using robots instead of humans to perform these functions (https://www.endustri40.com/karanlik-fabrikalar-ile-in-sansiz-uretim/).
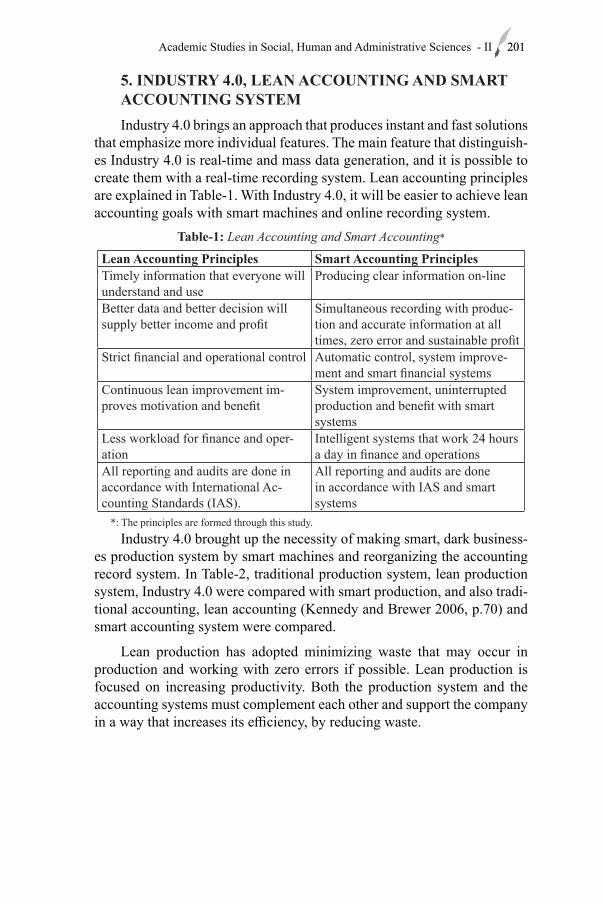
201Academic Studies in Social, Human and Administrative Sciences - II 201
5. INDUSTRY 4.0, LEAN ACCOUNTING AND SMART ACCOUNTING SYSTEMIndustry 4.0 brings an approach that produces instant and fast solutions
that emphasize more individual features. The main feature that distinguish-es Industry 4.0 is real-time and mass data generation, and it is possible to create them with a real-time recording system. Lean accounting principles are explained in Table-1. With Industry 4.0, it will be easier to achieve lean accounting goals with smart machines and online recording system.
Table-1: Lean Accounting and Smart Accounting*
Lean Accounting Principles Smart Accounting PrinciplesTimely information that everyone will understand and use
Producing clear information on-line
Better data and better decision will supply better income and profit
Simultaneous recording with produc-tion and accurate information at all times, zero error and sustainable profit
Strict financial and operational control Automatic control, system improve-ment and smart financial systems
Continuous lean improvement im-proves motivation and benefit
System improvement, uninterrupted production and benefit with smart systems
Less workload for finance and oper-ation
Intelligent systems that work 24 hours a day in finance and operations
All reporting and audits are done in accordance with International Ac-counting Standards (IAS).
All reporting and audits are done in accordance with IAS and smart systems
*: The principles are formed through this study.Industry 4.0 brought up the necessity of making smart, dark business-
es production system by smart machines and reorganizing the accounting record system. In Table-2, traditional production system, lean production system, Industry 4.0 were compared with smart production, and also tradi-tional accounting, lean accounting (Kennedy and Brewer 2006, p.70) and smart accounting system were compared.
Lean production has adopted minimizing waste that may occur in production and working with zero errors if possible. Lean production is focused on increasing productivity. Both the production system and the accounting systems must complement each other and support the company in a way that increases its efficiency, by reducing waste.
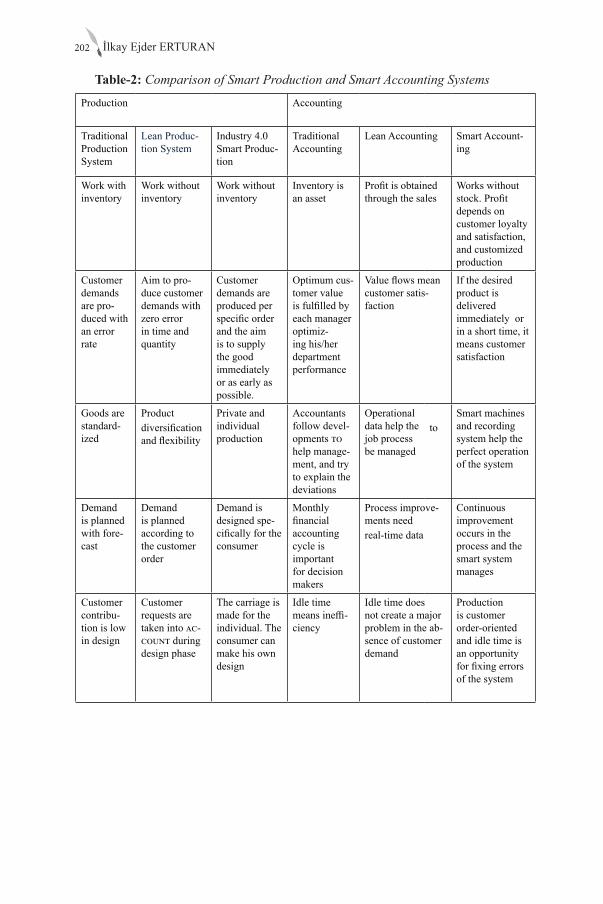
İlkay Ejder ERTURAN202
Table-2: Comparison of Smart Production and Smart Accounting Systems
Production Accounting
Traditional Production System
Lean Produc-tion System
Industry 4.0 Smart Produc-tion
Traditional Accounting
Lean Accounting Smart Account-ing
Work with inventory
Work without inventory
Work without inventory
Inventory is an asset
Profit is obtained through the sales
Works without stock. Profit depends on customer loyalty and satisfaction, and customized production
Customer demands are pro-duced with an error rate
Aim to pro-duce customer demands with zero error in time and quantity
Customer demands are produced per specific order and the aim is to supply the good immediately or as early as possible.
Optimum cus-tomer value is fulfilled by each manager optimiz-ing his/her department performance
Value flows mean customer satis-faction
If the desired product is delivered immediately or in a short time, it means customer satisfaction
Goods are standard-ized
Productdiversification and flexibility
Private and individual production
Accountants follow devel-opments to help manage-ment, and try to explain the deviations
Operational data help the job process be managed
toSmart machines and recording system help the perfect operation of the system
Demand is planned with fore-cast
Demand is planned according to the customer order
Demand is designed spe-cifically for the consumer
Monthly financial accounting cycle is important for decision makers
Process improve-ments needreal-time data
Continuous improvement occurs in the process and the smart system manages
Customer contribu-tion is low in design
Customer requests are taken into ac-count during design phase
The carriage is made for the individual. The consumer can make his own design
Idle time means ineffi-ciency
Idle time does not create a major problem in the ab-sence of customer demand
Production is customer order-oriented and idle time is an opportunity for fixing errors of the system
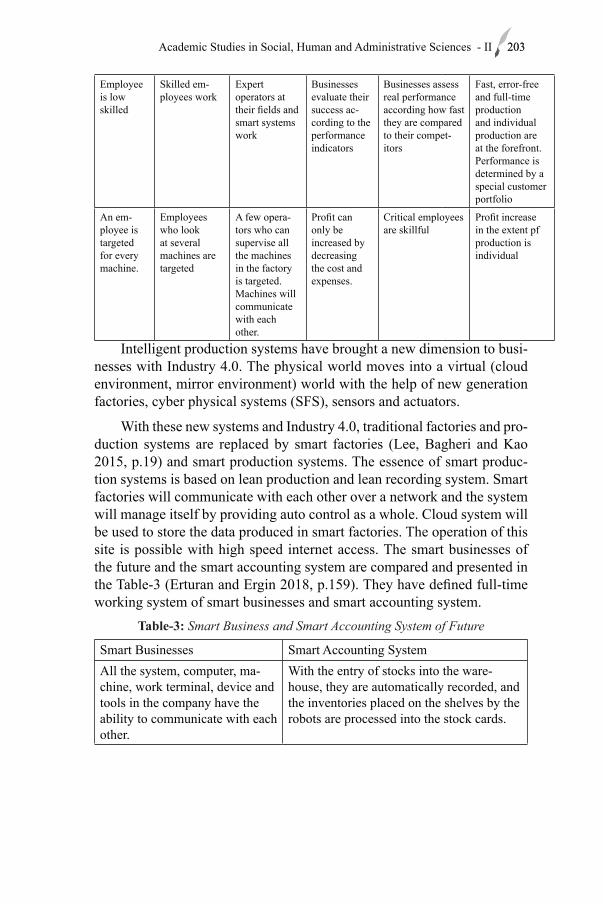
203Academic Studies in Social, Human and Administrative Sciences - II 203
Employee is low skilled
Skilled em-ployees work
Expert operators at their fields and smart systems work
Businesses evaluate their success ac-cording to the performance indicators
Businesses assess real performance according how fast they are compared to their compet-itors
Fast, error-free and full-time production and individual production are at the forefront. Performance is determined by a special customer portfolio
An em-ployee is targeted for every machine.
Employees who look at several machines are targeted
A few opera-tors who can supervise all the machines in the factory is targeted. Machines will communicate with each other.
Profit can only be increased by decreasing the cost and expenses.
Critical employees are skillful
Profit increase in the extent pf production is individual
Intelligent production systems have brought a new dimension to busi-nesses with Industry 4.0. The physical world moves into a virtual (cloud environment, mirror environment) world with the help of new generation factories, cyber physical systems (SFS), sensors and actuators.
With these new systems and Industry 4.0, traditional factories and pro-duction systems are replaced by smart factories (Lee, Bagheri and Kao 2015, p.19) and smart production systems. The essence of smart produc-tion systems is based on lean production and lean recording system. Smart factories will communicate with each other over a network and the system will manage itself by providing auto control as a whole. Cloud system will be used to store the data produced in smart factories. The operation of this site is possible with high speed internet access. The smart businesses of the future and the smart accounting system are compared and presented in the Table-3 (Erturan and Ergin 2018, p.159). They have defined full-time working system of smart businesses and smart accounting system.
Table-3: Smart Business and Smart Accounting System of Future
Smart Businesses Smart Accounting SystemAll the system, computer, ma-chine, work terminal, device and tools in the company have the ability to communicate with each other.
With the entry of stocks into the ware-house, they are automatically recorded, and the inventories placed on the shelves by the robots are processed into the stock cards.
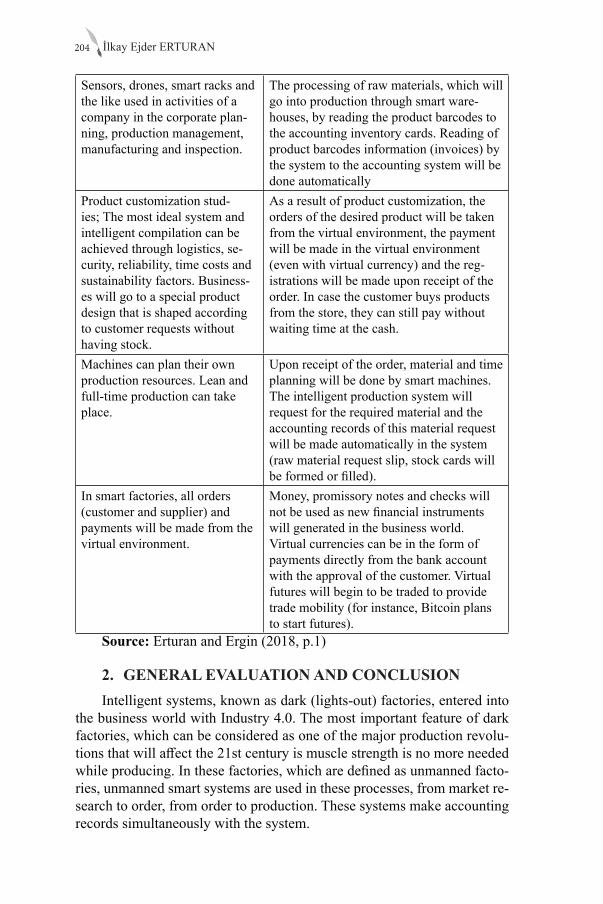
İlkay Ejder ERTURAN204
Sensors, drones, smart racks and the like used in activities of a company in the corporate plan-ning, production management, manufacturing and inspection.
The processing of raw materials, which will go into production through smart ware-houses, by reading the product barcodes to the accounting inventory cards. Reading of product barcodes information (invoices) by the system to the accounting system will be done automatically
Product customization stud-ies; The most ideal system and intelligent compilation can be achieved through logistics, se-curity, reliability, time costs and sustainability factors. Business-es will go to a special product design that is shaped according to customer requests without having stock.
As a result of product customization, the orders of the desired product will be taken from the virtual environment, the payment will be made in the virtual environment (even with virtual currency) and the reg-istrations will be made upon receipt of the order. In case the customer buys products from the store, they can still pay without waiting time at the cash.
Machines can plan their own production resources. Lean and full-time production can take place.
Upon receipt of the order, material and time planning will be done by smart machines. The intelligent production system will request for the required material and the accounting records of this material request will be made automatically in the system (raw material request slip, stock cards will be formed or filled).
In smart factories, all orders (customer and supplier) and payments will be made from the virtual environment.
Money, promissory notes and checks will not be used as new financial instruments will generated in the business world. Virtual currencies can be in the form of payments directly from the bank account with the approval of the customer. Virtual futures will begin to be traded to provide trade mobility (for instance, Bitcoin plans to start futures).
Source: Erturan and Ergin (2018, p.1)
2. GENERAL EVALUATION AND CONCLUSIONIntelligent systems, known as dark (lights-out) factories, entered into
the business world with Industry 4.0. The most important feature of dark factories, which can be considered as one of the major production revolu-tions that will affect the 21st century is muscle strength is no more needed while producing. In these factories, which are defined as unmanned facto-ries, unmanned smart systems are used in these processes, from market re-search to order, from order to production. These systems make accounting records simultaneously with the system.
205Academic Studies in Social, Human and Administrative Sciences - II 205
The idea of lean production, which has spread from Japan to increase production and reduce the cost, will enable to reach its targets much easier with the help of dark and smart factories. Lean production philosophy is a successful method that has been tried to be applied for many years. It is not possible to immediately see the results of lean applications in the financial statements. It will take time for accountants to observe the reflections of this system. This is a hard-to-define concept for accountants working with concrete data and expecting a value in the financial statements. Lean work in a business focuses on three things: offering value to customers, improve business processes, and eliminate waste. Value and value flow, customer satisfaction, customer perception are abstract concepts that are difficult to define as monetary value and to be capitalized in the balance sheet. Al-though this situation will return to the business as a value in the long term, the results obtained in terms of operation do not make sense. Inability to observe the reflection of lean work on financial results may evoke the per-ception to top management that the lean system is not working. It would be a better approach to combine operational and financial perspectives in order to continue lean operations in the company and convince senior management. With this understanding, the accounting system should be designed in accordance with the new structuring of the production system and to provide useful information in the company that have adopted a sim-ple philosophy.
Implementation of the lean manufacturing system will accelerate with industry 4.0. Technologies used in Industry 4.0 facilitate the applicability of lean production and lean accounting. Systems such as data analytics, robotic systems (Sensor and RFID infrastructure), industrial internet where machines and systems are communicating with each other, cloud systems, simulation, additive production supported by three-dimensional printers (Conner et al., 2014, p.74), cyber security, sensors are started to be imple-mented with Industry 4.0.
Smart-dark factories will maximize savings while maximizing pro-duction. Smart-dark factories help increase efficiency and provide cost advantage in a competitive market condition. It may be possible to imple-ment lean manufacturing processes with zero errors in smart-dark factories that are seen with the rise of the Industry 4.0 business world. Thus, it will be possible to achieve cost advantage.
These systems will make lean production much easier and more ap-plicable. The production systems of factories will differ and this differen-tiation will have an effect on the accounting system which will support the achievement of lean accounting by recording the produced products in an online manner.
İlkay Ejder ERTURAN206
REFERENCESBALCI, B.R. (2011). Yalın Finansal Muhasebe. İzmir: Altın Nokta
Yayınevi.CESUR, N. (1997). Yalın Üretimin Arkasındaki Nedenler. Verimlilik
Dergisi, 4, p.113- 144.CONNER, B.P., MANOGHARAN, G.P., MARTOF, A.N., and
CUNNINGHAM, J.E. (2003). Real Number: Management Accounting in a Lean Organization. Managing Times Press, Canada.
DUQUE, D.M. and CADAVID, L.R. (2007). Lean manufacturing measurement: the relationship between lean activities and lean metrics, Estudios Gerenciales, 23:105, p.69-83.
ERTURAN, İ.E. and ERGİN, E. (2018). Muhasebe Mesleğinde Dijitalleşme: Endüstri 4.0 Etkisi. The Journal of Academic Social Science, 72, p.153-165.
HICKS, B.J. (2007). Lean information management: understanding and eliminating waste, International Journal of Information Management, 27:4, p.233-249.
HIGH SCHOOL OF ARTS AND TECHNOLOGIES, Managerial Accounting Methods and Functions, https://www.coursehero.com/file/30886958/uw-eMBA-wikibook-managerial- accountingpdf/
KAGERMANN, H., WAHLSTER, W. and HELBING, J. (2013). Recommendations for implementing the strategic initiative INDUSTRIE 4.0. Acatech, Frankfurt.
KENNEDY, F.A. and BREWER, P.C. (2006). The lean enterprise and traditional accounting - Is the honeymoon over?, Journal of Corporate Accounting and Finance, 17:6, p.63-74.
KENNEDY, F.A. and WIDENER, S.K. (2008). A control framework: insights from evidence on lean accounting, Management Accounting Research, 19:4, p.301-323.
KÖSE, T. and AĞDENİZ, Ş. (2018). Integration of theory of constraints, lean manufacturing and six sigma – the TLS model, VII. International Congress on Current Debates in Social Sciences, 19-21 April 2018, İstanbul.
LEE, J., BAGHERI, B. and KAO, H. (2015). A cyber-physical systems architecture for industry 4.0-based manufacturing systems, Manufacturing Letters, 3, p.18-23.
MCKELLEN, C. (2004). Lean manufacturing and lean thinking, Metalworking Production, London.
MCNAIR, C. J., POLUTNIK, L. and SILVI, R. (2006). Customer-driven lean cost management, Journal of Cost Management, 20:6, p.9-21.
OHNO, T. (1988). Toyota production system: beyond large scale production, Productivity Press, New York.
207Academic Studies in Social, Human and Administrative Sciences - II 207
ODOMSKY, L.M., RODOMSKY, C.M., JORDAN, D.C., and LIMPEROS, J.W. (2014). Making sense of 3D printing: Creating a map of additive manufacturing products and services, Additive Manufacturing, 1-4, p.64-76.
OKUR, A. S. (1997). Yalın Üretim 2000’li Yıllara Doğru Türkiye Sanayii İçin Yapılanma Modeli, Söz Yayıncılık, İstanbul.
ROTHER, M. and HARRIS, R. (2001). Creating continuous flow: an action guide for managers, for engineers and production associates, Lean Enterprise Institute, Cambridge.
Wan, J., & Zhou, C. H. (2015). Industrie 4.0: Enabling Technologies. In:Intelligent Computing and Internet of Things (ICIT)International Conference on. IEEE, (s. 135-140). Çin, Harbin.
WOMACK, J. and JONES, D. (2003). Lean Thinking, 2nd Ed., Free Press, New York. WOMACK, J., JONES, D. ve ROSS, D. (1990). The machine that changed the world, Simon and Schuster, UK.
Yıldız, A. (2018). Endüstri 4.0 ve akıllı fabrikalar. Sakarya University Journal of Science, 22(2), 548-558.
http://www.automationtr.com/akilli-fabrika-aglarinda-siber-guvenlik.html. Mayıs 11, 2020 tarihinde alındı
https://commons.wikimedia.org/wiki/File:Basic_Lean_Acct_Diagram_(6).png. Mayıs 10, 2020 tarihinde alındı
https://www.automationworld.com/factory/robotics/article/13316849/turning-out-the-lights-on-the-factory-floor.
https://www.endustri40.com/karanlik-fabrikalar-ile-insansiz-uretim/. Mayıs 11, 2020 tarihinde alındı
https://www.tubitak.gov.tr/sites/default/files/akilli_uretim_sistemleri_tyh_v27aralik2016.pdf.
https://www.tubitak.gov.tr/sites/default/files/akilli_uretim_sistemleri_tyh_v27aralik2016.pdf. Mayıs 14, 2020 tarihinde alındı
https://enterpriseiotinsights.com/20160810/internet-of-things/lights-out-manufacturing-tag31-tag99. adresinden alınmıştır
http://www.automationtr.com/akilli-fabrika-aglarinda-siber-guvenlik.html. Mayıs 11, 2020 tarihinde alındı
https://commons.wikimedia.org/wiki/File:Basic_Lean_Acct_Diagram_(6).png. Mayıs 10, 2020 tarihinde alındı
https://www.automationworld.com/factory/robotics/article/13316849/turning-out-the-lights-on-the-factory-floor.
https://www.endustri40.com/karanlik-fabrikalar-ile-insansiz-uretim/. Mayıs 11, 2020 tarihinde alındı
https://www.tubitak.gov.tr/sites/default/files/akilli_uretim_sistemleri_tyh_v27aralik2016.pdf.
https://www.tubitak.gov.tr/sites/default/files/akilli_uretim_sistemleri_tyh_v27aralik2016.pdf. Mayıs 14, 2020 tarihinde alındı

Chapter 12SOCIAL MEDIA ADDICTION AND
CONTROLLING SOCIAL MEDIA USE: AN EXTENSIVE STUDY
Imran ASLAN1
1 Assoc.Prof.,Bingöl University, Healthcare Faculty, [email protected] , [email protected], Orcid: https://orcid.org/0000-0001-5307-4474

211Academic Studies in Social, Human and Administrative Sciences - II 211
1. INTRODUCTION
Immediate communication has changed the life of people with send-ing verbal messages, videos or images by a click. Virtual contacts and meeting even live videos have made people’s lives easier. (Guedes et al., 2016: 43–48).Virtual worlds such as online games, chat rooms, web rings such as home pages, electronic bulletin boards and social networking tools are ways of people interacting in online platforms. (Vannucci et al., 2017: 163–166).Facebook, YouTube, Instagram, Twitter, Wechat, QQ and Sina Weibo, TikTok, QQ, QZone, Sina Weibo, Reddit, Snapchat, Twitter, Flickr, Bebo, DeviantArt, Hi5, Friendster, Tagged, Badoo, Xing, Orkut, Pinterest, WhatsApp, Viber, Snapchat, LINE, Pinterest, YY, LinkedIn, Telegram, VKontakte, Blackberry Messenger, and KakaoTalkare are popular social media networks in 2020. (Liu &Jianling, 2018; Medya, 2020; Vannucci et al., 2017: 163–166) Facebook, YouTube, Instagram, TikTok, QQ, QZone, Sina Weibo, Reddit, Snapchat, Twitter and Pinterest are found to be the most popular social media networks in 2020. (Medya, 2020)
Social capital defined as “the sum of the resources, actual or virtual, that accrue to an individual or a group by virtue of possessing a durable network of more or less institutionalized relationships of mutual acquain-tance and recognition” can be formed in Social Network Sites (SNSs) . (Kuss&Griffiths, 2011).More than 73% of worldwide internet users are active on social media. (Kemp, 2017) and the ten most popular SNSs with their properties and services are shown in Table 1. It is estimated that there will be around 3.09 billion social media users around the globe by the end of 2021. (Statista, 2020) Among existing social media networks, Facebook the most popular of the SNSs has over 2.3- 2.41 billion members,monthly active users with more than 1.5 billion people using it daily in 2019. (An-dreassen et al., 2013: 90–99; Marengo, Poletti, Settanni, 2020) ) Insta-gram has recently surpassed 1 billion monthly active users, the vast ma-jority of whom are using it on daily basis. (Casale & Banchi, 2020) It was found in the study of Aslan &Yaşar(2019) carried out on Bingöl University students in the city of Bingöl, in Turkey, that the most widely used network among social media applications is Instagram, with 85.2%. This applica-tion is followed by YouTube and Facebook. As the most ten popular SNSs market are analyzed the USA and China are the pioneers at creating inno-vative SNSs, while the most popular two SNSs were invented by USA. People in China use mainly their SNSs while USA invented SNSs are more popular around the world. Sharing and communication with friends or sur-roundings are the main dimensions of these SNSs.
5-10% of Americans are social media addictive. (Hilliard &Parisi, 2020). The prevalence of Facebook addiction is estimated to be between
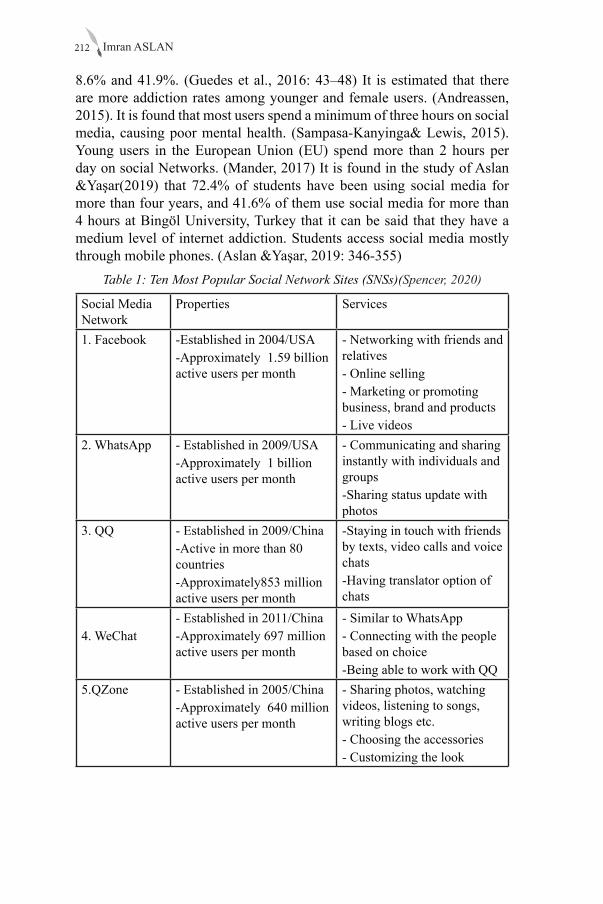
Imran ASLAN212
8.6% and 41.9%. (Guedes et al., 2016: 43–48) It is estimated that there are more addiction rates among younger and female users. (Andreassen, 2015). It is found that most users spend a minimum of three hours on social media, causing poor mental health. (Sampasa-Kanyinga& Lewis, 2015).Young users in the European Union (EU) spend more than 2 hours per day on social Networks. (Mander, 2017) It is found in the study of Aslan &Yaşar(2019) that 72.4% of students have been using social media for more than four years, and 41.6% of them use social media for more than 4 hours at Bingöl University, Turkey that it can be said that they have a medium level of internet addiction. Students access social media mostly through mobile phones. (Aslan &Yaşar, 2019: 346-355)
Table 1: Ten Most Popular Social Network Sites (SNSs)(Spencer, 2020)
Social Media Network
Properties Services
1. Facebook -Established in 2004/USA-Approximately 1.59 billion active users per month
- Networking with friends and relatives - Online selling- Marketing or promoting business, brand and products - Live videos
2. WhatsApp - Established in 2009/USA-Approximately 1 billion active users per month
- Communicating and sharing instantly with individuals and groups-Sharing status update with photos
3. QQ - Established in 2009/China-Active in more than 80 countries-Approximately853 million active users per month
-Staying in touch with friends by texts, video calls and voice chats-Having translator option of chats
4. WeChat- Established in 2011/China-Approximately 697 million active users per month
- Similar to WhatsApp- Connecting with the people based on choice-Being able to work with QQ
5.QZone - Established in 2005/China-Approximately 640 million active users per month
- Sharing photos, watching videos, listening to songs, writing blogs etc.- Choosing the accessories- Customizing the look
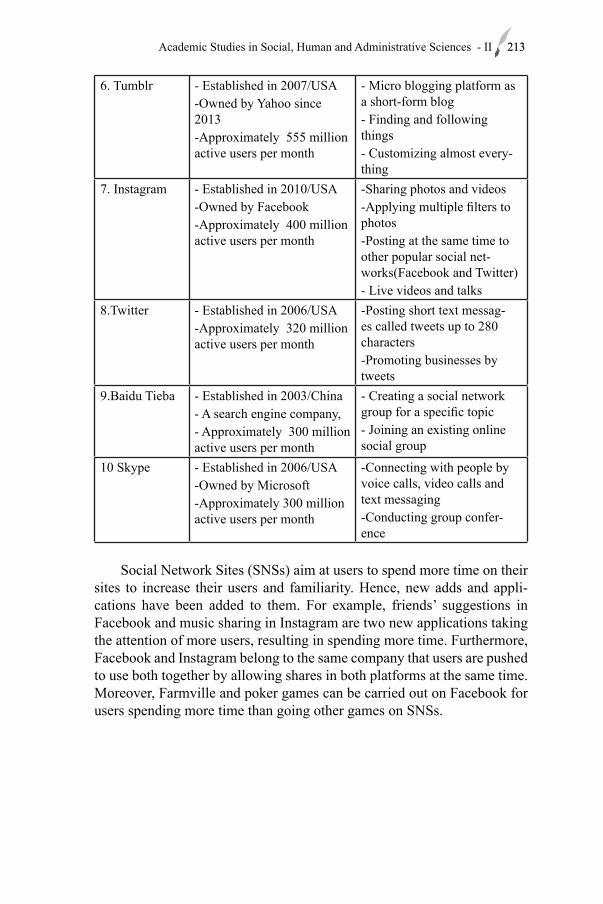
213Academic Studies in Social, Human and Administrative Sciences - II 213
6. Tumblr - Established in 2007/USA-Owned by Yahoo since 2013-Approximately 555 million active users per month
- Micro blogging platform as a short-form blog- Finding and following things- Customizing almost every-thing
7. Instagram - Established in 2010/USA-Owned by Facebook-Approximately 400 million active users per month
-Sharing photos and videos-Applying multiple filters to photos-Posting at the same time to other popular social net-works(Facebook and Twitter)- Live videos and talks
8.Twitter - Established in 2006/USA-Approximately 320 million active users per month
-Posting short text messag-es called tweets up to 280 characters-Promoting businesses by tweets
9.Baidu Tieba - Established in 2003/China- A search engine company,- Approximately 300 million active users per month
- Creating a social network group for a specific topic- Joining an existing online social group
10 Skype - Established in 2006/USA-Owned by Microsoft-Approximately 300 million active users per month
-Connecting with people by voice calls, video calls and text messaging-Conducting group confer-ence
Social Network Sites (SNSs) aim at users to spend more time on their sites to increase their users and familiarity. Hence, new adds and appli-cations have been added to them. For example, friends’ suggestions in Facebook and music sharing in Instagram are two new applications taking the attention of more users, resulting in spending more time. Furthermore, Facebook and Instagram belong to the same company that users are pushed to use both together by allowing shares in both platforms at the same time. Moreover, Farmville and poker games can be carried out on Facebook for users spending more time than going other games on SNSs.
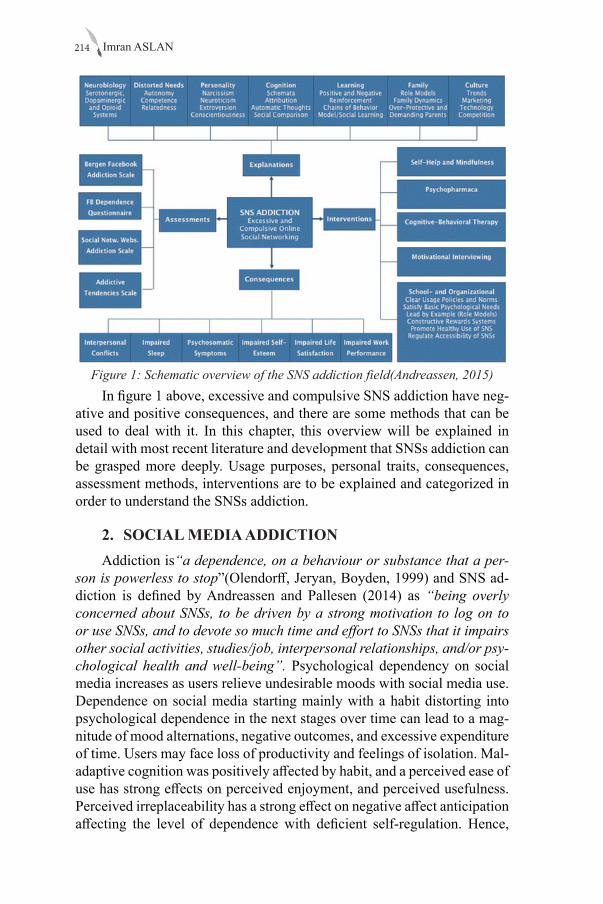
Imran ASLAN214
Figure 1: Schematic overview of the SNS addiction field(Andreassen, 2015)In figure 1 above, excessive and compulsive SNS addiction have neg-
ative and positive consequences, and there are some methods that can be used to deal with it. In this chapter, this overview will be explained in detail with most recent literature and development that SNSs addiction can be grasped more deeply. Usage purposes, personal traits, consequences, assessment methods, interventions are to be explained and categorized in order to understand the SNSs addiction.
2. SOCIAL MEDIA ADDICTION Addiction is“a dependence, on a behaviour or substance that a per-
son is powerless to stop”(Olendorff, Jeryan, Boyden, 1999) and SNS ad-diction is defined by Andreassen and Pallesen (2014) as “being overly concerned about SNSs, to be driven by a strong motivation to log on to or use SNSs, and to devote so much time and effort to SNSs that it impairs other social activities, studies/job, interpersonal relationships, and/or psy-chological health and well-being”. Psychological dependency on social media increases as users relieve undesirable moods with social media use. Dependence on social media starting mainly with a habit distorting into psychological dependence in the next stages over time can lead to a mag-nitude of mood alternations, negative outcomes, and excessive expenditure of time. Users may face loss of productivity and feelings of isolation. Mal-adaptive cognition was positively affected by habit, and a perceived ease of use has strong effects on perceived enjoyment, and perceived usefulness. Perceived irreplaceability has a strong effect on negative affect anticipation affecting the level of dependence with deficient self-regulation. Hence,
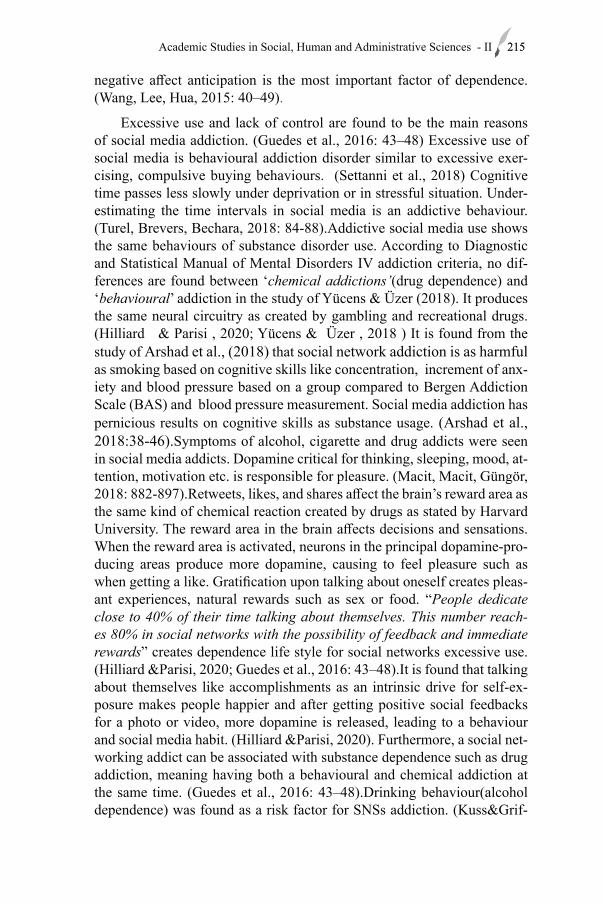
215Academic Studies in Social, Human and Administrative Sciences - II 215
negative affect anticipation is the most important factor of dependence. (Wang, Lee, Hua, 2015: 40–49).
Excessive use and lack of control are found to be the main reasons of social media addiction. (Guedes et al., 2016: 43–48) Excessive use of social media is behavioural addiction disorder similar to excessive exer-cising, compulsive buying behaviours. (Settanni et al., 2018) Cognitive time passes less slowly under deprivation or in stressful situation. Under-estimating the time intervals in social media is an addictive behaviour. (Turel, Brevers, Bechara, 2018: 84-88).Addictive social media use shows the same behaviours of substance disorder use. According to Diagnostic and Statistical Manual of Mental Disorders IV addiction criteria, no dif-ferences are found between ‘chemical addictions’(drug dependence) and ‘behavioural’ addiction in the study of Yücens & Üzer (2018). It produces the same neural circuitry as created by gambling and recreational drugs. (Hilliard & Parisi , 2020; Yücens & Üzer , 2018 ) It is found from the study of Arshad et al., (2018) that social network addiction is as harmful as smoking based on cognitive skills like concentration, increment of anx-iety and blood pressure based on a group compared to Bergen Addiction Scale (BAS) and blood pressure measurement. Social media addiction has pernicious results on cognitive skills as substance usage. (Arshad et al., 2018:38-46).Symptoms of alcohol, cigarette and drug addicts were seen in social media addicts. Dopamine critical for thinking, sleeping, mood, at-tention, motivation etc. is responsible for pleasure. (Macit, Macit, Güngör, 2018: 882-897).Retweets, likes, and shares affect the brain’s reward area as the same kind of chemical reaction created by drugs as stated by Harvard University. The reward area in the brain affects decisions and sensations. When the reward area is activated, neurons in the principal dopamine-pro-ducing areas produce more dopamine, causing to feel pleasure such as when getting a like. Gratification upon talking about oneself creates pleas-ant experiences, natural rewards such as sex or food. “People dedicate close to 40% of their time talking about themselves. This number reach-es 80% in social networks with the possibility of feedback and immediate rewards” creates dependence life style for social networks excessive use. (Hilliard &Parisi, 2020; Guedes et al., 2016: 43–48).It is found that talking about themselves like accomplishments as an intrinsic drive for self-ex-posure makes people happier and after getting positive social feedbacks for a photo or video, more dopamine is released, leading to a behaviour and social media habit. (Hilliard &Parisi, 2020). Furthermore, a social net-working addict can be associated with substance dependence such as drug addiction, meaning having both a behavioural and chemical addiction at the same time. (Guedes et al., 2016: 43–48).Drinking behaviour(alcohol dependence) was found as a risk factor for SNSs addiction. (Kuss&Grif-
Imran ASLAN216
fiths, 2011).Posts about drinking-related content meaning adhering to drinking norms are shared on SNSs. There is a moderate correlation be-tween alcohol-related SNS engagement and drinking alcohol, increased alcohol consumption with positive attitudes as a normative behaviour es-pecially among college students in the group in order to be approved by others. (Lee, Seok, and Sohn, 2019:397-403).Eight signs of drug addiction and social media addictions are shown in Table1 that there are many sim-ilarities such as not meeting responsibilities, health problems like anxiety, legal problems, withdrawal symptoms, spending too much time, ignoring activities and loss of self-control. Table 2: Comparison between drug addiction and social media addiction (Ayeni,
2019:19-42)
217Academic Studies in Social, Human and Administrative Sciences - II 217
Interactions on SNS can turn into behavioural addiction called as SNSs addiction causing social overload, envy and anxiety. Deficient self-regula-tion, neglect of personal life, cognitive preoccupation, mood modifying experiences, tolerance, concealment of addictive behaviours, and escap-ism are symptoms of that addiction with some abuse cases such as eupho-ria, withdrawal, relapse, and reinstatement.(Abbasi, 2019: 277-280)Social self-regulation is defined as “user’s ability to resist the automatic stimuli to use SNS generated from social situations (or actions) in both online and offline environments.” Users controlling their behaviour in the presence of social pressure from their social network show low addiction symptoms. (Osatuyi&2018). An addicted personality has a sense of loss of control, and a sense of failure known as self-distrust. (Yücens & Üzer, 2018: 313–318). Seeing the social media as the only place to be cared for, thinking they are not valuable when not using social media, not doing without social media and strong desire and necessity of using it are signs of addictive people. (Wang, Lee, Hua, 2015: 40–49).Avoidant and anxious attachment orientation, identity styles, impulsivity are common risk factors of using social media. Unsatisfied psychological needs can be met by social media. The fear of missing-out “the desire to stay continually connected with what others are doing” has direct effect problematic social media use with fear of being negatively evaluated and perception of low self-presentational skills. (Casale, Rugai, Fioravanti,2018: 83–87).In addition, when students feel lonely, they prefer to spend time on social media. During the day, the students stated that they were curious about what was happening on social media from the study of Aslan &Yaşar (2019: 346-355).
2.1 Dimensions Addiction
Cognitive-behavioural model using social media in unfamiliar envi-ronments, social skill model preferring virtual communication than face to face communication, and socio-cognitive model love the feeling of getting likes and comments are models leading to social media addiction. (Ofir& Alexander, 2020) Salience, tolerance or craving, mood modifica-tions, withdrawal,relapse or loss of control and conflict are six addiction symptoms, or six core components of social media addiction. (Andreassen, Pallesen, Griffiths, 2017: 287-293; Bechara, 2018: 84-88; Liu&Jianling, 2018: 55–59;Settanni et al., 2018: 165–170; Turel, Brevers). Neglecting of personal life, mental preoccupation, escapism, (for forgetting about the real problems of life), mood modifying experiences, tolerance and concealing the addictive behaviour are criteria that people fulfilling these six criteria are considered to be addicted.(Guedes et al., 2016: 43–48).Behavioural salience, withdrawal, relapse, and conflict core criteria of addiction have negative results on users, while cognitive salience, tolerance, and mood modification are related to high engagement peripheral criteria. (Andreas-
Imran ASLAN218
sen et al., 2013: 90–99).
If the answers to three or more questions below are “yes”, then one can be considered as addicted.
• Spending a lot of time thinking about social media or planning to use social media?
• Feeling urges to use social media more and more?
• Using social media to forget about personal problems?
• Often trying to reduce use of social media without success?
• Becoming restless or troubled if unable to use social media?
• Using social media so much that it has had a negative impact on job or studies? (Hilliard &Parisi, 2020).
Students declared that they spent a long time on things like games, chat, looking at photos, etc. It can be said that there is a medium level of dependency among students who state that their minds are busy when they do not enter social media. Using social media to escape from nega-tive thoughts in life, they often came out as though they wanted to cut the connection from what thought was happening in social media recently, and checked social media before doing a job, and they thought about entering social media when not connected to the internet. (Aslan &Yaşar, 2019: 346-355). Cooking to share on Instagram, sharing everything, knowing everything about people not known well, being unhappy due to comparing with social network people and being unhappy when one cannot reach their phone can make users worry about social media use. (Ayeni, 2019:19-42).
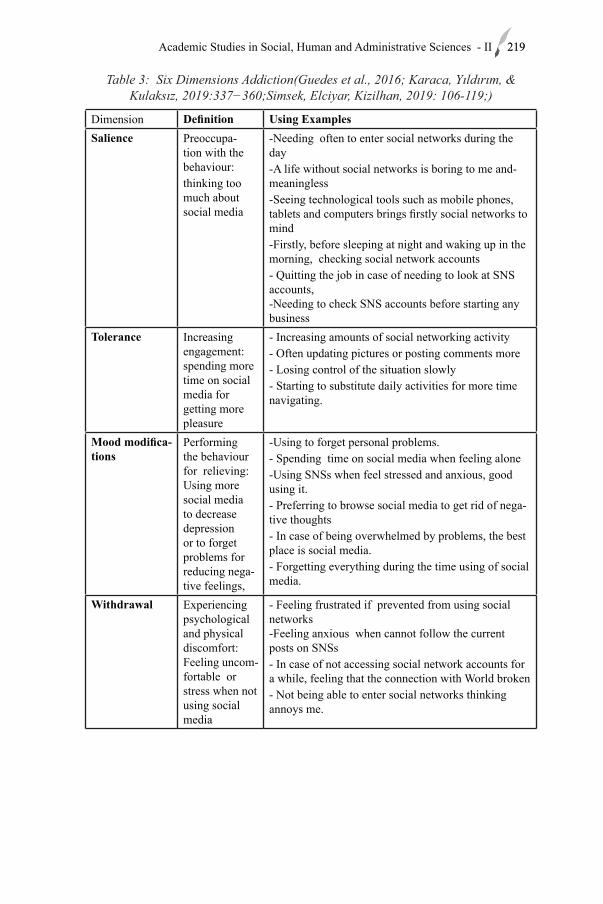
219Academic Studies in Social, Human and Administrative Sciences - II 219
Table 3: Six Dimensions Addiction(Guedes et al., 2016; Karaca, Yıldırım, & Kulaksız, 2019:337−360;Simsek, Elciyar, Kizilhan, 2019: 106-119;)
Dimension Definition Using ExamplesSalience Preoccupa-
tion with the behaviour:thinking too much about social media
-Needing often to enter social networks during the day-A life without social networks is boring to me and-meaningless-Seeing technological tools such as mobile phones, tablets and computers brings firstly social networks to mind-Firstly, before sleeping at night and waking up in the morning, checking social network accounts- Quitting the job in case of needing to look at SNS accounts, -Needing to check SNS accounts before starting any business
Tolerance Increasing engagement: spending more time on social media for getting more pleasure
- Increasing amounts of social networking activity- Often updating pictures or posting comments more - Losing control of the situation slowly- Starting to substitute daily activities for more time navigating.
Mood modifica-tions
Performing the behaviour for relieving: Using more social media to decrease depression or to forget problems for reducing nega-tive feelings,
-Using to forget personal problems.- Spending time on social media when feeling alone-Using SNSs when feel stressed and anxious, good using it.- Preferring to browse social media to get rid of nega-tive thoughts - In case of being overwhelmed by problems, the best place is social media.- Forgetting everything during the time using of social media.
Withdrawal Experiencing psychological and physical discomfort: Feeling uncom-fortable or stress when not using social media
- Feeling frustrated if prevented from using social networks -Feeling anxious when cannot follow the current posts on SNSs- In case of not accessing social network accounts for a while, feeling that the connection with World broken- Not being able to enter social networks thinking annoys me.
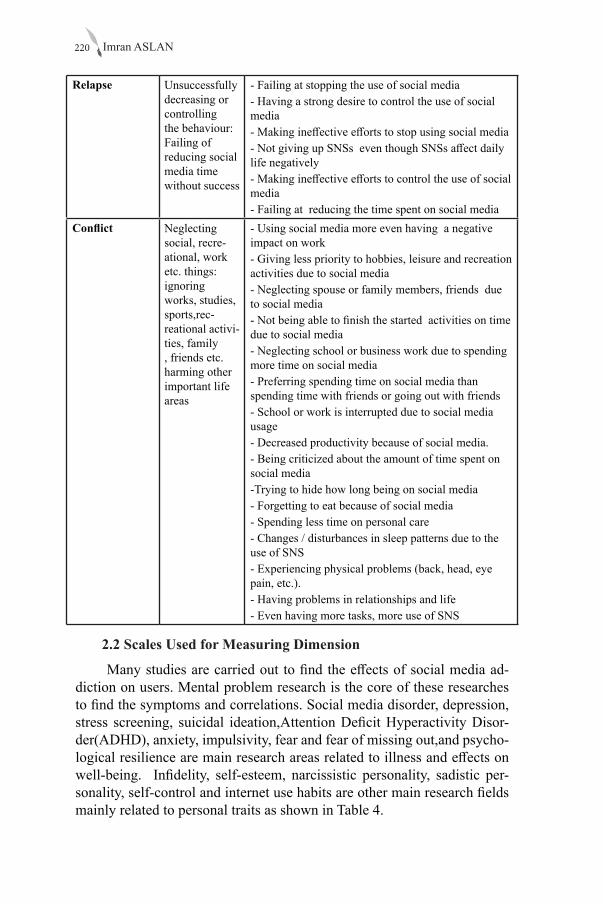
Imran ASLAN220
Relapse Unsuccessfully decreasing or controlling the behaviour: Failing of reducing social media time without success
- Failing at stopping the use of social media - Having a strong desire to control the use of social media- Making ineffective efforts to stop using social media- Not giving up SNSs even though SNSs affect daily life negatively- Making ineffective efforts to control the use of social media- Failing at reducing the time spent on social media
Conflict Neglecting social, recre-ational, work etc. things: ignoring works, studies, sports,rec-reational activi-ties, family , friends etc. harming other important life areas
- Using social media more even having a negative impact on work- Giving less priority to hobbies, leisure and recreation activities due to social media- Neglecting spouse or family members, friends due to social media- Not being able to finish the started activities on time due to social media - Neglecting school or business work due to spending more time on social media- Preferring spending time on social media than spending time with friends or going out with friends- School or work is interrupted due to social media usage- Decreased productivity because of social media.- Being criticized about the amount of time spent on social media-Trying to hide how long being on social media- Forgetting to eat because of social media- Spending less time on personal care- Changes / disturbances in sleep patterns due to the use of SNS- Experiencing physical problems (back, head, eye pain, etc.).- Having problems in relationships and life- Even having more tasks, more use of SNS
2.2 Scales Used for Measuring Dimension
Many studies are carried out to find the effects of social media ad-diction on users. Mental problem research is the core of these researches to find the symptoms and correlations. Social media disorder, depression, stress screening, suicidal ideation,Attention Deficit Hyperactivity Disor-der(ADHD), anxiety, impulsivity, fear and fear of missing out,and psycho-logical resilience are main research areas related to illness and effects on well-being. Infidelity, self-esteem, narcissistic personality, sadistic per-sonality, self-control and internet use habits are other main research fields mainly related to personal traits as shown in Table 4.
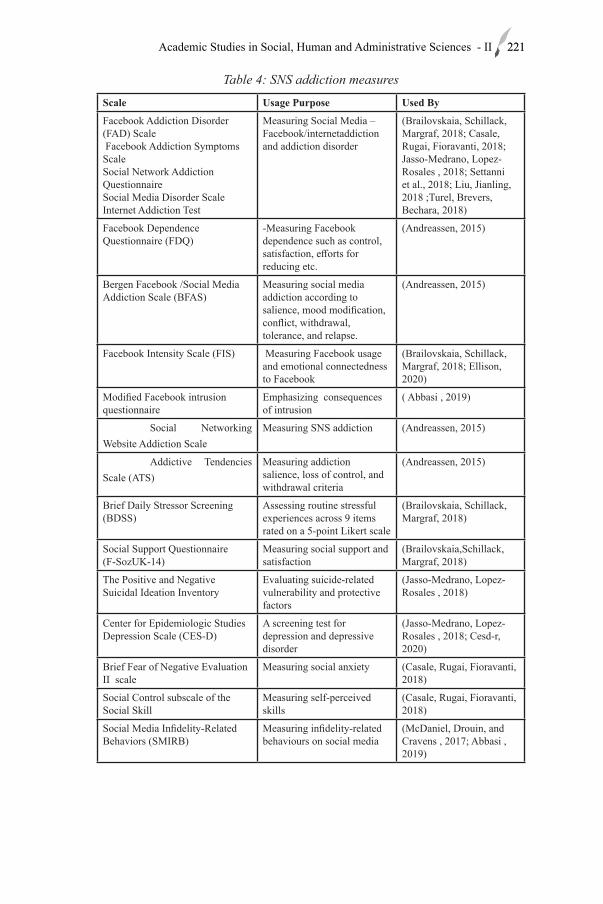
221Academic Studies in Social, Human and Administrative Sciences - II 221
Table 4: SNS addiction measures
Scale Usage Purpose Used By
Facebook Addiction Disorder (FAD) Scale Facebook Addiction Symptoms ScaleSocial Network Addiction QuestionnaireSocial Media Disorder ScaleInternet Addiction Test
Measuring Social Media –Facebook/internetaddiction and addiction disorder
(Brailovskaia, Schillack, Margraf, 2018; Casale, Rugai, Fioravanti, 2018; Jasso-Medrano, Lopez-Rosales , 2018; Settanni et al., 2018; Liu, Jianling, 2018 ;Turel, Brevers, Bechara, 2018)
Facebook Dependence Questionnaire (FDQ)
-Measuring Facebook dependence such as control, satisfaction, efforts for reducing etc.
(Andreassen, 2015)
Bergen Facebook /Social Media Addiction Scale (BFAS)
Measuring social media addiction according to salience, mood modification, conflict, withdrawal, tolerance, and relapse.
(Andreassen, 2015)
Facebook Intensity Scale (FIS) Measuring Facebook usage and emotional connectedness to Facebook
(Brailovskaia, Schillack, Margraf, 2018; Ellison, 2020)
Modified Facebook intrusion questionnaire
Emphasizing consequences of intrusion
( Abbasi , 2019)
Social Networking Website Addiction Scale
Measuring SNS addiction (Andreassen, 2015)
Addictive Tendencies Scale (ATS)
Measuring addiction salience, loss of control, and withdrawal criteria
(Andreassen, 2015)
Brief Daily Stressor Screening (BDSS)
Assessing routine stressful experiences across 9 items rated on a 5-point Likert scale
(Brailovskaia, Schillack, Margraf, 2018)
Social Support Questionnaire (F-SozUK-14)
Measuring social support and satisfaction
(Brailovskaia,Schillack, Margraf, 2018)
The Positive and Negative Suicidal Ideation Inventory
Evaluating suicide-related vulnerability and protective factors
(Jasso-Medrano, Lopez-Rosales , 2018)
Center for Epidemiologic Studies Depression Scale (CES-D)
A screening test for depression and depressive disorder
(Jasso-Medrano, Lopez-Rosales , 2018; Cesd-r, 2020)
Brief Fear of Negative Evaluation II scale
Measuring social anxiety (Casale, Rugai, Fioravanti, 2018)
Social Control subscale of the Social Skill
Measuring self-perceived skills
(Casale, Rugai, Fioravanti, 2018)
Social Media Infidelity-Related Behaviors (SMIRB)
Measuring infidelity-related behaviours on social media
(McDaniel, Drouin, and Cravens , 2017; Abbasi , 2019)
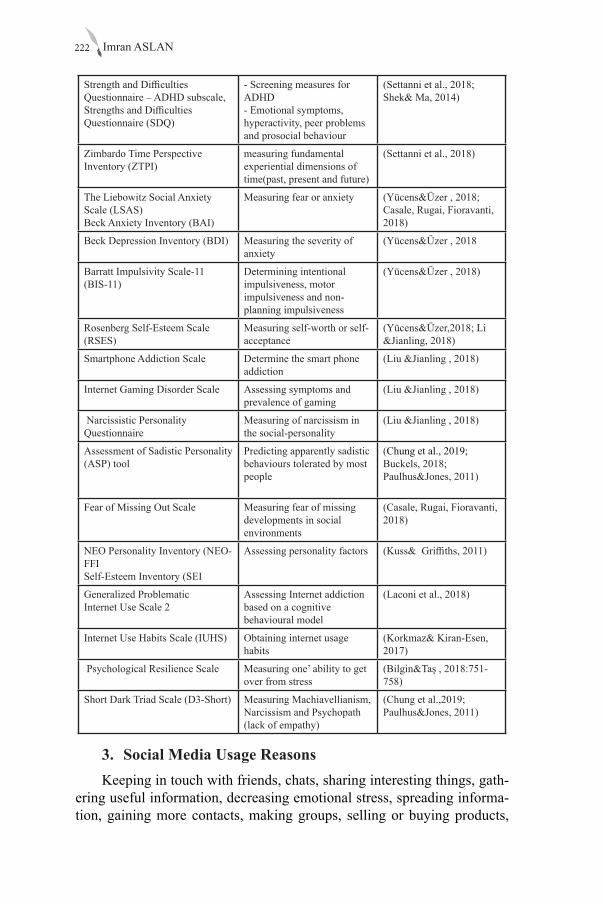
Imran ASLAN222
Strength and Difficulties Questionnaire – ADHD subscale, Strengths and Difficulties Questionnaire (SDQ)
- Screening measures for ADHD- Emotional symptoms, hyperactivity, peer problems and prosocial behaviour
(Settanni et al., 2018; Shek& Ma, 2014)
Zimbardo Time Perspective Inventory (ZTPI)
measuring fundamental experiential dimensions of time(past, present and future)
(Settanni et al., 2018)
The Liebowitz Social Anxiety Scale (LSAS) Beck Anxiety Inventory (BAI)
Measuring fear or anxiety (Yücens&Üzer , 2018; Casale, Rugai, Fioravanti, 2018)
Beck Depression Inventory (BDI) Measuring the severity of anxiety
(Yücens&Üzer , 2018
Barratt Impulsivity Scale-11 (BIS-11)
Determining intentional impulsiveness, motor impulsiveness and non-planning impulsiveness
(Yücens&Üzer , 2018)
Rosenberg Self-Esteem Scale (RSES)
Measuring self-worth or self-acceptance
(Yücens&Üzer,2018; Li &Jianling, 2018)
Smartphone Addiction Scale Determine the smart phone addiction
(Liu &Jianling , 2018)
Internet Gaming Disorder Scale Assessing symptoms and prevalence of gaming
(Liu &Jianling , 2018)
Narcissistic Personality Questionnaire
Measuring of narcissism in the social-personality
(Liu &Jianling , 2018)
Assessment of Sadistic Personality (ASP) tool
Predicting apparently sadistic behaviours tolerated by most people
(Chung et al., 2019; Buckels, 2018; Paulhus&Jones, 2011)
Fear of Missing Out Scale Measuring fear of missing developments in social environments
(Casale, Rugai, Fioravanti, 2018)
NEO Personality Inventory (NEO-FFISelf-Esteem Inventory (SEI
Assessing personality factors (Kuss& Griffiths, 2011)
Generalized Problematic Internet Use Scale 2
Assessing Internet addiction based on a cognitive behavioural model
(Laconi et al., 2018)
Internet Use Habits Scale (IUHS) Obtaining internet usage habits
(Korkmaz& Kiran-Esen, 2017)
Psychological Resilience Scale Measuring one’ ability to get over from stress
(Bilgin&Taş , 2018:751-758)
Short Dark Triad Scale (D3-Short) Measuring Machiavellianism, Narcissism and Psychopath (lack of empathy)
(Chung et al.,2019; Paulhus&Jones, 2011)
3. Social Media Usage Reasons Keeping in touch with friends, chats, sharing interesting things, gath-
ering useful information, decreasing emotional stress, spreading informa-tion, gaining more contacts, making groups, selling or buying products,
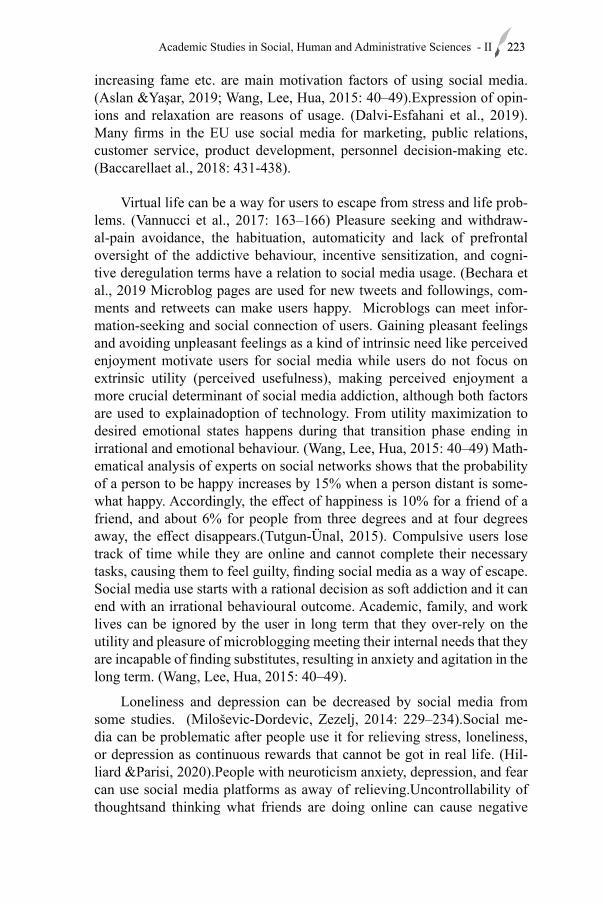
223Academic Studies in Social, Human and Administrative Sciences - II 223
increasing fame etc. are main motivation factors of using social media. (Aslan &Yaşar, 2019; Wang, Lee, Hua, 2015: 40–49).Expression of opin-ions and relaxation are reasons of usage. (Dalvi-Esfahani et al., 2019). Many firms in the EU use social media for marketing, public relations, customer service, product development, personnel decision-making etc. (Baccarellaet al., 2018: 431-438).
Virtual life can be a way for users to escape from stress and life prob-lems. (Vannucci et al., 2017: 163–166) Pleasure seeking and withdraw-al-pain avoidance, the habituation, automaticity and lack of prefrontal oversight of the addictive behaviour, incentive sensitization, and cogni-tive deregulation terms have a relation to social media usage. (Bechara et al., 2019 Microblog pages are used for new tweets and followings, com-ments and retweets can make users happy. Microblogs can meet infor-mation-seeking and social connection of users. Gaining pleasant feelings and avoiding unpleasant feelings as a kind of intrinsic need like perceived enjoyment motivate users for social media while users do not focus on extrinsic utility (perceived usefulness), making perceived enjoyment a more crucial determinant of social media addiction, although both factors are used to explainadoption of technology. From utility maximization to desired emotional states happens during that transition phase ending in irrational and emotional behaviour. (Wang, Lee, Hua, 2015: 40–49) Math-ematical analysis of experts on social networks shows that the probability of a person to be happy increases by 15% when a person distant is some-what happy. Accordingly, the effect of happiness is 10% for a friend of a friend, and about 6% for people from three degrees and at four degrees away, the effect disappears.(Tutgun-Ünal, 2015). Compulsive users lose track of time while they are online and cannot complete their necessary tasks, causing them to feel guilty, finding social media as a way of escape. Social media use starts with a rational decision as soft addiction and it can end with an irrational behavioural outcome. Academic, family, and work lives can be ignored by the user in long term that they over-rely on the utility and pleasure of microblogging meeting their internal needs that they are incapable of finding substitutes, resulting in anxiety and agitation in the long term. (Wang, Lee, Hua, 2015: 40–49).
Loneliness and depression can be decreased by social media from some studies. (Miloševic-Dordevic, Zezelj, 2014: 229–234).Social me-dia can be problematic after people use it for relieving stress, loneliness, or depression as continuous rewards that cannot be got in real life. (Hil-liard &Parisi, 2020).People with neuroticism anxiety, depression, and fear can use social media platforms as away of relieving.Uncontrollability of thoughtsand thinking what friends are doing online can cause negative
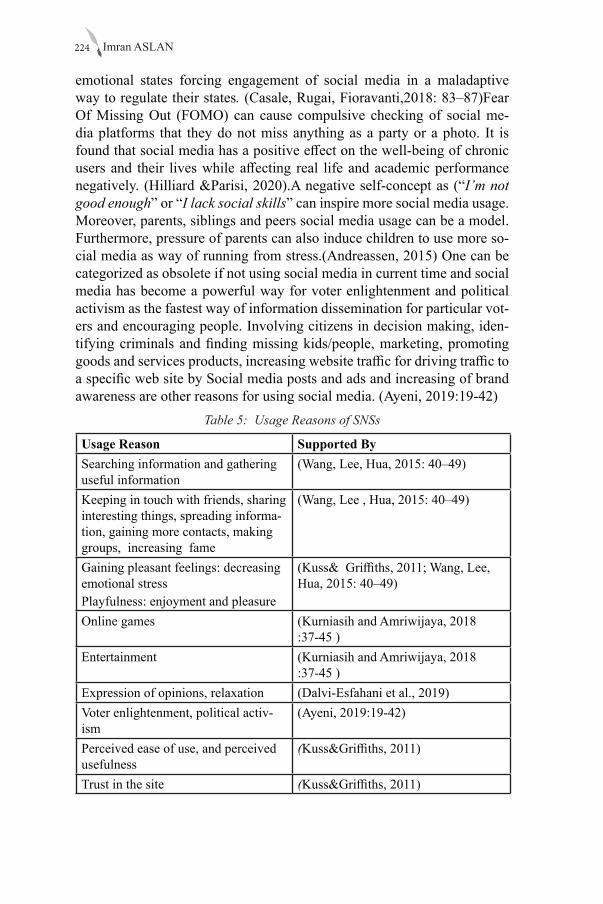
Imran ASLAN224
emotional states forcing engagement of social media in a maladaptive way to regulate their states. (Casale, Rugai, Fioravanti,2018: 83–87)Fear Of Missing Out (FOMO) can cause compulsive checking of social me-dia platforms that they do not miss anything as a party or a photo. It is found that social media has a positive effect on the well-being of chronic users and their lives while affecting real life and academic performance negatively. (Hilliard &Parisi, 2020).A negative self-concept as (“I’m not good enough” or “I lack social skills” can inspire more social media usage. Moreover, parents, siblings and peers social media usage can be a model. Furthermore, pressure of parents can also induce children to use more so-cial media as way of running from stress.(Andreassen, 2015) One can be categorized as obsolete if not using social media in current time and social media has become a powerful way for voter enlightenment and political activism as the fastest way of information dissemination for particular vot-ers and encouraging people. Involving citizens in decision making, iden-tifying criminals and finding missing kids/people, marketing, promoting goods and services products, increasing website traffic for driving traffic to a specific web site by Social media posts and ads and increasing of brand awareness are other reasons for using social media. (Ayeni, 2019:19-42)
Table 5: Usage Reasons of SNSs
Usage Reason Supported By Searching information and gathering useful information
(Wang, Lee, Hua, 2015: 40–49)
Keeping in touch with friends, sharing interesting things, spreading informa-tion, gaining more contacts, making groups, increasing fame
(Wang, Lee , Hua, 2015: 40–49)
Gaining pleasant feelings: decreasing emotional stress Playfulness: enjoyment and pleasure
(Kuss& Griffiths, 2011; Wang, Lee, Hua, 2015: 40–49)
Online games (Kurniasih and Amriwijaya, 2018 :37-45 )
Entertainment (Kurniasih and Amriwijaya, 2018 :37-45 )
Expression of opinions, relaxation (Dalvi-Esfahani et al., 2019)Voter enlightenment, political activ-ism
(Ayeni, 2019:19-42)
Perceived ease of use, and perceived usefulness
(Kuss&Griffiths, 2011)
Trust in the site (Kuss&Griffiths, 2011)
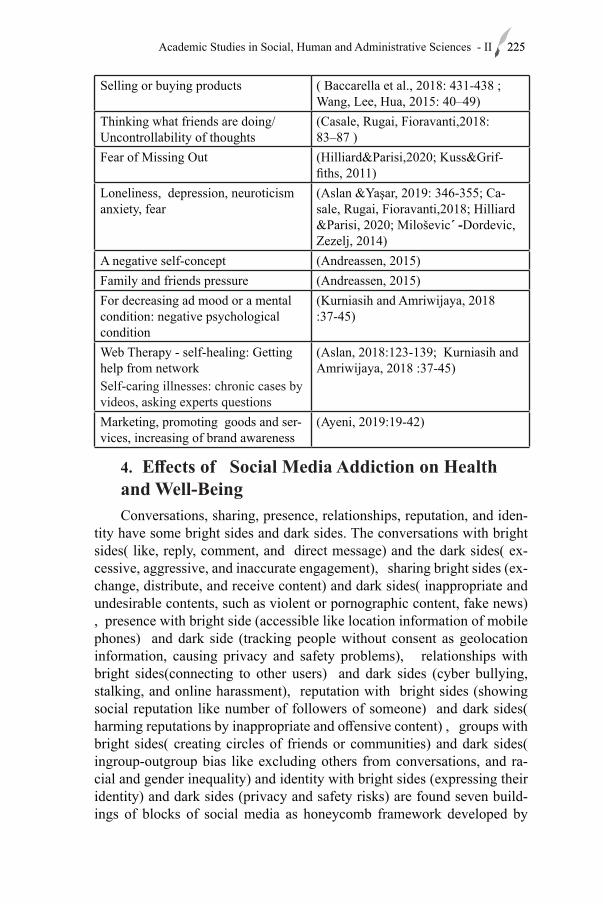
225Academic Studies in Social, Human and Administrative Sciences - II 225
Selling or buying products ( Baccarella et al., 2018: 431-438 ; Wang, Lee, Hua, 2015: 40–49)
Thinking what friends are doing/ Uncontrollability of thoughts
(Casale, Rugai, Fioravanti,2018: 83–87 )
Fear of Missing Out (Hilliard&Parisi,2020; Kuss&Grif-fiths, 2011)
Loneliness, depression, neuroticism anxiety, fear
(Aslan &Yaşar, 2019: 346-355; Ca-sale, Rugai, Fioravanti,2018; Hilliard &Parisi, 2020; Miloševic´ -Dordevic, Zezelj, 2014)
A negative self-concept (Andreassen, 2015)Family and friends pressure (Andreassen, 2015)For decreasing ad mood or a mental condition: negative psychological condition
(Kurniasih and Amriwijaya, 2018 :37-45)
Web Therapy - self-healing: Getting help from networkSelf-caring illnesses: chronic cases by videos, asking experts questions
(Aslan, 2018:123-139; Kurniasih and Amriwijaya, 2018 :37-45)
Marketing, promoting goods and ser-vices, increasing of brand awareness
(Ayeni, 2019:19-42)
4. Effects of Social Media Addiction on Health and Well-BeingConversations, sharing, presence, relationships, reputation, and iden-
tity have some bright sides and dark sides. The conversations with bright sides( like, reply, comment, and direct message) and the dark sides( ex-cessive, aggressive, and inaccurate engagement), sharing bright sides (ex-change, distribute, and receive content) and dark sides( inappropriate and undesirable contents, such as violent or pornographic content, fake news) , presence with bright side (accessible like location information of mobile phones) and dark side (tracking people without consent as geolocation information, causing privacy and safety problems), relationships with bright sides(connecting to other users) and dark sides (cyber bullying, stalking, and online harassment), reputation with bright sides (showing social reputation like number of followers of someone) and dark sides( harming reputations by inappropriate and offensive content) , groups with bright sides( creating circles of friends or communities) and dark sides( ingroup-outgroup bias like excluding others from conversations, and ra-cial and gender inequality) and identity with bright sides (expressing their identity) and dark sides (privacy and safety risks) are found seven build-ings of blocks of social media as honeycomb framework developed by
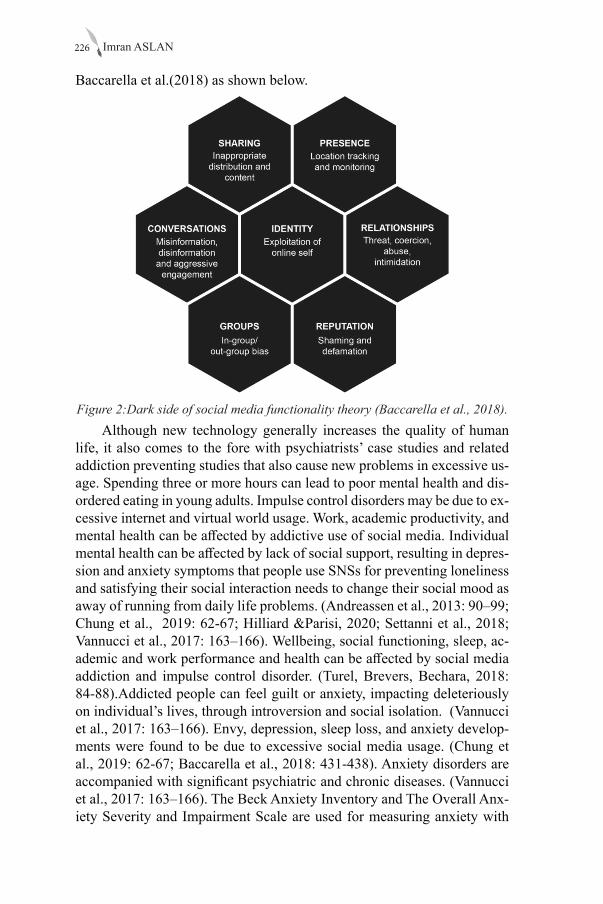
Imran ASLAN226
Baccarella et al.(2018) as shown below.
Figure 2:Dark side of social media functionality theory (Baccarella et al., 2018).Although new technology generally increases the quality of human
life, it also comes to the fore with psychiatrists’ case studies and related addiction preventing studies that also cause new problems in excessive us-age. Spending three or more hours can lead to poor mental health and dis-ordered eating in young adults. Impulse control disorders may be due to ex-cessive internet and virtual world usage. Work, academic productivity, and mental health can be affected by addictive use of social media. Individual mental health can be affected by lack of social support, resulting in depres-sion and anxiety symptoms that people use SNSs for preventing loneliness and satisfying their social interaction needs to change their social mood as away of running from daily life problems. (Andreassen et al., 2013: 90–99; Chung et al., 2019: 62-67; Hilliard &Parisi, 2020; Settanni et al., 2018; Vannucci et al., 2017: 163–166). Wellbeing, social functioning, sleep, ac-ademic and work performance and health can be affected by social media addiction and impulse control disorder. (Turel, Brevers, Bechara, 2018: 84-88).Addicted people can feel guilt or anxiety, impacting deleteriously on individual’s lives, through introversion and social isolation. (Vannucci et al., 2017: 163–166). Envy, depression, sleep loss, and anxiety develop-ments were found to be due to excessive social media usage. (Chung et al., 2019: 62-67; Baccarella et al., 2018: 431-438). Anxiety disorders are accompanied with significant psychiatric and chronic diseases. (Vannucci et al., 2017: 163–166). The Beck Anxiety Inventory and The Overall Anx-iety Severity and Impairment Scale are used for measuring anxiety with
227Academic Studies in Social, Human and Administrative Sciences - II 227
bothering home, school and working life. It was found that about 17% of U.S. undergraduate participants using Facebook have anxiety problems, meaning higher daily social media use resulting in greater dispositional anxiety symptoms with depressive symptoms. Validating their self-worth or decreasing intolerable worry may be done by posting more on social media sites in order to get more ‘likes’. Users may use social media sites for avoiding real-world stressors by cyber-stalking harassing or frightening someone or posting about their problems, as a maladaptive coping strategy. (Vannucci et al., 2017: 163–166) Furthermore, Facebook have caused peo-ple to be dismissed from work with excessive usage for at least five hours a day instead of working. (Kuss&Griffiths, 2011).
The term continued use is used for users still using social media even knowing negative consequences while compulsive use is defined as using social media without awareness of the negative outcomes. (Chung et al., 2019: 62-67) Impulse control disorders may be due to excessive internet and virtual world usage. Virtual life can be a way for users to escape. (Vannucci et al., 2017: 163–166)Problematic internet use is predicted by past negative and present fatalistic usage that users try to use more to avoid thinking about personal problems.(Settanni et al., 2018) Excessive gambling or pornogra-phy viewing are problematicactions of addicts. (Vannucci et al., 2017: 163–166) Pathological internet use was firstly defined by Young (1996) by evalu-ation of more than sixty hours internet usage weekly by users. Lonelier, less satisfied with life, depressive moods and lower self-esteem are properties of compulsive internet users. (Yücens&Üzer, 2018: 313–318).Problematic use for children and young adults can take them away from the real world like unrealistic beauty standards through social networking sites causing body image concerns. Risky social media challenges and engaging in negative behaviour can be another danger as they want to get more likes.(Hilliard &Parisi, 2020). Intensive playing of online games is another serious problem of SNSs. (Andreassen et al., 2013: 90–99)
Spending large amount of time on Facebook, always thinking about social platforms events, and having psychological unease when not using social media have more tendency to Facebook Addiction Disorder (FAD). People may not be able to complete their offline dutiesdue to excessive us-age which causes extra stress.(Brailovskaia et al., 2019:167-174)FAD has positive correlation with depression, anxiety symptoms and insomnia. The use of text messages and instant messaging services, use of mobile phones and use of mobile phones for users have higher scores in the FAD survey. Intensive Facebook use has a “dark side” that user becomes dependent on SNSs creating development of an emotional bond to these sites, causing to an obsessive need to permanently stay online. (Andreassen et al., 2013: 90–99). Higher stress associated with higher tendencies of Facebook ad-
Imran ASLAN228
diction. It is concluded that offline and online social support cannot be equally categorized. With hope of finding relief, people not having enough sufficient social support in the real world use social media. Having more social media friends means that users may get more positive comments such as likes for photos and congratulations for achievements, creating a psychological dependence on the online platforms with fear of having less support when leaving Facebook supported by the study of Brailovskaia, Schillack, Margraf (2018: 450–456). Admiration, self-presentation, per-sonality traits are also to be considered to find real results behind FAD.
Decision Making Trial and Evaluation Laboratory (DEMATEL) was used by Dalvi-Esfahani (2019) to determine predictors of social media addiction. Openness to experience from personality dimension, loneli-ness from psychosocial, and depression from comorbid are three most im-portant dimensions explaining social media addiction. (Dalvi-Esfahani et al., 2019).Internet addiction relationship with social anxiety, impulsivity, self-esteem, and depression including 392 undergraduate medical students in Afyon Kocatepe University was measured by Yücens & Üzer (2018) by the Internet Addiction Test (IAT) measuring psychological dependence. The study results showed that students with higher internet addiction ex-hibit higher social anxiety, lower self-esteem and were more depressed when compared with users not having internet addiction (Yücens & Üzer, 2018: 313–318).Adult attention deficit hyperactivity disorder, depression, schizophrenia and obsessive-compulsive disorder can accompany internet addiction as psychiatric comorbidity. Depression with internet addiction was found the most common comorbid disorder as well as a positive cor-relation with depression and anxiety scores. It was found that after treat-ment of internet addiction, aggressive behaviours had decreased among users. Internet addicted students can be on the internet instead of sleeping or engaging with others, or listening in class. More socially avoidant peo-ple have higher Internet Addiction Test. (Yücens & Üzer, 2018: 313-318).
Attention Deficit Hyperactivity Disorder (ADHD) shows symptoms of lack of attention and hyperactivity affecting social life, work and school contexts and has a high relationship with anxiety and mood disorders, and obsessive-compulsive disorder. In many studies, high correlations were found between ADHD and internet-related addiction in literature and there are signs of addiction to video gaming with ADHD patients who have a more hedonistic, fatalistic view of the present, are less optimistic and less future-oriented more caring about the present and have negative thoughts about the past. Present hedonistic orientation is defined as a pursuit of plea-sure in the present, and past negative orientation a negative vision of the past because of current traumatic situations, future orientation an orienta-tion towards the future present fatalistic orientation that the future is deter-
229Academic Studies in Social, Human and Administrative Sciences - II 229
mined and will not be changed are other orientations which explain social media addiction in the study of Settanni et al.(2018). Addictive Facebook use, past negative and present fatalistic orientation, and negatively predict-ed future orientation are positively correlated to ADHD symptoms related to a worsening in the perception of past and present experiences from that study and hence, addictive Facebook use can be a significant positive pre-dictor of ADHD symptoms from regression analysis. Students show high-er ADHD symptoms with high usage Facebook addiction, accompanying with negative past personal experiences, more fatalistic and not much fu-ture oriented.(Settanni et al., 2018).
Primary romantic relationships can be negatively affected, leading to the quality of the primary romantic relationship, physical and emotional in-fidelity, relationship dissatisfaction, romantic disengagement, and a higher risk of divorce. Social media users flirt with each other rather than meeting face to face in which most intimate thoughts and desires are shared, caus-ing conflict, loss of trust, and breakup. Viewing pornography, emotional disclosure, cybersex, emotional involvement, hot chatting, and online dat-ing are problematic SNSs behaviour. The time spent online can be spent with other significant people or work. (Abbasi, 2019: 277-280).
Suicide is explained as thought, planning or desire for death. Social media addiction and mobile device usage can cause depression and suicid-al ideation related to depression and emotional stress among university stu-dents. There is a relationship between suicidal ideation and the problematic use of internet. Cyber-victimization can be a cause of suicide. Social media may be used to decrease the stress for preventing suicidal ideation if used properly. Young people presenting suicidal ideation are risk groups using social media, and they use social media as a way of help.A study was carried out by Jasso-Medrano &Lopez-Rosales (2018) that in the last two weeks, 36.1% of students have had the idea of suicide. Suicidal ideation is related more with addiction behaviour rather than excessive usage. Just reducing online time may not be effective to reduce depression since there are relationships between hours of social media use and the frequency of mobile and addictive behaviour. (Jasso-Medrano& Lopez-Rosales, 2018: 183-191).Users’ abuse and manipulations, cyber-stalking and cyberbully-ing are negative sides of virtual worlds. Undesirable feedback known as cyberbullying or negative social comparisons as others having happier and better lives can cause stress on social media users. (Vannucci et al., 2017: 163–166). Online bullying, cyberbullying, expliciting images of them without their consent, name-calling, rumor-spreading, and harassment among adolescents can occur more, resulting in high suicide rates. (Hil-liard &Parisi, 2020). Curated content – advertisements as “a great job”, “excellent partner”, or “beautiful home” seen on social media can cause
Imran ASLAN230
jealousy, depression, or even feel suicidal because their life is not good as others.(Hilliard &Parisi, 2020).Cyber-bullying, sexting, and disseminating information about self-harm techniques and pro-suicide can lead to suicide among adolescents. Harmful messages, pictures, and videos about target-ed person can be threat and cause anger. It is found that female youths are perpetrators that for example, one was blackmailed as a cyberbullying action after the lady showed her breasts on a live webcam to an unknown person and later her body screenshots were shown on social media lead to the suicide of that lady after many classmates saw her photos. Cyberbully-ing by recording private lives secretly and sharing this content online was another reason for suicide. Sharing private photos and sexting information can cause to shame, humiliation, depression, and harassment. Abusive re-lationships, breakups, and suicidal ideation can be due to tracking ex-part-ners’ new partnerships on social media. Self-harm techniques as self-harm videos by some people showing suicidal intentions on social media and pro-suicide content can also encourage young people to commit suicide. (Intahchomphoo, 2019).
Homicide rate dividing the number of reported homicides by the total population has increased around the World and it has been researched whether conflicts, crimes, violence and homicide have any relationship with social media or not. Social media can cause or mitigate homicide for different purposes and in different ways. Positive and negative uses be-tween Facebook and homicide can be seen from past studies. In the study of Asongua at al.(2019), access to weapons, violent crime, conflict inten-sity, political instability and security officers and police control are vari-ables for measuring crimes, conflicts and homicide. Negative Facebook penetration and homicide from a cross section of 148 countries for the year 2012 data can be explained by solving conflicts and better informed peo-ple. However, these results can change across income levels and regions of the world. Adoption of common polices for countries with similar char-acteristics can help these countries to adopt a legal framework. Deleting unhealthy content from social media and improving tracking system for identifying information causingthe occurrence of homicide can be bene-ficial for decreasing homicide. (Asongua, Udujib, Okolo-Obasic,2019). Furthermore, it was found from the study of Ereviket al.(2018) that 96.7% of users were exposed to alcohol-related posts with mainly positive posts rather than focusing on negative sides of alcohol use. (Erevik et al., 2018: 131–137).
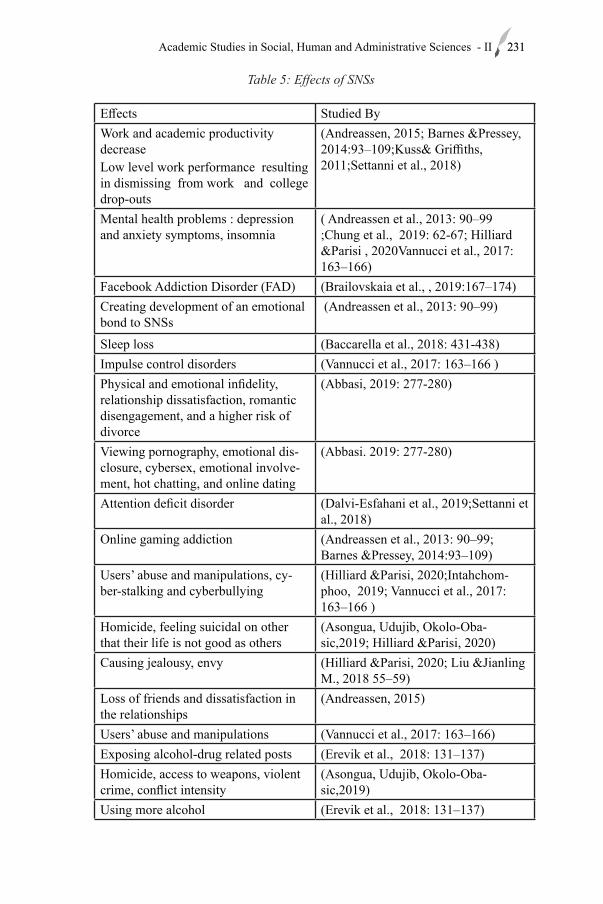
231Academic Studies in Social, Human and Administrative Sciences - II 231
Table 5: Effects of SNSs
Effects Studied ByWork and academic productivity decrease Low level work performance resulting in dismissing from work and college drop-outs
(Andreassen, 2015; Barnes &Pressey, 2014:93–109;Kuss& Griffiths, 2011;Settanni et al., 2018)
Mental health problems : depression and anxiety symptoms, insomnia
( Andreassen et al., 2013: 90–99 ;Chung et al., 2019: 62-67; Hilliard &Parisi , 2020Vannucci et al., 2017: 163–166)
Facebook Addiction Disorder (FAD) (Brailovskaia et al., , 2019:167–174)Creating development of an emotional bond to SNSs
(Andreassen et al., 2013: 90–99)
Sleep loss (Baccarella et al., 2018: 431-438)Impulse control disorders (Vannucci et al., 2017: 163–166 )Physical and emotional infidelity, relationship dissatisfaction, romantic disengagement, and a higher risk of divorce
(Abbasi, 2019: 277-280)
Viewing pornography, emotional dis-closure, cybersex, emotional involve-ment, hot chatting, and online dating
(Abbasi. 2019: 277-280)
Attention deficit disorder (Dalvi-Esfahani et al., 2019;Settanni et al., 2018)
Online gaming addiction (Andreassen et al., 2013: 90–99; Barnes &Pressey, 2014:93–109)
Users’ abuse and manipulations, cy-ber-stalking and cyberbullying
(Hilliard &Parisi, 2020;Intahchom-phoo, 2019; Vannucci et al., 2017: 163–166 )
Homicide, feeling suicidal on other that their life is not good as others
(Asongua, Udujib, Okolo-Oba-sic,2019; Hilliard &Parisi, 2020)
Causing jealousy, envy (Hilliard &Parisi, 2020; Liu &Jianling M., 2018 55–59)
Loss of friends and dissatisfaction in the relationships
(Andreassen, 2015)
Users’ abuse and manipulations (Vannucci et al., 2017: 163–166)Exposing alcohol-drug related posts (Erevik et al., 2018: 131–137) Homicide, access to weapons, violent crime, conflict intensity
(Asongua, Udujib, Okolo-Oba-sic,2019)
Using more alcohol (Erevik et al., 2018: 131–137)
Imran ASLAN232
5. Social Media Users’ Traits and Predictors of Social Media Addiction
The dark tetrad personality traits (psychopath, narcissism, machiavel-lianism, sadism), impulsivity, and social media addiction are measured in the study of (Chung et al., 2019: 62-67) that psychopath(lack of empathy): impulsive and reckless and engaging in unsolicited internet pornography, narcissism: need for approval and admiration, machiavellianism: employ-ing more self-presentation tactics, and sadism: pleasure from others’ suf-fering can cause pathological online use. Individuals having psychopath, narcissism, and machiavellianism properties have increased substance use and problematic gambling behaviour and also cocaine-addicted individ-uals have a higher machiavellianism characteristic. Bergen Social Media Addiction Scale, the Short Dark Triad, and the Assessment of sadistic personality are used in that study that average daily screen-time and psy-chopath have a positive correlation with social media addiction. Females spending more time over social media have higher levels of addiction on the psychopath scale of that study. It is also found that there is a positive correlation between spending time looking at a computer screen and inter-net addiction. From the dark tetrad personality, only psychopath is related to impulsivity, lack of self-control and having a lack of empathy and irre-sponsibility that parasitic lifestyle traits have a positive relationship with social media addiction. (Chung et al., 2019: 62-67). Trait impulsivity can be used for explaining non-substance-dependent addictive behaviours like pathological gambling, overeating and online gaming. It was found that psychopath and narcissism have positive correlation with impulsivity apart from machiavellianism.(Chung et al.,2019: 62-67)
Personality traits, demographics and needs can have effects on inter-net usage. Personality traits and trans-diagnostic constructs of cognitive distortions can also be the cause of internet addiction, social anxiety and depression. (Yücens& Ahmet Üzer, 2018: 313–318). Fear of missing out; compulsive use behaviour abnormality in controlling; self-esteem depend-ing on reflected appraisals, social comparisons, and self-attributions; st-tention deficit disorder; impulsivity without forethought; personality traits as agreeableness, conscientiousness, and neuroticism; narcissism; life sat-isfaction that lower level of life satisfaction means more internet addiction; depression and empathy that low level of empathy leads to internet and smartphone use disorders are predictors of social media usage. (Dalvi-Es-fahani et al., 2019) Introvert, low self-esteem and anxiety high on neurot-icism are risk groups of social media addiction.(Miloševic-Dordevic,Ze-zelj,2014) Impulsivity and low self-esteem as personal traits, loneliness, depression, and specific motives like gambling are main determinants of
233Academic Studies in Social, Human and Administrative Sciences - II 233
internet addiction. (Brand et al., 2016) It is found that less self-efficient, with lower self-esteem and more introverted have more tendency of social media addiction. (Alwagait, Shahzad, Alim, 2015).Online communication reduces social anxiety in short term and increases confidence to communi-cate with others. Internet is a good platform for people having low self-es-teem, low motivation, fear of rejection, and need for approval as a com-pensation of some deficiencies. (Yücens& Ahmet Üzer, 2018: 313–318).People with low self-esteem find social media platform as a safer place to express themselves than high self-esteem people. (Andreassen, Pallesen, Griffiths, 2017: 287-293; Liu & Jianling, 2018).Low self-esteem or high interaction anxiousness is defined as feeling worry and being anxious and in social encounters users find social media as a relief, and affordable means point. It was found that compulsive social media in which self-es-teem has a negative effect and interaction anxiousness has a positive significant effect with a negative effect on problematic learning outcomes among university students. Thoughtful engagement with social media is necessary for students with more self-awareness to prevent problemat-ic usage.(Aladwani&Almarzouq, 2016: 575-581) Lack of confidence in their strategic self-presentation can also be another reason of using SNSs. (Casale, Rugai, Fioravanti,2018: 83–87 )It was found that there is a nega-tive correlation between social media addiction and smartphone addiction, pathological internet use, and narcissism while negative correlation with self-esteem. (Chung et al., 2019: 62-67)Moreover, it was found from that study that self-esteem and narcissism are correlated with social media ad-diction. (Chung et al., 2019: 62-67).
Narcissistic people have low self-esteem and they have high problem-atic use of social media. (Liu &Jianling, 2018). Self-importance, fantasies of unlimited success, feeling special and unique, lack of empathy, envy, and arrogance are characteristics of narcissism. (Andreassen, Pallesen, Griffiths, 2017: 287-293).Vulnerable narcissism is explained as hypersen-sitivity in the opinions of others, an intense desire for approval, and defen-siveness. Sense of entitlement, grandiose fantasies and admiration desires are characteristics of narcissist users. Grandiose narcissism explained with grandiosity, aggression, and dominance can be found in problematic social media use. Facebook may be a better platform for narcissists that users can show themselves for self-promotion with status updated and photos while Twitter is restricted to 140 characters which doesn’t make it a good way for self-promotion.The presence of a self-reinforcement with more selfies may increase the level of n narcissism over time. (Casale&Banchi,2020) The Bergen Social Media Addiction Scale (BSMAS), the Narcissistic Per-sonality Inventory-16, and the Rosenberg Self-Esteem Scale are used to measure the relationship between narcissism, self-esteem and social media
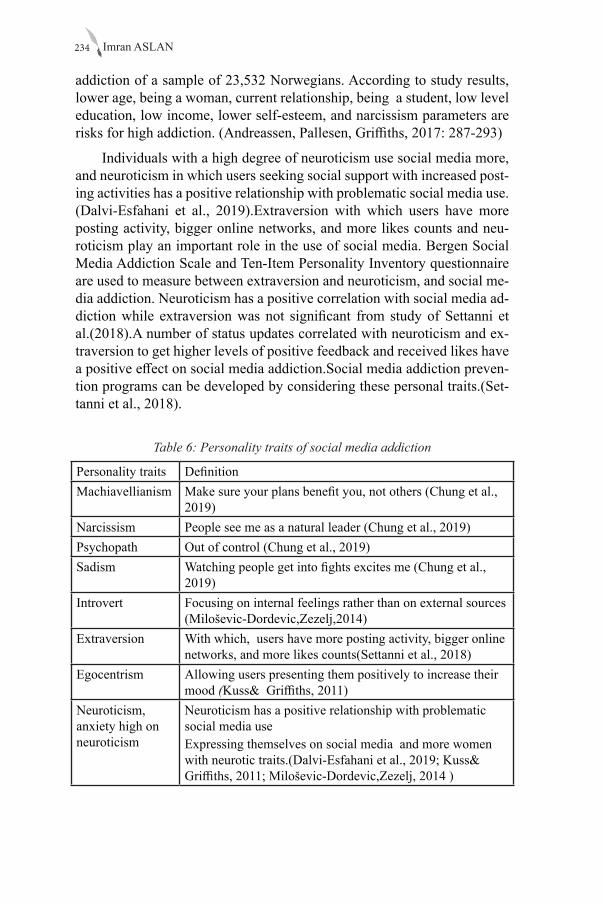
Imran ASLAN234
addiction of a sample of 23,532 Norwegians. According to study results, lower age, being a woman, current relationship, being a student, low level education, low income, lower self-esteem, and narcissism parameters are risks for high addiction. (Andreassen, Pallesen, Griffiths, 2017: 287-293)
Individuals with a high degree of neuroticism use social media more, and neuroticism in which users seeking social support with increased post-ing activities has a positive relationship with problematic social media use. (Dalvi-Esfahani et al., 2019).Extraversion with which users have more posting activity, bigger online networks, and more likes counts and neu-roticism play an important role in the use of social media. Bergen Social Media Addiction Scale and Ten-Item Personality Inventory questionnaire are used to measure between extraversion and neuroticism, and social me-dia addiction. Neuroticism has a positive correlation with social media ad-diction while extraversion was not significant from study of Settanni et al.(2018).A number of status updates correlated with neuroticism and ex-traversion to get higher levels of positive feedback and received likes have a positive effect on social media addiction.Social media addiction preven-tion programs can be developed by considering these personal traits.(Set-tanni et al., 2018).
Table 6: Personality traits of social media addiction
Personality traits DefinitionMachiavellianism Make sure your plans benefit you, not others (Chung et al.,
2019) Narcissism People see me as a natural leader (Chung et al., 2019)Psychopath Out of control (Chung et al., 2019)Sadism Watching people get into fights excites me (Chung et al.,
2019)Introvert Focusing on internal feelings rather than on external sources
(Miloševic-Dordevic,Zezelj,2014)Extraversion With which, users have more posting activity, bigger online
networks, and more likes counts(Settanni et al., 2018)Egocentrism Allowing users presenting them positively to increase their
mood (Kuss& Griffiths, 2011) Neuroticism, anxiety high on neuroticism
Neuroticism has a positive relationship with problematic social media useExpressing themselves on social media and more women with neurotic traits.(Dalvi-Esfahani et al., 2019; Kuss& Griffiths, 2011; Miloševic-Dordevic,Zezelj, 2014 )

235Academic Studies in Social, Human and Administrative Sciences - II 235
Low self-esteem, low self-worth
Feeling worried and anxious in social encounters. (Alad-wani, &Almarzouq, 2016; 575-581 ; Guedes et al., 2016: 43–48, Miloševic-Dordevic,Zezelj, 2014)
Low self-presen-tation
Lack of confidence in their strategic self-presentation (Casa-le, Rugai, Fioravanti,2018: 83–87 )
Psychopath im-pulsivity
Explaining non-substance-dependent addictive behaviour like pathological gambling, overeating and online gaming. (Chung et al., 2019: 62-67; Brand et al., 2016)
Low empathy Not sensing other people’s emotions (Dalvi-Esfahani et al., 2019)
6. Overcoming Internet and Social Media AddictionSnapchat, Facebook, YouTube, Instagram, Fortnite, Twitter, Internet
pornography etc. are named as new drugs making users addictive. Finding triggering, the most addictive activities or elements on internet as using Facebook, YouTube,Instagram etc. at work even against company policy, sharing photos or videos; blocking the most addictive website on some devices such as Facebook app; scheduling the time on internet using social media 30 minutes at night and one hour before sleep; finding new ways of socializing as being a member of an organization or a suitable substitute for attention like a new hobby for filling the spare time instead of mind-lessly scrolling through newsfeed; turning off notifications to concentrate on daily tasks; spending more time with friends’ and family members in real life; thinking of social media as athreat, and using it for a while after first doing something productive;avoid posting everything - enjoy the mo-ments; having a holiday from social media through informing friends and telling them how they can reach through installing cold Turkey program deactivating or blocking various addicting sites; and getting help form an addiction counselor can be some ways of overcoming internet addiction. (Avison, 2020; Ayeni, 2019:19-42; Perspecti Counseling, 2020).Deleting extra people, limiting memberships, deleting some SNSs, giving account passwords to family members that they just know the passwords and they give it or open when required, avoiding posting photographs or posts ev-ery day, and enjoying surroundings and environment, meditating, getting out of the house to have some entertainment by going swimming, run-ning, shopping etc., calling somebody if needed to be reached instead of sending social media messages, planning a new career change or learning something new and indulging in regular activities like listening to music and going to some physical activities are some otherways of defeating so-cial media addiction. (Heston, 2019).After stopping social media addic-tion, more time and attention for other things, better focusing, better social
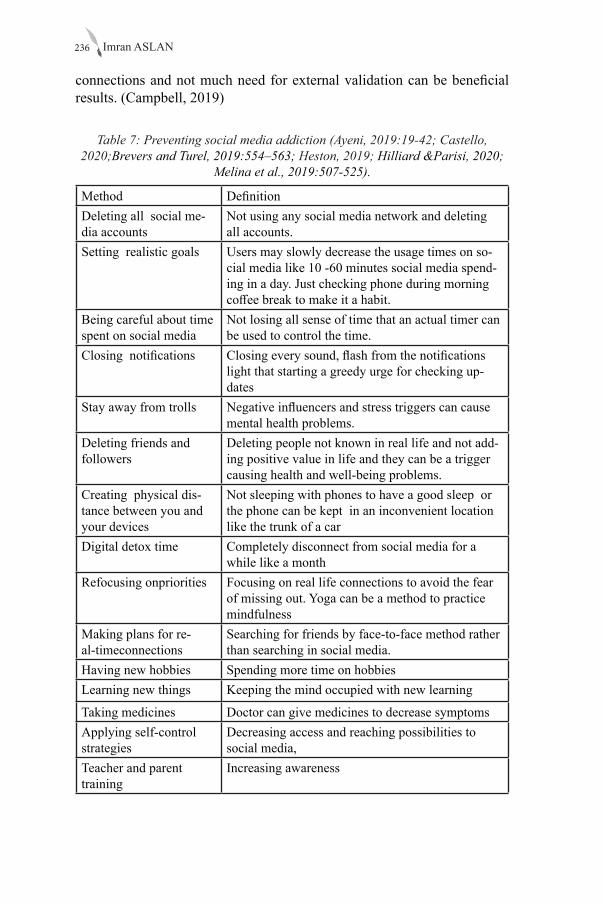
Imran ASLAN236
connections and not much need for external validation can be beneficial results. (Campbell, 2019)
Table 7: Preventing social media addiction (Ayeni, 2019:19-42; Castello, 2020;Brevers and Turel, 2019:554–563; Heston, 2019; Hilliard &Parisi, 2020;
Melina et al., 2019:507-525).
Method DefinitionDeleting all social me-dia accounts
Not using any social media network and deleting all accounts.
Setting realistic goals Users may slowly decrease the usage times on so-cial media like 10 -60 minutes social media spend-ing in a day. Just checking phone during morning coffee break to make it a habit.
Being careful about time spent on social media
Not losing all sense of time that an actual timer can be used to control the time.
Closing notifications Closing every sound, flash from the notifications light that starting a greedy urge for checking up-dates
Stay away from trolls Negative influencers and stress triggers can cause mental health problems.
Deleting friends and followers
Deleting people not known in real life and not add-ing positive value in life and they can be a trigger causing health and well-being problems.
Creating physical dis-tance between you and your devices
Not sleeping with phones to have a good sleep or the phone can be kept in an inconvenient location like the trunk of a car
Digital detox time Completely disconnect from social media for a while like a month
Refocusing onpriorities Focusing on real life connections to avoid the fear of missing out. Yoga can be a method to practice mindfulness
Making plans for re-al-timeconnections
Searching for friends by face-to-face method rather than searching in social media.
Having new hobbies Spending more time on hobbiesLearning new things Keeping the mind occupied with new learning
Taking medicines Doctor can give medicines to decrease symptoms Applying self-control strategies
Decreasing access and reaching possibilities to social media,
Teacher and parent training
Increasing awareness
237Academic Studies in Social, Human and Administrative Sciences - II 237
6.1 Therapeutic Interventions for SNS Addiction Self-Help Interventions:
Self-control is the inhibition of maladaptive impulses that proactive self-control strategies can be developed to fight against social media ad-diction. ColdTurkey, SelfControl and Freedom applications can be used by the user to block addictive sites. Turning mobile phone off, setting it on flightmode when not wanting to be disturbed or silent mode can also be self-controlled interventions. Not logging on to SNSs while busy at work or school, leaving the smartphone at home, giving adequate breaks for vis-iting SNSs, modifying thought patterns, setting limits and reasonable goals, and committing to offline activities can be other self-help ways to decrease SNSs addiction. (Andreassen, 2015; Brevers and Turel, 2019:554–563).From the study of Brevers and Turel (2019), 751 undergraduate students were surveyed and self-control strategies were developed. Preventing full access (e.g., “Spend two days in an area with no service and limited Wi-Fi”), preventing partial access (e.g., “I put my phone to charge 15 ft away from me”), modifying a feature on the device (e.g., “I put my phone on airplane mode”), delimiting a specific time of use (e.g., “I plan to stop us-ing social media after 11 pm”), self-talk (e.g., “tell myself that there is an important test coming up”) and straightforward self-control (e.g., “finish important tasks before checking my phone.”) were ways found to help pre-vent social media addiction. In addition, short-term and pleasure-oriented impulse generation (i.e., “trying to be proactive and prevent tempting sit-uations”) method was found to be more effective than intervening later. (Brevers and Turel, 2019:554–563).
Web Therapy“the employment of web resources, e-books and e-jour-nals and the reading of them in the treatment of mental and nervous diseas-es and disorders” is a self-help treatment method. The self-healing method can be used to overcome problems. When a problem cannot be discussed with friends and family, people can talk with others through social media for relaxing and refreshing. Laughable materials such as humorous stories can be read to decrease the stress rate. Moreover, sad and happy stories can be shared online to solve problems. Laughable reading materials, watching shows, entertaining songs and movies or videos, references for solving one’s problems, sarcasms, and online games with multiple players, inter-action or communication through chatting are types of information used by internet addicts for self-healing. (Kurniasih and Amriwijaya, 2018:37-45)
Therapeutic Interventions:Cognitive-Behavioural Therapy is used in that method with exploring mental processes, and focusing on how the addict perceives, thinks and solves problems. Alternative thoughts and strategies are created to deal with discomfort and detachment from social media addiction by making dysfunctional cognitions zero. Behavioural re-
Imran ASLAN238
hearsal, modeling, recovery and self-instruction techniques are used for behaviour management. Motivational interviewing treatment engaging intrinsic motivation is used to change behaviour of discrepancy between current and desired state. Clients can discover the negative sides of the behaviour with an intrinsic motivation to change it. (Andreassen, 2015).
Pharmacological Interventions: Certain medications are used to treat addictive people. (Andreassen, 2015)
Other Interventions: Focusing on norms and policies for promoting health, ensuring satisfaction of people’s basic needs with fewer challenges and demands at work, policies prohibiting personal use, being an example as teachers and parents, awarding people etc. are other intervention meth-ods. (Andreassen, 2015). Teacher and parent training and student education can raise awareness of social media addiction that users can reinforce for positive behaviour to reduce the likelihood of negative occurrences. High risk adolescents can be treated with digitally supported workshops, peer to peer training, media literacy intervention, multi-behaviour health pro-motion programs by internet use and gaming, which is a skill-based, com-petency enhancement strategy(encouraging critical thinking, self-monitor-ing, self-reflection, critical perception); reduction of comorbid symptoms and negative psychosocial consequences such as anxiety and depression with help from psychologists or doctors and cognitive behavioural group intervention protocols, and health education methods. The evaluation of interventions can be measured by usage outcomes, knowledge and attitude shifting-outcomes-awareness change, skill enhancement outcomes- better problem-solving, self-control, critical thinking, symptom reduction out-comes- comorbid symptoms and negative school-related outcomes, pro-cess evaluation outcomes- attitude change, multiple-risk behaviour out-comes- substance abuse and alcohol use. (Melina et al., 2019:507-525).
7. CONCLUSIONIt is beneficial if social media is used for panned and beneficial pur-
poses, but as a result of excessive use, psychological and physical disor-ders may arise, especially as a result of getting away from real social life, serious diseases such as depression occur. Hence, it is necessary to raise awareness of individuals and families about the harm of social media, and to establish a control mechanism especially for children and teenagers. Fa-thers and mothers can be a model for their children and in the case they use more social media, their children may follow them without knowing the dangers. As the usage of technology and online shopping increases, there is more need to use social media and hence individuals try to do everything on online platforms, hence old traditional methods such as visiting a shop
239Academic Studies in Social, Human and Administrative Sciences - II 239
to buy products, talking outside with friends and family members, search-ing for real friends rather than online friends etc. are methods which can help to prevent excessive usage.
From the study of Aslan &Yaşar (2019: 346-355) carried out at Bingöl University, it was found that the highest average is given to the proposition “I cannot understand how time passes while using social media”. There-fore, it turns out that time control in social media is not planned and more time is spent than intended. (Aslan &Yaşar, 2019: 346-355). Social media can affect the life of students negatively resulting in a decrease in academic performance and many mental problems such as anxiety through not con-trolling the time duration. Thus, new methods and rules are to be applied at universities to reduce social media usage like banning switching on cell phones in class or not allowing cell phones in university.
Cyberbullying can be a big threat for young people that some young people try to solve cyberbullying by themselves instead of informing par-ents or teachers. Deleting or blocking abusive social media users can be done in Facebook and teachers have to educate and be careful about cy-berbullying of their students in both online and offline platforms. Legis-lators, parents, and schools must work together to prevent cyberbullying. Attempts are made to prevent hate speeches leading to teenage suicide in Yelp, Facebook, and YouTube social media platforms with anti-cyberbul-lying polices. Non-consensual youth sexting can be severely punished by governments and suicide interventions to youth via social media are to be developed. (Intahchomphoo, 2019). Lots of fake news and trolls are on social media platforms, affecting young people negatively. The dangers of social media are to be taught to students in the class. Moreover, an inde-pendent control system without a political intervention can be created by governments to create necessary filters.
8. REFERENCESABBASI I.S.(2019), Social media addiction in romantic relationships:
Does user’s age influence vulnerability to social media infidelity?, Personality and Individual Differences, Volume 139, 1 March 2019, pp.277-280, https://doi.org/10.1016/j.paid.2018.10.038.
ALWAGAIT E., SHAHZAD B., ALIM S. (2015), Impact of social media usage on students academic performance in Saudi Arabia, Computers in Human Behavior, 51, pp.1092–1097, http://dx.doi.org/10.1016/j.chb.2014.09.028.
ALADWANI A.M., ALMARZOUQ M. (2016),Understanding compulsive social media use: The premise of complementing self-conceptions mismatch with technology, Computers in Human Behavior, 60, pp.575-581, http://dx.doi.org/10.1016/j.chb.2016.02.098.
Imran ASLAN240
ANDREASSEN, C.S. (2015), Online Social Network Site Addiction: A Comprehensive Review., Curr Addict Rep, 2, pp.175–184, https://doi.org/10.1007/s40429-015-0056-9.
ANDREASSEN C. S. , PALLESEN S. , GRİFFİTHS M.D. ( 2017), The relationship between addictive use of social media, narcissism, and self-esteem: Findings from a large national survey, Addictive Behaviors,Volume 64,pp.287-293, https://doi.org/10.1016/j.addbeh.2016.03.006.
ANDREASSEN, C.S., GRIFFITHS, M.D., GJERTSEN, S.R., KROSSBAKKEN, E., KVAM, S., PALLESEN, S.(2013). The relationships between behavioural addictions and the five-factor model of personality. J. Behav. Addic. 2 (2), pp.90–99. https://doi.org/10.1556/JBA.2.2013.003.
ANDREASSEN C.S, PALLESEN S. (2014), Social Network Site Addiction-An Overview,Curr Pharm Des., 20:4053–61.,
ARSHAD S., QURESHI M.F., RIZVI S.H.A., FEROZALI B.MAJEED S.A, KHAN S. & AJAZ H. (2018), Social media addiction is a new smoking, Annals of Psychophysiology, 5, pp.38-46, DOI: 10.29052/2412-3188.v5.i1.2018.38-46)
ASLAN I.(2018) Chapter: The Innovative Role of SocialMedia in Healthcare in German-Turkish Perspectives on IT and Innovation Management, Challenges and Approaches, FOM-Edition, International Series, Springer Gabler,pp.123-139, ISBN 978-3-658-16961-9 ISBN 978-3-658-16962-6 (eBook), https://doi.org/10.1007/978-3-658-16962-6.
ASLAN I. & YAŞAR M.E. (2019) BingölÜniversitesiÖğrencileriSosyalMedyaBağımlılığıAraştırması-Bingöl University Students Social Media Addiction Survey, International European Congress on Social Sciences –IV, pp.346-355, Diyarbakır, Turkey.
ASONGUA S.A. , UDUJIB J.I. , OKOLO-OBASIC E.N. (2019), Homicide and social media: Global empirical evidence, Technology in Society, Volume 59, https://doi.org/10.1016/j.techsoc.2019.101188.
AVISON P.(2020) 7 Ways To Stop Your Social Media Addictionhttps://www.bustle.com/articles/144893-7-ways-to-stop-your-social-media-addiction(Access Date:10.05.2020)
AYENI P.T. (2019) Social Media Addiction: Symptoms and Way Forward, The American Journal of Ierdisciplinary Innovations and Research, 1(4), pp.19-42.
BACCARELLA C.V., WAGNER T.F., KIETZMANN J.H., MCCARTHY I.P (2018) Social media? It’s serious! Understanding the dark side of social media, European Management Journal, 36,pp.431-438, https://doi.org/10.1016/j.emj.2018.07.002.
BARNES S.J., PRESSEY A.D. (2014) Caught in the Web? Addictive behaviour in cyberspace and the role of goal-orientation,
241Academic Studies in Social, Human and Administrative Sciences - II 241
Technological Forecasting & Social Change,86, pp.93–109, http://dx.doi.org/10.1016/j.techfore.2013.08.024 )
BECHARA, A., BERRIDGE, K. C., BICKEL, W. K., MORÓN, J. A., WILLIAMS, S. B., & STEIN, J. S. (2019). A Neuro behavioural Approach to Addiction: Implications for the Opioid Epidemic and the Psychology of Addiction.,Psychological Science in the Public Interest, 20(2), pp.96-127. doi:10.1177/1529100619860513 .
BILGIN O., TAŞ İ. (2018) Effects of Perceived Social Support and Psychological Resilience on Social Media Addiction among University Students, Universal Journal of Educational Research,6(4),pp.751-758, DOI: 10.13189/ujer.2018.060418.
BRAND, M., YOUNG, K.S., LAIER, C., WOLFLING, K., POTENZA, M.N.(2016) Integrating psychological and neurobiological considerations regarding the development and maintenance of specific Internet-use disorders: an Interaction of Person-Affect-Cognition-Execution (I-PACE) model. Neurosci. Biobehav. Rev. 71, pp.252–266.
BRAILOVSKAIA, J., SCHILLACK, H., MARGRAF, J.,(2018). Facebook Addiction Disorder (FAD) inGermany. Cyberpsychol. Behav. Soc. Netw. 21 (7),pp.450–456. https://doi.org/10. 1089/cyber.2018.0140.
BRAILOVSKAIA J. , ROHMANN E. , BIERHOFF H-W, SCHILLACK H., MARGRAF J.(2019)The relationship between daily stress, social support and Facebook Addiction Disorder, Psychiatry Research, 276,pp.167–174, https://doi.org/10.1016/j.psychres.2019.05.014.
BREVERS D. &TUREL OF. (2019) Strategies for self-controlling social media use: Classification and role in preventing social media addiction symptoms, Journal of Behavioral Addictions, 8(3), pp. 554–563, DOI: 10.1556/2006.8.2019.49.
BUCKELS E.E(2018) The Psychology of Everyday Sadism, Dissertation Submitted in Partial Fulfillment of the Requirements for the Degree of Doctor of Philosophy, University of British Columbia, Vancouver.
CESD-R(2020) Diagnostic and Statistical Manual (DSM-V),https://cesd-r.com/(Access Date: 08.05.2020)
CASALE S., BANCHI V. (2020) Narcissism and problematic social media use: A systematic literature review, Addictive Behaviors Reports, doi: https://doi.org/10.1016/j.abrep.2020.100252.
CASALE S. , RUGAI L. , FIORAVANTI G. (2018 ) Exploring the role of positive metacognitions in explaining the association between the fear of missing out and social media addiction, Addictive Behaviors, 85 ,pp.83–87, https://doi.org/10.1016/j.addbeh.2018.05.020.
CASTELLO S. (2020)Digital Detox: 10 Surprisingly Easy Ways to Kick Social Media Addiction, https://www.readersdigest.ca/health/healthy-living/social-media-addiction/ (Access Date: 08.05.2020)
CAMPBELL S. (2019) 5 Surefire Methods to Eliminate Your Internet and

Imran ASLAN242
Social Media Addictions,https://www.unstoppablerise.com/how-to-stop-internet-addiction/ (Access Date: 08.05.2020)
CHUNG K.L. , MORSHIDI I , YOONG L.C. , THIAN K.T. (2019) The role of the dark tetrad and impulsivity in social media addiction: Findings from Malaysia, Personality and Individual Differences, Volume 143, pp.62-67, https://doi.org/10.1016/j.paid.2019.02.016.
DALVI-ESFAHANI M., NIKNAFS A., KUSS D.J., NILASHI M., AFROUGH S. (2019) Social media addiction: Applying the DEMATEL approach, Telematics and Informatics, 43, 101250, https://doi.org/10.1016/j.tele.2019.101250.
ELLISON N. (2020) Scales,http://www-personal.umich.edu/~enicole/scale.html (Access Date: 08.05.2020)
EREVIK E.K., PALLESEN S., ANDREASSEN C.S. , VEDAA Q. , TORBJØRN TORSHEIM T. (2018) Who is watching user-generated alcohol posts on social media? Addictive Behaviors, 78,pp.131–137, https://doi.org/10.1016/j.addbeh.2017.11.023.
GUEDES E., SANCASSIANI F., CARTA M.G., CAMPOS C., MACHADO S. , KING A.L.S. , NARDI A.E.(2016) Internet Addiction and Excessive Social Networks Use: What About Facebook?, ClinPractEpidemiolMent Health,12,pp.43–48. doi: 10.2174/1745017901612010043.
GUEDES E., NARDI A.E. , GUIMARÃES F.M.C.L , MACHADO S. , KING A.L.S. (2016b) Social networking, a new online addiction: a review of Facebook and other addiction disorders, MedicalExpress (Sao Paulo, online), 3(1):M160101
HESTON K. (2019) How to Defeat a Social Networking Addictionhttps://www.wikihow.com/Defeat-a-Social-Networking-Addiction (Access Date: 08.05.2020)
HILLIARD J. & PARISI T. (2020) What Is Social Media Addiction?https://www.addictioncenter.com/drugs/social-media-addiction/( 07.05.2020)
INTAHCHOMPHOO C. ( 2019) Facebook Usage among Urban Indigenous Youth at Risk in Ontario, PhD degree in Electronic Business Technologies, University of Ottawa, Canada.
JASSO-MEDRANO J.L., LOPEZ-ROSALES F. (2018) Measuring the relationship between social media use and addictive behaviour and depression and suicide ideation among university students, Computers in Human Behavior,87,pp.83-191, https://doi.org/10.1016/j.chb.2018.05.003.
KARACA, F., YILDIRIM, O. G., & KULAKSIZ, T. (2019). Social Network Addiction Scale development: Validity and reliability study, Addicta: The Turkish Journal on Addictions, 6, pp.337-360. http://dx.doi.org/10.15805/addicta.2019.6.2.0049.
243Academic Studies in Social, Human and Administrative Sciences - II 243
KEMP, S. (2017). Digital in 2017: Global overview. Retrieved from:https://wearesocial.com/special-reports/digital-in-2017-global-overview.
KORKMAZ, M.; KIRAN-ESEN, B. (2017).The effects of peer-training about secure internet use on adolescents. Turk PsycholCounsGuid J, 4(38), 180-7.
KURNIASIH N. AND AMRIWIJAYA J. (2018 ) Web Therapy for Internet Addicts: A Case Study of Self-Healing by Social Media Addicts in Indonesia , Record and Library Journal, 4, pp.37-45.
KUSS D.J. , MARK D. GRIFFITHS M.D. (2011) Online Social Networking and Addiction-A Review of the Psychological Literature, Int J Environ Res Public Health, 8(9),pp.3528-3552, doi: 10.3390/ijerph8093528.
LACONI S, KALISZEWSKA-CZEREMSKA K, TRICARD N, CHABROL H, KUSS DJ (2018) The Generalized Problematic Internet Use Scale-2 in a French sample: Psychometric evaluation of the theoretical model. Encephale, 44(3):pp.192-199, doi: 10.1016/j.encep.2017.09.001.
LEE H. , SEOK B. , AND SOHN A.(2019) The Role of Social Media Content on Solitary Drinking Among Korean Adults, Cyberpsychology, Behavior, and Social Networking, Volume 22, Number 6, pp.397-403, DOI: 10.1089/cyber.2018.0381
LIU C. , JIANLING M. (2018) Development and Validation of the Chinese social Media Addiction Scale, Personality and Individual Differences,134 ,pp.55–59, https://doi.org/10.1016/j.paid.2018.05.046.
OSATUYI, B., TUREL O. (2018). Tug of war between social self-regulation and habit: Explaining the experience of momentary social media addiction symptoms, Computers in Human Behavior, 85,pp. 95-105, https://doi.org/10.1016/j.chb.2018.03.037.
OLENDORFF D., JERYAN C., BOYDEN K. (1999) Gale Encyclopedia of Medicine, First edition Gale Research, Detroit, 1999.
MACİT H.B. , MACİT G. , GÜNGÖR O. (2018) A Research on Social Media Addiction and Dopamine Driven Feedback, Mehmet AkifErsoyÜniversitesiİktisadiveİdariBilimlerFakültesiDergisi, Cilt: 5, Sayı: 3, pp. 882-897 , DOI: 10.30798/makuiibf.435845.
MEDYA (2020) SosyalMedyaKullanıcıSayıları, https://medyaakademi.com.tr/2020/02/03/2020-sosyal-medya-kullanici-sayilari/ (Access Date: 01.03.2020)
MANDER, J. (2017). Daily time spent on social networks rises to over 2 hours. Retrieved from https://blog.globalwebindex.com/chart-of-the-day/daily-time-spent-onsocial-networks Accessed 10 June 2018.)
MARENGO D., POLETTI I., SETTANNI M. (2020) The interplay between neuroticism, extraversion, and social media addiction in young adult Facebook users: Testing the mediating role of online
Imran ASLAN244
activity using objective data, Addictive Behaviors, 102, https://doi.org/10.1016/j.addbeh.2019.106150.
MCDANİEL, B. T., DROUİN, M., & CRAVENS, J. (2017). Do you have anything to hide? Infidelity-related behaviours on social media sites and marital satisfaction. Computers in Human Behavior, 66, 88-95. doi: 10.1016/j.chb.2016.09.031.
MILOŠEVIC-DORDEVIC J.S., ZEZELJ I.L. (2014) Psychological predictors of addictive social networking sites use: The case of Serbia, Computers in Human Behavior, 32, pp.229-234, http://dx.doi.org/10.1016/j.chb.2013.12.018.
MELINA A. THROUVALA, MARK D. GRIFFITHS, MIKE RENNOLDSON AND DARIA J. KUSS (2019) School-based Prevention for Adolescent Internet Addiction: Prevention isthe Key. A Systematic Literature Review, Current Neuropharmacology,17,pp.507-525, Doi: 10.2174/1570159X16666180813153806)
PAULHUS, D. L., & JONES, D. N. (2011) Introducing a short measure of the Dark Triad. Posterpresented at the meeting of the Society for Personality and Social Psychology, San Antonio.
PERSPECTI COUNSELING (2020) Overcoming Internet Addiction: Addiction Counseling in Michigan, https://perspectivesoftroy.com/overcoming-internet-addiction/(Access Date: 10.05.2020)
SAMPASA-KANYINGA, H., & LEWIS, R. F. (2015). Frequent use of social networking sites is associated with poor psychological functioning among children and adolescents. Cyberpsychology, Behavior, and Social Networking, 18(7),pp.380–385. https://doi.org/10.1089/cyber.2015.0055.
SETTANNI M., MARENGO D., FABRIS M.A., LONGOBARDI C. (2018) The interplay between ADHD symptoms and time perspective in addictive social media use: A study on adolescent Facebook users, Children and Youth Services Review, 89,pp.165–170, https://doi.org/10.1016/j.childyouth.2018.04.031.
SHEK, D.T.L.; MA, C.M.S. (2014) Effectiveness of a Chinese positive youth development programme: The Project P.A.T.H.S. in Hong Kong. Int. J. Disabil. Hum. Dev., 13(4), pp.489-496, http://dx.doi.org/10.1515/ijdhd-2014-0346.
SİMSEK A., ELCİYAR K., KİZİLHAN T. (2019) A Comparative Study on Social Media Addiction of High School and University Students, Contemporary Educational Technology, 10(2), pp.106-119,Doi: https://doi.org/10.30935/cet.554452.
SPENCER J. (2020) 65+ Social Networking Sites You Need to Know About, https://makeawebsitehub.com/social-media-sites/ (Access Date: 13.04.2020 )
245Academic Studies in Social, Human and Administrative Sciences - II 245
STATISTA (2020). Number of social media users worldwide from 2010 to 2021 (in billions). Retrieved from https://www.statista.com/statistics/278414/number-of-worldwide-social-network-users/>
OFİR T. &ALEXANDER A. (2020). Cognitive Biases and Excessive Use of Social Media: The Facebook Implicit Associations Test (FIAT), Addictive Behaviors. 105 (June): 106328.
TUTGUN-ÜNAL A. (2015) Social Media Addiction: A Research on University Students, PhD Thesis, Social Sciences Institute, Marmara University, Istanbul.
TUREL O. , BREVERS D. , BECHARA A. ( 2018) Time distortion when users at-risk for social media addiction engage in nonsocial media tasks, Journal of Psychiatric Research, Volume 97, February 2018, Pages 84-88 , https://doi.org/10.1016/j.jpsychires.2017.11.014.
VANNUCCI A., M. FLANNERY K.M. , MCCAULEY OHANNESSIAN C.M. ( 2017) Social Media Use and Anxiety in Emerging Adults, Journal of Affective Disorders , 207 , 163–166, http://dx.doi.org/10.1016/j.jad.2016.08.040.
WANG C., LEE M.K.O, HUA Z. (2015)A theory of social media dependence: Evidence from microblog users, Decision Support Systems, 69,pp.40–49, http://dx.doi.org/10.1016/j.dss.2014.11.002.
YOUNG, K.S. (1996) Psychology of computer use: XL. Addictive use of the Internet: a case that breaks the stereotype. Psychol. Rep. 79 (3), pp.899–902.
YÜCENS B., ÜZER A. (2013), American Psychiatric Association, 2013. Diagnostic and Statistical Manual of Mental, Psychiatry Research 267 (2018) 313–318, Disorders, 5th Edition (DSM-5). Diagnostic Stat. Man. Ment. Disord, pp. 280. http://dx.doi.org/10.1176/appi.books.9780890425596.74. TR.
YÜCENS B., ÜZER A. (2018). The relationship between internet addiction, social anxiety, impulsivity, self-esteem, and depression in a sample of Turkish undergraduate medical, Psychiatry Research, 267,pp.313–318, https://doi.org/10.1016/j.psychres.2018.06.033.

Chapter 13CHINESE SOCIAL MEDIA PLATFORMS AS AN ALTERNATIVE SOCIAL MEDIA TO THE NEW
WORLD
Mihalis (Michael) KUYUCU1
1 Doç.Dr., İstanbul Aydın Üniversitesi & CRI TÜRK Medya Grubu, [email protected]

249Academic Studies in Social, Human and Administrative Sciences - II 249
Introduction and Historical Background
Owing to a tremendous growth of internet and technology, social me-dia has gained immense importance and popularity around the globe. Due to interactive, transparent, and participative features on social media, a significant proportion of the population loves spending time on it. It has literally modified the way we collaborate and interact with each other. Ac-cording to statistics of December 2015, 649 Million internet users were reported that included 249 Million micro-blog users (Fei, 2016). The num-ber of users of Chinese social media like Weibo and We Chat has increased substantially since 2009 (Zhou & Wang, 2014).
Social media have pronounced impact on various fields of life includ-ing Tourism. Most of the young people utilize social media to stay connect-ed with their loved ones and for seeking help in various matters for travel decision making. They can find tourist destinations, modes of travelling, food options, and much more. Many tourism sites use social media for their advantage to attract attention of foreigners visiting their country.
Chinese social media are quite different from that of Western countries due to restrictions imposed by the Chinese government. Only a few foreign participants are involved in Chinese social media marketing. These restric-tions are likely to continue in the long run and people in China would be able to interact through selected forums only. Most of the global social media forums like Facebook, Twitter, and Google are strictly forbidden in China Moreover, the Chinese social media like Wechat and Weibo was in the beginning providing only Chinese language content that is quite diffi-cult for foreigners to utilize for their tourism. But after a few years Wechat start to be localized in different languages, which this made the platform international.
The historical background of Social media censorship in China stems from the riots in western province Xinjiang in 2010. In April 2010, the Chi-nese government revised the existing laws on Guarding State Secrets that restricted the global media access (Xu & Albert, 2014). This amendment required telecommunication and other IT companies to collaborate with the Chinese government to restrict global media and help minimization of leaking out of national secrets. However, the definition of the Chinese secrets remains vague that would facilitate the purpose of integrity of the state through social media restrictions. Keeping the door closed to the in-ternational media and staying inside a confined information space, prohib-its any kind of rebellion against national interests.
The Chinese government has been blocking the foreign content so that any kind of right-threatening and uncensored information couldn’t be ac-
Mihalis (Michael) KUYUCU250
cessed by Chinese citizens. Censorship of foreign content was an important step in promoting the local regime and school of thought. Through local news and social media, the Chinese government aims to prevent minimiza-tion of their authority. The Google also criticized the internet censorship in China. As the economy of China is rapidly growing, access to the foreign world is becoming quite important and social media provide the required resources for achieving this task.
Due to the differences in Chinese social media platforms as compared to the western world, only a few research studies have been reported in the former field. This area requires special attention considering the fact that China is now becoming a global leader in economy and technology, and it has to provide forums for global interaction through social media. This report will shed light on social media of China with respect to its role in marketing, tourism industry, differences from western social media, the number of users, and their limitations in facilitating the people for their required purpose.
The History of Chinese Social Media Restrictions
China is a giant in terms of the internet and social media users. As per statistics from 2012, 513 Million users in China were compared with 245 Million users in the USA, with more than 300 Million people using social media from blogs to social media, microblogs, and other media content (Chiu, Ip, & Silverman, 2012). The number of subscribers of internet grew to 800 Million in 2019 and social media users more than 500 Million. This population is more than the combined population of Spain, France, Italy, UK and Germany. Moreover, the usage of social media is also growing and reported to be 40% of overall time of the day (Chiu et al., 2012).
The Chinese market is quite unique in the sense that the economic corridors are open through localized social media marketing only. Gov-ernment is taking strict actions to ban any kind of foreign media content to shape native strategy for marketing of products and services. It is import-ant to understand the nuances, restrictions, content, and information about various Chinese social media platforms.
Chinese social media users are quite active in searching and exploring the native content through multiple accounts. Almost 80% Chinese social media users utilize different forums for collaboration and interaction as compared to just 39% in Japan (Chiu et al., 2012). The number of mobile social media users is also increasing drastically. Most of the Chinese are skeptical about the formal institutions and their school of thought, so they prefer taking opinion from friends and family for important decisions.
251Academic Studies in Social, Human and Administrative Sciences - II 251
Chinese social media have fierce competition for content marketing and attracting consumers. Many marketing companies hire bloggers and social media content writers to advertise their products in an attractive manner and also downgrade the products of other companies in compe-tition. Most of the negative news become viral and gain people’s atten-tion to make them against a particular brand or company. Businesses have to manage social media forums to avoid any kind of negative marketing against them. When comparing the brand value with other competitors, the companies must develop strong social media consumer insights.
The Chinese social media are quite local and fragmented as their con-tent is restricted to native interests. In a broader spectrum, Chinese social media have services in the e-commerce and digital media. In the former, the services of microblogging like Sina Weibo and Tencent Weibo are quite familiar and interesting, while the latter category of social media includes Renren and Kaixin001 (Chiu et al., 2012). These forums have their own focus, areas of strength, advantages, and also the geographical properties. Due to diverse social media forums, this kind of fragmentation requires quite complex marketing structure in terms of planning and resources. They must have a network of operators and partners in different fields to guide social media marketing campaigns. The competition is increasing in this regard to gather players in this field and seek attention through the available social media.
The challenging social media marketing strategy doesn’t put market-ers away from using the forums of microblogging and e-commerce for sell-ing their products and services. The unique market features require some intelligent methods to thrive. Firstly, the content should be unique and lat-est to serve the requirement of customers. Products that appeal customers through their functionality and originality must be advertised appropriately to initiate a successful campaign. Secondly, the test and learn approach is attractive in adapting to the changing marketing requirements. Trends evolve into different shapes and consumers expect companies to follow the innovative standards. Thirdly, social media marketing must focus on qual-ity, sustainability, and corporate social responsibility factors along with brand goals. Sheer number of Chinese social media users require a lot of effort to win their confidence.
In China, the social media are considered as the vital force, leading to prosperity and welfare of the state. Den Xiaoping, a reformist leader, pioneered the socialist market economy to China for achieving broad eco-nomic goals. Technology is always perceived as a source for achieving the desired goals of socialism. However, technology associated with social media is never value free, especially when it is diffused from another cul-ture and system. Considering the post-modern technical genre of China, it
Mihalis (Michael) KUYUCU252
is a gigantic task to isolate the international media from the Chinese inter-net and promote only native platforms for sharing ideas and digital content.
The Overall Social Media Landscape of China vs Western Social Media
The social media platforms of the West, including Facebook, WhatsApp, and YouTube have great influence in the western region in-cluding Asian countries. Most of them are inaccessible to Chinese due to restrictions imposed by the Chinese Government as explained earlier. It is important to consider the historical background of Chinese social media to cover the aspects of their comparison in terms of the strengths and weak-nesses with western media.
The real internet growth began in China in 1999 with the introduction of QQ by Tencent. Millions of youngsters utilized this forum to stay con-nected with their loved ones and enjoy unique features of enjoyment. Blog-China also emerged as an innovative forum in 2002 by Fangxingdong. In addition to the instant messaging services provided by QQ, Chinese users were also interested in audio, video content, microblogging, and payment services. Sina Weibo provided the microblogging platform, Kaixinwang and Jiepang offered social media services in their own specialized manner, and Wechat cultivated an altogether new social life with everything includ-ed on this forum.
Nowadays, the Chinese people would have social media accounts on a variety of forums and integrate them for linking their contacts, informa-tion, and media. This trend of integrating the social media is also used by the websites for their marketing purposes. They would know the target markets through social media trends and interests of the people. Moreover, the companies could make their online presence by gathering attention of people through social media Ads. The landscape of Chinese social media is changing at a rapid rate and has become quite rich in terms of features and options.
Innovation in Chinese social media comes from behaviors, require-ments, trends, political aspects, and cultural norms of China instead of just copying the features of western counterparts. The Chinese social media are creating an innovative landscape for providing various features for young generation. For example, some features of Wechat like searching for near-by friends and associate payment options are much better than WhatsApp. Consequently, China is becoming a global leader in setting social media trends. Consider the comparison of Chinese social media with western counter parts and you will appreciate the diversity of Chinese platforms (He & Pedraza, 2015).
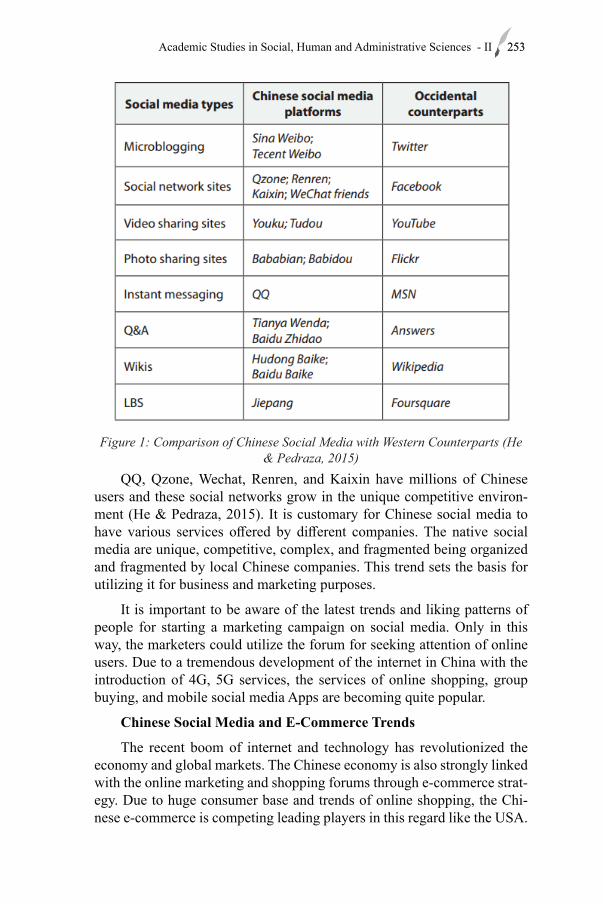
253Academic Studies in Social, Human and Administrative Sciences - II 253
Figure 1: Comparison of Chinese Social Media with Western Counterparts (He & Pedraza, 2015)
QQ, Qzone, Wechat, Renren, and Kaixin have millions of Chinese users and these social networks grow in the unique competitive environ-ment (He & Pedraza, 2015). It is customary for Chinese social media to have various services offered by different companies. The native social media are unique, competitive, complex, and fragmented being organized and fragmented by local Chinese companies. This trend sets the basis for utilizing it for business and marketing purposes.
It is important to be aware of the latest trends and liking patterns of people for starting a marketing campaign on social media. Only in this way, the marketers could utilize the forum for seeking attention of online users. Due to a tremendous development of the internet in China with the introduction of 4G, 5G services, the services of online shopping, group buying, and mobile social media Apps are becoming quite popular.
Chinese Social Media and E-Commerce Trends
The recent boom of internet and technology has revolutionized the economy and global markets. The Chinese economy is also strongly linked with the online marketing and shopping forums through e-commerce strat-egy. Due to huge consumer base and trends of online shopping, the Chi-nese e-commerce is competing leading players in this regard like the USA.
Mihalis (Michael) KUYUCU254
Local firms have noticed the online trends of social media and marketing their products right at social media forums where people are searching for their favorite things and brands. Currently, the microblogs are driving a huge amount of traffic on Chinese users like Jingdong, Tmall, and Tao-bao (He & Pedraza, 2015). The Chinese microblogs are linking customers with their searching forums and the online shopping places for easing out the exploration process for customers. The netizens could find products of their choice in reasonable price and quality. Through integration of dis-cussion forums like Weibo with e-commerce, the platform is available for discussion about the products in detail such that people are aware of all pros and cons of the products.
The Xiaomi online sales campaign is the best example of using social media for linking Chinese people to e-commerce. This company is a tech giant that launched its first series of smartphones in 2011 through the me-dia campaign that got very high appreciation from clients (He & Pedraza, 2015). With the help of social media, people commented on the quality of services provided by the smartphone. Thus, social media not only con-nected the end customers to online businesses, but also provided a suitable forum for discussing various features of products and services.
Launching marketing campaigns on social media looks quite easy for inviting a huge range of customers through the internet. However, local and international enterprises face some challenges in this regard. Firstly, social media’ strategy for businesses is not well defined and concrete (He & Pedraza, 2015). Due to lack of experience in this unique way of mar-keting, the startups and thriving companies have to take a risk in gathering attention of customers. Secondly, social media teams for businesses are scarce. Thirdly, it is difficult to measure the extent of the social media effort and hence allocating the resources for achieving this goal.
The Social Media Platforms of China
China has created many different social media platforms as alternative to western world. These social media platforms had better quality in same cases than the western social media platforms. Some of them like Tik Tok, wechat were also able to achieve to be global competitor in the word of social media globally.
Sina Weibo
It is one of the most famous microblogging forums in China, running as web 2.0 application. It is the market leader in China with almost 50% market share among social media forums. Almost 80% users of this forum are young people. So, it is important to analyze the social media require-ments of young people to make this forum successful.
255Academic Studies in Social, Human and Administrative Sciences - II 255
This service was introduced in 2009 and it is now the most popular blogging forum in China. It enables the users to search their favorite con-tent and repost them with limitation of 140 Chinese characters. However, their original content doesn’t have any limit of characters’ length. Howev-er, Chinese characters are quite powerful and concise, and it is possible to embed a lot of information in 140 characters as compared to the western al-phabetical system. This strength makes microblogging feature an interest-ing prospect for Chinese people. Like other typical western social media, Sina Weibo allows users to share content in the form of photos, videos, and URLs. The users can follow their friends and connections to stay updated with their posts.
By the end of September 2017, Sina Weibo claimed 376 Million sub-scribers that marks an increase of 27% in comparison with progress in 2016 (Wang, 2018). Moreover, the daily active users increased to 165 Mil-lion that marked an increase by 25% from the same period. Male users’ percentage was 56.3%, while females had 43.7% contribution among over-all users. The highest proportion of Sina Weibo users (38.6%) lie in the range of 23 to 30 years of age, while users in range 20-35 make up roughly 82% of total users.
The motivation of using social media like Weibo comes from the Maslow’s hierarchy of needs. According to this theory, different require-ments like safety need, psychological needs, self-esteem, social belonging, self-transcendence, and self-actualization exist. Motivations for using Wei-bo include information seeking, opinion sharing, social interaction, and media participation (Wang, 2018). According to a research study, people using Weibo could be categorized as follows (Wang, 2018):
1. Ordinary people use Weibo for opinion expression and entertain-ment.
2. Celebrities use Weibo for establishing their perfect images.
3. Entrepreneurs use Weibo for marketing their products and ser-vices.
4. Governmental officers use Weibo for disseminating information.
The role of Sina Weibo in bringing the Chinese community close to each other is tremendous. People are willing to share their moments, sto-ries, posts, emotions, and much more. The most remarkable part of the fo-rum is that it doesn’t rely on international sources of information that could have questionable authenticity. The information from the other Chinese people and other native sources provide authenticity for staying connected and getting important updates.
Mihalis (Michael) KUYUCU256
The historical background of Weibo makes it a formidable choice in comparison with Twitter to save China from political influences of all kinds. The international social media were banned in China during 2009, when many Chinese used unethical comments on microblogs in reaction to the global political situation (Sun, 2013). The complexity of the international social media and technology diffusion required the Chinese government to ban international social media and promote native and local sources of information. It provides the answer to the technological revolution and global socialization through media by providing a suitable to Chinese for their interaction, opinion, sharing, information exchange, and marketing.
The popularity of Sina Weibo could be analyzed from its extremely fast developmental trajectory as compared to global social media giants like Twitter. It took Twitter to achieve the milestone of 100 Million tweet per day, and Weibo achieved this goal in half the time period. The scale of Weibo is quite interesting for Chinese users as things get reposed very often, sometimes 1000 times reposting (Sun, 2013).
Right from the onset, Sina Weibo was always considered as the copy of Twitter. Later on, it was compared with Facebook and Twitter as it de-picted the features of both these social media that are banned in China (Sun, 2013). In fact, you can locate features of various American social media sites like Pinterest in Weibo. In addition to copying the interna-tional social media features, Weibo also developed many unique features that originated from Chinese internet culture, including threaded comment, rich media, micro-group, private chat, micro-event and so on. Later on, Twitter also adopted some of the innovative features of Weibo.
Apart from the features of Weibo that are strikingly similar to Twit-ter, the role of Weibo is very strong in terms of linking Chinese with their past events. A quick comparison of Weibo and Twitter suggests that local technologies are structural and behavioral construct. The technological features of Weibo suggests that it is deeply embedded in the Chinese in-ternet culture as a technological genre (Sun, 2013). With the help of genre enactment, millions of users use the recursive link between people and technology. Moreover, a novel structure of technology use is designed and then infused into a local culture.
Sina Weibo has to follow the censorship requirements imposed by the Chinese government. The platform owner, Sina Corp. is employing addi-tional resources to comply with governmental instructions. Internal cen-sorship is quite common in Chinese internet services. The Chinese govern-ment monitors internet trends and takes strict actions to block any content or even shutdown the whole website. The internal censorship method of Sina Weibo is quite strong as the website monitors the content shared by

257Academic Studies in Social, Human and Administrative Sciences - II 257
the people very closely. According to a research study, the internal cen-sorship of Sina is rigorous and content department is quite fast to remove the content not complying with governmental policies. 35% of the dele-tion would occur within 5-10 minutes of posting and other 60% would be removed within 24 hours (Sun, 2013). The users who have the history of more deleted posts will observe more surveillance for uploading content complying with the regulations.
The cost of maintaining the censorship for a huge platform like Sina Weibo is quite high (Sun, 2013). With coordination of content inspectors and machine-based surveillance, surveillance of the microblogging platform is quite strict as opposed to western social media. Some people might refer this strategy to labor-intensive business rather than technology oriented one as observed by other countries. Due to a high cost of censorship, many Chinese IT companies couldn’t rise to the level of democratic powers.
The strength of Sina Weibo lies in using social media for marketing purposes for gathering attention of the general public. In May 2013, Wei-bo give 18% shares to the e-commerce giant Alibaba (Sun, 2013). Conse-quently, Weibo linked to the Taobao platform that facilitates users to shop online on Taobao through the Weibo forum. This move came apparently from the political influence of stakeholders and its own business tactics, but the motivation also lies in the stigma initiated by Twitter for introduc-ing elements of democracy in the Chinese political regime (Sun, 2013). Moreover, Sina Weibo grew in popularity and influence to afflict potential political influence, even though this purpose was never intended.
Concluding the role and image of Sina Weibo, it first emerged as the copycat of Twitter. Now, it is playing the role of the local social media to provide all features of the global technology. This forum allows Chinese people to avail features of information exchange, collaboration, content sharing, and much more. The introduction of local social media to serve the requirements of the global one, makes it clearer to analyze how tech-nology responds to different structural forces.
With currently over one Billion monthly active users, Wechat is be-coming of the largest social media and multipurpose platform in China (Montag & Gan, 2018). This forum is open to global users also and many Asians users have registered account on it. This forum has attained atten-tion of a huge number of people in China and research studies are now focusing on impact of Wechat on societal and individual levels. Moreover, it is also interesting to analyze the impact of Wechat on social behaviors and interaction among people.
Mihalis (Michael) KUYUCU258
Chinese multinational company Tencent Holding Limited rolled out Wechat in January 2011 (Montag & Gan, 2018). Since the time of its launch, it boasts a huge number of users and provides plenty of functions beyond the usual communication functions of its counterpart WhatsApp in the western world. The huge range of Wechat services include communi-cation, payment features, booking trains or flights, pay for traffic fines, and other some other social services. The core function is to share messages, videos, and photos with contacts. Moreover, you can also share your mo-ments in the form of videos on your profile. It also provides the free video and voice call features as offered by its western counterpart WhatsApp. A large range of emoticons allow users to share their emotions and expres-sions on social media with their contacts.
The innovation in Wechat is quite outstanding. In Januray 2014, it added a new feature of Red Envelope for sharing gifts with friends in terms of money (Montag & Gan, 2018). It mimics the famous Chinese tradition of exchanging gifts in red packets, particularly spring festival. This feature became so viral on social media that 768 Million Chinese people were in-volved in sending and receiving red envelopes during six-day holidays in Spring Festival 2018 (Xinhua, 2018). The staggering statistics of Wechat don’t end here. In 2017, 38 Billion messages have been sent every day. An average user spent 139 Minutes on calling and 68 Million videos have been shared every day. These statistics clearly indicate that Wechat is becoming the integral part of life of most of the Chinese people.
It is important to explore the reasons of using Wechat. Researchers have investigated the motivations behind Wechat popularity as the social media with the diverse range of features. A quantitative study revealed that 47.1% people used Wechat life services for paying phone bills, while 20.9% people used Wechat for purchasing movie tickets. Wechat life ser-vices are user friendly and mostly related to payment options and e-wallet. The most interesting feature of Wechat is its integration with your bank cards. So, you don’t have to take cash with you while going anywhere. Your smartphone with Wechat payment options works everywhere in Chi-na.
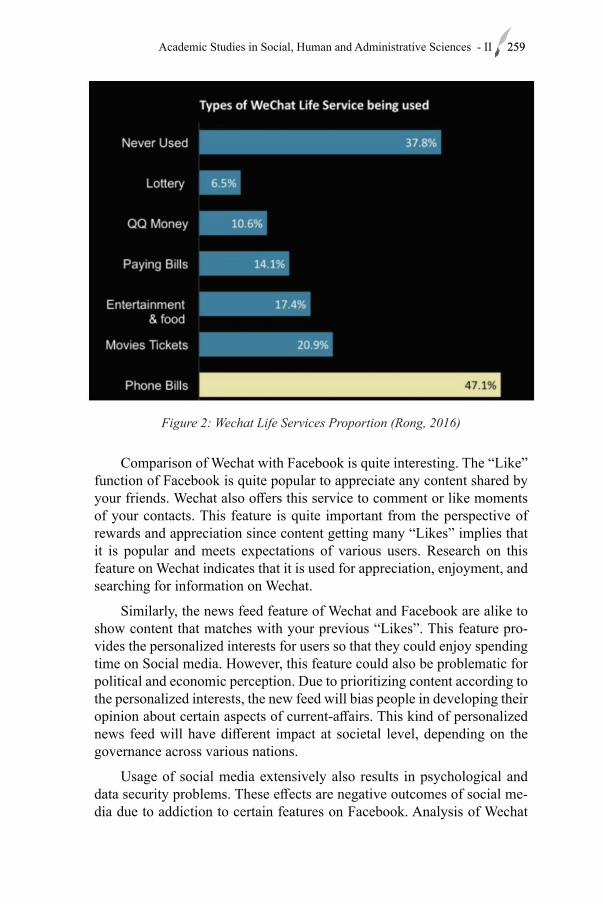
259Academic Studies in Social, Human and Administrative Sciences - II 259
Figure 2: Wechat Life Services Proportion (Rong, 2016)
Comparison of Wechat with Facebook is quite interesting. The “Like” function of Facebook is quite popular to appreciate any content shared by your friends. Wechat also offers this service to comment or like moments of your contacts. This feature is quite important from the perspective of rewards and appreciation since content getting many “Likes” implies that it is popular and meets expectations of various users. Research on this feature on Wechat indicates that it is used for appreciation, enjoyment, and searching for information on Wechat.
Similarly, the news feed feature of Wechat and Facebook are alike to show content that matches with your previous “Likes”. This feature pro-vides the personalized interests for users so that they could enjoy spending time on Social media. However, this feature could also be problematic for political and economic perception. Due to prioritizing content according to the personalized interests, the new feed will bias people in developing their opinion about certain aspects of current-affairs. This kind of personalized news feed will have different impact at societal level, depending on the governance across various nations.
Usage of social media extensively also results in psychological and data security problems. These effects are negative outcomes of social me-dia due to addiction to certain features on Facebook. Analysis of Wechat
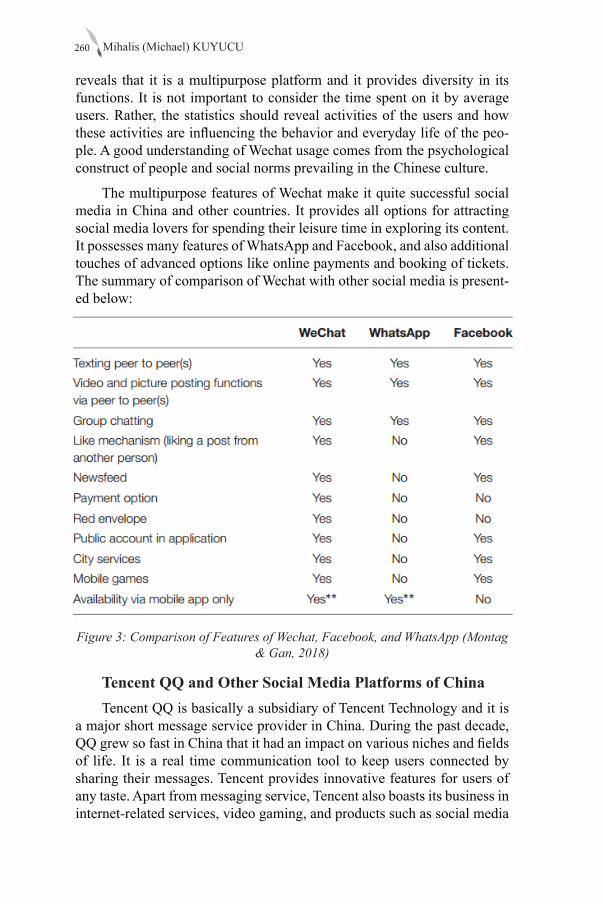
Mihalis (Michael) KUYUCU260
reveals that it is a multipurpose platform and it provides diversity in its functions. It is not important to consider the time spent on it by average users. Rather, the statistics should reveal activities of the users and how these activities are influencing the behavior and everyday life of the peo-ple. A good understanding of Wechat usage comes from the psychological construct of people and social norms prevailing in the Chinese culture.
The multipurpose features of Wechat make it quite successful social media in China and other countries. It provides all options for attracting social media lovers for spending their leisure time in exploring its content. It possesses many features of WhatsApp and Facebook, and also additional touches of advanced options like online payments and booking of tickets. The summary of comparison of Wechat with other social media is present-ed below:
Figure 3: Comparison of Features of Wechat, Facebook, and WhatsApp (Montag & Gan, 2018)
Tencent QQ and Other Social Media Platforms of ChinaTencent QQ is basically a subsidiary of Tencent Technology and it is
a major short message service provider in China. During the past decade, QQ grew so fast in China that it had an impact on various niches and fields of life. It is a real time communication tool to keep users connected by sharing their messages. Tencent provides innovative features for users of any taste. Apart from messaging service, Tencent also boasts its business in internet-related services, video gaming, and products such as social media
261Academic Studies in Social, Human and Administrative Sciences - II 261
and cloud computing.
The performance of QQ has been quite fast, but not smooth. It also suffered from scandals and downfalls due to controversy with Qihoo. The magazine China Computer World released plenty of negative literature about this social media. Despite a few shaky months, the social media were able to win its confidence as a giant leader in the Chinese internet industry.
When you analyze the Chinese market, you will explore the popularity of QQ as compared to Skype or MSN. Since its development in February 1999, it has become an integral part of life of many Chinese people. The key features of QQ include user-friendly features, elegant looking prod-ucts, and aware of the customer requirements. Apart from the messaging service, other facilities include QQ games, Q Coin, Q Zone, QQ Mail and so on. Due to its innovative features, it is one of the biggest social media brands in China.
The services of QQ are interesting and provide various innovative fea-tures to users. Firstly, Qzone is a blog which QQ users can access easily. Some blogs are free and some are paid that could be purchased with Q Coins. Qzone is somewhat similar to Facebook in the sense that both op-erate for social interaction and customization. QQ made Qzone interesting by including features like banners, music players, font options and much more. It is undoubtedly the next generation multimedia social space for Chinese users.
Another eminent social media product of Tencent, QQ Games pro-vides wonderful experience for Chinese people. It includes two main types: QQ platform with mostly casual games and non-QQ platform on-line games. It is one of the largest independent R&D platform for playing causal games. In order to seek attention of social media users, QQ games included various interesting options. Players can transform to a specific character in QQ games like Avatar. Users can also enjoy the animations within the game, while expressing their emotions. These animations make social media experience quite colorful. People can relax, enjoy, and utilize the fierce competing options.
There are various other QQ products like QQ Mail, 3G QQ, QQ An-ti-virus, input software, online TV, and so on. These services and products are introduced for brand recognition of Tencent. The purpose is to avail the bigger network effect. Tencent makes sure that different people with different social media requirements achieve something of their taste. For QQ users, most of the time is spent while observing the positive network effect. In spite of so many features, the interface of QQ is still immaculate. This is the reason why people would prefer QQ over other social media.
Mihalis (Michael) KUYUCU262
The services of QQ are not entirely free. It offers some paid services for adding another business niche in its market. The paid membership is called as “diamond”. With the help of these features, customers can enjoy some special features on the QQ platform. The colors and types of “dia-monds” decide the kind of membership. The highest-rated membership has red “diamonds” for which customers could avail free QQ Show costumes. When customers buy services, they are likely to use them more often and in turn spend more on other niches also.
QQ also launched international version in English, French and Japa-nese to grab attention of global customers. Later on, the Italian version of the QQ was also made available. In addition to the messenger, QQ services are also expanding to Asian countries and the USA. These are just a few options among a huge range of QQ services. However, the major target market of QQ lies in China. During recent times, Wechat has overtaken QQ in terms of popularity and users because it is a new forum with the lat-est features regarding enjoyment, communication, and interactive content. QQ was a pioneer for Chinese in social media, but Wechat is the modern leader in this game in China.
ConclusionThis article reviewed the historical background, the current situation,
important statistics, pros and cons, and different features of Chinese so-cial media. We highlighted the Chinese social media strategy in the light of governmental policies. Western social media forums are completely banned in China to promote native content, privacy of local political and social ideas, and preventing chaos in China through international media.
In order to serve the Chinese people with their social media require-ments, local Chinese companies like Tencent launched platforms like QQ, Wechat, Sina Weibo, Taobao, Renren, Kaixing, and many more. These ser-vices are similar in features and trends to their western counterparts like Facebook, Twitter, WhatsApp. The comparison of western social media with Chinese ones show that the latter services are quite competitive and even innovative in some features that western media don’t possess. The biggest example of creativity in social media of Chinese forums is integra-tion of e-wallet payment methods, and also the e-commerce. In conclusion, Chinese social media are quite powerful and satisfies the requirements of Chinese people in terms of their content sharing, information exchange, payment methods, tickets’ booking, gaming, e-commerce, and much more. With the help of these social media resources, online businesses could per-form marketing easily to promote their services and products. Finally, Chi-nese social media are laying the trend of global revolution in e-commerce and online business marketing.
263Academic Studies in Social, Human and Administrative Sciences - II 263
Among these social media platforms some of like wechat are also go-ing global. So, the growth of Chinese popularity in the world and growth of economy and its social impact in the globalization may bring a new opportunity to Chinese social media platforms for globalization. The main question here can be, ‘will Chine try to globalize its social media platforms to compete with the western social media platforms? Or will they only keep them to have an internal communication with the locals and promote the regime? Globalization of Chinese social media platforms may bring a big opportunity to the globalization of Chine as well as to re-position the Chinese impact in the world. But this also can be a disadvantage for the country. Because the trolls and other third parties may use these platforms to create their own agenda in Chine and to try to damage the regime. So this will be the question of the future for the global positioning of Chinese social media platforms.
ReferencesChiu, C., Ip, C., & Silverman, A. (2012). Understanding social media in
China, (March), 1–4.
Fei, X. (2016). Social Media in Chinese Tourism Industry, (March).
He, X., & Pedraza, R. (2015). Chinese social media strategies: Communication key features from a business perspective. El Profesional de La Información. 2015; 24 (2): 200-9.
Kristensen, A. E. (2013). Travel and social media in China: From transit hubs to stardom. Tourism Planning & Development, 10(2), 169–177.
Montag, C., & Gan, C. (2018). The Multipurpose Application WeChat : A Review on Recent Research, 9(December), 1–8. https://doi.org/10.3389/fpsyg.2018.02247
Rong, M. (2016). WeChat impact on social and economic in China.
Sun, H. (2013). Sina Weibo of China: From a copycat to a local uptake of a global technology assemblage. International Journal of Sociotechnology and Knowledge Development (IJSKD), 5(4), 27–37.
Wang, J. (2018). Analysis of Young Chinese Users of Sina Weibo Based on Uses and Gratifications Theory.
Xu, B., & Albert, E. (2014). Media censorship in China. Council on

Mihalis (Michael) KUYUCU264
Foreign Relations, 25, 243.
Zhou, L., & Wang, T. (2014). Social media: A new vehicle for city marketing in China. Cities, 37, 27–32.

Chapter 14SOURCES OF ENERGY AND THE SIGNIFICANCE OF
OIL1
Nazife Özge BEŞER2, Serdar ÖZTÜRK3,
1 This study was derived from a doctoral thesis titled “Oil Prices and Economic Growth: An Analysis on OECD Countries” completed in 2017.2 Prof. Dr., Nevşehir Hacı Bektaş Veli Üniversitesi, [email protected] Dr. Öğr. Üyesi, Ağrı İbrahim Çeçen Üniversitesi,


267Academic Studies in Social, Human and Administrative Sciences - II 267
INTRODUCTIONIn the late 19th century, oil gradually replaced coal which was the pri-
mary energy source for the first Industrial Revolution. Although patterns of consumption have changed over time and new sources of energy have emerged, oil has maintained its importance. In the first half of 21st century, despite increasing concerns regarding climate change both at an individual and a global scale, and the operational and governmental investments in sustainable sources of energy, oil and its derivatives continue to account for 97% of the energy needed for the production and usage of many every-day products, particularly the automobile.
The role of oil import and export cannot be ignored in China’s double digit economic growth despite a slower pace in recent years, as well as Russia’s overcoming of post Soviet economic crises. As oil occupies an important place in global energy consumption, its price serve as an indi-cator of the economic performance of countries. As a matter of course, the higher and the longer lasting the increases in oil prices, the greater its effect is on macroeconomic variables.
The embargo of several OPEC (Organization of the Petroleum Ex-porting Countries) member Arab states on Western countries in 1973 and the Iranian Revolution in 1978 led to oil crises and thus inflicted a heavy burden on global economy. Energy consumption that is essential for coun-tries to sustain their economic growth and reach their industrialization ob-jectives resulted in oil shocks and global economic stagnation. Increasing costs of energy led to growing debt especially especially in oil importer developing countries.
The growing world population is expected to double in the middle of this century, and almost all countries around the world are aiming for pos-itive economic growth. This economic development concentrated in the world is combined with increasing energy demand. Energy demand in a growing economy stems from various sectors such as agriculture, industry, commerce, transportation and housing. The growth of the world popula-tion and economic standards increases energy consumption. Since existing fossil energy sources are decreasing over time, new and renewable energy technologies should be developed and conventional technologies should be developed in order to meet the energy demand in the future.
DEFINITION AND SIGNIFICANCE OF ENERGYThe word energy derives from Greek energeia. In its lexical meaning,
it refers to being or doing something (Übelacker, 2005). Energy has been a factor of economic and social progress since the dawn of humanity. It has been a turning point several times in the history of humanity with the use
Nazife Özge BEŞER, Serdar ÖZTÜRK268
of fire, illumination of cities and the advance of nuclear physics (Cleve-land, 2009). Magnetism which allows for production of electricity was first discovered in China in 3000 B.C. Soon afterwards, bronze was obtained by mixing tin and copper. The first crude oil that was used by humans was found in pools which accumulated through leakages in the ground. Oil was used in Ancient Egypt for the purpose of preservation of mummies and as well as for carriages (Aydın, 2014). In the time of the Industrial Revolution, the use of steam engines increased the need for energy. Besides, the tran-sition to mass production resulted in the population density moving from rural to urban areas which in turn led to an increase in energy consumption. The rapid growth in most countries following World War II has also been a contributing factor in increasing demand for energy (Usta, 2016). The need for energy already had a great importance in the progress of develop-ing countries by 1950s and continued to rise after oil crises in 1970s (Prugh et al., 2005). In 1970s, the interest for energy increased further follow-ing the first oil crisis. In 1960, 11 oil exporting countries founded OPEC (Organization of Petroleum Exporting Countries) in order to monitor the production and price of oil. Following the stand the US and Europe took in favor of Israel in 1967 Arab-Israel War, OPEC member states began to turn to oil as a weapon against these countries. In January 1973, OPEC almost quadrupled the crude oil prices which stood at 1,8 USD per barrel (Aydın, 2014). This gave rise to search for alternative sources of energy.
Today, energy is considered a measure of economic progress and in-dustrialization (Başol, 1994). It is a contributing factor to economic growth and thus a highly important input. The energy producing sector creates added value as long as the entirety of the consumed energy is derived from domestic sources. This added value tends to be greater than the growth rate of economy and assists the economic progress as long as it is used efficiently in production. So long as the energy sector has high competitive capacity, economy keeps on demanding and consuming ever more energy. Higher energy consumption following productivity growth promote eco-nomic progress even more. Due to these reasons, energy consumption is a great determinant of economic growth (Saatçi & Dumrul, 2013).
Energy consumption increases by day in parallel to rising global popu-lation, urbanization, industrialization and advances in technology. Limited sources of energy rapidly decrease at a global scale in inverse correlation to increasing demand for energy. On the other hand, variables such as the global increase in population, varying rates of economic growth and the pursuit for high standards of living have resulted in differing levels of en-ergy need. Thus, developed, develeoping and underdeveloped countries differ in their demand for energy (T.C. Enerji ve Tabi Kaynaklar Bakanlığı, 2014). Within this context, Figure 1 shows primary energy consumption by region.
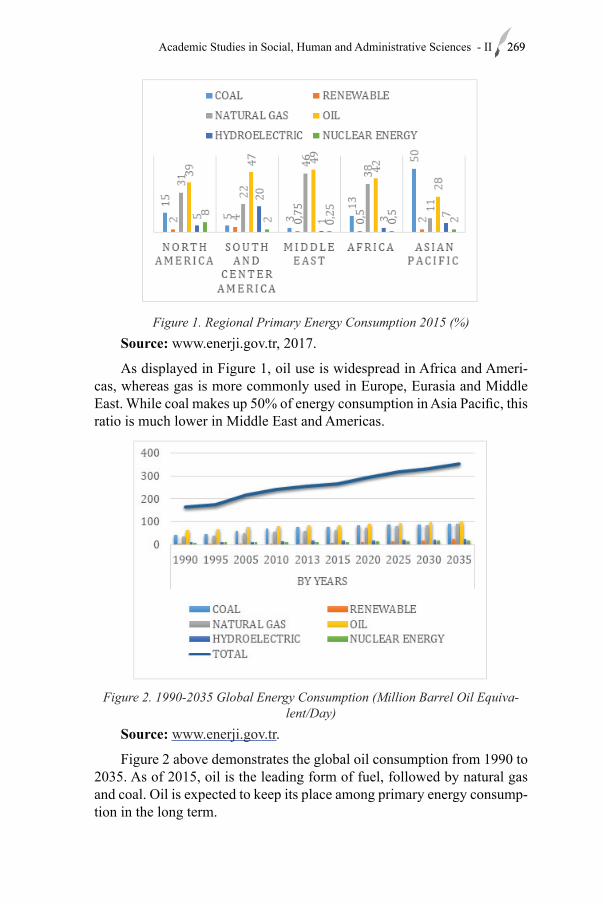
269Academic Studies in Social, Human and Administrative Sciences - II 269
Figure 1. Regional Primary Energy Consumption 2015 (%)Source: www.enerji.gov.tr, 2017.
As displayed in Figure 1, oil use is widespread in Africa and Ameri-cas, whereas gas is more commonly used in Europe, Eurasia and Middle East. While coal makes up 50% of energy consumption in Asia Pacific, this ratio is much lower in Middle East and Americas.
Figure 2. 1990-2035 Global Energy Consumption (Million Barrel Oil Equiva-lent/Day)
Source: www.enerji.gov.tr.
Figure 2 above demonstrates the global oil consumption from 1990 to 2035. As of 2015, oil is the leading form of fuel, followed by natural gas and coal. Oil is expected to keep its place among primary energy consump-tion in the long term.
Nazife Özge BEŞER, Serdar ÖZTÜRK270
NECESSARY CONDITIONS FOR ENERGY SECURITY AND ENERGY POLICIES There is no consensus provided in literature regarding the definition of
energy security. In its most widespread expression, energy security refers to securing economic energy sources sufficient for meeting a state’s vital neces-sities including cases of international crises and states of conflict. As stated by the working group at Council on Foreign Relations, “energy security is the continuous and uninterrupted supply of safe and economic energy”. In practice, it is understood that energy security covers “supplying of energy sources sufficient for basic needs as well as their delivery from the point of production to the end user without any obstacles” (Nogayeva, 2013).
International Energy Agency (IEA) defines energy security as “the uninterrupted availability of energy sources at an affordable price” (IEA, 2014). Energy security is multi-faceted. Whereas long term energy security is concerned mostly with investing in order to provide energy in parallel to economic developments and sustainable environmental needs; short term energy security investigates the ability of energy systems to react to abrubt changes in the supply and demand equilibrium (Öztürk et al., 2013).
According to World Bank, energy security means ensuring that countries can sustainably produce and use energy in order to reduce poverty reduction by facilitating economic growth and to directly improve peoples’ quality of life through broadening access to modern energy services (World Bank, 2005).
Energy security was brought to agenda following the oil crisis of 1970s. Subsequent to the founding of International Energy Agency in 1974, the notion of national energy security was officially proposed. Underlying this notion is the stability of crude oil supply and of price-guarantee. Kyoto Protocol which was signed in 1997 refers to energy security in addition to subjects around the protection of the environment and the provision of sustainable development. Thus energy security warrants coordinated and sustainable development, meeting of energy demand and providing for economic stability (Hu & Ge, 2014).
Energy security is closely connected with countries’ overall security. For this reason, it is one of the leading matters of discussion both at nation-al and international levels. Energy security as a concept requires contex-tualization of various prospects ranging from a terrorist attacks or power outage on energy distribution systems to obstacles caused by tornados and to the possibility of a civil war or an invasion (Sevim, 2012). The concept of energy security has changed with the influence of changes in the context of national security and it kept being extended with the inclusion of the security of oil supply in particular, as well as financial, technological, polit-ical, military, social and environmental dimensions all the way into 1990s.
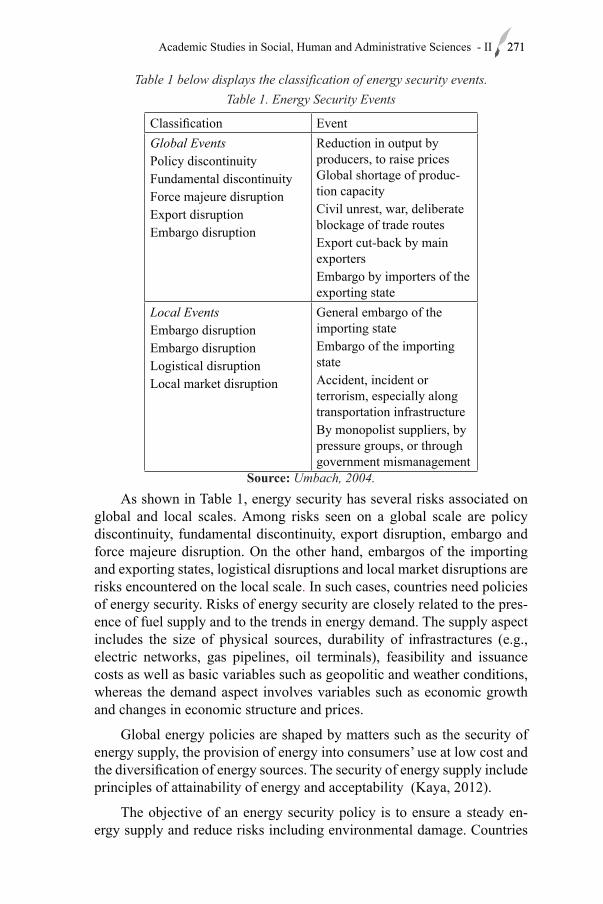
271Academic Studies in Social, Human and Administrative Sciences - II 271
Table 1 below displays the classification of energy security events. Table 1. Energy Security Events
Classification EventGlobal EventsPolicy discontinuityFundamental discontinuityForce majeure disruption Export disruption Embargo disruption
Reduction in output by producers, to raise prices Global shortage of produc-tion capacity Civil unrest, war, deliberate blockage of trade routes Export cut-back by main exporters Embargo by importers of the exporting state
Local EventsEmbargo disruption Embargo disruption Logistical disruption Local market disruption
General embargo of the importing stateEmbargo of the importing stateAccident, incident or terrorism, especially along transportation infrastructureBy monopolist suppliers, by pressure groups, or through government mismanagement
Source: Umbach, 2004.As shown in Table 1, energy security has several risks associated on
global and local scales. Among risks seen on a global scale are policy discontinuity, fundamental discontinuity, export disruption, embargo and force majeure disruption. On the other hand, embargos of the importing and exporting states, logistical disruptions and local market disruptions are risks encountered on the local scale. In such cases, countries need policies of energy security. Risks of energy security are closely related to the pres-ence of fuel supply and to the trends in energy demand. The supply aspect includes the size of physical sources, durability of infrastractures (e.g., electric networks, gas pipelines, oil terminals), feasibility and issuance costs as well as basic variables such as geopolitic and weather conditions, whereas the demand aspect involves variables such as economic growth and changes in economic structure and prices.
Global energy policies are shaped by matters such as the security of energy supply, the provision of energy into consumers’ use at low cost and the diversification of energy sources. The security of energy supply include principles of attainability of energy and acceptability (Kaya, 2012).
The objective of an energy security policy is to ensure a steady en-ergy supply and reduce risks including environmental damage. Countries
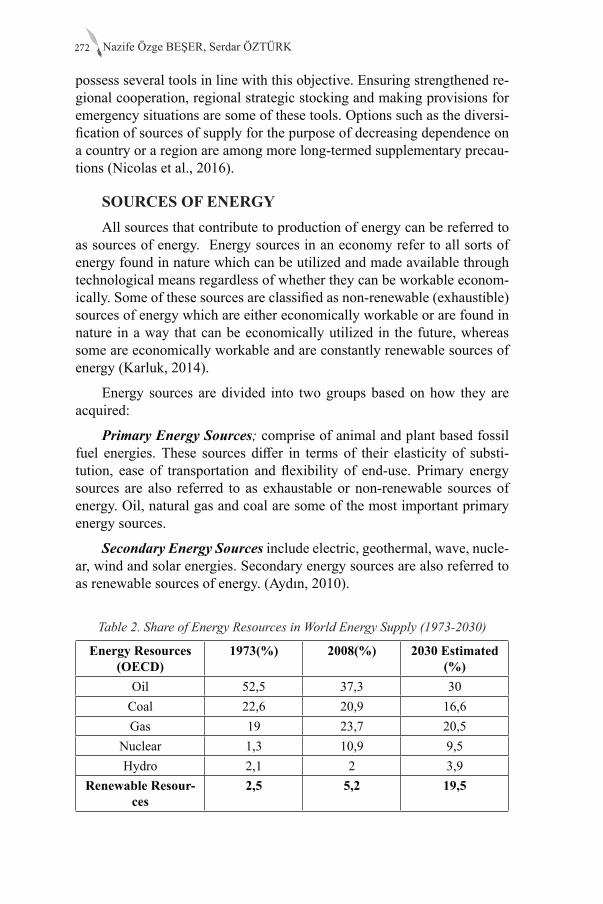
Nazife Özge BEŞER, Serdar ÖZTÜRK272
possess several tools in line with this objective. Ensuring strengthened re-gional cooperation, regional strategic stocking and making provisions for emergency situations are some of these tools. Options such as the diversi-fication of sources of supply for the purpose of decreasing dependence on a country or a region are among more long-termed supplementary precau-tions (Nicolas et al., 2016).
SOURCES OF ENERGYAll sources that contribute to production of energy can be referred to
as sources of energy. Energy sources in an economy refer to all sorts of energy found in nature which can be utilized and made available through technological means regardless of whether they can be workable econom-ically. Some of these sources are classified as non-renewable (exhaustible) sources of energy which are either economically workable or are found in nature in a way that can be economically utilized in the future, whereas some are economically workable and are constantly renewable sources of energy (Karluk, 2014).
Energy sources are divided into two groups based on how they are acquired:
Primary Energy Sources; comprise of animal and plant based fossil fuel energies. These sources differ in terms of their elasticity of substi-tution, ease of transportation and flexibility of end-use. Primary energy sources are also referred to as exhaustable or non-renewable sources of energy. Oil, natural gas and coal are some of the most important primary energy sources.
Secondary Energy Sources include electric, geothermal, wave, nucle-ar, wind and solar energies. Secondary energy sources are also referred to as renewable sources of energy. (Aydın, 2010).
Table 2. Share of Energy Resources in World Energy Supply (1973-2030)
Energy Resources (OECD)
1973(%) 2008(%) 2030 Estimated (%)
Oil 52,5 37,3 30Coal 22,6 20,9 16,6Gas 19 23,7 20,5
Nuclear 1,3 10,9 9,5Hydro 2,1 2 3,9
Renewable Resour-ces
2,5 5,2 19,5
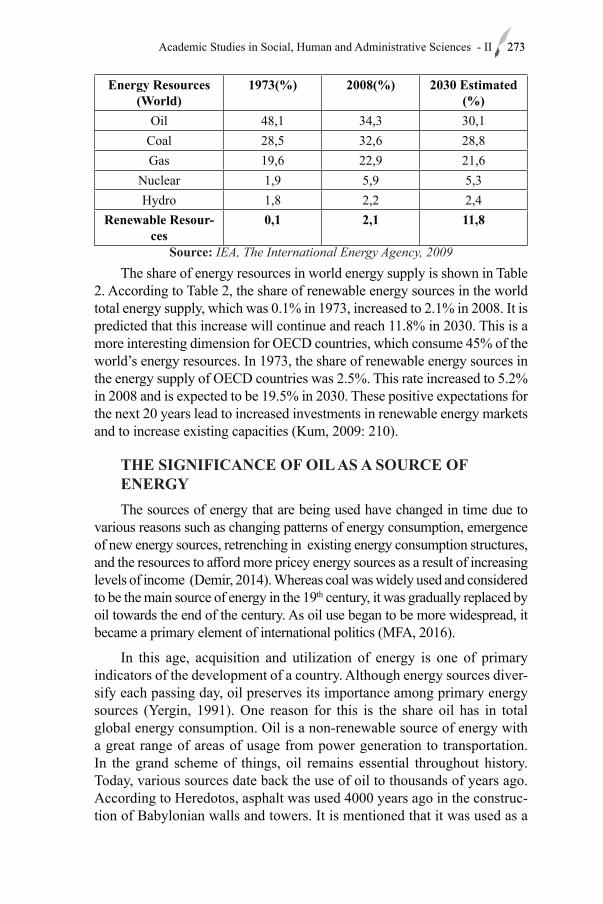
273Academic Studies in Social, Human and Administrative Sciences - II 273
Energy Resources (World)
1973(%) 2008(%) 2030 Estimated (%)
Oil 48,1 34,3 30,1Coal 28,5 32,6 28,8Gas 19,6 22,9 21,6
Nuclear 1,9 5,9 5,3Hydro 1,8 2,2 2,4
Renewable Resour-ces
0,1 2,1 11,8
Source: IEA, The International Energy Agency, 2009The share of energy resources in world energy supply is shown in Table
2. According to Table 2, the share of renewable energy sources in the world total energy supply, which was 0.1% in 1973, increased to 2.1% in 2008. It is predicted that this increase will continue and reach 11.8% in 2030. This is a more interesting dimension for OECD countries, which consume 45% of the world’s energy resources. In 1973, the share of renewable energy sources in the energy supply of OECD countries was 2.5%. This rate increased to 5.2% in 2008 and is expected to be 19.5% in 2030. These positive expectations for the next 20 years lead to increased investments in renewable energy markets and to increase existing capacities (Kum, 2009: 210).
THE SIGNIFICANCE OF OIL AS A SOURCE OF ENERGYThe sources of energy that are being used have changed in time due to
various reasons such as changing patterns of energy consumption, emergence of new energy sources, retrenching in existing energy consumption structures, and the resources to afford more pricey energy sources as a result of increasing levels of income (Demir, 2014). Whereas coal was widely used and considered to be the main source of energy in the 19th century, it was gradually replaced by oil towards the end of the century. As oil use began to be more widespread, it became a primary element of international politics (MFA, 2016).
In this age, acquisition and utilization of energy is one of primary indicators of the development of a country. Although energy sources diver-sify each passing day, oil preserves its importance among primary energy sources (Yergin, 1991). One reason for this is the share oil has in total global energy consumption. Oil is a non-renewable source of energy with a great range of areas of usage from power generation to transportation. In the grand scheme of things, oil remains essential throughout history. Today, various sources date back the use of oil to thousands of years ago. According to Heredotos, asphalt was used 4000 years ago in the construc-tion of Babylonian walls and towers. It is mentioned that it was used as a
Nazife Özge BEŞER, Serdar ÖZTÜRK274
preservative in cementation as well as an insulant in shipbuilding. Based on historical records, asphalt is known to have been used in embalmment in 300 B.C. Persian tablets reveal the use of oil by the Persian elite in illu-mination and in medicine (Yergin, 1991).
The first modern oil well was opened in Baku, Azerbaijan in 1848 (Pala, 2003). However, the emergence of oil as a source occured in Titus-ville on a Saturday afternoon, on August 27th in 1859 when the dark-col-ored liquid was discovered floating on water by Edwin Drake upon the drill entering a fracture as a 69 feet deep well was being drilled (Yergin, 1991). The discovery of oil led to the invention of the engine and so gave rise to the development of the automative industry. The number of vehicles has rapidly increased in the USA, the UK, England, France and Germany, thus oil claimed its place as the primary raw material of competition.
Early in the 20th century, countries have increasingly become depen-dent on energy sources to ensure their progress and industrialization. From this era onwards, oil began to be utilized in warships and thus the extra significance oil gained led developed countries to adapt different strategies in order to get hold of it. Energy and oil strategies affected international relations in various ways, which drove countries to take action either soli-tarily or in cooperation with others with regards to projects and agreements on various scenarios that are to be applied within the context of global competition (Alkin & Atman, 2006).
Starting in mid-20th century, the production center of oil moved to the Middle East and North Africa. By the end of this period, oil replaced coal as a cheaper input, which made it a highly important driving force for economic growth. In 1950s, a nationalization movement went into action in oil-pro-ducing countries which contributed to the foundation of OPEC and brought about the use of oil as a political weapon later in 1973-74 (MFA, 2016).
Global Oil Reserves Global annual oil production was at 150 million barrels in 1900. This
number reached 28 billion barrels by. A great portion of this increase was met by OPEC member countries in 1980s. 78% of global oil reserves are found in OPEC member countries whereas 16% are found in non-OPEC countries. OECD countries account for a share of 8% of reserves. 65,3% of oil reserves are found in the Middle East. Saudi Arabia alone accounts for 25% of reserves, followeed by Iraq with a share of 11% and United Arab Emirates, Kuwait and Iran with 9% each. (http://www.kamufinans.com/dunya-petrol-rezervlerinin-dagilimi/, 2016).
Annual oil production has reached its peak in most oil producer coun-tries. These countries utilize the reserve/production relation in order to pre-
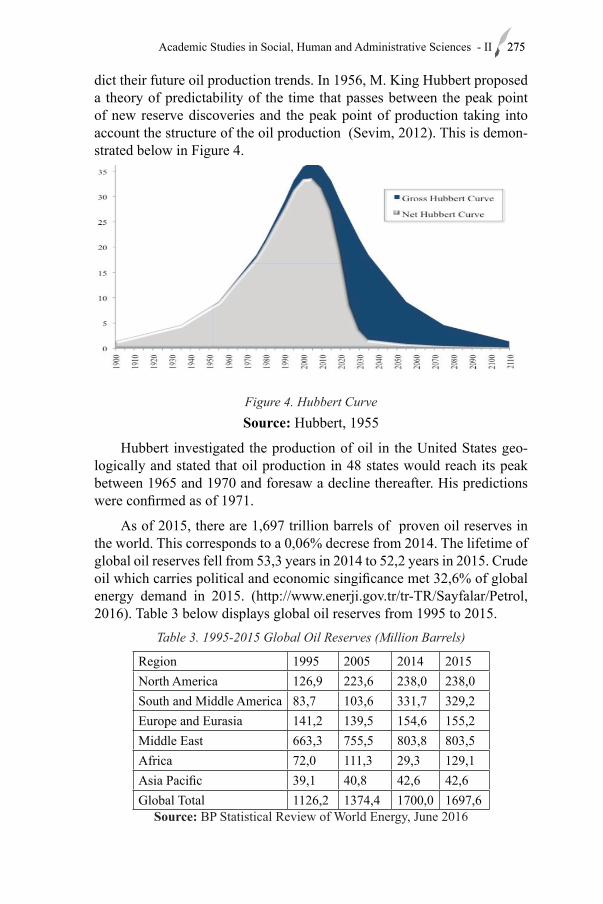
275Academic Studies in Social, Human and Administrative Sciences - II 275
dict their future oil production trends. In 1956, M. King Hubbert proposed a theory of predictability of the time that passes between the peak point of new reserve discoveries and the peak point of production taking into account the structure of the oil production (Sevim, 2012). This is demon-strated below in Figure 4.
Figure 4. Hubbert CurveSource: Hubbert, 1955
Hubbert investigated the production of oil in the United States geo-logically and stated that oil production in 48 states would reach its peak between 1965 and 1970 and foresaw a decline thereafter. His predictions were confirmed as of 1971.
As of 2015, there are 1,697 trillion barrels of proven oil reserves in the world. This corresponds to a 0,06% decrese from 2014. The lifetime of global oil reserves fell from 53,3 years in 2014 to 52,2 years in 2015. Crude oil which carries political and economic singificance met 32,6% of global energy demand in 2015. (http://www.enerji.gov.tr/tr-TR/Sayfalar/Petrol, 2016). Table 3 below displays global oil reserves from 1995 to 2015.
Table 3. 1995-2015 Global Oil Reserves (Million Barrels)
Region 1995 2005 2014 2015North America 126,9 223,6 238,0 238,0South and Middle America 83,7 103,6 331,7 329,2Europe and Eurasia 141,2 139,5 154,6 155,2Middle East 663,3 755,5 803,8 803,5Africa 72,0 111,3 29,3 129,1Asia Pacific 39,1 40,8 42,6 42,6Global Total 1126,2 1374,4 1700,0 1697,6
Source: BP Statistical Review of World Energy, June 2016
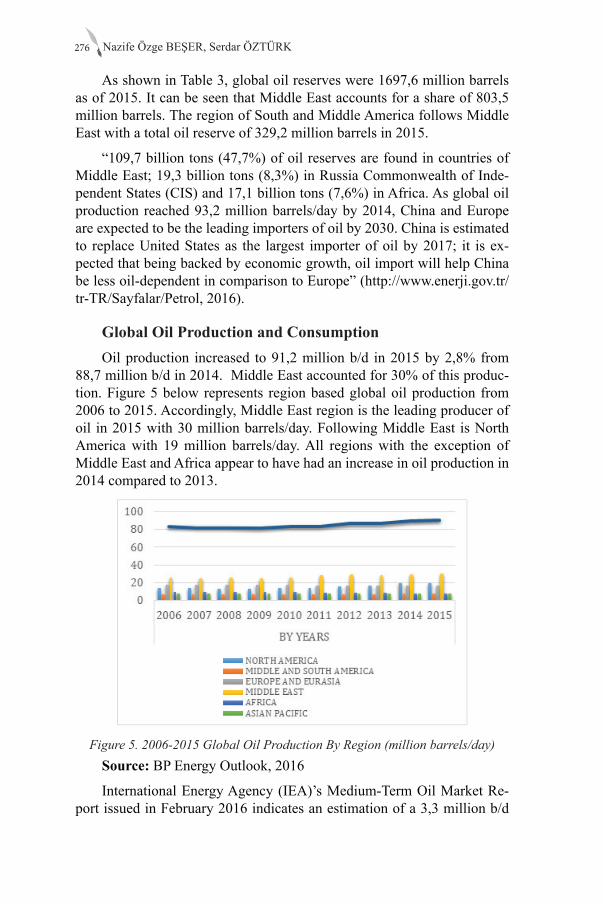
Nazife Özge BEŞER, Serdar ÖZTÜRK276
As shown in Table 3, global oil reserves were 1697,6 million barrels as of 2015. It can be seen that Middle East accounts for a share of 803,5 million barrels. The region of South and Middle America follows Middle East with a total oil reserve of 329,2 million barrels in 2015.
“109,7 billion tons (47,7%) of oil reserves are found in countries of Middle East; 19,3 billion tons (8,3%) in Russia Commonwealth of Inde-pendent States (CIS) and 17,1 billion tons (7,6%) in Africa. As global oil production reached 93,2 million barrels/day by 2014, China and Europe are expected to be the leading importers of oil by 2030. China is estimated to replace United States as the largest importer of oil by 2017; it is ex-pected that being backed by economic growth, oil import will help China be less oil-dependent in comparison to Europe” (http://www.enerji.gov.tr/tr-TR/Sayfalar/Petrol, 2016).
Global Oil Production and ConsumptionOil production increased to 91,2 million b/d in 2015 by 2,8% from
88,7 million b/d in 2014. Middle East accounted for 30% of this produc-tion. Figure 5 below represents region based global oil production from 2006 to 2015. Accordingly, Middle East region is the leading producer of oil in 2015 with 30 million barrels/day. Following Middle East is North America with 19 million barrels/day. All regions with the exception of Middle East and Africa appear to have had an increase in oil production in 2014 compared to 2013.
Figure 5. 2006-2015 Global Oil Production By Region (million barrels/day)Source: BP Energy Outlook, 2016
International Energy Agency (IEA)’s Medium-Term Oil Market Re-port issued in February 2016 indicates an estimation of a 3,3 million b/d
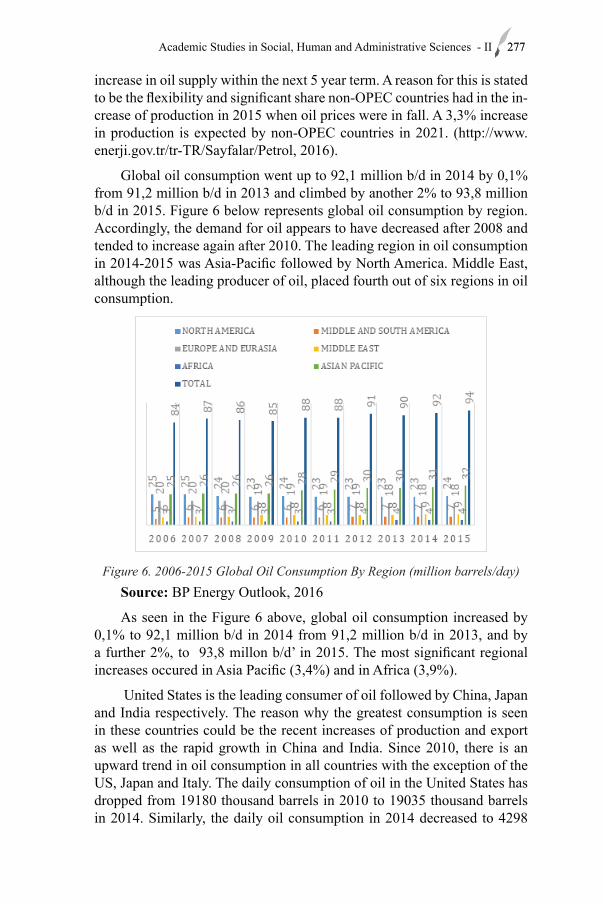
277Academic Studies in Social, Human and Administrative Sciences - II 277
increase in oil supply within the next 5 year term. A reason for this is stated to be the flexibility and significant share non-OPEC countries had in the in-crease of production in 2015 when oil prices were in fall. A 3,3% increase in production is expected by non-OPEC countries in 2021. (http://www.enerji.gov.tr/tr-TR/Sayfalar/Petrol, 2016).
Global oil consumption went up to 92,1 million b/d in 2014 by 0,1% from 91,2 million b/d in 2013 and climbed by another 2% to 93,8 million b/d in 2015. Figure 6 below represents global oil consumption by region. Accordingly, the demand for oil appears to have decreased after 2008 and tended to increase again after 2010. The leading region in oil consumption in 2014-2015 was Asia-Pacific followed by North America. Middle East, although the leading producer of oil, placed fourth out of six regions in oil consumption.
Figure 6. 2006-2015 Global Oil Consumption By Region (million barrels/day)Source: BP Energy Outlook, 2016
As seen in the Figure 6 above, global oil consumption increased by 0,1% to 92,1 million b/d in 2014 from 91,2 million b/d in 2013, and by a further 2%, to 93,8 millon b/d’ in 2015. The most significant regional increases occured in Asia Pacific (3,4%) and in Africa (3,9%).
United States is the leading consumer of oil followed by China, Japan and India respectively. The reason why the greatest consumption is seen in these countries could be the recent increases of production and export as well as the rapid growth in China and India. Since 2010, there is an upward trend in oil consumption in all countries with the exception of the US, Japan and Italy. The daily consumption of oil in the United States has dropped from 19180 thousand barrels in 2010 to 19035 thousand barrels in 2014. Similarly, the daily oil consumption in 2014 decreased to 4298
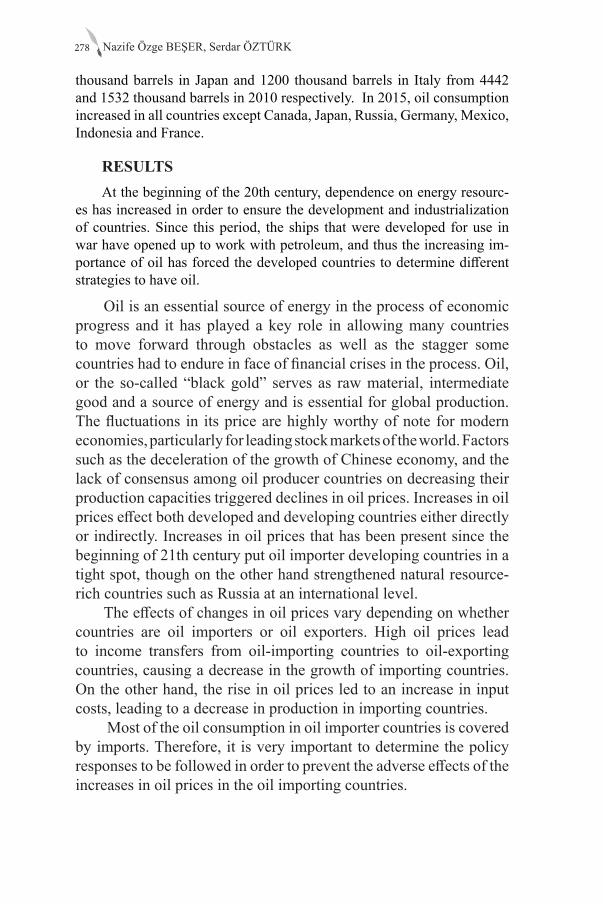
Nazife Özge BEŞER, Serdar ÖZTÜRK278
thousand barrels in Japan and 1200 thousand barrels in Italy from 4442 and 1532 thousand barrels in 2010 respectively. In 2015, oil consumption increased in all countries except Canada, Japan, Russia, Germany, Mexico, Indonesia and France.
RESULTSAt the beginning of the 20th century, dependence on energy resourc-
es has increased in order to ensure the development and industrialization of countries. Since this period, the ships that were developed for use in war have opened up to work with petroleum, and thus the increasing im-portance of oil has forced the developed countries to determine different strategies to have oil.
Oil is an essential source of energy in the process of economic progress and it has played a key role in allowing many countries to move forward through obstacles as well as the stagger some countries had to endure in face of financial crises in the process. Oil, or the so-called “black gold” serves as raw material, intermediate good and a source of energy and is essential for global production. The fluctuations in its price are highly worthy of note for modern economies, particularly for leading stock markets of the world. Factors such as the deceleration of the growth of Chinese economy, and the lack of consensus among oil producer countries on decreasing their production capacities triggered declines in oil prices. Increases in oil prices effect both developed and developing countries either directly or indirectly. Increases in oil prices that has been present since the beginning of 21th century put oil importer developing countries in a tight spot, though on the other hand strengthened natural resource-rich countries such as Russia at an international level.
The effects of changes in oil prices vary depending on whether countries are oil importers or oil exporters. High oil prices lead to income transfers from oil-importing countries to oil-exporting countries, causing a decrease in the growth of importing countries. On the other hand, the rise in oil prices led to an increase in input costs, leading to a decrease in production in importing countries.
Most of the oil consumption in oil importer countries is covered by imports. Therefore, it is very important to determine the policy responses to be followed in order to prevent the adverse effects of the increases in oil prices in the oil importing countries.
279Academic Studies in Social, Human and Administrative Sciences - II 279
REFERENCES1. A. Nogayeva, “Orta Asya’ da ABD, Rusya ve Çin Stratejik Denge
Arayışları”, İstanbul: Usak Yayınları, 2013.2. BP Statistical Review of World Energy 2016. Full Report (2016) BP.
http://www.bp.com/content/dam/bp/pdf/energy-economics/statistical-review-2016/bp-statistical-review-of-world-energy-2016-full-report.pdf (Accessed Date: 31 December 2016).
3. C. J. Cleveland, “Concise Encyclopedia of History of Energy”, San Diego, USA: Elsevier Press, 2009.
4. C. Pala 2003. 21. Yüzyıl Dünya Enerji Dengesinde Petrol ve Doğal Gazın Yeri ve Önemi: Hazar Boru Hatlarının Kesişme Noktasında Türkiye. 21. Yüzyıl Türkiye Enstitüsü. http://www.21yyte.org/assets/uploads/files/005-37%20Cenk.pdf (Accessed Date: 22 Nowember 2016).
5. C. Sevim, “Küresel Enerji Jeopolitiği ve Enerji Güvenliği”, Journal of Yasar University , 26(7): 4378 – 4391, 2012.
6. C. Usta, “Türkiye’de Enerji Tüketimi ve Ekonomik Büyüme İlişkisinin Bölgesel Analizi”, Uluslararası Ekonomi ve Yenilik Dergisi , 2(2):181-201, 2016.
7. D. Yergin, The Prize: The Epic Quest for Oil, Money and Power. New York: Simon & Schuster Building, Rockefeller Center, 1991.
8. E. Übelacker, “Enerji”, çev. Erdoğan A. U. İzmir: TUDEM Yayınları. 2005.
9. F. Umbach, “Global energy supply and geopolitical challenges”, Asia and Europe- Cooperating for Energy Security, Open Access Repository, pp.7, 2004.
10. F. F. Aydın, “Enerji Tüketimi ve Ekonomik Büyüme”, Erciyes Üniversitesi İktisadi ve İdari Bilimler Fakültesi Dergisi , 35:317-340, 2010.
11. F. Nicolas, Godement, F. T. Yakushiji, “Asia-Europe Cooperation on Energy Security An Overview of Options and Challenges”. http://www.iaea.org/inis/collection/NCLCollectionStore/_Public/37/121/37121774.pdf (Accessed Date:12 May 2016).
12. H. Kum, “Yenilenebilir Enerji Kaynakları: Dünya Piyasalarındaki Son Gelişmeler ve Politikalar”, Erciyes Üniversitesi İktisadi ve İdari Bilimler Fakültesi Dergisi, 33:207-223, 2009.
13. İ. Demir, “Uluslararası Petrol Politikaları, Piyasaları, Fiyatları”, Bursa: Dora Yayınevi, 2014.
14. İ. S. Kaya, “Uluslararası Enerji Politikalarına Bir Bakış: Türkiye Örneği”, Uluslararası Enerji Hukuku Sempozyumu, Mersin 2012, 269-288.
15. K. Alkin, S. Atman, “Küresel Petrol Stratejilerinin Jeopolitik Açıdan Dünya ve Türkiye Üzerindeki Etkileri”, İstanbul Ticaret Odası, Yayın
Nazife Özge BEŞER, Serdar ÖZTÜRK280
No: 48 :22, 2006.16. K. Başol, “Doğal Kaynaklar Ekonomisi”, Doğal Kaynaklar, Enerji ve
Çevre Sorunları, İzmir, Genişletilmiş 2. Baskı, 1994.17. L. Aydın, “Enerji Ekonomisi ve Politikaları”, Ankara: Seçkin Yayıncılık,
2014.18. M. K. Hubbert 1955. Nuclear Energy and the Fossil Fuels. www.
hubbertpeak.com/hubbert/1956/1956.pdf (Accessed Date: 10 December 2016).
19. M. Saatçi, Y. Dumrul, “Elektrik Tüketimi ve Ekonomik Büyüme İlişkisinin Dinamik Bir Analizi: Türkiye Örneği”, Uludağ Üniversitesi İktisadi ve İdari Bilimler Fakültesi Dergisi, Cilt/Vol. XXXII, Sayı/No. 2:1-24, 2013.
20. R. Karluk, “Türkiye Ekonomisi Cumhuriyet’in İlanından Günümüze Yapısal Dönüşüm”, İstanbul: Beta Basım Yayım, 2014.
21. S. Öztürk, A. Sözdemir, Ö. Ülger, “The Real Crisis Waiting for the World: Oil Problem and Energy Security”, International Journal of Energy Economics and Policy , 3:74-79, 2013.
22. T. Prugh, C. Flavin, J. L. Savin, “Petrol Ekonomisini Değiştirmek, Dünyanın Durumu 2005 Küresel Güvenliği Yeniden Tanımlamak”, TEMA Vakfı Yayınları, İstanbul , 125-153, 2005.
23. T.C. Enerji ve Tabii Kaynaklar Bakanlığı 2014. http://www.enerji.gov.tr/tr-TR/Sayfalar/Petrol (Accessed Date: 31 December 2016).
24. Z. Hu, Y. Ge, “The Geopolitical Energy Security Evaluation Method and a China Case Application Based on Politics of Scale”, Mdpi, Sustainability , 6:5682-5696, 2014.
25. http://www.mfa.gov.tr/enerji-diplomasisi.tr.mfa (Accessed Date: 30 December 2016).

Chapter 15ACADEMIC PROCRASTINATION AND SELF-HANDICAPPING AS MEDIATORS FOR THE
EFFECT OF PERFECTIONISM ON ACADEMIC ACHIEVEMENT
Nur TALUY1
1 Assistant Prof., Mugla Sitki Kocman University, [email protected]

283Academic Studies in Social, Human and Administrative Sciences - II 283
People put great effort into reaching perfection, and this behavior is an important field of study in psychology literature. Perfectionism, which has a multidimensional structure, has been defined as a personality trait that is associated with aspirations for flawlessness, overly high standards and the interpretation of one’s behavior through a critical lens (Flett and Hewitt, 2002). Perfectionism was first examined in detail by personality theorists (Blatt, 1995; Freud, 1959; Hamachek, 1978), and the issue was then taken up by contemporary theorists (e.g. Frost, Marten, Lahart and Rosenblate, 1990; Hewitt and Flett, 1991a; 1991b; 1993; 2002; Slaney, Rice, Mob-ley, Trippi and Ashby, 2001), whose findings related to perfectionism were mostly negative (e.g., Frost et al., 1990; Hewitt and Flett, 1991a; 1991b; 1993; Yorulmaz, 2002). The first attempts to measure perfectionism as a multidimensional construct were Frost et al. (1990), followed shortly thereafter by Hewitt and Flett (1991a), who developed a new multidimen-sional perfectionism scale that took into account both the personal and interpersonal aspects of perfectionism. Hewitt and Flett’s (1991a) multidi-mensional scale contain the three dimensions of self-oriented perfection-ism, other-oriented perfectionism, and socially prescribed perfectionism.
Self-oriented perfectionism involves the belief that striving for perfec-tionism and being perfect are important for an individual, and the individ-ual thus sets overly high standards for themselves. Other-oriented perfec-tionism concerns an individual’s beliefs regarding the skills of others, and involves high expectations from others. Socially prescribed perfectionism, on the other hand, refers to the belief that other people set overly high standards for the individual in question, in which acceptance by others is dependent upon meeting these standards (Hewitt and Flett, 1991a, 2002). Aside from the negative effects of self-blame, and symptoms of depression (Hewitt, Mittelstaed and Flett, 1990; Wheeler, Blankstein, Antony, McCabe and Bieling, 2011) and anorexia (Cockell, Hewitt, Seal, Sherry, Goldner, Flett, and Remick, 2002; Davis, Kaptein, Kaplan, Olmsted and Woodside, 1998; Hewitt and Flett, 2007; Hewitt, Flett and Ediger, 1995), self-oriented perfectionism also has some positive effects, such as aspirations for suc-cess, and the development of self-esteem (Hewitt and Flett, 1991a; 1993; Oral, 1999; Neumeister, 2004; Stoeber and Otto, 2006), intrinsic motiva-tion (Einstein, Lovibond and Gaston, 2000; Stoeber, Feast and Hayward, 2009), academic achievement (Blankstein and Dunkley, 2002; Cox, Enns and Clara, 2002; Flett, Blankstein and Hewitt, 2009), self-control (Flett, Hewitt, Blankstein and O’Brien, 1991) and adaptive social skills (Flett, Hewitt and DeRosa, 1996). Furthermore, some studies have reported that self-oriented perfectionism is related to positive or adaptive perfectionism (Frost, Heimberg, Holt, Mattia and Neubauer, 1993). In her study of highly talented college students, Neumeister (2004) argued that self-oriented per-fectionism can lead to mastery and performance-oriented goals.
Nur TALUY284
Studies of other-oriented perfectionism also report both positive and negative aspects. In addition to negative traits such as authoritarianism (Yadegarfard and Yadegarfard, 2016), social distance (Hewitt, Flett and Turnball, 1992), low agreeableness (Hill, McIntire and Bacharach, 1997; Sherry, Hewitt, Flett, Lee-Baggley, and Hall, 2007), interpersonal prob-lems (Hewitt and Flett, 2007), eating disorders, assigning hostility toward others, lack of trust and blame (Franco-Paredes, Mancilla-Diaz, Vazquez, Lopez ve Alvarez, 2005), this dimension is also associated with such positive traits as the ability to motivate and lead others (Franco-Paredes, et al., 2005), academic achievement (Flett,et al., 2009) and assertiveness (Flett,et al., 1996). In short, studies report that both self-oriented perfec-tionism and to a lesser extent, other-oriented perfectionism are associated with adaptive and positive traits (Flett and Hewitt, 2002; Flett, et al., 1996). Other-oriented perfectionism, in contrast, is overlooked in most studies into the clinical importance of multidimensional perfectionism (Dunk-ley, Blankstein, Masheb and Grilo, 2006). Many recent studies examining Hewitt and Flett’s (1991a) multidimensional model of perfectionism have focused on comparing self-oriented perfectionism and socially prescribed perfectionism, paying less attention to other-oriented perfectionism (eg. Miquelon, Vallerand, Grouzet and Cardinal, 2005; Powers, Koestner and Topciu, 2005).
There have also been previous studies reporting that socially prescribed perfectionism is associated with anxious, overly protective, affectionless and harsh parenting (Flett, Hewitt, Oliver ve Macdonald, 2002); destructive relationship responses and the depersonalization of and obsessive behavior toward a partner (Flett, Hewitt, Shapiro, and Rayman, 2001); as well as sui-cidal tendencies (Hamilton and Schweitzer, 2000; Hewitt, Caelian, Chen and Flett, 2014; Hewitt, Newton, Flett and Callander, 1997; Roxborough, Hewitt, Kaldas et al., 2012). There have also been numerous studies reporting that socially prescribed perfectionism is more negative than self-oriented perfec-tionism, and is more strongly associated with relationship discord (Flett et al., 2001; Klibert, Langhinrichsen-Rohling, and Saito, 2005; Sherry, Hewitt, Flett, and Harvey, 2003). According to Neumeister (2004), self-oriented perfectionists are motivated to achieve success, whereas socially prescribed perfectionists are motivated to avoid failure by setting both performance-ori-ented and performance-avoidant targets. Frost et al. (1993) found that the results of measurements conducted using their multidimensional scale were closely related to those conducted using the multidimensional scale of per-fectionism developed by Hewitt and Flett (1991a). The authors found that self-oriented perfectionism, other-oriented perfectionism, personal standards and order were clustered together as a factor reflecting the more positive as-pects of perfectionism, whereas socially prescribed perfectionism, concern
285Academic Studies in Social, Human and Administrative Sciences - II 285
over mistakes, doubts about actions, parental criticism and parental expecta-tions were clustered together as a factor reflecting the more negative aspects of perfectionism. According to Klibert et al. (2005), self-oriented perfec-tionism can be viewed as a positive trait only when it is not accompanied by socially prescribed perfectionism. Similarly, many studies (Dunkley et al., 2006; Sherry, et al., 2003) have reported that self-oriented perfectionism cannot be a good predictor of positive perfectionism if it overlaps with so-cially prescribed perfectionism, or if self-criticism is not kept under control.
Perfectionism can also lead to procrastination, as another negative tendency. According to Flett, Hewitt and Martin (1995), procrastination is closely related to perfectionism, in that it involves a tendency to set high standards. Accordingly, many researchers who share this view have stud-ied perfectionism and procrastination together (E.g., Bong, Hwang, Noh, and Kim, 2014; Smith, Sherry, Saklofske, and Mushqaush, 2017; Solomon and Rothblum, 1984, Walsh and Ugumba-Agwunobi, 2002).
The Relationship between Procrastination, Academic Procrastination and PerfectionismProcrastination is defined as the postponement of tasks to the last min-
ute (Solomon and Rothblum, 1984), or the voluntary delaying in taking an intended action, despite the potential for negative consequences (Steel, 2007). Solomon and Rothblum (1984) argue that the process of procrasti-nation results from worries about harsh judgments and evaluations. People are reported to procrastinate more when faced with tasks that are viewed as inconvenient, boring or difficult (Milgram, Sroloff and Rosenbaum, 1988). Different causes are identified for procrastination (Ferrari and Díaz-Morales, 2007), but both perfectionism and procrastination are thought to be linked to an excessive fear of failure (Flett, Blankstein, Hewitt and Koledin, 1992; Solomon and Rothblum, 1984). Procrastination has been found to be associated with higher levels of depression (Saddler and Sacks, 1993), and with higher anxiety (Haycock, McCarty and Skay,1998) and concern (Stöber ve Joormann, 2001) and with lower self-esteem (Ferrari, 1991) in populations. According to Burka and Yuen (1983), perfectionists set unrealistically high standards for themselves, and procrastinate due to their belief that they cannot meet these standards. According to another view, perfectionist individuals tend to procrastinate because they fear be-ing compared to their peers, as there can be no failure or insufficiency if a task is not attempted (Closson and Boutilier, 2017). This behavioral pat-tern indicates that procrastinators may have low levels of self-esteem. The idea that lower levels of self-esteem would be associated with a stronger tendency to procrastinate is supported also by research findings (Ferrari, 1991; 1994). The socially prescribed dimension of perfectionism in partic-
Nur TALUY286
ular is a strong predictor of procrastination. Flett et al. (1992) found that people who scored higher in socially prescribed perfectionism reported en-gaging in more procrastination than self-oriented perfectionists. In another study, Closson and Boutilier (2017) found that socially prescribed perfec-tionism was positively related to procrastination and negatively related to academic participation, whereas self-oriented perfectionism was related negatively with procrastination.
Academic procrastination is common among college students (Solomon and Rothblum, 1984), defined as postponing such academic tasks as pre-paring for an exam or turning in homework, waiting until to the last min-ute (Milgram, Mey-Tal and Levinson, 1998; Schouwenburg, 1995), and the intentional delaying of academic tasks out of a fear of making mistakes (Senecal, Koestner and Vallerand, 1995). The tendency for academic pro-crastination has been found to have a negative relationship with self-esteem (Beswick, Rothblum and Mann, 1988; Lekich, 2006). College students who tend to procrastinate receive lower academic scores than non-procrastinators (Steel, 2007), although the relationship between the tendency for academ-ic procrastination and academic achievement may be stronger or weaker, depending on the overall and performance-related self-esteem levels of stu-dents (Balkıs and Duru, 2010). There have been many studies reporting a negative relationship between procrastination and academic performance (Balkıs, Duru, Buluş and Duru, 2008; Beck, Koons and Milgrim, 2000; Lakshminarayan, Potdar and Reddy, 2013; Moon and Illingworth, 2005; Van Eerde, 2003; Wang and Englander, 2010). Among college students, in particular, higher levels of perfectionism are associated with higher levels of academic procrastination (Jadidi, Mohammadkhani ve Tajrishi, 2011). There are also studies reporting academic procrastination to have a significant and positive relationship with non-adaptive, socially prescribed perfectionism (Bong et al., 2014; Burns, Dittman, Nguyen and Mitchelson, 2000; Çakıcı, 2003; Saddler and Sacks, 1993; Wernicke, 1999), and a negative relationship with self-oriented perfectionism (Sula Ataş and Kumcağız, 2019; Bong et al., 2014; Closson and Boutilier, 2017; Çakıcı, 2003; Özer and Altun, 2011).
In addition to having perfectionist personality traits, people who report engaging in frequent procrastination display self-handicapping behavior (Fer-rari and Tice, 2000), make up excuses (Ferrari, 1993), and identify factors oth-er than their own performance as the reason for delay (Ferrari, Johnson, and McCown, 1995). These are reminiscent of self-handicapping behaviors.
The Relationship between Self-Handicapping and PerfectionismDefined by Zuckermann and Tsai (2005) as the creation of handicaps
that threaten the optimum performance of a task, the concept of self-hand-
287Academic Studies in Social, Human and Administrative Sciences - II 287
icapping was first raised by Berglas and Jones (1978), who argued that individuals engage a self-handicapping actions or performance choices do so to create an excuse or an opportunity to externalize failure and to internalize success. Most researchers argue that people who engage in self-handicapping behaviors do so to protect themselves from the negative effects of failure (Eg., Berglas and Jones, 1978; Covington, 1992; Green-berg, 1985; Urdan and Midgley, 2001). Self-handicappers create handicaps to their performance in order to avoid a situation that may negate their desired self-concept (Rhodewalt and Davison, 1986). Thus, according to Berglas and Jones (1978), any potential failure can be attributed to the ex-ternally created handicap, rather than to a deficiency of the person. If, on the other hand, the person succeeds despite the handicap, this would be an advantage, in that the success can be attributed to the person themselves. Self-handicapping is seen in individuals who lack confidence in their abil-ities, and as a behavior undertaken prior to the worrying event in question (Greenberg, 1985). Moreover, the more importance attributed to an event, the more worrying it becomes, and the more effective the self-handicap-ping mechanism (Greenberg, 1985). According to Urdan and Midgley (2001), self-handicapping can serve as a strategy of self-presentation as a means of manipulating the perceptions of others so that one’s deficien-cies are not revealed, or as a self-preservation strategy. Self-handicapping is a way of preserving self-esteem, but is also a destructive strategy that hampers self-awareness and prevents effort and taking responsibility, and by using this strategy, the individual facilitates the attribution of both fail-ure and success (Hirt, Deppe and Gordon, 1991). With self-handicapping strategies, a student can create obstacles to future success, and then attri-bute failure to these obstacles rather than to their lack of skills. Thus, the student shifts attribution from internal to external factors, and creates a defense mechanism for the preservation of self-confidence in the face of potential failure or low performance (Bobo, Whitaker and Strunk, 2013). Among student populations, self-handicapping is associated with weak adaptation and academic failure (Garcia, 1995; Zuckerman, Kieffer and Knee, 1998). Zuckerman et al. (1998) found that self-handicappers had lower performance and worse study habits than those who did not engage in self-handicapping, and had also lower self-esteem. Garcia (1995), on the other hand, reports that self-handicappers have low intrinsic motivation and bad time-management practices.
One of the most common self-handicapping strategies employed by students is procrastination. Studies of procrastination have reported that college students procrastinate more when they are worried about academic tasks, and procrastination is very common in the case of homework (Eg., Ellis and Knaus, 1977; Onwuegbuzie, 2004; Solomon and Rothblum, 1984; Özer, Demir, and Ferrari; 2009). Beck, Koons and Milgrim (2000) report
Nur TALUY288
that people who self-handicap more, spending less time studying and pre-paring for exams, also tend to procrastinate more than people who display fewer self-handicapping behaviors. Similarly, Ferrari and Tice (2000) re-port that procrastinators spend less time preparing for exams, and if they are assigned tasks that require cognitive skills, they tend to self-handicap by spending more time on fun and alternative tasks. Perfectionism, on the other hand, is considered to be one of the reasons underlying self-handi-capping behavior among students (Kearns, Forbes, Gardiner and Marshall, 2008; Stewart and Degeorge-Walker, 2014). Kearns et al. (2008) found that not all perfectionist students engage in self-handicapping, but they have a higher tendency to display such behaviors. The authors also report that students who desire to be perfect, and to be perceived as such, are more likely to engage in self-handicapping if they are also worried about their self-images. They argue that perfectionists in particular self-handicap out of a fear of failure when they believe they may fail to perform well, in order to mask potential failure. There have been many studies identify-ing a positive relationship between self-handicapping and perfectionism, and a negative relationship with academic achievement (Hobden and Plin-er, 1995; Karner-Huţuleac, 2014; Zuckerman et al., 1998). In a study by Hobden and Pliner (1995) in which they made use of Hewitt and Flett’s (1991a) scale to examine the relationship between multidimensional per-fectionism and self-handicapping, it was found that students with self-ori-ented and socially prescribed perfectionism were more likely to display self-handicapping behaviors. Self-oriented perfectionists use handicapping for self-protection, whereas socially prescribed perfectionists self-hand-icap out of a fear of self-presentation. People with non-adaptive perfec-tionist tendencies frequently engage in self-handicapping in order to avoid threats to their self-esteem (Stewart and Degeorge- Walker, 2014). Puldorf, Johnson and Awaida (2004) conducted an intercultural study in which they found that self-oriented perfectionism and self-esteem were major predic-tors of self-handicapping in both the Lebanese and British cultures, and that self-handicapping was partially a result of self-doubt.
Perfectionism, when faced with unrealistic expectations and goals, can lead to procrastination and self-handicapping among stu-dents, and thus lower academic achievement. The present study ex-amines procrastination and self-handicapping as mediators for the effect of perfectionism on academic performance.
Method
The Research Process and Participants
This study has a relational research design. The participants were col-
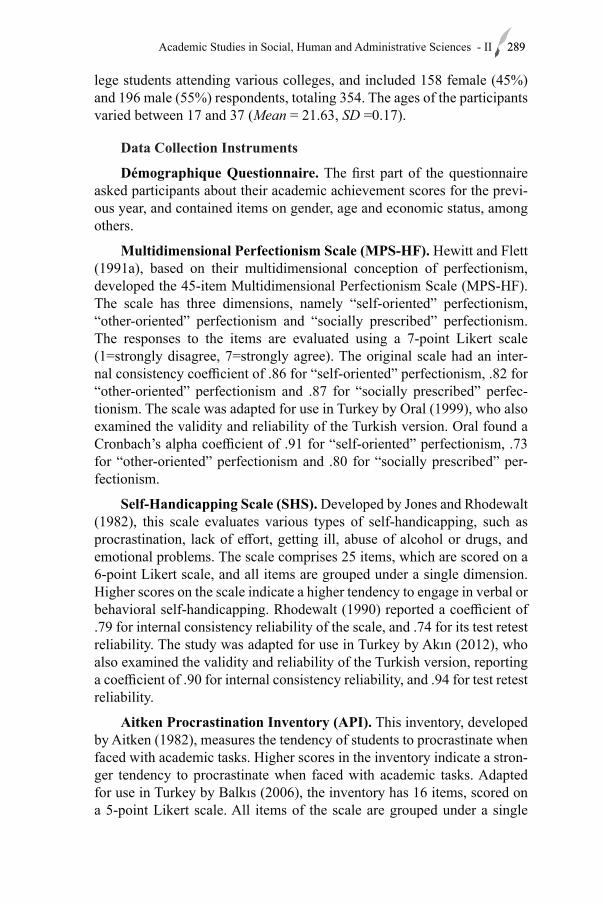
289Academic Studies in Social, Human and Administrative Sciences - II 289
lege students attending various colleges, and included 158 female (45%) and 196 male (55%) respondents, totaling 354. The ages of the participants varied between 17 and 37 (Mean = 21.63, SD =0.17).
Data Collection Instruments
Démographique Questionnaire. The first part of the questionnaire asked participants about their academic achievement scores for the previ-ous year, and contained items on gender, age and economic status, among others.
Multidimensional Perfectionism Scale (MPS-HF). Hewitt and Flett (1991a), based on their multidimensional conception of perfectionism, developed the 45-item Multidimensional Perfectionism Scale (MPS-HF). The scale has three dimensions, namely “self-oriented” perfectionism, “other-oriented” perfectionism and “socially prescribed” perfectionism. The responses to the items are evaluated using a 7-point Likert scale (1=strongly disagree, 7=strongly agree). The original scale had an inter-nal consistency coefficient of .86 for “self-oriented” perfectionism, .82 for “other-oriented” perfectionism and .87 for “socially prescribed” perfec-tionism. The scale was adapted for use in Turkey by Oral (1999), who also examined the validity and reliability of the Turkish version. Oral found a Cronbach’s alpha coefficient of .91 for “self-oriented” perfectionism, .73 for “other-oriented” perfectionism and .80 for “socially prescribed” per-fectionism.
Self-Handicapping Scale (SHS). Developed by Jones and Rhodewalt (1982), this scale evaluates various types of self-handicapping, such as procrastination, lack of effort, getting ill, abuse of alcohol or drugs, and emotional problems. The scale comprises 25 items, which are scored on a 6-point Likert scale, and all items are grouped under a single dimension. Higher scores on the scale indicate a higher tendency to engage in verbal or behavioral self-handicapping. Rhodewalt (1990) reported a coefficient of .79 for internal consistency reliability of the scale, and .74 for its test retest reliability. The study was adapted for use in Turkey by Akın (2012), who also examined the validity and reliability of the Turkish version, reporting a coefficient of .90 for internal consistency reliability, and .94 for test retest reliability.
Aitken Procrastination Inventory (API). This inventory, developed by Aitken (1982), measures the tendency of students to procrastinate when faced with academic tasks. Higher scores in the inventory indicate a stron-ger tendency to procrastinate when faced with academic tasks. Adapted for use in Turkey by Balkıs (2006), the inventory has 16 items, scored on a 5-point Likert scale. All items of the scale are grouped under a single
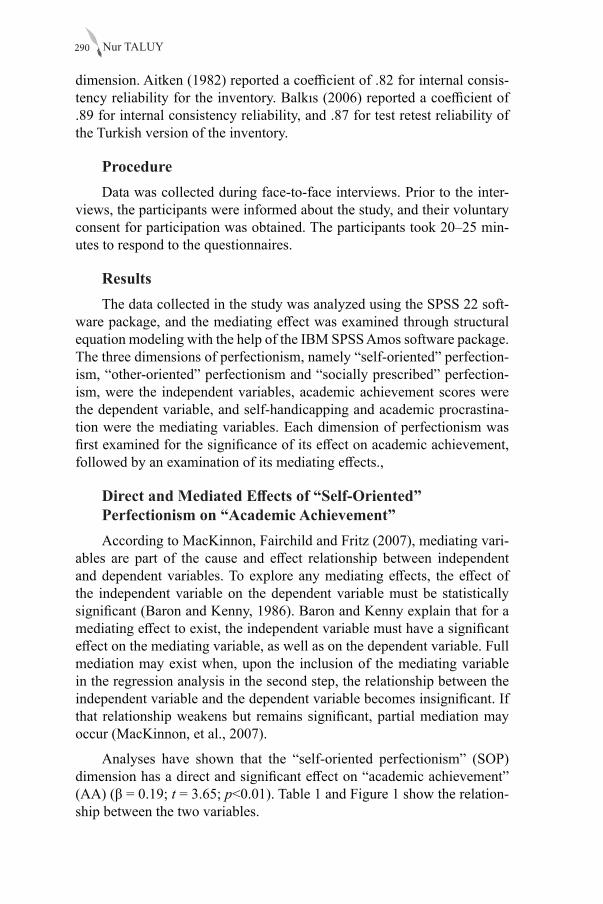
Nur TALUY290
dimension. Aitken (1982) reported a coefficient of .82 for internal consis-tency reliability for the inventory. Balkıs (2006) reported a coefficient of .89 for internal consistency reliability, and .87 for test retest reliability of the Turkish version of the inventory.
ProcedureData was collected during face-to-face interviews. Prior to the inter-
views, the participants were informed about the study, and their voluntary consent for participation was obtained. The participants took 20–25 min-utes to respond to the questionnaires.
ResultsThe data collected in the study was analyzed using the SPSS 22 soft-
ware package, and the mediating effect was examined through structural equation modeling with the help of the IBM SPSS Amos software package. The three dimensions of perfectionism, namely “self-oriented” perfection-ism, “other-oriented” perfectionism and “socially prescribed” perfection-ism, were the independent variables, academic achievement scores were the dependent variable, and self-handicapping and academic procrastina-tion were the mediating variables. Each dimension of perfectionism was first examined for the significance of its effect on academic achievement, followed by an examination of its mediating effects.,
Direct and Mediated Effects of “Self-Oriented” Perfectionism on “Academic Achievement”According to MacKinnon, Fairchild and Fritz (2007), mediating vari-
ables are part of the cause and effect relationship between independent and dependent variables. To explore any mediating effects, the effect of the independent variable on the dependent variable must be statistically significant (Baron and Kenny, 1986). Baron and Kenny explain that for a mediating effect to exist, the independent variable must have a significant effect on the mediating variable, as well as on the dependent variable. Full mediation may exist when, upon the inclusion of the mediating variable in the regression analysis in the second step, the relationship between the independent variable and the dependent variable becomes insignificant. If that relationship weakens but remains significant, partial mediation may occur (MacKinnon, et al., 2007).
Analyses have shown that the “self-oriented perfectionism” (SOP) dimension has a direct and significant effect on “academic achievement” (AA) (β = 0.19; t = 3.65; p<0.01). Table 1 and Figure 1 show the relation-ship between the two variables.
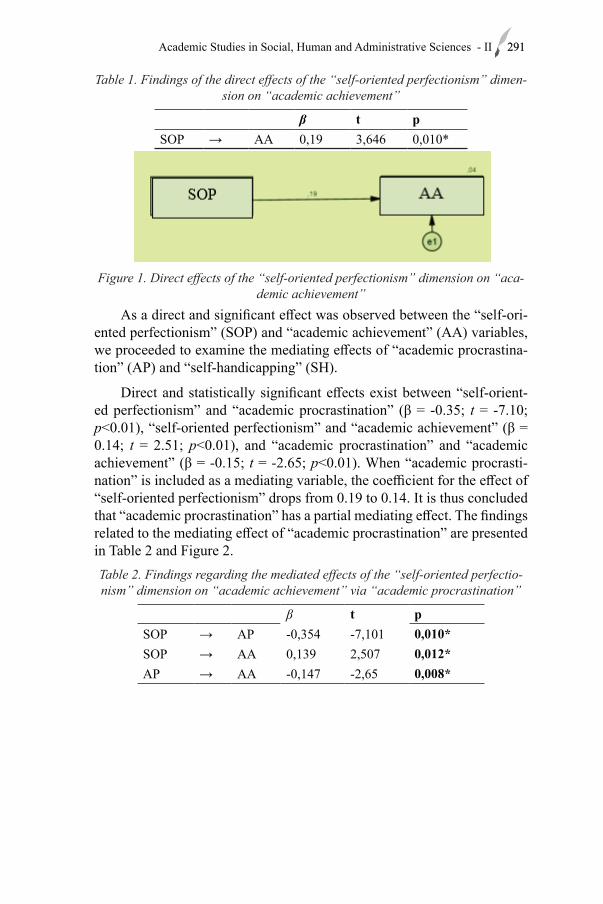
291Academic Studies in Social, Human and Administrative Sciences - II 291
Table 1. Findings of the direct effects of the “self-oriented perfectionism” dimen-sion on “academic achievement”
β t pSOP → AA 0,19 3,646 0,010*
Figure 1. Direct effects of the “self-oriented perfectionism” dimension on “aca-
demic achievement”As a direct and significant effect was observed between the “self-ori-
ented perfectionism” (SOP) and “academic achievement” (AA) variables, we proceeded to examine the mediating effects of “academic procrastina-tion” (AP) and “self-handicapping” (SH).
Direct and statistically significant effects exist between “self-orient-ed perfectionism” and “academic procrastination” (β = -0.35; t = -7.10; p<0.01), “self-oriented perfectionism” and “academic achievement” (β = 0.14; t = 2.51; p<0.01), and “academic procrastination” and “academic achievement” (β = -0.15; t = -2.65; p<0.01). When “academic procrasti-nation” is included as a mediating variable, the coefficient for the effect of “self-oriented perfectionism” drops from 0.19 to 0.14. It is thus concluded that “academic procrastination” has a partial mediating effect. The findings related to the mediating effect of “academic procrastination” are presented in Table 2 and Figure 2.Table 2. Findings regarding the mediated effects of the “self-oriented perfectio-nism” dimension on “academic achievement” via “academic procrastination”
β t pSOP → AP -0,354 -7,101 0,010*SOP → AA 0,139 2,507 0,012*AP → AA -0,147 -2,65 0,008*
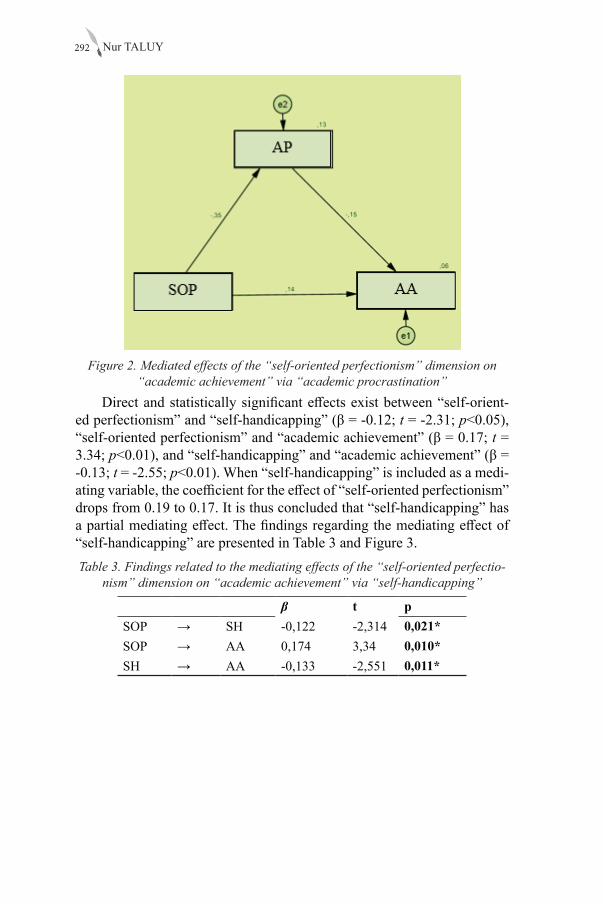
Nur TALUY292
Figure 2. Mediated effects of the “self-oriented perfectionism” dimension on “academic achievement” via “academic procrastination”
Direct and statistically significant effects exist between “self-orient-ed perfectionism” and “self-handicapping” (β = -0.12; t = -2.31; p<0.05), “self-oriented perfectionism” and “academic achievement” (β = 0.17; t = 3.34; p<0.01), and “self-handicapping” and “academic achievement” (β = -0.13; t = -2.55; p<0.01). When “self-handicapping” is included as a medi-ating variable, the coefficient for the effect of “self-oriented perfectionism” drops from 0.19 to 0.17. It is thus concluded that “self-handicapping” has a partial mediating effect. The findings regarding the mediating effect of “self-handicapping” are presented in Table 3 and Figure 3.Table 3. Findings related to the mediating effects of the “self-oriented perfectio-
nism” dimension on “academic achievement” via “self-handicapping”
β t pSOP → SH -0,122 -2,314 0,021*SOP → AA 0,174 3,34 0,010*SH → AA -0,133 -2,551 0,011*
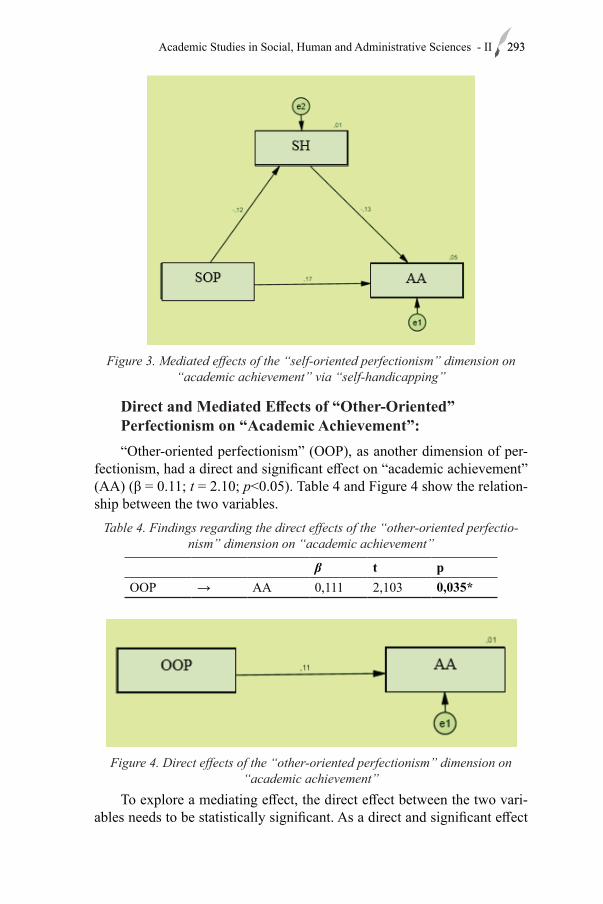
293Academic Studies in Social, Human and Administrative Sciences - II 293
Figure 3. Mediated effects of the “self-oriented perfectionism” dimension on “academic achievement” via “self-handicapping”
Direct and Mediated Effects of “Other-Oriented” Perfectionism on “Academic Achievement”:“Other-oriented perfectionism” (OOP), as another dimension of per-
fectionism, had a direct and significant effect on “academic achievement” (AA) (β = 0.11; t = 2.10; p<0.05). Table 4 and Figure 4 show the relation-ship between the two variables.
Table 4. Findings regarding the direct effects of the “other-oriented perfectio-nism” dimension on “academic achievement”
β t pOOP → AA 0,111 2,103 0,035*
Figure 4. Direct effects of the “other-oriented perfectionism” dimension on “academic achievement”
To explore a mediating effect, the direct effect between the two vari-ables needs to be statistically significant. As a direct and significant effect
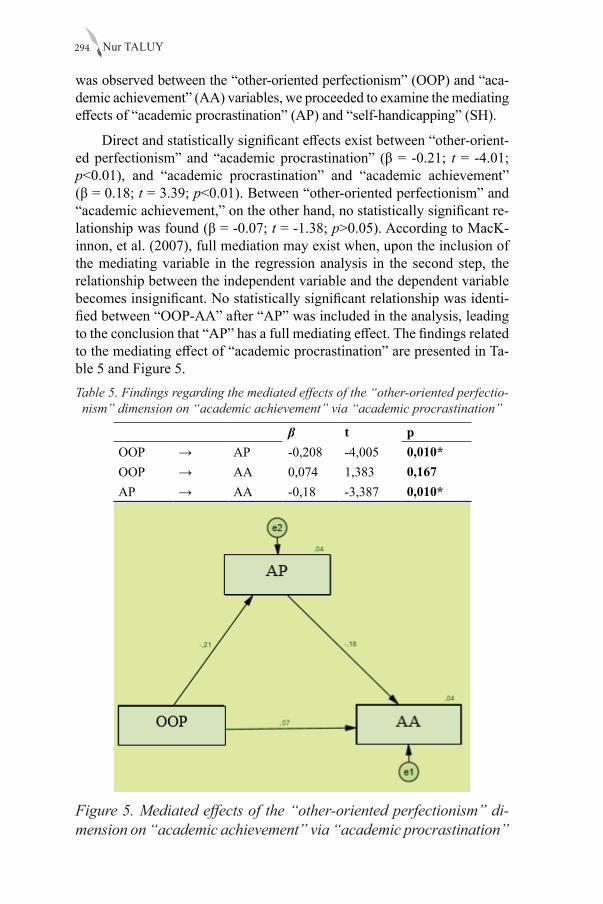
Nur TALUY294
was observed between the “other-oriented perfectionism” (OOP) and “aca-demic achievement” (AA) variables, we proceeded to examine the mediating effects of “academic procrastination” (AP) and “self-handicapping” (SH).
Direct and statistically significant effects exist between “other-orient-ed perfectionism” and “academic procrastination” (β = -0.21; t = -4.01; p<0.01), and “academic procrastination” and “academic achievement” (β = 0.18; t = 3.39; p<0.01). Between “other-oriented perfectionism” and “academic achievement,” on the other hand, no statistically significant re-lationship was found (β = -0.07; t = -1.38; p>0.05). According to MacK-innon, et al. (2007), full mediation may exist when, upon the inclusion of the mediating variable in the regression analysis in the second step, the relationship between the independent variable and the dependent variable becomes insignificant. No statistically significant relationship was identi-fied between “OOP-AA” after “AP” was included in the analysis, leading to the conclusion that “AP” has a full mediating effect. The findings related to the mediating effect of “academic procrastination” are presented in Ta-ble 5 and Figure 5.Table 5. Findings regarding the mediated effects of the “other-oriented perfectio-nism” dimension on “academic achievement” via “academic procrastination”
β t pOOP → AP -0,208 -4,005 0,010*OOP → AA 0,074 1,383 0,167AP → AA -0,18 -3,387 0,010*
Figure 5. Mediated effects of the “other-oriented perfectionism” di-mension on “academic achievement” via “academic procrastination”
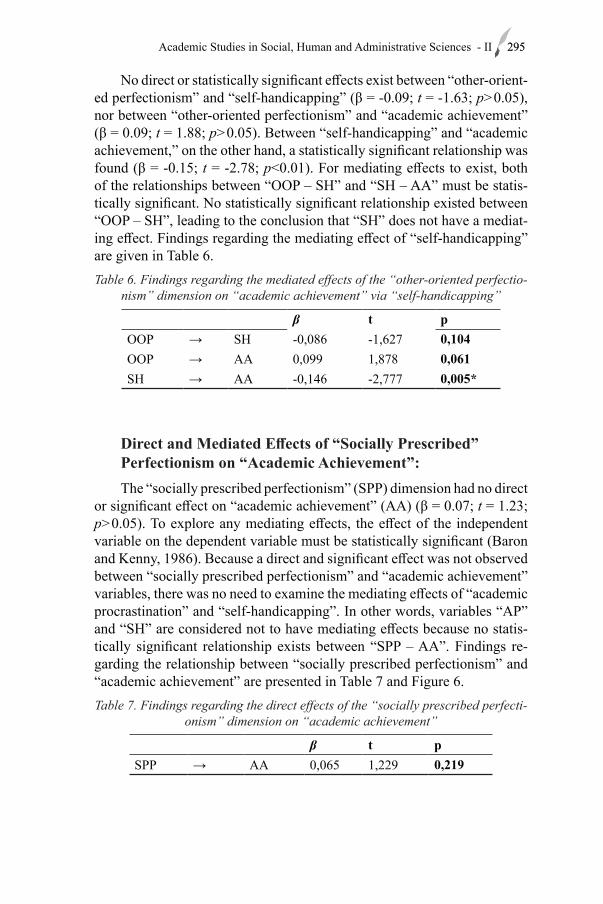
295Academic Studies in Social, Human and Administrative Sciences - II 295
No direct or statistically significant effects exist between “other-orient-ed perfectionism” and “self-handicapping” (β = -0.09; t = -1.63; p>0.05), nor between “other-oriented perfectionism” and “academic achievement” (β = 0.09; t = 1.88; p>0.05). Between “self-handicapping” and “academic achievement,” on the other hand, a statistically significant relationship was found (β = -0.15; t = -2.78; p<0.01). For mediating effects to exist, both of the relationships between “OOP – SH” and “SH – AA” must be statis-tically significant. No statistically significant relationship existed between “OOP – SH”, leading to the conclusion that “SH” does not have a mediat-ing effect. Findings regarding the mediating effect of “self-handicapping” are given in Table 6. Table 6. Findings regarding the mediated effects of the “other-oriented perfectio-
nism” dimension on “academic achievement” via “self-handicapping”
β t pOOP → SH -0,086 -1,627 0,104OOP → AA 0,099 1,878 0,061SH → AA -0,146 -2,777 0,005*
Direct and Mediated Effects of “Socially Prescribed” Perfectionism on “Academic Achievement”:The “socially prescribed perfectionism” (SPP) dimension had no direct
or significant effect on “academic achievement” (AA) (β = 0.07; t = 1.23; p>0.05). To explore any mediating effects, the effect of the independent variable on the dependent variable must be statistically significant (Baron and Kenny, 1986). Because a direct and significant effect was not observed between “socially prescribed perfectionism” and “academic achievement” variables, there was no need to examine the mediating effects of “academic procrastination” and “self-handicapping”. In other words, variables “AP” and “SH” are considered not to have mediating effects because no statis-tically significant relationship exists between “SPP – AA”. Findings re-garding the relationship between “socially prescribed perfectionism” and “academic achievement” are presented in Table 7 and Figure 6.Table 7. Findings regarding the direct effects of the “socially prescribed perfecti-
onism” dimension on “academic achievement”
β t pSPP → AA 0,065 1,229 0,219
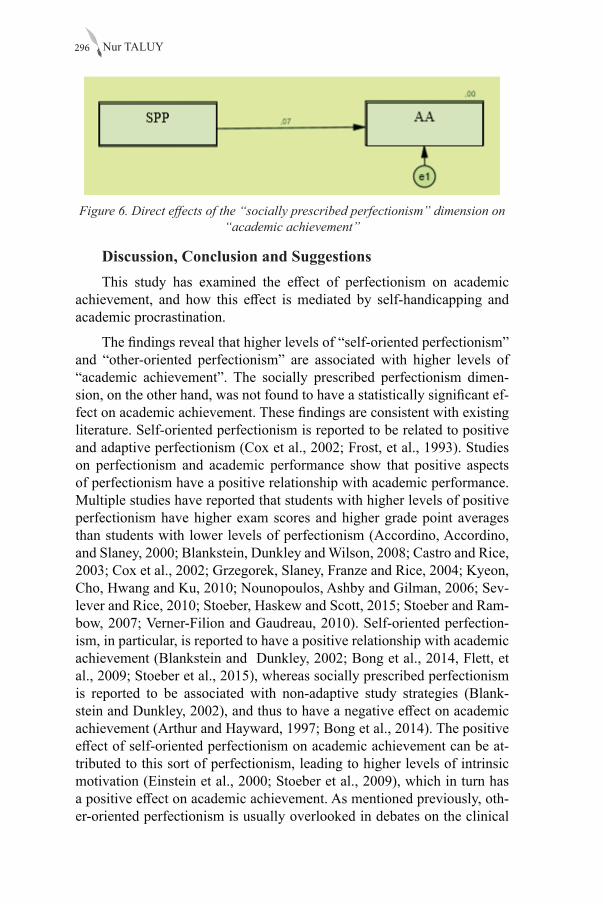
Nur TALUY296
Figure 6. Direct effects of the “socially prescribed perfectionism” dimension on “academic achievement”
Discussion, Conclusion and SuggestionsThis study has examined the effect of perfectionism on academic
achievement, and how this effect is mediated by self-handicapping and academic procrastination.
The findings reveal that higher levels of “self-oriented perfectionism” and “other-oriented perfectionism” are associated with higher levels of “academic achievement”. The socially prescribed perfectionism dimen-sion, on the other hand, was not found to have a statistically significant ef-fect on academic achievement. These findings are consistent with existing literature. Self-oriented perfectionism is reported to be related to positive and adaptive perfectionism (Cox et al., 2002; Frost, et al., 1993). Studies on perfectionism and academic performance show that positive aspects of perfectionism have a positive relationship with academic performance. Multiple studies have reported that students with higher levels of positive perfectionism have higher exam scores and higher grade point averages than students with lower levels of perfectionism (Accordino, Accordino, and Slaney, 2000; Blankstein, Dunkley and Wilson, 2008; Castro and Rice, 2003; Cox et al., 2002; Grzegorek, Slaney, Franze and Rice, 2004; Kyeon, Cho, Hwang and Ku, 2010; Nounopoulos, Ashby and Gilman, 2006; Sev-lever and Rice, 2010; Stoeber, Haskew and Scott, 2015; Stoeber and Ram-bow, 2007; Verner-Filion and Gaudreau, 2010). Self-oriented perfection-ism, in particular, is reported to have a positive relationship with academic achievement (Blankstein and Dunkley, 2002; Bong et al., 2014, Flett, et al., 2009; Stoeber et al., 2015), whereas socially prescribed perfectionism is reported to be associated with non-adaptive study strategies (Blank-stein and Dunkley, 2002), and thus to have a negative effect on academic achievement (Arthur and Hayward, 1997; Bong et al., 2014). The positive effect of self-oriented perfectionism on academic achievement can be at-tributed to this sort of perfectionism, leading to higher levels of intrinsic motivation (Einstein et al., 2000; Stoeber et al., 2009), which in turn has a positive effect on academic achievement. As mentioned previously, oth-er-oriented perfectionism is usually overlooked in debates on the clinical
297Academic Studies in Social, Human and Administrative Sciences - II 297
importance of multidimensional perfectionism (Dunkley et al., 2006), and consequently there is a lack of studies on the relationship between this di-mension and academic performance and achievement. The findings of the few studies that exist are consistent with the findings of the present study. Flett et al. (2009) report that other-oriented perfectionism has a significant and largely positive relationship with exam performance. Both self-orient-ed perfectionism and to a lesser extent, other-oriented perfectionism are re-ported to be associated with adaptive and positive traits (Flett and Hewitt, 2002; Flett, et al., 1996). Based on previous researches of perfectionism and academic performance (Flett et al., 2009; Stoeber, 2012), exam perfor-mance is expected to be positively affected by self-oriented perfectionism, and negatively affected by socially prescribed perfectionism. In the present study, however, no significant relationship was identified between socially prescribed perfectionism and academic performance. A study has reported similar results; in a study by Wong, et al. (2018), self-oriented perfection-ism was found to be a predictor of academic achievement, while socially prescribed perfectionism did not predict academic achievement.
Academic procrastination refers to the intentional postponing of im-portant academic activities (Schouwenburg, 2004). The relationship be-tween “self-oriented perfectionism” and “academic achievement” was found to be partially mediated by “academic procrastination”. Self-orient-ed perfectionism has a negative relationship with procrastination (Clos-son and Boutilier, 2017; Özer and Altun, 2011; Sula Ataş and Kumcağız, 2019). College students who tend to procrastinate receive lower academic scores than non-procrastinators (Steel, 2007). There have been many stud-ies reporting a negative relationship between procrastination and academ-ic performance, consistent with the present study (eg., Balkıs and Duru, 2010; Balkıs et al, 2008; Beck et al., 2000; Beswick et al., 1988; Laksh-minarayan et al., 2013; Moon and Illingworth, 2005; Tice and Baumeister, 1997; Tuckman, 2002; Van Eerde, 2003; Wang and Englander, 2010). In a study by Stoeber, et al. (2015), the relationship between self-oriented per-fectionism and exam performance was found to be mediated by task-ori-ented goals. Self-oriented perfectionism helps students set task-oriented goals, which in turn leads to better exam results (Stoeber et al., 2015). Set-ting task-oriented goals is assumed to function in a way in an opposite way to academic procrastination. Accordingly, the mediating effect identified in the present study is consistent with the findings of Stoeber et al. (2015).
Students often face performance challenges in academic environments, and can resort to self-handicapping strategies to deal with challenges that they expect to fail (Strube, 1986). Perfectionism is considered to be one of the underlying drivers of self-handicapping behaviors among students (Kearns et al., 2008, Stewart and Degeorge-Walker, 2014). Kearns et al. (2008) observe that not all perfectionist students display self-handicapping
Nur TALUY298
behavior, but that students who are worried about their self-image, and that would also like to be perceived as perfect by others, would be more likely to engage in self-handicapping. Many studies, however, have found that self-handicapping is positively related to perfectionism and negatively related to academic achievement (Hobden and Pliner, 1995; Karner-Huţu-leac, 2014; Zuckerman et al., 1998). The findings of the present study in this regard are different to those of most studies on perfectionism, with higher levels of self-oriented perfectionism being associated with lower levels of self-handicapping. This may be a reflection of the argument put forward by Kearns et al. (2008), who stated that not all perfectionist stu-dents engage in self-handicapping behaviors. Moreover, two recent studies (Akar, Doğan and Üstüner, 2018; Strumbel, 2016) report findings similar to those of the present study. Similarly, Strumbel (2016) found that people scoring high in self-oriented perfectionism were less likely to engage in self-handicapping. Akar et al. (2018) found that positive perfectionism was associated with less self-handicapping behavior among students. People with a tendency for self-oriented perfectionism – considered to be a posi-tive dimension – are reported to aim for success and to have higher levels of self-esteem (Hewitt and Flett, 1991a; 1993; Oral, 1999; Neumeister, 2004; Stoeber and Otto, 2006); and people with high levels of self-esteem, in turn, are known to engage in less self-handicapping behaviors (Üzbe and Bacanlı, 2015). Thus, self-oriented perfectionists are thought to avoid self-handicapping, because they have high self-esteem. The findings also indicated that the relationship between “self-oriented perfectionism” and “academic achievement” was partially mediated by “self-handicapping”. Higher levels of self-oriented perfectionism are associated with lower levels of self-handicapping, and lower levels of self-handicapping are as-sociated with higher levels of academic achievement. A recent study re-ports similar findings on mediating effects. Akar et al. (2018) found that the relationship between positive perfectionism and academic achievement was partially mediated by self-efficacy and self-handicapping. Akar et al.’s study also found that the tendency for positive perfectionism among stu-dents had a positive effect on their academic achievement and self-effica-cy, and a negative effect on self-handicapping. Self-handicapping among students has been associated with negative academic results (Urdan and Midgley, 2001; Zuckerman et al., 1998), and it was also found in the present study that self-handicapping lowers academic achievement. Even though no examination of academic achievement was made per se, a study into the relationship between perfectionism and performance found that this relationship was mediated by self-handicapping strategies. Stoeber, Uphill and Hotham (2009) found that performance avoidance mediated the relationship between perfectionist personal standards and performance among athletes.
299Academic Studies in Social, Human and Administrative Sciences - II 299
The findings of the present study are expected to contribute to lit-erature with regards to the dimension of “other-oriented perfectionism”, which has been covered in few studies to date. There are a lack of studies on the mediation of the effects of other-oriented perfectionism. The rela-tionship between “other-oriented perfectionism” and “academic achieve-ment” was found to be fully mediated by “academic procrastination”. Higher levels of other-oriented perfectionism were associated with lower levels of academic procrastination, and lower levels of academic procrasti-nation were associated with higher levels of academic achievement. In ad-dition to self-oriented perfectionism, other-oriented perfectionism is also considered to be associated with the adaptive aspects of perfectionism, though to a lesser extent (Flett and Hewitt, 2002; Flett, et al., 1996). It is reported that other-oriented perfectionism is associated with higher levels of self-confidence (Bieling, Israeli ve Antony, 2004). In a study on self-ef-ficacy when deciding upon a career, Ashby, Bieschke and Slaney (1997) found that adaptive perfectionists scored significantly higher in making accurate self-evaluations, setting appropriate goals, planning for the future and problem-solving. According to Flett, Hewitt, Blankstein, Solnik and Van Brunschot (1996), self-oriented and other-oriented perfectionists tend to have positive problem-solving tendencies. Thus, the finding that higher levels of other-oriented perfectionism, which is considered to be adaptive, are associated with lower levels of academic procrastination and higher levels of academic achievement, consistent with previous researches.
Self-handicapping was not found to have a significant mediating ef-fect between “other-oriented perfectionism” and “academic achievement”. Moreover, socially prescribed perfectionism was not found to have a sig-nificant effect on academic achievement, and thus any mediating effects between the two were not explored.
This study has a number of limitations. The academic achievement scores were limited to the previous year, and the participants were all stu-dents who majored in social sciences, limiting the generalizability of the findings. The inclusion of self-esteem among the variables would permit a more detailed examination, and further studies could examine the rela-tionships between variables related to parental expectations and sense of achievement.
This study has examined the effects on academic achievement of such important phenomena as perfectionism, self-handicapping and academic procrastination. It identifies the frequency of two problematic behaviors – academic procrastination and self-handicapping – among students, and helps prevent these issues in the future by raising awareness. Given the lack of studies on the mediating effects of academic procrastination be-tween perfectionism and academic achievement, the finding that the posi-
Nur TALUY300
tive aspects of perfectionism are negative predictors of self-handicapping and academic procrastination, and thus affect academic achievement, con-stitutes an important contribution to the literature.
Over the last three decades, studies of perfectionism have exam-ined many aspects of this phenomenon, resulting in a substantial body of knowledge. The authors have established that perfectionism, while usually viewed negatively, has a multidimensional structure, and when used prop-erly, has aspects that can motivate a person and lead to desirable results. Moreover, an increasing number of studies have found that the positive and adaptive aspects of perfectionism are associated with higher performance in different areas of life and at different achievement levels. This study is expected to contribute to literature in this sense.
ReferencesAccordino, D. B., Accordino, M. P., & Slaney, R. B. (2000). An investigation
of perfectionism, mental health, achievement, and achievement motivation in adolescents. Psychology in the Schools, 37(6), 535-545.
Aitken, M. E. (1982). A personality profile of the college student procrastinator. Unpublished Doctoral Dissertation, University of Pittsburgh, Pittsburgh, PA.
Akar, H., Doğan, Y. B. & Üstüner, M. (2018). The relationships between positive and negative perfectionisms, self-handicapping, self-efficacy and academic achievement. European Journal of Contemporary Education, 7(1), 7-20.
Akın, A. (2012). Self-handicapping scale: A study of validity and reliability. Eğitim ve Bilim, 37(164), 176.
Arthur, N., & Hayward, L. (1997). The relationships between perfectionism, standards for academic achievement, and emotional distress in postsecondary students. Journal of College Student Development, 38, 622-632.
Ashby, J., Bieschke, K., & Slaney, R. (1997). Multidimensional perfectionism and career decision-making self-efficacy. In Poster presented at the Annual Meeting of the American Psychological Association, Chicago, IL.
Balkıs, M. (2006). Öğretmen adaylarının davranışlarındaki erteleme eğiliminin, düşünme ve karar verme tarzları ile ilişkisi. Unpublished Doctoral Dissertation, DEÜ, Eğitim Bilimleri Enstitüsü.
Balkıs, M., & Duru, E. (2010). Akademik erteleme eğilimi, akademik başarı ilişkisinde genel ve performans benlik saygısının rolü. Pamukkale Üniversitesi Eğitim Fakültesi Dergisi, 27, 159-170.
Balkıs, M., Duru, E., Buluş, M. & Duru, S. (2008). Üniversite öğrencilerinde akademik erteleme eğiliminin çeşitli değişkenler
301Academic Studies in Social, Human and Administrative Sciences - II 301
açısından incelenmesi. Ege Üniversitesi Eğitim Fakültesi Dergisi, 7(2), 59-75.
Baron, R. M., & Kenny, D. A. (1986). The moderator–mediator variable distinction in social psychological research: Conceptual, strategic, and statistical considerations. Journal of Personality and Social Psychology, 51(6), 1173.
Beck, B. L., Koons, S. R., & Milgrim, D. L. (2000). Correlates and consequences of behavioral procrastination: The effects of academic procrastination, self-consciousness, self-esteem and self-handicapping. Journal of Social Behavior and Personality, 15(5), 3.
Berglas, S., & Jones, E. E. (1978). Drug Choice as a Self-Handicapping Strategy in Response to Noncontingent Success. Journal of Personality and Social Psychology, 36(4), 405-417.
Beswick, G., Rothblum, E.D., & Mann, L. (1988). Psychological antecedents of student procrastination. Australian Psychologist, 23, 207 217.
Bieling, P. J., Israeli, A. L., & Antony, M. M. (2004). Is perfectionism good, bad, or both? Examining models of the perfectionism construct. Personality and Individual Differences, 36(6), 1373-1385.
Blankstein, K. R., & Dunkley, D. M. (2002). Evaluative concerns, self-critical, and personal standards perfectionism: A structural equation modeling strategy. In G. L. Flett & P. L. Hewitt (Eds.). Perfectionism: Theory, research, and treatment (pp. 285-315). Washington, DC, US: American Psychological Association.
Blankstein, K. R., Dunkley, D. M., & Wilson, J. (2008). Evaluative concerns and personal standards perfectionism: Self-esteem as a mediator and moderator of relations with personal and academic needs and estimated GPA. Current Psychology, 27(1), 29-61.
Blatt, S., J. (1995). The Destructiveness of Perfectionism: Implications for the Treatment of Depression. American Psychologist, 50,1003- 1020.
Bobo, J. L., Whitaker, K. C., & Strunk, K. K. (2013). Personality and student self-handicapping: A cross-validated regression approach. Personality and Individual Differences, 55(5), 619-621.
Bong, M., Hwang, A., Noh, A., & Kim, S. I. (2014). Perfectionism and motivation of adolescents in academic contexts. Journal of Educational Psychology, 106(3), 711.
Burka, J. B., & Yuen, L. M. (1983). Procrastination: Why you do it, what to do about it now. Cambridge, MA: Da Capo Press.
Burns, L. R., Dittmann, K., Nguyen, N.-L., & Mitchelson, J. K. (2000). Academic procrastination, perfectionism, and control: Associations with vigilant and avoidant coping. Journal of Social Behavior & Personality, 15(5), 35–46.
Castro, J. R., & Rice, K. G. (2003). Perfectionism and ethnicity: Implications
Nur TALUY302
for depressive symptoms and self-reported academic achievement. Cultural Diversity and Ethnic Minority Psychology, 9(1), 64.
Closson, L. M., & Boutilier, R. R. (2017). Perfectionism, academic engagement, and procrastination among undergraduates: The moderating role of honors student status. Learning and Individual Differences, 57, 157-162.
Cockell, S. J., Hewitt, P. L., Seal, B., Sherry, S., Goldner, E. M., Flett, G. L., & Remick, R. A. (2002). Trait and self-presentational dimensions of perfectionism among women with anorexia nervosa. Cognitive Therapy and Research, 26(6), 745-758.
Covington, M. V. (1992). Making the grade: A self-worth perspective on motivation and school reform. Cambridge University Press.
Cox, B. J., Enns, M. W., & Clara, I. P. (2002). The multidimensional structure of perfectionism in clinically distressed and college student samples. Psychological Assessment, 14(3), 365.
Çakıcı, D.Ç. (2003). Lise ve üniversite öğrencilerinde genel erteleme ve akademik erteleme davranışının incelenmesi. Unpublished Master’s Thesis, Ankara Üniversitesi, Eğitim Bilimleri Enstitüsü, Ankara.
Davis, C., Kaptein, S., Kaplan, A. S., Olmsted, M. P., & Woodside, D. B. (1998). Obsessionality in anorexia nervosa: The moderating influence of exercise. Psychosomatic Medicine, 60(2), 192-197.
Dunkley, D. M., Blankstein, K. R., Masheb, R. M., & Grilo, C. M. (2006). Personal standards and evaluative concerns dimensions of “clinical” perfectionism: A reply to Shafran et al. (2002, 2003) and Hewitt et al. (2003). Behaviour Research and Therapy, 44(1), 63-84.
Einstein, D. A., Lovibond, P. F., & Gaston, J. E. (2000). Relationship between perfectionism and emotional symptoms in an adolescent sample. Australian Journal of Psychology, 52(2), 89-93.
Ellis, A., & Knaus, W. J. (1977). Overcoming Procrastination. New York: Institute for Rational Living.
Enns, M. W., & Cox, B. J. (2002). The nature and assessment of perfectionism: A critical analysis. In G. L. Flett & P. L. Hewitt (Eds.), Perfectionism: Theory, research, and treatment. (pp. 33–62), Washington, DC, US: American Psychological Association.
Enns, M. W., Cox, B. J., Sareen, J., & Freeman, P. (2001). Adaptive and maladaptive perfectionism in medical students: a longitudinal investigation. Medical Education, 35(11), 1034-1042.
Ferrari, J. R. (1991). Compulsive procrastination: Some self-reported characteristics. Psychological Reports, 68(2), 455-458.
Ferrari, J. R. (1993). Christmas and procrastination: Explaining lack of diligence at a “real-world” task deadline. Personality and Individual Differences, 14(1), 25-33.
Ferrari, J. R. (1994). Dysfunctional procrastination and its relationship with
303Academic Studies in Social, Human and Administrative Sciences - II 303
self-esteem, interpersonal dependency, and selfdefeating behaviors. Personality and Individual Differences, 17(5), 673-679.
Ferrari, J. R., & Díaz-Morales, J. F. (2007). Procrastination: Different time orientations reflect different motives. Journal of Research in Personality, 41(3), 707-714.
Ferrari, J. R., Johnson, J. L., & McCown, W. G. (1995). Procrastination and task avoidance: Theory, research, and treatment. Springer Science & Business Media.
Ferrari, J. R., & Tice, D. M. (2000). Procrastination as a self-handicap for men and women: A task-avoidance strategy in a laboratory setting. Journal of Research in Personality, 34(1), 73-83.
Flett, G. L., Blankstein, K. R., & Hewitt, P. L. (2009). Perfectionism, performance, and state positive affect and negative affect after a classroom test. Canadian Journal of School Psychology, 24(1), 4-18.
Flett, G. L., Blankstein, K. R., Hewitt, P. L., & Koledin, S. (1992). Components of perfectionism and procrastination in college students. Social Behavior and Personality: An International Journal, 20(2), 85-94.
Flett, G. L., & Hewitt, P. L. (2002). Perfectionism and maladjustment: An overview of theoretical, definitional, and treatment issues. In G. L. Flett & P. L. Hewitt (Eds.), Perfectionism: Theory, research, and treatment (pp. 5-31). Washington, DC, US: American Psychological Association.
Flett, G. L., Hewitt, P. L., Blankstein, K. R., & O’Brien, S. (1991). Perfectionism and learned resourcefulness in depression and self-esteem. Personality and Individual Differences, 12(1), 61-68.
Flett, G. L., Hewitt, P. L., Blankstein, K. R., Solnik, M., & Van Brunschot, M. (1996). Perfectionism, social problem-solving ability, and psychological distress. Journal of Rational-Emotive and Cognitive-Behavior Therapy, 14(4), 245-274.
Flett, G. L., Hewitt, P. L., & De Rosa, T. (1996). Dimensions of perfectionism, psychosocial adjustment, and social skills. Personality and Individual Differences, 20(2), 143-150.
Flett, G. L., Hewitt, P. L., & Martin, T. R. (1995). Dimensions of perfectionism and procrastination. In J. R. Ferrari, J. L. Johnson, & W. G. McCown, Procrastination and task avoidance: Theory, research, and treatment (pp. 113-136). The Springer Series in Social, Clinical Psychology. Springer, Boston, MA.
Flett, G. L., Hewitt, P. L., Oliver, J. M., & Macdonald, S. (2002). Perfectionism in children and their parents: A developmental analysis. In G. L. Flett & P. L. Hewitt (Eds.), Perfectionism: Theory, research, and treatment (pp. 89-132). Washington, DC, US: American Psychological Association.
Nur TALUY304
Flett, G L., Hewitt, P. L. Shapiro, B. & Rayman J. (2001). Perfectionism, beliefs, and adjustment in dating relationships. Current Psychology, 20(4), 289-311.
Franco‐Paredes, K., Mancilla‐Díaz, J. M., Vázquez‐Arévalo, R., López‐Aguilar, X., & Álvarez‐Rayón, G. (2005). Perfectionism and eating disorders: A review of the literature. European Eating Disorders Review. The Professional Journal of the Eating Disorders Association, 13(1), 61-70.
Freud, S. (1959). “Inhibitions, Symptoms and Anxiety”. The Standard edition of the Complete Psychological Works of Sigmund Freud. London: Hogarth.
Frost, R. O., Heimberg, R. G., Holt, C. S., Mattia, J. I., & Neubauer, A. L. (1993). A comparison of two measures of perfectionism. Personality and Individual Differences, 14, 119-126.
Frost, R. O., Marten, P., Lahart, C. & Rosenblate, R. (1990). “The Dimensions of Perfectionism”. Cognitive Therapy and Research, 14(5), 449-468.
Garcia, T. (1995). Worriers and Procrastinators: Differences in Motivation, Cognitive Engagement, and Achievement between Defensive Pessimists and Self-Handicappers. In Paper presented at the Annual Meeting of the American Educational Research Association, April 18-22. San Francisco, CA.
Greenberg, J. (1985). Unattainable Goal Choice as a Self‐Handicapping Strategy. Journal of Applied Social Psychology, 15(2), 140-152.
Grzegorek, J. L., Slaney, R. B., Franze, S., & Rice, K. G. (2004). Self-Criticism, Dependency, Self-Esteem, and Grade Point Average Satisfaction Among Clusters of Perfectionists and Non perfectionists. Journal of Counseling Psychology, 51(2), 192.
Hamachek, D. E. (1978). Psychodynamics of normal and neurotic perfectionism. Psychology: A Journal of Human Behavior, 15, 27-33.
Hamilton, T. K., & Schweitzer, R.D. (2000). The Cost of Being Perfect: Perfectionism and Suicide Ideation in University Students. Australian & New Zealand Journal of Psychiatry, 34, (5), 829-835.
Haycock, L. A., McCarthy, P., & Skay, C. L. (1998). Procrastination in college students: The role of self‐efficacy and anxiety. Journal of Counseling & Development, 76(3), 317-324.
Hewitt, P. L., Caelian, C. F., Chen, C., & Flett, G. L. (2014). Perfectionism, stress, daily hassles, hopelessness, and suicide potential in depressed psychiatric adolescents. Journal of Psychopathology and Behavioral Assessment, 36(4), 663-674.
Hewitt, P. L., & Flett, G. L. (1991a). Perfectionism in the self and social contexts: conceptualization, assessment, and association with psychopathology. Journal of Personality and Social Psychology, 60,
305Academic Studies in Social, Human and Administrative Sciences - II 305
456-470.Hewitt, P. L., & Flett, G. L. (1991b). Dimensions of perfectionism in
unipolar depression. Journal of Abnormal Psychology, 100, 98-101.Hewitt, P. L., & Flett, G. L. (1993). Dimensions of perfectionism, daily
stress, and depression: A test of specific vulnerability hypothesis. Journal of Abnormal Psychology, 102, 58-65.
Hewitt, P. L., & Flett, G. L. (2002). Perfectionism, stress, and coping in maladjustment. In G.L. Flett & P.L. Hewitt (Eds.), Perfectionism: Theory, Research and Treatment (pp.253-285). Washington DC: American Psychological Association.
Hewitt, P. L., & Flett, G. L. (2007). When does conscientiousness become perfectionism? Current Psychiatry, 6(7), 49–64.
Hewitt, P. L., Flett, G. L., & Ediger, E. (1995). Perfectionism traits and perfectionistic self-presentation in eating disorder attitudes, characteristics, and symptoms. International Journal of Eating Disorders, 18(4), 317-326.
Hewitt, P. L., Mittelstaedt, W. M., & Flett, G. L. (1990). Self-oriented perfectionism and generalized performance importance in depression. Individual Psychology: Journal of Adlerian Theory, Research & Practice, 46(1), 67-73.
Hewitt, P. L., Newton, J., Flett, G. L., & Callander, L. (1997). Perfectionism and suicide ideation in adolescent psychiatric patients. Journal of Abnormal Child Psychology, 25(2), 95-101.
Hill, R. W., McIntyre, K., & Bacharach, V. (1997). Perfectionism and the big five. Journal of Social Behavior and Personality, 12, 133-144.
Hirt, E. R., Deppe, R. K., & Gordon, L. J. (1991). Self-reported versus behavioral self-handicapping: Empirical evidence for a theoretical distinction. Journal of Personality and Social Psychology, 61(6), 981.
Hobden, K., & Pliner, P. (1995). Self-handicapping and dimensions of perfectionism: Self presentation vs self-protection. Journal of Research in Personality, 29, 461-474.
Jadidi, F., Mohammadkhani, S., & Tajrishi, K. Z. (2011). Perfectionism and academic procrastination. Procedia-Social and Behavioral Sciences, 30, 534-537.
Jones, E. E., & Rhodewalt, F. (1982). The self-handicapping scale. Princeton, NJ: Princeton University.
Karner-Huţuleac, A. (2014). Perfectionism and self-handicapping in adult education. Procedia-Social and Behavioral Sciences, 142, 434-438.
Kearns, H., Forbes, A., Gardiner, M., & Marshall, K. (2008). When a high distinction isn’t good enough: A review of perfectionism and selfhandicapping. The Australian Educational Researcher, 35(3), 21-36.
Klibert, J. J., Langhinrichsen-Rohling, J., & Saito, M. (2005). Adaptive
Nur TALUY306
and maladaptive aspects of self-oriented versus socially prescribed perfectionism. Journal of College Student Development, 46(2), 141-156.
Kyeon, Y. G., Cho, S. M., Hwang, H. G., & Lee, K. U. (2010). The effects of perfectionism on academic achievement in medical students. Korean Journal of Medical Education, 22(3), 205-214.
Lakshminarayan, N., Potdar, S., & Reddy, S. G. (2013). Relationship between procrastination and academic performance among a group of undergraduate dental students in India. Journal of Dental Education, 77(4), 524-528.
Lekich, N. (2006). The relationship between academic motivation, self-esteem, and academic procrastination in college students. Unpublished Master’s Thesis, Truman State University, Missouri.
MacKinnon, D. P., Fairchild, A. J., & Fritz, M. S. (2007). Mediation analysis. Annual Review of Psychology, 58, 593-614.
Milgram, N. N., Mey-Tal, G., & Levison, Y. (1998). Procrastination, generalized or specific, in college students and their parents. Personality and Individual Differences, 25(2), 297-316.
Milgram, N. A., Sroloff, B. & Rosenbaum, M. (1988). The Procrastination of everyday life. Journal of Research in Personality, 22(2), 197-212.
Miquelon, P., Vallerand, R. J., Grouzet, F. M., & Cardinal, G. (2005). Perfectionism, academic motivation, and psychological adjustment: An integrative model. Personality and Social Psychology Bulletin, 31(7), 913-924.
Moon, S. M., & Illingworth, A. J. (2005). Exploring the dynamic nature of procrastination: A latent growth curve analysis of academic procrastination. Personality and Individual Differences, 38(2), 297-309.
Neumeister, K. L. S. (2004). Factors Influencing the Development of Perfectionism in Gifted College Students. Gifted Child Quarterly, 48(4), 259-274.
Nounopoulos, A., Ashby, J. S., & Gilman, R. (2006). Coping resources, perfectionism, and academic performance among adolescents. Psychology in the Schools, 43(5), 613-622.
Onwuegbuzie, A. J. (2004). Academic procrastination and statistics anxiety. Assessment & Evaluation in Higher Education, 29(1), 3-19.
Oral, M. (1999). The Relationship between Dimensions of Perfectionism, Stressful Life Events and Depressive Symptoms in University Students: A Test of Diathesis-Stress Model of Depression. Unpublished Master’s Thesis, Middle East Technical University, Ankara.
Özer, A & Altun, E. (2011). Üniversite Öğrencilerinin Akademik Erteleme Nedenleri. Mehmet Akif Ersoy Üniversitesi Eğitim Fakültesi Dergisi, 1 (21), 45-72.
307Academic Studies in Social, Human and Administrative Sciences - II 307
Özer, B. U., Demir, A., & Ferrari, J. R. (2009). Exploring academic procrastination among Turkish students: Possible gender differences in prevalence and reasons. The Journal of social psychology, 149(2), 241-257.
Powers, T. A., Koestner, R., & Topciu, R. A. (2005). Implementation intentions, perfectionism, and goal progress: Perhaps the road to hell is paved with good intentions. Personality and Social Psychology Bulletin, 31(7), 902-912.
Pulford, B. D., Johnson, A., & Awaida, M. (2005). A cross-cultural study of predictors of self-handicapping in university students. Personality and Individual Differences, 39(4), 727-737.
Rhodewalt, F., & Davison Jr, J. (1986). Self-handicapping and subsequent performance: Role of outcome valence and attributional certainty. Basic and Applied Social Psychology, 7(4), 307-322.
Rothblum, E. D., Solomon, L. J., & Murakami, J. (1986). Affective, cognitive, and behavioral differences between high and low procrastinators. Journal of Counseling Psychology, 33(4), 387.
Roxborough, H. M., Hewitt, P. L., Kaldas, J., Flett, G. L., Caelian, C. M., Sherry, S., & Sherry, D. L. (2012). Perfectionistic self‐presentation, socially prescribed perfectionism, and suicide in youth: A test of the perfectionism social disconnection model. Suicide and Life‐Threatening Behavior, 42(2), 217-233.
Saddler, C. D., & Sacks, L. A. (1993). Multidimensional perfectionism and academic procrastination: Relationships with depression in university students. Psychological Reports, 73(3), 863-871.
Schouwenburg, H. C. (1995). Academic procrastination. In Ferrari, J. R.; Johnson, J. L.; McCown, W. G. (Eds.); Procrastination and task avoidance (pp. 71-96). Springer, Boston, MA.
Schouwenburg, H. C. (2004). Procrastination in Academic Settings: General Introduction. In Schouwenburg, H.C.; Lay, C. H.; Pychyl, T. A.; Ferrari, J. R. (Eds.). Counseling the procrastinator in academic settings, (pp. 3-17). Washington, DC, US: American Psychological Association.
Senecal, C., Koestner, R., & Vallerand, R. J. (1995). Self-regulation and academic procrastination. The Journal of Social Psychology, 135(5), 607-619.
Sevlever, M., & Rice, K. G. (2010). Perfectionism, depression, anxiety, and academic performance in premedical students. Canadian Medical Education Journal, 1(2), e96-e104.
Sherry, S. B., Hewitt, P. L., Flett, G. L., & Harvey, M. (2003). Perfectionism dimensions, perfectionistic attitudes, dependent attitudes, and depression in psychiatric patients and university students. Journal of Counseling Psychology, 50(3), 373-386.
Nur TALUY308
Sherry, S. B., Hewitt, P. L., Flett, G. L., Lee-Baggley, D. L., & Hall, P. A. (2007). Trait perfectionism and perfectionistic self-presentation in personality pathology. Personality and Individual Differences, 42(3), 477-490.
Slaney, R. B., Rice, K. G., Mobley, M., Trippi, J., & Ashby, J. S. (2001). The revised Almost Perfect Scale. Measurement and Evaluation in Counseling and Development, 34, 130–145.
Smith, M. M., Sherry, S. B., Saklofske, D. H., & Mushqaush, A. R. (2017). Clarifying the perfectionism-procrastination relationship using a 7-day, 14-occasion daily diary study. Personality and Individual Differences, 112, 117-123.
Solomon, L. J., & Rothblum, E. D. (1984). Academic procrastination: Frequency and cognitive-behavioral correlates. Journal of Counseling Psychology, 31(4), 503-509.
Steel, P. (2007). The nature of procrastination: A meta-analytic and theoretical review of quintessential self-regulatory failure. Psychological Bulletin, 133(1), 65-94.
Stewart, M. A., & De George-Walker, L. (2014). Self-handicapping, perfectionism, locus of control and self-efficacy: A path model. Personality and Individual Differences, 66, 160-164.
Stoeber, J. (2012). Perfectionism and performance. In Murphy, S. M. (Ed.), Oxford handbook of sport and performance psychology (pp. 294-306). New York: Oxford University Press
Stoeber, J., Feast, A. R., & Hayward, J. A. (2009). Self-oriented and socially prescribed perfectionism: Differential relationships with intrinsic and extrinsic motivation and test anxiety. Personality and Individual Differences, 47(5), 423-428.
Stoeber, J., Haskew, A. E., & Scott, C. (2015). Perfectionism and exam performance: The mediating effect of task-approach goals. Personality and individual differences, 74, 171-176.
Stoeber, J., & Otto, K. (2006). Positive conceptions of perfectionism: Approaches, evidence, challenges. Personality and Social Psychology Review, 10, 295-319.
Stoeber, J., & Rambow, A. (2007). Perfectionism in adolescent school students: Relations with motivation, achievement, and well-being. Personality and Individual Differences, 42(7), 1379-1389.
Stoeber, J., Uphill, M. A., & Hotham, S. (2009). Predicting race performance in triathlon: The role of perfectionism, achievement goals, and personal goal setting. Journal of Sport and Exercise Psychology, 31(2), 211-245.
Stöber, J., & Joormann, J. (2001). Worry, procrastination, and perfectionism: Differentiating amount of worry, pathological worry, anxiety, and depression. Cognitive Therapy and Research, 25(1), 49-60.
309Academic Studies in Social, Human and Administrative Sciences - II 309
Strube, M. J. (1986). An analysis of the self-handicapping scale. Basic and Applied Social Psychology, 7(3), 211-224.
Strumbel, B. K. (2016). The Mediating Effects of Self-handicapping on Eating Disorder Symptomatology. Unpublished Master’s Thesis, Cleveland State University, Cleveland, Ohio.
Sula Ataş, N., & Kumcağız, H. (2019). Academic procrastination attitudes of adolescents, academic self-efficacy beliefs and perfectionism levels. Hacettepe University Journal of Education. Advance online publication. http://www.efdergi.hacettepe.edu.tr/yonetim/plugins/uploads/files/3048-published.pdf
Tice, D. M., & Baumeister, R. F. (1997). Longitudinal study of procrastination, performance, stress, and health: The costs and benefits of dawdling. Psychological Science, 8(6), 454-458.
Tuckman, B. W. (2002). Academic Procrastinators: Their Rationalizations and Web-Course Performance. In Paper presented at the Annual Meeting of the American Psychological Association 110th, August 22-25, Chicago, IL.
Urdan, T. (2004) Predictors of Academic Self-Handicapping and Achievement: Examining Achievement Goals, Classroom Goal Structures, and Culture. Journal of Educational Psychology, 96(2), 251-264.
Urdan, T., & Midgley, C. (2001). Academic Self handicapping: What we know, what more there is to learn. Educational Psychology Review, 13(2), 115-138.
Üzbe, N., & Bacanlı, H. (2015). Başarı Hedef Yönelimi, Benlik Saygısı Ve Akademik Başarının Kendini Engellemeyi Yordamadaki Rolü. Journal of Turkish Educational Sciences, 13(1), 33-50.
Van Eerde, W. (2003). A meta-analytically derived nomological network of procrastination. Personality and Individual Differences, 35(6), 1401-1418.
Verner-Filion, J., & Gaudreau, P. (2010). From perfectionism to academic adjustment: The mediating role of achievement goals. Personality and Individual Differences, 49(3), 181-186.
Walsh, J. J., & Ugumba-Agwunobi, G. (2002). Individual differences in statistics anxiety: The roles of perfectionism, procrastination and trait anxiety. Personality and Individual Differences, 33(2), 239-251.
Wang, Z., & Englander, F. (2010). A cross-disciplinary perspective on explaining student performance in introductory statistics--what is the relative impact of procrastination? College Student Journal, 44(2), 458-472.
Wernicke, R. A. (1999). Mediational Test of the Relationships Between Perfectionism and Procrastination. Unpublished master’s thesis, American University, USA.
Nur TALUY310
Wheeler, H. A., Blankstein, K. R., Antony, M. M., McCabe, R. E., & Bieling, P. J. (2011). Perfectionism in anxiety and depression: Comparisons across disorders, relations with symptom severity, and role of comorbidity. International Journal of Cognitive Therapy, 4(1), 66-91.
Wong, R. S., Suhaimi, N. S. F., Loh, M. K., Ahamed, M. A., Thavachelvan, R., Sakhnini, Z. & Ali, S. A. (2018). Multidimensional Perfectionism among Medical, Dental and Optometry students at SEGi University, Malaysia. Journal of Educational, Health and Community Psychology, 7(1),1-16.
Yadegarfard, M.& Yadegarfard, N. (2016). The Influence of Parenting Styles and Parents’ Perfectionism on Children’s Sense of Entitlement in the City of Bandarabbas, Iran. Journal of Child and Adolescent Behaviour, 4, 315
Yorulmaz, O. (2002). Responsibility and perfectionism as predictors of obsessive-compulsive symptomatology: A test of cognitive model. Unpublished master’s thesis, Middle East Technical University, Ankara.
Zuckerman, M., Kieffer, S. C., & Knee, C. R. (1998). Consequences of self-handicapping: effects on coping, academic performance and adjustment. Journal of Personality and Social Psychology, 74, 1619-1628.
Zuckerman, M., & Tsai, F. F. (2005). Costs of self‐handicapping. Journal of Personality, 73(2), 411-442.
Chapter 16EFFECTS OF SOCIAL MEDIA ON VOTERS IN ELECTIONS CAMPAIGN: “EXAMPLE MALATYA OF GENERAL ELECTIONS OF
NOVEMBER 2015”
Nural İMİK TANYILDIZI1 ,Taha Yasin ATEŞ2
1 Assoc. Prof. Dr.Firat University, Faculty of Communication, Department of Public Relations and Publicity, [email protected] Lecturer. Turgut Özal University, Battalgazi Vocational High School, Department of Local Governments, [email protected]

313Academic Studies in Social, Human and Administrative Sciences - II 313
1. INTRODUCTION In recent years, one of the common features of political campaigns
ranging from large protests to different types of elections has been the fre-quent use of digital media for communication and coordination (Zhang and Song, 2018: 2). The impact of the new digital technologies has recently become the object of great interest for scientists alike. Especially for the social scientist, new mass media have increased quantity and variety of en-tertainment options and possibilities of information channels. Potential im-plications for voting behavior are enormous. Two, possibly counteracting, effects could be triggered. One of them is potential voters could be distract-ed from consumption of political information and mobilized towards the use of new Technologies for amusement. The other one is, the new media could offer unprecedented ways for information acquisition and political participation (Belloc, 2018:14).
The internet, which was used only as a means of getting information and accessing information at first, changed later. Especially defined as so-cial media, Facebook, Twitter etc. With the spread of the sites, it has be-come a social communication tool. It has created a virtual society that is constantly communicating almost everywhere where human beings exist (Köseoğlu and Al, 2013: 109). Since the internet became available to the general population, information travels quicker and a generation has grown up during a time of instant connectivity and communication (Vonderschmit, 2012:1). The use of social media in politics has also increased. It is widely used especially in election periods. With social media, messages not only spread faster, but also penetrate deeper at cheaper cost. The social link between the recipients also creates a social impact that causes more people to participate in the political process or collective action (Ayankoya et al., 2015: 8). A significant portion of online campaigns should be reserved for voter mobilization and the organization of campaigns (Lilleker et al., 2011; Nielsen and Vaccari, 2013).
Social media provides access to resources affecting psychological par-ticipation, campaign buying and political participation (Vitak et al., 2011). During the election periods, social media became common communication channels for candidates. Platforms such as Facebook and Twitter allow candidates to reach voters directly, mobilizing supporters and influencing the public agenda. These fundamental changes in political communication therefore offer election candidates a wide range of strategic options (Stier et al.,2018: 2). 2008 US Presidential elections are shown as examples of the first political election activity carried out on social media. In this pe-riod, Democratic Party Candidate, Barack Obama tried to communicate with his voters through a total of 16 different social media environments. Following the USA Presidential Elections, it was observed that parties and
Nural İMİK TANYILDIZI ,Taha Yasin ATEŞ314
candidates turned to social media in the elections held in the UK and Austra-lia in 2010. The political use of the internet for the first time in Turkey was seen during the 2002 General Elections (Onat and Okmeydan, 2015: 80).
In this study, it was pointed out that social media influenced voters during election periods. It is aimed to reveal the effect of social media on voter behavior in November 1 General Elections. The hypothesis of the research is that voters follow social media in election rotations. However, the social media is not effective in the political behavior of the voter. In the research, for this purpose the Survey Research model was applied and the questionnaire technique was used in this context.
2. LITERATURE REVIEWMedia play a vital role in the perception and decisions of individuals
in both economic and political contexts, as information is often distribut-ed through media channels (Deventer et al. 2019: 246). One of the most used media types today is social media. Sweetser says that in today’s so-cial media environment, publics are increasingly connecting with political groups through new media technologies (Housholder and LaMarre, 2015: 138), while social media have been touted as a mechanism for engaging key stakeholder groups, disseminating campaign messages and increasing candidate support (LaMarre and Suzuki-Holbrecht, 2013; Housholder and LaMarre, 2015: 138). The online tools and web media that allow users to interact and communicate with each other by sharing their knowledge, opinions, interests, feelings and thoughts are called social media. Easy-to-use and open-to-participate virtual communication environments such as blogs, online chat sites, RSS, social networking sites, social bookmarking, forum, podcast, email chains and wikis are social media (Onat, 2010: 105). The most important feature of using social media as a tool for political communication with its functions such as providing public support and changing instability in a positive way is interactivity. In order to attract public support, there is interactivity in the two-way communication with the target audience and in all areas that can create support. This situation has shaped the traditional tools and methods of political communication in the light of new technologies (Öztürk, 2014: 400-405).
Social media is used as a political propaganda tool. Today it is the intensity of use by active actors of the political system. Almost all political parties and party sub-organizations now have an active account on social media, and parties continue all their political programs through these ac-counts. In fact, most of the public relations activities of political parties are carried out through these portals. Political parties; It announces daily activ-ities programs, political ideas, conflicts with rival parties to voters through these accounts (Köseoğlu and Al, 2013: 115). Social media use of political
315Academic Studies in Social, Human and Administrative Sciences - II 315
campaigns played a vital role for every political party and candidate. Since social media sites attract more attention and traffic from a public or official campaign websites, their connection has become valuable and critical. So-cial media not only allows politicians to search for information, but also allows them to interact with others and express them online by writing articles about political views, attitudes to social networking sites and blogs (Kushin and Yamamoto, 2009; Kumar and Natarajan, 2015: 2-3). Election campaigns are run not only by party leaders, but also by candidates for the election. Especially online social media such as Facebook and Twitter offer individual candidates new opportunities to reach voters regardless of the central party (Karlsen 2011; Zittel 2009; Karlsen and Enjolras, 2016:339)
Social media offers much more important opportunities in political communication compared to traditional media. The most important of these opportunities is that the political character and the electorate can communicate with each other without time and place restrictions. Thus, an environment of mutual understanding and tolerance, instant feedback and much lower communication costs arise (Onat and Okmeydan, 2015: 83). Social media can be used as an effective campaign tool, but it is often not tracked or misused by filling supporters with irrelevant advertisements and requests. However, when it is used to disseminate relevant information and relate people to politicians, it will create a more successful campaign and create a stronger democracy (Vonderschmit, 2012: 2-3).
3. OBJECTIVE AND METHODIn this study, it was aimed to reveal the effect of social media on voter
behavior in the General Elections of November 1 in Turkey. The hypothe-sis of the research was that voters follow social media during the election periods. However, the social media was not effective in the political behav-ior of the voter. In addition, voters do not trust social media messages suf-ficiently. In the research, the field research model was applied and survey technique was used. The research was limited to 500 people in the Malatya city center. A questionnaire form consisting of 21 questions was used. In addition, questionnaire questions were prepared for the purposes of the research. The frequency and percentage analyze of the data obtained in the research were calculated. The reliability of the questionnaire was calculat-ed with the Cronbach Alpha coefficient and determined to be reliable.
In the questionnaire, age, gender and educational status were asked. Then, questions were asked to determine the rate of participants’ use of social media, the reliability of information shared on social media, and the impact of voters on political behavior. People under the age of 18 were not included in the study because they cannot make political choices. The data obtained after the research was evaluated by SPSS 20.0 statistical program,
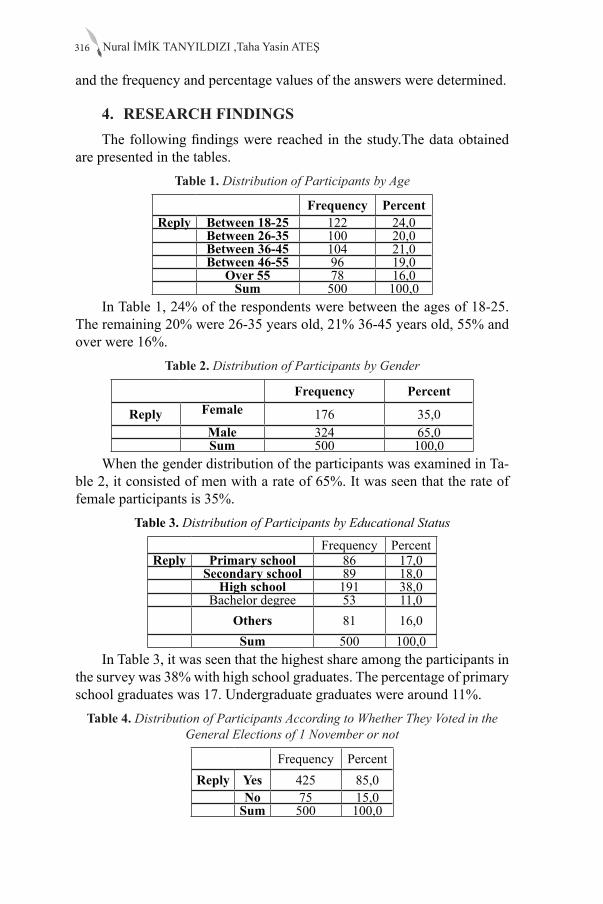
Nural İMİK TANYILDIZI ,Taha Yasin ATEŞ316
and the frequency and percentage values of the answers were determined.
4. RESEARCH FINDINGSThe following findings were reached in the study.The data obtained
are presented in the tables.Table 1. Distribution of Participants by Age
Frequency PercentReply Between 18-25 122 24,0
Between 26-35 100 20,0Between 36-45 104 21,0Between 46-55 96 19,0
Over 55 78 16,0Sum 500 100,0
In Table 1, 24% of the respondents were between the ages of 18-25. The remaining 20% were 26-35 years old, 21% 36-45 years old, 55% and over were 16%.
Table 2. Distribution of Participants by Gender
Frequency Percent
Reply Female 176 35,0Male 324 65,0Sum 500 100,0
When the gender distribution of the participants was examined in Ta-ble 2, it consisted of men with a rate of 65%. It was seen that the rate of female participants is 35%.
Table 3. Distribution of Participants by Educational Status
Frequency PercentReply Primary school 86 17,0
Secondary school 89 18,0High school 191 38,0
Bachelor degree 53 11,0Others 81 16,0Sum 500 100,0
In Table 3, it was seen that the highest share among the participants in the survey was 38% with high school graduates. The percentage of primary school graduates was 17. Undergraduate graduates were around 11%.
Table 4. Distribution of Participants According to Whether They Voted in the General Elections of 1 November or not
Frequency PercentReply Yes 425 85,0
No 75 15,0Sum 500 100,0
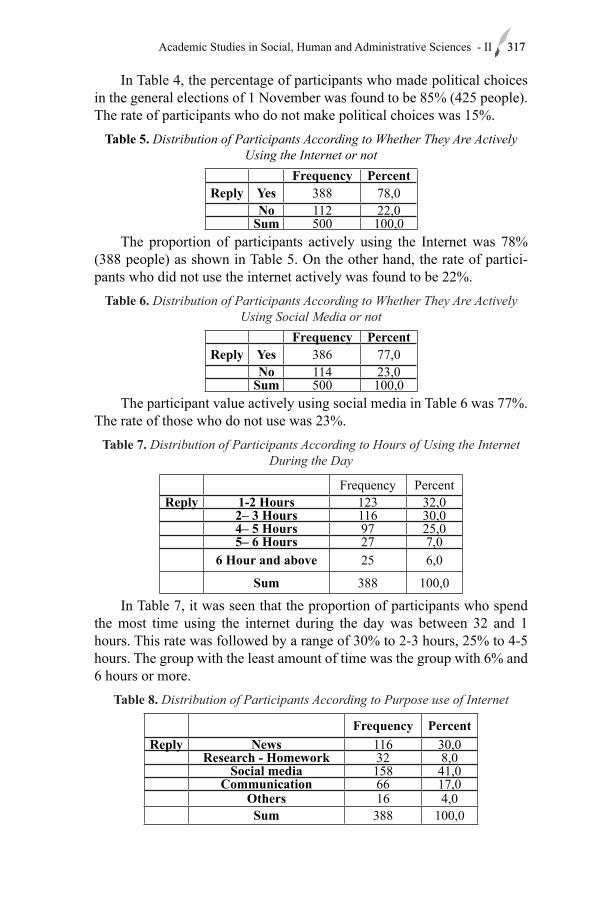
317Academic Studies in Social, Human and Administrative Sciences - II 317
In Table 4, the percentage of participants who made political choices in the general elections of 1 November was found to be 85% (425 people). The rate of participants who do not make political choices was 15%.
Table 5. Distribution of Participants According to Whether They Are Actively Using the Internet or not
Frequency PercentReply Yes 388 78,0
No 112 22,0Sum 500 100,0
The proportion of participants actively using the Internet was 78% (388 people) as shown in Table 5. On the other hand, the rate of partici-pants who did not use the internet actively was found to be 22%.
Table 6. Distribution of Participants According to Whether They Are Actively Using Social Media or not
Frequency PercentReply Yes 386 77,0
No 114 23,0Sum 500 100,0
The participant value actively using social media in Table 6 was 77%. The rate of those who do not use was 23%.
Table 7. Distribution of Participants According to Hours of Using the Internet During the Day
Frequency PercentReply 1-2 Hours 123 32,0
2– 3 Hours 116 30,04– 5 Hours 97 25,05– 6 Hours 27 7,0
6 Hour and above 25 6,0
Sum 388 100,0
In Table 7, it was seen that the proportion of participants who spend the most time using the internet during the day was between 32 and 1 hours. This rate was followed by a range of 30% to 2-3 hours, 25% to 4-5 hours. The group with the least amount of time was the group with 6% and 6 hours or more.
Table 8. Distribution of Participants According to Purpose use of Internet
Frequency PercentReply News 116 30,0
Research - Homework 32 8,0Social media 158 41,0
Communication 66 17,0Others 16 4,0Sum 388 100,0
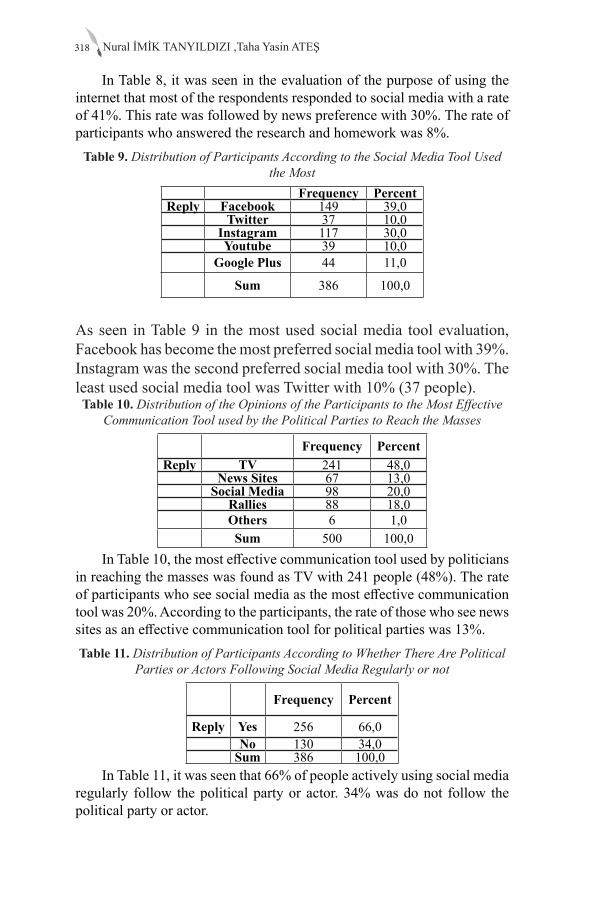
Nural İMİK TANYILDIZI ,Taha Yasin ATEŞ318
In Table 8, it was seen in the evaluation of the purpose of using the internet that most of the respondents responded to social media with a rate of 41%. This rate was followed by news preference with 30%. The rate of participants who answered the research and homework was 8%.
Table 9. Distribution of Participants According to the Social Media Tool Used the Most
Frequency PercentReply Facebook 149 39,0
Twitter 37 10,0Instagram 117 30,0Youtube 39 10,0
Google Plus 44 11,0
Sum 386 100,0
As seen in Table 9 in the most used social media tool evaluation, Facebook has become the most preferred social media tool with 39%. Instagram was the second preferred social media tool with 30%. The least used social media tool was Twitter with 10% (37 people).Table 10. Distribution of the Opinions of the Participants to the Most Effective
Communication Tool used by the Political Parties to Reach the Masses
Frequency PercentReply TV 241 48,0
News Sites 67 13,0Social Media 98 20,0
Rallies 88 18,0Others 6 1,0Sum 500 100,0
In Table 10, the most effective communication tool used by politicians in reaching the masses was found as TV with 241 people (48%). The rate of participants who see social media as the most effective communication tool was 20%. According to the participants, the rate of those who see news sites as an effective communication tool for political parties was 13%.Table 11. Distribution of Participants According to Whether There Are Political
Parties or Actors Following Social Media Regularly or not
Frequency Percent
Reply Yes 256 66,0No 130 34,0
Sum 386 100,0In Table 11, it was seen that 66% of people actively using social media
regularly follow the political party or actor. 34% was do not follow the political party or actor.
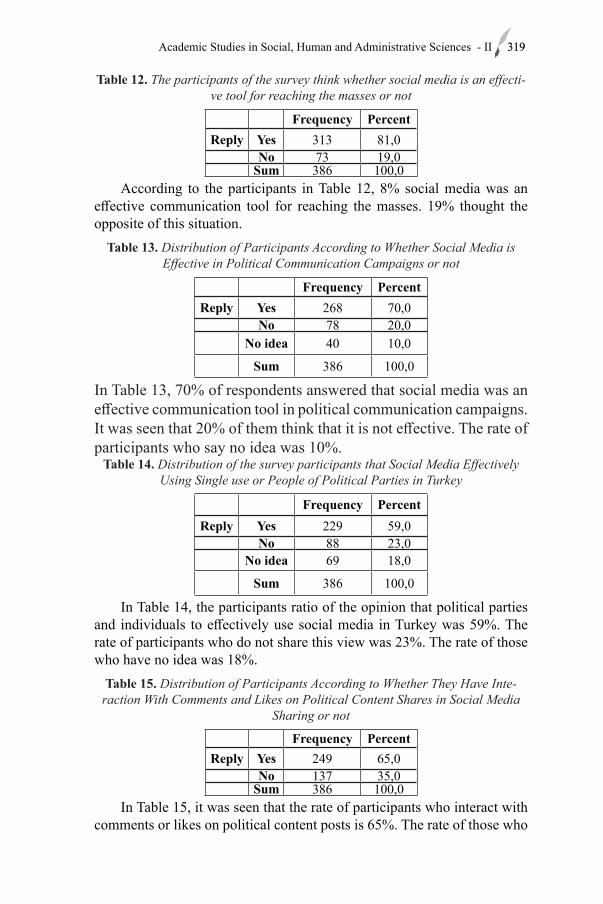
319Academic Studies in Social, Human and Administrative Sciences - II 319
Table 12. The participants of the survey think whether social media is an effecti-ve tool for reaching the masses or not
Frequency PercentReply Yes 313 81,0
No 73 19,0Sum 386 100,0
According to the participants in Table 12, 8% social media was an effective communication tool for reaching the masses. 19% thought the opposite of this situation.
Table 13. Distribution of Participants According to Whether Social Media is Effective in Political Communication Campaigns or not
Frequency PercentReply Yes 268 70,0
No 78 20,0No idea 40 10,0
Sum 386 100,0
In Table 13, 70% of respondents answered that social media was an effective communication tool in political communication campaigns. It was seen that 20% of them think that it is not effective. The rate of participants who say no idea was 10%.
Table 14. Distribution of the survey participants that Social Media Effectively Using Single use or People of Political Parties in Turkey
Frequency PercentReply Yes 229 59,0
No 88 23,0No idea 69 18,0
Sum 386 100,0
In Table 14, the participants ratio of the opinion that political parties and individuals to effectively use social media in Turkey was 59%. The rate of participants who do not share this view was 23%. The rate of those who have no idea was 18%.
Table 15. Distribution of Participants According to Whether They Have Inte-raction With Comments and Likes on Political Content Shares in Social Media
Sharing or not
Frequency PercentReply Yes 249 65,0
No 137 35,0Sum 386 100,0
In Table 15, it was seen that the rate of participants who interact with comments or likes on political content posts is 65%. The rate of those who

Nural İMİK TANYILDIZI ,Taha Yasin ATEŞ320
do not respond to political posts with comments or likes was 35%.Table 16. Distribution of the Participants According to Whether the Political Content Messages Shared on Social Media Affect Political Preference or not
Frequency PercentReply Yes 96 25,0
No 280 72,0No idea 10 3,0
Sum 386 100,0
In Table 16, 72% of the respondents answered that political posts shared on social media do not affect their political preferences. In 25%, it was seen that social media messages were effective in political choice. The rate of participants who have no idea about this was 3%.
Table 17. Distribution of the Questionnaires According to Whether They Trust Information from Social Media in Political Communication Campaigns or not
Frequency PercentReply Yes 184 48,0
No 191 49,0No idea 11 3,0
Sum 386 100,0
In Table 17, 49% of the participants stated that they do not trust the information received from social media in their political communication campaigns. The rate of trustworthy participants was determined to be 48%. The rate of participants who say I have no idea was 3%.Table 18. Distribution of Opinion of the Participants According to Whether Poli-ticians Actively Use Social Media in the 1st November General Elections or not
Frequency PercentReply Yes 209 54,0
No 97 25,0No idea 80 21,0
Sum 386 100,0
According to Table 18, 54% of the respondents think that politicians actively use social media in the November 1 general elections. The rate of participants who do not have this thought was 25%. It was seen that the rate of the participants who have no idea was 21%.
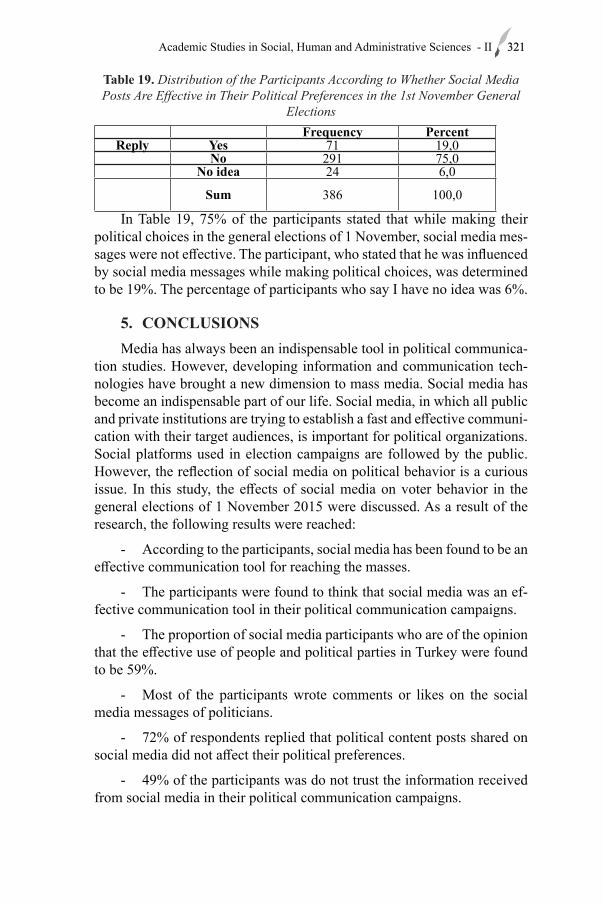
321Academic Studies in Social, Human and Administrative Sciences - II 321
Table 19. Distribution of the Participants According to Whether Social Media Posts Are Effective in Their Political Preferences in the 1st November General
ElectionsFrequency Percent
Reply Yes 71 19,0No 291 75,0
No idea 24 6,0
Sum 386 100,0
In Table 19, 75% of the participants stated that while making their political choices in the general elections of 1 November, social media mes-sages were not effective. The participant, who stated that he was influenced by social media messages while making political choices, was determined to be 19%. The percentage of participants who say I have no idea was 6%.
5. CONCLUSIONSMedia has always been an indispensable tool in political communica-
tion studies. However, developing information and communication tech-nologies have brought a new dimension to mass media. Social media has become an indispensable part of our life. Social media, in which all public and private institutions are trying to establish a fast and effective communi-cation with their target audiences, is important for political organizations. Social platforms used in election campaigns are followed by the public. However, the reflection of social media on political behavior is a curious issue. In this study, the effects of social media on voter behavior in the general elections of 1 November 2015 were discussed. As a result of the research, the following results were reached:
- According to the participants, social media has been found to be an effective communication tool for reaching the masses.
- The participants were found to think that social media was an ef-fective communication tool in their political communication campaigns.
- The proportion of social media participants who are of the opinion that the effective use of people and political parties in Turkey were found to be 59%.
- Most of the participants wrote comments or likes on the social media messages of politicians.
- 72% of respondents replied that political content posts shared on social media did not affect their political preferences.
- 49% of the participants was do not trust the information received from social media in their political communication campaigns.
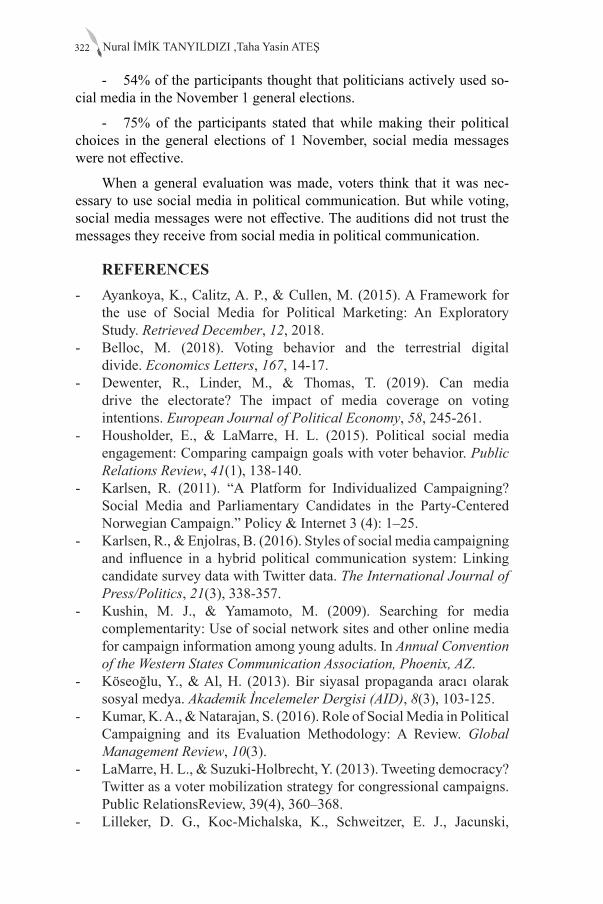
Nural İMİK TANYILDIZI ,Taha Yasin ATEŞ322
- 54% of the participants thought that politicians actively used so-cial media in the November 1 general elections.
- 75% of the participants stated that while making their political choices in the general elections of 1 November, social media messages were not effective.
When a general evaluation was made, voters think that it was nec-essary to use social media in political communication. But while voting, social media messages were not effective. The auditions did not trust the messages they receive from social media in political communication.
REFERENCES- Ayankoya, K., Calitz, A. P., & Cullen, M. (2015). A Framework for
the use of Social Media for Political Marketing: An Exploratory Study. Retrieved December, 12, 2018.
- Belloc, M. (2018). Voting behavior and the terrestrial digital divide. Economics Letters, 167, 14-17.
- Dewenter, R., Linder, M., & Thomas, T. (2019). Can media drive the electorate? The impact of media coverage on voting intentions. European Journal of Political Economy, 58, 245-261.
- Housholder, E., & LaMarre, H. L. (2015). Political social media engagement: Comparing campaign goals with voter behavior. Public Relations Review, 41(1), 138-140.
- Karlsen, R. (2011). “A Platform for Individualized Campaigning? Social Media and Parliamentary Candidates in the Party-Centered Norwegian Campaign.” Policy & Internet 3 (4): 1–25.
- Karlsen, R., & Enjolras, B. (2016). Styles of social media campaigning and influence in a hybrid political communication system: Linking candidate survey data with Twitter data. The International Journal of Press/Politics, 21(3), 338-357.
- Kushin, M. J., & Yamamoto, M. (2009). Searching for media complementarity: Use of social network sites and other online media for campaign information among young adults. In Annual Convention of the Western States Communication Association, Phoenix, AZ.
- Köseoğlu, Y., & Al, H. (2013). Bir siyasal propaganda aracı olarak sosyal medya. Akademik İncelemeler Dergisi (AID), 8(3), 103-125.
- Kumar, K. A., & Natarajan, S. (2016). Role of Social Media in Political Campaigning and its Evaluation Methodology: A Review. Global Management Review, 10(3).
- LaMarre, H. L., & Suzuki-Holbrecht, Y. (2013). Tweeting democracy? Twitter as a voter mobilization strategy for congressional campaigns. Public RelationsReview, 39(4), 360–368.
- Lilleker, D. G., Koc-Michalska, K., Schweitzer, E. J., Jacunski,
323Academic Studies in Social, Human and Administrative Sciences - II 323
M., Jackson, N., & Vedel, T. (2011). Informing, engaging, mobilizing or interacting: Searching for a European model of web campaigning. European Journal of Communication, 26(3), 195-213.
- Nielsen, R. K., & Vaccari, C. (2013). Do people “like” politicians on Facebook? Not really. Large-scale direct candidate-to-voter online communication as an outlier phenomenon. International Journal of Communication, 7, 24.
- Onat, F. (2010) “Bir Halkla İlişkiler Uygulama Alanı Olarak Sosyal Medya Kullanımı: Sivil Toplum Örgütleri Üzerine Bir İnceleme”, Gazi Üniversitesi İletişim Fakültesi Kavram ve Araştırma Dergisi, Sayı:31, Güz, ss.101-122.
- Onat, F., & Okmeydan, C. K. (2015). Politik Halkla İlişkilerde Sosyal Medya Kullanımı: 30 Mart 2014 Yerel Seçimleri ve 10 Ağustos 2014 Cumhurbaşkanlığı Seçimleri. Akdeniz Iletisim, (23).
- Öztürk, İ. D. (2014). Siyasal İletişim Aracı Olarak Sosyal Medya: 2012 Amerikan Başkanlık Seçimlerinde Twitter Kullanımı Üzerine Bir Araştırma. Yeni Medya Araştırmaları: Kavramlar, Uygulamalar, Tartışmalar, Konya: Literatürk Akademi, 399-436.
- Stier, S., Bleier, A., Lietz, H., & Strohmaier, M. (2018). Election campaigning on social media: Politicians, audiences, and the mediation of political communication on Facebook and Twitter. Political communication, 35(1), 50-74.
- Vitak, J., Zube, P., Smock, A., Carr, C. T., Ellison, N. and Lampe, C. (2011). Its complicated: Facebook users’ political participation in the 2008 election. Cyberpsychology, behavior, and social networking, 14(3), 107–114.
- Vonderschmitt, K. (2012). The growing use of social media in political campaigns: How to use Facebook, Twitter and YouTube to create an effective social media campaign.
- Zhang, N. Y., & Song, C. Y. The Role of Social Media in Political Campaigns: A Sentiment and Engagement Analysis of Political News Feeds and Facebook Comments in Three Political Events in Hong Kong.
- Zittel, Thomas. 2009. “Lost in Technology? Political Parties and Online Campaigns of Constituency Candidates in Germany’s Mixed Member Electoral System.” Journal of Information Technology & Politics 6:298–311


Chapter 17VIRAL MARKETING AS A MEANS OF
PROMOTING LIVE QUIZ SHOW “HADI LIVE”
Nural İMİK TANYILDIZI1, Ayşe Şebnem YOLCU2
1 Assoc. Prof. Dr. Firat University, Faculty of Communication, Department of Public Relations and Publicity, E-mail: [email protected] Lecturer. Bingöl University, Vocational School of Social Sciences, Call Services Program, [email protected]

327Academic Studies in Social, Human and Administrative Sciences - II 327
1. INTRODUCTION In this study, especially the virality and viral marketing were analysed.
The viral marketing touches on a phenomenon in which the communica-tion message spreads from person to person like a virus, so that the name viral marketing. It can be defined as a marketing strategy that permeates users to spread or share the message to others which can lead to multi-fold growth. When something like TV programme, advertisement or brand slogan became viral, they would have a tremendous impact and would provide their companies more visibility on the market. However, there is no single way to make something viral, here are different approaches to achieving successful results. The effectiveness of these approaches may vary by product or service (Goldsmith 2002, 3-6.) However sometimes viral effect can increase risk of negative reactions of consumers against the company. In this situation viral effect will able to damage company’s reputation. The unpredictable nature of viral marketing and high potential outcomes motivated the author to explore this issue in more depth because understanding certain approaches and elements increases the chances to derive successful outcomes. Nowadays, many people in Turkey are par-ticipating as an active user to live quiz program, and they follow the latest news and trends related the program. This fact became an additional moti-vational point to research effectiveness and importance of viral marketing in the live Quiz show “Hadi”. In this study, it is considered that the show is successful thanks to the implementation of successful viral marketing techniques. This research article intents to prove or refute this.
2. METHODOLOGYThe research methodology embodies of literature reviews consisting
of expert articles, reports, internet resources, books and interviews. Since the aim of the study is to examine the current theories on the subject, it is focused on the theoretical literature review. The author preferred a theoret-ical literature review method in which old studies as well as current theo-ries were examined. This section also includes the component of historical review, as it consists of viral marketing history and ‘Hadi’ quiz content. The literature review is divided into three main sections: The definition of viral marketing, the STEPPS theory of Jonah Berger, and the description and analysis of “Hadi” show according to the live quiz step theory.
3.LITERATURE REVIEW
3.1. VIRAL MARKETING-CONCEPTUAL ANALYSIS
In the contemporary competitive business world, every business own-ers look forward different technique to promote their business in globally.
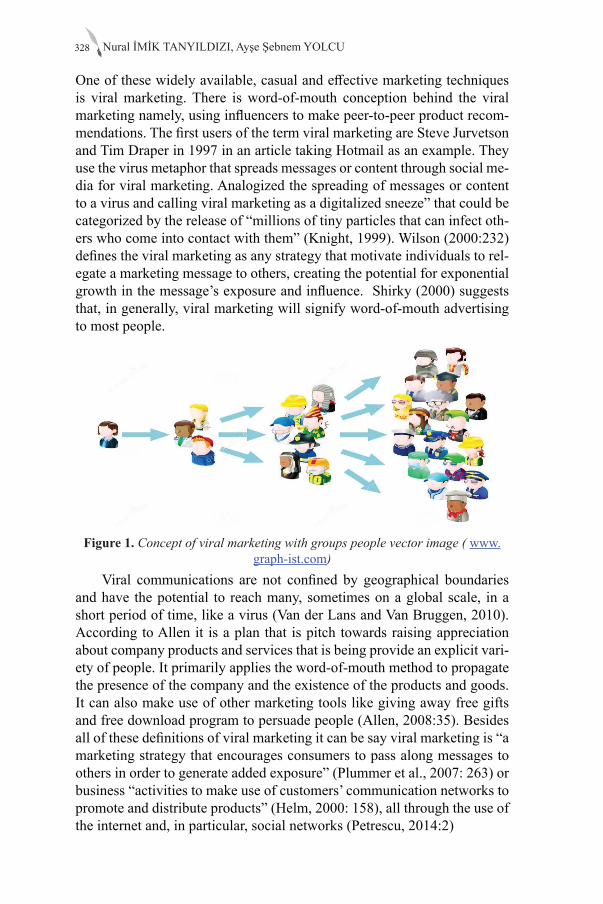
Nural İMİK TANYILDIZI, Ayşe Şebnem YOLCU328
One of these widely available, casual and effective marketing techniques is viral marketing. There is word-of-mouth conception behind the viral marketing namely, using influencers to make peer-to-peer product recom-mendations. The first users of the term viral marketing are Steve Jurvetson and Tim Draper in 1997 in an article taking Hotmail as an example. They use the virus metaphor that spreads messages or content through social me-dia for viral marketing. Analogized the spreading of messages or content to a virus and calling viral marketing as a digitalized sneeze” that could be categorized by the release of “millions of tiny particles that can infect oth-ers who come into contact with them” (Knight, 1999). Wilson (2000:232) defines the viral marketing as any strategy that motivate individuals to rel-egate a marketing message to others, creating the potential for exponential growth in the message’s exposure and influence. Shirky (2000) suggests that, in generally, viral marketing will signify word-of-mouth advertising to most people.
Figure 1. Concept of viral marketing with groups people vector image ( www.graph-ist.com)
Viral communications are not confined by geographical boundaries and have the potential to reach many, sometimes on a global scale, in a short period of time, like a virus (Van der Lans and Van Bruggen, 2010). According to Allen it is a plan that is pitch towards raising appreciation about company products and services that is being provide an explicit vari-ety of people. It primarily applies the word-of-mouth method to propagate the presence of the company and the existence of the products and goods. It can also make use of other marketing tools like giving away free gifts and free download program to persuade people (Allen, 2008:35). Besides all of these definitions of viral marketing it can be say viral marketing is “a marketing strategy that encourages consumers to pass along messages to others in order to generate added exposure” (Plummer et al., 2007: 263) or business “activities to make use of customers’ communication networks to promote and distribute products” (Helm, 2000: 158), all through the use of the internet and, in particular, social networks (Petrescu, 2014:2)
329Academic Studies in Social, Human and Administrative Sciences - II 329
3.2. TYPES OF VIRAL MARKETING
Viral marketing can be divided into two classifications as online and offline by channels and methods that used (Malinen, 2018:14). Online viral marketing includes viral videos, viral games, blogging and e-mail. Making a video one of the most excellent way to go viral for a company. A video can make consumers engage in company’s product and experience. If a company creates a video, which is the more shocking, memorable or fun-ny, it is more likely to go viral and downloads it into its media. Viral videos may be not necessarily related with a company or a product. As the main requirement, the company information cannot interfere with the video, but it might be added as a subtitle or in the form of expression of a charac-ter (Goldsmith, 2002: 79-82). Simple mechanism of games is designed to entertain the players for long hours. One of the well-known examples of viral games is “Candy Chrush”. It has a simple gameplay and tasks, and also easy to learn instructions. Levels of the game are interesting and full of surprise. Blogs are another way of online viral marketing. People can share their pictures, short videos and blogs easily using different social media platforms such as Twitter, Instagram etc. If the content is interesting or useful, visitors tend to tell friends, usually by sending them a link (Scott , 2009:166). Thus the content can be trend. E-mail is one of the most ef-fective methods for companies to reach their brands to costumers directly. By using E-mail marketing, digital word of mouth marketing aims to at-tract the attention of consumers using new methods and to increase sales. Sending E-mail as a viral marketing tool is a very influential way to create brand awareness and loyalty. Companies can contact with their costumers and potential customers in the accordance with their interests. Messages can be shaped personally and timing is flexible (Kalpakoğlu and Toros, 2011:4124). Offline viral marketing includes three subcategories, such as buzz, opinion leaders, and friend strategy. If the original information is backed up with fictional information that increases the level of discussion and with extra details, the benefit of the company or product will be sur-prising. This path is very dangerous because the result is unpredictable and the wind can reverse and let the company or product stand out, let alone lose their reputation (Rosen, 2009: 158-161).
Friend’s strategy viral marketing is one of the easiest methods to use a friend script. According to Cassingena (2009: 61), it is a simple program-ming script that companies can easily add to their website. Generally, tell a friend scripts are installed in pages where a media is placed so that a person can easily send the media to any of his/her friends or relatives and in return he/she wins some promotion like bonuses or prizes. Opinion leaders are one of the certain parts of the consumer segment and at the same time they are important references for other consumers. They are specialists about some
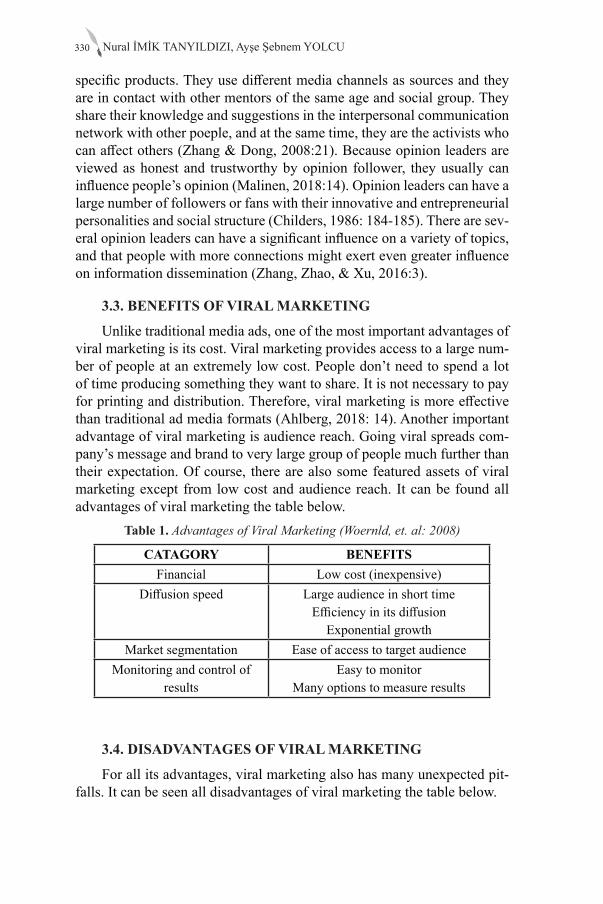
Nural İMİK TANYILDIZI, Ayşe Şebnem YOLCU330
specific products. They use different media channels as sources and they are in contact with other mentors of the same age and social group. They share their knowledge and suggestions in the interpersonal communication network with other poeple, and at the same time, they are the activists who can affect others (Zhang & Dong, 2008:21). Because opinion leaders are viewed as honest and trustworthy by opinion follower, they usually can influence people’s opinion (Malinen, 2018:14). Opinion leaders can have a large number of followers or fans with their innovative and entrepreneurial personalities and social structure (Childers, 1986: 184-185). There are sev-eral opinion leaders can have a significant influence on a variety of topics, and that people with more connections might exert even greater influence on information dissemination (Zhang, Zhao, & Xu, 2016:3).
3.3. BENEFITS OF VIRAL MARKETING
Unlike traditional media ads, one of the most important advantages of viral marketing is its cost. Viral marketing provides access to a large num-ber of people at an extremely low cost. People don’t need to spend a lot of time producing something they want to share. It is not necessary to pay for printing and distribution. Therefore, viral marketing is more effective than traditional ad media formats (Ahlberg, 2018: 14). Another important advantage of viral marketing is audience reach. Going viral spreads com-pany’s message and brand to very large group of people much further than their expectation. Of course, there are also some featured assets of viral marketing except from low cost and audience reach. It can be found all advantages of viral marketing the table below.
Table 1. Advantages of Viral Marketing (Woernld, et. al: 2008)
CATAGORY BENEFITSFinancial Low cost (inexpensive)
Diffusion speed Large audience in short timeEfficiency in its diffusion
Exponential growthMarket segmentation Ease of access to target audience
Monitoring and control ofresults
Easy to monitorMany options to measure results
3.4. DISADVANTAGES OF VIRAL MARKETING
For all its advantages, viral marketing also has many unexpected pit-falls. It can be seen all disadvantages of viral marketing the table below.
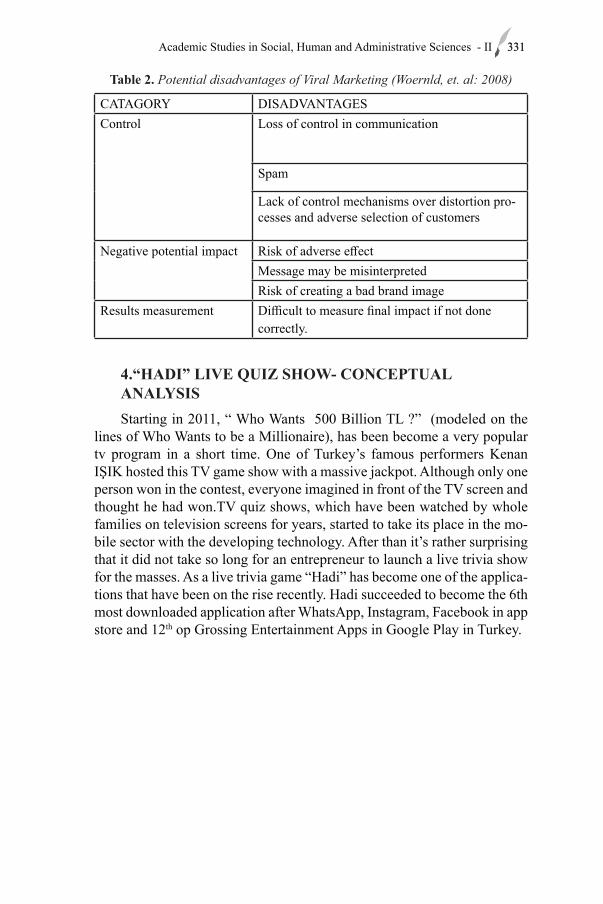
331Academic Studies in Social, Human and Administrative Sciences - II 331
Table 2. Potential disadvantages of Viral Marketing (Woernld, et. al: 2008)
CATAGORY DISADVANTAGESControl Loss of control in communication
Spam
Lack of control mechanisms over distortion pro-cesses and adverse selection of customers
Negative potential impact Risk of adverse effectMessage may be misinterpretedRisk of creating a bad brand image
Results measurement Difficult to measure final impact if not donecorrectly.
4.“HADI” LIVE QUIZ SHOW- CONCEPTUAL ANALYSIS Starting in 2011, “ Who Wants 500 Billion TL ?” (modeled on the
lines of Who Wants to be a Millionaire), has been become a very popular tv program in a short time. One of Turkey’s famous performers Kenan IŞIK hosted this TV game show with a massive jackpot. Although only one person won in the contest, everyone imagined in front of the TV screen and thought he had won.TV quiz shows, which have been watched by whole families on television screens for years, started to take its place in the mo-bile sector with the developing technology. After than it’s rather surprising that it did not take so long for an entrepreneur to launch a live trivia show for the masses. As a live trivia game “Hadi” has become one of the applica-tions that have been on the rise recently. Hadi succeeded to become the 6th most downloaded application after WhatsApp, Instagram, Facebook in app store and 12th op Grossing Entertainment Apps in Google Play in Turkey.
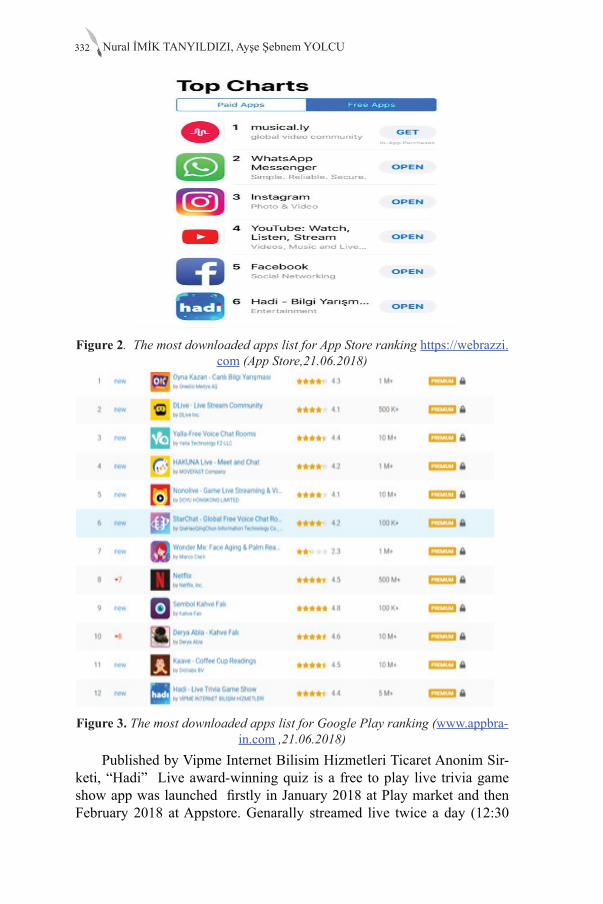
Nural İMİK TANYILDIZI, Ayşe Şebnem YOLCU332
Figure 2. The most downloaded apps list for App Store ranking https://webrazzi.
com (App Store,21.06.2018)
Figure 3. The most downloaded apps list for Google Play ranking (www.appbra-in.com ,21.06.2018)
Published by Vipme Internet Bilisim Hizmetleri Ticaret Anonim Sir-keti, “Hadi” Live award-winning quiz is a free to play live trivia game show app was launched firstly in January 2018 at Play market and then February 2018 at Appstore. Genarally streamed live twice a day (12:30

333Academic Studies in Social, Human and Administrative Sciences - II 333
pm and 20:30pm UTC+3), players can earn money by answering 12 trivia questions correctly. The contest is a quiz where online people can make real money.
Figure 4. Hadi’s mobil streaming guide (www.flaregames.com)
Live broadcasting starts at a certain time and people can join the broad-casts via mobile applications. There is an organizer asking questions and giving answers. The game mostly consists of 12 questions where the dif-ficulty level increases gradually. There are three options for each question and there is only one correct answer. Those who answer all 12 questions correctly share the award. The competitor is automatically disqualified in the first wrong answer. The money in the prize pool is shared equally to the winners and the money is transferred by PayPal. If everyone is disqual-ified before coming to the final question, the prize is not given to anyone and transferred to the next competition. Each question should be answered within 10 seconds after it appears on the screen. This time limit prevents cheating by making it harder to take advantage of Google. However, this measure does not prevent people from trying this path, as will be seen in the Google Trends chart below.
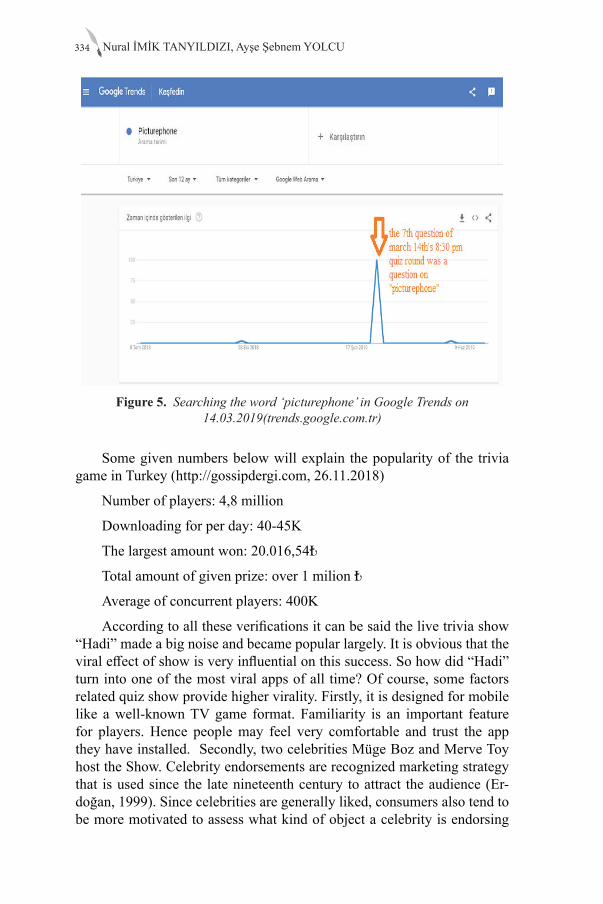
Nural İMİK TANYILDIZI, Ayşe Şebnem YOLCU334
Figure 5. Searching the word ‘picturephone’ in Google Trends on 14.03.2019(trends.google.com.tr)
Some given numbers below will explain the popularity of the trivia game in Turkey (http://gossipdergi.com, 26.11.2018)
Number of players: 4,8 million
Downloading for per day: 40-45K
The largest amount won: 20.016,54₺
Total amount of given prize: over 1 milion ₺
Average of concurrent players: 400K
According to all these verifications it can be said the live trivia show “Hadi” made a big noise and became popular largely. It is obvious that the viral effect of show is very influential on this success. So how did “Hadi” turn into one of the most viral apps of all time? Of course, some factors related quiz show provide higher virality. Firstly, it is designed for mobile like a well-known TV game format. Familiarity is an important feature for players. Hence people may feel very comfortable and trust the app they have installed. Secondly, two celebrities Müge Boz and Merve Toy host the Show. Celebrity endorsements are recognized marketing strategy that is used since the late nineteenth century to attract the audience (Er-doğan, 1999). Since celebrities are generally liked, consumers also tend to be more motivated to assess what kind of object a celebrity is endorsing

335Academic Studies in Social, Human and Administrative Sciences - II 335
( Knoll and Jörg Matthes, 2017:57). Thirdly it gives large enough prize to participants. The desire to make a lot of money is an effective factor that motivates people (Lawler,1981).
5. THEORETICAL FRAMEWORK
5.1. JONAH BERGER’S STEPPS THEORY
Jonah Berger is a proficient on marketing and he also works a profes-sor in the University of Pennsylvania. Berger analyzed thousands of pieces of viral content to understand what compels people to share information with their network. Then he wrote a book called “Contagious: Why Things Catch On” which exposed the “secret formula” of making the things go viral. According to Berger (2016), there is no special method to produce a very successful marketing message. It is possible to do this with tech-niques and strategies that increase the chances of the marketer (Malinen, 2018: 19).Berger reveals that the success of viral content can be attributed to just six elements, or “STEPPS”. STEPPS is the acronym to the follow-ing characteristic features of the top viral achievements: Social Currency, Triggers, Emotions, Public, Practical Value and Stories. These elements are displayed in Figure 2 and explained below:
Figure 6. Berger’s STEPPS-model (www.jonahberger.com)
a. Social Currency: Berger points out people would rather look cool than nerd, smart than dumb, or rich than poor in front of others because people care about how they look to others (Berger 2016: 22). A crucial side of social currency is remarkability. Sharing content is one of the ways of changing and improving others’ opinion about itself (Malinen, 2018:19). For instance, when someone shares an academic article about the global warm-ing on social media, people think that (s)he has environmental awareness.
b. Trigger: According to public relations literature, a trigger, or trig-gering event, is an event or occurrence that is likely to move those with a
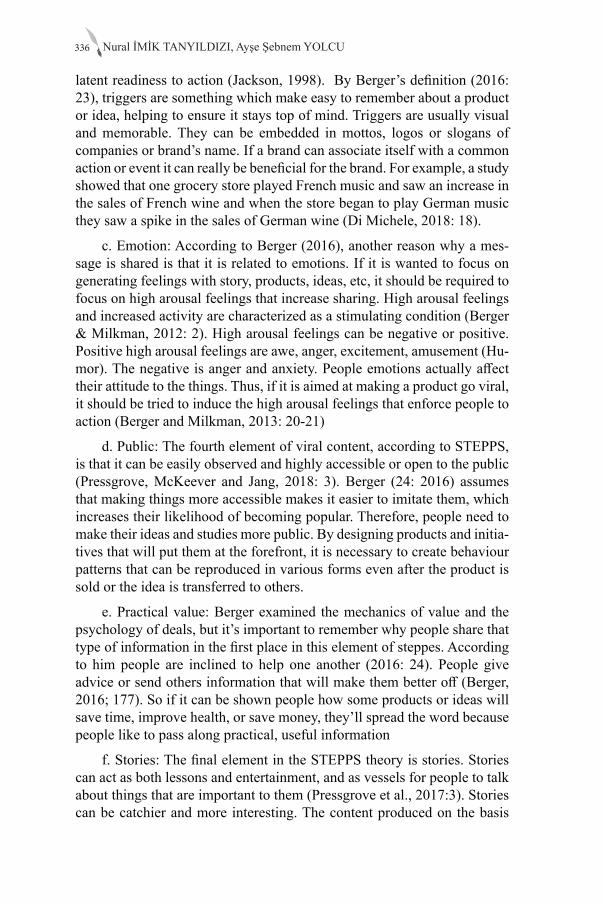
Nural İMİK TANYILDIZI, Ayşe Şebnem YOLCU336
latent readiness to action (Jackson, 1998). By Berger’s definition (2016: 23), triggers are something which make easy to remember about a product or idea, helping to ensure it stays top of mind. Triggers are usually visual and memorable. They can be embedded in mottos, logos or slogans of companies or brand’s name. If a brand can associate itself with a common action or event it can really be beneficial for the brand. For example, a study showed that one grocery store played French music and saw an increase in the sales of French wine and when the store began to play German music they saw a spike in the sales of German wine (Di Michele, 2018: 18).
c. Emotion: According to Berger (2016), another reason why a mes-sage is shared is that it is related to emotions. If it is wanted to focus on generating feelings with story, products, ideas, etc, it should be required to focus on high arousal feelings that increase sharing. High arousal feelings and increased activity are characterized as a stimulating condition (Berger & Milkman, 2012: 2). High arousal feelings can be negative or positive. Positive high arousal feelings are awe, anger, excitement, amusement (Hu-mor). The negative is anger and anxiety. People emotions actually affect their attitude to the things. Thus, if it is aimed at making a product go viral, it should be tried to induce the high arousal feelings that enforce people to action (Berger and Milkman, 2013: 20-21)
d. Public: The fourth element of viral content, according to STEPPS, is that it can be easily observed and highly accessible or open to the public (Pressgrove, McKeever and Jang, 2018: 3). Berger (24: 2016) assumes that making things more accessible makes it easier to imitate them, which increases their likelihood of becoming popular. Therefore, people need to make their ideas and studies more public. By designing products and initia-tives that will put them at the forefront, it is necessary to create behaviour patterns that can be reproduced in various forms even after the product is sold or the idea is transferred to others.
e. Practical value: Berger examined the mechanics of value and the psychology of deals, but it’s important to remember why people share that type of information in the first place in this element of steppes. According to him people are inclined to help one another (2016: 24). People give advice or send others information that will make them better off (Berger, 2016; 177). So if it can be shown people how some products or ideas will save time, improve health, or save money, they’ll spread the word because people like to pass along practical, useful information
f. Stories: The final element in the STEPPS theory is stories. Stories can act as both lessons and entertainment, and as vessels for people to talk about things that are important to them (Pressgrove et al., 2017:3). Stories can be catchier and more interesting. The content produced on the basis
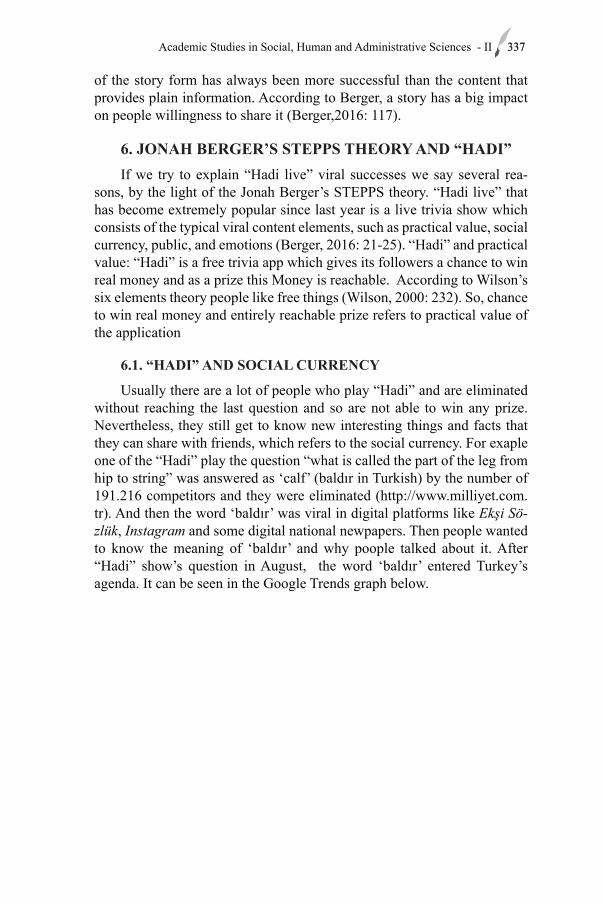
337Academic Studies in Social, Human and Administrative Sciences - II 337
of the story form has always been more successful than the content that provides plain information. According to Berger, a story has a big impact on people willingness to share it (Berger,2016: 117).
6. JONAH BERGER’S STEPPS THEORY AND “HADI”If we try to explain “Hadi live” viral successes we say several rea-
sons, by the light of the Jonah Berger’s STEPPS theory. “Hadi live” that has become extremely popular since last year is a live trivia show which consists of the typical viral content elements, such as practical value, social currency, public, and emotions (Berger, 2016: 21-25). “Hadi” and practical value: “Hadi” is a free trivia app which gives its followers a chance to win real money and as a prize this Money is reachable. According to Wilson’s six elements theory people like free things (Wilson, 2000: 232). So, chance to win real money and entirely reachable prize refers to practical value of the application
6.1. “HADI” AND SOCIAL CURRENCY
Usually there are a lot of people who play “Hadi” and are eliminated without reaching the last question and so are not able to win any prize. Nevertheless, they still get to know new interesting things and facts that they can share with friends, which refers to the social currency. For exaple one of the “Hadi” play the question “what is called the part of the leg from hip to string” was answered as ‘calf’ (baldır in Turkish) by the number of 191.216 competitors and they were eliminated (http://www.milliyet.com.tr). And then the word ‘baldır’ was viral in digital platforms like Ekşi Sö-zlük, Instagram and some digital national newpapers. Then people wanted to know the meaning of ‘baldır’ and why poople talked about it. After “Hadi” show’s question in August, the word ‘baldır’ entered Turkey’s agenda. It can be seen in the Google Trends graph below.
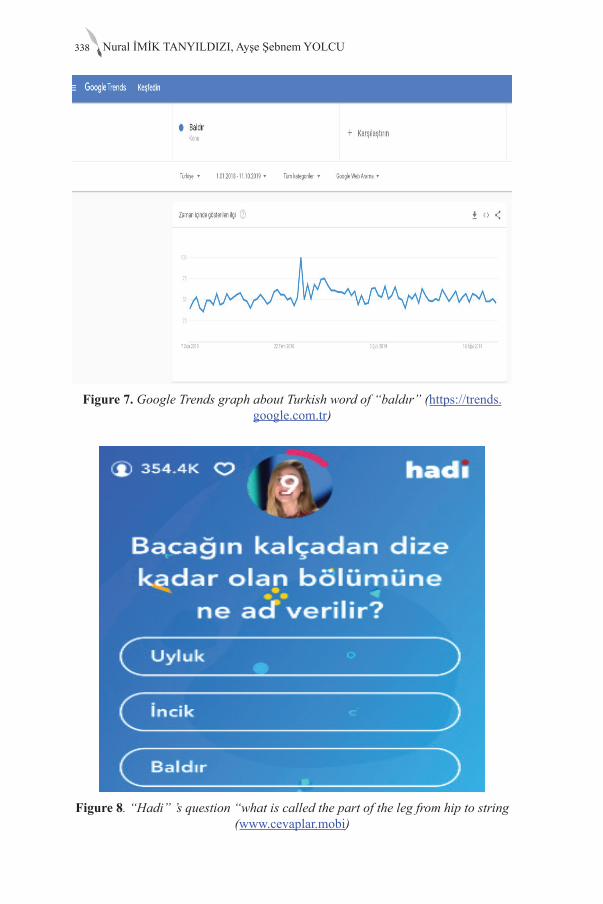
Nural İMİK TANYILDIZI, Ayşe Şebnem YOLCU338
Figure 7. Google Trends graph about Turkish word of “baldır” (https://trends.google.com.tr)
Figure 8. “Hadi” ’s question “what is called the part of the leg from hip to string
(www.cevaplar.mobi)

339Academic Studies in Social, Human and Administrative Sciences - II 339
figure 9. Response rate (www.cevaplar.mobi) About one mount after the question was asked again but this time
people knew the wright answer thank to social media, digital newspaper and platforms and there were only a few people eliminated.
6.3. “HADI” AND EMOTIONS
People desire to share the emotions (Berger 2016, 31- 32). Because of loving to share emotions, a lot of people share to their close friends during the game with that they feel i.e. excitement, feel of competition, sense of confidence or happiness of the win. Progressive difficulty of questions creates excitement to the competitor. Everyone loves bragging with their success, that’s why there is a Leaderboard. On the show, number of players being on live and percentage of people answering questions to progress to the next round are being given during the competition. Thus, the numbers make it more exciting for participants. Moreover, the game gives extra chance to make a mistake in the game. Using a ‘life’ to continue the game is the crown jewel of “Hadi” ’s growth. Who doesn’t want to get a second chance? Extra life gives the competitor a sense of confidence The compet-itors can refer their friends to get a ‘life’ or get referral code from official Instagram account or via some apps like Bip, Fizzy or Dergilik for continu-ing the game (https://www.haberturk.com).

Nural İMİK TANYILDIZI, Ayşe Şebnem YOLCU340
6.4. HADI AND PUPLIC
This gaming app becomes even more popular when celebrities lead the game. Firstly two celebrities Müge Boz and Merve Toy host the Show. Sometimes some famous people are invited to show for hosting like Alex De Souza. A celebrity host can add legitimacy to the show thus competitors tend to be more motivated for the show.
7. CONCLUSIONS“Hadi” is a fabulous example of viral marketing. By using viral mar-
keting techniques, “Hadi” obtains customer habits gain a significant com-petitive advantage “Hadi” ’s success can be clarified by the Nir Eyal “Hook Model” that he annotated to explain the why the game is such an addiction. Nir Eyal describes the process of building a habit-driven strategy as the Hook Model.
Figure 10. Nir Eyal’s “Hook Model” (https://www.academia.edu/36947601/OceanofPDF)
According to the Hook Model, it is what triggers ‘triggering’ behavior, and there are two types of trigger, internal and external. ‘Action’ occurs in the hope of a reward. ‘Variable Reward’ means rewarding users differently at each step and strengthening their motivation for each new action. “In-vestment” is an action to improve the service for the next issue (Eyal & Hoover, 2014).
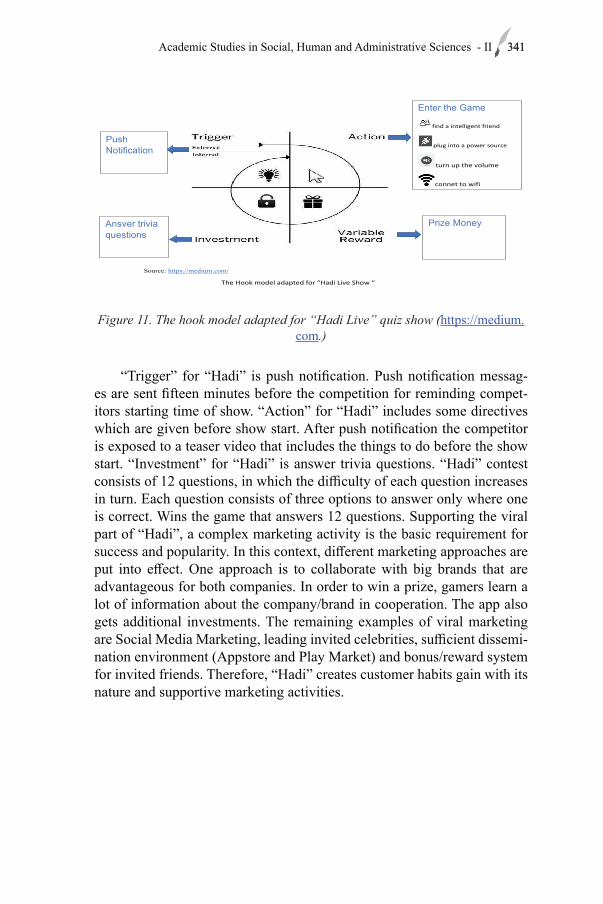
341Academic Studies in Social, Human and Administrative Sciences - II 341
Source: https://medium.com/
The Hook model adapted for “Hadi Live Show “
Enter the Game
find a intelligent friend
plug into a power source
turn up the volume
connet to wifi
Push Notification
Ansver trivia questions
Prize Money
Figure 11. The hook model adapted for “Hadi Live” quiz show (https://medium.com.)
“Trigger” for “Hadi” is push notification. Push notification messag-es are sent fifteen minutes before the competition for reminding compet-itors starting time of show. “Action” for “Hadi” includes some directives which are given before show start. After push notification the competitor is exposed to a teaser video that includes the things to do before the show start. “Investment” for “Hadi” is answer trivia questions. “Hadi” contest consists of 12 questions, in which the difficulty of each question increases in turn. Each question consists of three options to answer only where one is correct. Wins the game that answers 12 questions. Supporting the viral part of “Hadi”, a complex marketing activity is the basic requirement for success and popularity. In this context, different marketing approaches are put into effect. One approach is to collaborate with big brands that are advantageous for both companies. In order to win a prize, gamers learn a lot of information about the company/brand in cooperation. The app also gets additional investments. The remaining examples of viral marketing are Social Media Marketing, leading invited celebrities, sufficient dissemi-nation environment (Appstore and Play Market) and bonus/reward system for invited friends. Therefore, “Hadi” creates customer habits gain with its nature and supportive marketing activities.
Nural İMİK TANYILDIZI, Ayşe Şebnem YOLCU342
REFERENCESAhlberg, J. (2018). Successful Methods of Viral Marketing.Allen, K. (2008). Viral Marketing 100 Success Secrets-Secret Strategies,
Buzz Marketing Tips and Tricks, and Interactive Marketing: 100 Simple Online Campaign Principles. Emereo Pty Ltd.
Berger, J. (2016). https://hbr.org/webinar/2016/08/contagious-why-things-catch-on.
Berger, J., & Milkman, K. L. (2013). Emotion and virality: what makes online content go viral?. Marketing Intelligence Review, 5(1), 18-23.
Cassingena, B. (2009). The Mother of All Marketing Systems Volume 1 (Vol. 1). Lulu. com.
Center, A., & Walsh, F. (1985). Public relations practices: Managerial casestudies and problems(3rd ed.). Englewood Cliffs, NJ: Prentice Hall.
Childers, T. L. (1986). Assessment of the psychometric properties of an opinion leadership scale. Journal of marketing research, 23(2), 184-188.
Di Michele, J. (2018). The Role of Music in Sports-Related Branding.Erdogan, B. Z. (1999). Celebrity endorsement: A literature review. Journal
of marketing management, 15(4), 291-314.Eyal, N., & Hoover, R. (2014). Hooked. New York: Portfolio.Goldsmith, R. (2002). Viral Marketing: Get your audience to do your
marketing for you. Prentice Hall Business.Helm, S. (2000). Viral marketing-establishing customer relationships
by’word-of-mouse’. Electronic markets, 10(3), 158-161.Jackson, P. (1998). The Unforgiving Era. Currents, 24(9), 12-15.Kalpaklioglu, N. U., & Toros, N. (2011). Vıral Marketıng Tecnıques Wıthın
Onlıne Socıal Network. Journal of Yasar University, 6(24).Knight, C. M. (1999). Viral marketing. Boardwatch Magazine, 13(11), 50-
52.Knoll, J., & Matthes, J. (2017). The effectiveness of celebrity endorsements:
a meta-analysis. Journal of the Academy of Marketing Science, 45(1), 55-75.
Lawler, E. E., & Lawlor, E. E. (1981). Pay and organization development (Vol. 268). Reading, MA: Addison-Wesley.
Malinen, D. (2018). Viral Marketing As a Means of Promoting Video Games.
Petrescu, M. “Viral Marketing and Social Networks” (2014). HCBE Faculty Books and Book Chapters. 140.
Plummer, J., Rappaport, S. D., Hall, T., & Barocci, R. (2007). The online advertising playbook: Proven strategies and tested tactics from the advertising research foundation. John Wiley & Sons.
343Academic Studies in Social, Human and Administrative Sciences - II 343
Pressgrove, G., McKeever, B. W., & Jang, S. M. (2018). What is Contagious? Exploring why content goes viral on Twitter: A case study of the ALS Ice Bucket Challenge. International Journal of Nonprofit and Voluntary Sector Marketing, 23(1), e1586.
Rosen, E. (2009). The anatomy of buzz revisited: Real-life lessons in word-of-mouth marketing. Currency.
Scott, D. M. (2009). The new rules of marketing and PR: how to use social media, blogs, news releases, online video, and viral marketing to reach buyers directly. John Wiley & Sons.
Shirky, C. (2000). The toughest virus of all,: Business 2.0, vol.5, no.14 Van der Lans, R., & van Bruggen, G. (2010). Viral marketing: What is it,
and what are the components of viral success. The connected customer: The changing nature of consumer and business markets, 257-281.
Wilson, R. F. (2000). The six simple principles of viral marketing. Web marketing today, 70(1), 232.
Zhang, L., Zhao, J., & Xu, K. (2016). Who creates trends in online social media: The crowd or opinion leaders?. Journal of Computer-Mediated Communication, 21(1), 1-16.
Zhang, X., & Dong, D. (2008). Ways of identifying the opinion leaders in virtual communities. International Journal of Business and Management, 3(7), 21-27.
https://www.apple.com/tr/ios/app-store/ https://www.appbrain.com/ https://www.academia.edu/36947601/OceanofPDF.com_Hooked_How_
to_Build_Habit_Forming_Product_Nir_Eyalhttps://www.graph-ist.com/wom-marketing.htmlhttps://medium.com/@kosmischemusik/dissecting-the-viral-growth-of-
live-trivia-apps-like-loco-and-hq-trivia-2e7df59a11e1https://medium.com/@svharivinod/making-your-product-a-habit-the-
hook-framework-7815f94a2ddfhttps://www.haberturk.com/hadi-joker-nasil-kazanilir-hadi-de-joker-
alma-ve-kullanma-nasil-yapilir-2199292https://www.cevaplar.mobi/2018/10/hadi-baldir-olayi-baldir-sorusu-ve-
baldir-muhabbeti.html https://trends.google.com.tr/trends/?geo=TRhttp://www.milliyet.com.tr/hadi-calismadigimiz-yerden-sordu-istanbul-
yerelhaber-3030114/https://jonahberger.com/ https://gossipdergi.com/https://www.flaregames.com/hq-trivia-and-the-rise-of-mobile-streaming-
208a01686b01/ .

Chapter 18EVALUATION OF EFFICIENCY AND TOTAL
FACTOR PRODUCTIVITY OF SELECTED TEXTILE COMPANIES IN TURKEY
Saeid HAJIHASSANIASL1, Göktürk KALKAN2
1 Dr. Öğr. Üyesi, Gaziantep Üniversitesi, [email protected] Dr. Öğr. Üyesi, Gaziantep Üniversitesi, [email protected]

347Academic Studies in Social, Human and Administrative Sciences - II 347
IntroductionThe textile sector was first born due to the basic needs of people such
as dressing, covering and protection, and the production and trade volume of the textile sector in the economy has increased gradually over the centu-ries. After the industrial revolution, this sector not only produced clothes, curtains, carpets, but also started to produce a wide variety of products in the military, medical and automotive sectors, with rapid developments in science and technology in the 20th and 21st centuries. It is seen that the textile sector plays a driving role in the economic development of many countries. Countries like Japan, Republic of Korea, Turkey and China, thanks to the textile industry, they have achieved breakthrough moves in the industry and the development of industrial cultures. Today, Turkey, In-dia and China, as well as European countries such as Germany and Italy and US in North America, continue to be an important actor in the textile trade (UIB, 2018).
The textile sector has had a positive impact on the welfare and de-velopment of the countries due to the added value created and the high share of exports. Textile sector has become one of the basic sectors for these countries, especially due to the low labor and production costs of developing countries. In addition, developed countries are trying to protect their positions in this sector due to the production and modernization of the machinery lines of the textile industry and their R&D activities and con-tinue to be important markets in the sector. The textile and garment indus-try covers production processes such as fiber preparation, yarn, weaving, knitting, dyeing, printing, finishing, cutting, sewing. The part from fiber to yarn and manufactured fabric is evaluated in the textile sector, and the process from the fabric to clothing is evaluated within the apparel sector. Although the textile and apparel sectors are located in different sections of the “Nomenclature statistique des Activités économiques dans la Commu-nauté Européenne” (NACE) in the European Community, they are gener-ally evaluated together due to their close relations with each other(IAOSB, 2012).
Turkish textile and apparel sector, due to having cheaper production factors compared to other competing countries and because of the close geographical location of Turkey with Europe, has its advantages. Besides Turkey, to respond quickly to demand feature, and because of the ability to adapt to changing market conditions, it was able to maintain its position on the European market. Due to globalization, increased competition, shrink-ing opportunities in international markets, failures in strategic long-term planning, the main sectors of the textile and garment industry of Turkey’s economy, have revealed the necessity of restructuring (Aras, 2006).
Saeid HAJIHASSANIASL, Göktürk KALKAN348
Thanks to the Customs Union Agreement signed with the EU in 1995, the Turkish textile sector gained the right to export to the EU without quo-ta. In addition, compliance obligations under the EU’s Common Commer-cial Policy, Textile Restriction Agreement between the EU and third coun-tries have also started to be implemented in Turkey. These quotas were maintained until 2005 and after 2007, with the removal of quotas applied to China by the EU within the scope of the World Trade Organization Tex-tile and Clothing Agreement, Turkey, losing the advantage of cheap labor in the EU market, it has come to compete on flexible production, product development, innovation and branding where it cannot compete in terms of cost against China (Çevik, 2015).
The contribution of the textile industry to the economic system and the economic development of a country cannot be denied. Therefore, textile production and performance measurement have always had a major im-pact on the country’s economic growth. It is important to look for tools to analyze the efficiency of the textile factories activities and to improve the service of them. One of the most important ways to measure textile factory performance is measerment of these factory’s efficiency, and one of the most important approaches to measure the efficiency of these factories is the data envelopment analysis method (Verma, Kumavat & Biswas, 2015).
In highly competitive environments that characterize the textile in-dustry, evaluation of effectiveness has recently become an important topic in the business world (Coll, Blasco, Molina ve Martinez, 2011). Increased efficiency and productivity, are essential to meet the emerging challenges of global competition (Bhandari & Ray, 2012)
In this study, Data Envelopment Analysis and Malmquist productivity index methods were used to measure changes in technical efficiency and total factor productivity. The analysis will also include investigating the sources of changes such as efficiency differences and pure technical effi-ciency and scale efficiency change.
EfficiencyIn today’s world, competition forces firms to use their resources most
effectively. Measures such as efficiency and productivity analysis that businesses use to use scarce resources effectively and compete, determine the deviations of the firms from their target plans and their situation against their competitors. The fact that every entrepreneur or manager needs to be based on sustainable competitiveness while planning an effective produc-tion process, requires monitoring of the inputs used in the production units and analyzing the indicators such as the profitability rate and market share resulting from resource savings. To achieve this, firms should relatively evaluate their efficiency in the industry in which they compete and identify
349Academic Studies in Social, Human and Administrative Sciences - II 349
companies that should be referenced in order to take part in the efficiency frontier (Kayalı, 2009).
The efficiency of a firm (or an industry) is related to its performance in the use of resources and is a relative concept. Efficiency is the degree of reaching a goal in general. In other words, it is a criterion that shows whether it is sufficient to reach the goal or not. Efficiency in terms of firm, shows the production factors of a company or the realization degree of the production program that determined previously. The degree of efficiency or competence can be determined by the following equation:
Efficiency = standard performance / actual performance
If the efficiency rate is below “1”, it means that the efficiency did not happen as desired or as expected. The goal for a sufficient or effective per-formance is that the efficiency rate reaches “1”. Increasing efficiency aims to maximize business outcomes in all possible ways (economic, social, technological, etc.)(https://www.ekodialog.com/Konular/etkinlik_nedir.html).
The concept of economic efficiency is explained by the concepts of Pareto efficiency or Pareto optimality. The Pareto efficiency that first de-veloped by the Italian economist Vilfredo Pareto in the 19th century, is a very clear definition of activity. According to Pareto, if a change improves the situation of some individuals without worsening the status of other members of the society, economic efficiency is provided. If a change in-creases the welfare of some individuals without reducing the welfare of others, the welfare of the society will increase and thus the society will achieve economic efficiency. When society achieves economic efficiency or Pareto optimum, no new regulation in change and production makes one better, without making the other worse. Kopman, on the other hand, combines the concept of production efficiency with the Pareto Optimum. Pareto-Kopman efficiency; If it is not possible to develop any input or out-put without worsening some of the inputs or outputs, the company or firm that produces is fully efficient.
Economically, a company’s technical efficiency is defined as produc-ing maximum output (s) using a specific input level or using minimum input (s) to produce the given output level. The technical effectiveness re-flects the manufacturer’s ability to prevent waste of resources, given the restrictions faced by all companies in a group.
The first theoretical discussion on measuring technical efficiency was proposed by Debreu (1951) and Koopmans (1951). Later Farrell (1957) developed this and introduced various concepts of activity. Farrell (1957) introduced a new definition that evaluated efficiency and productivity at a
Saeid HAJIHASSANIASL, Göktürk KALKAN350
micro level, rather than a macro approach. He argued that a pieced linear production frontier should be determined for efficiency measurement in-stead of the regression line based on economically average performance values. The efficiency criterion based on contractions or dilatations in the form of rays radiating from ineffective observations to the production boundary, the views that the production frontier will be determined by the most pessimistic pieced linear data envelopment and that this limit can be reduced to two states (the slope is not positive and no observation between the frontier and the origin) can be disconnected from the classical efficacy and efficiency approaches. Farrell argues that the overall efficiency of de-cision-making units is equal to the product of the two components. It is a requirement of the rationality principle that Firms who known as econom-ic decision making units, achieve their goals at the lowest cost. To mea-sure the overall economic success of firms, a series of related efficiency concepts have been developed. The success of a company in producing at minimum cost level is called cost efficiency. Farrell has divided economic efficiency into two: technical efficiency and allocative efficiency.
Economic Efficiency = Technical Efficiency × Allocative Efficiency
Technical efficiency is the success of producing the most possible output using the input combination in the most efficient way. Within this framework, technically effecient decision making units should be located on the production frontier. It can be said that the decision making units that fall under the production frontier, waste resources. Allocation efficiency, on the other hand, is defined as the success of an economic unit that uses more than one input in choosing the most appropriate input combination considering the input prices. In explainning the allocative efficiency, con-sidering the input costs for a decision-making unit, the lowest cost input composition (optimum factor combination), isoquant curves and equiva-lent cost lines that will achieve a constant output level are used.
In Figure 1 a set of production possibilities with two inputs (x1, x2) and single output (y) is discussed. According to Farrell, in such a case, the production function is shown as y = f (x1, x2). This production function is shown as y = f(x1/y, x2/y) to form the frontier of technology. According to Figure 1 the company produces the unit output at point B, and EE isoquant curve shows the minimum input combinations (the maximum performance frontier) needed to produce a certain amount of output. With the help of this curve, technical efficiency (TE);
TE = OP / OB (1)
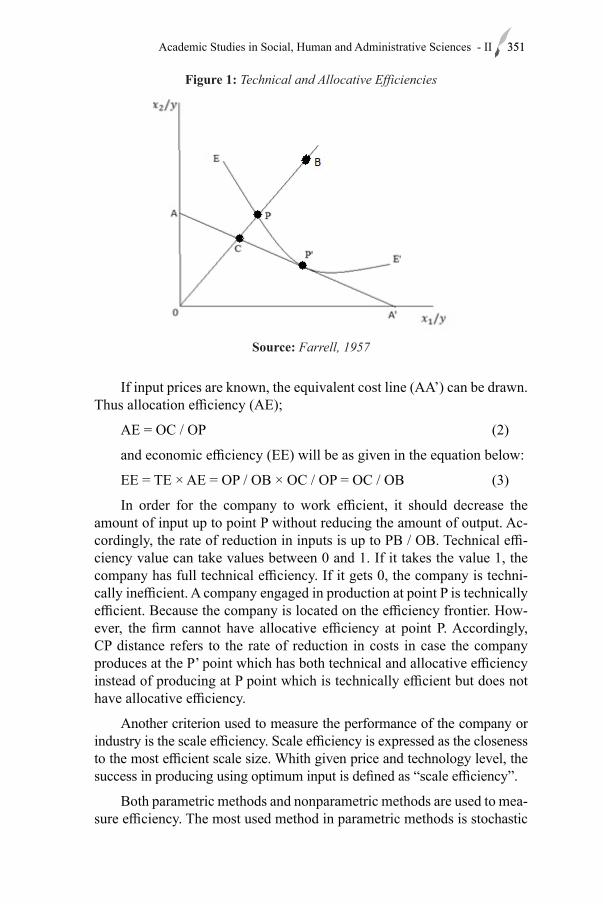
351Academic Studies in Social, Human and Administrative Sciences - II 351
Figure 1: Technical and Allocative Efficiencies
Source: Farrell, 1957
If input prices are known, the equivalent cost line (AA’) can be drawn. Thus allocation efficiency (AE);
AE = OC / OP (2)
and economic efficiency (EE) will be as given in the equation below:
EE = TE × AE = OP / OB × OC / OP = OC / OB (3)
In order for the company to work efficient, it should decrease the amount of input up to point P without reducing the amount of output. Ac-cordingly, the rate of reduction in inputs is up to PB / OB. Technical effi-ciency value can take values between 0 and 1. If it takes the value 1, the company has full technical efficiency. If it gets 0, the company is techni-cally inefficient. A company engaged in production at point P is technically efficient. Because the company is located on the efficiency frontier. How-ever, the firm cannot have allocative efficiency at point P. Accordingly, CP distance refers to the rate of reduction in costs in case the company produces at the P’ point which has both technical and allocative efficiency instead of producing at P point which is technically efficient but does not have allocative efficiency.
Another criterion used to measure the performance of the company or industry is the scale efficiency. Scale efficiency is expressed as the closeness to the most efficient scale size. Whith given price and technology level, the success in producing using optimum input is defined as “scale efficiency”.
Both parametric methods and nonparametric methods are used to mea-sure efficiency. The most used method in parametric methods is stochastic
Saeid HAJIHASSANIASL, Göktürk KALKAN352
frontier analysis method. In nonparametric methods, estimates are made us-ing linear programming technique. The most important and more frequently used non-parametric method is Data Envelopment Analysis (DEA).
Productivity Productivity, in the most general way, means producing the resources
by using the resources in the best way, without being wasteful, expressing the relationship between the various factors (inputs) introduced into the production process and the products (outputs) obtained at the end of this process (Yükçü & Atağan, 2009)
In cases where an output is produced using an input in the production process, the ratio of output to input is defined as productivity.
where an output is produced using an input in the production process, the productivity that can be calculated with the ratio of the output to the input loses its validity in multiple input and output production processes. It loses its validity in multiple input and output production processes. In this case, all inputs and outputs of the production process must be expressed with a single index. Thus, Total Factor Efficiency (TFV) can be calculat-ed by including all factors of production in the productivity measurement (Öncü & Aktaş, 2007)
The change in total factor productivity, which is one of the productiv-ity types that includes all the factors involved in the production process, is one of the important criteria that are handled in measuring the performance of the company or industry. The change in TFV is divided into two parts as the change in technical efficiency and technological change (Deliktaş, 2002). The advantage of total factor productivity is based on the ability to explain productivity for all inputs used in the production process. Total factor efficiency can also reflect technological progress in a country (Jajri & Ismail, 2006)
Total factor productivity (TFP) is also defined as the share of the in-crease in real production, which cannot be attributed to increased labor and capital inputs, which are the two main factors of production. In this context, increased productivity makes it possible to measure production productivity gains. this means that it can only be seen as an indicator of technological progress in the mid and long term (Kalai & Helali, 2016)
Malmquist Productivity IndexIn this study, the Malmquist Index was used to evaluate the total pro-
ductivity growth of production factors and Separation them into technical and technological efficiency changes. This index is defined based on the
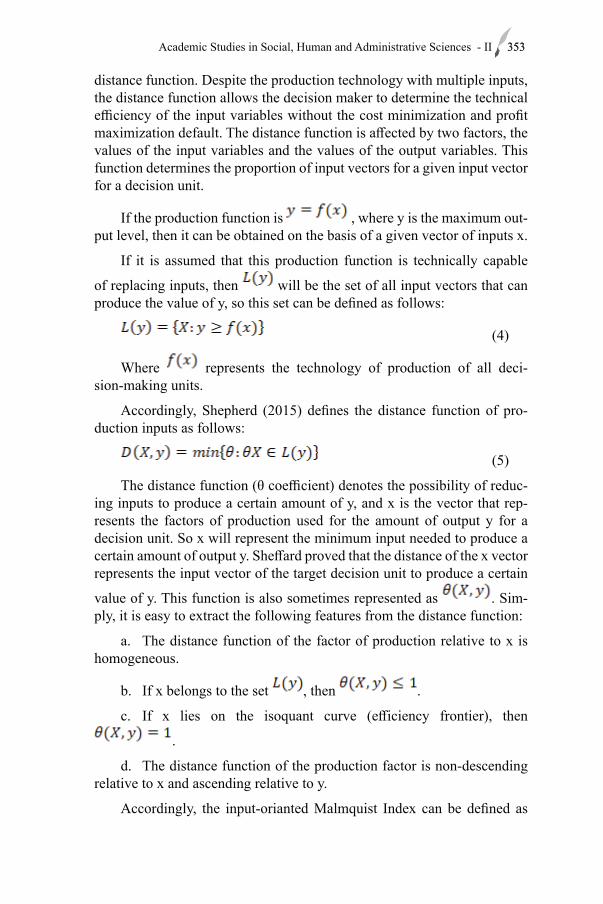
353Academic Studies in Social, Human and Administrative Sciences - II 353
distance function. Despite the production technology with multiple inputs, the distance function allows the decision maker to determine the technical efficiency of the input variables without the cost minimization and profit maximization default. The distance function is affected by two factors, the values of the input variables and the values of the output variables. This function determines the proportion of input vectors for a given input vector for a decision unit.
If the production function is , where y is the maximum out-put level, then it can be obtained on the basis of a given vector of inputs x.
If it is assumed that this production function is technically capable
of replacing inputs, then will be the set of all input vectors that can produce the value of y, so this set can be defined as follows:
(4)
Where represents the technology of production of all deci-sion-making units.
Accordingly, Shepherd (2015) defines the distance function of pro-duction inputs as follows:
(5)
The distance function (θ coefficient) denotes the possibility of reduc-ing inputs to produce a certain amount of y, and x is the vector that rep-resents the factors of production used for the amount of output y for a decision unit. So x will represent the minimum input needed to produce a certain amount of output y. Sheffard proved that the distance of the x vector represents the input vector of the target decision unit to produce a certain
value of y. This function is also sometimes represented as . Sim-ply, it is easy to extract the following features from the distance function:
a. The distance function of the factor of production relative to x is homogeneous.
b. If x belongs to the set , then .
c. If x lies on the isoquant curve (efficiency frontier), then
.
d. The distance function of the production factor is non-descending relative to x and ascending relative to y.
Accordingly, the input-orianted Malmquist Index can be defined as

Saeid HAJIHASSANIASL, Göktürk KALKAN354
below (Malmquist, 1953):
(6)
In this model,
: Malmquist Productivity Growth Index for a decision unit in year t + 1 relative to year t.
: DMU efficiency or distance function in year t compared to efficiency frontier of year t
: DMU efficiency or distance function in year t com-pared to efficiency frontier of year t+1.
: DMU efficiency or distance function in year t+1 compared to efficiency frontier of year t.
: DMU efficiency or distance function in year t compared to efficiency frontier of year t.
: Input vector of decision unit in year t
: Output vector of decision unit in year t
In the Malmquist model, the efficiency frontier for each year is defined as that year’s technology available. The components of this model will be calculated by the CCR secondary model as follows (Charnes, 1978):
(7)
s.t
Whenever the BCC secondary model is used instead of the CCR sec-ondary model to calculate the Malmquist model components, the distance function or maximum efficiency based on variable returns to scale will be as follows (Banker et al, 1984):
(8)
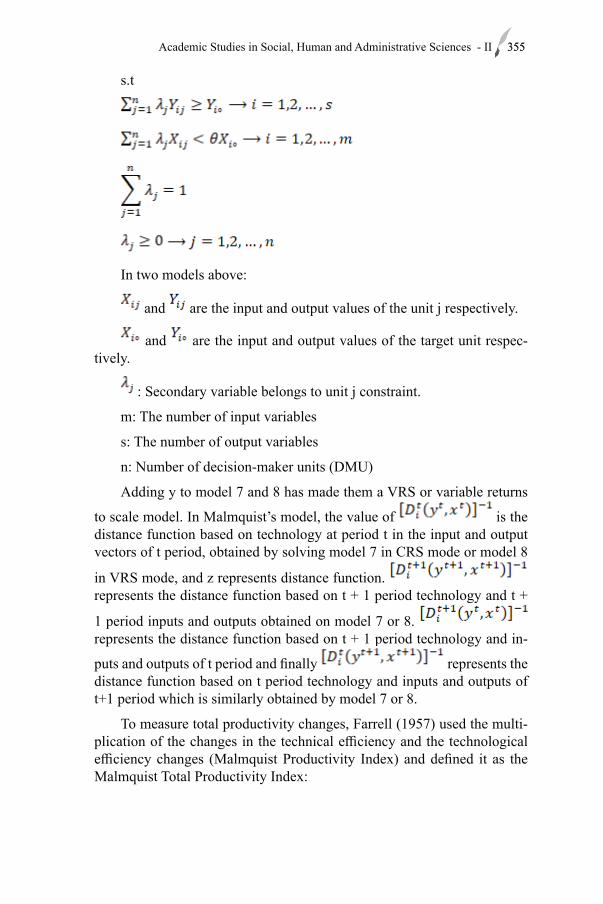
355Academic Studies in Social, Human and Administrative Sciences - II 355
s.t
In two models above:
and are the input and output values of the unit j respectively.
and are the input and output values of the target unit respec-tively.
: Secondary variable belongs to unit j constraint.
m: The number of input variables
s: The number of output variables
n: Number of decision-maker units (DMU)
Adding y to model 7 and 8 has made them a VRS or variable returns
to scale model. In Malmquist’s model, the value of is the distance function based on technology at period t in the input and output vectors of t period, obtained by solving model 7 in CRS mode or model 8
in VRS mode, and z represents distance function. represents the distance function based on t + 1 period technology and t +
1 period inputs and outputs obtained on model 7 or 8. represents the distance function based on t + 1 period technology and in-
puts and outputs of t period and finally represents the distance function based on t period technology and inputs and outputs of t+1 period which is similarly obtained by model 7 or 8.
To measure total productivity changes, Farrell (1957) used the multi-plication of the changes in the technical efficiency and the technological efficiency changes (Malmquist Productivity Index) and defined it as the Malmquist Total Productivity Index:
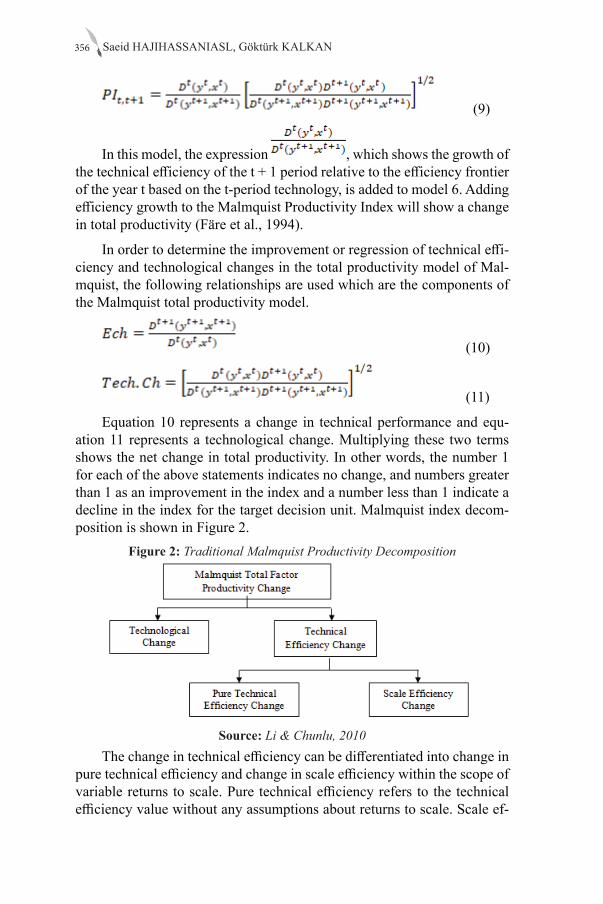
Saeid HAJIHASSANIASL, Göktürk KALKAN356
(9)
In this model, the expression , which shows the growth of the technical efficiency of the t + 1 period relative to the efficiency frontier of the year t based on the t-period technology, is added to model 6. Adding efficiency growth to the Malmquist Productivity Index will show a change in total productivity (Färe et al., 1994).
In order to determine the improvement or regression of technical effi-ciency and technological changes in the total productivity model of Mal-mquist, the following relationships are used which are the components of the Malmquist total productivity model.
(10)
(11)
Equation 10 represents a change in technical performance and equ-ation 11 represents a technological change. Multiplying these two terms shows the net change in total productivity. In other words, the number 1 for each of the above statements indicates no change, and numbers greater than 1 as an improvement in the index and a number less than 1 indicate a decline in the index for the target decision unit. Malmquist index decom-position is shown in Figure 2.
Figure 2: Traditional Malmquist Productivity Decomposition
Source: Li & Chunlu, 2010The change in technical efficiency can be differentiated into change in
pure technical efficiency and change in scale efficiency within the scope of variable returns to scale. Pure technical efficiency refers to the technical efficiency value without any assumptions about returns to scale. Scale ef-
357Academic Studies in Social, Human and Administrative Sciences - II 357
ficiency exists when a firm operates at a constant returns to scale (Kayalı, 2009). Pure technical efficiency is defined as the ability of the decision making unit to produce the highest possible output by using the input com-bination in the best way, and scale efficiency is defined as the ability to produce at the appropriate scale (Erdumlu & Sarıçam, 2013)
Literature Review
Some of the domestic and international studies measuring technical efficiency and total factor productivity in the textile industry have been examined.
Taymaz and Saatçi (1997), according to the findings of their study on technical change and technical efficiency in three sectors: textile, cement and motor vehicles, showed that there are significant cross-sectoral dif-ferences in technical exchange rates and facility level, in factors affecting technical efficiency. They said that inter-agency relations between firms in-crease the effectiveness of user firms in the textile, cement and motor vehi-cle industries, and the source of ownership and technology are also import-ant determinants of efficiency at the facility level. Kayalıdere and Kargın (2004) investigated the efficiency of companies in the textile and cement sectors listed on the Istanbul Stock Exchange in 2002. . In the study, an analysis using net sales and net profit as output, number of employees and total assets as output, a second analysis was conducted where the number of employees and tangible fixed assets were used as input and net sales and net profit used as output. By trying to calculate potential improve-ment rates, they tried to determine how they should make the input-output amounts efficient and productive compared to the efficient companies in the sector. Aras (2006) conducted the efficiency and risk analysis of the Turkish textile and garment industry for a period of 12 years. According to the findings of the study using data envelopment analysis, although im-provements have been observed in the recent period, the Turkish textile and apparel industry did not provide full efficiency for the study period. According to the efficiency analysis findings of public companies, their ef-ficiencies are above the industry average in some years. The overall result for both working groups is the decrease in the efficiency level of the sector after the economic crisis. Çetin (2006) tried to analyze the efficiency of the companies operating in the Istanbul Stock Exchange (ISE) textile sec-tor using Data Envelopment Analysis (DEA). As a result of the research, efficient companies were identified and the feature of being a reference to other companies in the sector was determined. Kayalı (2009) shows the technical efficiency values of the 29 companies operating in the textile products sector in terms of profitability and pure technical and scale effi-ciency values, which are components of technical efficiency. The number of employees equity and net assets used as input and net sales and net prof-
Saeid HAJIHASSANIASL, Göktürk KALKAN358
its used as output. The results of the analysis revealed that the textile in-dustry’s efficiency score is equal to 57%. Using data envelopment analysis, Öge and Ayrancı (2010) have calculated their technical activities for the 1997-2008 period, which constitute the Textile Sector Index within the Is-tanbul Stock Exchange (ISE). In order to calculate the relative technical ef-ficiency of businesses, “total asset size” and “equity” are considered as in-puts. The outputs were “net profit” and “net sales”. In the period discussed, the results of the efficiency of textile companies have entered a downward trend and followed a fluctuating course during the economic crisis. Yenil-mez and Girginer (2012), using output oriented CCR (Charnes, Cooper and Rhoders) models consisting of 3 inputs (net assets, number of workers, production quantity) and 1 output (export) analysed the efficiency of the textile companies exports operating in Eskişehir Organized Industrial Zone between 2008-2009. The result of the analysis is that inefficient companies should decrease their production amounts or increase their exports in or-der to reaching the efficiency. Sarıçam and Erdumlu (2012), analyzed the efficiency of textile and apparel companies operating in the Istanbul Stock Exchange (ISE) during 2003-2008 by data envelopment analysis. It is con-cluded that the average efficiency scores in the apparel industry are higher than the textile industry and the two industries together. Yayar and Çoban (2012) analyzed the efficiency of 25 companies operating in the textile and clothing industry, which entered the ISO 500 in the period 2008-2010, using Data Envelopment Analysis. According to the CCR model, 4 com-panies were efficient in the weaving industry and 2 firms in the garment industry, while 11 firms were found efficient in the weaving industry and 4 firms in the garment industry according to the BCC model. Erdumlu (2016) evaluated the efficiency of the Turkish textile, garment and leather industry using data envelopment analysis in two stages, which are defined as profitability and marketability. The findings revealed that the textile, garment and leather industry can be taken as a reference for marketability performance. Doğan and Ersoy (2017) tried to determine the efficiency level of a textile company operating in the Aegean Region for the past six-teen years by using data envelopment analysis method. As a result of the analysis, it has been concluded that the enterprise has been efficient in 7 of the 16 years since its inception. Akın (2018) calculated the efficiency and total factor productivity changes of 17 companies registered in the Borsa Istanbul (BIST) in the weaving industry for the period 2013-2017. Göral, Çağlıyan and Gelmez (2018) try to measure the Total Factor Productivity of the textile enterprises, which were listed in the ISO 500 Big Industrial Enterprises list in 2016, between 2014-2016 by analyzing Technical Effi-ciency Changes and Technological Changes. According to the results, it is determined that there is a decrease in the Total Factor Productivity of the enterprises. In addition, it was concluded that the decrease in the Total
359Academic Studies in Social, Human and Administrative Sciences - II 359
Factor Productivity of the enterprises was caused by the inability to realize the technological changes in time, and despite the positive situation in the technical efficiencies of the enterprises, it did not prevent the decrease in the total factor productivity. Perçin and Ustasüleyman (2007) measured the relative effectiveness of textile and food companies, considering the 2002 data. Using the Malmquist TFP index, changes in firms’ productivity and efficiency components were examined in the period 2000-2002. As a result of the analyzes, it was observed that the decrease in the efficiency of food companies was less than that of textile companies as of 2002. In addition, it was concluded that the most important reason for the decrease in the pro-ductivity of the textile and food companies during the period of 2000-2002 was the negativities arising from technical change.
Ahmad and Kalim (2016) suggested that the Pakistan textile industry could not benefit from the quota elimination of the Pakistan textile indus-try in terms of pre-quota and post-quota elimination status and that the productivity remained almost sluggish throughout the period. Zhu (1996) used data envelopment analysis / assurance area methods to evaluate the efficiency of the 35 textile factories of Nanjing Textile Company (NTC) in China. The results show that within two consecutive years of analysis, col-lective units performed better than state-owned units. Samad and Patwary (2003) tried to estimate technical efficiency for the textile industry in Ban-gladesh. For this purpose, they used translog stochastic frontier produc-tion function model for a period of 6 years. The overall average technical efficiency for Bangladesh’s textile industry is estimated to be 80%. Thang et al (2006) studied the determinants and development of the technical efficiency and productivity of the Vietnamese textile and garment industry in the 1997-2000 period. According to the results obtained, the average technical efficiency of these sectors are relatively high, but the technical ef-ficiency differs significantly in terms of ownership, location, size, age and export. While the most efficient firms in the textile sector are old, medi-um-sized, private, south-centered, export-oriented firms, the old, medium to large, private or foreign-invested south-based garment firms have the highest technical efficiency. Bhandari and Maiti (2007) have used translog stochastic frontier production functions in accordance with firm-level cross-section data for each of the selected five years to estimate the tech-nical efficiency of Indian textile companies. They stated that the average technical efficiency varied between 68-84% over these years, and individ-ual technical efficiencies varied with firm-specific characteristics such as size and age, and public sector firms were relatively less efficient. Vixathep (2011) demonstrated that the efficiency gap in garment companies in Laos has widened over the studied period, partly due to the increasing compe-tition in the global garment industry, and that efficiency development and
Saeid HAJIHASSANIASL, Göktürk KALKAN360
productivity growth are only evident at the firm level. Coll et al (2011) examines the technical efficiency of the Spanish textile industry for the pe-riod 1995-2005 by estimating a stochastic production function. Empirical findings showed that most of the textile groups operated in a high level of efficiencies in the first half of the period. In the second half, there was an increase in ineffectiveness, perhaps as a result of the sector’s impending liberalization (on January 1, 2005). Zhang and Yao (2014) used regional panel data between 2000-2012 using the DEA-Malmquist index method for total factor productivity analysis of the Chinese textile and apparel indus-try. The results show that the total factor productivity of the Chinese textile and apparel industry grew by an average of 9.5% annually, and techno-logical progress with 8.4% annual growth is main source of overall factor productivity growth. Mahmood (2012) calculated the technical efficiencies of the textile manufacturing industries in Pakistan using 5 digit industry data, using the Data Envelopment Analysis technique, under constant re-turns to scale (CRS) and variable returns to scale (VRS) assumptions. It has been found that imported raw materials and machinery have a positive effect, while non-industrial costs negatively affect technical efficiencies. Bhandari and Ray (2012) conducted a study that enabled the companies in the Indian textile industry to determine their technical efficiencies levels in different years and the contribution of technological differences between a group of companies to the extent of the overall technical efficiencies. The study found that by altering the input mix appropriately, even if there is no increase in allocation efficiency, the average production cost in the textile industry can be significantly reduced by 40% or more. Usman et al (2014) measured the technical efficiencies of 100 textile companies in Pakistan for the period 2006-2011 using data envelopment analysis. According to the results, it is seen that the sector is close to efficiency, and the aver-age values of technical efficiency scores are 0.82 and 0.86 under constant returns and variable returns to scale, respectively. Feng, Zhang and Xu (2017) selected 26 provinces, municipalities and autonomous regions in China from 2004 to 2014, using the data envelopment analysis Malmquist productivity index method to analyze technical efficiency change and tech-nological progress change. According to the results, it was concluded that there are significant differences in the total factor productivity of China’s textile industry and the growth of the total factor productivity in China’s textile industry is mainly due to the development of the Technical effi-ciency change index. Kapelko and Lansink (2015) showed that despite the decreases in technical and scale efficiencies, there was a relatively small overall efficiency increase for both textile and clothing companies due to positive technical change. Joshi and Singh (2010) made a total factor pro-ductivity estimation using the data envelopment analysis based Malmquist Productivity Index approach in the Indian apparel industry over the period
361Academic Studies in Social, Human and Administrative Sciences - II 361
2002-2007. According to the findings; The Indian apparel industry reached an average total factor productivity growth rate of 1.7 percent per year on average during the working period. It has also been observed that small-scale companies are more efficient than medium and large-scale compa-nies. Rakhmawan, Hartono and Awirya (2015) found that in the 2004-2008 period, the average productivity level of Indonesian textile industry and textile products was about 40% and the average productivity growth rate increased by 2.4%. Le and Wang (2017) using the Malmquist efficiency index, concluded that technological change is decisive for productivity in-crease and undeveloped technology is a major obstacle for the industry. Gambhir and Sharma (2015) calculated the productivity performance of the Indian textile manufacturing industry with the Malmquist productivity index, using panel data from 160 companies for the period 2007-2008-2012-2013. Regarding productivity gain resources, technology change and scale efficiency are seen as the main factors. The results showed that me-dium-sized companies performed better in the working period in the term of productivity. Naz, Khan and Syyed (2017) analyzed the productivity performance of Pakistan’s textile manufacturing industry using firm-level panel data from 64 companies for the period 2011-2015. It has been found that technical efficiency and technological change have a positive effect on the productivity of the composite and woven textile sectors, and in gener-al, the textile industry has no contribution to productivity growth. Goyal, Kaur and Aggarwal (2017) measured the overall technical efficiency, pure technical efficiency and scale efficiency in the Indian textile industry using section data from 101 companies for 2014-2015. Empirical results have shown that the overall technical inefficiency level in the Indian textile in-dustry is about 16.44%, and points of 11.79% are mainly attributed to their managerial ineffectiveness rather than improper selection of scale size.
Findings of the StudyThe main aim of this study is to examine the efficiency and productiv-
ity of 16 textile companies selected from the first 1000 companies between 2010-2018 in Turkey. The data required for the study were obtained from the Istanbul Chamber of Industry (ISO) website. The textile companies included in the study are especially the companies whose data are complete in the period examined, and the companies with missing or incorrect data are excluded from the analysis.
In this study, Net Sales Value of firms was used as output. The number of active employees in the firm for each year in the period under consid-eration, as well as annual equity data of the firms as capital variable, was used as input variables.
The study was conducted and examined in two stages. Firstly, the effi-
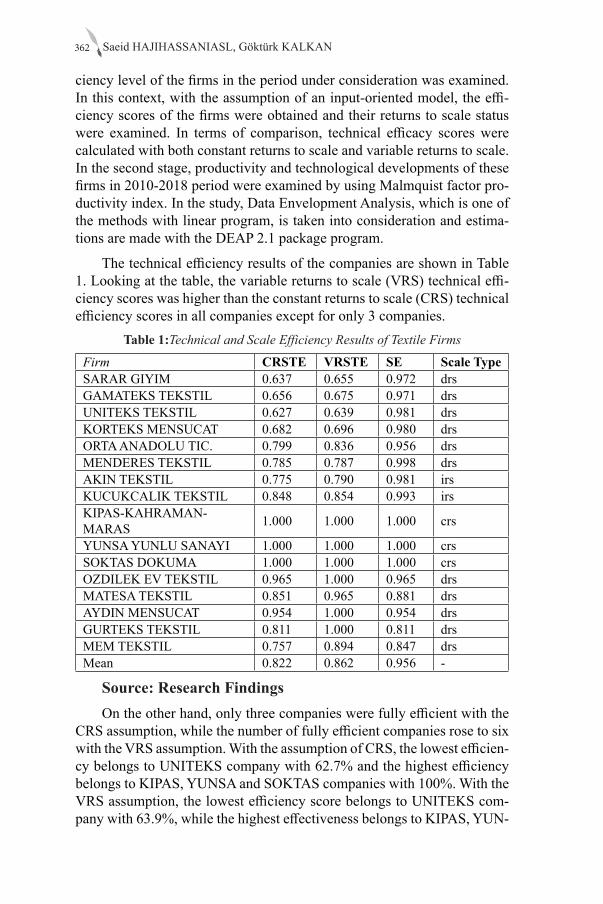
Saeid HAJIHASSANIASL, Göktürk KALKAN362
ciency level of the firms in the period under consideration was examined. In this context, with the assumption of an input-oriented model, the effi-ciency scores of the firms were obtained and their returns to scale status were examined. In terms of comparison, technical efficacy scores were calculated with both constant returns to scale and variable returns to scale. In the second stage, productivity and technological developments of these firms in 2010-2018 period were examined by using Malmquist factor pro-ductivity index. In the study, Data Envelopment Analysis, which is one of the methods with linear program, is taken into consideration and estima-tions are made with the DEAP 2.1 package program.
The technical efficiency results of the companies are shown in Table 1. Looking at the table, the variable returns to scale (VRS) technical effi-ciency scores was higher than the constant returns to scale (CRS) technical efficiency scores in all companies except for only 3 companies.
Table 1:Technical and Scale Efficiency Results of Textile Firms
Firm CRSTE VRSTE SE Scale TypeSARAR GIYIM 0.637 0.655 0.972 drsGAMATEKS TEKSTIL 0.656 0.675 0.971 drsUNITEKS TEKSTIL 0.627 0.639 0.981 drsKORTEKS MENSUCAT 0.682 0.696 0.980 drsORTA ANADOLU TIC. 0.799 0.836 0.956 drsMENDERES TEKSTIL 0.785 0.787 0.998 drsAKIN TEKSTIL 0.775 0.790 0.981 irsKUCUKCALIK TEKSTIL 0.848 0.854 0.993 irsKIPAS-KAHRAMAN-MARAS 1.000 1.000 1.000 crs
YUNSA YUNLU SANAYI 1.000 1.000 1.000 crsSOKTAS DOKUMA 1.000 1.000 1.000 crsOZDILEK EV TEKSTIL 0.965 1.000 0.965 drsMATESA TEKSTIL 0.851 0.965 0.881 drsAYDIN MENSUCAT 0.954 1.000 0.954 drsGURTEKS TEKSTIL 0.811 1.000 0.811 drsMEM TEKSTIL 0.757 0.894 0.847 drsMean 0.822 0.862 0.956 -
Source: Research FindingsOn the other hand, only three companies were fully efficient with the
CRS assumption, while the number of fully efficient companies rose to six with the VRS assumption. With the assumption of CRS, the lowest efficien-cy belongs to UNITEKS company with 62.7% and the highest efficiency belongs to KIPAS, YUNSA and SOKTAS companies with 100%. With the VRS assumption, the lowest efficiency score belongs to UNITEKS com-pany with 63.9%, while the highest effectiveness belongs to KIPAS, YUN-
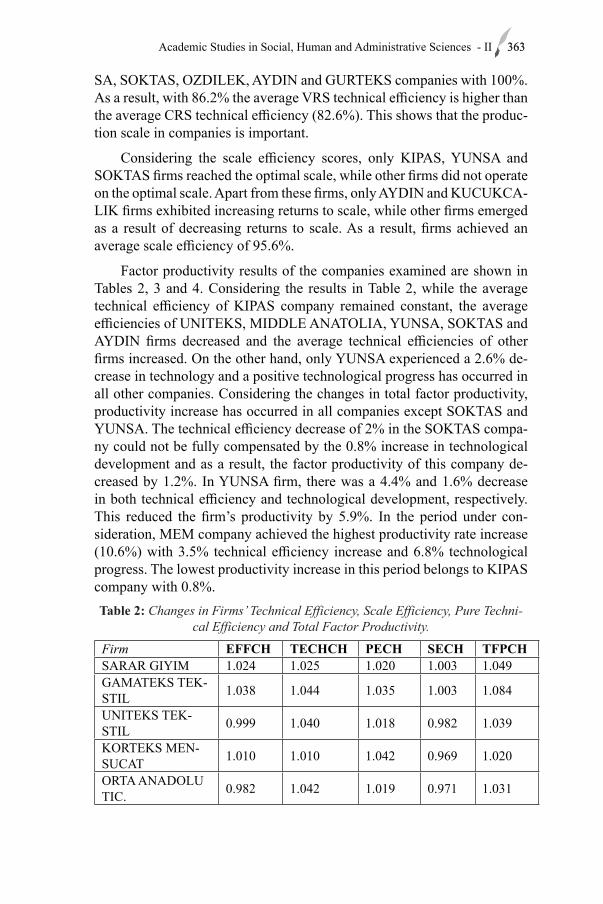
363Academic Studies in Social, Human and Administrative Sciences - II 363
SA, SOKTAS, OZDILEK, AYDIN and GURTEKS companies with 100%. As a result, with 86.2% the average VRS technical efficiency is higher than the average CRS technical efficiency (82.6%). This shows that the produc-tion scale in companies is important.
Considering the scale efficiency scores, only KIPAS, YUNSA and SOKTAS firms reached the optimal scale, while other firms did not operate on the optimal scale. Apart from these firms, only AYDIN and KUCUKCA-LIK firms exhibited increasing returns to scale, while other firms emerged as a result of decreasing returns to scale. As a result, firms achieved an average scale efficiency of 95.6%.
Factor productivity results of the companies examined are shown in Tables 2, 3 and 4. Considering the results in Table 2, while the average technical efficiency of KIPAS company remained constant, the average efficiencies of UNITEKS, MIDDLE ANATOLIA, YUNSA, SOKTAS and AYDIN firms decreased and the average technical efficiencies of other firms increased. On the other hand, only YUNSA experienced a 2.6% de-crease in technology and a positive technological progress has occurred in all other companies. Considering the changes in total factor productivity, productivity increase has occurred in all companies except SOKTAS and YUNSA. The technical efficiency decrease of 2% in the SOKTAS compa-ny could not be fully compensated by the 0.8% increase in technological development and as a result, the factor productivity of this company de-creased by 1.2%. In YUNSA firm, there was a 4.4% and 1.6% decrease in both technical efficiency and technological development, respectively. This reduced the firm’s productivity by 5.9%. In the period under con-sideration, MEM company achieved the highest productivity rate increase (10.6%) with 3.5% technical efficiency increase and 6.8% technological progress. The lowest productivity increase in this period belongs to KIPAS company with 0.8%. Table 2: Changes in Firms’ Technical Efficiency, Scale Efficiency, Pure Techni-
cal Efficiency and Total Factor Productivity.
Firm EFFCH TECHCH PECH SECH TFPCHSARAR GIYIM 1.024 1.025 1.020 1.003 1.049GAMATEKS TEK-STIL 1.038 1.044 1.035 1.003 1.084
UNITEKS TEK-STIL 0.999 1.040 1.018 0.982 1.039
KORTEKS MEN-SUCAT 1.010 1.010 1.042 0.969 1.020
ORTA ANADOLU TIC. 0.982 1.042 1.019 0.971 1.031
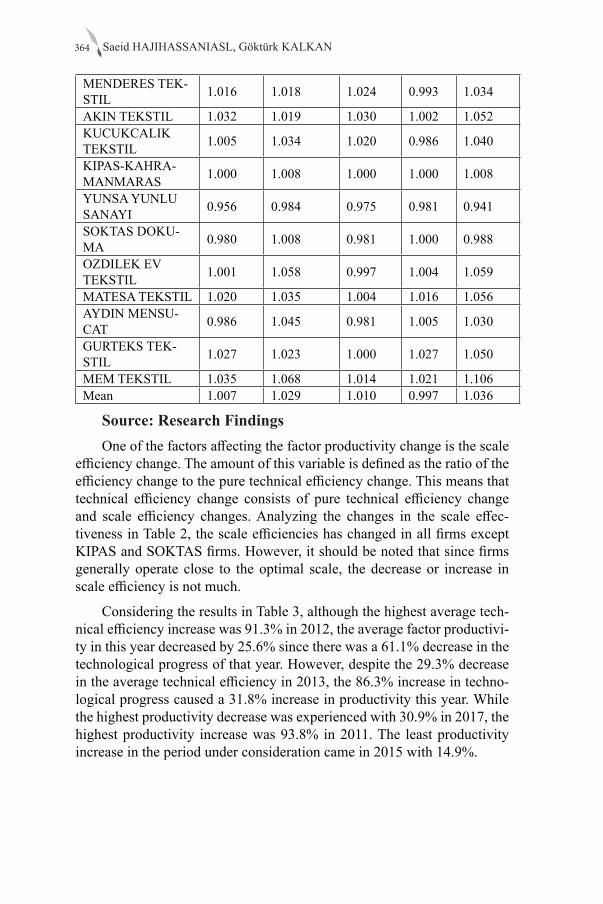
Saeid HAJIHASSANIASL, Göktürk KALKAN364
MENDERES TEK-STIL 1.016 1.018 1.024 0.993 1.034
AKIN TEKSTIL 1.032 1.019 1.030 1.002 1.052KUCUKCALIK TEKSTIL 1.005 1.034 1.020 0.986 1.040
KIPAS-KAHRA-MANMARAS 1.000 1.008 1.000 1.000 1.008
YUNSA YUNLU SANAYI 0.956 0.984 0.975 0.981 0.941
SOKTAS DOKU-MA 0.980 1.008 0.981 1.000 0.988
OZDILEK EV TEKSTIL 1.001 1.058 0.997 1.004 1.059
MATESA TEKSTIL 1.020 1.035 1.004 1.016 1.056AYDIN MENSU-CAT 0.986 1.045 0.981 1.005 1.030
GURTEKS TEK-STIL 1.027 1.023 1.000 1.027 1.050
MEM TEKSTIL 1.035 1.068 1.014 1.021 1.106Mean 1.007 1.029 1.010 0.997 1.036
Source: Research FindingsOne of the factors affecting the factor productivity change is the scale
efficiency change. The amount of this variable is defined as the ratio of the efficiency change to the pure technical efficiency change. This means that technical efficiency change consists of pure technical efficiency change and scale efficiency changes. Analyzing the changes in the scale effec-tiveness in Table 2, the scale efficiencies has changed in all firms except KIPAS and SOKTAS firms. However, it should be noted that since firms generally operate close to the optimal scale, the decrease or increase in scale efficiency is not much.
Considering the results in Table 3, although the highest average tech-nical efficiency increase was 91.3% in 2012, the average factor productivi-ty in this year decreased by 25.6% since there was a 61.1% decrease in the technological progress of that year. However, despite the 29.3% decrease in the average technical efficiency in 2013, the 86.3% increase in techno-logical progress caused a 31.8% increase in productivity this year. While the highest productivity decrease was experienced with 30.9% in 2017, the highest productivity increase was 93.8% in 2011. The least productivity increase in the period under consideration came in 2015 with 14.9%.
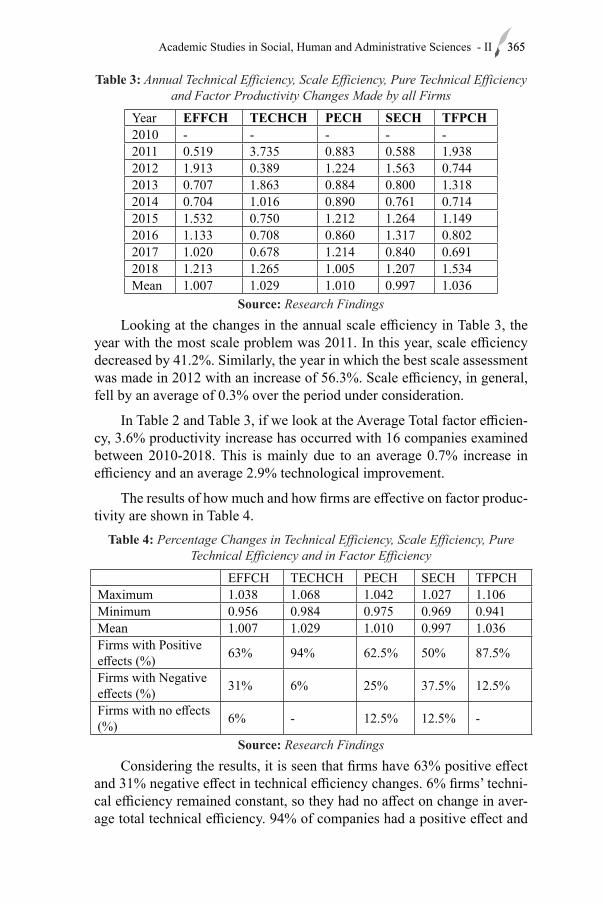
365Academic Studies in Social, Human and Administrative Sciences - II 365
Table 3: Annual Technical Efficiency, Scale Efficiency, Pure Technical Efficiency and Factor Productivity Changes Made by all Firms
Year EFFCH TECHCH PECH SECH TFPCH2010 - - - - -2011 0.519 3.735 0.883 0.588 1.9382012 1.913 0.389 1.224 1.563 0.7442013 0.707 1.863 0.884 0.800 1.3182014 0.704 1.016 0.890 0.761 0.7142015 1.532 0.750 1.212 1.264 1.1492016 1.133 0.708 0.860 1.317 0.8022017 1.020 0.678 1.214 0.840 0.6912018 1.213 1.265 1.005 1.207 1.534Mean 1.007 1.029 1.010 0.997 1.036
Source: Research FindingsLooking at the changes in the annual scale efficiency in Table 3, the
year with the most scale problem was 2011. In this year, scale efficiency decreased by 41.2%. Similarly, the year in which the best scale assessment was made in 2012 with an increase of 56.3%. Scale efficiency, in general, fell by an average of 0.3% over the period under consideration.
In Table 2 and Table 3, if we look at the Average Total factor efficien-cy, 3.6% productivity increase has occurred with 16 companies examined between 2010-2018. This is mainly due to an average 0.7% increase in efficiency and an average 2.9% technological improvement.
The results of how much and how firms are effective on factor produc-tivity are shown in Table 4.
Table 4: Percentage Changes in Technical Efficiency, Scale Efficiency, Pure Technical Efficiency and in Factor Efficiency
EFFCH TECHCH PECH SECH TFPCHMaximum 1.038 1.068 1.042 1.027 1.106Minimum 0.956 0.984 0.975 0.969 0.941Mean 1.007 1.029 1.010 0.997 1.036Firms with Positive effects (%) 63% 94% 62.5% 50% 87.5%
Firms with Negative effects (%) 31% 6% 25% 37.5% 12.5%
Firms with no effects (%) 6% - 12.5% 12.5% -
Source: Research FindingsConsidering the results, it is seen that firms have 63% positive effect
and 31% negative effect in technical efficiency changes. 6% firms’ techni-cal efficiency remained constant, so they had no affect on change in aver-age total technical efficiency. 94% of companies had a positive effect and
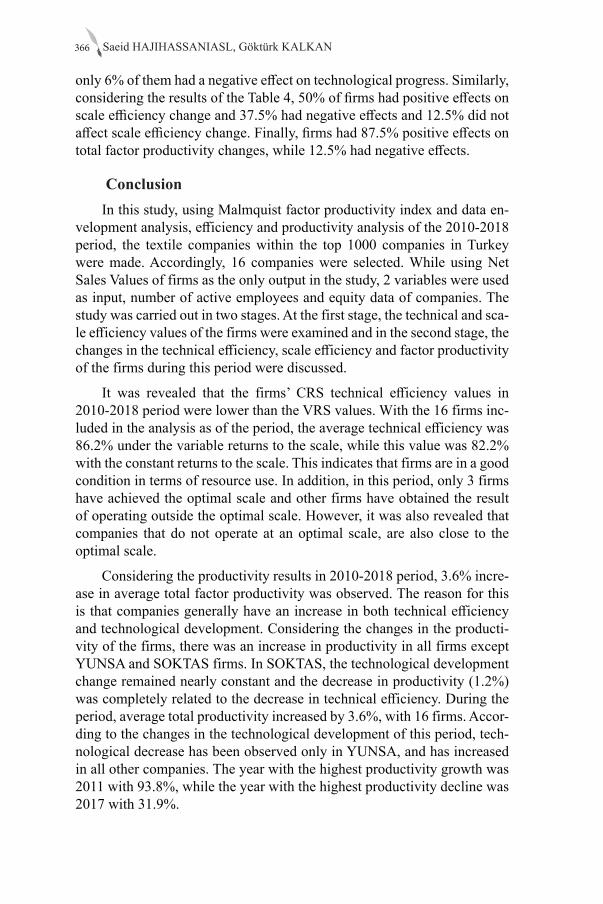
Saeid HAJIHASSANIASL, Göktürk KALKAN366
only 6% of them had a negative effect on technological progress. Similarly, considering the results of the Table 4, 50% of firms had positive effects on scale efficiency change and 37.5% had negative effects and 12.5% did not affect scale efficiency change. Finally, firms had 87.5% positive effects on total factor productivity changes, while 12.5% had negative effects.
ConclusionIn this study, using Malmquist factor productivity index and data en-
velopment analysis, efficiency and productivity analysis of the 2010-2018 period, the textile companies within the top 1000 companies in Turkey were made. Accordingly, 16 companies were selected. While using Net Sales Values of firms as the only output in the study, 2 variables were used as input, number of active employees and equity data of companies. The study was carried out in two stages. At the first stage, the technical and sca-le efficiency values of the firms were examined and in the second stage, the changes in the technical efficiency, scale efficiency and factor productivity of the firms during this period were discussed.
It was revealed that the firms’ CRS technical efficiency values in 2010-2018 period were lower than the VRS values. With the 16 firms inc-luded in the analysis as of the period, the average technical efficiency was 86.2% under the variable returns to the scale, while this value was 82.2% with the constant returns to the scale. This indicates that firms are in a good condition in terms of resource use. In addition, in this period, only 3 firms have achieved the optimal scale and other firms have obtained the result of operating outside the optimal scale. However, it was also revealed that companies that do not operate at an optimal scale, are also close to the optimal scale.
Considering the productivity results in 2010-2018 period, 3.6% incre-ase in average total factor productivity was observed. The reason for this is that companies generally have an increase in both technical efficiency and technological development. Considering the changes in the producti-vity of the firms, there was an increase in productivity in all firms except YUNSA and SOKTAS firms. In SOKTAS, the technological development change remained nearly constant and the decrease in productivity (1.2%) was completely related to the decrease in technical efficiency. During the period, average total productivity increased by 3.6%, with 16 firms. Accor-ding to the changes in the technological development of this period, tech-nological decrease has been observed only in YUNSA, and has increased in all other companies. The year with the highest productivity growth was 2011 with 93.8%, while the year with the highest productivity decline was 2017 with 31.9%.
367Academic Studies in Social, Human and Administrative Sciences - II 367
Analysis of the total factor productivity change shows that the change of this variable depends mostly on technological changes. This emphasizes that technological development is more important for production than inc-rease of production factors. The importance of this variable becomes more important especially in companies that experienced a decrease in techno-logical development in the period under review. Updating of machinery and equipment, using qualified and expert labor force and benefiting from foreign capital and foreign Technologies, play a very important role in the technological development of companies. The relations of higher educati-on institutions with the industries and the graduation of students according to the needs of production units are also important in this process. The att-raction of foreign capital in these industries requires some difficult laws in the country to change, business areas to be improved as well as facilitating partnership with foreigners. In addition, foreigners’ coming to the country may be important in terms of providing the necessary machinery and equ-ipment and providing support services and also in terms of technological development and improvement.
ReferencesAhmad, N. & Kalim, R. (2016) “Assessing Impact of Quota Elimination
on Factor Productivity Growth of Textile Sector of Pakistan”, Journal of Applied Economics and Business Research, 6(1):73-92.
Akın, N. G. (2018) “Dokuma Sektöründe Veri Zarflama Analizi ve Malmquist Toplam Faktör Verimliliği Endeksi”, Uluslararası Ekonomi, İşletme ve Politika Dergisi, 2(2):241-260.
Apan, M., Alp I. & Öztel, A. (2019) “Determination of the Efficiencies of Textile Firms Listed in Borsa İstanbul by Using DEA-Window Analysis”, Sosyoekonomi, 27(42):107-128.
Aras, G. (2006) “Efficiency and Risk Analysis of the Turkish Textile and Clothing Industry Using Data Envelopment Analysis”, Journal of Global Business and Technology, 2(2):65-73.
Banker RD., Charnes, A. & Cooper, WW. (1984). “Some Models for Estimating Technical and Scale Inefficiencies in Data Envelopment Analysis.” Management Science 30(9): 1078-1092.
Bhandari A.K. & Ray, S.C. (2012) “Technical Efficiency in the Indian Textiles Industry: A Non-parametric Analysis of Firm-Level Data”, Bulletin of Economic Research, 64(1):109-124.
Bhandari, A.K. & Maiti, P. (2007) “Efficiency of Indian Manufacturing Firms: Textile Industry as a Case Study”, International Journal of Business and Economics, 6(1):71-88.
Bhaskaran, E. (2013) “The Productivity and Technical Efficiency of Textile Industry Clusters in India”, J. Inst. Eng. India Ser. C, 94(3):245-251.
Saeid HAJIHASSANIASL, Göktürk KALKAN368
Coll, V., Blasco, O., Molina, X. & Martinez,T. (2011) “Efficiency of Spanish Textile Industry Before the Sector’s Liberalization” , The IUP Journal of Applied Economics, 10(3):5-24.
Çetin, A.C. (2006) “Türk Tekstil Sektörü ve Türk Tekstil Firmalarının Etkinlik Düzeylerinin Belirlenmesi”, Afyon Kocatepe Üniversitesi İİBF Dergisi, 8(2): 255–278.
Çevik, B. (2015) Türkiye Tekstil Sektörü,Türkiye İş Bankası İktisadi Araştırmalar Bölümü, https://ekonomi.isbank.com.tr/ContentManagement/Documents/sr02_tekstilsektoru.pdf, (date of access: February 3, 2020).
De Jorge-Moreno J. & Carrasco, O.R. (2015) “Technical Efficiency and its Determinants Factors in Spanish Textiles Industry (2002-2009)”, Journal of Economic Studies, 42(3):346-357.
Debreu, G. (1951) “The Coefficient of Resource Utilization”, Econometrica: Journal of the Econometric Society, 19(3):273-292.
Deliktaş, E. (2002) “Türkiye Özel Sektör İmalât Sanayiinde Etkinlik ve Toplam Faktör Verimliliği Analizi”, ODTÜ Gelişme Dergisi, 29(3-4):247-284.
Doğan, N.Ö. & Ersoy Y. (2017) “Etkinlik Ölçümü: Tekstil Sektöründen Bir İşletme Örneği”, Hitit Üniversitesi Sosyal Bilimler Enstitüsü Dergisi, 10(1):35-44.
Erdumlu, N. (2016) “Efficiency Benchmarking Based on Data Envelopment Analysis: A Case for Turkish Textile Sector”, The Journal of The Textile Institute, 107(6):702-710.
Erdumlu, N. & Sarıçam C. (2013) “Measuring the Efficiency of Turkish Apparel Retailers”, Ege Akademik Bakış, 13(2):237-244.
Farrell, M. J. (1957) “The Measurement of Productive Efficiency”, Journal of the Royal Statistical Society, Series A (General),120(3):253-290.
Gambhir, D. & Sharma, S. (2015) “Productivity in Indian Manufacturing: Evidence From the Textile Industry”, Journal of Economic and Administrative Sciences, 31(2):71-85.
Goyal, J., Kaur, H. & Aggarwal, A. (2017) “Investigating the Technical and Scale Efficiencies of Indian Textile Industry: A Target Setting Based Analysis Through DEA”, The IUP Journal of Operations Management, 16(1):16-38.
Göral, R., Çağlıyan, V. & Gelmez, E. (2018) “İşletmelerin Malmquist-TFV Endeksi İle Verimliliklerinin Analizi: Tekstil Sanayi Örneği”, Selçuk Üniversitesi Sosyal Bilimler Meslek Yüksekokulu Dergisi, 21(1):18–29.
İzmir Atatürk Organize Sanayi Bölgesi Proje ve İş Geliştirme Birimi (2018) Tekstil Ürünleri İmalatı ve Giyim Eşyalarının İmalatı, İAOSB Haber Dergisi, July 2012, http://www.iaosb.org.tr/Media/FileDocument/TEKSTIL%20VE%20HAZIR%20GIYIM%20SANAYI%20
369Academic Studies in Social, Human and Administrative Sciences - II 369
TEMMUZ%202012.pdf, (date of access: February 3, 2020).Jajri, I. & Ismail, R. (2006) “Technical Efficiency, Technological Change
and Total Factor Productivity Growth in Malaysian Manufacturing Sector”, MPRA (Munich Personal RePEc Archive Paper No. 1966).
Kalai, M. & Helali, K. (2016) “Technical Change and Total Factor Productivity Growth in the Tunisian Manufacturing Industry: A Malmquist Index Approach”, African Development Review, 28(3):344–356.
Kapelko, M. & Lansink, A.O. (2015) “An International Comparison of Productivity Change in the Textile and Clothing Industry: A Bootstrapped Malmquist Index Approach”, Empirical Economics, 48(4):1499-1523.
Kayalı, C.G. (2009) “2007 Yılı Tekstil İşletmelerinin Finansal Karlılık açısından Etkinliklerinin Değerlendirilmesi” , Tekstil ve Konfeksiyon, 1:3-8.
Kayalidere, K. & Kargin, S. (2004) “Cimento ve Tekstil Sektorlerinde Etkinlik Çalismasi ve Veri Zarflama Analizi”, Dokuz Eylul University Journal of Graduate School of Social Sciences, 6(1), 196-219.
Koopmans, T.C. (1951) Activity Analysis of Production and Allocation, John Wiley& Sons, Inc.
Li, Y. & Chunlu, L. (2010) “Malmquist Indices of Total Factor Productivity Changes in the Australian Construction Industry”, Construction Management and Economics, 28(9) 933-945.
Mahmood, T. (2012) “Effects of Input Composition on Technical Efficiencies of Textile Industries in Pakistan”, The Pakistan Development Review, 51(2):117-130.
Naz, F., Khan, H., & Sayyed, M. (2017) “Productivity and Efficiency Analysis of Pakistani Textile Industry using Malmquist Productivity Index Approach”, Journal of Management and Research, 4(2):1-23.
Öge, E. & Ayrancı, E. (2010) “Ekonomik Krizler ve Çin Faktörü Dikkate Alındığında, İstanbul Menkul Kıymetler Borsası Tekstil Endeksinde Bulunan İşletmelerin Etkinlikleri Üzerine Bir Araştırma”, ABMYO Dergisi, 19:13-25.
Öncü, S. & Aktaş, R. (2007) “Yeniden Yapılandırma Döneminde Türk Bankacılık Sektöründe Verimlilik Değişimi”, Yönetim ve Ekonomi, 4(1):247-266.
Öztürk, O. & Girginer, N. (2015) “The Export Efficiency of Turkish Textile and Apparel Firms: An Investigation Employing Data Envelopment Analysis (DEA) and Analytic Hierarchy Process (AHP) Methods”, Tekstil ve Konfeksiyon, 25(1):10-23.
Samad, Q.A. & Patwary, F.K. (2003) “Technical Efficiency in the Textile Industry of Bangladesh: An Application of Frontier Production Function”, Information and Management Sciences, 14(1):19-30.
Saeid HAJIHASSANIASL, Göktürk KALKAN370
Sarıçam, C. & Erdumlu, N. (2012) “Evaluating Efficiency Levels Comparatively: Data Envelopment Analysis Application for Turkish Textile and Apparel Industry”, Journal of Industrial Engineering and Management, 5(2):518-531.
Taymaz, E. & Saatci, G. (1997) “Technical Change and Efficiency in Turkish Manufacturing Industries”. Journal of Productivity Analysis, 8, 461-475.
Thang, N., Thanh, T.T., Dat, V.H. & Oostendorp, R.H. (2006) “Productivity Analysis for Vietnam’s Textile and Garment Industry”, Philippine Review of Economics, 43(1):131-166.
Uludağ İhracatçı Birlikleri Genel Sekreterliği (2018) Türkiye Tekstil Sektörü ve Bursa, Ar-Ge Şubesi, http://www.uib.org.tr/tr/kbfile/turkiye-tekstil-sektoru-ve-bursa, (date of access: February 3, 2020).
Usman, M., Hassan, A., Mahmood, F. & Shahid, H. (2014) “Performance of Textile Sector of Pakistan: Application of Data Envelopment Analysis Approach”, International Review of Management and Business Research, 3(3):1683-1698.
Verma, S., Kumavat, A. & Biswas, A. (2015) “Measurement of Technical Efficiency Using Data Envelopment Analysis: A Case of Indian Textile Industry”, 3rd International Conference on Advances in Engineering Sciences & Applied Mathematics (ICAESAM’2015) March 23-24, 2015 London (UK).
Vixathep, S. (2011) “Efficiency and Productivity Change in Lao Garment Industry: A Nonparametric Approach”, Journal of International Cooperation Studies, 19(1):87-111.
Yayar, R. & Çoban, M.N. (2012) “İSO 500 Firmalarının Etkinliklerinin Ölçülmesinde Veri Zarflama Analizi Yaklaşımı: Dokuma ve Giyim Eşya Sanayi”, Niğde Üniversitesi İİBF Dergisi, 5(2):165-180.
Yenilmez, F. & Girginer, F. (2012) “Assesing Export Performance of Textile Companies in Eskişehir Organized Industrial Zone by Use of Data Envelopment Analysis (DEA)”, Tekstil ve Konfeksiyon, 1:12-17.
Yükçü, S. & Atağan, G. (2009) “Etkinlik, Etkililik ve Verimlilik Kavramlarının Yarattığı Karışıklık”, Atatürk Üniversitesi İktisadi ve İdari Bilimler Dergisi, 23(4):1-13.
Zhou, J. (1996) “DEA/AR Analysis of the 1988-1989 Performance of the Nanjing Textiles Corporation”, Annals of Operations Research, 66:311-335.
Chapter 19ROLE OF MANAGEMENT INFORMATION
SYSTEMS INCLUDING ACCOUNTING INFORMATION SYSTEM IN FACING TOURISM
CRISIS; AN EMPRICIAL STUDY IN ADEN HOTELS
Semih BUYUKKIPEKCI1 , Yazeed Sultan Saeed AHMED2
1 Assist. Prof. Dr. Selcuk University, Faculty of Tourism, Department of Tourism Manage-ment,[email protected] PhD. Student Yazeed Sultan Saeed AHMED , Selcuk University, Institute of Social Science, Department of Tourism Management

373Academic Studies in Social, Human and Administrative Sciences - II 373
1. Introduction The tourism and hotel industry has developed considerably in the
past two decades, and the growth rate varied significantly from country to country and from year to year. These countries have long experience in the tourism and hospitality industry, and in other hands, this countries not forget another side its an important fields maybe will facing in any time without any introductions it’s “crises, natural disasters, & conflicts”, but in the recent years the tourism and hotel industry beginning to take care the management of crisis, though depending on continuously researches that study crisis and what successful ways in facing this situations and their effects. According to (Nathan et al, 2004, 459) with rapid changes in man-agement information systems “MIS” the applications and developments in “MIS” technologies that are continuing to become more affordable and easier to use “MIS” has evolved to become an integral component of an or-ganization’s business strategy, and the information systems are not a subset of strategy it is the business strategy. Therefore, the main goals of hotel’s organizations are not only for providing the growth opportunities in tour-ism markets (Current, & Future), but first to build a good organizational structures capable to facing the crises and management it, that happen at any time through, First, minimize the gap between management and sub-ordinates in crises situations, Second, depending on marketing research to collect all important informations about the external environment in period of crisis and beyond, to study this informations to explain the picture for high management in hotel’s organization to benefit from these new infor-mations to determine the new goals, and after that to formulate the alterna-tive strategies and use it specially in crises situations, Third, build a good reputation in the tourism market (Internal & External) through used direct advertising in the period of crises and beyond. And finally, to persuading the tourists and customers about the service quality that offers. Also, the effective and efficient for “MIS” to exchange new information between management levels and subordinates in special situations to clarify (re-sponsibilities, policies, expectations and strategies) ( Pittaway, Carmouche & Chell, 1998, 408; Chathoth & Olsen, 2002, 1; Connelly & Ruark, 2010, 746). Therefore, typically there is not a single leading organization but rather many organizations that produce relevant data and information in many respects data and information suffer from the same lack of integra-tion, in order to overcome this fragmentation to facilitate greater access and improved sharing of information a recent trend has been the develop-ment of “networked and interoperable” systems, this approach, whereby datasets are held by their original custodians and the internet is used to provide remote access to the data and services which allow interrogation of this data in the correct time (Stojanovic, Green, & Lymbery, 2010, 805).
Semih BUYUKKIPEKCI , Yazeed Sultan Saeed AHMED374
Therefore, we conclude that the role of management information systems concentrated in providing all modern & accurate informations to manag-ers in the organizations about the “Internal, & External” environments spe-cially at crisis’s period, that accidents happen when the organizations face change in one or more situations contains problems, for instance “wars, & civilian conflicts” and that push the organizations to stay “study, research & ready” to Re-Change some “Plans, Goals & Strategies” to facing this emergency situations.
From point of view of (Lee et al, 2012, 12743) the accidents occur in our daily life, and the severity crises grows in scales such as the “9/11, disaster, sars and tsunami”. The relationship between Accounting Informa-tion System and Management Information Systems:
Management Information Systems (MIS) aim to provide financial and non-financial information about historical, current or future variables relat-ed to the problem under study. The necessary data is collected to produce the information from sources within the facility or from the external envi-ronment surrounding it, where that information is disseminated formally and in the right time to managers to help them make decisions.
Some believe that the accounting information system (AIS) is part of the management information system where the role of (AIS) is limited to measuring historical accounting information for the purpose of preparing reports to external parties.
Others believe that the accounting information system is the basis and that the management information system is just part of it, given that the role of (AIS) extends to include providing the necessary information for planning, monitoring and making management-related decisions.
Some others believe that each of (AIS) and (MIS) is independent of each other and that each has its functions except the fact that there is an overlap between these two systems (Alikhani, Ahmadi, Mehravar, 2013).
The particular aims of this study are to Clarify the kinds of effects to management information systems in the management of the crisis, and their effectiveness in helping to Yemeni hotel organizations in facing the crises. And second, Clarify the ability of Yemeni hotel organizations to pre-dict the crisis, and what measures were taken to deal with it before, during and after the crisis through depending on use management information systems in his business, through providing truth and important information about the situation of crisis for decision-makers to enable them to make strategic decisions in order to confront crises that occurrence or expected to occur. The problem for our study it’s the Yemeni hotel organizations working under hard situations and passes in crucial times, and this means
375Academic Studies in Social, Human and Administrative Sciences - II 375
an increased probability of exposure these organizations to the crises that threaten its potential to stay to work in the Yemeni hotel markets. More-over, what dimensions the efficient of management information systems inability the Yemeni hotel’s organizations on facing and manage the crisis. While the importance of this study to concentrate to determine the effect of management information systems in facing the crises that happened in any “Place & Time” and what can the hotel’s management work at these situations minimize their effects on businesses of Yemeni hotel’s industry. Also, to find successful ways to exit from this situations as quickly and early as possible to stay works in the tourism market and seeking to build a good reputation from the view of his customers “Currents & Futures” at crisis’s period and beyond.
2. Conceptual Background
2.1. Management Information Systems.
There is a huge difference between management information systems and regular information systems according to the objectives and tasks per-formed by these systems in organization.
According to Sorensen et al (2010,38), MIS is a small branch of large planning activities and is, therefore, general and comprehensive control of the human application, the use of technology and all the work of the insti-tution. The role of information in the activities of organizations has been reflected in general and clearly (Alter, 1999, 37). As Javadi & Dastjerdia (2011, 1297) explained that there are two important types of management information systems of the Organization, a system that supports informa-tion and works to address and a system interested in making administrative decisions at the three levels of senior management and middle and super-visory. From viewpoint of (Ansoff & McDonell, 1990, 66; Curtis, 1995, 41; Thompson, 1997, 336; Druker, 1988, 4) explained each information system contains important elements that play a role in a compromise in its duties and assist in understanding how information systems work and these elements it’s:
1. Collect data, in this process to obtain data and information sourc-es taking into account the availability of (health, precision, thoroughness, flexibility, appropriate cost, relative value) of such information, as well as to provide the organization with information on future trends and prospects for the environment through reliance on marketing research to monitor the internal and external environment.
2. Data processing, the data is transferred with no moral value to val-ue through data (classification, selection, analysis, processing) to the data
Semih BUYUKKIPEKCI , Yazeed Sultan Saeed AHMED376
obtained from the external environment in order to be ready for use in the future.
3. Update and retrieval of information, in this process, is to benefit from the information gathered, classified and analyses the external envi-ronment for the purpose of benefiting in time of need after information is updated periodically by deleting information that does not possess the desired value and add new ones to suit the changes in the external envi-ronment.
4. Output, output value derived in their ability to influence on the tak-en decisions since that output “data” if it does not lead to a better resolution or influence on this information will have a negative value, it means that the importance of administrative information systems is to provide appro-priate information for decision-makers.
Finne (2000, 237) concluded that MIS revolves around three main points, the first is the integration of models in the information system soft-ware, the second provides senior management with a great deal of infor-mation to make effective and successful decisions, and the third provides strong languages for users of the system so that they can solve administra-tive problems, which information system can be developed within Orga-nization according to new concepts and variables. According to (Bistric, 2006, 215; Tripathi, 2011, 58) shows that “MIS” contributes to the effec-tive role of providing effective and useful information to make critical de-cisions that support the performance of the organization.
From point of view of (Bistricic, 2006, 215) who defined management information system as “a system in which people and means of informa-tion technology (computers, programmers, a communication network) fol-low determined procedures to timely deliver certain data information to those who need them”.
According to UNESCO (2009, 2), the management information sys-tem is “organized information and documentation service that systemati-cally collects, stores, processes, analyses, reports and disseminates infor-mation and data”. (Kotler, 1997, 109) defined the management information system is “a system composed of personnel, equipment and procedures for the classification, analysis and distribution of information required and the precision required for decision- makers”.
As (Alter, 1999, 3) defined that “a system that uses information tech-nology to access the information, transport, storage, retrieval, and process-ing, thus supporting other business systems”. From the point of view of (O’Brien, 1997, 56) the information system is “the system in an orderly way of processing information on past, present and future internal oper-
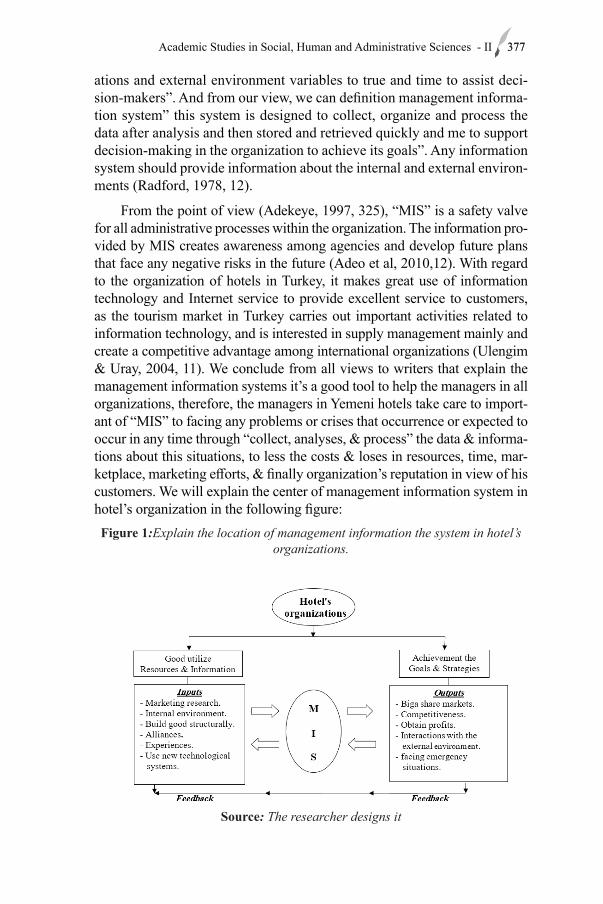
377Academic Studies in Social, Human and Administrative Sciences - II 377
ations and external environment variables to true and time to assist deci-sion-makers”. And from our view, we can definition management informa-tion system” this system is designed to collect, organize and process the data after analysis and then stored and retrieved quickly and me to support decision-making in the organization to achieve its goals”. Any information system should provide information about the internal and external environ-ments (Radford, 1978, 12).
From the point of view (Adekeye, 1997, 325), “MIS” is a safety valve for all administrative processes within the organization. The information pro-vided by MIS creates awareness among agencies and develop future plans that face any negative risks in the future (Adeo et al, 2010,12). With regard to the organization of hotels in Turkey, it makes great use of information technology and Internet service to provide excellent service to customers, as the tourism market in Turkey carries out important activities related to information technology, and is interested in supply management mainly and create a competitive advantage among international organizations (Ulengim & Uray, 2004, 11). We conclude from all views to writers that explain the management information systems it’s a good tool to help the managers in all organizations, therefore, the managers in Yemeni hotels take care to import-ant of “MIS” to facing any problems or crises that occurrence or expected to occur in any time through “collect, analyses, & process” the data & informa-tions about this situations, to less the costs & loses in resources, time, mar-ketplace, marketing efforts, & finally organization’s reputation in view of his customers. We will explain the center of management information system in hotel’s organization in the following figure: Figure 1:Explain the location of management information the system in hotel’s
organizations.
Source: The researcher designs it
Semih BUYUKKIPEKCI , Yazeed Sultan Saeed AHMED378
2.2. Accounting information system
The definition of an accounting information system is that essential and important part of the organization’s administrative information system that inventory and compiles financial data from sources inside and outside the organization, then it runs this data and converts it into useful financial information for users of this information outside and within the organiza-tion (Trigo, Belfo, Estébanez, 2016).
The accounting information system is also known as one of the com-ponents of the administrative organization that specializes in collecting, classifying, processing, analyzing and communicating the appropriate fi-nancial information to make decisions (Trigo, Belfo, Estébanez, 2016).
The accounting information system is one of the branches of man-agement information systems and the relationship lies between them that the accounting information system provides only financial information and deals with all commercial transactions while the management information system focuses on non-financial information.
There is a relationship that shows that the accounting information sys-tem consists of a financial accounting system and management account-ing system. As the management accounting system provides services to managers and internal users only in the organization, while the financial accounting system is concerned with providing services to shareholders and external users.
There are overlapping characteristics in the tasks between the man-agement information system and the accounting information system. The task of the management information system is to provide information to managers to make decisions. This information may be of a financial nature or that this information is related to changes in productivity or stock, while economic information in the management information system is general accounting information. That is, the relationship between them in the tasks is complementary.
The two systems are affected by a group of people and working ma-chines in addition to a set of procedures, and the two systems consist of subsystems based on providing information for both systems in full harmo-ny, and the main goal of providing information between the two systems is to improve the decision-making process and work to increase effective-ness and efficiency, where the account management provides Information directly to the management information system and indirectly provides information to external users, financial accounting provides information directly to external users, and the management information system indi-rectly.
379Academic Studies in Social, Human and Administrative Sciences - II 379
For managers and internal users, the accounting information system provides information to other external users, and work to increase the num-ber of users, and the accounting information system uses financial data while the management information system uses non-financial data in ad-dition to financial data, and this is the fundamental difference between the two systems (Alikhani, Ahmadi, Mehravar, 2013).
2.3. Tourists Hotel & Classifications Criteria.
The development that happened in recent years in the needs of people, it made peoples shifting from mass tourism to individual tourism, and that push the tourism & hotel industry to differentiation in all his activities that offered, for instance, means of accommodations “Resorts, Hotels, Villages holidays” that closely linked with job tourism sector, and it changes ac-cording to the nature of activities in tourism destinations. According to Ha-jiluca et al (2009, 5) explained the hotel’s organization classification within the following: First, the level of comfort “Luxury (4&5) stars, medium level, and modest class”. Second, the location of the territory “the season, mountain, in treatment areas, in cities center or periphery, possibly towards the airport, and along the road”. Third, the purpose functional on time of stay of guests “transit, and special purpose”. Fourth, the operating systems “open permanently, seasonal”. Fifth, the form of exploitation “individual service, association voluntary hotel chains, and companies or groups (inte-grated hotel chains)”. Sixth, the form of ownership “personal property, pri-vate, state property, cooperative, public property, public ownership of in-ternational concern, and joint ownership”. Seventh, the size hotels “small, medium, and large hotels”. Eighth, the target market” trade, interest, and vacation”. Ninth, the standards of service and facilities offered “full-ser-vice hotels, economic hotels, and self-catering hotel”. As (Aryee, 2011, 10) noted that people who travel to any country need a hotel to relax and rest while spending their tourist purposes.Hotels are the most important tourist supply in the hospitality sector (Karppinen, 2011, 11). As the Ministry of Tourism of Yemen seeks to implement the world criteria to classify the tourist’s hotels in Yemen (Caribbean tourism organization,2002,4; Aryee, 2011, 12; Karppinen, 2011,16).
We conclude from the hotels classification above that interest in hotels in various categories is an important point for the success of tourist desti-nations and repeat visit through tourists (Kandampully, Juwaheer, & Hu, 2011, 23). Tourism and hospitality sector is one of the vital sectors that de-velop countries. The element of service is the key element in the hotel sec-tor and this element is to achieve customer satisfaction (Chand, 2008, 100).
Semih BUYUKKIPEKCI , Yazeed Sultan Saeed AHMED380
2.4. Management of Crisis
The tourism and hotel industry has been hit by a host of problems and crises and has experienced many disasters, whether they are man-made crises such as terrorism, security and political instability, or by nature such as volcanoes, earthquakes, etc. From point of view of (Tavitiyaman et al, 2008, 27) who defined a crisis the crisis is a successive bad event affecting companies and damage their profitability and lack of continuity, such as fires. As to (Ritchie, 2004, 670) a crisis is defined as a general disorder that adversely affects the system as a whole, destroys any infrastructure and also threatens public order. From the viewpoint of (Anderson, 2006, 1290) disasters and crises are defined as a sudden and unexpected real challenge. The real role of any organization comes to meet this challenge and over-come it. All these crises and events are threats that hinder organizations in the exercise of their work (Okumus, Altinay & Arasli, 2005, 95; Chen, 2011, 203). And explained the management of crisis refer to the process of identifying and planning what and how to respond to a crisis, and of fol-lowing up on the plans if any crisis does occur, and the management of cri-sis has received much attention lately in the tourism and hospitality man-agement fields due to recent unexpected events and developments such as “War on the Arab region, the Asian financial crisis, the occurrence of foot and mouth disease in the UK, the terrorist attacks on America on 09/11 and the bombing in Bali”. Due to (Ritchie, 2004, 670) Whoever manages the crisis is a person of great efficiency and qualification. all officials in the tourism sector must study all the effects of crises and disasters and devel-op protection strategies in a thoughtful and tight (Paraskevas et al, 2013, 131). As (Ghaderi, Som, & Henderson, 2012, 80) Managers must have a preconceived perception of the crisis and how to deal with it according to clear and deliberate steps, to avoid significant damage,.These factors must be carefully diagnosed to understand the changes in tourism markets and deal with them effectively (Wang, 2009, 75). As (Anderson, 2006, 1291) There are clear signs of crisis recognition: First, imagine a confusing and exciting event, such as a danger to the structure of the organization and threaten the survival of the organization. Second, a stronger threat, espe-cially when making short decisions, occurs suddenly. Third, imagine the inability to avoid significant damage. Fourth, radical and decisive change, this change carries a negative and positive connotation. Fifth, the volatility and instability of situations is of concern. According to (Ritchie, 2004, 671) suggested three main types of crises, the first is the sudden and im-mediate crisis where there is no warning. The organizations are unable to develop a proactive plan to avoid the crisis. Second the primitive crises and need strong strategies to reduce their acceleration. Third, permanent crises that last for days and up to years. From our point of view, we concluded
381Academic Studies in Social, Human and Administrative Sciences - II 381
that all plans and strategies in Yemeni tourism establishments should deal with all types of crises effectively and accurately to control the magnitude of disasters that may occur. From the point of view of (Salamn, 2011, 148) he identified five stages of the crisis which is :
1. Predict, where the crisis hit signs warning, as may be generated at the beginning of the so-called semi-crisis and is delimited including the decline in sales, the decline in production.
2. Prevention, including prevention phase measures and decisions a private organization can take to prevent the crisis.
3. Containment, and intended containment activities are undertaken by the management in order to minimize the negative impacts of the crisis, which begins phase suppression and absorption crisis through understand-ing and a broad perception, and careful review of the causes of the crisis and work to analyses several aspects.
4. Healing, after the process, is completed to contain the crisis, analy-ses and identify the most important causes for the occurrence, and work to overcome the negative effects, management of the organization returns to practice various activities after the crisis occurs routinely.
5. Education, after recovery from the management of crisis works or-ganization or your team with management of crisis start with examining it in order to determine the main reasons that led to the crisis and the possi-bility to stand by and take advantage of the experience for the purpose of drawing up plans and strategies to face similar crises in the future.
Rousaki & Alcott (2006, 26) Refers to the possibility of three-dimen-sional crises and overcome them, First, the internal response of the orga-nization and the speed of dealing with it by knowing the most important resources in crisis management and the quality of the appropriate strategy; Second, the media power of the organization. Third, the sudden crisis that may affect the organization.
2.5. The effectiveness of management information systems in the business of the hotel’s organization at a crisis.
Nowadays the current business environment becomes more compli-cated. Therefore, managers in all hotels’ organizations need to make fast decisions to allocate and use important resources efficiently and effective-ly. As a result of the technological advances witnessed in the world, hotel organizations in all countries of the world are dealing with changing work environments, and thus the rise of global competition between hotel or-ganizations, crises and natural disasters, rapidly changing market trends have all increased the pressure on hotel’s organizations to come up with
Semih BUYUKKIPEKCI , Yazeed Sultan Saeed AHMED382
effective responses to survive and succeed. From the viewpoint of Lee et al (2011, 406) the primary objective of providing “MIS” in organizations has been to support the “managers & employees”, so they can perform their tasks better, especially in emergency situations. “MIS” is used to cope with the huge emergencies that afflict the organization, in addition to improving the organization’s system to respond to real crises, and also help the flow of information abundantly between organizations and thus create a great awareness among individuals and departments and predict the occurrence of crises and how to deal with them and avoid mistakes (Aedo, 2010, 12). One of the priorities of effective management during the management of real crises is to study the effects of this crisis on all admin-istrative departments within the company, and focus on the system of op-erations and information systems in addition to giving great importance to human resources management (Anderson, 2006, 1291). Due to (Gil, 2009, 105) as a result of the intensity of competition in different organizations and departments, managers need to provide them with accurate and com-prehensive information to manage the organization and reach the goals set.Managers’ perceptions of using “MIS” are very important, and the search for new information helps to create a strong information system for the company. There is a strong and important relationship between the tourism sector and “MIS”. All activities of the tourism sector depend heavily on the provision of more information and data, and thus increase the effectiveness of management in tourism organizations, the activity of tourism organiza-tions depends mainly on the information available to come up with strong tourism activities(Ramos & Perna, 2009, 278). According to (Adekeye, 1997, 325) “MIS” is the driving force of management. All managers in tourism organizations need to provide them with sufficient information to manage their tasks properly. Without this information, effectiveness in de-partments is reduced. Due to (Ranganathan & Kannnabiran, 2004, 284) observed MIS tasks and applications grow. The larger the workload, the greater the complexity and the wider scope of the implementation of the tasks, thus complicating the mission and function of the “MIS”, especially with technological progress. The success of any administrative decision depends on the success of “MIS”. It is an important and driving force for the success of all businesses in organizations, “MIS” has a significant im-pact on the functions in departments such as the Department of Marketing and Finance, etc., and these departments will not become more efficient without attention to “MIS”. Therefore, the good decision of managers is made by this tool (Tripathi, 2011, 59). “MIS” contributes to provide great benefits to organizations and works on continuous coordination between departments and achieve reliability and review all the work in the organi-zation (Reddy et al, 2009, 1). We conclude great importance to business “MIS” inside the works of Yemeni hotel organizations because the role
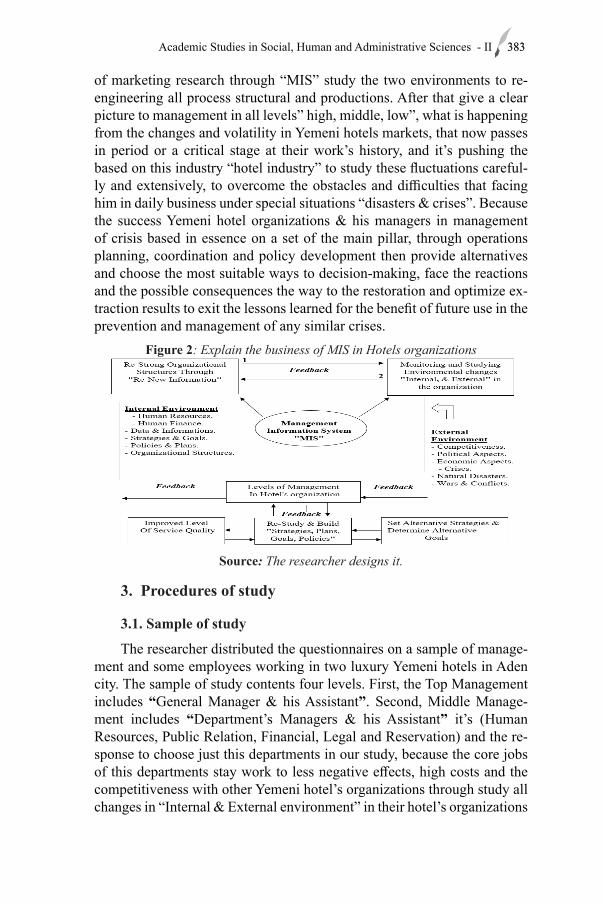
383Academic Studies in Social, Human and Administrative Sciences - II 383
of marketing research through “MIS” study the two environments to re-engineering all process structural and productions. After that give a clear picture to management in all levels” high, middle, low”, what is happening from the changes and volatility in Yemeni hotels markets, that now passes in period or a critical stage at their work’s history, and it’s pushing the based on this industry “hotel industry” to study these fluctuations careful-ly and extensively, to overcome the obstacles and difficulties that facing him in daily business under special situations “disasters & crises”. Because the success Yemeni hotel organizations & his managers in management of crisis based in essence on a set of the main pillar, through operations planning, coordination and policy development then provide alternatives and choose the most suitable ways to decision-making, face the reactions and the possible consequences the way to the restoration and optimize ex-traction results to exit the lessons learned for the benefit of future use in the prevention and management of any similar crises.
Figure 2: Explain the business of MIS in Hotels organizations
Source: The researcher designs it.
3. Procedures of study
3.1. Sample of study
The researcher distributed the questionnaires on a sample of manage-ment and some employees working in two luxury Yemeni hotels in Aden city. The sample of study contents four levels. First, the Top Management includes “General Manager & his Assistant”. Second, Middle Manage-ment includes “Department’s Managers & his Assistant” it’s (Human Resources, Public Relation, Financial, Legal and Reservation) and the re-sponse to choose just this departments in our study, because the core jobs of this departments stay work to less negative effects, high costs and the competitiveness with other Yemeni hotel’s organizations through study all changes in “Internal & External environment” in their hotel’s organizations
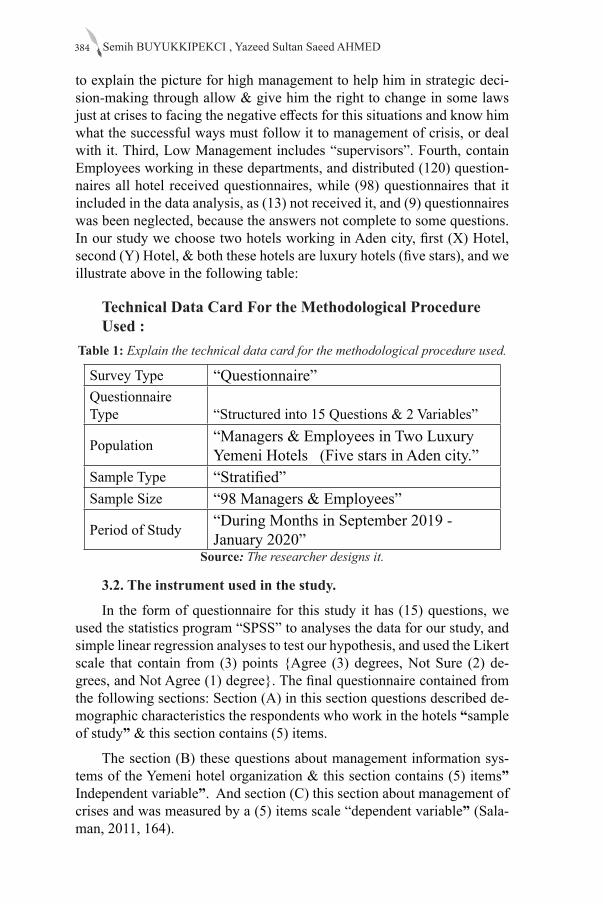
Semih BUYUKKIPEKCI , Yazeed Sultan Saeed AHMED384
to explain the picture for high management to help him in strategic deci-sion-making through allow & give him the right to change in some laws just at crises to facing the negative effects for this situations and know him what the successful ways must follow it to management of crisis, or deal with it. Third, Low Management includes “supervisors”. Fourth, contain Employees working in these departments, and distributed (120) question-naires all hotel received questionnaires, while (98) questionnaires that it included in the data analysis, as (13) not received it, and (9) questionnaires was been neglected, because the answers not complete to some questions. In our study we choose two hotels working in Aden city, first (X) Hotel, second (Y) Hotel, & both these hotels are luxury hotels (five stars), and we illustrate above in the following table:
Technical Data Card For the Methodological Procedure Used :
Table 1: Explain the technical data card for the methodological procedure used.
Survey Type “Questionnaire”Questionnaire Type “Structured into 15 Questions & 2 Variables”
Population “Managers & Employees in Two Luxury Yemeni Hotels (Five stars in Aden city.”
Sample Type “Stratified”Sample Size “98 Managers & Employees”
Period of Study “During Months in September 2019 - January 2020”
Source: The researcher designs it.
3.2. The instrument used in the study.
In the form of questionnaire for this study it has (15) questions, we used the statistics program “SPSS” to analyses the data for our study, and simple linear regression analyses to test our hypothesis, and used the Likert scale that contain from (3) points {Agree (3) degrees, Not Sure (2) de-grees, and Not Agree (1) degree}. The final questionnaire contained from the following sections: Section (A) in this section questions described de-mographic characteristics the respondents who work in the hotels “sample of study” & this section contains (5) items.
The section (B) these questions about management information sys-tems of the Yemeni hotel organization & this section contains (5) items” Independent variable”. And section (C) this section about management of crises and was measured by a (5) items scale “dependent variable” (Sala-man, 2011, 164).
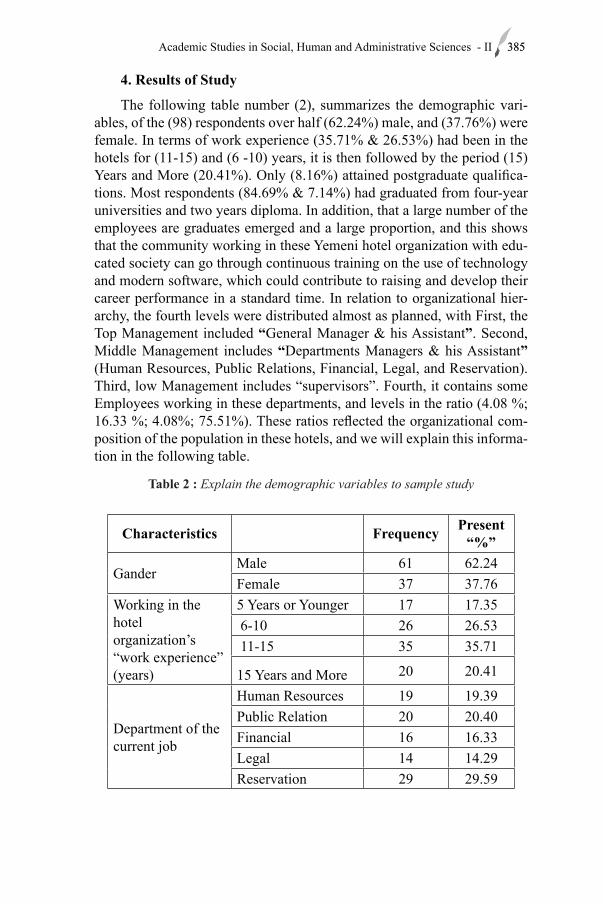
385Academic Studies in Social, Human and Administrative Sciences - II 385
4. Results of Study
The following table number (2), summarizes the demographic vari-ables, of the (98) respondents over half (62.24%) male, and (37.76%) were female. In terms of work experience (35.71% & 26.53%) had been in the hotels for (11-15) and (6 -10) years, it is then followed by the period (15) Years and More (20.41%). Only (8.16%) attained postgraduate qualifica-tions. Most respondents (84.69% & 7.14%) had graduated from four-year universities and two years diploma. In addition, that a large number of the employees are graduates emerged and a large proportion, and this shows that the community working in these Yemeni hotel organization with edu-cated society can go through continuous training on the use of technology and modern software, which could contribute to raising and develop their career performance in a standard time. In relation to organizational hier-archy, the fourth levels were distributed almost as planned, with First, the Top Management included “General Manager & his Assistant”. Second, Middle Management includes “Departments Managers & his Assistant” (Human Resources, Public Relations, Financial, Legal, and Reservation). Third, low Management includes “supervisors”. Fourth, it contains some Employees working in these departments, and levels in the ratio (4.08 %; 16.33 %; 4.08%; 75.51%). These ratios reflected the organizational com-position of the population in these hotels, and we will explain this informa-tion in the following table.
Table 2 : Explain the demographic variables to sample study
Characteristics Frequency Present “%”
GanderMale 61 62.24Female 37 37.76
Working in the hotel organization’s “work experience” (years)
5 Years or Younger 17 17.35 6-10 26 26.53 11-15 35 35.71
15 Years and More 20 20.41
Department of the current job
Human Resources 19 19.39Public Relation 20 20.40Financial 16 16.33Legal 14 14.29Reservation 29 29.59
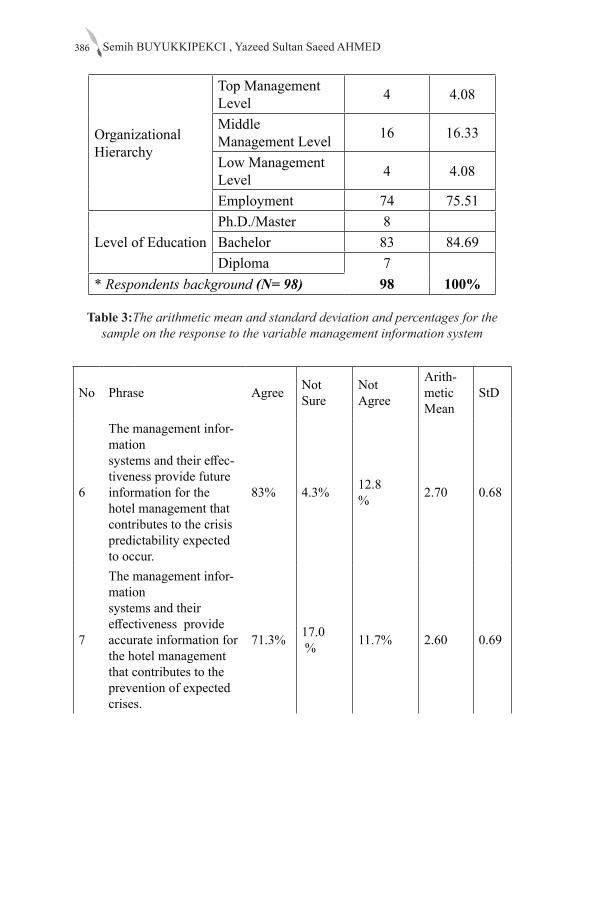
Semih BUYUKKIPEKCI , Yazeed Sultan Saeed AHMED386
Organizational Hierarchy
Top Management Level 4 4.08
Middle Management Level 16 16.33
Low Management Level 4 4.08
Employment 74 75.51
Level of EducationPh.D./Master 8 Bachelor 83 84.69Diploma 7
* Respondents background (N= 98) 98 100%
Table 3:The arithmetic mean and standard deviation and percentages for the sample on the response to the variable management information system
No Phrase Agree Not Sure
Not Agree
Arith-metic Mean
StD
6
The management infor-mation systems and their effec-tiveness provide future information for the hotel management that contributes to the crisis predictability expected to occur.
83% 4.3% 12.8 % 2.70 0.68
7
The management infor-mation systems and their effectiveness provide accurate information for the hotel management that contributes to the prevention of expected crises.
71.3% 17.0 % 11.7% 2.60 0.69

387Academic Studies in Social, Human and Administrative Sciences - II 387
8
The management infor-mation systems and their effectiveness would provide comprehensive information for the hotel management contribute to crisis management.
73.4% 10.6% 16% 2.57 0.75
9
The management infor-mation systems and their effec-tiveness would provide quality information for the hotel management contribute to the transit crisis with the least possible losses.
79.8% 13.8% 6.4% 2.73 0.57
10
The information provid-ed by the management information systems will contribute to determin-ing the effects of the cri-sis and lessons learned.
70.2% 18.1% 11.7% 2.59 0.69
The aritmetic mean and standard deviation in general 2,64 0.33
N = 98
From the above table number (3), the arithmetic means of the sample answers about variable management information systems in Yemen’s ho-tel organization (2.64), and standard deviation (0.33). That shows us the highly important to good utilizing from using all these techniques to help the managers in Yemeni hotel organization to determinates the goals, & desired strategies, reducing the costs and contact between Yemen’s hotel organization and his costumers (Current, Potential, Foreign, & Internal) “Travel agent, tourists, etc”, to reduce the gap between all of them, and then creating the loyalty to provide the achieving a new marketing op-portunities through enter to a new markets or alliance with other Yemen’s hotel organization to leader or capture the Yemeni hotel markets, and less the threats from another competitive in our tourism markets.
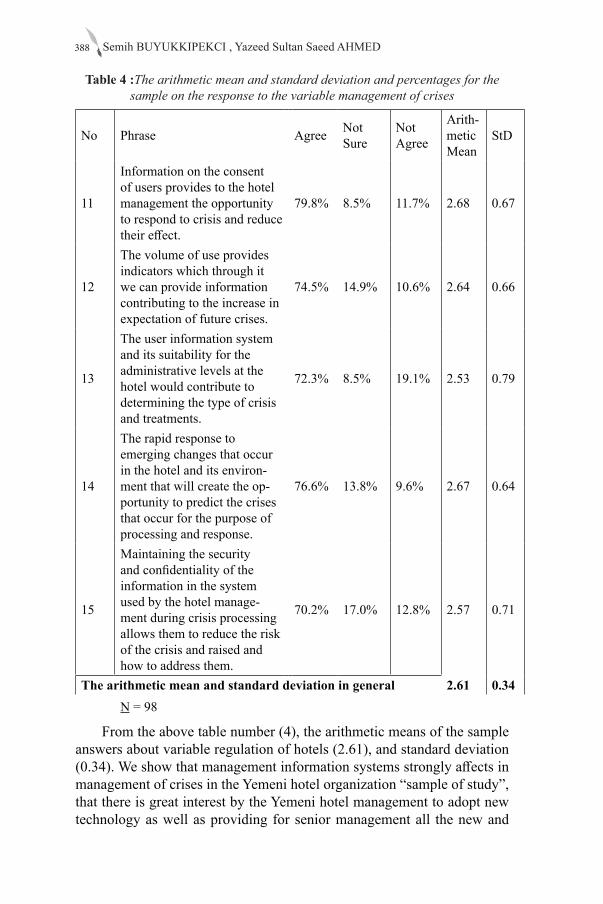
Semih BUYUKKIPEKCI , Yazeed Sultan Saeed AHMED388
Table 4 :The arithmetic mean and standard deviation and percentages for the sample on the response to the variable management of crises
No Phrase Agree Not Sure
Not Agree
Arith-metic Mean
StD
11
Information on the consent of users provides to the hotel management the opportunity to respond to crisis and reduce their effect.
79.8% 8.5% 11.7% 2.68 0.67
12
The volume of use provides indicators which through it we can provide information contributing to the increase in expectation of future crises.
74.5% 14.9% 10.6% 2.64 0.66
13
The user information system and its suitability for the administrative levels at the hotel would contribute to determining the type of crisis and treatments.
72.3% 8.5% 19.1% 2.53 0.79
14
The rapid response to emerging changes that occur in the hotel and its environ-ment that will create the op-portunity to predict the crises that occur for the purpose of processing and response.
76.6% 13.8% 9.6% 2.67 0.64
15
Maintaining the security and confidentiality of the information in the system used by the hotel manage-ment during crisis processing allows them to reduce the risk of the crisis and raised and how to address them.
70.2% 17.0% 12.8% 2.57 0.71
The arithmetic mean and standard deviation in general 2.61 0.34N = 98
From the above table number (4), the arithmetic means of the sample answers about variable regulation of hotels (2.61), and standard deviation (0.34). We show that management information systems strongly affects in management of crises in the Yemeni hotel organization “sample of study”, that there is great interest by the Yemeni hotel management to adopt new technology as well as providing for senior management all the new and
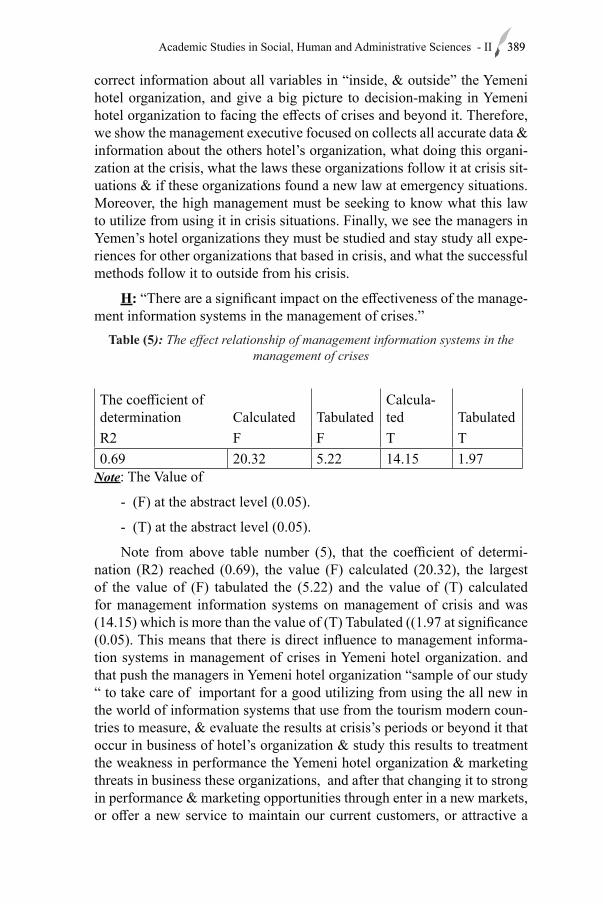
389Academic Studies in Social, Human and Administrative Sciences - II 389
correct information about all variables in “inside, & outside” the Yemeni hotel organization, and give a big picture to decision-making in Yemeni hotel organization to facing the effects of crises and beyond it. Therefore, we show the management executive focused on collects all accurate data & information about the others hotel’s organization, what doing this organi-zation at the crisis, what the laws these organizations follow it at crisis sit-uations & if these organizations found a new law at emergency situations. Moreover, the high management must be seeking to know what this law to utilize from using it in crisis situations. Finally, we see the managers in Yemen’s hotel organizations they must be studied and stay study all expe-riences for other organizations that based in crisis, and what the successful methods follow it to outside from his crisis.
H: “There are a significant impact on the effectiveness of the manage-ment information systems in the management of crises.”
Table (5): The effect relationship of management information systems in the management of crises
The coefficient of determination Calculated Tabulated
Calcula-ted Tabulated
R2 F F T T 0.69 20.32 5.22 14.15 1.97
Note: The Value of
- (F) at the abstract level (0.05).
- (T) at the abstract level (0.05).
Note from above table number (5), that the coefficient of determi-nation (R2) reached (0.69), the value (F) calculated (20.32), the largest of the value of (F) tabulated the (5.22) and the value of (T) calculated for management information systems on management of crisis and was (14.15) which is more than the value of (T) Tabulated ((1.97 at significance (0.05). This means that there is direct influence to management informa-tion systems in management of crises in Yemeni hotel organization. and that push the managers in Yemeni hotel organization “sample of our study “ to take care of important for a good utilizing from using the all new in the world of information systems that use from the tourism modern coun-tries to measure, & evaluate the results at crisis’s periods or beyond it that occur in business of hotel’s organization & study this results to treatment the weakness in performance the Yemeni hotel organization & marketing threats in business these organizations, and after that changing it to strong in performance & marketing opportunities through enter in a new markets, or offer a new service to maintain our current customers, or attractive a
Semih BUYUKKIPEKCI , Yazeed Sultan Saeed AHMED390
new customers to facing the competitiveness in marketing environments. Therefore, all managers levels in Yemeni hotel organizations must be de-pending on management information systems to alignment between the internal environment through study the “data, goals, strategies, plans, hu-man resources, finance resources, organizational structures” & external en-vironment through study some changes in Yemeni markets environments its “technological, economic, political & legal” to facing the changes in these environments, to achieve the successful in Yemeni’s hotel markets that have many from marketing opportunities through have more and more from tourism destinations and now based in crucial period in his business, and the data’s conclusions leads us to accept our hypotheses study.
5. Conclusions From the results of our study, we found a highly effective for man-
agement information systems in the work of Yemeni hotels organization, that push us to agree at our hypothesis. Therefore, the management and employee in the Yemeni hotels organization should use all the new tech-nologies in daily activities and seeking to update it to maintain his share marketing within tourism markets (current & potential), through effective communication with his costumes, and build a new communications chan-nels with new costumes “Travel Agent, Tourists, Visitors” (Local, Foreign, Current & Potential) especially at crisis, emergency situations.
1. The results showed that the management information systems contribute effectively to the development business of Yemeni hotel organi-zations, as contribute effectively in achieving the goals, plans, and strate-gies through saving time and resources at a crisis period.
2. The results showed that the management information systems have become an important tool to the Yemeni hotel’s industry, and from his view, the management information systems are playing an important role in creating the success of these organizations to facing the crisis and managing it.
3. The management information systems can facilitate the move-ment of information, laws in hotel’s organizations starting from high man-agement and finally in employees pass in middle & low management, moreover, management information systems can easier to monitoring & implementation the important decisions.
4. The management information systems could provide accurate data to high managers to Re-Formulate strategies in new methods, depend-ing on a study the resources “human & financial” to face the crises or emergency situations.
391Academic Studies in Social, Human and Administrative Sciences - II 391
5. The management information systems playing an important role in the communication process between hotel’s organizations and “Custom-ers” in all period and especially at the crisis to know what happens around it in competitive markets.
6. There is a differentiation in the classification of crises and their stages and requirements management and phases management of the cri-sis, which refers to the presence of an actual need to study and understand the terms of crisis, to face this threat.
6. Recommendations In light of the foregoing conclusions we reached we can
put forward some recommendations that Yemeni hotel management “the study sample” should taken into account in confronting the crises and what correct scientific methods they should follow that will help them to get rid of the negative effects that appear in times of crisis, and perhaps beyond:
1. Yemeni Hotel management must take into account the increasing importance of management information systems, and according to the at-tributes of the important tools that help those administrations to know the challenges and changes that occur in the surrounding business environ-ment, especially in times of crisis.
2. Hotel management that operate in the tourism market of Ye-men, “the study sample”, must take into consideration the formation of a working group specializing studying crises and stages and so-called “management team of the crisis,” and is headed by the Director-General or the Executive Director of the hotel organization and a membership of the heads of departments (public relations, finance, legal & human resources) because of these departments vital and important role in the work of the Organization hotel.
3. Yemeni hotel Management must put the “management team of the crisis” into intensive training courses to build scientific and practical experiences that facilitate their work in how to study and deal with the crisis without confusion and unrest.
4. Yemeni hotel Organizations “the study sample” must take all that is new in the world of information systems, including network “In-tranet” to ensure access to accurate information about the competing hotel organizations that working in the tourism market of Yemen to be a cofactor to the managers of the Hotel organizations in taking and making the right decisions.
5. The Yemeni hotel Management must take into consideration to study the experiences of the developed countries in tourism and
Semih BUYUKKIPEKCI , Yazeed Sultan Saeed AHMED392
what are the ways and correct scientific methods that are taken by these countries to face the crises that they passed by.
ReferencesAdekeye, W.(1997).”The importance of management information
systems”. Library Review, 46(5), pp. 318 - 327.Aedo, L., Diaz, P., Carroll, J., Convertino, G.,&Rosson, M.(2010).”End-
user oriented strategies to facilitate multi-organizational adoption of emergency management information systems”. Information Processing and Management, 46, pp. 11 - 21.
Alikhani, H., Ahmadi, N., & Mehravar, M. (2013). Accounting information system versus management information system. European Online Journal of Natural and Social Sciences: Proceedings, 2(3 (s)), pp-359.
Alter, S. (1999).”Information systems management perspective”. Third Edition. Addison – Wesley educational publisher.USA.
Anderson, B.(2006).”Crisis management in the Australian tourism industry: Preparedness, personal and postscript”. Tourism Management, 27, PP. 1290 - 1297.
Ansoff. H., & McDonnell, E.(1990).”Implanting strategic management” .2nd Ed. Prentice Hall International (UK) Ltd. London.
Aryee, S.(2011).”Hotel maintenance management”. Master thesis, Sweden kingdom, Architecture and Built environment Division of Real Estate Management.
Bistricic, A.(2006).”Project information system”. Tourism and Hospitality Management, 12(2), pp. 213 - 224.
Caribbean Tourism Organization. (2002).”Hotel classification system”. Research, New York.
Cathoth, P.,&Olsen, M.(2002).”Organizational leadership and strategy in the hospitality industry”. Journal of services research, 2(1), pp. 1 - 25.
Chand, M.(2008).”Manager’s perception of hotel management curricula in India: An exploratory study”. Journal of Tourism, pp. 100 - 116.
Chen, M.(2011).”The response of hotel performance to international tourism development and crisis events”. International Journal of Hospitality Management, 30, pp. 200 - 212.
Connelly,S,.& Rurak,G.(2010).”Leadership style and activating potential moderators of the relationships among leader emotional displays and outcomes”. Journal of leadership Quarterly, 21, pp.745 - 764.
Curtis, G.(1995).” Business information systems: Analysis Design and practice “ 2 and Ed. Addison – Wesley Publishing Co. Inc. The UK.
393Academic Studies in Social, Human and Administrative Sciences - II 393
Drucker.P.(1988).”The coming of the new organization”. Research.Harvard business review. Harvard College.
Finne, T.(2000).”Information systems risk management: Key concepts and business process”. Computers & Security, 19, pp.243 - 242.
Ghaderi, Z., Som, A.,& Henderson, J.(2012).Tourism crisis and island destinations: experiences in Penang, Malaysia. Tourism Management, 2(3), pp.79-84.
Gil, D.(2009).”Management information systems and strategic performances: The role of top team composition”. International Journal of Information Management, 29, pp. 104 – 110.
Hajiluca, P., et al. (2009).”Classification of hotel establishments within the EU”. Report. Cyprus. The European consumer centers network.
Javadi,M.,& Dastjerdia,M.(2011).”Evaluation effect of management information system implementation on personal resistance causes in Isfhan power plant management corporation in Iran”. Procedia Computer Science, 3, pp. 1296 - 1303.
Kandampully, J., Juwaheer, T., & Hu, H.(2011).The influence of the hotel firm’s quality of service and image and its effect on tourism customer loyalty. International journal of hospitality & tourism & administration, 12(1), pp. 21-42.
Karppinen, M.(2011), “Strategic marketing plan for a hotel”. Master thesis. The Republic of Finland. University of applied sciences.
Kotler, P.(1997). “Marketing Management Analysis, Planning, Implementation, and Control”. Ninth Edition. Prentice Hall Inc.
Lee, J., Bharosa, N., Yang, J., Janssen, M., &Rao, H.(2011).”Group value and intention to use – A study of multi-agency disaster management information systems for public safety”. Decision Support Systems, 50, pp. 404 – 414.
Lee, W., Wang, Y., Wang, W., & Cheung, C.(2012).”An unstructured information management system (UIMS) for emergency management”. Expert Systems with Applications, 39, PP. 12743 - 12758.
Nathan, B., Apigian, C ., Nathan, T.,&Tu, Q.(2004).”A path analytic study of the effect of top management support for information systems performance”. The international journal of management science, 32, pp. 459 - 471.
O’brien, G.(1997).”Introduction to information system”, Eight Editions, the McGraw-Hill Companies Inc. The USA.
Okumus,F.,Altinay,M.,&Arasli,H.(2005).”The impact of Turkey’s economic crisis of February 2001 on the tourism industry in Northern Cyprus”. Tourism management, 26, pp. 95 - 104.
Paraskevas, A., Altinay, L., McLean, J.,& Cooper, C.(2013).Crisis knowledge in tourism: types, flows, and governance. Annals of
Semih BUYUKKIPEKCI , Yazeed Sultan Saeed AHMED394
tourism research, 41, pp. 130-152.Pittaway, L., Carmouche, R.,&Chell, E.(1998).”The way forward:
Leadership research in the hospitality industry”. International of Hospitality Management, 17, pp. 407 - 426.
Radford.K.(1978).”Information systems for strategic Decisions”. Reston Publishing Co. The USA.
Ramos, C.,& Perna, F.(2009).”Information system for tourism activity monitoring and forecasting indicators as an experience for Portugal”. High school of management hospitality and tourism, 9 (4), pp.277 – 289.
Ranganthan, C.,& Kannabiran, G.(2004).”Effective management of information systems functions: an exploratory study of Indian organizations”. International Journal of Information Management, 24, pp. 247 – 266.
Reddy, G., Srinivasu, R., Rikkula, S.,& Rao, V.(2009).”Management information system to help managers for providing decision making in an organization”. International Journal of Reviews in Computing, pp.1- 6.
Ritchie, B.(2004).”Chaos, crises and disaster: a strategic approach to crisis management in the tourism industry”. Tourism management, 25, pp. 669 - 683.
Rouski, B.,& Alcott, P.(2006).”Exploring the crisis readiness perceptions of hotel managers in the UK”. Tourism and Hospitality Research, 7, PP.27- 38.
Salman, M.(2011).”Crisis management and information systems impact and effectiveness ranges”. International journal of economic science, 28, pp. 134 – 165
Sorensen,C.,Fountas,S.,Nash,E.,Pesonen,L.,Bochtis,L.,Pedersen,S.,Bas-so,B.,& Blackmore, S.(2010).”A conceptual model of a future farm management information system”. Computers and Elec-tronics in Agriculture, 72, pp.37 - 47.
Stojanovic, T., David, G.,&Lymbery, G.(2010).”Approaches to knowledge sharing and capacity building: The role of local information sys-tems in marine and coastal management”. Ocean & Coastal Management, 53, PP. 805-815.
Tavitiyaman, P., Leong, J., Dunn, G., Njite, D.,&Neal, D.(2008).”The effectiveness of loading crisis management plans”. Journal of Quality Assurance In Hospitality & Tourism, 8(4), pp.24 - 60.
Thompson, J.(1997). “Strategic management: Awareness and change”.3rd Ed. International Thomson Publishing Co. The UK.
Trigo, A., Belfo, F., & Estébanez, R. P. (2016). Accounting Information Systems: evolving towards a business process oriented account-ing. Procedia Computer Science, 100, 987-994.

395Academic Studies in Social, Human and Administrative Sciences - II 395
Tripathi, K.(2011).”Role of management information systems (MIS) in human resource”. International Journal of Computer Science and Technology, 2 (1), pp. 58 - 62.
Ulengim, F.,& Uray, N.(2004).”Adoption of information technology in supply chain management: experiences of Turkish firms”. Jour-nal of Transnational Management, 10(2), pp. 1-30.
UNESCO.(2009).”Developing management information systems for com-munity learning centers”. A guidebook, Published by UNES-CO Asia and Pacific Regional Bureau for Education. Bangkok. Thailand.
Wang, Y. (2009).”The impact of crisis events and macroeconomic activity on Taiwan’s international inbound tourism demand”. Tourism management, 30, pp. 75 - 82.
![[901~1.9l:H] - Administrative Records](https://static.fdokumen.com/doc/165x107/6337b73efe1f34a1c300a976/90119lh-administrative-records.jpg)