Social Development
64
12.1. Introduction: Social Development and Human Development The purpose of this chapter is to focus on the education and health capabilities of the people of Uttar Pradesh. Improvements in education and health are Chapter 12 Social Development valuable in their own right, but they also have strong linkages with broad-based development and growth. Dréze and Sen (1995) have outlined the importance of health and education in at least five important dimensions (Box 12.1) and UNDP includes health and BOX 12.1 Importance of Health and Education According to Dréze and Sen (1995), education and health can be seen to be valuable to the freedom of a person in at least five distinct ways: (1) Intrinsic Importance: Being educated and healthy are valuable achievements in themselves, and the opportunity to have them can be of direct importance to a person’s effective freedom. (2) Instrumental Personal Roles: A person’s education and health can help him or her to do many things—‘other’ than just being educated and healthy—that are also valuable. They can, for instance, be important for getting a job and more generally for making use of economic opportunities. The resulting expansion in incomes and economic means can, in turn, add to a person’s freedom to achieve functioning that he or she values. (3) Instrumental Social Roles: Greater literacy and basic education can facilitate public discussion of social needs and encourage informed collective demands (e.g. for health care and social security); these in turn can help expand the facilities that the public enjoys, and contribute to the better utilisation of the available services. (4) Instrumental Process Roles: The process of schooling can have benefits aside from formal education. For example, the incidence of child labour is intimately connected with non-schooling of children, and the expansion of schooling can reduce the distressing phenomenon of child labour so prevalent in India. Schooling also brings young people in touch with others and thereby broadens their horizons, and this can be particularly important for young girls. (5) Empowerment and Distributive Roles: Greater literacy and educational achievements of disadvantaged groups can increase their ability to resist oppression, to organise politically, and to get a fairer deal. The redistributive effects can be important not only between different social groups or households, but also within the family, since there is evidence that better education (particularly female education) contributes to the reduction of gender-based inequalities. These influences need not work only for the person who receives education or health care. There are also interpersonal effects. For example, one person’s educational ability can be of use to another (e.g. to get a pamphlet read, or to have a public announcement explained). The interpersonal connections can be of political significance as well; for example, a community may benefit generally from the civic attention it receives through the educated activism of a particular group within that community. Also, the use of economic opportunity by one person can, in many circumstances, open up further opportunities for others, through backward and forward linkages in supply and demand. It is hard to evaluate the contributions of education except through a broad ‘social choice’ approach. There are similar interconnections in matters of health because of the obvious importance of externalities in morbidity, preventive care, and curative treatment. Expansion of health and education can have influences that go much beyond the immediate personal effects. U T T A R P R A D E S H
-
Upload
khangminh22 -
Category
Documents
-
view
2 -
download
0
Transcript of Social Development
12.1. Introduction: Social Development andHuman Development
The purpose of this chapter is to focus on theeducation and health capabilities of the people of UttarPradesh. Improvements in education and health are
Chapter 12
Social Development
valuable in their own right, but they also have stronglinkages with broad-based development and growth.Dréze and Sen (1995) have outlined the importance ofhealth and education in at least five importantdimensions (Box 12.1) and UNDP includes health and
BOX 12.1
Importance of Health and Education
According to Dréze and Sen (1995), education and health can be seen to be valuable to the freedom of a person in at leastfive distinct ways:
(1) Intrinsic Importance: Being educated and healthy are valuable achievements in themselves, and the opportunity to havethem can be of direct importance to a person’s effective freedom.
(2) Instrumental Personal Roles: A person’s education and health can help him or her to do many things—‘other’ than justbeing educated and healthy—that are also valuable. They can, for instance, be important for getting a job and more generallyfor making use of economic opportunities. The resulting expansion in incomes and economic means can, in turn, add toa person’s freedom to achieve functioning that he or she values.
(3) Instrumental Social Roles: Greater literacy and basic education can facilitate public discussion of social needs andencourage informed collective demands (e.g. for health care and social security); these in turn can help expand the facilitiesthat the public enjoys, and contribute to the better utilisation of the available services.
(4) Instrumental Process Roles: The process of schooling can have benefits aside from formal education. For example, theincidence of child labour is intimately connected with non-schooling of children, and the expansion of schooling can reducethe distressing phenomenon of child labour so prevalent in India. Schooling also brings young people in touch with othersand thereby broadens their horizons, and this can be particularly important for young girls.
(5) Empowerment and Distributive Roles: Greater literacy and educational achievements of disadvantaged groups can increasetheir ability to resist oppression, to organise politically, and to get a fairer deal. The redistributive effects can be importantnot only between different social groups or households, but also within the family, since there is evidence that bettereducation (particularly female education) contributes to the reduction of gender-based inequalities.
These influences need not work only for the person who receives education or health care. There are also interpersonal effects.For example, one person’s educational ability can be of use to another (e.g. to get a pamphlet read, or to have a publicannouncement explained). The interpersonal connections can be of political significance as well; for example, a community maybenefit generally from the civic attention it receives through the educated activism of a particular group within that community.Also, the use of economic opportunity by one person can, in many circumstances, open up further opportunities for others,through backward and forward linkages in supply and demand. It is hard to evaluate the contributions of education exceptthrough a broad ‘social choice’ approach. There are similar interconnections in matters of health because of the obviousimportance of externalities in morbidity, preventive care, and curative treatment. Expansion of health and education can haveinfluences that go much beyond the immediate personal effects.
UTTAR PRADESH
UTTAR PRADESH DEVELOPMENT REPORT—VOL. 2334
educational capability among the most importantdimensions of human development.
Education is known to have vital and importantlinks with the achievement of income and healthsecurity. A number of recent studies also provide ampleevidence of the mutual analytical and empirical linkagesbetween human resources and poverty in India.1
Improvement in educational performance, especially ofwomen, is closely related to health and fertilitybehaviour. Female literacy and workforce participationare important determinants of variations in childmortality (Kishor, 1994; Murthy et al., 1995). Bettereducated women are more likely to marry late, exercisegreater control over the choice of size of family, havefewer children and adopt family planning methods on alarger scale. A smaller number of pregnancies alone, arelikely to result in better maternal and child health andlower maternal and child mortality. Better education ismore likely to be associated with greater utilisation ofhealth services by women and children (Krishnan,1996) and improved health and hygiene practices againlowering maternal and child mortality and leading toimprovements in health.
Improvements in health and education haveimportant implications for the supply and demand oflabour. Indian evidence shows that the offer price forlabour improves with the health and educationalattainments of the labour force (World Bank, 1997). Onthe other hand, the lack of education leads to greatervulnerability in labour markets. Large differentials inhuman resource endowments between social groups andgender have, by depressing the returns to labour ofsocially disadvantaged groups, women, and children,been an important cause of high relative inequalitiesand endemic poverty among these groups and women.In India, where educational access has traditionally beenconfined to upper caste males, the spread of educationamong socially disadvantaged groups and women hasextremely significant implications for the economicprogress of these groups.
Apart from the instrumentalist roles of educationand good health in raising incomes and growth, andbiasing these towards the poor, good health andeducation are also intrinsically important, in that theyimprove people’s capabilities. Women’s education andhealth, for instance, impact on improvements in genderequality and gender relations and women’sempowerment. The spread of education among the
poorer groups and women has a significant influenceon participation in the democratic processes and ininfluencing the priorities of development in accordancewith the principles of sustainable development and localneeds. With the move towards devolution following the73rd Amendment, the absence of widespread literacy isa serious obstacle in empowering women and sociallydisadvantaged groups who have acquired the possibilityof taking responsibility of formal leadership in thevarious rungs of local self-government. To the extentthat decentralisation and devolution can improveefficiency and design of development programmes,particularly those relating to the poor, the absence ofliteracy and education is likely to affect the performanceof these programmes. Low educational levels of thepopulation encourage lack of transparent functioningand information flows and reduce the accountability ofgovernment. Thus, better education can have importantrepercussions for the design and implementation ofdevelopment strategies and their impact on the poor.Education also increases self-esteem and social dignity,reduces vulnerability and powerlessness. Hence,education impacts directly on virtually all dimensions ofdeprivation (physical, social, economic, political andpsychological) enumerated by Chambers (1995).
This chapter focusses on an analysis of the healthand education sectors of Uttar Pradesh. It analysesUttar Pradesh’s performance in these two sectors andlocates current priorities and future strategies in thelight of this performance. Accordingly the chapter isorganised as follows: Section 12.2 gives a comparativestatus of education, health and fertility in UttarPradesh. A detailed discussion on health is provided inSection 12.3 and Section 12.4 discusses the educationsector in Uttar Pradesh.
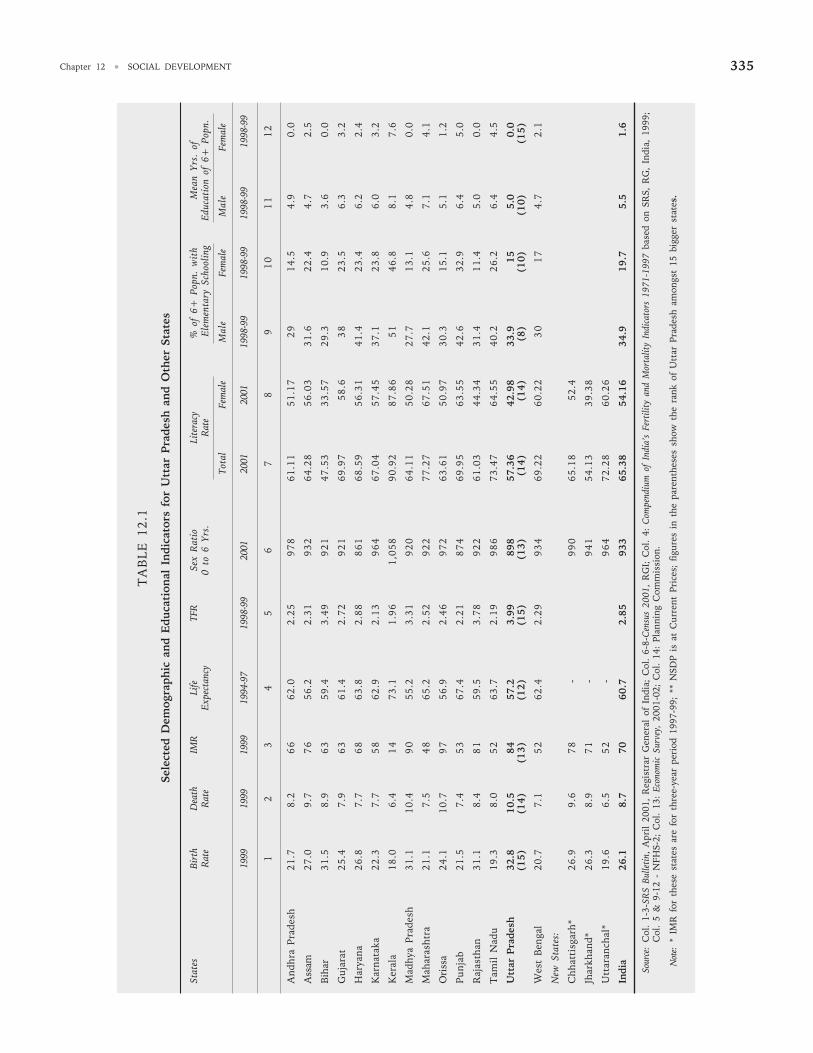
12.2 Education, Health and Fertility:Uttar Pradesh in Comparative Perspective
Despite steady improvement in the status ofeducation and health status of the population over thelast several decades, the level of social development inthe state and the persistent inequalities based on socio-economic status continue to be a cause of significantconcern.
Life expectancy at birth, which is a crucialsummary indicator of the health status of thepopulation, is 57.2 years in Uttar Pradesh, almost fiveyears less than the national average, and is the third
1. Tilak, 1989; Dréze and Sen, 1995, 1997; Krishnan, 1996; World Bank 1991, 1997.
Chapter 12 • SOCIAL DEVELOPMENT 335
TA
BL
E 1
2.1
Sele
cted
Dem
ogra
phic
and
Edu
cati
onal
Ind
icat
ors
for
Utt
ar P
rade
sh a
nd O
ther
Sta
tes
Stat
esBi
rth
Dea
thIM
RLi
feTF
RSe
x R
atio
Lite
racy
% o
f 6+
Pop
n. w
ith
Mea
n Y
rs.
ofR
ate
Rat
eEx
pect
ancy
0 to
6 Y
rs.
Rat
e E
lem
enta
ry S
choo
ling
Educ
atio
n of
6+
Pop
n.
Tota
lFe
mal
eM
ale
Fem
ale
Mal
eFe
mal
e
1999
1999
1999
1994
-97
1998
-99
2001
2001
2001
1998
-99
1998
-99
1998
-99
1998
-99
12
34
56
78
91
01
11
2
And
hra
Prad
esh
21.7
8.2
66
62.0
2.25
97
861
.11
51.1
72
914
.54.
90.
0
Ass
am27
.09.
77
656
.22.
319
32
64.2
856
.03
31.6
22.4
4.7
2.5
Bih
ar31
.58.
96
359
.43.
499
21
47.5
333
.57
29.3
10.9
3.6
0.0
Guj
arat
25.4
7.9
63
61.4
2.72
92
169
.97
58.6
38
23.5
6.3
3.2
Har
yana
26.8
7.7
68
63.8
2.88
86
168
.59
56.3
141
.423
.46.
22.
4
Kar
nata
ka22
.37.
75
862
.92.
139
64
67.0
457
.45
37.1
23.8
6.0
3.2
Ker
ala
18.0
6.4
14
73.1
1.96
1,05
890
.92
87.8
65
146
.88.
17.
6
Mad
hya
Prad
esh
31.1
10.4
90
55.2
3.31
92
064
.11
50.2
827
.713
.14.
80.
0
Mah
aras
htra
21.1
7.5
48
65.2
2.52
92
277
.27
67.5
142
.125
.67.
14.
1
Ori
ssa
24.1
10.7
97
56.9
2.46
97
263
.61
50.9
730
.315
.15.
11.
2
Punj
ab21
.57.
45
367
.42.
218
74
69.9
563
.55
42.6
32.9
6.4
5.0
Raj
asth
an31
.18.
48
159
.53.
789
22
61.0
344
.34
31.4
11.4
5.0
0.0
Tam
il N
adu
19.3
8.0
52
63.7
2.19
98
673
.47
64.5
540
.226
.26.
44.
5
Utt
ar P
rade
sh32
.810
.584
57.2
3.99
898
57.3
642
.98
33.9
155.
00.
0(1
5)
(14
)(1
3)
(12
)(1
5)
(13
)(1
4)
(14
)(8
)(1
0)
(10
)(1
5)
Wes
t B
enga
l20
.77.
15
262
.42.
299
34
69.2
260
.22
30
17
4.7
2.1
New
Sta
tes:
Chh
atti
sgar
h*26
.99.
67
8-
99
065
.18
52.4
Jhar
khan
d*26
.38.
97
1-
94
154
.13
39.3
8
Utt
aran
chal
*19
.66.
55
2-
96
472
.28
60.2
6
Indi
a26
.18.
770
60.7
2.85
933
65.3
854
.16
34.9
19.7
5.5
1.6
Sour
ce:
Col
. 1-
3-SR
S Bu
lleti
n, A
pril
2001
, R
egis
trar
Gen
eral
of
Indi
a; C
ol.
6-8-
Cen
sus
2001
, R
GI;
Col
. 4:
Com
pend
ium
of
Indi
a’s
Fert
ility
and
Mor
talit
y In
dica
tors
197
1-19
97 b
ased
on
SRS,
RG
, In
dia,
199
9;C
ol.
5 &
9-1
2 -
NFH
S-2;
Col
. 13
: Ec
onom
ic S
urve
y, 2
001-
02;
Col
. 14
: Pl
anni
ng C
omm
issi
on.
Not
e:*
IMR
for
the
se s
tate
s ar
e fo
r th
ree-
year
per
iod
1997
-99;
**
NSD
P is
at
Cur
rent
Pri
ces;
fig
ures
in
the
pare
nthe
ses
show
the
ran
k of
Utt
ar P
rade
sh a
mon
gst
15 b
igge
r st
ates
.
UTTAR PRADESH DEVELOPMENT REPORT—VOL. 2336
lowest among major Indian states. The infantmortality rate was estimated at 84 in 1999, whichplaces the state at the second lowest level. The birthrate and the total fertility rate in Uttar Pradesh is thehighest among all states and the death rate is also thesecond highest. The 0 to 6 years sex ratio (number offemales per thousand males), which is a crucialindicator of gender status, stood at 898 in 2001,showing a deficit of 102 female children per thousandmale children. This was again the third lowest amongthe Indian states.
Educational attainment in the state is equally poor.Although literacy levels have been improving rapidly inrecent years, more than two-fifths of the 7+ totalpopulation and more than three-fifths of the femalepopulation in this age group was still illiterate in 2001.The state is the second lowest among all states interms of literacy.
Uttar Pradesh’s showing in terms of the percentageof the male/female population completing elementaryschooling is considerably poorer than the nationalaverage. According to the National Sample Survey (NSS)55th Round (1999-00), only 16.2 per cent of UttarPradesh’s population above five years in the rural areas,and 32.4 per cent in the urban areas had completedmiddle school, compared to 18.4 per cent of the all-India rural population and 41.8 per cent of thecountry’s urban population. This, taken together withthe literacy profile and other indicators of educationalaccess, implies a high inequality in the access toeducation across socio-economic groups.
12.3 Health
There has been steady improvement in the healthstatus of the population, but the resultant achievementstill falls short of even the average achievement in thecountry. Improvement in health status is linked notonly to the performance of the health care system, butalso to health awareness, environmental sanitation,availability of potable drinking water, nutritional intake,and various other social and cultural factors. Thissection reviews the state’s progress and its currentstatus in the improvement of health attainment.
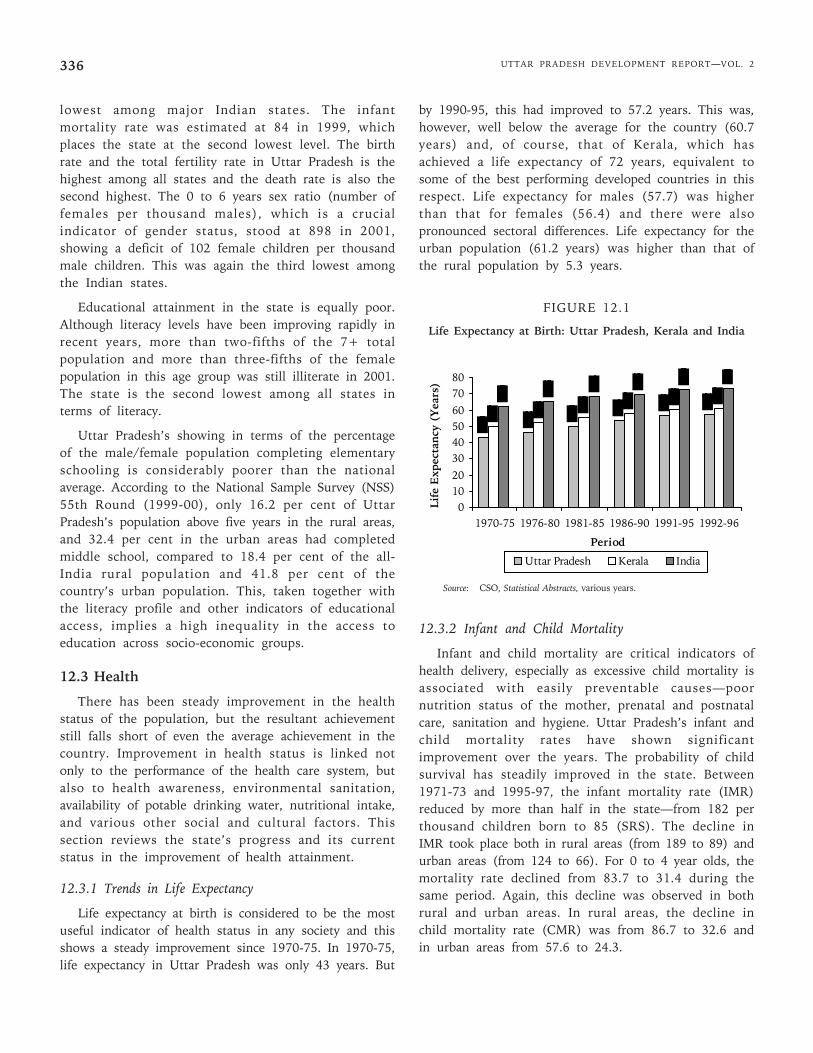
12.3.1 Trends in Life Expectancy
Life expectancy at birth is considered to be the mostuseful indicator of health status in any society and thisshows a steady improvement since 1970-75. In 1970-75,life expectancy in Uttar Pradesh was only 43 years. But
by 1990-95, this had improved to 57.2 years. This was,however, well below the average for the country (60.7years) and, of course, that of Kerala, which hasachieved a life expectancy of 72 years, equivalent tosome of the best performing developed countries in thisrespect. Life expectancy for males (57.7) was higherthan that for females (56.4) and there were alsopronounced sectoral differences. Life expectancy for theurban population (61.2 years) was higher than that ofthe rural population by 5.3 years.
FIGURE 12.1
Life Expectancy at Birth: Uttar Pradesh, Kerala and India
12.3.2 Infant and Child Mortality
Infant and child mortality are critical indicators ofhealth delivery, especially as excessive child mortality isassociated with easily preventable causes—poornutrition status of the mother, prenatal and postnatalcare, sanitation and hygiene. Uttar Pradesh’s infant andchild mortality rates have shown significantimprovement over the years. The probability of childsurvival has steadily improved in the state. Between1971-73 and 1995-97, the infant mortality rate (IMR)reduced by more than half in the state—from 182 perthousand children born to 85 (SRS). The decline inIMR took place both in rural areas (from 189 to 89) andurban areas (from 124 to 66). For 0 to 4 year olds, themortality rate declined from 83.7 to 31.4 during thesame period. Again, this decline was observed in bothrural and urban areas. In rural areas, the decline inchild mortality rate (CMR) was from 86.7 to 32.6 andin urban areas from 57.6 to 24.3.
01020
304050607080
1970-75 1976-80 1981-85 1986-90 1991-95 1992-96
Period
Lif
e E
xpec
tan
cy (
Yea
rs)
Uttar Pradesh Kerala India
Source: CSO, Statistical Abstracts, various years.
Chapter 12 • SOCIAL DEVELOPMENT 337
FIGURE 12.2
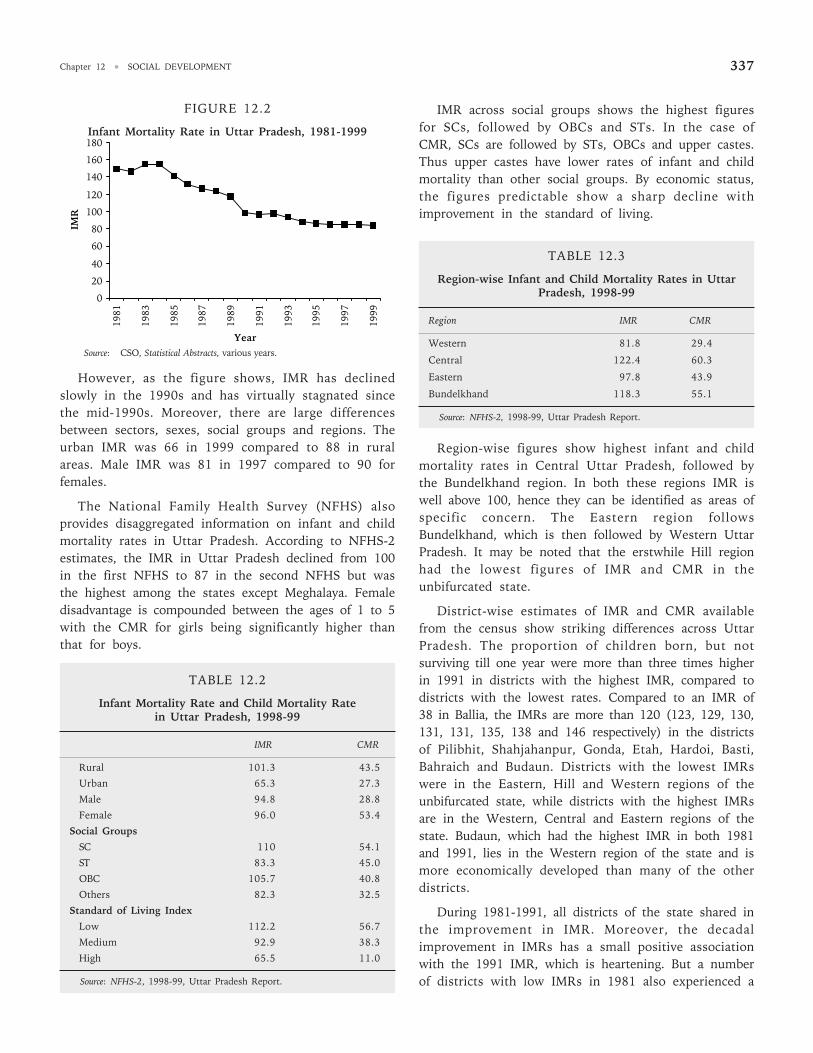
Infant Mortality Rate in Uttar Pradesh, 1981-1999
However, as the figure shows, IMR has declinedslowly in the 1990s and has virtually stagnated sincethe mid-1990s. Moreover, there are large differencesbetween sectors, sexes, social groups and regions. Theurban IMR was 66 in 1999 compared to 88 in ruralareas. Male IMR was 81 in 1997 compared to 90 forfemales.
The National Family Health Survey (NFHS) alsoprovides disaggregated information on infant and childmortality rates in Uttar Pradesh. According to NFHS-2estimates, the IMR in Uttar Pradesh declined from 100in the first NFHS to 87 in the second NFHS but wasthe highest among the states except Meghalaya. Femaledisadvantage is compounded between the ages of 1 to 5with the CMR for girls being significantly higher thanthat for boys.
TABLE 12.2
Infant Mortality Rate and Child Mortality Ratein Uttar Pradesh, 1998-99
IMR CMR
Rural 101.3 43.5
Urban 65.3 27.3
Male 94.8 28.8
Female 96.0 53.4
Social Groups
SC 110 54.1
ST 83.3 45.0
OBC 105.7 40.8
Others 82.3 32.5
Standard of Living Index
Low 112.2 56.7
Medium 92.9 38.3
High 65.5 11.0
Source: NFHS-2, 1998-99, Uttar Pradesh Report.
IMR across social groups shows the highest figuresfor SCs, followed by OBCs and STs. In the case ofCMR, SCs are followed by STs, OBCs and upper castes.Thus upper castes have lower rates of infant and childmortality than other social groups. By economic status,the figures predictable show a sharp decline withimprovement in the standard of living.
TABLE 12.3
Region-wise Infant and Child Mortality Rates in UttarPradesh, 1998-99
Region IMR CMR
Western 81.8 29.4
Central 122.4 60.3
Eastern 97.8 43.9
Bundelkhand 118.3 55.1
Source: NFHS-2, 1998-99, Uttar Pradesh Report.
Region-wise figures show highest infant and childmortality rates in Central Uttar Pradesh, followed bythe Bundelkhand region. In both these regions IMR iswell above 100, hence they can be identified as areas ofspecific concern. The Eastern region followsBundelkhand, which is then followed by Western UttarPradesh. It may be noted that the erstwhile Hill regionhad the lowest figures of IMR and CMR in theunbifurcated state.
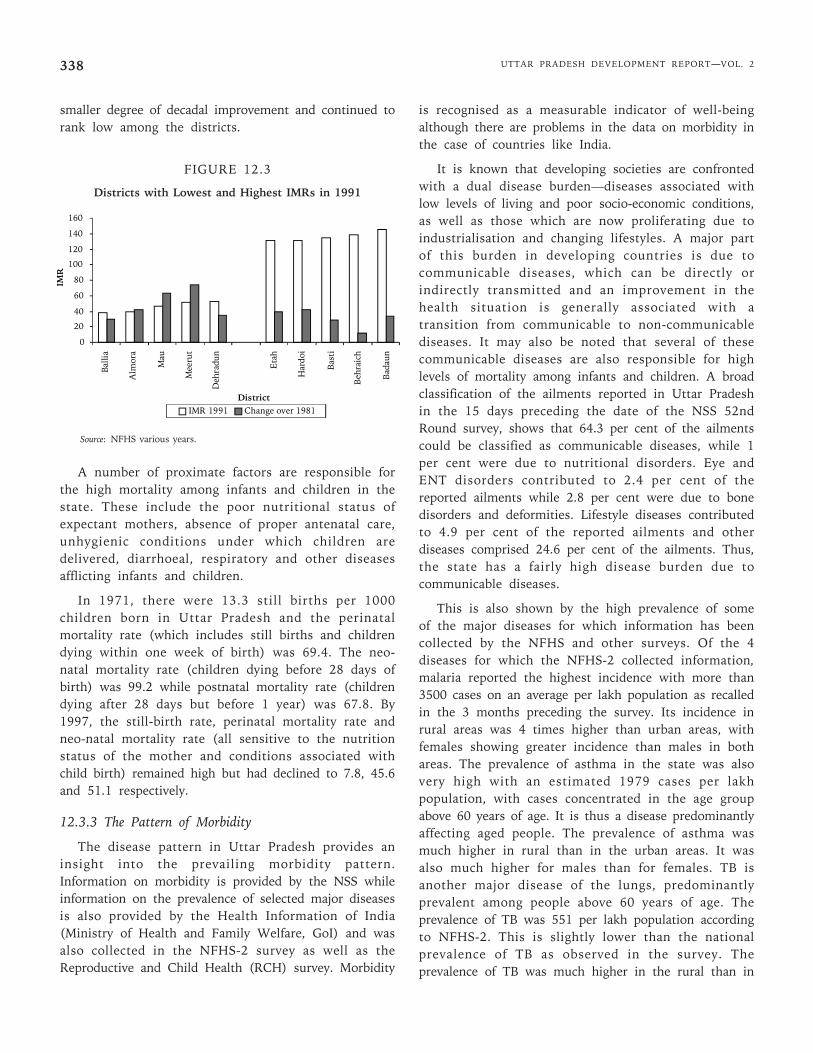
District-wise estimates of IMR and CMR availablefrom the census show striking differences across UttarPradesh. The proportion of children born, but notsurviving till one year were more than three times higherin 1991 in districts with the highest IMR, compared todistricts with the lowest rates. Compared to an IMR of38 in Ballia, the IMRs are more than 120 (123, 129, 130,131, 131, 135, 138 and 146 respectively) in the districtsof Pilibhit, Shahjahanpur, Gonda, Etah, Hardoi, Basti,Bahraich and Budaun. Districts with the lowest IMRswere in the Eastern, Hill and Western regions of theunbifurcated state, while districts with the highest IMRsare in the Western, Central and Eastern regions of thestate. Budaun, which had the highest IMR in both 1981and 1991, lies in the Western region of the state and ismore economically developed than many of the otherdistricts.
During 1981-1991, all districts of the state shared inthe improvement in IMR. Moreover, the decadalimprovement in IMRs has a small positive associationwith the 1991 IMR, which is heartening. But a numberof districts with low IMRs in 1981 also experienced a
0
20
40
60
80
100
120
140
160
180
1981
1983
1985
1987
1989
1991
1993
1995
1997
1999
Year
IMR
Source: CSO, Statistical Abstracts, various years.
UTTAR PRADESH DEVELOPMENT REPORT—VOL. 2338
smaller degree of decadal improvement and continued torank low among the districts.
FIGURE 12.3
Districts with Lowest and Highest IMRs in 1991
Source: NFHS various years.
A number of proximate factors are responsible forthe high mortality among infants and children in thestate. These include the poor nutritional status ofexpectant mothers, absence of proper antenatal care,unhygienic conditions under which children aredelivered, diarrhoeal, respiratory and other diseasesafflicting infants and children.
In 1971, there were 13.3 still births per 1000children born in Uttar Pradesh and the perinatalmortality rate (which includes still births and childrendying within one week of birth) was 69.4. The neo-natal mortality rate (children dying before 28 days ofbirth) was 99.2 while postnatal mortality rate (childrendying after 28 days but before 1 year) was 67.8. By1997, the still-birth rate, perinatal mortality rate andneo-natal mortality rate (all sensitive to the nutritionstatus of the mother and conditions associated withchild birth) remained high but had declined to 7.8, 45.6and 51.1 respectively.
12.3.3 The Pattern of Morbidity
The disease pattern in Uttar Pradesh provides aninsight into the prevailing morbidity pattern.Information on morbidity is provided by the NSS whileinformation on the prevalence of selected major diseasesis also provided by the Health Information of India(Ministry of Health and Family Welfare, GoI) and wasalso collected in the NFHS-2 survey as well as theReproductive and Child Health (RCH) survey. Morbidity
is recognised as a measurable indicator of well-beingalthough there are problems in the data on morbidity inthe case of countries like India.
It is known that developing societies are confrontedwith a dual disease burden—diseases associated withlow levels of living and poor socio-economic conditions,as well as those which are now proliferating due toindustrialisation and changing lifestyles. A major partof this burden in developing countries is due tocommunicable diseases, which can be directly orindirectly transmitted and an improvement in thehealth situation is generally associated with atransition from communicable to non-communicablediseases. It may also be noted that several of thesecommunicable diseases are also responsible for highlevels of mortality among infants and children. A broadclassification of the ailments reported in Uttar Pradeshin the 15 days preceding the date of the NSS 52ndRound survey, shows that 64.3 per cent of the ailmentscould be classified as communicable diseases, while 1per cent were due to nutritional disorders. Eye andENT disorders contributed to 2.4 per cent of thereported ailments while 2.8 per cent were due to bonedisorders and deformities. Lifestyle diseases contributedto 4.9 per cent of the reported ailments and otherdiseases comprised 24.6 per cent of the ailments. Thus,the state has a fairly high disease burden due tocommunicable diseases.
This is also shown by the high prevalence of someof the major diseases for which information has beencollected by the NFHS and other surveys. Of the 4diseases for which the NFHS-2 collected information,malaria reported the highest incidence with more than3500 cases on an average per lakh population as recalledin the 3 months preceding the survey. Its incidence inrural areas was 4 times higher than urban areas, withfemales showing greater incidence than males in bothareas. The prevalence of asthma in the state was alsovery high with an estimated 1979 cases per lakhpopulation, with cases concentrated in the age groupabove 60 years of age. It is thus a disease predominantlyaffecting aged people. The prevalence of asthma wasmuch higher in rural than in the urban areas. It wasalso much higher for males than for females. TB isanother major disease of the lungs, predominantlyprevalent among people above 60 years of age. Theprevalence of TB was 551 per lakh population accordingto NFHS-2. This is slightly lower than the nationalprevalence of TB as observed in the survey. Theprevalence of TB was much higher in the rural than in
0
20
40
60
80
100
120
140
160
IMR 1991 Change over 1981
Balli
a
Alm
ora
Mau
Mee
rut
Deh
radu
n
Eta
h
Har
doi
Bast
i
Beh
raic
h
Bad
aun
IMR
District
Chapter 12 • SOCIAL DEVELOPMENT 339
urban areas. Males reported a greater prevalence of TBthan females. Jaundice is one of the most commoninfectious diseases prevalent in India, caused by poorhygiene and contaminated food and water. Theincidence of jaundice recorded in the 12 monthspreceding the survey was 963 per lakh population andwas higher in urban than in rural areas, which isreverse of the trend observed so far for other diseases.This highlights the problem of poor hygiene and qualityof drinking water in urban areas.
12.3.4 Child Mortality and Immunisation
Data was collected by NFHS-2 on the incidenceand treatment-seeking behaviour of childhooddiseases of Acute Respiratory Infection (ARI), feverand diarrhoea for children below three years of age inthe sample population through a two-week recallperiod. On the whole, rural areas showed higherprevalence of these diseases than the urban areas.Prevalence was slightly lower among girls ascompared to boys.
TABLE 12.4
Proportion of Children Suffering from ARI, Fever andDiarrhoea and Subsequent Treatment Sought,
(2 Weeks Recall), Uttar Pradesh, 1998-99
% Children < 3 Years % Taken to anyof Age Suffering from Health Facility/
Provider
ARI Fever Any Diarrhoea ARI Diarrhoea
Rural 21.5 28.7 24.1 59.7 61.2
Urban 18.9 23.1 19.4 70.2 68.0
Male 22.7 28.9 23.8 64.5 60.6
Female 19.4 26.6 22.8 57.1 63.8
Total 21.1 27.8 23.3 61.3 62.1
Distribution by Regions
Western 17.3 27.4 22.2 75.1 71.8
Central 27.4 31.8 22.8 54.1 58.9
Eastern 23.0 28.0 26.0 53.8 54.9
Bundelkhand 17.5 20.3 17.8 61.9 65.9
Source: NFHS-2, 1998-99, Uttar Pradesh Report.
ARI, which is primarily pneumonia, affected about20 per cent children in the survey, of which 61.3 percent were taken to a health facility/provider fortreatment. Region-wise data shows that prevalence ofARI is highest in Central Uttar Pradesh, followed byEastern, Bundelkhand and Western Uttar Pradeshregions. In terms of treatment sought, the proportion is
highest for Western Uttar Pradesh followed byBundelkhand, Central and Eastern Uttar Pradesh.
Fever had the highest prevalence among the threediseases covered, with 28 per cent children reported tohave suffered from it in the two weeks preceding thesurvey. The regional picture shows highest prevalenceof fever in Central Uttar Pradesh followed by Eastern,Western and Bundelkhand regions.
Diarrhoea is one of the most common and also mosteasily preventable causes of mortality among children inthe world. In Uttar Pradesh diarrhoea recorded 23 percent cases among children below three years of age inthe two weeks preceding the survey. Region-wise datashowed highest prevalence in the Eastern region,followed by Central Uttar Pradesh, Western UttarPradesh and the Bundelkhand region. Among thosesuffering from diarrhoea, 62.1 per cent were taken to ahealth facility for treatment, which is almost the sameas the proportion taken for treatment of ARI. Region-wise pattern of seeking treatment is similar to that ofARI, with maximum proportion being taken to healthfacility in Western Uttar Pradesh, followed byBundelkhand, Central and the Eastern regions. Eightper cent of the children suffering from diarrhoeareceived home treatment of some kind, while 30 percent received no treatment. The proportion was thesame for girls and boys, not indicating anydiscrimination in the treatment between them. Theproportion of untreated cases was higher at 31 per centin the rural areas than in the urban areas where it was24 per cent.
Thus, on the whole, while morbidity was generallyhigher in the Central and Eastern regions, utilisation ofhealth facilities for treatment was highest in theWestern region. Morbidity was lowest in the erstwhileHill region of the state, followed by Bundelkhand.
Immunisation of Children
Data on the immunisation status of children isavailable from various large surveys (NSS, NFHS andRCH). NFHS collected information for 1992-93 and1998-99 on the immunisation status of children agedbetween 12-23 months in the sample population toassess coverage against major diseases in the population.The percentage of children fully immunised increasedslowly from 20 in 1992-93 to 21.2 per cent in 1998-99.At the same time, children not getting any vaccinationdeclined from 43 to 30 per cent. The immunisationstatus of children in 1998-99 is shown in Table 12.5.
UTTAR PRADESH DEVELOPMENT REPORT—VOL. 2340
TABLE 12.5
Immunisation Status of Children, Uttar Pradesh, 1998-99
Type of Vaccine By Residence By Region
Rural Urban Total Western Central Eastern Bundelkhand
BCG 54.3 74.3 57.5 54.1 61.4 59.0 45.7
Polio 1 63.6 81.5 66.5 52.3 61.6 60.6 43.8
Polio 2 56.9 78.5 60.3 41.3 51.5 49.4 32.8
Polio 3 39.1 59.7 42.3 27.8 39.3 37.3 21.0
DPT 1 53.8 75.8 57.3 65.8 66.0 65.9 66.6
DPT 2 42.7 66.7 46.5 59.2 58.9 59.8 42.2
DPT 3 30.9 49.6 33.9 38.7 47.3 42.2 44.7
Measles 31.7 50.0 34.6 31.8 35.5 36.6 23.8
All 19.2 32.3 21.2 14.5 27.5 24.9 10.0
Source: NFHS-2, 1998-99, Uttar Pradesh Report.
The proportion of fully vaccinated children is higherin the urban than in the rural areas. Immunisationagainst TB (BCG) was highest at 57.5 per cent,followed by polio (42.3%), measles (34.6%) and DPT(33.9%). In the case of both polio and DPT,immunisation is fairly high for the first dose butsubsequently drops sharply till the final dose. Thusonly a small proportion of the population completes thefull course of vaccination. Only 16 per cent of thechildren were fully vaccinated by the age of 12 months,which means that a fourth of the fully vaccinatedchildren did not receive their vaccination within thegiven time frame of 12 months from birth. Femalechildren with 19 per cent full immunisation receivedlower priority in vaccination as compared to malechildren (24%).
The pattern across regions shows the highestvaccination coverage in the erstwhile Hill regionfollowed by the Central, Eastern, Western andBundelkhand regions. Western and Bundelkhandregions show an extremely low proportion of completedvaccinations–14.5 and 10 per cent respectively.
Vitamin A supplementation is a part of the NationalProgramme for the Prevention of Blindness and isprovided in the form of oral dose every 6 monthsstarting at the age of 9 months till the age of 35months. The NFHS-2 survey found that only 14 percent of the eligible children had received Vitamin Asupplementation in Uttar Pradesh. The proportion washigher in urban than in the rural areas. It was alsohigher for males than for females. By regions, it wasseen that the former hill region showed the highestproportion of children covered (21.3%), followed byBundelkhand (15.1%), Western region (12.4%) and
lastly Central and Eastern regions with six per centeach.
12.3.5 Nutrition Status of Women and Children
The nutritional status of women and children is animportant indicator of their health and their capabilityto resist diseases. A good nutritional status impliesreduced mortality and health risk during pregnancy incase of women, and proper physical and mentaldevelopment in case of children. The survey measuredthe height and weight as well as haemoglobin levels ofthe sample women and children to assess theirnutritional status.
Nutritional Status of Women
The indicator used in this section to assess thenutritional status of women is the Body Mass Index orBMI which is the ratio of the weight of a person to thesquare of her height. BMI is an effective and widelyused indicator of nutritional status. A BMI below 18.5kg/m2 indicates chronic energy deficiency (CED), causedby a highly deficient diet.
TABLE 12.6
Nutritional Status in Terms of BMI of Womenin Uttar Pradesh, 1998-99
Categories Mean BMI of % Women withWomen (kg/m2) BMI < 18.5
Rural 19.5 39.1
Urban 21.8 23.3
Regions
Western 20.5 31.1
Central 19.8 40.1
Eastern 19.7 37.5
Bundelkhand 19.4 43.1
Source: NFHS-2, 1998-99, Uttar Pradesh Report.
In Uttar Pradesh about 36 per cent women sufferfrom CED, more so in rural than in urban areas. Onthe whole, nutritional status of rural women is poorerthan urban women. In terms of social groups, uppercaste women have the highest BMI of 20.6 while allother social groups of SC, ST and OBC have BMIranging between 19-20 kg/m2. BMI shows an increasingtrend with increasing economic status of householdsand with increasing education levels of women.
The regional picture shows nutritional status to behighest in the Western region, while in the other threeregions it is lower, ranging between 19-20 kg/m2. Theproportion of women with BMI below 18.5 also shows
Chapter 12 • SOCIAL DEVELOPMENT 341
the same pattern with the lowest proportion in theWestern region, followed by the Eastern region. In theCentral and Bundelkhand regions the proportion is wellabove 40 per cent, indicating a very high prevalence ofCED in these regions.
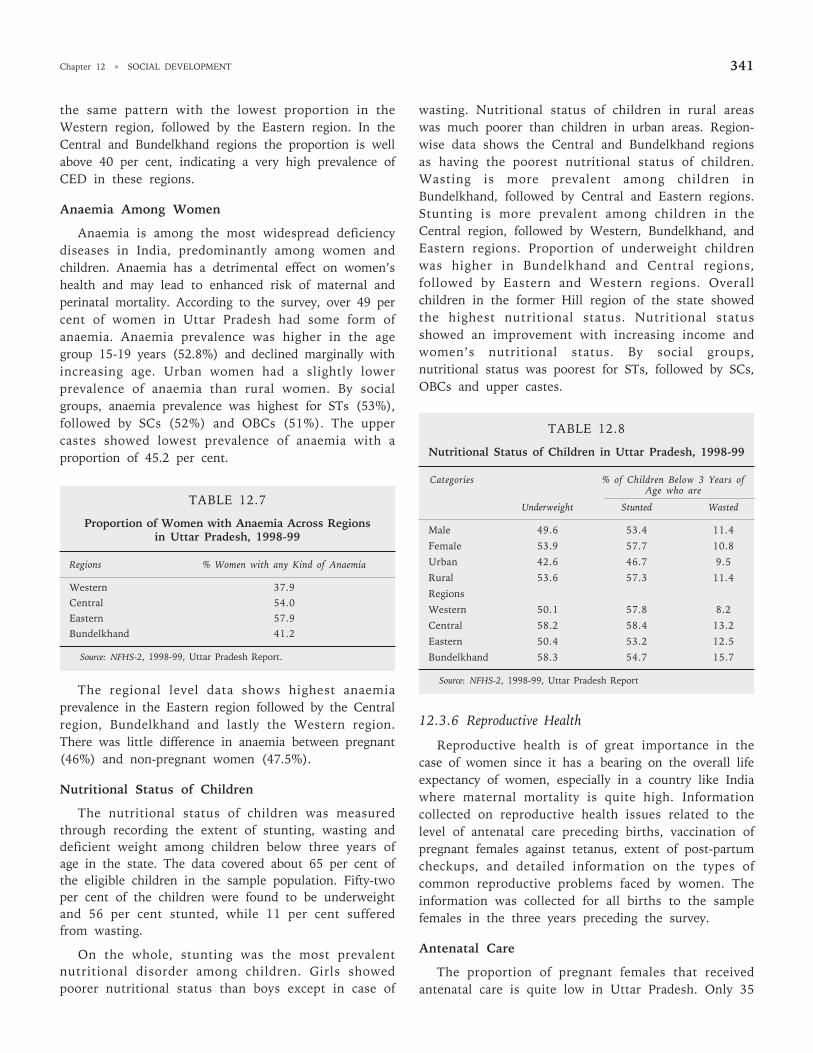
Anaemia Among Women
Anaemia is among the most widespread deficiencydiseases in India, predominantly among women andchildren. Anaemia has a detrimental effect on women’shealth and may lead to enhanced risk of maternal andperinatal mortality. According to the survey, over 49 percent of women in Uttar Pradesh had some form ofanaemia. Anaemia prevalence was higher in the agegroup 15-19 years (52.8%) and declined marginally withincreasing age. Urban women had a slightly lowerprevalence of anaemia than rural women. By socialgroups, anaemia prevalence was highest for STs (53%),followed by SCs (52%) and OBCs (51%). The uppercastes showed lowest prevalence of anaemia with aproportion of 45.2 per cent.
TABLE 12.7
Proportion of Women with Anaemia Across Regionsin Uttar Pradesh, 1998-99
Regions % Women with any Kind of Anaemia
Western 37.9Central 54.0Eastern 57.9Bundelkhand 41.2
Source: NFHS-2, 1998-99, Uttar Pradesh Report.
The regional level data shows highest anaemiaprevalence in the Eastern region followed by the Centralregion, Bundelkhand and lastly the Western region.There was little difference in anaemia between pregnant(46%) and non-pregnant women (47.5%).
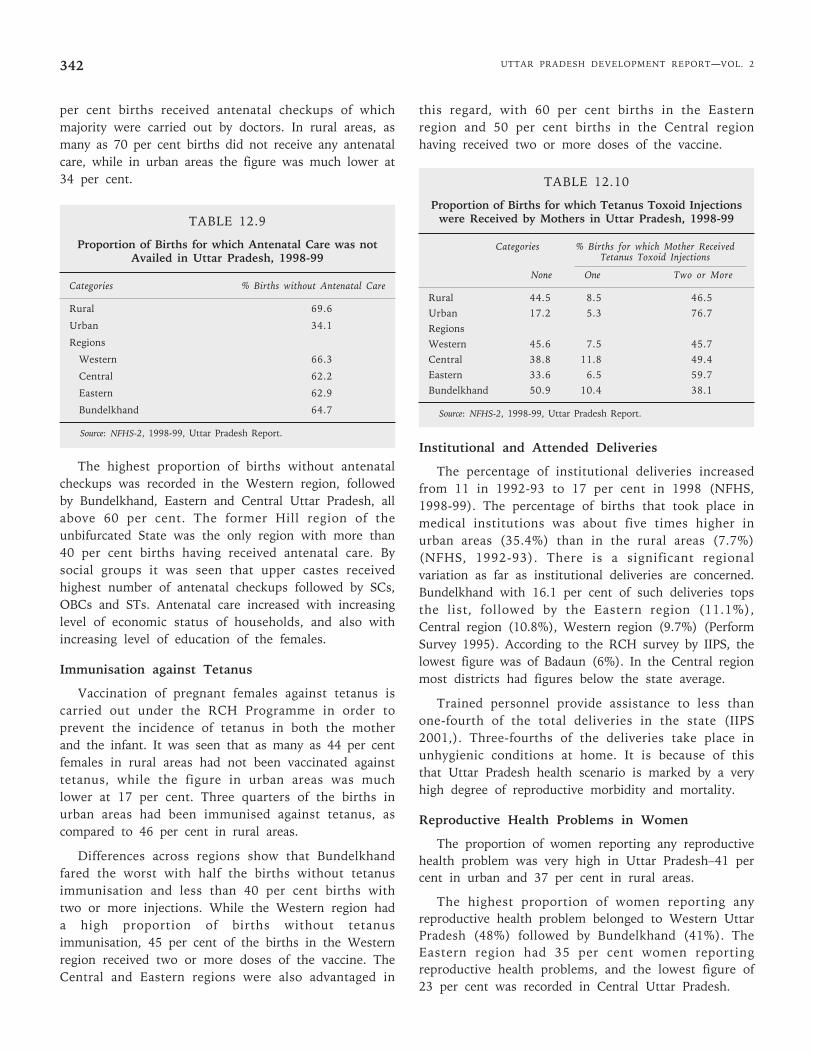
Nutritional Status of Children
The nutritional status of children was measuredthrough recording the extent of stunting, wasting anddeficient weight among children below three years ofage in the state. The data covered about 65 per cent ofthe eligible children in the sample population. Fifty-twoper cent of the children were found to be underweightand 56 per cent stunted, while 11 per cent sufferedfrom wasting.
On the whole, stunting was the most prevalentnutritional disorder among children. Girls showedpoorer nutritional status than boys except in case of
wasting. Nutritional status of children in rural areaswas much poorer than children in urban areas. Region-wise data shows the Central and Bundelkhand regionsas having the poorest nutritional status of children.Wasting is more prevalent among children inBundelkhand, followed by Central and Eastern regions.Stunting is more prevalent among children in theCentral region, followed by Western, Bundelkhand, andEastern regions. Proportion of underweight childrenwas higher in Bundelkhand and Central regions,followed by Eastern and Western regions. Overallchildren in the former Hill region of the state showedthe highest nutritional status. Nutritional statusshowed an improvement with increasing income andwomen’s nutritional status. By social groups,nutritional status was poorest for STs, followed by SCs,OBCs and upper castes.
TABLE 12.8
Nutritional Status of Children in Uttar Pradesh, 1998-99
Categories % of Children Below 3 Years ofAge who are
Underweight Stunted Wasted
Male 49.6 53.4 11.4
Female 53.9 57.7 10.8
Urban 42.6 46.7 9.5
Rural 53.6 57.3 11.4
Regions
Western 50.1 57.8 8.2
Central 58.2 58.4 13.2
Eastern 50.4 53.2 12.5
Bundelkhand 58.3 54.7 15.7
Source: NFHS-2, 1998-99, Uttar Pradesh Report
12.3.6 Reproductive Health
Reproductive health is of great importance in thecase of women since it has a bearing on the overall lifeexpectancy of women, especially in a country like Indiawhere maternal mortality is quite high. Informationcollected on reproductive health issues related to thelevel of antenatal care preceding births, vaccination ofpregnant females against tetanus, extent of post-partumcheckups, and detailed information on the types ofcommon reproductive problems faced by women. Theinformation was collected for all births to the samplefemales in the three years preceding the survey.
Antenatal Care
The proportion of pregnant females that receivedantenatal care is quite low in Uttar Pradesh. Only 35
UTTAR PRADESH DEVELOPMENT REPORT—VOL. 2342
per cent births received antenatal checkups of whichmajority were carried out by doctors. In rural areas, asmany as 70 per cent births did not receive any antenatalcare, while in urban areas the figure was much lower at34 per cent.
TABLE 12.9
Proportion of Births for which Antenatal Care was notAvailed in Uttar Pradesh, 1998-99
Categories % Births without Antenatal Care
Rural 69.6
Urban 34.1
Regions
Western 66.3
Central 62.2
Eastern 62.9
Bundelkhand 64.7
Source: NFHS-2, 1998-99, Uttar Pradesh Report.
The highest proportion of births without antenatalcheckups was recorded in the Western region, followedby Bundelkhand, Eastern and Central Uttar Pradesh, allabove 60 per cent. The former Hill region of theunbifurcated State was the only region with more than40 per cent births having received antenatal care. Bysocial groups it was seen that upper castes receivedhighest number of antenatal checkups followed by SCs,OBCs and STs. Antenatal care increased with increasinglevel of economic status of households, and also withincreasing level of education of the females.
Immunisation against Tetanus
Vaccination of pregnant females against tetanus iscarried out under the RCH Programme in order toprevent the incidence of tetanus in both the motherand the infant. It was seen that as many as 44 per centfemales in rural areas had not been vaccinated againsttetanus, while the figure in urban areas was muchlower at 17 per cent. Three quarters of the births inurban areas had been immunised against tetanus, ascompared to 46 per cent in rural areas.
Differences across regions show that Bundelkhandfared the worst with half the births without tetanusimmunisation and less than 40 per cent births withtwo or more injections. While the Western region hada high proportion of births without tetanusimmunisation, 45 per cent of the births in the Westernregion received two or more doses of the vaccine. TheCentral and Eastern regions were also advantaged in
this regard, with 60 per cent births in the Easternregion and 50 per cent births in the Central regionhaving received two or more doses of the vaccine.
TABLE 12.10
Proportion of Births for which Tetanus Toxoid Injectionswere Received by Mothers in Uttar Pradesh, 1998-99
Categories % Births for which Mother ReceivedTetanus Toxoid Injections
None One Two or More
Rural 44.5 8.5 46.5Urban 17.2 5.3 76.7RegionsWestern 45.6 7.5 45.7Central 38.8 11.8 49.4Eastern 33.6 6.5 59.7Bundelkhand 50.9 10.4 38.1
Source: NFHS-2, 1998-99, Uttar Pradesh Report.
Institutional and Attended Deliveries
The percentage of institutional deliveries increasedfrom 11 in 1992-93 to 17 per cent in 1998 (NFHS,1998-99). The percentage of births that took place inmedical institutions was about five times higher inurban areas (35.4%) than in the rural areas (7.7%)(NFHS, 1992-93). There is a significant regionalvariation as far as institutional deliveries are concerned.Bundelkhand with 16.1 per cent of such deliveries topsthe list, followed by the Eastern region (11.1%),Central region (10.8%), Western region (9.7%) (PerformSurvey 1995). According to the RCH survey by IIPS, thelowest figure was of Badaun (6%). In the Central regionmost districts had figures below the state average.
Trained personnel provide assistance to less thanone-fourth of the total deliveries in the state (IIPS2001,). Three-fourths of the deliveries take place inunhygienic conditions at home. It is because of thisthat Uttar Pradesh health scenario is marked by a veryhigh degree of reproductive morbidity and mortality.
Reproductive Health Problems in Women
The proportion of women reporting any reproductivehealth problem was very high in Uttar Pradesh–41 percent in urban and 37 per cent in rural areas.
The highest proportion of women reporting anyreproductive health problem belonged to Western UttarPradesh (48%) followed by Bundelkhand (41%). TheEastern region had 35 per cent women reportingreproductive health problems, and the lowest figure of23 per cent was recorded in Central Uttar Pradesh.
Chapter 12 • SOCIAL DEVELOPMENT 343
TABLE 12.11
Proportion of Women Reporting any Reproductive HealthProblem in Uttar Pradesh, 1998-99
Categories % Women with any Reproductive Health Problem
Rural 37.4
Urban 40.8
Regions
Western 47.8
Central 23.2
Eastern 34.7
Bundelkhand 41.0
Source: NFHS-2, 1998-99, Uttar Pradesh.
12.3.7 Provision of Health Infrastructure:Public and Private
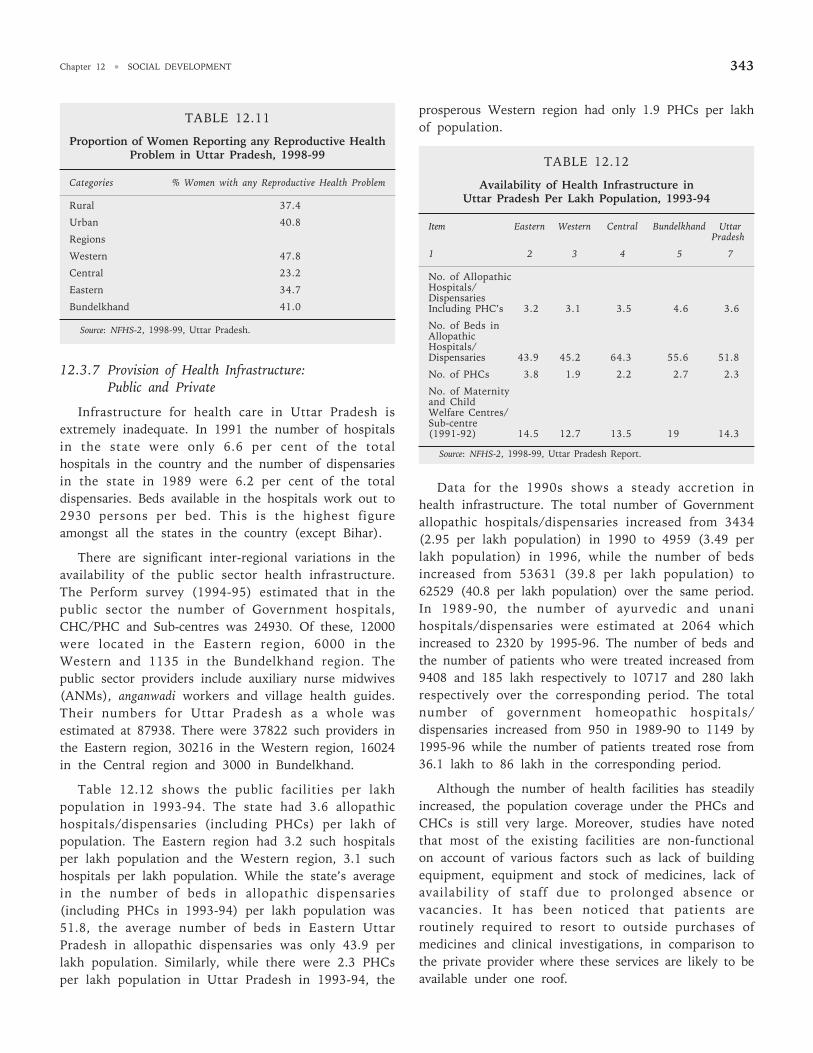
Infrastructure for health care in Uttar Pradesh isextremely inadequate. In 1991 the number of hospitalsin the state were only 6.6 per cent of the totalhospitals in the country and the number of dispensariesin the state in 1989 were 6.2 per cent of the totaldispensaries. Beds available in the hospitals work out to2930 persons per bed. This is the highest figureamongst all the states in the country (except Bihar).
There are significant inter-regional variations in theavailability of the public sector health infrastructure.The Perform survey (1994-95) estimated that in thepublic sector the number of Government hospitals,CHC/PHC and Sub-centres was 24930. Of these, 12000were located in the Eastern region, 6000 in theWestern and 1135 in the Bundelkhand region. Thepublic sector providers include auxiliary nurse midwives(ANMs), anganwadi workers and village health guides.Their numbers for Uttar Pradesh as a whole wasestimated at 87938. There were 37822 such providers inthe Eastern region, 30216 in the Western region, 16024in the Central region and 3000 in Bundelkhand.
Table 12.12 shows the public facilities per lakhpopulation in 1993-94. The state had 3.6 allopathichospitals/dispensaries (including PHCs) per lakh ofpopulation. The Eastern region had 3.2 such hospitalsper lakh population and the Western region, 3.1 suchhospitals per lakh population. While the state’s averagein the number of beds in allopathic dispensaries(including PHCs in 1993-94) per lakh population was51.8, the average number of beds in Eastern UttarPradesh in allopathic dispensaries was only 43.9 perlakh population. Similarly, while there were 2.3 PHCsper lakh population in Uttar Pradesh in 1993-94, the
prosperous Western region had only 1.9 PHCs per lakhof population.
TABLE 12.12
Availability of Health Infrastructure inUttar Pradesh Per Lakh Population, 1993-94
Item Eastern Western Central Bundelkhand UttarPradesh
1 2 3 4 5 7
No. of AllopathicHospitals/DispensariesIncluding PHC’s 3.2 3.1 3.5 4.6 3.6
No. of Beds inAllopathicHospitals/Dispensaries 43.9 45.2 64.3 55.6 51.8
No. of PHCs 3.8 1.9 2.2 2.7 2.3
No. of Maternityand ChildWelfare Centres/Sub-centre(1991-92) 14.5 12.7 13.5 19 14.3
Data for the 1990s shows a steady accretion inhealth infrastructure. The total number of Governmentallopathic hospitals/dispensaries increased from 3434(2.95 per lakh population) in 1990 to 4959 (3.49 perlakh population) in 1996, while the number of bedsincreased from 53631 (39.8 per lakh population) to62529 (40.8 per lakh population) over the same period.In 1989-90, the number of ayurvedic and unanihospitals/dispensaries were estimated at 2064 whichincreased to 2320 by 1995-96. The number of beds andthe number of patients who were treated increased from9408 and 185 lakh respectively to 10717 and 280 lakhrespectively over the corresponding period. The totalnumber of government homeopathic hospitals/dispensaries increased from 950 in 1989-90 to 1149 by1995-96 while the number of patients treated rose from36.1 lakh to 86 lakh in the corresponding period.
Although the number of health facilities has steadilyincreased, the population coverage under the PHCs andCHCs is still very large. Moreover, studies have notedthat most of the existing facilities are non-functionalon account of various factors such as lack of buildingequipment, equipment and stock of medicines, lack ofavailability of staff due to prolonged absence orvacancies. It has been noticed that patients areroutinely required to resort to outside purchases ofmedicines and clinical investigations, in comparison tothe private provider where these services are likely to beavailable under one roof.
Source: NFHS-2, 1998-99, Uttar Pradesh Report.
UTTAR PRADESH DEVELOPMENT REPORT—VOL. 2344
Staff shortage is a major weakness of the health caresystem. Of 3,787 sanctioned positions for medicalofficers in Uttar Pradesh primary health centres, 1524were found to be vacant in 1997. The ANMs, the mostsignificant extension health workers, are seriously over-burdened and lack promised back up and support. OneANM subcentre is sanctioned for every 6200population. However, 1016 ANM vacancies wererecorded in 1997. According to a World Bank report itis found that there have been no new ANM postingsagainst vacancies in a number of areas during thelast 8 years. Interestingly, while there are more than1000 ANM vacancies in the state, there are around7000 women trained as ANM who are waiting forassignments. As a consequence of these staffshortages, most ANMs in the district are forced tocover a population larger than what is defined bygovernment norms. A major problem of the health caresystem is the shortage of competent staff in rurallocations and the consequent overstaffing of selectedurban locations.
It is obvious from the above discussion that amassive public sector health set up exists in the state.The government provides services to the ruralcommunity through fixed site dispensaries, sub-centresand PHCs, etc. Outreach services to children andpregnant women are provided by ANMs. The services tothe poor at all the facilities are provided free, though anominal user fee has been introduced for the non-poorat the CHC level and above. It is, however, surprisingthat these services remain costly and bypass the bulk ofthe state’s population. A number of studies/surveysreveal that health consumers are dissatisfied with thefinancial burden of care, the lack of cleanliness infacilities and behaviour and attitude of the staff.2
As far as the MCH services are concerned a numberof studies suggest that the outreach services areactually out of reach of the needy mothers and children.A baseline survey of Uttar Pradesh (1993) suggests thatless than 16 per cent of the households were actuallyvisited by a PHC/SC worker during the three monthperiod before the survey with the picture virtuallyunchanged between 1993 and 1998 (Mohan, 2001).Both inter-temporal and inter-spatial analysis alsosuggests that the ANMs in particular are able to visit avery limited proportion of the households allocated tothem. It appears that the major reasons for this gap arethe lack of local accountability structures as well as the
unrealistic workload, which the ANMs are subjected to(Mohan, 2001).
This, it is apparent that the public health systemsuffers severely from the problem of access and qualityof services delivered.
The Private Sector
A large network of private providers exists alongwith the public sector providers. The total number ofregistered and unregistered private sector doctors isestimated to be around 1.5 lakh. Trained and untraineddais are estimated at around 1.1 lakh while commercialoutlets, including medical shops, pharmacies, etc.number about seven lakh (Mohan, 2001). Unlike thedistribution of public sector providers, the highestconcentration of the private providers is in the Westernregion. The distribution of health providersunderstandably has a strong bearing on the health carein Uttar Pradesh. Regions with a lower concentrationof medical providers (in proportion to population) havelower maternal and child health care coefficient andhigher unmet need for family planning services.
The total number of registered allopathic doctorswas 23730 and 18400 were in the private sector. A largenumber of doctors in the state actually belong to thehomeopathic and ayurveda/unani traditions. Lucknow,with 3993 allopathic doctors, has the highest numberof doctors in the entire state. A large number of thesedoctors (3735) are actually in the private sectors(Mohan, 2001). Sonbhadra with only eight allopathicdoctors is at the bottom of the list. The Western regionhas the highest concentration of allopathic doctorswith 8264 registered medical providers, while theEastern region which houses a slightly largerproportion of Uttar Pradesh population has only 6022allopathic medical providers. The Central region has7420 allopathic doctors and the Bundelkhand region isthe least well served by registered medical providers.Records of the relevant agencies suggest that almosttwo-thirds of the registered medical providers in UttarPradesh are non-allopathic medical providers.
A number of studies show (see section 12.3.10below) that while there is a heavy dependence on thepublic sector for the provision of family welfare services,a very small proportion of the population depends uponpublic health services in case of normal ailments, andhere too, the services are mainly provided by untrained
2. Baseline survey for Uttar Pradesh Health Systems Development Project, (STEM, 2000). The findings are supported by other surveys and studies and thedistrict level health assessment of World Bank.
Chapter 12 • SOCIAL DEVELOPMENT 345
practitioners. This implies that solutions to theproblem of health care access will require bold andinnovative solutions, based on the existing strengths ofboth the public and private sectors.
12.3.8 Trends in Public Expenditure on Health
Health care in India is a joint responsibility of thecentral as well as state governments although the stateis responsible for the bulk of this expenditure. Publicexpenditure on medical, public health and familywelfare, as detailed in the state budget documents, hasbeen analysed here to gain an understanding of thetemporal trends in public expenditure on health care inUttar Pradesh.
Interstate Pattern in Expenditureon Health and Family Welfare
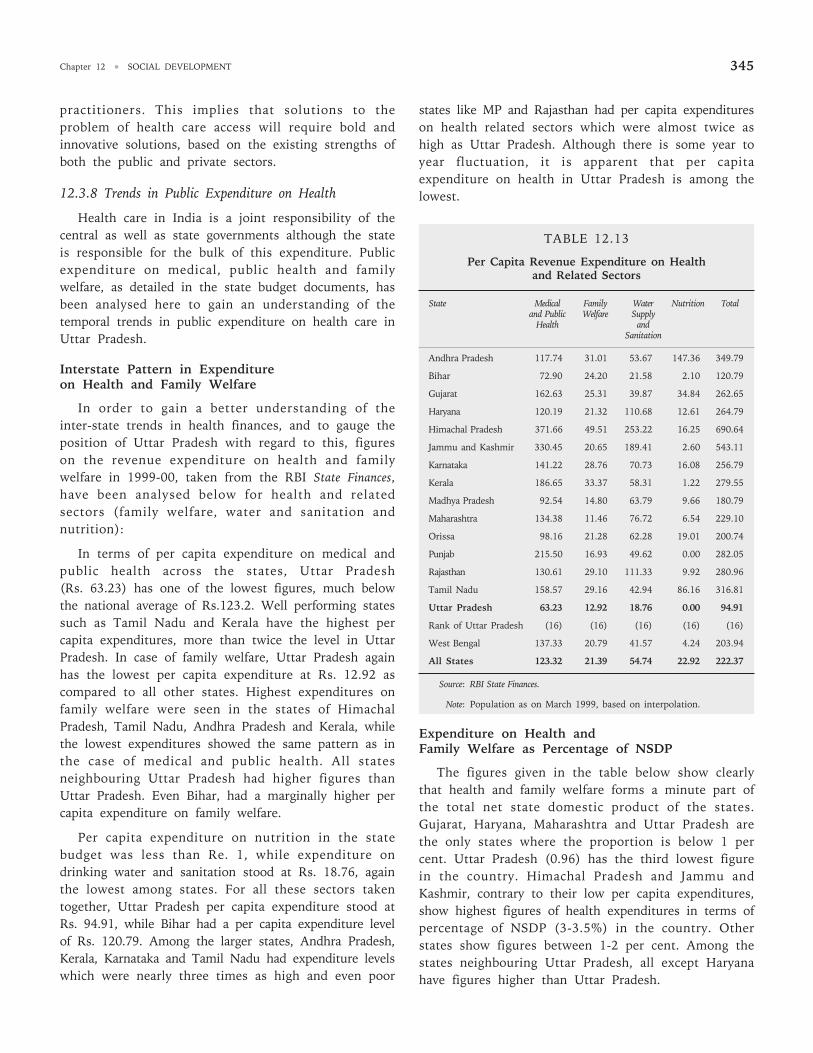
In order to gain a better understanding of theinter-state trends in health finances, and to gauge theposition of Uttar Pradesh with regard to this, figureson the revenue expenditure on health and familywelfare in 1999-00, taken from the RBI State Finances,have been analysed below for health and relatedsectors (family welfare, water and sanitation andnutrition):
In terms of per capita expenditure on medical andpublic health across the states, Uttar Pradesh(Rs. 63.23) has one of the lowest figures, much belowthe national average of Rs.123.2. Well performing statessuch as Tamil Nadu and Kerala have the highest percapita expenditures, more than twice the level in UttarPradesh. In case of family welfare, Uttar Pradesh againhas the lowest per capita expenditure at Rs. 12.92 ascompared to all other states. Highest expenditures onfamily welfare were seen in the states of HimachalPradesh, Tamil Nadu, Andhra Pradesh and Kerala, whilethe lowest expenditures showed the same pattern as inthe case of medical and public health. All statesneighbouring Uttar Pradesh had higher figures thanUttar Pradesh. Even Bihar, had a marginally higher percapita expenditure on family welfare.
Per capita expenditure on nutrition in the statebudget was less than Re. 1, while expenditure ondrinking water and sanitation stood at Rs. 18.76, againthe lowest among states. For all these sectors takentogether, Uttar Pradesh per capita expenditure stood atRs. 94.91, while Bihar had a per capita expenditure levelof Rs. 120.79. Among the larger states, Andhra Pradesh,Kerala, Karnataka and Tamil Nadu had expenditure levelswhich were nearly three times as high and even poor
states like MP and Rajasthan had per capita expenditureson health related sectors which were almost twice ashigh as Uttar Pradesh. Although there is some year toyear fluctuation, it is apparent that per capitaexpenditure on health in Uttar Pradesh is among thelowest.
TABLE 12.13
Per Capita Revenue Expenditure on Healthand Related Sectors
State Medical Family Water Nutrition Totaland Public Welfare Supply
Health andSanitation
Andhra Pradesh 117.74 31.01 53.67 147.36 349.79
Bihar 72.90 24.20 21.58 2.10 120.79
Gujarat 162.63 25.31 39.87 34.84 262.65
Haryana 120.19 21.32 110.68 12.61 264.79
Himachal Pradesh 371.66 49.51 253.22 16.25 690.64
Jammu and Kashmir 330.45 20.65 189.41 2.60 543.11
Karnataka 141.22 28.76 70.73 16.08 256.79
Kerala 186.65 33.37 58.31 1.22 279.55
Madhya Pradesh 92.54 14.80 63.79 9.66 180.79
Maharashtra 134.38 11.46 76.72 6.54 229.10
Orissa 98.16 21.28 62.28 19.01 200.74
Punjab 215.50 16.93 49.62 0.00 282.05
Rajasthan 130.61 29.10 111.33 9.92 280.96
Tamil Nadu 158.57 29.16 42.94 86.16 316.81
Uttar Pradesh 63.23 12.92 18.76 0.00 94.91
Rank of Uttar Pradesh (16) (16) (16) (16) (16)
West Bengal 137.33 20.79 41.57 4.24 203.94
All States 123.32 21.39 54.74 22.92 222.37
Source: RBI State Finances.
Note: Population as on March 1999, based on interpolation.
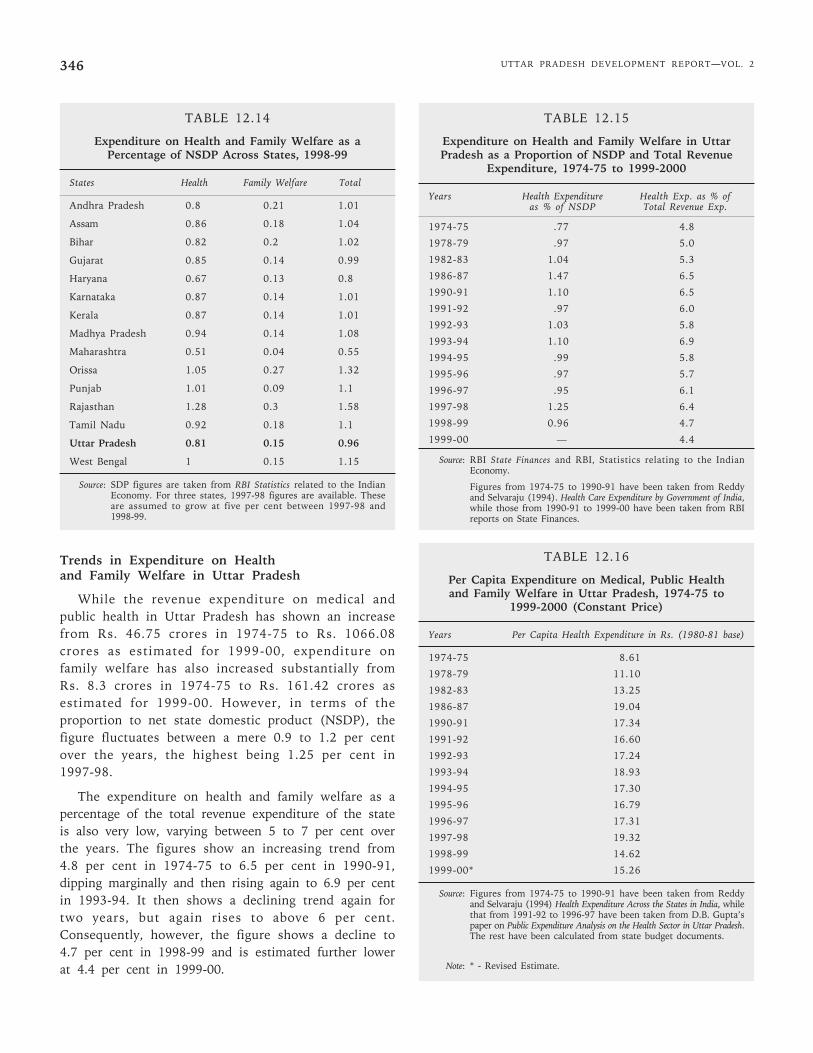
Expenditure on Health andFamily Welfare as Percentage of NSDP
The figures given in the table below show clearlythat health and family welfare forms a minute part ofthe total net state domestic product of the states.Gujarat, Haryana, Maharashtra and Uttar Pradesh arethe only states where the proportion is below 1 percent. Uttar Pradesh (0.96) has the third lowest figurein the country. Himachal Pradesh and Jammu andKashmir, contrary to their low per capita expenditures,show highest figures of health expenditures in terms ofpercentage of NSDP (3-3.5%) in the country. Otherstates show figures between 1-2 per cent. Among thestates neighbouring Uttar Pradesh, all except Haryanahave figures higher than Uttar Pradesh.
UTTAR PRADESH DEVELOPMENT REPORT—VOL. 2346
TABLE 12.14
Expenditure on Health and Family Welfare as aPercentage of NSDP Across States, 1998-99
States Health Family Welfare Total
Andhra Pradesh 0.8 0.21 1.01
Assam 0.86 0.18 1.04
Bihar 0.82 0.2 1.02
Gujarat 0.85 0.14 0.99
Haryana 0.67 0.13 0.8
Karnataka 0.87 0.14 1.01
Kerala 0.87 0.14 1.01
Madhya Pradesh 0.94 0.14 1.08
Maharashtra 0.51 0.04 0.55
Orissa 1.05 0.27 1.32
Punjab 1.01 0.09 1.1
Rajasthan 1.28 0.3 1.58
Tamil Nadu 0.92 0.18 1.1
Uttar Pradesh 0.81 0.15 0.96
West Bengal 1 0.15 1.15
Source: SDP figures are taken from RBI Statistics related to the IndianEconomy. For three states, 1997-98 figures are available. Theseare assumed to grow at five per cent between 1997-98 and1998-99.
Trends in Expenditure on Healthand Family Welfare in Uttar Pradesh
While the revenue expenditure on medical andpublic health in Uttar Pradesh has shown an increasefrom Rs. 46.75 crores in 1974-75 to Rs. 1066.08crores as estimated for 1999-00, expenditure onfamily welfare has also increased substantially fromRs. 8.3 crores in 1974-75 to Rs. 161.42 crores asestimated for 1999-00. However, in terms of theproportion to net state domestic product (NSDP), thefigure fluctuates between a mere 0.9 to 1.2 per centover the years, the highest being 1.25 per cent in1997-98.
The expenditure on health and family welfare as apercentage of the total revenue expenditure of the stateis also very low, varying between 5 to 7 per cent overthe years. The figures show an increasing trend from4.8 per cent in 1974-75 to 6.5 per cent in 1990-91,dipping marginally and then rising again to 6.9 per centin 1993-94. It then shows a declining trend again fortwo years, but again rises to above 6 per cent.Consequently, however, the figure shows a decline to4.7 per cent in 1998-99 and is estimated further lowerat 4.4 per cent in 1999-00.
TABLE 12.15
Expenditure on Health and Family Welfare in UttarPradesh as a Proportion of NSDP and Total Revenue
Expenditure, 1974-75 to 1999-2000
Years Health Expenditure Health Exp. as % ofas % of NSDP Total Revenue Exp.
1974-75 .77 4.8
1978-79 .97 5.0
1982-83 1.04 5.3
1986-87 1.47 6.5
1990-91 1.10 6.5
1991-92 .97 6.0
1992-93 1.03 5.8
1993-94 1.10 6.9
1994-95 .99 5.8
1995-96 .97 5.7
1996-97 .95 6.1
1997-98 1.25 6.4
1998-99 0.96 4.7
1999-00 .— 4.4
Source: RBI State Finances and RBI, Statistics relating to the IndianEconomy.
Figures from 1974-75 to 1990-91 have been taken from Reddyand Selvaraju (1994). Health Care Expenditure by Government of India,while those from 1990-91 to 1999-00 have been taken from RBIreports on State Finances.
TABLE 12.16
Per Capita Expenditure on Medical, Public Healthand Family Welfare in Uttar Pradesh, 1974-75 to
1999-2000 (Constant Price)
Years Per Capita Health Expenditure in Rs. (1980-81 base)
1974-75 8.61
1978-79 11.10
1982-83 13.25
1986-87 19.04
1990-91 17.34
1991-92 16.60
1992-93 17.24
1993-94 18.93
1994-95 17.30
1995-96 16.79
1996-97 17.31
1997-98 19.32
1998-99 14.62
1999-00* 15.26
Source: Figures from 1974-75 to 1990-91 have been taken from Reddyand Selvaraju (1994) Health Expenditure Across the States in India, whilethat from 1991-92 to 1996-97 have been taken from D.B. Gupta’spaper on Public Expenditure Analysis on the Health Sector in Uttar Pradesh.The rest have been calculated from state budget documents.
Note: * - Revised Estimate.
Chapter 12 • SOCIAL DEVELOPMENT 347
Trends in Real Per Capita Expenditureon Health and Family Welfare
The per capita expenditure on health and familywelfare in Uttar Pradesh (at constant 1980-81 prices)had almost doubled on an average from Rs.8.61 in1974-75 to Rs.14.62 in 1998-99 and Rs.15.26 asindicated by the Revised Estimate (RE) of 1999-00. Thedata shows an increasing trend with 3 distinct peaks in1986-87, 1993-94 and 1997-98 when the figure reachedRs.19 per capita. As shown earlier, the stategovernment health expenditure, however, is one of thelowest in the country, well below the average healthexpenditure of all the state governments put together.
Public Expenditure on Health andFamily Welfare by Functional Categories
Analysing the public expenditure on health andfamily welfare by functional categories, it is seen thatwhile non-plan expenditure forms bulk of theexpenditure in medical and public health, it is vice versain the case of family welfare, with negligible non-planexpenditure over the years.
TABLE 12.17
Government Expenditure on Health and Family Welfareby Functional Categories in Uttar Pradesh, 1974-75 to
1999-2000 (Rs. Lakh)
Years Medical and Public Health Family Welfare
Plan Non Plan Total Plan Non Plan Total
1974-75 1149.6 3525.4 4675.0 833.4 0.0 833.4
1978-79 2223.9 5958.3 8182.2 1332.2 0.0 1332.2
1982-83 2378.4 10823.6 13202.0 5250.9 0.0 5250.9
1986-87 14102.2 16140.1 30242.3 10001.1 0.0 10001.1
1990-91 12916.2 34686.6 47602.8 8991.8 41.3 9033.1
1991-92 7662.8 38717.0 46390.0 16450.0 0.2 16450.2
1992-93 9800.5 47719.0 57520.0 1530.0 0.8 15300.8
1993-94 8372.2 53534.0 61910.0 25590.0 1.3 25591.3
1994-95 9050.1 53251.0 62300.0 27220.0 9.6 27229.6
1995-96 9532.9 65444.0 74970.0 22420.0 0.0 22420.0
1996-97 11561.0 70660.0 82220.0 29300.0 4.1 29304.1
1997-98 36162.9 105372.4 141535.3 32229.2 0.0 32229.2
1998-99 1867.0 99933.0 101799.0 22071.1 2.2 22073.3
1999-00 4377.0 101088.0 105465.0 21555.0 0.0 21555.0
Source: Figures from 1974-75 to 1990-91 have been taken from Reddyand Selvaraju (1994). Health Expenditure by Government of India, whilethat from 1991-92 to 1996-97 have been taken from D.B. Gupta’spaper on Public Expenditure Analysis on the Health Sector inUttar Pradesh. The rest have been calculated from state budgetdocuments.
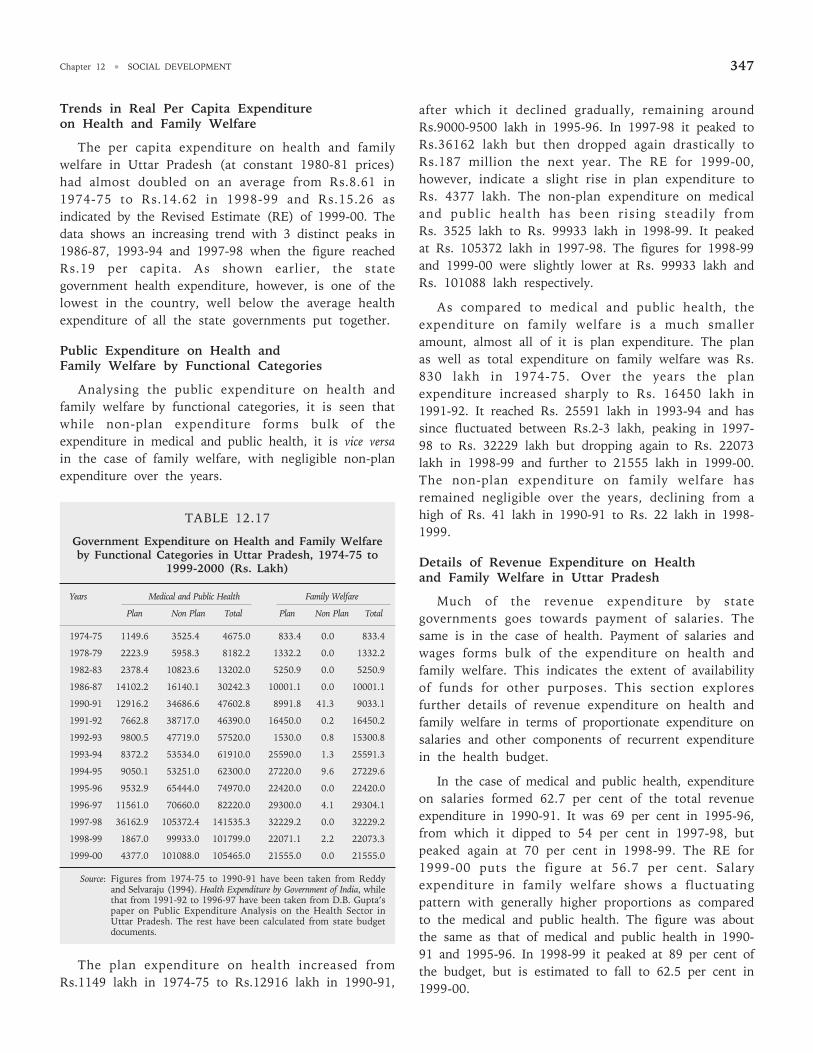
The plan expenditure on health increased fromRs.1149 lakh in 1974-75 to Rs.12916 lakh in 1990-91,
after which it declined gradually, remaining aroundRs.9000-9500 lakh in 1995-96. In 1997-98 it peaked toRs.36162 lakh but then dropped again drastically toRs.187 million the next year. The RE for 1999-00,however, indicate a slight rise in plan expenditure toRs. 4377 lakh. The non-plan expenditure on medicaland public health has been rising steadily fromRs. 3525 lakh to Rs. 99933 lakh in 1998-99. It peakedat Rs. 105372 lakh in 1997-98. The figures for 1998-99and 1999-00 were slightly lower at Rs. 99933 lakh andRs. 101088 lakh respectively.
As compared to medical and public health, theexpenditure on family welfare is a much smalleramount, almost all of it is plan expenditure. The planas well as total expenditure on family welfare was Rs.830 lakh in 1974-75. Over the years the planexpenditure increased sharply to Rs. 16450 lakh in1991-92. It reached Rs. 25591 lakh in 1993-94 and hassince fluctuated between Rs.2-3 lakh, peaking in 1997-98 to Rs. 32229 lakh but dropping again to Rs. 22073lakh in 1998-99 and further to 21555 lakh in 1999-00.The non-plan expenditure on family welfare hasremained negligible over the years, declining from ahigh of Rs. 41 lakh in 1990-91 to Rs. 22 lakh in 1998-1999.
Details of Revenue Expenditure on Healthand Family Welfare in Uttar Pradesh
Much of the revenue expenditure by stategovernments goes towards payment of salaries. Thesame is in the case of health. Payment of salaries andwages forms bulk of the expenditure on health andfamily welfare. This indicates the extent of availabilityof funds for other purposes. This section exploresfurther details of revenue expenditure on health andfamily welfare in terms of proportionate expenditure onsalaries and other components of recurrent expenditurein the health budget.
In the case of medical and public health, expenditureon salaries formed 62.7 per cent of the total revenueexpenditure in 1990-91. It was 69 per cent in 1995-96,from which it dipped to 54 per cent in 1997-98, butpeaked again at 70 per cent in 1998-99. The RE for1999-00 puts the figure at 56.7 per cent. Salaryexpenditure in family welfare shows a fluctuatingpattern with generally higher proportions as comparedto the medical and public health. The figure was aboutthe same as that of medical and public health in 1990-91 and 1995-96. In 1998-99 it peaked at 89 per cent ofthe budget, but is estimated to fall to 62.5 per cent in1999-00.
UTTAR PRADESH DEVELOPMENT REPORT—VOL. 2348
FIGURE 12.4
Proportion of Expenditure on Salaries to Total RevenueExpenditure on Health and Family Welfare in Uttar
Pradesh, 1990-91 to 1998-99
Expenditure on scholarships and stipends forms avery small part of the revenue expenditure on medicaland public health, varying around 2 per cent for mostof the years. The proportion is lower in the case offamily welfare, fluctuating around 1 per cent except fora high of 3.8 per cent in 1990-91.
Grants form a regular part of the revenue budgetand show a variation between 4 to 6 per cent over theyears in the case of medical and public health. In 1990-91 they formed 4.75 per cent of the budget,subsequently fluctuating between 3-6.5 per cent. Incase of family welfare, grants form a minor part of thebudget, remaining below 1 per cent, except for 1995-96when the proportion was 5.8 per cent.
Maintenance expenditure again forms a minusculepart of the total revenue expenditure, remaining below1 per cent for most of the years. In family welfare therehas been no expenditure on maintenance for the yearsconsidered.
Expenditure on drugs and medicines also show verylow figures and account for less than 5 per cent of thehealth budget. The 1990-91 Budget includes drugs as apart of materials and supplies, hence there are nofigures for drugs in the budget. Drugs show a risingtrend in the case of medical and public health, but forfamily welfare they show a fluctuating trend with anabnormal high of 13 per cent in 1997-98.
Thus it can be seen that expenditure on salariesdominates revenue expenditure by the government inboth health and family welfare. Other expenditures formminor parts of the total budget. If all the itemsdiscussed above are clubbed as recurrent expenditure,then this forms about 70-80 per cent of the budgetexpenditure in health and family welfare.
Capital Expenditure on Health and Family Welfare
The figures for capital expenditure in the healthbudgets are usually small amounts as compared torevenue expenditure, and mostly attributed toconstruction and building works. Capital expenditure iswholly plan expenditure in the case of health andfamily welfare in Uttar Pradesh.
Figures for capital expenditure in health and familywelfare have shown a rising trend from Rs.545.5million in 1990-91 to Rs.823.2 million in 1997-98. Aspercentage of total capital outlay, a peak of 8.3 per centwas reached in 1991-92, but thereafter the trend hasbeen declining, with capital outlays on health and
TABLE 12.18
Expenditure on Selected Items as % of Total Revenue Expenditure on Health and Family Welfare inUttar Pradesh, 1990-91 to 1999-2000
Years Medical and Public Health Family Welfare
Salaries Scholarships Grants Maintenance Drugs Salaries Scholarships Grants Maintenance Drugs& Stipends & Stipends
1990-91 62.69 2.62 4.75 .82 0 62.32 3.8 .71 0 0
1995-96 69.03 1.38 6.30 1.74 .37 69.15 0 5.78 0 .31
1997-98 53.72 .88 6.88 .52 1.74 67.45 1.43 .33 0 13.43
1998-99 70.14 2.58 3.82 .94 3.96 88.92 1.09 .03 0 .90
1999-00* 56.67 2.22 16.14 .61 7.94 62.52 1.71 .13 0 2.36
Source: Uttar Pradesh State Budget Documents.
Note: * - Revised Estimate.
1990-91
Salaries
Others
1995-96
Others
Salaries
1998-99
Others
Salaries
Chapter 12 • SOCIAL DEVELOPMENT 349
family welfare touching lows of 2.74 per cent and 3.19per cent in 1998-99 and 1999-00 respectively.
TABLE 12.19
Capital Expenditure on Health and Family Welfarein Uttar Pradesh, 1991-92 to 1999-2000
(Rs. Million)
Years Exp. on Medical, Public Health % to Total Capital& Family Welfare Outlay
1990-91 545.5 4.63
1991-92 592.1 8.30
1992-93 533.2 4.20
1993-94 532.4 5.61
1994-95 658.9 5.88
1995-96 541.3 4.79
1996-97 644.1 4.49
1997-98 823.2 4.94
1998-99 575.6 2.74
1999-00 631.1 3.19
Source: RBI reports, on State Finances.
Expenditure on Major Heads in the Health andFamily Welfare Budget in Uttar Pradesh
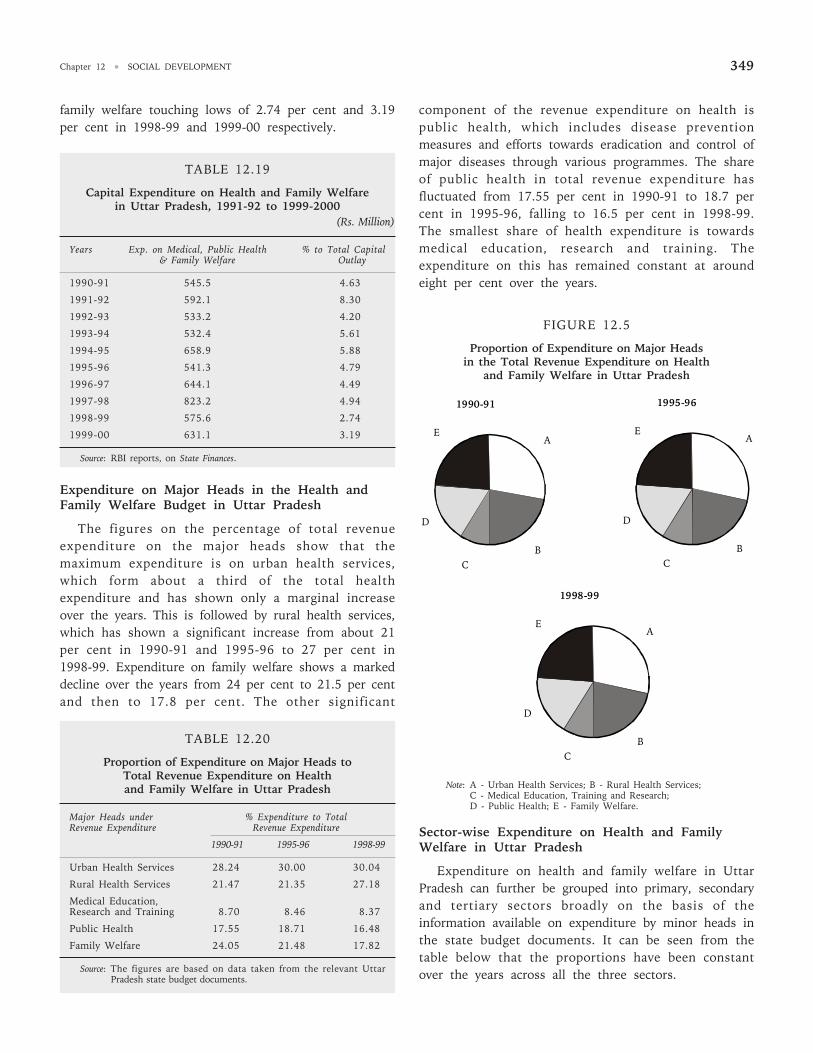
The figures on the percentage of total revenueexpenditure on the major heads show that themaximum expenditure is on urban health services,which form about a third of the total healthexpenditure and has shown only a marginal increaseover the years. This is followed by rural health services,which has shown a significant increase from about 21per cent in 1990-91 and 1995-96 to 27 per cent in1998-99. Expenditure on family welfare shows a markeddecline over the years from 24 per cent to 21.5 per centand then to 17.8 per cent. The other significant
component of the revenue expenditure on health ispublic health, which includes disease preventionmeasures and efforts towards eradication and control ofmajor diseases through various programmes. The shareof public health in total revenue expenditure hasfluctuated from 17.55 per cent in 1990-91 to 18.7 percent in 1995-96, falling to 16.5 per cent in 1998-99.The smallest share of health expenditure is towardsmedical education, research and training. Theexpenditure on this has remained constant at aroundeight per cent over the years.
FIGURE 12.5
Proportion of Expenditure on Major Headsin the Total Revenue Expenditure on Health
and Family Welfare in Uttar Pradesh
Note: A - Urban Health Services; B - Rural Health Services;C - Medical Education, Training and Research;D - Public Health; E - Family Welfare.
Sector-wise Expenditure on Health and FamilyWelfare in Uttar Pradesh
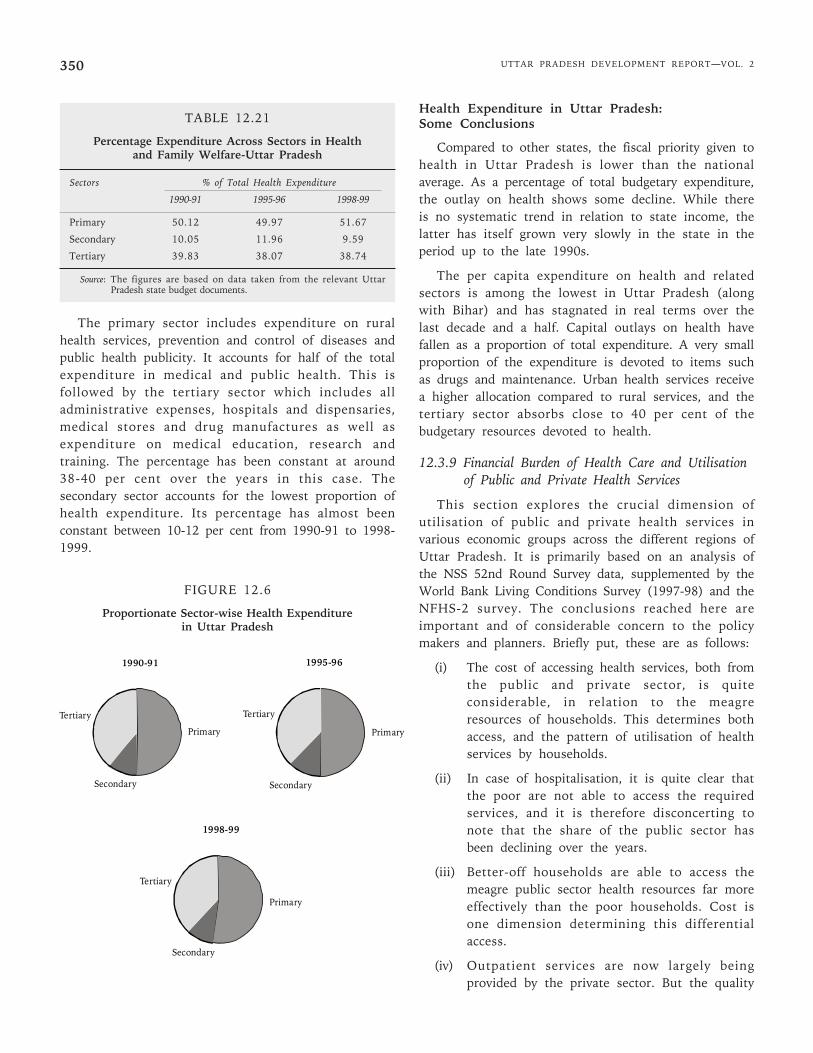
Expenditure on health and family welfare in UttarPradesh can further be grouped into primary, secondaryand tertiary sectors broadly on the basis of theinformation available on expenditure by minor heads inthe state budget documents. It can be seen from thetable below that the proportions have been constantover the years across all the three sectors.
TABLE 12.20
Proportion of Expenditure on Major Heads toTotal Revenue Expenditure on Healthand Family Welfare in Uttar Pradesh
Major Heads under % Expenditure to TotalRevenue Expenditure Revenue Expenditure
1990-91 1995-96 1998-99
Urban Health Services 28.24 30.00 30.04
Rural Health Services 21.47 21.35 27.18
Medical Education,Research and Training 8.70 8.46 8.37
Public Health 17.55 18.71 16.48
Family Welfare 24.05 21.48 17.82
Source: The figures are based on data taken from the relevant UttarPradesh state budget documents.
1990-91
A
B C
D
E
1995-96
A
B C
D
E
1998-99
A
B C
D
E
UTTAR PRADESH DEVELOPMENT REPORT—VOL. 2350
TABLE 12.21
Percentage Expenditure Across Sectors in Healthand Family Welfare-Uttar Pradesh
Sectors % of Total Health Expenditure
1990-91 1995-96 1998-99
Primary 50.12 49.97 51.67
Secondary 10.05 11.96 9.59
Tertiary 39.83 38.07 38.74
Source: The figures are based on data taken from the relevant UttarPradesh state budget documents.
The primary sector includes expenditure on ruralhealth services, prevention and control of diseases andpublic health publicity. It accounts for half of the totalexpenditure in medical and public health. This isfollowed by the tertiary sector which includes alladministrative expenses, hospitals and dispensaries,medical stores and drug manufactures as well asexpenditure on medical education, research andtraining. The percentage has been constant at around38-40 per cent over the years in this case. Thesecondary sector accounts for the lowest proportion ofhealth expenditure. Its percentage has almost beenconstant between 10-12 per cent from 1990-91 to 1998-1999.
FIGURE 12.6
Proportionate Sector-wise Health Expenditurein Uttar Pradesh
Health Expenditure in Uttar Pradesh:Some Conclusions
Compared to other states, the fiscal priority given tohealth in Uttar Pradesh is lower than the nationalaverage. As a percentage of total budgetary expenditure,the outlay on health shows some decline. While thereis no systematic trend in relation to state income, thelatter has itself grown very slowly in the state in theperiod up to the late 1990s.
The per capita expenditure on health and relatedsectors is among the lowest in Uttar Pradesh (alongwith Bihar) and has stagnated in real terms over thelast decade and a half. Capital outlays on health havefallen as a proportion of total expenditure. A very smallproportion of the expenditure is devoted to items suchas drugs and maintenance. Urban health services receivea higher allocation compared to rural services, and thetertiary sector absorbs close to 40 per cent of thebudgetary resources devoted to health.
12.3.9 Financial Burden of Health Care and Utilisationof Public and Private Health Services
This section explores the crucial dimension ofutilisation of public and private health services invarious economic groups across the different regions ofUttar Pradesh. It is primarily based on an analysis ofthe NSS 52nd Round Survey data, supplemented by theWorld Bank Living Conditions Survey (1997-98) and theNFHS-2 survey. The conclusions reached here areimportant and of considerable concern to the policymakers and planners. Briefly put, these are as follows:
(i) The cost of accessing health services, both fromthe public and private sector, is quiteconsiderable, in relation to the meagreresources of households. This determines bothaccess, and the pattern of utilisation of healthservices by households.
(ii) In case of hospitalisation, it is quite clear thatthe poor are not able to access the requiredservices, and it is therefore disconcerting tonote that the share of the public sector hasbeen declining over the years.
(iii) Better-off households are able to access themeagre public sector health resources far moreeffectively than the poor households. Cost isone dimension determining this differentialaccess.
(iv) Outpatient services are now largely beingprovided by the private sector. But the quality
1990-91
Primary
Tertiary
Secondary
1995-96
Primary
Tertiary
Secondary
1998-99
Primary
Tertiary
Secondary
Chapter 12 • SOCIAL DEVELOPMENT 351
of such services is exceedingly poor and bulk ofthe providers are unqualified practitioners.
(v) Public health inputs (vaccinations, pre andpostnatal maternal care) is still largely aprerogative of the public sector.
Expenses on Hospitalisation
Hospitalisation imposes a huge cost on households.The average total expenditure per case of hospitalisationin the last one year is higher for Uttar Pradesh than forIndia as a whole in both rural and urban areas. Thecost of hospitalisation and medical expenses was foundto be Rs. 4949 per person in India and Rs. 5580 perhousehold in Uttar Pradesh.
Hospital expenditures appear to be associated withthe ability to bear the financial burden of such episodeswith better-off households in better-off regions beingable to avail slightly better facilities—quite often in theprivate sector. The average cost of hospitalisation wasthe highest in the Hills and the Western region,followed by the Central and Eastern region, while itwas the lowest in the Bundelkhand region, which isalso the poorest.
TABLE 12.22
Cost of Hospitalisation Per Hospitalised Person
Region/ Cost of Other Total IndirectSector Hospitalisation Hospitalisation Direct Cost
& Other Related ExpensesMedical Expenses Expenses
West 5424.3 417.65 5841.95 827.63
Central 4302.11 375.76 4677.88 745.73
East 3786.14 375.62 4161.76 718.8
Bundelkhand 2707.64 182.9 2890.55 636.26
Total 4567.97 381.88 4949.85 759.79
Source: NSS 52nd Round (computed).
The same feature is also shown in the quintile-wise expenditure on hospitalisation. Expenditure perperson on hospitalisation in rural Uttar Pradeshincreases from Rs. 1495 in the lowest quintile toRs. 10204 in the highest quintile. Similarly in urbanUttar Pradesh, expenditure on hospitalisation is thelowest in the poorest quintile (Rs. 2291) andincreases to Rs. 11628 in the highest quintile. Thisis also the case for the regions of Uttar Pradesh—with expenditures in the higher quintiles generallymuch higher than that incurred in the poorerquintiles.
TABLE 12.23
Cost of Hospitalisation and Related Medical Expenses perHospitalised Person in Uttar Pradesh by Per Capita
Consumption Quintile (Rs.)
Region/Sector Monthly Per Capita Consumption Quintile
1 2 3 4 5 Total
Rural
West 1249.88 1643.91 2457.65 3639.5 11369.35 5451.11
Central 1786.8 1434.29 1414.92 4724.66 8529.98 4380.9
East 1492.09 2669.59 2785.01 3482.71 10201.65 4167.16
Bundelkhand 646.53 827.12 1267.31 4113.37 3147.64 1398.65
Total 1494.76 2080.3 2131.87 3666.49 10203.76 4638.59
Urban
Hill 125 852.81 2802.23 4374.88 11895.14 8184.81
West 2791.88 4007.36 5564.96 5193.34 14073 6806.68
Central 756.47 2373.6 2593.14 3750.97 9749.73 5454.55
East 2902.54 2841.18 3371.17 2743.79 7890.89 4107.79
Bundelkhand 982.83 3424.63 3023.96 10764.51 21139.44 4737.85
Total 2291.12 3424.05 4156.35 4866.15 11627.92 6044.8
Source: NSS 52nd Round (computed).
While the expenditure per day is considerably higherin the private hospitals (Rs. 504 in private hospitals,compared to Rs. 290 in public hospitals), except forCentral Uttar Pradesh, the number of days in hospitalare higher for public hospitals (14) than for private
TABLE 12.24
Cost of Hospitalisation Per Person in Public and Private Hospitals in Uttar Pradesh
Public Private Both Public and Private
Region/Sector Cost Other Other Total Cost Other Medical Other Total Costs Medical Other TotalIncurred Medical Costs Costs Incurred Costs Cost Costs Incurred Costs Costs Costs
in Hospital Costs in Hospital in Hospital
West 4960 475 547 5982 5536 369 949 6854 5350 403 820 6572
Central 3154 390 611 4154 5184 317 827 6327 4097 356 711 5164
East 3597 367 710 4674 3964 381 728 5073 3782 374 719 4875
Bundelkhand 2162 121 705 2989 3621 282 550 4453 2740 185 644 3568
Total 3830 391 631 4852 5032 357 845 6234 4495 372 750 5617
Source: NSS 52nd Round (computed).
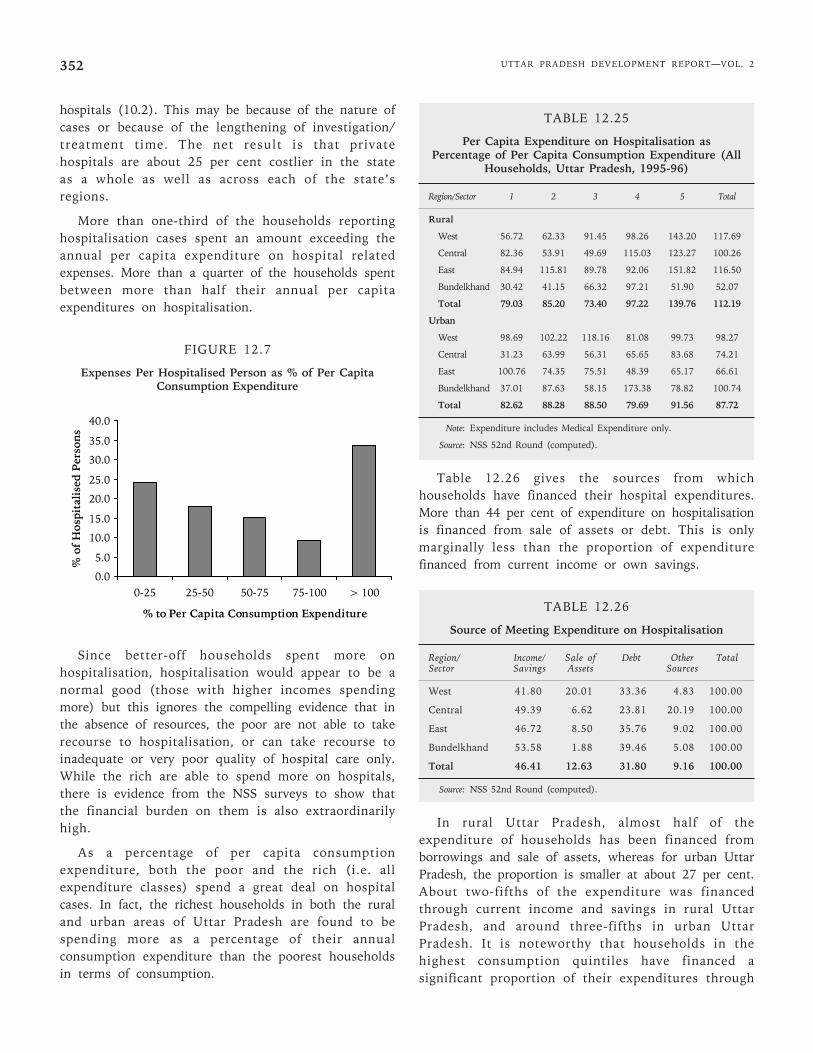
UTTAR PRADESH DEVELOPMENT REPORT—VOL. 2352
hospitals (10.2). This may be because of the nature ofcases or because of the lengthening of investigation/treatment time. The net result is that privatehospitals are about 25 per cent costlier in the stateas a whole as well as across each of the state’sregions.
More than one-third of the households reportinghospitalisation cases spent an amount exceeding theannual per capita expenditure on hospital relatedexpenses. More than a quarter of the households spentbetween more than half their annual per capitaexpenditures on hospitalisation.
FIGURE 12.7
Expenses Per Hospitalised Person as % of Per CapitaConsumption Expenditure
Since better-off households spent more onhospitalisation, hospitalisation would appear to be anormal good (those with higher incomes spendingmore) but this ignores the compelling evidence that inthe absence of resources, the poor are not able to takerecourse to hospitalisation, or can take recourse toinadequate or very poor quality of hospital care only.While the rich are able to spend more on hospitals,there is evidence from the NSS surveys to show thatthe financial burden on them is also extraordinarilyhigh.
As a percentage of per capita consumptionexpenditure, both the poor and the rich (i.e. allexpenditure classes) spend a great deal on hospitalcases. In fact, the richest households in both the ruraland urban areas of Uttar Pradesh are found to bespending more as a percentage of their annualconsumption expenditure than the poorest householdsin terms of consumption.
TABLE 12.25
Per Capita Expenditure on Hospitalisation asPercentage of Per Capita Consumption Expenditure (All
Households, Uttar Pradesh, 1995-96)
Region/Sector 1 2 3 4 5 Total
Rural
West 56.72 62.33 91.45 98.26 143.20 117.69
Central 82.36 53.91 49.69 115.03 123.27 100.26
East 84.94 115.81 89.78 92.06 151.82 116.50
Bundelkhand 30.42 41.15 66.32 97.21 51.90 52.07
Total 79.03 85.20 73.40 97.22 139.76 112.19
Urban
West 98.69 102.22 118.16 81.08 99.73 98.27
Central 31.23 63.99 56.31 65.65 83.68 74.21
East 100.76 74.35 75.51 48.39 65.17 66.61
Bundelkhand 37.01 87.63 58.15 173.38 78.82 100.74
Total 82.62 88.28 88.50 79.69 91.56 87.72
Note: Expenditure includes Medical Expenditure only.
Source: NSS 52nd Round (computed).
Table 12.26 gives the sources from whichhouseholds have financed their hospital expenditures.More than 44 per cent of expenditure on hospitalisationis financed from sale of assets or debt. This is onlymarginally less than the proportion of expenditurefinanced from current income or own savings.
TABLE 12.26
Source of Meeting Expenditure on Hospitalisation
Region/ Income/ Sale of Debt Other TotalSector Savings Assets Sources
West 41.80 20.01 33.36 4.83 100.00
Central 49.39 6.62 23.81 20.19 100.00
East 46.72 8.50 35.76 9.02 100.00
Bundelkhand 53.58 1.88 39.46 5.08 100.00
Total 46.41 12.63 31.80 9.16 100.00
Source: NSS 52nd Round (computed).
In rural Uttar Pradesh, almost half of theexpenditure of households has been financed fromborrowings and sale of assets, whereas for urban UttarPradesh, the proportion is smaller at about 27 per cent.About two-fifths of the expenditure was financedthrough current income and savings in rural UttarPradesh, and around three-fifths in urban UttarPradesh. It is noteworthy that households in thehighest consumption quintiles have financed asignificant proportion of their expenditures through
0.0
5.0
10.0
15.0
20.0
25.0
30.0
35.0
40.0
0-25 25-50 50-75 75-100 > 100
% to Per Capita Consumption Expenditure
% o
f H
ospi
tali
sed
Per
son
s
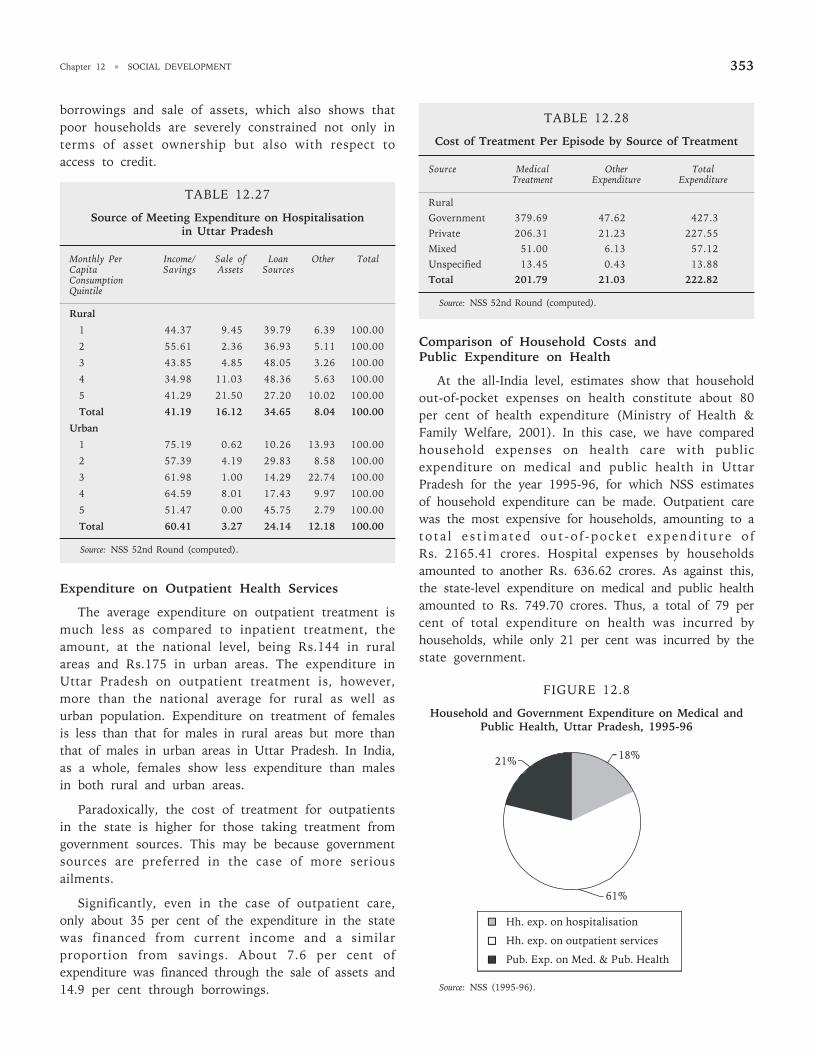
Chapter 12 • SOCIAL DEVELOPMENT 353
borrowings and sale of assets, which also shows thatpoor households are severely constrained not only interms of asset ownership but also with respect toaccess to credit.
TABLE 12.27
Source of Meeting Expenditure on Hospitalisationin Uttar Pradesh
Monthly Per Income/ Sale of Loan Other TotalCapita Savings Assets SourcesConsumptionQuintile
Rural
1 44.37 9.45 39.79 6.39 100.00
2 55.61 2.36 36.93 5.11 100.00
3 43.85 4.85 48.05 3.26 100.00
4 34.98 11.03 48.36 5.63 100.00
5 41.29 21.50 27.20 10.02 100.00
Total 41.19 16.12 34.65 8.04 100.00
Urban
1 75.19 0.62 10.26 13.93 100.00
2 57.39 4.19 29.83 8.58 100.00
3 61.98 1.00 14.29 22.74 100.00
4 64.59 8.01 17.43 9.97 100.00
5 51.47 0.00 45.75 2.79 100.00
Total 60.41 3.27 24.14 12.18 100.00
Source: NSS 52nd Round (computed).
Expenditure on Outpatient Health Services
The average expenditure on outpatient treatment ismuch less as compared to inpatient treatment, theamount, at the national level, being Rs.144 in ruralareas and Rs.175 in urban areas. The expenditure inUttar Pradesh on outpatient treatment is, however,more than the national average for rural as well asurban population. Expenditure on treatment of femalesis less than that for males in rural areas but more thanthat of males in urban areas in Uttar Pradesh. In India,as a whole, females show less expenditure than malesin both rural and urban areas.
Paradoxically, the cost of treatment for outpatientsin the state is higher for those taking treatment fromgovernment sources. This may be because governmentsources are preferred in the case of more seriousailments.
Significantly, even in the case of outpatient care,only about 35 per cent of the expenditure in the statewas financed from current income and a similarproportion from savings. About 7.6 per cent ofexpenditure was financed through the sale of assets and14.9 per cent through borrowings.
TABLE 12.28
Cost of Treatment Per Episode by Source of Treatment
Source Medical Other TotalTreatment Expenditure Expenditure
RuralGovernment 379.69 47.62 427.3Private 206.31 21.23 227.55Mixed 51.00 6.13 57.12Unspecified 13.45 0.43 13.88Total 201.79 21.03 222.82
Source: NSS 52nd Round (computed).
Comparison of Household Costs andPublic Expenditure on Health
At the all-India level, estimates show that householdout-of-pocket expenses on health constitute about 80per cent of health expenditure (Ministry of Health &Family Welfare, 2001). In this case, we have comparedhousehold expenses on health care with publicexpenditure on medical and public health in UttarPradesh for the year 1995-96, for which NSS estimatesof household expenditure can be made. Outpatient carewas the most expensive for households, amounting to ato ta l e s t imated out -o f -pocke t expend i tu re o fRs. 2165.41 crores. Hospital expenses by householdsamounted to another Rs. 636.62 crores. As against this,the state-level expenditure on medical and public healthamounted to Rs. 749.70 crores. Thus, a total of 79 percent of total expenditure on health was incurred byhouseholds, while only 21 per cent was incurred by thestate government.
FIGURE 12.8
Household and Government Expenditure on Medical andPublic Health, Uttar Pradesh, 1995-96
Source: NSS (1995-96).
61%
21% 18%
Hh. exp. on hospitalisation
Hh. exp. on outpatient services
Pub. Exp. on Med. & Pub. Health
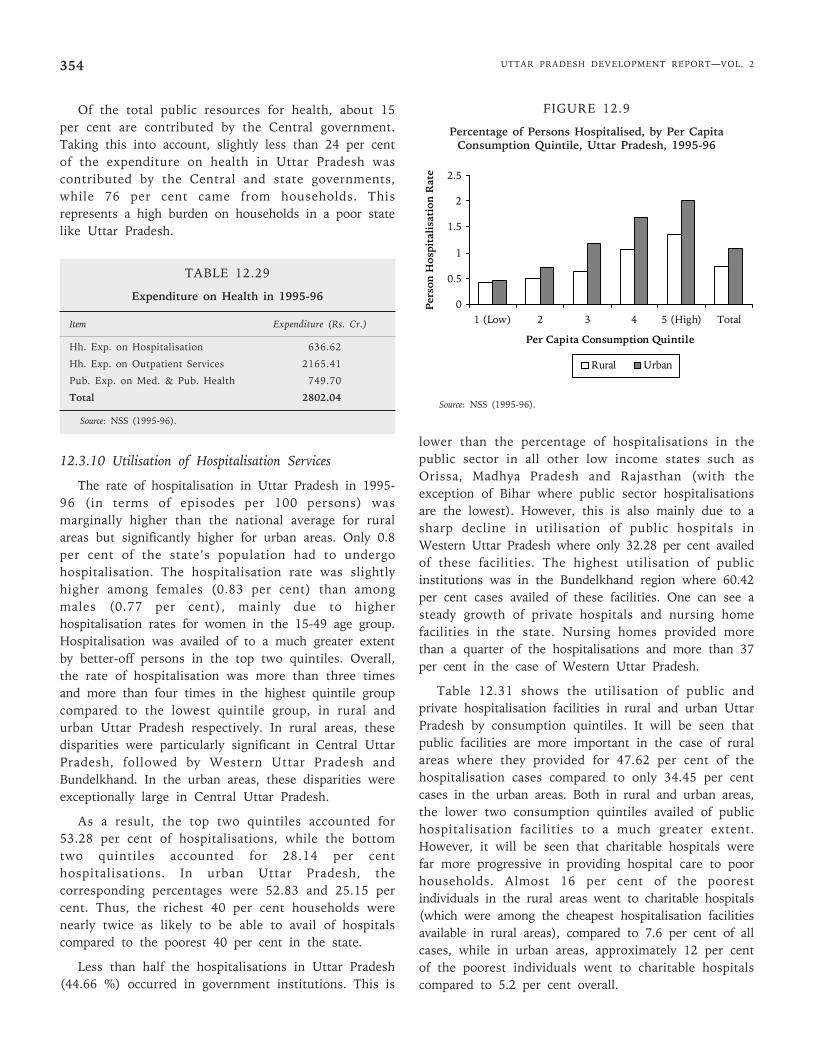
UTTAR PRADESH DEVELOPMENT REPORT—VOL. 2354
Of the total public resources for health, about 15per cent are contributed by the Central government.Taking this into account, slightly less than 24 per centof the expenditure on health in Uttar Pradesh wascontributed by the Central and state governments,while 76 per cent came from households. Thisrepresents a high burden on households in a poor statelike Uttar Pradesh.
TABLE 12.29
Expenditure on Health in 1995-96
Item Expenditure (Rs. Cr.)
Hh. Exp. on Hospitalisation 636.62
Hh. Exp. on Outpatient Services 2165.41
Pub. Exp. on Med. & Pub. Health 749.70
Total 2802.04
Source: NSS (1995-96).
12.3.10 Utilisation of Hospitalisation Services
The rate of hospitalisation in Uttar Pradesh in 1995-96 (in terms of episodes per 100 persons) wasmarginally higher than the national average for ruralareas but significantly higher for urban areas. Only 0.8per cent of the state’s population had to undergohospitalisation. The hospitalisation rate was slightlyhigher among females (0.83 per cent) than amongmales (0.77 per cent), mainly due to higherhospitalisation rates for women in the 15-49 age group.Hospitalisation was availed of to a much greater extentby better-off persons in the top two quintiles. Overall,the rate of hospitalisation was more than three timesand more than four times in the highest quintile groupcompared to the lowest quintile group, in rural andurban Uttar Pradesh respectively. In rural areas, thesedisparities were particularly significant in Central UttarPradesh, followed by Western Uttar Pradesh andBundelkhand. In the urban areas, these disparities wereexceptionally large in Central Uttar Pradesh.
As a result, the top two quintiles accounted for53.28 per cent of hospitalisations, while the bottomtwo quintiles accounted for 28.14 per centhospitalisations. In urban Uttar Pradesh, thecorresponding percentages were 52.83 and 25.15 percent. Thus, the richest 40 per cent households werenearly twice as likely to be able to avail of hospitalscompared to the poorest 40 per cent in the state.
Less than half the hospitalisations in Uttar Pradesh(44.66 %) occurred in government institutions. This is
lower than the percentage of hospitalisations in thepublic sector in all other low income states such asOrissa, Madhya Pradesh and Rajasthan (with theexception of Bihar where public sector hospitalisationsare the lowest). However, this is also mainly due to asharp decline in utilisation of public hospitals inWestern Uttar Pradesh where only 32.28 per cent availedof these facilities. The highest utilisation of publicinstitutions was in the Bundelkhand region where 60.42per cent cases availed of these facilities. One can see asteady growth of private hospitals and nursing homefacilities in the state. Nursing homes provided morethan a quarter of the hospitalisations and more than 37per cent in the case of Western Uttar Pradesh.
Table 12.31 shows the utilisation of public andprivate hospitalisation facilities in rural and urban UttarPradesh by consumption quintiles. It will be seen thatpublic facilities are more important in the case of ruralareas where they provided for 47.62 per cent of thehospitalisation cases compared to only 34.45 per centcases in the urban areas. Both in rural and urban areas,the lower two consumption quintiles availed of publichospitalisation facilities to a much greater extent.However, it will be seen that charitable hospitals werefar more progressive in providing hospital care to poorhouseholds. Almost 16 per cent of the poorestindividuals in the rural areas went to charitable hospitals(which were among the cheapest hospitalisation facilitiesavailable in rural areas), compared to 7.6 per cent of allcases, while in urban areas, approximately 12 per centof the poorest individuals went to charitable hospitalscompared to 5.2 per cent overall.
0
0.5
1
1.5
2
2.5
1 (Low) 2 3 4 5 (High) Total
Per Capita Consumption Quintile
Per
son
Hos
pita
lisa
tion
Rat
e
Rural Urban
FIGURE 12.9
Percentage of Persons Hospitalised, by Per CapitaConsumption Quintile, Uttar Pradesh, 1995-96
Source: NSS (1995-96).
Chapter 12 • SOCIAL DEVELOPMENT 355
TABLE 12.30
Type of Hospitalisation Facility Availed Per Person, Region-wise in Uttar Pradesh
Region/Sector Public PHC Public Total Public Private Nursing Charitable Others TotalHospital Dispensary Hospital Home Hospital Private
West 26.11 6.1 0.07 32.28 25.75 37.46 3.97 0.54 67.72
Central 50.85 2.46 0.23 53.54 12.55 25.02 8.04 0.85 46.46
East 44.11 5.13 0.3 49.54 21 16.99 11.17 1.31 50.47
Bundelkhand 50.01 10.41 0 60.42 7.95 26.39 5.24 0 39.58
Total 39.35 5.14 0.17 44.66 20.35 26.62 7.1 1.27 55.34
Source: NSS 52nd Round (computed).
TABLE 12.31
Utilisation of Public and Private Hospitals Per Person in Uttar Pradesh
Per Capita Public PHC Public Total Private Nursing Charitable Others Total TotalConsumption Hospital Dispensary Public Hospital Home Hospital PrivateQuintile
Rural1 54.95 2.55 0.34 57.84 10.89 13.09 15.77 2.42 42.17 1002 47.4 5.32 0.2 52.92 16.57 18.6 11.03 0.89 47.09 1003 41.72 5.29 0 47.01 19.32 20.04 12.86 0.77 52.99 1004 31.23 12.48 0.21 43.92 28.76 20.25 3.87 3.21 56.09 1005 42.63 1.94 0.07 44.64 19.51 33.22 2.54 0.09 55.36 100Total 41.46 6.02 0.14 47.62 20.57 22.71 7.64 1.47 52.39 100
Urban1 41.94 3.82 0.00 45.76 13.18 29.11 11.96 0.00 54.25 100.002 42.25 2.73 0.24 45.22 14.19 36.71 3.88 0.00 54.78 100.003 26.78 2.09 0.79 29.66 25.93 42.35 1.95 0.12 70.35 100.004 31.97 1.98 0.00 33.95 19.42 42.31 4.33 0.00 66.06 100.005 27.92 1.37 0.20 29.49 19.23 42.13 7.05 2.10 70.51 100.00Total 32.05 2.13 0.27 34.45 19.57 40.14 5.24 0.60 65.55 100.00
Source: NSS 52nd Round (computed).
Thus, the poor are able to use hospitals in a morelimited way and are confined to cheaper facilities in thepublic and private sector. The better-off households areable to make higher use of hospitals—both in thepublic sector and in the private sector. They are able tomake larger use of the more expensive private facilitiessuch as those offered by private nursing homes.
Utilisation of Outpatient Services
The information on per thousand distribution ofoutpatient treatments in the past 15 days by NSS 52ndRound respondents shows a greater extent ofoutpatient treatment in urban areas in case of femalesas compared to males. This is true for Uttar Pradesh aswell as India as a whole.
According to the NSS, 6.1 per cent of thepopulation reported some ailment during the reporting
fortnight and 90.7 per cent reported receiving sometreatment for the ailment (higher than the nationalaverage). A slightly higher proportion of femalesreported ailments, but a lower percentage among themreported receiving treatment.
Table 12.33 classifies the reported source(s) oftreatment for outpatients in Uttar Pradesh. While 3 to9.6 per cent (5.45 per cent at the state level) of thetreatment sources were unspecified or mixed (bothpublic and private), private sources emerged as thepreponderant source of treatment in all regions. In thestate as a whole, 90.22 per cent of the treatments weregiven by private sources. The highest percentageavailing of government sources was in the Bundelkhandregion (6.97%) while the lowest percentage was in theWest (2.73%).
UTTAR PRADESH DEVELOPMENT REPORT—VOL. 2356
TABLE 12.32
Percentage of Population Reporting Ailment and Treatmentin Uttar Pradesh (by Gender)
% Reporting Ailment Of which, % ReportingTreatment
Region/ Male Female Total Male Female TotalSector
West 7.1 7.8 7.4 92.2 90.6 91.4Central 7.8 8.3 8.0 88.1 88.6 88.4East 3.9 3.9 3.9 95.5 94.8 95.2Bundelkhand 5.5 5.5 5.5 91.1 90.3 90.7Total 5.9 6.3 6.1 92.1 91.3 91.7
Source: NSS 52nd Round (computed).
The use of government facilities is smaller in thelower quintiles in the rural areas. Only 2.24 per cent ofoutpatients were treated at government centrescompared to 6.67 per cent in the highest quintile.
TABLE 12.33
Region-wise Source of Treatment for Outpatients in UttarPradesh
Source West Central East Bundelkhand Total
Government 2.73 4.63 4.59 6.97 4.33Private 92.53 92.34 87.75 87.82 90.22Mixed 0.46 1.28 0.70 0.11 0.81Unspecified 4.28 1.75 6.96 5.10 4.65Total 100.00 100.00 100.00 100.00 100.00
Source: NSS 52nd Round (computed).
TABLE 12.34
Source of Treatment for Outpatients in Uttar Pradesh inUrban and Rural Uttar Pradesh by Consumption Quintile
Source/ Per Capita Monthly Consumption Expenditure QuintileSector
1 2 3 4 5 Total
Rural
Government 2.24 3.35 2.53 3.79 6.67 3.59
Private 89.82 92.39 92.4 89.7 88.39 90.7
Mixed 1.1 0.1 0.21 1.67 0.57 0.71
Unspecified 6.84 4.16 4.87 4.83 4.37 5
Total 100 100 100 100 100 100
Urban
Government 6.14 8.16 5.8 12.37 6.97 7.75
Private 89.05 87.41 87.16 86.62 89.77 87.98
Mixed 0.66 1.82 3.24 0.13 0 1.26
Unspecified 4.15 2.61 3.8 0.88 3.27 3.01
Total 100 100 100 100 100 100
Source: NSS 52nd Round (computed).
NFHS-2 also collected information on the source ofhealth care generally availed by households in time ofneed (Table 12.35).
TABLE 12.35
Utilisation of Healthcare Facilities by Source in UttarPradesh, 1998-99
% of Population Utilising the Given HealthCare Facilities by
Sources of Residence Standard of TotalHealth Care Living Index
Urban Rural Low Medium High
1. Public MedicalSector 15.3 10.4 9.1 11.9 14.9 11.4
Government/ Municipal Hospital 10.9 3.7 3.7 5.0 8.7 5.2
CHC/Rural Hospital/ PHC 0.9 5.8 4.8 5.2 3.4 4.7
2. NGO or Trust Hospital/Clinic 0.3 0.1 0.2 0.1 0.4 .02
3. Private Medical Sector 83.8 89.0 90.2 87.6 83.8 87.9
Private Hospital/Clinic 18.1 14.2 13.0 14.8 20.1 15.0
Private Doctor 62.6 71.3 73.2 69.7 60.8 69.5
Vaidya/Hakim/Homeopath 1.5 0.6 0.9 0.5 1.5 0.8
4. Other Source 0.6 0.5 0.5 0.4 0.9 0.5
Source: NFHS-2, 1998-99, Uttar Pradesh.
The data again confirms that the overwhelmingmajority (88%) of the population in Uttar Pradesh goesto private health facilities in time of need. The share ofpublic sector is only 11 per cent. Among the differentsources of private health care, private doctors are themost frequented with 70 per cent of the populationavailing their services. This is followed by privatehospitals and clinics. The share of NGOs, trusthospitals and others is negligible. Sources of non-allopathic care such as ayurveda and homeopathy alsohave a negligible share, the bulk of utilisation being inurban areas and among the high-income groups.Utilisation of private facilities is more in rural than inurban areas, more so of private doctors. Public facilitiesare utilised more in urban than in rural areas, mainlygovernment hospitals. Utilisation of health carefacilities by economic status shows that utilisation ofprivate health care facilities is more in the low-incomegroup (90%) and declines with increasing standard ofliving.
The so-called ‘private doctors’ consist of a mix ofqualifications (those with allopathic, ayurvedic orhomeopathic degrees, registered medical practitioners(RMPs), quacks or ‘jhola chhap’ doctors and faith
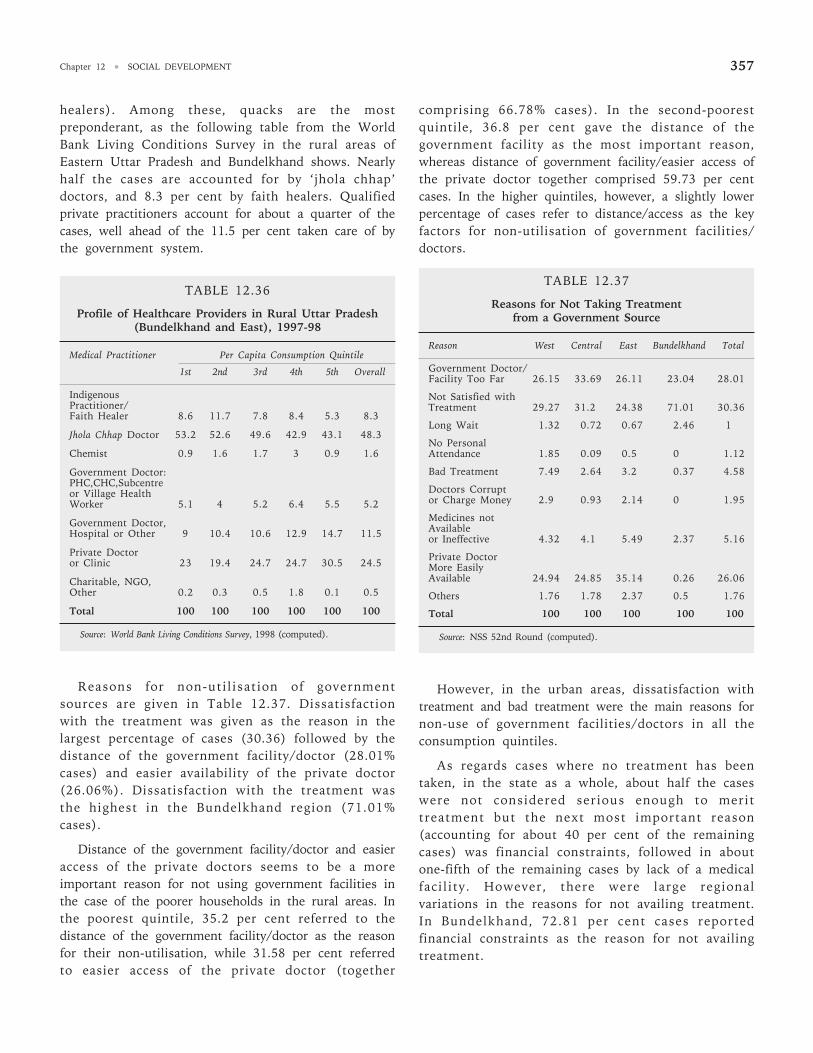
Chapter 12 • SOCIAL DEVELOPMENT 357
healers). Among these, quacks are the mostpreponderant, as the following table from the WorldBank Living Conditions Survey in the rural areas ofEastern Uttar Pradesh and Bundelkhand shows. Nearlyhalf the cases are accounted for by ‘jhola chhap’doctors, and 8.3 per cent by faith healers. Qualifiedprivate practitioners account for about a quarter of thecases, well ahead of the 11.5 per cent taken care of bythe government system.
TABLE 12.36
Profile of Healthcare Providers in Rural Uttar Pradesh(Bundelkhand and East), 1997-98
Medical Practitioner Per Capita Consumption Quintile
1st 2nd 3rd 4th 5th Overall
IndigenousPractitioner/Faith Healer 8.6 11.7 7.8 8.4 5.3 8.3
Jhola Chhap Doctor 53.2 52.6 49.6 42.9 43.1 48.3
Chemist 0.9 1.6 1.7 3 0.9 1.6
Government Doctor:PHC,CHC,Subcentreor Village HealthWorker 5.1 4 5.2 6.4 5.5 5.2
Government Doctor,Hospital or Other 9 10.4 10.6 12.9 14.7 11.5
Private Doctoror Clinic 23 19.4 24.7 24.7 30.5 24.5
Charitable, NGO,Other 0.2 0.3 0.5 1.8 0.1 0.5
Total 100 100 100 100 100 100
Source: World Bank Living Conditions Survey, 1998 (computed).
Reasons for non-utilisation of governmentsources are given in Table 12.37. Dissatisfactionwith the treatment was given as the reason in thelargest percentage of cases (30.36) followed by thedistance of the government facility/doctor (28.01%cases) and easier availability of the private doctor(26.06%). Dissatisfaction with the treatment wasthe highest in the Bundelkhand region (71.01%cases).
Distance of the government facility/doctor and easieraccess of the private doctors seems to be a moreimportant reason for not using government facilities inthe case of the poorer households in the rural areas. Inthe poorest quintile, 35.2 per cent referred to thedistance of the government facility/doctor as the reasonfor their non-utilisation, while 31.58 per cent referredto easier access of the private doctor (together
comprising 66.78% cases). In the second-poorestquintile, 36.8 per cent gave the distance of thegovernment facility as the most important reason,whereas distance of government facility/easier access ofthe private doctor together comprised 59.73 per centcases. In the higher quintiles, however, a slightly lowerpercentage of cases refer to distance/access as the keyfactors for non-utilisation of government facilities/doctors.
TABLE 12.37
Reasons for Not Taking Treatmentfrom a Government Source
Reason West Central East Bundelkhand Total
Government Doctor/Facility Too Far 26.15 33.69 26.11 23.04 28.01
Not Satisfied withTreatment 29.27 31.2 24.38 71.01 30.36
Long Wait 1.32 0.72 0.67 2.46 1
No PersonalAttendance 1.85 0.09 0.5 0 1.12
Bad Treatment 7.49 2.64 3.2 0.37 4.58
Doctors Corruptor Charge Money 2.9 0.93 2.14 0 1.95
Medicines notAvailableor Ineffective 4.32 4.1 5.49 2.37 5.16
Private DoctorMore EasilyAvailable 24.94 24.85 35.14 0.26 26.06
Others 1.76 1.78 2.37 0.5 1.76
Total 100 100 100 100 100
Source: NSS 52nd Round (computed).
However, in the urban areas, dissatisfaction withtreatment and bad treatment were the main reasons fornon-use of government facilities/doctors in all theconsumption quintiles.
As regards cases where no treatment has beentaken, in the state as a whole, about half the caseswere not considered serious enough to merittreatment but the next most important reason(accounting for about 40 per cent of the remainingcases) was financial constraints, followed in aboutone-fifth of the remaining cases by lack of a medicalfacility. However, there were large regionalvariations in the reasons for not availing treatment.In Bundelkhand, 72.81 per cent cases reportedfinancial constraints as the reason for not availingtreatment.
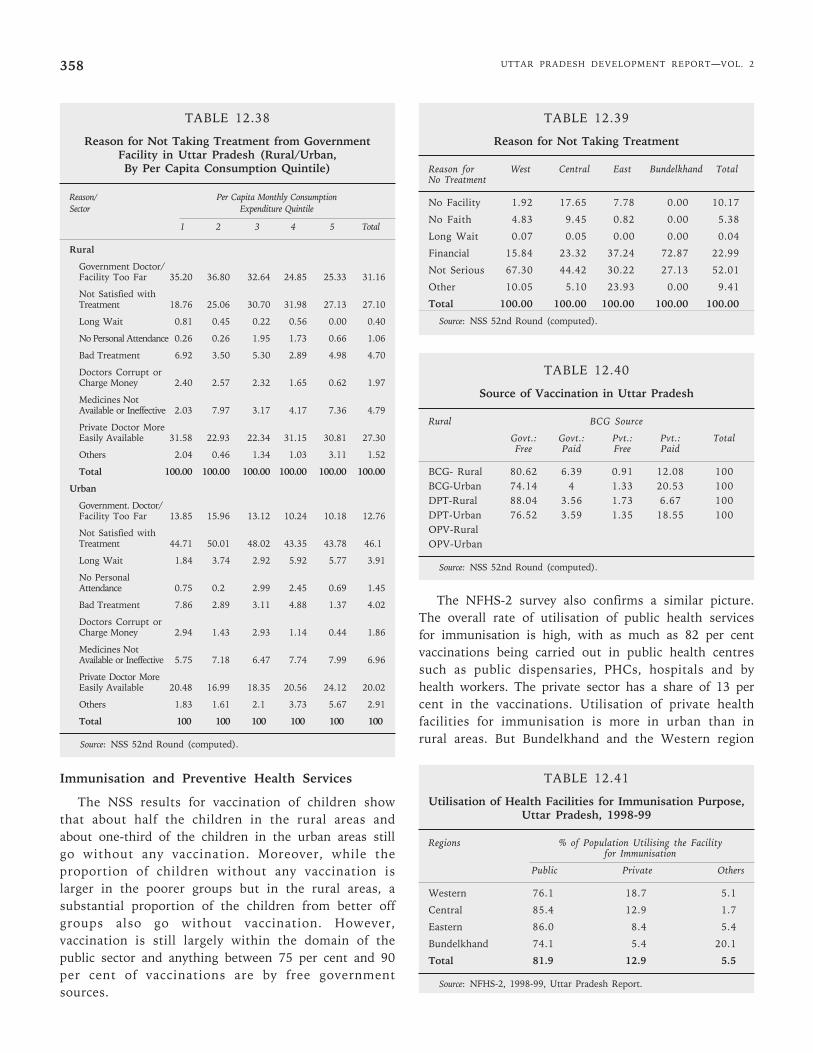
UTTAR PRADESH DEVELOPMENT REPORT—VOL. 2358
TABLE 12.38
Reason for Not Taking Treatment from GovernmentFacility in Uttar Pradesh (Rural/Urban,By Per Capita Consumption Quintile)
Reason/ Per Capita Monthly ConsumptionSector Expenditure Quintile
1 2 3 4 5 Total
Rural
Government Doctor/Facility Too Far 35.20 36.80 32.64 24.85 25.33 31.16
Not Satisfied withTreatment 18.76 25.06 30.70 31.98 27.13 27.10
Long Wait 0.81 0.45 0.22 0.56 0.00 0.40
No Personal Attendance 0.26 0.26 1.95 1.73 0.66 1.06
Bad Treatment 6.92 3.50 5.30 2.89 4.98 4.70
Doctors Corrupt orCharge Money 2.40 2.57 2.32 1.65 0.62 1.97
Medicines NotAvailable or Ineffective 2.03 7.97 3.17 4.17 7.36 4.79
Private Doctor MoreEasily Available 31.58 22.93 22.34 31.15 30.81 27.30
Others 2.04 0.46 1.34 1.03 3.11 1.52
Total 100.00 100.00 100.00 100.00 100.00 100.00
Urban
Government. Doctor/Facility Too Far 13.85 15.96 13.12 10.24 10.18 12.76
Not Satisfied withTreatment 44.71 50.01 48.02 43.35 43.78 46.1
Long Wait 1.84 3.74 2.92 5.92 5.77 3.91
No PersonalAttendance 0.75 0.2 2.99 2.45 0.69 1.45
Bad Treatment 7.86 2.89 3.11 4.88 1.37 4.02
Doctors Corrupt orCharge Money 2.94 1.43 2.93 1.14 0.44 1.86
Medicines NotAvailable or Ineffective 5.75 7.18 6.47 7.74 7.99 6.96
Private Doctor MoreEasily Available 20.48 16.99 18.35 20.56 24.12 20.02
Others 1.83 1.61 2.1 3.73 5.67 2.91
Total 100 100 100 100 100 100
Source: NSS 52nd Round (computed).
Immunisation and Preventive Health Services
The NSS results for vaccination of children showthat about half the children in the rural areas andabout one-third of the children in the urban areas stillgo without any vaccination. Moreover, while theproportion of children without any vaccination islarger in the poorer groups but in the rural areas, asubstantial proportion of the children from better offgroups also go without vaccination. However,vaccination is still largely within the domain of thepublic sector and anything between 75 per cent and 90per cent of vaccinations are by free governmentsources.
TABLE 12.39
Reason for Not Taking Treatment
Reason for West Central East Bundelkhand TotalNo Treatment
No Facility 1.92 17.65 7.78 0.00 10.17
No Faith 4.83 9.45 0.82 0.00 5.38
Long Wait 0.07 0.05 0.00 0.00 0.04
Financial 15.84 23.32 37.24 72.87 22.99
Not Serious 67.30 44.42 30.22 27.13 52.01
Other 10.05 5.10 23.93 0.00 9.41
Total 100.00 100.00 100.00 100.00 100.00
Source: NSS 52nd Round (computed).
TABLE 12.40
Source of Vaccination in Uttar Pradesh
Rural BCG Source
Govt.: Govt.: Pvt.: Pvt.: TotalFree Paid Free Paid
BCG- Rural 80.62 6.39 0.91 12.08 100BCG-Urban 74.14 4 1.33 20.53 100DPT-Rural 88.04 3.56 1.73 6.67 100DPT-Urban 76.52 3.59 1.35 18.55 100OPV-RuralOPV-Urban
Source: NSS 52nd Round (computed).
The NFHS-2 survey also confirms a similar picture.The overall rate of utilisation of public health servicesfor immunisation is high, with as much as 82 per centvaccinations being carried out in public health centressuch as public dispensaries, PHCs, hospitals and byhealth workers. The private sector has a share of 13 percent in the vaccinations. Utilisation of private healthfacilities for immunisation is more in urban than inrural areas. But Bundelkhand and the Western region
TABLE 12.41
Utilisation of Health Facilities for Immunisation Purpose,Uttar Pradesh, 1998-99
Regions % of Population Utilising the Facilityfor Immunisation
Public Private Others
Western 76.1 18.7 5.1
Central 85.4 12.9 1.7
Eastern 86.0 8.4 5.4
Bundelkhand 74.1 5.4 20.1
Total 81.9 12.9 5.5
Source: NFHS-2, 1998-99, Uttar Pradesh Report.
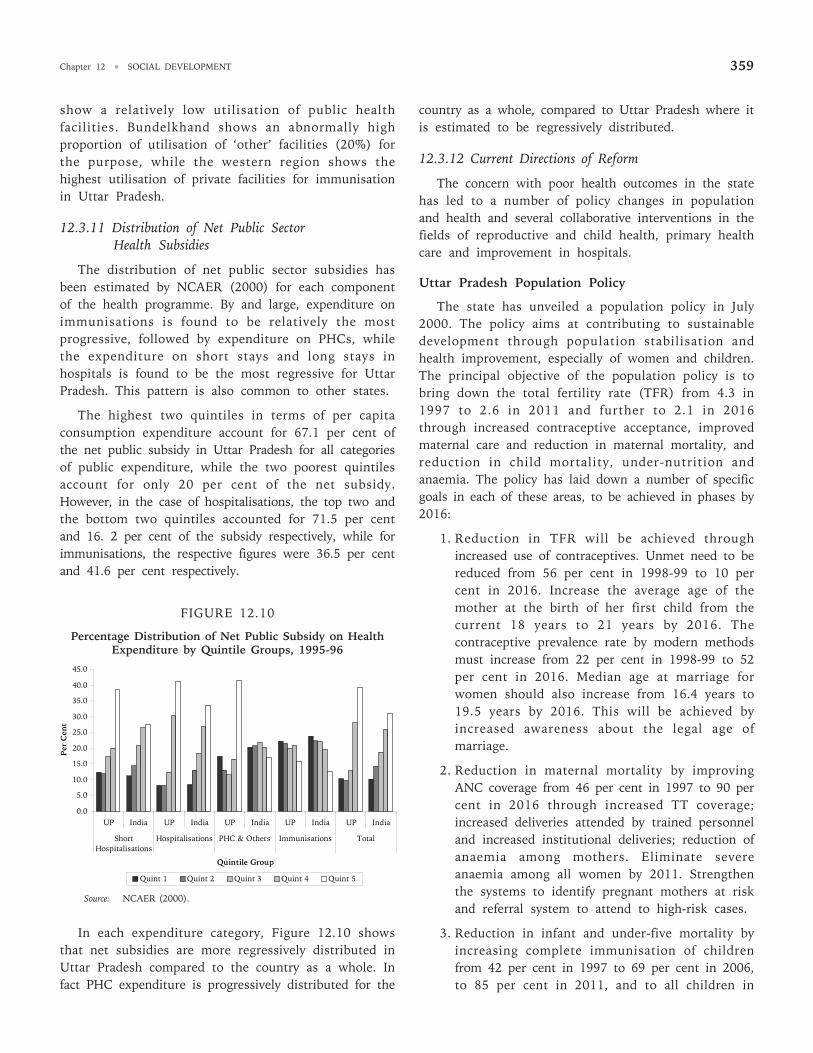
Chapter 12 • SOCIAL DEVELOPMENT 359
show a relatively low utilisation of public healthfacilities. Bundelkhand shows an abnormally highproportion of utilisation of ‘other’ facilities (20%) forthe purpose, while the western region shows thehighest utilisation of private facilities for immunisationin Uttar Pradesh.
12.3.11 Distribution of Net Public SectorHealth Subsidies
The distribution of net public sector subsidies hasbeen estimated by NCAER (2000) for each componentof the health programme. By and large, expenditure onimmunisations is found to be relatively the mostprogressive, followed by expenditure on PHCs, whilethe expenditure on short stays and long stays inhospitals is found to be the most regressive for UttarPradesh. This pattern is also common to other states.
The highest two quintiles in terms of per capitaconsumption expenditure account for 67.1 per cent ofthe net public subsidy in Uttar Pradesh for all categoriesof public expenditure, while the two poorest quintilesaccount for only 20 per cent of the net subsidy.However, in the case of hospitalisations, the top two andthe bottom two quintiles accounted for 71.5 per centand 16. 2 per cent of the subsidy respectively, while forimmunisations, the respective figures were 36.5 per centand 41.6 per cent respectively.
FIGURE 12.10
Percentage Distribution of Net Public Subsidy on HealthExpenditure by Quintile Groups, 1995-96
In each expenditure category, Figure 12.10 showsthat net subsidies are more regressively distributed inUttar Pradesh compared to the country as a whole. Infact PHC expenditure is progressively distributed for the
country as a whole, compared to Uttar Pradesh where itis estimated to be regressively distributed.
12.3.12 Current Directions of Reform
The concern with poor health outcomes in the statehas led to a number of policy changes in populationand health and several collaborative interventions in thefields of reproductive and child health, primary healthcare and improvement in hospitals.
Uttar Pradesh Population Policy
The state has unveiled a population policy in July2000. The policy aims at contributing to sustainabledevelopment through population stabilisation andhealth improvement, especially of women and children.The principal objective of the population policy is tobring down the total fertility rate (TFR) from 4.3 in1997 to 2.6 in 2011 and further to 2.1 in 2016through increased contraceptive acceptance, improvedmaternal care and reduction in maternal mortality, andreduction in child mortality, under-nutrition andanaemia. The policy has laid down a number of specificgoals in each of these areas, to be achieved in phases by2016:
1. Reduction in TFR will be achieved throughincreased use of contraceptives. Unmet need to bereduced from 56 per cent in 1998-99 to 10 percent in 2016. Increase the average age of themother at the birth of her first child from thecurrent 18 years to 21 years by 2016. Thecontraceptive prevalence rate by modern methodsmust increase from 22 per cent in 1998-99 to 52per cent in 2016. Median age at marriage forwomen should also increase from 16.4 years to19.5 years by 2016. This will be achieved byincreased awareness about the legal age ofmarriage.
2. Reduction in maternal mortality by improvingANC coverage from 46 per cent in 1997 to 90 percent in 2016 through increased TT coverage;increased deliveries attended by trained personneland increased institutional deliveries; reduction ofanaemia among mothers. Eliminate severeanaemia among all women by 2011. Strengthenthe systems to identify pregnant mothers at riskand referral system to attend to high-risk cases.
3. Reduction in infant and under-five mortality byincreasing complete immunisation of childrenfrom 42 per cent in 1997 to 69 per cent in 2006,to 85 per cent in 2011, and to all children in
0.0
5.0
10.0
15.0
20.0
25.0
30.0
35.0
40.0
45.0
UP India UP India UP India UP India UP India
ShortHospitalisations
Hospitalisations PHC & Others Immunisations Total
Quintile Group
Per
Cen
t
Quint 1 Quint 2 Quint 3 Quint 4 Quint 5
Source: NCAER (2000).
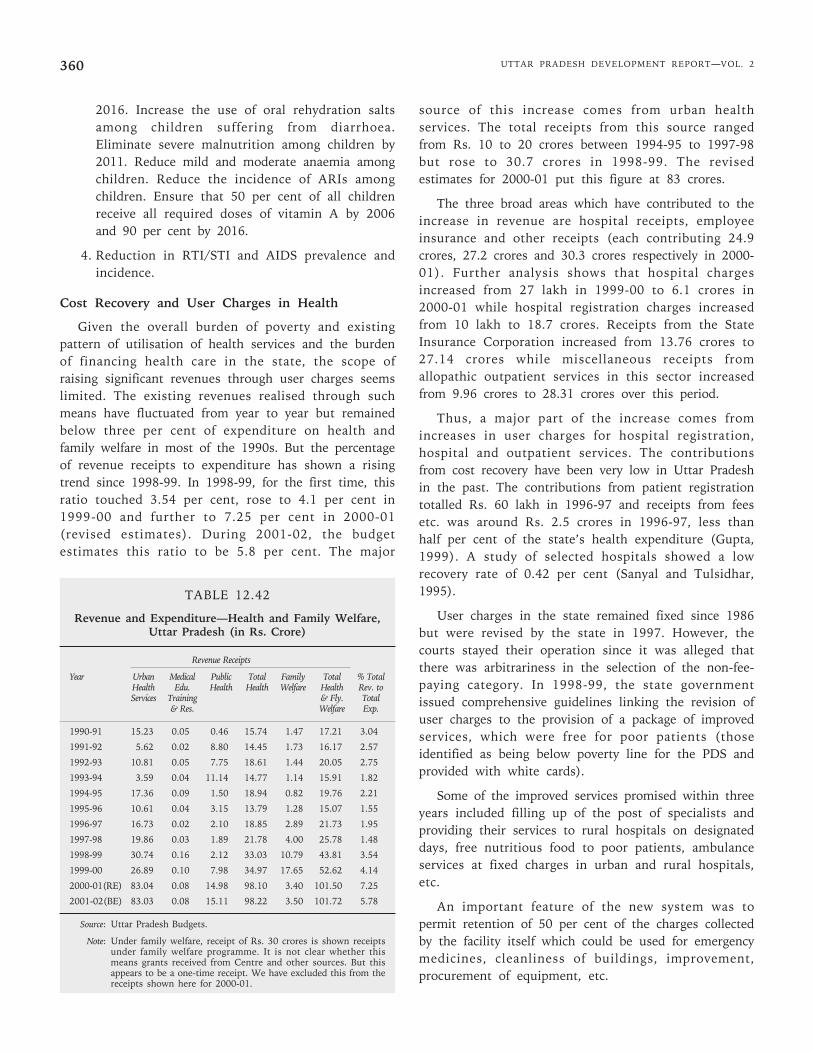
UTTAR PRADESH DEVELOPMENT REPORT—VOL. 2360
2016. Increase the use of oral rehydration saltsamong children suffering from diarrhoea.Eliminate severe malnutrition among children by2011. Reduce mild and moderate anaemia amongchildren. Reduce the incidence of ARIs amongchildren. Ensure that 50 per cent of all childrenreceive all required doses of vitamin A by 2006and 90 per cent by 2016.
4. Reduction in RTI/STI and AIDS prevalence andincidence.
Cost Recovery and User Charges in Health
Given the overall burden of poverty and existingpattern of utilisation of health services and the burdenof financing health care in the state, the scope ofraising significant revenues through user charges seemslimited. The existing revenues realised through suchmeans have fluctuated from year to year but remainedbelow three per cent of expenditure on health andfamily welfare in most of the 1990s. But the percentageof revenue receipts to expenditure has shown a risingtrend since 1998-99. In 1998-99, for the first time, thisratio touched 3.54 per cent, rose to 4.1 per cent in1999-00 and further to 7.25 per cent in 2000-01(revised estimates). During 2001-02, the budgetestimates this ratio to be 5.8 per cent. The major
source of this increase comes from urban healthservices. The total receipts from this source rangedfrom Rs. 10 to 20 crores between 1994-95 to 1997-98but rose to 30.7 crores in 1998-99. The revisedestimates for 2000-01 put this figure at 83 crores.
The three broad areas which have contributed to theincrease in revenue are hospital receipts, employeeinsurance and other receipts (each contributing 24.9crores, 27.2 crores and 30.3 crores respectively in 2000-01). Further analysis shows that hospital chargesincreased from 27 lakh in 1999-00 to 6.1 crores in2000-01 while hospital registration charges increasedfrom 10 lakh to 18.7 crores. Receipts from the StateInsurance Corporation increased from 13.76 crores to27.14 crores while miscellaneous receipts fromallopathic outpatient services in this sector increasedfrom 9.96 crores to 28.31 crores over this period.
Thus, a major part of the increase comes fromincreases in user charges for hospital registration,hospital and outpatient services. The contributionsfrom cost recovery have been very low in Uttar Pradeshin the past. The contributions from patient registrationtotalled Rs. 60 lakh in 1996-97 and receipts from feesetc. was around Rs. 2.5 crores in 1996-97, less thanhalf per cent of the state’s health expenditure (Gupta,1999). A study of selected hospitals showed a lowrecovery rate of 0.42 per cent (Sanyal and Tulsidhar,1995).
User charges in the state remained fixed since 1986but were revised by the state in 1997. However, thecourts stayed their operation since it was alleged thatthere was arbitrariness in the selection of the non-fee-paying category. In 1998-99, the state governmentissued comprehensive guidelines linking the revision ofuser charges to the provision of a package of improvedservices, which were free for poor patients (thoseidentified as being below poverty line for the PDS andprovided with white cards).
Some of the improved services promised within threeyears included filling up of the post of specialists andproviding their services to rural hospitals on designateddays, free nutritious food to poor patients, ambulanceservices at fixed charges in urban and rural hospitals,etc.
An important feature of the new system was topermit retention of 50 per cent of the charges collectedby the facility itself which could be used for emergencymedicines, cleanliness of buildings, improvement,procurement of equipment, etc.
TABLE 12.42
Revenue and Expenditure—Health and Family Welfare,Uttar Pradesh (in Rs. Crore)
Revenue Receipts
Year Urban Medical Public Total Family Total % TotalHealth Edu. Health Health Welfare Health Rev. toServices Training & Fly. Total
& Res. Welfare Exp.
1990-91 15.23 0.05 0.46 15.74 1.47 17.21 3.04
1991-92 5.62 0.02 8.80 14.45 1.73 16.17 2.57
1992-93 10.81 0.05 7.75 18.61 1.44 20.05 2.75
1993-94 3.59 0.04 11.14 14.77 1.14 15.91 1.82
1994-95 17.36 0.09 1.50 18.94 0.82 19.76 2.21
1995-96 10.61 0.04 3.15 13.79 1.28 15.07 1.55
1996-97 16.73 0.02 2.10 18.85 2.89 21.73 1.95
1997-98 19.86 0.03 1.89 21.78 4.00 25.78 1.48
1998-99 30.74 0.16 2.12 33.03 10.79 43.81 3.54
1999-00 26.89 0.10 7.98 34.97 17.65 52.62 4.14
2000-01(RE) 83.04 0.08 14.98 98.10 3.40 101.50 7.25
2001-02(BE) 83.03 0.08 15.11 98.22 3.50 101.72 5.78
Source: Uttar Pradesh Budgets.
Note: Under family welfare, receipt of Rs. 30 crores is shown receiptsunder family welfare programme. It is not clear whether thismeans grants received from Centre and other sources. But thisappears to be a one-time receipt. We have excluded this from thereceipts shown here for 2000-01.
Chapter 12 • SOCIAL DEVELOPMENT 361
A full assessment of the new system ofdiscriminatory user charges is still to be made. But oneobvious source of concern is the high extent ofinclusion and exclusion errors in the preparation of thebelow poverty line (BPL) lists in Uttar Pradesh(Srivastava, 2002).
The Uttar Pradesh Health SystemDevelopment Project (UPHSDP)
The UPHSDP started in 2000 with World Bankassistance for 10 years. The first phase of the Projectwill last five years and will involve a cost of about Rs468 crores of which 86 per cent will be World Bankcredit. The objective of the project is to establish a wellmanaged health system which delivers more effectivepolicy reform, institutional and human resourcedevelopment and investment in health services. Thus,the four pillars of the project are: (a) policy reforms,(b) strengthening and renovation of existing resources,(c) skill development of human resources, and(d) public and private partnerships.
A detailed health systems development policy matrixhas been evolved consisting of the following directions:
• Restoration and stepping up of allocations to thehealth sector.
• Increased allocation to drugs and other medicalsupplies and maintenance of equipment andincreased share of allocations to primary andsecondary health care.
• District level planning and budgeting to meetlocal needs within resource constraints.
• Cost sharing and user charges to partly covernon-salary recurrent steps, while at the sametaking steps to protect the poorest sections ofsociety.
• Increased public accountability andimplementation of the Citizen’s Charter.
• Strengthening of policy and strategy developmentcapabilities.
• Reduction in skill mismatch, improved incentivesfor rural postings, etc.
• Incorporation of the private sector in meetinghealth sector goals; better regulation of theprivate health sector and effective partnerships.
• Contracting for support services.
• Coordination of various projects for improvinghealth.
A Strategic Management Board (SMB) and StrategicSupport Group (SSG) have been set up to initiate policyreforms and capacity building in the medical and healthsystem. The infrastructure development component ofthe project will consist of improvements in buildingsand equipments by renovations, strengthening,additions and replacement in primary/community healthcentres and district (male/female) hospitals, and gettingambulances and computers in secondary level healthcare delivery institutions.
The project aims at renovation and strengthening of117 health units in 28 selected districts and equippingthese with necessary equipment and infrastructuralfacilities. It will also ensure availability of staff andmedicines at these centres.
In order to improve capacity of the health system,the project proposes to set up a computerised healthmanagement and disease surveillance informationsystem. It will also set up a district level diseasesurveillance system and strengthen labs for promptinvestigations.
Innovative approaches will be developed to makehealth services accessible to remote areas throughcommunity, NGO and public-private partnerships.The latter will also be used to provide a minimallevel of standardised medical services in otherareas.
Transparent quality maintenance systems will bedeveloped to ensure good quality medicines and controlon food adulteration.
The performance of the programme will be measuredby a number of indicators. These include:
(a) increased budgetary resources to the healthsector with greater share for the primary andsecondary levels and an increasing non-wagecomponent in the current expenditure; and
(b) improved health facility service quality measuredby increased utilisation of inpatient andoutpatient facilities, especially by the poor andby women; increased patient and attendantsatisfaction; increased referrals from lowerlevels, efficient utilisation of retained usercharges, availability of staff at centres accordingto norms, optimum use of disease surveillancesystem, adoption of clinical waste managementpractices, application of computerised financialpractices and other appropriate managementsystems, etc.
UTTAR PRADESH DEVELOPMENT REPORT—VOL. 2362
Reproductive and Child Health Programme (RCH)
Launched in 1998 with the support of the WorldBank, EC, UNFPA and UNICEF through the governmentof India for a period of five years with a total allocationof Rs. 6736.7 million, the programme includes allcomponents of maternal and child health, child survivaland safe motherhood, family planning services, RTI/TIand AIDS. All the districts in the state are being coveredsince April 1999. The objectives of the programme areto bring about a reduction in birth and death rates,infant and child mortality, child under nutrition, and toincrease the couple protection rate (CPR).
State Innovations in FamilyPlanning Services (SIFPS)
The SIFPS Project is another major initiative takenfor reorienting and revitalising the family planningservices in Uttar Pradesh. The project is the result ofan agreement signed between the GoI and the UnitedStates Agency for International Development (USAID)on September 30,1992. Under the agreement, USAID isto provide a total assistance of US$ 325 million, out ofwhich $225 million is to be spent in Uttar Pradesh forspecific activities and $100 millions to be spent onequipment, services and training for the project. Themajor objectives of the project are to: (1) bring downthe TFR from 5.4 (5.2 as per SRS 1993) to four at theend of project period of 10 years; (2) to increase theCPR from 35 to 50 per cent at the end of project periodof 10 years; (3) to increase percentage of birthsreceiving ANC from 30 to 40 per cent; (4) to increasepercentage of deliveries assisted by a doctor or nurse/mid wives from 17 per cent to 30 per cent.
The objectives are sought to be achieved through:
• Increasing access of family planning services byexpanding service delivery in the public sectorand in the non-governmental sector.
• Improving the quality of family planning servicesby expanding the choice of contraceptivemethods and improving the technicalcompetence of personnel.
• Promoting family planning by broadening supportamong leadership groups and increasing publicunderstanding of the benefits of family planning.
The project is implemented by an autonomoussociety (the State Innovations in Family PlanningServices Project Agency (SIFPSA)) and is presentlyoperative in 22 districts. It has funded more than 150private sector/NGO projects in the state.
State Programme for Action on Nutrition (SPAN)
In order to reduce child malnutrition, the GoUPDepartment of Women and Child Development hasdeveloped a state plan of action on nutrition. TheIntegrated Child Development Services (ICDS), is run bythe department with the support of UNICEF, CARE,WFP and the GoI in 550 rural blocks and 21 urbanslums (to be expanded to another 110 rural blocks withthe support of the World Bank), along with otherprogrammes and sectoral activities.
12.3.13 Future Challenges in Health inUttar Pradesh and Recommendations
Health is acknowledged to be a multiplex issuewhich has strong linkages with nutritional intake,environmental sanitation, availability of safe drinkingwater, education and awareness and the access topreventive and curative health care. Uttar Pradeshcontinues to have a high burden of disease, high levelsof infant and child mortality, high maternal mortality,low life expectancy which reflects a huge developmentalbacklog in the health-related spheres mentioned above.Moreover, progress in these indicators has been slow inthe recent decade.
Detailed district-level analysis carried out for theUttar Pradesh Human Development Report shows that thereis considerable variation in health outcomes acrossdistricts with a few districts showing a clustering ofpoor input and outcome indicators. As far as the healthcare system is concerned, the poor delivery of healthservices through the public health system is forcingpoor people to fall back upon a mainly unskilled andunqualified private sector for curative services. Despitepoor quality, the cost of accessing health services,especially hospitalisation services is very high inrelation to income, forcing the poor to remain outsidethe purview of these services.
The state government has laid down a number ofimportant health related goals in its population policy,discussed above in Section 3.12. These includeadherence to strict time bound objectives in improvingANC coverage, proportion of births attended by trainedpersonnel, reduction of anaemia among mothers,reduction in MMR, increase in child vaccination rates,reduction in IMR and CMR, reduction in childmalnutrition, and in diarrhoea and ARI cases, andimprovement in vitamin A coverage. As detailed above, anumber of reforms are already under way in the healthsector which address institutional, managerial,professional and financial issues. Some of the issues
Chapter 12 • SOCIAL DEVELOPMENT 363
which need to be underscored and are crucial toimproved health outcomes in the state are discussedbelow:
(1) The pattern of health outcomes across UttarPradesh again emphasises the need for aconvergent and holistic approach to health.Health should not be seen as a concern of theDepartment of Health and Family Welfare alone.Health goals should be dovetailed with goalsset in the areas of environmental sanitation,drinking water, elimination of maternal andchild malnutrition, education and healthawareness. Safe drinking water, availability oflatrines, drainage and sewage systems andwaste disposal should be a priority. The qualityof drinking water should be regularly monitoredby the health boards and the findingspublicised through radio and newspapers.
(2) The significant variations in the healthoutcomes across the state also call for adecentralised approach to health managementbased upon a holistic approach and convergencebetween basic services and health services, asoutlined earlier. Such an approach should relyupon district-level epidemiological surveillance,computerised MIS, flexibility in meeting gaps inrequirements locally, and greater control overhealth related decisions and health careinstitutions by people’s committees linked tothe representative institutions at the local level(such as village health committees, districthealth boards, etc.). A similar approach wasrecommended by the Bhore committee and isalso the cornerstone of the health care systemin states such as Kerala and Karnataka.
(3) Using inputs from micro-level planning at locallevels and people health committees,strengthened by epidemiological surveillanceand MIS, district health plans may be prepared.These plans should identify needs andrequirement gaps, from the primary health carelevel upwards and should set clear goals whichare linked to key health outcomes. Theperformance of the functionaries in the health-related sectors should be periodically assessedin terms of the achievement of these goals.
(4) A set of core standards in basic services andhealth care should be identified at each levelwith the help of the state government andshould be linked to the people’s charter in
health and basic services. The indicators andinputs which feed into the core standardsshould be easily monitorable and the standardsand the charter should create clear entitlementsand accountability.
(5) The requirement and gaps in the health caresystem are normally related to health personnel,medical inputs, equipment and institutionalreform and change. The health plans should beable to indicate non-resource-based changeswhich can lead to improved utilisation andbetter performance from existing resources. Atthe same time, the health plans should be ableto identify critical resource gaps, which alsocontribute to sub-optimal performance throughshortages, etc.
(6) At the state level, the district, regions and statelevel needs in relation to the health-relatedsectors have to be carefully strategised andprioritised. In comparison to other states, UttarPradesh per capita allocation to health, familywelfare, water and sanitation is much less. Wehave no analysis of these expenditures at thesubstate level, but it is likely that per capitaexpenditures are much below the state averagein several parts of the state. Expenditures mayhave to be raised at the state and district levelto ensure good performance. Even to arrive atthe current national average, Uttar Pradeshexpenditure on health and related sectors wouldneed to be more than doubled. The under-funding of the health sector is now wellrecognised and the new national policy onhealth aims at increasing the share of healthexpenditure in GDP from about 1 to 2 per cent,with the Centre bearing up most of theadditional burden. Assuming progressiveness inCentral allocations, clear financial goals andtargets can be set after taking into accountrequirements and the current slack in terms ofthe efficiency of resource use. The raising ofuser charges for the non-poor, permission forits retention at the unit level, and laying downof service standards are moves in the rightdirections, but identification of the eligible poorand provision of quality will remain majorissues requiring close monitoring.
(7) The state has a large set-up of trained privatemedical and para-medical staff, and a muchlarger untrained component which has been
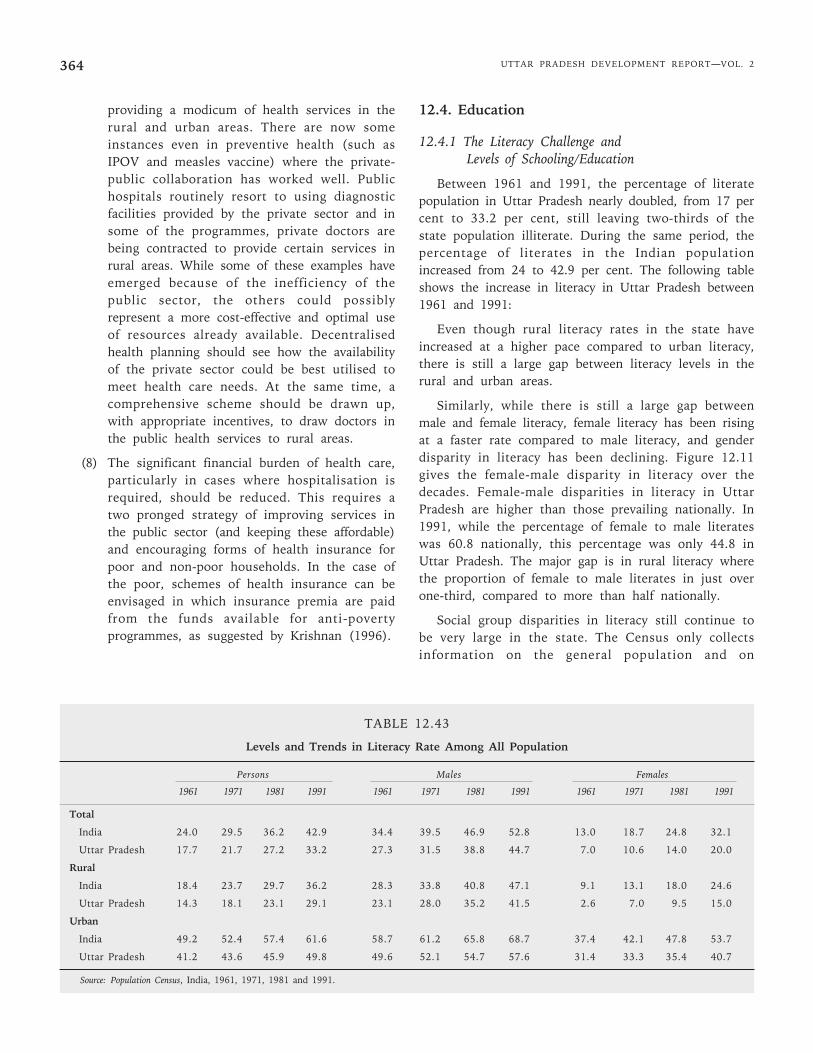
UTTAR PRADESH DEVELOPMENT REPORT—VOL. 2364
providing a modicum of health services in therural and urban areas. There are now someinstances even in preventive health (such asIPOV and measles vaccine) where the private-public collaboration has worked well. Publichospitals routinely resort to using diagnosticfacilities provided by the private sector and insome of the programmes, private doctors arebeing contracted to provide certain services inrural areas. While some of these examples haveemerged because of the inefficiency of thepublic sector, the others could possiblyrepresent a more cost-effective and optimal useof resources already available. Decentralisedhealth planning should see how the availabilityof the private sector could be best utilised tomeet health care needs. At the same time, acomprehensive scheme should be drawn up,with appropriate incentives, to draw doctors inthe public health services to rural areas.
(8) The significant financial burden of health care,particularly in cases where hospitalisation isrequired, should be reduced. This requires atwo pronged strategy of improving services inthe public sector (and keeping these affordable)and encouraging forms of health insurance forpoor and non-poor households. In the case ofthe poor, schemes of health insurance can beenvisaged in which insurance premia are paidfrom the funds available for anti-povertyprogrammes, as suggested by Krishnan (1996).
12.4. Education
12.4.1 The Literacy Challenge andLevels of Schooling/Education
Between 1961 and 1991, the percentage of literatepopulation in Uttar Pradesh nearly doubled, from 17 percent to 33.2 per cent, still leaving two-thirds of thestate population illiterate. During the same period, thepercentage of literates in the Indian populationincreased from 24 to 42.9 per cent. The following tableshows the increase in literacy in Uttar Pradesh between1961 and 1991:
Even though rural literacy rates in the state haveincreased at a higher pace compared to urban literacy,there is still a large gap between literacy levels in therural and urban areas.
Similarly, while there is still a large gap betweenmale and female literacy, female literacy has been risingat a faster rate compared to male literacy, and genderdisparity in literacy has been declining. Figure 12.11gives the female-male disparity in literacy over thedecades. Female-male disparities in literacy in UttarPradesh are higher than those prevailing nationally. In1991, while the percentage of female to male literateswas 60.8 nationally, this percentage was only 44.8 inUttar Pradesh. The major gap is in rural literacy wherethe proportion of female to male literates in just overone-third, compared to more than half nationally.
Social group disparities in literacy still continue tobe very large in the state. The Census only collectsinformation on the general population and on
TABLE 12.43
Levels and Trends in Literacy Rate Among All Population
Persons Males Females
1961 1971 1981 1991 1961 1971 1981 1991 1961 1971 1981 1991
Total
India 24.0 29.5 36.2 42.9 34.4 39.5 46.9 52.8 13.0 18.7 24.8 32.1
Uttar Pradesh 17.7 21.7 27.2 33.2 27.3 31.5 38.8 44.7 7.0 10.6 14.0 20.0
Rural
India 18.4 23.7 29.7 36.2 28.3 33.8 40.8 47.1 9.1 13.1 18.0 24.6
Uttar Pradesh 14.3 18.1 23.1 29.1 23.1 28.0 35.2 41.5 2.6 7.0 9.5 15.0
Urban
India 49.2 52.4 57.4 61.6 58.7 61.2 65.8 68.7 37.4 42.1 47.8 53.7
Uttar Pradesh 41.2 43.6 45.9 49.8 49.6 52.1 54.7 57.6 31.4 33.3 35.4 40.7
Source: Population Census, India, 1961, 1971, 1981 and 1991.
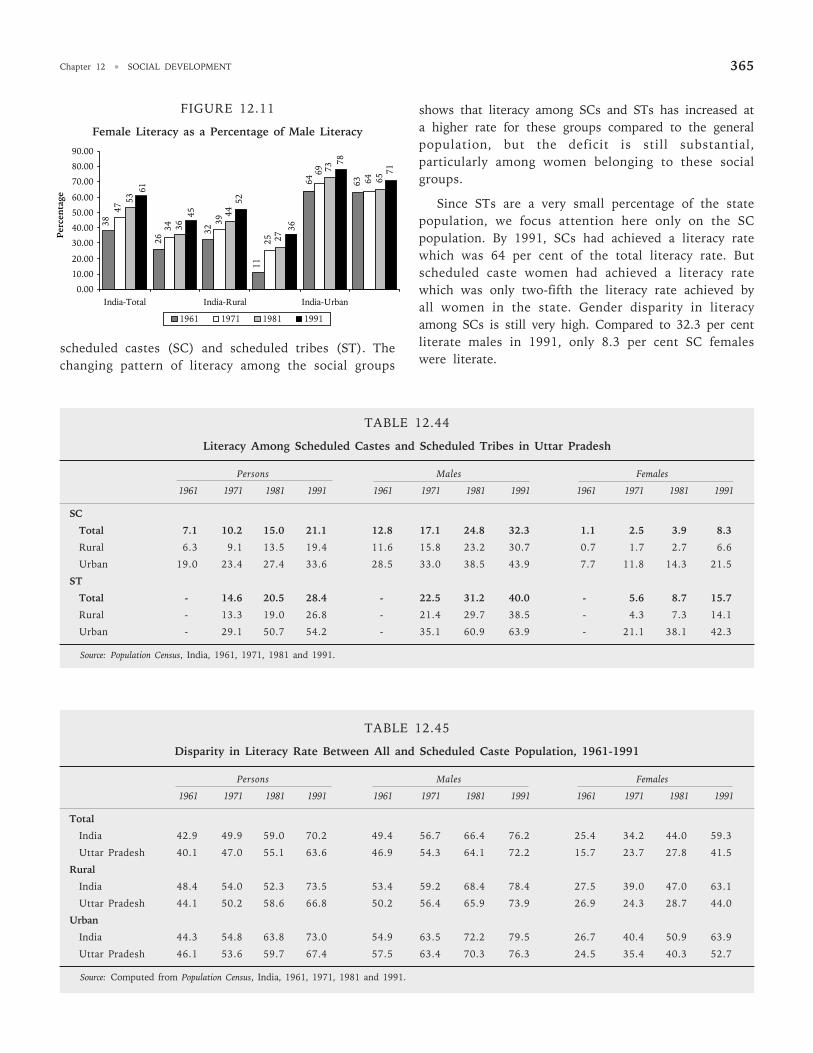
Chapter 12 • SOCIAL DEVELOPMENT 365
scheduled castes (SC) and scheduled tribes (ST). Thechanging pattern of literacy among the social groups
shows that literacy among SCs and STs has increased ata higher rate for these groups compared to the generalpopulation, but the deficit is still substantial,particularly among women belonging to these socialgroups.
Since STs are a very small percentage of the statepopulation, we focus attention here only on the SCpopulation. By 1991, SCs had achieved a literacy ratewhich was 64 per cent of the total literacy rate. Butscheduled caste women had achieved a literacy ratewhich was only two-fifth the literacy rate achieved byall women in the state. Gender disparity in literacyamong SCs is still very high. Compared to 32.3 per centliterate males in 1991, only 8.3 per cent SC femaleswere literate.
TABLE 12.44
Literacy Among Scheduled Castes and Scheduled Tribes in Uttar Pradesh
Persons Males Females
1961 1971 1981 1991 1961 1971 1981 1991 1961 1971 1981 1991
SC
Total 7.1 10.2 15.0 21.1 12.8 17.1 24.8 32.3 1.1 2.5 3.9 8.3
Rural 6.3 9.1 13.5 19.4 11.6 15.8 23.2 30.7 0.7 1.7 2.7 6.6
Urban 19.0 23.4 27.4 33.6 28.5 33.0 38.5 43.9 7.7 11.8 14.3 21.5
ST
Total - 14.6 20.5 28.4 - 22.5 31.2 40.0 - 5.6 8.7 15.7
Rural - 13.3 19.0 26.8 - 21.4 29.7 38.5 - 4.3 7.3 14.1
Urban - 29.1 50.7 54.2 - 35.1 60.9 63.9 - 21.1 38.1 42.3
Source: Population Census, India, 1961, 1971, 1981 and 1991.
TABLE 12.45
Disparity in Literacy Rate Between All and Scheduled Caste Population, 1961-1991
Persons Males Females
1961 1971 1981 1991 1961 1971 1981 1991 1961 1971 1981 1991
Total
India 42.9 49.9 59.0 70.2 49.4 56.7 66.4 76.2 25.4 34.2 44.0 59.3
Uttar Pradesh 40.1 47.0 55.1 63.6 46.9 54.3 64.1 72.2 15.7 23.7 27.8 41.5
Rural
India 48.4 54.0 52.3 73.5 53.4 59.2 68.4 78.4 27.5 39.0 47.0 63.1
Uttar Pradesh 44.1 50.2 58.6 66.8 50.2 56.4 65.9 73.9 26.9 24.3 28.7 44.0
Urban
India 44.3 54.8 63.8 73.0 54.9 63.5 72.2 79.5 26.7 40.4 50.9 63.9
Uttar Pradesh 46.1 53.6 59.7 67.4 57.5 63.4 70.3 76.3 24.5 35.4 40.3 52.7
Source: Computed from Population Census, India, 1961, 1971, 1981 and 1991.
FIGURE 12.11
Female Literacy as a Percentage of Male Literacy
45
3638
26
6364
32
11
47
34
64
69
39
25
53
36
65
73
44
27
71
61
78
52
0.00
10.00
20.00
30.00
40.00
50.00
60.00
70.00
80.00
90.00
India-Total India-Rural India-Urban
Per
cen
tage
1961 1971 1981 1991
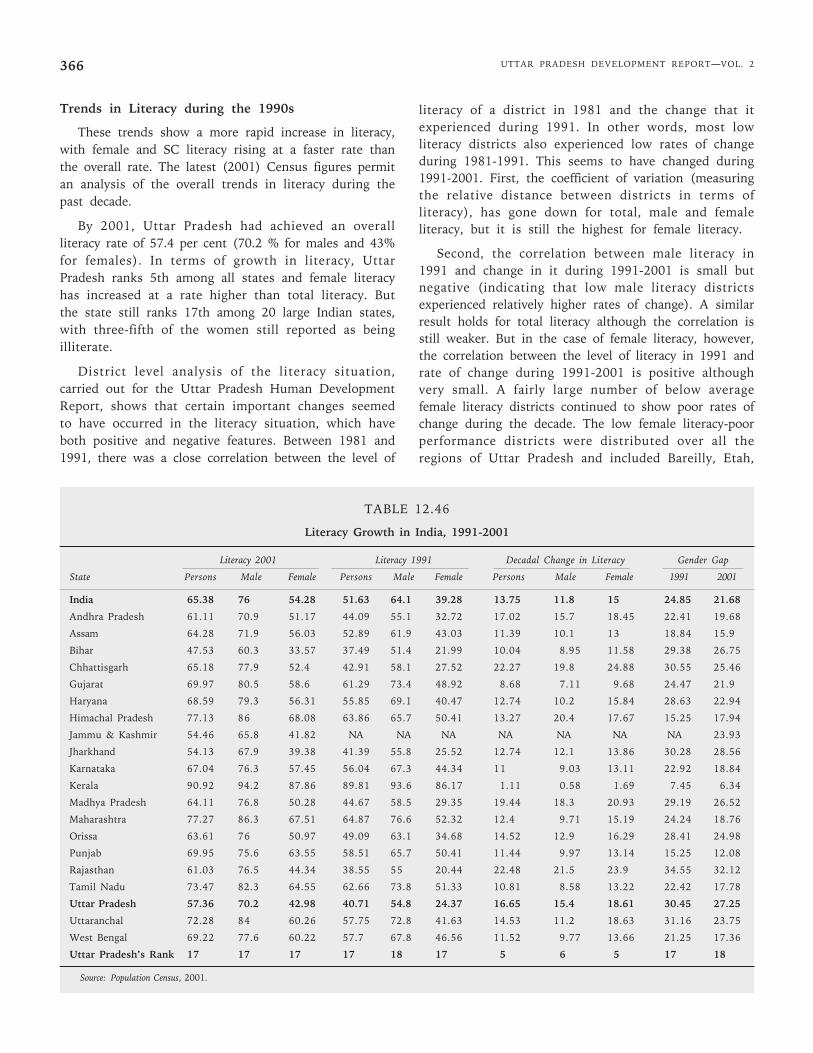
UTTAR PRADESH DEVELOPMENT REPORT—VOL. 2366
Trends in Literacy during the 1990s
These trends show a more rapid increase in literacy,with female and SC literacy rising at a faster rate thanthe overall rate. The latest (2001) Census figures permitan analysis of the overall trends in literacy during thepast decade.
By 2001, Uttar Pradesh had achieved an overallliteracy rate of 57.4 per cent (70.2 % for males and 43%for females). In terms of growth in literacy, UttarPradesh ranks 5th among all states and female literacyhas increased at a rate higher than total literacy. Butthe state still ranks 17th among 20 large Indian states,with three-fifth of the women still reported as beingilliterate.
District level analysis of the literacy situation,carried out for the Uttar Pradesh Human DevelopmentReport, shows that certain important changes seemedto have occurred in the literacy situation, which haveboth positive and negative features. Between 1981 and1991, there was a close correlation between the level of
literacy of a district in 1981 and the change that itexperienced during 1991. In other words, most lowliteracy districts also experienced low rates of changeduring 1981-1991. This seems to have changed during1991-2001. First, the coefficient of variation (measuringthe relative distance between districts in terms ofliteracy), has gone down for total, male and femaleliteracy, but it is still the highest for female literacy.
Second, the correlation between male literacy in1991 and change in it during 1991-2001 is small butnegative (indicating that low male literacy districtsexperienced relatively higher rates of change). A similarresult holds for total literacy although the correlation isstill weaker. But in the case of female literacy, however,the correlation between the level of literacy in 1991 andrate of change during 1991-2001 is positive althoughvery small. A fairly large number of below averagefemale literacy districts continued to show poor rates ofchange during the decade. The low female literacy-poorperformance districts were distributed over all theregions of Uttar Pradesh and included Bareilly, Etah,
TABLE 12.46
Literacy Growth in India, 1991-2001
Literacy 2001 Literacy 1991 Decadal Change in Literacy Gender Gap
State Persons Male Female Persons Male Female Persons Male Female 1991 2001
India 65.38 76 54.28 51.63 64.1 39.28 13.75 11.8 15 24.85 21.68
Andhra Pradesh 61.11 70.9 51.17 44.09 55.1 32.72 17.02 15.7 18.45 22.41 19.68
Assam 64.28 71.9 56.03 52.89 61.9 43.03 11.39 10.1 13 18.84 15.9
Bihar 47.53 60.3 33.57 37.49 51.4 21.99 10.04 8.95 11.58 29.38 26.75
Chhattisgarh 65.18 77.9 52.4 42.91 58.1 27.52 22.27 19.8 24.88 30.55 25.46
Gujarat 69.97 80.5 58.6 61.29 73.4 48.92 8.68 7.11 9.68 24.47 21.9
Haryana 68.59 79.3 56.31 55.85 69.1 40.47 12.74 10.2 15.84 28.63 22.94
Himachal Pradesh 77.13 86 68.08 63.86 65.7 50.41 13.27 20.4 17.67 15.25 17.94
Jammu & Kashmir 54.46 65.8 41.82 NA NA NA NA NA NA NA 23.93
Jharkhand 54.13 67.9 39.38 41.39 55.8 25.52 12.74 12.1 13.86 30.28 28.56
Karnataka 67.04 76.3 57.45 56.04 67.3 44.34 11 9.03 13.11 22.92 18.84
Kerala 90.92 94.2 87.86 89.81 93.6 86.17 1.11 0.58 1.69 7.45 6.34
Madhya Pradesh 64.11 76.8 50.28 44.67 58.5 29.35 19.44 18.3 20.93 29.19 26.52
Maharashtra 77.27 86.3 67.51 64.87 76.6 52.32 12.4 9.71 15.19 24.24 18.76
Orissa 63.61 76 50.97 49.09 63.1 34.68 14.52 12.9 16.29 28.41 24.98
Punjab 69.95 75.6 63.55 58.51 65.7 50.41 11.44 9.97 13.14 15.25 12.08
Rajasthan 61.03 76.5 44.34 38.55 55 20.44 22.48 21.5 23.9 34.55 32.12
Tamil Nadu 73.47 82.3 64.55 62.66 73.8 51.33 10.81 8.58 13.22 22.42 17.78
Uttar Pradesh 57.36 70.2 42.98 40.71 54.8 24.37 16.65 15.4 18.61 30.45 27.25
Uttaranchal 72.28 84 60.26 57.75 72.8 41.63 14.53 11.2 18.63 31.16 23.75
West Bengal 69.22 77.6 60.22 57.7 67.8 46.56 11.52 9.77 13.66 21.25 17.36
Uttar Pradesh’s Rank 17 17 17 17 18 17 5 6 5 17 18
Source: Population Census, 2001.
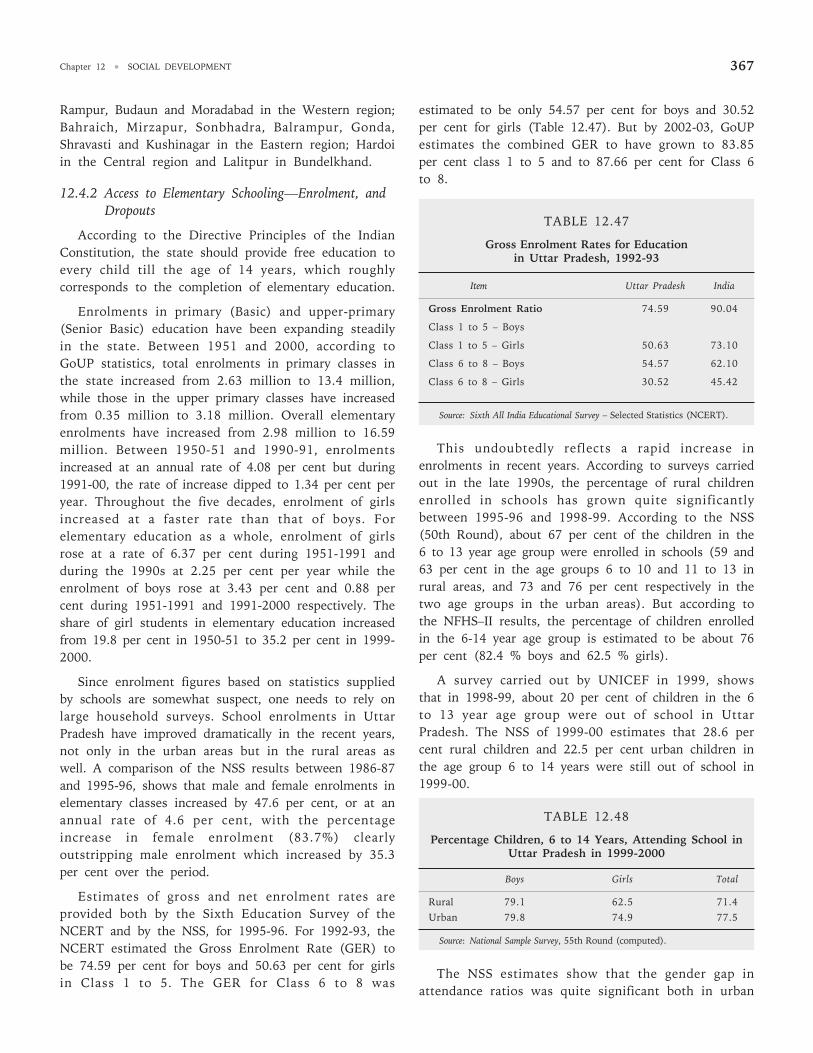
Chapter 12 • SOCIAL DEVELOPMENT 367
Rampur, Budaun and Moradabad in the Western region;Bahraich, Mirzapur, Sonbhadra, Balrampur, Gonda,Shravasti and Kushinagar in the Eastern region; Hardoiin the Central region and Lalitpur in Bundelkhand.
12.4.2 Access to Elementary Schooling—Enrolment, andDropouts
According to the Directive Principles of the IndianConstitution, the state should provide free education toevery child till the age of 14 years, which roughlycorresponds to the completion of elementary education.
Enrolments in primary (Basic) and upper-primary(Senior Basic) education have been expanding steadilyin the state. Between 1951 and 2000, according toGoUP statistics, total enrolments in primary classes inthe state increased from 2.63 million to 13.4 million,while those in the upper primary classes have increasedfrom 0.35 million to 3.18 million. Overall elementaryenrolments have increased from 2.98 million to 16.59million. Between 1950-51 and 1990-91, enrolmentsincreased at an annual rate of 4.08 per cent but during1991-00, the rate of increase dipped to 1.34 per cent peryear. Throughout the five decades, enrolment of girlsincreased at a faster rate than that of boys. Forelementary education as a whole, enrolment of girlsrose at a rate of 6.37 per cent during 1951-1991 andduring the 1990s at 2.25 per cent per year while theenrolment of boys rose at 3.43 per cent and 0.88 percent during 1951-1991 and 1991-2000 respectively. Theshare of girl students in elementary education increasedfrom 19.8 per cent in 1950-51 to 35.2 per cent in 1999-2000.
Since enrolment figures based on statistics suppliedby schools are somewhat suspect, one needs to rely onlarge household surveys. School enrolments in UttarPradesh have improved dramatically in the recent years,not only in the urban areas but in the rural areas aswell. A comparison of the NSS results between 1986-87and 1995-96, shows that male and female enrolments inelementary classes increased by 47.6 per cent, or at anannual rate of 4.6 per cent, with the percentageincrease in female enrolment (83.7%) clearlyoutstripping male enrolment which increased by 35.3per cent over the period.
Estimates of gross and net enrolment rates areprovided both by the Sixth Education Survey of theNCERT and by the NSS, for 1995-96. For 1992-93, theNCERT estimated the Gross Enrolment Rate (GER) tobe 74.59 per cent for boys and 50.63 per cent for girlsin Class 1 to 5. The GER for Class 6 to 8 was
estimated to be only 54.57 per cent for boys and 30.52per cent for girls (Table 12.47). But by 2002-03, GoUPestimates the combined GER to have grown to 83.85per cent class 1 to 5 and to 87.66 per cent for Class 6to 8.
TABLE 12.47
Gross Enrolment Rates for Educationin Uttar Pradesh, 1992-93
Item Uttar Pradesh India
Gross Enrolment Ratio 74.59 90.04
Class 1 to 5 – Boys
Class 1 to 5 – Girls 50.63 73.10
Class 6 to 8 – Boys 54.57 62.10
Class 6 to 8 – Girls 30.52 45.42
Source: Sixth All India Educational Survey – Selected Statistics (NCERT).
This undoubtedly reflects a rapid increase inenrolments in recent years. According to surveys carriedout in the late 1990s, the percentage of rural childrenenrolled in schools has grown quite significantlybetween 1995-96 and 1998-99. According to the NSS(50th Round), about 67 per cent of the children in the6 to 13 year age group were enrolled in schools (59 and63 per cent in the age groups 6 to 10 and 11 to 13 inrural areas, and 73 and 76 per cent respectively in thetwo age groups in the urban areas). But according tothe NFHS–II results, the percentage of children enrolledin the 6-14 year age group is estimated to be about 76per cent (82.4 % boys and 62.5 % girls).
A survey carried out by UNICEF in 1999, showsthat in 1998-99, about 20 per cent of children in the 6to 13 year age group were out of school in UttarPradesh. The NSS of 1999-00 estimates that 28.6 percent rural children and 22.5 per cent urban children inthe age group 6 to 14 years were still out of school in1999-00.
TABLE 12.48
Percentage Children, 6 to 14 Years, Attending School inUttar Pradesh in 1999-2000
Boys Girls Total
Rural 79.1 62.5 71.4Urban 79.8 74.9 77.5
Source: National Sample Survey, 55th Round (computed).
The NSS estimates show that the gender gap inattendance ratios was quite significant both in urban
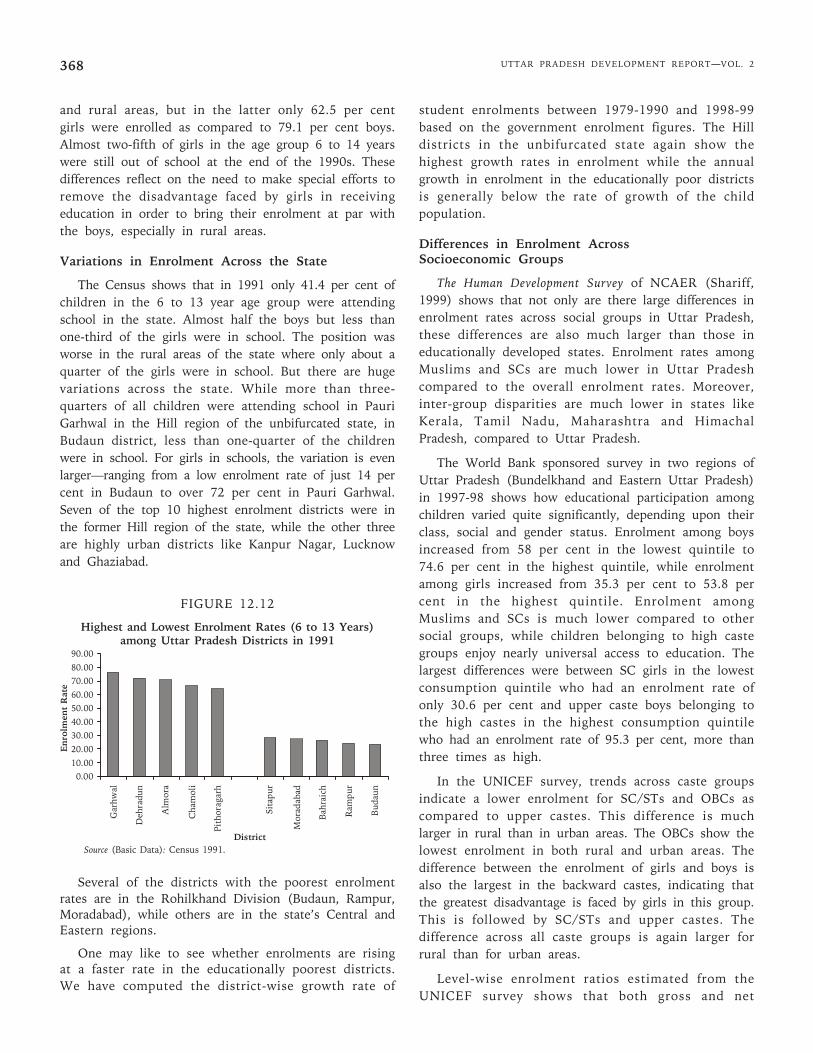
UTTAR PRADESH DEVELOPMENT REPORT—VOL. 2368
and rural areas, but in the latter only 62.5 per centgirls were enrolled as compared to 79.1 per cent boys.Almost two-fifth of girls in the age group 6 to 14 yearswere still out of school at the end of the 1990s. Thesedifferences reflect on the need to make special efforts toremove the disadvantage faced by girls in receivingeducation in order to bring their enrolment at par withthe boys, especially in rural areas.
Variations in Enrolment Across the State
The Census shows that in 1991 only 41.4 per cent ofchildren in the 6 to 13 year age group were attendingschool in the state. Almost half the boys but less thanone-third of the girls were in school. The position wasworse in the rural areas of the state where only about aquarter of the girls were in school. But there are hugevariations across the state. While more than three-quarters of all children were attending school in PauriGarhwal in the Hill region of the unbifurcated state, inBudaun district, less than one-quarter of the childrenwere in school. For girls in schools, the variation is evenlarger—ranging from a low enrolment rate of just 14 percent in Budaun to over 72 per cent in Pauri Garhwal.Seven of the top 10 highest enrolment districts were inthe former Hill region of the state, while the other threeare highly urban districts like Kanpur Nagar, Lucknowand Ghaziabad.
FIGURE 12.12
Highest and Lowest Enrolment Rates (6 to 13 Years)among Uttar Pradesh Districts in 1991
Several of the districts with the poorest enrolmentrates are in the Rohilkhand Division (Budaun, Rampur,Moradabad), while others are in the state’s Central andEastern regions.
One may like to see whether enrolments are risingat a faster rate in the educationally poorest districts.We have computed the district-wise growth rate of
student enrolments between 1979-1990 and 1998-99based on the government enrolment figures. The Hilldistricts in the unbifurcated state again show thehighest growth rates in enrolment while the annualgrowth in enrolment in the educationally poor districtsis generally below the rate of growth of the childpopulation.
Differences in Enrolment AcrossSocioeconomic Groups
The Human Development Survey of NCAER (Shariff,1999) shows that not only are there large differences inenrolment rates across social groups in Uttar Pradesh,these differences are also much larger than those ineducationally developed states. Enrolment rates amongMuslims and SCs are much lower in Uttar Pradeshcompared to the overall enrolment rates. Moreover,inter-group disparities are much lower in states likeKerala, Tamil Nadu, Maharashtra and HimachalPradesh, compared to Uttar Pradesh.
The World Bank sponsored survey in two regions ofUttar Pradesh (Bundelkhand and Eastern Uttar Pradesh)in 1997-98 shows how educational participation amongchildren varied quite significantly, depending upon theirclass, social and gender status. Enrolment among boysincreased from 58 per cent in the lowest quintile to74.6 per cent in the highest quintile, while enrolmentamong girls increased from 35.3 per cent to 53.8 percent in the highest quintile. Enrolment amongMuslims and SCs is much lower compared to othersocial groups, while children belonging to high castegroups enjoy nearly universal access to education. Thelargest differences were between SC girls in the lowestconsumption quintile who had an enrolment rate ofonly 30.6 per cent and upper caste boys belonging tothe high castes in the highest consumption quintilewho had an enrolment rate of 95.3 per cent, more thanthree times as high.
In the UNICEF survey, trends across caste groupsindicate a lower enrolment for SC/STs and OBCs ascompared to upper castes. This difference is muchlarger in rural than in urban areas. The OBCs show thelowest enrolment in both rural and urban areas. Thedifference between the enrolment of girls and boys isalso the largest in the backward castes, indicating thatthe greatest disadvantage is faced by girls in this group.This is followed by SC/STs and upper castes. Thedifference across all caste groups is again larger forrural than for urban areas.
Level-wise enrolment ratios estimated from theUNICEF survey shows that both gross and net
90.00
80.0070.00
60.0050.00
40.0030.00
20.00
10.000.00
Gar
hwal
Deh
radu
n
Alm
ora
Cha
mol
i
Pith
orag
arh
Sita
pur
Mor
adab
ad
Bah
raic
h
Ram
pur
Bud
aun
Enr
olm
ent
Rat
e
DistrictSource (Basic Data): Census 1991.
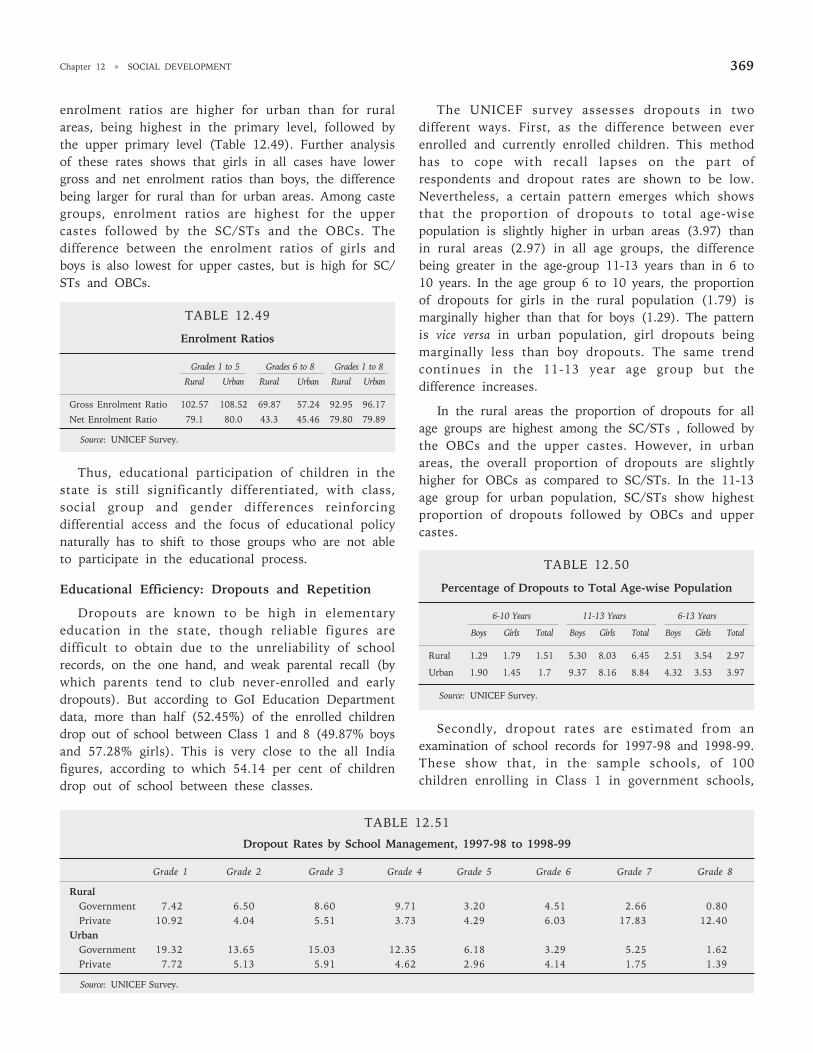
Chapter 12 • SOCIAL DEVELOPMENT 369
enrolment ratios are higher for urban than for ruralareas, being highest in the primary level, followed bythe upper primary level (Table 12.49). Further analysisof these rates shows that girls in all cases have lowergross and net enrolment ratios than boys, the differencebeing larger for rural than for urban areas. Among castegroups, enrolment ratios are highest for the uppercastes followed by the SC/STs and the OBCs. Thedifference between the enrolment ratios of girls andboys is also lowest for upper castes, but is high for SC/STs and OBCs.
TABLE 12.49
Enrolment Ratios
Grades 1 to 5 Grades 6 to 8 Grades 1 to 8
Rural Urban Rural Urban Rural Urban
Gross Enrolment Ratio 102.57 108.52 69.87 57.24 92.95 96.17
Net Enrolment Ratio 79.1 80.0 43.3 45.46 79.80 79.89
Source: UNICEF Survey.
Thus, educational participation of children in thestate is still significantly differentiated, with class,social group and gender differences reinforcingdifferential access and the focus of educational policynaturally has to shift to those groups who are not ableto participate in the educational process.
Educational Efficiency: Dropouts and Repetition
Dropouts are known to be high in elementaryeducation in the state, though reliable figures aredifficult to obtain due to the unreliability of schoolrecords, on the one hand, and weak parental recall (bywhich parents tend to club never-enrolled and earlydropouts). But according to GoI Education Departmentdata, more than half (52.45%) of the enrolled childrendrop out of school between Class 1 and 8 (49.87% boysand 57.28% girls). This is very close to the all Indiafigures, according to which 54.14 per cent of childrendrop out of school between these classes.
The UNICEF survey assesses dropouts in twodifferent ways. First, as the difference between everenrolled and currently enrolled children. This methodhas to cope with recall lapses on the part ofrespondents and dropout rates are shown to be low.Nevertheless, a certain pattern emerges which showsthat the proportion of dropouts to total age-wisepopulation is slightly higher in urban areas (3.97) thanin rural areas (2.97) in all age groups, the differencebeing greater in the age-group 11-13 years than in 6 to10 years. In the age group 6 to 10 years, the proportionof dropouts for girls in the rural population (1.79) ismarginally higher than that for boys (1.29). The patternis vice versa in urban population, girl dropouts beingmarginally less than boy dropouts. The same trendcontinues in the 11-13 year age group but thedifference increases.
In the rural areas the proportion of dropouts for allage groups are highest among the SC/STs , followed bythe OBCs and the upper castes. However, in urbanareas, the overall proportion of dropouts are slightlyhigher for OBCs as compared to SC/STs. In the 11-13age group for urban population, SC/STs show highestproportion of dropouts followed by OBCs and uppercastes.
TABLE 12.50
Percentage of Dropouts to Total Age-wise Population
6-10 Years 11-13 Years 6-13 Years
Boys Girls Total Boys Girls Total Boys Girls Total
Rural 1.29 1.79 1.51 5.30 8.03 6.45 2.51 3.54 2.97
Urban 1.90 1.45 1.7 9.37 8.16 8.84 4.32 3.53 3.97
Source: UNICEF Survey.
Secondly, dropout rates are estimated from anexamination of school records for 1997-98 and 1998-99.These show that, in the sample schools, of 100children enrolling in Class 1 in government schools,
TABLE 12.51
Dropout Rates by School Management, 1997-98 to 1998-99
Grade 1 Grade 2 Grade 3 Grade 4 Grade 5 Grade 6 Grade 7 Grade 8
RuralGovernment 7.42 6.50 8.60 9.71 3.20 4.51 2.66 0.80Private 10.92 4.04 5.51 3.73 4.29 6.03 17.83 12.40
UrbanGovernment 19.32 13.65 15.03 12.35 6.18 3.29 5.25 1.62Private 7.72 5.13 5.91 4.62 2.96 4.14 1.75 1.39
Source: UNICEF Survey.
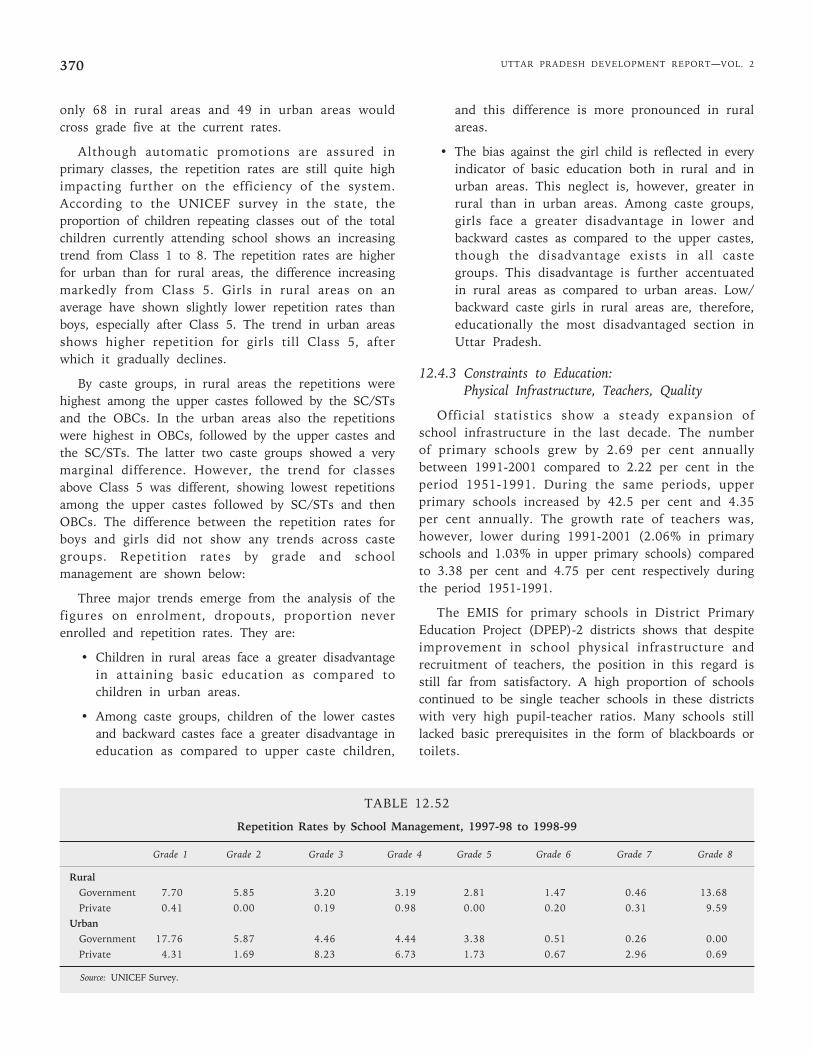
UTTAR PRADESH DEVELOPMENT REPORT—VOL. 2370
only 68 in rural areas and 49 in urban areas wouldcross grade five at the current rates.
Although automatic promotions are assured inprimary classes, the repetition rates are still quite highimpacting further on the efficiency of the system.According to the UNICEF survey in the state, theproportion of children repeating classes out of the totalchildren currently attending school shows an increasingtrend from Class 1 to 8. The repetition rates are higherfor urban than for rural areas, the difference increasingmarkedly from Class 5. Girls in rural areas on anaverage have shown slightly lower repetition rates thanboys, especially after Class 5. The trend in urban areasshows higher repetition for girls till Class 5, afterwhich it gradually declines.
By caste groups, in rural areas the repetitions werehighest among the upper castes followed by the SC/STsand the OBCs. In the urban areas also the repetitionswere highest in OBCs, followed by the upper castes andthe SC/STs. The latter two caste groups showed a verymarginal difference. However, the trend for classesabove Class 5 was different, showing lowest repetitionsamong the upper castes followed by SC/STs and thenOBCs. The difference between the repetition rates forboys and girls did not show any trends across castegroups. Repetition rates by grade and schoolmanagement are shown below:
Three major trends emerge from the analysis of thefigures on enrolment, dropouts, proportion neverenrolled and repetition rates. They are:
• Children in rural areas face a greater disadvantagein attaining basic education as compared tochildren in urban areas.
• Among caste groups, children of the lower castesand backward castes face a greater disadvantage ineducation as compared to upper caste children,
and this difference is more pronounced in ruralareas.
• The bias against the girl child is reflected in everyindicator of basic education both in rural and inurban areas. This neglect is, however, greater inrural than in urban areas. Among caste groups,girls face a greater disadvantage in lower andbackward castes as compared to the upper castes,though the disadvantage exists in all castegroups. This disadvantage is further accentuatedin rural areas as compared to urban areas. Low/backward caste girls in rural areas are, therefore,educationally the most disadvantaged section inUttar Pradesh.
12.4.3 Constraints to Education:Physical Infrastructure, Teachers, Quality
Official statistics show a steady expansion ofschool infrastructure in the last decade. The numberof primary schools grew by 2.69 per cent annuallybetween 1991-2001 compared to 2.22 per cent in theperiod 1951-1991. During the same periods, upperprimary schools increased by 42.5 per cent and 4.35per cent annually. The growth rate of teachers was,however, lower during 1991-2001 (2.06% in primaryschools and 1.03% in upper primary schools) comparedto 3.38 per cent and 4.75 per cent respectively duringthe period 1951-1991.
The EMIS for primary schools in District PrimaryEducation Project (DPEP)-2 districts shows that despiteimprovement in school physical infrastructure andrecruitment of teachers, the position in this regard isstill far from satisfactory. A high proportion of schoolscontinued to be single teacher schools in these districtswith very high pupil-teacher ratios. Many schools stilllacked basic prerequisites in the form of blackboards ortoilets.
TABLE 12.52
Repetition Rates by School Management, 1997-98 to 1998-99
Grade 1 Grade 2 Grade 3 Grade 4 Grade 5 Grade 6 Grade 7 Grade 8
RuralGovernment 7.70 5.85 3.20 3.19 2.81 1.47 0.46 13.68Private 0.41 0.00 0.19 0.98 0.00 0.20 0.31 9.59
UrbanGovernment 17.76 5.87 4.46 4.44 3.38 0.51 0.26 0.00Private 4.31 1.69 8.23 6.73 1.73 0.67 2.96 0.69
Source: UNICEF Survey.
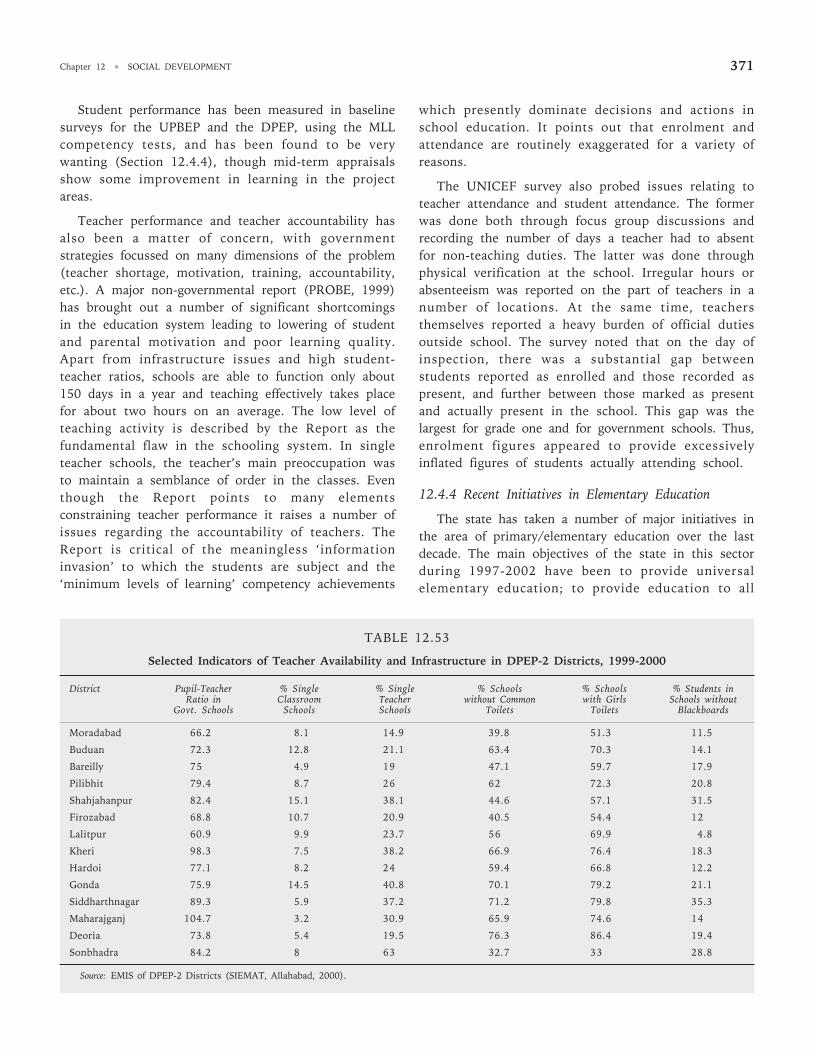
Chapter 12 • SOCIAL DEVELOPMENT 371
Student performance has been measured in baselinesurveys for the UPBEP and the DPEP, using the MLLcompetency tests, and has been found to be verywanting (Section 12.4.4), though mid-term appraisalsshow some improvement in learning in the projectareas.
Teacher performance and teacher accountability hasalso been a matter of concern, with governmentstrategies focussed on many dimensions of the problem(teacher shortage, motivation, training, accountability,etc.). A major non-governmental report (PROBE, 1999)has brought out a number of significant shortcomingsin the education system leading to lowering of studentand parental motivation and poor learning quality.Apart from infrastructure issues and high student-teacher ratios, schools are able to function only about150 days in a year and teaching effectively takes placefor about two hours on an average. The low level ofteaching activity is described by the Report as thefundamental flaw in the schooling system. In singleteacher schools, the teacher’s main preoccupation wasto maintain a semblance of order in the classes. Eventhough the Report points to many elementsconstraining teacher performance it raises a number ofissues regarding the accountability of teachers. TheReport is critical of the meaningless ‘informationinvasion’ to which the students are subject and the‘minimum levels of learning’ competency achievements
which presently dominate decisions and actions inschool education. It points out that enrolment andattendance are routinely exaggerated for a variety ofreasons.
The UNICEF survey also probed issues relating toteacher attendance and student attendance. The formerwas done both through focus group discussions andrecording the number of days a teacher had to absentfor non-teaching duties. The latter was done throughphysical verification at the school. Irregular hours orabsenteeism was reported on the part of teachers in anumber of locations. At the same time, teachersthemselves reported a heavy burden of official dutiesoutside school. The survey noted that on the day ofinspection, there was a substantial gap betweenstudents reported as enrolled and those recorded aspresent, and further between those marked as presentand actually present in the school. This gap was thelargest for grade one and for government schools. Thus,enrolment figures appeared to provide excessivelyinflated figures of students actually attending school.
12.4.4 Recent Initiatives in Elementary Education
The state has taken a number of major initiatives inthe area of primary/elementary education over the lastdecade. The main objectives of the state in this sectorduring 1997-2002 have been to provide universalelementary education; to provide education to all
TABLE 12.53
Selected Indicators of Teacher Availability and Infrastructure in DPEP-2 Districts, 1999-2000
District Pupil-Teacher % Single % Single % Schools % Schools % Students inRatio in Classroom Teacher without Common with Girls Schools without
Govt. Schools Schools Schools Toilets Toilets Blackboards
Moradabad 66.2 8.1 14.9 39.8 51.3 11.5
Buduan 72.3 12.8 21.1 63.4 70.3 14.1
Bareilly 75 4.9 19 47.1 59.7 17.9
Pilibhit 79.4 8.7 26 62 72.3 20.8
Shahjahanpur 82.4 15.1 38.1 44.6 57.1 31.5
Firozabad 68.8 10.7 20.9 40.5 54.4 12
Lalitpur 60.9 9.9 23.7 56 69.9 4.8
Kheri 98.3 7.5 38.2 66.9 76.4 18.3
Hardoi 77.1 8.2 24 59.4 66.8 12.2
Gonda 75.9 14.5 40.8 70.1 79.2 21.1
Siddharthnagar 89.3 5.9 37.2 71.2 79.8 35.3
Maharajganj 104.7 3.2 30.9 65.9 74.6 14
Deoria 73.8 5.4 19.5 76.3 86.4 19.4
Sonbhadra 84.2 8 63 32.7 33 28.8
Source: EMIS of DPEP-2 Districts (SIEMAT, Allahabad, 2000).
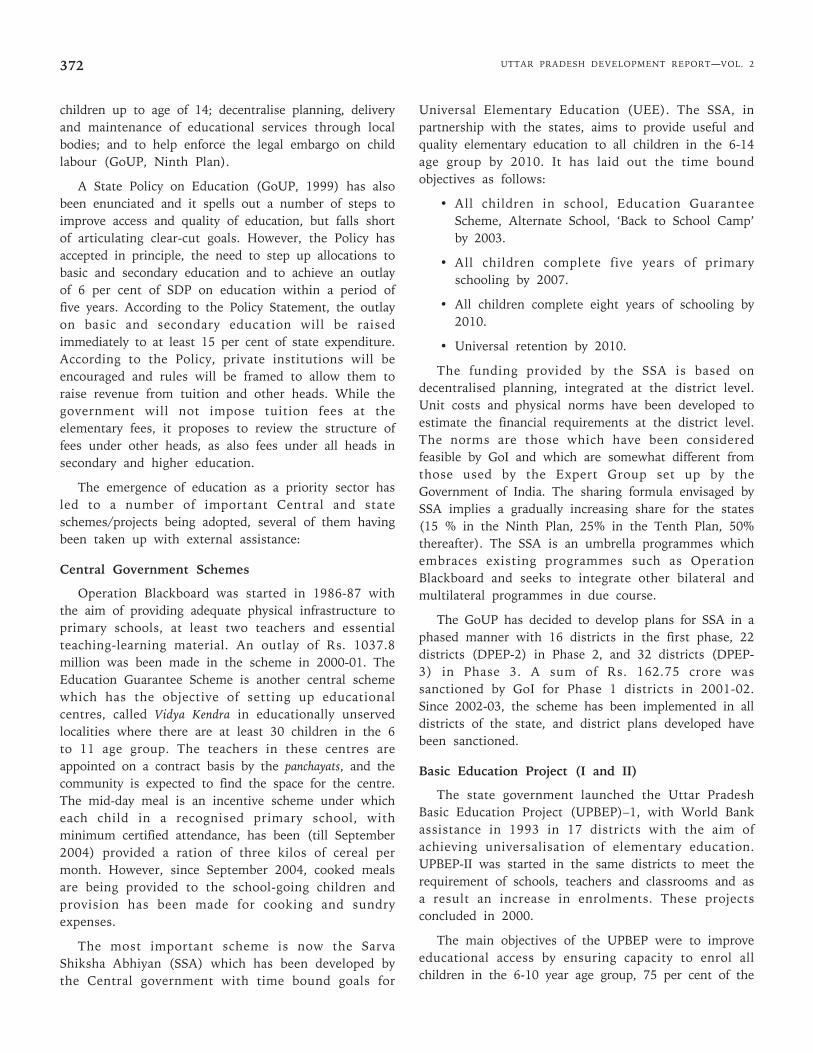
UTTAR PRADESH DEVELOPMENT REPORT—VOL. 2372
children up to age of 14; decentralise planning, deliveryand maintenance of educational services through localbodies; and to help enforce the legal embargo on childlabour (GoUP, Ninth Plan).
A State Policy on Education (GoUP, 1999) has alsobeen enunciated and it spells out a number of steps toimprove access and quality of education, but falls shortof articulating clear-cut goals. However, the Policy hasaccepted in principle, the need to step up allocations tobasic and secondary education and to achieve an outlayof 6 per cent of SDP on education within a period offive years. According to the Policy Statement, the outlayon basic and secondary education will be raisedimmediately to at least 15 per cent of state expenditure.According to the Policy, private institutions will beencouraged and rules will be framed to allow them toraise revenue from tuition and other heads. While thegovernment will not impose tuition fees at theelementary fees, it proposes to review the structure offees under other heads, as also fees under all heads insecondary and higher education.
The emergence of education as a priority sector hasled to a number of important Central and stateschemes/projects being adopted, several of them havingbeen taken up with external assistance:
Central Government Schemes
Operation Blackboard was started in 1986-87 withthe aim of providing adequate physical infrastructure toprimary schools, at least two teachers and essentialteaching-learning material. An outlay of Rs. 1037.8million was been made in the scheme in 2000-01. TheEducation Guarantee Scheme is another central schemewhich has the objective of setting up educationalcentres, called Vidya Kendra in educationally unservedlocalities where there are at least 30 children in the 6to 11 age group. The teachers in these centres areappointed on a contract basis by the panchayats, and thecommunity is expected to find the space for the centre.The mid-day meal is an incentive scheme under whicheach child in a recognised primary school, withminimum certified attendance, has been (till September2004) provided a ration of three kilos of cereal permonth. However, since September 2004, cooked mealsare being provided to the school-going children andprovision has been made for cooking and sundryexpenses.
The most important scheme is now the SarvaShiksha Abhiyan (SSA) which has been developed bythe Central government with time bound goals for
Universal Elementary Education (UEE). The SSA, inpartnership with the states, aims to provide useful andquality elementary education to all children in the 6-14age group by 2010. It has laid out the time boundobjectives as follows:
• All children in school, Education GuaranteeScheme, Alternate School, ‘Back to School Camp’by 2003.
• All children complete five years of primaryschooling by 2007.
• All children complete eight years of schooling by2010.
• Universal retention by 2010.
The funding provided by the SSA is based ondecentralised planning, integrated at the district level.Unit costs and physical norms have been developed toestimate the financial requirements at the district level.The norms are those which have been consideredfeasible by GoI and which are somewhat different fromthose used by the Expert Group set up by theGovernment of India. The sharing formula envisaged bySSA implies a gradually increasing share for the states(15 % in the Ninth Plan, 25% in the Tenth Plan, 50%thereafter). The SSA is an umbrella programmes whichembraces existing programmes such as OperationBlackboard and seeks to integrate other bilateral andmultilateral programmes in due course.
The GoUP has decided to develop plans for SSA in aphased manner with 16 districts in the first phase, 22districts (DPEP-2) in Phase 2, and 32 districts (DPEP-3) in Phase 3. A sum of Rs. 162.75 crore wassanctioned by GoI for Phase 1 districts in 2001-02.Since 2002-03, the scheme has been implemented in alldistricts of the state, and district plans developed havebeen sanctioned.
Basic Education Project (I and II)
The state government launched the Uttar PradeshBasic Education Project (UPBEP)–1, with World Bankassistance in 1993 in 17 districts with the aim ofachieving universalisation of elementary education.UPBEP-II was started in the same districts to meet therequirement of schools, teachers and classrooms and asa result an increase in enrolments. These projectsconcluded in 2000.
The main objectives of the UPBEP were to improveeducational access by ensuring capacity to enrol allchildren in the 6-10 year age group, 75 per cent of the
Chapter 12 • SOCIAL DEVELOPMENT 373
children in the 11-13 year age group in schools and byreducing the percentage of SC/ST children and girls notin school by at least half; improving quality andcompletion by bringing about 50 per cent improvementin dropout and repetition rates and MLL over the baseline and making the Village Education Committees(VECs) functional; building institutional capacity at alllevels.
Although admittedly there are problems in thequality of data, the growth rate of enrolment in the EPdistricts may have been higher than the non-BEPdistricts by about 33 per cent and the enrolment ofgirls, particularly SC girls increased more rapidly thanthe overall rates. Official enrolment data show anincrease in total enrolment from 2.6 million in 1993 to5 million in 2000, with the percentage of girls enrolledincreasing from 31 per cent to 43 per cent over thisperiod. Net enrolment rates in a survey of 6 districtswere estimated at 84 per cent for the primary level(World Bank, 2001b). Rapid increases were alsoobserved at the upper primary level, enabling the projectto meet its enrolment goals. The percentage of girls (6-14 years) out of school is estimated to have fallen from50 to 18 over the project period.
Dropout rates, which were estimated to be 60 percent for girls and 40 per cent for boys, may have fallento 27.7 per cent as per EMIS data with little differencesbetween genders. Repetition rates at the primary stageare also estimated to have fallen from 12 per centaverage to 3.3 per cent. While the mid-term assessmentdid not show an improvement in MLLs, the finalassessment study does show improvement, althoughthe methodologies are not comparable. But the Projecthas made an impact on classroom processes (WorldBank, 2001b). VECs have played a role in schoolconstruction and enrolment drives in the project areas.
To improve access, 3396 new primary schools, 1464upper primary schools, and 3429 classrooms were builtunder BEP. In addition, 1284 primary schools, 601upper primary schools, and 7081 classrooms were builtunder BEP-II, while 870 primary schools and 80 upperprimary schools were rehabilitated.
In order to convert all single teacher schools to twoteacher schools, 9482 teachers in new schools, 15175additional teachers and more than 57000 para-teachershave been appointed. Even so, 15 per cent of theschools remained single teacher schools.
Moreover, enrolment growth in Class 1 slowed downsince 1997 and the enrolment increase out-stepped the
increase in the creation of physical capacity andrecruitment of new teachers bringing about an increasein the pupil-teacher ratio (from 47 to 60) and studentsper classroom in many of the districts remained veryhigh (World Bank, 2001b)
Major inputs in the programme have been in thestrengthening of decentralised management, buildinginstitutional capacity at all levels, improving andstrengthening teacher training, curricula revision andimproved textbooks, supporting improved classroomprocesses. Several models were evolved for alternativeschooling, although the total number of childrenenrolled were below target.
The District Primary Education Project (DPEP-II)
The District Primary Education Project–II wasstarted in 18 districts in 1997 (extended to 4 moredistricts in 1999) as a centrally sponsored scheme toachieve universal primary education. The objective ofthe project is to expand access, increase retention,improve quality and build institutional capacity. Thespecific aims of the project are to:
• Reduce differences in enrolment, dropout andlearning achievement among gender and socialgroups to less than 5 per cent.
• Reduce average primary dropout rate for allstudents to less than 10 per cent.
• Raise average achievement level by at least 25 percent over measured baseline assessment level andensure achievement of basic literacy and numeracycompetencies and a minimum of 40 per centachievement level in other competencies by allprimary school children.
• Provide access to all children to primaryeducation or its equivalent non-formal education.
• Strengthen the capacity of national, state anddistrict level institutions and organisations forplanning, management and evaluation of primaryeducation.
The DPEP has been conceived as a holisticprogramme, with flexible approaches, operationalisingthe NPE’s strategy for decentralised planning anddisaggregated target setting. Central to the DPEPstrategy is the concept of contextuality so thatprogramme interventions are tailored to meet thespecific needs and requirements of the district. Thisrequires decentralised planning, management and targetsetting for achievement of the goal of Universal Primary
UTTAR PRADESH DEVELOPMENT REPORT—VOL. 2374
Education (UPE). The approach bases itself on intensivecommunity participation, with the community playingan important role in mobilisation, awareness building,planning and management of educational resources.
To improve access and retention, the project plansto build 3744 new primary schools, reconstruct 2398existing schools, add 7547 new classrooms and provide16130 toilets and 3620 hand-pumps. Sixty per cent ofthe cost of construction is being borne by otherschemes of the Department of Rural Development orthe PMGRY through convergence. To meet shortage ofteachers, 8649 teachers were appointed and anadditional 6471 shiksha mitras were in place by March2001.
Apart from strengthening the regular school system,the projects also aims at improving access to marginalgroups and older girls through several models ofalternative schooling, and improving the access andretention of young girls by strengthening early care andeducation in the ICDS centres (which is expected tolower the load of sibling care on young girls).Integration of children with disabilities is now a specialfocus of the programme and a number of initiativeshave also been taken to increase girls’ participation. Anumber of alternative schooling models have beenadopted under DPEP-2. These include the shikshaghar,balshala, prahar pathshala, maktabs/madarsas, Rishi Valleymodel and camps. Together with EGS centres, thesemodels catered to 92613 children (50635 boys and41978 girls).
Community participation, in particular theparticipation of women, is being encouraged andfacilitated in a number of ways and capacity buildingand training of the VECs is a special priority of theprogramme.
A large number of measures have been taken toimprove the quality of education which includeimproved training, focus on classroom processes, andimprovement in curricula and textbooks. These appearto have been reflected in the levels of learning. Acomparison of learning levels in language andmathematics between the BAS (1997) and the MAS(2000) shows an improvement for Class 1 in languagein 12 of the 15 districts, (with 8 registering more than25 per cent improvement) and in mathematics in all thedistricts (with only 2 registering less than 25 per centimprovement over the base year). Among Class 5students, language competency in 8 of the 15 districtsimproved (with only 1 registering a more than 25 percent increase) while mathematics learning improved in
10 districts (with 25 per cent or more improvementbeing registered in four districts) (DPEP Core ResourceGroup, November 2000).
Official enrolment statistics, quoted in the 2000-01Annual Report, show an increase of 35 per cent inenrolment in 2000-01 over 1996-97, with girls’enrolment increasing by 60 per cent. EMIS data showsan increase in dropout rate from 52 to 46.8 per cent,while repetition rate has declined from 5.24 per cent to3.34 per cent over the period. Detailed EMIS statisticsfor the period 1997-2000, reported by SIEMAT, andanalysed by Aggarwal (2000) show a mixed picture insome respects. GER showed an improvement in all but2 districts, with girls’ enrolment growing more rapidly.Infrastructural facilities also improved in the districtsbetween these years. But teacher strength had not keptpace with the increase in the number of schools,leading to a significant increase in the percentage ofsingle teacher schools in all the 16 districts for whichresults were reported. Pupil teacher ratios were higherthan 60 in all the districts and showed an improvementin only 2 of the districts. The extent of enrolmentincrease varied between districts, but 6 districts showeda decline in enrolment in Class 1. The percentage ofSC/ST students enrolled showed small changes (ineither direction).
The District Primary Education Project (DPEP-III)
Under DPEP-III, launched in April 2000, anadditional 38 districts (6 of which are now inUttaranchal have been de-linked from the Uttar PradeshProject Board) are being covered with a total projectcost of Rs. 804 crores and a project duration of fiveyears. Thus, in all, 77 of erstwhile Uttar Pradesh 83districts have been/are being covered under theprojects. The objectives and the approach of DPEP-IIIare similar to DPEP-II. The physical inputs which willbe provided by the project include 2502 new primaryschools and 2977 reconstructed schools; 10140 newclassrooms, 13958 toilets and 4418 hand pumps, 1530ECCE rooms, 377 BRCs and 3833 NPRCs.
Studies of the BEP/DPEP show that project districtshave experienced a higher rate of increase in enrolmentsand higher retention compared to non-project districts.Also learning achievements in these districts also showan improvement. The projects have also impacted teacherquality (through better training), quality of text books,and availability of physical and educational infrastructureand have given a fillip towards a greater role for the ruraland urban communities and the Village and WardEducation Committees (VECs and WECs).
Chapter 12 • SOCIAL DEVELOPMENT 375
Joint UN Initiative and UNICEFSupported Primary Education Project
A joint UN initiative has been launched in the statewhich will supplement DPEP in specific focal areas,such as the programme to make education interestingfor students and teachers (Ruchipoorna Shiksha). Inaddition, a UNICEF-supported project is underwaywhich will cover the six districts in the state notincluded under DPEP-III.
Other State Schemes/Projects
The state has started a para-teachers or ShikshaMitra scheme under which youths who have passed10+2 can be employed as para-teachers. Half of thoseemployed should be women. The selection of the shikshamitras will be done by the VEC of the panchayats, whowill have administrative control over them. The parateachers will be employed contractually for a period of10 months and will be paid Rs 2250 per month. Thescheme is expected to reduce the pupil-teacher ratio of52:1 at the primary level. Till date more than 57000para-teachers have been appointed, mostly in singleteacher schools.
12.4.5 Role of the Private Sector
Uttar Pradesh has a long and distinguished traditionof provision of education by non-governmentalreligious, social and philanthropic bodies. The modernschool system in Uttar Pradesh developed under theaegis of British rule. But according to the IndianEducation Commission of 1881, there already existed inthe state a large network of indigenous schools, thepathshalas or maktabs/madarsas, in which a single teacherimparted education to a small group of children. TillIndependence, most of the primary and middle schoolswere managed by local bodies which also hadsubstantial powers of regulation. However, the role ofthe state government in funding school educationincreased in the first half of the 20th century and thegovernment also acquired regulatory and supervisorypowers. By 1921, the state government’s contributionin education had already increased to 52.8 per cent withthe share of local bodies declining to 27.4 per cent andthat of fees to 9.6 per cent.
In 1960-61, about one-fifth of educationalinstitutions at all levels were managed by thegovernment, while 46.5 per cent were managed by localauthorities and 33 per cent were privately managed. Atthe primary level, local authorities managed 55.9 per
cent of the schools, while at the upper primary level,they managed 53.4 per cent of schools (Vashisht,1994). However, governments were the major source offinance for all types of managed schools, contributing67.5 per cent of funds, while the contribution of feeswas 16.9 per cent. Local Board funds contributed 9.7per cent to the total expenditure on schools (Vashisht,1994:5).
During the 1960s, the urban and local bodiesgradually became moribund in Uttar Pradesh and inlarge parts of the country and their financial resourcescontinued to dwindle. The lack of uniformity in theservice conditions of teachers, in recruitmentconditions etc. led the state government to promulgatethe Basic Education Act, under which basic educationwas effectively decentralised at the state level. Underthe Uttar Pradesh Basic Education Act of 1972, alleducational institutions of the municipal boards andzilla parishad’s imparting primary education weretransferred to the basic shiksha parishad constitutedunder the Act. The Parishad has the responsibility ofpromoting basic education and to this end appointingofficers and teachers, organising training, preparing thesyllabi, giving recognition to schools, conduct ofexaminations, etc. Under Section 12, the director isempowered to issue directions for the effective controlof basic schools through inspection and visits.Recruitment and service conditions of teachers arecovered by Section 19 of the Act.
Although the state government bore the principalfinancial burden of fostering the expansion of theeducation system, non-governmental organisations,societies and trusts as well as private individualscontinued to set up institutions for diverse reasons.These institutions were ‘recognised’ by the stategovernment if they fulfilled certain laid down norms,and the further observance of certain normative criteriacould entitle them to a ‘grant-in-aid’ which wouldcover the bulk of their recurring expenses, andoccasionally certain specific capital outlays. Thusgovernment financing and regulation (of fee structures,qualifications, salaries and recruitment of teachers,quality of physical infrastructure, etc.) was generic to awhole range of management structures.
Since official statistics do not cover privateinstitutions adequately, we have taken recourse toestimates generated from the 52nd Round of NSS toconsider the significance of the ‘private’ sector ineducation.
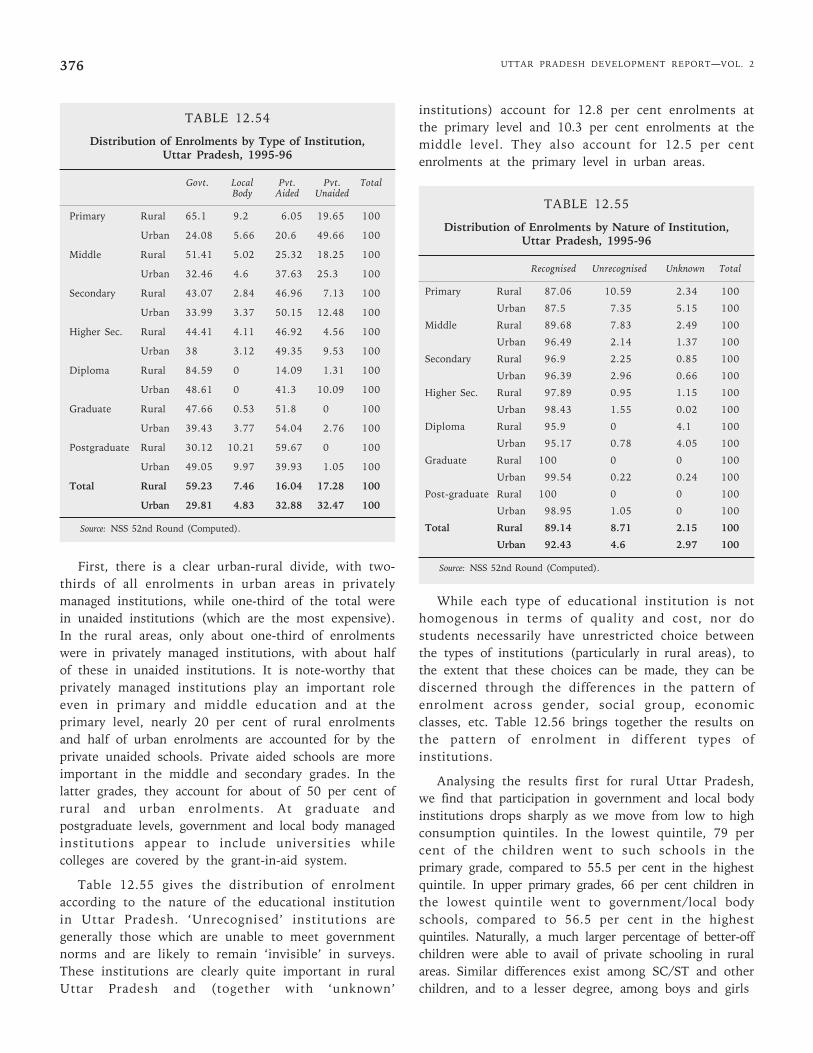
UTTAR PRADESH DEVELOPMENT REPORT—VOL. 2376
TABLE 12.54
Distribution of Enrolments by Type of Institution,Uttar Pradesh, 1995-96
Govt. Local Pvt. Pvt. TotalBody Aided Unaided
Primary Rural 65.1 9.2 6.05 19.65 100
Urban 24.08 5.66 20.6 49.66 100
Middle Rural 51.41 5.02 25.32 18.25 100
Urban 32.46 4.6 37.63 25.3 100
Secondary Rural 43.07 2.84 46.96 7.13 100
Urban 33.99 3.37 50.15 12.48 100
Higher Sec. Rural 44.41 4.11 46.92 4.56 100
Urban 38 3.12 49.35 9.53 100
Diploma Rural 84.59 0 14.09 1.31 100
Urban 48.61 0 41.3 10.09 100
Graduate Rural 47.66 0.53 51.8 0 100
Urban 39.43 3.77 54.04 2.76 100
Postgraduate Rural 30.12 10.21 59.67 0 100
Urban 49.05 9.97 39.93 1.05 100
Total Rural 59.23 7.46 16.04 17.28 100
Urban 29.81 4.83 32.88 32.47 100
Source: NSS 52nd Round (Computed).
First, there is a clear urban-rural divide, with two-thirds of all enrolments in urban areas in privatelymanaged institutions, while one-third of the total werein unaided institutions (which are the most expensive).In the rural areas, only about one-third of enrolmentswere in privately managed institutions, with about halfof these in unaided institutions. It is note-worthy thatprivately managed institutions play an important roleeven in primary and middle education and at theprimary level, nearly 20 per cent of rural enrolmentsand half of urban enrolments are accounted for by theprivate unaided schools. Private aided schools are moreimportant in the middle and secondary grades. In thelatter grades, they account for about of 50 per cent ofrural and urban enrolments. At graduate andpostgraduate levels, government and local body managedinstitutions appear to include universities whilecolleges are covered by the grant-in-aid system.
Table 12.55 gives the distribution of enrolmentaccording to the nature of the educational institutionin Uttar Pradesh. ‘Unrecognised’ institutions aregenerally those which are unable to meet governmentnorms and are likely to remain ‘invisible’ in surveys.These institutions are clearly quite important in ruralUttar Pradesh and (together with ‘unknown’
institutions) account for 12.8 per cent enrolments atthe primary level and 10.3 per cent enrolments at themiddle level. They also account for 12.5 per centenrolments at the primary level in urban areas.
TABLE 12.55
Distribution of Enrolments by Nature of Institution,Uttar Pradesh, 1995-96
Recognised Unrecognised Unknown Total
Primary Rural 87.06 10.59 2.34 100
Urban 87.5 7.35 5.15 100
Middle Rural 89.68 7.83 2.49 100
Urban 96.49 2.14 1.37 100
Secondary Rural 96.9 2.25 0.85 100
Urban 96.39 2.96 0.66 100
Higher Sec. Rural 97.89 0.95 1.15 100
Urban 98.43 1.55 0.02 100
Diploma Rural 95.9 0 4.1 100
Urban 95.17 0.78 4.05 100
Graduate Rural 100 0 0 100
Urban 99.54 0.22 0.24 100
Post-graduate Rural 100 0 0 100
Urban 98.95 1.05 0 100
Total Rural 89.14 8.71 2.15 100
Urban 92.43 4.6 2.97 100
Source: NSS 52nd Round (Computed).
While each type of educational institution is nothomogenous in terms of quality and cost, nor dostudents necessarily have unrestricted choice betweenthe types of institutions (particularly in rural areas), tothe extent that these choices can be made, they can bediscerned through the differences in the pattern ofenrolment across gender, social group, economicclasses, etc. Table 12.56 brings together the results onthe pattern of enrolment in different types ofinstitutions.
Analysing the results first for rural Uttar Pradesh,we find that participation in government and local bodyinstitutions drops sharply as we move from low to highconsumption quintiles. In the lowest quintile, 79 percent of the children went to such schools in theprimary grade, compared to 55.5 per cent in the highestquintile. In upper primary grades, 66 per cent children inthe lowest quintile went to government/local bodyschools, compared to 56.5 per cent in the highestquintiles. Naturally, a much larger percentage of better-offchildren were able to avail of private schooling in ruralareas. Similar differences exist among SC/ST and otherchildren, and to a lesser degree, among boys and girls
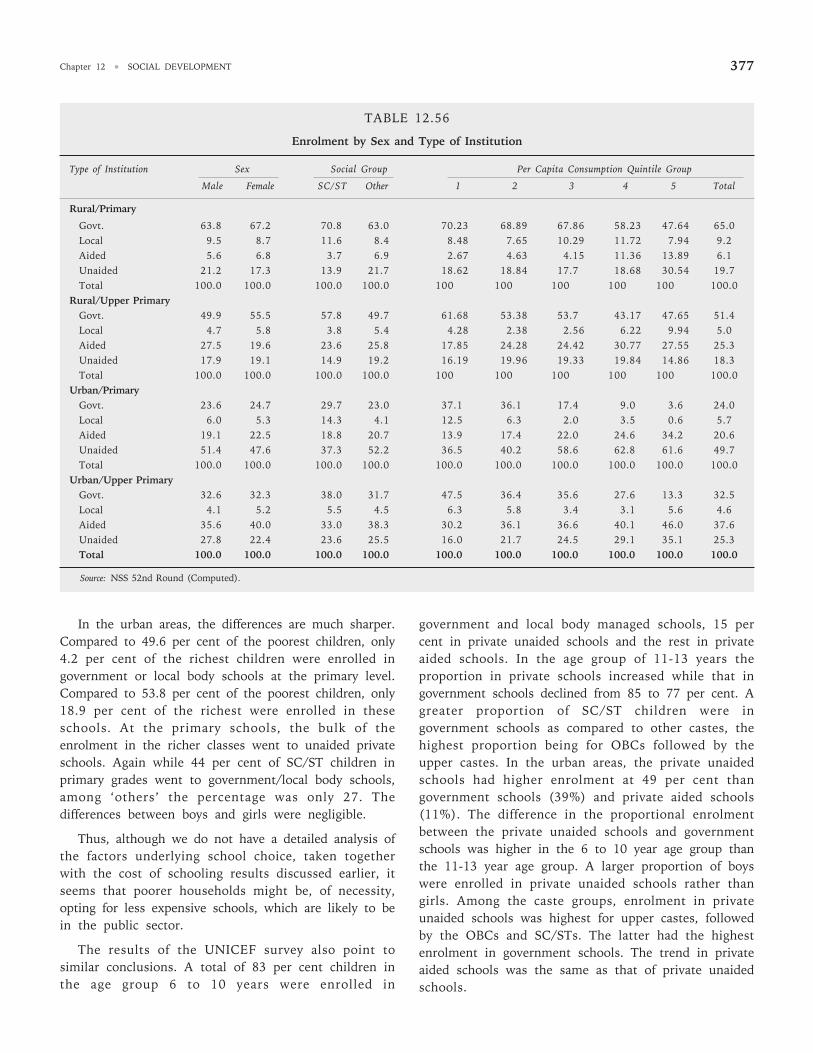
Chapter 12 • SOCIAL DEVELOPMENT 377
In the urban areas, the differences are much sharper.Compared to 49.6 per cent of the poorest children, only4.2 per cent of the richest children were enrolled ingovernment or local body schools at the primary level.Compared to 53.8 per cent of the poorest children, only18.9 per cent of the richest were enrolled in theseschools. At the primary schools, the bulk of theenrolment in the richer classes went to unaided privateschools. Again while 44 per cent of SC/ST children inprimary grades went to government/local body schools,among ‘others’ the percentage was only 27. Thedifferences between boys and girls were negligible.
Thus, although we do not have a detailed analysis ofthe factors underlying school choice, taken togetherwith the cost of schooling results discussed earlier, itseems that poorer households might be, of necessity,opting for less expensive schools, which are likely to bein the public sector.
The results of the UNICEF survey also point tosimilar conclusions. A total of 83 per cent children inthe age group 6 to 10 years were enrolled in
government and local body managed schools, 15 percent in private unaided schools and the rest in privateaided schools. In the age group of 11-13 years theproportion in private schools increased while that ingovernment schools declined from 85 to 77 per cent. Agreater proportion of SC/ST children were ingovernment schools as compared to other castes, thehighest proportion being for OBCs followed by theupper castes. In the urban areas, the private unaidedschools had higher enrolment at 49 per cent thangovernment schools (39%) and private aided schools(11%). The difference in the proportional enrolmentbetween the private unaided schools and governmentschools was higher in the 6 to 10 year age group thanthe 11-13 year age group. A larger proportion of boyswere enrolled in private unaided schools rather thangirls. Among the caste groups, enrolment in privateunaided schools was highest for upper castes, followedby the OBCs and SC/STs. The latter had the highestenrolment in government schools. The trend in privateaided schools was the same as that of private unaidedschools.
TABLE 12.56
Enrolment by Sex and Type of Institution
Type of Institution Sex Social Group Per Capita Consumption Quintile Group
Male Female SC/ST Other 1 2 3 4 5 Total
Rural/Primary
Govt. 63.8 67.2 70.8 63.0 70.23 68.89 67.86 58.23 47.64 65.0Local 9.5 8.7 11.6 8.4 8.48 7.65 10.29 11.72 7.94 9.2Aided 5.6 6.8 3.7 6.9 2.67 4.63 4.15 11.36 13.89 6.1Unaided 21.2 17.3 13.9 21.7 18.62 18.84 17.7 18.68 30.54 19.7Total 100.0 100.0 100.0 100.0 100 100 100 100 100 100.0
Rural/Upper PrimaryGovt. 49.9 55.5 57.8 49.7 61.68 53.38 53.7 43.17 47.65 51.4Local 4.7 5.8 3.8 5.4 4.28 2.38 2.56 6.22 9.94 5.0Aided 27.5 19.6 23.6 25.8 17.85 24.28 24.42 30.77 27.55 25.3Unaided 17.9 19.1 14.9 19.2 16.19 19.96 19.33 19.84 14.86 18.3Total 100.0 100.0 100.0 100.0 100 100 100 100 100 100.0
Urban/PrimaryGovt. 23.6 24.7 29.7 23.0 37.1 36.1 17.4 9.0 3.6 24.0Local 6.0 5.3 14.3 4.1 12.5 6.3 2.0 3.5 0.6 5.7Aided 19.1 22.5 18.8 20.7 13.9 17.4 22.0 24.6 34.2 20.6Unaided 51.4 47.6 37.3 52.2 36.5 40.2 58.6 62.8 61.6 49.7Total 100.0 100.0 100.0 100.0 100.0 100.0 100.0 100.0 100.0 100.0
Urban/Upper PrimaryGovt. 32.6 32.3 38.0 31.7 47.5 36.4 35.6 27.6 13.3 32.5Local 4.1 5.2 5.5 4.5 6.3 5.8 3.4 3.1 5.6 4.6Aided 35.6 40.0 33.0 38.3 30.2 36.1 36.6 40.1 46.0 37.6Unaided 27.8 22.4 23.6 25.5 16.0 21.7 24.5 29.1 35.1 25.3Total 100.0 100.0 100.0 100.0 100.0 100.0 100.0 100.0 100.0 100.0
Source: NSS 52nd Round (Computed).
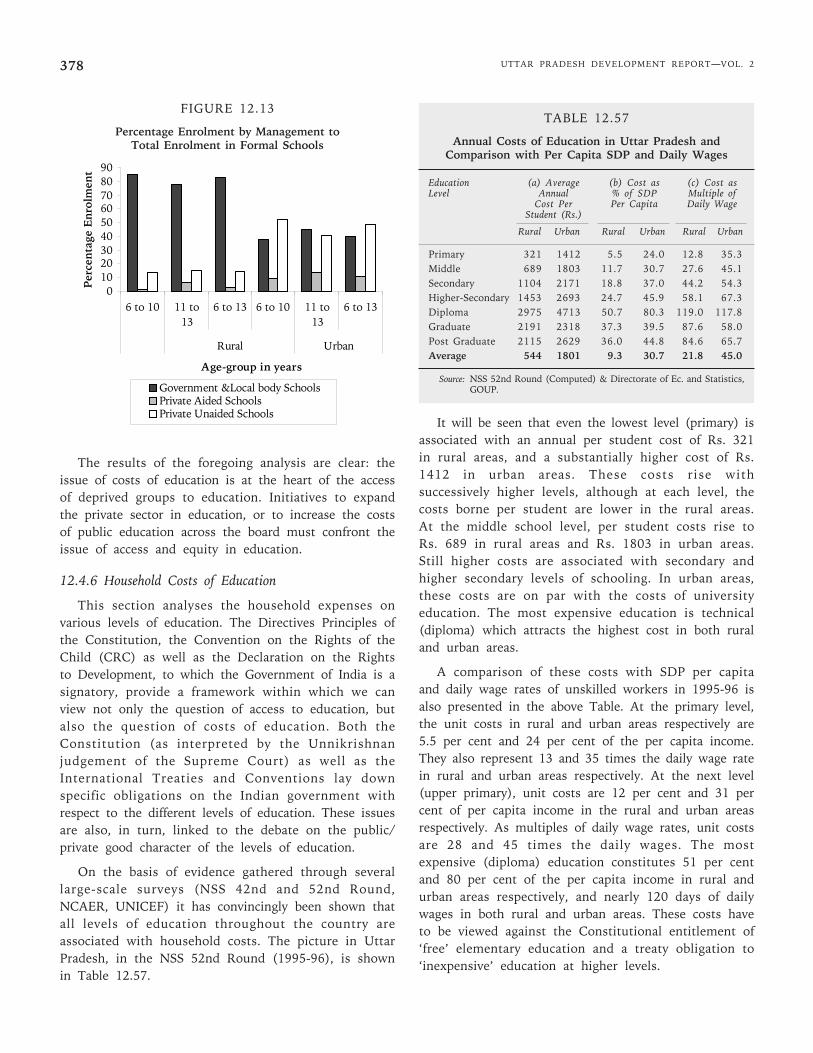
UTTAR PRADESH DEVELOPMENT REPORT—VOL. 2378
FIGURE 12.13
Percentage Enrolment by Management toTotal Enrolment in Formal Schools
The results of the foregoing analysis are clear: theissue of costs of education is at the heart of the accessof deprived groups to education. Initiatives to expandthe private sector in education, or to increase the costsof public education across the board must confront theissue of access and equity in education.
12.4.6 Household Costs of Education
This section analyses the household expenses onvarious levels of education. The Directives Principles ofthe Constitution, the Convention on the Rights of theChild (CRC) as well as the Declaration on the Rightsto Development, to which the Government of India is asignatory, provide a framework within which we canview not only the question of access to education, butalso the question of costs of education. Both theConstitution (as interpreted by the Unnikrishnanjudgement of the Supreme Court) as well as theInternational Treaties and Conventions lay downspecific obligations on the Indian government withrespect to the different levels of education. These issuesare also, in turn, linked to the debate on the public/private good character of the levels of education.
On the basis of evidence gathered through severallarge-scale surveys (NSS 42nd and 52nd Round,NCAER, UNICEF) it has convincingly been shown thatall levels of education throughout the country areassociated with household costs. The picture in UttarPradesh, in the NSS 52nd Round (1995-96), is shownin Table 12.57.
TABLE 12.57
Annual Costs of Education in Uttar Pradesh andComparison with Per Capita SDP and Daily Wages
Education (a) Average (b) Cost as (c) Cost asLevel Annual % of SDP Multiple of
Cost Per Per Capita Daily WageStudent (Rs.)
Rural Urban Rural Urban Rural Urban
Primary 321 1412 5.5 24.0 12.8 35.3Middle 689 1803 11.7 30.7 27.6 45.1Secondary 1104 2171 18.8 37.0 44.2 54.3Higher-Secondary 1453 2693 24.7 45.9 58.1 67.3Diploma 2975 4713 50.7 80.3 119.0 117.8Graduate 2191 2318 37.3 39.5 87.6 58.0Post Graduate 2115 2629 36.0 44.8 84.6 65.7Average 544 1801 9.3 30.7 21.8 45.0
Source: NSS 52nd Round (Computed) & Directorate of Ec. and Statistics,GOUP.
It will be seen that even the lowest level (primary) isassociated with an annual per student cost of Rs. 321in rural areas, and a substantially higher cost of Rs.1412 in urban areas. These costs rise withsuccessively higher levels, although at each level, thecosts borne per student are lower in the rural areas.At the middle school level, per student costs rise toRs. 689 in rural areas and Rs. 1803 in urban areas.Still higher costs are associated with secondary andhigher secondary levels of schooling. In urban areas,these costs are on par with the costs of universityeducation. The most expensive education is technical(diploma) which attracts the highest cost in both ruraland urban areas.
A comparison of these costs with SDP per capitaand daily wage rates of unskilled workers in 1995-96 isalso presented in the above Table. At the primary level,the unit costs in rural and urban areas respectively are5.5 per cent and 24 per cent of the per capita income.They also represent 13 and 35 times the daily wage ratein rural and urban areas respectively. At the next level(upper primary), unit costs are 12 per cent and 31 percent of per capita income in the rural and urban areasrespectively. As multiples of daily wage rates, unit costsare 28 and 45 times the daily wages. The mostexpensive (diploma) education constitutes 51 per centand 80 per cent of the per capita income in rural andurban areas respectively, and nearly 120 days of dailywages in both rural and urban areas. These costs haveto be viewed against the Constitutional entitlement of‘free’ elementary education and a treaty obligation to‘inexpensive’ education at higher levels.
0102030405060708090
6 to 10 11 to13
6 to 13 6 to 10 11 to13
6 to 13
Rural Urban
Age-group in years
Per
cen
tage
En
rolm
ent
Government &Local body SchoolsPrivate Aided SchoolsPrivate Unaided Schools
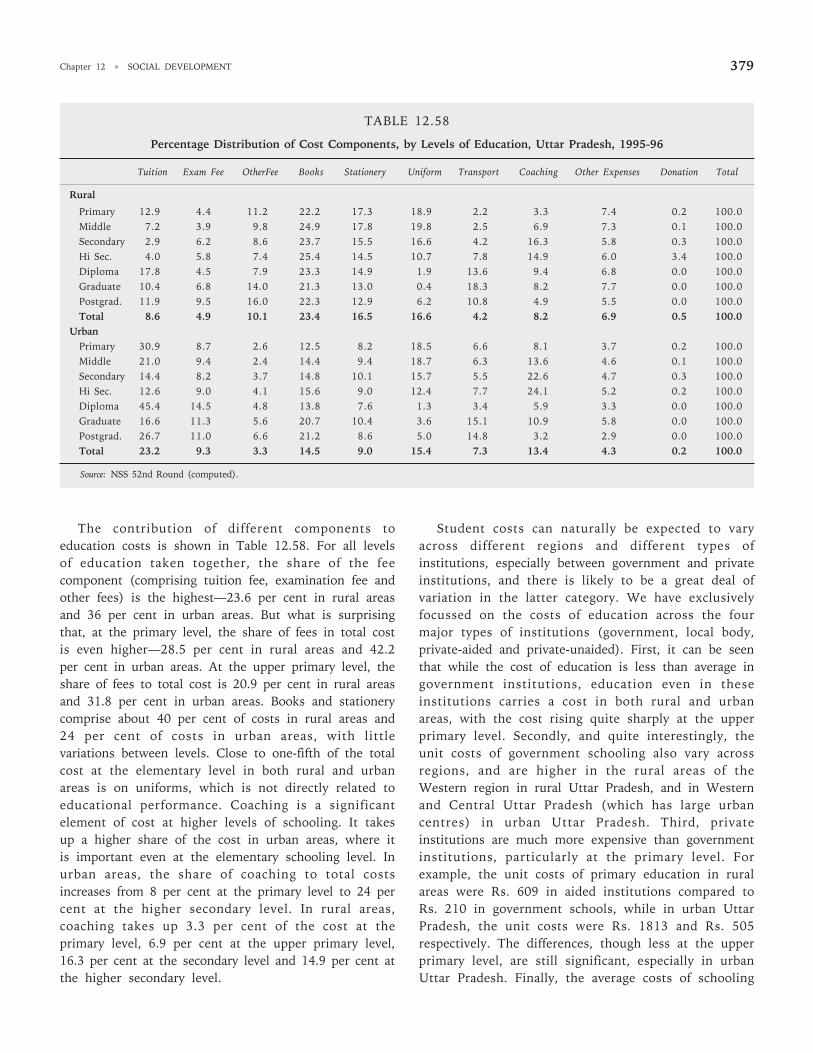
Chapter 12 • SOCIAL DEVELOPMENT 379
The contribution of different components toeducation costs is shown in Table 12.58. For all levelsof education taken together, the share of the feecomponent (comprising tuition fee, examination fee andother fees) is the highest—23.6 per cent in rural areasand 36 per cent in urban areas. But what is surprisingthat, at the primary level, the share of fees in total costis even higher—28.5 per cent in rural areas and 42.2per cent in urban areas. At the upper primary level, theshare of fees to total cost is 20.9 per cent in rural areasand 31.8 per cent in urban areas. Books and stationerycomprise about 40 per cent of costs in rural areas and24 per cent of costs in urban areas, with littlevariations between levels. Close to one-fifth of the totalcost at the elementary level in both rural and urbanareas is on uniforms, which is not directly related toeducational performance. Coaching is a significantelement of cost at higher levels of schooling. It takesup a higher share of the cost in urban areas, where itis important even at the elementary schooling level. Inurban areas, the share of coaching to total costsincreases from 8 per cent at the primary level to 24 percent at the higher secondary level. In rural areas,coaching takes up 3.3 per cent of the cost at theprimary level, 6.9 per cent at the upper primary level,16.3 per cent at the secondary level and 14.9 per cent atthe higher secondary level.
Student costs can naturally be expected to varyacross different regions and different types ofinstitutions, especially between government and privateinstitutions, and there is likely to be a great deal ofvariation in the latter category. We have exclusivelyfocussed on the costs of education across the fourmajor types of institutions (government, local body,private-aided and private-unaided). First, it can be seenthat while the cost of education is less than average ingovernment institutions, education even in theseinstitutions carries a cost in both rural and urbanareas, with the cost rising quite sharply at the upperprimary level. Secondly, and quite interestingly, theunit costs of government schooling also vary acrossregions, and are higher in the rural areas of theWestern region in rural Uttar Pradesh, and in Westernand Central Uttar Pradesh (which has large urbancentres) in urban Uttar Pradesh. Third, privateinstitutions are much more expensive than governmentinstitutions, particularly at the primary level. Forexample, the unit costs of primary education in ruralareas were Rs. 609 in aided institutions compared toRs. 210 in government schools, while in urban UttarPradesh, the unit costs were Rs. 1813 and Rs. 505respectively. The differences, though less at the upperprimary level, are still significant, especially in urbanUttar Pradesh. Finally, the average costs of schooling
TABLE 12.58
Percentage Distribution of Cost Components, by Levels of Education, Uttar Pradesh, 1995-96
Tuition Exam Fee OtherFee Books Stationery Uniform Transport Coaching Other Expenses Donation Total
Rural
Primary 12.9 4.4 11.2 22.2 17.3 18.9 2.2 3.3 7.4 0.2 100.0Middle 7.2 3.9 9.8 24.9 17.8 19.8 2.5 6.9 7.3 0.1 100.0Secondary 2.9 6.2 8.6 23.7 15.5 16.6 4.2 16.3 5.8 0.3 100.0Hi Sec. 4.0 5.8 7.4 25.4 14.5 10.7 7.8 14.9 6.0 3.4 100.0Diploma 17.8 4.5 7.9 23.3 14.9 1.9 13.6 9.4 6.8 0.0 100.0Graduate 10.4 6.8 14.0 21.3 13.0 0.4 18.3 8.2 7.7 0.0 100.0Postgrad. 11.9 9.5 16.0 22.3 12.9 6.2 10.8 4.9 5.5 0.0 100.0Total 8.6 4.9 10.1 23.4 16.5 16.6 4.2 8.2 6.9 0.5 100.0
UrbanPrimary 30.9 8.7 2.6 12.5 8.2 18.5 6.6 8.1 3.7 0.2 100.0Middle 21.0 9.4 2.4 14.4 9.4 18.7 6.3 13.6 4.6 0.1 100.0Secondary 14.4 8.2 3.7 14.8 10.1 15.7 5.5 22.6 4.7 0.3 100.0Hi Sec. 12.6 9.0 4.1 15.6 9.0 12.4 7.7 24.1 5.2 0.2 100.0Diploma 45.4 14.5 4.8 13.8 7.6 1.3 3.4 5.9 3.3 0.0 100.0Graduate 16.6 11.3 5.6 20.7 10.4 3.6 15.1 10.9 5.8 0.0 100.0Postgrad. 26.7 11.0 6.6 21.2 8.6 5.0 14.8 3.2 2.9 0.0 100.0Total 23.2 9.3 3.3 14.5 9.0 15.4 7.3 13.4 4.3 0.2 100.0
Source: NSS 52nd Round (computed).
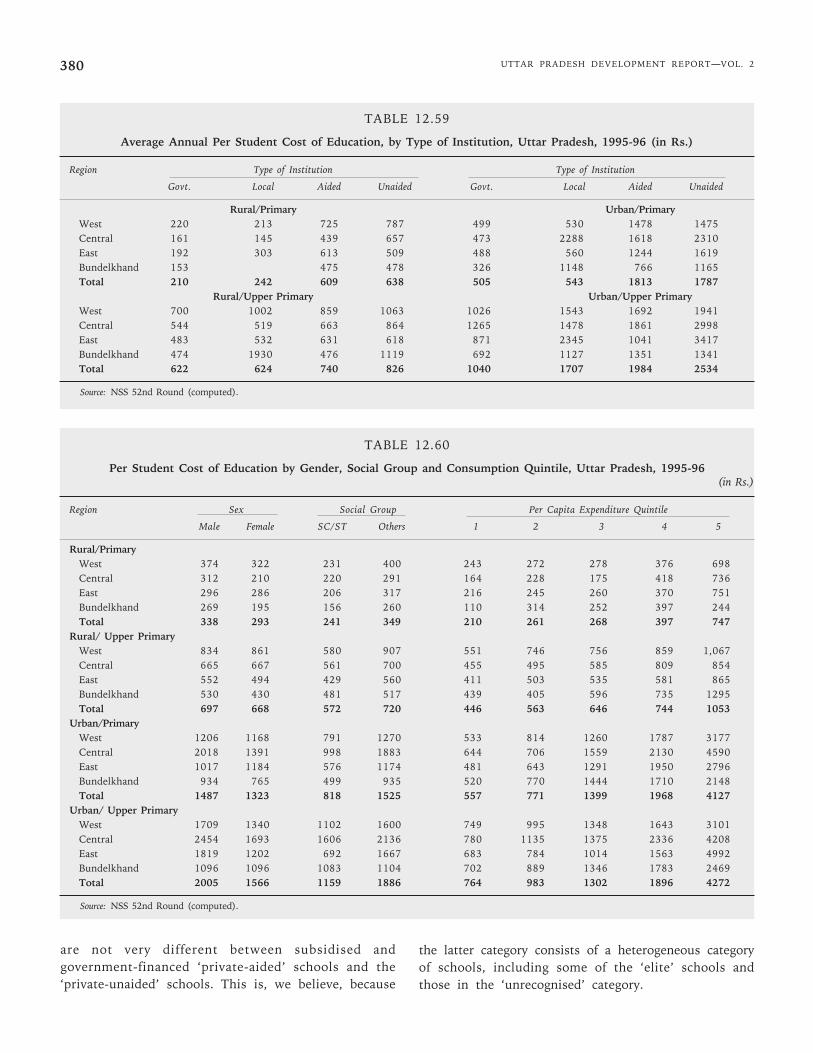
UTTAR PRADESH DEVELOPMENT REPORT—VOL. 2380
TABLE 12.59
Average Annual Per Student Cost of Education, by Type of Institution, Uttar Pradesh, 1995-96 (in Rs.)
Region Type of Institution Type of Institution
Govt. Local Aided Unaided Govt. Local Aided Unaided
Rural/Primary Urban/PrimaryWest 220 213 725 787 499 530 1478 1475Central 161 145 439 657 473 2288 1618 2310East 192 303 613 509 488 560 1244 1619Bundelkhand 153 475 478 326 1148 766 1165Total 210 242 609 638 505 543 1813 1787
Rural/Upper Primary Urban/Upper PrimaryWest 700 1002 859 1063 1026 1543 1692 1941Central 544 519 663 864 1265 1478 1861 2998East 483 532 631 618 871 2345 1041 3417Bundelkhand 474 1930 476 1119 692 1127 1351 1341Total 622 624 740 826 1040 1707 1984 2534
Source: NSS 52nd Round (computed).
TABLE 12.60
Per Student Cost of Education by Gender, Social Group and Consumption Quintile, Uttar Pradesh, 1995-96(in Rs.)
Region Sex Social Group Per Capita Expenditure Quintile
Male Female SC/ST Others 1 2 3 4 5
Rural/PrimaryWest 374 322 231 400 243 272 278 376 698Central 312 210 220 291 164 228 175 418 736East 296 286 206 317 216 245 260 370 751Bundelkhand 269 195 156 260 110 314 252 397 244Total 338 293 241 349 210 261 268 397 747
Rural/ Upper PrimaryWest 834 861 580 907 551 746 756 859 1,067Central 665 667 561 700 455 495 585 809 854East 552 494 429 560 411 503 535 581 865Bundelkhand 530 430 481 517 439 405 596 735 1295Total 697 668 572 720 446 563 646 744 1053
Urban/PrimaryWest 1206 1168 791 1270 533 814 1260 1787 3177Central 2018 1391 998 1883 644 706 1559 2130 4590East 1017 1184 576 1174 481 643 1291 1950 2796Bundelkhand 934 765 499 935 520 770 1444 1710 2148Total 1487 1323 818 1525 557 771 1399 1968 4127
Urban/ Upper PrimaryWest 1709 1340 1102 1600 749 995 1348 1643 3101Central 2454 1693 1606 2136 780 1135 1375 2336 4208East 1819 1202 692 1667 683 784 1014 1563 4992Bundelkhand 1096 1096 1083 1104 702 889 1346 1783 2469Total 2005 1566 1159 1886 764 983 1302 1896 4272
Source: NSS 52nd Round (computed).
are not very different between subsidised andgovernment-financed ‘private-aided’ schools and the‘private-unaided’ schools. This is, we believe, because
the latter category consists of a heterogeneous categoryof schools, including some of the ‘elite’ schools andthose in the ‘unrecognised’ category.

Chapter 12 • SOCIAL DEVELOPMENT 381
Faced with different types of schooling costs,households make decisions keeping in mind theireconomic circumstances and the value they place uponeducation. Table 12.60 shows how the average cost ofschooling varies across regions, for boys and girls, SC/ST and others and for households placed in differentper capita consumption quintiles.
The unit costs of education are lower for girls thanfor boys in both rural and urban Uttar Pradesh and forprimary as well as upper primary education. Since girlsand boys come from similar socio-economicbackgrounds (in fact, girls from less favoured economiccircumstances are less likely to find themselves inschools than boys), parents appear to opt for lowerinvestments in girls’ education even at these levels.These results hold for most of the regions across thetwo levels of education and urban/rural areas, althoughthere are a few exceptions.
The amount spent on the education of an SC/STstudent is invariably less than what is spent for otherstudents, at both levels of education, in urban as wellas rural areas but the differences are much larger in theurban areas. For example, an SC/ST student spends, onaverage, Rs. 818 in urban primary education comparedto Rs. 1525 for other students, while at the urbanupper primary level, SC/ST students spend Rs. 1159compared Rs. 1886 spent by others.
Across quintile groups, differences are very large atall levels, but again higher in urban areas. A student inrural Uttar Pradesh in the highest quintile spendsnearly three times as much in acquiring education as astudent in the lowest quintile at the primary level andabout twice as much at the upper primary level. Incomparison, in urban areas, a student in the highestquintile spends nearly eight times as much in acquiringeducation as a student in the lowest quintile at theprimary level and about seven times the amount at theupper primary level.
Thus, the out-of-pocket cost of education, was byno means, inconsiderable in Uttar Pradesh in 1995-96even at the elementary level, and tended to rise witheach successive level of education. These costsnaturally varied with the type of school. These costshave led to highly differentiated strategies ofschooling between boys and girls, socially deprivedgroups and others, and between different economicstrata. This is but another demonstration of marketfailure in the provision of education, requiringeffective public policy intervention.
12.4.7 Public Resources for Education–Expenditure andRevenue Mobilisation
Since education is a state subject, bulk of theexpenditure on education is incurred by the Stategovernment. But the Central government alsocontributes to the education sector. Moreover, externalassistance has also contributed quite significantly tothe growth of educational expenditure in the state.
The expenditure on education is classified under twoheads—revenue expenditure which reflects operationalexpenditure, and capital expenditure. Most educationalexpenditure in Uttar Pradesh (close to 99%) is in theform of revenue expenditure though it is widely agreedthat capital expenditures, which are often made out ofad hoc grants to educational institutions, or in recentyears, out of the Department of Rural DevelopmentSchemes, are not captured well in the presentclassification.
Further, all expenditure is also divided into ‘Plan’expenditure (reflecting investment/expenditure on newschemes) and ‘non-plan’ expenditure (reflectingmaintenance and current expenditure on old schemes).In general, the expenditure on schemes which are inthe ‘Plan’ in the first round are subsequentlytransferred to the ‘non-plan’ side, but there are someschemes which continue to be shown in the ‘Plans’.
A number of departments, other than the educationdepartment, also cater to education at the state level.These include the Central Ministries of SocialEmpowerment, Rural Development, Agriculture and theMinistry of Labour. At the State level, the Departmentsof Technical Education, Medical Education, Labour andEmployment, Agriculture, Rural Development, SocialWelfare, Minorities Welfare, Rural Development, andWomen and Child Development—all spend on education.
Educational expenditure is also incurred in the statethrough external assistance, provided either throughCentral schemes like ‘Joyful Learning’ or through stateprogrammes like the BEP. These funds are madeavailable directly through a state implementing agencyand these transfers are not reflected in the state budget(except for the state component which is shown in thebudget). External assistance to state programmes isprovided to state governments as ‘Additional CentralAssistance’ on the same terms and conditions as‘Central Assistance’, whereas external assistancethrough Central schemes is provided to the state onthe terms and conditions (of counterpart funding, etc.)which are specified for the scheme.
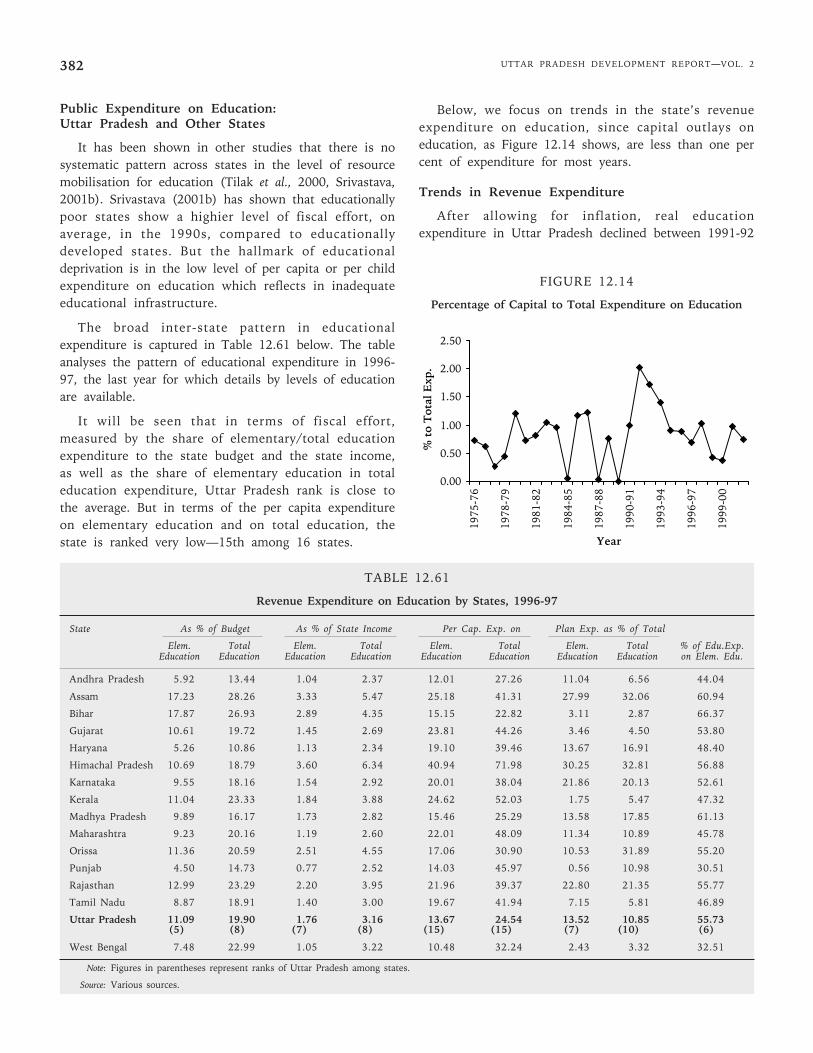
UTTAR PRADESH DEVELOPMENT REPORT—VOL. 2382
Public Expenditure on Education:Uttar Pradesh and Other States
It has been shown in other studies that there is nosystematic pattern across states in the level of resourcemobilisation for education (Tilak et al., 2000, Srivastava,2001b). Srivastava (2001b) has shown that educationallypoor states show a highier level of fiscal effort, onaverage, in the 1990s, compared to educationallydeveloped states. But the hallmark of educationaldeprivation is in the low level of per capita or per childexpenditure on education which reflects in inadequateeducational infrastructure.
The broad inter-state pattern in educationalexpenditure is captured in Table 12.61 below. The tableanalyses the pattern of educational expenditure in 1996-97, the last year for which details by levels of educationare available.
It will be seen that in terms of fiscal effort,measured by the share of elementary/total educationexpenditure to the state budget and the state income,as well as the share of elementary education in totaleducation expenditure, Uttar Pradesh rank is close tothe average. But in terms of the per capita expenditureon elementary education and on total education, thestate is ranked very low—15th among 16 states.
Below, we focus on trends in the state’s revenueexpenditure on education, since capital outlays oneducation, as Figure 12.14 shows, are less than one percent of expenditure for most years.
Trends in Revenue Expenditure
After allowing for inflation, real educationexpenditure in Uttar Pradesh declined between 1991-92
TABLE 12.61
Revenue Expenditure on Education by States, 1996-97
State As % of Budget As % of State Income Per Cap. Exp. on Plan Exp. as % of Total
Elem. Total Elem. Total Elem. Total Elem. Total % of Edu.Exp.Education Education Education Education Education Education Education Education on Elem. Edu.
Andhra Pradesh 5.92 13.44 1.04 2.37 12.01 27.26 11.04 6.56 44.04
Assam 17.23 28.26 3.33 5.47 25.18 41.31 27.99 32.06 60.94
Bihar 17.87 26.93 2.89 4.35 15.15 22.82 3.11 2.87 66.37
Gujarat 10.61 19.72 1.45 2.69 23.81 44.26 3.46 4.50 53.80
Haryana 5.26 10.86 1.13 2.34 19.10 39.46 13.67 16.91 48.40
Himachal Pradesh 10.69 18.79 3.60 6.34 40.94 71.98 30.25 32.81 56.88
Karnataka 9.55 18.16 1.54 2.92 20.01 38.04 21.86 20.13 52.61
Kerala 11.04 23.33 1.84 3.88 24.62 52.03 1.75 5.47 47.32
Madhya Pradesh 9.89 16.17 1.73 2.82 15.46 25.29 13.58 17.85 61.13
Maharashtra 9.23 20.16 1.19 2.60 22.01 48.09 11.34 10.89 45.78
Orissa 11.36 20.59 2.51 4.55 17.06 30.90 10.53 31.89 55.20
Punjab 4.50 14.73 0.77 2.52 14.03 45.97 0.56 10.98 30.51
Rajasthan 12.99 23.29 2.20 3.95 21.96 39.37 22.80 21.35 55.77
Tamil Nadu 8.87 18.91 1.40 3.00 19.67 41.94 7.15 5.81 46.89
Uttar Pradesh 11.09 19.90 1.76 3.16 13.67 24.54 13.52 10.85 55.73(5) (8) (7) (8) (15) (15) (7) (10) (6)
West Bengal 7.48 22.99 1.05 3.22 10.48 32.24 2.43 3.32 32.51
Note: Figures in parentheses represent ranks of Uttar Pradesh among states.
Source: Various sources.
0.00
0.50
1.00
1.50
2.00
2.50
1975
-76
1978
-79
1981
-82
1984
-85
1987
-88
1990
-91
1993
-94
1996
-97
1999
-00
Year
% t
o T
otal
Exp
.
FIGURE 12.14
Percentage of Capital to Total Expenditure on Education
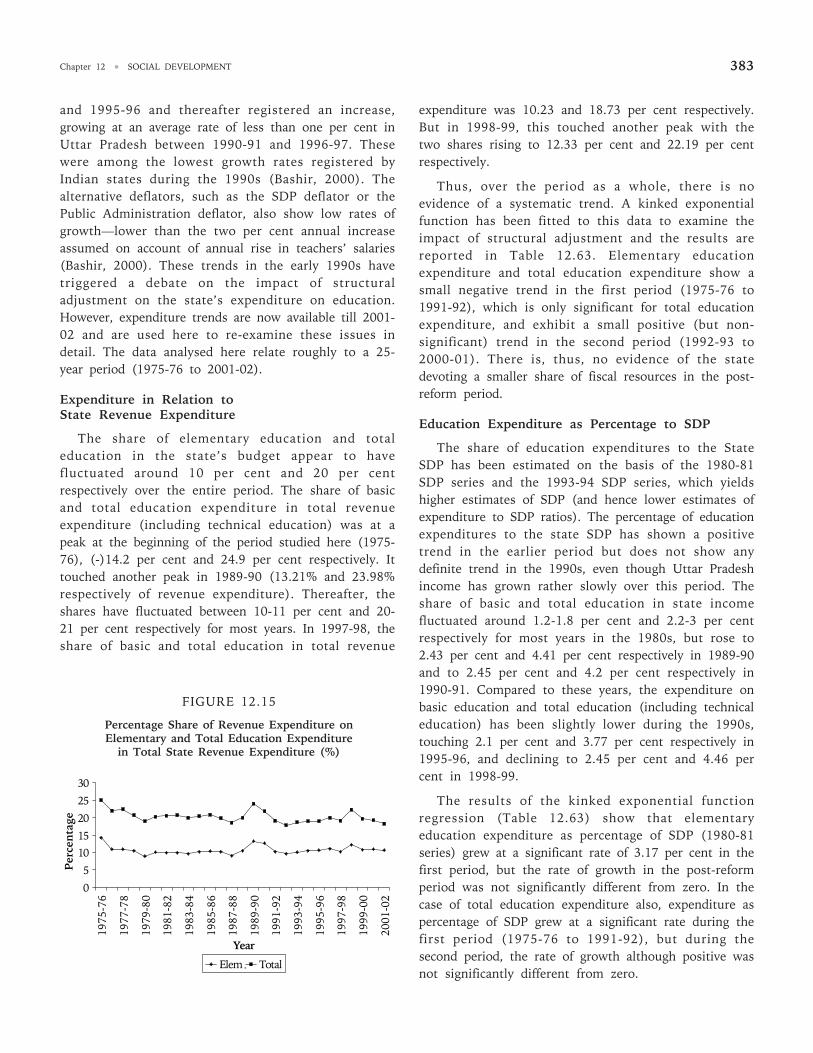
Chapter 12 • SOCIAL DEVELOPMENT 383
and 1995-96 and thereafter registered an increase,growing at an average rate of less than one per cent inUttar Pradesh between 1990-91 and 1996-97. Thesewere among the lowest growth rates registered byIndian states during the 1990s (Bashir, 2000). Thealternative deflators, such as the SDP deflator or thePublic Administration deflator, also show low rates ofgrowth—lower than the two per cent annual increaseassumed on account of annual rise in teachers’ salaries(Bashir, 2000). These trends in the early 1990s havetriggered a debate on the impact of structuraladjustment on the state’s expenditure on education.However, expenditure trends are now available till 2001-02 and are used here to re-examine these issues indetail. The data analysed here relate roughly to a 25-year period (1975-76 to 2001-02).
Expenditure in Relation toState Revenue Expenditure
The share of elementary education and totaleducation in the state’s budget appear to havefluctuated around 10 per cent and 20 per centrespectively over the entire period. The share of basicand total education expenditure in total revenueexpenditure (including technical education) was at apeak at the beginning of the period studied here (1975-76), (-)14.2 per cent and 24.9 per cent respectively. Ittouched another peak in 1989-90 (13.21% and 23.98%respectively of revenue expenditure). Thereafter, theshares have fluctuated between 10-11 per cent and 20-21 per cent respectively for most years. In 1997-98, theshare of basic and total education in total revenue
expenditure was 10.23 and 18.73 per cent respectively.But in 1998-99, this touched another peak with thetwo shares rising to 12.33 per cent and 22.19 per centrespectively.
Thus, over the period as a whole, there is noevidence of a systematic trend. A kinked exponentialfunction has been fitted to this data to examine theimpact of structural adjustment and the results arereported in Table 12.63. Elementary educationexpenditure and total education expenditure show asmall negative trend in the first period (1975-76 to1991-92), which is only significant for total educationexpenditure, and exhibit a small positive (but non-significant) trend in the second period (1992-93 to2000-01). There is, thus, no evidence of the statedevoting a smaller share of fiscal resources in the post-reform period.
Education Expenditure as Percentage to SDP
The share of education expenditures to the StateSDP has been estimated on the basis of the 1980-81SDP series and the 1993-94 SDP series, which yieldshigher estimates of SDP (and hence lower estimates ofexpenditure to SDP ratios). The percentage of educationexpenditures to the state SDP has shown a positivetrend in the earlier period but does not show anydefinite trend in the 1990s, even though Uttar Pradeshincome has grown rather slowly over this period. Theshare of basic and total education in state incomefluctuated around 1.2-1.8 per cent and 2.2-3 per centrespectively for most years in the 1980s, but rose to2.43 per cent and 4.41 per cent respectively in 1989-90and to 2.45 per cent and 4.2 per cent respectively in1990-91. Compared to these years, the expenditure onbasic education and total education (including technicaleducation) has been slightly lower during the 1990s,touching 2.1 per cent and 3.77 per cent respectively in1995-96, and declining to 2.45 per cent and 4.46 percent in 1998-99.
The results of the kinked exponential functionregression (Table 12.63) show that elementaryeducation expenditure as percentage of SDP (1980-81series) grew at a significant rate of 3.17 per cent in thefirst period, but the rate of growth in the post-reformperiod was not significantly different from zero. In thecase of total education expenditure also, expenditure aspercentage of SDP grew at a significant rate during thefirst period (1975-76 to 1991-92), but during thesecond period, the rate of growth although positive wasnot significantly different from zero.
FIGURE 12.15
Percentage Share of Revenue Expenditure onElementary and Total Education Expenditure
in Total State Revenue Expenditure (%)
0
5
1015
20
25
30
1975
-76
1977
-78
1979
-80
1981
-82
1983
-84
1985
-86
1987
-88
1989
-90
1991
-92
1993
-94
1995
-96
1997
-98
1999
-00
2001
-02
Year
Per
cent
age
Elem Total.
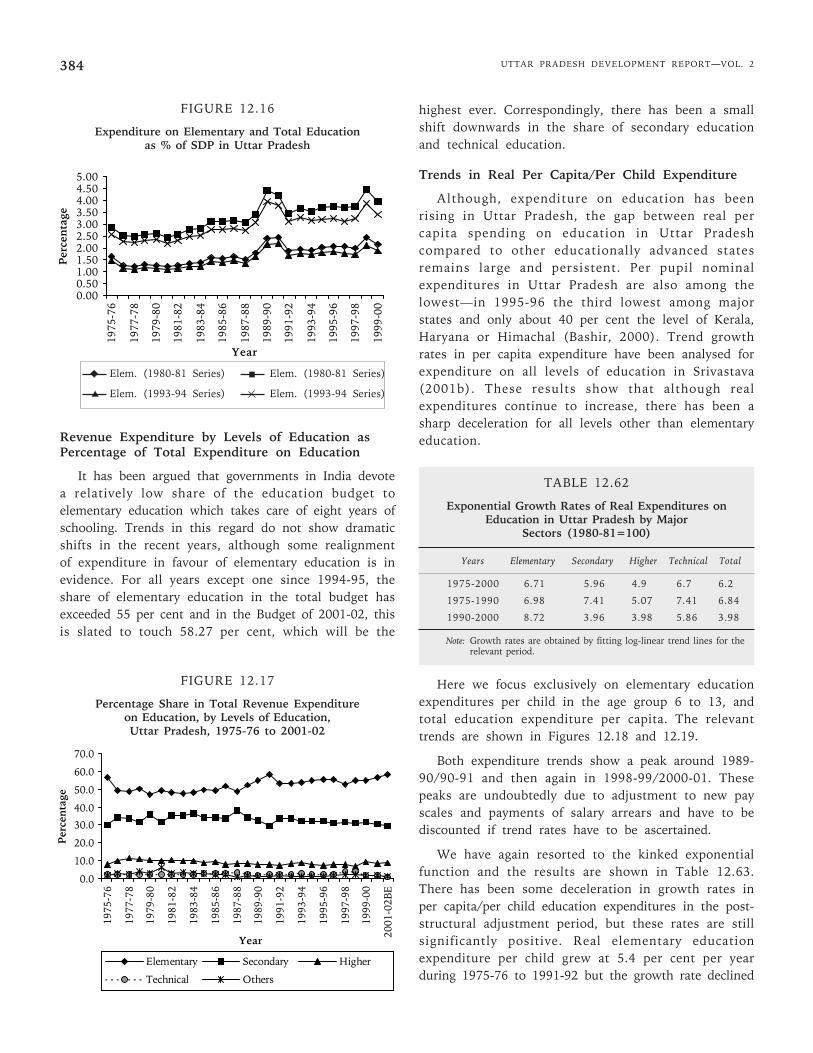
UTTAR PRADESH DEVELOPMENT REPORT—VOL. 2384
FIGURE 12.16
Expenditure on Elementary and Total Educationas % of SDP in Uttar Pradesh
Revenue Expenditure by Levels of Education asPercentage of Total Expenditure on Education
It has been argued that governments in India devotea relatively low share of the education budget toelementary education which takes care of eight years ofschooling. Trends in this regard do not show dramaticshifts in the recent years, although some realignmentof expenditure in favour of elementary education is inevidence. For all years except one since 1994-95, theshare of elementary education in the total budget hasexceeded 55 per cent and in the Budget of 2001-02, thisis slated to touch 58.27 per cent, which will be the
highest ever. Correspondingly, there has been a smallshift downwards in the share of secondary educationand technical education.
Trends in Real Per Capita/Per Child Expenditure
Although, expenditure on education has beenrising in Uttar Pradesh, the gap between real percapita spending on education in Uttar Pradeshcompared to other educationally advanced statesremains large and persistent. Per pupil nominalexpenditures in Uttar Pradesh are also among thelowest—in 1995-96 the third lowest among majorstates and only about 40 per cent the level of Kerala,Haryana or Himachal (Bashir, 2000). Trend growthrates in per capita expenditure have been analysed forexpenditure on all levels of education in Srivastava(2001b). These results show that although realexpenditures continue to increase, there has been asharp deceleration for all levels other than elementaryeducation.
TABLE 12.62
Exponential Growth Rates of Real Expenditures onEducation in Uttar Pradesh by Major
Sectors (1980-81=100)
Years Elementary Secondary Higher Technical Total
1975-2000 6.71 5.96 4.9 6.7 6.2
1975-1990 6.98 7.41 5.07 7.41 6.84
1990-2000 8.72 3.96 3.98 5.86 3.98
Note: Growth rates are obtained by fitting log-linear trend lines for therelevant period.
Here we focus exclusively on elementary educationexpenditures per child in the age group 6 to 13, andtotal education expenditure per capita. The relevanttrends are shown in Figures 12.18 and 12.19.
Both expenditure trends show a peak around 1989-90/90-91 and then again in 1998-99/2000-01. Thesepeaks are undoubtedly due to adjustment to new payscales and payments of salary arrears and have to bediscounted if trend rates have to be ascertained.
We have again resorted to the kinked exponentialfunction and the results are shown in Table 12.63.There has been some deceleration in growth rates inper capita/per child education expenditures in the post-structural adjustment period, but these rates are stillsignificantly positive. Real elementary educationexpenditure per child grew at 5.4 per cent per yearduring 1975-76 to 1991-92 but the growth rate declined
FIGURE 12.17
Percentage Share in Total Revenue Expenditureon Education, by Levels of Education,Uttar Pradesh, 1975-76 to 2001-02
0.0
10.0
20.0
30.0
40.0
50.0
60.0
70.0
1975
-76
1977
-78
1979
-80
1981
-82
1983
-84
1985
-86
1987
-88
1989
-90
1991
-92
1993
-94
1995
-96
1997
-98
1999
-00
2001
-02B
E
Year
Per
cent
age
Elementary Secondary Higher
Technical Others
0.000.501.001.502.002.503.003.504.004.505.00
1975
-76
1977
-78
1979
-80
1981
-82
1983
-84
1985
-86
1987
-88
1989
-90
1991
-92
1993
-94
1995
-96
1997
-98
1999
-00
Year
Per
cen
tage
Elem. (1980-81 Series) Elem. (1980-81 Series)
Elem. (1993-94 Series) Elem. (1993-94 Series)
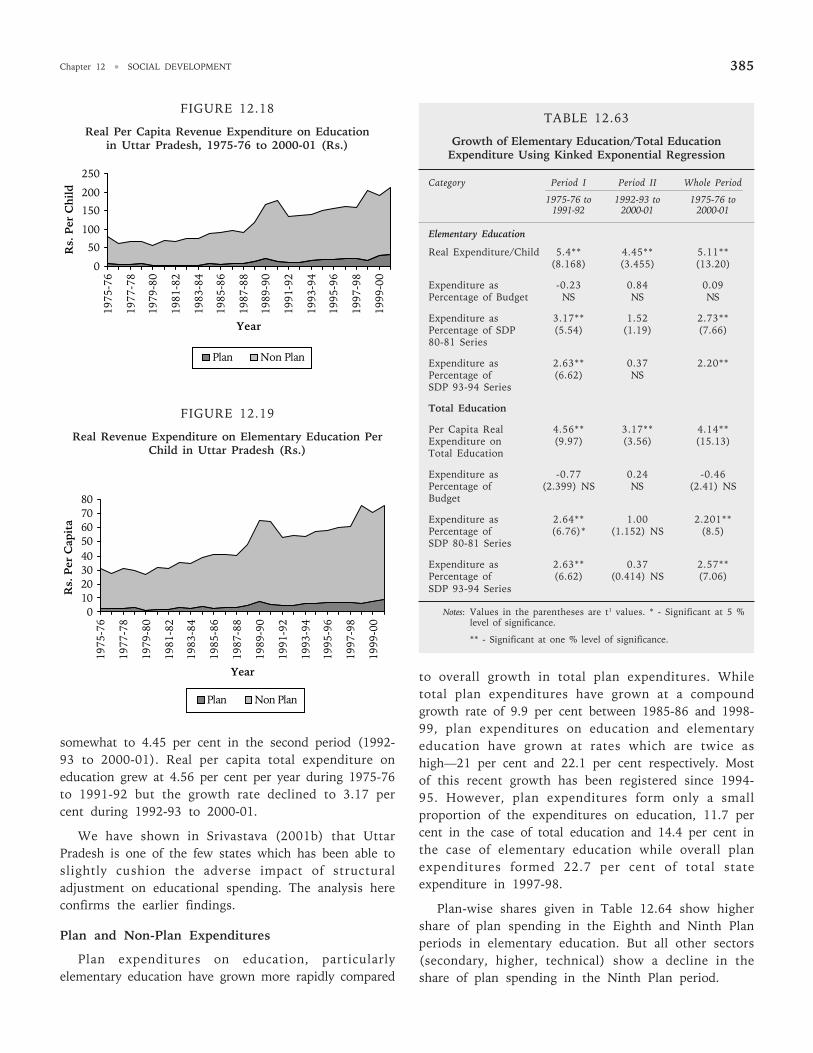
Chapter 12 • SOCIAL DEVELOPMENT 385
FIGURE 12.18
Real Per Capita Revenue Expenditure on Educationin Uttar Pradesh, 1975-76 to 2000-01 (Rs.)
0
50
100
150
200
250
1975
-76
1977
-78
1979
-80
1981
-82
1983
-84
1985
-86
1987
-88
1989
-90
1991
-92
1993
-94
1995
-96
1997
-98
1999
-00
Year
Rs.
Per
Ch
ild
Plan Non Plan
FIGURE 12.19
Real Revenue Expenditure on Elementary Education PerChild in Uttar Pradesh (Rs.)
01020304050607080
1975
-76
1977
-78
1979
-80
1981
-82
1983
-84
1985
-86
1987
-88
1989
-90
1991
-92
1993
-94
1995
-96
1997
-98
1999
-00
Year
Rs.
Per
Cap
ita
Plan Non Plan
somewhat to 4.45 per cent in the second period (1992-93 to 2000-01). Real per capita total expenditure oneducation grew at 4.56 per cent per year during 1975-76to 1991-92 but the growth rate declined to 3.17 percent during 1992-93 to 2000-01.
We have shown in Srivastava (2001b) that UttarPradesh is one of the few states which has been able toslightly cushion the adverse impact of structuraladjustment on educational spending. The analysis hereconfirms the earlier findings.
Plan and Non-Plan Expenditures
Plan expenditures on education, particularlyelementary education have grown more rapidly compared
TABLE 12.63
Growth of Elementary Education/Total EducationExpenditure Using Kinked Exponential Regression
Category Period I Period II Whole Period
1975-76 to 1992-93 to 1975-76 to1991-92 2000-01 2000-01
Elementary Education
Real Expenditure/Child 5.4** 4.45** 5.11**(8.168) (3.455) (13.20)
Expenditure as -0.23 0.84 0.09Percentage of Budget NS NS NS
Expenditure as 3.17** 1.52 2.73**Percentage of SDP (5.54) (1.19) (7.66)80-81 Series
Expenditure as 2.63** 0.37 2.20**Percentage of (6.62) NSSDP 93-94 Series
Total Education
Per Capita Real 4.56** 3.17** 4.14**Expenditure on (9.97) (3.56) (15.13)Total Education
Expenditure as -0.77 0.24 -0.46Percentage of (2.399) NS NS (2.41) NSBudget
Expenditure as 2.64** 1.00 2.201**Percentage of (6.76)* (1.152) NS (8.5)SDP 80-81 Series
Expenditure as 2.63** 0.37 2.57**Percentage of (6.62) (0.414) NS (7.06)SDP 93-94 Series
Notes: Values in the parentheses are t1 values. * - Significant at 5 %level of significance.
** - Significant at one % level of significance.
to overall growth in total plan expenditures. Whiletotal plan expenditures have grown at a compoundgrowth rate of 9.9 per cent between 1985-86 and 1998-99, plan expenditures on education and elementaryeducation have grown at rates which are twice ashigh—21 per cent and 22.1 per cent respectively. Mostof this recent growth has been registered since 1994-95. However, plan expenditures form only a smallproportion of the expenditures on education, 11.7 percent in the case of total education and 14.4 per cent inthe case of elementary education while overall planexpenditures formed 22.7 per cent of total stateexpenditure in 1997-98.
Plan-wise shares given in Table 12.64 show highershare of plan spending in the Eighth and Ninth Planperiods in elementary education. But all other sectors(secondary, higher, technical) show a decline in theshare of plan spending in the Ninth Plan period.
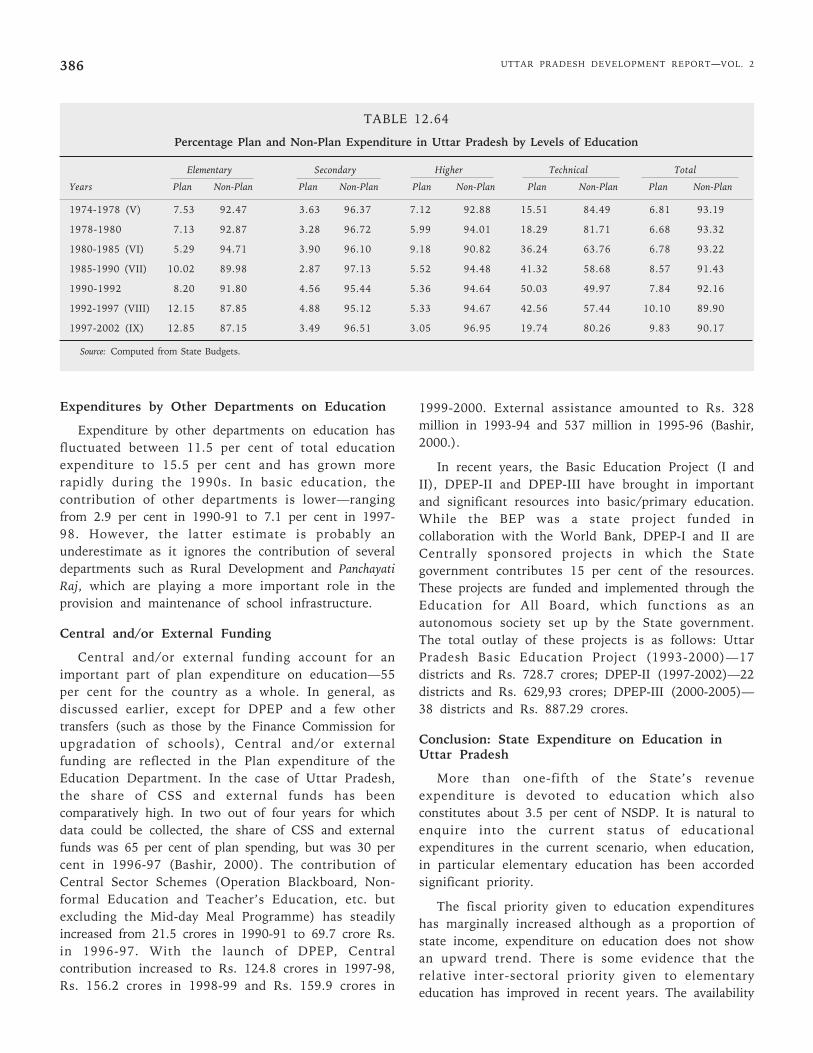
UTTAR PRADESH DEVELOPMENT REPORT—VOL. 2386
Expenditures by Other Departments on Education
Expenditure by other departments on education hasfluctuated between 11.5 per cent of total educationexpenditure to 15.5 per cent and has grown morerapidly during the 1990s. In basic education, thecontribution of other departments is lower—rangingfrom 2.9 per cent in 1990-91 to 7.1 per cent in 1997-98. However, the latter estimate is probably anunderestimate as it ignores the contribution of severaldepartments such as Rural Development and PanchayatiRaj, which are playing a more important role in theprovision and maintenance of school infrastructure.
Central and/or External Funding
Central and/or external funding account for animportant part of plan expenditure on education—55per cent for the country as a whole. In general, asdiscussed earlier, except for DPEP and a few othertransfers (such as those by the Finance Commission forupgradation of schools), Central and/or externalfunding are reflected in the Plan expenditure of theEducation Department. In the case of Uttar Pradesh,the share of CSS and external funds has beencomparatively high. In two out of four years for whichdata could be collected, the share of CSS and externalfunds was 65 per cent of plan spending, but was 30 percent in 1996-97 (Bashir, 2000). The contribution ofCentral Sector Schemes (Operation Blackboard, Non-formal Education and Teacher’s Education, etc. butexcluding the Mid-day Meal Programme) has steadilyincreased from 21.5 crores in 1990-91 to 69.7 crore Rs.in 1996-97. With the launch of DPEP, Centralcontribution increased to Rs. 124.8 crores in 1997-98,Rs. 156.2 crores in 1998-99 and Rs. 159.9 crores in
1999-2000. External assistance amounted to Rs. 328million in 1993-94 and 537 million in 1995-96 (Bashir,2000.).
In recent years, the Basic Education Project (I andII), DPEP-II and DPEP-III have brought in importantand significant resources into basic/primary education.While the BEP was a state project funded incollaboration with the World Bank, DPEP-I and II areCentrally sponsored projects in which the Stategovernment contributes 15 per cent of the resources.These projects are funded and implemented through theEducation for All Board, which functions as anautonomous society set up by the State government.The total outlay of these projects is as follows: UttarPradesh Basic Education Project (1993-2000)—17districts and Rs. 728.7 crores; DPEP-II (1997-2002)—22districts and Rs. 629,93 crores; DPEP-III (2000-2005)—38 districts and Rs. 887.29 crores.
Conclusion: State Expenditure on Education inUttar Pradesh
More than one-fifth of the State’s revenueexpenditure is devoted to education which alsoconstitutes about 3.5 per cent of NSDP. It is natural toenquire into the current status of educationalexpenditures in the current scenario, when education,in particular elementary education has been accordedsignificant priority.
The fiscal priority given to education expenditureshas marginally increased although as a proportion ofstate income, expenditure on education does not showan upward trend. There is some evidence that therelative inter-sectoral priority given to elementaryeducation has improved in recent years. The availability
TABLE 12.64
Percentage Plan and Non-Plan Expenditure in Uttar Pradesh by Levels of Education
Elementary Secondary Higher Technical Total
Years Plan Non-Plan Plan Non-Plan Plan Non-Plan Plan Non-Plan Plan Non-Plan
1974-1978 (V) 7.53 92.47 3.63 96.37 7.12 92.88 15.51 84.49 6.81 93.19
1978-1980 7.13 92.87 3.28 96.72 5.99 94.01 18.29 81.71 6.68 93.32
1980-1985 (VI) 5.29 94.71 3.90 96.10 9.18 90.82 36.24 63.76 6.78 93.22
1985-1990 (VII) 10.02 89.98 2.87 97.13 5.52 94.48 41.32 58.68 8.57 91.43
1990-1992 8.20 91.80 4.56 95.44 5.36 94.64 50.03 49.97 7.84 92.16
1992-1997 (VIII) 12.15 87.85 4.88 95.12 5.33 94.67 42.56 57.44 10.10 89.90
1997-2002 (IX) 12.85 87.15 3.49 96.51 3.05 96.95 19.74 80.26 9.83 90.17
Source: Computed from State Budgets.
Chapter 12 • SOCIAL DEVELOPMENT 387
of plan funds for elementary education has alsoimproved, which is not the case for other sectors ineducation.
Per capita/per child education expenditures appear tobe closely correlated to educational performance andthese are comparatively very low for Uttar Pradesh. Inthe post-structural period, per child real expendituresin elementary education, and per capita realexpenditures in total education have continued toincrease at a significant rate, although this is lowerthan the pre-structural adjustment growth rate in realper capita expenditures. The inflow of external andcentral funds (mainly to the elementary educationsector) have also increased and this is partly reflected inthe increased plan outlays.
12.4.8 Revenue Receipts andCost Recovery from Education
Till recently, the government of Uttar Pradesh didnot charge tuition fee up to the higher secondary level.But prescribed tuition fees are chargeable by aidedinstitutions and the government has also prescribed,from time to time, the schedules of tuition fees (at thehigher education level) and other fees and charges. Butthe schedule of such fees remains unrevised for severalyears at a stretch. As a consequence, the contributionof revenue (fee) receipts to the expenditure made byeducational institutions has been constantly decliningat all levels, necessitating a higher level of budgetarysupport, even at the same real expenditure levels.
As far as the government itself is concerned, it isonly entitled to the revenues accruing in governmentinstitutions and a share of specific items of fees (suchas tuition fees) collected by aided institutions. In recentyears, the government of Uttar Pradesh has made aconcerted effort to increase the fees payable atsecondary, higher secondary and higher educationlevels. It has also given certain categories ofinstitutions the flexibility of adopting a fee rate, and ofraising resources through self-financed courses,consultancies and so on. Thus, the major implication ofrevenue raising measures in institutions drawingfinancial support from government is likely to be onown revenues, which may help to strengthen theinternal resources of these institutions andconsequently help the government in reducing itsfinancial burden (and refocus on areas requiring agreater degree of such support).
So far as the government itself is concerned, thecontribution of fees to the state budget in Uttar
Pradesh has been very small. In 1984-85, revenuereceipts to the state government were Rs. 13.46 croreswhich was only about 2 per cent of the stateeducational expenditure in that year. In 1990-91 theamount of revenue went up to Rs 33.90 crores but itsrelative contribution came down to 1.63 per cent. Thecontribution from educational revenue could neverreach even 2.5 per cent of the total educationalexpenditure in a particular year right up to 1998-99. In1998-99, fee contributed Rs 95.89 crores, whichrepresented only 1.63 per cent of the total educationalexpenditure of that year.
However, the reform in the fee structure, especiallyin secondary level educational institutions, higher andtechnical education institutions is slowly making itselffelt. The revenue receipts from secondary education rosefrom Rs. 81.28 crores in 1999-00 to Rs. 108.64 croresin 2000-01 (RE) and were budgeted to rise to Rs.127.22crores in 2001-02. The revenue receipts from highereducation were only 4.24 crores in 1999-00, but thisfell to 1.01 crores in 2000-01. However, receipts fromthis sector were budgeted to increase to Rs. 75.15crores in 2001-02. Receipt from fees in technicaleducation fell marginally from Rs. 3..66 crores in 1999-00 to Rs. 4.84 crores in 2000-01 but this is expected toincrease to Rs. 10.16 crores in 2003-04. But ‘otherreceipts’ have been fluctuating, so that total receiptsfrom the sector fell from Rs. 8.85 crores in 1999-00 toRs. 6.17 crores in 2000-01 and 11.02 crores (estimated)in 2003-04. However, this is now budgeted to increaseto Rs. 57.01 crores. The percentage of total revenuereceipts in education to revenue expenditure in UttarPradesh was 3.25 per cent in 1999-00 and rose to 3.63per cent in 2000-01 (revised estimates). In 2001-02,this was budgeted to increase to 6.76 per cent.
It therefore appears that of late the growing concernon the part of the state government to increase theresources available from education and to collect morerevenue from educational fees for the state exchequer hassucceeded in raising fee rates and increasing revenuecollections. The recent moves have partly offset the long-term declining trend of fee receipts to institutionalbudgets. But such changes have to be judiciously appliedand carefully calibrated so as not to further reduce accessand equity in the educational system. During 1995-96,when the government’s revenue receipt from educationwas only Rs. 48.5 crores, estimates from the NSS 52ndRound showed that students in the state paid Rs. 628.9crores as fees and other charges to educationalinstitutions. The analysis in the preceding sections hasshown that the cost of education is certainly one of the
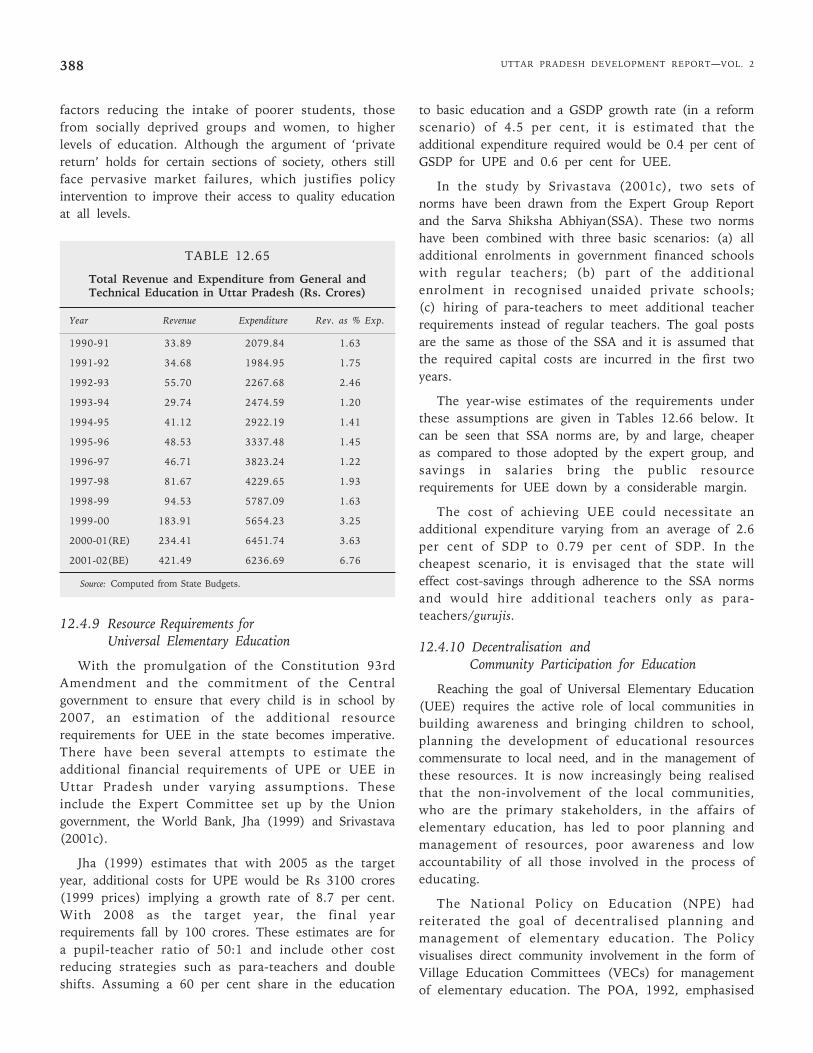
UTTAR PRADESH DEVELOPMENT REPORT—VOL. 2388
factors reducing the intake of poorer students, thosefrom socially deprived groups and women, to higherlevels of education. Although the argument of ‘privatereturn’ holds for certain sections of society, others stillface pervasive market failures, which justifies policyintervention to improve their access to quality educationat all levels.
TABLE 12.65
Total Revenue and Expenditure from General andTechnical Education in Uttar Pradesh (Rs. Crores)
Year Revenue Expenditure Rev. as % Exp.
1990-91 33.89 2079.84 1.63
1991-92 34.68 1984.95 1.75
1992-93 55.70 2267.68 2.46
1993-94 29.74 2474.59 1.20
1994-95 41.12 2922.19 1.41
1995-96 48.53 3337.48 1.45
1996-97 46.71 3823.24 1.22
1997-98 81.67 4229.65 1.93
1998-99 94.53 5787.09 1.63
1999-00 183.91 5654.23 3.25
2000-01(RE) 234.41 6451.74 3.63
2001-02(BE) 421.49 6236.69 6.76
Source: Computed from State Budgets.
12.4.9 Resource Requirements forUniversal Elementary Education
With the promulgation of the Constitution 93rdAmendment and the commitment of the Centralgovernment to ensure that every child is in school by2007, an estimation of the additional resourcerequirements for UEE in the state becomes imperative.There have been several attempts to estimate theadditional financial requirements of UPE or UEE inUttar Pradesh under varying assumptions. Theseinclude the Expert Committee set up by the Uniongovernment, the World Bank, Jha (1999) and Srivastava(2001c).
Jha (1999) estimates that with 2005 as the targetyear, additional costs for UPE would be Rs 3100 crores(1999 prices) implying a growth rate of 8.7 per cent.With 2008 as the target year, the final yearrequirements fall by 100 crores. These estimates are fora pupil-teacher ratio of 50:1 and include other costreducing strategies such as para-teachers and doubleshifts. Assuming a 60 per cent share in the education
to basic education and a GSDP growth rate (in a reformscenario) of 4.5 per cent, it is estimated that theadditional expenditure required would be 0.4 per cent ofGSDP for UPE and 0.6 per cent for UEE.
In the study by Srivastava (2001c), two sets ofnorms have been drawn from the Expert Group Reportand the Sarva Shiksha Abhiyan(SSA). These two normshave been combined with three basic scenarios: (a) alladditional enrolments in government financed schoolswith regular teachers; (b) part of the additionalenrolment in recognised unaided private schools;(c) hiring of para-teachers to meet additional teacherrequirements instead of regular teachers. The goal postsare the same as those of the SSA and it is assumed thatthe required capital costs are incurred in the first twoyears.
The year-wise estimates of the requirements underthese assumptions are given in Tables 12.66 below. Itcan be seen that SSA norms are, by and large, cheaperas compared to those adopted by the expert group, andsavings in salaries bring the public resourcerequirements for UEE down by a considerable margin.
The cost of achieving UEE could necessitate anadditional expenditure varying from an average of 2.6per cent of SDP to 0.79 per cent of SDP. In thecheapest scenario, it is envisaged that the state willeffect cost-savings through adherence to the SSA normsand would hire additional teachers only as para-teachers/gurujis.
12.4.10 Decentralisation andCommunity Participation for Education
Reaching the goal of Universal Elementary Education(UEE) requires the active role of local communities inbuilding awareness and bringing children to school,planning the development of educational resourcescommensurate to local need, and in the management ofthese resources. It is now increasingly being realisedthat the non-involvement of the local communities,who are the primary stakeholders, in the affairs ofelementary education, has led to poor planning andmanagement of resources, poor awareness and lowaccountability of all those involved in the process ofeducating.
The National Policy on Education (NPE) hadreiterated the goal of decentralised planning andmanagement of elementary education. The Policyvisualises direct community involvement in the form ofVillage Education Committees (VECs) for managementof elementary education. The POA, 1992, emphasised
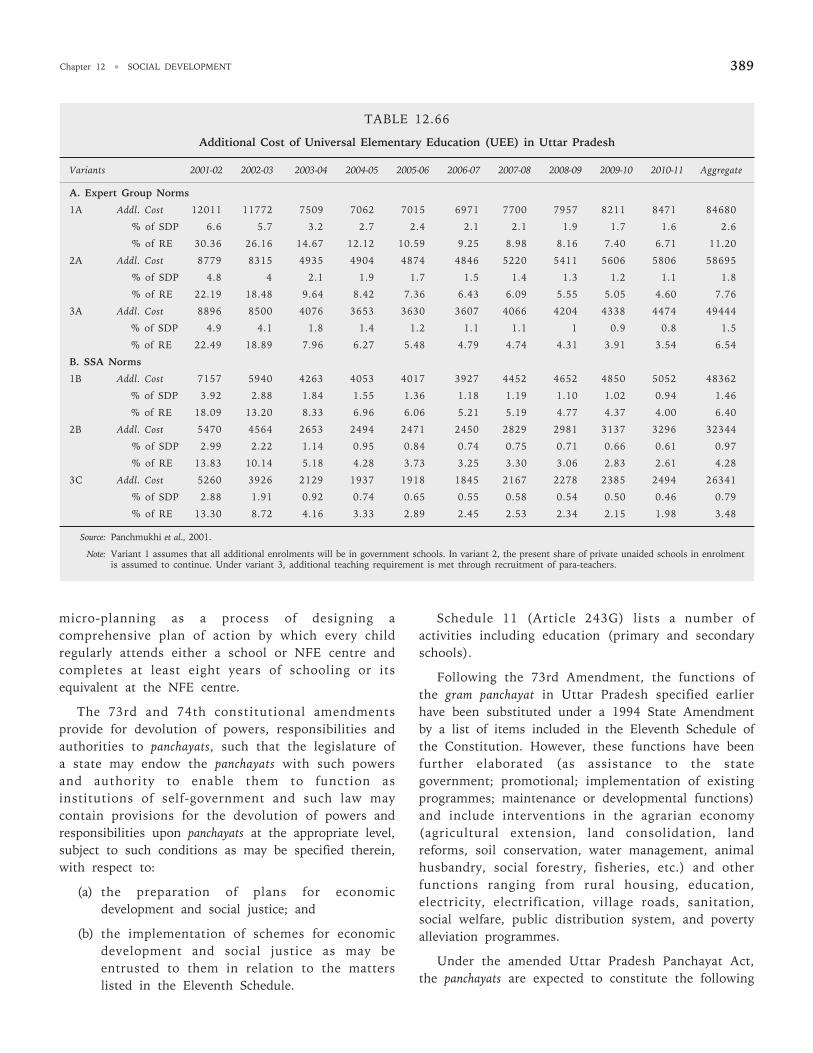
Chapter 12 • SOCIAL DEVELOPMENT 389
TABLE 12.66
Additional Cost of Universal Elementary Education (UEE) in Uttar Pradesh
Variants 2001-02 2002-03 2003-04 2004-05 2005-06 2006-07 2007-08 2008-09 2009-10 2010-11 Aggregate
A. Expert Group Norms
1A Addl. Cost 12011 11772 7509 7062 7015 6971 7700 7957 8211 8471 84680
% of SDP 6.6 5.7 3.2 2.7 2.4 2.1 2.1 1.9 1.7 1.6 2.6
% of RE 30.36 26.16 14.67 12.12 10.59 9.25 8.98 8.16 7.40 6.71 11.20
2A Addl. Cost 8779 8315 4935 4904 4874 4846 5220 5411 5606 5806 58695
% of SDP 4.8 4 2.1 1.9 1.7 1.5 1.4 1.3 1.2 1.1 1.8
% of RE 22.19 18.48 9.64 8.42 7.36 6.43 6.09 5.55 5.05 4.60 7.76
3A Addl. Cost 8896 8500 4076 3653 3630 3607 4066 4204 4338 4474 49444
% of SDP 4.9 4.1 1.8 1.4 1.2 1.1 1.1 1 0.9 0.8 1.5
% of RE 22.49 18.89 7.96 6.27 5.48 4.79 4.74 4.31 3.91 3.54 6.54
B. SSA Norms
1B Addl. Cost 7157 5940 4263 4053 4017 3927 4452 4652 4850 5052 48362
% of SDP 3.92 2.88 1.84 1.55 1.36 1.18 1.19 1.10 1.02 0.94 1.46
% of RE 18.09 13.20 8.33 6.96 6.06 5.21 5.19 4.77 4.37 4.00 6.40
2B Addl. Cost 5470 4564 2653 2494 2471 2450 2829 2981 3137 3296 32344
% of SDP 2.99 2.22 1.14 0.95 0.84 0.74 0.75 0.71 0.66 0.61 0.97
% of RE 13.83 10.14 5.18 4.28 3.73 3.25 3.30 3.06 2.83 2.61 4.28
3C Addl. Cost 5260 3926 2129 1937 1918 1845 2167 2278 2385 2494 26341
% of SDP 2.88 1.91 0.92 0.74 0.65 0.55 0.58 0.54 0.50 0.46 0.79
% of RE 13.30 8.72 4.16 3.33 2.89 2.45 2.53 2.34 2.15 1.98 3.48
Source: Panchmukhi et al., 2001.
Note: Variant 1 assumes that all additional enrolments will be in government schools. In variant 2, the present share of private unaided schools in enrolmentis assumed to continue. Under variant 3, additional teaching requirement is met through recruitment of para-teachers.
micro-planning as a process of designing acomprehensive plan of action by which every childregularly attends either a school or NFE centre andcompletes at least eight years of schooling or itsequivalent at the NFE centre.
The 73rd and 74th constitutional amendmentsprovide for devolution of powers, responsibilities andauthorities to panchayats, such that the legislature ofa state may endow the panchayats with such powersand authority to enable them to function asinstitutions of self-government and such law maycontain provisions for the devolution of powers andresponsibilities upon panchayats at the appropriate level,subject to such conditions as may be specified therein,with respect to:
(a) the preparation of plans for economicdevelopment and social justice; and
(b) the implementation of schemes for economicdevelopment and social justice as may beentrusted to them in relation to the matterslisted in the Eleventh Schedule.
Schedule 11 (Article 243G) lists a number ofactivities including education (primary and secondaryschools).
Following the 73rd Amendment, the functions ofthe gram panchayat in Uttar Pradesh specified earlierhave been substituted under a 1994 State Amendmentby a list of items included in the Eleventh Schedule ofthe Constitution. However, these functions have beenfurther elaborated (as assistance to the stategovernment; promotional; implementation of existingprogrammes; maintenance or developmental functions)and include interventions in the agrarian economy(agricultural extension, land consolidation, landreforms, soil conservation, water management, animalhusbandry, social forestry, fisheries, etc.) and otherfunctions ranging from rural housing, education,electricity, electrification, village roads, sanitation,social welfare, public distribution system, and povertyalleviation programmes.
Under the amended Uttar Pradesh Panchayat Act,the panchayats are expected to constitute the following
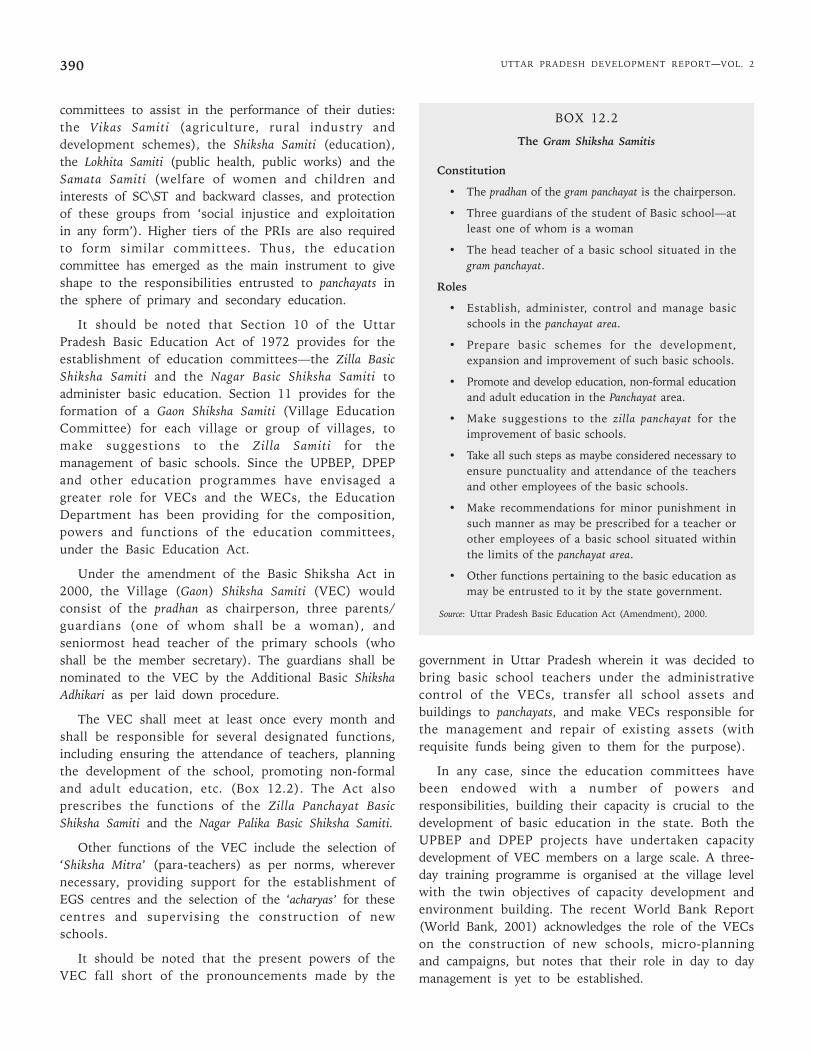
UTTAR PRADESH DEVELOPMENT REPORT—VOL. 2390
committees to assist in the performance of their duties:the Vikas Samiti (agriculture, rural industry anddevelopment schemes), the Shiksha Samiti (education),the Lokhita Samiti (public health, public works) and theSamata Samiti (welfare of women and children andinterests of SC\ST and backward classes, and protectionof these groups from ‘social injustice and exploitationin any form’). Higher tiers of the PRIs are also requiredto form similar committees. Thus, the educationcommittee has emerged as the main instrument to giveshape to the responsibilities entrusted to panchayats inthe sphere of primary and secondary education.
It should be noted that Section 10 of the UttarPradesh Basic Education Act of 1972 provides for theestablishment of education committees—the Zilla BasicShiksha Samiti and the Nagar Basic Shiksha Samiti toadminister basic education. Section 11 provides for theformation of a Gaon Shiksha Samiti (Village EducationCommittee) for each village or group of villages, tomake suggestions to the Zilla Samiti for themanagement of basic schools. Since the UPBEP, DPEPand other education programmes have envisaged agreater role for VECs and the WECs, the EducationDepartment has been providing for the composition,powers and functions of the education committees,under the Basic Education Act.
Under the amendment of the Basic Shiksha Act in2000, the Village (Gaon) Shiksha Samiti (VEC) wouldconsist of the pradhan as chairperson, three parents/guardians (one of whom shall be a woman), andseniormost head teacher of the primary schools (whoshall be the member secretary). The guardians shall benominated to the VEC by the Additional Basic ShikshaAdhikari as per laid down procedure.
The VEC shall meet at least once every month andshall be responsible for several designated functions,including ensuring the attendance of teachers, planningthe development of the school, promoting non-formaland adult education, etc. (Box 12.2). The Act alsoprescribes the functions of the Zilla Panchayat BasicShiksha Samiti and the Nagar Palika Basic Shiksha Samiti.
Other functions of the VEC include the selection of‘Shiksha Mitra’ (para-teachers) as per norms, wherevernecessary, providing support for the establishment ofEGS centres and the selection of the ‘acharyas’ for thesecentres and supervising the construction of newschools.
It should be noted that the present powers of theVEC fall short of the pronouncements made by the
government in Uttar Pradesh wherein it was decided tobring basic school teachers under the administrativecontrol of the VECs, transfer all school assets andbuildings to panchayats, and make VECs responsible forthe management and repair of existing assets (withrequisite funds being given to them for the purpose).
In any case, since the education committees havebeen endowed with a number of powers andresponsibilities, building their capacity is crucial to thedevelopment of basic education in the state. Both theUPBEP and DPEP projects have undertaken capacitydevelopment of VEC members on a large scale. A three-day training programme is organised at the village levelwith the twin objectives of capacity development andenvironment building. The recent World Bank Report(World Bank, 2001) acknowledges the role of the VECson the construction of new schools, micro-planningand campaigns, but notes that their role in day to daymanagement is yet to be established.
BOX 12.2
The Gram Shiksha Samitis
Constitution
• The pradhan of the gram panchayat is the chairperson.
• Three guardians of the student of Basic school—atleast one of whom is a woman
• The head teacher of a basic school situated in thegram panchayat.
Roles
• Establish, administer, control and manage basicschools in the panchayat area.
• Prepare basic schemes for the development,expansion and improvement of such basic schools.
• Promote and develop education, non-formal educationand adult education in the Panchayat area.
• Make suggestions to the zilla panchayat for theimprovement of basic schools.
• Take all such steps as maybe considered necessary toensure punctuality and attendance of the teachersand other employees of the basic schools.
• Make recommendations for minor punishment insuch manner as may be prescribed for a teacher orother employees of a basic school situated withinthe limits of the panchayat area.
• Other functions pertaining to the basic education asmay be entrusted to it by the state government.
Source: Uttar Pradesh Basic Education Act (Amendment), 2000.
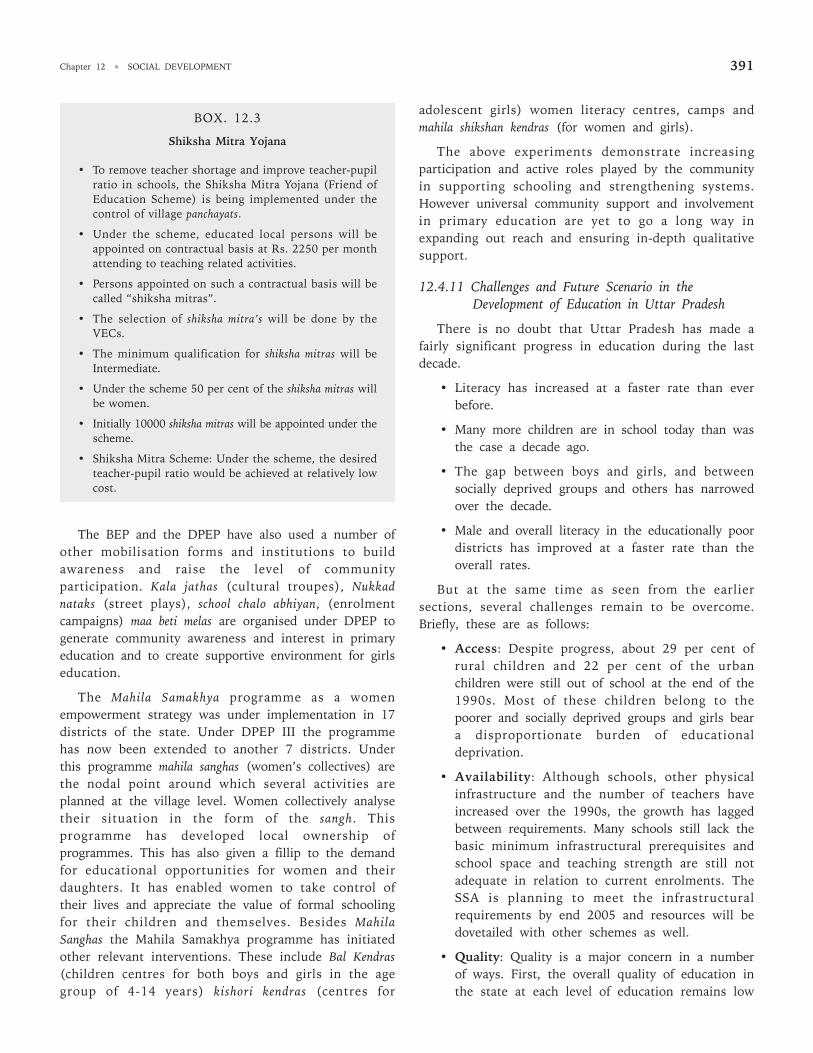
Chapter 12 • SOCIAL DEVELOPMENT 391
The BEP and the DPEP have also used a number ofother mobilisation forms and institutions to buildawareness and raise the level of communityparticipation. Kala jathas (cultural troupes), Nukkadnataks (street plays), school chalo abhiyan, (enrolmentcampaigns) maa beti melas are organised under DPEP togenerate community awareness and interest in primaryeducation and to create supportive environment for girlseducation.
The Mahila Samakhya programme as a womenempowerment strategy was under implementation in 17districts of the state. Under DPEP III the programmehas now been extended to another 7 districts. Underthis programme mahila sanghas (women’s collectives) arethe nodal point around which several activities areplanned at the village level. Women collectively analysetheir situation in the form of the sangh. Thisprogramme has developed local ownership ofprogrammes. This has also given a fillip to the demandfor educational opportunities for women and theirdaughters. It has enabled women to take control oftheir lives and appreciate the value of formal schoolingfor their children and themselves. Besides MahilaSanghas the Mahila Samakhya programme has initiatedother relevant interventions. These include Bal Kendras(children centres for both boys and girls in the agegroup of 4-14 years) kishori kendras (centres for
adolescent girls) women literacy centres, camps andmahila shikshan kendras (for women and girls).
The above experiments demonstrate increasingparticipation and active roles played by the communityin supporting schooling and strengthening systems.However universal community support and involvementin primary education are yet to go a long way inexpanding out reach and ensuring in-depth qualitativesupport.
12.4.11 Challenges and Future Scenario in theDevelopment of Education in Uttar Pradesh
There is no doubt that Uttar Pradesh has made afairly significant progress in education during the lastdecade.
• Literacy has increased at a faster rate than everbefore.
• Many more children are in school today than wasthe case a decade ago.
• The gap between boys and girls, and betweensocially deprived groups and others has narrowedover the decade.
• Male and overall literacy in the educationally poordistricts has improved at a faster rate than theoverall rates.
But at the same time as seen from the earliersections, several challenges remain to be overcome.Briefly, these are as follows:
• Access: Despite progress, about 29 per cent ofrural children and 22 per cent of the urbanchildren were still out of school at the end of the1990s. Most of these children belong to thepoorer and socially deprived groups and girls beara disproportionate burden of educationaldeprivation.
• Availability: Although schools, other physicalinfrastructure and the number of teachers haveincreased over the 1990s, the growth has laggedbetween requirements. Many schools still lack thebasic minimum infrastructural prerequisites andschool space and teaching strength are still notadequate in relation to current enrolments. TheSSA is planning to meet the infrastructuralrequirements by end 2005 and resources will bedovetailed with other schemes as well.
• Quality: Quality is a major concern in a numberof ways. First, the overall quality of education inthe state at each level of education remains low
BOX. 12.3
Shiksha Mitra Yojana
• To remove teacher shortage and improve teacher-pupilratio in schools, the Shiksha Mitra Yojana (Friend ofEducation Scheme) is being implemented under thecontrol of village panchayats.
• Under the scheme, educated local persons will beappointed on contractual basis at Rs. 2250 per monthattending to teaching related activities.
• Persons appointed on such a contractual basis will becalled “shiksha mitras”.
• The selection of shiksha mitra’s will be done by theVECs.
• The minimum qualification for shiksha mitras will beIntermediate.
• Under the scheme 50 per cent of the shiksha mitras willbe women.
• Initially 10000 shiksha mitras will be appointed under thescheme.
• Shiksha Mitra Scheme: Under the scheme, the desiredteacher-pupil ratio would be achieved at relatively lowcost.
UTTAR PRADESH DEVELOPMENT REPORT—VOL. 2392
in terms of content, teaching methods, etc.Further, quality is seriously compromised by theevaluation system which is expected to assessquality and screen students on its basis.3 Second,different groups of students have differentialaccess to schools of variable quality, with poorstudents and those belonging to socially deprivedgroups accessing the poorest quality schools.Thus quality, along with issues of access, isintegrally linked to the issue of equity in theeducational system.4
• Accountability: The system is afflicted with lowaccountability of the administration and teachingstaff which is then intimately connected withtheir performance and the overall efficiency.
• Efficiency: Both internal (measured by indicatorssuch as dropout, repetition, average years takento complete an educational cycle) and external(measured by indicators such as maintenance andoptimum utilisation of assets, performance andaccountability and teachers, administrators andother components of the educational system)efficieny is low.
• Participation: In addition to contributing toefficiency and accountability, participation of theprimary stakeholders in decision making andmanagement of education, particularly at lowerlevels, is now considered to be part of a rightsbased approach to educational development.Despite some change, progress in this directioncontinues to be slow.
• Resources: Per capita and per student publicresources allocated to education in Uttar Pradeshcontinue to be very low and have seriousimplications for access, adequacy and quality ofthe system.
12.4.12 Recommendations
As analysed in the earlier sections, majorgovernmental initiatives in the recent years have aimedat: (1) bringing socially deprived children into theeducational mainstream through formal or alternateschooling streams and improving their retention andlearning; (2) ensuring improved quality of educationthrough better teacher motivation and training, focus
on curricula, classroom processes, etc.; (3) ensuringbetter planning, improved care of educationalinfrastructure and better delivery through greaterdecentralisation and more responsibilities/powers toVEC/WECs. Many of these initiatives are fairly recentand, although some evaluations exist, it is still early tocome to a firm conclusion regarding them.
i) In the sphere of decentralisation, as notedearlier, some progress has mainly been achievedin the rural sector where VECs have been givensome powers and considerable responsibilities,but the principal powers still continue toreside with the educational administration atthe block and higher levels. There is no furthermove on the anvil to devolve the administrativecontrol of educational institutions any further.There is, in our view, a mismatch between thepowers and responsibilities of the VECs andhigher committees at the block and districtlevel, have, in any case, very limited roles. Inother words, the current reforms have tinkeredwith the responsibilities and functionsassigned to various agencies in a minor way,and one may question, whether the change issufficient to bring about greater ownership inthe community, and greater accountability inthe school system. This is a central issue.Having brought an increasing number ofparents and children to the doors of theschool, it is important that they step and stayin as direct stakeholders, and that theteaching-learning process can expand andimprove in step with the increased enrolments.
ii) The state has adopted a number of innovativeapproaches to bring children from socio-economically deprived groups into theeducational process. The children who remainout of school belong to the poor sectionsamong these groups, often eke out a living inways which makes a social stable existencedifficult, and where the children’s contributionis often considered to be quite central to thehousehold’s subsistence strategies. All in all,these children come from a variety of social,cultural and economic settings, which can beidentified through local micro-planning, but
3. Evaluation system has been revamped at class 5 and class 8 level. The annual examinations of these classes have been made public examination. Propersetting of question papers, evaluation of answer, books, sample checking, analysis of results are the new measures that have been adopted.
4. Recently, GoUP has taken measures to revamp the evaluation system at class 5 and class 8 level. The annual examinations of these classes have been madepublic examination. Proper setting of question papers, evaluation of answer, books, sample checking, analysis of results are the new measures that havebeen adopted.

Chapter 12 • SOCIAL DEVELOPMENT 393
the solutions to bring these children intoschool may require strong communityparticipation, local institutional support andcommitment of resources.
iii) Each of the various estimates of the additionalcosts of reaching UEE in Uttar Pradeshsuggest that at the very minimum, additionalresources equivalent to about 0.7 per cent ofGSDP will be required annually, on average, ifthe state is to reach this goal within the timeframe and the minimum norms accepted by theSSA. We have seen that GOUP has only beenable to maintain the share of basic educationin GSDP over the last decade, but raising thisshare to the level required requires a close lookat the financial resources available within thestate. At the same time, resource flows fromthe Centre and the external agencies havealready been augmented to some extent. Underthe SSA, the Centre has committed itself tomeeting 50 per cent of the required resourcesin the Tenth Plan, with the burden offinancing being gradually assumed by the state.In view of the resource requirement, and thecommitments of the Centre, we suggest thatthe state work out its own financialrequirements and commitment to the educationsector as a whole over a period of 15 years.
iv) It has to be emphasised that the requirementsmentioned above are based upon a minimumset of norms and a package of cost-savingstrategies. The issue here is that statestrategies which are predicated upon bringingthe more difficult areas into the educationalmainstream through inexpensive strategies‘can’ succeed in the short run if they arepredicated upon strong community support,and this may also be essential, but in the longrun, considerable (and marginally greater)investments may be required to bring suchchildren into schools, retain them, and providethem with good quality education.
v) A further core issue here, is that the state’scommitment to provide ‘free’ elementaryeducation to all children up to 14 years mustremain undiluted and free education must notsimply be interpreted as free tuition. There area number of studies, summarised in earliersections, which show that households incursubstantial direct costs in sending children to
government schools, and it has to be theobligation of the state, to assess and offsetsuch costs. The preceding analysis also showsthat a substantial part of the household costsare incurred on items (such as uniforms)which have a doubtful relationship with thequality of education. State policy should alsobe directed at eliminating such expenditures.
vi) Substantial resources have come into theeducation system in the recent past throughexternally assisted programmes, which pose arepayment liability either on the state or theCentre and which, in any case, have to befiscally and institutionally sustainable after theproject duration. The first such programmelaunched during the preceding decade (theBasic Education Project) came to an end inSeptember 2000. Considerable attention waspaid to internal financial sustainability afterthe project and the state government has beenable to absorb the additional commitmentsraised by the programme. The issue offinancing education through alternativechannels and the issue of institutionalsustainability needs to be seen and addressedin its wider context.
vii) The role of the non-governmental and privatesector in elementary education has been widelydiscussed. There is no contradiction inrecognising the pivotal duty of the state inproviding free, good quality elementaryeducation, on the one hand, and recognisingthat the private sector will continue to play animportant role in this sector in view of thechanging income and demand patterns. It is,therefore, a positive step that the state policygives due recognition to both these aspects.On the other hand, the non-governmentalsector, which has played an important role inthis sector in a number of ways has neitherbeen assessed fully, nor has it been given duerecognition in the state policy.
viii) With respect to secondary and higher levels ofeducation, the government has now acceptedthe argument that a greater proportion ofresponsibility of financing these sectors shouldcome from the private and household sectors.As far as households are concerned, thisfollows the understanding that there aregreater private returns from higher levels of
UTTAR PRADESH DEVELOPMENT REPORT—VOL. 2394
education and that fee realisation as aproportion of school/college revenue resourceshas been gradually falling. Both thesearguments merit attention and the governmenthas, in line with this understanding, revisedfee structures along with giving privateinstitutions greater flexibility in determiningtheir own fees. The role of the private sector inthe investments and managements ofinstitutions at secondary and higher levels ofeducation has been amply recognised by thestate, which has also liberalised the norms ofrecognition and functioning of theseinstitutions. Some attention is also being paidto regulating the quality of these institutions,such as through the process of centralisedadmission and examinations in engineeringinstitutions. However, given the centrality ofsecondary, technical and higher levels ofeducation in the state, the impact of lowfunding and overall poor infrastructure (inboth private and government institutions) andpervasive market failure (manifested in poorenrolments of girls and students belonging tosocially deprived groups, and regionaldisparities in the growth of institutions) hasnot been given due significance. Theseshortcomings imply need for greater funding ofthese levels of education, and a package ofmeasures to make such education moreaccessible to students from weaker sections,while also giving scope to the private sector.
In conclusion, there is clear evidence of considerabledynamism in the elementary education sector in thestate in recent years. Building upon the foundations ofthe earlier years, it is now possible to reach the crucialgoal of universal elementary education in the nearfuture. What is required is a strong state commitmentto this goal expressed both in terms of commitment ofhigher resources and relevant policies around a coreflexible and decentralised approach which will allowcommunity ownership to develop over all aspects of thisprogramme. The private sector and the wealthiersections of households are now expected to play amuch greater role in financing investments andexpenditure at the higher levels of education. But theneed to provide greater access and quality (central toestablishing the competitiveness of human resources inthe state) implies greater state funding in these sectorsas well, along with a greater need to improve efficiencyand regulate quality.
References1. Documents and Reports
Government of Uttar Pradesh, Department of Education. Progress of Education (inHindi), Annual Reports.
————. Department of Health and Family Welfare (2000) Uttar Pradesh PopulationPolicy.
————. Department of Health and Family Welfare (2000). Annual Progress Report,2000-2001 (in Hindi).
————. Department of Finance, Annual Financial Report and Brief Review of theFinancial Situation, 2000-01, 2001-02 (in Hindi).
————. Department of Planning, Ninth Five Year Plan 1997-2002 and Annual Plan,1997-98, Vol. 1.
————. Department of Planning, Annual Plan, 2000-2001, Volume 1 Part 1 andVol. 2, Part 2.
————. Department of Planning, Annual Plan, 2001-2002, Volume 1 Part 1 andVol. 2, Part 2.
————. Department of Planning, Government of Uttar Pradesh, The First UttarPradesh Human Development Report, Lucknow (forthcoming).
Government of India (1999). Planning Commission, Ninth Five Year Plan, Vols. 1and 2.
————. (1999). Department of Education. Annual Report, 1998-99.
————. Central Bureau of Health Intelligence, DGHS, Ministry of Health &Family Welfare, Health Information India (Annual Publication).
————. Ministry of Health & Family Welfare, Draft National Health Policy 2001.
Health-Watch Uttar Pradesh/Bihar: Comments of the Uttar Pradesh PopulationPolicy.
Jha, Jyotsna (1999). Financial Requirements for Achieving Universal Primary Education inUttar Pradesh, Report prepared for DPEP Uttar Pradesh.
National Council of Educational Research and Training, Sixth All India EducationalSurvey: Selected Statistics.
National Council of Applied Economic Research (2000). Who Benefits from PublicSpending on Health in India? (Draft)
National Sample Survey Organisation, Department of Statistics, Government ofIndia (1997). “Economic Activities and School Attendance byChildren of India”, Fifth Quinquennial Survey, NSS 50th Round, 1993-94,Report No. 412.
————. Department of Statistics, Government of India (1998). “Attending anEducational Institutional Institution in India: Its Level, Nature andCost, NSS 52th Round, 1993-94. July 1995-June 1996, report No. 439.
State Institute of Educational Management and Training (SIEMAT) (2000), UttarPradesh EMIS Study, 1997-98 to 1999-00 (DPEP), Allahabad.
Uttar Pradesh Education for All Board. Making a Difference: Primary Education forGirls in Uttar Pradesh.
————. Basic Education Project: Annual Reports, 1998-99, 1999-00.
————. District Primary Education Uttar Pradesh, Annual Report, 1998-99,1999-00, 2000-01.
Uttar Pradesh Voluntary Health Association.(1995). State of Health in Uttar Pradesh.
World Bank (1996). India: Five Years of Stabilisation and Reform and the Challenges Ahead.A World Bank Country Study. Washington D.C. : The World Bank
————. (1998) “Reducing Poverty in India: Options for More Effective PublicServices”, Report No. 17881-IN, Poverty Reduction and EconomicManagement Unit, South Asia Region, The World Bank,Washington D.C.
————. (2000) World Development Report 2000/2001.
————. (2001a). India: Confronting Poverty: The Challenge of Uttar Pradesh (Draft).PREM: South Asia Region.
————. (2001b). Implementation Completion Report for the Second UttarPradesh Basic Education Project. Education Sector Unit, South AsiaRegion, Report No. 21755.
2. Books, Articles and Papers
Aggarwal, Yash (2000). An Access of Trends in Access and Retention, National Instituteof Educational Planning and Administration, New Delhi.
Bashir, Sajitha (2000). Government Expenditure on Elementary Education in the Nineties.The European Commission.
Chapter 12 • SOCIAL DEVELOPMENT 395
Chambers, Robert (1995). “Poverty and Livelihoods: Whose Reality Counts”,UNDP (mimeo).
Chaturvedi, Sarika (2001). “Interstate Variations in Outcome and PublicExpenditure on Health in India”. M. Phil. Dissertation. Centre for theStudy of Regional Development, Jawaharlal Nehru University, NewDelhi.
Dreze, Jean and Amartya Sen (1995). India: Economic Development and SocialOpportunity, Oxford University Press, New Delhi, pp. 13-15.
————. (1997). Indian Development: Selected Regional Perspectives Oxford UniversityPress Delhi:
Dréze, Jean and Harris Gazdar (1997). “Uttar Pradesh: The Burden of Inertia”,in Jean Dréze and Amartya Sen (eds), op. cit.
Gupta, Devendra B. (1999). “Public Expenditure Analysis on the Health Sector”,Report prepared for the Health Sector Development Programme forUttar Pradesh. Lucknow.
IIPS (2001). Reproductive and Child Health Project-Rapid Rural Survey (Phase I& II) 1998-99, Mumbai.
Kingdon, Geeta G. (1996). “Private Schooling in India: Size, Nature and EquityEffects”, Economic and Political Weekly, Dec. 21.
Kishor, Sunita (1994). “Gender Differentials in Child Mortality: A Review ofthe Evidence”, in Monica Dasgupta, T. N. Krishnan and LincolnChen (eds.), Women’s Health in India: Risk and Vulnerability, Bombay:Oxford University Press.
Krishnan, T.N. (1996). “Health, Poverty and Labour”, in The Indian Journal ofLabour Economics, Vol. 39 No (1), Jan-March.
Mohan, Arvind (2001). “Health in Uttar Pradesh”, Background Paper to the FirstUttar Pradesh, Human Development Report, Department of Planning,Government of Uttar Pradesh, Lucknow (forthcoming).
Murthy, Mamta, Guio, Anne-Catherine and Jean Dréze (1995). “Mortality,Fertility and Gender Bias in India”, Population and Development Review,21.
Panchamukhi, P. R., Ranjana Srivastava, Ravi Srivastava and Santosh Mehrotra,Uncaging the Tiger Economy: Financing Elementary Education in India,September 2001, (forthcoming)
Prakash, Ved, S. K. S. Gautam and J. K. Bansal (2000). Scholastic Attainment underMAS, DPEP Core Group, National Council of Educational Research andTraining, New Delhi, November.
Ramchandran, V. K., Vikas Rawal and Madhura Swaminathan (1997).“Investment Gaps in Primary Education: A Statewise Study”,Economic and Political Weekly, Jan. 4-11.
Reddy, K. N. and V. Selvaraju (1994). Health Care Expenditure by Government of India1974-75 to 1990-91, Seven Hills Publication, New Delhi.
Registrar General of India (2001). SRS Bulletin, April.
Sachidananda (2000). “Role of VEC and Community Participation So Far”,Research Study Report prepared for DPEP/SIEMAT, SulabhInstitute, Patna.
Sanyal, S.. K. and Tulsidhar, V. B. (1995). “Utilization, Pattern and Financingof Public Hospitals: A Report”, National Institute of Public Financeand Policy, New Delhi (mimeo).
Shariff, A. (1999). India:Human Development Report, Oxford University Delhi Press.
Sharma, P.N. (2000). “Role of Private Institutions in Expanding ElementaryEducation”, Research Study Report prepared for DPEP/SIEMAT,Society for Action, Vision and Enterprise, Lucknow.
Singh, Shailendra, and Kala S. Sridhar (2000). “A Study of Private Schoolingand Children in DPEP-II Districts”, Research Study Report preparedfor DPEP/SIEMAT, IIM, Lucknow.
Srivastava, Ravi S. (1998). “Devolution in India since the 73rd Amendment:Impact on Safety Nets and the Social Sector”, Background Paper forthe World Bank (Reducing Poverty in India: Options for More Effective PublicServices, Report No. 17881-IN, Poverty Reduction and EconomicManagement Unit, South Asia Region, The World Bank,Washington D.C.)
————. (1999). “Social Security Through Education in India: Linking TwoSides of the Same Coin”. The Indian Journal of Labour Economics.
————. (2000). “Access to Basic Education in Uttar Pradesh”, in A.Vaidyanathan and P. R. G. Nair (eds.), Elementary Education in India.Sage New Delhi.
Srivastava, Ravi S. (2001a). “Costs and Financing of Elementary Education inUttar Pradesh”, Study report prepared for UNICEF, New Delhi.
————. (2001b). “Public Expenditure on Elementary Education”, Chapter inPanchmukhi et al., op. cit.
————. (2001c). “Resource Needs for Universal Elementary Education in theStudy States”, Chapter in Panchmukhi et al., op. cit.
————. (2002). “Evaluation of Anti-Poverty Programmes in Uttar Pradesh”,Study Report. Planning Commission. New Delhi.
STEM (2000). Baseline Survey for Uttar Pradesh Health System DevelopmentProject.
The Probe Team (1999). Public Report on Basic Education In India, Oxford UniversityNew Delhi Press (referred to as the Probe Report).
Tilak, J.B.G. (1989). “Education and its Relation to Economic Growth, Poverty,and Income Distribution”, World Bank Comparative Studies, ResearchPaper No. 3, The World Bank.
————. (1996). “How free is “free” Primary Education in India”, Economic andPolitical Weekly, Feb. 3 and 10.
Tilak, Jandhyala B.G. and Ratna M. Sudarshan (2000). Private Schooling in India,prepared under the Programme of Research in Human Development,National Council of Applied Economic Research.
Vashist, S. R. (ed.) (1994). Educational Administration in India, Anmol PublicationsNew Delhi.
World Bank (1991). Gender and Poverty in India, Washington D.C.
————. (1997). Primary Education in India, Washington D.C.
UTTAR PRADESH DEVELOPMENT REPORT—VOL. 2396