Social Indicators of Development - World Bank Document
-
Upload
khangminh22 -
Category
Documents
-
view
0 -
download
0
Transcript of Social Indicators of Development - World Bank Document

* - - -s -~~~~~~~-.H_ - -4 _s .__ .
, wh k._ _ .. - _- , : - -_.
t~~~~~~~~ -- ~- ' I
'' J U ._1_ - .
,~~~~ b
r-7
X~~~~~~~~~~~~~~~~~~~-Z!fw r- v -
-- - Fs*5.. . - - - - -.V'., - :
I -,- -t2~~~~~~~~~~~~~-i
iL-~ ~~~~-~
-A-.~~~~~~~~~~
Pub
lic D
iscl
osur
e A
utho
rized
Pub
lic D
iscl
osur
e A
utho
rized
Pub
lic D
iscl
osur
e A
utho
rized
Pub
lic D
iscl
osur
e A
utho
rized
Pub
lic D
iscl
osur
e A
utho
rized
Pub
lic D
iscl
osur
e A
utho
rized
Pub
lic D
iscl
osur
e A
utho
rized
Pub
lic D
iscl
osur
e A
utho
rized

AVAILABLE NOW
Social Indicators of Development1995
DataThis software edition of So- 0 n alows teuser to view andcalIldicators of Develop- manipulate the data and toment 1995 provides the exportdata selections toothersame social and economic l C! k tt computer programs, such asindicators,formorethan200 _ Lotus 1-2-3, dBase, Javelincountries, as the print edi- Plus, and Aremos, and totion. The 1995 edition fo- word-processing programscuses on poverty indicators _ that read ASCII characters.that describe the character-istics of poverty and the effectiveness of efforts to The Social Indicators diskette set includes thereduce poverty. Unlike the print edition of the completei?STARS*softwareanddataondouble-Indicators, whichpresents dataforthreebroadtime density 3 1/2" diskettes for use on personal com-spans, the software edition presents time-series puters with a hard disk and at least 512K memorydata for more than 25 years. andMS-DOS version 2.1 orhigher. Ausers manual
provides a complete guide to getting started, view-The indicators for each country are accessible ing and extracting data. and using extract files.through *STARS*-the World Bank's Socio-economic Time-series Access and Retrieval Sys- For details on how to order this-and other statis-tenL This convenient and user-friendly system tical data collections available in *STARS*-
please tum the page.

Order Form
O Yes, Please send me Social Indicators of Development 1995 on diskette andother products as indicated below.
Quantity Tide Stock Number Price Total CUSTOMERS IN
Soc Indicata of Development 1995 C THE U.S.t formPrint edition 45021 $26.95 Codmalet thi or
Diskettes 12918 $45.00 ~~~~~~~~and mail to:-Diskettes 12918 $45.00 World Bank Publications
World Tables 1995 Box 724178 619rint edition. 45a $4595 USAl
_ Diskettes 12919 $65.00
Wodd Debt Tables 1994-95 Telephone orders:Print edition voL 1 12912 521.95 Fa02) orders:
= Print edition, 2 voL set 12914 5150.00 (2Fsi) 67orde8- Diskettes 12915 $95.00 Telex orders
Afian Development Indicators 99-95 WIut 64145English print edition 13127 $24.95 2Customer ser :
_ Diskettes 13203 $45.00CUSTOMERS OUTSIDE
World Development Report 1995 - Workers in an Integrating World TE U.S.tEnlish paperback pnnt edition 61102 $19.95 Prices and payment terms
Wodld Development Indicators 1995 vary by country. ContactDiskettes 12921 $45.00 ~_____ your local distributor (liste
. DiskeK« 12921 S45.00 . at the back of this book)SubtotalIS5 before placing an order.
*Shipping and handlng US$ When requesting informa-Airmail surcharge outside USA 'is t__ ion about specific prices
__ ~~~and payment termst, provideTotal USS the complete title and stock
0 Fncloesd is my check payable to World Bank in US. dollas drawn on a US. bank. number of the publicationsO Charge my 0 VISA 0 Mastercard 0 American Express you wish to order. If no
distributor is listed for yourcountry, complete this rder
Crecht card acwtnt number Expiratin date form and return it to the US.address. Orders received in
Signature the U.S. from countries withauthorized distributors will
O Enclosed is my purdha oder sed invoie. (itutonal cgstDmers ony.) be retumed to the customer
iShipping and HandlingPWM print cl eby In the US. add $5.00. For
N.m______________________________________________ airmail delivery outside theU.S. add US$8.00 for the firstitem and US$6.00 for eachadditional item.
Ci Sta _.Postad Code____
Country Telephone
SD95

0
SocidIndic' tors ofI velopment
1995
Published for the World BankThe Johns Hopkins Univerity Press
Baltimore and London

Copyright 0 1995 by the International Bankfor Reconstruction and Development/The World Bank1818 H Street, N.W., Washington, D.C. 20433, U.S.A.
All rights reservedManufactued in the United States of AmericaFirst printing April 1995
The Johns Hopkins University PressBaltimere. Maryland 21211-2190, U.S.A.
This publication has been compiled by the staff of the Socio-Economic Data Division of the World Bank'sInternational Economics Department The World Bank does not accept responsibility for the accuracy orcompleteness of this publication. Any judgments expressed are those of World Bank staff or consultants and do notnecessarily reflect the views of the Board of Executive Directors or the governments they represent
The material in this publication is copyrighted. Requests for permission to reproduce portions of it should be sent tothe Office of the Publisher at the address in the copyright notice above. The World Bank encourages disseminationof its work and wili normally give permission prompfly and, when reproduction is for noncommercial purposes,without asking atfe. Pernission to photocopy portions for classmom use is granted through the Copyright ClearanceCenter, Inc., Suite 910,222 Rosewood Drive, Danvers, Massachusetts 01923, U.SA
The complete backlist of publications from the World Bank is shown in the annual Index of Publications, whichcontains an alphabetical title list and indexes of subjects, authors, and countries and regions. The latest edition isavailable free of charge from the Distribution Unit, Office of the Publisher, The World Bank, 1818 H Street, N.W.,Washington, D.C. 20433, U.S.A., or from Publications, The World Bank, 66 avenue d'I6na, 75116 Paris, France.
ISBN 0-8018-5021-5ISSN 1012-8026

Contents
Symbols, Abbreviations, and Conventions . .............................. viIntroduction ..................................... viiTable 1. Social and Economic Conditions... . ......................... xCountry Fages.: ............................. 1Table la. Basic Indicators for Other Economies. .............................. 384Technical Notes.. ............................ 385
Sources and Methods. . ............................. 385Data Reliability.. ........................... 385Explanation of Termns . . .... ...................... 386
Selected References. ...... ..................... 390Classification of Economines . . ..... ... ........... ........... .. .. .. ...... . . 392

Symbols, Abbreviations, and Conventions
Data not available or nonexistent0,0.0 Zero or less than half the unit shown and not known more preciselyAnnual percent Percentage change between adjacent years (not a multiyear average)DPT Diphtheria, perlussis, and tetanusGDP Gross domestic productGNP Gross national productKg Kilogram (2.2 pounds)Km Kilometer (0.62 miles)Mre Most recent estimatePop. PopulationSq. km Square kilometer (0.3861 square miles)Thou. Thousandst According to UNESCO, illiteracy is less than 5%
The cutoff date for all data is March 31.1995.

Introduction
The 1995 edition of Socia ndicators of Development con- Czech Republic, Fanner Yugoslav Republic of Macedonia,tinuesto address themostpressing issuenow facingdteBank Federated States of Micronesia, Slovak Republic, Slovenia,and its member countries: how to reduce poverty. Priority and the Federal Republic of Yugoslavia. Country pag forPoverty Indicators (PMs), identified in the Bank's Poveny other economies with sparse data are omitted in the book.ReductionHandbook, and supplemenary povert indicators, These economies, along with basic indicators, are listed inwhich include access to basic services and social safety nets, Table IaLare presented on the first page of each country table; other The technical notes and demographic paameters ar a-indicators covering hum.an resources, natural resources, ex- integral part of the document; readers are strongly urged topenditures, and investment in human capital are presented on read dien before trying to draw conclusions from the datathe second page. In combination, they monitor social condi-tions at the country level, and provide a framework for Overview of Soial and Economic Condiltomassessing human welfare across countries.
Social Indicators of Development is issued on diskette as Whie the emphasis is on country data, inteunational corn-well as in bookform. In the book, observations are presentcd parisons are also provided by a table oai social and economicforthroeperiods: 1970-1975,1980-1985, and the mostrecent conditions that presents a selected rray of indicators for 117estimate (MRE; the latest available esfimate between 1988 economies. It compares a few important a-s of develop-and 1993). The diskettes contan time series for 1965-1993; ment over 25 years. The left-hand page of the table reportshowever, for many indicators, data are only available for a selected social and economic conditions, and the right-handfew benchmark years. The diskettes, which use the page shows changes in these conditions. Countries are ar-*STARS* reteval system for easy retrival of data into rangedunderregionalheadmgs,andincoomegroupsarelistedLots, Javelin, Aremnos, or ASCII forma may be obtined by at the bottom of the page. Only low- and middle-incomeusing the order frmm in the front of the book or by contacing economies with popuations of more than 2 million aretheDistibutionUnit,OfficoftePublisher,WoddBank, 1818 included here; however, the summary masures aggregate aUH Steet N.W, Washington. D.C. 20433 ( 473-1155). economies in the relevant category.
lbs 191 economiespresented in thecountry pages reflecta wide variety of political, social, economic, and cultual Country Pagesconditions. Recent changes in naional boundaries affect thepresentation of data in the following ways. Most social data The country pages identify poverty trends for each country.for Gamany refer to the unified Germany, and economic the social issues and problems accompanying development,infomation prior to 1991 refes to the Federal Republic of and the extentto which public policy may affect poverty andGamany before unification (see footnotes). Although data related social conditions. The pages contain poverty meas-aresparse,thiseditionshowscountrypagesfarseveralnewly ures and underlying economic vaiables such as wages andindpendent countries: Bosnia and Herzegovina, Croatia, prices, as well as related information on health status and
vii

access to basic services. The role of the government and the from contingencies. If households do not have access to suchshare of output (GDP) dedicated to social expenditures are social cushions as unemployment benefits or health care,also included where possible, although this is an area requir- sudden emergencies can be catastrophic. The indicators re-ing considerably more work before such measures can be ported here give some indication of the extent to which thereported for most countries. population is unprotected by such basic safety nets.
The country pagesalsoofferinternational comparisons by Three charts are included on the PPI page. Tho first twopresenting aggregated data (mostly weighted by population) show changes in population and GNP per capita, with thefor reference groups. The three reference groups for each same scale maintained across countries to make internationalcountry are th2 income category in which the economy is comparisons easier. Values for the country are shown as bars;classified, the next higher income category, and the geo- averages for the income group in which the country is clas-graphic region. sified are represented by lines. The third chart is a develop-
ment diamond. It portrays relationships among fourPrioriy Poverty Indicators socio-cconomic indicators for a given country and compae
them with the average of the country's income group. LifeLevels of poverty a- difficult to measure directly but can be expectancy, gross primary school enrollment, access to safeassessed by monitoring changes in countries in a number of water, and GNP per capita are presented, one on each axis,key areas. These areas are known as Priority Poverty Indica- and then connected (with a bold line) to form a polygon-thetors (PPIs). "diamond." Ile shape of the diamond can thus easily be
Two thresholds (upper and lower "poverty lines") have compared with the income group to which it belongs. Thebeen established to convey more precisely what is meant by averages for each income group are indexed (equal to 1); this"poverty" in each country. These are presented along with reference diamond is drawn as a fine line. Any point outside"headcount indexes" that report what percentage of the coun- the reference diamond represents a value better than thetry's population is below each threshold. In general, as group average, and any point inside the -*rence diamondcountries develop, poverty lines change. At present poverty represents a value below the group average. Where data arelines, of vanable quality and reliability, are available for not available, only part of the diamond appeas. Since theabout 25 countries; the coverage is expected to ir.crease as reference diamond rpreset different values in differentmore national household income and budget surveys-im- income groups, comparisons should be limited to the sameportant sources of data concerning povert lines-are proc- income group.esed.
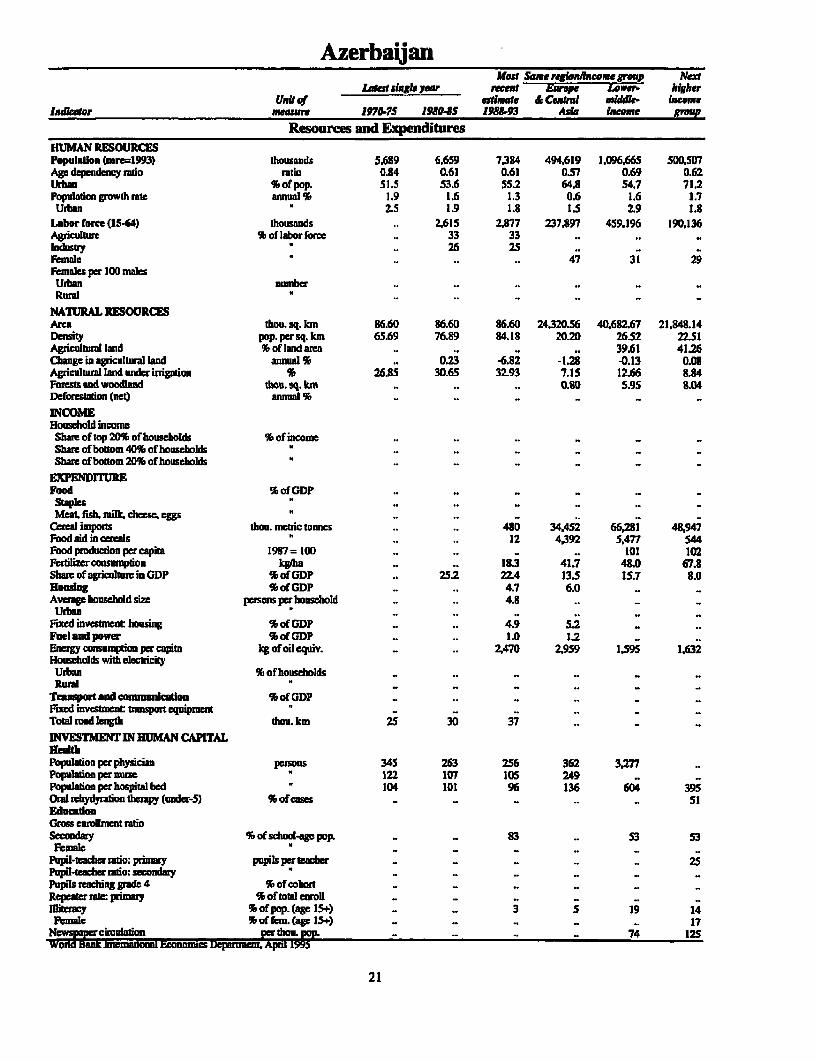
Income indicators track the income-earning opportunities Resources and Eapenditurarand living standardsof thepoor. Since unskilled laborisoftenthe only factor of production owned by the poor, unskilled The main themes covered in the right-hand page are humanwages can be taken as a barometer of their incomes Such resources, natural resources, income, expenditure, and in-wage data are generally difficult to come by, as they require vestment in human capital. Other demographic data, such asspecial surveys and are rarely available from the official sex ratos andbirth and death rates, are available in theWorldstatistical system. Furthermore, where labor remuneration Development Indicators at the back of the World Develop-other than cash is involved, estimating such wages poses the meat Report and are thdeefore not included in this volume;additional challenge of placing a cash value on payments-in- Intenationally comparable environmental indicators arekind or on other arrangemnents. Nonetheess, unskilled wages not available for most countries; however, efforts are under-are included, where available, in this voluinw Because the way in the World Bank and elsewhere to develop measuespoor typically spend nearly all their incomes on consumption, formonitoring and evaluating environmental charactristics.and neartly halfoffthis consumption is on food, the information For example, the 1993 U.N. System of National Accountsavailable on food prices is also reported, disaggregated by (SNA) provides for "satellite" accounts on enviromentalurban-rural rsidence. issues. The U.N. Environment Programme and others are
Social indicators track the provision and outcome of collaborating on aGlobalEnviromnentalMonitoring Systemsocial services. Taken together with the income indicators, that seeks to measure air and water quality. Geographicthey follow proress in reducing poverty in countries where informaton systems (including those based on remote sens-household-based surveys are not available. ing) are being harnessed to sudy environmental issues.
Also lacking ame data measuring physical or fabricatedSupptemaeay Poverty Indicators capital. Few countries can estimate the stock of income-gen-
erating or productive weath that theseassebt reprenL How-Supplementary Poverty Indicators trace the vulnerability of ever, some sctol flows indicators, specifically on housinga country's population. The poorest households are usually or infratructure, a avaiable from the United Nations'the most vulneable and the least able to protect themselves International Comparison Program (ICP) and are incorpo-
viii

rated here. Additional efforts are needed in the intenational 1980 and 64 In 1985, although no countries in the Latinstatistical community to develop indicators for repair and American continent participated in 1985. Coverage droppedmaintenance. These Indicators are incresingly recognized to only 30 European countries in 1990 but Is expected toas significant in assessing leves of services and real assign- increase to more than 80 countries In thu surveys now beinging worth to physical capital. conducted, which will have a base-year of 1993. Data for
Income and outlay indicators suggest how basic resources 1985 are from ICP Phase V reports by Eurostat, for Africa;are used and er,hanced. The data also suggest what improve- Economic and Social Commission for Asia and the Pacificments in human capital are taking place with what inputs and (ESCAP), for Asia; and Economic Commission for Europewhat is being done to raise the quality of labor in particular. CECA) and the Organization for Economic Cooperation and
The income section reports the approximate distribution Development (OECD), for Europe and other industrializedof income among households. These diata are gathered countries. The 1990 data come from OECD.through nationwide studies of income distributions, usually Staple goods as defined here comprise bread, cereals,based on household surveys, which tend to be infrequent, potatoes, and tubers but exclude pulses. Staples are less
Selected elements of expenditure as percentages of GDP expensive than, say, meat and may include items of fairly loware also reported, usually based on information collected for nutritional value. To show that they form a significant shareICP but sometimes taken directly from national accounts. of food consumption in most poor developing countries, aThese give a general context for conventional social indica- separate mcasure of staples' share in GDP expenditure istors. For example, cereal imports and other signals of trends given (with a complementary measure for spending on meat,in food availability are viewed against the background of fish, milk, cheese, and eggs).food's share in GDP expenditure. Shares in GDPexpenditurealso shed light on the relative income distribution in a coun- Tools for Social Monitoringtry. These shares are given here in original national currencyvalues, pardy because ICP results are not available for all The country pages form an evolving fmework that, as thecountries but also because relative values in the prices actt- World Bank condnues to expand its indicator range, will aidally applying in each country are also useful for poverty in evaluating and monitoring social progress. Reschesanalysis. As shown, the indicators represent the relative are invited to seek additional information, or address relatedimportance of difiemnt outlays in national price structures. questions, by writing to Chief, Soio-Economic Data Divi-Datafor 1975 and 1980areobtainedfiomICPPhasesHand sion, World Bank, 1818 H Street N.W., Washington, D.C.IV. Coverage increased from 34 counties in 1975 to 60 in 20433.
ix

Table I. Social and Economic CondidionsCurrent ConAdow~n
ONP pr SIONar f iq an mewaIby Chlm Pd.:! ,du.l PeraugPopualudo cwpl,a q,*ubaares In (par 1000 lAw Mahwrfdmam exroinen, Itmufw
1993 1993 1973 199 197 99 19 J97S J99Ii 199Sub-SaiiarAfoa 558.9 520 23 19 119 93 .. 5 . IAngola 10.3 ,, . . 160 122 20 .. 53Bonin 5.1 430 31 36 103 35 .. 77BurkdnaFam 9.8 300 38 ,, 162 229 .. 16 31 I2Burmndl 6.0 1EO 61 47 127 102 . 22 69 soCameomo 12.5 320 29 29 102 62 14 97 .. 46
CentraAfrlcunRep. 3.2 400 35 47 122 201 . 73 . 62Chad ~~~~6.0 210 43 41 154 120 .. 35 .. 70
eonvo 2.4 950 Is I 1 91 84 .. 43Caumd'Ivolre 23.3 630 28 33 117 92 I. 6 46Ethiopia 51.9 20 . . 149 117 47 24 22
cftm ~~~~16.4 430 48 41 103 79 36 7 1 ,.40
cOunm 6.3 S00oo 24 167 132 1 8 30 42 76Kenya 25.3 270 30 25 82 621 22 95 .32I
Lesodia 1.9 650 29 1222 77 IOD00 2 00 +iberia 2.8 .. 25 1. 67 223 .. 62 ,,62
madagsca 13.9 220 30 32 1I0S 9 39 95 .. 20MalawI 10.5 200 35 36 277 242 27Mmli 10.1 270 62 42 191 157 .. 24 .. 68MauriaIll 2.2 So0 27 25 125 9 . 19 .. 66Moumbiqne 15.1 90 . 3 1 160 146 .. . 60 67
Niger 8.5 270 s0 39 157 122 .. 20, . 72Nigeria 105.3 300 3 1 33 105 83 43 51 . 49Rwanda 7.6 210 49 37 133 109 29 56 SD 5semegu 7.9 750 30 20 97 67 20 41 58 62SierLone 4.5 140 33 .. 192 164 .. 39 .. 79
Somalia 9.0 .. 49 .. 149 120 .. 59 .. 76South Africa 39.7 2.9B0 3 4 72 52Sudan 26.6 .. 38 97 77 .. 4 .73
Twanania 23.0 90 37 49 113 34 28 53 68Togo 3.9 340 27 49 117 833. 99 .7
U*mda 18.0 130 0 49 114 114 23 4471 52zair 41.2 .. 17 .. 117 92 25 83 70 28Zambia 3.9 330 13 34 94 103 27 97 - 27Zimbabwe 10.7 520 16 13 36 67 .. 73 200 + 33MbIdlIeBaat&N. Afric 261.6 .. 9 .. 107 53 .. 79 96 46Algriia 26.7 1.7110 10 I11 112 53 9 93 99 43EgyprArab Rep. 56A4 660 28 16 131 64 9 71 .. 52lran.uanic Rep. 64.2 I. 1 I . 100 35 .. 93 100,+ 46hra 19.5 8. . . 4 56 .. 94 89 40Jordan 4.1 1.190 .. 7 42 27 6 .. 100.+ 20
Lebaon 3.9 .. . . 48 33 .. ... 20Libya 5.0 . 2 107 66 .. . .36
Morocco 25.9 1,040 17 14 110 66 9 62 69 51Oman 2.0 4,840 3 .. 95 29 - 4 0SaudiArabia 17.1 - I .. 75 28 .. 53 78 38
SyrianiiArb Rep. 13.7 - 18s . 67 38 .. 96 100.+ 36Taniaja 8.7 1,720 19 16 88 42 .. 97 100. 35Yeinn. Rep, 13.2 - .. 20 158 117 30 41 .. 62Ems Asia &Paific 1,713.9 820 28 17 53 35 24 100 + 100 + 24CamboliB 9.7 - .. 47 2M3 113 - ... 65cuana 1,173.4 490 32 20 40 31 24 100 + 100 + 27Iadoerola 187.2 740 30 19 10s 56 46 86 100 + 23Komw. DR 23.0 .. .. . 35 24 Kcrea,Rep. 44.1 7.660 24 7 30 11 Ili100 100. 4
LaO PDR 4.6 230 .. S 135 95 41 53Malaysia 19.0 3,140 23 . 34 13 .. 91 93 22Mongolia 2.3 390 Is 1 88 58 100 +MyanMer 44.6 - 47 63 114 32 32 83 .. 19PapuaNcwGuine 4.1 1.130 30 26 77 67 - 6 73 48
Philippuine 64.8 850 30 22 62 '42 33 100 + 100 + 10ThaILand 59.1 2.110 27 10 56 36 13 83 .. 7VietNam 71.3 170 .. 29 92 41 42 100 + 1a;0+ 12+ Ratios eceed10,far ezactmagnitudesee cotrey page

Iii in 0 -, -L 04 o 009
Co- 1 1 1 10 T cl 1 ltn 12 X q dn t2do i
I C1 el 4 n an CE an re in el n I , -C v i eV - en el n mm "Mm cn en | lw ri R| - - -s -2 | C4 !| | X8 s
U~~~~~~~~~~L
p~~~~~~~~~~~~~~~~~~~~~
92 gog EJt~ .ci~t wt e vii [email protected] vvr

Table 1. SocIal and Economic Condidions (continuald)Current Cmonditon
ONP per Share of Ia/ant iofla& Child Prhnary chool PercemtPopulaon capita qWrkcauha In (per 1,100 Rh'e Mahn ultRa. enmiaeiv Illiterate
(mndlllwa) (US$1" - * ...Q&1L...... JaL........ (91 (aged 15.)1993 1991 0 iwr yin 197 1993 1?)) P 7 1990
SouLh Ads. 1,193.5 310 39 28 130 84 61 74 100 + 54AfghanIstan 17.7 .. . . 113 161 .. 26 .. 71Bangladesh 115.2 220 62 3 1 137 106 68 73 .. 65India 8993.2 300 37 23 129 30 63 79 100 52Nepa 2018 190 69 41 131 96 50 5I 100+ 74Pedwanu 122.8 430 30 22 130 83 40 46 .. 65Sri LinksL 17.9 600 29 22 44 17 .. 77 lo;0+ 12Euompe*&CentVWAsia 494.6 2.50 .. . 39 24 .
Albaina 3.4 340 so.. 5 29 .
Armenka 3.7 660 .. 59 22 21 .
Azrbaijan 7.4 730 . .. 37 28 . 97Bedauns 10.2 2,870 .. 17 22 16d . - 87-Bosnia and Hlazegovina 3.8 .. . . 36 15 .
Bulgaria 8.9 1,140 .. 13 22 14 .. 99 90Croatia 4.5 . 12 21 9 .
Czech Republic 10.3 2,710 .. 6 1 8 9 .. .
Georgia 5.4 580 .. 53 27 19 .. .
StaceM 10.4 7-38 19 - 25 10 .. 10+ -7
Hungary 10.2 3.350 18 6 27 IS - 9 Kazaldistan 17.0 1.54 . - 45 29 . .-
Kyrgyz Republic 4.6 850 .. 55 34 - .
Latwia 2.6 2.010 is 1 23 14 - .
uLidania 3.7 1.320 .. 21 22 13 . .. 92-
MacedIonia, FM 2.1 780 .. - 57 26 . ..
Moldova 4.4 1.060 -. 35 37 25 - . 94 Poland 38.3 2,260 6. 23 is .. 100 91Portuga 9.8 9.130 .. 30 10 .. 100 c .I
Romnania 22.8 1.140 .. 21 31 23 - 100 + 81
Rsina Federaton 143.7 2.340 . .. 30 21 . .. 93 Slo"akRepublic 5.3 1,950 - 7 22 12 . .. 100Slovmnia 1.9 6.490 - 5 17 a .. . .
Thjlkistan 5.8 470 . .. 69 47 - .. 71Turkey 59.6 2.970 26 14 120 62 - 100+ 100+ 19
TurkanenistaLn 3.9 - - -. 73 56 - .. 94Ukrane 51.6 2.210 - 35 23 16 . ..
Uzbekistan 21.9 960 .. 23 58 40 -
Yupgoavio, Fed. Rep. 10.6 - . .. 38 20 - 100 + .
Lffn Aeria &Cwiben4663 2.950 I .. 67 43 - 99 .. 15Afgmrm ~~~33.3 7,220 6 6 39 24 .. 100 + .. 5
Bolivi 7.1 760 20 .. 131 73 11 85 .. 23Brazil 156.5 2Z930 I I .. 79 57 7 88 -. 19Chile 13.8 3,170 7 .. 45 16 .. 10 96 7Colombia 35.7 1.40 24 .. 59 36 10 l11W. 100 + 13
Cosats Rca 3.3 2.150 20 15 30 14 2 100-.- 100 + 7Cuba 10.9 - - - 22 12 .. 100 + 100 + 6Domniican Republic 7.5 1.23 22 16 84 40 10 100 + - 17Ecudadr 11.0 1,200 18 12 82 49 -. 100 + .. 14ElSalvado 5.5 1.320 23 9 17 45 .. 75 78 27
Guatemal 10.0 1.100 - 25 12 46 .. 61 - 45Haiti 6.9 - - 39 121 84 .. 60 -47
Honduma 5.3 600 25 17 81 41 - 18 . 27Jamaica 2.4 1.430 7 8 26 14 7 97 -2
MaCia. 90.0 3.720 11 8 58 35 .. 100 + 100+ 13
Nicaragua 4.1 340 22 30 97 51 12 82 100+ -Panama 2.5 2,600 11 10 35 24 7 100. . 12Parauay 4.7 1I51 37 26 53 37 4 100. 100W+ 10Peru 22.9 1.490 16 1 1 100 63 1 1 100+ 100+ 25PuertRico 3.6 7.000 3 1 20 1 1 .. 100+ -
Uumguay 3.1 3,830 15 9 42 19 .. 10+ 100-i- 4Venezuda 20.9 2*940 5 5 39 23 6 97 .. 8
Low-income 3.091. 380 32 27 91 62 40 94 100. 41Middle-income 1,597.1 2.48 - - 63 37 .. 96 - 20High-income 8124 23.630 4 - 13 7 .. 10+ 103 +b. Fonmer Yqosl)av Republic of Macadamia

Average Annual Percenrage Change, 1975 to Latest Available Year
Private PrimaryrIvp consumption lfant school
Population per capita per capita MenalUry at enrollment .tSouth Asia 2.1 2.7 2.4 -2.1 2.0Arghanlsman 0.1 .. .. -0.9 -8Banglaesh 2.2 21 0.9 -12 1.8India 2.1 2.6 2.5 -23 1.6Nepal 2.6 IA .. -2.1 6.4Pakistan 2.8 3.7 2.3 -2.1 0.7Sri Lanka 1.5 3.0 3.0 -5. 1 0.4Europe & Centl Asia 09 -03 .. -2.7Albania 2.0 -3.2 0.7 -3.5 -(2Annenia I's S4.2 _ -0.5Azerbaijan l.S -0.4 .. -IABearus 0.5 3.3 .. -t.4Bosnia mid Hetzegovina 035 -5.9
Bulgatia 0.1 0.5 0.2 -3.0 -5Cronti 03 .. .. -5.4Czech Republic 0.1 .. .. -3.6 05Georgia 0.6 -23 _ -2.7Greec 0.7 1.0 2.7 -5.6 -0.5
Hungary -02 2.1 1.2 -3.6 -0.4Kaalkstan 1.1 -1.6 .. -2.5 _Kyrgynstan 1.9 0.1 .. -25LatIia 0A -0.6 .. -1.8Lithuania 0.7 -0.5 .. -2.6
Macedonia, PYR bi 1.2 .. -4.8Moldova 0.8 0.1 .. -1.8 _Poland 0.7 0.4 1.0 -3.2 0.1Portugal 0.4 2.8 1.8 -7.0 1.0Pamania 03 0.0 . -2.9 -1.1
Russian Fedeaion 0.6 -1.0 _ -1.5Slvak Republic 0.6 - .. -3.1 0.6Skvenia 0.6 . .. 48TajiWlaan 2.9 -1.5 .. -2.1Turky 2.3 2.6 1.6 -3.6 00
Turkmenistan 2.5 0.1 .. -1.6Ukrine 03 1.4 _ -1.5Uzbeld 2.5 -0.2 -2.1Yugodlavia F Rep. 0.8 _ .. -42 -0.6
Ladn Amenlca & Caibbean 2.1 0.0 0.6 -2.8 0.5Argentina IA -0.9 - -33 03Budivia 2.2 -1.6 1.9 -3.2 0.6Brazil 2.1 0.6 0.6 -2.2 1.3Chile 1.6 2.6 2.0 -6.7 -0.5Colombia 23 1.2 1.0 -3.2 0.4
Costa Rica 2.9 0.1 0.0 -62 -02Cuba 0.9 .. .. -SA -0.3Dominican Republic 2.3 0.6 -0.5 -3.8 -03Ecuador 2.6 0.2 0.5 -3.0 1.2El Salvador 15 -1.2 -1.1 -3.6 -0.4
Guatemala 2.9 -1.1 -1.0 -33 1.6Haiti 1.9 -1.6 -0.6 -2.2 03Honduras 3.2 -0.1 -0.2 42 0.9Jamaica 1.1 -1.4 2.1 -4 -0.6Mexico 2.4 0.4 0.7 -3.1 0A
Niaragu 2.9 -60 -5.7 -3.2 1.1Paiama 2.2 0.6 03 -2.8 0.3Parguay 3.2 019 0.6 -1.8 0.0Peru 2.3 -ZO -1.8 -2.6 0.5Puerto Rico 1.0 0.5 1.5 -42 -2.0
Umgay 0.6 -0.4 0.8 -3.7 -02Vcnezuda 2.7 -1.6 03 -3.7 02
Low-income 2.0 3.4 29 -2.4 IBMiddle-income 1.8 0.6 .. -3.1 0.7HIgh-income 0.6 2.1 2.2 -4A O0.
xii

Country Pages
Afghanistan 2 Dominican Rcpublic 98 Lebanon 194 Rwanda 288Albania 4 Ecuador 100 Lasolbo 196 SL Kitts and Nevis 290Alga 6 EIyp Amab Rep 102 Liberia 198 SL Lucia 292Angola 8 El Salvador 104 Libya 200 SL Vuicen 294Antigua ad Baubuda 10 Equtoril Guinea 106 Lihudnia 202 Sio Toni and Prinipe 296Argenina 12 Esonmia 108 Luxembowug 204 Saudi Anrbia 298Anneiia 14 Ethiopia 110 Macedonia, Former SalD 300Austalia 16 Fiji 112 Yupolav Rep. 206 Seydels 302Austia 18 Fnlnd 114 Madagscar 208 Siera Leone 304Azeuamijan 20 France 116 Malawi 210 Sigpp 306Bahamas 22 Frnch Polynesa 113 Malaysia 212 Slovak Republic 308Enbrain 24 Gabon 120 Maldives 214 Slovenia 310BaqgadEsh 26 Gambia, The 122 Mali 216 Solomon Islands 312Babados 28 Geoorga 124 Malta 218 Somalia 314Belanus 30 Gemny 126 Marfnique 220 South Afiica 316Belginu 32 Ghana 129 Mat-innia 222 Spain 313Belize 34 Greece 130 Ma irifius 224 Sri Lanka 320Benin 36 GFenada 132 Mexico 226 Sudan 322Bernmda 38 Guadcloupe 134 Mikroncsia. Fed. St. 228 Suwname 324BhtMan 40 Goua 136 Moldova 230 Swaziland 326Bolivia 42 CGuatIaan 139 Mwgolia 232 Swdcn 323Bosniand Herzegovina 44 Guinea 140 Moocco 234 Switzedand 330Botwana 46 Guinea-Bissau 142 Moznbique 236 Syrian Arab Rep. 332Brail 48 Gyana 144 Myannr 238 Tyildstan 334Bnmei 50 Haiti 146 Nanibia 240 Tanzania 336Bulgaria 52 Hondurs 148 Nepal 242 Thailand 338BuriinaFaso 54 Hong Kong ISW Netherlands 244 Togo 340Burundi 56 Hung;uy 152 Netherland Antilks 246 Tonga 342Cambodia 58 Iceland 154 NewCaledonia 248 Trinidad and Tobago 344Cameroo 60 India 156 New Zalnd 250 Tunisia 346Canada 62 ldonesia 158 Nicaragu 252 Turke 348Cape verde 64 a Islanic Rep. 160 Niger 254 Tmimcaa 350Cetral Afric Republic 66 Iraq 162 Nigeia 256 Uguaa 352Chad 68 Ireland 164 Norway 258 Ukraine 354Chile 70 Isrel 166 Oman 26D United Arb Emnats 356China 72 Italy 168 Pacstan 262 United langdom 358Colowbia 74 Jamaica 170 Panama 264 UnitedStaes 360COWOTos 76 Japan 172 Papoa New Guinea 266 Uruguay 362Congo 78 Jordan 174 Parguay 268 Uzbekisan 364Costa Rica 80 Kazakhsman 176 Peu 270 Vanuatu 366Cte d!ivoire 82 Kenya 178 Philippines 272 Venzuea 363Croatia 84 Kiribati t80 Poland 274 Vie Nam 370Cuba 86 Korea, DewL Rep. 182 Portgal 276 Westen Samoa 372Cypras 88 Kora RepubEc 184 Pueo Riec 278 Yeme Ru of 374Czech Republic 90 Kuwait 196 Qatar 280 Yugoslavia. Fed. Rep. 376Dnmauk 92 Kyrgyz Republic 188 Rfuion 282 Zaite 378Djibouti 94 Lao PDR 190 Ranmia 284 Zambia 380Dominica 96 LJvia 192 Russian Federaion 286 Zimbabwe 382

AfghanistanMeal Sme rlenfollRcam grup Nazi
Laett asLngleyw r ec h4herUn&t of climate Seh Law- legme
Indkicor inutlre 1970175 19504S5 1988.93 Ask iRcerme group
Priority Poverty IndicatorsPOVERTYUpper poverty line local cur. .. ..
Headcountindex %ofpop. .. .. .. 23 19Lower poverty linc local cur. ..
Headcouat index % of pop. .. ..
GNPpercapita USS .. .. $. 310 380 1,590SHORT TERM INCOME INDICATORSUnskiled urban wages local curr. .. ..
Unskiled mdal wagsRual tms of tade
Consuiner price index 1987=100 .. 86 467 .. _Lower incomeFood a
Urban .. 82 367
SOCAL INDICATORSPublic expenditure on basic social services % of GDP .. .. .. .. .. .Gnrss enroilmeni ratiosPuinay % schoolagepop. 26 20 24 IK6 108 104Male 44 27 32 118 116Fennie 8 13 17 93 101
Moralityknfant mority perthou. Iivebirths 194.0 113.0 1612 83.7 63.1 39.0UnderS moraity 5.. .. 27.0 123.9 101.4 61.5
IlunumizatioaMeases % age group .. 14.0 19.0 85.8 87.3 77.6DPIr .. 15.0 23.0 90.2 39.9 32.
Child malnutridon (under-5) -. .. .. 60.4 40.3life cpeancyTotal yars 38 40 44 60 62 67Fenaleadvanta * 0.0 1.0 1.0 0.4 2.1 5.9
Total fertility ate births per womn 7.1 6.9 6.8 4.0 3.6 29Maternal morlity raw per 100.000 livc birhs .. 600 .. 420
Supplementary Poverty IndicatorsExpenditus on social security % of total 1 exp. ..-Social scurity coverae * eon. active pop. .. .. .. .. _Accesstosafewatector l %ofpop. 9.0 20.5 20.9 695 67.0
UdIan 40.0 38.0 39.2 73.8 78.7Rural 5.0 17.0 17.4 67.2 62.0
Access to health c a. 49.0 .. 95..
Population growth rate GNP per capita growth rate Development diamondb(annual average perent) (annual avange. percnt)
4 - - 5
2 - 0-- ~~~~~~~~~~~~~~~~~~~per Ipim
capita ow0~ -5
-2 -101970.75 1980-85 1988-93 1970-75 198045 1988-93 Acscsto safe war
m Afghanistan - Af-a- Lwricome - [nw-fenxme
a. See the technical tes p387. b.Thbe dvelop nt diamond based on fourkey indicatos shows theavegelevel of development in dhe countycopnared with its incom group. See the introduction.
2

AfghanistanMost Swa euioEnfiunrom w~p Neod
Latest singl Year raeen higherunit of aitxien SOUlS LOW- lammet
jadkuater measure 1070-75 19UA8S 1955-93 Asia Income PVupResource BDd ExpeDditume
HUMAN RESOURCESPopulation (nhre=199) thousands 15,373 14,519 17.691 1,193,503 3,091,764 13096,665Age depedency rato rato 0.86 0.80 0.83 0.74 0.67 0.69Urban % of pop. 13.3 16.9 19.3 25.7 27.6 54.7Population growth rate annual Ii 2.4 -2.0 4.5 2.1 1.9 1.6urban N5.9 -0.5 6.4 335 3.9 2.9
Labor force (15464) thousands 4.569 4,971 6,640 437.133 1.442.452 459,196Agriculture % ofiabor fomce 64 6 1Industry 13 14Female 7 3 9 22 33 31Females per I100 malesUrban number...Rural
NATURAL RESOURCESArea thou. sq. km 652.09 652.09 652.09 5.133.49 39,091.96 40,682.67Density pop. persq- km 23.58 22.27 25.93 227.55 77.60 2652Agricultural land %l orland area 53835 58.36 58.36 59.0 52.82 39.61Change in agricultural land annual % 0.00 0.00 0.00 0.00 0.0 -0.13Agricultural land under irripation % 6.39 6.80 7.27 29.34 13.02 t2.66Fbresta and woodland thou. sq. km ,. 0.02 0.02 0.66 1.15 5.95Deforestation (net) annual % ... .00INCOMEHousehold incomaeShare of top 20% of households 51 of income ..
Shame of bottom 40% or householdsShare of bottom 20% ofrhousehoklds
Food % OfGDP . ..
StaplesMeat. rd milk, choeese egg ..
C3ereal imports thou. maeti tonnes 13 58 215 6,211 34,420 66.281Food aid in cemals -10 s0 172 1,624 8,334 5.477Pood producsion per capima 1987=10OD 115 JOB 69 III 113 101Fertilizer comsumption kgla 1.0 1.9 Li1 10.2 59.9 48.0Shuuectfagrcuturein GDP %Of GDP ... .27.4 26.3 1517Reousing S ofOGDP ....
Averag househol size peesoas per houseold...Urban
Fixed investment housing %iof GDP ......- -
Fuel and power 'lbof GD?P..Encrgy courumptionaper-capitw kg of oil equiv. 51 Si 145 216 364 1.595Househods with electricity
Urban % of households...Rumal
Transport mad connunkcatlon 5 of GDP ..
Fixed investment transport equipment. .
Tota road lcndth thou. kin...INVEFThMEN IN BUMAN CAPffALHealthPopulation per physician persons 163960 12736 6.690 2.850 .. 3.277Population per -u 16,573 8.616Populatin per hospital bed 5.495 3.559 2Z945 1,638 1,016 6D4O ra ehydyraton therapy (under-S) 5' of casem.. 26 37 38EducationGrmossefnrolent ratioSecondary 5' of scLool-age pop, 8 9 8 40 41 53
Female 2 6 6 29 34 .
Pupil-rece ratio: puimury pupils per teacher 42 37 49 6 1 39Pupil-teacher ratio: secodary 12 1 8 5 26 20Pupils reahing grade 4 5' of cohort 67...
ReetraW cprim ay% ortotnenr*Ul 27 6lilirency %of pop. (age 15..) .- 76 71 54 41 19Female % of fem (mgelS.+) - 91 86 69 53
Newpaercirculation parthou. pop 7 8 12 26 .. 74worwd bank lnernaon[ai Economics Deparmem. April 1995
3

AlbaMe-st SmrqeuIfinc~grOUp NeFa
Latedst sInge year rext Europe kjherUnit of esemre 4 Centad Law Income
Irnctr iNre 1979.75 1 NO-S 19,J593 As income grPo
Priority Povert IndicatorsPOVZRTYUpper povety line local curr. ..
Headcount index % of pop. .. .. .. .. 19Lowerpvrty lne local cur. .. ..Headcoum index S of pop. .. .
GNPpercia USS -i 340 2,450 380 1,590SHORT TERM INCOME INDICATORSUnskifled urban wages local cur. _ ..
Unskid rum]l wagesRura ter of Hrade
Consmer price index 1987=100 .. ..Lowe incomeFootUrbanRural
SOC]IALINDICATORSPublic expenditurm on bsic social serAces S of GDP - ..Gaoss cmuihnt ratiosPimay % school age pop. 106 103 101 .. 108 104Male 109 104 100 .. 116Female ' 102 102 101 .. 101
MorlityInfant mortaity perthotL live births 58.0 4S.0 292 24.3 63.1 39.0UnderS tiortdity -_. 41.0 36.4 101.4 61.5
Measls S age op _ 96.0 87.0 .- 87.3 77.6DPT .. 96.0 94.0 _ 89.9 82.2
Child mlnutridon (under-5) ' .. .. _ .. 40.3ULfe expecnyToat Yeas 68 70 72 69 62 67FankIe udvanue 3.5 5.0 5.8 8.8 2.1 5.9
Total ulrMe births perworan 4.7 3A 2.3 2.1 3.6 2.9Matenal mtaliLy ra pcr 100.000 live birfts .. ..- -
Supplementay Poe IndicatorsExpenditurs an sodal swarity 'S of t govtexp .. e.X. .. _Socia security coverge * eon. ac pop. .. .. _ . _Access to safe water totl of pop. .. 96.7 100.0 _ 67.0
Urban .. 100.0 100.0 78.7RURal .. 95.0 100.0 _ 62.0
Access to health cae .. 100.0 _ - -
Population growth rate GNP per capita growth rate Development diaMondb
(um!s avgrae percent) 10 (al avera percent) Iiec
4 -- 5-
2 0 _ _ _ _ _ __n_ _ _ _ _ _ _ _ _ _ _ G Mcn ro ssen_ _ _ _ _ _ _ -s ~~~~~~~~~~~~~~~~~~~~~~capita elfouami0 0 L
1970-7S 198045 1988-93 1970-75 198205 1988-93 Asstosd c
Z Abanis - Albania- Low-incom law-income
a. See t echnicaln s.p387. b. lbe devlopmtdiaon bd on fourkey i aoshows treavawelvdofdvelopment in the ntryconymed with its income gup. See the irducion.
4

AlbaniaMeat Sme roineenmau Next
IaL"stiffleyew rwent higherN&Unait of eaaiauue & Coraln Low. Income
inSole s~~~~~~~~~iecure .1"70-7 198t4 1U9553 AsI4 lucere PrOW
Resourcesand Expenditu' isHUMAN RESOURCESPopuMlod.(pure=193) thousands 2,424 2,962 3,389 494.619 3,091.764 1,096665Ape dependency ratio rato 0.30 0.66 0.60 0.57 0.67 0.69Urban % of pop. 32.8 34.8 36.7 64.8 27.6 54.7Popuai"onpgowthrate annud % 2.5 2.1 1.2 0.6 1.9 1.6
Urban *3A 2.6 2.1 1 5 3.9 2,9Labor forcefl15..6 tosn.1,043 1,98 1.704 237,397 1.442452 459,195Agrculture %orlaborforce dl 56Indusiry p23 26Femal 40 41 41 47 33" 31Females per 100 nulesUrban number...Rural
NATVRAL RESOURCESArea thou. sq. kmn 28.75 28.75 28.75 24,320.56 39,091.96 40,682.67Density pop. perrsq.kmn 8431 103.03 116A49 20.20 77.60 26.52Agricultural lAnd % of land area 39A42 40.58 40.15 .. 52.12 39.61Change in ugricukual land maual % -3.74 -0.09 -0.27 -1.28 0.03 -0.13Agricltural land under irrigation % 30.65 35.88 33.64 7.15 18.0 12.66Forst and woodland tho. sq. km n 0.01 0.OI 0.30 7.15 5.95Detbmrstation (net) amnnua % .. -0.01INCOMEHousehoald income
Sham oftop 20% ofhbouebuolds % of income...Sham of bottom 40% of households Sham of biottom 20% of househols-U1ENnuFood OfOGDP .. 17.9Stapes .3 3.3MeatL fsh,mi Cliente.eggs a . 0
Cerea import thou, metric tones 92 78 647 34,452 34.420 65,281Food aid in cutai*.. 513 4,392 8,334 5,477Food pwduction per capha 1987 l00 93 100 76 .. 113 101Fertilzer consmption Icglha S7.9 84.6 21.4 41.7 59.9 48.0Shre of agriculture inCGDP % ofGDP .. 27.9 40.1 13.5 26.3 15.7Homing %ofGDFP. 4.2 .. 6.0Average household size person per household ..
UdbanFixed investment housing % of GDP .. 5.9 . .Fu.laddpower %ofGDP .. 0.9 - 1.2Energ consmption per capita kg of oil equiv. 656 110 455 2.959 364 1.595Households with electricityUrban S of households...Rural
Tnmswt nd ommuicaion%ofOGDP .. 5.6 Fixed investment transpr equipmn N . 12.3Totd adllroau s tomu. kmu..
INVESTNMEN INBHUMAN4 CAPTrALHealthPopulation per physician person 1.069 1.076 .. 362 .. 3,277Populaton per nreN233 249.. 24Populaton per hospital. bedt 141 .. 249 136 1.016 604Oral rehydyrmxio therap (under-5) % of casem.. .. 38EducutlonGross anilmens ratioSecondary % of school-age pop. 35 72 79 .. 41 53
Fewmae 27 68 74 .. 34Pupil-teahe ratio: primary pupilis per teachr 25 20 19 .. 39Pupil-teacer ratio: secondary 108 29 20 .. 0 Pupirsumacing grade 4 % of cohort .. 100
Repeater zate primary S~~ of total enroill-.Illtercy % of pop. (BPelS4) . .. 11Female Of fem. (age 154.) - .53
Newsaprcirculatints hu.pp 47 46 49 .... 74wen an interanona 15cononuCS; DepartMent. April I M
5

AlgeriaMaut Sa oe3 , Wfamcrlwp NM
Lanet sitgaer radnt - N1t1.iic r- higherUnif ! estlmae & Nerh uddk- iacome
lAdkaor measure 197(75 19804S 1381.93 4frica Income group
Priority Poverty IndicatorsPOVERTYUpper povaty line local cutr. .. .
Headcount index '% of pop. .. ..
Lower poverty line local curr. .. ..
Headcount index % of pop. .. ..
GNP per capita USS 950 2.490 1,780 1.980 1.590 4.350SHORT TERM INCOME INDICATORSUndilled urban wages local curr. .. ..Unskiled Ura wagcs n
Rual tems of tradeConsumerprice index 1987=100 31 83 270
Lower income
Urban .. 79 207Rural
SOCIAL INDICATORSPublic expenditum an basic social services % of GDP - .. 12.7Gross enrollnt radosPdmary % chool age pop. 93 92 99 97 104 105
Male * 109 102 IOS 103Feale' 75 82 92 90
MortalityhIfantmorality per thou. live births 132.0 88.0 52.8 523 39.0 35.8Under5 mondity .. .. 68.0 699 61.5 42.6
ImmunizationMeasles %aggroup . 17.0 83.0 813 77.6 82.0DPr - .. 33.0 89.0 84.0 82.2 74.2
Child malnutrition (under-5) .. .. 9.2 -
Life expectancyTold years 54 61 67 66 67 69Female advantagp 2.0 2.0 2.4 2.3 5.9 5.9
Total fertility rate birts per woman 7.4 6.4 3.8 4.7 2.9 2.9Matenal mortality rare per 100.000 live birts .. 129
Supplementary Poverty IndicatorsExpenditures on social security % of total got CXp. .. ..
Soial security covera % econ. active pop. *- 62.0Accs to sae wat. tol % of pop. .. 69.0 *. d33 .. 86.7
Urban 84.0 85.0 .. 98.7 .. 93.9Rural .. S5.0 .. 69.0 .. 66.7
Aces tw health care .. .. .. 87.4
Population growth rate GNP per capita growth rate Development di.mondhb(annual averge, pcet) (annual nvag Prcent) life
T4 -- 5 - 1
2 GNP Grosspm primarycaita nolmn
0
1970.75 198085 1988-93 1970-75 198"5 1988-93 Acesstosafcw
a Algeria _ Algea- Lower-middle-income Lower-midole-income
a. See the technical note. p.387. b. The development diamond, basd on forbicey indicatr shows the averagc evel of devdopment in the countrycompared with its income group. See the inrdaction.
6

AlgeriaMort Sanme ra!aluum ru ext
Latelt snlermeant MIt-Eas Loer igherunit of animatef & NOrth middlle- income
Indicato slas rre 19f705 1.98045s 1918-93 Africa income groupResources and Expenditures
HUMAN RESOURCESPopuIutIon (mure="199) thousands 16,018 21.8817 26.722 261.650 1.096.665 500.507Age dependency ratio ratio 1.07 0.97 0.89 0.87 0.69 0.62Urban Si of pop. 40.3 47.5 54.2 55.2 54.7 71.2Populaton growthrate annual % 3.1 3.1 2.4 2.7 1.6 1.7
Urban *3.5 4.9 3.9 3.7 2.9 I.ELabor rente (15-64) thouands 3,455 4.834 6.503 71,333 459.196 190.136Agiicultar %iofl liabrorce 39 0 0Inustry 24 0 0 3 2Female 7 9 10 1 12Females per 1 00 rnids
Urban number . ..
RuralNATURAL RESOURLCESArea thou. sq. km 2.381.74 2,381.74 2.381.74 11,021.26 40,682.67 21,848.14Density pop.persq. km 6.73 9.19 10.96 23.10 26.52 22.51Agricultural land % ofluiad arm 15.37 16.40 16.19 32.10 39.61 41.26Chnnge in agriculturalland annualS, -1.31 -1.41 -0.19 0.04 -0.13 0.08Agr-ultundtalinid under irrigation %1 0.56 0.87 1.12 30.59 12.66 8.84Forests and woodland thou. sq. km .. 0.04 D.04 0.45 5.95 8.04Deorarstation (net) annual Si-,. 0.76INCONP3rHousehold iconsha r otop 20% of households S of incme . 47Share of bottom 40% of households ... Is9Shar of bottom 20% of households .- 7
Food i of GDP ... 19.9Staples ... 6.2Meat. fish. milk, cheese, eggs 5....9
Cereal imports thou. nietuc ronnes 1.669 5,266 5.821 38,092 66,281 48,947Food aid in cereals 54 2 1 5 1.249 5.477 SFood productionuper capita 198T7 100 125 107 103 102 101 102Fertiizer oDumarption kgWha 2.8 7.2 2.5 89.9 4810 67.8Share oflagricultur in GDP VaOfCDP 9.9 8.2 10.0 13.3 15.7 8.0HousIng Siof GDP ... 5.7Average household size persons per household . ..
Urban . ..
Fixed investmmet housing i of GDP 2.2. 6.5Fueland power % ofGDP ... 1.2Energ consumption per capita kg of oil equiv. 373 904 955 1,097 1.595 1,632Households with electricity
Urban Si of households -....Rural
Transport ani communicatIon Siof GDP ... 3.2Fixed investmnent tranport equipment 5.9 . 2.3Total road length thou. km 78 78 75INVESTMENITIN HUMAN CAPITALH.lthPopulation per physician persons 8,095 2,343 2.322 .. 3.277Population per nurse. 332 329Population per hospitad bed if352 .. 399 633 604 395Oral rehydymaton thrapy(under-5) % ofeanss... 27 .. 51EducationuGwes enroaient ratioSecondary Si of school-age pop. 20 so 60 56 53 53
Female ' ~14 42 53 50Pupil-teache rato: primary pupils per teacher 41 28 27 26 .. 25Pupil-teacher ralo: secondary 27 22 17 21Pupilsreaching gmde 4 % ofcobort 93 96 98 95Repeaer rameiprimnary % OftDta1emWOl1 13 8 7lillwiercy % of pop. (agelS4-) 74 51 43 45 19 14"Female % oflfurL(agel15+) .. 65 55 57 .. 17!tCIdralZatiorI Ecnmc deaIm iLAmI 18 i 26 38 33 74 125
7

AngolaMM soft Sa eg nglneA eme grou Next
Late~bst a! a,!, yr recena qua- gamer- hXigerURN of adane sa_wm u1e- fnceme
ludlcatr measure 1970-7S 19JW 4S 191913 AfIa Income gnwpPriority Poverty Indicators
POVERTYUpp povaty lne local cufr. .. .. ..
Hedomuntindex %orpop. .. .. .. ..Lower povat line local curr. .. .. .. .. ..
Headcountdesz % of pop. .. .. .. .. ..
GNPpercapa US$ .. .. 520 1,590 4,350SHORT TERM 'NCOME KIDICATORSUnkilled udam wages load cun. .. .. .. .. ..Uniled rural wagesRural tms of tndeComnmerppdce index 1987=100 .. .. .. .. .. ..Lower income ..
Rural .........SOCIAL INDICATORSPublic cxpenditmu on basic sowial services * orGDP .. 3.3 10.0 .. ..
Gross eumlment tuiosPrimary S sdcoolagepop. 66 98 91 67 104 105Male 85 147 9S 74 ..
Female 4B 121 B 7 60 ..
Infant morlity per ISoan live bitts 173.0 149.0 121.6 93.1 39.0 35.8UnderS mocihsy .. 292.0 172.3 61.5 42.6
ImmuniztionMasles % ag group . 43.0 39.0 49.9 77.6 82.0DPI 3 .. 7.0 26.0 51.9 82.2 74.2
Child malnutdiion (wuder-5) e .. .. 20.0 4. ..Ufc expectancyTotal yeas 38 42 47 52 67 69Female advantac 3.1 3.2 3.2 3.3 5.9 5.9
Total fetility rae bird per woman 6.6 7.0 7.1 6.2 2.9 2.9M Da morm noe per 100.000 liv birthls .. 650 ..
Supplementary Poverty IndicatorsExpndit an oncial seutiy % of tol gnV't cxp .. .. .. .. ...
Social security co e econ. active pop. .. . .. .. .
Acss tosafe water total% of pop. .. 30.1 37.6 .86JUrba .. 79.8 75.0 .. .. 93.9RuWal 1 .4.8 18.5 .. . 66.7
Access to hea c*e 70.0 24.0
Population growth rate GNP per capita growth rate DeveJopment diamondb(anual avermgerge.aperent) life runq
4-
2 cm0- Grossper -rma
O - | | I enr I | | : S * . \ apita encollment
.2 1-101970-75 1980-85 1988-93 1970-75 1980-85 1988-93 Accesstosafewamr
J Angola _ Angola- Lower-iddle-incomc Lower-middb-ineome
a. Sec te echnicad nots, p387. b. The devldopamdiamond. based on fwur ky indicators. shows de aveag level of development in ft countrycompard with it Incnm group. See dth inodcon.
8

AnmgolaMort same ewgfrwIueom. group NaW
Lavea ufugle year ruam Sun- Lever- MkfterUnit 4f msuse Sahara .iddle. facmes
Resources and ExpenditureHURMA RESOURCESfp.platl.n (ser-1993 thousands 6,1110 7,976 10.276 558.978 1,096.665 50D.507Ago dependency ratio ratIo 0419 0.96 1.00 0.94 0.69 0.62Urban % of pop. 17.8 2435 30.6 29.8 54.7 71.2Poputatdongrwth rate annualS S1. 2.6 3.7 2.9 1.6 1.7Urban 5.0 5.5 6.3 5.0 2.9 1.3
Laboir force (15-44 huad 2.957 3.7 19 4.345 229,480 459.196 190,136Agriculture S of tabor force 76 74Indifly 9 t0Female 41 40 33 36 3'1 29Females per 100 maleUrban number .
Rura NATURAL RESOURCESAmea thou. sq. km 1,24.70 1,246.70 1,246.70 24,273.63 40,632.67 21,348.14Density pop.per sq. km 4.90 6.40 7.94 22.37 26.52 22.51Agricultural land % of laud are 25.99 25.99 26.07 52.54 39.61 41.26Change in agricultura land Annua 5 0.00 0.00 0.15 0.06 -0.13 0.03Agricultural land aider impgaton S - - . 0.53 12.66 3.84Forests and woodland thou. sq. kin .. 0.25 023 5.32 5.95 8.04Defbrestation (net) &a]a S . 0.72 INCOMEHousehold inca..
Showamftop 20l%of houschmlds S of iacomn...Share of bottom 40% of honsehohdsShaw of bottom 20% of householdls
Fund % ofOGDP ... 5.6Staple - 19.9Meat, ish, milk. cheese egg 15..6..
Cereal iumpots thou. mewetrinmnes 163 234 346 13,157 66,281 48.947Food aid incerealb C. 84 III 5,079 5,477 544Food production percapha 1937= 100 132 101 32 101 101 102Fr-ctilizer consumption kglha 0.1 0.6 0.3 4.6 431.0 67.3Shmeaf agrieulturein GDP of GDP .. 13A 17.9 163 15.7 5.0Housing %ofGDP - . .1..-Aveagehoushod size perons per household. .
UrbanFixed investmet housing %ofOGDP ..- 3.9Fudland power Of GDP ... 3.0Enflnrgconsumpton per capiwR kg of oil equiv. 151 126 96 257 1.595 1,632Households with lctrcidty
urba S Of households...Rural
Transport mud comnumudcatlom Sof GDP . .3.3
Fixed invesment ansport equipment *..1.3 .
Totalradleng thou. km 72i 72 73INVESTMEENT IN HUMAN CAPfTALHealShPopulaio per physician Permon 3.597 16,152 ... 3.277
Population per nurse ~~~~~~ ~~~1.735 922 -Population per hosita ed33- 771 1.269 604 395Omal rehydyratoutherapy (under-5) % of cuses . 48 37 Si
Cums nUont ratioSecondary % ofsdmol-ap pop. 9 12 12 13 53 53Female * g
Pupil-tace ratio: pria uils per teacher 32 31 32 40..2Pupil-teacher ratio: secondary 139. Pupils ewching Vade 4 %Ofeoo . .44
Repeatr rat primay % of totwlemrul. 36 ...
llkerac % ofpop. (agielS+) .. 64 53 50o 19 14"Female % of fem,(Sp,eIS+) .. 77 72 62 .. 17
n 7 j~ci,cuiation =erthuj"L 1$ 13 12 12 74 125
9

Antigua and BarbudaMost Same egim incomegroup N
Latest slugleyw recent ii a Nflfl ppm hgheorunitO easluowe America .1d4e1 tncome
IndieeMr nmsure 1970-75 19854S 19W-f3 Caribbea Income groupPriority Poverty Indicators
POVERTYUpper poverty line local curr. . ..Headcount Index % of pop. .. ..
Lower poverty line local curr. .. ..Headcount ndex % of pop. .. ..
UNP per capita USS .. 3.440 6.540 2.930 4,350 23.680SHORT TERM INCOME INICATORSUnskilled urban wages local curr. .. ..
Unskillcd rural wagesRural te.n, of tradeConsumerprice index 1937=100 .. ..
Lower incomeFood'
Urban'.........Rural *
SOCIAL INDICANORSPublic expenditure on basic social servbe %of GDP .. .. .Gross cmualtmi radsPrimuy % school a pop. .. .. .. 107 lOS 103Mae .. .. .. .. .. 103Feale a.. .. .. .. .. 103
MortalityInfant mortaity per thou. live births .. .. .. 43.0 35.8 7.0Under 5 nortaity 5.. .. .. 2.2 42.6 8.5
InunmuizationMaue. % age group .. 73.0 89.0 7R.7 .0 82.5DPl .. 94.0 99.0 73.7 74.2 90.2
Cild malnutriticn (under-5) .. 9.9Life expectancyTotal y .. .. .. 69 69 77Famie advantage .. .. .. 53 5.9 6A
Total fertity rate births per woman .. .. .. 3.1 2.9 1.7Maenal mortit rate per 100.000 live birhs .. .. .. .. ..
Supplementary Poverty IndicatorsExpenditures on social security % of tot gov't acp. .. ..
Social seurity coverage * econ. active pop. .. ..
Acss to safe water total % of pop. .. .. .. S0.0 86.7Urban .. .. .. 90.1 93.9Rural 5.. .. .. 7.6 66.7
Access to health care .. 100.0 100.0
Population growth rate GNP per capita growth rate Development diamondb6 (annual average. ercent) (15ual avere. percent) Life eec
4- 5--
2 - _ _ O - N ~ ] | | GNP < > Gross0 ~~~~~~~~~~per - prmy
0 capita enrollment
-2 -101970-75 1980485 1988-93 1970-75 19804S 1988-93 Acces to safe watcr
[2 Andgua and Buabuda _ Antigua and Barbuda- Upper-m idd le-income - Upper-middle-incomne
L See the teclmical nots, p.38 7. b.1Mm development diamond, based on four key indico, shows dke avrg level of development in the countrycompared with its income gep. Soe the toduction
10

Antigua and Barbuda
unit of .asu,uue Amnufle uIVAI.. Inmernladleat or macame 197075 193.5 1988.33 Carlbm Mac Icome VOuW
Resource and ExpendituresHUMAN RESOURCESPopulatlan (n1rc1l93) ilhousmnda 59 62 65 466,304 500,507 912,447Age dependency ratio ratio .. . 0.75 0.66 0.62 0.49Urban %of pop. 34.2 35,0 35.6 71.2 71.2 77.9Populalion growth raze annual V. 0.7 0.3 0.3 2.0 1.7 0.6Urban it 0.9 0.6 0.5 1.9 3.8 0.
L-abor forc (1564) thousands ... . 169.939 190,136 395.641Agriculture % of labor force . .. ..
IndustryFenale ... ,..2 29 31Females per 100 Males
Urban number 117 .
Rural 1 16 .
NATURAL RESOURCESArea thou. sq. kcm 0M4 0.44 0,44 20,505.92 21.*48.14 324146.13Densily pop. per sq. kin 134.09 140.91 147.26 22.29 22.51 25.11Agriculdtural land V. of land are 25.00 27.27 27.27 40.00 41.26 42.10Change in agricultural land annual V. 0.00 0.00) 0410 0.39 0.0 -0.48Agricultural land under irrigation %., .. 3A41 8.84 13396Forests and woodland thou. sq. km .. 0.00) 0.006 9.87 8.04 10.56Deforestation (net) annual % .. 0.20INCOME.Household incomecShar of top 20% of households V. of income ..
Shazuof botom 40% of householdsShare of bottom 20% of housholds...
EXPENDITURFood %ofODP ..... . .
Staples 1.. . .. .6Meat, fish, milk, cheese, eggs 3.....8..Cereal imports thou. mectric tornaes 6 i 27.700 483947 77.530Food aid incereaL . 0 1 1,565 544 8Food production per capita 1987 100 5 1 98 93 101 102 95Fertilizer consumption kglh . .m. 16.1 67.8 150.0Sham of agriculture in UDP %.of GDP .. 4. 3.5 9.0 3.0Howlag % OfGDP ... .. . 11.7Average household size perons per household 4.3.
Urbant. .
Fixed investmenr housing %.ofG(DP ... . .. .0Fuel andipower %ofGDP ... . 2.0Enerrgy onsumption per capita kg of oil equiv. 4,*61 1.774 2.000 913 1,632 5.203Households with electricity
Urban V. of households...Rural...
Transport and cMuMnlatilek %.of GDP........ LFixed investment transport equipment ... .. . 2.1Total road length tho. kcm...
INVESTMIENT IN HUMAN CAPITrALHealthPopulation per plhysiciant Peron 2.478 ...... 453Population per nurse *413 .i.3~ 4Population per hospital bed 133... 513914Oralmheydyradonthenpy (under-S) % of cams ... 061 51EdcaionGros emnrolmnt ratioSecodary %of school-ag pop. ... . 47 53 92
Female ... .. .94
Pupil-teache ratio: primary pupils per tehace 22 ... 26 25Pupil-teacher ratio: secondary 24 .1...-
Pupils reacing grade 4 V. ofleohon...Repeater rat primary V. Of toDa enrOll Illiteray % of pop. (alSp -5) . . 51Female % of frm (agel15+) ... . 18 17
Newsp=,er~erulaioll =111011u06E 68 9 94 85 125 320
woriaom inematind Ecnomic DepmwnL Au 111

Argentina-r a wowS on meroap N
URN of eatImu Amuflu. fluke.ndkaaer .1I.u1 mas nasa.. nu.n c.Nin imam _ M
Priority Poerty IndicateorsPOVERTYUpper poverty line lcl crr. .. .. . ...HIeubountlndex *ofpop. .. .. .. .. ..
Lower poverty line loca eurr .. .. .c .. ..Holad ndex iof pop. .. .. ..
ONP per capta US 2,680 3,050 7,220 2.930 4.350 23.680
SHORT TERM INCOME INDICATORSUnkilled emn wage locaeuwr. . .. .. .GM.
Umliled runra wagesRural mms o, trado
Comun erpdce index 1957.100 0 23 1.276,139 .*Lower Income ., ,, .. .. ,
PooeUrban * . 22 1,157,943 Rn!
SOCIAL INDICATORSPublic expendu on bcic smodal miMs * orODP 4 156 17.8Graou enrollment radwPfrniy uschoolIVpop. 106 107 111 107 105 103Male 106 107 107 . 103Fenulo * 106 108 114 .. 103
MorlilyIhnfat morlity per tL live birt 48.0 32.0 23.6 43.0 35.8 7.0UnderS tnoslwhy 6 27.0 52.2 42.6 8.5
JmmunizadonMeolem ae B p o. 90.0 99.0 78.7 82.0 82.DPT " . 66.0 84.0 73.7 74.2 902
Child mnanutriton (under-5) * . .,Lire oxpeotmncyTotal yeas 67 70 72 69 69 77Female advntwe " 6.7 6.9 7.1 5.3 5.9 6A
Towlfadeliyrate blzubperwwonn 3.2 3.2 2.7 3.1 2.9 1.7Mt-ater morliqy rau per 100.000 livebhth .. e 140 . ..
Supplementry POVEt Indators
Expcndiums on soclaelcurty S* or Ltl movw exp. 4. 19.1 21S .. 4.
Social secity coverage * cL actve pop. 79.1 .. 44 .. ..Ac wto mafe water tot *-of pop. 66.0 SS.7 64.3 0.0 86.7
Urban " 7C.0 63.0 73.0 90.1 93.9Rualr 26.0 17.0 169 S7.6 66.7 .
Acces to health c 44 ... .. .. cm
Population growth rate GNP per capita growth rate Devdopment diamondb(nnual av e. prcenol)1 (annual av*age. pezcent) Ulf expechany
2; 0 r-mt.W| :W Gms
1970.75 19B805 1988-93 1970S7 191015 198893 Ams omt waler
4 - - --Upper-minw -tarbmo
a. See the technical mica. p.387. -b. ibe devloau is ,n based on four hay idIaos daw thl a*aelevel ef delpamns i th coutcompared with its incomnegrOUp. See the introthaotiauN
12

ArgentinaLa*ufulugf.yeer MONt iso uwpkonilrmem Nedi
URNi qf adW mrc wSddE. IncmIedketaer measure 19170-75 1951145 J955-9 CarWbeax lucerne ar u
Resources and ExpendituresHUMAN RESOURCESPopulation (mreml1593) thousads 26.049 30.170 33.778 46.304 50050 812.447Age dependency rato mdo 0.51 0.64 0.63 0.66 0.62 0A49Urban Sofrpop. 90.7 34.8 17.5 71.2 71.2 77.9Population grawth mte annual Ii 1.7 1IA 14 LO0 1.7 0.6
Urban " 2.2 1.9 1.5 1.9 1.9 0.9Labor forre (15-64) thousands 9.8991 10.9134 12.03 169A839 190,136 395.641Agriculture % oriahorfraw 15 13Industry 34 34 i22 3Female *26 27237290Females per 300 malesUrban number .. 104 . ..
Rural so3 -.. ,-
NATURAL RESOURCESArea thou. sq. km 2Z766.89 21766.89 2.766.99 20,55.92 21l.3411.14 321146.15Density pop. per sq. km 9.41 10.9D 12.04 22.29 22.51 25.11Agricultural land * of land area 62.32 62.08 61.33 40.00 41126 42.30Change in agricultural land annual % -0.03 -0.06 -0.06 0.39 0.031 4048Agricultural land under irigation S 0.84 0.95 1.00 3A1 B.84 13.96Forests and woodland thou, sq. km .. 0.60 0.39 9.87 3.04 10.56Deforestation (net) annual % .. 0.14IaNCMHouschold income
Share of top 20% or households % of income.... -
Sham or bottom 405k of householdsShare of bottom 20% of hmoueolds
EXPENDIUREFood %Of GDP .. 23.1 . .. .Staplcs 2.6 - -. 1.6Meal, fish, mitt chese egg .. 34 ..-- 3.8
Cereal import thou. nenic tonnts 0I 8 27.700 43.947 77.530Food aid in cereals ... . 1.565 544 3Foodproduction per cspta 1917=100 95 106 100 101 102 95Fertilizer consumption kglha 0.4 1.0 1.3 16.1 67.3 150.0Sham ofagxicultum in GDP ofOGDP 6.4 - 7.6 6.0 9tO s.0 Housing % of GIPJ? 6.5 ... .11.7
Average hoisehold size peron per household 38 . 4.0 .
]UrbanFixed investment- housing S of GD!' 6.2 S.. .0Feel and power % of GDP .. 1.6 Lo. . .Energy consumptionpmxrcapita kg of oiloequiv. 1.301 I.29. 1.351 913 1.632 5,20Households with electricity
Urban S of households...Rural
Transport and commnnisletlou S of GDP .. .6 .... LBiFaxed investment trmpart equipment .. 2.3 ... .2.1
Totalroad length tlaou.lkm 207 212 211INESITMENT IN HUtMAN CAPITALHealthPopulation per physician persons 535 368 ...- 4S3Population per nurse U96D 975... Population per bospital hod a179 .. 217 517 395 145Oral rehydyrtion therap (under-5) S of case .. - 30 61 51EducationGross enrollment ratiSecondary S of school-age pop. 54 71 71 47 53 92
Female 57 75 74 . 94Pupil-teacher ratio: rmr pupils per teaher 18 20 .. 26 25Pupil-teacher ratio: secondary S7 3 7Pupils recahing gmde 4 Of cohort 73 76Repeater sic prmr% Of total ewnol 9......-Ilitrc % of pop. (agelS4.) 7 5 5S" 14 Fewn %of fenm(agr IS+) .. 6 5 13 17
NeVVppe cidrculaton pe drorLop 106 131- 144 95 125 320wrdBulk infmatronaL llCOSnomCS JiepasIMen APrt 1 5F
~13

ArmeniaMos Same regieenlcme group New
[Laestsintgleyer Meen lrepe higherUnk qJ esimate & Centrl IMw- Ierns
Indkator mewawre 197145 19J5S 198593 xle Income ap
Priority Poverty IndicatorsPOVERTYUpper poverty line local curr. .. .. .. .
Headcount index * of pop. . .. .. .. 19Lower povry line local curr.. .. ..
Headcoust index S o.pop. .. ..
GNP per capita USS . .. 660 2Z450 330 1,590
SHORT TERM INCOME INDICATORSUnsilled urban wages local curr. .. ..
Unskilled rral wagesRural terms of tradeConsumer price index 1987=100 .. ..
Lower incomeFoDo.
UrbanRural
SOCIAL INDICATORSPublic expenditure on basic soci services * of GDP .. .. 8.2Grmss enrollment ratiosPrimiuy * school age pop. .. .. 84 _ 108 104
Male .. .. .. .. 116Female .. .. .. .. 101
MorutyInfant morality per hu,. live bifths 22.0 22.0 20.8 24.8 63.1 39.0Under S mortaitry .. .. 33.0 36.4 101.4 61.5
ImmunizationMeasls % age group .. .. .. 87.3 77.6DPI' *.. .. .. .. 89.9 82.2
Child malnutrition (under-5) .. _ .. .. 40.3Life expectancqTotal years 72 72 73 69 62 67Female advaRntge 6.0 6.1 6.0 8.8 2.1 5.9
Totlw feniity rate births per woman 3.U 2A 2.6 2.1 3.6 2.9Matenal mortality rate per 100,000 live births .. 27 35 .. -
Supplementary Povert IndicatorsExpenditures on social security of total govt exp. .. .. 4.7 .. _Social security coverage econ. acdve pop. .. .. .. .. _Aceess to safe wate total % of pop. .. .. .. .. 67.0
Urban U .. .. .. .. 78.7Rurl .. .. .. .. 62.0
Access to health care
Population growth rate GNP per capita growth rate Development diamondb6+ (annual average. percent) a a vo pret
l0+- (annalfaerag.wpecent
2 '- :ne _ _ _ 0 __ _ ___ ON G
0 in: s [1J-2 -10
197G-75 198045 1988-93 1 1970-75 1980-85 1988-93 Actfsaoswatr
A ria - Armenia- LoW-incOme -- Lw-incomn
a. See thetecnical nom p387. b. Tbe develpentdimond, based on ourkey indicos. hows the aveage levl of devdopment in th countrycompared widh ir income group. See the introdhction.
14

ArmeniaMess Some regieniscomu sroup Nowt
Laeft!adn&j yar reen Europ kigerVaile of elini., & Centra Lo*v Iense
Indiator meagire 117J 75 1in&" 1.98*4 .4sia Income grop
Resource and ExpendituresHUM1AN RESOURCESPopulatiom (mru=1993) thousads 2,82.6 3,310 3,731 494,619 3,091,764 1.096,665Age dependency ratio rnuo 0.67 ... 0.57 0.67 0.69Urban % or pop. 63.0 66.6 68.2 64.8 27.6 54.7Population gmwth rate .muml % 2.3 1.5 1.5 0.6 1.9 1.6
Urban -3.4 Ii 1.9 1.5 3.9 2.9Labor force (1564) thousands .. 1,547 1.633 237,997 1,442.452 459.196Agriculture % of labor force .. 20 30Industry .. 39 31Female- c... 47 33 31Feninles per 100 malesUrban number...Rural
NATURAL RESOURCESArea thou. sq. km 29.80 29.80 29.90 24,320356 39,091.96 40.68267Density pop.perrsq. km 94.83 111.09 123.34 20.20 77.60 26.52Agricultural land % of land area 44.93 49.09 44.58 52892 39.61Chnnge inagricultural land annual % .. -0.93 -0.63 -1.28 0.03 4013Agricultural land under irrigaton % 22.34 21.60 22.70 7.15 19.02 12.66Pornt and woodland thou. sq. k . . . 0.90 7.15 5.95Deforesatin (net) annual 5,...INCOMEHousehold income
Share of sop 20% of households % of income. Sham of bottom 40% of households ..-
Share of'bottom 20% of households.....-
Food %ofGlDP...staplesMeat. ish, milk, cheese, eggs
Cereal iompot thou. MetriC twines . 350 34,452 34.420 66,281Food aid in acerals. 143 4.39 8,34 5,477Food prodution per capita 1987=100 - . .. 113 101Fertilize coasuniptio kgla - - 19.8 4117 59.9 48.0slime oragriculturc in GDP % of GDP - 14.7 48.0 1335 26.3 15.7Housig %ofGDP - - 4.7 6.0Averag household size personis per household - . 4.7Urban
Fixed investment houing %.of GDP - 4.9 5.2Fad land power % of GDP - 1.0 1.2Energ consumptiont per capita kg of oil equiv- 08 97 2,959 364 1,595Households with lectuidity
Uxban S. of households -
RuralTnmortan ammikaton%ofOGDP--
Fixd invesunmt transport equipmentTotal road length thou. km 1 iii. INVESTMENT IN HUMAN CAPITALHealthPopulafion per physician person 289 259 261 362 - 3,277Populationper nurse 129 108 101 249 - -
Popalationper hopita bed 116 H118 120 136 1,016 604Oral rebydytation therapy (under-5) S. of cases ...... 31 Eduction
Secondmay S of school-ag pop. ...-.. 41 53FemC enR...... 34
Pupil-teacher ratio: primay pupils per teacher -. .. 39Pupi-teacher ratio: secondary ... .20
Pupils recmhing grade,4 S. Of cohort . -
Rheae rafte prmry of total enrol. .... .-
Illiteracy %of pop. (age 154.) - .1541 19"Female % Of fetm(age 154-) --... 53
!!~~M - .
15

AustraliaMost Serualeaiucemegp
Ualt of ottiawa KIwIw&ator measure 197975 195955 191893 ince
Priority Poverty IndicatorsPOVERTYUpper povty line local cur..
Headcount index * of pop.Lower povaty line local cur.
Headcount index * of pop.GNP percapita USS 7,760 11,370 17.500 23,680
SHORT TERM INCOME IDICATORSUnkllUed urban wages local cut. Unskilled rumal wagesRural tems of tade .Cansmnrpriceindex 1987=100 34 8S 131Lower income.Fooed 22 87 131
UrbanRurml
SOCIALINDICATORSPublic expenicwa on basic socdal services % of GDPGross aolment ratiosPinity % sdhol age pop. 17 106 107 103
Male 107 107 107 103Fele * 107 10S 107 103
MnHItyIdnf mortality per thl live bitts 17.0 10.0 6.8 7.0Under5morality .. - 8.0 S
immnmianionMek s S age gup .. 68.0 68.0 S25DPr .. - 90.0 902
Chld m ztustion (under-5) -. _Life expectanc
Total yes 72 75 78 77Femole advmnbge 6.8 6.8 5.9 6.4
Tot feiltifty rate births perwoman 2.5 1.9 1.9 1.7Maenal mortality rate per 100,0D0 livc births .. 11
Supplementy Povet hIndicatorsExpenditues on social security % of total gov't exp. 22.4 25.7 29.6Social secrity covmea S aeon. wtvc pop. -Acces to salwater. tod % of pap. .. _ _
urbanRural
Acces to health carc .. 98.6 100.0
Population growth rate GNP per capita growth rate Development diamond,.(annu al a aveagercPatO) [(= udaverage pcent) Li ancy
4- 5
2 0 .JZ O4I{ ~ L..I IGNP Gum
J--, -5~~pr O I -5 ~~~~~~~~~~~~~~~capita enrllen
-2 0
1970-75 1988 1988-93 1970-75 1980-85 1988-93 Access to safwe
[ Austalia _ Astria- Highincn Ihicz
a See tehtecnical nots, p387. b. Te devopmdimon bed onfourkyindic , ss the averaglvd of dcvelopment idi comyconpaid with its hicome group. See die itoducin
16

AustraliaMed Sam reglIsoxe_ group
Latest singik Yew recamUnit qf Hi-
Indkator wsten 1970975 19804S 19993 Iome
Resources and ExpendituresHUMAN RESOURCESPopulatIon (mre=l993 thousands 13,900 15.641 17498 812,447Agdependency ratio raio 0.57 0.51 0.50 0.49Urban % of pop. 85.9 85.5 84.9 77.9Ppulation growth rate annual % 2.1 1.A IA 0.6
Urban * 2.2 1A 1.3 0.8Labor fore (15-64) thousands S,993 7,364 8,268 395.641Agrculture 6 of labar force 7 7Industry 34 32Rmalem 34 38 38 38Femades per 100 malesUrban number 99 I..Rual 83 87
NATURAL RESOURCESAien thou.sq.km 7.71336 7.713.36 7,713.36 32,146.15Density pop. per sq. kIn 1.80 2.03 225 25.11Agrculturalland % oflandarea 63.69 61.87 60.95 42.80Change in agaicultwal land annul * -0.18 -0.02 0.69 -OARAgriculnurl land under irrigption % 0.30 0.36 OA4 13.96Foests and woodland thou. sq. bn .. IA6 1.46 10.56Deforestaton (net) annual * .. - 0.00INCOMEHousehold imxonue
Sharc of top 20% of housebolds S of inwmc .. 37Share of bottom 40% of households .. 21Shan: of bosom 20% of households ' .. 8
EXP1BDrURtEFeod % of GDP .. 8.3 L. 8.4
Stapics * .. 1.2 1.6 1.6Me, fish, milk. chmse, eggs U .. 3.6 3.2 3.8
Ceald imnp)ors thou. mntic omaes 4 25 32 77.530Food aid incaual .. .. BFooWproductionpercapita 1987=100 103 103 108 95Fadlizerconsomption kglha 1.5 2.4 2.9 150.0Sharn of agrdlure in GDP %ofGDP 5.0 4.0 32Homu g % of GDP _ 13.7 124 11.7Averap household size persons per household 33 3.0 _
Urban 33 2.9Fxed investment housing S of GDP 24.5 53 5.6 S.;Fuseand power %ofGDP .. IA 13 2.0Enery cnsumption per capita kg of oil equiv. 4.391 4.729 5,316 5,203Households wihi elctricity
Urban % of households 98.9 _ _Rural 95.1
T ansportmd comu atlon %ofODP .. 8.7 9.1 8.8Fixed invesu t tansport equipment .. 42 1.8 2.1Toual mad length thou. kn 845 797 799 -
INVESMErM IN HUMAN CAPiTAL
Popuion per physician pcrsons 836 519 .. 453Poptlation per nurse * .. 139Populnatnperlhospitalbed 84 .. 181 145Oral rehydyation thrpy (nder-5) % of cases .. _.EducateluGOms win t ratioSecondary % of school-age pop. 87 79 82 92Female * 87 80 83 94
Pupl-teacher ratio: primary pupil per teachr 21 16 17Pupil-echer ratio: secondary * 15 12 12Pupilse nching gade 4 % of cohort 76 96 99Repeater rate: primary % of tota Cmil.lliterq % of pop. (age 15+) .. _.Female% of fem. (age 5+) _ t .
Newsp dr cirwionct per Iou. op. 383 275 265 320Wodd Bank loensuiial Efonomics DepIUMMEn ApM 19W1
17

AustriaAela Samere* nfincomegroup
Zwigsisuulvear rgwcetUnir of atbaoe Jlgh-
lndkeor masure 19=775 198045 1988 93 IncomePr[ority Poverty Indicators
POVERTYUpper poveny line local curr.Hcndcouni index % of pop.
Lowea poveity line local cuir.Hendoouni index % of pop.
GNPpercapiFa USS 5.150 8.740 23.510 23.680SHORT TERM INCOME INDICATORSUnskilled urbhn wages local curt.Unskifed mrura wAgesRurd terms or tradeConsumerpricc index 1987=100 S9 97 120
Lower incomecFood 47 97 117
UrbanRumd
SOCIAL INDICATORSPublic cxpenditure on basic soaial services %ofGDPGross enollment ratiosPrinary %s-bool age pop. 102 IO 103 103
Male * 102 101 103 103Fle m 101 99 101 103
MoxtalityInfant mortality per thou. live births 24.0 12.0 6.8 7.0UnderS moaity 8.0 8.5
ImmutizaionMeasles 9% age group .. 90.0 60.0 B2.5DPr .. 90.0 90.0 90.2
Child malnutrition (under-S) * .LifcexpmncyToal yeas 71 73 76 77Famale advantage 7.3 72 62 6.4
Total fentiql rate bi'in per woman 2.0 1.6 1.5 1.7Matcmal montaity mte per ICOD,OD live bibts .. 11
Supplementary Poverty IndicatorsExpendittes on social security % oftoal gov'texp.Socia seuwity covvrae % emn. acdve pop.Accsm to safe watcrr totl d of pop. .. 100.0 100.0
Urban .. 100.0 10D.0Rural .. 100.0 100.0
Access to health ca .. .. 100.0
Population growth rate GNP per capita growth rate Development diamondb(annual avera percent) ( nu avea . percent) L p
4-5
2O I ~ GNP Gras2 0' i - -d e _
capita etrollsent
-2 4101970.7S 1980-35 1983-93 1970-75 1980.85 1988-93 Access tosfewater
Anstria Austria-Higl-inome - Hilhincome
a. See the recimical nos p387. b. lhe deveopment diamond, based on four key iedcato. shows the avaug levl of development in te countrycnmpmd with its inwme group. See the introduction.

AustriaMeat Sam r.an cumngroup
LAhsE dab jr mtceVSil of uuimat NIgh.
Inadwer IamrN WNJ7I5 JI5S J198 INcome
Resources and ExpendituresHUMAN RESOURCESPopulatbn(mureI ) thusands 7.579 7,5S8 7.862 312,447Age dependency atio raio 0.62 0.48 0.48 0.49Urban % of pop. 53.2 55.2 55.5 77.9Populaton gw rate rnnual * 0.3 0.0 0.7 0.6
Urban m 0.9 0.2 0.7 0.1Labor force (15.64) thousands 3,198 3.504 3.574 395.641Agriculture * orlabor force 12 9 ..Industry 42 41 .Fcmale ' 40 40 40 38Females per 100 malesUrn number 116 109 .. .Ruml 106 100
NATURAL RESOURCESArea thou.sq.km 83.85 83.85 83.85 32,146.15Density pop. persq. km 90.39 90.14 93.13 25.11Agricultural land % of land area 4S.82 42.44 4221 42.30Change in agricultural land anuwl% -0.03 0.09 -0.77 -0.48AgriculturallDndunderuinigation % 0.11 0.11 0.11 13.96Fosests and woodland thou. sq. kn .. 0.04 0.04 10.56Deforestation (net) annual .. .. -0.37INCOMEHousehold incomeShan: of top 20% orhouseholds % of ineme .Share of bottmn 40% of householdsSham of bottom 20% of households ' .. -
EXPEND=TUEFood $ ofGDP I1A 10.3 9.2 BA
Staples 1.8 1.6 1.6 1.6MeaL raiskh. ches.ggs * 5.5 4.3 4.1 3.8
Cereal imports thou.meuictonnes 146 107 184 77,530Food aid incerals .. - .. 8Foodprduthionpercapita 1987=100 8i 99 97 95Frtilizerconsumption kg1b SZ6 110.6 76.5 150.0Shaeofaguicuturein GDP SofGDP 5.0 33 2.4Boudng % ofGDP 7.7 11.1 OA 11.7Averge household size pesons per household 29
UrbanFxed investmenthousing Sof GDP S.9 2.5 53 5.0FUd and power SofGDP 24 3.3 2.4 2.0Energy consumpion per capita kg of oil equiv. 2,690 3.071 32M S203Housholds with electricity
Urb %ofhousehold ..dRuralr
Transport anl conmunalon %ofODP 3.5 10.0 10.1 3.8Fixed investment tanspot equipmet 17 19 2.4 2.1Tota road length dml. bn 103 107 125INVFSrIEf INHUMAN CAPITALHealthPopulation perphyscian peons SU 389 230 453Popion per nurse ' 302 184Populauion perhcspital bed 93 90 94 145Oral rehydyraion therapy (undcr-5) of cases .. EdocatioGross arlmntratioSecondary Sof chool-agepop. 74 78 104 92Female ' 76 s0 100 94
Pupil-teader ratio: prim:ay pupils per teacber 19 10 11.Pupil-teacher ratio: sondary 17 10 8 _Pupils rcbing grade 4 % of cbo 94 99 99Repeaterrntprumary %ofttalmueoll S _Uiberacy %ofpop. (agelS+) t .. tFemale of fem. (ap 15+) _ - t -
N e irculation per tou pop. 317 361 398 320worm Baxntemazonal Ecomcs Dpartme A pol 1995
19

AzerbaijanMon Samer ftoIIUomCrsUlP Nut
Last sbkyar _ recam Euwpe Lawd, higherunit of sUmate & Centl middle- Income
Indkafar measure 1970-75 1980-8S 1988-93 Asia icn gr. p
Priority Poverty IndicatorsPOVERTYUpper povry line hoal cur. .. ..
Headcount index 1 o pop. .. ..Lower poverty line local cor. .. ..
Headcounn index % of pop. .. ..
GNP per capita USS .. .. 730 2,450 1.590 4,350SHORT TERM INCOME INDICATORSU.skilled urban wages local cur. .. ..Unskilled mrl wagesRuml terms of rade.
Consumer pdle indeK 1987=100 .. ..Lower income
UrbanRural
SOCIAL INDICATORSPublic expenditure on basic social services % of GDP .. .. .0DGss eallm ent ratiosPvimy % school Ne pop. 97 *- 104 105MaleFemale
MoaityInfant motdity per thou. live birtis 35.0 33.0 27.6 24.3 39.0 351SUndcrS molity -_ 52.0 36.4 61.5 42.6
InuunizationMeaes % a p . . .. 77.6 82.0DFT B .. . .. 82.2 74.2
Child mlnutition (under-5) _Life expectnyTota yeas 69 68 71 69 67 69Female advantage 7.6 7.8 79 LB 5.9 5.9
Talw fertlityofte birhs perwoman 4.3 3.0 2.5 2.1 29 2.9MAWAW nwrity rateper 100.000 live birth - 39 29...
Supplementary Povert IncatorsExpenditures on social secuity S of totl goifexp. .. ..Socda security covege en. active pop. .. .. .. .. . -Access to safe watr total S of pop. .. _ .. .. .. 86.7
Urban .. .. .. .. 93.9Runia .. _ .. .. .. 66.7
Access to bealdth cmePopulation growth rate GNP per capita growth rate Development diuuonud
(annual avege. petent) S (annal avage Percent) Lire expctncy
4 -- 5
GNP Gross2- + ,*, * 0 | t t 1 perl <primary
capita n m
-21 -101970-75 1980-85 1988-93 1970-75 1980-BS 1988-93 Access to sat wate
m Arcrbajaa Azerbuijan- Low er-iniddle-inoome - Lowe ddle-income
a. See ie technical nols.p387. b. The development diamord. based on four key indiats, sbws the avage level of development in the countrycompared with its income group. See dhe introldcNL
20
AzerbaijanNest Sane regln/lcme.egrap Nex
Lwatest Inglyea recnt Europe Lewwer_. higherUn it of estmate & Central middle- Income
lIdicator measure 1970-75 1980-55 198&-93 Ada Income grouResources and Expenditures
HUMAN RESOURCESPopulation (mre=1993) dhousands 5.689 6.659 7.384 494.619 1.096.665 500.507Age dependency ratio ratio 0.94 0.61 0.61 0357 0.69 0.62Urban 'lof pop. 51.5 53.6 55.2 64.8 54.7 71.2Ppoplationpmwth rate annualS% 1.9 1.6 1.3 0.6 1.6 1.7Urban 2.5 1.9 1.9 1.5 2.9 1.8
Labor force (15.64) thousainds .. 2.615 2,877 237,897 459.196 190.136AgricultueSo abrfre. 33 33Industry .. 26 25 2Female..... 47 31 2Fenales per 100 males
Urban number...Rural
NATURAL RESOUJRCESArea thou. sq. km 86.60 86.60 96.60 24,320.56 40,682.67 21,848.14Density pop- per sq. km 65.69 76.89 84.18 20.20 26.52 22.51Agricultural land % of land ama ...... 39.61 41.26Change in agicialtural land annual S . 0.23 -6.82 -1.28 -0.13 0119Agricultural land under irrigption % 26.85 30.65 32.93 7.15 12.66 8.84Forumt and woodland thou. sq. kmb. ... 0.80 5.95 8.04Defomutaidon (net) annasi S ... -
INCOMEHouschold incmeShare of top 20% of households % Of income.... Sham of bottom 40% of householdsSham of bottom 2D% of households... ..-.
EXPENDfURFood %ofGDP . . . ..
Staplesmeal fish milk, cheese eggs
Cereal -mor tho. metric tonnes ... 480 34.452 66,281 48$947Food aid in ccreals ... 12 4,392 5,471 s4oFood production per capta 1917= 100 ...... 101 102Fertilzercosns ption kgVha .... 18 41.7 48.0 67.8Sham of agricultumhinUDP %ofGDP .. 25.2 22.4 13.5 1537 8.0HousIg % of GDP ... 4.7 6.0Avaage bowuhold size persons per household ... 4.8 .
urban...Fixed intmeat housing %ofOGDP 4... i 5.2 Fuelandipower %OfOGDP ... 1.0 1.2Energconsumpton per capita kg of oil equiv. Z... 2470 2,959 1,595 1,632Households with electricityUrban % of households... .-
RuraTraort and coununleatan S of aID? . . ..
Fixed investment tansport equipment......-Total moad lengt to. km 25 30 7-
INVESTMaENT IN HUMLAN CAPITAL
Pouation per physician peison 345 263 256 362 3,277Population per nurse 122 107 106 249 ( 39populaio per hospital bed 104 101 96 136 60 39Oral rchydration therpy (under-5) S of cases - .. 5 . 1S
Gross cmrolment ratioSecondary % of school-age pop. - . 83 .. 53 53
Female...-...-Pupil-teacher ratio: primay pupils per teacher ...--- 25Pupi-teacherroati: seconidary...PNpils mdcbuagrade.4 Of cohort. - ....
Repeater rat: primary S Of tota carli. -. -
illitracy % of pop.(agels.+) ... 35 19 14Female S of fan. (age 15+) ....-.. 17NsrJcimdc rionPer t Ea do ME.-~ - 74 125
2 1

The BahamasMoal Same regfwlincame group
L41estsingleyJar recentUnit f estinaate Nigh-
lndicaor measwre 1970-75 198J-85 1988.93 income
Priority Poverty IndicatorsPOVERTYUpper povaty line local cum.Headcount index % of pop.
Lower poverty line local curr.Headcount index % of pop.
GNP per capita USS 2.960 S.550 11.420 23.680SHORT TERM INCOME INDICATORSUnskilled usban wages local curr.Unsilled rurd wagcsRural mans of badeCansumerpriceindex 1987=100 48 90 134Lower incomeFood' 39 85 135
UrbanRu'..
SOCUL INDICATORSPublic expenditum on basic socicl sevces % of GDPGross enollment ratiosPrimary % school age pop. .. .. 105 103Male ' .. .. 103 103Female .. .. 108 103
MoraityInfant nornality per dtou. livc births 32.0 28.0 22.2 7.0WnderS muntiy '.. .. . 8.5
ImmunizadtionMeasles * age group .. 62.0 87.0 82.5DPr .. 62.0 86.0 90.2
Child malnutrition (und5r-S)Life expctancyTotal years 66 70 73 77Femcl advatage 6.7 7.9 9.1 6A
Total frtiity rte biths per woman 3.0 2.8 2.0 1.7Matemal morality mte per 100,000 Elve birtfs .. 38
Supplementary Poverty IndicatorsExpenditus on social security % of total gov't cxp. 6.4 10.9Social socurity covag % econ. activc pop.Access to safe watwr total % of pop. 65.0
Urban 100.0 100.0Rural * 13.0
Amu to health eam 100.0 100.0
Population growth rate GNP per capita growth rate Development diamond'(annualvage. percent) 5 (amuual avcrage. percent) U cxpcny
4 --
GNP Gross
2 [T[bc. 0dma pe Tlk maum
capita e~~~~nnnrolmn
-2 -- 101970-75 1980-8 1988-93 1970-75 1980485 1988-93 Acces to saee water
7hl BahhIUs- The Bahamas- Hig-income - High-income
a. Sce thc tedh a noes p387. b. The development diamond, based on four key indicators, shws the average levl of detvlopnm t in the countycompamd with its inom group. See h introduction
22

The BahamasMeo Same rtfolnIcomegreup
Latstsgle yer recantUakqf a: bas 8411b-
Indkfr mesuurs 1.970-75 1]iO485 J,85f93 InclmeResources and Expenditures
HUMAN RESOURCESPopulation (mre=1993) tiousands 190 234 268 812,447Age depcndency raio ratio 0.84 0.65 0.54 0.49Urban % of pop. 73.4 79.7 85.3 77.9Populaion growih ate annual % 2.2 2.2 1. 0.6
Urban 2.7 3.3 2.2 0.8Labor force (1-64) thousands 65 89 102 395.641Agriculture Wiorlabor owe ...Industry *Fmnale * 32 34 33 38Females per 100 males
Urban number ..Rural *
NATURAL RESOURCESArea thou. sq.lun 13.88 13.8B 13.88 32,146.15Density pop.persq.)m 13.69 16.86 19.01 25.11Agriculturalland i of land uea 1.00 1.20 1.20 42.O8Change in agnculrl land annual W 0.00 9.09 0.00 -0.48Agricultural land under irrigation 96 .. .. .. 13.96Forests and woodland thou. sq. kin .. 0. 0.00 10.56Deroresiaton (net) annual .. .. 2.14INCOMEHousehold incomc
Sharc of top 20% of households % orincome 51Shae of botom 40% of households ' 12Shar of botom 20% of hcuseholds 3
EXPENDITUREFood % of GDP.. 7.4 .. 8A
Staples .. 1.3 .. 1.6Mcat. f milk. chee eggs -.. 2S .. 3.B
Ceal imprts thou. metic bmcs 14 20 14 77.530Food aid in cereals .. .. .. 8Food production percapita 1987 =100 86 96 n 95Ferilizr consumption kglha 114.1 41.7 25.0 150.0Sharc of agriculuu in GDP %WofGDP .. 1.9Housing %ofGDP .. 13.B .. 11Averagc household sizc pesons per household 4.1
Urban *Fied invesment housing %ofGDP .. 4. .. 5.0Fued and power of GDP .. 2.9 .. 2.0Eergy consumpion per capita kg of oil equiv. 9,184 6,530 6.900 5.203Households with elctrcity
Urban * of households .. ..Rur
Tmsport amd commomnatln %of GDP .. 10.2 .. 8.8Fixed investment ranspot e t * .. 2.9 .. 2.1Total road kngth thou bn ....
INVESTMEN IN HUMAN CAPITALHealthPopulation per physician persons 1308 1.060 776 453Population per nurse N 265 206 210Pop eationpehospital bed N 195 227 .. 145Oral rehydyation therapy (under-5) % of caes .. .. 54EducationGross enrollment rtioSecondary % of school-ag pop. .. .. .. 92
lF;male * .. - 94Pupil-teacherrio primay pupis per teicher 27 19 ..Pupil-teacher ratio: secondary * 37 19 ..Pupils eaching grm 4 % of cohort .. .. 84Repeater rae: primary % of tol enoll .....Iliteacry %ofpop.(agS p ) .....Feaale % of fein. (age 13S.)
NeW7 qcrc ton perd ui=,r 16I3 167 133 320WDIId mm InternationdEconomics DpKneP APDi 19 5 15
23

BahrainMasi Same M*n/income Next
Lawst sinle Omr r nei mli&w t Up per- higherUR it f eotfate & Nakh middl- Income
Indkato meuwe 1970.75 19J08S 198J-93 Afric Incemoe grwp
Priority Poverty IndicatorsPOVERTYUpper povefty line local cuf. .. ..
Headcount index % of pop. .. ..
Lower poverty line local curr. ..Hedcount index % of pop. .. ..
GNP per capita USS 8.130 1.030 1,980 4.350 23,680SHORT TERM INCOME INDICATORSUnskilled urban wages loal crr. .. ..
Unskilled rural wagesRural terms of nuadeConasnicrpriceindex 1987=100 48 104 103Lower incomenFooo'". .... ..
UrbanRural
SOCIAL INDICATORSPublic expenditur on basic social services % of GDP .. ..
Gross enrllment mriosPrimary %sdcoolagepop. 96 112 93 97 105 103Male 107 113 94 103 .. 103Femace 85 110 93 90 .. 103
MoralityInfant mortality per thou. live biritJ 52.0 22.0 17.6 52.3 35.8 7.0Under mortalit y .. .. .. 69.9 42.6 8.5
InunizationMeasles %agegmup .. 50.0 85.0 813 8Z.0 82.5DPT .. 64.0 97.0 84.0 74.2 90.2
Child mnalnutdiion (under-5) .Life expecnqcy
Tote yeas 64 69 72 66 69 77Female advantage 3.7 4.3 4.3 2.3 5.9 6.4
Total feaility rate births perwoman 5.9 4.6 3.7 4.7 2.9 1.7Matmal morlity rte per 10D.000 live biths .. 19
Supplementlay Poverty IndicatorsExpenditues on social securty % of toa gov'texp. .. ..
Socal security coverage % econ. acive pop. .. ..
Access to safe water total % of pop. 100.0 100.0 100.0 35 86.7Urban 100.0 100.0 100.0 98.7 93.9Rural 100.0 100.0 100.0 69.0 66.7 .
Acces to heith care .. 100.0 100.0 87.4
Population growth rate GNP per capita growth rate Development dia& ondb(annual avera percer (.nnua avcmgc) percent IiS ectancy
2 -a ar
- Upper-midcfe-ieme - Upper.ic-inconm
a. &ee the technica noes p.387. b. Tbce developmet diamnd, basd on four key indicatos shows the avag level of development in the counascompared with its inine glOUp. See th e introuction.
24

BahrainLast singkeye reset uk l UIO a
Resources and ExpendituresHLIMAN RESURCESPopulatlm(n(mreulP3) thousands 272 414 533 261,65 SAM50 812,447Ago depedency ratio mdc 0.12 0.52 0.53 0*87 0.62 0.49Urban % of pop. 79,2 84.1 89.2 55.2 71.2 77.9Populaton gmwthrfto annuald 4.2 3.5 LU8 2. 1.7 0.6
Urban ". 44 4.4 3.4 3.7 I .3 0.1Labor rorce (15.64) thousads 8I 1II 243 71,333 190,136 395.641Agriculture bor lhbor orce 5 3 .
Industry 1436 35 ..... 3iFemale 9 1 1101293Females per 100 males
Urban number 72...Rurald 93...
NATURAL RESOURCESArea chu. sq. km 0.63 0.69 0.63 11,021.26 21,84314 32,146415Density pop. per sq. kmn 400.00 608.32 762.29 23.10 22.51 2S.11IAgrictltural land %l of hand ama 2.32 8.82 3.82 32.10 41.26 42.80Change in agicultura land smutS 0.00o 0.00 0.00 0.04 0O0 -0.4$Agricultural land under irrigation % 16.67 16.67 16.67 30.59 $3.4 13.96Fondss and woodlad thou. sq. km .. .0 0.00 045 £814 10.56Defaomstton (neO annum! % .. 0.00
Household incmeShar oftop 20% of households % Orincse....Share of botto, 40% of' households . .
Share of bottom. 20% of househldks U. ..
Food % ofOCDP ... .A.. .Stape . . .... 1.6Mot~ Ash maxh cheese eggs. .. .. 32
Cereal imports, thu, aeneic tones 30 S6 91 33.092 48.947 77.530Foodaid in certas ... . 1.249 544 3Food pouhction per capita 1987=100 ... . 102 102 95FeuiiLweconsumption kgham 3.9 80.0 116.7 99.9 67.3 150.0Sharecof agricultureinOGDP %ofODP .. 1.2 0.9 13.3 LO0Hoesfn %orODP........ 17Averag household size person per household...Urban a....
Fixed invesment honing S of GDP . .. .. .Fuel and power %SOfP .....1... 2.0Energ consumption per capita kg of oil equiv. 8.926 11.700 11.925 1.097 1,632 5,20Households with electricityUrban % Of households . ..
Rural a. ..
Transport v cand monlcatlon S of GDP . .. .. .Fixed invsment arasport equipmen .... . 2.1ToW] mad length thou kinm ..
1NVEFThMENT IN HUMAN CAPITAL
Population per physician peson 2,444 799 ... . 4S3Popualaion per nurse 264 361 .
Populaton perrhospita bed *241 313 .. 63 395 145Oral zhydyration theap (under-5) 5k of cases ... 73 56 51
Cores enrofllment ratioSecodary %Aofswhool-agp pp. 52 84 97 56 53 92
Female 55 82 97 so - 94Pupill-teachr rato: primrwy pupil per teacher 22 20 21 26 25PWOupi-edwremtiox seconday 24 2 1 20 21 -Pupfls macbnggrado4 SOf omboit 99 100 96 95 Repealermtarjxirnay % Oftotnenroll .. 9 3 .. -
Jiltsc %of pop. (mgeIS+) 60 27 23 45 14Female % of fezn.(srel+) - 37 31 5.7 17
New citco aoonomrcs 96 46 13 33 125 320
25

BangladeshhUntM Some reu!Wianeren group Next
La:1 dlqf~year _ rcexl~~ ~ ~-~~vni higherU.N Of etilmate South low- bIcumeo
ludiwer measIJur 1970.M 1NM.IS 198893 Axle Lncnse grfup
Prlority Poverty IndicatorsPOVERTYUpper poveny lino lorAl eun. .. ..Heodcountindox %ofpop. .. 79 4R 2R 19
Lowor poverty line lcail nur. .. ,cHeadcount Index S of pop. .. 54 2'
GNPporcnpita US$ 150 150 220 310 380 1590SHORT TERM INCOMl INDICATORSUnskilled urban wagps Iocal uI. .. .. .. .. ..
Unmkilod rual wagemRuml trnu of utde..Conrsumerprice Index 1987uol0 32 R2 145Lower Inco.m
Urban * .. 80 135Rural
SOCIAL INDICATORSPublc expenditum on balc dl survlcea %orODP .. .. 2A(km enrollmen ratslPrimary % school ag pop. 73 60 77 106 108 104Male 95 70 83 lII 116.Fenile * 51 50 71 93 101
Mortlitylnrnt mortality per thou, live bhs 140.0 128.0 105.6 83.7 63.1 39.0Under 5 moraity * .. .. 122.0 123.9 IOIA 61.5
ImmunizadonMeales 9 Saxgmup .. 1.0 3.0 85.0 87.3 77.6DpIr .. 2.0 63.0 90.2 89.9 82.2
Child milnutLidon (under-S) * 84.4 70.1 68.0 0-4 40.3Ufe expectmncyToal yas 45 50 56 60 62 67Fmae advantge * -1.5 -0.8 0.0 OA 2.1 5.9
Total ferilty te births per woman 7.0 6.2 4.3 4.0 3.6 2.9Matra morality rate per 100,000 live births .. 3000 600 420
Supplementary Poverty IndicatorsExpenditnu on srcial security % of ta govt exp. .. ..Soeil security covem ge econ. active pop. .. ..Acess to safe waur: totl % of pop. 56.0 40.6 782 69.5 67.0
Urban U 22.0 24.0 38.5 73.8 78.7Rural 5 61.0 43.0 89.5 67.2 62.0
Access to health cam ., 45.0 74.0 95.8
Population growth rate GNP per capita growth rate Development diamondsb(annua averae prcent) 1 (enmual nveae per. 'nt) re ue
4--
GN1P Gross2 prI primary
capita eioiu
-2 -10Acestsawtr1970-75 1910-85 19B-93 1970-75 1980-85 1988-93 Accstosafewar
E - _ Bangladesh- Law-incone - Low-income
a. See dt tedmilv nes. p.387. b. The devl pet dimoM baed four key indicam sbows the avage level of devdopment in the countycompawed with i income goup See the intrderi.
26

BangladeshMow Sme ugaA c grwop Nat
Zan$ stngle eobr - rtp higherUnk of usdiae Sewah Low. &ucouwe
IndkIor measure 1970-75 1980-85 J &-93 Asia ioe group
Resurces and ExpenditursHUMAN RESOURCESPopulation (mre=1993) thousands 76,582 93,556 115,203 1.193,503 3.091,764 1.096,665Age dependency ratio mtlo 098 0.92 0.77 0.74 0.67 0.69Urbn * of pop. 9.3 13A 17.3 25.7 27.6 54.7Population growth rate annual % 2.3 2.2 2.0 2.1 1.9 1.6
Urban . 6.5 5.4 5.1 3-5 3.9 2.9
Labor force (15-64) thousands 22,548 28.845 36,506 437,138 1,442,452 459,196Agriculture % or labor force 78 75Industry 5 6Female * 6 7 8 22 33 31Females per 100 malesUrban number 87 72Rurm] 95 95
NATURAL RESOURCESArea thou. sq. kin 144.00 144.00 144.00 S,133A9 39,091.96 40,622.67Density pop. per sq. 1ir 531.32 684.42 783.92 22735 77.60 2632Agricultunr land % of land nwa 74.74 74.79 79.08 59.03 52.82 39.61Change in agriculturai land annual % -0.04 0.03 -0.26 0.00 0.03 -0.13Agricultural land underirrigation % 14.81 21.29 30.11 29.34 18.02 12.66Forests nnd woodland thou. sq. km .. 0.01 0.01 0.66 7.15 5.95Defoestation (net) annual % .. .. 3.90 .. .
INCOMEHouschold incomeShare or top 20% of households % of income 42 39 39Shar ofbetorn 409G of households is 22 23Shae ofbottom 20S of households 7 9 10
EXPENDrTUREFood %ofGDP - 49.1
Staples - 29.9 .. _Mear fisr milk chees eggs .. 9.7 - _
Creal impons thou. metric tonnes 2,5S1 2583 1,175 6.2tl 34.420 66,281Food aid in cerals 2.076 1.500 719 1.624 8.334 5.477Food production per capita 197 =100 116 104 104 III 113 101Fertilizer consumption kgiha 22.1 5S.5 97.1 70.2 59.9 48.0Shame of agriculture in GDP % of GDP 62.0 411. 30.5 27.4 263 153Housing o ofGDP .. t14 .. _Average household size persons per household 5.6 S.8 SA
Urban - 5.9 6.1 53 _Faxed investment: housing % of GDP .. 5.7 -
Fue and power .j.JxGDP .. SA ..
Energyconsumptionpercapia kgofoilequiv. 23 '0 59 216 364 1,595Households with eecticity
Urban % of households .. _ - _Rural *
Transport and comou,nication % of GDP .. 2.6 ..
Fxed investnent traport equipment .. 3Totalm road length thoulkn 4 10 14 .
INVESTMENT IN HUMAN CAPITALHealthPopuation per physician persons 8,447 6.595 5,21f ZBS .- 3,277Population per nurse - 65 3802 1347 -
Population per hospital bed ' 6.467 3.527 3,189 1.638 1.016 604Orna reydyration therapy (under-5) % of cases .. 2 26 37 38 -
EducationCross enroflment ratioSecondary % of schodo-age pop. 26 18 19 40 41 53
Female ' 11 10 12 29 34Pupil-tsacherra±io: prnimay pupils per tacher 52 47 63 61 39Pupil-reacher ratio: secondary - 24 28 28 26 20Pupils reaching grade 4 % of eohort . 29 45 _ReeterrAte:prinary %oftotalenU e u 18 7 -
Illiteacy % of pop. (age 15+) 74 68 65 54 41 19Fenmle %,of fen. (agp 5+) .. 31 78 69 53 -
Newspaper circulation p hou p. 5 6 6 26 .. 74Woldo Baik lntemnananil Economics Department. April 1
27

BarbadosNest Same rele awe grw Net
loas sin peer rwcet aNn upperl hgherUnit of esdmte Amria midl Inome
ladte"r mesurW 197M-75 191S I91-93 Carbea hnem goup
Priority Poverty IndicatorsPOVnTYUppu poe lIn local cuw. .. ..
Headcount Inda * of pop. .. .. ..L pover y ine CIl .cw. .. .. .. ..c.
Headcount index * of pop. . .. .. ..
ONP per capita US 1.660 4.480 6,230 2,930 4.350 23.680SHIORTTEM INCOME IDICATORSUnsldlcd umt wages local corr. .. .. .. .. ..Unskilld nlwages .Rual nnmerftrdeConsusnerpriceindex 1987=100 41 96 131 .. ..Lewer income 0
R?od 0 17 93 127 .. ..UrbanRura -
SOCIAL INDICATORSPublic pepnditumt on basic social services % ofGDP - .. .. .. .Grass enmllnt raosPriuy %aschooasepop. 103 110 107 107 105 103Mae * 103 113 lo .. - 103Femac * 103 108 106 .. 103
MoaulityIfnntmortaity periom. live bihs 33.0 17.0 9.0 43.0 35.8 7.0UnderS momality . .. .. 52.2 42.6 8.5
ImmuinfiradMoanes % age gmUp _ M 87.0 78.7 82.0 82.5DFP 0 _ 83.0 91.0 73.7 742 90.2
Cho Inuatitio (under-5) -.. 5.3 .. ..IUfeexpectacyTol years 69 73 75 69 69 77Faealeadvutge 5.1 5.0 5.0 5.3 S9 6A
Tota iblkqy re birdsperwom 2.7 1.9 1.8 3.1 29 1-7M al modalitze per 100,00Dlive births - 24 27 - -
Supplementary Povert IndicatorsExpenditues on social security % of total goKtexp. 6.4 16.2 19.5Social secuity coverag S econa. actie pop. - .. ..
Accesstosafewatertowal Sofpop. 10.0 99.4 .. 50.0 86.7Urban 100.0 100.0 .. 90.1 93.9Rural 100.0 99.0 . S 7.6 66.7
Access to hbeth cam 0 .. 100.0 100.0
Poplation growth rate GNP per capita growth rate Deveopment diamondb6 )01£Ue &W)(annual average.pprcent) 0K (ru vrr m Lkccwy
4 ;
2 0 per ON? Gamss
cyila \ / e~~~nrollmnen0 -5~~~~~~~~~e
-2 -101970-75 198045 1981-93 1970-75 198045 198-S93 Access to safe wer
M Ba os - Bbdas- Upper-middle-income Uppe er_ddlcom
a See the tecni norm p3B7. b. The dewlopnennlamo=l. based on our key indica_, sbow the aveage level of dcvelpmet in the counrycoazm d with k incme grup. See iro ductin.
28

BarbadosMost Smearegiomnliucewwroap Next
Lasutualeyw reces Laf tipper- higherURit of eutlate America mlidel- Ilane
indicator meansr 19711.75 1959-S 1959-93 Calbbein incomne grou
Resorce mnd ExpemiifturesHUMAN RESOURCESPopuatlaen (mrenl1S3) thousands 246 253 260 466.304 500.507 312,447Age dependency ratio sio 0.72 0.64 0.56 0.66 0.62 0.49Urban Sorpop. 38.6 42.5 46.4 71.2 71.2 77.9Populadion growth rate mmud '1 0.6 0.3 0OA 2.0 1.7 0.6
Urbtan 1 4 I A 1.5 1.9 1.8 0.3Labor remc (15-14) thousands 107 127 143 169.839 190136 395,641Agriculture % of labor fomce 14 10Industry 23 21 Femnalc 43 47 47 27 29 33Females per 1 00 males
Urbain number...RuralNATURAL RESOURCESArea thor. sq. km 0.43 0.43 0.43 20,505.92 21,148.14 32,146.15Density pop. per sq. km 572.09 53837 602.30 22.29 22.51 25.11Agricultural land % of land arca 41.86 41.86 41186 40.00 41.26 42.80Change in agrcultural land annual % 0.00 0.00 0.00 0.39 0O0 -0OAKAgFicultura land under irrgation % -.... 341 8.84 13.96Forests and woodland tho. rq. km .. 0.00 0.00 9.37 8.04 10.56Deforestation (net) annual % ... 0.00INCOMEHousehold incomecShime of top 20% or households % of income 44 .
Shoe cof bottomn40% of housebolds 19 .
Slime of bottomn 20% of households 7 .
EXPENDfURFood %ofGDP . 22.4 - . . 4Staples - .4.6 .... 1.6MaLrish. na,cltesr,e -ggs 12.0 ..- - 3.8
Ceeal imports thou. metric tonnes 38 59 54 27.700 48,947 77.530Food aid in cereals 0 0 .. 1,565 544 3Foodproduction per cmpita 1987=I1OD 102 97 91 101 102 95Fertilizer consumption kglh 233.3 185.1 150.0 16.1 67.8 150.0Sbaztoragicitum irn GDP %ofGDP 11.5 6.2 5.6 9.0 8.0Housin % ofGDP -. 11.7 ... .11.7
Average household size persons per household 4.0 .
Urban-Fixed investment housing %ofrGDP .. 3.7 . .. .Fuel andipower %ofGDP .. 3.7 . .. 2.0Energyconsumpion percapita kg ofoilecquiv. 1.313 14648 1.381 913 1.632 5.203Households. with eleenicily
Urban % of households..,Rural
Transport and conwunulatlon % orGDP 43....88Fixed investment transport equipment -. 1.7 ... .2.1
Tomaroad length thou.km 1 2 2INvF-STrME IN HUMAN CAMALHealthPopulation per physicia pemsons 1.912 1.121 -.. 453Population per nurse 296 222-..-Population per hospital bed 98 117 .. 517 395 145Oral rehydyration therpy (undecr-5) % of cases ... 15 61 51 -
EdwminconGros enrollment ratioSecondary % of school-age pop. 77 93 87 47 53 92Femiale Si 94 83 .. - 94
Pupil-taeaer ratio: primary pupils per teaher -. 21 17 26 25Pupil-teacher ratio: secondary S20 20 20 .
Popils maching grade 4 %Of cobort 64 91... Repeater rat: primary % of tota enroll......-lisitracy S of pop. (age 15+i) 1 1-.i 14Farrale % of kmn(agelst.) I . 8 1 7
Newsape circulation perthou.poM. 100 153 158 85 125 320worLd lwk nteratsonal Economics Departmnt.i April 1995
29

BelarusMad Sase reglenfmeuegreup New
La simleer rywent sure, Upper. higherUrnit ef eotaw & Gan) mddl- Lucome
ludkaor meure 197-75 1M945 19U-93 Asia ncome grop
Priority Poverty [ndicatorsPOVERTYUpper poverty line loca cor. .. ..
Headcount index S of pop. .. ..
LwerpovAtyline local cur. .. ..Headcount index % of pop. .. ..
GNP per capita US$ .. .. 2,870 2,450 4.350 23.680SHORT TERM INCOME INDICATORSUnsdlled uanwages local cur. .. 141 3862Unsidlled nnml wages .. 155 3507Rurl tems of rade .. ..
Consumerpuice index 1997=100 .. ..Lower income -.Food' .. 91 2.332 .. .. .
UrbanRural
SOCAL INDICATORSPublic expenditus on basic socia sevices % ofrGDP .. .. 8.0Gross enoment ratiosPimaMy * school age pop. .. _ 87 .. 105 103Male *.. .. .. .. .. 103Female .. _ 103
MorlityInfant mortlity per di ive birds 21.0 20.0 16.0 24.8 35.8 7.0Under S mortality .. .. 22.0 36A 42.6 8.5nuiunization
Meases Sage grop .. .. .. .. 82.0 82.5DVPT .. .. .. .. 74.2 902
Child malnutifiom (under-5)Life expectancyTota yews 71 70 70 69 69 77Female advantage 8.9 9.6 10.6 8.8 5.9 6.4
Totl ferulityrate birtbs per woman 2.2 2.1 1.7 2.1 2.9 1.7Mael motulily rate per 100.000 live birdts .. 29 25 .. ..
Supplementar Povert IndicatorsExpenditures on socia seuity % of toal gotexp. . .. 12.0 .. ..Social security coveage S eown. active pop. .. .. .. .Access to safe water. total %of pop. .. 100.0 .. .. 86.7
Uban * .. 100.0 .. 93.9Rural .. 100.0 .. .. 66.7
Access to hethc .. 100.0 100.0 .
Population growth rate GNP per capita growth rate Development diamond(annual avege perceno ,0 (a vurage. percent) Uf I '
4 -5
2 0GNP Gros2- ~ _ O L 9 I per -//
capita ecrollnentO- | lll ll .l ~~~~~~-5- \ 7
-2 -101970-75 1980485 19S8-93 1970-75 1980-85 198893 Acesstsafewater
[ Bdarus B Delamus- Upper-middle-income Upper-aii -income
a. See tbh technical nots, p387. b. The development diamnd based on fourky indicaod smdavragstleevd of deveopment ia the camnycompered with its income group. See Ihe inoduction.
30

BelarusMeet SNUGrezi euulcrgoup Neod
Lees: ingle year retest zwept UPPe6 higherUn it of estmate & Calou .iddh. kern..
Indicator measure 1970-75 1980-8 1985-93 Asia lucere groupResources and Expenditures
HUMAN RESOURCESPopulation (mre=-1993) thousands 9,367 9.958 10.188 494.619 500.57 812.47Age dependency ratio ratio 0.55 0.49 0.51 0.57 0.62 0A9Urban %1 of pop. 50.3 61.8 69.4 64.8 71.2 77.9Population growth raet annual 56 0.7 0.7 0.0 0.6 1.7 0.6
Urban 3.3 2.4 1.3 1.5 1.8 0,8Labor force (15.64) thousands .. 5,112 4.826 237.897 190.136 395,641Agticultur % ofhlbor forc . 24 20Industry .. 39 38Femal . ,. 47 29; 38Females per 100 malesUrban numiber . ..
NATURAL RESOUIRCESArca thou. sq. kin 207.60 207.60 207.60 24.320.56 21,84&14 32Z146.15Density pop. per sq. km 45.12 47.97 49.05 20.20 22.51 25.11Agricultural latnd % ofland azua ...... 41.26 42.80Change in agricultural land annual 51 . -0.16 -0.10'O -1.28 0.08 -0.48Agricultural land underinrigation 56 1.42 1.65 1.38 7.15 8.84 13.96Forest and woodland thou. siq. kinm 0.06 0.06 0.80 8.04 10.56Delbrcstation (net) annual %t ... 0.45 .
I[NCOMEHousehold incme
Sham of top 20% of househods 56 or income ..
Sham of bottom 40% of households...Sham of bottom 20% of households ..
Food % ofGDP ... .. .8.4
Staples ... .. .1.6
Meat,fish milk, cheese, eggs ... .. .3.8
Cereal import fthu, metric tonnes .... 1,5 34.452 48.947 77.530Food aid in cereals ... 246 4.392 544 SFood production per capita 1987 =100 ... . . 0 95Fertilizer consumption kgtlha -.. 148.6 4117 67.8 150.0Shareof agFicultum in GDP % ofGDP .. 7.2 16.9 13.5 tO0Housing %Of GDP ... 4.7 6.0 11.7lAverag househod size persons per household ... 3.2
UrbanFixedinvstminet housiing %of GDP ... 4.9 5.2 S .0Feielandipower % ofGDP ... 1.0 1.2 .. 2.0Emcrconsumptionpecapiba kg of oil equiv. .. 3.427 Z.959 1.632 5X23Households with electricityUrban 56 of households...Rural
Transport and commnuication 51.of GDP -.. . .. .!Fixed investment transpout equipment -. ..... 2.1Total road length thou. km Si 5 98INVESTENTM IN HUMAN CAPITALHealthPopulaton per physician persns 331 257 232 362 .. 453Populaton per nurse 1tO 92 88 249Populaton per hospital bed 88 76 79 136 395 145Oral arhydyzuton therpy (under-5) 56 of cases .... 51EdudentoGross enrllment ratiSecondary 56 of school-age pop. ... 91 .. 53 92FemaleU- .. .. 94
Pupil-teacher ratio: primary pupils per teacher -..... 2SPupil-teacher rtio:, seondaryPupils mvadhing grade 4 % ofcrohort . .. ..
Repeate xmt pniufary 56 oyf total enroll .
IlliLter %of pop. (agel15+) ... 2514Female % Of fenu(agel15i) ...-.. 17
N on ~~~~~~~~~~~per thou. pop. .- .. 125 320Worl liaK iiemaiocaooonucs Department. Apraim99
31

BelgiumMost Smre,gnilaaem groru
ZaestsioWkpf recaUnit of afima*. High-
ladkolwr axsre 1970-75 19805S I98-93 imeme
Priority Poverty IndicatorsPOVEUTYUpper poverty linc local curr.
Hcadcount index W% of pop.Lower poveay line load curr.
Headcount index % of pop.GNP per capita USS 6.480 7.970 21.650 23.680SHORT TERM INCOME INDICATORSUnskiled urban wages local curt.Unskiled rurnl wagesRuml terms of tmradConsumerpficeindex 1987=10D 51 97 117
Lower incomeFood' 39 99 109
Urban .Rural
SOCIAL INDICATORSPublic expenditue on baic socia services % of CDPGross cnrolhnnt rtiosPrimary % schoolm e pop. 102 99 99 103Male 102 99 98 103Female 102 99 100 103
MortaltyInfant mortity per thou. live births 19.0 11.0 6.0 7.0UnderS mortality .. .. 10.0 8.5
InmuniunatonMasles % age group .. 90.0 75.0 82.5DPT ' .. 95.0 94.0 902
Child malnutrtion (under-5)Lie cxpctancy
ToWa yews 71 74 76 77Female advantage ' 6.5 6.8 6.7 6A
Total fertiqity rae birth per wornu 1.9 1.6 1.7 1.7Marnal mortality mte per 100,000 live birtlbs .. 10
Supplementary Poverty IndicatorsExpenditrs on social security % of oal govt cxp. 43.4 38.2 42.0Social security coverage % ecn. active pop.Access to safe water total % of pop. .. 100.0
Urban ' .. .. 100.0Rral ' .. .. 100.0
Access to health carm 100.0 100.0
Population growth rate GNP per capita growth rate Development diamondb(amual averge. prcent) (5i amuavrae. percent) fexec
4 -- 5-
2- . O- [<. ;GNP G"oss
capita \ rollme
0 r------- -5
-2 -- 101970-75 1930.85 1986-93 1970-75 1980-85 1989-93 Acc afc vmw
C Belgium Belgkam- Hligl-incomc Hi gh-income
, Sec the technical notes. p37. b. Thc development diamond. based on four key indicators, shws the average level of development in the countycompared with its incmen group See the inodction.
32

BelgiumMost Smerig bce .Jnvi
[atds silgleyear rentUnit of clinaft Hgh-
Indkcaor mneaure 197t1-75 HAMS JlW43 heomre
Resources and ExpendituresHUMAN RESOURCESPopulation (nrem1993) thousands 9.796 9,857 10,048 812,447Age dcpcndcncy aio ratlo 0.57 0.48 0.50 0.49Urban * of pop. 94.9 96.0 96.8 77.9Population growth rate annual * 0.3 0.0 0.3 0.6
Urban " 0.4 0.1 0.4 0.3Labor force (15-64) thousands 3,767 4,092 4,158 395.641Agriculitre %of labor force 4 3Industry 40 36Female ' 32 34 34 33Females pcr 100 maeksUrban number ..Rural
NATURAL RESOURCESArea thou.sq.kni .. .. .. 32,146.15Density pop. per sq.km .. ..km 25.11Agriculturl land * of land ana .. .. .. 42.30Change in agricultural land annual % .. . .. -OASAgricultural land under irrigation % .. .. .. 13.96Forests and woodland thou. sq. km 0.01 0.01 10.56Defo:rstadon (net) annual * _ .. 4031
INCOMEHousehold incomeShae of top 20% of households * of income .. . 34Share of bottom 40% or households .. .. 25Share of bottom 20% of households .. .. 10
EXPENDITUREFood %ofGDP 12.4 11.7 9.7 8.4
Staples 1.9 1.5 1.5 1.6Meat, fish, milk, cheese, eggs 6.7 6.5 52 3.3
Cereal impots titn. metric tomes .. .. .. 77.530Food aid in cereals .. .. .. 8Foodproduetinpercapita 1987 100 .. 95Fbilizer consuutpdan kgih. .. .. 150.0Shau of agriculbuc in GDP *ofGDP 2.8 2.2 1.7Housing %ofCGDP 9.6 12.8 103 11.7Avenge household size persons per household 2.9 2.7
Urban I .. ..Fixed investment housing %ofSGDP 5.7 1.6 43 5.0Fuel and power % of GDP 3.6 5.0 2.7 2.0Eegy constumption per capita kg of oil equiv. 4.345 4,467 4,989 5.203Households with electricity
Urban % of households ..Rural '
Transport and conunnicaton %ofEGDP 6.9 83 7.9 8.8Fixed investment ansport equipment 1.9 1.7 2.2 2.1Total oad length thom. n 125 128 133 -
INVESTMENT IN HUMAN CAPITALHealthPopuaition per physician persons 649 331 .. 453Population per nuse .. 108Populadon per hospital bed 120 107 121 145Orarehydyrtion therapy (under-5) % of cases ..EducationGross cnrmlnnt IatioSeconday of schoolw-age pop. 84 98 102 92
Female * 83 98 103 94Pupil-teacherratio: prnmry pupils per teacher 19 17 10Pupil-teacher ratio: secondaryPupils waching grade 4 * of cohort .. 79 _Repeater rate: primay 9 of total emoll 24 17 .Illitezcy %ofpop.(apg5+) .. .. t
Female % offbn.(age 15+) .. tNew= 7 ciculation perthou.pp 239 220 310World ;ian Intmanonra Econornics PIuntI,111. Apni 1993
33

BelizeMeat Same regnfincewmgroup Naxt
Laftsingle rac. Lts f;ewer- higherU.S of esi 4affkerIa mkdle- income
Idicalor macsm 070S I75 0 4 1J9153 Caibbekm income groupPriority Poverty Indicators
POVERTYUpper poverty line local curr. .. ..
lcadcount Index 51 of pop. .. ..Lower poverty line local cur. .. ..
Headcount index 51 of pop. .. ..
GNP per capita USS 830 1.180 2.450 2.930 1.590 4.350SHORTTERM INCOME INDICATORSUnskilled urban wages local curr. ..Unskilled nual wagesRuml tms or tradeConsonner price index 1987=100 .. 97 120
Lower ineormeFoot .. 91 123 .
UrbanRural
SOCIAL INDICATORSPublic expenditure on basic social services * of CDP .. _ 9.0Gross enroilment ratiosPrimary % school age pop. .. .. 107 104 105Male ..Female ". .. ..
MortldityInfat mortality per thu. live births 52.0 39.0 32A 43.0 39.0 35.8Under 5 mortality .. .. .. 52.2 61.5 42.6
Immunizationmeasles %agegroup .. .. 81.0 78.7 77.6 82.0DPT 84.. 4.0 73.7 82.2 74.2
Child malnuriiron (undcr-5) " .. 5.7.UfcexpeacyTotal years 68 71 74 69 67 69Female advantage 1.4 2.2 2.6 5.3 5.9 5.9
Toti ferdyrate birtsper woman 6.3 5.4 4.1 3.1 2.9 2.9Matemal mortality rate per 100.000 live biths .. .
Supplementay Poverty IldicatorsExpenditus on social security % of total govtexp. .. 4.0 3ASoci security covew % ewcn. active pop. . . ..Access to safe watar total % of pop. . .. .. 80.0 .. 86.7
Urban 1000 90.1 93.9Rual .. 38.0 .. 57.6 .. 66.7
Accs to heali cam .. 75.0 95.0
Population growth rate GNP per capita growth rate Development diamondb(anuua averagc. percent) 1, (amual average. percet) Ecx
F -I ~ GNP Gros2 S-.......I 0- per penury
0 ~~~~~~t -Ii ~~~~~~~~~~~~~~~ ~capita ebolun0 F~~~~~~~I-
| 197075 19W0-8S 1988-93 1970-7S 1980-5 19893 Acces to safe water
2JBdize - edi- Lower-miiddl c inc -me
a. Se the tecnical notes. p.387. b. The development diad, based on fourkey irdcatr, show the average levd of development in thecountrycompared with its income gmp, See the introduction.
34

BelizeMosn .Mir rsolouneemegmr, 'Next
Lat"iNskcae er swuig isao L er bhighrVi. I of estmate America middle. twine
Indkcator meeawre 1970-75 1980-IS 196MM Cafribbean Incme gruMpResources and Expenditure
HUMAN RESOURtCESPopulation(mremP993) thousands 134 166 204 466.304 1.096,665 500.07Age dependecy redo rato 1.09 1.05 0.90 0.66 0.69 0.62Urban % of pop. 50.2 48.5 47.1 71.2 54.7 71.2Population growth rAte annual S 1.7 2.6 2.5 2.0 1.6 1.7
Urban 1.4 2.2 2.1 1.9 2.9 1.9Labor force (15-64) thousands 38 54 63 169.839 459.196 190.136Agriculture % of labor fore...Indus"r Femal *21262 27 31 29Females per IO0 males
Urban numzber...Rural
NATURAL RESOURCESArea thou. sq. Ian 22.96 22.96 22.96 204505.92 40,692.67 21,841.14Density pop. per sq. kmn 5.94 7.23 8.67 22.29 26.52 22.51Agricultural land % of land ame 3.73 4.43 4.61 40.00 39.61 41.26Change inagriculturallmnd annualS% 1.19 4.12 0.00 0.39 -0.13 aoa8Agricultural land under inigaton % 1.18 1.98 1.90 3A1 12.66 8.84Forests and woodland thou. sg. km OM .0 0.0 9.97 5.95 9.04Deforesatilon (net) annual S 0... enINCOMEHousehold incomeShare oftop 20%of households S of incomen . ....
Share of botto 40% of householdsShare of bottom 20% of households
EXPENDITUIREFood %ofGDP ... 4.2Staplsa .. 9.1Meal. rish, milk, cheese, egsU .. 7.6
Cerea imnports thou. metric ons13 tO 17 27,700 66,281 41.947Food adin cmas I 0 5 1.565 S.477 544Foodproducrion per capira 1987 I100 93 9 1 96 101 101 102Ferniiercomnsumpto kgiha 24.7 24.0 57.1 16Ll 48.0 67i9Share of agricultuem in GDP % ofUGDP 17.8 16.4 tO0 15.7 SD0Housing Sof GDP ... 9.8Average household size pawons per household 5.2......-Urban
Fxwd inveunet housing %of GDP ..- 6.2"Fuel a"dpower % of GDP 3. . 4Encrgy consumptionper capta kg of oil equiv. 485 459s 426 913 1,595 1,632Households with electricity
Urban S of households...Rural
Transport and comnunmleatiou %s of GDP ... 10.7Fixed investmet transport equipmnt . . 5.7Totalroad kngth thou. km - 2DNVEST1hIEWIN HUMAN CAPIALHlealthPopulton per physician person 3.000 3,677 1,562 .. 3,277 -Population per nurse 458 496 361... Populatin perhbospialW bed U190 ... 517 604 395Oral rehydyration therapy Cunder-S) S of cases ... 92 61 .. 51EducationGros enrlment ratioSeconday % of sebool.agepop. . .. 47 53 53
Female .
Pupil-teaer railo: pmriay pupils per teacher 26 25 26 26 . 25Pupil-teacher ratio: secondary a14 13 Pupils reaching grade 4 % ofcoDbort 65 .. 72 .
Repeate mton primary S oftotal cnroll . .
Ilitracy % of pop. (agelS4.) 9 ... 15 19 14Female % of fnL (qpel+) I.. .1 a. 17
N circulation rto. .30 19 .. 5 74 125a orematina nutimsDq U rAp I
35

BeninMosd Sme releu/x cmI group Net
LmNlagf Eyo rnaeo sue- higherCrIst of eslimate Sakun Low- income
Indicator meaure 1710-7s 1955 190S43 Afca incme raop
Priority Poverty IndicatorsPOVERTYUpper poverty line local curr. .. ..Hrndcount Indxo pop. .. .. .. .. 19 .,
InT rpoverty line locl curr. .. ..Headcount index % of pop. .. ..
ONPPpercapia US$ 220 280 430 520 380 1,590
SHORT TERM INCOME INDICATORSUnskiled ura wages local curr. .. ..
UnsklRed rua wagesRural terns of trade *Consumer prioe index 1987=100 .. _.Lower incomeFooe
Urban _Rural
SOCIAL INDICATORSPublic expenditur on basic social srvics % ofGDP .. _.GmOs emnllment raiosPrimary % scwol age pop. SO 67 66 67 108 104Male * 70 89 78 74 116Femae * 31 44 39 60 101
MortalityInfant morlity per thou. live births 136.0 100.0 84.6 93.1 63.1 39.0Under 5 mortaity ' .. .. 144.0 172.3 101.4 61.5
Im iuitionMeasks % ag gmup .. 23.0 70.0 49.9 87.3 77.6DPT * .. 17.0 67.0 51.9 89.9 82.2
Child malnutrition (under-S) 0.. .. . . 403.Life expectanqTotal years 40 44 48 52 62 67Femaleadvatage ' 3.1 3A 3.4 3.3 2.1 5.9
Total fertlityrate births perwonan 7.1 7.1 7D0 6.2 3.6 2.9Matmnml motaliy rma pcr 100,000 live births _ 1680 .. .
Supplementary Poverty IndicatorsExpendibtues on social secuity $of total govt exp. .. ..
Social security covage SE aoctve pop. .. -
Access to safe wer totl of pop. 34.0 49.5 50.3 .. 67.0Urn 100.0 30.0 79.0 .. 78.7Runrl ' 20.0 34.0 345 .. 62.0
Accwss to heWth care .. .. 50.0
Population growth rate GNP per capita growth rate Development difmondb
(cmnu l aveage percent) 10 (annual avr. percent) Life xp y
45
2 - G r~ -=GIP Gross
Captita
O - l l ll -S- capt4P f enralment
197tt7t 198 1988-93 1970-75 1980-85 1988-93 Access to safe waer
llenin _ min- Low-incomne Lincome
a. See the teebnical notes. p387. b. The devdopment diamond based on four ky indicat shows the avaWe levl of development in the countryconmwed with its iwom group. See the intduction.
36
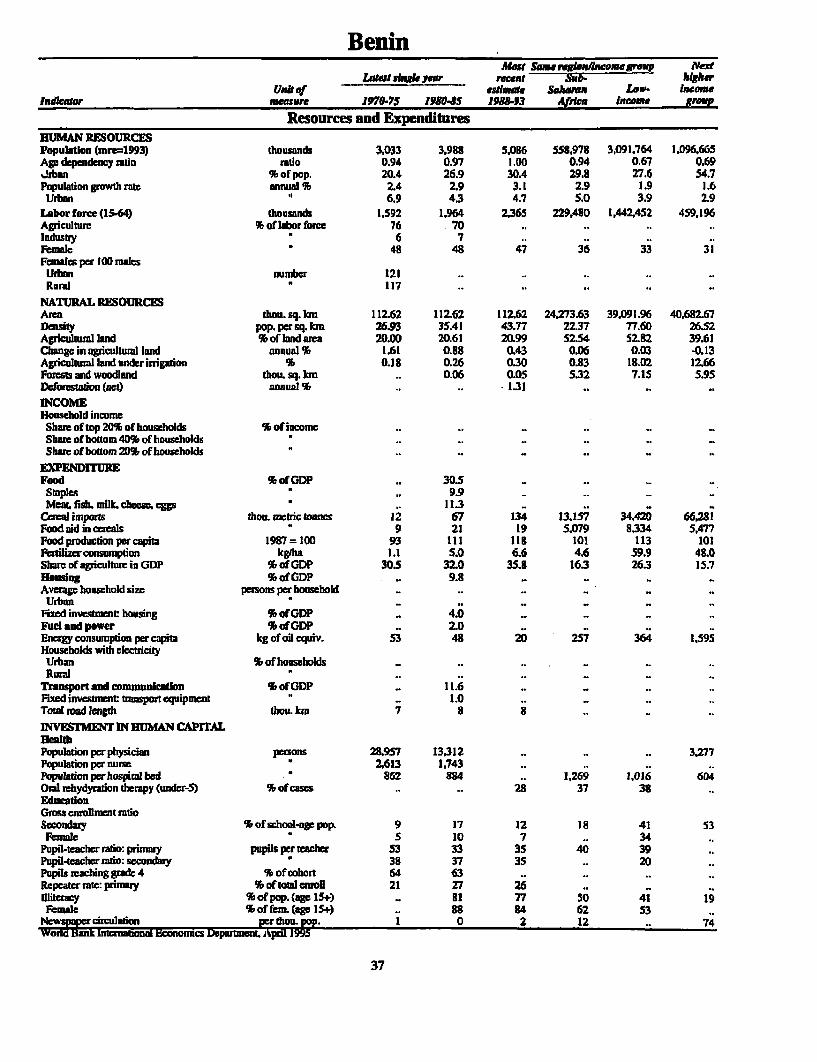
BeninMast Smug regie,Wh,enr grwp Next
Laartsinge ear recet S]ub- MgherfVln of estimfte Sahara. Low- Income
IFndicaor measure 19711-75 19l0-85 1M88-93 Arica Income gffraE
Resources and ExpendituresHUNMA RESOURCESPopulation (murm=1993) thousands 3.033 3.988 5.016 558.978 3.091.764 1.096.665Age dependency rato rmto 0.94 0.97 1.00 0.94 0.67 0.69tJrbnn % of pop. 20.4 26.9 30.4 29.8 27.6 54.7Population growth rate annual S 2.4 2.9 3.1 2.9 1.9 1.6
Urban .16.9 4.3 4.7 5.0 3.9 2.9Labor force (1544) thousands 1.592 1.964 2.365 229.480 1.442452 459,196Agriculture % of labor force 76 70Industry 6 7Femal f 48 48 47 36 33 3 1Females per 100 males
Urban number 121 .
NATURAL RESOURCESArea thou. sq. km 112.62 112.62 112.62 243273.63 39.091 .96 40,682167Density pop. per sq. km 26.93 35.41 43.77 22.37 77.60 265S2Agricultul land or land area 20.00 20.61 20.99 52.54 52-82 39.61Clunge inagricultural land annual % 1.61 0.88 0.43 0.06 0.03 -0.13Agriculurnl land undecr inigaton % 0.18 0.26 0.30 0.83 18.02 12.66Forests and woodland thou. sq. km .. 0.06 0.05 5.32 7.15 5.95Deforestation (net) annual % .. 1.31INCOMEHousehold incm
Shame of top 2D% of households % of imncoe...Share of bottm 40% of householdsShare of bottom 20% ofliousehodMs
Food % of GDP .. 30.5Staples f.. 9.9..-Meat.fish. milk.cheese.ecgps~ 11.3
Cerea import thou. metric Iowea 12 67 134i 13.1576 34,420 66.28Food aid in cmezus 9 21 19 5.079 8,334 5.477Food producton per capita 1937 100 93 III 118 lOX 113 101Fezilzeconsumption k&~a 1.1 5.0 6.6 4.6 59.9 48.0Share of agricultur in GDP % of GDP 3035 32.0 35.8 16.3 26.3 15.7HoousIg % of GDP .. 9.8 - .
Averag household sirs persons per household -. ..
Urban f
Fixed investment: housing %of GD?P. 4.0 ..
Fuel and power % of GDP .. 2.0Energ consumption per capita kg of oil cquiv. 53 48 20 257 364 1.595Households with electricity
Ulrban Veof housel,Dlds......
Trmnsport and coummnicatIon S of GD?P. 11.6Fixed investmet tranport equipment . 1.0Toznlmadlangdt tou. krn 7 a aINVESTMENT IN HFUMAN CAPIALHealthPopuaton per physician persons 28.957 13.312 ... . 3.277Population per nurse U 2613 1.743Population per hospital bed *862 884 -. 1,269 1,016 604Omal ruhydyration therapy (under-5) % of cae-.. 28 37 38
Gross earoflnient ratioSeconrdary' Sof school-ag pop. 9 17 12 18 41 53PanSe ft 10 7 . 34
Pupil-teacher ratio: primnay pupils per teacher 53 33 35 140 39Pupl-tewbhernrao: secondary S38 37 35 .. 20Pupils =achinggrade4 Of cohort 64 63Repeater mte: prinary %Of tomalemuo 21 27 26 . -
illiteray of pop. ageclS.) .. 81 77 50 41 19Female % of &m. (agelIs+) .. 88 84 62 53N nrw circulation pe thouwM. I 0 2 12 .. 74
Wf tS International Eiconons Depatment. Apnil 1 53
37

BermudaMest Se. rnzon/uemegrnup
Lftfst flugliYW recentUnRef csalaet tuigh-
Indkloer murc _ 1970-75 1959-85 188-93 IneauPriority Poverty Indicators
POVERTYUpper povety line locl curr.Headcount index % of pop.Mower poverty line local curr.Headcount indeu 9b of pop.
GNP per capita USS . .. .. 23,680
SHORT TERM INCOME INDICATORSUnskilled urban wages local curr.Unskilled rural wagesRural terms of tradeConsurncr price index 1997=100
Lower incomefnFoe .. 93 123
UrbanRurda
SOCIAL INDICATORSPublic expenditure on basic social services % of GDP
ross ensuilment mtiosPrimary %schootagepop. .. .. .. 103
Male .. .. .. 103
Female .. .. .. 103
MortalityInfant motlity per thou. live birts .. .. .. 7.0Under S mortity .
ImmuzitionMeasles % age group .. .. 63.0 825DPT .. .. 62.0 902
Child malnutrition (under-5)Iife expecncyTotal years .. .. .. 77Femae advantage .. ... 6A
Totl fcility rat birts perwomm .. .. .. 1.7Matenal mortality are per 100,000 live births
Supplementary Poverty IndicatorsExpenditures on social security * of lgow rt exp.Swcial scurity coverag econ. acdve pop.Access to safe water total % of pop.
Urban -
Rural -
Access to health car _ _ _ _ _ _ _ _ _ _ _ _ _ _ _ _ _ _ _ _ _ _ _ _
Population growth rate GNP per capita growth raft Development diamonde(6animl average. pecent) (annual aveage. percent) iJfc expecancy
4 -- 5
2 0 O GNP Grass
O _1 -S- ~~~~~~ ~ ~ ~ ~ ~ ~~~~~~~~~~capita\ /_
-2-11970-75 1980-8S 1988-93 1970-75 19B0-85 1988-93 Acces to safe wax
m Bemuda Bemda- figh-income bincome
a Sec he technical no: p387. b be drevlopmnm diaondbased on forkey india, shows dh average evelofdveop in the countlycompared with its income group. See the introction.
38

BermudaMoat Sae rcgbnfnicouu gr
Luau,f.- ain,I ya. ONtUnat of out mat1 HLtnt
lndkmor measure AMOT5 IMJO4S 198J.93 inceme
Resources and ExpendituresHUMAN RESOURCESPopulatIon (mre.1993) thousAnds 53 56 62 8 12,447Ago dependency ratio ratio .. .. .. 0.49Urban %of pop. 100.0 100.0 100.0 77.9Population growth mte annual 0.0 0.7 0.7 0.6
Urban " 0.0 0.7 0.7 0.8Labor force (1564) thousands .. .. .. 395,641Agriculture % of labor forceIndustryFmale .. .. .. 38Femnaes per 100 males
Urban numberRurai
NATURAL RESOURCESAWa thou. sq. km 0.05 0.05 0.05 32,146.15Density pop. persq. km 1,060.00 1,120.00 1,235.84 25.11Agriculturl land %orlandarea .. .. .. 42.80Clhange in agriculturta land annual % ,. ., .. -0.48Agricultura land under irrigation % .. .. .. 13.96Forests and woodland thou. sq. km .. 0.00 0.00 10.56Deforestation (net) mannul . 0.00INCOMEHousehold incomeSh of top 20% of households % of incomeShare otbottom 40% of householdsShar of bottom 20% of households
EXPENDITUREFood % of GDP .. .. .. 8A
Staples .. .. .. 1.6Mcal. fish, milk. cheresc eggs .. .. 3.8
Ceral imports thou. rmetric tonnes 3 5 3 77,530Food aid in cereals 8.. .. _Food produetion percapita 197 =100 .. .. .. 95Fertilizer consumption kg/ha .. .. _ 150.0Share of agricultur in GDP % of GDPHousing % of GDP .. .. 11.7Average household size persons per household 3.4 2.9 _
Urban p 3.1 2.9 _Faxed investrmnat housing % of GDP .. .. - 5.0Fuel and power %ofGDP .. .. _ 2.0Energy consumption percapta kgof oil oquv. 3.623 3.143 2,798 5,203Households with clecuity
Urban % of householdsRural
Transport and communication * of GDP .. .. _ 8.8Fixed investmcenttransport qpn .. .. .. 2.1Total road length thou. kmn
INVESTMNT IN HUMAN CAPITALHealthPopulation per physician persons 815 1,324 .. 453Populafion per nursePopulation per hospital bed 104 .. .. 145O.1 rehydyradon theapy (under-5) % of .asesEduatlionGross enroUment ratioSecondary of school-age pop. .. .. .. 92
Female .. .. .. 4
Pupil-teacher mtio: pimary pupils per teaher 21 17Pupi-techer rtio: secondary p 14 11Pupis reaching grade 4 % of cohort .. 97Repeater rate: primnary % oftobalc noli 7Illiteracy % of pop. (pge 15+) 2 .. .. .
Female * of fem. (ae 15+)News rcircuation per thou. pp. 208 321 259 320WOMFLd B MatiemUMational Econcs Departmnt Apnl 1995
39

BhutanMed Same re nAuei NdXt
loft ytgeji.ar reu kihiorVnit ,r onimmd SnurI few. Incomr
Jandkdee mew.Ire __ -970I7s J19 S iNa.,i Asia incomoe gmupPriority Poverty Indicators
POVERTUpper povy lin local curr. ..Hoedountlmdex *orpp. ,, . ,p 28 19
LeWOr pOverly line local w. .. .urrHeadcount lndop W of pop,
GNPpercaplta USS . .. .. 310 380 1.590SHORT TERM INCOME INDICATORSUnskilled urban was locnl cur. .. ..Unskilled rual wagpsRural amp of trdConsumr price lndex 1987.100 .. B6 167Lower IncoMoFood * .. .. 115 . ..
UrbanRural
SOCIAL INDICATORSPublic oxpendtiturm on baic socia serviee 9 of GDP 5.9
mss enrollment ratiosPrimAzy %school appop. 6 27 25 106 103 104Male " 11 34 31 IlIi 116Fenale I 19 19 93 101
MortuityInfan moality per thou. live births 83.7 63.1 39.0Under 5 mortality .. .. .. 123.9 l01A 61.5
ImmunizationMeasles b age group 11 0 36.0 15.B 87.3 77.6OPr r 10.0 46.0 90.2 89.9 82.2
Child mulnutridom (under-5) H .. .. .. 60A 40.3We espectancTota years 60 62 67F;:ale advantge A 0 4 2.1 5.9
Toud fertility ate birth per woman 4.0 3.6 2.9Maternal moraity rate per 100.000 live births 773 420
Supplementary Poverty IndicatorsExpcndius on social ecurty l of toil gov't exp. 1.0 0,5Social serity wveuage % econ. acve pop.Accecstosafewater toi %*of pop. 15.1 33.9 69.5 67.0
Urban * 40.0 60.0 73.8 78.7Rumal 1.. 4.0 30.0 67.2 62.0
Access to helth care S.0 00.0 95.8
Population growth rate GNP per capita growth rate Development diamondb(annual avemge, percent) (annual avelage, percent) Bfeexp=Wrn
4 -- S
_GNP Gass2 _*0 1 1 per I < I > primary
capita \ I/ enrollment0 -- pr
-2 51 11970-7.5 198-Is I989 I97-7.5 190-85 1981-93 Acc to af wae
M Bhutan Bhutan- Low-incone - Low-income
n Sec the echnical noos p387. b. The &-vlopment diaxmod, base on four lky indckaton, shows the average leed of developmun in the counuycompard with its inxcoe gup. See the i;tduction.
40

BhutanMeAt Sme regefincmereup Ne
ltsut shg Ie par rsen higherUfiltf atImae Soma Lew- Lnome
Imad r m_r 197075 111045 1MB-fl Asla icore group
Resources and ExpendituresPllMAN RESOURCESPopudton (mnrml9f3) thDusaniu .. .. .. 1,193,503 3,091,764 1,096,665Age dqeendency mtio raio .. .. .. 0.74 0.67 0.69Urban of pop. .. .. .. 25.7 27.6 54.7Populadon grwth rate anual% .. .. .. 2.1 1.9 1.6Urban .. .. .. 3. 3.9 2.9
Laboreorce (154) thousands .. .. .. 437,138 1,442.452 459,196Agdculture oF labor force .. .. ..
Female .. .. .. 22 33 31FRmnes per IOD maks
Urban number .. .. ..Rurd .. .. ..
NATURAL RESOURCESArea thou. sq. km 47.00 47.00 47.00 5,133.49 39,091.96 40.682.67Density pop. persq. kn 23.81 20.67 14.73 227355 77.60 26.52Agricltura land * of land area 7.94 3.43 8.66 59.03 52.82 39.61Change in agricultual land annald % 054 0.51 0.99 0.00 0.03 -0.13Agricultura land under imigption % 5.90 7.58 8.35 29.34 12.02 12.66Forests and woodland thou. sq.km .. 0.03 0.03 0.66 7.15 5.95Deforstation (net) annua % .. .. 0.57.INCOMEHoushbold incormShare of top 2D% of hosehiolds % of iacnmc .. .. .Shame of botto40% of bouseholds - .. .. ..Share of bonom 20% of houscholds .. .. ..
Food %ofGDP .. .. ..StaplesMeat fish. milk chees, eggs '
Cereal inpors hL metric lonnes 3 12 35 6;211 34,420 66jZ81Foodaidinceerals ' .. 5 3 1,624 8,334 5.477Fobdproductionpercapita 1987=100 89 93 84 111 113 101Feriizer osusqption kglha 0.3 0.3 0.3 702 59.9 43.0ShareoragricaltureinGDP %ofGDP .. 51.7 38.8 27A 26.3 15.7Rowing %ofGDP .. .. ..Average housebold siZe perans per household .. .. ..Urban * .. .. ..
Fixed invment hoin * of GDP .. .. ..Fuel d power SofGDP .. .. ..EnerW consumption per caita kg of oil equiv. .. 24 33 216 364 1,595Households with electricityUrban S of households .. .. ..Rumrl .. .. ...
Transpot mud cm n tmn of GDP .. .. ..FRxed investn tanspot equipment .. .. ..Tota ro d length dt. km .. .. ..
INVESTENT IN HUMAN CAPITALBldhPopulation per physician ps .. .. .. 2,0 .. 3,277Populaion per muse .. .. ..Pbpulion per hospital bed p . .. .. 1,o63 1,016 604Onr rehydynton therapy (under-5) S of cases .. .. 85 37 38EducmatlGross eanmant mtioSoeacdmy % ofschool-ag pop. 1 4 5 40 41 53Female U 0 t 2 29 34
Papil4eacberrdo primry pupils per teaber 24 39 31 61 39Pupil-tacherratio scondary .. S 26 20Pupils reaching grade 4 % of cbort .. .. .. .Repearat pi of toMlNerol .. e 17Illitracy % of pop. (ae IS+) o8 62 54 41 19Female %oftrn4ae51+) *- 81 75 69 53
N>rn: 7r circulation per thou.jow - .. 26 74dank Intmnahl ona Economics Peparbent, Apead I5
41

BoliviaMostl Ste reglonie grp Next
Latestns1gle er recent lotlls or higherUna of sit.We Amera middk- Income
Indicator mOaOsr 190-7S 19G-IS 198J93 Cd rleet income group
Priority Poverty IndicatorsPOVERTYUpper povyt line local curr. .. ..
Headcount index %I of pop. .. ..
Lower povecty line local curm. .. ..
Headeount index * of pop. .. ..
GNP per capita USS 400 440 760 2.930 1,590 4.350SHORT TERM INCOME INDICATORSUnskilled urban wages local curr. .. ..
Unkied rnal wages ..
Rural ten. of tradeConsucrrprice idex 1987=100 0 23 231Lower incomeFood'
Urban ". 24 184Rural
SOCIAL INDICATORSPublic expenditur on basic socal services % ofGDP .. ..
Grss enaromnent ratiosPrimay * school age pop. 85 91 aS 107 104 105Male * 94 96 89Female * 76 85 S1
MortalityInfaimoalkity perdiou.livebirths 151.0 109.0 73.2 43.0 39.0 35.8UndrA 5 monality .. _ 114.0 52.2 61 5 42.6
InunniwzatonMeasles % age group .. 17.0 73.0 78.7 77.6 82.0DPTr .. 24.0 58.0 73.7 32.2 74.2
Child malnutrition (under-S) .. 145 11.4Life expectancy
TotaW yes 47 54 60 69 67 69Fenale advantage 4.4 3.7 3.3 5.3 5.9 5.9
Total ferdity te birts perwoman 6.5 53 4.7 3.1 2.9 2.9Maternal morality rae per 100,000 live births .. 430 600
Supplementary Poverty IndicatorsExpenditures on social ecurity oftotal gvwtexp. .. .. 11.6Social security coverge % n ac ive pop. .. ..
Access to safle waer tota % of pop. 34.0 41.9 463 80.0 .. 86.7Urban 81.0 75.0 77A 90.1 .. 93.9Rural 6.0 13.0 15.2 57.6 .. 66.7
Accss wo hel cuem
Population growth rate GNP per capita growth rate Development diamond'64 (anual avenge. per et ) (amual average. percnt) life expency
4 5
F -1 GNP~~~~Wl Gross2 0~~~~~~~~~~~~. pe primary
capita crUm0
-2 ~~~~~~~~~~-101970-75 1980.85 t988-93 17-5 18 989 m Dsf ae
ElBoliviaBoV- Lower-umidl-income oe-cdl-non
a. see th technial notes p.387. b. The development diamond, based on foar key indicators. shows the averag level of development in the cowntycompared wit its inewcSme rp- See the introducion.
42

Boliviameat saea ragleuicem1egroWa Next
Latest shingle yar rwenta galls Lever. higerUN& of elf lmate America uSd1. Income
indicator sinewy 197045S 195045 1955-9l Caribbean Income grONJ
Resources and ExpendituresHUMAN RESOURCESPopulation (mre=1993) thousands 4,759 5,957 7,065 466,304 1,096.665 500,507Age dependency rato ratio 0.87 0.88 0.89 0.66 0.69 0.62Urban % of pop. 41.5 50.6 58.8 71.2 54.7 71.2Population gawth rate mnmual % 2.4 2.1 2.1 2.0 1.6 1.7
Urban S 2.8 4.2 3.9 1.9 2.9 1 ALabor frce (IS-64) thousands 1.565 1.987 2,461 169.839 459.196 190,136Agriculture V of labor force 49 46Industry 20 20Female 22 24 26 27 31 29Females per 100 mules.Urbatn number 99 lo8Rural 99 t00
NATURALL RESOURCESArea thou. sq. km 3,098.58 1,098.58 1.0983S8 20,505.92 40,682.67 21,348.14Density pop. per sqk1m 4.33 5.42 6.30 22.29 26.52 22.51Agricultuwal land %orfland ama 26.82 26.33 26.63 40.00 39.61 41.26Change in agricultura land umual 0.13 -0.07 -0.10 0.39 -0.13 0.03Agricutural land under irrigation V. 0.41 0.55 0.61 3.41 12.66 8.84Forests and woodland thou. sq. km .. 0.56 0.49 9.87 5.95 8.04Deforestation (net) annual V.... 1.20INCOMEHousehold incomec
Shameof top 21%orhouschclds % of inwcm 59 .. 48Shareofbottom 40% of households -13 is 1Shaic of bottom 20% of households 4 .. 6 .
EXPENDrrUREFood %ofGDP .. 29.4Staples - .6.9 .
Meat, fish, milk, cheese. eggs - . 12.8 .
Cereal imports thou. metric tonncs 241 400 298 27,700 66.281 48.947Food aid incereals* 22 III 227 1,565 5,477 544Food production per capita 1987=100 104 100 106 101 101 102Fertilizer conisumption kgfih 0.1 0.2 035 16.1 48.0 67.8Shame of agriculture in GIDP V. of GDP 20.3 36.9 32.6 9.0 15.7 3.0Housing V.of GDP .. 9.6... Average household size persons per household.....-
UrbanFixed investment housing V.ofGODP 6. 1.2Fueleand power V.ofGDP .. 1.3 -
Encrgy consumption per capirn kgofoilequiv. 248 295 310 913 1,595 1.632Households with electricityUrban V. of households .
RualiTransport and communuication V. of DP .. .0Fixed investment tranport equipment -6.7 1.8Total mad length thou,. km 37 41 4IVESTMENT IN HUMAN CAPITALHealthPopulation pe-r physiciant PCm 2,040 1.446 ... 3,277Population per nurse * 2992 2,316 Population per hospital bed 486 .. 765 517 604 395Oral rehydyrasion therapy (under-5) % of cases ... 63 61 .S IEducationCress enmolnmnt ratioSeeondary V. ofrschool-age pop. 31 37 34 47 53 53Female U20 34 31
Pupil-teacher ratio: primary pupils per reacher 22 25 25 26 - 25Pupil-reacher ratio: secondmy 19 .
Pupils reaching grade 4 V. of cohor 52 S9Repeater ratc: primary V. of total enroll . ..
Illiteracy V. of pop. (age 15.e) .23 23 15 19 1Female 9&of fem. (age I54+) .. 36 29 18s- 17
Newspae circulation Mrhou- . 42 49 56 '5 74125woandtank Intemational Ecmonomics DepurtIFTICIt, ApriU I
43

Bosnia and Herzegovinamom Samen rf/IuAmcai vsrma mmt
zLag a6p sr meat _a. higerU.n of iiate 4 caf LOw- l,.t cse
Indleoter rgrsls I970-75 1J -5 1981-93 Aia income w
Priority Poverty IndicatorsPOVERTYUpper povety line local cum. .. ..
Headrount index a of pop. .. .. .. .. 19Lower poverty line kxad curt. .. ..
Headcount index * of pop. .. ..
GNP per capita US$ 2.450 380 1,590
SHORT TERM INCOME INDICATORSUnskilled urban wages local cwr. .. ..
Unskilled ural wagesRural tems or tade .Consumer price index 1987=100 .. .. .. .. .
Lower inconmFoot?
Urban .........aura .
SOCIAL INDICATORSPublic expenditure on basic social services S orGDP . .. .. .. _Gross emollment mdaosPuinmry % school age pop. .. .. .. .. 108 104
Male 1.. .. - 116
Female .. . _ .. 101Mortalitylnfat monraliy per thou. live births s1.0 27.0 14.6 24.8 63.1 39.0Under S mortality . .. 36.4 IOIA 615
InrunuizationMeases % ae group .. .. .. - 17.3 77.6DPr * .. .. .. B9.9 822
Child nmlnutrition (under-5) .. .. ..- 40.3Life expectancyTotal years 67 71 72 69 62 67Female advantage 43 5.5 5.6 8. 2.1 S.9
Total fertility rate births per woman 2.6 2.0 1.6 2.1 3.6 2.9Maternal mortality rate per 10D.00Dlive births .. .. .
SupplementaryPoverty l dicatosExpenditurs on social security * of toa ve .. .. _ . ..Soci security cova econ. active pop. .. _.Accesstosafewaer.ssal S.a%fpep. _ .. _ _ 67.0
Uris U .. .. .. _ 78.7Rual ' .. .. 62.0
Access to health ame
Population growth rate GNP per capita growt rate Development dimont
(amnna avea. percent) 1 (anua average, -,-i Si /
OINP Gnoss2 0 1 1 ~~~~~~~~~~~~~~~~~~~~~~~~~per - pitnuary
-2 1-101970-75 1980-85 1988-93 1970-75 1980485 1988-93 Acess to safwaer
Bosia and Herregovina Bosnia and HeesegovinaLow-income- Low-income
a Sec the technica noe p387. b.Th duopnet diamond bud owtiy inicat s ws the lvel of deveopmein the eonyrcompared with its income group. Sec the inoductin.

Bosnia and Herzegovina'Unit ~~~Laites Lqekyear recent -Eird` higher
Unk 4f ~~~~~~estimat & Cenra Low. incomelindicator meoasre 1970-75 1919-85 191-93 Agia Income grasp
Resources and ExpendituresHUMAN RESOURCFSPopulation (mru=1993) thousands 3,747 4,122 3.776 494.619 3,091,764 1,096,665Age dependency ratio ratIo 0S7 0."4 0.43 0.57 0.67 0.69Urban % of pop. 31.3 40.0 47.2 64.8 27.6 54.7Population growth rate annual lb 1.0 1.0 -4.4 0.6 1.9 1.6
Urban S3.7 3.3 -2.5 1.5 3.9 2.9Labor ror"e (15.64) thousands .... 237.99 1,442.452 459,196Agriculture lb of labor forece....IndustryFermale U .. .47 33 31Females per I100 males
Urban number...Rural
NATURAL RFSOURCESArea iou. sq. km .. 51.13 51.13 24,320.56 39,091.96 40,682.67Density pop. per sq. km .. 77.35 77.17 20.20 77.60 26M5Agricultural land lb of land area ... 38.04 .. 52.82 39.61Change in agricultural land annual % ... -17.09 -1.28 0.03 -0.13Agricultural land under irrigation lb... 0.10 7.15 18.02 12±66Forets and woodland tho. sq. km .. .0 0.02 0.30 7.15 5.95Deforestation (net) annual lb... 0.13INCOMEHousehold incomeShaeof top 20%of househiolds % orfiacoe .
Sham of bottom 40% of householdsShame of bottom 20% of households
EXPENDIT7UREFood %ofGDP . ..
StaplesMeat. rLsh. milk, cheese eggs
Cereal imports thou. miefcrtonnes . . 34A452 34,420 66.281Food aid in cereals ... . 4,392 s.33 5.477Food production per capita 1987=0 IOD.... 113 101Fertilizer consumption kg/ba ... 5.2 41.7 59.9 48.0Share Of agricultume in GDP lb of CDAW . . 13.5 26.3 15.7Housing lbofrGDP ... . 6.0Average household size persons per household... ...-
UrbanFixed investment housing lbof GDP ... . 5.2-Fuel and power % of GDP ... . 1.2 -
Energy consumnption per capita kg of oil equiv. ... . 2959 364 1.595Househiolds with electricityUrban % of households .... .-
RuralTransport and counmmnicatlsn lbof GDP . .-.
Fixed invesunent transpo equipment 10--. -
Tota road length thou. km ..-
INVESTMNTf IN HUMAN CAPITALHealthPopulation per physicin persons ... .362 .. 3.277Populafion per nurse .... 249Poptaatiou per hospita bed - .. .136 1.016 0Oral rehydyration therapy (under,5) lb of case ... .. 38EducailonGrass enrollment ratioSecondary lb of school-age pop- .. .. 41 53
Flemale 34.....
Pupil-teacher ratio: primary pupils per teacher ...... 39Pupil-teacher ratio: secondary ... .- 20Pupils reaching grade 4 % of cohort . ..
Repeater rate primary S of total enroll . ..
luliteracy % of pop. (BP l5+) ... . 11Female % of fcm (agp 15+) 53.....
Ne7prcirculation prthou-op ... 131 .. 74Boi ank Interntional Ecnmies Department, Apri 1 95
45

BotswanaMost Senme regoufincomegp Next
Laer rlfte year rent Sii i hkiherUna of esulms Sna_ aW.- 1, Income
Indiaor mEsUre 1970-75 19808S 1988-93 Afrka income group
Priority Poverty IndicatorsPOVERTYUpper poverty line local curr. .. ..
Headcount Index % of pop. .. ..
Lower poverty line local curr. .. ..
Headcount index % of pop. .. ..
GNP per capita USS 390 1,020 2790 520 1,590 4,350SHORT TERM INCOME INDICATORSUnskilled urban wages local curr. ..Unskilled mral wagesRural krms of tradeConsumer price index 1987=100 28 83 200
Lower income .. ..
Food'UrbanRural
SOCAL INDICATORSPublic expnditure on basic social servies % of GDP .. ..
Gross enrollmnct ratiosPrimary 9h scool age pop. 72 110 116 67 104 105
Mole 65 105 114 74Fueale 79 115 118 60
MortlityInfant monality per thou. live births 88.0 64.0 41.1 93.1 39.0 35.1Under S morality - .. .. S6.0 172.3 615 42.6
ImnmizationMeasles S age goup .. 6.0 .. 49.9 77.6 82.0DPT k .. 68.0 .. 519 82.2 74.2
Chdid malnuitidon (under-5) .. 27.0 .. .. ..
Life expectayTota yearn 53 59 65 52 67 69Fanale advantage ' 35 3.7 3.7 3.3 5.9 5.9
Total ferdlity rate births per woman 6.6 5.8 4.8 62 2.9 2.9Maternal motality rate per 100,000 live birhs .. 250 .. .. -.
Supplementary Poverty IndicatorsExpcnditures on soci secuLriy % of total govt ezp. .. ..
Social security coveage S% ewn. active pop. .. ..
Access to safe wate utl S or pop. 45.0 55.8 .. .. .. 86.7Urban * 9S.0 98.0 98.0 .. .. 93.9Ruml - 39.0 46.0 .. .. .. 66.7
Acess to health care .. .. S6
Population growth rate GNP per capita growth rate Deveopment diamondb(annual average. perent) l5 gD , avua percent) Li* r
4 5
GNP Urns2 - per 0priss
0. t 1, 1 lIt 1 -5 \
1970-75 1980-85 1988-93 1970-75 19B0-85 1988-93 Access to salwat
DBoswana _ Botswana- Lower-niddle-incom Lower-middle-income
a. See the technica nom p.337. b. The development dianotd, based on Fitr key indicates, shows the average l of development hi t moumycompared with its income group. See tbe introduction.
46

BotswanaMeat Sameregiil eme group Next
klAest timieyr, r_eet SibW Th WciT higherUn if of testimate Sihtsrh middle. income
Indketor mea_ure 1970&75 1980W5 1955-93 Africa income group
Resources and ExpendituresHUMAN RESOURCESPopulatian (mreu1993) thousands 759 1,077 1,401 558,978 1,096,665 S00,507Age dependency ratio ratio 1.10 0.97 0.36 0.94 0.69 0.62Urban 9bof pop. 12.0 18.8 26.1 29.8 54.7 71.2Populadon growth raile anIual % 3.5 3.5 3.2 2.9 1.6 1.7Urban " 9.7 7.5 7.1 5.0 2.9 1.8
Labor force (15-64) thousands 278 381 492 229.480 459.196 190.136Agriculture 9E of labor force 78 70Industry 8 13Female * 41 36 34 36 31 29Females per 200 males
Urban number 99 86Rural 145 137
NATURAL RESOURCESArma thou. sq. km 581.73 581.73 531.73 24,273.63 40.682.67 21,848.14Density pop.persq.km 1.30 1.85 2.33 22.37 26.52 22.51Agriculturd land %b of land arca 59.96 60.05 60.28 52.54 39.61 41.26Change in agricultural land annual 0.00 0.00 0.19 0.06 -0.13 0.08Agricultural land under irigation lb 0.00 0.01 0.01 0.83 12.66 8.84Forests and woodland thou. sq. km .. 0.15 0.14 5.32 5.95 8.04Deforstaion (net) annual % .. .. 0352INCOMEHousehold incomcSham of op 20% of households % of income 60 ..Sham of bottom 40% of households * ..Share of bottom 20% of households 2 ..
EXPENDITUREFood % of GDP .. 14.2
Staples 3 .. 6.6Meat. rish, milk. cheese, eggs p .. 4.3
Ceral imports ou. metric tonnes 24 155 133 13,157 66.281 48.947Food aid in cereals 5 39 10 5.079 5,477 54Foodproductionpercncita 19S7=lWl0 ISS 123 90 101 101 102Fertilizerconsumption kglha 0.1 0.0 0.0 4.6 48.0 67.8ShareofagriculluminGDP SofGDP 31.6 6.5 5.7 16.3 15.7 L0Housing % of GDP .. 4.7Average household size persons per household .. SA
Urban ".Fixed investment housing %ofGDP 4.6 23Fuelandpower SEofGDP .. 1.2Enugyconsumptionpercapula kgofoilequiv. 304 416 338 257 1,595 1.632liouseholds with electricity
Urban % of households .. ..
RuralTransport and communiaetion SE of GDP .. 4.3Fixed investment: transport equipment 23 4.5Total road length thou. nm 10 8 9
INVESTMENT IN HUMAN CAPITALHealthPopulation per physician pesons 7.539 6.931 5.139 .. 3,277Populaionpernurse 1.913 705Population per hospisalbed .. 423 - L269 604 395Oral rhydyration therpy (under-5) % of cases .. .. 64 37 ., 51EducationGrss enrollment ratioSecondary %ofschool-agepop. 16 31 54 is 53 53Fenale 16 33 57
Pupil-tacher ratio: prinary pupils per teadcr 33 32 29 40 .. 25Pupil-teacher ratio: secondary 21 25 20Pupil maching grade 4 % of cohort 94 96 92Repeatermta:prinpmy % oftotalenroll 3 6 5Illiteracy S ofpop.(agel5+) 59 30 26 50 19 14Female % of fem. (age 15+) .. 40 35 62 .. 17
Nwspa ciution perta o d po. 18 17 29 12 74 125World k Iniemaaonal Econonucs L)eiairnent. Apriu 1
47

BrazilMat Same reganlueame group Net
LAt single eer recent [AM U er- hiherUnk of esaueue America midde- Lucerme
Indictor mnuawe 1970-75 19045 1988-93 Caribbean Income grpalPriority Poverty Indicators
POVERTYUpper poverty line local curr. .. ..
Heudcount index % of pop. .. ..Lower poverty line lcd cure. .. ..
Hemdcount Index lb of pop. 48 26GNP per capita USS 1,170 1.580 2.930 2,930 4.350 23,680
SHORT TERM INCOME INDICATORSUnidilled urban wages loal curr. .. ...Unskilled rural wages .Rural tern of tradeConsumerprice index 19867100 0 12
Lower incomePooe
Urban I.. S 15.034.690Rural
SOCIAL INDICATORSPublic expenditure on basic social services S of GDP .. ..Gross enro nt ratiosPrilmay % school g pop. 88 101 106 107 105 103Male 89 108 .. .. .. 103Female U 87 99 .. .. .. 103
MortlityInfant mortality perthou. live births 91.0 71.0 57.0 43.0 35.8 7.0Under S mortdity .. .. 63.0 52.2 42.6 8.5
ImmunizationMeasles % age grOup .. 80.0 83.0 78.7 82.0 82.5DPF .. 67.0 75.0 73.7 74.2 90.2
Child malnutrition (under-5) - 18.4 .. 7.1 -Life expectancy
Total years 60 63 67 69 69 77Female advantage 4.6 4.6 4.7 5.3 5.9 6A
Total ferility rate birthspcrwoman 4.7 3.7 2.8 3.1 2.9 1.7Matcrnal mortality mte per 100,000 lire births -.. 1..
Supplementar Pove Indicaors
Expenditus on social security % of ta govt exp. 50.0 20.7 27.7Social security covemge * econ. active pop. .. ..Access to safe water total % of pop. 55.0 753 961 8.0 86.1
Urban 87.0 85.0 99.8 90.1 93.9Ruml 28.0 53.0 85.7 57.6 66.7
Access to heath cuae t .. .. _...
Population growth rate GNP per capita growth rate Development diamonde(annual average. percent) I p vu avage percent) Likc _
4 -- 5
CONPOn
-2 ~~~ ~
1970-7S 1980-85 1988-93 1970-75 1980-85 1988-93 Access to sde waer
1 Brazil _ BrailUpper-middleincome - Upper-middle-income
a. See die tchnial note. p3 87. b. The devlopmenA diondo baud on four key indicaus, shows the average level of development in the countrycompared with its income group. See the intodudction.
4B

BrazilMai Saurulenlncmgrap Nut
Lutesfaiqiywr recnt LaI" Uppr higerU.kitf atm ate Anerit sMil- lawes
luiskalar unsure .19701.75 1959-8 1955-93 Cariben Incomne gropResources and Expenditures
HUMAN RESOURCESPopulation (rurem1l"3) ftousands 108.032 135.042 156.486 466,304 500.507 912.447Age dependenc mato rato 0.78 0.68 0.62 0.66 0.62 0.49Urban %hof pop. 61.2 70.6 70.8 71.2 71.2 77.9Populoilon growth rate annual 1' 2.4 2.2 1.8 2.0 1.7 0.6
Urban 4.2 3.4 0.0 1.9 i.8 0.8Labor force (15-64) thotsands 37.492 49.642 58.694 169,939 190.136 395.641Agriculture Soflaborfom 38 31Industry 24 27Female 24 27 28 27 2 38Females per 1 00 rmles
Urban number 110 105Rurl 93 903
NATURAL RESOURCESAmea thou.sq.km 8,511.97 8,511.97 9.51t1.97 20,505.92 21,348.14 32,146.15Density pop. per sq. km 12.69 15.96 18.05 22.29 22.51 25.11IAgriculturaliland %bofland amu 24.24 27.21 29.07 40.00 41.26 42.80Chang in agrcultura land annual % 1.69 0.13 0.94 0.39 0.03 -0.48Agricultural land under irrigaton 5 0.54 0.9 1 1.14 3.41 3.84 13.96Fortas and woodland tho. sq. kin .. 5.98 5.61 9.87 8.04 10.56Derorestation (net) mnusal % .. 0.63...
INCOMECHousehold incomeSham of top 20% of households of inconie 62 63 69Shaoe of bottom 40% ofhiouseholds 9 a 7Share of bottom 20% of househods 3 2 2
qmrmFood %oIfGDP 24.2 26.1 ...- 8.4
Staples 6.0 66...-1.6Meat, fish, milk, cheese, eggp 9.9 10.3 . - 3.8
Cereal impotpn thou. metric tonWs 2Z244 4.857 7.848 27.700 48.947 77,530Food aid in enmals 3 1 10 I1I 1,565 544 3Food production per capita 1987=100 85 100 105 101 102 95
F~Jizr consumption kgfh 9.7 13.9 14.6 16.1 6738 ISM.Shamcof agrictnc in GDP % OfGDP 10.7 10-5 9.6 9.0 2.0Homing %orGDP 7.6 7.6 t . . 1.Average household size persons per household 4.8 4.2
Urbza * 4.6 4.1Fixed investmen housing S of GDP 2.6 2.6 ... .5.0
Fuel and power S ofGDP 219 1.2 2.. . 0Energy consumiption percapita, kg or'oiequiv. :506 602 666 913 1.632 5203Households wit electricity
Urban Sof housceholds .. 83Rural
Transport and counnuncatlon Sof ODP 7.3 5.7 .... 8.8Fecd itnvesur fraport equipinn 2 6 1.9 ... .2.1
Tota road length thou. kin 1.489 1,438 1,670DCifltMENTIN mmb wCAPIAHealthPopulation per physician persons 1.600 681 ... .453
Populaton pernurse *2.322 1,201Popultion per hospita bed -200 .. 300 s17 395 145iOral rehydyration ftheap (under-5) S of case .. 63 61 51EducatonGross enrollment ratioSecondary % of schol-ag pop. 26 36 39 47 53 92
Female H28 41 ... .94
Puid-teacier ratio: pimary pupils per teacer 22 24 23 26 25Pupil-teacherratio: secondary S15 . .*
Pupllreaching grade 4 %ofooon54 46 .
Repeatur atprim"ax %oftotaenroll Is 20Eitemeay % ofpop. (magelS) 34 22 19 1 1.4
Female %ofibflL(Ogel5+) .. 23 20 i8 17Ne7peroiruhatiom pe dxOIL 9M. 39 48 55 8s 125 320
Wol lMInurnanona E4conomics lkpmrtCMe APM1 1 5
49

BrunetMeNg Same reglaunuoma group
Leastringle year reentUnit of anmate Wflk-
hIdkcJr measure 1970-7S 198945 198J93 income
Priority Povery IndicatorsPOVERTYUpper povety ne local curt.
Headcount index % of pop.Lower povety line locl courr.
Headcount index * of pop.GNPpercapita US$ .. .. .. 23.680
SHORT TERM INCOME INDICATORSUnskilled urba wages local curr. .. .Unskilled rura wagesRurnl terms of tradeConsumer prcc index 1987=100Lowerincome
Urban .. 9S 103Rural
SOCIAL INDICATORSPublic expenditure on basi social services % of GDPGross enrolment mtiosPrimay % school age pop. .. .. 113 103
Male .. .. 118 103Femuale.. .. 107 103
Mortlitylnfantmoxiy perthou.livebirths 54.0 14.0 8.0 7.0Unda S mortality - - .. 8.5
ImnmuizationMeasles % age group .. 98.0 100.0 82.5DPr .. .0 91.0 90.2
Child malutition (under-S)Ufe expeacyTotal yeas 68 72 75 77Femae advantage 3.0 3S 3.8 6.4
Total fertilty rate birtis per woman 5.4 3.B 3.0 1.7Maternal mortality raft per 100.000 live births
Supplementary Poverty IndicatorsExpenditures on social security of total govtexp..Sodal scurity coverg % ccn active pop.Access to safe wate toal * of pop.
Urban .. IC0.0Rural .. 95.0
Access to badth care .. 96.0 _
Population growth rate GNP per capita growth rate Development diamontb(annal averag. percent) (annual avege, pect)
4 -5
per -dar2 Ocait a_ P< It0
-2 -101970-75 1980-85 1988-93 1970-75 1980-5 19B8-93 I wt
L] Bmnei _ unci- High-income - Igb-income
a. See thetchnical notes. p.387. b. The developmet di nd based on four key indicat sw the avea le of devlopmt in de countycompaed with its income grop. See the inrbducdon.
50

BruneiMWJe Saea nwe /lnceme group
atralukayear r,eusUR& of atimae High.
Indicator meant. J970-75 ]95045 195f93 cneunResoures and Expenditures
HUMAN RESOURCESPopulation (mre.1953) thousands 161 226 273 812,447Age dependency atIo ntlo 0.77 0.67 0.61 0.49Urban % of pop. 62.0 57.7 57.8 77.9Population growth rate annual * 43 3.2 2.1 0.6
Urban " 4A 2.4 2.1 0.8Labor force (15-4 thousnds 67 95 110 395,641Agricullure Ii of labor forceIndustryFemale 36 36 35 38Females per 100 males
Urban numberRural
NATURAL RESOURCESArcn thou. sq. krm 5.77 5.77 5.77 32.146.15Dcnsity pop. persq. km 27.90 39.17 46.42 25.11Aguiculural lad % or land arc 3.23 2.47 2.47 42.80Change in agnicultural land annual % -5.56 0.00 0.00 -0.48Aguiculturl lan under irrigation % .. 7.69 7.69 13.96Fornsts and woodland thou. sq. km .. 000 0.00 1056Deforesution [ne) annual% .. .. 0.39
INCOMEHousehold incomeShue of top 20% of houscholds * of incomeShau of bottom 40% of householdsShare of bottom 20% of households
EXPENDITUREFood % of GDP .. .. .. 8A
Staples .. .. .. 1.6Meatl rash milk, cheesc, eggs .. .. .. 3.8
Ceral imports thou. metric tomes 14 34 35 77,530Food aid in cereals .. .. .. 8Foodproduectionpercapita 1907=100 1W7 130 81 95Fertilizer consumption ma .. 68.9 230.8 150.0Shame oragriculture in GDP % of GDP IA 1.2 2.6Housing %ofGDP .. .. .. 11.7Average household size pernms per household 5.8 .. .
Urban 5 S.8 .. .Fixed investment: housing % of GDP .. .. .. 5.0Fuel and poer S of GDP .. .. . 2.0Energy consumption per capita kgoroilequiv. 1.1 9A425 7.687 5,203Households with eectricity
Urban %of households .. .. .Rural
Trnsport and c _mmuniadon % of GDP .. .. . 8.8Fixcd investment: transportequipment ". .. .. 2.1Total road lenglh thou. km 1INVESTMENT IN HUMAN CAPITALHealthlPopulation per physician persons 3.333 1,898 .. 453Population per nurse 532 273 _ .
Populadon per hospial bed 28S 334 _ 145Oral rehydyration therapy (undcr-5) S of cases .. .. .
EdnetlenGss enrollment ratioSecondary % of school-e pop. .. .. _ 92
Female .. .. 94Pupil-teacrratio: primary pupils per eaher 19 IS 16Pupil-teacher ratio: secondway 20 12 13Pupils reaching grade 4 %of cohort .. 94 _Repewerrawe pmary SOftatalenroll 8 10 .Akliecy S%ofpop.(Bge 15+) 36 22 _Falde % of fcm (BPg15f .. - - .
Newspapercircation per OL pop. 48 __ 75 320world Mank IMtenaafonal Ecoonomcs Department. Apg 195
5'

BulgariaMest Sle. waa omeuugroup Next
Latest loglyear meft lrupe LufW highuerUnkitf I ntAae & Cenai middle- liseunm
lndiMor nmare 197e-75 JPSOJS 195143 Asia income growp
Priority Poverty Indicators}"ovmnUpper poverty line local curr. .. ..
Hendeount index S of pop. .. ..
Lowerpovarty line local curr. .. ..
Headcount index % of pop. .. ..
GNPpercapita USS .. 1.990 1,140 2.450 1,590 4,350
SHORT TERM INCOME INDICATORSUnedilled urban wages local curr. .. ..
UnuWlled ral wages N
Rura termr of tradeConsumer price index 1937=100 .. .0Lower incone
Food' .. 96 424UrbianRural
SOCIAL INDICATORSPublik expenditure on basic social services % of GDP .. .. 63Grss enrollment ratiosPrinay $ scbool age pop. 99 102 90 .. 104 105
Male 99 103 91Female " 99 102 88
MornaityInfant motality per thou. live births 26.0 18.0 14.0 24.8 39.0 35.8Under 5 morlity 3 .. .. 19.0 36.4 61.5 42.6
ImmunizationMasles % age group .. 99.0 97.0 .. 77.6 82.0DPI .. 99.0 99.0 .. 822 74.2
Child malnutrition (under-5)life expectancyTotal years 71 71 71 69 67 69Femle advantage 5.2 S.B 7.1 8.8 5.9 5.9
Totd femlity rte births prwoman 2.2 2.0 1.5 2.1 2.9 2.9Maternal moralily rme per 100,000 live births .. 22 .. .. ..
Supplementary Poverty IndicatorsExpenditures on modal security S% total govtexp. .. .. 32.4Social security coveage % econ. active po .. .. .. .. ..
Acces to safe water tota % of pop. .. .. 100.0 .. .. 86.7Urban n .. .. 100.0 .. .. 93.9Rural ". .. 100.0 .. .. 66.7
Accms to helth c N .. 10.0 100.0
Population growth rate GNP per capita growth rate Development diamondb(anua aveuaug, percent) 1 - (mal average, Lt) life expectacy
45
GNP Grass2 ~~~~~~~~~~~~~ 0 ~~~~~~~~~~~Per - pin=ry
capita enrollment
-2 -- 101970-75 1980-85 1998-93 1970-75 1980-85 1988-93
1 Bulgada BulgariaLower-middceincome lO-m iddlcfi
a. See the technical notes. p387. b. The devdopment diamond based on four key indkao, shows the average level of development ia the counycomprd with its income group. See he iroduction.
52

BulgariaMeat Same Nqlaeu/nca om p Next
Laiad singe ja p racist i-- riCflwe,' lgberlnin Ouf estimafe & Central middle- Income
Jadkwar mature IflO-75 195985 11188.98 Ari. income
Resources and ExpendituresHUMAN RESOURCESPopulation (snreul993) thousands 8,722 8,960 8.870 494,619 1.096,665 500,507Age dependency rati Mailo 0,49 0.48 0.49 0.57 0.69 0.62UIxhn % or pop. 57.5 64.5 69.5 64.8 54.7 71.2Population growth rate annual 5, 0.5 0.2 -0.4 0.6 1.6 1.7
Urban N2.5 1.3 0.5 1.5 2.9 1.8Labor force (15464) thousands 4,496 4,483 4,500 237.897 459,196 190,136Agriculture Sr of labor rorc 27 lB8Industry U42 45Female 46 46 47 47 3 1 29Females per 1 00 untes
Urbain number 96 10OD.Rural 10lO I0D
NATURAL RESOURCESArea thou. sq. km 110.91 110.91 110.91 24,320.56 40,682.67 21,848.14Density pop. per sq. kmn 78.64 50.79 80.26 20.20 26.52 22.51Agricultural land Sr of land arca 53.87 55.80 55.67 .. 39.61 41.26Change inagricultumal land annualS, -1.37 -0.05 .0.11 -1.28 -0.13 0.08Agricultural land under inigazion Sr 18.94 19.92 20.10 7.15 12.66 8.84Foress and woodland thou. sq. km .. 0.04 0.04 0.80 5.95 8.04Deforestation (net) annual % ... -0.22INCOMEHousehold inowme
Shamrorftop 20%of households % of incone . . 36Share or' bottomn 40% of households ... 24Share of bottom 20% of horscholds ... 10
EXPENDffUREFood %ofGDP ... 17.0staples ... .EMeal, fish, milk, cheese, eggs ... 8.2
Cerea imports thou. muetric:onnes 665 1,792 2.41 34,452 66,281 48,947Food aid in cereas N... 200 4,392 5,477 544Food produclion per capita 1987= 100 95 92 75 .. 101 102Fertilizer consumption kglha 114.0 140.1 46.7 41.7 48.0 67.3Sham ofagriculwmrin CDfP %ofGDP .. 11.9 13.0 13.5 15.7 8.0Housin %ofODP ... 6.7 6.0Avemr-g household size persns per housebold 3.1......
Urban N3.0......
Fixed investment housing gb of GDP . .1152.
Fadland power % ofGDP ... 1.8 1.2Energy consamption per capita kg of oil equriv. 2Z662 3,410 1,954 2.959 1,595 1,632Households with electricityUrban Sr of househoklds..Rural
Transport and cmnundcation %orGDP ... 7.0Fixed investment transport equpmen 2.7Toa road length thou. km .. 38 37 .
INVESTMIENT IN HUVMA CAPITALHeathPopulator per physiciant perwns 537 276 318 362 3,277PopldWon per nurse U239 155 .. 249-PopulationperhIspitalbed -129 90 104 136 604 395Oral rehydyration therapy (under-5) Sr Of cae .. .. .51
EducatonGross enrviluient ratioSecondar Sr of' school-age pop. 89 102 71 .. 3 53Faule .- 102 73
Pupil-teacher ratio: primary pu,pils per teche 20 1 8 14 ... 25Pupil-teache rfito: secondary 13 17 13Pupils xeadhing grade 4 % Of cohort 96 95 95Repeater mte:primnay % Of tDtalcnrU 2 2 3litraMcy Sr of pop. (age 15+) ...- 519 14"Female Sr of far. (aeV 15+) - ..-. .17
NEw arhup 232 293 164 .. 74 125
53

Burkina FasoMiSnt ,higherfink~ ~ - ritsege Mealw Same relm/le.n rSi Ygen
uN kV Rr oraenman Saharoa Laow lnemeIndkiAlor _mian 197117s IPOMS 1M5.9.Y AI ee lnerne rO-p
Prlority Poverty IndicatorsPOVERTYUpper poverty line local curr. .. ..
HadboLml Index % ot pop, 19Lower povny lin local curr. .. .. ..
Headcount Index of pop. .. .. .. ..
GNP per ampita USS 120 160 300 520 380 1,590SHORT TERM INCOME INDICATORSUnhkilld urban wage local curr. .. .Unskilled rural w,Rurnl terns of tradeConsuner price Index 1987100 43 106 104
Lower Income ".FoodsUrbanRural .. .. .. ...
SOCAL INDICATORSPubli expeandlturo on but social svices 9 of ODP .. ,. 9.5amss enailment tiosPrimary * scBhol Be pop. 16 29 31 67 108 104Male 21 36 37 74 116Fenaie 2 2 21 24 60 101
MoralityInfnt moradity pertldou. liv births 173.0 149.0 128.6 93.1 63.1 39.0Under 5 mortaity " .. .. 175.0 172.3 101.4 61.5
ImmnizatinMasles S BP group .. 38.0 42.0 49.9 37.3 77.6DP' .. 2.0 37.0 51.9 39.9 82.2
Child malnutition (unde-S) *. ,, ., ,. 40.3Life expctncyTotal years 41 45 47 52 62 67Female advantag ' 3.1 3.3 3.1 3.3 2.1 5.9
Total ferdliy rate birhs per woman 6.4 6.5 6.4 6.2 3.6 2.9Matenal motlity rate per 100,000 live births .. 600
Supplementary Poverty IndicatorsExpenditures on social ocurity % of total gov't uxp. 6.0 6.7Social uity covege eco. active pop. .. ..
Access to safe water otal %of pop. 25.0 67.0 67.3 .. 67.0Urban 5.0 43.0 43.9 .. 78.7RuraD 23.0 69.0 71.9 .. 62.0
Acess to healthre a.. 70.0
Population growth rate GNP per capita growth rate Development diamondb(a nual avemget percent) aKy
4 5
GNP (boGs
capita enolmenrt0 ~ ~ ~ ~ - r Tt 1 ,17-7 93-5 1989
-2 -101970-75 1980-SS 198-93 1970-75 1930-B5 1988-93 Accesstos water
Jl Burkina Paso- Low-in4ome Low-i ncon
a See tdh technical nos, p387. b. Thc dcvdopmuem diamond based on four key indicaus, shows the average evel of development in the countyompaed with is income grup. See the intamduction.
54

Burkina FasoMen Sum. real. Wblam.. groupI Nea
Lwamingle y" rout SW higherflail of asSoe. ISuumaN LOW. Enemae
indicaor manure 1flh175 1iS8S .135.93 Africa income groU
Resource and ExpendituresHUMAN RESOURCES"opulatlon (mreu1993) thousnndrs 6,202 7,979 9.772 558.978 3,091.764 1.096.665Age dependency utile nude 0.89 0.81 0.91 0.94 0.67 0.69Urban % of pop. 6.3 I1IA 23.5 29.8 27.6 54.7Population growth rate animal lb 2.2 2.5 2.9 2.9 1.9 1.6
Urban *4.1 7.7 11.1 5.0 3.9 2.9Labor force (15.64) thousands 3,111 3.765 4.442 229,480 1,442.452 459.196Agriculturc % of abor rorco 97 87Industry 4 4 4 ~3 1Fealent 48 47463331Funnies per 100 miales
Urban number 94 .
Rural *110 .
NATURAL RESOUREArea fthu. sq. km 274.00 274.00 274.00 24,273.63 39.09 1.96 40A612.67Density pop. par sq. km 22.64 21176 34.66 22.37 77.60 26.52Agricultural land lb of land ama 45.92 47.64 49.57 52.54 52.82 39.61Change in agricultural land annual lb 0.67 0.39 0.00 0.06 0.03 40.13Agricultural land under inrigaton lb 0.06 0.09 0.18 0.83 18.02 12.66Foacsls and woodland thou. sq. km n 0,05 0.04 5.32 7.15 5.95Deforestation (net) annual lb... 0.69INCOMEHousehold income
Shame of top 20% of households lb of incom . .
Share of bottom 40% of householdsShame Of bottom 20% of households
EXPENDITUREFood %orGDP ... 35.7
Staples ... 13.9Meat. Cash, milk, cluces., egg .. 14.6
Cereal irnports thou. nmeuictonnes 26 205 121 13,157 34.420 66281Food aid in cereals 28 128 30 5,079 8.34 5,477Fo podpwduion per capisa 1987=100 91 103 110 101 113 101Fertilizer consumption kg/h 0.1 0.9 1.6 4.6 59.9 48.0Share of agriculture in GDP lbor GDP 37.5 42.4 41.6 163 263 15.7Housing lbofrGDP ... 15.2Average bousehold size pemoms par household...Urban
Fixed investnrmnt: housing lbof GDP...35Fuel and power %of GDP ... 11.7Energy consumption per capita kg of oil equiv. 121 1 6 257 364 1.595Households with electricity
Urban lb of housholds...Rural
Transport and communIatIon lb f GDP ... 15.0 Fixed investent transpost equipnent U . .. 2Totalnmadlength dthoukm 17 9 1 INVESTMENT IN HUMAN CAPITALHealthPopulation per phaysiciux vemnos 95.690 57.22.4 57.213... 3,277Population per auuse 3.999 1.684 1.679Population par hospital bed 1,724 .. 3.38 1.2 1,016 604Oral rehydyration therapy (under-5) lb of eases ... 15 37 38EducationGros enrollmnt ratioScOnm j'W % of sehol-agepop. 2 5 8 I8 41 53
Female 1 3 5 .. 34Pupil-teacher ratio: priunay Pupils Par teacher 47 58 60 40 39Pupil-teaher ratio: secondary 23 23 39 .. 20Pupilsztaching gmde 4 lbOf cohort 72 92 87Repeaterratepriaar %Of towalearoil 17 14 17 -
Illitercy % of pop. (agelIS+) 91 96 82 5041 19Fcmale % of fbm. (BP 5+) .. 94 91 62 53
Newsw circulation pe tbomLJr. 0 1 0 12 .. 74
55

BurundiMost Sr. rgoIncome grou Next
at singe Wyear recent 3- higherUnit Oe ulnge Sebhn m Low Income
Indiaor meaure 1970-75 IJJ85 198893 Afria Income groupPriority Poverty Indicators
POVERTYUpper poverty line local cur. .. ..
Headcount Index S of pop. .. .. ,. ., 19Lower poverty line local cuo. ..Headcount Indext S of pop. .. ..
GNPpercapita USS 110 240 180 520 380 1,590SHORT TERM INCOME INDICATORSUnskilled urban wages Ic curr. .. ..
Unskilled rnun wagesRural temis of tradeConsurer price index 1987=100 30 92 156Lower incoe"Food 22 109 145UrbanRurl.
SOCIAL INDICATORSPublic expenditure on basic soaal services % ofrGDP .. .. 7.9Gross enrollment ratiosPrimary % school age pop. 22 53 69 67 108 104Male * 28 62 76 74 116Female 17 44 62 60 101
MortalityInfant mortlity per tho. live births 137.0 117.0 100.8 93.1 63.1 39.0Under 5 mortality .. .. 178.0 172.3 101.4 61.5
InunmnizationMeasles age group .. 42.0 7S.0 499 87.3 77.6DPI' * .. 38.0 83.0 51.9 89.9 822
Child malnutrition (under-5) * .. .. 40.3Life expetancyTotal ya 44 48 S0 52 62 67Female advantage * 3.2 3.4 3.5 3.3 2.1 5.9
Total ferHtili re births per woman 6.8 6.8 6.7 6.2 3.6 2.9_atcmml mortdity mi per 100,000 live births
Supplementary Povert IndicatorsExpnditures on social seurity 9 of total gov't exp. 1.5 ..
Social secmty coverage $ econ. acdve pop. .. ..
Acss to safe watew total S of pop. .. 25.6 37.8 .. 67.0..Urban * 77.0 9B.0 99.9 .. 78.7Rural .. 22.0 33.9 .. 62.0
Acces to helth care .. 45.3 80.0
Population growth rate GNP per capita growth rate Development diamondb(annual avee. pcn Iudav p=ent) life exp a
4 -- 5 0- .
0r.~~~~~ri77~~~~* O~NP Gros2 ~~~~~~~~~~~~~~~~~~~~~~~~~~~L ------ J per pnu
m | | l l l l l l I -5- capita enromclnent
-2 -101970-75 1980-85 1988-93 1970-75 1980-85 1988-93 Aatosafe watu
[ Burundi - Burndi- Low-incomc LoW-income
a. Se the technical oes, p.387. h The dcrelopment dianond. baed an four kcy indicatos, shows the average level of devclopmaet in the comuycmpared with its income gruap. See the indcion.
56
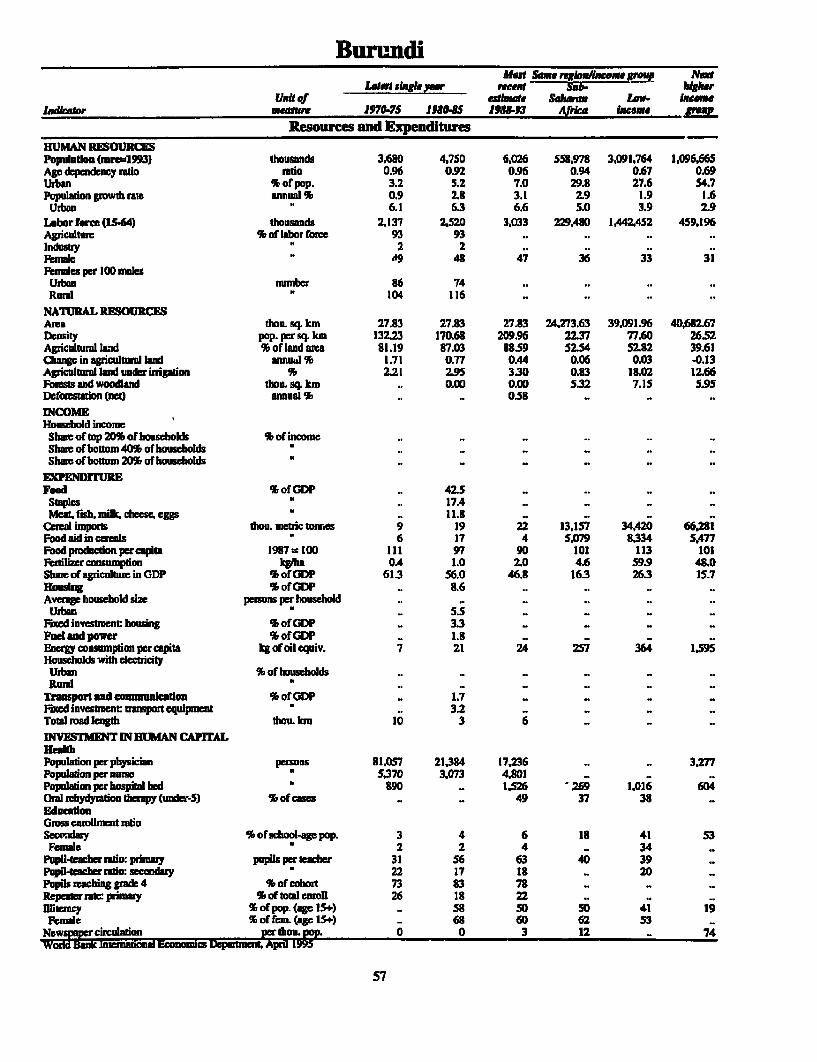
BurundiMat Sme. uwln /aemegrmwp Net
IS iqak Pear recent -5 V h4gkmrV.Ut of slms. SalWmr Law Inane
JgrdedJr woeaur. 1970-75 19JU895 98W13 Arrica hme VnWf p
Resources and ExpendituresHUMAN RESOURCESPopulationm OnremS3) thousands 3,680 4,750 6,026 558,978 3,091,764 1.096,665Ago depmndeocy rtio rtio 0.96 (092 0.96 0.94 0.67 0.69Urban * of pop. 3.2 5.2 7.0 29.8 27.6 54.7Populadon growthrae annualS 0.9 2.8 3.1 2.9 1.9 1.6
Urban 6.1 6.3 6.6 5.0 3.9 2.9Labor force (1S564) thousands 2.137 2.520 3.033 229A.40 1.442452 459,196Agriculture % of labor force 93 93Industy 2 2Fannie 49 43 47 36 33 31fencs per 100 mals
Urban number 86 74Ruorl 104 116
NATURAL RESOURCESArea thou. sq. km 27.83 27.83 27.83 24,273.63 39.091.96 40,632.67Densiy pop. per sq. km 132.23 170.68 209.96 22.37 77.60 26.52Agriculmuri land % o land area 81.19 87.03 88.59 52.54 52.82 39.61Change in agzicultum land nnuJal 1.71 0.77 0.44 0.06 0.03 -0.13Agricultumal land under iridgation * 2.21 2.95 330 0.83 18.02 12.66Forests and woodlnd thou. sq. km .. 0.OD O.W 5.32 7.15 5.95Defwestadon (net) annual S .. .. 0.58
INCOMEHousehold incomeShue of top 20* of housIhokls * of inoDme .. .. .. .
Shae of bottom 40% of households .Sham of bottom 20% of households
Feed % of CD .. 42.5 . . .Staples .. 17A4Mat, f milk chesegsp .. 11.8 ..
ceea imports thou. metric tonrges 9 19 22 13,157 34,420 66,281Food aid in ceals 6 17 4 5,079 3334 5,477Foodproducdonpercapita 1987 100 111 97 90 101 113 101Fadlizer conumption kgha 04 1.0 2.0 4.6 59.9 48.0Shnmofagrcultu.rinGDP %ofGDP 61.3 56.0 46.8 16.3 26.3 15.7Housing % of GDP .. 8.6 .. .. -
A g bhsold size perons per houseold .. _Urban .. 55 .. .. .. _
Plxed investten hons % of GDP 3.3 .. . ..
Fe and pwer %ofGDP - 1.8 .. - - -
EBaM consumptionpercapita kg of oil equiv. 7 21 24 257 364 1.595Households with electicityUrban S of households - -
Rud .Transport and cunmualaon S%ofCD? .. 1.7 .. . _Fixed invesbment truspart equipment - - 3.2 .. .Total road lngth thou. km 10 3 6
NESnET INHUMAN CApiTALHealthPopuon per physician pesons 81,057 21.34 17,236 .. 3,277Population per nurs " 5370 3.073 4,801Pop ion per hospital bed K 390 - 1.5269 1.016 604Oml ebydyraion thra (under-5) % of cases .. - 49 37 38EdincalGross enm llm n mratioSeCOPday % ofshool-ag pop. 3 4 6 18 41 S3
Fmndle K 2 2 4 .. 34pupil-teacher mro: prim pupils pe memher 31 56 63 40 39Pupilteclerratw. secoday 22 17 18 .. 20Pupils wbig ggrade 4 % of cohort 73 3 78 .. -Repaerratepiinaimy %oftowenoll 26 18 22ilitracy % of pop. (age 154) - 58 50 SO 41 19RNae * of fn, (agel 1S) - 68 60 62 53
Newspap ciruaion per ho. pop. 0 0 3 12 - 74word sanii intennalmd EconomiCr Departmen AprIl I9s
57

CambodiaHJost Sane region/Incomegroup Next
Laest single yer recent higherUna of esti e East Low- income
Indkator _masure IPYU-75 1951S J5985-93 Asia income RFOUP
Priority Poverty IndicatorsPOVERTYUpper poverty line local curr. .. ..
Headcountlindx %ofpop. .. .. .. I2 19Lower poveny line locai curr. .. ..c
Headccount index * of pop. .. .. .. 9GNP per capila US$ .. .. .. 820 380 1.590
SHORT TERM INCOME WDICATORSUnskilled urban wages local curm. .. ..
Unsilld mnal wagesRural wurms of tradeConsumer price index 19S7=lW .. ..
Lower incomeFood~UrbanRural
SOCIAL INDICATORSPublic expenditure on basic socidl serces % of GDP .. .. U2Gross enrolment ntiosPrimary %schBolagepop. 42 .. .. li1 108 104
Mai e 48 .. .. 123 116Femal 35 .. .. 115 101
MortaityInfantnmoutdity pertor.lUvebirths 181.0 160.0 1132 35.5 63.1 39.0UnderS mortlity .. .. 181.0 60.5 1OIA 61.5
lmmuniadonMeales % age grop . .. 33.0 93.0 87.3 77.6DPr .. .. 38.0 95.0 89.9 32.2
Child malnutrition (nder-5) .. 20.0 *- 24.1 40.3Life epecancyTotal years 40 46 52 68 62 67Feime advantag 2.7 2.8 2.8 3.6 2.1 5.9
Tol fertiiy rare births per woman 5.5 5.1 52 23 3.6 2.9Marnal nmorlity rae per 100,000 live births .. 500 90D 116
Supplementary Poverty IndicatorsExpendite an social security of total govtexp. .. ..
Social security covere % o. acve pop. - ..
Access osafewater total %ofpop. 45.0 .. .. 67.1 67.0Urban t 97.0 .. 20.0 83.5 78.7Rumrl 38.0 .. 12.0 61.3 62.0
Access to health car
Population growth rate GNP per capita growth rate Development diamondb(annul averg p e (annud avee. p cn) exct
45
2 GAmkK] 0 2 9 9 O- <~~~~~~~~~~~~~~~~~~ I ~~~per 1- 1 pnimwq
0 r1 Iu Ii .5
-2 -101970.75 1980-85 1938-93 1970-75 1980-85 1983-93 Access to safe water
l mbodia _ Cmbodia- Low-income Low-income
a. See the echnical noes p.387. b. The devdopmen diond based on four y inicat sbows the average levcl of dwevpment in the countycompared with its incow group. See ft inttiooL
58

CambodiaMast &uen ge e nigreap Nc
Indicator Link of L~~~~~~ade s.ingfie per reZZ higherunit qf o^tme FAs Low. oame111,11cator mQan,t 1e970-7 1980-85 1980-93 Asia income group
Resources and ExpendituresHUMAN RESOURCESPopulaton (mre1993) thousandrs 7,098 7,562 9.6S3 1,713.813 3.091.764 1,096,665Ago dependeny mtio radIo 0.80 0.77 0.17 0.54 0.67 0.69Urban % of pop. 10.3 14.8 19.5 31.3 27.6 54.7Populadon growth rate annual % 0.5 3.0 3.2 1.4 1.9 1.6
Urban -2.2 63 6.4 4.0 3.9 2.9Labor force (15.64) thousands 3,205 3.602 3.821 942.977 1.442,452 459,196Agricultur % of labor hrce 76 74 ..Industry " 5 7 .. ., 3 .
Female 41 41Fernales air 100 males
Urban number .. ..Ruml .. ..
NATURAL RESOURCESArea thou. sq. kin 181.04 181.04 131.04 16.367.91 39,091.96 40.682.67DenLsity pop. persq, kmn 39.21 41.77 51.11 103.27 77.60 26.52Agricultural land %of land ar 15.18 13.60 24.93 44.21 52.82 39.61Change in agriculturaland annual % 0.00 13.74 4.76 0.24 0.03 -. 13Agricultural land under irrigation % 3.32 3.7S 2.14 14.68 18.02 12.66Foests and woodland thou. sq. km .. 0.13 0.12 4.06 7.15 5.95Dedoesnation (net) annual % .. .. 1.02INCOMEHousehold incomcSham of top 20% of housholds I of incomne .. .. .. ..
Share of bottom 40% of households r .
Shae of bottom 20% of householdsEXIENDIURFood S of GDP .. 19.8Staples .. .. 3.6 ..Meal, fish, milk, cheese, eggs .. .. 89 ..
Ccal imports thou. metric tonnes 112 55 106 30.036 34.420 66.281Food aid in cereals 226 27 82 447 8.334 5.477Foodproductionpercapita 1987=100 77 102 113 I1S 113 101Fertilizer consumption kglha 00 0.8 1.5 76.4 59.9 48.0ShareofagriculturcinGDP % ofGDP .. .. 47.3 17.1 26.3 15.7Housing * ofGDP .. .. 4.7Averagc household size persons per houschold .. .. 5.5Urban n .. 6.1 .. ..
Fxed investnent housing % ofGDP .. .. 4.9Fuel and power %ofGDP .. .. 1.0 .. ..
Energy consumption per capita kg of oil equiv. 54 56 52 632 364 1,595Households with electricityUrban * of households .. .. .. ..
Rural .. .. ..Transport and conununcatbon % of GDP .. 6.2 .. ..
FLxed investment: transpot equipment * .. .. 103 ..
Total road length thou. km . ..
InVFSTMhNd IN HUMAN CAPITALHealthPopulation per physician persons 16248 16.667 9W523 1.063 .. 3.277Population pernurse * 1376 .. 1,251 1.490 .. .
Population per hospital bed 925 *- 491 612 1,016 604Oral ithydyration therapy (undcr-S) % of cases .. .. 6 32 38EducatIonGross nrollmcnt ratioSecondary % of shol-agc pop. 10 .. .. 53 41 53
Female 6 47 34Pupil-teacher ratio: prinary pupils per teacher 24 .. 23 39 .Pupil-acher tio: seconday 39 .. .. 16 20Pupils reaching grade 4 % of cohort .. .. .. 92 ..
Repeater rnim primary %I of total Oll . .. 6 - -Uiteracy % of pop. (agc 15+) .. 71 38 22 41 19
Female of fem. (ag IS+) .. 83 51 36 53Nesapecireul,fion pe thou. po.10 .. .. - 74World Bank Intemabonal Econoiecs Lepartment April 1995
59

CameroonNest Sam. rq wceuee gre! , Ne
Latex flugle year rees h'S- Lever- AlsgAerChb i Of aenmte Saes mi"1le ineone
Indur maur J.7075 19J S 19J43 Afrka bhewn, groap
Priority Poverty IndicatorsPOVERlYUpp povty line locut sum. Headeount Indea % of pop. .. ..
Lower povAly line local curr. .. ..
Headcoumt index % of pop. .. .. .. ..
GNP per capita USS 340 800 820 52D 1,590 4,350SHORT TERM INCOME INDICATORSUnsilled urban wages local curt. .. ..Unstlled nuata wages 3500Rural ten.s of tnde .. ..
Consumerprinc index 1987=100 27 82 lOSLower incomceNote
Urban . 93 93Real
SOCIAL INDICATORSPublic expenditume on basic social services * of GDP .. ..Gass enmioment ratiosPrimay % scbool age pop. 97 102 101 67 104 105Male 108 110 109 74Fcmale 87 93 93 60
MortalityInfant morality per thou.live births 119.0 88.0 61.4 93.1 39.0 35.8UnderS motality .. .. 113.0 1723 61.S 42.6
IhmmnizulionMcasles % aBe group .. 47.0 56.0 49.9 77.6 82.0Dfrr 50.0 56.0 51.9 82.2 74.2
Child mahumidoin (under-S) .. .. 13.6l.XeaexpctancyTotal yeas 46 51 56 52 67 69Fcmale advntagc 3.0 3.0 3.0 3.3 5.9 5.9
Total fertlity raz births per woman 6.3 6.4 S.6 62 2.9 2.9Maternal manity rnt per 100,000 live birdis .. 430 430
Supplementary Povet IndicatorsExpenditm on socda serity 9 of total govt exp. .. 4.2 7.2Socia secuity covrg % a Won active pop. .. ..Acocsstosfcwater total %ofpop. 32.0 31.7 342 .. .. 86.7
Urban ' 77.0 46.0 46.9 .. .. 93.9Rural ' 21.0 24.0 26.5 .. .. 66.7
Access to hellhca .. 20.0 15.0
Population growth rate GNP per capita growth rate Development dimondb(aNS avore. percent) 5 (annual avge, percent) L cryeancy
4 -- 5 --
2 0 per -nr tr 2 i dle ¢ d wbx p.387 v i b. lrdevop dimod b o o Rweyindc-shos fieavlle lve ofd q inxi cCapitnount
-2 -101970-75 1980-8 1988-93 1970-75 1980495 1988-93 Ae.ntosae watm
- Lower-mniddle-incoreo- Lower-middle-incomne.
a. See the techical nots. P.397. b. Mce deveclopmuent diamond, band on fontkey indicato shows the averg level of devrelopment in the countrycompard with its ncome group. Scc thc intduction.
60

CameroonMadt Soxe regIouiuemuev gmas Next
lates $sinlk aw Mont Saab. "Wmef higherunu c - estmaeJe Saeamm midle bIcome
Imadaor UewMIW .197(1-75 19804 1958893 Alita income p..,Resources and Expenditures
HUMPAN RESOURCESPopulation (mure-ll93) thousancls 7,526 9,971 12,S22 558.978 1,096,665 500,507Age dependency ratio ratIo 0,98 0.94 0.92 0.94 0.69 0.62Urban S orpop, 26.9 35.7 43.1 29.1 S4.7 71.2Populatio growth nate annualS 2.6 2.8 2.8 2.9 1.6 1.7
Urban * 7.6 5.3 4.9 5.0 2.9 1.BLabor rorce (15-64) thousands 3.345 3.958 4.663 229.480 459.196 190,136Agriculture %of labor forc 77 70Industry 7 8Female 37 34 33 36 31 29Fenales. per 100 males
Urban number*..Rural
NATURAL RESOURCESArea thou. sq. kin 475.44 475.44 475.44 24.273.63 40,682.67 21,848.14DrNsity pop. per sq. kmn 15.83 20.97 25.62 22.37 26.52 22.51Agricultural lad of land ama 31.57 32.80 32.96 52.4 39.61 41.26Change in agriculturi land annual % 0.79 0.00 0.13 0.06 -0.13 0.08Agricultural land under inrigation % 0.07 0.14 0.23 0.83 12.66 8.84Forest and woodland thou. sq. km ,. 0.22 0.20 5.32 5.95 8.04Del'osestaiion (net) annual * Om. 05
INCOIMEHousehold incomeSha reltop M% of houseolds % of income ..
Sham or'bottm 40% of householdsSha re@'bottom 20% of households
EXPENDI[TUREFood %ofGDP .. 16.0Staples N .4.9
Meat. fish, milk, cheese, eggsp. 6.9Cereal imports thou. nietrie tomnes 69 141 281 13.157 6628 48.947Food aid in cereas N4 13 1 5.0Y79 5,477 544Food production per capita 1987=100 131 108 87 101 101 102Fertilizer consumption kgllu 0.9 3.7 IA4 4.6 41.0 67.8Share of agricultur in GDP %ofGDP 29.1 20.2 28.6 16.3 15.7 8.0Housing *ofGDP .. 10.9Average household size parson per household 5.2 .
UrbanNFixed investment housing S of GDP 4.1 6AFuead adpower %bof GDP .. 1.7Enmrgyconsumptionper capita kg of oil equiv. 65 126 8'7 257 1.595 1.632Households with electricity
Urban % of households...Rural
Transport and oonumunicatlon S of GIDP .. 7.9"Fixed invesment transport equipment N3.7 2.1 Total road length thou.knn 44 65 70
INVSTMNTIN HUJMAN CAPITALHealthPopulaton per physician persons 13.86W. 12,001 .. 3,27Population per nurse 13.860. 2,O00Popul,ation per hospital bed 405 .. 394 1.269 604 395Omal rehydyrfatin therapy (under-5) % of eases ... 84 37 .. 51EducationGross enrollment ratioSecondarY % ofachool-age pop. 1 3 23 28 1 8 S3 53Female 1 17 23
Pupil-teacbecrratio: primnary pupils perteadher 51 51 51 4..25Pupil-teacher ratio: seconday 32 34 21Pupils madhinggrade 4 %Of cohort 80 82 -Repeater rate:primary % of towalenoll 25 29 29lfliteracy % of pop. (age 15-n . 52 46 50 19 1'4Female % Of ftm.(agcls-+] 64 57 62 .. 17
Newspaperrcirculation PerthoLg 3 4 4 12 74 125Would IJank InerIlationanl1 conomiCS VF M Ap 0
61

CanadaMort Smeregiaouaame greup
Liatd E e year reentUnit of eumue High.
Indikaor mwnUre 1970-75 191945 1988.93 IncomePriority Poverty Indicators
POVERTYUpper povety line local curr.
Headeouni index * of pop.Lewer poverly line local curr.Headcount Index % of pop.
CGNP per capita US$ 7,710 13.250 19.970 23,680SHORT TERM INCOME INDICATORSUnskdlled urban wages local cur. .. .
Unskilled mrnl wagesRufui terms of tradeConsuner price index 1917=100 42 92 125Lower incomeFood' 26 91 117
UrbamRural d
SOCIAL INDICATORSPublic expenditure on basic sodal services * of GDP .. .. .Gross enrollment raiosPrimay * scheol ap pop. 99 15 107 103
Malc 99 106 108 103Female 99 104 106 103
MortalityInfant mortality per thoa. five births 16.0 9.0 6.8 7.0Under S moraity "_ .. .0 8.5
IummnizationMeasles S age group .. . 85.0 82.5DPT r0 9.. 85.0 90.2
Child malnutrition (under-5)Lift epecptncyToW. yes 73 76 78 77Female advantag 7.1 7.2 6.4 6.4
Total fertility rat births perwoman 2.0 1.7 1.9 1.7Matn motality re per 100.000 live birts .. 2 .. ..
Supplementary Pov t IndicatorsExpenditues on social security S of tal govtexp. 30.1 272 32.1Social security covrgC S econ. acilvC pop. .. _ .
Access to safe wiecr toal * of pop. .. 100.0Urban . 10040Rumrl 100.0 .4
Access to healith caue - 99.0 ..
Population growth rate GNP per capita growth rate Development diamondb6+ (annual avrae percent) (annia pemenO
2 ( a pet expectancy
4 -- 5./
2 0C(NP Grosper --capita mnfolmet
-2 -101970-75 1980485 1988-93 1970-75 198D-85 1988-93 Acces to sk wmr
J Canada Canada- Iiig-income - Higb-inome
See fcr technical notes. p3B7. b. The dewdopment diamond. based on Iour ley inde s sbws the averap leel of devlopme in the countrycompard with its income g p. See the introduction.
62

CanadaMot Sime. ruou/,caw 1group
Lairs$ !Ingk ter rwentUnit of - - U atimae Mfgh&
Indicaor memu,re 1970.75 1980.85 198593 Income
Resources and ExpendituresHUMAN RESOURCESPopulation (mre=1993) thousands 23.209 25,942 2S,782 812,447Age dependncry rado ratio 0.53 0.46 0.48 0.49Urban % of pop. 75.6 76.4 76.7 77.9Populdon gmwth talc annual % 1.7 1.1 1.2 0.6
Urban 1.7 1.3 1.2 0.8Labor force (15-64) thousands 10.161 12,723 13,691 395,641Ag8iculture % of labor force 6 5Industby 30 29 .. ..Female 36 40 40 38Females per 100 mnales
Urban number 102 102Rwual 90 93
NATURAL RESOLURCESArea thou. sq. kin 9,976.14 9.976.14 9,976.14 32,146.15Density pop. per sq. km 2.33 2.60 2.85 25.11Agricultual land % of land area 7.31 8.09 7.96 42.80Change in agricultural land annual % 0.30 -0.17 -0.23 -0.48Agricultural land under irrigalion % 0.74 1.00 0.95 13.96Forests and woodland thou. sq. km .. .. 4.53 10.56Dcforestation (nct) annual %..INCOMEHousehold incmmeShare of top 20% of households % of inconeSham of bottom 40% of householdsShar of bottom 20% of households
EXPENDITRFood % of GDP .. 7.3 63 8AStaples .. 1.1 1.2 1.6Meat, fsh, milk cheee eggs .. 3.6 2.8 3.8
Cereal imports thou. metric tonnes 862 692 1,095 77,S30Food aid in cerals .. .. .. 8Food producrion percapita 1987 =100 82 98 101 95Fertilizer consump,don kgfia 19.4 31.2 29.7 150.0Shae of agriculture in GDP % of GDP 4.5 2.8 2.4Housing %ofGDP .. 13.5 132 11.7Average household size persons per household 3.5 2.9Urban 2.. 28
Fxed invcstnent housing %of GDP 6.5 4.5 6.8 S.0Fuel and power % of GDP .. 2.4 2.0 2.0Encrgy cnsumption percapita kgofoilequiv. 6.940 7.513 7.821 5.203Households with electricityUrban % of householdsRural
Transport and comnumnicaon % of GDP .. 9.3 93 8.8Fixed investnent transport equipment 2.5 2.3 2.2 2.1Total road length thou. km 494 279 826
INVESTMENT IN HUMAN CAPITALHealthPopuladon per physician persons 684 525 469 4S3Populadon per nurse 140 124Population perhospital bed 101 .. 67 145Oral rehydyration thrap (under-5) % of casesEducationGross enrolment ratioSecondary %of school-age pop. 91 103 104 92Female '- 92 103 104 94
Pupil-teacher mtio: primary pupils per teacher 10 17 17Pupil-teacher rtio: secondary 18 IS 16Popils reaching grade 4 % of cohort 96 95 97Repeater rate: pinmay % of total enrollIlliteracy % of pop. (age 15- .. .. 1..Female %offem (age 15+) .. .. t
Newpaercirculation ae thou. ao. 210 215 207 320Worldiriank Intenaiional Economics Department April 1945
63

Cape VerdeMnst Samea v InAacoa tgreup Next
Latul sfle jt Sub- Lw.,wr' hherUnit of atImet Sahara. middh- Inoee
Ind&&"or nerurI 1970-75 19885 J -I93 Aiam Inee group
Priority Poverty IndicatorsPOVERTYUpper povery line loal curr. .. .. ..
Headcount index % of pop. ..
L:ower poverty line local curr. .. ..
Headcount index % of pop. .. ..
GNP per capita USS 240 350 920 520 1,590 4,350SHORT TERM INCOME INDICATORSUnskilled urban wages local cuir. .. ..
Unskilled rural wagesRural terms of tradeConsuier price Index 1987=100 87 144
Lower incomeFooc'
UrbanRural
SOCIAL INDICATORSPublic expenditure on basic social services % of GDP .. .. 16.0Grass enrollment ratiosPrimary % school ag pop. 145 113 116 67 104 105Mae 152 116 117 74Female 138 III 113 60
MortalityInfant mortality per thou. live births 82.0 66.0 48.2 93.1 39.0 35.8Under 5 mortily - .. .. .. 172.3 61.5 42.6
ImmunizationMcasles 'b age group .. 54.0 7S.0 49.9 77.6 82.0DPr .. 39.0 88.0 51.9 82.2 74.2
Child malnutrition (under-5)Life expectncyTotal years 57 60 65 52 67 69Female advantage 3.0 2.0 2.0 3.3 59 5.9
Total fertility rat births per woman 7.0 6.3 4.2 6.2 2.9 2.9Maenl mortality rae per 100.OOOHive births .. 134 ..
Supplementary Poverty IndicatorsExpenditus an social scurity % of tota gov'terxp. .. .. ..
Social security coveragc % econ. acdve pop. .. .. ..
Accesstosafewatcr.total %ofpop. .. 62.4 74.1 .. .. 86.7Urbm .. 99.0 86.8 .. .. 93.9Ruml .. 50.0 65.0 .. .. 66.7
Access to realtl care ... 1.7
Population growth rate GNP per capita growtl rate Development diamnondb64 (annual average. pent) 5 - (annual averge, percenl) Life expectncy
4 -- 5
2 _ 1 4 1 O - I 1 ~~~~~~~~~ ~ ~~~~~~~~~~~~~GNP I 4 Gross2 -- 0
O [ | n | | s o \ , ~~~~~~~~~~~~~~~~enrolnnmt
-2-11970-75 1980-85 1988-93 1970-75 1980.85 1988-93 Acces to sfe water
z CaperVde _ Cape Verde- Lower-middle-income LowA -middl-i ncome
a. Sece technical noles p.387. b. The develop.ont diaond based on four key indicatr shows the averge level of development in the countrycompard witb its income grup. See die inutduction.
64

Cape VerdeMomsit Sme mge'a. 9PO NWx
Latex ulaa9wa rmeo SibThLwer- AWAIrUna Of clWimat Shaumn middle- Income
JIRIENcrI IIaMIur Jf97075 1980-S 1955413 Ajl* Iwngom sni
Resources and ExpendituresHUMAN RESOURCESPopulmtion (mureul,993) thousands 278 310 370 558.978 1,096,665 500,507AgV dependency riatI ratio 1.09 0.97 0.90 0.94 0.69 0.62Urbakn 9of pop. 21A 33.0 50.3 29.8 54.7 71.2Population growth rae annual 1* 0.8 1,4 2.6 2.9 1.6 1.7
Urban k2.5 7.3 6.7 5.0 2.9 1.8Labor foree(1S-64) thousands 97 121 153 229.480 459,196 190.136Agriculture 9k of labor fott 58 52IndustFy 1 9 23...FeMale 26 29 29 36 31 29Females per 100 malesUrban number . .. ..
RuralNATURAL RESOURCESArea thou, sq. km 4.03 4.03 4.03 24,273.63 40,682.67 21,348.14Density pop. per sq. km 63189 76.92 89.47 22.37 26.52 22.5!Agriculmura land orimand are 16.13 16.13 17.37 52.54 39.61 41.26Change in agricultural land annual 9k 0.00 0.00 2.94 0.06 -0.13 0.08Agricultural land under inigation % 3.08 3.08 2.86 0.33 12.66 t.84Pornt and woodland thou. sq. km .. 0.00 0.00 5.32 5.95 8.04Deforestation (net) annual %b. 0.00...INCOMEHousehold incomeShut of top 20% of housholds % of income .. . .
Shum of bottomn 40% of households . .. ..
Shut of bottom M01 of households . ..
EXPENDrFUREFood %ofGDP *. 24.3...staples ... 8.2 Meat, rish, milk, chenese, eggs. 8.5...
Cereal imports thou, metric tonnes 40 67 53 13.157 66281 48,947Food aid in cereals 7 50 45 5.079 5,477 544Food production percapita 1987=100 46 St 74 101 101 102Fertilzerconsumsption kg/Is 1.5 1.5 .. 4.6 43.0 67.8Shame of agriculture in (GDP 9k of GDP' 8.5 11.6 12.9 16.3 15.7 3.0Housing 9kof GDP ... 3.7...Avenage houshold size pewsns per household...... Urban
Fixed investmntn housing % of GOP... 4A.-Fuel and power % ofGDP ... 1.8...Energy consumption per capit kg of oil equiv. 791 342 305 257 1.595 1,632Households with lcuidcityUrban S of huseholds44....Rural
Transport and cenm,nknation 9k of ODP ... 9.2. Fixed investment: trnsport equipmient ... 3.8..4Total rmad length thou. km . .. ..
INVESTMEN1T IN HUMAN CAPITALHealthPbpalation p-rphysidin person 12,136 5,024 .... 3.77Populaton per nurse "4,078 709 . ..
Population per hospital bed ' ~ 710 457 .. 1,269 604 395Oral sehydyration therapy (under-5) lb of cases* 5 37 51EducationGross enrollmnt rfatiSecondary S of schol-apepop. a 13 19 1 8 53 53
Female 8 12 19 .44
Pupil-teachermtio: primary pupils perteachff 52 39 33 40 .2
Pupil-teacher mtio: secondary 26 34 30...Pupils wahinggrade 4 of cohort *, 91 92 .
Repeater rate: primary b Of tota curofl. 28 19...Illiteracy % of pop. (age 15+) 63 53 I.501 14"Female % of fern. (age 15t.) .. 62 17
Nwpprcirculation pe thou. po. 44. 12 74 125;Wor0-dusank Interational Economics Department. April 1993
65

Central African RepublicMast S- i rgu iceme ELup Ne
,hU0 sJdkwF racwE.t aria- higherUNI Of saharo. LOW- income
Indkcator -measure 1970-75 1951-8 1958-93 AltEca Incomne group
Priority Poverty IndicatorsPOVERTYUpper povery line local cur. .. ..Hcadoount Index S%o pop. ., .. .. .. 19
Lower poverty line local curr. . ..
Headaont index S of pop. .. ..
ONP percapita U$ ISO 270 400 520 330 1,590SHORT TERM INCOME INDICATORSUnslilled thoan wages local curr. .. ..
Unskiled rurld wageS Rural memns of tradeConsumer pidce index 1987=100 .. 105 90Lower incomeFootr
UrbanRural
SOCAL INDICATORSPublic expenditure on basic social services %ot UDP .. .. 7.7Gross enrollnent sDtiosPdinay % school age pop. 73 74 68 67 108 104Male 96 92 85 74 116Female 51 57 52 60 101
MoralityInfantwmority pertou. live births 132.0 114.0 100.8 93.1 63.1 39.0UnderS motlity .. .. 177.0 172.3 101.4 615
IlmmnizationMeasles * age group .. 23.0 82.0 49.9 87.3 77.6DPT * .. 20.0 82.0 51.9 89.9 82.2
Child nmanutrition (under-5) H 39A 30.0 .. .. 40.3Lifc expectancyTotal yeas 43 47 49 52 62 67fmadeadvamte 5 52 5.2 4.9 3.3 2.1 5.9
Total fertility rate births per woman 5.7 5.7 5.6 6.2 3.6 2.9MatrMal mortaity ralc per 100,000 Hlve ihs .. 600
Supplementary Poverty IndicatorsExpenditures on social security * of total govft exp. .. ..
Social security coverage S econ. activc pop. .. ..
Access to safe watr.total % of pop. .. .. 1I.9 .. 67.0.Urban .. 13.0 13.5 .. 78.7Rural .. 5.0 11.0 .. 62.0
Access to healti care -. .. 12S5
Population growth rate GNP per capita growth rate Development diamond'(amual avange. pericent) 1 sama avmge, pert) Life cxpectancy
4 -5
2- O I L-< I C~~~~~~~~~~~~~~~~~~~~~~~NP< FGrossrt7r77m I I, SI,lTsL capita \enrollment0 1~~~~~~~~~~~ -5
-2 -11970-75 193045 1938-93 1970-75 1980-85 1982-93 Ac osaewae
f Cm"nal ican Repuolic Central Amican Republic- low-incme - Low-inFome
a. See the techcl no p.387. b. e delopmentdiond bad on forkey i a w sows iavera evel ef devopm in dle cuntycompard with its income group. See tMe introduction.
66

Central African RepublicMoest Same regioncew gmudp Nat
Latest skagfapw rncent Sub. hg4kerUR* of e-tImate Saharn Low. income
Indkcator mesure lJ 70T75 19,595 9851893 Ali. Inceme group
Resources and ExpendituresHUMAN RESOURCESPopulaton (mreI[993 thousnids 2,057 2.595 3,156 558.978 3.091,764 1,096.665Ap dependency raio mtlo 0.80 0.86 0a8s 0.94 0.67 0.69Urbam of pop. 33.7 36.3 38.6 29,8 27.6 54.7Population growth ratL annual * 2.1 2.3 2.6 29 1.9 1.6Urban e 4.2 3.0 3.5 5.0 3.9 2.9
Labor force (1564) thousands 1,123 1.2S2 1,460 229.480 1,442.452 459,196Agriculture * of labor frrce 78 72Industry 5 5 6Femle ' 49 47 45 35 33 31Fenales per 100 malesUrban number ItI ..
Rural ' 119 ..
NATURAL RESOURCESArea thou. sq. kIn 622.90 622.98 622.98 24,273.63 39.091.96 40,682.67Density pop. per sq. km 330 4.17 4.94 22.37 77.60 26.52Agricultumr land % of' land area 7.85 8.00 8.06 52.S4 52.82 39.61Change in ancultual land annual 0.41 0.02 0.28 0.06 0.03 -0.13Agricultural lImd under irrigation S .. .. .. 0Q3 18.02 12.66Forests anl woodland thou. sq. km .. 0.32 0.31 5.32 7.15 5.95Deforeatulion (net) annua % .. .. 0.41
INCOMEHousebold income
Share of top 20% of households * of income .. ..
Shm of bottom 40% of householdsSham of bottom 20% of households
Food % of GDP .. .. 33.0Staples .. .. 10.7 .. .. .Meat, fsh, milk hees, eggs c.. .. 12.3
Cereal impons thou. nrieuctonnes 10 22 32 13,157 34,420 663281Food aid in cerals * 1 12 5 5,079 8,334 5,477Foodproducionpercapita 1987= 100 116 93 93 101 113 101Fertilizer consumption kgIha 0.4 0.6 0.2 4.6 59.9 40.0Share of aicultur in GDP *ofGDP 35.4 37.1 47.4 16.3 26.3 15.7Housing % of GDP .. .. 10.6Aveage household size prsons per household 5.1 ..Urban .
Fixed investnent: housing 9 of GDP .. .. 2.8Fuel and power % of GDP .. .. 2.1Enwr consumption per capita kg of oil equiv. 25 33 29 257 364 1,59SHouseholds with decridtyUrban S of households .. ..
Rural .. ..Transport and commnunlcation * of GDP .. .. 12.6Fixed investment: transport equipment .. .. 0.7Total road kngth thou. bn 22 20 24 .. .. ..
lNVESSM IN HUMAN CAPITALHealthPopulation per physician persons 44,024 23,288 25,286 .. .. 3,277Populaion per nurse 2.476 2.192 .. .. .. ..Populaion per hospitd bed * 533 642 1.139 1,2C9 1,016 604Oral tehydynaoa therapy (under-S) % of cases .. .. 24 37 38EducatIonGross enrollment ratioSeconday % ofschool-agepop. 8 16 12 18 41 53
Famale 3 8 7 34Pupil-teacher ratio: prinwy pupils per teaicr 67 66 90 40 39Pup i- ratio: secondary 40 74 38 .. 20Pupils ching gradc4 % of cohort 76 74 84 .. .
Repeteratc primary of total enroll 35 29 31Illiteracy Sofpop.(ngel5S+ .. 69 62 50 41 19
Female % offenL(ag15+) .. 81 75 62 53Ncwspercirculalion per t ou, 4p. 0 .. 1 12 .. 74World Bsanc Internlational BCODnoUMslCpS D Aprl 1695
67

Chadeora Samil iau Next
leet single er re.n higherUnil Of ailmh Sofier. law% l rne
udlouer mue H9707S J50"iS J9M M AMhn inecme groy-Priouity Poverty Indicators
POVERTYUpper poverty lHim local cumr. ,, ,, ,
Headcount Index % of pop. .. ., ,, ,, 19Lower poverty line local ur. ., ,, ., ., ..
Hud ount Index * of pop. ,, , .. ..
GNPperc pcia USS 160 120 210 520 380 11590SHORT TERM INCOIME INDICATORSUmWdiled urban wages locia curr. .. .. .. .. ..
Umkilled rural wages N ,, ,, .
Rural twnns of tmrdeConsumer price Index 1987mIO0 .. 122 110 .. ..Lower income
UodRural " .. .. .. .. ..
SOCIAL INDICATORSPublic expcndllurm on basic social serviceS % of GDP S.S .. ..Gross enrollment ratiosPrimary tschooSagepop. 35 43 65 67 108 104Male 51 63 89 74 116 99
Female " 18 24 41 60 101 99
MortalityInfant mortality per thou. live births 166.0 143.0 120.0 93.1 63.1 39.0Under S nroiiy N .. 206.0 172.3 1014 61.5
ImmunizationMeasles % age oup .. 8.D 28.0 49.9 87.3 77.6Dr .. 1.0 I18o S1.9 89.9 l:.2
Child malnutridon (under-S) .. 35.0 40.3Life expetncyTool years 39 43 48 52 62 67Femaleadvmnt a 3.1 32 3.2 3.3 2.1 5.9
Tota fertlity rte btits per wonan 6.0 5.9 598 6.2 3.6 2.9Man-i mortality rte per 100,000 live birts 858 700 .. .. 9.
Supplementary Poverty IndicatorsExpendinu on socWial security * of totl gov't cip. .. .. .. .. ..
Social security coverae * econ. active pop. .. .. .. .. ..
Aeoss to safe water total % of pop. 26.0 29A 67.0Urban 43.0 27.0 .. .. 78.7Rural 23.0 30.0 62.D
Access to heal cam" 30.0 26.0 .. ..
Population growth rate GNP per capita growth rate Development diamonds6 (nMnual average. percent) (annual avrag papent) Life xpecuy
4F]
GNP Ginass2- tF 0- ~ 1 - l per primroy
0- l l i l l I r7rN T vl Scapita / enrolment
1970-7S 1980 1988-93 1970-75 198 1988-93 Acces to safe wa
EJChad - adMLow-inome- Low-income
a. Sce the teciWcHal noe. p387. b. Ih: deveopment diamond, based on four key inic sbow. he avage level of development in the comunycompared with its income grup. See the inroduction.

ChadNeat Siam. reaeuImafnagraaEM Nea
Latest sINs4egewMan rEUR aab- higherlUnit of alimat Sahmara Low- iacome.
ludkdIuor macun 1970-75 I98-8S 1MB-fl ADiea Income grouResources and Expenditures
HUMAN RESOURCESPopulatdon (mareul[993) thousands 4.030 5,013 6.010 553,973 3.091,764 1.096,665Age dependenc ratio rattio 0.83 0.85 0.39 0.94 0.67 0.69Urban % of pop. 15.6 19.6 21.0 29.8 27.6 54.7Population groth rage annual W 2.0 2.3 2.5 2.9 i .9 1.6
Urban 7.0 3.2 3.3 5.0 3.9 2.9Labor force (15-64) thousands 1.496 1,790 2Z096 229,430 1,442,452 459.196Agriouhturo * of labor force 87 83Industry so 4 5Female1 23 22 2136 33 31Females per 100D mades
Urban number...Rurml
NATURAL RESOURCESArea thou. sq. km 1.284.00 124W.00 1,284.00 24,273.63 39,091.96 40,682.67Density pop. per sq. km 3.14 3.91 4.57 22.37 77.60 26.52Agricultural lud * of land area 33.12 38.24 33.32 52.54 52.32 39.61Change in agricultural land annual W 0.17 0.01 0.11 0.06 Om0 -0.13Agricultural laud under inigaton 1' 0.01 0.02 0.03 0L83 18.02 12.66Fbrestsand woodland dhon.sq. km .. 0.12 0.11 5.32 7.15 5.95Derorestaton (net) amnna i ... 0.74
INCOMEHousehold income
Shameof top 20oof households % of income .
sha rec'bottom 40% -of housoholdsShare or bottom 20% -of households.EPENDITURE
Food %ofGDP ... 55.1..-Staples ... 21.5..-Meat, fish, milk, cheese,eg.. .g. 22.6
Cereal imports thou, metric tonnes, to 101 59 13,157 34,420 66,231Food aid in creals 20 163 3 5,0`79 8,334 5,477Food produotion per capita 1987=100 107 93 105 101 113 101Fertilizer coasuaption kglha 0.1 0.2 0.2 4.6 59.9 49.0Shar of agriculture in GDP %i f GDP 43.1 43.2 41.3 16.3 26.3 15.7Housing Wi of rDP .. 7.3 .-
Average household size peisons per ho,srhold . .. .-
UrbannFoted invnstent: housin Wi of CIDP... 2.1Fmeland power % ofCGDP ... 6.0..-Energyconsumptionperrcapita kg of oilequiv. 01916 257 364 1,595Households with electuicitY
Urban Wi of households...Rural
Transportid canmmmnlmtion Wi ofGCDP'.. 9.8Fixed invesment: transport equiPment ... 1.2Total road length thou. kmn 31 27 2
INVSIMNTIN HUMAN CAPITALHealthPopulation per physician Pessn 61,8938. 29,412 ... 3,277Populton per nurse - 8021..-Population pe hospital bed 763 .. 1,345 1,269 1.016 604Oral relydyrauon therap (under-5) Wi ofecases is..1 37 38EducationGross enrollment WitoSecodary Wiofschol-age pop. 3 6 7 18 41 53
Female 0 2 3 -- 34Pupil-teaciser rato: prmazay pupils per teacher 80 71 64 40 39Pupil-teacer ratio: secondaryu 35 . 35 . 20Puipils meachfin grea&4 % ofeohost .- 71Repeatr rato ptimay Wi Of toDal enro 37 . 33Illiteacy Wi ofpop. (age 15-) 77 70 so 41
Femaole % oflkm (agel15.t) .. 3 82 62 53
nm m cimWadon M~pe thuLc. 0 0 0 1 2 74
69

ChileMeal Sme regf/ncome geNext
tal a ls.l year rweed u La j ppetr- higherURN qf clmate America mIde Income
IndIator measure 1970.75 2950485 JUl93 CarNbean Incomere grelp
Priority Poverty IndicatorsPOVERTYUpper poverty line local crr. .. ..
Headwunt index o(f pop. .. ..
Lower povety Ine local cufr. .. ..
Headcount Index % of pop. .. ..
ONP per capita US$ 920 1,410 3,170 2.930 4.350 23,680SHORT TERM INCOME INDICATORSUnskilled urban wages local crr. .. ..
Unskilled mral wagesRural terms of tadecConsumer prie index 1987=100 2 70 261Lower income .Food S 6 ........
Urban .. 65 283
SOCIAL INDICATORSPublic expenditure on basic socal services % of GDP .. ..
Gross enollmnet ratiosPrimy % sool ae pop. 118 106 96 107 105 103Male 119 107 96 .. .. 103rFmale 118 104 95 .. .. 103
MortalityInfant mortity per thou. liv births 69.0 24.0 15.6 43.0 35.8 7.0Under 5 moratyli .. .. I7.0 52.2 42.6 8.5
ImmunizationMeasles % ae gDup .. 77.0 93.0 78.7 82.0 82.S5DPT .. 84.0 90.0 73.7 74.2 90.2
Child malnutrition (under-5) .. 1.1Life expetancyTotal yeas 64 71 74 69 69 77Fanale advantage 6.3 6.8 7.0 5.3 5.9 6.4
Toal fertility rte births per woran 3.6 2.7 2.5 3.1 2.9 1.7Matenal mority rae per 100,000 live births 180 55 40
Supplementary Poverlt IndicatorsExpendituresansocualseczinty %oftotalgov'texp. 23.8 37.1 31.1Social security covemge % econ. active pop. .. ..
Acctssrosafewatcr toDtl Sofpop. 70.0 86.8 86.0 80.0 86.7Urbaa 78.0 100.0 100.0 90.1 93.9Rural 28.0 22.0 20.5 57.6 66.7
Accesc to health care .. 94.7 95.0
Population growth rate GNP per capita growth rate Development diamondb
16+. (amm al aveg perpent) (aMnal averar. pcnt) Life expectancy
4 5 - 1
E~~~~~ cwi~~~~~~~ta enroUtmt
-2 -10 1970-75 1980-85 1988-93 1970-75 1980-45 1988-93 Access to sde water
- Upper-midd!e-inowzUe Uppr-nide-inwem
a. See the tedchical no p387. b. The deviopmeat diamuond. based -n for key iicatn shows the avera kvel of development in the countycompaed with its incom group. Sec the introducfion.
70

Chilemast Same reglfiwcme gep Neut
10a10StnLe 6yefr re"amai Upr higherunit of estimae America middle- income
IudIcaJar memoirs 197075 J980-85 1955-93 Caxl bbue Income groupResources and Expenditures
HUMAN RESOURCESPopulation (mareml9P3) thousands; 10.334 12.076 13.522 466.304 500.507 812,447Ape de-pendency railo ratio 0.73 0.55 0.5 0.66 0.62 0.49Urban % of pop. 75.4 82.6 83.7 71.2 71.2 77.9Population growth rate manual lb 1.7 1.6 1.7 2t0 1.7 0.6
Urban U2.5 2.0 1.9 1.9 1.8 0.sLabor force (15-64) thousands 3,322 4,276 5.002 169,839 190,136 395.641Agriculture % of labor force 20 1 6Industry 27 25Feanle 25 25 29 27 29 31sFemales per IW0 malesUrban number [15 105Rural * 4 75
NATURAL RESOURCESAmea thou. sq. km 756.95 756.95 756.95 20,505.92 21,848.14 32,145.15Density pop. per sq. km 13.65 15.95 17.95 22.29 22.51 25.11Agricultural land S of land ama 21.79 23.50 23.52 40.00 41.26 42.80Change in agricultural land annual b 2t00 0.39 -0.54 0.39 0.05 -0.A1Agricultural land under irrigation % 7.61 7.14 7.11 3.41 5.14 13.96Forests and woodland thou. sq. km .. 0.09 0.09 9.87 5.04 10.56Deforesation (net) annual lb.. -0.14 -
INCONEHousehold income
Shameof top 209bof households % of ineome . 52Sham of bottomn40lbof houscholds ... 17Share of bottom 20% of households ... 7
EXENDITUREFood lb ofOGDP .. 21.4 ... .8.4
Staples -. 5.3 ... .1.6
MeaL. fsh, milk. cheese eggs .. 8.1 ... .3.8
Cowl imports dhou metric tomnes 716 486 983 27,700 48,947 77,530Food aid incereas 323 1 0 3 1,565 544 1Food production per capita 1987=100 91 94 118 101 102 95Feniizer conswnption kg/a 5.6 11.6 20.2 16.1 67.5 150.0Share of ogricultur in GDP lb of GDP 6.6 7.4 8.5 9.0 tOHousing %ofGDP .. 10.0 I. . . 1.Avenage household size persons per household 5.0 .
urban -5.0 .
Fixed investmet housing lbof GDP 4.5 4.2 ... .5.0
Fuel and power S OfOOP .. 1.6 ... .2.0
Fnergconsmptionper capita kg ofoalequiv. 603 611 911 91,3 1,632 5=23Households with elecuricity
Urban lb of households...
Transport and comznsmlcatton lbof GDP .. 8.0 ... .8.3
Fixed invesbuent transport equipment 2.1 2.9 ... .2.1
Total road length thou. kmn 75 79 so1NVEfME1 EN UMAN CAPITAL
Population per physician person Z157 1.227 2.149 ... 453Population per nurse *457 370 335Popuatonperrhospital bed -265 293 320 517 395 145Oral rebydyradon therapy (.nxcr-5) lb of cases ... 90 61 51EducationGCas enrollentr ratioSecondamy % of sdiol-apepop. 48 67 72 47 53 92
Female S 2 70 75 ... 94Pupil-teacher ratio: primary pupils per teacher 35 33 25 26 25Pupil-tecwher ratio: secondazy -16 .
Pupils reahing grade 4 lb of cohort 54 96 95Repeaterate: primary * oftotalenrui 12 7Ilitemrcy % of pop. (ageIS+) 11 I5 7 15 14
Female % oflhm.L(BPeIS+) .. 7 15 17Newspae ciwulaton ae fthu. a90 94 456 55 125 320World BJanK batematzonal Econonucs LDepflnBnt Apri 19"
71

ChinaMost SaeregionAincoma group Nezt
Laf iting9eoar _ wrece hul,erUnit of audmuae Eost Low- Income
ludkafor *msure J97675 195045 195J93 Asia Income group
Priority Poverty Indicators.OVE.I ..
Upperpovtyline locdcurr. .. 10 324Headcountindex %ofpop. .. 26 11 12 19
Lowerpoverty llne loci curr. .. 161 287Hudcount index % of pop. .. 20 9
GNP per capta USS 350 490 820 380 1.590
SHORT TERM INCOME INDICATORSUnskilled urban wages local curr. .m ..
Unskilied mra wags.Rurnl tms of trae.Consumerpice index 1987=100 62 86 190
Lower incomeFood' - NS 182
Urbon .. 83 192Rraug 86 172
SOCIAL INDICATORSPublic expenditure an baric social ervices % of GDP .. ..
GOMB enrrolentmmtdsPrimary * school ag pop. 126 124 121 its 108 104
Male 135 132 125 123 116Femnle 115 114 116 115 101Mordaityiffant mortality per thou. live births 48.0 37.0 30.5 35.5 63.1 39.0UnderS mortality .. .. 54.0 60.5 101.4 61.5
ImunizionMeases % ap group .. 74.0 93.0 93.0 87.3 77.6DPT p .. 78.0 95.0 95.0 89.9 82.2
Child malnutritin (under-5) .. .. 24.0 24.1 40.3Lifc expecacy
ToWa yeas 64 68 69 68 62 67Female advantag L.t 2.9 3.2 3.6 2.1 5.9
Total ferdlity rate birds per woman 3A 2.2 2.0 2.3 3.6 2.9Maeiamoraititymat perl00,000livebirds .. 44 115 116
Supplementary Poverty IndicatoirsExpenditur on scial security % of totD govtexp. .. .. 0.0 -Socia surit covep % econ. active pop. .. ..
Access to i watcr tota oEfpop. .. .. 71.3 67.1 67.0Urban .. .. 87.0 83.5 78.7Rurd .. .. G7.7 61.3 62.0
Access to helth cmt .. _ . . _ . . _ . . _ . . _..
Population growth rate GNP per capita growth rate Development diamondb(annual verage, pc=*) (ann averge. percent) lie (xpemc q cy
4 -- 5
GIP Goss2 0- I PC primary
E0::] i { | 1 < 1-- l 5 -capita en/rnlmenta -5
-2 -101970-75 1980-85 1988-93 1970-75 1980-85 1988-93 Access to safe water
jar ina China- Low-incom Low-income
a See the technical note. p307. b. lTe development diamond. bred on fou key indicat shows the average level of development in the cowuntycompared with its income grmup. See the inrdntion.
72

ChinaMail Same regleu/iwuoms grup Next
Law ahageyear wnatl higher(Mb Cf aenatlu Eant In- income
ludIcale meezure 19fl.75 1980-8S 19K8-93 Asia Income groupResources and Expenditures
HUMLAN RE9OURCESFopuIatIonOnrae.1993) fthusads 916.395 1,051.013 1,178.40M 1,713.883 3,091,764 1,096665Age dependency rado ratio 0.78 0.54 0.48 0.54 0.67 0.69Urban Vs of pop. 17.3 22.5 28.7 31.3 27.6 54.7PapuladugPM&ihra annualS 1.8 1.4 1.2 IA ii9 IAUibaa 2.7 4.0 4.1 4.0 3.9 2.9
L-abor force (15-64) thmousnd 431,759 617.906 707.467 942Z977 1.442.452 459.196Agricutwre S of labor force 76 74 .
Indus"r 12 14..IFemale 42 43 43 41 33 32Fenil. per 100 males
Urban number .. 88 .
Rurlnd. 95 .
NAflUDAL RESOURCESArea thou sq. km 9,561.00 9.561.00 9,561.00 16.367.91 39.091.96 40,682.67Density pop. per sq. km 95.35 109.93 121.84 103.27 77.60 26.52Agricudtuml lad % oriand ama 43.13 50.30 53.32 44.21 52.82 39.61Chanpeinagricultuaulland Ianual % 1,16 1.41 -0.05 0.24 0.03 -0.13Agricultural land under irripadon % 1033 9.42 9.11 14.68 18.02 12.66Fousts and woodfland thou. sq. kcm . 1.33 1.25 4.06 7.15 5.95Defomutnion (aut annual S .. 0.68
Household IncomeSham of top 20% of houeholdBs O S wotncoe .. 39 42Share of botom40% of houschods is. 1 17Sham of botom 2o% of hsehoklds'. 7 6
Food %ofGDP . 43.1 .
StRaplsMeaL nat. milL cheese eggs
Ceral imparts thou, metric tonnes 3.7 18 5,85 7.332 30,036 34,420 66.281Food aid in crcals U . 262 107 447 1.334 5.477Food pmdutionpercapita 1987=100 73 95 119 115 113 101Fmiilizwconsunmption kg/h 16.1 35.3 57.9 76.4 59.9 48.0Sham ofragcicturwinmGDPr SofGDP 32.0 29.8 19.5 17.1 26.3 15.7Housin % ofOGDP .. 5.5 .
Averag househod size puawns per household .. 4.8 .
UrbanS 3.8 .
fixed invstment housing S Of GJDP . .
Fuelandipower 5hofGDP -18.
Encrgy consumpLion per capiha kgof oil equiv. 342 492 632 632' 364' 1.595Households with cleMciciyUrban Sbor househols . ..
Rura . ..
Tnsoland eommuuuleaftl S of GDP .. (L .
Fixed investment tanspor equipmnTotal ad length thou. km 784 942 1.084
DINVISTM1N EN HUMAN CAPffAL
Popilatianper physician pesaus1.0 1.011 1.063 1,063 .. 3.277Populatio per nure if2400 1,617 1,4910 1A490Pokbmrl's pitalbed 5600 SOS 612 612 1,016 604Oral whydyraton theap (under-i) S of cases ... 22 32 38
Gross ewonment ratioSecmondry S of adrool-agepop. 47 39 53 53 41 53Famal 38 32 47 47 34
Pupi-teadhe ratio: jximay pupils per teacher 29 25 22 23 39Pupil-teacberratio: secondary 21 I 1 I5 16 20Pupilsreachinggrade4 Of cohort .. 76 92 92Repearemtuipzmary % Oftotaleamnri.. 6 6lflterCY Sofpap. (srelS4) .. 32 22 22 41 1Female % Ofmni.(srelS+) .. 45 36 36 53
ucoaoitcsv.tm E!po ? .. 37 . .7
.73

ColombiaMoat Somerelr/Iacomsgroeup Next
untesftle yew ret 7.Witi h r. higheru(ik of .sdrot. America middle- inceme
Indkiator mcun I70.75 195058S J1UN93 Caribhsa income group
Priority Poverty IndicatorsPOVERTYUpper poveny line local cor. .. .. ..
Headcouni index % of pop. .. ..
Lower povery line localeaiu. .. ....
Headcount index % of pop. .. ..
CINP per cqala USS 600 1,240 1.400 2.930 1.590 4.350
SHORT TERM INCOME WNCATORSUnsidllied urba wages local curr. .. ..
Unkilled mla wags * .. .. ..
Rural temn of trade .
Consumerpriceindex 1987=100 S 68 423Lower income .. 69 427Foo*f 3UrbanRurti .. 66 405
SOCIAL INDICATOIRSPublic expenditure on basc social senrices % of GDP 3.9 4.0Gross enollment ratiosPrimrny % school age pop. 118 107 117 107 104 105Male 116 105 116Fenmle 120 109 117
MortblityInfant moraity per thou. live births 73.0 41.0 36A4 43.0 39.0 35.8Under 5 moraity .. .. 44.0 52.2 615 42.6
ImmunizationMeasles % ag group .. S2.0 75.0 78.7 77.6 82.0DPT .. 60.0 84.0 73.7 82.2 74.2
Child malnutrition (under-5) .. 16.7 10.1Life expectancy
Tdat yeas 62 67 69 69 67 69Female advantage 3.5 5.3 5.9 5.3 5.9 5.9
Total fetility nun births per womnan 4.7 3.5 2.6 3.1 2.9 2.9Matemal mortality rase per 100,000 live birdts .. 130 110
Supplementary Poverty IndicatorsExpenditures on social security * of total gov't exp. .. IRASocial secuity coverae % econ. active pop. .. ..
Accesstosfewatectot %ofpop. 64.0 91.9 .. 80.0 .. 86.7Urb 86.0 100.0 .. 90.1 .. 93.9Rural * 33.0 76.0 - 57.6 .. 66.7
Access to heath care .. 87.6 87.0
PopulatioIn growth rate GNP per capita growth rate Development diamondb
(anual average. percent) 1 (a.nl aversge pemunt) LiceXpectnc
4 5--
GNP Gross
0- 1 1 4 1I 1 110 I 8 0 I | -5- . capita \ / enroDnent
-2 -- 101970-7S 1980-85 1988-93 1970-75 19804S5 1988-93 Aestosaewrie
J Colombia _ Colmbia- Lower-iddICeDcOMe Lowa-middle-incomc
a. See the tecnical notes. p387. b. The dvelopnentdiamon based on fourkey indios. shows fl avemge level ofdevelopmnt in fit countrycompard with its income group. See the introduction.
74

ColombiaMoAst Same ioIncmame group Nex
Lasttsaiieler reint r higherunLit of srdms America middle, inceme
Indicator manure 19070-75 I18045 I9-23 Caribbar income group
______________ ~~Resources and ExpendituresHUMAN RESOURCESPopulatIon (mrse11993) thousands 23.776 29,730 35.682 466.304 1.096.665 500,S07AgVe dpcndency ratio ra 0.84 0.69 0.6S 0.66 0.69 0.62Urban %ofpop. 60.7 67.0 71.6 71.2 54.7 71.2Population growth rate annual % 2.1 2.3 2.3 2.0 1.6 1.7Urban 33 3.2 3.0 1.9 2.9 1.8
L-abor force (1544) thousands 7,060 9.195 11,131 169,839 459,196 190,136Agrculturm % of labor force 37 34Industry " 23 23Fznmalc 22 22 22 Z7 31 29Females per 100 males
Urban number 126 115Rural 90 U ...
NATURAL RESOURCESArea thou. sq. km 1,138.91 1,138.91 1,138.91 20,505.92 40,682.67 21,86.14Density pop. per sq. km 20.88 26.10 30.62 22.29 26.52 22.51Agricultura land % of land ara 40.37 43.14 44.34 40.00 39.61 41.26Change in agricultural land annual 1 0.69 0.64 0.28 0.39 -0.13 0.08Agncultumi land under irrigation % 0.72 1.04 1.15 3.41 12.66 8.84Foresis and woodland thou. sq. kmn .. 0.58 034 9.87 S.95 8.04Defomstation (net) annual % ., .. 0.65
INCOMEHousehold income
Sham of top 20% or househokis % orincome 59 .. 56Shre of bottom 40% orhouseholks 1 .. 11 Sham of bottom 20% orhouseholds * 4 . 4
EXPENDITUREFood % orGDP 26.7 23.1
Staples 6.0 4.8Meat, lish,.nilk checs,cggs 127 11.1
Cercal imports thou. mneric lonnes 323 858 1.702 27.700 66.281 48947Food aid in eemals *r 28 4 17 1.565 5.477 544Food productio percapita 1987 = I0O 98 97 109 101 101 102Fertilizerconsumption kgfha 5.1 8.1 12.2 16.1 48.0 67.8Share of agriculture in GDP % of GDP 23.9 17.0 15.6 9.0 15.7 8.Housing %ofGDP 6.1 8.9Average houschold size persons per household 5.7 52
Urban 5.5 5.1Fied invesment housing %of GDP 2.3 2.3 .. Fuel and power % of GDP 1.3 1.4Enera consumptionpercapita kgofoilequiv. 479 563 661 913 1,595 1.632Households witb electricity
Urban % of houseolds .. - 90.0 -.Rural
Transport and communaicaton *of GDP 73 9.5Fixed investment trnsport equipment 2.7 2.5Total ad length thou.km 54 100 129INVESTMENT IN HUMAN CAPITALHealthPopulation per physician persons 2.256 1,236 .. .. 3,277Population per nurse n .. 653Popudation per hospit3 bed 451 596 725 517 604 395Oral rehydyraion theapy (under-5) * of CMOs . . 40 61 - 51EducationGross anllmnt ratioSecondary % of school-age pop. 39 46 55 47 53 53Fenale 39 46 60
Pupil-teacher ratio: primary pupils per techer 32 30 28 26 .. 25Pupil-techer ratio: secondary " 20 21 21Pupils reaehing grade 4 % of oDhozt 52 68 73Repeater at primary b of total enrl 15 17 12 _ _Illitecy % of pop. (ag 15+) 19 IS 13 IS 19 14
Fenmle %c oflnm.(agel5.) .. 16 14 18 .. 17Newspaper circulation pe thou. pop. 52 61 60 a5 74 125Word Bank Incniational Economics Department. Apnt 1995
75

Comorosmad r 11ae regha coame group Naz
Latw shir year retad 3 IF- higherULRN of es aite Saka law te. Inee
etndkor mesr 19-75 19J11 19JJ 93 4frleu income f p
Priority Poverty IndicatorsPOVERTYUpper poverty line local curr. .. ..
Headcount index % of pop. .. .. .. .. 19Lower poverty line loca cuft. .. ..
Headcoumt index % of pop. .. ..
GNP per capita US$ ISO 250 430 520 380 1,590SHORT TERM INCOME INDICATORSUnskilled urban wages local curr. .. .. 3500Unskilled rural wagesRurd tenus of tradeConsumner price index 1987=100 .. ..
Lower incomeFood' .........
UrbanRural
SOCIAL INDICATORSPublic expenditure on basic modal services % of GOP .. .. 5.2 -
Gross mollment rtiosPrinmy % school ag pop 46 82 79 67 108 104
Male 64 91 86 74 116Femae N 29 72 73 60 101
MortalityInfant mority perdto live births 1350 109.0 87.0 93.1 63.1 39.0Under 5 mortality .. .. .. 1723 IOlA 61.5
ImmunizationMeales % age group .. 18.0 35.0 49.9 87.3 77.6DF T .. 31.0 85.0 51.9 39.9 82.2
Child malnutrition (under-5) " .. .. .. .. 403Lifeexpecunqcy
Total yam 47 52 56 52 62 67Female advantage 1.0 1.0 1.0 33 2.1 5.9
Total fertility rate birt perwomran 7.1 7.1 6.9 6.2 3.6 2.9Matenal mordlity ate per 100.000 live biths . S00 - .
Supplementary Poverty IndicatorsExpeaditurcs on social security * of total gvtexp. .. .. ...Social security covea E ecoDn acive pop. .. .. .Acces to safe water total S of pop. .. 63.2 5S.0 .. 67.0
Urban " .. 99.0 - .. 78.7Rural .. 52.0 .. .. 62.0
Access to health car m .. 82.4 .. .. ..
Population growth rate GNP per capit growth rate Development dimmdb(annual aveowge pereen) (u
4 5 -
0rtF}1F11:wi....i'"~~~~~~~~~~~~~~~~~p panty-2 -10
1970-75 1980-85 1988-93 L970-75 1980-85 1968-93 Astolrfe:waler
Clomms Como,nsLow-inome L -income
a. Seethe technical nowes p387. b. flc de pm entdiam based on fourkey indicatos,s wskeaveamgevelofdeloirn m ocompared with its income group. See the intrOdUcion.
76.

ComorosMess Sme.. rkau ltestre Next
Oak..? 5~Ltutsinfl zrf. recent hub- bjgherUnk 0'r ofit~~~~uima Stews1 Iaiv. ISCAINI
Indieaf tr munre 197945 1980-85 1988.93 Alden lucewe grop
Resources and ExpendituresHUMAN RESOURCE-SPopulation (uureml,993) thousands 316 455 607 558.97B 3,091 764 1,096.665Age dependency ratio ratio 0.99 1.01 1.03 0.94 0.67 0.69Urban %I of pop. 21.2 25.3 29.5 29.8 27.6 54.7Popultilori gmowdi rate annual % 2.8 3.5 3.3 2.9 1.9 1.6
Urban 4.5 5.1 5.3 5.0 3.9 2.9Labor force (15.64) thousands l55 204 250 229.480 1.442452 459.196Agriculture % of labor rorce 85 83 0Industry 5 6Fcmale 43 4 1 40 36 33 3l;Females per IOD moles
Urban number .. 104Rural .. lO
NATURAL RESURCfAMR ~~~~~~~~thou. sq. km 2.23 2.23 223 24,273.63 39.091.96 40,682.67
Density pop. per sq. km 141.70 204.04 262.14 22.37 77.60 26.52Agricultural land 5 of land ama 47.09 5022 51.57 S2.54 52.82 39.61Change in agriculturland an inual % 0.00 2.75 0.00 0.06 0.03 -0.13Agricultaml land under imiation % Om... 08 18.02 12.66Forcsts and woodland thou. sq. km .. 0.00 0.00 5.32 7.115 535sDeforestation (net) annual % .. 0.00
INCOMEHousehold income
Shar or top 2D% of housebolds % of incomen .
Sharc orbottom 40% of houiseholds"...Share or bottom 20% of households.....,
EXPENDITUREFood % of GDP ... 45.8staples ... 15.1... Meat fish, milk. cheese, eggss... 14.7 ..
Cereal imports thou, metric tomne 1 2 19 46 13,157 34,420 66.281Food aidin cereals S1 5 6 5.079 8.334 5.477Food production percapita 1987=100 135 97 90 101 113 101Fertilizer consumption kg/ha ... 0.9 4.6 5939 48.0Share of agriculture inOGDP % of GIDP .. 36. 39.5 16.3 26.3 15.7Housing % of GDP ... 4.2Avenge household size persns per houselhold...urban
Fixed investment housing S of GDP .. . GFuel and power % ofGDP ... 1.7Energy consumption per capita kg of oil equiv. 32 35 30 257 364 1.595Households with electricityUrban S of households...Rural
Transport and communIcatIon S of GDP...15Fixed invesbucuL transport equipamet ... 1.9Totaroad lcngth thou. km .. I
INVESTMENT IN HlUMAN CAPITALHealthPopulation per physician Persons 14.474 14.110 7,551 ... 3.277Population per nurse 1.812 Z.617 -population per hospital bed 492 ..- 1.269 1.016 604Oral wchydyration therapy (under-5) S of casem.. 70 37 38EducatimGross enrolimet radoSecondary % of sehool-age pop. 7 28 17 i8 41 53Female -2 22 IS . 34
Pupil-teacher ratio: primary pupils per teacher 42 35 45 40 39Pupil-tacher mtio. secondary 25 31 31 .. 20Pupils reaching gmde 4 % of cohort . ..
Repeater rate: primary S of total enroll .. 33 .
Iliteracy S of pop. (age 15.9 .. Si. 50 41 19Female % offrem ndagc5+) -.-. 62 53
Ncwj 7e circulation pe dho. pop . - .. 12 74Woird Bm intnmtin EonomsDepuartent. Apml 1995
77

CongoMOSt Soe retincegroue NSIt
Latst slugLe Mr recant SUN0 blaerUnk f eFallOmae Schar midle. lncerne
Indkenor measur 1970.75 19504t5 138843 AMs lucnume grupPriority Poverty ndiccators
POVERTYUpper poverty llne local cuir. .. ..
Hadecoun: index 9 of pop. .. ..
Lower poverty Une local curr. .. .
Headcount index % of pop. .. ..
GNP per capita USS 550 1,020 950 520 1.590 4.350
SHORT TERM INCOME, INDICATORSUnskilled urban wages local curs. .. ..
Unskilled mrra wagesRural terms, or trdeConsumer pricc index 1987-100 36 96 115 4.
Lower incomeFood .. 98 113UrbanRwal
SOCIAL INDICATORSPublic expenditure on basic social services * of GDP 4. .. .. .. ..Gross enrollment ratiosPrimary ushool ap pop. 133 .. .. 67 104 105
Male * 74Female .. .. .. 60 .
MortalityInfant mortality per tu.live births 95.0 57.0 83.8 93.1 39.0 35.8UnderS morlity .. .. 109.0 172.3 61.5 42.6
ImmunizationMensles lb age group . 67.0 .. 49.9 77.6 8:L0DPT .. 54.0 4. S1.9 82.2 74.2
Child malnutrition (under-S)Life expecancyTotal yeas 47 51 51 52 67 69Fenale advimtage 5.2 5.6 4.8 3.3 5.9 5.9
Total fertility rate birtha per woman 6.3 63 6.2 62 2.9 2.Matemal mortality rai per 100,000 live birtis 1000 .. .. .. ..
Supplementary Poverty IndieatorsExpenditures on soci seurity % of total govt enp. 0.5 4.4 _ .. ..Social security covge % econ. active pop. .. .. .. .. ..Access to sare wsrtotal of pop. 3L0 20. _ .. .. 86.7
Urban * 81.0 42.0 _ .. .. 93.9Rural 9.0 7.0 . .. 66.7
Acess to healdi car _ _.._ _._ _._ _._ _._ _ .
Population growth rate GNP per capita growth rte Development dhuondb6 ( anmua averag. percent) muav ge eo
6 (annual average,paxem) X (a Sage. percent) lif e
4 n2 O~~~~~~~~~~~~~~~~~~~~~~~~~~CNP Gross
0V tftFl,: ea~~~~~~~~~~~~~~~~~~~~~~~~~~~crolumint
-2 -101970-75 1980-5 1988-93 1970-75 1980-8 1988-93 Accessto safb wau
O 41] o - Congo- Lower-middk-inoome Lower-middle-incomc
a See te tecical t p387. b. TMe development diamond, based on four key indicaxs, shows the avere level of devdopm t in the countycompaed with its income group. See the introduo.
78

CongoLast ,!'te ye scent ,11- Lwr highe
URNi of aaiJume S.akwn moidd- IneomeIndkawor unsure 1fl6475 JMBOES flU-fl ma. (Remo. group
Resources and ExpendituresHUMAN RESOURCECSPopulatio (mroml993) (hotaundi 1,447 1,923 2,43 550,978 1,096,665 500,507Age dependency ratio ratio 0.92 0.95 0.96 0.94 0.69 0.62Urban Ii of pop. 34.8 47.5 56.7 29.8 54.7 71.2Population growth rat. annual * 2.7 2.8 3.1 2.9 2.6 1.7
Urban N3.9 5.6 5.0 5.0 2.9 1.8Labor fern (15464) thoumand 582 710 838 229,4810 459,196 190,136Agriculture %ofloabor rocwc 64 62Industry N12 1 2Female 40 39 * 39 36 3 I 29Fenmale per 10OD maine
Urban number ,,.
Rurm U. .
NATURAL RESOURCESArea thou. sq. km 342.00 342.00 342.00 24,273.63 40,682.67 21,8481.14Density pop. per sq km 4.23 5.62 6.93 22.37 26.52 22.51Agricultural land lb of loand ama 29.70 29.76 29.78 5234 39.61 41.26Change in agricultural land annual lb 0.02 0.04 0.01 0.06 -0.13 0.08Agricultural land under irrigatioz b 0.02 0.04 0.05 0.83 12.66 8.84Forets and woodlad thou. sq. kmn . 020 0.20 5.32 5.95 8.04Deforestation (net) annual lb... 0.16
INCOMEHousehold incomeShareof top 2D%of households % of inconme...Sham of bottom 40% of households...Share ofbotomn 20% of households...
ECP'ENDITUREFood % of rGDP 17Astaples .. 7.7Meat. fish. mOIk, chee seiep N. 5.9
cereal inmpot thou. metc tonnes 36 100 148 13.157 66,281 48,947Food aid is cereals 2 7 5,079 S.477 544Food production percapita 1987=I00 108 100 85 101 101 102Fertiizer consumpton kgih 0.2 0.5 0.2 4.6 48.0 67.8Sham of agacututm in GD? lb of GDP 14.5 7.5 II A 16.3 15.7 8.0Housing % of GDP . 44Avenge household size perons per householdW 5.3
Urban 5.5 6.1Fixed investmnent: housing lbof GDP . 6.1F.edmnd power %Of GDP .135
Energy consnpdon per capita kg ofoil equiv. 14" 178 165 257 1,595 1.632Households with electricity
Urban lb of households...Rural
Tramspedt and communIcatIo l %oof D? .Fixed investment transport equipment .2.4
Total road length thou. km 89 9INVESTMENTIN HUMAN CAPITALHealthPopulaton per physician persos 9,945 8.411 ... 3,277Populatioper nurse: 815 594 .
Populatin per hospital bed 228 ... 1.269 604 395Oral rcbydymation themapy (under-S) * of easem. 67 37 .. SEducationGross enrollment ratioSecondary lb of school-age pop. 33 I. . 1 53 53
FemalePupil-teacher matio: prinmay pupils per teacher 59 6 67 40 . 25Pupil-teadchr rato: scoandary 46 42 35Pupils maching grade 4 % of cohot 92 88 87Repeatcr ne: primary Sof total cami 26 30 36Illiteay % of pop. (BP 15-~) .. 48 43 50 29
Female % of frin(BPe15+) .62 56 62 .. 17Nesicirculaton pe thou. pop. 1 4 8 12 74 125
Wadd Lnmmafional Emo epirtme nt.rI 1J93
79

Costa RicaMait Sae rl onn ,ae o N
Latest sMiwe Ye rwIIt' we& higherUnlqlf nlumuie Amefca mWAVE. lces.
Indlor msarmre 1970975 19584S IM 93 Crflbbuea Incee roupPriority Poverty Indicators
POVRRTYUpper poverty line local curr.Headcount lndox * of pop.
Lower povery line local curm. . *tHeadcount Index * of pop. ..
ONP per capita USS 1,030 1,270 Z150 2,930 1.590 4,350
SHORT TERM INCOME INDICATORSUnskIlled urban wags local cur. .. .. .. . ..Unskilled rural wagesRural terms or trade .. ...
Conumerprice index 1987100 12 77 288Lower .ncome.
Footd ..
Urban * .. 78 291Ruml
SOCIAL INDICATORSPublic expenditure on basic wsal serices 9b of GDP .. ..
Gross enrollment radosPrimay % school age pop. 107 97 105 107 104 105
Male rIW 98 106Femae 106 96 105
MortalityInfant morality per tou.live births 53.0 19.0 13.6 43.0 390 35.8Under 5 mortity .. .. 16.0 52.2 613S 42.6
llmLunizationtMeasles it ae group .. 83.0 90.0 78.7 77.6 820DPl .. 82.0 95.0 73.7 82.2 74.2
Child malnutridon (under-5) * .. 6.0 2.3Ufe expwtancy
Total yeas 6B 74 76 69 67 69Female advantage 3 4.1 4.5 4.6 5.3 59 5.9
Tond ferility rate birds per womn 4.3 3.5 3.1 3.1 2.9 2.9Matenal mortlity rat per 00000 live births . 26 .. .. ..
Supplementar Pov t IndicatorsExpenditurs on social security * of total gov'i exp. 26A 14.5 13.8Social scrity coverage i econ. acdve pop. .. ..
Anas to safe wat tol b of pop. 72.0 90.5 93.6 8.0 _ 86.7Urban * 100.0 100.0 100.0 90.1 .. 939Rural 56.0 83.0 84.0 57.6 .. 66.7
Access to healh care .. 94.8 97.0
Population growth rate GNP per capita growth rate Devedopment diamond"(amua average peien 1 (anmual average. pe t Ufaec)
4 5 --
2 a cli~~~~~~~~~~~~~~~~~~~~~7 1 appGos
1970-75 1980-85 1918-93 1970-75 1980.85 1988-93 Acass to afe water
Costa Rica - Costa Ria- Lower-midle-inicome towr-middl4nce
aL See the tedmrica noes, p37. b. The development diaond, basd on Sour key indicaons, shw the aveng level of development in it countrycompaed wit itw income grup. See tIe introduedon.
80

Costa RicaLatest uw!y~~~e most Same re$eafi.cmu ga p Nan
_______recent ldflwr hislherURk of as inmate America middle-. incoer
Indicator maemars 19719.75 19ff-IS 195-fl Caribbean Incomei MrEuResources and Expenditures
HUMAN RESOURCESPopulation (niraul93) thomusnds 1.968 2.642 3.270 466.304 1.096.665 500.507Age dependency ratio ratIo 0.84 0.69 0.67 0.66 0.69 0.62Urben % of pop. 41.3 44,9 48.7 71.2 54.7 71.2Population gmowth mate annual * 2.6 2.9 2.6 2.0 1.6 1.7Urban *3.3 3.7 3.7 1.9 2.9 1.8
Labor force (15.64) thousands 638 904 1.09 169.839 459,196 190.136Agricuilture I' of labor force 37 3 1Industry "22 23Female 20 22 22 27 3 1 29Females per IOD males
Urban number iII 114Rural U90 93
NATURAL RESOURCESArea ihou. sq. km 51.10 51.10 51.10 20.505392 40,682.67 21A148.114Density pop. per sq. km 33.51 51.70 62.33 22.29 26.52 22.51Agricultura lund %o land are 43.56 54.90 56.21 40.00 39.61 41.26Chaange in agriculturad land annual S 3.61 2.00 0.33 0.39 -0.13 0.03Agricultural land under inipation * 1.70 3.92 4.11 3.41 12.66 8.114Forests and woodland thou. sq. km . .02 0.01 9.37 5.95 8.04DNromstkin (not) annual % .. 2.94INCOMEHousehold incomeSham of top 20% of households aof inconme 55 51Sham of bottom 40oof households 12 .. 13Sham of bottom 2D5 of households 3 4
EXPENDITUREFood %ofGDP .. 23.6
Staplcs - .6.1
Meat. fish. milk.ceh ees.c .. tCereal inports thou. metric twines 113 138 535 27.700 66.28 48.947Fodaid in cms 1 164 95 1,565 5.477 544Foodproducdon perecapitn 1987= 100 113 101 109 101 101 102Fertilizer consumption kgflha 31.2 23.8 43.5 16.1 48.0 67.3Sham or agricutduum in ODP % of GDP 20.3 18.9 15.3 9.0 15.7 8.0Housing S of GDP .6.5
Avenage household size Pensons per household 6.0 .
Urban *87.0 .
Faxed investmecnt: housing % ofrGDP .. 8.Fuel and power % orD? . 1.0Energy consumplion per capita kg of oil cquiv. 504 514 558 913 1,595 1.632Households with electricity
Urban S ofrhouseholds . .. ..
Ruram] -
Transport and conumnunmtadn S of GIDP .. .7"Fixed investment: mansport equipmecnt .3.9
TotAl road length thou, km 24 29 36INVESTMENT IN HUMAN CAPITALHealthPopulation per physician persons 1.622 1.011 ... 3.X77Population per numse 460 475Population per hospital bed *253 302 .. 517 604 395Ora rahydyat fionterapy (umlder-5) S of casem-. 78 61 .. 51EduittonGros enrollumet ratoSecondary % of school-age pop. 42 40 43 47 53 53
Female 45 42 45Pooil-Meach" ratio: psimaay pupils pertcacher 29 31 32 26 .. 25Pupil-teacher raio: secondary 524 II8 22Pupilsmreaeinggrade 4 Ofcobort 79 9390Repeater mte primlly % Of tow jemu 6 1 11 -
iiimllerc S of pop. (age 15+) 12 8 7 15 19 1Fenmale %of fein(jagelS) .. 8 7 II . 17
ewpercireulos pe dwou. a. Si 106 103 85 74 125woi ankntritfrna Economites earment Aprnl 199
SI

COte d'IvoireMom Some rgnfioiucoe,enp Next
!fqbler MM rmnSSiF higherUntoJ Ofdhue Shmu Low. Income
laticetiw wzura 197975 hUMS W191Y93 -Afrka lme group
Priority Poverty IndicatorsrovnTmUpper poveny line local curr. .. . .. ..Huadcountindex % of pop. .. .. .. . 19
Lower poverty llne local curr. 4 4 .. .HeAdcount Indoux at pp. .. .. .. .. ..p..
GNP per capita US$ 580 630 630 510 380 1,590SHORT TEUM INCOME INDICATORSUnmkillcd urban wages local curr. . .. ..Unskilled rural wagesRural tern of tnde "
Conaunerpdcelndmx 1987ul00 31 88 116 44
Lower income n4 85 109 ..
FoodTM N 18 .. .. .. .. .UrbanRural .. 78 99 .. ..
SOCIAL INDICATORSPublic expenditure an busc nodal sericea % roiDP .. .. .. .. ..(Dram enrollnnt ratiosPrimary % school ageP . 62 75 69 67 108 104Male 77 88 81 74 116Fimalc 47 62 S8 60 101
MortityInfat mnrtaity per tIhoa live births 129. 105.0 91.2 93.1 63.1 39.0Undr S mortity " 120.0 172.3 101.4 61.5
ImmunizaionMeases * ae group 44 28.0 42.0 49.9 87.3 77.6DPI 4. 25.0 48.0 51.9 89.9 12.2
Child malnuirido -5) N 30.6 . *0.3weepecanucyTotl yems 45 51 51 52 62 67
lemna adva. N 3.2 3.5 23 33 2.1 5.9Toal fenility n bird. per woman 7.4 7A 73 6.2 3.6 2.9Maternal an . per 100,000 livc births .. .. .. .. -
Supplementary Poverty IndicatorsEKpedituns o,j % of t gov p .. .. .. .. ..
Social secrity r % acon. ctive pop. .. .. .. .. ..Acces to sae . S or pop. 44.0 17.1 82.8 .. 67.0
Urban 98.0 30.0 100.0 78.7Rural 29.0 10.0 75.0 .. 62.0
Acces to health cme _ .. .. 60.0 ..
Population growth rate GNP per capita grow rate I Deve'opment diamontb(annl avae. p. ,iO
- ~ ~ ~ ~ ~ ~ ~ ~ ~~(nulaeae Lo Lifeoexpecta-ncym
4 -
comp Cite if Ivime glp Scee ivorton
82

Cbe dIlvoireMost Same qregilaacome gre up Neat
tateatslugle yewr recetw Is- higherUNsd1 of estmate Bafhama ar L uw Icoer
Indicator meanure 1917075 191945 1988-93 Afrika Iucerne groupResources and Expenditure
HUMAN RESOURCESPopulation (mirc=1993) duousmads 6.755 9,933 13.316 558.978 3.091.764 1.096,665Age dependency ratio ratio 0.93 1.00 1.06 0.94 Di? 0.69Urba Va of pop. 32.1 3' 6 42.3 29.8 27.6 54.7Population growth rate annual % 4.1 3.9 3.7 2.9 1.9 1.6
Urban 7.0 5.4 5.2 5.0 3.9 2.9Labr force (1544) thousands 3.153 4,053 4,952 229,480 1.442.452 459.196Agriculture Vaorflabor force 7 1 65industry 7 8Fealfue 37 35 34 36 33 31Females per 100 males
Urban number 76 .
Rural 103 .
NATURAL RESOURCFSAren thou. sq. km 322.46 322A46 322.46 24,273.63 39,091.96 40,682.67Density pop. per sq- km 20.95 30.80 39181 22.37 77.60 26.52Agricultural land %a of land awtn 50.05 52.14 52.55 52.54 52.82 39.61Change in agricuhtuml land annual % 0.25 0.57 0.12 0.06 0.03 -0.13Agricultural land under irrigation Va 0.21 0.33 0.41 0.83 18.02 12.66Fomestsand woodland thou. sq.knm - 0.12 0.11 5.32 7.15 5.95Dcforesraion (ner) annualV - .. 1.0
INCOMWEHousehold incomeShareof top 20% of households % of income 50 6 1 42Share of bouom 40l%of households 20 15 19Share of bottom 20W% of households 9 5 7
EXPENDITUREFood %oafGDP .. 24.4 -
Staples SA.8. Meat, fish, milk, ehcese eggs .. 6.5S
Cescalimposs thou. metuic tonnes 82 554 59D 13.157 34.420 66.281Food aid in cereals -4 1 41 5,079 8,34 5.477Food production per capita 1917= 100 98 100 90 101 113 101Fertlizer consumption k11. 2.4 2.5 2.9 4.6 59.9 48.0Shaxrcof agicukumin GDP % of GDP 28.2 25.2 32.6 16.3 26.3 1517Reusing %Of GDP .. 3.0 .
Avemrag household size persons par household...Urban
Fixed invesumnen housing %aof GD?P 2.8Fuel and power %ofGDP .. 0.8 .
Energyconsumptionper capita kg of oil equiv. 172 150 109 257 364 1,595Households with electricity
Urban Va of househods . ..
Rural... ..-
Teansport and communication %ofGDP .. 1Fimed investment tunspoart equipment 3.2 2.1Totalmrad length thou.kmn 45 47 49
INVESTbMEN IN HUMAN CAPITALHealthPojpluion per physician person 15,535 14.251 - .. 3,277Population per nure H .00 .
Population per hospital bed 3 65 I" 1.268 ,6 1.01'6 604Oral rebydyraton therapy (under-5) S of cases ... 16 37 38EducatonGiross enrolment mileSeCOndarxy eof scho-agepop. 13 20 24 18 41 53
Fanale .17 1 2 16 .. 34 -
puplilcaccr~ ratio: pruimary pupils per teacher 44 36 37 40 39Pupil-tencherratio: secondaty H32 36 43 .. 20 -
Pupils madhinggrade 4 % Of cohort 88 83 84Repcater rate:prmary of tomi enroll 21 28iflitemey % of pop. (agel15+) .. 51 46 5,0 41 19
Femaje %of fenL (agel5+) .. 66 60 62 53Newspaercirculation perdwu. pop. S 9 7 12 .. 74World Biank Interntional EcOnOmZies epatmet Apnl 1995
83

CroatiamAst Sume regibaufacen groulp Nen
Lnisaingkeycr recesst Hsp. Lawn.' higherVlmbrf eslat.e £ Cental middk- income
Indkao eesan Ifr9-75 19N045 1918.93 Aia inceme group
Priority Poverty IndicatorsPOVERTYUper pover"y line local cur. .. ..
Hcadcount index 'b of pop. .. ..
Lower povey line local cur. .. ..
Headcount index * of pop. .. ..
GNPpercapita USS .. .. .. 2.450 1590 4350
SHORT TERM INCOME INDCATORSUnskilld urban wages local cur. .. ..
Unskilled mral wags'Rural tm of tradeConsumer price index 1987-100 .. .. 6.966.991LowerincomeFooct
UrbanRural
SOCIAL INDICATORSPublic expenditue on basic sodal servie:s % of GDP .. ..Gross enrollment ratiosPrinwy %school age pop. .. .. .. 104 105
MaleFenmae
MortltyInfant mrlity per tu live birtis Z7.0 18.0 9.0 24.8 39.0 35.8Under S mnortity .. ..- 36A 61.5 42.6
ImmunizaionMeasles % age grup 77.6 82.0DPT .. .. .. _Z 812 74.2
Child n.lnutdtion (under-S) 'LifeexpectancyToal years 69 70 71 69 67 69Female advatg 6.7 8.2 8.6 8.8 S.9 5.9
Total lility rate birds per woman 2.0 2.0 1.7 2.1 2.9 2.9Materal morality ratc per IW.O00 live biths . ..
Supplementary Poverty IndicatonExpnditurs on soci secwity % of total govteXp. .... 1...Socid securily coveagp e . aciepop. .. .. .. POP.Acoess to seb wanre total % of pap. .. . .. .. .. 86.7
Urban 9 _ .. .. .. .. 3.9Rural .. .. .. .. .. 66.7
Access to health car * *- *- - -- *-
Population growth rate GNP per capita growth rate Development diamond'
6* (annual iavr, percant) I (f l al _ - L; u
4 o
2- D pe -\ cptl \ / cRfitU enrolment
-2 -101970-75 1980485 198W-93 1970-75 19 19f8h93 Acor to safe water
[--I cm"a Croatia- Lower-middle-income L- a-middle-income
a. See the temnica notes p387. b The development diand, based an fourkey indicatrs, shows the avwa level of devdlopmnt in the countcomprd with its ncome group. See th introduction.
84

CroatiaMoat Same Nxiolfin/Lcmern r Next
Latest single year recent Europe ! amer higherUnit of ei.atea & Centra middl- Iwmae
Inicator meanure 1970-VS J9O-*5 JWS938 Asia breamc trampResources and Expenditures
HUMAN RESOURCESPopulation (mre=1!)3) thousands 4.263 4,471 4.511 494.619 1,096,665 5004507Age dependncy rato rAtio OAR9 046 0.47 0.57 0.69 0.62Urban 9k of pop, 45.1 55.0 62.6 64.8 54.7 71.2Population growth raze annual % 0.5 0.4 0.1 0.6 1.6 1.7
Ueban 2.6 2.2 1.5 1.5 2.9 1.8Labor rorce (15.64) thousads ... . 237.897 459.196 l90.136Agriculture S of labor rforee. IndustryFcemae-. .. 47 31 2Females per 100 males
Urban number...Rural
NATURAL RESOURCESArea thou. sq. kmn 56-54 56.54 56.54 24.320-56 40.682-67 21,84.14Density pop- per sq. kmn 75.00 79.00 79173 20.20 26.52 22.51Agricultural land S or land area .. 57.26 39.93 .. 39.61 41.26Change in agricultural land annual S . -0.09 -29.69 -1.28 -0.13 0.01Agricutturd landundermnrigntion S . 0.13 7.15 12.66 8.84Forests and woodland thun. sq. kn . 0.02 0.02 0.80 5.95 1.04Defozestalion (net) amnnua % .. 0.15 .
INCOMEHousehold inicomeShame of top 20% of households S of incooe .
Sham of bottom 40% of householdsSham of bottom 20% of households...
EXENDITUREFood Sof'OP...
RiaplesMeam fish, milk, cheese eggs
Cereal imports thou, metric tonacs. is.. 1 34.452 66,281 41.947F-ood aid in cereals ...- 4.392 5.477 544Fwodproduction perrcpita 1987-100 ... .- 101 102Fertilizteromnsmption kglha ... 5.1 41.7 48.0 67.8Shareof agriculture in GDP S of GDP . . 11-5 13.5 15.7 8.0Housing S ofrGDP .... 6.0Average household size persns per household...
Fixed investment housing SorGDP -... 5.2. Fuwlandipower S of GDP - .. 1.2 .
Energ consumption per capita kg of oil equiv. ... 1.109 2,959 1,595 1.632Households with dectricityUrban % of households...- .-
RturalTraruport and oinrunicatlon Sof GDP...... Fixe investmet trantsport equipment...Total mad length dou. km...
INVESTWMEN IN HUMAN CAPITALHesklthPopulalion per physician prm362 3.27Population per nurse ... . 249Population per hospta bed ... . 136 604 395Ora rehydyratio therpy (undcr-5) S of casem.. . .. 51EAucationCarms earolbuct ratioSecondary S of school-ag pop. ... . 53 53
Pupil-teachr matiw. primary pupils per teacher ... 9. . 25Pupfl-teache rzaliu secondaryPupils reaching grade 4 S of cohort...... Repealer ratc: primary S of total enrull...Illiterac S of pop. (age 15+) ... .5 19 1 4
Female Of fer. (Sp l5+) ... .. .17
Newpaerciculation per thou - ... . 74 125woria eank interanona Economics Dcperanme Apr Il19
85

CubaMost Same egfa Acse grmup Next
Aet single ye. recent La-in Lover- higherUn t of 1 egime9e America mddk- Income
Indicator meaure 1970-75 19f-S0 1981-93 Caribbean scome group
Priority Poverty IndicatorsPOVERTYUpper povarty line local curr. .. ..Headcount index % of pop. .. ..
Lower poverty linc local curt .. .. .. Cr ..Headcounm index %I of pop. .. ..
GNP per capita LISS .. .. .. 2930 1.590 4.350SHORT TERM INCOME INDICATORSUnskilled uban wages local curr. .. ..Unskilled rural wagesRural tenms of tradeConsumer price index 1937=100 .. ..
Lower inconie
UrbanRural
SOCLIL INDICATORSPublic expcnditue on basic social smices * of GDP .. .Grss enrollment ratiosPrimary 9% school age pop. 124 104 102 107 104 105Male 126 107 103Female 122 101 102
MortalityInfant mortlity per thou. live births 38.0 17.0 11.8 43.0 39.0 35.8Under 5 mortality - - 13.0 52.2 61.5 42.6
ImmunizationMeasles age goup .. 30.0 99.0 78.7 77.6 82.0DFT U .. 67.0 99.0 73.7 812 74.2
Child malnutrition (under-S) .. 5.0Life expecyTotal years 71 74 75 69 67 69Female advantage m 33 3A 3.8 5.3 5.9 5.9
Total ferility rue birtis perwonmn 3.6 1.8 1.8 3.1 2.9 2.9Matermal mortaity raze per I00.000 livebiribs .. 31 39 - - -
Supplementary Poverty IndicatorsExpenditures on socia scuuity % of tora gottexp. .. .Socia security cverage S econ. aclive pop. .. .. . .. .Access to safe water otal % of pop. 56.0 . _ S0.0 .. 867
Urban 96.0 90.1 939Rul 15.0 .. .. 57.6 .. 66.7
Access to health care . . 100.0 - -
Population growth rate GNP per capita growth rate Development diamond"(6anual verag. perent) 5 (amual averaqge. pecen)
4- 5
2- Glms_
1 w ~~~~~~~~~~~~~~~~~~~~~~per -pmmcapita wnnment
-5 ~ ~ 8
-2 -101970-75 198G-35 1988-93 1970-75 1980-85 1988.93 Access to Satl wafte
EJCub - Cuba- Lower-middle-inc e LOWaer-0iddle-incame
a.See the technicalnote.p387. b. Thedeveopmentdiamond.based onfourkey indicatos,shows theaveag level of development in the eunatrycompared with its income group. See thre intoduction.
86

CubaMVora Same rqielanAcoww proup Next
LMr bgl, reces la iir&Y highefrUR&S of esubmas Amerka middl- Lucoern
Indicaor measnm 197075 line-" 1185-93 Carlm InLcerne groupResource and Expenditure
HUMAN REOURCESPopulation (mre=1993) thousands 9.306 10.102 10.862 465.304 1,096.665 500.50?Age drpendemcy ratio ratio 0.79 0.53 0.46 0.66 0.69 0.62Urban % of pop, 64.2 71.0 75.0 71.2 54.7 71.2Population growth rate onual % 1.8 0.1 0.8 2.0 1.6 1.7
Urban 3.0 1.6 1.5 1.9 2.9 1.8Labor force (15-64) thousands 3,047 3,987 4,699 169.839 459,196 190,136Agriculture %of ltor fow 27 24Indusury 28 29Female 25 3 1 32 27 31 29Femalez per 100 males
Urban number 103 104Rural IS 89
NATURAL RESOURCESArea thou. sq. km 110.16 110.86 110.86 20,505.92 40,682.67 21,148.14Denzity pop. per sq. km 83.94 91.12 97.18 22.29 26.52 22.51Agricultural land % of land are 52.36 54.02 57.46 40.00 39.61 41.26Change in agrieuhura land annual % 2.11 0.51 0.16 0.39 40.13 0.08Agricultural land under irnigation % 10.09 14.51 14A42 341 12.66 8194Forests and woodland thou. sq. km .. 0.02 0.02 9.87 5.95 8.04Defomestation (net) annual % .. 0.96 INCOMEHousehold income
Sharc of top 20% of househods % of income...Shamortfbottom 40% ofrhousehols . ..
Share of bottom 20% of households...EXENDfTIlPond %ofUDP ..
StaplesMeat, fish, milk chea eggs. ..
Cereal imports tu.mritwns 1.559 2.215 1,541 27,700 6621 4.4Food aid in cereals .. 2 5 1,565 5A477 544Food production perecapita 1987=100 81 103 65 101 102 102Fertilizcer onsumption kglha 57.6 98.7 39.5 16.1 48.0 67.8Share of oagrcltur in GDP Sof GD?P.... 9.0 15.7 to0Housing % of GDP .
Average household size persons per household 4.5 . .-.
Urbarn 4.1.Fixed investment housing of GDP ..
Fuel andpower %ofODP .. ..
Energyconsumpuion percapita kg of oilcquiv. 910 1,039 839 91'3 1,595- 1,632Households with electricity
Urban % of households .. 98.6Run]... .
Transport and conmmonkation S of GD? .. -.
Fixed investraent tranport equipmentTota road length thou. kmIan.- INVE-STMENTIN HIUMAN CAPITALHealthPopulation per physician persons 1.217 532 274 .. 3.277Population pr nurse *- 286 82-Population per hospital bed *216 .. 206 517 604 395Oml rehydynaion twerpy (under-5) % of Gases so..3 61 .. 51EducationGross menrlment ratioSecondary % of school-age pop. 42 82 88 47 53 53
Female *42 85 94 -Pupil-teachter ratio: primary pupils per teache 23 14 12 26 .. 25Pupil-teacher ratio: secondary -13 12 9-Pupils eachuiggWade 4 S Of ooort 94 96 95Repea ate:mtprninuy % Of ttoclcarolI 3 4- Uilteracy %of pop. (agul5+) .. 8 6 iS19 1
Female % of km (agel15+) .. 9 7 18. 17Newsj circrulation m e thoup. 93 119 122 85 74 125
Word LM Inemtina Fionmis eparnuonet ApmI
87

CyprusMess Samemrqieui.omesgroep
La uialkear Unito eJb atr fikh-
Indikor measf I970-7S 1980-85 SJf93 incomePriority Poverty Indicators
POVERTYUpper povery line local curr.Headcount index % of pop.
Lower poverty line local cuer.Headcount indxc % of pop.
GNP per capita USS .. .. 10,380 23,680SHORT TERM INCOME INDICATORSUnskilled urban wagr locd cuun.Unskillod nral wagesRura tms of Htrae
Consumerpriceindcx 1987=100 47 96 132Lower incomeFooe .. 94 134
Rural
SOCIAL INDICATORSPublic expendkum on basic wodal rviacs %of GDP .. 8.1Grs anollmcnt ratiosPrimary % school pge pop. .. 103 102 103
Male N 103 101 103FPeme 1 .. 02 102 103
MoaityInfant morality pr thou. live birts 29.0 16.0 8.6 7.0Under S mortality .. . . 85
InmunizationMeasles BageP group .. 60.0 74.0 925DPr " .. 91.0 98.0 902
Child malnutrition (under-5) .Ufeexpecta
Total yeas 71 75 77 77Fnek advtage N 2.9 4.5 4.4 6A
Total fertiity nate births per woman 2.5 2A 2S 1.7mammal mrtaity rae per 100,000 live births .. .. _
Supplementary Poverty IndicatorsExpenditures on social security % of al gov't cxp. 14.0 17.6 19.6Social security covee % econ. activc pop.Access to safe waer tot * of pop. 95.0 100.0 100.0
Urban 94.0 100.0 100.0Runld 96.D 100.0 100.0
Accss to healdthcae n 100.0 100.0
Population growth rate GNP per capita growth rate Development diamond6
6i (annual aveag percent) 11 tannudal avege percent) Ufe expeCtcy
4 5--
20 2 - O [E;~~~~~~~~~0 per 1 pximm
Oapit \ enrollment
0 ~~~~~~~~~~-5 -2 -10
1970-75 1980S 1989-93 1970-75 19804S 1998-93 A osafcwatr
ED Cypru- Cypms- Higb-incom. - I+ghincome
a. See the technica nots. p387. b. The developmnctdinond. based onfourkey indikato shows the aageleWel of deveopmnt ithe countrycompaed with its incmne gmrup See tet inboduction.
88

CyprusMost Some rqinllieugrep
Igat stnsle bXw recet
rndkdor _ _ _ nm Z 9 r 075 1 MO-85 1981-93 inM eResources ad Expenditures
HUMAN RESOURCESPupiaStuin (mre=ll3) thousands 609 665 726 812,447Age dependency raio rado O.S6 056 017 0.49Urban S of pop. 43A 48.7 53.0 77.9Populaion pewSrule annual* 0,2 1.1 1.1 0.6
Urban 1.0 2.2 2.1 0.8Laor trore (15 thousands '75 312 336 395.641Agriculumre of laborforce 32 26Industy 31 33Fenale 34 35 36 38FenWIes per 100 malesUrban numberRural
NATURAL RESOURCESArea thou. sq. km 9.25 9.25 9.25 32,146.15Density pop.perrsq.km 65.84 71.89 77.59 25.11Agriculhandl land % of land a 18.29 17.64 1721 42.80Change in agiculhurd land amumal % -S.06 *0.6I -1.24 0.48Agriculurl land under inigation % 17.75 18.40 23.27 13.96Forts and woodld thou. sq. km .. 0.00 0.00 1056Defosaon (net) annua * .. .. 0.07
INCOMEHousehold income
Shi of top 20% orhosehlds % of incomeShie of bottom 40% of householdsSham of bottom Ain of households
EXPENDTUREFood % of GDP .. 19.0 .. 84
Staples p .. .. .. 1.6Meat, fish, milk, dicese. eggs - .. - 3.8
Ceeal imports tborn. metric tonnes 195 412 473 77.530Fbod aid in creas 19 2 0 8Food producdon percapita 1987 =100 83 100 100 95Fertiizerconsumption kg/ha 86.8 111.4 178.5 150.0Shae of aicultum in GDP %ofGDP 15.7 7.S 5.7Hosin % ofGDP .. 72 .. 11.7Avea houhold size parsons per household 3.9
UrbanFixed investmnmt housing %.of GDP .. .. .. 5.0Fael and pwer %ofGDP .. 1.6 .. 2.0Energy consunpdon per capita kg of oil eqtiv. 931 1,606 2.517 S203Households with eectricity
Urban of housholds .. .. ..
Tramnport and cou Uoucato %of GDP .. 12.5 .. 8.8Fixed investment trnspt equ t .. .. 2.1Totnldoad kngth tou. km 10 12 10 .
IN1VESTMENIN HUMAN CAPITALHaPopulation per physician persons 1,247 1.05S .. 453Popuation per nurse * 367 355Populatincaper hospital bed U 186 180 .. 145Oral rehydytin therapy (under-5) % of ass .. - 60EdmcatimGross m ln t rtioSecoac y % of school-age pop. .. 94 90 92
Female .. 95 91 94Pupil-adier ralio: pimary pupils per eacher 23 19Pu-macher raio: secondary p 21 17 13Pupils raching grade 4 % of cohort 91 - 100Repeater mte:psimary % oftotald enol I 0 0Diteracy * of pop. (age 15+) _ -PeruSe off kmag (BPSi.+) .
Nstu7 ~circuton Wdihu.CLr 128 125 10 3208
89

Czech RepublicMoos Same region/Income group Next
Laitsn ink year retest Riipf- MjT iiF hisherUnt of estImate & Cenrad middle- Income
ndkiaor sAXre 19fb7-S 198085 1J00-93 Asa income group
Priority Poverty IndicatorsPOVERTYUpper poverty ine lod cal. ....Headcouu index % of pop. .. ..
Lowrpovetylnc loaidcr. .. ..cuHeadcount index * of pop. .. ..
GNP per capia US$ .. .. 2710 2,450 1,590 4,350
SHORT TERM INCOME INDICATORSUnskilled ban wages localr .. ..cuffUnskilled nuaal wgesnRural ms of .udeCnuAmerprice index 1937=100 .. ..
Lower incomn
Urban n,
SOCIAL INDICATORSPublic expenditur m basic social sarices % ofGDP .. ..Gross enrollmet ratiosP y % I a pup. .. 9. 5 .. 104 105Male .. .. 94Femae .. .. 96
MortaityInfatmonrlity prthou. live births 20.0 15.0 9.0 24.8 39.0 35.8Under 5 mu ity .. 10.0 36.4 61.5 42.6
ImmunizaionMeasles ag group c . - .. 77.6 82.0
DFF 8 .. .. .. 32.2 742Child mdnuitim (under-5)Life cxpecac
Total years 70 71 71 69 67 69Female advatrage 6.9 7.1 7.1 S.8 5.9 5.9
ToWal fieliq tycah birtbs perwoan 2.2 2.0 1.5 2.1 2.9 23Matma nwrtity malt per 100,000 live birts .. .. .
Supplementary Poverty IlndicatorsExpenditrmes on soci security of totl gvt exp. .. .. 25.6 .. ..
Socal serty covege % cew. acdve pop. .. .. _Aocsstosafewater. total %ofpop. .. .9 . .. 8 6.7
Urban .. .. _ .. .. 93.9Rural . .. 66.7
Aocess to halt care " .. .. _ .. ..
Population growth rate GNP per capita growth rate Development diamondb6t (anua avege poers)nul vne. pLice
(mmd avmMp. percent)(annual averag. pecent life cxcuc
45
GN. CNP Gross2 * -- g-- *O I -= (9Inw
O 'AN | I___ I -SJ- ocapita enrollment
-2 -10- 1970-75 1980485 1988-93 1970-75 198045 1988-93 Access to safe wate
W Cvxchl eubhic Czech RepublicLswr-indddle-moome Lower-middl-income
a. See t techical note. p387. b. Th de ropmest diamond. based on four key indicats, shows the avag level of dcvdopnment in the contrycompard with is income gr See tbintoto
90

Czech RepublicMost Same rluuoapy Nx
(Jilf of adNma A Catgu ml dle- IncomeIndgicor measure 1978-75 1950.5 1988-3 Asia taco.e LI
Resources mnd ExpendituresIIUMAN RESOURCESPopulation (rnre=1[993) thousoinds 9.997 10.305 10.296 494,619 1,096.665 500,07Age dependecmy rato railo 0.54 0354 0.49 0.57 0.69 0.62Urban % of pop. S7.8 64.5 65.2 64.8 54.7 71.2Population growth rate annual % 0.4 0M0 .0.1 0.6 1.6 1.7
Urban 2.4 03 0.1 1.5 2.9 i.ELabor force (15-64) thousands 5,014 5,375 5.010 237,897 459,196 190,136Agriculture I, of labor force .
IndustryFclend.. . 45 47 31 29Females per 1 00 males
Urban number ..
RuralNATtiE41 RESOURCESArea thou. sq. km ..- 78.86 24,320.56 40,682.67 21,18,8.14Density pop. per sq. km ..- 130.64 20.20 26.52 22351Agricultural land % of land aTea ... 53.91 .. 39.61 41.26Change in agricuLtural land annual % ... . -1.28 -0.13 0.08Agriculturl tland nder irrigation % ... 0.58 7.15 12.66 8.84Forests and woodland thou. sq. kin Om.0 0.03 0.80 5.95 8.04Deforcstation (net) annual % ... -0.04INCOMEHousehold incomeShareof top 20% or lhrischolds % ofhiecome ..
Shame of bottom 40% of householdsShare of bottom 20% of households
EXPENDrITUREFood %ofGCDP...
StaplesMea fish, milk, cheese, eggs
Cerea imports thou. metric wanes ... 519 34A452 66,281 48,947Food aid in cereas ... . 4,392 5,477 S44Food production per capita 1987= 100 - .. . 101 102Fertilizer consumption kg/ha -... 41.7 48.0 67.8Share of agrcultur in GDP Wi of GDP - 69 62 135 15.7 S.DHousing Wi of GDP -... 6.0Average household size pemsons per household --
UrbanFixed investment: housing Wi of GDP -... 52Fuieland power % ofOGDP .... 1 2Energy consumption per capita kg of oil equiv. ... . 2.959 1,595 1,632Households with electricity
Urban 't of households...Rum]l
Transport and communication Wiof GDP ..
Fixed investment: transport equipmientTotal woad length thou. kIan..
11VESTMENT IN HIUMAN CAPITALHealthPopulation per physician person . . 272 362 3,277Population pernurse - .. . 249Population per hospital bad ... 122 136 604 395Oral rhydyration therapy (under-5) Wi of cases ... . .. IEducationGross enrolment ratioSecondary Wi of school-age pop. ... 89 .. 53 53
FemalePupil-teacher ratio: primary pupils per eacher -... I -. 25Pupil-teacher ratio; secondaryPupilsreneing grde 4 % of cohort .....
Repeater ratc primry Wi of ftot ej-voll-......-Illiterac * nf POP. (.get+) -..- 5 19 14Female Wi of fleui-t( 15-I) - ... 17
NE!..r icul532n .. 74 125
91

DenmarkMM Samea rqimAncomgp
Lates shale itan' riweaUni of eartlug. High-
lxdJuaor * IN 197(675 1i8 S 198.93 income
Priority Poverty IndicatorsPovERTYUpper povaty line local cuir.Hudcount index % of pop.
LDwerpoverty liD locad curr.Hendcunt Indux % or pop.
GNP per capot USS 7,540 10,940 26,730 23,680SHORT TERM INCOME INDICATORSUnskiled urban wages locnl cuir.Unskiledn wages Rural t of ade.Consumnerpiceindex 1987=100 39 93 119
LowerlncowmeFood' * .. 97 III
Urbam .Rural N .. ..
SOCAL INDICATORSPubic expenditure on basic socil services * of GDPGross enliment rdosPiinmy % school ae pop. 104 98 9S 103Male ' 95 98 95 103Femae 97 98 95 103
Morail,yInfant monality per hou. live bihts 12.0 8.0 7.0 7.0Under S morality - .. 8.0 8.5
lhauizatonMeasles % aBe group _ 20.0 36.0 32.5DPr - 85.0 95.0 90.2
Child rainuttition (undcr-S) .Life expecancy
ToWd yeas 74 75 75 77Female avntW 5.5 6.0 5.7 6.4
Total frtility rate birhs pe wonan 2.0 1A 1.7 1.7Matral modaity Mr per 100,000 live birbs .. 4 -
Supplementary Poverty IndicatorsExpaditums on socialmccaity % of totaw ovt exp. 35.9 33.3 38.5Socia secuity covwau % econ. active pop. -
Access t safe water tko * of pop. .. .. 100.0Urban .. 100.0Rud ' 95.9 .. 100.0
Access to health care .. 100.0 tI.O0
Population growh rte GNP per capita growth rate Development diamondb(ann4ml avege, vpee 10) ( aver Lifexp y
4 -- 5-
__ __ ___ GNP \Gxss2 0 . p,e ,"
0 4> *Capita/ en l
-2 -- 101970-75 1910-8S 1988-93 1970-75 1980-85 1988-93 AcaD osafew
Denoak Deimak- Highinome - High-income
.See dietechI nolu p.387. b. he dvelopmentdiamond, basd on four key ic show the avea eel ofdevopmet in ftcoouycm d wilh its income gmnp. See the introducdon.
92

DenmarkMost Same reglonflncomueax
Latest sIgeirpmFa ree1tUnit of - ate If Izb.
Indkiatr m smur 1970-75 IJ908S 1J8-93 incomeResources and Expenditures
HUMAN RESOURCESPopulilsn (mreulfl3) thousands 5,060 5,114 5,165 812,447Ago depaedncy mdo rato 0.56 0.50 0.48 0.49Urban of pop. Sl.8 B4.3 85.0 77.9Population growth rte annual 1' 0.5 0.0 0.2 0.6Urban * 1.0 0.1 0.3 0.B
Labor rorce (1564) thosands 2.534 2,784 2.874 395.641Agriculturc % of labor fror 9 7Industry 34 32Female 40 44 45 38Fenules per 100 malesUrban number 104 101Ruml 90 87
NATURAL RESOURCESArea thou. sq. km 43.07 43.08 43.09 32.146.15Density pop.persq.nkm 117A.4 118.71 119.66 25.11Agricultural land Ii of land mia 69.32 66.87 64.95 42.80Change in agricultuml land annual % 0.17 -0.74 .0.5 I -0.48Agrcultural land underirrigation * 6.13 14.47 15.78 13.96Forests and woodand thoi. sq. km - 0.00 0.00 10.56Dcforstafion (nrt) annual % .. .. 0.00INCOMEHousehold incomeShau of top 20% of households a of income .. 39Shar of bonom 40% of households i .. 17Share of bottom 20% of households .. 5
EXPEDrrUREFood % doGDP 103 9.1 75 8.4
Staples 1.6 1.3 1.1 1.6Meat. fisk, milk, cheese, eggs 5 5.0 4.4 35 3.8
Cereal impors dtou. metic looms 262 404 579 77.530Food aid in cereals .. .. .. 8Foodproductionpereapian 1987=t10 81 17 115 95Ferilizcr consumption kg/ha 217.6 223.6 193.0 150.0Share of agriculre in GDP % of GDP 5.1 4.9 3.1Housing % of GDP 12.S 13.7 14.3 11.7Avage household size persons per household 2.7
Urban 2.5Fied investment housing %of GDP 6.8 3.6 3.9 5.0Fuel and power % of GDP 3.4 3.4 3.1 2.0Energyennsumptionpereapia kgofoilequiv. 3551 3,844 3,861 5,203Houseiolds with electricityUrban % of households ..
Rural "Transport and commnIcation %of GDP 7.8 9.4 8S $Fixed inveasent trnsport equipment 2.3 1.9 2.0 2.1Total road lengdi thou. km 67 70 71 .
INVESTMEiT IN HUMAN CAPITALHealthPopulation per physican personm 694 399 .. 453Populationpernusc ' .. 61Population per hospital bed * 103 - 177 145Oral rehydyration dterapy (under-5) W of eCses --
EducationGross enrollment mtioSecondary % of school-age pop. S0 105 IOB 92
Female N 75 105 110 94Pupil-acher rati p pupils per tacher 8 12 11Pupil-tacher tio sen .. 9Pupls readhing grade 4 % of oDhort 100 99 9gRepeaerrate pdmry Oftota enrol 0 0llitery % of pop (agc 15+) .. - tFemale % Of fm (Ogel I5+) .. .. t
Newsa ercirc1ation pe 'to op. 341 363 332 320
93

DjiboutiMaI Same re&fe ncomem Next
l ate r reAl SubF hw ewr.' h*hermnar ofv n -as Sa-onu mi4.e Income
Indkaoar mossure ]97075 BU S 19JD-J5 1"3 inscome_ gr upPriority Poverty Indicators
POVERTYUpper povety line local crr. ,. ,
Headeount Index l of pop. ,, , ,, ., ,.Lower poverty line local orr. .. .
HCJdcount Index 9b of pop. .. .. . ..
QNP per clpita USS .. 520 1,590 4,350SHORT TERM INCOME INDICATORSUnskiled urban wages local crr. .. .. . ..Unskilled naval wages .Rurl enns of tbde . . . .. ....Consunrpricelndex 1987=100 . 1 . .. . ..
Lower incomeFooe
UrbanRUral ,. .. .. .. .. .Rural
SOCIAL INDICATORSPublic expenditure on basic social series6 % ofrGDP .. .. 4.9 .. ..
Gross enmllnicnl ratiosPrimay %schoolagepop. .. 43 41 67 104 105
Male .. S0 46 74 ..
Fenm , 36 36 60Modalitylnfant nortaity per thou. !ive births 154.0 132.0 1132 93.1 39.0 35.8Under5 mortality .. .. 172.3 61.5 42.6
lmm.nfzadonMeasles %ae pomp .. 27.0 61.0 49.9 77.6 82.0DPr 3 .. 30.0 60.0 51.9 92.1 74.2
Cild malnutrition (under-5) .. 40.0 .. ..
Life cxpectncyTotal years 41 45 49 52 67 69Female advatage 3.2 3.2 3.3 3.3 5.9 5.9
Tot fifility rate births perwoman 6.7 6.6 5.7 6.2 2.9 2.9Matrnal mWotality rate per 100.000 live birth 600 .. .. .. ..
Supplementary Poverty IndicatorsExpendiurs on social security % of tolal gov't exp. .. 99 9. 9. 99 9
Social security coverage % CC0nL acive pop. .. .. .. .. ..
Access to safe water. tolal of pop. .. 43. 2. .. . 86.7Urban n 50.0 93.9Rural 21.0 .. . 66.7
Access to health cam "9 37.0 . 9. 9. 9.
Population growth rate GiNP per capita growth rate Development diamondb(annual average. O p e cnul aeagce pecent) expectac
4
GNP Gross2 ~~~~~~~~~~~~~~~~~~~~~~~~~perI- primay
capit enrollment
-2 -- 101970-75 1980-85 1988-93 1970-75 198045 1988-93 Acce to safe water
M Djibouti - Djiboud- Lower-iddle-income - Lower-middle-income
a See the tehnical notes. p387. b. The develpment diaemnd. based on our key indicatr shows the avenge levl of development in the contryconpared with its incocm group. See the itOductio.
94

DjiboutiMost Slame 1,qiOnfn111foegF!! Ncrt
Unit talent aingI. veer recent S-FTaiiW h(gereatIuute Sahar, .Win' Sniffle
Iadkintnr seur 97075 1Mh45 Jf85.PJ Afrka bgeu,we groupResources and Expenditures
HUMAN RESOURCESPopulation (mrs.19M) thousands 205 til I 557 558,978 1,096,665 500,507Age dependency railo ratIo 0.83 0.17 0.0Li 0.94 0.69 0.62Urban *of pop. 685s 77.7 82.0 29.8 54.7 71.2Populadon gmowth rate annual 1' 6.5 6.6 3.1 2.9 1.6 1.7Urban 118. 7.6 3.6 5.0 2.9 1.9
Labor force (15.64) thousands 115 171 191 229.480 459.196 190.136Agricultum 1' of labor force ..
Industry 43 2Female'424 03319Females per I100 nulesUrban number...Rural
NATURAL RESOURCESAmea thou. sq. km 23.20 23.20 23.20 24,273.63 40,682,67 21,845.14Density pop. per sq. km 8.84 16.85 23.29 22.37 26.52 22.51Agricultural land S of land area 8.63 8.63 8.63 52.54 39.61I 41.26Change In agricultural lan annual % 0.00 0.00 0.00) 0.06 40.13 0.081Agricultura land untder irrgation % ... . 0.83 12166 1.84Foresis and woodlanid thou. sq. km D. .O0 0.00 5.32 5.95 1.04Deforestation (net) annual S .. 0.00INCOMEHousehold incomeshare or top 20% of households % of income...Share of bottom 40% of households...share ofbottom 20% of households
EXPENDIrUREFood %ofODP ... 42.4
staples B.. 16.5Meat, fish, milk, cheese, eggs '. 17.4
Cereal imports thou. metri toanes 12 64 43 13.157 66.281 48,947Food aid in cereals .. I 21 5,079 5.477 544Foodprmduction per capita 1987= 100 ... .101 101 102Frflilizer consumption kg/ha .0.1 .. 4.6 48.0 67.8Sham of agriculture in ODP %ofCIDP .. 2.2 2.4 16.3 15.7 8.0HousIng %ofGDP ... .0Average household size person per household...
UrbaLn...Fixed investmient: housing S of ODP...3.Fuel andipower %ofGIDP ... 4.6Energy consumption per capita kg of oil equiv. 2,171 1,261 975 257 1.59 1.632Households with electricity
Urban % of households...Rural
Transprt and communication S6 ofGCDP .. 7.5Fixed investment trnsPort equiPmn *... 2.0Total road length thou, kin .. 3INVETMNTm IN HUMAN CAPITALHealthPopulation per physician persons 3,364 4,463 6,155 . 3,277Population per nurse 989 540 754Population per hospital bed 157 2566. 1,269 604 395OMral reydymation therapy (under-5) S of cases... 56 37 . 51EducationGross enrollment ratioSecondary % of school-age pop. .. 14 14 2853 53
Female I . 1 12Pupil-teacher ratio: primary pupils per teacher 36 49 4240. 25Pupil-teachermtio: secondarya 1 6 23 31pupils reaching gmde 4 S ofeobon . 98 83Repeater rawe: primary Of towaenmou 1 9 12 1 3Illiteracy %fo.ae5e)...501'9' 14
Female % offeiu.(agelS+) ... .62 .. 17
Newsja circlaton mdu .. . . 12 74 125
95

DominicaMmatt 2 S% lnhlm ha!p Nut
Wa rt NAk Mr Meont Win _W_, higherUnR of eal-lmte ApmcHa middle. Income
Indkauor meue 197Mo75 1919J 198it9a Coauhteau Inca prtnapPriority Poverty Indicators
POVERTYUpper poveny line loaalcu .. ....
Handaoun index % or pop. .. .. ..Lower poveny line loca aui. .. .. ..
Headcount index of pop. .. .. ..
ONPpereapla USS 410 1,200 2,720 2,930 1,1590 4,350SHORT TERM INCOME INDICATORSUnskilled urban wags local cu.r .. .. ..Unskillbd runrl w..Rurai tems or ado .. .. .. ..
Cansumer price lndex 1987-100 35 94 128 ,. 4.
Lower Income ., ..
Peod' ' .. 90 127 ..
UrbAn .. . .. ..Rural .. .. .. ..
SOCIAL INDICATORSPublic expenditu m basile social services 'A or ODP .. .. .. ..Gross enrollment ratiosPrimazy %schoolaBPpop. . 95 107 104 105Male . .. , 94 ,. ...
Fenal .. 96 ..MorlityInfant nortality per thou. live birtlh .. .. 43.0 39.0 35.8Under 5 mortality ' .. ., ,. 52.2 61.5 42.6
ImmunizatonMesles 9 age group .. 85.0 68.0 78.7 77.6 82.0DPT 84.0 94.0 73.7 82.2 74.2
Child mainutrition (under-5) " 4.8 .
ifJe expectAncyTotal yan .. .. 69 67 69Femae advanbt S ,. 543 5.9 549
Totaw fertility rate bithe per woman .. .. .. 3.1 2.9 2.9Maternal mortality rae per 100,OO live births .. .. .. . ,..
Supplementary Poverty IndicatorsExpendituuus on soial security % of tota g t exp. .. .. .. .. ..Social scurity coverage % eon. active pop. .. .. .. .. ..Access to safe water tota of pop. .. 80.0 .. 86.7
Urban 4 90.1 93.9Rural ' .. .. .. 57.6 .. 66.7
Access to th cam . 100.0 100.0 . ..4
Population growth rate GNP per capita growth rate Development diamnondh(annual average, percent) - (anniaS aveme, percent) Ufe expecny
4 -5 X n GN~~SlP / \Gross
2 . 0 Ep.I. GNPr.m
capita enmollment
-2 -11970-75 1980-3S 1988-93 1970-75 1980-85 1988-93 Access to safe water
a DomIwo - Dominica- Lower-middle-income -Lower-midincome
a. See the technical nolt p387. b. The developmentdiamond based on four key indka sows the avemge level of development in te coustycompared with its income group. See the intrduction.
96

DonminicaMost Same rwgeu/Ineeme gVW. Natl
ltwest 'suit pee"r recant Liath Leer- hAgherUnit of east saue lAmeda wmidle- iLucern
Indicator Sarwe 1970-75 .1981-5 1918-93 Caribean Lucemrne goapResource and Expenditures
HUMAN RESOURCESPopuh.tIon (nuc=-1993) thousands 72 72 71 466.304 1.096.665 500.507Age depedency ratio ratio ... . 0.66 0.69 0.62Urban % of pop. .. , , 71.2 54.7 71.2Popuilatdon growth mis annual 1 0.6 -0.6 0.0 2.0 1.6 1.7
Urban ... .1.9 2.9 1.8Labor force (15-64) thousands ... . 169.839 459.196 190.136Agriculture% 'of labor force ..
IndustryFemale .... 2.7 31 29Females per I100 males
Urban number...Rural
NATURAL RESOURCESArma thou. sq. km 0.75 0.75 0.75 20,505.92 40,682.67 21.848. 14Density pop. per sq. kmn 96.00 96.00 94.67 22.29 26.52 22.51Agricultural land % of land -m 25.33 25.33 25.33 40.00 39.61 41.26Change in agricultural land annual S 0.00 0.00 0.01) 0.39 -0.13 0.08Agricultural lan under-irrigation S .... 3A41 12.66 8.84Forests and woodlfand thou. sq. km .. 0.00 0.00 9g87 5.95 8.04Deforestation (net) annual S .. 0.70
INCOMEHousehold incomeShare of top 20% of households S of income...Share of bottom 40% of householdsShare of bottom 20% of households
EXNPENDITUREFood % of GDP...StaplesMeat, fish, milk, cheese, eggs
Cereal imports thou. metric tonnes 6 7 8 27.700 66,281 48,947Food aid inecereals 0 0 1 1,565 5,477 544Food production per capita 1987=100 70 83 96 101 101 102Fertilize constnuitidon kglha .. 142.1 263.2 16.1 49.0 67.8Shair oragriculwre in GDP OfOGDP .. 23.3 20.5 9.0 1517 80Housing S of GDP . .-
Average household size persons per household . ..
UrbanNFixd investment housing Sof GDP . ..
Fueland power SofGDP . ..
Eniergy consumption per capita kg of oil eupi'v. 167 236 296 913 1,595 1,632Households with electricityUrban S of households...Rural
Transport and cemmuniunlelon S of GDP...Fixed investment transport equipmentTotal woad length thou. kmin .
INVSTMNTIN HUMAN CAPfIALHealthPopulation per physic-ian person 6,364 2,896 ... 3,27Population, per -un 492 . ..
Populatin per hospita bed *230 si..51 60i4 395Oral rehtydyration therapy (undrr-5) S of cases so..5 61 .. 51EdicutlonGross enmlinient ratioSecondary % of school-age. pop. ... .47 53 53
FemalePupil-tadlirrado: primamy pupils per teacher 2.5 15 21 26 25Pupil-teacher ratio: secondary N26 - ..
Pupils reaching grade- 4 5 of cohort 74 79 93 .
Repeate rate: pdrirry % of total emnrl...... Illiteracy % of pop. agels5+) 6 I...151 14,Female Of fezn. (agel15+) is...1 - 17
Nwsapercirculation esonc e hu 4 p .- .8 74 125
97

Dominican RepublicMeat Se ragiowneome group Next
Lwatest'gle year recnt ain LWer higherUnief clmate Ameria middle- Income
lndkltor -w e 1979-5 If0-85 19K-f3 Caribbean Income group
Priority Poverty IndicatorsPOVERTYUpper poverty line local cuf. .. ..
Headcount index % of pop, .. ..
Lower pverty line local cur. . ..Headcount index * of pop. .. ..
GNP per capita USS 720 760 1.230 23930 1.590 4.350SHORT TERM INCOME INDICATORSUnsidlied urban wages local curt. .. ..
Unsldiled nul wagesRwu tems of tradeConsumerpriceindex 1987=100 23 79 567
Lower incomeFood" n. 74 m
Urban " 2.Rural
SOCIAL INDICATORSPublic expenditure on basic social services % of GDP .. .. .
Gross enmlmelt raiosPrimry bschoolagepop. 104 126 95 107 14 [OS
Male 100 124 95Female 100 129 96
MoralityInfant nmolity per thou. live births 94.0 71.0 40.4 43.0 39.0 35.8Under Stotraity .. .. 43.0 52.2 61.5 42.6
InmunizationMeasis S age rup .. 19.0 69.0 78.7 77.6 8z0DPr " .. 20.0 47.0 73.7 82.2 74.2
Child malnutrition (under-5) .. .. 10.4Life expectancyTotal years 60 66 70 69 67 69Female advantagc 3.7 3.9 4.1 53 5.9 5.9
Total ferdlity rate birds perwoman 5.6 3.9 3.0 3.1 2.9 2.9Matnia mortality raw per 100,000 live births .. 300
Supplementary Poverty IndicatorsExpendhites on social serity % oftSO govitexp. 6.0 7.0Social security coverage * ccon. acive pop. .. .. .. .. ..
Accesstosftwascr toa %ofpop. 55.0 61.1 62.4 80.0 .. 86.7Urban 88.0 85.0 86.1 90.1 .. 93.9Rural 27.0 33.0 28.4 57.6 .. 66.7
Access to health cae _ .. .. .. .. ..
Population growth rate GNP per capita growth rate Development diamonde(annual aveg. percent (annual average. percent) we ctacy
45
2 l ONp Grnss
O- 1 1 1I < 1 I - _ | I _5\ Capita \/ 011ment
-2 -- 10tosfwae1970-75 1980-85 1988-93 197D-75 1980-S5 1988-93 Access to safe wata
) DominicmRepublic Dominican Republic- Lower-middle-income L
a- See the tehnical tles p337. b. The deveopmet diaond, bused on four key indicators, shows the aveage level of development in the conycompaed with its incom group. See the introdcon
98

Dominican RepublicMost: Same reglon/lacome group Next
Lales tsingle Year recent Laren Lower- higher(halt of estiate America middle- incoe.
iakatr measure 1970-75 1988.8 1988-93 Carfibben Income FrouResources and Expenditures
HUMAN RESOURCESPopulation (mre=1993) thousands 5.049 6,376 7,543 466.304 1.096,665 500.507Age dependency ratio ratio 0.94 0.74 0.66 0.66 0.69 0.62Urban % of pop. 45.3 55.7 62.9 71.2 54.7 71.2Population groth ate annualS% 2.7 2.3 2.1 2.0 1.6 1.7
Urban 4.9 4.1 34 1.9 2.9 1.8Labor ferne (15-64) thousands 1,340 1.862 2.384 169.839 459,196 190.136Agricultur %of labor force 50 46Indstr 15 1 5Female 1 2 1 4 16 27 31 2Females per I100 mules
Urban number l18 106Rural 92 99
NATURAL RESOURCESArfea thou. sq. km 48373 48.73 48.73 20.505.92 40,682.67 21.84B.14Density pop perrsq-.km 103.61 130.84 151.59 22.29 26.52 22.51Agricultural land % of land ara, 69.18 72.80 73.21 40.00 39.61 41.26Clumgein agrculturland annual % 0.90 0.00 0.11 0.39 -0.13 0.08Agrmicutural land under irrigation % 4.18 5.62 6.49 3.41 12.66 8.84Forests and woodland thou. sq. kmin 0.01 0.01 9.87 5.95 8.04Defowestation (net) annual S. -. 2378-INCOMEHousehold incometsh aroItop 20% of housebolds % of income .. 56Shore of bottom 40% of households -.- 12 .-
Share of bottom 20% of househods K .4
Food %oDfGDP .. 37.6Staples 10.3oMeat.fish. milktcheeseeggs S-. 11A
Cereal iMPOns thou. metric tonnes 226 426 961 27.700 66.28 48,947Food aid in cienls *16 107 7 1,565 5,477 5.4Food production per capita 1987=1OD 109 101 97 101 101 102Fcatlhzereosnimption ke-h 21.8 17.3 28A4 16.1 48.0 67.8Share of agriculturein GDP %ofGDP 21.5 19.7 15.5 9.0 15.7 8.0Housing % of GIDP .. 12.4 - -Averge household size persons per household 5.0 .
Urban 5.0 .
Faxed investment housing S of GDP .. 7.6Fuel and power %ofGDP .. 3.8EnergycDnsumption per capiz kg of oil equiv. 390 388 340 913 1.595 1.632Households with electricityUrban % of households...Rural
Transport and commununiation 9S of GDP . . ..-
Fixed investomet tranport equipme-nt S .1.9
Totalroad lmgth thou. km 12 1 8
INVESTbMEN IN HUM4AN CAPITALHealthPopulation per physician personLs 2,299 1.7.54 ... 3,277Population per nurse 2,240 1.203Population per hospital bed 400 .. 532 517 604 395Oral rebydyraion therapy (under-5) % of cases... 37 61 .. 51EduesaloGross enrolment ratiosecondary % of school-age pop. 36 51 .. 47 53 53Female .. 57 .
Pupil-teacer rato: prinmay pupils per teacher 52 33 .. 26 .. 25Pupil-teacher ratio: secoudazy 26 37 . .-
Pupils teching grade 4 % of cohort 34 . .--
Repeater ratet piminay % Of total enroll 22 17 - .-
tIliteracy % of pop. (age 154-) 33 20 17is1 14"Female % Of frm.(age-l5-s) .. 22 18 18 . 17
NaLsIaji circulation pe thou. EL. 39 34 36 85 74 12
99
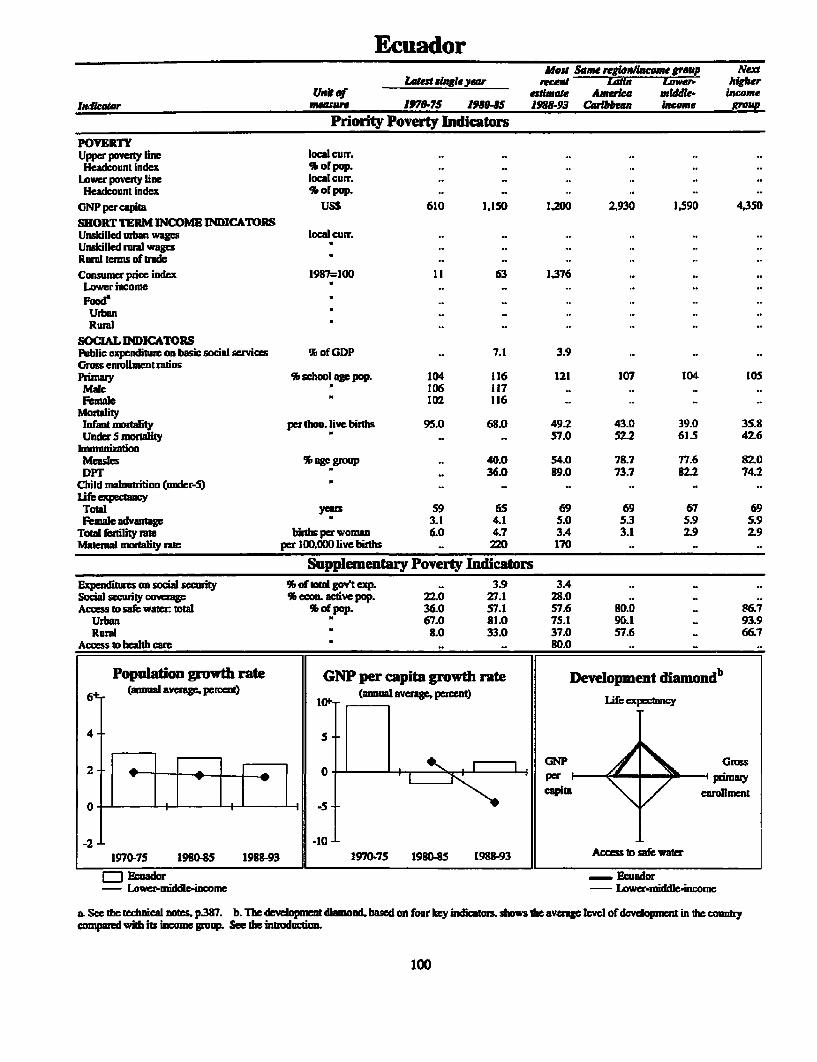
EcuadorMost &me reln cme grap Nest
aest sinle year recetd Laffn Lawer higherUnitf eotamae Axmerika middle- Income
Indator mes 197*Z75 1989-85 198&93 Car4bban Income group
Priority Poverty IndicatorsPOVERTYUpper poverty line local Cuf. .. ..
Headcount index % or pop. .. ..Lower poverty line loca CUIT. .. ...
Headcount index % ofpop. .. ..
GNP percapita USS 610 1.150 1,200 2,930 1590 4.350SHORT TERM INCOME INDICATORSUnskiged urban wages local cur. .. ..
Unskilled rnul wagesRural terms of tradeConsumer pice index 1987=100 11 63 1,376Lower incomeFootUrbanRural
SOCIAL INDICATORSPublic expenditure on basic socil services % of GDP .. 7.1 3.9Gross enulent raiosPrimary % schoolagepop. 104 116 121 107 104 10SMale 106 117Female * 102 116 .
MortalityInfant motlity per thou. live births 95.0 69.0 49.2 43.0 39.0 35.8Under S m ity 5 .. .. 7.0 522 615 42.6
bmnunizationMeases l uBe group .. 40.0 54.0 783.7 77.6 82.0DPT .. 36.0 89.0 73.7 82.2 74.2
Child malnutrition (under-5) .life c tancyTotl ye:s 59 65 69 69 67 69Female advantage N 3.1 4.1 5.0 5.3 5.9 5.9
Tota fadlity rate births perwoma 6.0 4.7 3A 3.1 2.9 2.9Uaterna mortaity rate per 100,000 live births .. 220 170 .. ..
Supplementary Poverty IndicatorsExpenditures on social security % of total govtexp. . 3.9 3.4 .. _Social scrity cov e % econ. active pop. 22.0 27.1 28.0Access to safe water total S of pop. 36.0 57.1 S7.6 80.0 .. 86.7
Urban N 67.0 81.0 75.1 90.1 _ 93.9Rurl N 8.0 33.0 37.0 57.6 .. 66.7
Access to bedth care - .. .. 80.0
Population growth rate GNP per capita growth rate Development dimondb6 (annudl avrage. percent) (anual aveag, percent) _
4 -- 5
5GNP GRoss2 0 ~~~~~~~~~~~~~~~~~~~~~~~~~~~~per primary
-2 11970-75 19804IS 1988-93 1970.75 1985 I988Z93 Aac ID safe water
a Ecuador EcuadorLower-middle-ig":nce wer-nideinwome
aL See the tehnic notes. p.387. b. The devlopment diamond, based an fo ky indickaoxs,w Ite avangc lev of development in tbe countrycotmpared With its inwcme group. See the introduction.
100

EcuadorMatl Same rugonlxewlse gnup Nex
Laden singl yea recnt, Lob Lawer, higherUnkt.f estimate America middle- income
injicabor secure 19701.75 1950985 1988-93 Caribbean income groupResources and Expenditures
HUMANRESOURCESPopulauca (mru=1993) thousands 6,907 9,099 10.980 466,304 1,096,665 500,507Age dependency rato ratio 0.92 0.82 0.71 0.66 0.69 0.62Urban S of pop. 42.4 SM. 57.0 71.2 54.7 71.2Population growth rate annual W 2.9 2.7 2.3 2.0 1.6 i.7
Urban 4.3 4.3 3.6 1.9 2.9 IIILabor force (15-64) thousands 2Z136 2.839 3.582 169.839 459.196 190.136Agriculture S of labor famue 45 39Industry 20 20 1i2 i2Femalc 1 8 1 9197312Females per 1 00 nmale
Urban number 113 109Rural 94 95
NATURAL RESOURCESArea thou. sq. km 281.56 283-56 283.56 20,505.92 40,682.67 21,848.14Density pop. per sq. km 24.36 32.09 37.83 22.29 26.52 22.51Agriculbaraland % of landaan 19.45 26.12 28.73 40.00 39A61 41.26Change in agricullt ara land annual % 4.20 1.76 0A49 0.39 -0.13 0.08Agricultura land under irrigation % 9.47 7A47 6.99 3.4t 12.66 8.84Fbrests and woodland thou. sq. knm. 0.14 0.12 9.87 5.95 8.04Deformstation (net) manual % .. 1.80
INCOMEHousehold incme
Share of top 20% of households. S of income...Share of bottmn 40% of householdsShar of bofttm 20% of households.
Food % of GDP 23.1 21A4 25.0Staples .5.3
Meat, fish, milk cheesei eggs. 6.0Cerea iwmpot thou metric lonane 203 279 428 27,700 66.28'1 48,947Food aid in cereuls 13 18 14 t,565 5,477 544Food production per capita 1987=100 Il8 103 110 101 101 102Fertdiiereonsunption kg/ha 6.1 10.0 14.4 16.1 48.0 67.8Sharm of agrcultur in GIDP % OfGDP 17.9 13.3 12.1 9.0 15.7 10Housing S of GDP 6.6 4.4 Averag household size persons per bousehold 5.3 5.1 4.7
Urban -- 4.6Fixed invauesten housing S of G3DP 3.6 2.2.....-Fuel andipower %ofGDP - 0.9Energyconsumption percapita kg of oilequiv. 336 530 561 913 1.595 1.632Household with electricity
Urban % of households . . 97.0Rural .. S3.0
TraLnsot and commmilcatton If GDP 5.2 L6 8.9Fixed investmen flasport equipment .. 4.3 .
Total road length thou. km 33 38 38INIVESTMENT IN HUMAN CAPITALHealthPopuation per physcican persons 2Z847 803 957 - 3.277Population per nurse Z.640 599 599 Population per bo*pta bed N393 524 608 517 604 395Oral rehydyatiora therapy (under-5) S of cases ... 70 61 .5 1EducationGross enrlmentratioSecondary S of school-agepop. 40 55 53 47 53 53
Female *38 56 -
Pupil-tacherrmatio:piur pupils per tewcher 38 32 .. 26 .. 25Pupit-ueacher rato: scnay1 9 1is. -
Pupilsreaching grade 4 % of coVAo 7 1 74Rlepeater` rate primary % of total enroll I11 9Iiteramcy S of pop. (ap l5+) 26 17 14 51 14
Fermie of fem. (age 154.) - 20 16 18 .. 17
n mm CiMVMDft ape thou. . 48 88 64 85 74 125
101

Arab Republic of EgyptMeH Same.leIAw egrrn,p Next
Ltt slial. yar reoe MW-Kilt hifeUnit of ettate & Newh Low- Income
Indie wr malre 1970-75 198045 I989-93 4fAf. Lcome growp
Priority Poverty IndicatorsPOVERTYUpper poverty line 1 cL .. ..curr.HaBdcount index * of pop. .. .. .. .. 19
Lower poverty line local cu. .. ..
Headcount index * of pop. .. ..
GNP percapitr USS 320 620 660 1.980 300 1,590SHORTTER INCOME INDICATORSUnusciDed uban wages local curr. .. ..
UnkDlled rnaal wagesRurl terms of tradeConsumerpricc index 1987=100 19 67 254LoweincomeFood .. 65 238
Urban .. .. 256Rral d. .. 247
SOCAL INDICATORSPublic expenditure on basic social servces %oFGDP .. 5.3 4.9Gros .rolmen ratiosPrimy % school age pop. 71 91 101 97 108 104Male - 85 101 110 103 116Female 57 82 93 90 101
MortalityInfant mortaity pcr ihou. live birts 150.0 115.0 64.4 23 63.1 39.0Under5monaliy .. .. 86.0 69.9 101.4 61.5
lmmnizationMeasles agegroup . 740 89.0 813 873 77.6DPT .. 95.0 86.0 84.0 89.9 822
Child malnutrition (under-S) .. .. 9A .. 403life expectancy
Total yeas 52 57 64 66 62 67Femaleadvantage 2.6 2.5 2.4 23 2.1 5.9
Total feility rar birtd per woman 55 5.1 3.8 4.7 3.6 2.9Matnal morality rae per 100.000 live births .. 50.
Supplementary Poverty IndicatorsExpendites On social security S of toa govt CXp. 8.4 11.6 9.1 .Social security covrage % econ. active pop. .. ..
Access to sde watr total % of pop. 93.0 75.0 862 835 67.0.Urban 94.0 93.0 96.0 98.7 78.7Rural 93.0 61.0 B2.0 69.0 62.0
Access health ce .. 99.0 99.0 7A..
Population growth rate GNP per capita growth rate Development diamondb(manual avage. pe O (nnual avage Percent) Lifexpmq
4 -- 5
2 n r l l l I || o | f n- GNP Gro
-2 -101970-75 1980-85 1988-93 1970-75 1980-85 1988-93 Acom to saf
[ )Ab Republic of Egypt _ Ab Republic oEgpt- Low-income Low-income
& See t ebdcicwl nabs. p3S7. b. The deveopme diamod basd on four key indicats. dsws tic avage levl of developmentcin the counatycompaed with its income group. See the introduction.
102

Arab Republic of EgyptMost Same reglenlincome group, Next
Latas single year recetInTQ Ei - higherUnit of estimacte & North, Low- income
ineilealr alwuea r 1970-75 191045 19889-53 Arfric income gej
Resources and ExpendituresHUMAN RESOURCESPopulution (mrernl993) thousands 3B.841 48,250 56.434 261.650 3.U91l.764 1.096.665Age dependency ratio ratio 0.79 0.80 D.80 0.87 0.67 0.69Urban % ar pop. 43.5 43.9 44A 55.2 27.6 54.7Populntion growth raie annual %I 1.9 2.0 2.0 2.7 1.9 1.6Urban .12.5 2.0 2.4 3.7 3.9 2.9
Labor force (15-64) thousands 10.037 12,837 15,788 71.333 1,442.452 459,196Agriculture % of labor force 49 46Industry 1820 I3 'Ferauac 8 9 1 33Femaales per 100 malesUrba number...Rural
NATURAL RESOURCESAma ~~~~~~~~thou. sq. km 1.001,45 1,001.4A5 1,001.45 11,021.26 39.091.96 40.682.67
Density pop. per sq. km 38.78 48.18 55.26 23.10 77.60 26.52Agricultural land S of land area 2.84 2.51 2.61 32.10 52.82 39.61Chinge inagriculturalland annualS -0.63 0.16 -1.63 0.04 0.03 -0.13Agricultural Land undcr irrigation S 100.00 100.00 101.73 30.59 18.02 12.66Forests and woodland thou. sq. km .. 0.00 0.00 0.45 7.15 5.95Deforestation (net) annual WI... 0.00
INCOMEHousehold incomeShareof Lop 20% of households S of income 49 .
Sham of bottom 40% of households IS .
Shar of bottom 20% of households. S
EXPENDITUREFood %ofGDP .. 33.9staples - .6.8
MM 4fish, milk. cheese.,eggs .. 13.5Cereal imports thou. metric tonnes 4.214 83903 '7.206 38.092 34.420 6628'1Food aid in ceceals -610 1.951 482 1,249 8.34 5.477Food production per capita 1997=100 97 93 100 102 113 101FertIlizer consumption kgiha 177.4 345.8 339.2 89.9 59.9 43.0Shameof agriculturein GDP %ofGDP 28.1 19.3 16.3 13.3 2GZ3 15.7Hlousing %DfGDP .. 6.2 . ..
Average household size persons per household..- Urban
Fixed investmcnt: housing W'of GDP lOS5 2.7-Feel and power W,ofGDP .. 1.7 -
Energy consumption pcr-capita kg of oil equiv. 237 516 576 1.097 364 1.595"Households with electricityUrban S of households . .-
Runt!Transport and cononumnication S of CJDP .. 2.5Fixed invesumnra transport equipment 8.2 4.3Totalmrad legth thou. km 26 31 31
INVSTMNTIN HUMAN CAPITALHealthPopulation per physician persons 1.997 774 1,336 -.. 3,277Popuation per nurse 2.481 827 496Populationperrhospitalbed U526 513 523 633 1.016 604Oral relydyrationtherapy (under-5) S Ofeae .. 34 56 38EducatonGross enrollmenit ratioSecondary % of school-age pop. 43 66 s0 56 41 53
Female 31 54 73 50 34Pupil-teacher ratio: primary pupils per teacher 35 32 26 26 39Pupil-teachr ratio secondary 34 22 2 1 21 20Pupils reaching grade 4 % of cohort 95 82 99 95Repeater rat:primry %ortotalenwHl 7 2-Ilitewracy % of pop. (age 154.) .. 55 52 45 41 1 9Femnale % ofkm. (age, 1e-) .. 71 66 57 53
Newspaper circulation pe thou. po. 24 49 44 33 .. 74world BLan Intcmunrnoa Economics Department. April 19*5
103

El SalvadorMea Seme regeon/ncoue group Nex
fLaUt singlayw rcent Latn f r, higherUnat of eiutae. America middle- income
Indkeoer SEure 1970.75 1980-85 1988-93 Caribbean income grOup
Priority Poverty Indicators
POVERTYUpper povert line locb curr. .. ..
HNedcount index % of pop. .. ..
Lower poverty hie local cur. .. ..
Headcount index * of pop. .. ..
GNP per capita USS .. .. 1,320 2930 1,590 4,350
SHORT TERM INCOME INDICATORSUnskilled urban wages local crr. .. ..
Unskilled runal wagesRurd trn of ui.Consunerprice index 1987=100 17 61 264
LowerincomeFoodcUrban .. 61 345Rural
SOCIAL INDICATORSPublic expenditure on basic social sevices 9 aO .. ..GDPGrass enrollment raiosPrimnay S%schoolagepop. 75 74 78 107 104 105
Male- 76 73 78
Fmale 74 75 79MortalityInfant mortity pcr thou. live births 99.0 77.0 44.6 43.0 39.0 35.8UnderS moraity .. .. 60.0 52.2 61.5 42.6
ImmunizationMcasles % Sa group .. 41.0 53.0 78.7 77.6 82.0DYI - .. 44.0 60.0 73.7 82.2 74.2
Child malnutritio (under-5) 21.6 .. 15.5 -
Life expecncyTotal yeas 59 57 67 69 67 69Female advantage 4.5 13.2 4.9 5.3 5.9 5.9
Total frtility ra births per woman 6.1 5.0 4.0 3.1 2.9 2.9Matenal mortality ate per 100.000 live births .. 300
Supplementary Poverty IndicatorsExpendits on socia security % of oal govtexp. 3A 2.4 2A.Soi seuriy covea S ccon. active pop. .. ..
Access to safe wate ua % orpop. 53.0 .. 40.7 80.D . 86.7Urban 89.0 76.0 75.8 90.1 .. 93.9RIUal ' 28.0 .. 10.0 57.6 .. 66.7
Access to hcEalth came _ _ _ _ _ _ _ _ _ _ _ _ _ _ _ _ _ _ _
Population growth rate GNP per capita growth rate Development diamondb(annual avege prcne ) (annual averae t) eife qx cy
IGNP Grss2 ~~~~~~~~0per primay
capita cnrollment
.2 ~~~~~~~~~~-101970-75 1980-85 1988-93 1970-75 1910-85 1938-93 Acce to safe walr
2 El Salvador - E Slvador-Le luiddl-inconle - Lower-middle-income
a. See th technical notes, p.3S7. b. The devlopment diamond based on for kcy idiao, shows the aveage lvel of dvelwomnt in the countycompared with its income goup. See the inWcr dOen.
104

El SalvadorMHat Sae rqlmn/lnc.ueroup Next
ZaLet e ge per recen sans Lswer- hWghw(Ink ef esltefte Amerc midle- Incem
INdleA101 measur 1979-5 JP54 JUl493 CaShes Incomne are upResources and Expenditures
HUMANRFSOURCFSPopulaftim (ure-IffS thousands 4,065 4.739 5,517 466,304 1,096.665 500.507Age depedency ratio ratio 0.95 0.97 0.84 0.66 0.69 0.62Urban % of pop. 40.4 42. 44.6 71.2 54.7 71.2Populalion growthrmte annualS% 2.6 0.9 2.1 2.0 1.6 1.7
Urban *3.1 1.5 2.6 1.9 2.9 1.3Labor force (1544) thousands. 1.367 1.332 2,374 169.339 459.196 190.136Agricultuam % orl'lbor force 49 43hudustjy 1 7 19 2 i3Female 23 25257319Fmeales per 100 males
Urban number 119 .
Rural 96 .
NATURAL RFSOUIRCFESArea thou. sq. kmi 21.04 21.04 21.04 20,505.92 40.682.67 21.S4t.14Densty pop. per sq. km 194.15 225.24 256.73 22.29 26.52 22.51Agriculbralland Soof landarme 60.48 64.77 64.67 40.00 39.61 41.26Chang in agrcWulra land annual % 0.00 0O5 -0.22 0.39 -0.13 0.03Agricultural land under irrigation % 2.62 3.20 8.96 3.41 12.66 8.84Forams ar-4 woodland thou. sq. kmin 0.00 moo 9.37 5.95 3.04Defomestaidon (net) annua % .. 2.24
Household incomeShare of top 20% of housebolds. % of incoe... .
Slume of bottom 40% ofbhouseholds-Share of bottmn 20% of households
Feud %oVUDP .. 25.7Staples .. 9.1Mm tfish.muik.chwse. eg . 10.1
Cereal import tho. metric tonnes 103 224 236 27.700 66,231 48.947Food mid in carals 4 194 131 1.565 5.477 544Foodproduction per capita 1937100 112 107 III 101 101 102Pertiizer coumplion kuJha 74.5 63.1 58.4 16.1 49.0 67.3Share of agriulturein GDP % orGDP 23.0 19.2 3.6 9.0 1517 8.0Housin %ofGDP -53
Average houisehold size perons perhousehld 4.6 .
UrbanFixed nvetmnet Wmusin %orclDP 139 34Fuel and power % of'ODP - 1L4Energ consmption per capita kg of oil equiv. 183 221 222 913 1.595 1.632Households. with electricity
Urban %of housebolds - .
RuralTransport andconununleatln %ofGDP .. I.Flind investment tranpor equipment 33 2.4Total road length tho. km I i 12 12DINVTNMEN IN HUMAN CAPITAL
Popuation perphysician persons 4.096 2.22... 3.277 Popuation per nurs 336 932 -Poplulaton per hospital bed 500oo 699 517 604 395Oral rehydyratio therap (wider-5) S of ese . . 45 61 .. 51EducatIomGmrl oinroilmet ratioSeconday %ofschool-agepop. 19 27 25 47 53 .53Femual 17 23 27-
Pupil-wmack ratio: primary pupils per teacher 53 42 .44 26 .. 25Pupil-teacher ratio: secondary 25 12 -Pupils reachinggrade4 S Of cobot 53 66 . ..
Repealerrnzeiniry ofwoealnro 7 S illteac S ofpop. (orel5i) 43 31 27 15 19 14Female % ofktm.(ageli.i.) - 35 30 13 - 17
N%7 7 r circulation per thu pop 57 51 90 35 74 125WomatM latemaonal EcononCsR ljmneUm. Apnh199Y3

Equatorial GuineaMet Same rengmlce, group Next
lafat ghak r recant S& higherUnit of amamate Sakarn Low- Income
In ator _ acaure 1970-75 190S 19X8-93 _ a_ ceme group
Priority Poverty IndicatorsFOVPRTYUpper povaty line loca cur. .. ..
Headcwunt index % of pop. .. .. .. .. 19Lower poverty line local curr. .. ..
Headcount index Ii of pop. .. ..
GNPpercqita USS .. .$ 420 520 380 1,590SHORT TERM INCOME INDICATORSUnsidlcd urban wagcs local curr. .. ..Unskilled ruial wagDs .Rurl lwn. of tradcConsomer price index 1987=100 .. 140 98
Lower incomne .........bodeUrbanRural
SOCIAL INDICATORSPublic expandituic on basic sodal services % of GDP -. .. 7.1Gross enrollment ratiosPrimrmy sdchoolagepop. 78 147 .. 67 103 204
Male 17 .. .. 74 116FemaIe 69 .. _. 60 101
MortalityInfantrmonaity perthou.livebihts 157.0 137.0 115.0 93.1 63.1 39.0Underf 5 morality " .. .. .. 172.3 101A 615mnunizationMeasks % age gMup .. 11.0 .. 49.9 87.3 77.6DPT .. 3.0 .. 51.9 89.9 82.2
Child malnutrition (under-S) * .. .. .. 403Life expecutncToad years 41 44 48 52 62 67Femaleadvantage 3.1 3.2 3.2 3.3 2.1 5.9
Tota fertiity rate births per woman 5.7 5.8 5.8 6.2 3.6 29Mawma nwrtaley rm per 100,00 live births .. ..
Supplementary Poverty IndicatorsExpenditures on social secinty % of total gov'texp. .. ..Social secuity coverage % econ active pop. .. .. .. .. ..
Access to safe wa:c total % of pop. .. .. .. .. 67.0Urban 47.0 .. .. 7.7Rural .. .. .. .. 62.0
Access to health rcw
Population growth rate GNI per cm,pit. growth rate Development diamond6
(annu aveme percet) S ( ave expecny
4 5 --
GNP Gros2. 0 -
capila enrollment-5
-2 - ~~~~~~~~~-101970-75 1910-85 1988-93 1970-75 1980-8S 1988-93 Access to sa water
qutorial Guhzes - Equatorial Guinea- low-incomne Low-incme
a. See the technical n p.387. b. The deveopment dimond based on fourkey indicatos, shows thavealeve of developmentin thecountrycompazd with its income group. See the intoductmn.
106
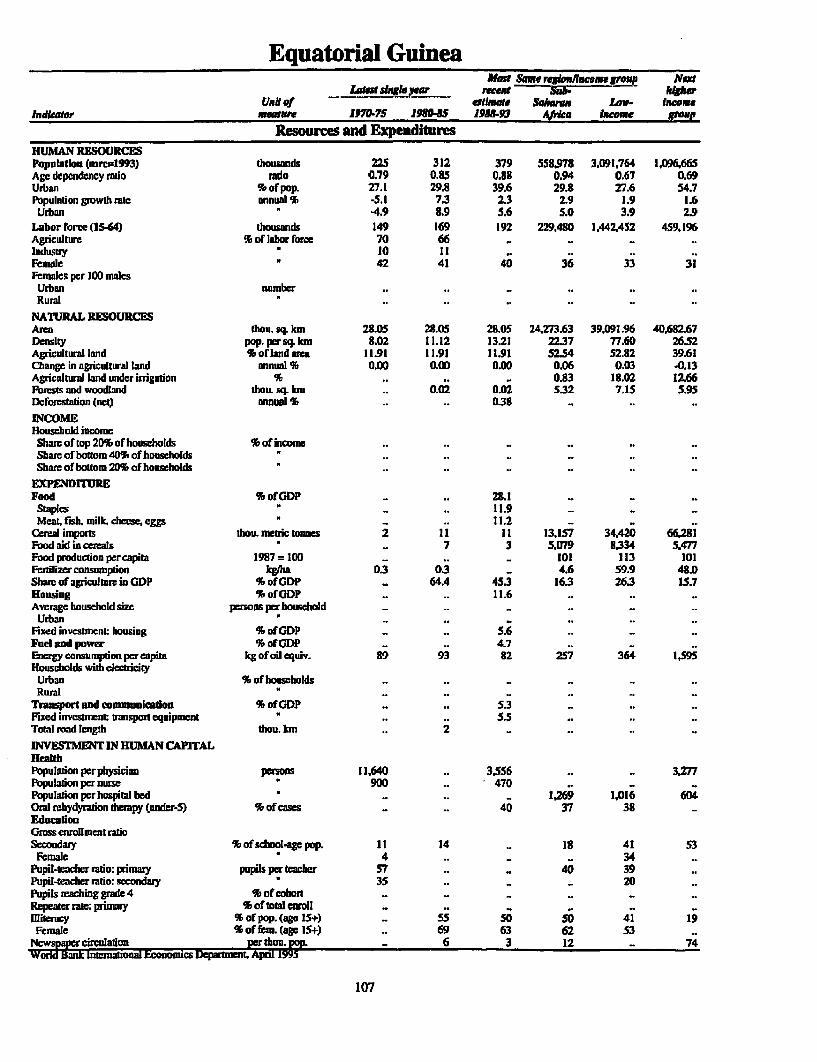
Equatorial Guineamasn Sane rqJemIlscwas aVeup Nat
&atet sian. yea MWes Sub- fIJhFf(Jail. of elimate Schemria Law- income
lufadluir Nsewi Iue o7-7 1is"- 1955-9 A4fua bwome geaup
Resource and ExpendituresHUMAN RESOURCESl'opuaitlon (mirelS93) thousands 225 312 379 5583978 3.091,764 1,096,665Age dependency railo rato 02.79 0.85 0.83 0.94 0.67 0.69Urban % of pop. 27.1 29.8 39.6 29.8 27.6 54.7Population growth rate annual % -5.1 7.3 2.3 2.9 1.9 1.6
UrbaLn -4.9 8.9 5.6 5.0 3.9 2.9Labor rorce (15-64) thousands 149 169 192 229,480 1.442.452 459.196AgricuLture S of labor force 70 66 Industry 10 I IFemale 42 41 40 36 33 31iFemales per 100 males
Urban number... Rural
NATURAL RESOURCESArea tho. sq. km 28.05 23.05 23.05 2,1.273.63 39,091.96 40,68267Density pop. per sq. km 8.02 11.12 13.21 22.37 77.60 26.52Agricultural land * of land area 11.91 11.91 11.91 52.54 52.82 39.61Change in agricultural land annual % 0.00 0.00 0.00 0.06 0.03 -0.13Agricultural lan under irrigation * .... 0.83 18.02 12.66Foress and woodland thou. sq. km . 0.02 0.02 5.32 7.15 5.95Deroretation (net) annual % .. 0-38INCOMEHouschold income
Share of top 2D% of households S of income c..Share of bottom 40% of householdsShare of bottom 20% of households...
EXPENDffUREFood %ofGDP ... 28.1
Staples ... 11.9-.. Meat. fish, milk, cbecse. eggs B... 11.2
Cerealimports thou.netdc tonnes 2 1 1 1 1 13.157 34.420 66.281Food aiduincemeals .. 7 3 5,079 3.334 5.477Fbodproduction per capita 1987=100 ...- 101 113 101Fertilizer consumption kg/ha 0.3 0.3 - 4.6 59.9 48.0)Sham ofa2gricuitore inGDP %ofGDP . 64.4 45.3 16.3 26.3 15.7Housing % of GDP ... 11.6Average household size persons per household...
UrbanFixed investmient: housing 'S of GDP S.. .6Fuel and power % OfGrDP ... 4.7 -
Energy consumption per eapitrn kg of oil equiv. 89 93 82 257 364 1,595Households with electricity
Urban S of housebolds...-Rural
Transport and conmaunleadon Sof GDP ... 5.3Fazed invesumen trasport equipment ... 55Total mad length tho.lcni. 2INVESTMENT IN HUMAN CAPiTALHealthPopulation perrphysician person 11.640 .. 3556 ... 3.277Populaton per nurse *900 470 -.
Population per hospital bed ..... 1,269 1,016 604Oral whydyration therpy (under-5) S of cae .. 40 37 38 EducatonGross enrollment ratioSecondary of school-Agepop. I11 14 -. 1s 41 53
Female 4 ..-- 34Pupil-teache ratio: primary pupils per teacher 57 ... 40 39Pupil-teacher ratio: secnday N35 . -. 20Puipils xeachinggrade 4 Sorcohort - ... .-
Repeater rate: pirimy S of total enroll .
miwracy % of pop. (agel15+) .. 55 Si S0 41 1 9Female S Offtn. (APelS4) .. 69 63 62 53w=G= circulation pe thou.pp .. 6 3 12 .. 74
Wol aInternational Economics Depamrtmn. April 1995
107

Estoniaifl Hugh ~~~ Modt SameML rabufan MM Nowt
______________ mount scrW Upper hihrU.k of eimate Ceumw miCl fuse
Iudlcar emure 1P1-07S M95 S 1MI-l Asia lucone rOpPriority Poverty Indicators
POVERTYUpper poveuty line local cmu .. ...
HeadoLmt Index * of pop. .. ..Lower povwy line local curr. . .. ..Headcount index % of pop. .. ..
GNP per capita USS . ., 3,080 2,4S0 4,350 23,680SHORT TERM INCOME INDICATORSUnskilled when wages local cuT. . ..Unskilled ndnl wasge. Rural tems oftrade N
Conaw erprice index 1937=100 . ...Lower incomeFDoe
UrbanRural
SOCIALINDICATORSPublic expenditwe on basic social services % of GDP . .. 7.5Quas enrolment ratiosPrimuy % sdhol auppp. .. .. 85 .. 105 103
Male .. .. 85 .. .. 103Femade n .. 95 .S 103
ModlityInfatntowlity prrhdaiflvebibt 21.0 20.0 16.0 24.8 35.8 7.0Undcr 5 mwrnnty N .. .. 23.0 36.4 42.6 85ramnizationMeases % group . 82.0 92.5DPr .. .. .. .. 74.2 902
Child mainutrilion (under-S) .Life expeca
Total yea 70 70 69 69 69 77Fande advanage 8.9 9.7 11.0 8. 5.9 6A
Totd f*laty rute births per womu 2.2 2.1 1.6 2.1 2.9 1.7Materall raxity ate per IW,OOOivei .. 27 41 .. _
SuppimentrY Poverty Indicatoirs
Expenditures an social security % of Il gwt exp. .. .. .. .. ,Social se coverae S on actve pop. . .. .. .. .Accs;s to safe watr tot % of pop. .. .. .. .. 6.7
Urban .. .. .. .. 93.9Rural .. .. .. .. 66.7
Accss to hea cme 66.._ _._ _ . _ _._..7..
Population growth rate GNP per capita growth rate Devlopmeut diamond6+. (ualm p) 11w(annualavere.percent)
45
2 _O- GNP Groamper -immcapita m 1t
°. F 1 F- ___ -s cli w l
-2 -10 -1970-75 1980-BS 1988-93 1970-75 1980-95 1989-93 A es o s ewar
E] Estok - _ seD- Uppe ramiddl-income - Uppesr-mid dleicm e
a. See the tehnical note, p387. b. The devedeptent diamond, bued n fir key in ates, sls the avage l of develpment in th counyeonred with its income pa. See he inruidon.
108

EstoniaMeat Same rqlrdincema egp Nat
Latet sngl per- racenui Xi-------pper higherLink of a- exflrue A C.sui midole. itcm
Indicator m un1975.75 J980485 1985.93 Arka Income piUPResources and Expenditures
HIUMAN RESOURCES-1Population (mreul993S) thousands 1,432 1.536 1,552 494.619 500,507 312,447Age dependency ratio milo 0.51 0,51I 0.11 0.57 0.62 0,49Urbain % of pop. 67.6 70.3 72.6 64,81 71.2 77.9population growth rate annual % 1.0 0.7 .0.3 0.6 2.7 0.6
Urban 1.8 1.1 0.1 1.5 1.8 0.8Labor force (15.64) thousands 715 811 812 237,897 190,136 395.641Agriculture 'A,oflIabwrforece. 1 3 12Indusitry " 42 44Feimale 4 5 48 49 47 29 3Females per 200 malesi
Urbain number...Rural4
NATURAL RESOURCESArea thou. sq. kmi 45.10 45.10 45.10 24,320.56 21,848.14 32,146.15Denasily pop. persq. km 31.75 34.06 34.52 20.20 22.51 25.l1IAgricultural land % of land ame 31.56 31.39 34.52 .. 41.26 42.80Change in agricultural land annual % 44 0.00 0.00 -1.23 0.03 -0.48Agricultural land under irrigation % ... . 7.15 8.84 13.96Forusm and woodland thou. sq. km .,. . 0.80 3.04 10.56Deorestation (net) annual %.,.INCOMEHousehold income
Share of top 20% of households % of inwcm ..
Share of bottom 40% of households . .
shar of botiomn 20% of householdsEXPENDITUREFood % ofGDP ... 18.6 ... 8.4
Staples 0...3A ... 1.6Meat, fish. milk, cheese, eggsp.. 8.4 ... 3.8
Cerea imports thou. metric lonne . 46 34Q52 48,947 77,530Food aid in cereals ... 231 4,392 544 8Fbod production per capita 1987 I 100 ...... 102 95Pertilizerconsumprion kg/ha 44 95.6 41.7 67.8 150.0Sham of agrcultumein GDP %orGDP *. 20.7 8.2 13.5 tO0Housing S OrGDP ... 4.4 6.0 11 I.7Average household size persons per household . . 3.1 .
UrbanFaxed investment: housing % of GDP ... 44 5.2. .Fuel and paver % of GDP ... 0.9 1.2 .. 2.0Energy consumption per capita kg of oil equiv. ... 0 2.959 1.632 5.203Households with electricity
Urban 'I orouscholds.....-.Rural
Transport aind cormnunleatlon % of GDP . . 59. . LFixed investment: transport equipment... 9.3 .... 2.Tomalroad length thoti,kmu 27 23 30...INVESTMENT IN HUMAN CAPITALHealthPopulation per physician person 270 216 255 362 .. 453Population per nunse 99 37 123 249 .. iPopulation per hsostal bed 90 so Jos 136 39524Oral rehydyration theapy (under-5) %b Mencses . .-. 51EducationGross enrolment ratioSweonduy % of school-age pop....... 53 92
Pupil-teacher ratio: primazy pupils per teneher.. 25 .. 25Plupil-teacher ratio: secondazy . ..
pupils rcaching grade 4 %Of cohort . .. ..
Repeater rate: primaty % of total carat. . . .
Illiteracy % ofpop. (agel15+) ... .5 14Female % of frw.(Sp l5+) .... 17
Newspae circlation pe thou. pop. 44. . 125 320wortdlHEaak lntemauonal Edbnomics DeParment, APril 1995
109

EthiopiaMari Sum. abnfceuugmunp Na;1
Xllit drlJl"r ~rlm amSu n. hlgherVAN 'f -. uiuuu Subsran 145th. Income
Jnldnftur mumn 3970-75 380-45 J9R&93 Allis Income Priority Poverty Indicators
POVERTYUpper pDovy llne local cuir, .. .. .. ..
leadcoint Index I or pop. ,, ,, ,. , 19Lnwer povermy line local cufw .. ..
Hundcount Indcx % of pop. . .. .. ..
ONI' porcapita US$ .. .. 100 520 380 1.590Sl IORT TIERM INCOME INDICATOPSUnsklllud uwban w'agai local curr. .. .Umnkilkd rural wages ,.Rural tcrmN of trade .Cosuntcr pricc Index 1987-100 38 114 189
Lower Inconmerood' 30 .. .. .
Urban 1.. 26 191Rurml
SOCIAL INDICAT'ORSPlublic expenditure on basic soclal services % of GDP .. ..aross enolment alasPrmary % sctoolagepop. 24 36 22 67 log 104
Male 32 43 26 74 116Femnale IS 28 18 60 101
MonalityInrani morality per thou. live birdi 154.0 161.0 116.6 93.1 63.1 39.0Under 5 mortality .. .. 204.0 172.3 IOIA 61.5
ImmunizationMasles age group .. 12.0 37.0 49.9 873 77.6DPT ' . 6.0 44.0 51.9 89.9 82.2
Child malnutrition (under-5) " .. 37.3 46.9 .. 40.3Lire eapectancy
Total years 41 40 48 52 62 67Female advantage m 3.2 3.2 3.2 3.3 2.1 5.9
Total fertility ratc births per woman 6.8 6.9 6.9 6.2 3.6 2.9Mntcrnal mortality mte per 100.000 RIe births 2000 452 -
Supplementary Poverty IndicatorsExpendituns on social sccurity % of total gov't exp. 4.7 5.7 3.9Social security covemge % ccon. active pop. .. ..Access to safe water wtal %of pop. 8.0 15.7 17.S .. 67.0
Urban r 5B.0 69.0 70.0 .. 78.7Rural 1.0 9.0 11.2 .. 62.0
Access to health care N .. 44.0 55.0
Population growth rate GNP per capita growth rate Development diamondb
(amnual avenge. percent) (annu vege, prent) fex cy
45
O Itt enrolbmnt
-2 1-101970-75 1980-85 1988-93 1970-75 1980-35 1988-93 Access to safe water
07 Ethiopia Edhiopia- Low-income Low-income
a. Se the technical notes, p.387. b. The developmentdiamond, based on fourkey indicatos. shows theaveng les of development in the cotntrycomnpad with its incomc group. Sec the introduction.
110

EthiopiaModt Sawe regonflmncue grmu Nex
Lates, atugh per reTNt Sub- higherUvit of schuss 5.1v Leaw- Income
Indicator ~~~~~~~~measure 1&70-7 1950-5 198.193 4FrIc iuceme group
Resources and ExpendituresHUMAN RESOURCESPopulation (mmre1993) thousands 32,221 41,137 51,859 558,978 3,091.764 1.096.665Age depedency rato ado 0,94 0.92 0.96 0,94 0.67 0.69Urban % of pop. 9.5 11.5 13.0 29.8 27.6 54.7Populatio growth nate annual % 2.3 2.5 3.0 2.9 1.9 1.6Urbn 4.2 4.2 4.7 5.0 3.9 2.9
Labor frocee (15.64) thousandis 15.912 19,182 22,543 229,480 1,44Z.452 459,196Agricultuem %orlmhr forme 12 s0Industry 7 8female 40 31 37 36 33 31'Females per lt) males
Urban number 102 123Rural 96 102
NATURAL RESOURCESArea thou. sq. kin 1,221.90 1.221.90 1,221.90 24,273.03 39,091.96 40,682.67Density pop. per sq. km 26.37 33.67 41.20 2237 77.60 26.52Agricultural land Ii of land amtn 53.93 53.66 53.34 52.54 52.82 39.61Change in agricnltmurl land annual % .0.08 -0.08 409 0.06 0.03 4013Agricultura land under irrigation % 0.27 0.27 0.28 0.83 18.02 12.66Forests and woodland thou. sq. kma. 0.15 0.14 5.32 7.15 5.95Deforestation (net) annual %N .. 0.277INCOMEHousehold incormeShare of top 20% of households 'N of income .. 41Shze ofhoatom 40% of houeholds .. 21 .
Shareof bomtom20% of houscholds .. 9EXPENDITUREFool %ofGDP .. 43.3.
Staples .. 21.1 .
Meat, fish, milk, cheese, egs. 9,4Cerea impo.us thou. metric tonnes 67 741 1,047 13,157 34,420 66,281Food aid in cemals U54 869 994 5,0V79 8,334 5.477Food production per capita 1987=100 113 99 99 101 113 101Fertilizer consumption kg/ha 0.5 1.1 2.3 4.6 59.9 48.0Share of agritcutr in ODP lb of CDP ... . 16.3 26.3 15.7HousIng %ofGDP .. 12.1 .
Average household size persons per household 5.0 .. -.
Urban 4.0 .
Fixed investment housing %of GDP 3.9 3.0Fneand pnwer % of GDP .. 6.3 - .
Energ consumption per cpits kg of oil cquiv. I5 17 23 257 364 1,595Households with eeciaWty
Urban % of households -. ..
RuralTransport and commuatctdon %ofEGDP - 7.3Faxed investment trasport e.jipment 91.2 1.6Toal road lcngth shou. kin 23 38 38INVESTNMENT IN HUTMAN CAPITALHeSshPopulation per physician persons 84485 75,160 30.560 ... 3,277Population pe,rnmrse .. 5,141Populcation per hospiud bed if3,422 3,263 3,837 1.269 1,016 604Oral rhydyrsion therapy Cunder-5) %bOf css- .. 68 37 38EductionGross enolt!nwnt ratioSeCondary % of school-agepop. 6 12 12 189 41 53
Female 4 9 1 1 .34-
Pupil-teache ratio: primnary pupils per teacher 44 48 27 40 39Pupil-teacherratio: secondary 34 43 32 .2,0
Pupils reacIring Fade 4 %kOf cohort 59 39 56 .
Repeaer rate priniy % of totalecnroll. 12illiteracy%fo.(gl+ 96 38 .5041 19Fenale % of fem 4agul5-) . - 62 53
Ne!~~Mpeirculation 2 1 12 .7
Except for population and swarea, daea for Erit rea not yet disaggmpgted and are bincuded in Ethiopia.-

FijiMewt Same gloneame grow Next
Laesf sigk yar ruce at Lwer- higherUnit of ause East mid&ek income
Indiesr fiure 1970-75 1950-8s 198893 Asia income group
Priority Poverty IndicatorsPOVERTYUpper poverty line loca cufr. .. ..
Headcount index % of pop. .. .. 12Lower povcrty linc local curr. .. ..Headcount index % of pop. .. .. .. 9
GNPpercaplta USS 1,130 1.620 24130 820 1,S90 4.350SHORT TERM INCOME INDICATORSUnskilled urban wages local cufr. .. ..Unskilled rural wagesRural tms of tradcConsufnerpriceindex 1987=100 43 93 151 . .. .Lower incomeFood - 24
Urban .........Rural
SOCIAL INDICATORSPublic expenditure on basic soca services t of GDP .. 10.6Gross enrollment ratiosPrimauy % srhoolagepop. 115 122 128 11B 104 105Mnic 115 122 128 123Fcmale ' 115 122 127 115
MortalityInfant mortity per thou. live births 45.0 31.0 22.4 35.5 39.0 35.8Under S mo ity .. .. - 605 615 42A
lmmunizalionMcasles % age group 5. S7.0 69.0 93.0 77.6 82.0DPr i .. 69.0 98.1 95.0 82.2 74.2
Child malnutrition (under-5) *. .. .. 24.1Life expectaucyTotal yCeaS 65 69 72 68 67 69Female advantage 3.1 4.0 4.2 3.6 5.9 5.9
Total fetiity rate birt perwoman 4.2 3.8 2.9 2.3 2.9 2.9Maremnamortalityrate perl00.000livebirts .. 47 90 116
Supplemenary Poverty IndicatorsExpenditues on social security % of total gov't exp 2.5 7.6 3.6 .. _ _Social security covage * econ. active P.p'. .. ..Access to safe water tota *of pop. 69.0 67.7 79.3 67.1 .. 8.7
Urbam 9 89.0 100.0 95.9 83.5 . 939Rural 56.0 48.0 6a8 61.3 .. 66.7
AcCss to health a.. 100.0 99.0
Population growth rate GNP per capita growth rate Development dimondb(annud avege. percent) p(e.rc average, rcent) Lifectancy
4 -- 5
2 - 0 - r K 1 | GNP Gr1ss
-2-11970-75 198 1988-93 1970-75 19085 1988-93 Access to saf water
ED Ni,i _ FXiji- mLowr-iddle-income - m ome
a See the ehaic noltes p387. b. Mhe developnmnt diamod. based on four key india shows dth avemg levd of devdopmnt in the countrycompared with its income group. See the intoduction.
112

Fijimost Safme reglawflaeenegrora Next
Latest zf,e year rwet Lower- higherVail of enirnee Eart midde- Encase
Indikator measure 1970-75 19N4S 1M9k3P Asias Inae group
Resources and ExpendifturHUMAN P.ESOURCFSPopulation (mre=1993) thousands 576 680 762 1,713.883 1,096,665 500.507Age dependency ratio radio 0.73 0.69 0.68 0.54 0.69 0.62Urban % ofpop. 36.7 313 40.1 31.3 54.7 71.2Population growth rate aunnaal% 2.1 IA4 IA IA4 1.6 1.7
Urban 3.1 1.8 2.1 4.0 2.9 1.3Labor forme (15.64) thousands 181 231 269 942.977 459.196 190,136Agriculure Sof labor foce 49 46Industry 1 7 1 7Female Is1 1 9 21 41 3i 29Femnales per 100 males
Urban numbe . .
RundNATURAL RESOURCESArea thou. sq. km 13.27 18.27 18.27 16,367.91 40,682.67 21,848.14Density pop. per sq-kmn 31-53 37.25 41.12 103.27 26.52 22.52Agricultural land % or land ara 13.41 1.8.3 23.81 44.21 39.61 41.26Change in agriculbhri laud annual S zo0o 4.55 2.59 0.24 -0.13 0.03Agriculiural lan under itrigation % D.41 0.29 0.23 14.63 12.66 3.84Forests and woodland thou. sq. km .. 0.01 0.01 4.06 5195 3.04Dcfoittation (net) annual % .. 0.00
INCOMEHousehold income,
Share of top 20%or households Of income 43 .
Sham orbotonm 40% of housholds 15 . ..
Sham or'bottom 20% of households S .
EXPENDITUREFood %of GDP .. 19.5 -.
Staples Meat, fish, mnilk, cheese, eggs
Cerealinmports thou. metdcwnnmcs 57 86 116 30.036 66,281 48.947Food aid in crcals -14 2 5 447 5.477 £44Foodproduction per cmpia 1937=1 00 93 106 116 115 101 102FertiHizr consumption kg/ba 47.1 39.5 30.1 76A 43.0 67.3Share of agriculturrc in GDP % of GDP 23.5 16.4 16.3 17.1 1517 1.0Honusig %ofGIDP .. 9.2Avenge househod size person perhousehold .
UrbanFixed investment housing S of GDP...Fuel and power S of CDP...Encrgyconsuznption percapita kg of oilceqniv. .516 538 325 63'2 1,595 1,632Houseolds with electicity
Urban % orhousehokds...Rural
Transport and connunlkatlon S ofGODP .. .5Fixed investmet transport equipment-Total mad length thou. kin 34
INVETSrMENT IN HUMAN CAPITALHealthPopuamnon per physician perons 2I00 2007 2Z770 1,063 3.277Populaton per nurse 60D 486 - 1.490Population per hospital bed 30D 362 .. 612 604 395Oral schydlyration therap (under-5) S of caesoo. 1 6 32 .. 51EducatlmsGross enrollnmen ratioSecondary % of school-4agepop. 66 5 1 52 53 53 53
Female 66 51 52 47 Pupil-teacher ratio: primary pupils per tehahe 32 29 3 1 23 .. 25Pupil-teachrratio: secondary 24 16 20 16 Pupils arhing grade 4 % of cohort 94 95 .. 92Rpcpr atmte:pdmnary % oftIota elen l 7 3 .. 6Ilitracy % of pop. (BgP 15+) is15. 22 1 9 14
Female % of frnL(ogel5+) .. 19 .. 36 .. 17Nm 7aPercLrcubbon md op 35 31 36 .. 74 125
113

FinlandMost Same regInfincome sroup
LttiE singek year recentUnit qf e-ima-e Dial-
Indkator measure 1974-75 1980985 J18-93 IncomePriority Poverty Indicators
POVERTYUpper povety line local curt.
Headeount index S of pop.Lower poerty line local curr.
Headcouni index % of pop.
GNP per capita USS 5,70 10.470 19,300 23,680SHORT TERM INCOME INDICATORSUnskilled urban wages local CIuT.Unsklled rnual wages .Rua teram of tradeConsumer price indcx 1987=100 37 93 130Lower incoreFIood" 20 95 112.
UrbanRural". . ..
SOCIAL INDICATORSPubEc expenditure on basic social services 9 of GDPGrmss esollment ratiosPrimmy % school age pop. 102 102 100 103
Male 103 103 100 103Fenmle 101 102 99 103
MortalityInfant mortality per thou. live birfs 12.0 6.0 5.0 7.0Under S mortality .. .. 6.0 8.5
ImmnizandonMeasles %bagegroup .. 81.0 97.0 s5DPT .. 92.0 95.0 90.2
Child malnutrition (under-5) .life expectancyTotal years 71 74 76 77Female advant;p "8.4 7.9 7.8 6.4
Total &crtiliy rate 1bins per woman 1.6 1.7 1.9 1.7Maternal mortality ale per lOOI,OOlivebirths .. 5
Supplementay Poverty IndicatorsExpenditures on soc secuity % of towl govt exp.Social security coverag % eon. active pop.Access to safe water total % of pop. .. 95.4 100.0
Urban 86.6 99.0 100.0Ruoa 54.2 90.0 100.0
Aceesstoheathcae u.. 100.0 100.0
Population growth rate G| N per capita growth rate Development diamondb(annu avege. percent) (anua ag, peret) lfe cy
45
0- I I 1 1 1 1 1 1 1 | -5 f
-2 -101970-75 19 8 1988-93 1970-75 1980-85 1988-93 Acesstosafewatr
LI Finland _ FinIs.!l- High-income - lhjcm
a. See the technical note p387. b. The development diamond, based on four key indiatr shows the average level of development in the countrycompaed with its income giwp. See the itroductionL
114

FinlandMost Swae regloululncone grop
Lctest snle year reentUnit of esduafe Bigb-
Indicator measure 1970-75 1980985 1988-93 Income
Resources and ExpendituresHUMAN RESOURCESPopulation (mren=1993) thousands 4,711 4,902 5,058 812,447Age dependency ratio ratio 0.49 0.47 0.49 0.49Urban % of pop. 58.3 59.8 62.5 77.9Population growth rage annual % 0.5 0.5 0.5 0.6
Urban 3.2 0.5 1.1 0.8Labor ferce (I5-64) thousands 2.313 2.488 2,572 395.641Agriculturm % of labor rorce 16 12Industry 35 35Female 45 47 47 38Females per I00 male
Urban number 109 [OsRural - 95 92
NATURAL RESOURCESArea thou. sq. km 338.13 338.13 338.13 32Z146.15Density pop. per sq. km 13.93 1450 14.89 25.11Agiicultuua land % of land amea 9.20 8.35 8.64 42.80Change in agricultural land annual % -0.39 -1.17 -0.53 -0.48Agriculturl land under irrigation % 1.43 2.44 2A3 13.96Forests and woodland thou. sq. km .. 0.23 0.23 10.56Deforestation (net) annual % .. .. -0.02
LNCOMEHouschold incomeSharc of top 20% of houscholds of income .. 3BShare of bottom 40% of houscholds .. 8Share of bottom 20% of households .. 6
EXPENDlTUREFood %orGDP .. 10.7 7.9 S.4
Staples .. 2.0 1.6 1.6Meat rish, milk, cheese, cggs .. 4.8 3.7 3.8
Cbe31 impons thou. metric tonnes 267 130 10 77,530Food aid in cereals .. .. .. 8Foodproductionpercapita 1987= 100 105 114 104 95Ferdlizerconsumpdon kgfha 184.5 199.4 130.1 150.0Share of agricultumm in GDP %a of GDP 9.9 73 44Housing %ofGDP .. 9.8 9.0 11.7Average household size persons per household 2.7 2.6 - _
Urban 2.5 2.5Faxed investment housing %of GDP S.1 3.8 7.3 5.0Fael and power % ofGDP .. 2.5 t.S 2.0Energy consumption per capita kg of oil equiv. 4,253 5336 5.635 5.203Households with eectricity
Urban % of householdsRural
Transport and communication %ofGDP .. 9.3 9.1 8.8Fixed investment: tansport equipment 2.6 1.6 2.1 2.1Total road length thou. km 74 76 76INVEMENT IN HUMAN CAPITALHealthPopulation per physician persons 961 443 406 453Population per nurse 128 59Populatimo per hospital bed 77 64 93 145Oral rehydyrazion deapy (undcr-5) Fe of casEducationGross enrollment ratioSecondary % of school-age pop. 89 104 121 92
Female 94 112 133 94Pupil-teacher rado: primary pupils per teacher 19 15 18Pupil-teacher ratio: secondary 15 14Pupils reaching grade 4 % of cohort 98 100 98Repeatr rate: primary % oftotal enroll .. .. 0Illiteracy % of pop. (age 15+) .. .. t
Female o of fem. (age 15+) .. _ tNtwspaper rculation per thouL pp. 439 543 512 320World Balk Inuemational Economics Deparutent. April 1995
115

FranceMali ScM4 regiefificeme group
Lass skigt ear rweanUniu of clhmate High-
indiator msmin& 1970.75 1980185 1985.93 Incomc
Priority Povert IndicatorsPOVERTYUpper poverty line local cur.
Headcount index % orpop.Lower poverty line local curr.Headcount Index * or pop.
GNP per capita US$ 6,530 9.420 22.490 23.680SHORT TERM INCOME INDICATORSUnskidled urban wages local curr.Unskilled rural wages .RuMl tms Of tdeConsumer price index 1987=100 36 94 119
Lower income ....Food' 24 95 114 .
UrbanRural
SOCIAL INDICATORSPublic expenditure on basic social services % of GDPGross enrollment ratiosPrimary % scool age pop. 109 109 106 103
Male l lI1 110 107 103Pensle * 117 107 105 103
MortalityInfant monaity per thou. live birihs 16.0 9.0 7.0 7.0Under 5 nortSiy * .. .. 9.0 85
ImmunizationMeasles % age group .. 37.0 69.0 82.5DPT U .. 79.0 95.0 902
Child malnutrition (under-5)Life expecyTotal yars 72 75 77 77Female advantage 7.7 8.1 7.7 6A
Total filitynte birtis perwoman 2.3 1.9 1.7 1.7MaldJWormfityn mk per 101,O00livebirths .. 13
Supplementary Poverty IndicatorsExpaidius on noeinl security % of tol gov'texp. .. 8.7 433Soial seurity coverage *cwn. acdive pop.Access to safe wate total % of pop. .. 100.0 100.0
Urban .. 100.0 100.0Rurml * 93.7 100.0 100.0
Access to health care *m.. .. .. ..
Population growth rate GNP per capita growth rate Development diamondb(annual avea, pecent) , (aual average. percent) fexpctcy
45
it GNP Gro(iss
0 - O I ,I I p e IpO- -S capita \ / nilment
-2 -101970-75 1980-85 1988993 1970-75 1980-85 1988-93 Acces to safe water
[I Fmnce _ France- High-income High-income
a. Sce the tchnical notes. p387. K The development dimond. based on four key indicators, shows e avage level of development in the countrycompared with its income group. Sce the introducdon.
116

FranceMwt Same reonIAceme group
lateststile ja rateMUni of admale igh.
Indkiamr mianure 1970-75 198098S 1988.93 incomeResources and Expenditures
HUMAN RESOURCESPopulatdon (real9l3) thousands 52.699 55,170 57.472 812,447Age dependency ratio ratio 0.60 0.52 0.52 OA9Urbim * of pop. 73,0 73.1 72.8 77.9Population growth rate annual * 0.8 0.5 OA 0.6
Urban 13 OA 0.5 0.8Labor force (15-64) thousands 22617 24,639 25,764 395,641Agricultum 4 of labor rtc, I 1 9Industry 37 35Female * 38 40 40 38Females per 100 males
Urban number 101 102Rum] * 93 93
NATURAL RESOURCESArea thou. sq. km 551.50 551.50 551.50 32.146.15Density pop, per sq. km 95.56 100.04 103.75 25.11Agriculturaland % of land area 5.82 57.16 55.18 42.80Change in agricultural land annual % -0.26 -0.21 -0.26 -OAKAgricultural land under iigaidon % 2.10 3.34 3.92 13.96Forestsandwoodland thou. sq. km .. 0.13 0.14 10.56Deforestation (net) annual % .. .. 40.07`
INCOMEHousehold incomeShare of top 20% of households * of income 46 38Share of bottom 40% of households * 16 22Shar of bottom 20% of households * 5 8
EXPENDITUREFood %ofGDP 12.3 11.3 9.5 8
Staples ' 1.8 1.6 1.4 1.6MeaLtishmilk. cheemseggs 65 6.0 5.1 3.8
Cercal imports thou. metric tonnes 1.295 1.216 1,188 77,530Food aid in cereals ". .. .. 8Foodproductionper capita 1987= 100 85 99 95 95FertilirrconsumptiDn kg/ha 144.8 181.1 1493 150.0Sharc of agnculture in GDP %ofGDP .. 3.9 2.8Housing *ofGDP 9A 11.9 11.6 11.7Avenge household size persons per household 2.9
Urban k 2.8Fixed investment housing % of GDP 7.6 2.6 5.2 5.0Fuel and power % of GDP 2.3 3.4 2.2 2.0Enegy consumpion pcr capita kg of oil equiv. 3,078 3.637 4.031 S,203Houscholds with electricity
Urban % of householdsRural
Transport and comnunication % of GDP 7.5 9.0 10.1 B.8Faxed investment transport equipment * 2.0 2.7 1.8 2.1Total road length thou. km 801 805 806
INVESTMENT IN HUMAN CAPITALHealthPopuation per physician persons 747 461 .. 453Populationpernwrse - 272 111 .. .Popultion perhospital bed 139 .. 109 145Oral rehydyration therapy (under-S) % of casesEducationGross enroUlment raioSecondary % of school-age pop. 82 90 101 92
Female 77 94 104 94Pupil-teacher ratio: primary pupis per teacher 23 IS 12Pupil-teacher ratio: secondary 13 ISPupils reaching grade 4 % of cohort 87 94 97Repeater rate: primary Ut of totl enroll 9 8 5Iliteracy %t of pep. (Age 15+) .. .. t.Fmale % of fem. (ag 15+) .. .. t
Newsjrcircuation p,ardti7Lp. 201 193 205 320World 1mK nImernatima EfonsdlHisoDepanM, Apnl 1951
117

French PolynesiaMel SeA reanfle come pwp
LW StWs yer rantChit of climteic Higfr
luIkater uew 197J&75 lUOSS IJ88 93 Inme
Priority Poverty IndicatorsIPOVERTEUpper povety line loc curr.
Hcadcount index % of pop.Lower povet line local ctr.Headount indx % of pop.
GNP pcr capitA US .. .. .. 23.680SHORT TERM INCOME INDICATORSUnsidlled hbun wages local cumUnskilled mrl wagesRurl terms of tradeConsuner price index 1987=100
Lower incomeFoode*. . ..
UrbanRural
SOCIAL INDICATORSPublic expenditur on basic socil rices % of GDPGross cvlineat rtiosPFimuny % school agC pop. .. .. .. 103Male .. .. .. 103Female * .. .. .. 103
Modalityinfant mortality per dho.. live birtis 64.0 30.0 16h 7.0Under 5 modlity * .. .. .. 8.5
ImnmwnizationMeasles % age group .. 79.0 81.0 32-5DPT * .. 7,.0 89.0 90.2
Child manutrition (under-S) * .Life expectancyTotal years 61 66 70 77Female advaMtae* 3.7 5.0 5.6 6A
Toraleility rate birthsperwoman S.I 3.8 32 1.7Matdna mortlity rate per 100,000 live birts .. .. .
Supplementary Poverty bIdicatorsExpenditurs on social security % of tot gov't cxp.Social seurity coverae cnt active pop.Acce to sa water total % of pop.
UrbanRural * .. ..
Access to health car m ... . ..
Population growth rate GNP per capita grow&t rate Development diamond0
(annual avera per (annual averaep. perent) Life e
4 -- 5
ONP Gross2 [ ] [ ] 0 I I per1- pruaayI.~~~~~~~~ ~~~~~~.I ~~~~~~capita carolInas0 _ + I -5->
-2 --- 101970-75 198085 19M-93 1970-75 1980-85 1988-93 Acces to safe water
a FrnchPolynesia _ French Polynesia- migb-incone High-income
L See the tchnial noes p387. b The dvedopment dianoed based on four key indicatos hows the avea lvel of devdopment in the countaycompaud wi its incomc group. SWe the intoduction.
118

French PolynesiaNeat Soar ngiouiLuemem group
Laces swglf year nMeatSU(Ja of ni ate il(gh
Indkeor mesue IJflh14 JEW& 11114-3 IncoeResources and Expenditures
HUMAN RESOURCESPopuiatom (mre=1P3) thousands 130 174 21D 812,447Age dependency ratio raio 0.84 0.66 0.63 0.49Urban % of pop. 56.0 57.3 56.4 77.9Population growth nte annual % 3.2 2.8 2.2 0.6
Urban 3.9 2.9 2.2 0.8
Labor force (15-64) thousands 42 57 66 395,641Agriculture S of labor forceIndustryFemalc * 24 26 27 38Females per 100 males
Urban numberRural
NATURAL RESOURCESArea thou. sq. km 4.00 4.00 4.0D 32,146.15Density pop. per sq. km 32.50 43.50 5l.47 25.11Agricultural land * of land area 12.84 12.84 12.84 42.80Change in agricultural land annual % 0.00 0.00 0.00 0.48Agricultural land under irrigation S .. .. .. 13.96Forests and woodland itou. sq. km .. 0.OD 0.00 10.56Deforcstation (net) annual% .. . 0.00
INCOMEHousehold income
Share of top 20% of households % of income .. .. .. .Sharc of botom 40* of householdsShun of bottom 20* of households
EXPENDITUREFood % of GDP .. A. .. 8
Staples .. .. .. 1.6Meam fish, milk, cheese, eggs .. .. .. 3.8
Cereal imports thou.rmetrictwnes 20 31 31 77,530Food aid in cereals 6 .. .. .. 8Food prduction per capita 1987 100 181 100 80 95Fertilizer consunption kg/ha 6A 23A 21.3 150.0Share of agricultum in CDP S of GDP .. .. .Housing % of GDP .. .. .. 11.7Aveage household size persons per household
UrbanFixed investment housing S%ofGCP .. .. .. 5.0Fuela ndupwr % ofGDP .. .. .. 2.0Ener consumption per capita kg of oil equiv. 1,069 1.609 1,439 S,203Households with electricity
Urban * of households .. 93.0Rum)
Tmnsport and commuleatn of GDP .. .. ..
Fixed investment transport equipment * .. .. . 2.1Total road length ihou.km .. I
INVESTMENT IN HUMAN CAPITALHealthPopulation per physician persms .. 813 .. 453Population per - .. 442 .Population per hospital bed * .. .. .. 145Oral zehydyation therapy (uader-5) S of cass .. .. .. eEducationGross enrollment ratioSecondasy % of shool-age pop. 92.. .. g2
Female .. .. .. 94Pupil-tacher ratio primay pupils per tekcer 24 20 17Pupl-tacerratlo. seconday * 17 17 IS 1Pupals rnaing grad 4 s%feoht 86 93 91Repeatrate: riismay * of otl enmro 19 10Illitacy %ofpop. (ap 150I.)
Female % of fr l(a lS+) .. .. _N7 aperckcuhltion autho¶.~ 5. 107 320woaria tlanK jnt fiona al Econonjics DeparunlM A I9U9SW1
119

GabonMest Semc regmliancome group Next
ist single year remS Subi b U perj higJierUN& of erIide Sahan midtle income
Indcior measure 1970-75 1JW 85 19J8-93 4ftfa income group
Priority Povery IndicatorsPOVERTYUpper poverty line local cur. .. ..
Headeount index 9b of pop. .. ..Lower pove"q line loa curr. .. ...
Headcount index % of pop. .. ..
GNP per capita USS 2*90 3,730 4,960 520 4,350 23,680SHORT TERM INCOME INDICATORSUnskilled urban wages local curr. .. ..Unskilled ruml wagsRural terms of irmdeConsumer price index 1987=100 32 77 95Lower incomeFbod' .. 95 37
UrbanRural
SOCIAL INDICATORSPublic expenditume an basic social serices %ofGDP .. .. 7.4Cronss enrollment mrtiosPrimazy %schoolagepop. 102 113 .. 67 105 103Male ' 105 121 .. 74 .. 103Female O 1D 105 .. 60 .. 103
MortalityInfantmortlity perthou.livebluths 132.0 112.0 92.2 93.1 35.8 7.0Under S morality .. .. 154.0 172.3 42.6 8.5
lmamunizadonMeasles % age grp .. 58.0 64.0 49.9 S20 82.5DPT .. 14.0 .. 51.9 74.2 90.2
Cbild malnutrition (under-5) .. 12.8 25.0 -
Life expectuncyTotal yass 45 49 S4 52 69 77Femae advantage 3.2 3.3 3.3 3.3 5.9 6.4
Total forility mate births perwomnan 43 4.5 5A 6.2 2.9 1.7Matenal mortality rate per 100,000 live births .. 190 .. .
Supplmetary Poverty IndicatorsExpenditmes on social suity % of total grWtexp. .. ..
Social security coverage % econ. acive pop. .. ..
Access osafewatw.tota %ofpop. 1.0 495 72.0 .. 86.7Urban 6.0 75.0 90.1 .. 93.9Rural " .. 343 50.0 66.7.
Access to health casm .. 80.0 87.0
Population growth rate GNP per capita growth rate Development diamondb(anual aveag percent) (annual aveage, percent) Ute acx any
4 5
2 0it -t
0-- 1 -Scapita enrment
-2 -10
1970-75 1910-85 198-93 1970-75 19304 19S8-93 Acec to-saewn
EJ Gabon O_ bon- Upper-mie-inme Upper-middle-income
a. Seethechnical not p387. b. The devlopmentdianond. based on fourkey indiao sbows theerage level of developmnt in thcountrycompared with its income group. See tk idroducticL
120

GabonAMost Saue rge&liweome grouip 'Newt
Icies single yer recen sub- Uper- hkhglerUniti of estImat Schema midl- Income
Judicato macsun 1970-75 1980-5 1988-93 AId. Incoms. group
Resources and ExpeadiftureHUMAN REOURCESPopulation (nnc=199l) thousands 637 873 1.007 553.971 500.507 812.447Age dependncy ratio ratio 0.61 0.72 0.79 D.94 0.62 0.49Urban % of pop. 30.6 40.9 48.3 2939 71.2 77.9Population gmwth rate annual % 4.7 2.7 2.7 2.9 2.7 0.6
Urban 3.0 4.2 3.5 5.0 1.8 0.8Labor force (15-64) thousands 481 518 551 229.480 190.136 395.641Agricultur of labor force 78 75Industry I10 1 iFemale 40 38 37 36 29 38Females per 1010 males
Urban number ..
RuralNATURAL RESOURCESArea thou.. sq. kin 267.67 267.67 267.67 24,273.63 21.984.14 32Z146.15Density pop. per sq. km 2.38 3.28 3.70 22.37 22.51 25.11Agricultuml land %of land arma 20.06 19.99 20.03 52.54 41.26 42i80Changr in agricultural land mutual % 0.37 041) 0.06 0.06 0.08 -0.48Agricultural land under irrigation % ... . 0.83 8.84 13.96Fozets md woodland thanr.sq. km .. 0.19 0.18 5.32 8.04 10.56Deforestatin (net) annual % ... 0.62INCOMEHousehold incomec
Share of top 20% of households % of incmue.....-Share orbomDom 4D% of households... Sham of bottom 20% of houscholds
PEDfInEFood %of GDP .. 20.8 .. 8.4
Staples -'... 91 7. 1.6Meat fish, milk, cheese. eggs... 6.3... 3.8
Cerea impors tho. metric tomnes 63 64 77 13.157 48.947 77,530Food aid in cereas *I 0 - 5.079 544 8Food production percapita 1987=100 117 100 91 101 102 95Fertilizer consumption kgfha 0.1 0.5 0.1 4.6 67.8 150.0Shameof agricultarrin GDP % oftGDP 6.4 6.2 8.2 16.3 8.0Housing %ofGDP ... 1.4 I. . 1.Avenage household size person per household ...- -.
Urban Fixed invegunenr housing % of GDP .. 2.1 - .5.0
Fuelandpower %ofGDP ... 0.3 .... 2.Energ consumption per capita kg of oil equ iv. 799 821 953 257 1.632 5,203Households with eleciticity
Urban S of households .-.. .-
RuralTranspor and eomumunication S6 of GIDP Li- . .. .
Fixed investment trasport equipment ... 4.3 ... 2.1Total road lcngth thou.lkm 7 8 ..
mvisnmIN HUMAN CAPffALHealthPopulation per physician persons 5.2 2.111 4.279 ... 453Population per nursec 573 252 . ..
Population per hospital bed 101 705 .. 36 395 145Oral rehydyration therpy (uader-5) % of cases ..- 25 37 SI
Gross enrolmeint ratioSecondary % of sdhOl-age pop. 17 ... 18 53 92Female 12 ... .- 94
Pupil-tamcher ratio: prinmay pupils per teacher 48 46 44 4025 -.Pupl-teacher ratio secondary 4'24 21 32 ..-
Pupils reaching gradc4 S of cohort 49 79 31 -
Repeatr rat primary of totdal noll 34 32... miteasy S of pup. (age 15+) .. 44 39 SO 14 -
Female %bof fan. (agel15+) .. 7 52 62 17-wofarld cirulation pe thou 4op Ea 23 20 12 125 320
121

The GambiaMeol Same rqealaiicema #reup Nexl
latest inglekyar _e re Sub, hkherVnl of estimate Sahka Low- income
Indieflr measure 1970-7S 1980-85 1981.93 Africa Income group
Priority Poverty IndicatorsPOVERTYUpper poveny line local cur. .. ..Heacountindez %ofpop. .. .. 64 .. 19
Lowr poverty lne local cuinr. . ..HeadcounL index % of pop.
GNP per capita US$ 230 240 350 520 380 1.590SHORT TERM INCOME INDICATORSUnskilled wban wages locl o ucd .. ...
Unskiiled rural wagesRual temus of trade N
Consumer price index 1917=100 17 52 172Lower iwconceFood' I 9 ..
Urban .. 51 176 .Runml i.. .. ..
SOCAL^ INDICATORSPublic expenditure on basic socidal sermces 'lb of GDP .. .. 15.0Grss croll ment ratiosPrimay % sdhl age pop. 33 68 69 67 108 104Male N 44 84 81 74 116Female N 21 52 56 60 101
MoalaityInfant morality per thou. live births 179.0 154.0 130.0 93.1 63.1 39.0Under 5 mortity .. .. .. 172.3 101.4 61.5
lniunizationMeasles % age grup .. 75.0 .. 49.9 87.3 77.6DPT .. 77.0 .. 51.9 89.9 82.2
Child malnutrition (under-5) .. 20.0 .. .. 40.3Ufeexpecqc yToWal years 37 41 45 52 62 67Female advantage 3.1 3.2 3.2 3.3 2.1 5.9
Toal frdlity rate births per woman 6.5 6.5 5.5 6.2 3.6 2.9Matenal morlity rate per 100,000 live births .. 1500
Supplementary Poverty IndicatorsExpendihturs on socia scurity % oftotal govl exp. 3.8 3.5 2.7Social security coverage % econ. active pop. .. ..
Accesstosafewatcr: total %ofpop. 12.0 59.3 55.0 .. 67.0Urban * 97.0 97.0 78.0 .. 78.7Rumd ' 3.0 50.0 40.0 .. 62.0
Accss to hcaltha' .. 90.0 .. .. .. ..
Population growth rate GNP per capita growth rate Development diamondb(.mual avenqge. percent) {annal average. pnt)
4 5
2 .____________ _1 _ OGNP G rossper F -- tmrcapita c moment
-2 -101970-75 1980-85 198893 1970-75 1980-85 1988-93 Accss to safe waler
2 The Gambia _ The Gambia- lo-income Low-income
a. See dre technical notes, p387. b. The development diamod. bhued on four key indicatm shows the average level of devdopment in the countrycompaed with its income group. See the introduction.
122

The GambiaAfoat Same aegiRnmerom p NeOW
Latest sglj reent - hMgontUnit of~~ - ~ estimate Skvhiurn low. Incomr
Inucatr iguure I P70.75 I9J11-JS 19J8&Y3 A8ea Inc,me psoup
Resources and ExpcndituresIlUMAN RESOURCESPopulation (mre.1993) thousands 548 745 1,042 558,978 3.0914764 1,096,6o5Ag dependcncy rato Milo 0.82 0.86 0.80 0.94 0,67 0.69Urban %ofpop. 16,6 20.2 24.3 29.8 27.6 54.7Populailon growth rate annual % 3,3 3.0 4.5 2.9 1.9 1.6
Urban " 5.3 5.0 6.9 5.0 3.9 2.9Labor force (I5-64) thouNands 263 307 345 229,480 1.442.452 4S9.196Agriculture 'S of labor force 85 34 ..Industry 6 7 ..Fcmale ' 43 41 40 36 33 3IFemales pcr 100 males
Urban number .. .. ..Rural
NATURAL RESOURCESAr:a thou, sq. kni 11.30 11.30 11.30 24,273.63 39,091.96 40,682.67Density pop. per sq. km 48.50 65.93 83.19 22.37 77.60 26.52Agricultural land % of land area 24.20 25.50 27.00 52.54 52.82 39.61Change in agricultural land annual% 1.68 0.00 0.00 0.06 0.03 -0.13Agricultural land under inigalion 5b 4.13 4.71 5.56 0.83 18.02 12.66Forests and woodlnnd thou. sq. .. 0.00 0.00 532 7.15 5.95Deformstation (net) annual% .. .. 0.73INCOMEHousehold income
Shar of top 20% of houscholds % of income .. .. ..Sham of bottom 40% of householdsSham of bottom 20% of households .. .. ..
EXPENDITUREFood % of GDP .. .. 43.3
Staples 1 .. .. 16.7Meat, fish, milk. cheese, eggs .. .. 17.3
Cereal imports thou. mctric tonnes 15 73 97 13.157 34.420 66.281Foodaidincereals 9 21 6 5,079 8334 5.477Foodproductionpercapita 1987=100 172 82 61 101 113 101Fertilizer consumption kglha 3.1 15.3 3.0 4.6 59.9 48.0Shar of agricultum in GDP 9bofGDP 31.9 25.4 23.1 16.3 26.3 15.7Housing %ofGDP .. .. 7.8Avcrae household size persons pcr household 8.3 .. 9.6
Urban 6.1 .. 6.5Fixed investment housing % orGDP .. .. 2.2Fuel and power % of GDP .. .. 3.0Energy consumption per capita kg of oil equiv. 57 77 57 257 364 1.595Households with electricity
Urban % of households .. .. 410.Rural * .. .. 0.0
Transport and csnmunlcatoa 'S orGDP .. .. 5.2Fixed investment: tmnsport equipment .. .. 2.1Totu mad length thou. km 1 3 3
INVESTMIENT IN HLMAN CAPITALHealthPopulation per physician persons 25,190 12,213 .. .. .. 3.277Population per nurse .. .. ..
Population per hospital bed .. 59a .. 1.269 1.016 604Oral rehydyration therapy (under-5) % of cases .. .. 51 37 38EdueationGmss enrollment ratioSecondary % of sehoot-Age pop. 10 17 18 18 41 53
Female * 5 10 12 .. 34Pul-teacher ratio: priary pupils per teacher 26 23 30 40 39Pupit-teacherratio: secondary 20 20 .. .. 20Pupilsreachinggade4 % orcohort 96 89 88Rcp&arerratr prmary %oftow enmul 10 17 IsIllitcacy %ofpop.(age 15+) .g 8o 73 S0 41 19Female % of fenL (age t5..) .. 90 84 62 53
Newspaper circulation per thou. pop. .- 5 2 12 .. 74World Bank international Ecnonncs LDeparenCt, Aprl 1995
123

GeorgiaMut Same rqIeueanepy Next
_______l -r recnt bropeWisuNia of esUmfe t Celn l Zn. lan
Indluar mnure 1970X.7 lo" If&9I ArAni lcere preup
Priority Poverty IndlcktorsPOVERTYUpporpovwnylinm local curr. .. .. 1.500 ,, ,,
loadeount lndea % of pop. .. .. 30 .. 19Lower povurty limo local aurr.
Hoadeount Index * of pop. .. ..
GNP purcapila USS .. .. 590 2,450 380 1,590SHORT ITRM INCOME INDICATORSUnskilled urban waps local curr. .. .. .Unskilled nual wags.Rural ter fade " .. .. .. .r
Conaumerprlce ind 1987100 .. .. ...Lw income
UrbanRural
SOCIAL INDICATOItSPublic expenditura on bhua modal urvices * of ODP .. .. 6.2 ..
Goss enrollment ratiosPrimay % choollage pop. .. . . .. 108 104Mole . .. .. .. 116Femnlo .. .. .. .. 101
MonaltyInfant mortality per thou. live births 33.0 23.0 18.8 24.8 63.1 39.0Under S mortality * .. .. 20 36A 101.4 61.5
ImmunizadonMeales % ae group .. .. .. .. 87.3 77.6DlI ' .. .. .. .. 89.9 82.2
Chid malnutriton (undAer5) . .. 40.3ULf expecyTotl yeaN 69 70 73 69 62 67Femle advttage 7.9 7.8 8.2 8.8 2.1 5.9
Total ferdlity rate birds perwomn 2.6 2.3 2.1 2.1 3.6 2.9Matemal mortity rate per 100,000 live birthis 9 26 55 .. ..
Supplementary Poverty lndicatorsExpendinm en sodl security % of total pvt exp. .. .. .. .. ..
Sodial secuity covemge % econt acdve pop. .. .. .. .. ..
Accass to safe wate tot % of pop. .. .. .. 67.0Urban N 78.7Rural .. .. 99 62.0
Access to health cm
Population growth rate GNP per capita growth rate Development diamondb6~ (aiitttiiamr percent (annual aveage.: Percent) Lieepetw
45
4 wmF peO ] 5° ~~~~~~~~~~~~~~ ~~ t ~~NP \Gw ]2 0 FIe _ _ P__ _ _ OI G-imary
rn nm , capita \/eolmn(1 l''l -5nmm
-2 J..10[]r1970-75 198045 1988-93 1970-75 1980-9S 198-93 Accoss tosafewater
- Lawincomw -lwm
a, See the techical noes. p.387. b.Thbe dvelopment diamod based on four key indicas, shows the re level of develpmnt in the wuntryonipard with its incon grop. See th intducdwon.
124

______ ~~~GeorgiaMost Same regenIa&came group Next
Unit of r" SMA~f~ "eet Europe highervAir of imsh"gaw at & Cowun Len' Inincom
IudkeJor measure 1.970-75 1950 -55 198543 Asle Income gRoup
Resource and ExpendituresHUMAN RESOURCESPopulation (mnre=199) thousands 4.908 5,252 5.446 494.619 3.091.764 l.096.A65Ago dependency ratio rato 0.59 0.51 0.53 0357 0.67 0.69Urban 5w of pop. 49.5 53.9 57.5 64.8 27.6 54.7Population growth rate annual % 0.8 0.8 0.2 0.6 1.9 1.6
Urban 1.6 1.7 1.1 1.5 3.9 2.9L-abor rorc (15-.") thousands Z.2667 2.521I 237,897 1,442.452 459,196Agriculture % of labor force . 29 27industry .. 29 29 4 ~3Female ' ~.. 49 4 33Females per I100 males
Urban auwaber...Rural
NATURAL RESOURCE'SArea. thou. sq. km 69.70 69.70 69.70 24,320.56 39,091.96 40,682.67Density pop. per sq. km 70.42 75.35 77.96 20.20 77.60 26.52Agricultural land %W of land area ...... 52.82 39.61iChang in agricultural land mmual % .. 0.31 -5.31 -1.25 0.0 -0.13Agricultural land under irrigation % 11.50 13.67 14.85 7.15 18.02 12.66Forets and woodland thou. sq. km ... . 0.80 7.15 5.95Deforestation (net) annual5'....-INCOMIEHousehold income
Share of top 20% of households Wi of income...Share of bottom 4D% of householdsShame of bottom 2D% of households
Food % ofGDP...StaplesMeat, fish, milk, cheese eggs
Coere imnports thou. metric tonner. . 500 34,452 34,420 66.2811Food aid in cereals ... 170 4.392 8,334 5.477lbod productionaper capita 1987=100 ... . 113 101Fertilizcrconsumption kgla.. . 23.1 41.7 59.9 41.0Sham eof agrieulturinfGDP % of GDP .. 23.8 58.0 13.5 26.3 15.7HousIng % of GDP .. 4.7 6.0Aveng household sixe persons per household ... 4.1Urban
Fixed investment housing S of GDP .. 4.9 5.2"Fuel and power %ofGDP .. 1.0 1.2Energy consumption per capita kg of oil equiv. ... 891 2,959 364 1,595Households with electricityUrban % of households...Rural
Transport and coinmunkcaton Sof GIDP ..
Fixed investment transport equipment Total road length thou. kmn 38 37 34ITVESTI7ME IN HUMAN CAPITALHealthPopulaton per physician persons 241 186 182 362 .. 3,277Population perrus 98 86 8s 249Popukasiou perhospirad bed *102 95 95 136 106 60Oral rohydynition therapy (under-SI % of ess...... 38EducationGross emnrolmnt ratioSecondary % of school-ag pop. ...-.. 41 53
Female ...... 34Pupil-teacher ratio: pimary pupils per teachr ...... 39Pupil-teacher ratio:- secondary ...... 20Pupils rcwcing gmde 4 S olcohort...Repeater rate: primary S ftotl cEml -.. Illiterarcy S of pop. (age 15+) ... 1541 19"Female % of fern.(agel15+) - .... 53
New r 7 Prcirculation per thou. poM. . .. . 74woldBank International Economies DeCporment April Y9~5
125

GermanyMot Sameregkis ncomegroup
Laeat sm lkyea recantUnit ef eadmnte High-
ludlear are 1970-75 1DMS 198l93 income
Priority Poverty IndicatorsPOVERTYUpper poverty line locD cuwr.
Headconnt Index * of pop.Lower pvet lie loc1 curt.Hedcount Index % of pop.
GNP per capita US$ 6650* 10980* 23.560 23,680
SHORT TERM INCOME INDICATORSUnddiled urban wag locd cuir.Unsillkd rural wagesRural terms of tradeConsumer price index 1987=100 68 IOD 120 .
Lower incomeFooda 56
RuralSOCIAL INDICATORSPublic expcnditume on basic social services S of GDPGross enrollment rtios*Primary % ssool age pop. 101 99 107 103Mole 101 99 106 103Female 101 99 107 103
MortallyInfant mortity per thou. live births 21.0 11.0 6.0 7.0Under S morelaity U .. .. 7.0 8.5
ImmunizationMeasles BaePgroup .. 20.7 90.0 02L5DPF * .. 56A 80.0 90.2
Child malnutuidom (under-..Ufec tancyTota years 71 73 76 77Female advange S .9 6.5 6.3 SA
Totl fertilty rat births per woman 1.6 1.5 1.3 1.7Matral mortlity nae per 100.000 live birts .. 11
Suppkmentury Poverty IndicatorsExpendius on social security * of total govt cap.Social security coveage % eocn. active pop.
Access to safe water: 1to % of pop.UrbanRural *. ..
Access to health cam
Population growth rate GNP per capita growth rate Development diamondbt (annual ayage. perct) (annu a pent)
4 5
2 - O - ~ ; ~ ; ~ I per I prmary_________________ ~~~~~~~~~~~capita erlm enmt
-2 -101970-75 1980-5 1988-93 1970-75 19S045 1988-93 Access to safe wii
Gama _ GammayH igh-incolrc Nigh-inDcmc
L See he tchnica notcs. p387. b. Tc dcvelopment diamond based bfour key indica s, hows tave leve ordevdopmen in the coutrycompaed with its income grop. See di io
126

GermanyMarl SEfirNE oflOLliEcoeNJtt5eIi
latet stgkey recentUnit of esdIma Jgh
lieajow nselSr 197075 1930.85 1958-93 Incee
Resourcs and ExpendituresHUMAN RESOURCESPopulation (mre=1993) thousands 78,679 77,668 80,693 812,447Age dependency rado ratio 0.57 0.44 0.45 0.49Urban 9bof pop. 81.2 84.0 96.0 77.9Populaion growth rate annual * 0.3 -0.2 0.6 0.6Urban 0.6 0.2 0.8 0.8
Labor form (15-64) ihousands 44,912 48,439 42,089 395,641Agriculture Sb of labor force 9 8Industry 48 46Fenacl 41 41 40 38Fenudaes per 100 nudesUrban numberRumal
NATURAL RESOURCESArea thou. sq. km 356.91 356.91 356.91 32,146.t5Desity pop. persq. kan 220.44 217.61 224.84 25.11Agricultural land % ofland area 53.65 52.15 49.11 42.80Change in agsicultural land annual % -0.15 -0.22 -1.03 -0.49Agricultual land under irigaton % 2.38 2.58 2.77 13.96Foests and woodland thou. sq. km .. 0.10 0.11 10.56Deforeation (net) annual I .. .. -0.45INCOMEHousehold income
Shar of top 20% of households It of income 45 35Shae of bottom 40% of households I 8 24Sham of bottom 20% of households 7 10
Foed % of GDP 9.9 8.3 7.0 8.4Staples 2.0 1.3 1.1 1.6Meat, fis, milk, cheese, eggs 3.9 3.9 3.2 3.B
Crea imports thaot metric tonnes 6.606 6,482 3.533 77.530Food aid in crals " .. .. .. BFood production percapir 1967=100 80 99 90 95Fertlizerconsumption kg'ha 165.3 174.6 165.7 150.0Shme ofagricultur in GDP % ofDP .. .. 1.2Housing % orGOP 95* 12.7* 113 11Average household size pesons pe household -Urban
FLxed invesment housing 56 of GDP 5.2* 32 .0 5.0Fuel and power % ofGDP 2.4- 3.7* 2.1 2.0Energy consumption per capita kg of oil equiv. 4.017 4,632 4.170 S,203Housebolds with electricityUrban % of householdsRural
Transport and communicaen % of GDP 7.9' 9.1' 8.7 S.8Fixedinvestnent transwportcquipmnt "17* 1.9* 2.0 2.1Total mad length thou. km 470 487 501INVESTNIEW IN HUMAN CAPITALHealthPopulation per physician* persons 583 432 369 453Population per nursePopulation per hospital bed* 73 .. 118 145Ond rehydyration therapy (under-S) % of casesEducation'Gross enrollment matioSecondry lb of school-ag pop. 87 94 97 92Female 8S 93 103 94
Pupil-teadcer ratio: primary pupils per teacher 24 .. 16Pupil-teacher rado secondary 15 .. 13Pupils caching grade 4 % of obort 91 94 99Repeaner rat prmary % of total enroll -Iliteracy SE of pop. (age 15+) _ _ t -.
Female % of fen. (Car 15.) - .. tNeraLecirculadon prthou.po. 425 511 329 320World Bank infniatLonal -tconomics DcparU April I99'Data refer to Federa Rcpublic of Gemny befoe nnificationc
127

GhanaMaost Sanme remnnome group NWt
Lat t single recant Stab, higherUnR it enInate SbarMe Low Income
Indleater measure 1970-75 195(145 195-93 Afrka Income grop
Priority Poverty IndicatorsPOVERTYUpper poverty line local wxr. .. .. 32.981
Hleadcount Index % of pop. .. .. 36 .. 19 .
Lowe poverty line local curr. .. .. 16,491Headcount index % of pop. .. .. 7 .. .. ..
GNP per capita USS 300 350 430 520 320 1,590SHORT TERM INCOME INDICATORSUnskilled urban wages ocal curr. .. ..
Unskilled rual wagesRuralte moftde ..u.
Consumerpricc index 1987=100 0 57 367Lower incomeFood' .. 60 353UrbanRural*.........
SOCIAL ]INDICATORSPublic cxpcediturc on basic social services % orGDP 6.3 3.2 7.4GOrS enmlnient ratiosPrimary % sdool age pop. 71 76 74 67 108 104Male s o0 85 80 74 116Femele 62 66 67 60 101
MortalityInfant monrality per Ihou. live births 107.0 98.0 79.4 93.1 63.1 39.0Under5morality .. .. - 1723 1014 61.5
ImmunizationMeasles % ag group .. .. 39.0 49.9 87.3 77.6DPI .. 22.0 43.0 51.9 89.9 82.2
Child nalnutrition (undcr-5) n. *- 35.5 .. 40.3Life expectancy
Total years 50 52 56 52 62 67Female advantage 3.4 3.5 3.6 3.3 2.1 5.9
Totalfertility rat birhs per woman 6.6 6.5 5.9 6.2 3.6 2.9M nal mortality rnte per 100.000 live birtbs .. 413 IO00
Supplementary Poverty IndicatorsExpenditus on social security * of totl gov'texp. 6.9 4.0 6.4Social security coverage S own. active pop. .. ..
Access to safe water total *of pop. 35.0 49.2 55.7 .. 67.0Urban * 86.0 72.0 93.0 .. 78.7Rural * 14.0 39.0 39.0 .. 62.0
Accss tohealthcame .. 64.0 25.0 .. .. .
Population growth rate GNP per capita growth rate I Development diamond'(annual aveage. percent)f cpcmc
6+- (:weu:d avc pel) 10 (annual average percent) Life expetnc
4 S5
2- GN~~~~~(PP Gros2 0 ~~~~~~~~~~~~~~~~~~~~~~~~per -dm
caipita enrollnment
-2 -101970-75 1980-15 1988-93 1970-75 1980-85 198893 Accsstosafe watr
r Ghana _ Ghana- Low-income LoincoMC
t Seetde tchnical noes. p387. b. The developme dianond, based on four key indicatos, sbows the aveage level of devlopment in tecontrycompaed with its income group. See the intrduction.
128

GhanaMost Same rie&afucoeme reup Nazi
- Lates:x gAk pea recent SiF- kWhe,UK& of cUmin Sakes Law. Income
Indicator imeaure 1970.75 195045 1985-93 Africa income Primp
Resources and ExpendituresHUMAN RESOURCESPopulatIon (mre=1953) thousands 9.831 12.839 16.446 558.978 3.091,764 1.096.665Age dependenc-y ratio ratio 0.93 0.93 0.93 0394 0.67 0.69Urban 'I of pop. 30.1 32.3 35A4 29.8 27.6 54.7Populafion growih rate annual % 2.7 3.6 3.1 2.9 1.9 1.6
Urban 3.4 4.3 4.4 5.0 3.9 2.9Labor force (15-64) thousands 3,813 4,963 6.2 12 229,480 1.442.452 459.196Agriculture % of labor force 57 56Industry N1 7 1 8Female 42 41 39 36 33 31Pennies perIO nudmaesUrban number...Rural
NATURAL RESOURCESArea thou. sq. km 238.54 238354 238&54 24,273.63 39,091.96 40,682.67Density pop.qper sq. kn 41.21 53.82 66.86 22.37 77.60 26.52Agricultural land % of land amic 34.76 33.80 33.97 52.54 52.82 39.61Change in agricultural land annual % .0.38 0.00 0.00 0.06 0.03 40.13Agricultural land under irrigation % 0.09 0.09 0.10 0.83 11.02 12.66Forestsand woodland thou. sq. km .. 0.11 0.10 5.32 7.15 5.95Deforstniion (net) annual %I .. 1.34INCOMEHousehold incomeSham oftop 20% of households. %of incofme...4Share of bottom 40% of households - .is
Share of boneom 20% of households - .7
EXPENDITUREFood % of GDP 39.3 .. 40.2-Staples - .8.6
kMeats.fl, milk. cheese. eggs - .. 0o 0Cereal imports thou. metric ronnes 85 137 396 13.157 34.420 66.281Food aid in cemals 33 96 75 5.079 8.334 5.477Fbodpmduction percapita 1987= 100 135 98 97 101 113 101Fertilizer consumuption kg/aM 3.1 1.6 1.4 4.6 59.9 48-0Share of agriculture in GDP % of GDP 47.7 44.9 47.6 16.3 26.3 1517Housing % of GDP 8.4 .. 5.6 -
Avenge household size persons per household 4.7 .
UrbanFixed investment housing %of GDP ... 0.4Fuel and power % of GDP -.. 2.3..-Energy consurmption per capita kg of oil equiv. 125 76 96 257 364 1.595Households wiith electricity
Urban S of households. .
RmurlTransport and communicatIon Sof GDP 2.4 . 3.5 -
Pixed investment: transport equipmnte 1.8 1.2 2.1 -
Total mad length thou. km 3 1 35 36INVESTMENT IN HUMAN CAPITALHealthPopulation per physician per-OnS 12.895 15.162 23.178 ..- 3,27Population per nurse 688 650Populaton per hospital bed Boo 649 692 1.269 1.016 604Oral zehydlyntion therapy (under-5) % of cases ... 44 37 38EducationGrass enroihuent ratioSecondawy % of school-age pop. 37 40 38 1 8 41 53
Female 28 3 1 29 .. 34Pupikeracherralo: primay pupilsaper teacher 3 1 28 29 40 39Pupil-teachemuio: secondary N23 20 1 9 .. 20Pupils rcachiing grade 4 % of oDhort 82 75Repeater rate: primary SOf tota enrll 2 2Illitercy % of pop. (ap l5*) 70 47 40 so 41 19
Female % of fem (agel15+) .. 58 49 62 53Nesaecirculton pe thou. pop 5 1 40 189 12 .. 74
;W~omrd Bank lntemnatonal EconoFnics Department. April 19905
129

GreeceMost Sme reglonfeincone group Next
Latest sile year recentw, iU pjFrji ihigierUn t of estimate & Central middle- income
indikator measure 1970-75 1989S 1988J93 Asia Income group
Priority Poverty IndicatorsPOVERTYUpper povcrty line local cur. .. ..
Headcount index % of pop. .. ..
LAwer poverty line local curr. .. ..
Heddcount index % of pop. .. ..
CGNP per capita USS 2,590 3,490 7.390 2,450 4.350 23.6810SHORT TERM INCOME INDICATORSUnskilled urban wages local curr. .. ..
Unskilled rumi wagesRural terms of indeConsumerprice index 1987=100 13 70 246
Lower income"Food' 5 74 246
UrbanRural
SOCAL INDICATORSPublic expcnditu on basic social services dl of GDP .. ..
Goss esucilment ratiosPrim.y % school age pop. 104 104 97 .. 105 103
Male 105 104 97 .. .. 103Female 104 104 98 .. .. 103
MortulityInfant mOrality per thou. live births 34.0 15.0 9.B 24.8 35.8 7.0Under 5 mortality .. .. 11.0 36.4 42.6 8.5mnununizationMeasles % ap group .. 77.0 76.0 .. 82.0 82.5DPT .. 54.0 54.0 .. 74.2 90.2
Child malnutrition (under-S)UltexpectancyTotal years 72 75 7B 69 69 77Female advantage 3.6 4.7 5.1 B.8 5.9 6.4
Total fertiliy rate births perwoman 2.3 2.0 IA 2.1 2.9 1.7Mausn mortality rate per 100,000 live birts .. 12
Supplementary Poverty IndicatorsExpenditues on social secuity % of total govt exp. 25.3 32.3 12.2Social securiy covemge % econ. acdve pop. .. ..
Accesstossafwaler total %ofpop. 65.0 98.0 10.0 .. 86.7Urban *88.0 180.0 100.0 9.. 3.9Rural 37.0 95.0 100 0 66.7
Acces to health care m .. .. . ..
Population growth rate GNP per capita growth rate Development diamondb6 (annu al lOtpren) 01 (anmuad vezge. percent) Life expectancy
4 -- 5 -
2 (_ .--..... SSl _ : _ , _GNP G
I capita cnrollnr
-2 .1011970M75 1980485 1988-93 1970-75 198045 1988-93 Acce to safe watr
j Greece Greec- Upper-middle-incorme - Upper-middle-income
a. See the technical notes. p3 87. b. The development diamond, based on fourkey indicators shows the avnage level of .Svelopment in the countycompared with its income group. See the introduction.
130

GreeceNest Same reglen/lkscome group Next
Latest jinluge year recent - Ei-u i -luip jerI- higherUnit of a- - - *tl.t & Central middle~- income
inidicator measure 1970475 1MG-US 1981-93 Asi income grOupResources and Expenditures
HUMAN RESOURCESPoapulation (mireul993 thousands 9.047 9,934 10.365 494.619 500.507 81I2A447Age dependency ratio ratio 0.56 0.53 0.49 0.57 0.62 0.49Urban % of pop. 55.3 60.1 64.2 64.8 71.2 77.9Population growth rate annual % 0.6 0.6 0.4 0.6 1.7 0.6
Urban ' ~1.6 1.4 1.2 1's 1.8 0'sLabor rerct (15464) thousands 3.460 3.780 3,810 237.897 190.136 395.641Agriculture %oflabor romee 37 3 1
lndusuy ~ ~~~~~~~~~28 29 2Female 26 26 27 47 29 3Females per 100 males
Urban number lOS 10Y7Rural lOS 99
NATURAL RESOURCESArea thou. sq. km 131.99 131.99 131.99 24.320.56 21,848.14 32,146.15Density pup. persq. km 68.54 75.26 78.21 20.20 272.51 25.11Agricultural land % or land arca 70.74 71.33 71.D6 .. 41.26 42.80Change in agricultural land annual * -0.25 -0.13 .0.08 -1.21 0.08 -0.48Agricultural land under irrigation % 9.60 11.95 13.43 7.15 8.84 13.96Forests and woodland thou. sq. km .. 0.06 0.06 0.80 8.04 10.56Deforestation (net) annual % .. 0.01
INCOMEHousehold income
Sham or top 20l%ofhonseholdLs of income...Share of bottomn 40% of households...Share of bottomn 20% of households
EXPENDITUREFood % ofCGDP .. 20.2 22.1 8. .4B
Staples U .2.2 VS - . 1.6Meat, fish, milk, cheese. eggs. 9.8 11.4 ... 3.8
Cereal imports thou. metric tonnes 1.013 453 708 346452 48,947 77.530Fooduaidin cereals .... 4~392 544 8Foodproduction percapita 1987=100 103 iIt Ill .. 102 95Fertilizer consumption kg/ha 50.8 74.5 55.8 41.7 67.8 150.0Share of agricultur in GDP of GDP 19.1 17.5 15.4 13.5 8.0Housing of GDP .. 7.9 8.3 6.0 .. 11.7Average household size persons perhousebold 3.0 .
Urban 3.0 .
Fixed investment: housing % of GDP 5.6 0.9 4.8 5.2 .. 5.0Fuel and power S ofOGDP 2.2 1.9 1.2 .. 2.0E,nergy consumption per capita kg of oil equiv. 1.344 1.870 2.160 2.959 1.632 5.203Households with electricity
Urban S of households...Rural
Transport and comm.uicatimu %oOFDP .. A 9.8 ... 8.8Fixed investment t-masport equipFment 1.6 2.2 1.5 ... 2.1Total road length thou.lkm 37 38 38
INVESTMENT IN HlUMAN CAPITALHealthPopulatio peir physician persons 600 350 587 362 .. 453Population per nurse 994 453 .. 249Population per hospiwl bad 200 162 199 136 395 145Oral rehydiyztion therap (under-5) % of cases ...... 5 1EducationGross enrolment ratioSecondary % of school-Age pop. 78 90 98 .. 53 92Female 69 89 94 ... 94
Pupil-teacher ratio: primary pupils per teachr 30 23 19 .. 25Pupil-teacher rato: secodary 28 17 14Pupilsreaching grade 4 % of eohor 96 100 99Repeater rate: primary % of total enroll 3 0Illiteracy % of pop. (agrel5+) 16 9 7 5 14Femal %of fem. (agel15-i) .14 II . 17
Newspprcirculation pe thoLu. o. 103 136 136 .. 125 320Worldi Bank International Economies Department. Aprdi
131

GrenadaMot Scme reglon/lne.ne greup Next
Laest ringleyear receat Luts Lew higherUnit of etirme Amerka mnddle- lncome
Indcator meems 1970475 1980V15 191893 Caribbewn lncome group
Priority Povert IndicatorsPOVERTYUpper poverty tne local curr. .. ..
Headcount index % orpop. .. ..
Lower poverty line local curr. .. ..
Headcount index % of pop. .. .,
GNP per capima USS .. .. 2.30 2,930 1.590 4.350
SHORT TERM INCOME INDICATORSUnskilled urban wages local cur. .. ..
Unskilled rural wagesRural terms of trade
Consumerpriccindex 1987=100 .. 100 124Lower incomeFoode
UrbanRural
SOCIAL INDICATORSPublic pnditum on basic social scrvices * of CDP .. ..
rss nrollment tiosPrimary Wi sdwol agc pop. .. .. .. 107 104 105male
MeraliyInfant mortality per thou. live births .. .. .. 43.0 39.0 35.8UnderS monraity .. .. .. 52.2 61.5 42.6
lmnumizationMeasles age group .. 31.0 S5.0 78.7 77.6 82.DDPT .. 76.0 80.0 73.7 82.2 74.2
Child malnutriion (under-5)Life expcancy
Total ycar. .. .. .. 69 67 69Femalc advanta .. .. .. 5.3 5.9 5.9
Tomalferdlity raw birdshperwoman . .. .. 3.1 2.9 2.9Mater mortaiy rate per 100.000 live births ..
Supplementary Povert IndicatorsExpendiues on social securiy % of tol govt c _ .....
Soci swurity covage % econ. activ pop. - ..Access to safe water total 9i of pop. 83.0 .. .. 80.0 .. 36.7
Urban 100.0 .. . 90.1 . 93.9Ruml 770 .. .. 57.6 .. 66.7
Access to health cam _
Population growth rate GNP per capita growth rate Development diamonde(anual averae percent) , (a al avemg percent) Uli expctancy
GNP GrossT * - +- -- ¢ 0- per pnmary
I I | . . I | . I S \* CpitS nrollmentf r- -5
-2 1~~~~~~~~~~J1970-75 1980-35 1938-93 1970-75 1980-85 1983-93 Access to safe water
G M=& Grenada- Lower-middle-income Lower-middle-incomc
a. See the technical notes, p.387. b. The development diarond, based on four key indicauts shows the avaage level of dcvlopment in the countrycompard with its income group. See the inrduction.
132

GrenadaMast Same raeln/iauceue group Natd
Latest single pear recent LaNI" iaiiR higher(hail qf eatlmale America middle- incoer
I*dkwoir meacae 1979-75 19.985S 1988-93 Caribbean income groupResources and Expenditures
HUMAN RESOURCESPopulation (mre=1993) thousands 92 90 92 466,304 1,096,665 500,507Agc dependency ratio rato .. 0.70 0.71 0.66 0.69 0.62Urban % orpop. ... . 72.2 54.7 71.2PDopulaton gmowlh rate annual '1 -04 0.2 0.7 to0 2.6 2.7
Urbmn 1 ..... 9 2.9 I.ELabor rorce (15.64) thousands ... . 169,839 459,196 190,136Agricultture S of labor force...Industry 2 i29Female.....2319Femnales per 100 males
Urban number...Rural
NATURAL RESOURCESArea thou. sq. km 0.34 0.34 0.34 20,505.92 40,682.67 21,848.24Density pop. per sq. km 270.59 264.71 261.82 22.29 26.52 22.51Agricultural land % of land amea 50.00) 44.12 35.29 40.00 39.61 41.26Change in agricultural land amual 1 0.00 0.00 -7.69 0.39 -0.23 0.01Agiaultual land under inigation 5 .... 3A41 12.66 8.84Foatsts ant woodland thou. sq. kcm .. 0.00 0.00 9.87 5.95 8.04Deforestation (net) amnnua % .. -4.33INCOMIEHousehold income
Sham of top 20% of households %ori'ice......-Shorn of bottom 40% of households-Share of bottomn 2(1% of households ". .. ..
Food %orODP 99 28.6 . ..
Staples 3 .5.9 . .
Meat. fish. milk. cbeese,eggs 3 . 11.7 . ..
Cereal imports thou. metric tommes 8 9 12 27,7006 66,28'1 48,947Food aid in cereals 0 0 3 1,565 5.477 544Food production per capita 1987=100 95 93 84 101 101 202Fertilierconsumption kg/ha ... 16.1 48.0 67.8Share of dagrcltur in GDP % ofGDP .. 142i 10.7 9.0 1517 8.0Housing % of GDP .. 15.1 . ..
Average household size persons per household . .. ..
UrbanFixed investment housing %,of GDP .. 3.8 ....
Fuel and power % of GDP .. 3.0 . ..
Energyconsumption per capita kg of oil equiv. 163 233 283 913" 1,595 L.632Households with electricityUrban % of households . .. ..
RuralTrxauspo and comrmunication S6 Of G3DP 99 8..1...Fixed investmnt transport equipmnent 3 . 7.2 . ..
Total road length Ac.n. km . .. .-
INVESTlINT EN HFUMAN CAPITALHealthPopulation per physician persons Z,848 2,041 ... 3,277Population per nurse *776......
Populaton per hospital bed '9136 171 .. 517 604 395Oral rdUydyraioen ther'apy (under-5) % of cases ~. 70 61 .. SEducatIonGros enrollmient ratioSecondary % or'school-ngp pup. ... . 47 53 53
FemalePupil-teacher ratio: primary pupils per teacher 37 23 23 26 * 25Pupil-teacher ratio: secondary *21 3 1 27 .
Pupils rcacling gmde4 Of cohort .. 99 . ..
Repeater atc prinmay S oftbotaenroll 6 i5s..Illteacy% ofipop. (age 15+) 2 is.. 1 19 14"
Female % of ftum(agel15+) ... I .. 1 7Nes7 r ciruation er thou. po. 32 ... 5 74 125
Worlank International Economics Department. Apru 1995
133

Guadeloupeaost Same ego.me group Next
lteast thief.ear _ rcaent Lath upper- higherUnit of esimate America middle- income
Indkator measure 1970-75 950485 1955-93 Caibben income groupPriority Poverty Indicators
POVERTYUpper poveaty line local cuff. .. .Headcount index % of pop. .. ..
Lower poverly line local curt .. ..I -deount index % of pop. .. ..
GiiP per capit USS .. .. .. 2930 4,350 23.680SHORT TERM INCOME INDICATORSUnskilled urban wages local curt .. ..Unskilled nnl wagesRuml terms of utde.Consumcr plice index 1987=100 .. ..Lower incomeFood 20 ..Urban 9Rural
SOCiAL INDICATORSPublic expenditure on basic sodal services % of GDP .. ..Gross enmllmnl ratiosPrimary % school ag pop. .. .. _ 107 105 103
Male .. .. .. .. .. 103Female .. .. .. .. .. 103
MortlityInfant mortality per om. live births 42.0 15.0 11.8 43.0 35.8 7.0Under 5 moaity ... .. 2.2 42.6 8.5Immunization
Measles % age grup .. .. 78.7 S2.0 82.5DPT .. .. .. 73.7 74.2 90.2
Child malmtridon (under-5)life expectancyTotal yeas 68 72 75 69 69 77Femalc advatge 62 73 69 53 5.9 6A
Tosalfertiltyr ate birthsperwomnun 4.5 2.6 23 3.1 2.9 1.7Manl moradity rae per 100.000 Dive births .. .. _
Supplementary Poverty IndicatorsExpnditures on social secuwlitY of toItl gVt exp. .. ..
Social scurity covra $ ewon. activc pop. .. .. .Access to safe waler: toal % of pop. .. .. .. 80.0 86.7
Urban .. .. .. 90.1 939Rwual .. .. .. 57.6 66.7
Acces to he came au_ .. .. .. .. ..
Population growth rate GNP per capita growth rate Development diamonde
6+ camnuu averae perlet) 10 (annual avrage. percent) Life execny
4 -- 5-
2 0 ... 4 ~~~~~~~~~~~~~~~~~~~~~~~~~GNP Gros2 - . 0 - >lI per -pnmauy
°- 1- -S- capila \, / a~~- wontf0 EIll,I I, -5 C*
-2 _10
1970-75 19085 1988-93 1970-75 198-1Bs 1988-93 Acorn to safe water
QJ Guadeloup _ Guadeloupe- Upper-middle-income Uppermddle-inome
a See the technical notes, p387. b. The development diamond, based on four key indicatr dhows the avge leve of developmnt in the countrycompand with it inme group. See the inroduction.
134

GuadeloupeMari Samengi"acAncaregrouip Nexs
Latest shygie3esr recent Latin uClpev higher(Jili of estim.aft Amerika middle hInme
1.dkutor unmsur 197075 198045 19889.93 Caribbea Iencoe groupResource mnd Expenditures
HUMAN RESOURCESPopulation (mnre=199) thousands 329 355 413 466,304 500.507 812,447Age dependency railo ratio 0.90 0.60 0.52 0.66 Ofl 0.49Urban % of pop. 82.9 95.2 99.0 71.2 71.2 77.9Population growthratc annualS 0.6 1.6 1.8 2.0 1.7 0.6urban 2.4 3.1 2.0) 1.9 1.8 0.8
Labor force (1564) thousands 113 148 160 169,839 190,136 395,641Agriculture % or labor force 22 1 5Industry 22 20Female *40 43 42729 38Females per lOOmae
Urban number...Rural
NATURAL RESOURCESJArea hou. sq. kon 1.71 1.71 1.71 20,505.92 21,848.14 32,146.15Density pop. per sq. km 192,40 207.60 237.01 22.29 22.51 25.11Agriculturaland SoflandArs, 34.91 34.32 31.95 40.OD 41.26 42.80Chage in agrcultural land annual % 7.27 0.00 0.00 0.39 0.018 -0.48AgriculturalI landlner irrigatioa % 1.69 5.17 5.56 3A1 8.84 13.96Forcsts and woodland thou. sq. km .. 0.00 0.00 9.87 8.04 10.56Deforuutation (act) annual % .. 0.32INCOMEHousehold inconme
Share of top 20% of households % of income...Share of bottom 40% or households f .
Share of bottom 20% of households...EXrN-nIFood S of ODP ... .A.. .
Staples ... .. .1.6
Meatrt. fish. chk eese eggs . .. .. 3.8CBat. impnri thou. metric to-es 79 97 74 27.700 48.947 77,530Food aid in ceanl . . 1,565 544 8Pood production percapita 1987=100 127 109C9 101 102 95Fcrtilizerconsumption kglha 166.7 163.2 150.0 16.1 67.8 15D.0Shameof agricuture in GDP % ofGDP ... . 9.0 8.0Homsing SofGDP -.. .. . 11.7Average household size persons per household...
UrbanFixed investmient housing S of GDP .........
Fweland power %ofGDP ... . . .Energy conmption percapita kg of oil equivt 413 665 627 913 1,632 5,20Households with electricity
Ujrban % of households...Rural . ..
Transport and eomnunlcatlo, S of GDP ... .8.8
Fixed invsment transport equipment ...-... 2.1Total road length thou. km...INV'ESTNMEN IN HUMAN CAPIALHealthPopulation per physicia person 1.839 761 ... . 453Population per nurse 87 .
Population per hospitalbed 90 ... 517 395 1450.1l rehydyration them"p (under-5) % Of cases ..- .61 51IEducationGross enrollment ratioSecondary ofrschool-agepop. ... .47 53 92
Female f.....,..94
Pupil-macher ratio: primay pupils per teacer 31 22 20 26 25Pupdl-tacher mauo secondary 19 14Pupils waching rade 4 of cohort .. 96 . .
Repealer trat primary % of total enroll 20 .. 9IllitelacY % ofpop. (age 15+) .. 10 .. 15 14
Female % of 1km. (aBP 15+) is....1 17Emomdmmoo lh~~erdoum pop 7 96 86 85 125 320
World SKink anS Economa Depnutent, At 99
135

GuamMost Sime reglenAhcowm roap Next
Lanesatisgk year recent Tppe,- higherURNi of alimage awu middle- Income
Indkvor masure 1970-75 J9W0-85 1988-93 Asia Income gropupPriority Poverty Indicators
PovERTYUpper poverty lime local curr. .. ..
Headcount indcx % of pop, .. .. .. 12Lower poverty line local cuf. .. ..Hendcount index * of pop. 9
GNP per capita USS .. .. .. 820 4,350 23,680
SHORT lSRM INCOME nxICATORSUnskilled urban wages local curr. .. ..
Unskiled mrl wagesRural tem of tradeConsumer price index 1987=100 .. ..
Lower inomcmFood! * 22 84 231
Urban *Rural
SOCLAL INDICATORSPublic expenditure on basic social serices % of GDP .. ..
Grmss earolment ratiosPrmary S school age pop. .. .. .. 118 105 103Male " .. .. .. 123 .. 103Femnale .. .. .. 15 .. 103
MortalityInfiat mortlity per thou. live births 21.0 11.0 7.8 35.5 35.1 7.0Undr 5 nrlity .. .. .. 60.5 42.6 8.5
ImmunizaionMeasks % age gup .. 97.0 97.0 93.0 32.0 82.5DPT * .. 97.0 97.0 95.0 74.2 90.2
Child malnutrition (under-5) .. .. .. 24.1Lieexpeancy
Total ye 69 74 76 68 69 77Femae advantage * 7.6 5.6 5.5 3.6 5.9 6.4
Total fertilty ae birthsper wman 4.1 3.1 32 2.3 2.9 1.7Maae nmrtality rate per 100,000 live births .. .. .. 116 .
Supplementary Poverty IndicatorsExpenditures on social security So total govt exp. .. ..
Social security coverage * econ. activepop. .. ..
Access to sae wat. total %ofpop. .. .. .. 67.1 86.7Urban 9 94.0 .. .. 83.5 93.9Rural ' 98.0 .. .. 61.3 66.7
Access to health cam .
Population growth rate NGM per capita growth rate Development diamondb(annual averae. percent) (aimual average percet)
4 5
2 ~~~~~~~~~~~~~~~~GNPGrs
-20
O i _ _r | S *~~~~~~~~~~CpSE enolmn0 97 75 19J E 5 19I L9 1970-75 1980-85 1983-93 Access to safe water
J Guam- Upper-middle-incone Uam
aL Se he hdical notes, p387. b. The development diand. based on four key indicatos shows the avnge kvd of developmm in the countryconqmared with its income roup. See dte introdon.
136

GuamMast Same mqiaftlcauegaau Next
Learailhis1ajear - rweNt - hp-- i higherUR&1 of HUc art .i1*41. incom.
lfidkaior ow~~mesure 197(1-75 15I45S 1958893 Asia income mrupResources and Expeinditures
HEUMA RESOURCESPopulation (mre.1l93 thouanods 95 I119 143 1.713.883 500,507 812,447Age depedency mdc ratio 0OhS 0.57 0.54 0,54 0.62 0.49Urban %of pop. 32.5 35.7 38.1 31.3 71.2 77.9Population growth rate annual % 2.2 2.1 2.3 IA4 1.7 0.6
Urban 6.4 1.7 2.4 4.0 1.8 0.8Labor force (15-64) thousands 34 44 49 942,977 190,136 395,641Agricultur S of labo force...Industry 22 42 3Female245 27 4293Females per 1 00 males
Urawn number...Rural
NATURAL RESOURCESArea thou. sq. km 0.55 0.55 0.55 16,367.91 21,848.14 32,146.15Density pop. per sq. km 172.73 216.36 254.83 103.27 22.51 25.11Agricultundl land S of land nam 36.36 36.36 3636 4.21 41.26 42.80Orange in agricultural land annual % 0.00 0.00 0.00 D.24 0.08 *0.48Agricultural land under irrigation S .... 14.615 8.84 13.96Forets and woodland thou. sq. km . 0.00 0.01) 4.06 8.04 10.56Deforestation (net) annual % .. 0.00INCOMEHousehold incomte
SbaRm of top 205bof housebolds % of incomnc. Slameof botom 40l%of houschokdsShare of botuoin 20% of households
EXPENDITUREFood S of GDP 8.- . .. 4
staples ... .. .1.6
meat, fish. milk cheese, egg .. . .. 3.8Cereal imnports thou. metric tomic 4 109 30.036 48.947 77.530Food aid in cereals ... . 447 544 aFood prduction per capita 1987=100 ... . 115 102 95Feerdlinsu.piond kghAm. .. 76A4 67.1 150.0Sharceof agricultum in GDP % ofGDP ... . 17.1 8.0Housing % ofGDP ... .. . 11.7Averag househld size persons per household 4.3 .
Urbani 4.3 .
Faxed investment: housing S of GDP - ...... 5.0Fuel and power S of GDP ... . . 2.0Energy consumptiont per capita kg of oil equiv. 13.779 10,202 9.4711 632 1.632 5,203Households with electricity
Urban S of households...Rural
Transport mud connmnoleatlon of GDP ... .. . 8.3Fixed investment: trnsport equipment ... .. .2.1
Tomalrmadlength thou. Ian. .
INVESTMENT IN HUMAN CAPIALHeaflPopulaton per physician peros .... 1,063 .. 453Populaton per nurew. ... 1.490 4Population perrauspital bed ... .612 39514Oral rehydyratom dumapy (under-5) S of casem. .. 32 51EducationGrass enrollment ratioSecondary of school-age pop..... 53 53 92
Female ... .47 .. 94Pupil-teacher rati Ro: rmr pupils per reachr 15... 23 25Pupil-teacher ratio: secondary i.....16
Pupilsrmaching grade 4 % Of coho 29 .. 92Repeazarrat prumaryofototlalenrofl. .. 6illieray of pop. (ape 154.) .4.. 22 14
Female % of fem. (ageIS4.) 36 17
aemm circulationper thm M2kp 189 15 173 125 320
137
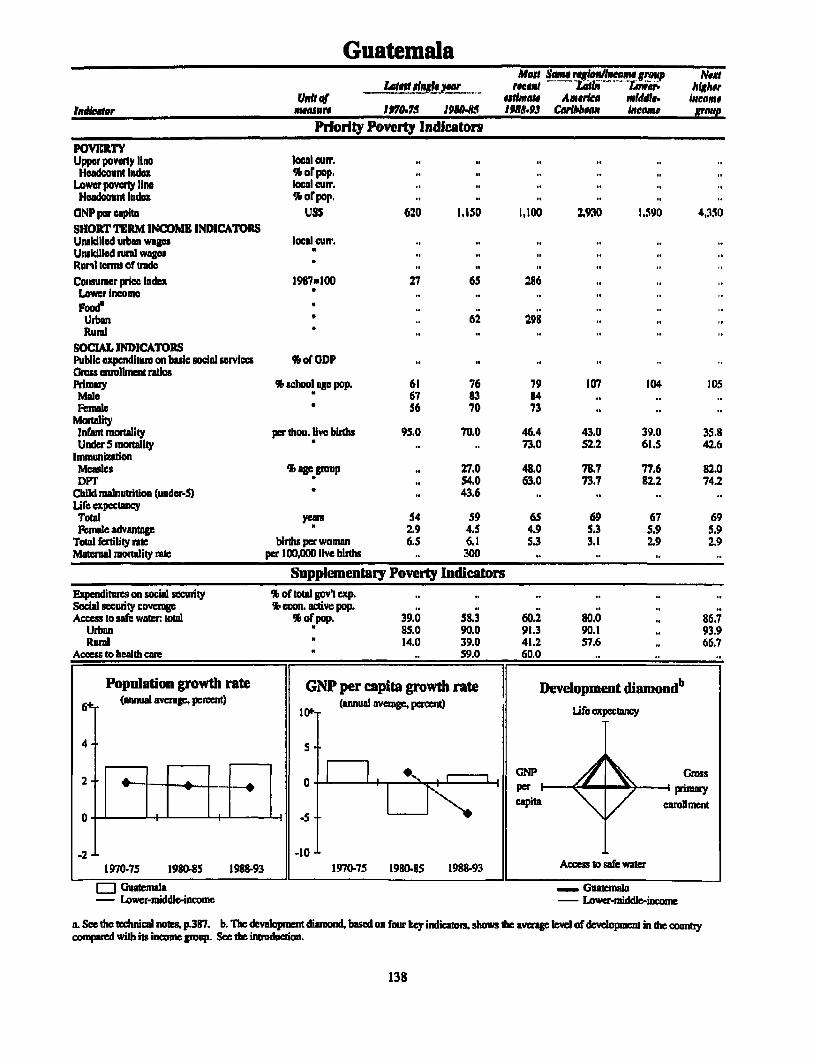
Guatemala-~~~~~ ' ~~~~~~MetG Som.rc mglean.mu.rou. NaxY
Lag te:W2 aIqqea *len a L**ItWioWdD ALgAUnt Of ettlmate Amer*c middle. Income
admur measure 197045 WMW 190.1 19 &93 Cchlnbrmn Intome group
Priority Poverty IndicatorsPOVERTYUpper poverty line local cuir. .. ..
Heodcount Index * or pop. .. ..Lower poverty line local cur. .. ..
Head nnil Index % orpop. .. ..pONP per capita USS 620 1.150 1J100 2.930 1.590 4,350SHORT TERM INCOME INDICATORSUnuilieod utban wges locl curn .. ..Unskilled mrm waeRurnl torn of trade ,Consumer price Index 1987100 27 65 286Lower IncomeFood.
Urban .. 62 298Rural a
SOCIAL INDICATORSPublic expenditure on basic sodal services 9% of ODP .. ..Cross enrmlment ratiosPimy % school ap pop. 61 76 79 107 104 105Male 67 83 94Fenile 56 70 73
MoralyInrant mnortity per thou. live births 95.0 70.0 46.4 43.0 39.0 35.8Under moSrtity .. .. 73.0 S2.2 61.5 42.6
ImmuniaionMeasles % aP group .. 27.0 41.0 78.7 77.6 82.0DPT S .. 54.0 63.0 73.7 82.2 74.2
Child malnutrition (under-S) " . 43.6Lif expectancyTotal years 54 59 6S 69 67 69Femae advantage 2.9 4.5 4.9 5.3 5.9 5S9
Total fertility ate birdisperwoman 6.5 6.1 5.3 3.1 2.9 2.9Matalw mortllity Mte per 100,000 live births .. 300
Suppleinentary Poverty IndicatorsExpendituies on soial secuity % of total gov't exp. .. ..Social secuity coverge mecon. actve pop. .. ..Access Lo safe watw woal % ofpop. 39.0 58.3 60.2 80.0 .. 86.7
Urban ' 85.0 90.0 91.3 90.1 .. 93.9Ru] ' 14.0 39.0 41.2 57.6 .. 66.7
Aceess to health cue ' .. 59.0 60.0
Population growth rate GNP per capita growth rate 1 Development diamondb(annul avrage, percent) (anual avenge.e 1cen) Lifeecac
4 -5
GNP Gross
0Tt7~~~~~~~~~~~~7F1 ~~~~~~~~Capita enrollment-2. I' I 5 = GN l a Qe
-2 -1~~~~~~~~~01970-75 1980-85 1998-93 1970-7S 1980-95 1988-93 Access tosafewattr
LI] Guatemala Guatmal- Lower-maiddle-incomne Lowermkid-income
a. See the technical notes. p3R7. b. The developrnt diamond, based on four key indiats shows the avge level of development in the countycompared widl its income grmup. See the intrrod on.
138

GuatemalaMost Sine rqlon/Incoe,irestap Next
Isalt singlyeaer recent LiMflT Wer higherunit of estimate America middle- Incoer
Indicator measre 1970.75 1989485 1955.-93 CarIbbean butanje gMropResources and Expenditures
H[UMAN RESOURCESPopulation (mre=1993) thiousands 6.023 7,963 10.029 466.3D4 1.096.665 500.507Age dependency ratio ratio 0.94 0.95 0.93 0.66 0.69 0.62Urban % or pop. 36.7 33.1 40.7 71.2 54.7 71.2Population gmwlh rate annual W 2.8 2.8 2.9 2.0 1.6 1.7
Urban 3.4 3.2 3.9 1.9 2.9 I.EL&. or rorce (15-64) thousands 1.775 2Z261 2.900 169.839 459.196 190.136
Agnoculture %ior labor force 59 57Industry 17 17Female 13 Is 17 27 31 29Females per tOO males
Urban number lOS 115Rum] ' 92 98
NATURAL RESOURCESArea thou. sq. kma 108.89 108.99 108.89 20,505.92 40,682.67 21,848.14Density pop. perrsq. km 55.31 73.13 89.47 22.29 26.52 22.51Agricultural land % of land area 26.63 29.37 30AH 40.00 39.61 41.26Change in agricultural lankd annual S 0.45 0.95 0.30 0.39 -0.13 0.08Agrcultural land under irrigation * 2.49 3.20 3198 3A41 12.66 8.84Forests and woodland thou. sq. km .. 0.05 0.04 9.87 5.95 3.04Deforestation (net) annualW ... 1174
INCOMEHousehold incomeShare of top 20%of households % of inconke 60 55 63Share of bottom 40% of houscholds. 13 14 aShare of bottom 20% of households 5 6 2
EXPENDITUREFood % ofGCDP . 29.2Staples -. AMeat, fish, milk, cheese, eggs . 12.3 . .-
Cereal imnports thou. metric taonnes 15,1 140 486 27,700 66.28'1 48.947Foodnaid incereals 9 23 109 1,565 5,477 544Food production per-capita 1987 100 115 106 100 101 101 102Fertilizer consumption krglh 19.0 29.9 47.5 16.1 48.0 67.3Shame of agriculture in GDP % of GIDP ... 25.2 9.0 15.7 8.0Housing S of GDP .. 10.8 . ..
Average hiousehold size persons per household 5.0 5.3Urban 5.0......
Fixed investment: housing %af GDP 1.5 1.3Fuel and power i ofrODP .. 3.7Energy eonsumption per capita kg of oil equiv. 195 152 159 91'3 1.595 1.632Households with electirciy
Urban S of households...Rural
Transport and oommtmicatlon S of GDP . 2.7Fixed investment: trnsport equipment 2.4 1.0Tota mad]length thou. km 17 17 13
INVESThMEN IN HUMBAN CAPITALHealthPopulaton per physicia persons 3,656 2.185 ... 3.277Populalion per nurse - . 51Populaton per bwspimia bed 500 . 673 517 604 395Oral rehydymlion therapy (under-5) % or cases ... 24 6 1 .5 1EducationGross enr'llineat ratioSecondary % of school-age pop. 12 19 28 47 53 53
Etmale 1 1 16 Pupil-teacher ratio: primary puisprtahr35 37 3426 25Pupil-teacher ratio: secoondary...Pupils rcaching grade 4 % Of cohort 37 68Repeater rate: primary S Of totaenroll I5 13qlliteracy S of pop. (agP 15+) 54 48 45 1 5 19 14Female % of fmn. (ag 15.) - 56 53 18 . 17Newsape circuation perthou. gpop 41 31 1 8 85 74 125
Worid Bank iaen itzo Ecaozucs Deparmnent. April 195
139

GuineaMost Some reogauteegroup Next
l,t afgle offr rent Sub- higherUna 4 aclmate Sahr Lou'. income
Iadkoor meoawe 1 V70-75 1984JS J988493 4Jrke Income groupPriority Poverty Indicators
POVERTYUpper poverty line local err. .. ..cHeadcountindex % ofpop. .. .. .. .. 19
Lower poverty line localen. .. .....Headcount index % of pop. .. ..
CNP per capita LVS$ .. .. 500 520 380 1,S90SHORT TERM INCOME INDICATORSUnskilled urban wages local eurr. .. ..Unskilkd rural wagesRural terms of trade
Consurnaer price index 1987-100 .. .. .. ..Lower incomeFood..
UrbanRural
SOCIAL INDICATORSPublic expcnditure on basic social services % of GDP .. .. 6.2Gross enrollment ratiosPrimary % schol ap pop. 30 34 42 67 108 104Male 40 47 57 74 116Female * 20 22 27 60 101
MortalityInfant mortality per thou. live births 177.0 1S7.0 132.0 93.1 63.1 39.0Under5 morutlity .. .. 226.0 1723 1OlA 61.5
ImmnunizationMeasles % age group .. 44.0 50.0 49.9 873 77.6DPT .. 4.0 50.0 519 89.9 82.2
Child malnutrition (under-) .. 23A 1I.0 - 403Ufe expecutncyTotal years 37 40 45 52 62 67Female advantage 1.0 1.0 1.0 3.3 2.1 5.9
Total fertlity rate biths per woman 7.0 7.0 6.9 6.2 3.6 2.9Matemrnal mortality e per 100 live births .. .. 559 .. .
Supplemeutay Poverty hindiatrsExpenditmse on social security S of tDta govtex.. .. ...
Social security coverge % ecrL. active pop. .. ..
Acees; to safe water toial 9b of pop. 14.0 .. 60.0 .. 67.0Urban 68.0 41.0 7S.0 .. 73.7Rural .. 2.0 42.0 .. 62.0
Acces to healthcare .. 13.0 45.0
Population growth rate GNP per capita growth rate Devdopment diamondb(annual verage, perCent) I (amualvar, percent) epec
45
_ _ _ _ _ _ _ _ X f7 1 1 1 nGNP Gross2 0per -i 1 w-ar
a _____________________________ ~~~~~capita = m n
-2 -10
1970-75 1980-B5 1988-93 1970-75 1980-85 1918-93 Acesstowatcr
adm Gu _ - Lowincome Lnw-ineo
a. See the technical no p387. b. i devdqpment dind based en furkey indicatos sbows the avere leve of delopment in dt countrycompared with its income group. See tbe inboduction.
140

GuineaIaanrust. lyer rZ t _su; A t'hL!r
unist of atlant ISlAW0. Law- incomeIndicator nawura J970-75 1980-85 1998543 Africa luceme gmnz
Resources and ExpendituresHUMAN RESOURCESPopulation (rnremlS3) thousands 4.149 4.987 6,306 558,978 3.091,764 1.096.665Age dependency ratio ratio 0.92 0.96 0.98 0.94 0.67 0.69Urban Sb of pop. 16.3 22.3 28.1 29.8 27.6 54.7Population growth rotc annual Sb 1.2 2.2 3.1 2.9 1.9 1.6
Urban 4A4 5.1 5.3 5.0 3.9 2.9Labor rorce (15.64) thousands 2.393 Z.846 3.272 229.480 1 2,42452 459.196Agriculture % of labor farcc 83 IIIndustry 8 9Female 42 4 1 39 36 33 31Females per I100 wales
Urban number.,.Rural
NATURAL RESOURCESArea thou. sq. kcm 245.86 245.86 245.86 24,273.63 39,091.96 40,632.67Density pop. per sq. km 16.88 20.28 24.88 22.37 77.60 26.5Agricultural land S of land ram 25.19 25.33 25.35 52.54 52.82 39.61Change in agricultund land annual Sb 0.00 0.16 0.00 0.06 0.03 -0.13Agricultural land under inilgation Sb 0.10 0.29 0.42 0.33 18.02 12.66Forests and woodland thou. sq. km .. 0.08 0.07 S.32 7.15 5.95Derorestation (net) annual Sb... 1.21INCOMEHousehold income
Share of top 20% of households Sb of income ..
Share of bottomn 40% of househods...Share of bottom 20% of households ..
EXPENDITUREFood %of GDP .. 26.5
Stapls ... 8.6Meat, fish, milk, cheese, eggs S. 9.9
Cereal imports thou, metric tonnes 67 140 335 13,157 34,42 66.281Food aid inercwals 49 52 30 51719 8.334 5.477Food production per eapima 1987=100 107 101 102 101 113 101Fertilizer consumption kglh 0.2 0.1 0.6 4.6 59.9 48.0Share or'agrculturw in CDP Sbof GDP .. 23.9 16.3 26.3 15.7Housing % ofGDP ... .5...-Average household sine peisons per household .6.7
UrbanFixed investment: housing S or G;D? .. 4.8. Fuel andpower S of GDP . 1.7 .. -
Ene-rgy consumption per capita kg or oil equziv. 68 74 66 257 364 1.595Households with electrici ty
Urban % orhousebolds...Rum]l
Transport and comunnnication sb of GD?P.. 10.1-Fixed investment transport equpipent "...1.1
Total readlength thou. km 28 29 30INVFSTMCENT IN HUMAN CAPITALHealthPopulation per physician poisos 50.649 33.961 3. .277~z
Population per nurse -3.730 5,183 ....
Population per hospital bed *569 .. 1.816 1,269 1,016 604Oral ruhydyration therapy (under-5) Sb of cases ... 2 37 38EducadionGross enrollmentt ratioSecondary % of school-age pop. 14 13 10 18 41 53
Female 7 7 5 .. 34Pupil-teaeher atio: primaay puipils per teacher 41) 36 49 40 39Pupil-teadchr ratio: secondary 26 23 29 - 20Pupils reaching grade 4 %Of cohort. 75 33 -
Repeawerare:prinmry % of totalerf COM 27 1isniiteracy %of pop. (BPeIS+) 8. 3 76 SD 41 19
Female % of fern. (BP Is+) .. 92 87 62 53Newrercirculation pe houtop I3 .. 12 - 74
141

Guinea-BissauMod Same relolnconme grup Net
Lates tigle a mcentJ Sub- hgherUna of sli latre Sakeran Low- Income
Indkcaor measre 190W-S 198WS 18-93 Africa lncome gran,p
Priority Poverty IndicatorsPOVERTYUpper povery line locil curr. .. ..
Headcount index % of pp. 49 19 19Lower poverty line local curr. .. ..
Hwadcount index * of pap. .. .. 26
GNPpercapita USS 200 180 240 520 380 1.590
SHORT TERM INCOME INDICATORSUnskilld urban wages local curr. .. ..
Unskilled rural wagesRumrl erms of trade
Consumer price index 1987=100 .. .. 1,526Lower income .Footd
UrbanRufal
SOCIAL INDICATORSPublic expendilure on basic social services % of GDP .. .. 4.6 - .. .
GiOn enrolhent ratiosPrmary % school age pop. 64 64 60 67 108 104
Malc 90 U4 77 74 116Femalc 39 43 42 60 IDI
Mortalit',Infant modality perthou. live births 183.0 163.0 137.8 93.1 63.1 39.0Under S morality _ .. 235.0 172.3 101.4 615
InununizationMeasles l age group . 35.0 _ 49.9 87.3 77.6DPT I _1. .. 51.9 89.9 82.2
Child malnutridon (under-5) .. 24.1 .. .. 40.3 -
Life xpectanucyTotal years 37 40 44 52 62 67Female advantage 3.1 3.1 3.2 3.3 2.1 5.9
Total feili rate births perwoman 5.4 5.8 S.7 6.2 3.6 2.9Matenal mortality rate per 100,000 live births .. 600 .. -. .. -
Supplementary Poverty IndicatorsExpendimtrs an social security l of total gDVtp. .. .. _.Social security coverage * econ. active pop. .. .. -
Access to safe wate total % of pop. .. 21.1 24.9 67.0.Urban .. 17.0 17.5 .. 78.7Rural .. 22.0 27.1 .. 62.0
Access to health cae .. 64.0 80.0
Population growth rate GNP per capita growth rate Development diamond"6e (annual avaIge. per ent) (annal average. percent)
4 5
2- __________________ GNP G/ Gro
0~~~ _ _ I | 1 4 | | I | -S- ~~~~~~~~~~~~~~~~capita \; 011111_o -
1970-75 1980.85 1983-93 | 1970-75 1930.8 198-93 Accxetomaeu'wa
EJC Guinea-Bissau _ Guinea-Bissau- Low-income Low-income
a. Sce the technical notes p3 8 7 . b. The dcvelopment diamond, based on fur ky indicats, shows the avemge kvel ofdevelopmnt in th countrycompared with its income group. See the intoducto.
142

Guinea-BissauMon Sm rwvivgktaamrou Aext
WeLAtet IneYea recent 3b- bightr(Jail of asSal. swltana Law- lucene
mlcnd e.w measure - .19775 1950-US 1995-l Ajfnt incoe., groupResources a.d Expeuditures
HUMAkN RESOURCESPopulation (nsre=1993) thousands 627 873 1.028 5SB.978 3,091.764 1,096.665Age dependency rfati rtio 0.72 0.79 0.83 0.94 0.67 0.69Urban Wz of pop. 15.9 ILl1 21.3 29.1 27.6 54.7Population growth rate annual % 3.6 1.9 2.1 2.9 1.9 1.6
Urban 4.6 3.3 4.3 5.0 3.9 2.9Labor force (15S4) thoeusnds 323 427 480 229.480 1.442Z452 459,196Agriculture 91 of labor force 83 82 .
Industry 3 4Female 43 42 40 36 33 3!1Females per 100D males
Urban numibera.
NATURAL RESOURCESArea thou. sq. kcm 36.12 36.12 36.12 24.273.63 39,091.96 40,68267Deniwty pop- per sq. kin 17.36 24.17 27.86 22.37 77.60 26.52Agricultural lan S of leind aica 48.54 49.79 50.50 52.54 52.82 39.6!Change in agricutural land annual % 0.00 0.36 0.00 0.06 0.03 4113Agricultura land under inription S .... 0.83 18.02 12.66Forcsts and woodland thou.msq.lkm .. .02 0.02 5.32 7.15 5.95Deforesaton (net) annal * .. 0.75INCOMEHousehold incomeShare of top 20% of househDlds Sofincm ... 59 Share ofbottom 40% of households . . 9Share of'boWor 20% of householdls ... 2
Food % ofGDP . . 36.9 .
Staples ... 12.0Meat, fish, milk, chese eggs... 13.7
Cereal impot thou. metric wanes 22 30 70 13,157 34.420 66,281Food aid in ccreas I 1 3 1 9 5,079 8,334 5,477Food prmdution per cpita 1987=100 103 97 100 101 113 lOtFertilize conswmption kg/ha 0.2 OA4 0.2 4.6 59.9 48.0Share of agriculture in GDP 51 Of GDF 47.8 42.5 44.8 16.3 26.3 1517Reusing %*of GDP -.. 11.9 -
Average household size pesos per household . ..
Urban-Fixed investmet: housing %of GDP ... 5.8i-Fuel and power S ofOGDP -.. 2.4 Energy consumption per capita kg of oil equiv. 46 38 37 2S7 364 1 595Households with electricityUrban % of households ...
Transport mud comnuncatlon Sk of GDP .. 14.1-Fixed investment btrasport equipment -. .1.4
Totalirod lengtb tbou. km .. 4 .
INVESTNENT IN HUMAN CAPITALHealthPoIpulation per physician person 17.500 7.156 .-- 3.277Population per nurse 2.863 1.112126 0;6(PopuLaidon per hospital bed S 72 529 . .6 .1 0Oral rehydyration therap (under-5) % of cases ... 26 37 38EducagionGross. enrolment ratioSoconduay % of sclool-agepop. 3 1 1 7 118 41 53
Fefmale 2 5 4 - 34Puil-teache raio: riar pupils per teacher 38 25 .. 40 39Pupil-teiacher rato: secondary I11 13 ... 20Pupils maching gmad4 % of cohort..6Repeate rate: primary % of total enrol 14 s0 ...
Iffireracy % of pop. (OFlS+) .. 70 64 50 41 19Female % of frnn.(BPelS+) .. 82 76 62 53Z7 Z? nn,eonmis10 7 6 12 .. 74
143

GuyanaMost em. rug)n/ilw.me greup Nea
Latest singbwe ar reent tIN higherUR it of ealmate America Low. income
Indkator measure 1979-75 198045 J9JOJ93 Carnigea: bincome Rroup
Priority Poverty IndicatorsPOVERTYUpper poverty line local curr. .. .. 47,500
Headornt index % of pop. .. .. 43 .. 19lower poverty line local cur. .. .. 35.000
Headcount indcx * of pop. ., .. 29
GNP per capita USS 690 490 350 2.930 380 1.590SHORT TERM INCOME INDICATORSUnskilled urban wages local curt. .. ..Unskilled rural wagesRural icrms of trade .,Consumer priee index 1987=100 16 72 158
Lower incomeFood.Urban .. 71 250Rural
SOCLL INDICATORSPublic expenditure on basic social services Su f GDP .. ..Guss enrollment ratiosPtimary *schoolagepop. 95 103 98 107 108 104
Male 96 104 98 .. 116Feimale 95 101 98 .. 101
Mortalityinfant mortality per thou. live births 79.0 63.0 46.8 43.0 63.1 39.0Under5 mortality .. .. 69.0 52.2 IOIA 61.5
ImmuniztionMeasles S age group _ 33.0 80.0 78.7 87.3 77.6DPT .. 43.0 80.0 73.7 89.9 82.2
Child malnutrition (under-5) 32.1 22.1 3.0 .. 40.3Life expecancy
Total years 60 61 65 69 62 67Female advantage 4.1 5.8 5.5 5.3 2.1 5.9
Total fertility rae birts perwoman 4.9 3.3 2.5 3.1 3.6 2.9Matemal mortality rate per 100,000 live births .. 200 .. .D .
Supplementary Poverty IndicatorsExpendiues on social secLuity % of total gov t uxp. 2.5 3.2Social security coverge % econ. active pop. . .. .. .. ..
Access to safc water total % of pop. 84.0 76.1 80.0 67.0Urban 100.0 100.0 93.6 90.1 78.7Rural 75.0 65.0 74.3 57.6 62.0
Access to health cam .. 8B8. 96.0 .. ..
Population growth rate GNP per capita growth rate Development dianonds'(annual average. percent) 1 (annal avegrage percent) Life expectancy
45
2 ~ ~ ~ ~ ~~~ 0 CliP ~~~~~~~~~~~~~Gauss2~~ GNP Gw
0 m I r -s ~~~~~~~~~~~~~~~~capita eruo
-2 -lo1970-75 1980D45 1988-93 I 1970-75 1980485 1918-93 Access o sa water
m Guyana Guyana- Lew-income l-w-inconc
a. Se the technical notes. p387. b. The delopmentdiumond. based on four key idiatos, shows the avge levd of dcvelopmen in the countyconwped with its income grup. See the introduction.

GuyanaMaos Sami raegerdic.em group NMxt
L- tl shiglewr - t Latin lherUnJal aSae A.rrkera Low. Income
Iwdicatar emmure 1970475 198085 1980-93 Caribbean Income group
Resources and ExpendituresHUMAN RESOURCESPopulation (mrem1993) thousands 734 790 816 466,304 3.091,764 1.096,665Agc dependency ratio mrio 0.91 0.68 0.58 0.66 D.67 0.69Urban % of pop. 30.0 31.7 35.2 71.2 27.6 54.7Population growth rtac annual % 0.7 0.8 0.6 2.0 1.9 1.6Urban 2.1 1.6 2.1 1.9 3.9 2.9
Labor rorce (15-64) thousands 239 337 412 169.839 1,442.452 459.196Agriculturm % of labor force 29 27Indusuy N 27 26Female 23 25 2S 27 33 31Females per 100 males
Urban number 103 ..Ruml 103 ..
NATURAL RESOURCESArea thou. sq. km 214.97 214.97 214.97 20,505.92 39.091.96 40,682.67Density pop. per sq. km 3A1 3.67 3.77 22.29 77.60 26.52Agricultural land % of land area 7.00 8.76 8.77 40.00 52.82 39.61Changc in agricultural land annual 9 0.15 0.00 0.00 0.39 0.03 -0.13Agricultural land under igigation * 8.71 7.36 7.53 3.41 18.02 12.66Fonrstsandwcodland thou.sq.km .. 0.19 0.18 9.87 7.15 5.95Deforestation (net) annual % .. .. 0.1U.
INCOMEHouschold incomeShare of top 20% of households % of income .. .. 40Shan of booom 4Dl of households n .. 12Shar of bottom 20% or households * . . 4
EXPENDITUREFood %oFGDP .. ..
StaplesMeaL, fish, milk, chese, eggs
Cerl imports thou. metric tonnes 62 1 58 27,700 34A420 66.281Food aidincereals * 1 0 58 1.565 8,334 5,477Foodproductionpercapita 1987_100 121 107 104 101 113 101Fertilizer consumption kglh 9.3 7.2 7.1 16.1 59.9 48.0Share of agriculture in GDP % of GDP 28.8 22.5 25.5 9.0 26.3 15.7Housing *ofGDP .. ..Avcragc household size persons per household 5.0 ..
UrbanFixed investment: housing % of CDP .. ..Fuel and power * of GDP .. ..Energy consumption percapita kgofoil quiv. 816 601 349 913 364 1,595Households with electridty
Urban % or househods .. ..Rural
Transport and cammnicalin % of GDP ..
Fixed investment trnsport equipment .. ..Total road length thou. km 4 9INVES-ENT IN HUMAN CAPITALHealtbPopulation per physician persons 4=022 6,220 7 3.n7Populaion per nurse N 1.156 884Population per hospital bed U 201 300 .. 517 1,016 604Oral rehydyration thcrapy (under-5) % of cases .. .. 31 61 38EducationGmss enrollment raioSconday % of school-age pop. 54 63 57 47 41 53
Female * 55 65 59 .. 34PLpil-teacher ratio: primary pupils per teacher 32 37 Z9 26 39Pupil-teacherraio: scndary 21 35 .. _ 20Pupils reaching grdc 4 % of cohort 100 94Repeater rate: primay % of total enro 8 4Illiteacy % of pop. (age 15+) 8 5 4 15 41 19Female % of fm ae 15+) .. 6 5 18 53
Newspaprcirculaion per thou.pop. 165 99 99 85 .. 74world Biank Intematonal Economics Department. April I14
145

HaitiMost Some regirnWinces. group Ne
Latest single year recent liBF hisgherUnit of a etsmate America Lew- Incens
lndnalor serare J2970.75 198458 198593 CarIbbean Income group
Priority Povcrty IndicatorsPOVERTYUpper poverty line local cur. .. ..
Headcount index % of pop. .. .. .. .. 19Lower poverty line local cur. .. ..
Headcounl index % or pop. .. ..
GNPpercapitn USS .. .. $. 2.930 380 1,590
SHORT TERM INCOME INDICATORSUnskilled urban wages local curr. .. ..
Unskilled rural waes.Rural tcrms of tradc
Consumcrprice index 1987=100 41 109 228Lower income
Food' 0 25Urban " .. 119 178Rural
SOCIAL INDICATORSPublic expenditure on basic social scrvices S; of GDP .. ..
Gros.s enrollment ratiosPrirmny % school agc pop. 60 96 56 107 108 104Male .. 102 58 .. 116Female n. 90 54 .. 101
MortalityInfantuuwrtality perthou.livebirths 135.0 108.0 84.2 43.0 63.1 39.0UnderS morality .. .. 130.0 52.2 101.4 61.5
InmnunizationMeasles % age group .. 13.0 31.0 78.7 87.3 77.6DPr S .. 12.0 41.0 73.7 89.9 82.2
Child malnutrition (under-5) 40.3Life expctancyToal years 49 53 57 69 62 67Feme advantage 2.9 3.2 34 5.3 2.1 5.9
Total fcrtility rate births per woman 5.8 5.2 4.8 3.1 3.6 2.9Maternal mortlity raut per 100.000 live births .. 340 600
Supplementary Poverty IndicatorsExpenditmure on social security % of total govt exp. .. ..
Social security coverage % econi active pop. .. ..
Accesstosafewaterttala %ofpop. 12.0 373 41.8 80.0 67.0.Urban 46.0 59.0 55.5 90.1 78.7Rural 3.0 30.0 364 57.6 62.0
Access to health camc .. .. 45.0 -
Population growth rate GNP per capita growth rate Development diamondb
(annual aveang, Parent) (anna avg paent FI ~~~~~~~~~~~~~~Life expectancy
4 -5
_____________________ GNP Gross2 I T S 0 - I _ | I I 1= 1 <+ Iper primay
0 | 1 11 1 |1 I1 .- capita enro\lnent
-2 -10 -1970-75 198045 1988-93 1970-75 1980-85 1988-93 Accesstosafekwadr
E Haiti _ Haiti- Low-incone Lov-income
a. See the technical notes, p387. b. The developmentdiamond, based on four key indicators, shows the average level of development in the countycompard with its income group. See the introduction.
146

HaitiMeet Samxe! reiN/come growp Net
Lasgs a iaglaea recnt z4n. higherLunitof cflmate Amerika Law- incoern
indicator Hmaare 1970-75 19f -S 1988-93 Caribbean incom. grouResources and Expenditures
HUMAN RESOURCESPopuladon (niDY1S) ihousands 4,920 5.865 6.893 466,304 3.091.764 1.096,665Age dependency ratio ratio 0,84 0.81 0.79 0.66 0.67 0.69UrbaLn % of pop. 21.7 26.0 30.4 71.2 27.6 54.7Population grwth rate annual % 1.7 1.8 2.0 2.0 1.9 1.6
Urban 3.5 3.6 4.0 1.9 3.9 2.9lAbor force (15-64) diousends 2,441 2,822 3,344 169,839 1,442,452 459.196Agriculture Itoflabhorforce 72 70Industry a 8Female if45 43 41 27 3 31Females periOD0 males
Urban numter 144 134Rural 103 103
NATURAL RESOURCESArea hou. sq. km 27.75 27.75 27.75 20,505.92 39,091.96 40,682.67Density pop. per sq. km 177.30 211.35 243A3 22.29 77.60 26.52Agricultural land It of land ama 51.52 51.05 50.98 40.00 52.82 39.61Change inagriculturzdlland annualS -1.39 0.00 0.29 0.39 0.03 -0.13Agricultural land under krrgation It 4.93 4.98 5.34 3.41 18.02 12.66Forest and woodland thou. sq. km .. 0.00 0.00 9.37 7.15 5.95Deforestaton (et) unnail S . 4.77
Household incomeShuuof top 20%of hoshoklds %of income ..
Share of bottom 40% of households ,.Slame of bottom 20% of households ...
Food % OfGOP?...staples Meat, fish, milk cheese eggs i
Cereal iwmps tho. mDetric tonnes 88 220 381 27.700 34,420 66,281Food aid in casmals 25 101 74 1.565 8,334 5,477Pbodproduction per capta 1987=1O0 109 108 71 101 113 101Fcrtilizerconsumptioo kg/ha 1.5 2.3 3.1 16.1 59.9 48.0Share of agricultur in GDP It of GDP ... 38.6 9.0 26.3 1.5.7Housing S of GDP...Average household size peluons per household 3.6 .
Urban if2.2 .
Fixed investmient housing Itof GDP ..
Fuel a£4 power It of ODP...Energycoumuption per capta kg of oil equiv. 34 51 47 913" 3 6'4 1.595Households with electricity
Urban S of households... Rural i
Transport and communkcatIo ItorGDP...Fixd investmet tranport equipnmetiToudmoad leigdi thou. km344
Ir4WDGNTIN HUMAN CAPITALHealth Populainper physician Persom 1,2,392 7,304 ... . 3.277Populaton per wure i 7,408 2,270Populain perbospital bed 1,299 1,384 1,326 517 1,01.6 604Oral rehydyration therapy (under-5) % of cassw.. 20 61 38EduainaGOss enroilment ratioScccndmiy % of schol-ap pop. 1 18 22 47 41 53Female 7 17 21 - 34
Papil-tenher ratio: primay pupils per tacher 40 38 21 26 39PWup-teacherratio. secodary 16 20 20 . 20Pupilsreacbing grde 4 % Of caohw 37 60Repeaterrte:primtay Of tow a mlenol 9 .
Illtercy % of pop. (or lS+) 79 52 47 15 41 19Female % of femu.(egelS.) .. 58 53 18 53
Ne7z~ Cireuatioa ertdhorL p. 19 9 7 85 .. 74
147

HondurasMost Samerem megroup N
Latetsingl year rfecent an higherUnit of flibntJe Amerka Law. Income
lntkaor meagre 1970E757 19808S 19M893 Carbbean N ntomine groFUPPriority Poverty Indicators
POVERTYUpper powrty line local cnrr. .. .
Headcoum index % of pop. .. .. .. .. 19Lower poverty line iecal cur. .. .
He-adcount index % of pop. .. .. ..
GNP per capitA USS 400 790 600 2Z930 380 1.590SHORT TERM INCOME INDICOTORSUnskilled urban wages local curr. .. ..
Unskilled marn wages * .. . 19Rnal tems of tradeConsumer price index 1987=100 42 94 228Lower income*Food' 34 97 235
UrbanRural *
SOCIAL INDICATORSPublic aependitum on basic social services %ofGDP .. 10.3 5.3Gross enrollment ratiosPrinmy t schoolagepop. 88 102 105 107 108 104MDIC 89 101 102 .. 116Female 86 103 107 .. 101
MortaliyInfant mortlity per thou. live birdhs 104.0 65.0 41.4 43.0 63.1 39.0Under 5 mortaity .. .. 56.0 52.2 1014 61.5
ImmunizationMeasles %ae group .. 51.0 86.0 78.7 87.3 77.6DPT * .. 48.0 94.0 73.7 89.9 82.2
Child malnutrition (under-5) * .. 20.8 .. .. 40.3Ufe expectancyTotal years 54 62 68 69 62 67Female advantage * 4.1 4.4 4.7 5.3 2.1 5.9
Total fertility rul births per woman 7.1 6.0 4.8 3.1 3.6 2.9Materna mortlity rat per 100,000 live births .. 82 221
Supplementary Poverty bidicatorsExpenditures on social security % of towal gov't exp. 72 ..Social security coverage % rcon. active pop. .. 12.8Acceutosafewartotad %ofpop. 41.0 51.7 .. 8D.0 67.0
Urban * 99.0 56.0 .. 90.1 78.7Rural * 10.0 49.0 .. 57.6 62.0
Access to health cm .. .. 62.0
Population growth rate GNP per capita growth rate Development diamond'(annual average, patent) (mum average percent
4 5
2 1_ O- 1 r GNP Gosms
capta \ /
-2 -101970-7S 198045 1988-93 1970-75 1980-85 1988-93 Ace wst safe wowe
2 Ho rs Honduas- Low-income Low-income
L See the tcnical noes. p387. b. The development diamond, based on four key indiors, sows x se ange level of dvelopmet in the countryconyard with its income group. See the introducion.
148

HondurasNear Sante!ragumImcnu grp Newt
Lmatr abglyerm reent LoAN hkigherUiNk of animat America low. Inome
Indlener measure flO-7S 1980-5 1NA.93 Caribea income romHpResources and Expenditures
HUMAN RESOURCESPopulation (mre=1993) fthusands 3.017 4,186 5,335 466,304 3,091,764 1,096,665Age dependency ratio ratio 1.02 0.96 0.90 0.66 0.67 0.69Urba % of pop. 32.1 37.7 42.6 71.2 27.6 S4.7PopulatIon growlh rate anual % 3.0 3.2 3.0 2.0 1.9 1.6
Urban *5.1 4.7 4.6 1.9 3.9 2.9L-abor force (15-64) thousands 909 1,303 1,768 169.939 1.442,452 459.196Agricultum % oflaborforce 63 60 -Industry 15 1 6 Feanle 15 1 7 20 27 33 31Females per 1 00 mailes
Urban number 120 110Rural * 10 92 ... .
NATURAL RESOURCESAmu thou. sq. km 112.09 112.09 112.09 20J.9052 39.09 1.96 40.682.67Density pop. per sq. kmn 26.92 37.34 46.17 22.29 77.60 26.52Agricultural land % of lanid ama 35.17 35.32 39.64 40.00 52.82 39.61Change in agricultural land amnnual 1.51 0A49 0.52 0.39 0.03 -0.13Agricultual land under irtigation * 2.03 1.90 2.07 3.41 18.0 12.66Forets and woodland ditu. sq. kcm .. 0.06 0.05 9.87 7.15 5.95Deforcstation (net) amual S 7. . 15
INCOMEHousehold income
Sham of top MS of households % orincm ... 64 -
Sham of bottom 405 of households -.. 9Shaowfdbotom 20l%of households ... 3
Food S of GDP 32.6 29.8 . ..
Staples 6.163Meat. fish, miilk cheese, eggs. IDA ..-
cerawlhport thumentric tonnes 113 112 197 27,700 34.420 6628'1Food aid in cemals 31 118 64 1,565 8,334 5,477Food pxductionper capits 198710 I100 98 96 101 113 101Fer-tilizer consumnption kg/ha 5.1 5.3 LB9 16.1 59.9 48.0Sham of agricultm in GDP % ofOGDP 24.6 19.3 16.9 9.0 26.3 15.7HousIn S Of G3DP 17.6 16.2Average household size persons per household...
UrbanFixed investmet housing %OfOGDP 3.3 2.3...-Fociand power % ofOGDP 5.1Energ consumpuion per capita kg of oil equiv. 208 200 ISO 913 364 1,595Households with electricity
Ujrban % of hoocholds . ..
RuralTransport and eomnummicationt SOf GD? 2.4 2.2Fied investment tnmsport equipment 3.3 1.3Total roodlength thou. km 7 12 1 1 .
INVESTNMETIN HUMAN CAPITALHealth Populaton per physician person 372D 1,448 2,326 ... 3,277Populaton per -u * 1.446 644 - .
Populaton per hospital bed S 57 764 949 517 1.016 604Oral rehydyration thrntp (under-5) S of camse... 70 61 38EducationGrmasserollment ratioSecoondary % of school-age pop. 16 35 19 47 41 53Female *17 35 34 .. 34
Pupil-teacher ratio: primary pupils per teache 35 38 38 26 39Pupil-teacher ratio: secoondary ...... 20Pupils reaching gmde 4 of cohort 36 46Repearerat primary SOf totalenrvoll is1 .
Nlliaeray % of pop.{(SWel5+) 43 32 217 15 41 19Female S of fem. (agelS5+) .. 35 29 18 53
N Pervltin thou4rv 33 70 3 1 85 - 7
149

Hong KongMat Sae rqeu/ffl r e genp
Letar tnl ya recentUnit of i asiAme a1gh-
lndictor mecmwe 970&75 1980-S 1905&93 lucere
Prority Poverty IndicatorsPOVElRTYUpper povery line local cuir.
Headcount index * of pop.Lower poverty line local curr.
Headeount index % of pap.
GNPpercapita USS 2,380 5,870 18,060 23,680
SHORT TERM INCOME INDICATORSUnskdlled urban wages local curr.Unskiled rnual wagesRural temis of trdecConsumerprice index 1987=100 40 92 171LowerinconeFooct .. 94 176
UrbanRuraln
SOCIAL DICATORSPublic expenditre on basic social services b of GDPGross enoUment ratiosPrimary % s ool age pop. 119 104 108 103
Male 122 105 .. 103Fenule 117 103 .. 103
Moraitylfmnt mortality per tou. live births 17.0 10.0 6.8 7.0UnderS moality .. .. 1.0 8.5
I_numntionMcsles 9 age goup .. 42.0 12.5DPr .. 87.0 3.0 90.2
Child malnutrtidon (under-5)Ufe expectnyTotal yeaus 72 75 79 77Fem.dlc advantge 7.1 5.7 6.2 6.4
TOtl ferdlity rate birth perwonan 2.9 1.8 1.2 1.7Maimnl mortality rae Fpr 100.000 live births .. 4
Supplementary Poverty IndicatorsExpenditures on social sectity S of totl govt exp.Social security coveage % ccon. active pop.Access to sde watc total * of pop. 89.0
Urban 93.0Rural * 49.0
Access to health cma. _
Population growth rate GNP per capita growth rate Development diamondb
6* (anual avarag. pecent) 1 (anndl aagv . percent) l&
45
2 fl -. Oi- ipero i_ prinmary
capita \enn ollmat
-2 -- 101970-75 1980-15 19 93 1970.75 1980-85 1988-93 Acsosas lDwaer
[f Hong Kong - Hong Kong- High-income gh-income
a. See technicl nores. p3 87. b. The development diamond. baud on four key indcat, shows the avernge level of dcvelopment in the countycompwed with its incom grop. See the inoduction.
150

Hong KongMon SamerqnRc ome guuaap
L1tesM stngle peer r NfcetUnit qr estldmaS 11sh
Indicator masugre 1970.75 19s45 19J8.93 Encase
Resources and ExpendituresHUMAN RESOURCESPopulationi (mre=1993) thousands 4.396 5.456 5.800 812.447Age dependency ratio ratio 0.56 0.45 0.42 0.49Urban % of pop. 89.7 92.9 94.6 77.9Plopulation growth mat annual % 2.2 1.6 0,6 0.6
Urban 2.6 1 9 0.7 0.8Loiter fome (15-64) thousands 2.030 2.800 3.244 395.641Agriculture % of labor forcc 0 0Industry 0 0Ftnidc 35 36 34 38Females per 100 males
Urban numbr .. 87Rural N .. 83
NATURAL RESOURCESArea thou. sq. km 1.04 1.04 1.04 32.146.15Density pop. per sq. km 4,226.92 5.246.1S 5S546.60 25.11Agncultural land % of land area 9.90 9.09 L.08 42.80Change in agricultural land annual * -16.67 0.00 0.01 -0.48Agricultural land under irrigation $ 60.00 33.33 25.0D 13.96Forests and woodland thou. sq. km .. 0.00 0.03 10.56DcforcsLation (net) annual S .. .. -0.47INCOMEHousehold incomc
Sharc or top 20% of households % of income 49 47Share orbottomm40% of households 1S 16Share of bottom 20% of households * 6 5
EXPENDITUREFood %,ofGDP .. 8.0 .. 8.4
Staples .. 0.9 .. 1.6MeaL fish. milk, hecse.eggs * 43 .. 3.8
Cereal imports thou. metric tonnes 681 861 640 77,530Food aid in cereds 2 .. 8 8Foodproductionipercapita 1987=100 163 201 164 95Fcrtilizer consumption kglha .. .. .. 150.0Shar of agriculture in GDP SofCDP 1.1 05 0o2Housing %ofGDP .. 9.8 .. 11.7Average household size persons per household 4.0 3.9
Urban *Fxcd invesiment: housing %a of GDP 32 6.2 .. 5.0Fuel and power % of GDP .. 1.2 .. 2.0Encrgy consumption per capita kg of oil cquiv. 957 1,373 2,278 5.20Households with electricity
Urban % of householdsRuial
Transport and comnunication S of GDP .. 5.S .. L8Fixed invesunent transport equipnznt * 1.8 1.3 2.1Tota road length tlou. Ian 1 1 1INVESTMENT IN HUMAN CAPITALHealthPopulation per physician persons 1,500 1,211 .. 453Population per nurse 566 795Population per hospital bed 200 204 234 145Oral rehydyration therapy (under-5) S of casesEducationGross enrollment ratioSecondary % of school-age pop. 49 72 - 92
Female 47 75 .. 94Pupil-teacher ratio: primary pupils per teahcr 31 27.Pupil-teacber ratio: secondazy *Pupils uaching grade 4 % ofcobort 97Repeaterrate: puimay % of tot enroll - 2Illitracy % of pop. (age 15+) 23 12 .
Femalc % of fern. (agc 15+) . 19Newspaper cirulation per thou. pop. _ 751 823 320World Bank International Economtcs Deparntent, April 1995
151

HungaryMoet Same reglm/Iseinme group New
LaNai hlatngjrw - nu XJZurape jUippW' higherUnit uiJ eflimale A Centrul mOdWle Income
Indlcator semur, IP70,7. 1919.08 198N93 Asias Income ras
Priority Poverty IndicatorsPOVRTYUpper pDvrty linc local cur. .. ..
Headcouni index * or pop. . ..
Lower poveity line local curr. .. .. .. ..Headeunti Index S of pop. .. ..
ONP per capit USS .. 1,89 3.350 2,450 4.350 23.680SHORT TERM INCOME INDICATORSUnskilled uirban wnges local urrn .. ..
Unskilled ruml wagesRural terms of tradeConsumer pale. Index 1987-1W0 46 87 353Lower income .. ..
Foodd 40 90 261UrbanRamr]
SOCIAL INDICATORSPubic expcnditure on basic sdal services % orODP .. ..
Groms enollment ratosPrimauy % school age pop. 99 98 9 .. 105 103Male 99 98 89 .. .. 103Female 99 99 89 . 103
MortalityInfant mortality per thou. live births 34.0 20.0 15.0 24.8 35.3 7.0Under 5 nrtlity .. .. 17,0 36A 42.6 85
InununizationMeasles age group .. 99.0 100.0 .. 82.0 82.5DPT .. 99.0 100.0 .. 74.2 90.2
Child malnutrition (under-5)Life expectancyTotl years 69 69 69 69 69 77Female advantage 5.9 7.7 9.3 8.8 59 6A
Total fertUyrale birthsperwomn 2.1 1.8 1.7 2.1 2.9 1.7Mntd mortality rate per 100.000 live births .. 28
Supplementary Poverty IdicatorsExpenditurs on social security % of total gov't exp. .. 23.9 27.7Social security coverag S% econ. active pop. .. ..
Aceesstosafewater toal of pop .. 97.8 10D0 .. 86.7Urban u 100.0 100.0 .. 93.9Rwura 10.6 95.0 100.0 .. 66.7
Acess to bealthcae .. 100.0
Population growth rate GNP per capita growth rate Development diamondb6' - 4(annua avge, perent) (Amual average. percent) Lfe I Y1
4 -- 5
2 _ 0 ^NF1 1 ... I OGNP mG:
Cqatta enrollment
-2 -101970-75 198045 1988-93 1970-75 198D-BS 1988-93 A ucomtosdewater
r Hungay - Hungay- Upper-middle-income Upper-middle-income
a. See the technical noxts. p387. b. The development diamond, based on four key indicators. shows the ramge lvel of dvelopment in the countrycomped with its income grup. See the introduction.
152

Hungarymat 5..e rwgleulaeame group Next
Vedi - ~~Laleat shiasa year recant aurope UpprW higherUR& of ftd~~~~nfm. a c.ewfi middle- bweau
Indkcator meaure- 1970-75 1980-8 19891-93 Asia lee..e grou
Rciources and ExpenditureHUMAN RESOURCESPopulation (mreurcPlP) thousands 10,532 10.579 10.210 494,619 500,507 312.447Age dependency ratio latio 0.49 0.51 0.49 03S7 0.62 0.A9Urban % of pop. 52.8 59.5 63.7 64.8 71.2 77.9Population growth rue annual % OA -0.2 -0a5 0.6 1.7 0.6
Urban *2.0 0.6 0.3 1.5 1.8 0.8labor foree (15.64) thousands 5,445 5,215 5.353 237,1197 190,136 395,641Agriculture %Df labor force 22 18 .
Indus-try S44 44 . ..
Female * $2 44 45 47 29 33Females. per IODOmnie
Urban number 104 106Rural *105 lO . . .
NATURAL RESOURCESArea thou. sq. km 93.03 93.03 93.03 24.320.56 21,848.14 32,146.15Density pop. per sq. kmt 113.21 113.72 110.33 20.20 22.51 25.11Agricultural land % of land area 73.32 70.81 66AS . 41.26 42180Change in agriculturn land annual % -0.13 -0.23 -5.02 -1.28 0.08 -OARAgricultunul land under irrigation % 2.30 2.11 3.65 7.15 8.84 13.96Foresis and woodlan thou. sq. km .. 0.02 0a02 0.30 8.04 10.56Ddfosstation (net) annual %... -0.52...
INCOMEHousehold incomeShareoftop 20%ofho.sehoklds % of income 34 32 34sharec rbottom 40% of households 25 26 26Showuof bottom 20% of househklds 10 1 II1
Food % of GD? 16.1 16.0 ... . .4Staples ' ~2.2 1.9 ... .1.6
Meat fish. milk.i cheese eggs 6.9 7.6 ... .3.8
Cereal irnpnft thou. Metric tons191 134 137 34,452 48.947 773S30Foodmidinceenmis -4 ... 4.392 544 8Foodproductionaper capita 1987=.100 34 99 76 . 102 95Feitilizer consumption k&h, 224.3 2D4.6 23.7 41.7 67.8 150.0Shameof agicultumein GDP % of GDP 17.9 16.1 5.6 13.5 8.0 Housing % of GDP 4.5 5.9 .. 6.0 .. 11.7Average household size persons per household 3.0 2.3
Urban -2.3 2.7Fixed investment housing S of GDP 5.9 5.6 .5.2 S. .0Fuel andipower % ofUGDP 2.0 2.9 .. 12 .2.0
Energy consumption per capita lkg of oi cqniv. p225 2,9R 2.385 2.95 1,632 5420Households with electricity
Urban S of housebolds .. 99.1
ITransport andeornmmnunceulon %ofUGDP 4.5 5.8 Si. . .Fixed investment transport equipment -2.9 1.2 ... .2.1
Total moad length thou. km .. 91 105 ...-
DIVESTMENT IN HUMAN CAPITALHealthPopulaton per physician Persn 507 304 330 362 .. 453Population per nurse 215 172 .. 249 - 4Population per hospital bed 123 109 91 136 39514Oral rehydyrauion therap (under-5) S of cases .. . . SEducationGross enrolment ratioSecondary S of school-age pop. 63 72 31 .. 53 92Female 51 72 81 ..- 94
Pupil-ftester ratio: primary pupils per teacher 1 6 is 12 .. 25Pupil-teacher ratio secondary IS5 13 12Pupils reaching grade 4 Of cohort 95 97 98-
,epatrrprraay Of towalenroll 3 3 3 Ullilcracy S ofpop. (age 15..) 2 1 .. 5 14Female S of fern (age 15+) ...... 17
Newsppecirculation perou &oLo. 233 257 282 125 32Dwo IBnk emgatiorul Economnics Dprmn.Apri 1 35
153

IcelandJMom SeareragfrnsYueoei.peup
lates Ingle ar recnUn of estimwte hf4
lndior macun 1976-75 198045S 1988.3 iceeme
Priority Poverty IndicatorsPOVERTYUpper povr line local cuor.Headcount index % of pop.
Lower poverty line loca CUrJ .. .. cu.Headcount index % of pop.
GNPpercapita US$ 7380 11.610 24,950 23,680SHORT TERM INCOME INDICATORSUnskilled urban wges locl cuir.Unskilld rual wagesRural tem of trade
Consumer price Index 1987=100 2 70 203Lower income .Food,Urban N 70 191Rumal"......
SOCIAL INDICATORSPublic expenditure on basic soial services % of GDPG enrollment ratiosPriury * schoo age pop. 100 99 101 103Male N 98 99 .. 103Female 102 99 103
MortalityInfan mortality per thou. live birts 12.0 6.0 5.0 7.0Under S nmwiaHty . 8.5
Measles * ae goup .. 90.0 99.0 82.5DPT .. 92.0 99.0 902
Child malnutrition (under-5)Life expectncyTota yas 74 77 78 77Famnale advantage 6.0 5.9 5.0 6.4
Total fertiity ate birhs per woan 2.8 23 2.2 1.7Matera mortality rat per 100,000 live births .. 23
Supplementary Poverty IndicatorsExpendinus on scial security * of total govt exp. 12.5 14.0 19.6Socia security covera * econ. active pop.Access to safe water toa % of pop. .. 100.0 [00.0
Urban 1.. 1D.0 100.0Rural 10D.0 10D.0
Acces to health came. 100.0
Population growt rate GNP per capita growth rate Derelopment diamon4b6 (annual avenge percent (mod peraent) 1m De elopementimod
41
2 01 Iper primary
EIZL.rrrn r n ~~~~~~~~~~~~~~~~~~~c*m mpitam
-2-t197D-75 1950-15 1988-93 1970-75 19B0-I5 198-193 Acce stos w va
17 d - Icland- High-income E-bgh-incom
a. Seethe tec1 ns. p387. b. TI. developmn diamon, based on fouriky indicators sbows the av p lvlofdvlopment in te countryc-pad with its incme glop. See d. intoduction.
154

IcelandMost SWaerabi oa e gwp
nset rnleyer rwetUlt of mri' rate 14$-
lndikar smaurt 19740-75 19105 19W-193 Ceame
Resources and ExpendituresHUMAN RESOURCESPopulation (mre-1993) thousands 211 241 263 812.447Age dependency ralio ratio 0.64 0.57 O.SS 0.49Urban *ofpop. 06.6 89.5 91.2 77.9Populadongmwehrawe annual% 1.3 1.1 1.1 0.6Urban 1.7 1 A 1.3 0.8
labor orte (15.64) thousnds 103 127 141 395,641Agricultur % of labor foce 14 10bndbsmy N 31 37
Femnae 3B 42 43 38Fcmales per 1ODnma
Urban numberRural
NATURAL RESOURCESArea thou. sq. km 103.00 103.00 103.00 32Z146.15Density pop. persq. km 2.12 2.34 2.53 25.11Agiculturad land % of land area 22.81 22.75 22.74 42.80Chang in agrcultral land annual S 0.00 0.00 -0.04 -OA4Agricltural land under inigation .. .. .. 13.96Fores and woodland thou. sq. km .. 0.00 0.00 10.56Deforesaton (net) annual % .. .. 0.00INCOMEHousebold income
Shar of top 20% of hoasholds % of incomeShue of botom 40% of householdsShare of botom 20% of househoidsEIPENDITflFood S of GDP .. .. 11.5 8.4
Suople .. .. 1.8 1.6Meat. fob. milk cees eggs U .. .. 6.0 3.8
Carew iapons thou. metric tmnes 30 23 22 77.530Food aid in cerls 3 .. .. 8Foodproductionper capita 1987=10D 117 106 81 95Ftlize consumpdon kg/ha 12.3 11.1 8.8 150.0Shae of agriculture in GDP * of GDP 9A 9.5 9.9HomNg %ofGDP .. .. 9.3 11.7Avage houschold size pcrsons per householdUrbn N .. ..
Fed investment housing *ofGDP .. .. 12.3 5.0Fed and power S ofGDP .. .. 1.6 2.0Enery consmption per coita kg of oil equiv. 3,615 4,473 S502S 5.203Households with elcridityUrban % of householdsRurad
Tko_sport and _mmmnketiox % of GDP .. .. 8.7 SiFixed ivesmn transport equipment .. .. 3.4 2.1Totalroadlength thou.knk 12 12 11INVESTIIENT IN HUMAN CAPITALHeallthPopuladon per physician persons .. 433 - 453Popuation peruuse .. 87 -
Population per hospital bed U .. .. 145Oal wehydyraon they (undr-5) % of casesEducadonGr ssenromhentratioSecondary % of school-age pop. 80 91 99 92Female N 75 87 .. 94
Pui-mOacher rati: primary pupils per teacer 19PuPilaerrio secondary N 13Pupils aching grade4 % ofohort 100Repeatr &= pimary % of total aenollIlliemy 9 of pop. (age 15 -) .. ..Female % of fet (ageI) .. .. tf.Nws I ci aon per thoup. 431 469 S18 320Wodda isank mtennhonS Econonics DepaO_ncnt, Apni i195
155

IndiaMwt Sam rionMeome group Nexe
Lalet single pear tecent higherUR it uf tinle South Low- income
Idknaor _ __ meesurn 1970-75 198EP5 1958-93 As Inco gro.up
Priority Poverty Indicators
Upper povaty line local cur. .. .. 1.296Headcountindex %Sofpop. 43 .. 25 28 19
LOWr povety lie local cufr. .. ..Headeount IndeS % of pop. .. ..
GNPpercapit USS IB0 280 300 310 310 1,590SHORT TERM INCOME INDICATORSUnskilled utban wages local cor. .. ..Unskilled ural wagesRual umrins of Uade .. 84 94Consumerpriceindex 1987=100 45 85 171Lower incomeFood 2 ..2
Urban .. 83 176Rural
SOCIAL INDICATORSPublic expcnditure on basic social services % of GDP .. ..Gros llmenit ratios;PiMary %schoolBgepop. 79 96 106 106 108 104
Male * 94 III 118 118 116Fcmale * 62 s0 93 93 101
MnrlityInfant monrtality per tou. live birdis 132.0 106.0 80.0 83.7 63.1 39.0Under S morlWity .. .. 122.0 1239 lOIA 61.5
humunizationMeales % age goup .. .. 85.8 85.8 873 77.6DPT ' .. 41.0 90.2 90.2 89.9 82.2
Child manutuiton (under-5) .. .. 63.0 60A 403Life expeuancy
Tota yeCa 50 55 61 60 62 67Elec advanage -1.9 -03 0.1 0A 2.1 59
Totl ferility ra buirbs per woman SA 4.5 3.7 4.0 3.6 2.9Mammal mltality rae per 100..O livc bits .. 460 420 420
Supplementary Poverty IndicatorsExp i on s ty % or tot v'tcxp. .. .. .. Social secrity coverage % econ. active pop. .. -Accss losafe water toWl *ofpop. 31.0 56.3 745 693 67.0 _
Urban 80.0 76.0 79.0 73.8 78.7Rural 18.0 50.0 73.0 67.2 62.0 _
Access io health cain .. 75.0 100.0 95.8
Population growth rate GNP per capita growth rate Development diamond"(annual avenrae perct) 5v (a erage. percent) life expectnc
45
2- 0-- 1 O _ ~ l 1- 1 l per pnmary
0- l ~lI I ) l l l I -S . capita \ment
-2 -101970-75 1980-85 198E 93 1970-75 1980-85 1988-93 Access to safe war
[ Iia - India- Low-incme - Law-income
a See the tchnical otes. p387. b. The dcvlopmentdiamo base on fourkey indicam x, shows the avemge lev of deveopmet in he countrycompad with is ine group. See the jatducto
156

IndiaMeost Same re$e Wxincoe. group Next
La,: xikgfrw recent higherURn It of mUslear seth Law- Incoern
Indicator HUmane 1970-75 1P98085 1988.93 Ada income grouResources and Expenditures
HUMAN RESOURCESPopulation {mme=1993) thousads 620.701 762.975 898.200 1.193.503 3.091.764 1.095.665Age dependency ratio ratIo 0.77 0.72 0.70 0.74 0.67 0.69Urban ' of pop. 21.3 24.3 26.3 25.7 27.6 54.7Population growth maw annual % 2.2 2.0 2.0 2.1 1.9 1.6
Urban 3.7 3.0 3.0 3.5 3.9 2.9Labor force (15-64) thonsandE 243.411 293.193 341.460 437,138 1.442.452 459.196Agriculture % of labor force 7 1 70Indusury 13 1 3Female 28 26 25 22 33 31Females per IOU0 males
Urban number H I soRund 96 94
NATURAL Il' sOURCESArea thou. sq. km 3.297,59 3.287.59 3,287.59 5,133.49 39.091396 40.692.67Density pop. per sq. km 19.8.0 232.05 267.69 227.55 77.60 26.52Agricultural land % of land atm 60.83 60.86 60.39 59.03 52.82 39.61Change in -ugricultural laud annual 5b 0.47 -0.07 0.03 0.00 0.03 -0.13Agricultural land under ingation % 18.65 23.09 25.30 29.34 18.02 12.66Forests and woodland thiou. sq. kman 0.55 0.52 0.66 7.15 5.95Defomestation (net) annual % .. 0.63
INCOMEHousehold incomecShamoftop 20% of households Sofincome 49 41 41Share of bottom 4l% of houscholds 16 20 21Shareof bottom 20l%ofhouseholds 6 8 9...
EXPENDITUREFeed Sof GOP 43.6 35.3staples 20.6 12.4 . ..
Meat, fish, milk, cheese eggs, 6.5 7.4 ... .-
Cram] imports thou. n,tic tonmes 7.669 205 694 6.2111 34420 66.281Food aid in cereals 1.512 304 276 1.624 8.334 5.477Foodproduction per capita 1987=100 95 104 113 Ill 113 101Fertilizer consumption kg/ha 19.3 47.0 67.5 70.2 59.9 43.0Share of agiculture in GDP % of GDP 36.6 29.5 28.2 27.4 26.3 15.7Housing % Of GOP 4.4 7.1 . ..
Average household size persons per household 5.2...... urban 4.8 .. ..
Fixed investmient: housing S of GOP 2.3 2.8Fuel and power S of GDP 2.4 2.3Energy consumption per capita kg of oil equiv. 123 170 243 216 364 1.595Households with dlectricityUrban S of households...Rur-al
Transprt and communIcation S of GOP 4.7 5.'1Fixed investment: transport equipment 1.4 2.3Total road length thou. km 1,375 1,546 1,636INVESTMENT IN HUMAN CAPITALHealthPopulton per physician person 4.958 2.515 2,446 2.80 . 3.27Population per nurse 3.756 1.696Populton per hospital bed 1.720 1.296 1364 1,638 1.016 604Oral rehydyrailon thrxapy (under-5) S of cases ... 37 37 38EducationGross enrollment rtdoSecondary S of school-age pop. 26 38 4440 41 53
Fenial . 1 6 26 32 29 34Pupil-teacher ratio: primary pupils per teacher 42 58 63 61 39Pupil-teaherratio: secorwary 21 21 26 26 20Pupils rewhing gradce4 S Ofewort 51 58Repeater raic primuaty S ot total enroll 17 ..
Illiteracy S of pop. (age 15..) 66 56 52 54419Female % of fem. (age 15.-) - 71 66 69 53
Nesapercirculation merthou. po. 15 26 31 26 .. 74World Bank Iarernanional Econonacs Depnrnezz Apnl 1995
157

IndonesiaMasf Same regIonIncome group Next
I-asesisinglkyar recent Thiir. higherUnit of limate East middle- income
hIdleear masare 1970-75 1980-85 1988-93 Asa income grotup
Priority Poverty IndicatorsPOVERTYUpper poveity line local curr. .. ..Headcountindex %orpop. .. 45 17 12
Lower povaty line local curr .. ..Hhadcountindex %orpop. .. 29 IS 9
GNP per cpita US 220 520 740 820 1.590 4.350SHORT TERM INCOME INDICATORSUnudlled ubn wages localeurr. .. 315 1176Unkied rural wagesRural tens of tradeComsumer price index 1987=100 28 86 159LowerincomeFood * .. 83 71
UrbanRural
SOCLAL INDICATORSPublic expenditure on basic social srvices % of GDP .. 3.1Gmss enolment ratiosPrissy %scJwolagepop. 86 117 115 118 104 105Male - 94 120 116 123Female 78 114 113 115
MortalityInfant mortality per thou. live births 114.0 90.0 56.0 35.5 39.0 35.8UnderSmortality .. .. 111.0 60.5 61.5 42.6
IimunonMeasles % age group .. 15.0 B0.0 93.0 77.6 82.0DPT * .. 15.0 B6.0 95.0 82.2 74-2
Child maluition (under-5) .. .. 46.0 24.1Life expetncyTotal yes 49 56 63 68 67 69Female advantage 2.5 3.5 3.5 3.6 5.9 5.9
Totl fertility rate birhs per woman 5.1 4.1 2.9 2.3 2.9 2.9Matenal mor ty rate per 100.000 live birLhs .. 450 450 116
Supplementary Poverty indicatorsExpendin on sociel seuty % of total govt exp. .. ..
Sodl seuty coverge * econ. active pop. .. ..
Accessto salwater.toi D %ofpop. 11.0 37.8 41.6 67.1 .. 86.7Urban 41.0 43.0 65.0 83.5 .. 93.9Rura - 4.0 36.0 31.7 61.3 .. 66.7
Access to hth ca.. .. 42.7
Populadon growth rate GNP per capita growth rate Development diamondb'(annua aveuge. pesuet) 10 (annual average, percent) Life cptiCy
45
2NP Gross2- 0- per iprimaryO- enrol-S- \ zapim erollment
-2 -101970-75 19045 1988-93 1970-75 1980-85 1988-93 Access to safe water
a~~~~~~~~~~~~~~~~~ _ Idonest
- Lower-midde-income - Lower-middle-income
a. Sce the technica nots, p387. b. The development diamond, based on four key indicators shows the aveage leve of devclopment in the countrycomipard with its income gp. See tbe inlroduction.
158

IndonesiaMeot Same regln 0eme reNp Next
insiNgle ear rcnt ewea hilAerUnit of ctimae Eas midde Income
Iadlckasr meaure 1979-fl 19845 J2985-3 Asia lacse. groupResources and Expenditures
HUMAN RESOURCESPopulation (iureuIM3) thousands 135,666 163.966 187,151 1,713.883 1,096,665 500,507AVg dependency rao ratio 0.82 0.73 0.67 0.54 0.69 0.62Urban % of pop. 19.4 26.1 33.5 31.3 54.7 71.2Populadon gwth rae annual % 2.4 1.7 1.7 IA 1.6 1.7Urbin r 4.8 4.7 4.6 4.0 2.9 1.8
Labor rore. (15-64) thousads 50.526 63.430 76.125 942977 459.196 190.136Agriculture * of labor force 62 57Industry 12 13Feanle 31 3 1 31 41 31 29Feanles per 100 maks
Urban mnmber 102 102Rurld 110 106
NATURAL RESOURCESArea thou. sq. km 1,904.57 1,904.57 1,904.57 16,367.91 40,682.67 21,148.14Density pop. persq. km 71.23 86.09 96.65 103.27 26.52 2251Agriculturalland *oflanduae 17.66 18.19 18.93 44.21 39.61 41.26Chag in agicultural land annual * 0.97 0.15 0.18 0.24 -0.13 0.08Agriculturaland under inigation S 15.08 21.42 24.0S 14.68 12.66 9.84Forests and woodland thou. sq.km .. 1.22 1.10 4.06 5.95 8.04Deforestation (net) annual S .. .. 1.04
ENCOMEHousehold income
Sham oftop 20 of households % of incone 52 .. 42Sham of bottom 40% of households * 17 .. 21Share of botom 20% of households * 7 .. 9
EWENDfUlEFwd % of GDP .. 30.2Staples .. 13.1Meat fish, milk cheesc, eBgs .. 6.4
Cereal imports thou. metric tonnes 1,424 1,447 3,105 30,036 66.281 48,947Foodudincereals * 301 270 40 447 5,477 544Foodproductionpercapita 1987=100 77 98 113 115 101 102Ferfize consumption kgha 153 59.8 75.2 76A 41.0 67.8Sham ofagriculturinGGDP %ofGDP 30.2 23.2 18.1 17.1 IS.7 8.0Housing %ofGDP .. 8.2 -
Avge household size prson per household 5.0 4.1Urban * 5.0 5.3 _
Fixed investmunt housing S of GDP .. 3.5 _Fueland power b of GDP .. 4.2Energyconsmuptionpercapita kgofoilequiv. 100 189 330 632 1,595 1,632Households with electricityUdrn % of households .. 46.7 -Rural
TraI port and canumnl athm % of GDP .. 2.6Fixed inveswmenr transport equipment * .. 1.9Totl road length thou. lm 105 207 266 .. ..
INVESTIENT IN HUMAN CAPITALHeathPbpulation per physician peasuns 27,614 9,500 7.033 1,063 3.277Pbpulafion peanrse * 4,914 1.269 .. 1,490Population per bospital bed 1'250 1.806 1.502 612 604 395Oral ruhydyration thrpy (uader-5) S of cases m. .. 78 32 .. S1EducadonGrss enrollment rtioSecondary S of school-age pop. 20 41 45 53 53 53Fewale " 1S 33 41 47 -
Pupil-tacr ratio: primay pupils per reacher 29 25 23 23 _ 25Pupil-teacher ratio: secondary 16 17 16 16 _ .Pupils reaching grade 4 % of cohort 78 89 91 92 . .
Repaerate:primay % oftotalerolil II 11 10 6 .. .
Illmey % ofpop. (age S4+) 43 28 23 22 19 14Female % oFfcm. (age 15+) .. 37 32 36 . 17
NeOM circuladon pr thou. M. 16 18 25 .. 74 125World KORK kmaron Economics Depaimean Apri . S
159

Islamic Republic of IranMove Sam reg&mn eomrunap Next
Ltt igleye resnt MU-&=t Law higherUnitqf estoimae a & Nornk n e- bcame
lxdkf lcOr 1I7O-75 IMtS I 108 93 Afrrka xeome Irroula
Prority Po y IndicatorsPOVERTYUpper povry line local curr. .. ..
Henicount index S of pop. .. ..
Lower povety line local cur. .. ..Hendount index Sof pop. .. ..
GNPpercapita USS .. 3,420 2,120 1.980 1.S90 4,350SHORT TERM INCOME INDICOTORSUnskilled urban wages local cuf. .. ..
Unskilled rurl wagesRural tems of tradeConsumerprie index 1987=100 15 66 302Low incom ..Fooe * .. 64 281UrbanRual
SOCLL INDICATORSPublic expendim o bssic social srvices * of GDP .. 11.6 8.Jc0ro emlmnent latiosPdmary csdwolapgepop. 93 98 109 97 104 105Male 114 108 114 103Fmamle i 71 88 104 90
MoraltyInfant monlity perzhou. live births 122.0 78.0 34.8 523 39.0 35.8Undr5S morality " .. .. 54.0 69.9 61.5 42.6
ImamnizatiocMeasles age group .. S1.0 84.0 81.3 77.6 82.0DPr i .. 51.0 98.0 84.0 82.2 74.2
Child malnutrition (under-5) 43.1 .. - -Life expecncyTOal ye 56 61 68 66 67 69Fmleadvage -0.7 3.6 1.1 2.3 5.9 59
Total feutiity rate births per womn 6.5 6.8 4.9 4.7 2.9 2.9Mateal mortlity rle Fr 100.000 live bir.hs .. 120
Supplementary Poverty IndicatorsExpenditums on social secmity * orlto govt exp. 2.4 11.3 11.0Soia seculy coverage % coon. active pop. .. ..Access to safe watc tol S% of pop. 51.0 71.8 8B.9 NA .. 86.
Urban 76.0 90.0 100.0 98.7 .. 93.9Rural i 30.0 S2.0 75. 69.0 66.7
Access to hedath came .. 67.0 73.0 B7.4
Population growth rate GNP per capita growth rate Development diamondb6v (annual averg. pent) 5 - (mnul avaage. percent) lit apectancy
4 -5
2 EKL1 W1 41 llo FIN} drGNP Grosscapita .I=HxwIIfI
0 i -S
-2-11970-75 1980-45 1988-93 1970-75 1980-S 1998-93 Aces taScwaaer
E] lmic Republic of Jim Islamic Republic of Inm- Lower-middle-income Lower-niddle-income
a. Seeetechnical note p387. b. The dcvelopm dianond, based on fourkey inicas shows h average leve of developmn i the counycompard with its incom group. See die ioducti
160

Islamic Republic of IranMost Same. reonAlncomegrsnp Naxt
Latestsingleyer reesst nWW s Lever. hiher(iJa of estfmate & North middle- bume
Indicntor aneure 1970-75 198JS 1988-93 Africa Income group
Resources and ExpendituresHUMAN RESOURCESPopulation (mre=1993) thousands 33,344 48,916 64,169 261,650 1.096.665 500,507Age dependency ratio ratio 0.95 0.94 0,92 0.87 0.69 0.62Urban % of pop. 45.8 53.2 57.9 55.2 54.7 71.2Population growth rate annual % 3.2 4A 3.2 2.7 1.6 1.7
Urban 4.9 5.8 4.1 3.7 2.9 1.8Labor force (15464) thousands 9.493 13,023 16.818 71,333 459.196 190,136Agriculture % of labor force 40 36 0Industry 31 33 0Femnle 14 17 19 16 31 29Females per 100 males
Urban number 98 88Rural " 102 102
NATURAL RESOURCESArea thou. sq. km 1[648.00 1,641.00 1,648.00 11,021.26 40,682.67 21,848.14Density pop. per sq. km 20.23 29.68 37.71 23.10 26.52 22.51Agricultura land % of land arca 36.94 36.60 38.00 32.10 39.61 41.26Change in agricultural land annual % -0.85 0.55 0.52 0.04 -0.13 0.08Agiculturallandunderirdgation * 9.76 11.36 15.12 30.59 12.66 8.84Fozests adwoodland thou.sq.km .. 0.18 0.1S 0.45 5.95 8.04Defomstation (net) annual % .. .. -0.01INCOMEHousehold incomeShar of top 20% of houscholds %ofinwme Ss ..
Share orbotom 40% of bouseholds I ..IShare or bottom 20% of houscholds ' 4 ..
EXPENDITUREFoud SofGDP 14.7 24.8
Staples 4.5 6A.Meat, fish milk, cheese, eggs " 5.0 10.8
Cereal impons thou. retric tonnes 2,109 4.216 4.840 38,092 66281 48,947Foodaidincereals * 51 .. 31 1,249 5.477 544Food production per capita 1987 = 100 86 96 105 102 101 102Fertilizer consumption kglha 5.6 15.1 22.1 89.9 43.0 67.8ShareofagricultureinGDP %ofGDP 11.1 19.7 20.7 13.3 15.7 8.0Housing Sof GDP 7.7 15.3Average household size pesons per household .. .. ..Urban
Fixed investment housing Sof CDP 6.7 7.9Fuel and power %ofCGDP 1.5 1.6Energy consumption per capita kg of oil equiv. 947 1.092 1,235 1,097 1.595 1.632Households with electricityUrban % of households .. ..
Rural *Trmnsportandcommnnication %ofGDP 3.1 3.9Fixed investment tansport equipment 4.6 2.1Total roadlength thou.hn 50 139INVESTMENT IN HUMAN CAPITALHealthPopulation per physician persons 3,270 2.991 3,314 .. 3,277Populationpernumse 1,782 1,196Population per hospital bed ' 725 668 766 633 604 395Orl rehydyration themapy (under-5) 9 of cases .. .. 85 56 .. 51EducatioGrss enrollment ratiDSecondary S of school-age pDp. 45 45 57 S6 53 53
Fcmale 33 37 49 S0Pupil-teacher ratio primay pupils per teacher 29 22 32 26 .. 25Pupil-teacher mtio. scondary ' 27 16 28 21Pupils madcing grade 4 9 of cohort 79 90 93 95Repeaterrate:primayi Softotalenroll 9 10 9 .. .Illiteracy % of pop. (age 1S4) - 52 46 45 19 14Femalc % of fenL (age 15.u) - 64 57 57 - 17
Ney= r datercnanon pe thou.po. 15 26 20 33 74 12pwold Bank rncouat Eonooncs 15p26t, Apn2 1991
161

IraqAttm S a teunlnhMep Next
_ lWetslwig_" rmAt mid-lt Leiwr- booerUnitOf flhuuta & Ne middle- nceme
IntleMfr m re-u _ 1970-75 198045 195593 AIrke lcome grup
Priority Poverty Indicators
POVERTYUppr poverty line local curm. .. ..
Headcount index % of pop. .. ..
Lower povesty ine local cur. .. ..
Headcount Index 9a of pop. .. ..
GNP per capia US$ .. .. .. 1,980 1I590 4.350
SHORT TERM INCOME INDICATORSUnsildled urban wages local cur. .. ..
Unskilled mtral wagesRural ms of trade
Consumer price index 1987=100 .. ..
Lower incomenFood
UrbanRural
SOCIAL INDICATORSPublic expenditure on basic social services % of 0) .. ..CDPGross erollment ratiosPrimary %schoolagepop. 94 100 89 97 104 105
Male 122 108 96 103Feimale ' 64 92 82 90
Mortalitylnfta modality per thou. live births 96.0 78.0 55.1 S2.3 39.0 35.8Under S mortaity .. .. 71.0 69.9 61.5 42.6
ImmuniionMealeks % ge group .. 25.0 73.0 813 77.6 82.0DP r .. 13.0 69.0 84.0 82.2 74.2
Child malnutrition (under-5)Life expctancy
Totbl years S7 62 66 66 67 69Femaleadvannge 1.8 1.8 3.0 23 5.9 5.9
Total feriity rmte bin. per womIan 7.1 6A4 5.6 4.7 2.9 2.9Matnmirn lity nuo e per 100.000 live bihs .. 117
Supplementary Poverty lndicatoirs
Expndint on social security S of total govt exp. .. ..
Social secarity covrge econ. active pop. .. ..
Acocss to safe watec total * of pop. 66.0 82.0 92.5 835 .. 6.7Urban * 100.0 95.0 100.0 98.7 .. 93.9Rural 11.0 54.0 72.3 69D .. 66.7
Access to health cmin " .. 94.0 98.0 87.4
Population growth rate GNP per capita growth rate Development diamondb
(annual average pecent) (annul aveag. percent) Lfe expwqr
45
z lo. ~~~~~~~~~~~~~~~~~~~I o. NPiXNG2 7 rt-f ] 0 1irzas
D- l l I l l I l l I | -S- \ ~~~~~capita e nrollmentoD -5
-2 -101970-75 1980-85 1988-93 1970.75 1980-85 19-3 Access to safe wate
-Lower-iddlincome Lowr-middleincome
L See the technical notes, p.3S7. b. The developmens dimnond. based on four key indicators, shows de avrg. level of development in the cuntrycomparud with its income group. See t introducton.
162

IraqMosl Samen S nfineouaegr.y Next
latest sIgo year recent MLaiii. highrUnlr qf -atlmate & Neh m.Jdl. income
Indl&ir measire 1970.75 195045 19W893 APl income groupResources and Expenditurcs
HUMAN RESOURCESPopulation fmrel9w 3) Ut amds 11.020 15,317 19,465 261,650 1,096,665 500,507Ago dopendency silo ratlo 0.96 0.92 0,88 0.87 0.69 0.62Urban % of pop. 61A 68.8 731 55.2 54.7 71.2Populatdon growth rate annwl % 3.3 3.3 2,5 2.7 1.6 1.7Urban " 5.0 4.2 3.2 3.7 2.9 1.8
Labor force (15-64) oMands 2,890 4.259 5,770 71,333 459,196 190,136Agiculture % of labor force 37 30Indusby 22 22 .. ..Female 13 20 23 16 31 29Females per 100 malesUrban number 94 ..Rural 108 ...
NATURAL RESOURCESArea thou. sq. km 438.32 438.32 438.32 1 I.M1.26 40,682.67 21,848.14Density pop. per sq. km 25.14 34.94 43.33 23.10 26.52 22.51Agrieultural lnd of land ama 21.23 21.61 21.61 32.10 39.61 41.26Cange in agricultural land annual 0 0.05 0.00 0.00 0.04 -0.13 0.08Agriculn l land under iigalion % 16.88 1852 26.98 30.59 12.66 8.14Forcsts and woodland thou. sq. km .. 0.02 0.02 0.45 5.95 8.04Dcfostation (nc) nnual S% .. .. 0.10
INCOMEHousehold income
Share of top 20% of households * or income .. ..Share of bottom 40% of households .. ..Share of bottom 20% of households
EXPENDrFUREFood % of GDP .. .. .. .. .StaplesMeat, fish, milk, cheese, eggs
Cereal imports thou. metric tonnes 745 3,463 1,397 38,D92 66,281 48,947Food aid in cereals 0 0 80 1,249 5.477 544Foodproductionpercapita 1987=100 109 126 85 102 101 102Fertilizermcosumption k/a 3.5 18.7 22.2 899 4B.0 67.8Shame of agricture in GDP 9 of C;DP .. .. .. 13.3 15.7 8.0Housing % of GDP .. .. .Aveage household size pesons per household .. ..Urban
Find investment housing % of GDP .. .. .Fuel and power % of GDP .. ..Enrgy consumption per capita kg of oil equiv. 537 1.179 1.103 1.097 1.595 1,632Households with electricityUrban S of housebolds .. ..Rural
Transport and counmu.lcutien % of GDP .. ..Fixed investment transport equipmentTotal road length thou. km 12 30 40INVESTMENIN HUMAN CAPITALHealthPopulation per physician persons 3,237 1,760 1,659 .. 3,277Populalionperuse 0 2.298 2.195 99 .. .. .Population per hospital bed 5 513 528 603 633 604 395Ori rehydyraion therapy (under-5) % of cases .. .. 70 56 .. 51EducalonGross enrollment ratioSecondary % of school-age pop. 35 55 48 56 53 53Female 0 21 39 37 S0
Pupil-techeratio:pimar pupilsperteaher 25 24 22 26 .. 2SPupil-teacher ratio: sconday 0 25 30 20 21Pupils eachinggrade4 %ofcohort 93 91 90 95Repeater rate: primary % of toal enroll 16 21 19mlairacy %Sofpop.(age IS) *- 48 40 45 19 14Female % of fen (age 15+) .. 59 51 57 .. 17
Newspaper circulation per thou. pop. 17 39 35 33 74 125wordd Bn Intemnaonal Econonucs Department, April 1995
163

IrelandMost Sirre regoiaince.megrop
nert t shw year reatUR& qf aImute High-
Indkleor m aure 197075 J98045 1988-93 Income
Priority Poverty IndicatorsPOVERTYUpper poverty line local curr.Headcount Index % of pop.
Lower poverty line local curt.Headcount index % of pop.
GNP per capita IJS$ 3.020 4,990 13,000 23,680SHORT TERM INCOME INDICATORSUnskilled urban wages local cUwr.Unskilled rurai wagesRural terms of trade ".Consunerpice index 1987=100 27 93 119Lower incomeFood' 16 93 277
UrbanRuml]
SOCIAL INDICATORSPublic expenditurc on basic social services * of GDPGross enroUment rtiosPrimazy % school age pop. 103 100 103 103Male 103 100 103 103Femanle 103 100 103 103
MortalityInfant mortlity per thou. live births 18.0 9.0 7.0 7.0Under S rortality .. .. 8.0 8.5
ImmunizaionMencles * age group .. 63.0 78.0 82.5DPT .. 45.0 65.0 90.2
Child malnutrition (under-5)Life expectancyTotal years 71 73 75 77Female advantapg 4.9 5.5 5.5 6.4
Total fertility rate births per woman 3.8 2.9 2.1 1.7Maternrl mortality rate per 100,W0 live births .. 7
Supplementary Poverty IndicatorsExpenditurs on social security % of total gov't exp. .. 24.4 27.7Social security coverage % econ. active pop.Acecss to safe water totl % of pop. .. 100.0 100.0
Urban * .. 100.0 100.0Rundl .. 100.0 100.0
Access to heal thant .. 100.0 .. ..
Population growth rate GNP per capita growth rate Development diamondb
(must aveag, Percent) I (amual avege, perent) Li ex y
2 0 I'GN'l
Ocapita enrodmrent
-2 -- 101970-75 1980-8S 198S-93 1970-75 19S0-85 1988-93 Access to safe water
h rleand hreland- Hig-lincome - ighiincorne
a See thetechnical notes,p387. b. The developmentdiamwnd, basedonfourkey indicators, sbows theavngelevel of developmentin thecountrycompared with its incone group. See the introduction.
164

IrelandMust Samc regieuawmu Ereyp
astslgeyear reatUna of enimae 11th.
Ina&weaor meaun 1970-75 0 1945 195-fI-93 lnemeResources and Expenditures
HUMAN RESOURCESPopulatIon (mre1993) thousands 3.177 3.552 3,S33 812,447Ago dependency ratio ratio 0.73 0.67 0.58 0.49Urban * or pop. 53.6 56.3 S7.3 77.9Population growth rate annual i .5 0.9 0.3 0.6uran *2.2 1.2 0.5 0.8
Labor fome (1544) thousands 1.192 1.337 1.553 395,641Agriculture a of labor force 22 19Industry 32 34FeImal * 27 29 30 38Females per 100 males
Urban number 110 106Rural " 85 87
NATURAL RESOURCESArea thou. sq. km 7028 70.28 70.28 32,146.15Density pop. per sq. km 45.20 50.54 50.13 25.11Agricultural land % of land area 82.96 82.81 81.48 42.80Change in agricultura land amual i 0.40 0.16 -0.25 -0.48Agricultural land undrr irrigdtion % .. .. .. 13.96Forests and woodland thou. sq. km .. 0.00 0.00 10.S6Deforestaion (net) annual S .. .. -1.19INCOMEHousehold incomeShare of top 20% of households % of income 39Sharm of bottom 40% of households * 20Sharu of bottom 20% of houseolds * 7
EPENDrlUREFood %ofGDP 17.1 15.2 10.6 8.4
Staplas 3.2 2.5 2.3 1.6Meat. fish, milk chlee, eggs * 8.7 7.5 4.9 3.8
Ceral inpons thou. metric tomes 658 S00 409 77,530Food aid in cereals * .. .. .. 8Foodproductionpcrcapita 1987=100 94 98 114 95Fertilizer consumption kg/ha 75.5 108.7 115.5 150.0Share of agiculture in GDP %ofGDP .. .. 7.1HousIng % ofGDP 7.5 6.2 6.0 11.7Averag household size persons per household 3.9 3.7
Urban * 4.0FLxed investment housing %of GDP 6.1 6.6 39 S.0Fuel and power % of GDP 3.3 3.3 2.7 2.0Ener consumption per capita kg of oil equiv. 2.180 2,514 3.016 5,203Houseolds with electricityUrban % of households .. 99.6Rurad
Transport and comrunlmation %of GDP 6A 8.6 6.9 8.8Fixed investment transport equipment 2.1 3.9 2.0 2.1Total oad length thou. kn 89 92 92INIVESTMENT IN HUMAN CAPALHealthPopulation per physician pesons 9BS 680 630 453Population per nurse 158 139Population per hospital bed 79 103 101 145Orl rahydytion trapy (under-S) 9 of casesEdctlonGross cnrollnent ratioSecondary % of sdchol-ag pop. 86 98 101 92
Female 91 103 105 94Pupil-macer rado: primay pupils per teacher 31 27 25Pupil-teacher atio: secondary 14Pupils ching gade 4 of eohort .. 99 99Repeater rate: primary % of total enollMlimr-aq % of pop. (age 1S+)......Femae % of fen (age 154)
Newsj2al2er circulation perthou. rop. 218 193 185 320;W1orld Hardk Intemmfional Eononuics Department, ApVY15
165

IsraelMeal S.. qiu/neemt#e ru
L"reagRgaajer ret tunit oif e aralbu ate ill gil
Indkuor ewue I P70.75 iJI.8S 1a8a"9 lacome
Priority Poverty IndicatorsPOVERTYUpper poveny line local curr.Headcount Indecx or pop.
Lower poveny line local curr.Hendcount Indcx % or pop.
GNP per capita USS 4,230 6.380 13,920 23.690SHORT TERM INCOME INDICATORSUnskilled urban wages local curr.Unskilled rural wagesRural termsortmdeConsumcr pricc indcx 1987-100 0 56 242
Lower IncomeFood .. 56 209
Udban Rural
SOCAL INDICATORSPublic expenditure an basic social services % of GDP .. 10.2Guss enrollment raiosPrimary * school ge pop. 97 97 94 103
Mo '' 96 95 94 103Female 97 98 94 103
MortalityInfant mortality per thou. live births 23.0 14.0 8.9 7.0Under 5 mortality .. .. 12.0 8.5
ImmunizationMeasles % age group .. 85.0 88.0 82.5DPT .. 92.0 W8.0 90.2
Child malnutrition (under-5) .Life expectancy
Total years 72 74 77 77Female advantuge p 3.2 3.4 3.8 6.4
Total fertility rate births per woman 3.8 3.1 2.8 1.7Maternal mortality rate per 100,,O0 live births .. 5
Supplementary Poverty IndicatorsExpenditures on social security % at lotal gov't exp. 15.1 14.9 21.9Social security coverage % econ. active pop.Acocss to safe water total % of pop. .. .. 10.0.
Urban .. .. 10W.0Rurnd .D.0
Access to health care .. 100.0 100.0
Population growth rate GNP per capita growth rate Development diamondb(annul average, percent) 1( nnu(a iuaveage. prcent) L eeca
4 5
2 G n o oNP Grssper ~~~~~piimal7
O - ca -| Sepita\ /elon0 I I 1 ~~~~~~~-5t
-2 -101970-75 1980-85 19S8-93 1970-75 1980-S5 1989-93 Acce to sae waler
E] _krad -- High-income - High-income
a See the technical notes. p.387. b. The development diamond, based on four key indicators, shows the averag veor development in the countycompared with its income group. See the introduction.
166

IsraelMost Same rwegfleu/ceme
Lchst dinRh year recentUnit of esthieate High-
Iadicasar measure 1970-75 1985"s 1958893 income
Resources and ExpendituresIIUMAN RESOURCESPopulmilon (nsreul93) thousands 3,455 4,233 5,219 812,447Age depcndency ratio ratio 0.68 0.70 0.65 0.49Urban % or pop. 86.6 89.9 90.5 77.9Population growlh rate annual % 3.0 1.8 3.8 0.6
Urban 3.6 2.0 3.8 0.8Labor force (15-64) thousands 1,279 1.610 1,924 395,641Agricultur % or Ilabor force 8 6Industry 34 32 ..rFeale 32 34Femnales per 100 males
Urban number 102 103Rural " 95 92
NATURAL RESOURCESAren thou. sq. km 21.06 21.06 21.06 32,146.15Density pop. per sq. km 164.06 201.00 238.64 25.11Agricultural land % of land ara 26.19 27.89 28.08 42.80Change in agnicultural land annual % -0.92 1.95 -0.34 -0.48Agricultuml land under irrigation % 33.33 40.52 31.09 13.96Forests and woodland thou. sq. km .. 0.00 0.00 10.56Defeorestatioa net) annual % .. .. -0.26
INCOMEHousehold incomcSharc of top 20% of households % of incomc 39 40 ..Sham of bottom 40% of households 21 18Sham of bottom 20% of households S 8 6
EXPENDITUREFood % of CDP .. 14. .. 8.4
Staples .. 2.0 .. 1.6Mea,L fish. milk. chese, eggs - .. 5.9 ,. 3.8
Cercal imports thou. metric tonncs 1.644 1.714 2,293 77,530Food aid in cereals 5 53 8 2 8Food productionpercapita 1987 100 103 103 77 95Fertilizer consumption kg/ha 138.1 160.2 168.9 150.0Sharc of agriculture in GDP % of GlDP 4.7 3.5 2.3Housing % of CDP .. 13A .. 11.7Avcragc household sizc persons per household 3.8Urban 3.7 *-
Fixed investmcnt housing % of GDP 13.7 4.5 .. 5.0Fuel and power % of GDP .. 1.6 .. 2.0Energy consumption per capita kg of oil equiv. 2.218 1.885 2.607 5.203Households with electricity
Urban % of households ..Rural
Transport and comnmunicatlon % of GDP .. 6.7 .. 8.8Fixcd invcsunene transport equipment 0.0 1.4 .. 2.1Total road length thou. km 4 5INVESTMENT IN HUMAN CAPITALHealthPopulation per physician persons 400 344 .. 453Population per nurse .. 106Population per hospital bed 200 200 22D 145Oral rehydyration therapy (wider-5) % of casesEducationGrss nrwollmrent ratioSecondary % of school-ap pop. 66 80 85 92
Female 71 85 89 94Pupil-teacher ratio: primary pupils per teacher 16 17 16Pupil-teacher ratio: secondawryPupils reaching gadr 4 % of cohort 96 100 98Repeater rare: primary % of total ewoll ...llitercy % of pop. (age 15+) 12 5Female % of fem. (agr 15+) .. 7
Newspaper circulation per thou. pop. 3S7 260 247 320World Bank Intemabonal Econonics Depamnt, April 1995
167

ItalyMaMst Same regAfinceme greup
L__at ngk year ewentuVf of estmate High.
Indcator raiare 1970.7S 19Nv8s 1988.93 Incoe
Priority Poverty ldicaaorsPOVERTYUpper poverty line local curr.Headcount Index * or pop.
Lower poverty line local curr.Headcount Index % or pop.
GNP per capita US$ 4,020 7,490 19,140 23,630SHORT TERM INCOME INDICATORSUnskilled urban wages local curr.Unskilled rural wages *
Rural terms of trade.Consumer pdccindex 1987=100 22 90 139Lower income .Food"* 14 91 134
Urban*.Rural
SOCIAL INDICATORSPublic expenditure on basic socal services * of CDPGross enrollrmnt raiosPrimary % school age pop. 106 96 95 103Mle 107 96 94 103Female 106 96 97 103
MortalityInfant mortality per thou. live births 26.0 13.0 7.1 7.0Under 5 mowlity .. .. 9.0 8.5
ImmunizationMeasles Sag group .. 12.0 50.0) 82.5DFr .. 12.0 95.0 90.2
Child malnutrition (under-S)Lifc expecancyTotal years 72 75 77 77Female advantage " 6.D 6.6 6.4 6A
Total ferdlity rate birth per woman 2.3 1.6 1.3 1.7Matenal mortality rate per 100.000 live births - 13 .
Supplementary Poverty IndicatorsExpenditues on social secuity % of total gov't cxp. .. 28.5Social security coverag % econ. active pop.Acwesstosafewater toal %ofpop. .. i I 100.0
Urban . 101 0 100.0Rural n 100.0 100.0
Access tohealth cac .. 100.0
Popuation growth rate GNP per capita growth rate Development diamondb6+ (annual aver. pmet (a4nnal average. penrent) l
4 - -_ _ _ _
i O7 - CiGNP Gross2 0 ~~~~~~~~~~~~~~~~~~~~~~~~~per primary
O ---- * { ca;ita \ / enrollment
-2 - -11970-75 1980-35 1983-93 1970-75 1980-35 1988-93 Access to sfe water
Italy - Italy- High-income - Higb-income
a. Scc the technical nots, p.387. b. The dcvelopmcnt dianmond based on four key indicatot shows the average level of development in the countrycompard with its income group. See the introduction.
168

ItalyMosJ Sae SregioMflncme& op
ldat sWle yepar Fr:nVail qr amtlxare High-
Indikaot meunr 197037S 9I0DS 198893 Income
Resources and ExpendituresHUMAN RFSOURCESPoulalion (nren:1993) thousands 55,441 56,771 57,121 812,447Age dependency ratio rtio 0.57 0.48 0.45 0.49Urban % of pop. 65.6 66.8 66.6 77.9Populaion growth rae annual I 0.6 0.1 0.1 0.6
Urban ' L,0 0.2 0.0 0.BLabor force (15-64) thousands 21,332 22.763 23,459 395,641Agriculture %orlaborforce 15 12Industy N 42 40Female 30 32 32 38Female per 100 males
Urban numberRural .
NATURAL RESOURCESArea thou. sq. km 301.27 301.27 301.27 32,146.15Density pop. persq.km 184.02 181.44 189.49 25.11Agricultral land % of lnd area 59.56 55.13 57.28 42.80Cange in agricultural land annual * 0.09 -0.86 -0.06 -0.48Agricultural land under irigation % 15.53 17.55 1L70 13.96Foests and woodland thou. sq. un 0.09 10.56Deforestation (net) annual %INCOMEHousehold incomeShare of top 20% of housdiolds % of incomeShum of bottom 40% of householdsSham of botom 20% of households
Food % of GDP 20.1 136 11.1 8AStaples 3.0 1.8 1.6 1.6Mat, sh,milk chee eggs 10.0 7.1 5.8 3.8
Caer imponpt thou. metric tomes 7,059 7,052 6,249 77,530Food aid in cereals . . 8Food procction per capita 1987 =100 92 97 97 95Ferdlizerconsumption kglh 85.0 123.0 110.8 150.0Sharc of agricultJc in GDP %ofGDP 7.2 4-5 3.1HousIng % of GDP 3.6 9.6 9.8 11.7Average houeold size psons perhousehold 3.3 3.0Urban
Fazod inesmnt: housing 'of GDP 62 36 52 5.0Fuel and power % of GDP 2.0 2.8 2.2 2.0EneBrg consumption per capita kg of oil cquiv. 2.243 2.405 2,697 5,203Homsehokls wiih electrictyUtban % of huseholdsRural
Transport ud cammunladon %of GDP 7.1 7.8 7.6 8.8Faxed iwaestment tansport equipment 2.1 2.0 2.1 2.1Totw rd lngth hou. km 292 298 304INVESUEM IN HUMAN CAPITALH"lthPopulation perphysician persons 555 750 211 453Population pernu rsc 250Popuation per hospiud bed 95 .. 132 145Oral rhydyration therapy (under-5) % of casesEducationGross enmrlment ratoSeodary % of school-age pop. 70 73 76 92
Female 66 72 76 94Pupil-tcacher ratio: pimary pupils per teacher 19 14 12Pupil4-acherrado: secondary 11 10 9Pupils rching grade 4 S of coonRepeaera pm % of talcnroll 3 1 1Illiteracy % ofpop. (age 15+) 6 4 t
Female % Of nL (age 15+) 5 tNews perciawntion perd otLpo. 114 97 106 320World ank InumanSonal Economics DepartmevL Apm 1991
169

JamaicaMost Sme regillanomea gop- Next
lanaItelgla year rn t a Latsin Lcwear higherVUI of aNmte Amerka mxiddle- Income
lnukaAor msure 1970675 195045 198893 Cwibbean Income group
Priority Poverty IndicatorsPOVERTYUpper povrt lnc locd curr. .. ..Headcont Index % of pop. .. ..
Lowur poverty line loca curr. .. ..Headoont Index % of pop. .. ..
GNP per capta USS 1.380 930 1,440 2.930 1,590 4,350
SHORT TERM INCOME INDICATORSUnsilled una wages local cur. .. ..Unskilled rura wags"Rura m eefu aradeCoInsmerpice indei 1987=100 14 1I 494
Lower incomeUod "i 6 ........Food
Urban".........Rucld
SOCIAL INDICATORSPublic qenditum on basic soci services 96 of GDP .. ..Gross eaolbt ratiosPrimary % schoolaeVpoj 97 100 106 107 104 105Mdc 97 99 105Femae 98 101 108
MortaityIrantD mrtality per thoL live births 42.0 18.0 13.6 43.0 39.0 35.8Under 5 mortality r .. .. 17.0 52.2 61.5 42.6
IrumuiztionMeas * age group .. 60.0 74.0 78.7 77.6 82.0DPT .. 57.0 86. 73.7 82.2 74.2
Child malnuiticn (under-5) .. 14.9 7.2life xpecyTotal yaus 69 71 74 69 67 69Ferale advant " 4.2 4A 4.4 53 5.9 5.9
Toatl fertlity rte birtis perwom 5.0 3.6 2.3 3.1 2.9 2.9Maternl rtilty re per 100,000 live binhs .. 1W .. -
Supplementary Poverty IndicatorsExpendituwus on scid security % of totl goV t cap. .. .. .. .Social security covcrge % em. activc pop. .. ..Accesstwsafewwrtoadl % ofpop. 86.0 .. 71.9 80.0 .. 86.7
Urb 100.0 99.0 95.2 90.1 .. 93.9Rural r 79.0 . 45.9 57.6 .. 66.7
A=ces to health car __ * *-
Population gnwth rate GNP per capita growth rate Development diamonde(annsualaverage. peanut)w p LEcqw n
(mvW avmp percent) (namad averag. Percnt lie expecmtac
4 5 - I
2 O- qk, , F -- 1 a~~~~ ~~~~~NF GOwss
O n Ir | l S ~I apita arolnin
-2 11970-75 198045 1988-93 1970-75 195 1988-93 Access to safC water
[ Jamaica Jamaa- l owr-eWrdle-incoma Lower-middle-incomec
t See dte technicl note p.387. b. The devlopmuet dimond, based on for key indiats, sbows the avere lvl of devdopment in the counrycompaed with its income group. See itroducton.
170

JamaicaLais! tingle yaw rI'eNt Lagmn Loaffs' higher
Unit of uavhuf. Amwfla midle/a lacoe.Indka tor measure 1970-75 1980-55 1988-93 Caribbean kncomne group
Resources and ExpendituresHUMAN RESOURCESPopulation (rnreul993) thousmnds 2,013 2,311 2,411 466,304 1.096.665 500,507Age depenidency ratio ratIo 1.04 0.77 0.62 0.66 0.69 0.62Ursbon % of pop. 44.1 49.2 52.1 71.2 54.7 71.2Population growth rate annual % 1.5 1.6 0.5 2.0 1.6 1.7
Urban ' 2.7 2.6 IA4 1.9 2.9 1.8Labor farce (15.64 thousands 803 1.095 1,334 169.839 4S9.196 190.136Agriculture % of labor fomco 32 3 1 industry S1 7 16Female *45 46 46 27 31 29Females per IOU mules
Urban number...Rural
NATURAL RESOURCESArea thou. sq. km 10.99 10.99 10.99 20,505.92 40,682.67 21,848.14Density pop.perrsq.lkm 183.17 210.28 218.21 22.29 26.52 22.51Agricultural lad% of land ama 46.81 44.04 43.95 40.00 39.61 41.26Change in agricultural land annual % 0.00 0.00 0.00 0.39 -0.13 O.K9Agricultural land under irrigation '1 6.31 7.13 7.35 341 12.66 8.84Forests and woodland thou. sq. km .. 0.01 0.00 9.*7 5.9S 1.04Deforesutation (net) annual S .. 7.25 .
INCOMEHousehold income
Shameof top 20% of households S ofinou .. .. 49shar of bottom 4D% ol'households 5...16 .
Sham of bottom 2D% of households 5...6
EXPENDTURtEFood % of GDP 22.4 27.2...-
Staples 9.8 10.2Meat, fish, milk, cheese eggs 7.6 8.5
Cereal imports thou, mectric toneos 343 380 429 27,700 66281 48.947Food aid in cermals ,'1 225 206 1,565 5A477 544Food production per capita 1987= 100 103 93 107 101 101 102Fertilizer consumption kgffha 36.1 24.7 44.8 16.1 481.0 67.8Share of agricultur in GDP S of GDP 7A 6.0 8.4 9.0 15.7 3.0Hlo"usg %ofGDP 7.9 11.0Average household size prsnos. per household 4.0... Urban
Fixed investmient housing S of GD? 7.0 5.2Fuel.nd power SofGDP 1.9 3.8Energy consumption per capita kg of oil equiv. 1.270 702 1,096 913 1,595 1.632Households with electricityUrban % of houseolds...Rura . .
Tranmport and commnunicadon %ofGDP 8.5 17.0Fixed invesment ftranpor equipment N3.7 4.9Tota road length thou. km 13 17IN4VESTNMEN IN HUMAN CAPrrALHealthPopulation per physicijan person 2,632 2Z040 ... 3,27Population per nurse S 30 486 ...-
PIopulation per hospital bed *200 300 s. 51 604 395Oral rehydyration therap (under-5) % of camse... 10 61 .. 51EdutionGross enrollment ratioSecondary % of school-agepop. 53 59 62 47 53 53
Female 63 62 66Pupil-readier ratio: primary pupils per tewter 32 35 38 26 .. 25Pupil-eadier rugati:seodary 34 31Pupils rcaching grade 4 %Of Cohort .. 97 99... Repcatr rat.primmry w,Ofo'a emgu 4t 3 4-Illitray % of pop. (age 15+) ... t 15 19 14
Female % offem. (agels5+) .... 1 18 - 17NLewsp circulation perthou. pop 6 60 67 35 74 125
Wol im ntemaonal EconmomPeann? Ape! I9MI
171

Japanfart Same rag2isfieome peup
lttan zlb ys ear reantUit f ate Hgh-
Indiaor maswre 1970.75 1980655 198593 incomePriority Poverty Indicators
POVERTYUpper pory line local curr.Headcouni ndex Iofmpop. .. ..
Lowr poverty line local cor.Headcounlindex I of pop.
GNP percapita US$ 4,940 10,950 31,490 23,680SHORT TERM INCOME INDICATORSUnskilled urban wages local cusmUnskilled nzal wagesRural terms of ndecConsumerprice index 1987=100 63 99 113Lower incomepwdj' 38 101 114
Urban Rural if
SOCIAL INDICATORSPublic expenditurc on basic socia services % ofrGDPGross enromment tiosPdimuay % school age pop. 99 102 102 103
Male 99 102 102 103Female 99 102 102 103
MortalityInfant mrtality per to. live birfts 12.0 7.0 4.0 7.0Undera S m liy " _ 6.0 5.5
ImmunizationMeasle % ag group _ 73.0 66.0 82.5DPT 983.0 87.0 90.2
Child minuntridan (under-S) - 2.5LifeexpctancyTotal Years 73 77 79 77Fernale advantage 5.6 5.5 6.1 6.4
Total fertility rate birs per womun 2.1 1.8 1. 1.7Matnal moruity rate per 100,000 Eve births - 1S
Supplementary Poverty IndicatorsExpenditues on social secudity %S of total govt exp.Social secuity covcrage % ecn. active pop.Access to safe waler totl * of pop.
UrbanRural
Access to health cau 100.0 100.0
Population growth rate GNP per capita growth rate Development dimondb
6+ (annual avrag pecent) (1 n= avenre. pecnt)Li
4 - - 1
1970-75 198045 1985-93 1970-75 19804S 1985-93 Acces to safe waw
mi p Japan _ Jan-TghiwUEwD - Higb-income
a See the tecnidcalows, p.387. b. The developmentdiamond, based on fourkMy indictors shwns lte avea lev of dvelopment i ecotrycompared with its income group. See the intoducion.
172

JapanMost Same rglioiincoie gremp
Laeast Jinleear meaVno of ordmate uigh-
Indkator measure 1970.75 198045 19U-93 Income
Resources and ExpendituresHUMAN RESOURCESPopulation (mre=1993) thousands 111,524 120.837 124,469 812,447Age dependency ratlo ratio 0.47 OA7 0.44 0.49Urban 'I or pop. 75.7 76.7 77.4 77.9Population growth rate annual * 1.3 0.7 0.3 0.6Urban 2.5 0.8 0.4 0.8
Labor force (15-64) thousands 55.678 59.772 63.317 395.641Agricullure % olaboriorce 15 11.Industry 34 34Femab*B 38 38Fcmales per 100 malesUrban number 102 101Rural 107 102
NATURAL RESOURCESArea thou. sq. km 377.80 377.80 377.80 32.146.15Density pop.pcrsq. km 295.19 319.84 328.63 . 25.11Agricultural land % of land area 14.80 14.29 13.74 42.80Change in agricultural Iand annual % -0.75 -0.32 -0.61 -0.48Agricultural land under liigation * 56.90 S4.88 54.18 13.96Forsts and woodland thou. sq. km .. 0.24 0.24 10.56Deforestation (net) annual % . 0.00
INCOMEHousehold income
Share of top 20% of households % of incomeShare of bottom 40% of householdsSharu of bottom 20% of households
EXPENDITUREFood %oofGDP 13.8 10.8 102 8A
Staples * 2.7 2.3 3.3 1.6Meat, fish, milk. cheese, eggs g 5.6 4A 3.7 3.8
Ccieal impons thou. metric tonnes 18,846 26.720 28,035 77,530Food aid in ceries .. .. .. 8Food produetionpercapita 1987=100 101 101 89 95Fartilizer consumption kg/ha 323.2 378.1 344.9 150.0Share of agriculture in GDP % of GDP 5.5 3.2 2.2Housing %oarGDP 8.9 113 113 11.7Averge household size prisons pr household 3A 3.2
Urban ' 3.3 3.1Fixed investnent housing % of GDP 7.6 3A 6.4 5.0Fuelandpower %ofGDP 1.1 1.9 1.4 2.0Energy consumption pr capita kg of oil equiv. 2.771 2.996 3,642 5,203Households with elctricity
Urban % of householdsRural .
Transport and co.munictln %ofGDP 5.4 5.7 6.0 S.8Fixed investment: transport equipment * 2.5 3.0 3.2 2.1Total roadlength biou kn 1.079 1,125 1,116
INVESInENT IN HUMAN CAITALHealthPopulation per physician persons 890 663 607 453Population per nurse * 307 184Population per hospital bed 80 86 64 145Oral rehydyratio therapy (under-5) S of cesmEduaentnGross erllment radoSecondary %of school-age pop. 91 95 97 92
Female 92 96 98 94Pupil-tubderratio: primuy pupils per taher 26 24 20Pupil-teacber ratio: seaodaryPupils reaching grade 4 % of cobort 100 100 100Repeaterr taprinsy % of toa cmlno 0 0 0Illitray %ofpop. (agSF) .. .. t.
Fbmale %offrm.(age 15t) .. .. t..Ne17 apemrcircu1ation er thou. pop. 525 565 577 320World LBantemtiional Econ ics OqDeament. April1995
173

JordanMert Same regleulornome group Next
Late tsingleyear recvi ntMIaIs 1oWir& higkerUni of estlmue & North middle. Income
Priority Poverty IndicatorsPOVERTYUpper poverty line local cr.. .. ..
Headeount Index 8b of pop. .. .
Lower poverty line local curr. .. ..Headcount index % of pop. .. ..
GNP per cpia USS .. 1,890 1,190 1.980 1,590 4.350SHORT TERM INCOME INDICATORSUnskilled urban wages local cur. .. ..
Unskilled muml wagesRural erms ortradeConsumnerprice index 987=100 44 100 183Lower incomeFoot .. 100 176UrbanRural
SOCIAL mNICATORSPublic expenditure on basic social scrvices * orGDP .. 12.1Gross enrollmnct ratiosPrimgay school agpop . 99 105 97 104 [asMale .. 98 105 103Fermae .. 99 105 90
MortalityInfant mortlity per thou. live births .. 40.0 27.0 52.3 39.0 35.8Under S mortality .. .. 42.0 69.9 61.5 42.6
ImmunizationMeasles agegroup .. 39.0 85.0 81.3 77.6 82.0DPT .. 53.0 92.0 84.0 82.2 74.2
Child malnutrition (urndcr-5) 17.4 .. 6.4Life expectancy
Total years 57 64 70 66 67 69Female advantage 3.4 3.6 4.1 2.3 5.9 5.9
Toul fertiliy rae births per woman 7.7 6.5 5.l 4.7 2.9 2.9Matmi mortlity rate per 100,000 live births .. ..
Supplementary Poverty IndicatorsExpenditures on social security S of total gov't exp. 8.9 7.3 8.7Social security coveragc % con. ative pop. .. ..Acceastosafewater: al %W ofpop. 77.0 956 99.3 835 .. 86.7
Urban 98.0 I00.0 10D.0 98.7 .. 93.9Rural 59.0 88.0 97.8 6 .0 .. 66.7
Access to hlth cam .. B0.0 90.0 87A
Population growth rate GNP per capita growth rate Development diamondb, ( uel averge. percent) I (annual average, percent) Life ex
4 ~~~~~~~~~~~~5
2 4 g 4 O - I ~~~~~~~~~~~~~~>* I ~~~~per F pnmary
O | | l I l | I _ H -5- 1\* 1 G4ii~~~~~~~~~cata \ /muvlment-I -5
1970-75 1980-85 1988-93 1970-75 1980-85 1988-93 Accessto safeCwaer
IZ Jordman Jordan- Lwer-niddlc-incore Lower-middle-income
a. See de teeical nos. p387. b. The development diamond, based on fourlmky indicaos, shows de avrage level of development in ffie countrycompasd wilh its income grup. See de introduction.
174

JordanMadt Same. rug! owiM come rap Nexd
1&9Latest j rarest Mhd-Bait Lai'er. higherUN IVof cubdmate & North middle- Income
IndIcatr manure 1970-75 1980-85 1958-93 Afska Incomne groupResources and Expenditure
HUMAN RESOURCESPopulatIon (mrmuI993) thousands 1,810 2,644 4,102 261.650 1.096,665 500.50Are dependecscy ratio ratIo 1.00 1.03 0.97 0.87 0.69 0.62Urban % ofpop. 55,3 74.1 70.1 55.2 54,7 71.2Population growth rate annual 3.5 3.9 3.8 2.7 1.6 1.7
Urban *5.2 7.8 4.8 3.7 2.9 1.8Labor forc(15464) thousands 634 799 1,124 71.333 459,196 190.136Agicoulture of Laborfomre 19 10Industry 2.6 26Feinae 7 9 1 1 16 31 29Females per 1 00 miales
Urban number...Rural
NATURAL RESOURCESArea thou. sq. km 89.21 89.21 89.21 11,021.26 40,612.67 21.848,24Density pop. pcr sq. km 20.29 29.64 44.27 23.10 26.52 22.51Agricultural land % of land are 12.54 12.88 13.45 32.10 39.61 41.26Change in agricultural land annual % 0.09 0.26 0.25 0.04 -0.13 0.08Agricultural land under irigation S 3.23 4.19 5.43 30359 12.66 8.84Forests and woodland ahom. sq. km .. 0.00 0.00 0.45 5.95 8.04Deforestation (net) amnnua S .. -1.06INCOMEHousehold incomeSham of top 20% of households S of income ... 48Sham of botom 40% of households -... 17Sham of bottom 20% of households -... 7
Food % of GDP 43.6 32.8 staplesMeat, ris,, milk cheese, eggs96 3,92 6.81 4,4
Ceara impnrt thou. metric tconnes 176 721 159 3,9 6.81 4,4Food aid in cerals *79 28 254 1,249 5,477 544Food production perecapita 1987=100 77 108 99 102 lOt 102Fertilizer consumptio kgflu 5.2 13.5 1335 89.9 48.0 67.8Shun of agriculture in GDP % of GDP .. 4.3 6.8 133 15.7 8.0Housing * of GDP 5.7 5.7 -
Averag household size pemsons per household 6.0 .
UrbanaFixd invesment housing Sk of GDP 7.8 9.6Fuel and power S of GDP...Energy consumplion per capita kg of' oil equiv. 444 .062 922 1,097 1.595 1,632"Households with elecricity
Urban S of households...Rural
Transport mnd cunmmunication Sof GDP 6.3 5.2 Fixed investment trunportequipnrnet 4.8 3.3TotalmadWlength thou kin 4 5 6
DINVESFMENT IN HUMAN CAPITALHealthPopulation per phys ician persons 2.645 860 767 .. 3,277Populanon per nurw 874 980 497PDoplatin per hospital bed 975 830 519 633 604 395Oral rehydyration theapy (under-5) S of cases ... 53 56 .. StEdmcationGrass enrollmet ratiSecondary S of scbool-age pop. .. 79 91 56 53 53
Female .. 78 62 50Pupil-eaCherratiw:priMay pupils per teachuer 3'5 3 1 22 26 .. 25Ptupi-teacher ratio:sccondary 21 1s 13 21Pupils reaching gradce4 of cohort 94 96 99 95Rapeatrzatcprimay of toinenroll 4 s 3
litemacy % of pop-.(OF 15+) - 26 20 45 19 14Female of feni.(agels5+) - 38 30 57 .. 17
ci~rcuatilon perthou. pop. 32 59 63 33 74 125worl Baic nmmtiod EonoucsDepartment. April199
175

KazakhstanMoNe Sm. rAln/Ineme -group Nea
£alutdngluyw recen W i L viv,r higchsunai of exfllne Contral middle Income
idkmanur uei 1970D75 19JOD5 9J&93 Aiai leome graoup
Priority Poverty IndicatorsPOVERTYUpper poverty line local curr. .. ..Headcunt hndeu. % or pop. .. ..
Lower povery line local cu. .. ..
Hendooust Index % of pop. .. ..
GNP per capita USS .. .. 1560 2.450 1.590 4,350SHORT TERM INCOME INDICATORSUnskiled tban wages local car. .. ..
Unklled rumral wages .Rural trn of trade N
Consumwrprice index 1987=l0 .. ...Lower Income .
urban
SOCIAL MIDICATORSPublic expendiure on basic social srvice. * of GDP .. .. 8.0Grass enrollment raiosPrimuY %school ag pop. .. .. .. .. 104 105
MaleF-emale
MoalityInfant mortality per thou. live birth 50.0 36.0 29A 24. 39.0 35.8UnderS morlity N .. .. 49.0 36.4 615 42.6
ImnYAZtionMeases %9eWpvup .. .. .. ,. 77.6 S2.0DPI .. .. .. .. 82.2 74.2
Child malinutrition (under-5) .Lif cxpecancqTotal years 64 67 70 69 67 69Fumak advantAp 103 10.2 8.8 8.8 5.9 5.9
Total fertility rate birhs perwoman 3.5 3.0 2.5 2.1 2.9 2.9Matral mortality rate per 100,000 live birts .. 56 53
Supplementary Poverty IndicatorsExpenditmes on soci security Yb of total goVt exp. .. ..
Social securiy coveap econ. acdve pop. .. ..
Access to safe war total % of pop. .. .. .. .. .. 86.7Urban .. .. .. .. .. 93.9Rural .. .. .. . .. 66.7
Access to healh camc _
Population growth rate GNP per capita growth rate Development diamondb6 (annual average, percent) I 1 averag. percent) ti1 expctany
4 -5
2 0 ~~~~~~~~~~~~~~~~~~~~~~~~~~~~prprimary
-2 -101970-75 198 5 19893 1970-75 199045 1983 Access to st waer
J Karkhst KazakhstanLow-iniddle-inc Lower nuddle-inclme
a See tbe tcical noles p387. b. Te deVeIlMent diaMond, based on four key indicat shows the avrage level of devdopmet in the countrycompaed with its incom grop. See tbe inoduction.
176

KazakhstanMeatSca eg.fuem,yy N
Lager aInwgŽ PMa recanf i o,'- hgeVlmt of ealiufle & Genital middle. income
ladhLamr manure 1970475 19O-5M 195-93 Asia Incoe. groupResources and Expenditures
HUMAN RESOURCESPopulation (arEuI99S) thouriands 14,136 15.780 16,952 494,619 1,096,665 500,507Ago dependency ratio ratio 0.68 0.61 0.59 0.57 0.69 0.62Urban % of pop. 52.2 55.1 58.9 64.8 54.7 71.2Population growih rate annual %, 1.5 1.1 0.6 0.6 1.6 1.7
Urban 2.2 I.E 1,4 1.5 2.9 I'sLabor force (15.64) thousands .. 7,136 7,390 237.897 459,296 190.136Agriculture % or labor force .. 23 24Indusiry . 3 1 30Female U .. .47 31 29Females per I1D0 males
Urban number...Rural
NATURAL RESOURCESArea thou. sq. km 2.7 17.30 2,717.30 2Z717.30 24.320.56 401.682.67 21,848.14Density pop. per sq. km 5.20 5.31 6.201 20,20 26.52 22.51Agricultural land *of land arem. .... 39.61 41.26Change in agricultural land annua lb*. 0.28 -0.28 -1.28 -0.13 0.08Agriculturel land under itrigation '1 0.73 0.97 1.02 7.15 12.66 8.84Forumstand woodland fthu. sq. km ... . 0.80 5.95 8.04Dcfomstation Cnet) annual*...
INCOMEHousehold incomec
Shame of top 20% of households % of Income ..
Share of bottom 40% of households...Share of bottom 20% of households...
ExPENDITUREFood %ofGDP...
Staples Meat, fish milk, cheee, eggs
Ceral imports thou. metrc tonnes .... 10 34,452 66,28'1 48,947Food aid incermals ... 3 4,392 5,477 544Food prolucton per capita 1987=1 00 lot . . 0 102Fertilize conumption kglho . 2.1 41.7 48.0 67.8Shareoragriculturmin GDP %ofGDP .. 24.1i 28.5 13.5 15.7 1.0Honsing % of GDP ... 4.7 6.0Average househod size persons per household ... 4.0
UrbanFixed invesment housing % of GDP ... 4.9 5.2Fuel andpower %OfOGDP ... 1.0 1.2Enegy consumption per capita kg of oil equiv. ... 4.435 2.959 1,595 1.632Households with clectricity
Urban % of houscholds...Rural
Transport and eonunnulcation % of GDP...Fixed investntmt: transport equipment...Totalimad length thou. km 103 113 189
INVESTMENT IN HUMAN CAPITALHealthPopulation per physician persons 361 269 253 362 3,277Population pernurse 1OS 87 91 249Population per bospitml bed "79 74 75 136 604 395Ora welydynition theray (under-5) S of camses. .. . 51EducationGrMas enrollment ratioSecondary S of school-age pop. ... 92 .. 53 53Female ...
Pupil-teacher ratio: prnypupils per teacher ... .. .25
Pupil-teacher ratio: eona.Pupils reacin grad 4 S Of coDhort..Repeater rate primary % of towtal noE. ....-
Illteacy % of pop. (AP l5+) ... 914Femalec S of fern. (age 15+) 1.....*
Newsae ciculation pe thDou. po. 74125world Bankc laftmahonal Economices DePaItMeL April1995
177

Kenyat Same reglmin/ne.me grp Niie
LIvenfli! r race Sib hi gherunit of enltae Sahara 1I income
Indkcator mecure 1970STS 198045 19JJ. 3 AJHca Income group
Priority Povert; IndicatorsPOVERTYUpper poverty line local curt. .. ..Headcount index % of pop. .. .. 37 . 19
Lower poverty line local ctrr. .. ..licadcount Index %S opop.
CINPpercapka US$ 250 300 270 520 380 1,590SHORT TIRM INCOME INDICATORSUnskilled urban wages loca cuar. ...Unskiled rural wages .. . 136Ruml terms of trdeConsumer price Index 19gl=100 26 89 329Lower incomeFood
Urban .. 93 116Rural
SOCIAL INDICATORSPublic expenditure on basic socia scrvices Sb of CDP .. 7.1Gross cnrollment ratosPrimay % school ap pop. 95 98 95 67 lo8 104Male 103 101 97 74 116Fcanle 87 95 93 60 101
MortalityInfant motality per thou. live births 88.4 64.2 61.0 93.1 63.1 39.0Under 5 mority .. .. 94.0 1723 IOIA 61.5
lmmmizaionMeasles I' age group .. 63.0 36.0 49.9 873 77.6DPT .. 70.0 36.0 51.9 89.9 822
Child malnutrtion (under-5) 227. 22.3 .. 403Lif cxpetncyTota years 53 S7 58 52 62 67Female advantagc ' .. .. 3.0 3.3 2.1 5.9
Total fertility rte birdhs per woman 8.1 6.9 5.2 6.2 3.6 2.9Matemal mormliiy rate per 1 00.000 live births SID51
Supplementary Poverty IndicatorsExpendinu on ocidal security % of total gov'tcap. 0.2 0.1 0.1Social acurity coverage % eco. active pop. .. ..Access to safe water. total % of pop. 17.0 28A .. .. 67.0
Urban 100.0 61.0 .. .. 78.7RuRn r 4.0 21.0 .. .. 62.0
Access lo heali care ..
Population growth rate GNP per capita growth rate Development diamondb
6+ ( u cgpe(annual average. peprent)
(lsual avenge. pereen) WUfa e4 5 -
2 -- wGNP Crass
-2
1970-75 1980.85 1988-93 1970-75 1980-85 1988-93 AcezutD safe wate
Kenya - KenyaLow-income - Low-iDoJUC
a. Sec tle tehical noes, p.387. b. The deelcopm tdi&tL basedoan fourkey indts, s the avagc ll of delvlopmet in the counycompaed with its icome group. See the troduction
178

KenyalAs SntarurLmNuamagrw? Noni
Latest 51351994r Facet SiF - h~~~~iighsfunitt of etat SAsonm La'. (Reame
lindiaNs aemaru .197.75 A"P895 J955413 ApAce bunsI gprimpResources and Expeuditures
HUMAN RESOURCESPopulatlon (nwe.1993) thousands 13,741 19.997 25.347 558.978 3,091.764 1.096.665Apodepcndoncy rallo Mailo 1.12 1.14 1.05 0.94 0.67 0.69Urban % or pop. 12.9 19.7 26.1 29.9 27.6 54.7Population growth rate annual li 3.7 3.5 2.7 2.9 1.9 1.6
Urban 7.8 7.3 5.9 5.0 3.9 2.9Loabr force (15-64) thousands 5.990 9,389 11,161 229.480 1.442,452 459.196Agricultumc % oflabor force 83 S IIndustry N6 7 3. .. ..
Femnale *42 4 1 39 3 3SFemales per 100 males
Urban n-umber . .. ..
RumalNATURAIC RESOURtCESArca * thu. sq. 1cm 580.37 510.37 510.37 24.273.63 39.091.96 40,682.67Density' pop. per sq. km 23.68 34.46 42.52 22.37 77.60 26.S2Agrlcultdral land oif land mam 70.88 71.11 71.25 52.54 52.32 39.61Change in agricultural land annual N' 0.07 0.09 0.02 0.06 0.03 -0.13Agricultural land under irrigaioa Ii 0.10 0.10 0.13 0.83 18.02 12.66Forestsaand woodland thou. sq,.km - 0401 0.01 5.32 7.15 5.95Deforestation (net) annual Ii... 0.56 .
INCOMEHlousehold incomeShameoftop 20%of households % of iacme 60 .. 62 . .-
Shameofbottom 40%bof homseholds 9 .. 0 .
Shameoftbatom 2D%of houscholds 3 .. 3 EXPNDITFood % ofGDP 21.3 23A -. 44
staples U12.2 11.3 .
Meat. limh, milk, cheese eggsp 7.3 6.7 Cemal imports thou. metric tonnes 86 279 569 13,15 34,420 66,231Food aid in cereals *2 340 287 5,079 8.334 5.477Foodproduction per capita 1987=100 104 96 80 101 113 101Fertilizer coisunption kglha 1.1 2.7 2.5 4.6 59.9 48.0ShamcofagriculuacinOGDP % orGDP 30.2 28.5 24.5 163 26.3 1537Hamming liof CDP 8.7 8.3 ...
Averag household mize peniaons per household 5.0 .. 4.9...Urban 5.0 .. 3.1...
Fixed invesument housing % of'DP 3.5 3.1 . ..
Fuedand power % ofGDP 1.7 1.7 . ..
Energy consumption per caita kg ofoil equiv. 114 101 99 257 364 1,595Households with electricity
Urban % of houscholds ... 37.0...Rural .. .. 2.0 ..
Trmnsport and emmnunleimn l of GDP 5. 5.6 4 .
Fazed investment tranport equipment 2.7 1.7 . ..
Totalrwad lengtb thou. km SD 65 67...INHMAN CAPITAL
HealthPopulatio per physician perUso 7,900 6,512 9,851 ... 3.277Populaton per aumt *2525 942 . ..
Population per hospital bed g oo 5S0 602 1.269 1.016 604Oral zehydyration therap (under-S) I% of case 44 69 37 31EdacatimGros enrollment ratioSecondriy % ofschool-age pop. 13 21 29 18 41 53Female 9 16 25 .. 34 4
Pupi-fteser raio: prinmar pupils per teacher 33 34 31 40 39Pupil-techer rato: stoondary 25 20 17 4420
Pupilsreaching grade 4 % Of cohort 97 68 77...RepeWa eritprimay % of totalemuo 5 13 . ..
Illiteacy %of pop. (agelIS+) .. 35 31 50 4'1 19"Female % of km. (ageIS+) - 47 42 62 53
New je circulation pe totI pop 10 14 14 12 .. 74Ws anK Jateuabonal Economacs DepeztnuPLNt, prl 19
179

KiribatiMwt: Sans rvulmnflneomgroup Next
narlt abrgm.91 r - recnl "Lower& hkherlinmi qf -almat East middle. income
Indicator measure 19707S J9IO4i5 JUN.93 Aria Income grolup
Priority Poverty IndfcatorsP OVERTYUpper poverty lino local curr. .. ..
lecadcoun:index ' of pop. .. . .. 12Lower poverty line local curs. .. .Headcount index % of pop. .. . 9
GNP per capita USE .. 520 710 It-0 1.590 4.350SHORT TERM INCOME INDICATORSUnskilled urban wages local curr. .. ..Unskilled runt wagestRural termis of tradeConsumer price Index 198710 .. ....
Lower IncomePDD..
Urban .. 88 118Rumrl
SOCIAL INDICA1tY!SPublic expenditure on basic social services % orGDP .. .. ..
mross enrollmnot ratiosPiralry % schoolagcpop. .. 84 .. 118 104 105Male * .. .. *. 123Female .. .. 115
MortlityInfant mortalily per thou. li1 births .. 35.5 39.0 35.8Under S mortlty '0 .. .. 6.5 61.5 42.6
ImmunizationMeasles % A group .. 4.0 63.0 93.0 77.6 S2.0DPI S .. 37.0 79.0 95.0 82.2 74.2
Child malnutrition (under-S) 24 . .. 1 ..ifGe expectncyTotal years .. .. .. 68 67 69Female advantur ' .. .. .. 3.6 5.9 5.9
Total fertlity r births per woman .. .. .. 23 2.9 2.9Maternal nmtaiL per 1000001ive births .. .. .. 116
Supplementary Poverty IndicatorsExpcnditures on 'Ni of ta govt exp. . .. .. .. ..Social scurity co '% econ. ctve pop. .. . ..Access to safe wa S of pop. .. .. 72.9 67.1 . 6.7
Urban * .. .. 91.3 83.5 .. 93.9Rural .. 62.5 61.3 .. 66.7
Access to healhi cage * .. 100.0 100.0
Population growth rate GNP per capita growth rate Development diamondb(annual avenge. percent) (annual average, percent) Ufe exl .
4 5
GNP/ Gross2 - i 2-0 - I i= II capita en--- -- roilme
-2 -101970-75 198045 1988-93 1970-75 198045 1988-93 Aces.. to safe water
r Kiribati - Kiribati- Lower-nidde-income - l,wer-middIemincome
L See die technical notes. p3V7. b. Mme develqoment diamond. based on four key indicators, shows die aveage level of development in the countrycompard with its incwme group. See the intrducfion.
180

Kiribati110>t Same regianflhzome gnnp Next
LoetS sangle year rweuti User6 higherUnat of estimat Eaii mkide- income
lndkcamar utewure 1970-75 198045 19B-93 Asia Income grass
Resource and ExpendituresHUMAN RESOURCESPopulation (mitl!1993) thousands 55 67 76 1,713.883 1,096,665 500,507Age dependency ratio ratio .. 0.71 0.71 0.54 0.69 0.62Urban % of pop. 30.1i 33.5 35.3 31.3 54.7 71.2Population growth rate annual % 1.9 1.9 1.7 1IA 1.6 1.7
Urban 4S5 3.0 2.3 4.0 2.9 1.8L-abor force (15464) thousands ... . 942Z977 459.196 190.136Agriculture % of labor force...IndustryFemale ... .41 31 29Females per 100 males
Urban number 99 .
Rural 15.NATURtAL RESOURCESArea thou. sq. kcm 0.73 0.73 0.73 16,367.91 40,682.67 21,8481.14Density pop. per sq. km 75.34 91.78 102.36 103.27 26.52 22.51Agricultural land % of land area 49.32 50.68 50.68 4421 39.61 41.26Change in agricultural land annual Ii 0.00 0.00 0.00 0.24 -0.13 0.01Agricultural land underirrigaton ...... 14.68 12.66 8.84Forests and woodland thou. sq. km .. 0.00 0.00 4.06 5.95 8.04Deforestation (net) annual S .. 0.00INCOMEHousehold income
Share of top 20% of households 1. of incomen . ....
Share of bottomn 40% of householdsShame of bottomn 20% of households
EXPENDITUREFood %ofGDP...
StaplesMeai, fishi, mini. cheese, eggs
Cereal imports thou. metric tonnes S 9 30,036 66,28'1 48,947Food aid in crcals .1.. 447 5.477 544Food production per capita 1987= 100 ..- .115 101 102Fertilizer consumption kgta . - 76A4 48.0 .67.8Shre of agriculture in GDP % ofGDP . 27.3 21.3 17.1 15.7 8.0Housing S ofG(DP...Average household size peorson per household 6.1 .
UrbanFixed investment: housing % of GDP...Fuel and power % of GDP.....-Energ consumption per capita kg of oil equiv. 200 104 105 632 1.595 1,632Households with electricityUrban % of househoklds..Rural
Transport and comxnuicatim lb of GDP...Fixecd investment transport equipmentTotal road length thou. Ian...INVESTMEN4T IN HUMAN CAPITALHealthPopuation per physician persons 1,667 2.033 5,143 1,063 3.277Population per numse .. 240 190 1,490Population per hospita bed 83 220 .. 612 604 395Oral rehydyration therpy (under-5) S of case . . 85 32 .51I
EducatioGross enrmlbuent ratioSecondary S of school-agp pop. ... .53 53 53
Female U .. .47
Pupil-teacher ratio: primary poupis per teacher 48 29 30 23 .. 25Pupil-teacher ratio: secondary 31 3 1 6 1 8 16Pupils waching grade 4 of cohort .. 92 94 92Rqcpater ratezprmary % OfrotDaenrol . 3 1 6 - -
Iliteracy % of pop. (agel15+) ... 10 22 19 14Female %Of femd arel5+) ... .36 . 17
Newsjiaer circulation ve hi o.. .. .74 125wrdBank interatonlEconomics Deparment. April 1995
181
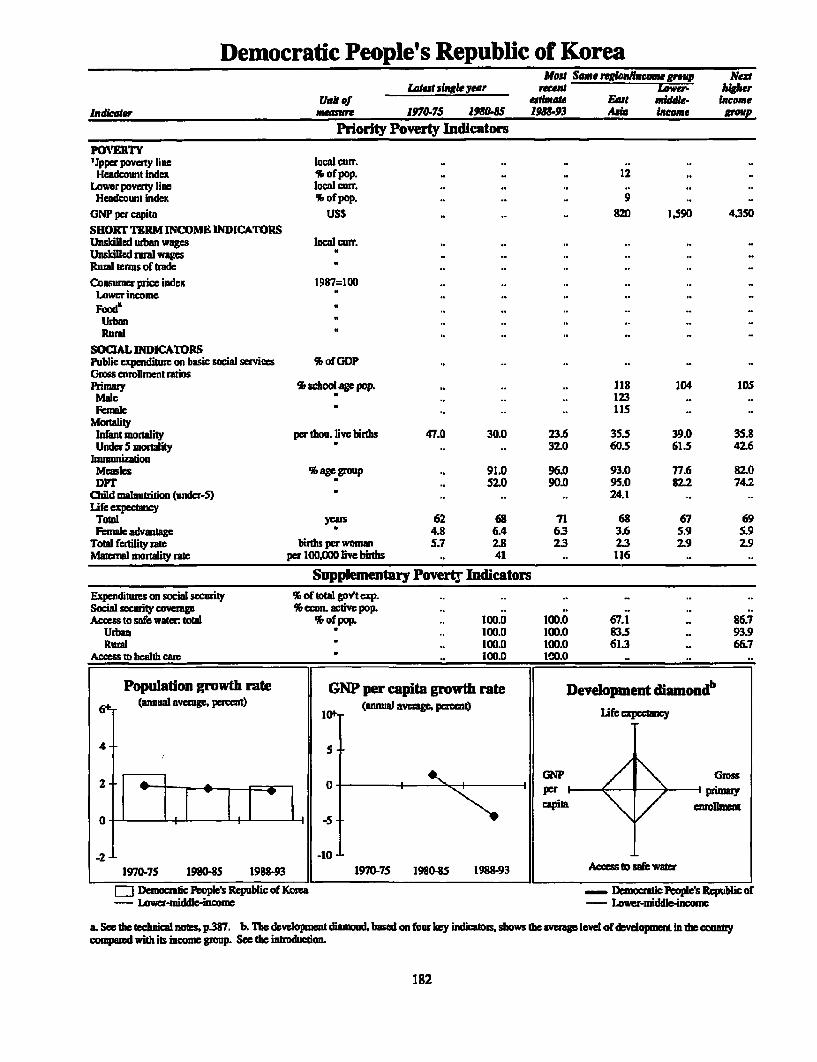
Democratic People's Republic of KoreaMos Samelgowu egM vo Nest
at siwke ye recant LNw. hitherUni of etimat Rat m re- Incame
ndicaer measure 19 5 80IJS 298-93 Aia nome gup
Priority Poverty IndicatorsPOVERTY'Jpper poverty line local curr. .. ..
Headcountindex %ofpop. .. .. .. 12Lower poverty lit local cur. .. ..
Headounit index % of pop. .. .. .. 9GNP per capita USS .. .. .. 820 1.590 4,350
SHORT TERM INCOME INDICATORSUnsklled wuban wages local cur. .. ..
Unskiled nal wagesRural tems of tade..Consumer price index 1987=100 .. ..
Lower income
UrbanRurad
SOCIAL INDICATORSPublic expenditure on basic social services % of GDP .. .
Gross enromment ratiosPrimary % school age pop. .. .. .. 118 104 105
Malc .. .. .. 123Female ' .. .. .. 115
mortalityInfant mortality per thou. live birdts 47.0 30.0 23.6 35.5 39.0 35.8UnderS mtity .. .. 32.0 605 615 42.6
immunizationMeasles Sage group .. 91.0 96.0 93.0 77.6 82.0DPT .. 52.0 90.0 95.0 82.2 74.2
Child malnutriion (unider-5) * .. .. .. 24.1Life expcbncy
Toutl yuas 62 68 71 68 67 69Female advatage 4.8 6A 6.3 3.6 5.9 5.9
Total fertility rale births per woman S.7 2.8 23 2.3 2.9 2.9Mamml morulity rate per 100,OOlivcbirths .. 41 .. 116
Supplementar Poverty lldicatorsExpeditus on social security % of total golt ep .. ..Socd secunty coverage % ecen. active pop. .. ..
Access to safie waow tal * of pop. .. 100.0 100.0 67.1 .. 86.7Urban ' .. 100.0 100.0 835 _ 93.9Rund ' .. 100.0 100.0 61.3 66.7
Aces to health care ' 100.0 100.0
Population growth rate GNP per capita growth rate Development diamondb6 (annual ave percent) (annuaJ avrage, percent) Life epeca ny
45
2 0GNP Gross1 1 1 1 1 1 ca~~~~~~~~~~~~~~~~~~~~~per errineng
-2 -p01970-75 19804 1918-93 1970-75 1910-85 1988-93 Access to ma water
m Democatic Peoples Repubfic of Korea Dm cPeopies Rcpublic of- Lower-muiddle-irome - Lmwer-niddleincs
a. See theteckaical notesp387. b. lTh dvelopmtdad basedon fourkry indicator shows theava level of development in thecountrycompared with its income grup. See the intducton.
182

Democratic People's Republic of KoreaMoni Siame ruglonAncoemagroupi Next
Lateu single year recent L. wer- higher[Unit of tifsmote East mhidle- income
ludicoJlar measure 1970-75 2980-85 1988-93 Asira income group
Resources and ExpendituresHUMAN RESOURCESPopulaton (mnre=1993) thousands 16,562 19.3988 23,036 1.7 13,333 1.096,665 500.507AgV dependency ratio ratio 0.93 0.53 0.50 0.54 0.69 0.62Urban ¶,of pop. 56.5 5tH8 60.7 31.3 54.7 71.2Population growthrate annual % 2.5 1.7 1.9 1.4 1.6 1.7
Urban 3.6 2.4 2.4 4.0 2.9 1.8Labor rore (1564 thousands 6.312 9.084 11,399 942Z977 459,196 190,136Agriculture % of labor forc 48 43Industry 2.8 30 4 "3I2Female 45 46 641312Females per 100 males
Urban numUber...Rural
NATURAL RESOURCESAmea thou. sq. km 120.54 120.54 120.54 16.367.91 40.682.67 21,848.14Density pop. per sq.kmn 137.40 164.99 187.55 103.27 26.52 22.51Agricultural land % of land area 15374 16.65 17.19 44.21 39.61 41.26Change ina aguicral lanWd annual % 0.53 0.50 0.49 0.24 -0.13 0.06Agricultural land under irrigation % 47.49 63.34 70M3 14.61 12.66 SM8Forests and woodland thou. sq km .. am am0 4.0 5.95 8.04Deforsation (net) innual % ... 0.00... INCOMEHousehold income
Share of top 20% of households % of income . .. ..
Share of bottomn 40% of householdsShare of bottomn 20% of households
Fond % of GDP . .. ..
staplesMeat. frs niillc chemese eggs
Cereal impots duo,. mectric tonnes 621 200 1,29 30,036 66.281 48,947Food aid in ceralsca... 447 5,477 S44FoDd puuduction percwpita 1987=10W 79 98 75 115 101 102Fertilizer consupmpto kglha 228.9 421.2 399.8 76A4 48.0 67.3Share of agriculture in GDP % of GD?P.... 17.1 15.7 tO0Houing % ofOCDP......Average househod size pemsons per household-.....-
UrbanFixed investment housing % of GDP .* ..
Fuel and power % of GDP - .
Energ consumption, per capita kg of oil equiv'. 1.587 1.823 1.701 632 1.595 1,632Households with electricityUrban % of households - .
RuralTranspon and ronunulctlon % of GD?P..Fixed investment trnsport equipmateu........-Total mad length thou, kin -.
RiVESThIENT IN HUMAN CAPiTALHealtPopulton per physician persons .. 426 .. 1.063 3.277Populaton per nurse..... 1.490 Population per hospital bed - .. . 612 604 395Oral rehydyration therap (undea-5) 5' ofrcase ... 5 32. 51EducationOcos enrolnent rutoSecondar 5 of school-ag pop. ... .53 53 53
Female ... . 47Pupil-reacher rato: pmaypupils per teacher ... .23 .. 25Pupl-teacher ratio: eodry. . 16Pupilsreaching gradc 4 %Of cohot .... 92lepemr rare priaty 5' Of tota enolM1. . 6 Niwnny 5' oflpop. (age 15+) .. 22 19 14
emWe ~% oIf tm. (ag 15.) ... . 36 .. 17Ne==2rcirculation per thou.LR. 64 226 221 .. 74 125
183

Republic of KoreaMost Same reglonnoeeme group Next
lAtest singe year recent Upper-- h;igherUnit of atbniae East middle- income
Indiceter measure 1970-75 1990-85 1981-93 Asia income grotp
Priority Poverty IndicatorsPOVERTYUpper poverty line local cur. .. ..
Headcountrindex % of pop. 5 13 .. 12Lower povety linc localeurr. 84 363Headcomntindex %orpop. .. 5 .. 9
GNP per capita USS 640 2,260 7.660 820 4.350 23,680SHO!RT TERM INCOME INDICATORSUnskillcd urban wages local cur. .. ..
Unskilled ruml wagesRural tenns of ude -. 84 130Consumer price index 1987=100 30 94 150
Lower income1ot 14 95 161
UrbanRural
SOCIAL INDICATORSPublic expendituw on basic social services % of GDP .. 7.0Gross enrollment ratiosPinimay %schoolagepop. 107 97 102 118 105 103
Male 107 96 101 123 .. 103Female 107 98 103 115 .. 103
MormlityInfant morality per thou. live births 38.0 23.0 10.6 35.5 35.8 7.0Under 5 mortality 1 .. .. 12.0 60.5 42.6 8.5
immiunzationMeasles % ae group .. 99.0 93.0 93.0 82.0 12.5DPTr .. 76.0 74.0 95.0 74.2 90.2
Child malnutrition (undcr-5) .. .. - 24.1 -
Life expectancyTotal years 63 67 71 68 69 77r-flmale 2dvantagc 6.8 7.6 7.5 3.6 5.9 6.4
Totalfenihty raw birthsperwoman 4.1 2.4 1.7 2.3 2.9 1.7Matanl mortality ralc per 100.000 live births .. 34 30 116 . -
Supplementary Poverty IndicatorsExpcndiues on social security %of total gov'texp. 5.3 5A 7.9Social secuty coverage % econ. active pop. .. ..
Access to safe water total %ofpop. 66.0 742 78.4 67.1 86.7Urban 95.0 90.0 91.0 83.5 93.9Rual" 38.0 48.0 49.0 61.3 66.7
Accss to health care -. 80.0 100.0
Population growth rate GNP per capita growth rpte Development diamondb(annual ave. percent) 1 (anual average. percent) life exc ancy
4 5 - I
0] - | [- | l 5capita enrollment
-2 41970-75 1980-5 1988-93 T1970-75 1980-85 1983-93 Access to safe wat
[J Republic of Korea Republic of Korea- Upper-middleiincome Upper-middle-income
a See the echnical wotss p.387. b. Th development diamond based on four key indicatos, shows the avnge level of development in the countrycompared with its income group See the introduction.
184

Republic of KoreaMaot Same reglenucomaegroap Ness
Latest sIngl yea recent Upper- MheghrUnit of estimate East middle- income
Indicator measure 1970-75 1980485 19U-93 Asia income grolup
Resources and ExpendituresHiUMAN RESOURCESPopulation (mre=1993) thousands 35.281 40.806 44.131 1.713.883 500,507 812.447Age dependency ratio ratio 0.71 0.52 0.43 0.54 0.62 0.49Urban % of pop. 48.0 64.9 78.3 31.3 71.2 77.9Population growth rate annual % 2.0 I A 1.0 1.4 1.7 0.6
Urban 5.1 3.9 2.9 4.0 1.8 0.8Labor force (15.64) thousands 13,054 16,790 19.780 942,977 190.136 395.641Agriculture % of labor force 43 36Industry K23 27 3Femal 33 34 34129 3Pemaies per 100D males
Urban number 103 102Rural 97 94
NATURAL RESOURCESArea thou. sq. km 99.02 99.02 99.02 16,367.91 21,848.14 32,146.15Density pop. perrsq-km 356230 412.10 441.40 103.27 22.51 25.11Agriculbn7 Land % ofland ama 23.01 22351 21.90 44.21 41.26 42.110Change in agricultura land annual 5 0.18 -0.31 -0.87 0.24 0.08 -CAB9Agricultural land under irrigaton % 56.21 59.63 61.29 14.68 8.34 13.96Forests and woodland thou. sq. km .. 0.07 0.06 4.06 8.04 10.56Derbiwstation (net) annual % ... 0.14
INCOMEHousehold incorme
Share of top 20% of households % of inconce 45 .. 42Sham of bottom 40% of households 18 .. 20Shaxcof bofom 20% of households 7 .. 7
EflENDITUREFood %ofGDP 37.1 2117 ..- .84
Staples 18.1 8.8 ..- .1.6
Meat fish, milk cheese, eggs 5.6 6.6 .... 3.8Cereal imports thou, metric tonnes 3.124 6.825 11.271 30,036 43.947 77,53Food aid in cermals 234 53 .. 447 544 8Food pwddwtion percapita 1987=100 89 103 100 115 102 95Flertilizericonsumption kglha 380.9 363.2 445.7 76.4 67.8 150.0Sham of agricultumeintGDP %ofGDP 24.1 12.5 7.1 17.1 8.0Housing %ofGDP 5.6 6.5 . - 11.7Average household size persons per household 5.0 4.5..-
Urban 5.0 4.4Fixed investment: housing % of GDP 4.5 4.6 .... 5.0
Fnduand power %Of GDP 3.3 2.8 ... .2.0
Energy consumption per capita kg of oil equiv. 689 1.314 2Z863 632 1,632 5.203Households with electricity
Urban % of households.....-
Transport and conrmunication % of GDP 4.9 5.6 ... .8.8
Fixed investment tranport equipment 5.4 3.2 ... .2.1
Total road length thou. kmn 46 51 56INVESITMENT IN HUMAN CAPITALHealthPopulaton per physician person 2200 1,381 951 1,063 .. 453Population per nurse *1,189 .. 454 1,490Popubation perhbospital bed 1.900 596 301 612 395 145Oral rehydyration thrxapy (under-5) % of cases ...- 32 51EducationGros enrollment ratioSecodary % of school-agepop. 56 90 90 53 53 92Female 48 88 91 47 - 94
Pupil-teacher ratio: piaypupils per teacher 52 38 31 23 25Pupil-teacher ratio: secondary 40 37 24 16 -Pupils redring grade 4 %OfcoDhort 96 98 100 92-Repcater raw primary %Of towalenmli 0 0 0 6 Illtercy % ofpop. (ngel5+) 12 5 t 22 14
Female % of frnt(agel15+) -. 9 7 36 17NC-S Eccuaon pe thoup. a 170 245 412 .. 125 320
185

KuwaitMew S.e rqi.a/bwon.pwxq,
URN e Okt waJt RhIdkador m ure 197J.7S 1980JS 198.93 bcon,
Priorit Poverty IndicatorsPOVERTmUpper poverty line local curr.
Headcount index % of pop.Lower povety line local curr.
Headcount index % of pop.GNPpercapita US$ 10.140 14,910 19,360 23,680SHORT TERM INCOME INDICAIlORSUnskilled uba wage local curr.Unskilled adl wags.Rural tiniu of ta.deConsunerprice index 1987=100 55 98 125
Lowerincomc ' .Foot . 102 106UrbanRuml
SOCL INDICATORSPublic expenditure an basic social services % ofGDPGross erolrihent ratiosPrimary school a1 pop 92 103 61 103Mae 99 104 60 103Female ' 85 102 60 103
MorrlityInfant mtoority per dto. live binhs 43.0 25.0 172 7.0Under5mortality 21.. 0. 2. 8.5
Inmmnizationmeasles % apg gmp .. 91.0 98.0 B2SDr .. 98.0 94.0 902
Child malnunidon (under-S) '. 6.4 -Life expecamcyTotal Yeas 67 72 75 77Female advantage 4.0 4.1 3.9 6.4
Total ferility am birlihs perwonm 6.9 49 3.1 1.7Matral motity mte per 100,000 live births . 18 .
Supplementary POhv IndicatorsExpenditures on social serity %oftotalgovtcxp. 0.0 6.6 9.7Social secnity covae % econ. active pop.Accesstosafewatcr total % ofpop. 89.0 10i0 100.0
Urban * 100.0 .. !O.ORural .. 100.0 100.0
Acenbtoalhcaru ' c. 100.0 _ IODD0
Population growth rate GNP per capita growth rate Development diamonde(annuavcavege. percent) b m percent) Life
4
2 0 7p'y - ~ OMP Gross
0-X < -+ i J-2~~~~~~~~~~~~-
1970-75 1980-85 1988-93 1970-75 1980485 1918-93 Access to sztf water
El Kuwait Kuwit- High-incm Hgb-ighm
a. See the ehnical aoteS, p387. b. The devep au dinond based mn four key indicaton shows the aveae level of d opment in le coun"ycwaed with its uincme gpup. See dte inoductin
186

KuwaitMast Sme ruxiou/lname gruep
Lar,sigleyte raentU ni of a - awle Hlith-
Ius5atr maure 1970.75 1980-5 1988-93 lameResources and Expenditures
HUMAN RESOURCESPopulation (mrn.lPf) thousands 1.007 1,720 1,762 812,447Age dependcy rtio mtio 0.85 0.62 0.67 0,49Urban % of pop. 83.8 93.8 96.6 77.9Popnidon gowth rate annua % 6.1 45 -6.5 0.6Urban 7.5 5,3 -6.3 0.8
Labor force (15-64) thousands 31 677 921 395.641Agriculture % of labor force 2 2Indusby 32 32 . ..Female 1 2 13 16 38Femles per 100 unies
Urban namnber ..Renal .
NATURAL RESOURCESArea thou. sq. km 17.82 17.82 17.82 32.146.15Density pop.persq.km 56.51 9632 10536 25.11Agriculturl land of land ana 758 7.69 7.97 42.80Chamge in agriculurl land ann'd % 0.00 0.00 0.71 -0.48Agricultund Ind underirrigation % 0.74 1.46 1A. 13.96Foet and woodland thou. sq. kn .. 0.00 0.00 1O.S6Defmosttion (nel) annuald .. .. 0.00INCOMEHousehold incomeShun of top 20% of households % Of income .. .Sham of bottom 40% of households ..Sham of bottom 20% of bouseholds ..
EXENDlTREFeod %ofGDP .. .. .. 8A
Staples .. .. .. 1.6Meat, fis, milk, che, eggs .. .. .. 3.8
Cera inports hou. metric tonnes 216 S76 251 77,530Food aid in creals .. .. 3Foodproductionperapitn c197= 100 .. .. 95Fertilizrconsunrpdon kg/ha . 5.l 5.6 150.0Share of agricultum in GDP % of GDP 0.3 0.6 05
ouIng %ofGDP .. .. - 11.7Aveage ho od size persons per houseold 65
UrbanFixed investment houing %ofGDP .. .. .. 5.0Fud nd power %ofGDP .. .. - 2.0Encrgy consumrption per capita kg or oil quiv. 5,764 6,838 4,217 5203Households with elearicityUrban % of households -. .Rnral '
Trilwt and _a ff_nk * of GDP .. .. _ 3.8Fixed irrstri sport t enu tpme .. .. - 2.1Total road lngth thou. In 2 4 41NESTMENT IN HUMAN CAMAL
Poplation per physicin person 1,048 609 .. 453Popuin per nurse ' 257 175 ...Population pr hospital bed * 207 241 _ 145Ol ehydyration terapy (under-SI % of cases .. *- 10EducationGrass emolrment raioSecondary % of school-age pop. 66 91 51 92Famile ' 61 87 51 94
Pupilacherratio:opiay pupilsPIrteacher 18 18 16 6.Pupil-acher tio: seconday 12 13 11Pupils reachig grade 4 % of cohmt 97 93Repeatercpimnary %oftotalenroll 11 5.Iitery %ofpop. (age 15+) 40 29 27Feane %of fmL (age 1s+) - 37 33
Ne w j 7 circultion _er toupop. 34 221 255 320WorW Ban Intimabonral Economs Dcputnnr April I
187

Kyrgyz RepublicMost Sm. reglonlhncomegroup Next
least single y _ar raes Eitropc 'aiier, higherUnit of estimate & Central middle. mean
Ildicator measure 1970-75 1905 1988-91 IAsia income group
Priority Poverty IndicatorsPOVERTYUpper poverty line local cur. .. ..
Headcount index $ of pop. .. ..
Lower poverty line loc curT. .. ....
Headkount index % of pop. .. ..
GNP per capita USS .. .. 850 2.450 1.590 4,350SHORT TERM INCONE INDICATORSUnsidiled urban wages local curr. .. ..
Unsiilled rural wagesRural erms uof tradeConsumer prie indx 1987=100 .. ..
Lower incomeFood
UrbanRural
SOCIAL INDICATORSPublic expenditure on basic social services % of GDP .. .. 7.1Gross anomenl ratiosPrimary % school age pop. .. .. S9 .. 104 105
MaleFemale
MortaityInfant mortality per thou. live births 59.0 44.0 34.4 24.8 39.0 35.8Under S mortality 5.. . 8.0 36.4 61.5 42.6
ImmuniztianM slks % age group .. .. .. - 77.6 82.0DPTI .. .. .. .. 82.2 74.2
Child malnutrition (under-5) 'Life expectancy
Total yeas 63 65 69 69 67 69Female advantage - 8.5 8.5 7.7 8.8 5.9 5.9
Total fertilitrate birft perwoman 4.7 4.1 3.6 2.1 2.9 2.9Maternal moraliy rmte per 100.000 live births .. 49 43
Supplementary Poverty IndicatorsExpendtures on social security % or total gov'texp. .. .
Social security coveage % econ. active pop. .. ..
Access to safe water total * of pop. .. .. .. .. .. 86.7Urban .. .. .. .. .. 93.9Rural .. .. .. .. .. 66.7
Access to health care ___ _ ............... .......... .. .. ....
Population growth rate GNP per capita growth rate Development diamond'(anual average, percent) 5 (annual avage.,percent) Ufe expeq ncy
4 -- 5
GNP Gross
12 F 0 - pe rim1 1 1 1 1 1 ~~~~~~~~~~~~~~~~~~~~~~~~cpt enrollment
-2-11970-75 19804 1988-93 1970-75 1980.85 1988-93 Ace to safe water
[ Kyrgyz Republc Kyrgyz Republic- Lower-middle-icome Lower-middle-income
a See t echnical nort p.38 7. b. The development diamond, based on four key indicators, shows he average level o!development in the countrycmpared with its income group. See the introductirnL
188

Kyrgyz RepublicMost Same region/income group Nedt
Latest single year recent Europe iiwe higherUnit of estimate .1 Central middle- Income
Indicator Measure 1970-75 1980485 1918893 AIsi income group
Resources and ExpendituresHIUMAN RESOURCESPopulalion (mre=1993) thousands. 3_299 3.990 4,590 494.6 19 1,096,665 500,507Age dependency ratio ratio 0.85 0,73 0.75 0.57 0.69 0.62Urban % of pop. 37.9 38.2 38.6 64.8 54.7 71.2Population growth rate annual S2.1I 2.0 1.7 0.6 1.6 1.7
Urban 2A4 1.9 2.1 1.5 2.9 1.8Labor force (15-64) thousands .. 1,614 1.839 237.897 459.196 190,136Agriculture s of labor foroce. 33 38industry .. 27 23Female *..53 47 321 29Females per 2 00 males
Urban number...Rumal
NATURAL RESOURCESArea thou. sq. km 298.50 198350 198.50 24,320.56 40,682.67 21.8451.14Density pop, per sq. km 16.62 20.10 22.73 20.20 26.52 22.51Agricultural land % of land arca ...... 39.61 41.26Change in agricultural land annualS . 0.04 -2.17 -1.28 -0.13 0.01Agricultural land under irrigation % 8.58 9.57 9.21 7.15 12.66 8.84ForesL' and woodland thou. sq. km ... . 0.80 5.95 8.04Deforestation (net) annual %...INCOMEHousehold incomeSharcoftopfM% of honsebolds S orincome .c 57Share of bottom 4D% of households ... 10 . .-
Share of baotto 20% of households 3EXPENDITUREFood %Of GDP ... 17.7
Staples ... 3.2Me2t OAsh milk, Cheese, eggs -. 7.9
Cerea imports thou, metric tonnes ... 120 34.452 66.28 1 48.947Food aid in ecreals ... 921 4,392 5.477 544Food production per capita 1987=100 ... .. 01 102Fertilizer oonsunpioon kgiha ... 3.2 41.7 451.0 67.8Share or agrijuiture in GDP S ofG(DP .. 29.9 43.2 13.5 15.7 8.0Housing % of GDP ... 4.2 6.0Average housechold size persons per household ... 4.7Urban
Fixed investment: housing S of (DP ... 5.4 5.2Fuel and power % of ODP ... .9 1.2Energy consumption per capita kg of oil equiv. ... 965 2,959 1.595- 1.632Housebolds with cleetUicity
Urban %of households...Run!
Transport and comnmunication S of GDP ... 5.6Fixed investment: transport equipment ... 11.4Toal road length thou. km 2.3 32 30INVESTMENT IN HUMAN CAPITALHealthPopulation per physician personls 402 296 310 362 3.277Population per nurse 122 102 101 249Population per hospital bed as8 83 94 136 604 395Oral rehydyration themapy (under-5) S of cases ... .. .51
EducationGross enrollment ratioSecondary % of school-age pop. ... 81 .. 53 53Female
Pupil-teachr ratio: primary pupils per teacher ... .. .25
Pupil-teacher ratio: secondaryPupils maching grade 4 S of ohont...Repeater rate: primary S of total enroll...Illiteracy % ofpop. (agelIS+) ... 3 5 19 14
Female %of fcnC(agelS5+) ...... 17News;paper circulation per thou- npop ...... 125World Bank lnternanonal Ecoinomics Departlmen Apni 1995
189

Lao People's Democratic Republicmest S.. rqn/Ieaemue urnp Neut
Eaten silgk year rcent higherUni of eLlus.im Bat Law- Income
Indidor measure 197_ 75 IJwos 18981-93 Asia Ilcome group
Priority Poverty IndicatorsPOVERTYUpper povety line local curr. .. . 11.472
Headcount index % orpop. ., .. 46 12 19Lowcr poverty line local curr. .. .. 3.558
Headcount index %orpop. .. .. 22 9GNP per capit USS .. .. 280 820 380 1.590SHORT TERM INCOME INDICATORSUnsldilled ubma wages local cu. .. ..
Unskilled rl waesRural eam of trtdeConsuimer pice index 19B7=100 .. ..
Lower inconeFeoo
UrbanRuml
SOCIAL INDICATORSPublic expecnditure on basic social services % of GDP .. .. 2.7 _Grmss cmalnent raiosPimauy % scboolBPepop. 58 JJI 98 113 108 104Mue 66 121 112 123 116Female 40 100 84 115 101
MortaityInfant mortiy per thou. live births 145.0 122.0 94.8 35.5 63.1 39.0Under S mortaity ' .. .. 141.0 60.5 101.4 615
Immun ationMesles * age group .. 33.0 47.0 93.0 87.3 77.6DPT .. 4.0 22.0 95.0 89.9 82.2
Child umiumtrition (under-5) .. 36.5 40.6 24.1 40.3Ufe expecancyTotal yeu 40 46 Sl 68 62 67Femalce advantage 2.7 3.0 3.0 3.6 2.1 5.9
Total ferility tc births per woman 6.2 6.7 6.6 2. 3.6 2.9Mateal mortlity rae per 100,000 live births .. .. 660 116
Supplementary Poverty IndicatorsExpendituies on social security % oftoali govt exp. .. _.S l security coverage % eown. aciwv pop. .. ..
Accss to sar Wtc tDoal %of pop. 41.0 _ 28.3 67.1 67.0Urban *0.. 47.1 93.5 78.7Rurl .. _ 25.0 61.3 62.0
Acocss to hadih cac .. 66.7
Population growth rate GNP per capita growth rate Development diamondb6 (annual avage. pernt) 0 (anual average, percent) lfi xl 1
4 -- 5-
2 .. rr* J ~~~~~~~~~~~~~~~j~~~~ ~GNP Gros
capita eflu
-2 -101970-7S 19805 1983-93 1970-75 19808S 1988-93 Accxs to safe water
[ lao Peoples Democratic Republic ao Peoples Democafic Republi- Low4ncome - Low-income
a. See the teciical notcs, p387. b. The development diamond, based on four key indicators, shows the average lvel of devclopnmm in the countycompan:d with its inCome grup. See the inuduction.
190

Lao People's Democratic RepublicMosl Same rLej*aficse group Net
Lat:st rinigla rY=a-- me -n - hi1gherUnt qf ut hud. Eatl Lew- Income
ldiator merr 19775 190-8S 1958-3 Aria Income gronp
Resources and ExpenditUresHUMAN RESOURCESPopulation (rrelH3) tbousands 3,024 3,594 4,605 1,713,883 3.091,764 1,096,665Age dependency rado ratio 0.81 0.84 0.90 0.54 0.67 0.69Uban % ofpop. 11.4 15.9 20.5 31.3 27.6 547Population growth rate annual % 2.2 2.3 3.2 1.4 1.9 1.6
Urban 5 5A4 55 6.2 4.0 3.9 2.9Laborforce (1564) thousnnds 1,760 2014 2,383 942,977 1.442,452 459.196Agriculture % of labor force 77 76Industry " 6 7Femalc 46 45 44 41 33 31Femalcs par 100 nules
Urban number 97 ..
Rural 97 ..
NATURAL RESOURCESArea thou. sq. km 236.80 236.80 236.80 16,367.91 39,091.96 40,682.67Density pop. per sq. km 12.77 15.18 18.34 103.27 77.60 26.52Agricultural lad % of land area 6.37 7.24 6.95 44.21 52.82 39.61Change iFnagiculturalland annualS% 0.00 3.73 -0.31 0.24 0.03 40.13Agricultural land nder iniption % 2.72 7.13 7.79 14.68 18.02 12.66Forestsandwoodlmnd thou.sq.la .. 0.14 0.13 4.06 7.15 5.95Defoesution (net) annual % .. .. 0.93
INCOMEHousehold income
Sham of top 20% of households % of income ..
Share of bottom 40% of householdsShar of bottom 20% of houselds .. ..
EXPENDITUREFood % ofGDP 5. . 2.6
Stlapies * . 32.0Meat, fish, milk, cheese, eggs . .. 10A4
Cera imports thou. metric tonnes 24 23 8 30,036 34.420 66.281Food aid in cerals 7 8 447 8.334 5.477Foodpoducdionpercapita 1997=100 72 11] 92 115 113 101Fertilzer consunmption kglha 0.1 1.2 2.1 76A 59.9 48.0Sham ofagriculture in GDP %ofGDP .. . 513 17.1 26.3 15.7Housng %ofGDP .. .. 15.6Average household size persons per household .. ..
UrbanFixed investment housing % of GDP .. . 4.2.Feel ad pwer % of GDP .. . 5.8Enegy consumption per capita kgof oil equiv. 44 40 39 632 364 1,59SHouseholds with elcicity
Urban % of households .. ..RuralTransrt and commnuncatlon % of GDP .. .. 2.8Fied invem t transport equipment .. .. 0.9
Total road length thou. kin .. ..
INVESTENT IN HEMAN CAPITALHealthPopolationperphysician pusGns 15.156 1,362 4.447 1.063 3,277Population per nuse 1,37S 532 493 1,490Popultion per hospital bed 1.078 . 405 612 1.016 604Oral rehydytion thrapy (under-5) S of cases - - 55 32 38EducationGross enrollment ratioSecary % of school-age pop. 7 23 22 53 41 53Fenale 2 19 17 47 34
Pupil-teacher ratioe prmay pupils per tscher 38 25 29 23 39Pupil-teacherrado: seconday 24 12 12 16 20PUpiS macingrgade 4 % ofcohon .. 31 . 92Repeater rate: primary % oftotal enron . 30 6
Illiteacy % ofpop.(agelF+) 65 56 .. 22 41 19Female % of fenL (age IS+) .. 24 .. 36 53 _
NewM =er circulation per thouL po. 2 4 3 .. 74Werld Biank Intemanonal Econonacs Deprtment Aprl 1Y95
191

LatviaMost Sum roicemo group Next
Ltest slingle sear recent uew higherUnit of a- ktiste & Contral middle- Incomo
Indotaor m-as-eu 1970-75 1PSU0S 1985.93 Asia income group
Priority Poverty IndicatorsPOVERTYUpper poverty line lonl crr. .. .
Heoadount Index % or pop. .. .Lower poverty line local curr. .. ..
Headcount Index % or pop. .. .
GNP per aipta USS .. .. 2.010 2,450 1,590 4.35DSHORT TERM INCOME INDICATORSUnskilled urban wages local curr. .. ..Unskilled rural wages .Rurl terms of tmdeConsumerpriceindex 1987=100 ,. ..Lower Income
UrbanRural
SOCIAL INDICATORSPublic expenditure on basic social services S or GDP .. .. 8.0Gross enrollment ratiosPrimaay S school age pop. .. .. .. .. 104 105Male .........
MortalityInrant monrtality per thou. live births 21.0 18.0 14.0 24.8 39.0 35.8Under 5 morality .. .. 26.0 36.4 61.5 42.6
ImmunizationMeases % ae group .. .. .. .. 77.6 82.0DFr .. .. .. .. 82.2 74.2
Child malnutrition (under-S)Life expectac
Total yeas 70 69 69 69 67 69Female advantage 5 9.2 9.7 11.6 8.8 5.9 5.9
Total frtility rate birhs per woman 2.0 2.0 1.6 2.1 2.9 2.9Matrnal mortality mte per 100,000 live biris .. 25
Supplementary Poverty IndicatorsExpenditurs on social security % of tot gov t exp. .. ..
Social seculity coverage % econ. active pop. .. ..
Access to safe war totr ] S8 of pop. .. .. .. .. .. 86.7Urban .. .. .. .. .. 93.9Rural U .. .. .. .. .. 66.7
Access to health cam.
Populstion growth rate GNP per capita growth rate Development diamondbi (annual average. prcent) 10 (aun aveage. mt) wfe expectancy
4 5-
2 _ __ _ ' GNIP Grosper pnnpauy
0O r- i I~~[ capita enrollrent
-2 -101970-75 1980B-5 1988-93 1970-75 1980-85 1988-93 Access to safe water
Ltvia _ Lavia- Lower-middle-income Lower-midd-income
a See the technical nols p387. b. The development diamnond based on four key indicato. dshws the averg level of devdopment in the countrycomposed with its income group. See the introduction.
192

LatviaMost Some npironln comejrpoMp Neot
I WM! Wm recent ieji.,e. AlpharUnit of eduweti & Ceurnul middle. Luenem
Indicator measure 1970-fl 1 910-5 1985-9 Asia Incomep group
Resources and ExpendituresIIUMAN RESOURCISPopuliltonl (smreull93 thouslandsl 2A474 2.613 2.611 494.619 1.096.665 500,507Age dependlency ratio nubc 0.51 0.49 0.51 D.57 0.69 0.62Urban % of pop. 65.4 69.2 72.2 64.8 54.7 71.2Plopulation growth mte annuail Ii 0.0 0.6 -0.5 0.6 1.6 1.7
Urbain *1.9 0.9 -0.1 I's 2,9 1.0Labor forc (15.64) thousands 1,240 1.395 1,397 237.897 459.196 190,136Agriculture %of labor force .. I 16Industry -,4 1 401...Female 50 47 47 47 3 1 29Females per 100 males
Urban number. .
RuralNATURAL REOURCESArea thou. sq. km 64.50 64.50 64.50 24,320.56 40,602.67 21,048.14Density pop. per sq. km 38.36 40.51 40.69 20.20 26.52 22.51Agricultural land % of land area 40.84 40.15 40.77 .. 39.61 41.26Change in agricultural land annual % .. 0.00 -1.44 -1.29 -0.13 0.08Agricultural land under irrigaton % ... . 7.15 12.66 8.84Forests and woodland thou. sq. km ... . 0.00 5.95 8.04DeforetSlion (nct) annual %...INCOMEHousehold incomeShare of top 20% of households % of income...Share of bottom 40% of householdsShare of bottom 20% of households
EXPENDfIltUEFood %orGDP...
StaplesMeat, rash, milk. cheese, eggs
Cerea imports thou, metric twines ... I I 34,452 66,2811 48,947Food aid incereals ... 390 4,392 5.477 544Food production percapita 1987=100 ...... 101 102Fertilizer consumption kg/ha ... 66A 41. 48.0 67.8Shamt of agriculture in GDP % ofOGDP .. 20.8 14.9 13.5 15,7 8.0Hous;Ing %of GDP ... 4.7 6.0Average household size persons per household ... 3.1
Urban Fixed investment: housing % of GDP ... 4.9 5.2Fuel and power % of GDP 1. 1)I 1.2Energy consumption per capita kg of oil equiv. ... 1.717 2.959 1.595 1,632Households with electricity
Urban %of househods...Rural
Transport and conamunIcadion % of GOP...Fixed investment: tranport equipment...Totalroad length thou. km 26 28 6
INVSTMNTIN HUMAN CAPITALHlealthPopulation per physician persons .. 241 281 362 3.277Populaton per nurse .. 12 119 249PopuLtidon perhospital bed .. 73 83 136 604 395Ordl rehydyration therapy (under-5) %6of css.......51
Gros enrollmient ratioSecondary % of schol-age pop. ...-.. 53 53Female
Pupil-teadchr ratio: priimay pupils per teAchr. .- .. 25Pupil-temeher rato: sceodaryPupilsreaching gnde 4 % nf cohort... --
Repeaterrmae primary 56 of total enroil.u. .-
illiteracy 56 of pop. (age 15+) ... .5 19 14Female %Of fem.L(agel15+) -...... 17
News r rcirculation thou. a .... . 74 125worl santltemnatioa E en s pFFaiteat Apni95
193

LebanonMeal Same eatlucemegrou Nex
Lat alqAt jw nasl Wii - --owh, hiherUnit of -M nd mte a Not niddles Income
lnocater measlur 1970975 195945 19-P9 A)491e income grou
Priority Poverty IndkcatorsPOVERYnUpper poverty lina local curr, . ..Headcount Index %b of pop. .. ..
LAwer poveny line locIl curr. ., .. .. ..Headcount Index 5' of pop. .. ..
GNP per capita US. 1.980 1.590 4,350SIIORT TERM INCOME INDICATORSUnskilled urban wages local cur. .. .. ..Unskilled arial wag".RumJ ierms or tmdeConsumer price Index 1987100 .. .. .. ,.
Lower income .Fond
UrbanRurl 9. .. . . .. ..
SOCIAL INDICATORSPublic expenditure on basic social services 9% ofDP .. .. .. ., ..Choss enrollmnent rationPrimnay hamchoolagepop. 121 99 Il 97 104 losMale * 130 104 113 103 ..Female * 112 94 109 90 ..
ModalityInrant monaity per thou. live births 48.0 41.0 33.0 52.3 39.0 35.8Under 5 mortality .. .. 40.0 69.9 615 42.6
IrmunizadonMeasles age group .. 23.0 40.0 81.3 77.6 82.0DPT ' .. 60.0 80.0 84.0 82.2 74.2
Child malnutrition (under-S)Lie expectancyTobal years 65 65 69 66 67 69Female advantage 3.9 3.9 3.8 2.3 5.9 5.9
Toud ferdlity rate births per woman 4.9 3.8 3.0 4.7 2.9 2.9Matemral mortality rate per I00,000 live births .. .. .. .. ..
Supplementary Poverty Indicatorstxpenditues on social security % of total gov't exp. .. .. .. .. ..Social secuwity coverage i ecoon. acdve pop. .. .. .. .. ..Access to safe water: total of pop. 92.0 98.0 .. 83.5 .. 86.7
Urban * 95.0 98.0 .. 98.7 .. 93.9Rural * 85.0 98.0 69.0 .. 66.7
Accss o health cm *. 95.0 .7.4 ..
Population growth rate GNP per capita growth rate Development diamonde(annual avag pent) 5 (annual average. pe t) ULe expectancy
It, ~~~~~~GNPGrs
tl (|5 ca>- pita trenrollnt
-2 -10 1970-75 19M0-85 1988-93 1970-75 198045 1988-93 Access to sfe water
j Lbanon _ Lebanon-Lo-werr-middb4n >c b=-mddle-income
a. See the teclhical noes p.3B7. b. Th development diamon bed on four key indkators, shows the ave e levl of developmnt in the countrycompared with its incorm goup. See tie inruduction
194

LebanonMost Same reglaonincome group Nut
Lates singleaear recent M?ld-Eaat Lower- higherUnit if estimaee & North middle- bucame
Indicator meamur 1970-75 1980-8S 1988-93 Afria bcome group
Resources and ExpendituresHUlMAN RESOURCESPopuladion (mre=1993) thousands 2.767 3.074 3,855 261,650 1.096.665 50.507Age dependency ratio ratio 0.86 0.74 0.73 0.87 0.69 0.62Urban % of pop. 66.B 79.1 85.9 55.2 54.7 71.2Populadon growth rake annual 9% 2.3 2.8 2.8 2.7 1.6 1.7Urban 45 4.3 3.6 3.7 2.9 1.3
Laborforce(15-64) thousands 771 769 992 71,333 459,196 190.136Agricultur % oflaborfore 17 14Industry 26 27Female 20 26 27 16 31 29Femle per 200 malesUrban number 97 ..Rural 99 ..
NATURAL RESOURCESArea thou.sq.km 1040 10.40 10.40 11.021.26 40.682.67 21.,4E.14Density pop. persq. km 266.06 295.62 360.34 23.10 26.52 22.51Agricultural land % of land :ma 33.72 30.11 30.89 32-10 39.61 41.26Change in agricultural land annual * -1.43 0.00 0.00 0.04 -0.13 0.08Agricultural land under inrigation * 24.93 27.92 27.22 30.59 12.66 S.84Forests and woodland thou. sq. km .. 0.00 0.00 0.45 5.95 8.04Defon:station (net) annual * .. .. 0.60
INCOMEHousehold incomeSham of top 20% of households 9. of income 55 ..Share of bonom 40% of householids I ..IShar of bottom 20% of househods 4 ..
EXPENDrrUREFood %ofGDP .. ..
StaplesMeat, fish, milk, c le eggs .
Cereal imports dhou. metric tonnes 585 579 737 38,092 66.281 48,947Food aid in cereals 26 14 5 1.249 5,477 544Foodproductionperccapita 1987=100 61 86 134 102 101 102Fertilizer consumption kglha 37.7 115.9 120.6 89.9 48.0 67.8Shareofagricultum in GDP % of GDP .. .. .. 13.3 15.7 8.0Housing % of GDP .. ..
Avera household size persons per household .. ..
UrbanFLxed investment housing % of GDP .. ..
Fuet and power % of GDP .. ..
Energy cons.unption per capitr kg of oil equiv. 774 871 727 1.097 1.595 1.632Households with electricityUrban % of households .. ..
Rural *Transport and conmiFmmation % of GDP .. ..
Fixed invamenet tasport equipmentTotal road length thou. km .. ..
INVESTSM IN HUMAN CAPITALHealthPopulation per physician prsons 1.299 735 741 .. 3,277Population per nurse 950Population per hospital bed - 230 .. .. 633 604 395Oral rehydymation derap (under-5) % of .. .. 45 56 .. 51EducatinGross arollment ratioSecondary % of school-age pop. S0 56 63 56 53 53
Female 33 56 64 50Pupi-teacherraio: primary pupils per teachcr 10 .. 26 .. 25Pupil-teacher ratio: secondary .. .. 21Papil' reaching gmde 4 % of cohort .. .. .. 95Repeater ma primay % of total enroll .. ..
Illitray % of pop. (agr 15-F) .. 23 20 45 19 14Female %of fam.(agelS54) .. 31 2 57 .. 17
Newscircuhlaion thou. . 102 93 133 33 74 125World Kanic Intematonal Econormcs Departent April 1995
195

LesothoMost Same region/Ineose group Next
latet iglc year recent Sub higheri r of estimate Saaren Low- inceme
Indicator easure 1970-75 1980-85 1988-93 Africa ncerme group
Priorty Poverty IndicatorsPOVERTYUpper poverty line local cur .. ..cHcadeount irdx % of pop. .. * * . 9
Lower poecrty line local curr. .. ..
Hcadcounl indcx % of pop. .. .. .. ..
GNP per capita US$ 250 370 650 520 380 1590
SHORT TERM ENCOME INDICATORSUnskilled urban wages local er. .. ..
Unskilled ruad wagesRural terms of tradeConsumer pricc index 1987=1O0 21 76 224 .
Lower incomeFood' " 13 75 198UrbanRural
SOCIAL INDICATORSPublic expendituu on basic social scrvices %ofGCDP .. .. 11.5Gross cnrolmcnt ratiosPrimasy % school age pop. OS 113 106 67 IOB 104Male 87 101 98 74 116Female 123 125 113 60 101 -
MortlityInfant mortlity per thou. live births 130.0 100.0 77.0 931 63.1 39.0UnderS monartity .. .. 156.0 172.3 101.4 61.5
ImmunizaionMeasles % age group .. 63.0 70.0 49.9 873 77.6DPT w .. 69.0 75.0 519 89.9 82.2
Chidl malnutrition (under-5) .. 133 .. - 40.3Life expectancyTotal years 50 55 61 52 62 67Fema advantage 5.0 5.0 5.0 3.3 2.1 5.9
Total fertility rate birds perwonmn 5.7 5.7 5.1 62 3.6 29Matenal mortality rate per 100,000 live births 1600 .. 220
Supplementar Povety IndicatorsExpenditures on social security % of total gov't exp. .. .. .. _ ..
Social security covemgc % econ. active pop. .. .. .. _Acce ssto sale water total % of pop. 17.0 173 46A - 67.0
Urban 65.0 37.0 59.4 - 78.7Rural - 14.0 30.0 44.5 - 62.0 .
Access to healtb care .. 50.0 80.0 -
Population growth rate GNP per capita growth rate Development diamonde6t (annual averae, percent) (inual aveg, percent) f
45
GNPGrs2- * i-I permaty
O l lI I I -5 -eptl > <aolxn
-2 -101970-75 1980-85 1988-93 1970-75 1980-85 198-93 o s w r
fl Lesotho _ Lesotho-Low-income - low-income
a. See the technical notes, p38 7. b. The development dianond. based on four key indicators, shows the avcrV level of development in the countrycompard with its income group. See the intoduction.
196

LesothoMost Same relenfinceme group Next
Latest single year recent Srrb highe(Int of estimate 8th. 3. Low- incoern
In tor mueasren 1970.75 1950-85 1988-93 Africa in comre grup
Resources and ExpendituresHUMAN REOURCESPopulation (znre-19193) thousands 1,1W7 1,563 1.943 558.978 3.091.764 1.096.665Age dependency ratio ratio 0.93 0.98 0.86 0.94 0.67 0.69Urban % of pop. 30.8 16.1 21.6 29.8 27.6 54.7Populatongrowthrate annural% 2.2 3.3 2.7 2.9 1.9 3.6
Urban 6.4 6.6 6.2 5.0 3.9 2.9Labor force (15.64) rhousands 597 730 861 229.480 1.442,452 459.196Agriculture % oflabor fome 88 86Industr 4 4Female 47 4.5 43 36 3 3'1Females per 100 males
Urban number 128... Rural 100 .
NATUIRAL RESOURCESArea thou. sq. km 30.35 30.35 30.35 24,273.63 39.091.96 40,682.67Density pop- persq- km 39.11 51.50 62.31 22.37 77.60 26.52Agricultural land % of land ama 71.15 75.91 76.44 52.54 52.82 39.61Change in agricultural land annual % 0.72 0.30 0.04 0.06 0.03 -0.13Agricultural land under irrigation %I. .. 0.83 18.02 12.66Forests and woodland thou. sq. km .. 00 . 5.32 7.15 5.95Deforestation (net) annual %...INCOMEHousehtold incomeShare of top 20% of households % of income...Share of bottom 40% of householdsShare of bottom 20% of households
Food %ofGDP...
Meal, fish, milk, cheese, eggsCereal imports thou. mectric tomnes 56 78 131 13.157 34.420 66.29'1Food aid in cereals 14 71 45 5.079 8.334 5.477Food productionper capfta 1987=100 126 104 89 101 113 101Fertilizer consumption kglba 0.6 1.5 2.5 4.6 59.9 48.0Shamc of agriculture in ODP % of GDP 28.7 17.6 8.1 16.3 26.3 15.7ReuiWng % ofGD)P..-Avenage household size persons per household 5. 4Urban
Fixed investment housing %ofGDP 2.5 1.8Fatel and power %ofGDP ..
Energy consumtion per capita kg of oil equiv. ... .257 364 1,595Households with electricityUrban % of households...Rural
Transport and comnrnuncatlcn % ofGCDP...Fixed investment transport equipment 3.9 7.3Totalmrad length thou. knt 3 4 5 . .-
ENVESTMEENT IN HUMAN CAPIALHealthPopulation per physician persns 30,247 14,472 ... . 3,277Population per nurse 3,958 .
Population per hospital bed 597 ... 1.269 1,016 604Oral reltydyraton therpy (unldcr-5) % of case .. 78 37 38EducationGross wroilment ratioSecondary % of school-agepop. 13 23 25 18 41 53
Female 14 27 30 .. 34Pupil-teacher ratio: primary pupils per teacher 53 55 51 40 39Pupil-teacher rato: secndary 26 21 21 .. 20Pupilsreahing grade 4 % ofcohoct 79 78 82Repeaterrate:prirry %Of tocglemuol 6 23 22Illiwirncy % ofpop. (aBP I5+) . 26 - 50 4 1 19
Female %Of femn.(agels5+) .1 6 .. 62 53Newspaer circulation per thou. po. 30 7 12 .. 74world Biank ltemnantog Eonmics 7Departmnt, April 1995
197

LiberiaMost Sae reionhincme group Nexw
Latest single year recen Sub- higherUnit of a tlmate Sahe Low- Income
Indicator Mesure 1970-75 I9S0P 5 1988-93 Aft income grmup
Priority Poverty IndicatorsPOVERTYUpper poverty line local curr. .. ..
Hendcountindex % orpop. .. .. .. .. 19Lower poverty line local cam. .. .. .. .. .
Headcount index % of pop. ..
GNP per capita USS .. .. .. 520 380 1.590
SHORT TERM INCOME INDICATORSUnslilled urban wages local cor. .. .. .. .. ..
Unskilled nual wages .Rurl terms or trade
Consumerprice index 1987=100 51 92 120Lower income
Fooe 36 101 149UrbanRura
SOCIAL INDICATORSPublic expenditure on basic social scrvices * of GDP .. ..
Gwuss enroimunet ratiosPrinary % tchoo age pop. 62 40 .- 67 108 104Male 80 51 .. 74 116Fcmale 45 28 60 101
MortalityInfant mortality per thou. live births 182.0 153.0 123A 93.1 63.1 39.0Under 5 nortality .. .. 217.0 172.3 101.4 61.5
bmuanizadonMeasles % age group .. 83.0 - 49.9 87.3 77.6Dfr - .. 45.0 .. 51.9 89.9 82.2
Child malnutrition (under-5) - .. .. .. .. 40.3Life expectancyTotal yeam 47 51 56 52 62 67Female advantage 3.0 3.0 3.0 3.3 2.1 5.9
Total fertility rate births per woman 6.8 6.8 6.7 6.2 3.6 2.9Matmnal morality rate per 100.000 live births 173 173
Supplementary Poverty IndicatorsExpnditrs on social security oftotal gov'texp. 0.0 0.6 0.8Social searity coverage % econ. activc pop. .. ..
Accesstosafewater totul *ofpop. 15.0 3S.6 S0.4 ;. 67.0Urban 100.0 71.0 93.0 .. 78.7Rural - 6.0 24.0 21.9 .. 62.0
Acccss to health caue 35.0 34.0
Populaton growth rate GNP per capita growth rate Development diamondb(annualaverage percent) (nnua av= pecent) Lfi:exp cc
4 5
GNP Gros2 ~~~~~~~~~~~~~0 I c - dm
Cgapita a roUnc:t
0 II -5
-2 -101970-75 1980-85 1988-93 1970-75 1980-85 1988-93 Acces to safe water
fl Liberia Libria- Low-income Low-income
a. See the techical notes, p387. b. Tbe dcvelop ntdinond bsd on fourkey indicators,shows theavrage levelof development i e countrycompared with its incorm group. See the intrduction.
198

LiberiaMast Sanre rglufnei rVv& up Nxt
Lamesftksnge er recen SWaD h4r*erUNit of elim ate Wsahra Law- Inemel
h,Aato measure 1970-75 1M085S 195843 Africa income grouFpResources and Expenditures
HUMAN RFSOURCESPepuinlatln (nure=1993) thousands 1,609 2.199 2Z345 558.978 3,091.764 1,096,665Age dependency rato ratio 0391 0.93 0.97 0.94 0.67 0.69Urban S of pop. 3D.3 39.3 43.8 29.8 27.6 54.7Population growth rate annual 5 3.0 3.2 3.3 2.9 1.9 1.6
Urbafn 5.9 5.4 4.7 5.0 3.9 2.9Labor force (15-64) thousands 636 808 981 229.480 1,442,452 459.196Agricultur % of labor force 76 74Industy 9 9Female 32 3 1 30 36 33 31Fenules per I100 malesUrban number 84...-Rural 113 .
NATURAL RFSOURCFSArea thou. sq. km 97.75 97.75 917.75 24,273.63 39,091.96 40,682.67Density pop. per sq. kmn 16.46 22.50 28.15 22.37 77.60 26.52Agricultural land % of land area 62.70 62.7.5 62.79 52.54 52.82 39.61Change in agricultural land annual % 0.00 0.00 0.03 0.06 0.03 -0113Agricultura land under irrigation % 0.03 0.03 0.03 0.83 18.02 12.66Forets and woodland thou. sq. km -. 0.05 0.05 5.32 7.15 5.95Deforestation (net) annual % .. 0.53INCOMEHousehold incomec
Shatr ofwtp 20% of houscholds S of income 73 .
Share of bottom 40% of housebolds I I.Sham of bottomu20% of households 5 .
Food % ofGDP...staplesMeat fish, milk, cheese eggs K
Carna imports thou, metric tomnes 41 103 137 13,157 34.420 66.281Food aid in cereals '3 20 156 5,079 8.334 5.477Food production per capita, 1987=100 10`7 100 56 101 113 101Festilizer consumpdon kg/ha 0.8 0.2 0.1 4.6 59.9 48.0Shameof agricultowininGDP %ofGDP 24.8 33.3 . 16.3 26.3 15.7Housing % OfGDP...Average household size persons per household . .. ..
UrbanFixed investment housing S of GDP ...- --
Fod and power % of GDP . .. ..
Enerwycowsuptionper capita kg of oil equiv. 391 162 38 257 364 1.595Households with electricityUrban % of households...Rural
Transport aNd cswnnulatlo. Sof GDP ..
Fixed invesment transport eqtuipmn... .
Total madlkngth thouJkmSn 6INVESTMENT IN HUMAN CAPITALHeaBhPopulation per physician persns 12.548 9,338 ...- 3,277Popuaton per nurse -937 1.374... Populton per hopktal bed 607 .. . 126 1.016 604Oral ehydyraton therapy (under-5) S of cases ... 15 37 31EducationGrvoss eumoumcnt ratioScecadary *ofschool-agepop. 17 17 .. 18 41 53
Female - 12 ... 34Pupil-teacher ratio: primary pupils per teacher 27 16 .. 40 39Pupil-teacher ratio: secondary U20 46 -.. 20Pupils reaching grade 4 S ot cohort...IRepeater mte prmr% of tota enroll. .. ..
Illitracy % of pop. (age 1.5+) 80 68 61 50 41 19Femnale % otfrfm.(agrel5+) .. 79 71 62 53
Neatjwzm circulation pe thou. pWp 8 13 13 12 .. 74Worl Bak lftmiona EcnonicsDepartracnt. April1995
199

LibyaMost Sam&eregleieonemgump Next
Lar single year ecent B1ast Uppe r-_ higherVuai of estimate & North mddle- income
indicator measure 1970-75 10SES 1988-93 Africa income group
Priority Poverty IndicatorsPOVERTYUpper poverty line local cor. .. ..
Hcadcount index % of pop. .. ..
Lower poverty line local curn. .. ..
Headcount index % of pop. .. ..
GNP per capita USS .. .. .. 1.980 4.350 23.680SHORT TERM INCOME INDICATORSUnskillcd urban wages local curr. .. ..
Unskilled rural wagesRural tcnns of tradeConsumer price index 1987=10 .. 0.Lower incomeFwoda*.........
UrbanRural
SOCAL INDICATORSPublic expenditure on basic social services %orGDP .. .. 6.7 .
Gross enrollment ratiosPrimay % schoolagpop. .. .. .. 97 105 103Male * .. .. 103 .. 103Fcmalc .. .. . 90 .. 103
MoralityInfant mortality per thou, live births 117.0 97.0 65.6 52.3 35.S 7.0Under 5 nortality .. .. 100.0 69.9 42.6 8.5
ImmunizationMeasles *age group .. 50.0 59.0 81.3 82.0 82.5DF' .. 51.0 62.0 84.0 74.2 90.2
Child malnutrition (under-5) 14. 5 -*
Life expectncyTotl years 53 58 64 66 69 77Fcmale advantage - 3.1 3A 3A 2.3 5.9 6.4
Total fertility ratc births pervwomn 7.6 7.2 6.3 4.7 2.9 1.7Maternal mortality rate per 100.000 live births .. ..
Supplementary Poverty IndicatorsExpenditures on social security % of total govt exp. .. _ _Social security coverage % econ. active pop. .. .. -
Access to safe water total 7. of pop. 87.0 90.5 97.0 835 86.7.Urban * 100.0 100.0 100.0 98.7 93.9Rural ' 82.0 75.0 80.0 69.0 66.7
Acess to heithcare N .. 100.0 100.0 87.4
Population growth rate GNP per capita growth rate Development diamondb(annual averge Percent) (mual aveage. percent) liif z cn
4 5
GNP Gross
2 0 ~~~~~~~~~~~~~~~ per ~~~~~~~~~~~~~primaryOIcenrollment
0 i -s
-2 -t01970-75 1980-85 1988-93 1970-75 1980-85 1988-93 A=ccss to safe water
1 Libya _ Libya- Upper-middle-income Upper-mide-income
a. See the tecdiical notes. p.387. b. The dedeopment diamond. based on four key indicators, shows the average lvcel of development in the countrycompared with its income group. See the inroduction.
200

LibyaMeat Samet region/Icoe asgroup Next
Latest abagle pa rarest MWi-East Uj,oi_W higheIrMUpi of estlate & Nork salUte- bames
fIndkefoSr masaure 1970-75 .195-S 1988-93 Arita income group
Resources and ExpendituresHUMAN RESOURCESPopulmIlon (inre-1993) thousands Z.446 3,786 5.044 261.650 500.507 812Z47Age dependency rato ratio 0.94 0.95 0.93 0.17 0.62 0A49Ujrban % of pop. 61.0 77.1 84.6 55.2 7112 77.9Population growth rate annual %412 4.4 3.5 2.7 1.7 0.6
Urban 9.5 6.3 4.3 3.7 1.8 0.8Labor foree(15-64) thousands 628 904 1.193 71.333 190.136 395,641Agriulturm % or labor(force 23 18lndusty 27 29Fefmale 7 8 10 16 29 38"Females per ZOO males
Urban number 78 .
Rural 19 .
NATURAL RESOURCESArea thou. sq. tnt 1,759.54 1,759.54 1,759.54 11,021.26 21,848.14 32,146.15Density pop per sq-Ikm 1.39 2.15 2.77 23.10 22.51 25.11Agricultura land %i of la ndrea 7.99 8.77 8.79 32.10 41.26 42.80Change in agricultural land annual 1 lA49 0.08 0.06 0.04 0.08 -OA48Agricultural lan under irrigation 51 1A42 1.52 1.62 30359 8.84 13896Forests and woodland thou. sq.kin . 0.01 0.01 0O45 1.04 10.56Dcforestation (nict annual %... -lIINCOMWEHousehold incomeShare of top 20% of households 51 of income-..Shaire of botnom 40% of householdsShare of bottom 20% of households
EXPENDITUREFood %of GOP ... 17.5 . 8.4
Staples .. 4.3 ... 1.6Meat, fish, milk, cheese, eggsp. 10.2 ... 3.8
Ceacal imports thou. mietric tonecs 601 1.114 2,892 38.092 48,947 77,530Food aid in cereals a .. . 1,249 544 aFood producuon per capita 1987=100 162 130" 125" 102 102 95Fertilizer consumption kg/ha 2.6 3.9 5.1 89.9 67.8 150.0Share of agriculturfe in ODP S orGDP 2.2 3.5 .. 13.3 8.0HousIng %ofGDP ... 14.2 ... 11.7Average household size persons per household 5.8 ...-
Urban 5.9 . .. .-
Fixed investment: housing * of GDP 6.2 2.2 2.7 -.. 5.0Fuel and power S of CDP'.. 1.7 ... 2.0Energy consumption per capita kg of oil equiv. 1.525 2.344 1,883 1,097 1.632 5.203Households with electrcity
Urban % of households... Rural
Trauspefland communkcation % of GDP ... 6.3 ... 8.8Fixed investment nunspor equipment 2.2 017 4.3 ... 2.1Total moad leigth thou. 1c . .
INESTNMEN IN HUMtlAN CAPITALHealthPopulation per physician Persons 2,717 691 957 ... 453Pboplation per nurse k376 350 221-Population per hospital bed U262 207 246 633 395 145Ora rehydyralio theapy (unfder-5) 51 of casem. - 80 56 51EducationGros enrollment ratioSecondary % of school-ape pop. ... .56 53 92Fermle so....5 -- 94
Pupil-teacher ratio: primay pupils per teacher 23 16 . 26 25Pupil-teacherratio: sewcndazy is 14 12 21PupIlsredchigmrde 4 of cohort 95 -.. 95R-CPCatr mtc primary % nroual_nroll 16 toIlimrmacy 51 of pop. (age iS.) 61 44 36 45 14"Female %-of fbm.(ape 154.) - 60 s0 57 17
Ncwsp circtwuation perthu.Pop 17 17 15 33 125 320world Biank Jntemaniona EcoMnonCS Depnnent. ApMi 199
201

LithuanaMeat Same rfeuio .u groyp Nex
low_tdi_yewr recent Eurpe Lewe higherUni of .rtlat.e & CQuil middle- income
lIndentr nwnure 1978-75 198085 1918-93 Asis income group
Priority Poverty IndicatorsPOVERTYUpper povry lie oad curr. .. ..
Headcooni index * of pop. .. ..
Lower povety line oca curt. .. ..
Headeounl index * of pop. .. ..
GNPpercapila USS .. .. 1320 2.450 1.590 4,350
SHORT TERM INCOME INDICATORSUnsiled uban wgs local cun .. ..c.Utul ed nau wags ".. ..
Rurd terms ofrd" .. ....
Conser price index 1987=100 .. ..
Lower incove ..
RualUFa .. .. .. _ ..
Rurd! " .. ........
SOCIAL INDICATORSPublic expenditure n basic scial sevices of GDP .. .. 7.3 _Guss enmaulnrtfimsPanay % school age pop. .. .. 92 .. 104 105
Male ". .. 93Feal" .. .. 91 .. .. _
Modaltyrna q motaity per tho veWbiths 22.0 18.0 13.0 24.8 39.0 35.8Under5moliry .. .. 20.0 36.4 615 42.6
Ia_uizadonMeass % age group -. .. .. . 77.6 820DFT .. .. .. .. 82.2 74.2
Chid malodmti (under-5) .. ..
Totil yes 71 71 70 69 67 69Femidt a6J r & L4 9.6 11.1 8. 5g 5.9
TotJ fJiq" rrc biras per womara 2.3 2.0 1.3 2.I 2.9 2.9Mammd iortenty rate per 100.000 live bi .. 27 29 -
Supplementary Povert IndicatorsExpenditures an social security * Of total goVt exp. .. .. 33.7Scad security cnuage % econ. active pap. .. ..
Acs to saf waer: tota % of pop. .. .. .. .. .. 86.7Urban * ._ ,. 93.9Rural .. . . . 66.7
Access to heal e cm
Popuation growth rate GNP per capita growth rate Development diamond6
(mnualavmall peterro (anua average. peent) Life xpc cy
4 5_
2 0 GNP \Gsscapita \enuollument
1970-75 1980-85 1988-93 1970-75 1980-85 1988-93 Acco safe water
F- Lithuania - Utbuazna- Lowr-unidl-income Lower-middle-incme
a. See the technical nos p3S7. b. The dcvelopment diamond bonsd on four key indicators, shows the average lvl of development in th countrycotpamed wi& its ime gmu. See the ind
202

LithuaniMeNr Same ,eglmflumne group Next
Zlati AWNgl yer recent Iauq Lower- let munit of eads. & Centra middl- lucern
Indkce manureaw 1970.75 1950.55 19WPS3 Asia income groupResources and. Expenditure
HUMAN RESOURCESPopulhuion (mnre=199) thousands 3,303 3,537 3.7 12 494,619 1,096,665 500,507Age dependency ratio rato 0.58 0.50 0.51 0.57 0.69 0.62Urban % of pop. 55.7 65.1 70.8 64.8 54.7 71.2Population grwwth rate annmal % 1.0 0.9 0.2 0.6 1.6 1.7
UrbanO 3.2 2.1 1.1 1.5 2.9 1.8Labor force (15.64) thousands 1.650 1.860 1,806 237,89 459.196 190.136Agriculture % of labor force .. 20 22Industry .. 40 32Female 50 43 49 47 31 29Females per I 0 malesUrban number...Rural
NATURAL RESOURCESArea thou. sq. kin 65.20 65.20 65.20 24.320356 40,682.67 21,848.14Density pop. per sq. km 50.74 55.02 56.85 20.20 26.52 22.51Agricultural land S of land area ..-. . 39.61 41.26Change in agricultural land amnual S . -0.27 0.34 -1.28 -0.13 0.03Agricultural land under irrigation % .-. 7.15 12.66 3.MForests and woodland thou. sq. km . -. 0180 5.95 8.04Deforestation (net) annual %i. .. .-
INCOMEHousehoald incomeSham of top 20% of households % of inconmc. Sharc of bottom 40% of householdsShare of bottom 20% of households
EXPENDITUREFood % of GDP ... 18.0 . .-
Staples U-..3.3...
Meat, fish, milk, cheese, eggs ... .Cereal impnrt ihou. metric tannes ... 415 34*452 66,281 48.947F-ood aid in cereals U . 407 4,392 5.477 544Food production per capita 1987=100 ... . . O 102Fertilizer conumption kg/a... 47A 41.7 43.0 67.8Shamc of agriculture in GDP S ofGUDP . 217.7 20.5 13.5 15.7 tOHousin %ofGDP . 42 6.0Average household size persons per household ... 3.2Urban
Fixed investment housing S Of GDIP ... 53 5.2Fueland power %DIfGDP ... 0.9 1.2..-Engyconsurnpion perrapita kg of OHlequiv. -.. 2,596 2.959 1.595 1,632Households with electricityUrban % of households...Rural
Transport and communIcatIon S of GDP ... 5.7Fixed investnent transport equipnrient S .11.0...
Total road length thou. km 33 3944.
EINVETMENT IN HUMAN CAPITALHealthPopulation per physician PeDSo 293 233 233 362 3,277Populationpernurse 1og 82 91 249Population perhbospitl bad -90 79 83 136 604 395Oral rehdyratian theWapy (under-5) S of cases ... .. - SIEdcatIonGras enrollment ratioSecondary S -of school-ag pop. ... .53 53Festcd
Pupil-teacher ratio: primary pupils per tmacher. . 25Pupil-tcacher ratio: secondaryPupils reaching grade 4 5 of cohort...Repeater raze: primary % Of totd al uc .
mWIteaY Sof pop. (age 15+) . .. 91Female % Ofkm. (age 15+) ... .17
Ncus 7 qcarcu1ton erthou~o. ... .74 125
203

LuxembourgMart Same rgofnlc.u grea,p
Late single pear reent-Un1t of estimate iflgk-
Indicator measure 1970-75 1980"S 19J893 inceme
Priority Povert IndicatorsPOVERTYUpper poverty line local cumr.Headcount index * of pop.
Lower poverty line local curr.Headcount index * of pop.
GNP per capita USS 8,640 14,120 37.320 23.630SHORT TERM INCOME INDICATORSUnskillcd urban wages local curr.Unskilled aural wagesRural terms of tradeConsuner price index 1987=100 53 100 120
Lower incomeFood' ' 38 .. .UrbanRural
SOCIAL INDICATORSPublic expenditure on basic social services % of GDP .. .. .Gross eazullmert ratiosPrimary % school age pop. 112 .. 90 103
Male ' 112 .. 88 103Fenle ' 112 .. 93 103
MortalityInfant mortality per thou. live births 16.0 12.0 6.8 7.0Under 5 morality .. ..- 8.5
ImmuniunionMeasls S agegroup .. .. 71.0 82.5DPT " .. .. 90.0 90.2
Child malnutrition (under-S)LifeexpectancyTotal years 71 74 76 77Fcmale advantage 7.2 6.9 7A 6A
Totd fetiity rate births per woman 2.0 15 1.7 17Maternal mortity rate per 100,000 live birfs .. 25
Supplementary Poverty IndicatorsExpenditures on social secuuity * of a govt exp. 46.0 492 46.5Social security coverage % econ. active pop.Access to safe wntr total % of pop. .. .. 100.0
Urban 9'.8 .. 100.0Rural ' 973 .. 100.0
Accass to hcalth cam .. 100.0 100.0
Population growth rate GN[ per capita growth rate Development diamond"(annual average, percent) I (maw'a average. rt) Lifean
4 -- 5
2 GP- .- Gross
O- = I S- capita enrollment
-2 -101970-75 1980-SS 1988-93 | 1970-75 19804 1998-93 Acces ta safewater
Z] Luxembourg _ Laen- High-income High-income
a See thetechnical notes, p.37. b. The d lopment diamond based on four key inca showserage level of dcvelopment in thcountycomparrdwith its incme group. See the introductiorL
204

LuxembourgMest Same regwicu/nceme group
latest singk year recentunit ef estimate 111gb-
Indicator measure 1970-75 1980-85 1988-93 IneomeResources and Expenditures
HUNMAN RESOURCESlPopulution (nireu1993) thousands 362 367 396 812,447Age depcndcncy ratio ratio 0.54 0.44 0.44 0.49Urban % of pop. 73.7 82.9 88.0 77.9Population growth rauc annual % 1.3 0.2 1.3 0.6
Urban 2.9 1.1 1.9 0.8Lubor force (15-64) thousands 144 155 154 395.641Agriculturc % of labor force 7 5Industry 39 35Female 29 32 32 38Females per 100 males
Urban number 103Rural 98
NATURAL RESOURCESArea thou. sq. km .. .. .. 32,146.15Density pop. per sq. km .. .. .. 25.11Agricultural land % of land area .. .. .. 42.80Change in agricultural land annual % . .. .. -0.48Agricultural land under inigation % . .. .. 13.96Forests and woodland thou. sq. km .. 0.00 0.00 10.56Deforestation (net) annual 'A .. .. -0.11
INCOMEHousehold income
Share of top 20% of households h of income .. 34Share of bottom 40% of households .. 25Share of bottom 20% of households .. 10
EXPENDITUREFood %ofGDP 11.9 9.9 7.1 8.4
Staples 2.0 1.6 1.2 1.6Meat. fish, milk, cbees. eggs - 5.9 4.8 3.7 3.8
Cercal imports thou. metric tonnes .. .. .. 77.530Food aid in cereals .. .. .. 8Food production per capita 1987=100 .. .. .. 95Fertilizer consumption kglha .. .. .. 150.0Share of agriculture in GDP % of GDP 33 26 1A ..Housing %ofGDP 10.7 13.0 11.8 11.7Average household size persons per household 3.1
Urban 29.Fixed invcstment housing %' of DP 7.8 2.0 4.6 5.0Fued and power 'A of GDP 3.1 5.5 3.5 2.0Energy consumption per capita kg of oil equiv. 10.605 8.591 9.879 5.203Households with electricity
Urban % of householdsRural
Transport and cornmanication % of GDP 7.7 11.0 10.6 8.8Fixed investment: Lransport equipment - 1.9 2.5 3.2 2.1Total road length thou. km 5 5 5
INVESTM IN HUMAN CAPITALHealthPopulation per physician persons 939 554 508 453Populationpernurse ' 310 242Population per hospital bed 86 84 .. 145Oral rehydyration therapy (under-5) % of casesEducationGross enrollment ratioSecondary % of schoDI-age pop. 59 75 75 92
Female 59 74 71 94Pupil-teachcr ratio: primary pupils per teacher 19 13 -Pupil-teacher ratio: seconday 16Pupils reaching grade 4 ' of cohort 90 86Repeaterrate: primary % of total enroll 6 6Illiteracy 9e orpop. (age 15+) - *- tFemale % of frm( age 15+) -- *- t
Newspaper circulation per tbou.op. 445 381 371 320World Bank Intematonal Economics Departent, Apra 199
205

Former Yugoslav Republic of MacedoniaMost Same re"i oeme grou Mie
latest single lar rent ElnwI L7eir- higherUni Or of *lm.ti & Cntrl midde. Iucome
Indicator meoswe 197075 1980-85 198J-93 Asi Income greup
Priority Poverty IndicatorsPOVERTYUpper poverty line local cur. .. ..cHeadcount index % a' pop. .. ..
Lower poverty lne lacd curr. .. ..
Headcount index %h of pop. .. ..
GNP per capita USS .. .. 780 2,450 1,590 4,350
SHORT TERM INCOME INDICATORSUnskilled urban wages local cut. .. ..
Unskilled mural wags.Rural tenns of tradc ".
Consumer price index 1987=100 .. ..
Lowerincome
UrbanRural
SOCIAL INDICATORSPublic expenditure on basic social services % of GDP .. ..
Cross eolbnent ratiosPrimay % school age pop. .. .. .. 104 105Male
MortalityInfant mortality per thou. live births 74.0 48.0 26.4 24.8 39.0 35.8Under 5 mortality .. .. .. 36.4 61.5 42.6
ImmunizationMeasle % age glOUp .. .. .. .. 77.6 82.0DPT ' .. .. .. .. 82.2 74.2
Child malnutridon (under-5)Life expectany
Total yearn 67 70 72 69 67 69FeMale advmatage 28 4'A 6.2 8.8 5.9 5.9
Total ferlity rar births per woman 3.0 2.5 2.0 2.1 2.9 2.9Maternal mortality rate per 100,000 livec births .. ..
Supplementau Poverty Indicators
Expenditures on social security % of total govt exp. .. ..
Social security covnage % con. active pop. .. .
Access to safe water total % of pop. .. .. .. .. .. 86.7Urban .. .. .. .. .. 93.9
Rural .. .. .. .. .. 66.7
Access to healthc .. .. .
Population growth rate GNP per capita growth rate Development diamondb(anmual avem , perent) 1 (annual average, percent) Life rw
4- - 5
2 ~~~~~~~~~~~~0 1
capita enrollment0 1 17 I ~~~~~~~~-5
-2 1-101970-75 19980.8 1988-93 1970-75 198045 1988-93 Acbsaf Eewater
rJ Former Yugoslav Republic of Macedonia _ Fame Yugoslav RepublicofMi- Lower-middle-ilcone - Iower-mddle-income
a See the tchnial not. p387. b. The development diamond, based on four key indicato. shows the average level of devedopment in the comuyoompawd with its income group. See the inaroduction.
206

Former Yugoslav Republic of MacedoniaMatl Sante raa*mnfin~~oeue roup Next
______ _____ ~~mount EiiljiT wer. hit OileUni.t qf et fun ate & Cenltral middle- Incomee
Indfrarnr lmowr.f 1970-75 19804S 1988-93 Asils Income oResources and Expenditures
hIUMAN REtSOURCESPopulantion (mreul 993) thousands 1,676 1.898 2,075 494,619 1.096,665 500,507Age dependency rzilo ratio 0.59 ... 0.57 0,69 0.62Urban % ofpop. 50.6 55.7 59.1 64.8 54,7 71.2PopulatIon growth rate annual % 1.3 1.1 2.1 0.6 1.6 1.7Urban 2.7 1.9 2.8 1,5 2.9 2.8
Labor force (115.64) thousands ... . 237,897 459,296 190,236Agriculturc 'S of labor forx . .
IndustryFemale ... . 47 321 29Rcmales per 100 males
Urban number...Rural
NATURAL RESOURCESArea thou. sq. km .. 25.71 25.71 24,320.56 40.682,67 21,848.14Density pop. per sq. km .. 70.60 79.81 20.20 26.52 22.51Agricultural land 'S of land arem. . 51.36 .. 39.61 41.26Change in agricultural land annual 'S... 1.02 -1.28 -0.13 0.08Agricultural land under irrigation 'S... 5.28 7.15 12.66 8.84Forest and woodland thou. sq. km .. 0.01 0.01 0.80 5.95 8.04Deforestation (ne-t) annual 'S... 0.14INCOMEHousehold income
Shamof top 20%of households % of income .c
Sham of bottom 40% of householdsShare of bottom 20% of households
EXENDflrUREFood 'So!GDP...
StaplesMeat, rish. milk, cheese eggs
C'ereal imports. thou. mantic tonnes .... Il 34A452 66,282i 48.945Food aid in ccreals ... . 4,392 5.477 54Food production perrcpita 1987=200 ...... 101 202F-ertlizercoasumption kg/h . . 1135 41. 48.0 67.8Shiare of agriculture in GDP %ofGDP ... . 13.5 15.7 8.0Housing 'S of GDP ... . 6.0Average household size persons per household...
UrbanFixed investment: housing 'S of aIDP ... . 5.2Fuel and power 'SofGDP 1.. . .2Energy consumption per capita kg of oil equiv. ... . 2.959 2,595 1,632Households with electricity
urban 'S of housholds...Rural
Transport and coinmunleatioa 'Sof GJDP...Fixed investment: ftraport equipmentTotal road length ,Wou.tkm ... 10,591
INVESTMENT IN HUMAN CAPITAL
Populaton per physician persons . . 425 362 3,277Popuation per nurse ... . 249Population per hospital bed ... 189 136 6D4 395Oral rehytdyrtom therapy (under-5) 'S of casem.. . .. 51EducationGross enrollment ratioSecondary 'S of school-age pop. .... 53 53Female
Pupil-teacher ratio: primary pupils per teacher . .20 .. 25Pupil-teacher ratio: secondary...Pupilsicachinggrade 4 'SOf cohort...Repeater rate primary 'S of total e-nroll...illltercy % of pop. (agc5+) ... .519 14"Female % of ftnt(agel5+) ... ... 1 7
Newsppe circulation pe thou. po.M .. . 74 125wornd rian Imcmtiraonalecnormis De-partment, April 1995
207

MadagascarMNat NSma rrfionenaeomgriip Next
Ie' ft ear rnt .ab- ,lhghearUnit uf -ilmati Sahanrn LAW. t IciCDIk
Jndknltr _ _m#ur. 1970.75 1980.5 1 P.95 Aftln iweme. grmuupPriority Poverty Indicators
rovurrYUpporplovony lln loci cur. .. ..
HoAdcnunt Index % of pop. .. ., ,, ,, 19,Lower poverty lino loul cufr. .. ..
Ieadcanunt Index %, of pop. .. ..
GNP par capita USS 300 280 220 520 380 1,590SHORT TlRM INCOMB INDICATORSUnskilled wban wages local curr. ..Unskilled mraa wageFRural temu of tmde .. ..
Consunrar price Index 1987.100 20 76 211Lower IncomenPoadN 12 ..Uran d.. 78 206Ruml
SOCIAL INDICATORSPublic expcndilure on baslc sodal services % of CDP .. .Gross enroll wnt ratiosPrimary % school age pop. 95 118 79 67 108 104Male 103 122 81 74 116Female 88 114 77 60 101
Mortlitylariant railty per thou. live births 172.0 130.0 93.0 93.1 63.1 39.0UnderS morality .. .. 164.0 172.3 101.4 61.5
lmmunfrhtitonMeasics % age group . 28.0 33.0 49.9 87.3 7 o.6DPT .. 23.0 46.0 51.9 89.9 82.2
Child malnutrition (under-S) . 32.8 39.0 .. 40.3Life expectncyTota yeas 46 Si 57 52 62 67Fenala dvantage 3.0 3.0 3.0 3.3 2.1 5.9
Total fertility tale birtFs per woman 6.6 6.6 6.0 6.2 3.6 2.9Maternal mrwlity rate per 100,000 live births .. 403 350
Supplementary Poverty IndicatorsExpenditures on social security %9of towl gov'tcxp. .. ..Social security covge % wcon. a;ve pop. .. ..Accesstosafewatcr total %ofpop. 25. 21.2 .. .. 67.0
Urban 76.0 81.4 . .. 717.Rural 14.0 9.0 10.0 . 62.0
Acoes to helth came n 65.0 65.0
Population growth rate GNP per capita growth rate Development diamondb(annual aveage. prcnt) (ann avere. percen) Life expectancy
4- 5
2 0 | _ 4~~~~~~~~~~~~~~; | l C~~~~~~~~NP G_ ~pmssy
O- .J }j L 1 p } l l l l I -S L L erpig \p/ enrollmn
-2 -101970-7S 1980-85 1988-93 1970.75 1980-85 1988-93 Acess to safe watr
r2 Mada s Madasca- Lowincome Low-income
aL See tbe technical otes, p3 87. b. lle development diamond, bosed on four key indicators, shows the average leve of development in thr counrycompaed wilh its incone gwup. See the intrduction.
208

MadagascarMest Samre eWioFl4Dcome group Next
Lawe l giai ywF recet Sik igherUnit of esmat hn . Sahara. Law- income
indicafor measure 1970-7.5 11959-85 1985.93 Adenk income Zroap
Resources and ExpendituiresHUMAN RESOURCESPopulation (mre=1993) thousands. 7,787 10.632 13,354 558.978 3.091.764 1,096.665Age dependency ratio ratio 0.91 0.93 0.96 0394 0.67 0P.69Urban S of pop. 16.1 20.9 25.8 29.8 27.6 54.7Population growth rate anneialS% 2.5 3.2 3.3 2.9 1.9 1.6
Urban 5.0 5.7 5.9 5.0 3.9 2.9Labor force (15-64) thousands 3.668 4.5 10 5.354 229.410 1.442.452 459,196Agriculture %oflabor force 32 SI .
Industry 5 6 3..3Female P41 40 33633 3Females per IOU males
Urban number 106...Rural 103...
NATURAL RESOURCESAreca thou. sq. km 587.04 587.04 587.04 24,273.63 39.091.96 40.682h67Density pop. per sq. kmn 13.26 13.11 22-84 22.37 77.60 26.52Agricultural land % of land area 63.21 63.69 63.80 52.54 52.82 39.61Change in agricultural land annual % 0.78 0.05 0.01 0.06 0.03 -0.13Agricultural land under irrigation % 1.26 2.23 2.53 0.33 1I.02 12.66Forests and woodland tho. sq. km .. 0.17 0.16 5.32 7.15 5.95Deforestation (ncr) annual S %. 0.32
INCOMEHousehold income-
Share of top 20% of households ¶' of income......-sham of bottom 40% of households .. 14 .
Slirofbottom 20% of houscwlds .. 5
EXPENDITUEFood % of GDP .. 50.6 .
staples .. 22.0 .
Me-at, fish, milk, cheese eggs 1. 6A .
Cereal imports thou. metric tonnes 72 195 III 13,157 34,420 66,281Food aid inwvrcals 7 98 58 5,079 8,334 5,477Food pruducLion perecapita 1987= 100 117 105 92 101 113 101Fertilizer consumption kgfiia 0.2 0.3 0.2 4.6 59.9 48.0Share of agriculture in GDP % of GDP 30A 31.3 3117 16.3 26.3 15.7Housing % of GDP .. 10.0 .
Average household size persns per household 4.5...Urban 5.0...
Fixed investmient housing S of GDP .. 1.1 .
Fuel and power % of GDP .. 5.5.....-EneWCDMNUI,',) percajitakg oroiiequiv.7 38 34 257 3 6'4 1.595
Hiouseholds with electricityUrban % of households . ..
RuralTransport and conmumication %ofGDP .. 3.2 Fixed investment transport equipment .. 1.0 . ..
Totalmrad length thou.kmn 28 s0 50...-ENVESTMEN4T IN HUMAN CAPITALHerdtSPopulation per physician persons 10.343 10,413 8,733 ... 3,277Population per nurs 246 1,799 .
Population peThospital bed 410 .. 1,228 1,269 1.01-6 604Oralrechydyradionrtherapy (under-5) S of russn.. 26 37 38EducationGros enollment ratioScecondary % of schol-agepop. 12 34 19 18 41 53Female la 28 IS . 34
Pupil-teachcernfiti; pdimy pupils perzcwach 61 34 38 40 39Pupil-teacher ratio: secondazy 26 28 21 .. 20Pupils madhinggradc 4 S of ohDrt 69 37 70Repeater rate: primary % of tota enrol 24 . 35-Illitera % ofpop. agel15+) .. 23 20 50 41 1 9
Female Of ftm (agels5+) - 32 27 62 5.3ckculation perthot9gm. 8 6 4 12 74
209

MalawiMost Snmc regon/fincome getulp Nex
Latetsingke r recct Sub- higherUnitf c/Iar sh ma s Low- Income
Indicator measure 1970-75 1980-45 198593 Afria Ince groupPriority Poverty Indicators
POVERTYUpper poverty linc local curr. . .*
Hcadcountindcx % ofpop. .. .. .. . 19Lower poverty line local curr. .. ..
Headcount index % of pop. .. .. .. .. ..
GNP per capita USS 130 160 200 520 380 1.590
SHORT TERM INCOME INDICATORSUnskilled urban wages local curr. .. ..
Unskilled mand wagesRural emns of tr.deConsumer price index 1987=100 .. 70 278
Lower income ,. 70 233Foae 68 noUrban 68 250Rural
SOCIAL INDICATORSPublic expcnditure on basic sodal services %ofGDP .. .. 2.0 .
Gmss muollmen ratiosPrimary % school age pop. .. 59 66 67 10S 104Malc * .. 67 72 74 116Fenalc .. 51 60 60 101
Morulitylrhnt mortality per ou. live births 191.0 163.0 141.6 93.1 63.1 39.0Under 5 mortality .. .. 223.0 1723 101A 61 5
ImmunizafionMeasles % ap. group .. 49.0 78.0 49.9 87.3 77.6DP .. 52.0 81.0 51.9 19.9 82.2
Child malnutrition (under-5) .. 23.9 27.0 .. 40.3Lifc cxpectancyTotal yes 41 45 45 52 62 67li e advantagt IA 1.4 12 3.3 2.1 5.9
Total fcrtiliy rate births perwoman 7A 7.6 7.1 62 3.6 2.9Matemal mortality rate per 100,000 live births .. 250 380
Supplementary Poverty IndicatorsExpenditures on socal seurity % of total gov't exp. 2.2 0.8 0.0)Sodal secuitny covemg 9 ecDn. acive pop. .. ..
Access to safe water. total % of pop. .. 532 .. .. 67.0Urban 8.. 2.0 .. .. 78.7Rural .. 50.0 49.0 .. 62.0
Accs to calh care * .. 54.0 80.0
Population growth rate GNP per capita growth rate Development diamondb(annual aveage, perent) (vmua avera percen c
4 -> -
2- I o l k3lNP -/ (I 'ron
I Ic.1I I, H sT lapita \ ment
-2 11970-75 1980-85 1988-93 1970-75 1980-8S 1988-93 Accss to sa waer
L Malawi Malawi- Low-inwme - Low-inaome
a. See the technical ar p387. b. The developmentdiamond, based on fourkeyindicatrs shows the averge leeof-dvelopment inthecountrycompard with its income grup. See the intoduction.
210

MalawiMast Same rqlaaifincme group Neu
Lats iwgIe year recen Sb- higherUN&of -ha , 3h. w LoF- income
Indicaior meaure 1970-75 198&45 19W8-93 Afria Income grupResources and Expenditures
HUMAN RESOURCESPopulation (mre=1993) thousands 5.244 7,247 10.520 558,978 3,091,764 1,046,665Age depenJency mtio rtio 0.98 0.98 0.98 0.94 0.67 0.69Urban * orpop. 7.7 IDA 12.8 29.8 27.6 S4.7Populationgmwlh rat wal % 3.0 3.2 4.7 2.9 1.9 1.6Urban 7.5 5.7 7A 5.0 3.9 2.9
Labor force (1564) thousands 2,382 3,074 3,778 229,480 1,442,452 459.196Agriculmre % of labor fowe 87 83Industry 6 7
2le * 45 43 40 36 33 31Females per 100 males
Urban numbcr .. ..
NATURAL RESOURCESArea thou.sq.hkm 11.48 118.48 1184A8 24,273.63 39,091.96 40.682.67Density pop. persq.km 44.26 61.17 84.70 22.37 77.60 26.52Agriculrl land i of land aren 33.06 35.18 37.63 5254 52.82 39.61Change in agricltual land annuaI % 0.32 0.76 0.28 0.06 0.03 -0.13Agricultunal land under inigadon % 0.42 0.54 0.62 0.83 18.02 12.66Forsts and woodland thou. sq. kin .. 0.04 0.03 5.32 7.15 5.95Deforstaion (nat) annu % .. .. 1.39
INCOMEHousehold income
Share of top 20% of households Wi of income .. ..
Shae of bottom 40% of houseoldsShare of bottom 20% of households
EXPNDITUREFood % ofGDP 42.2 22.9Saples * 20.1 6.8Mcax fish, milk, clhs eggs * 6.8 8.5 . . .. . .
Cueal impot thou, metric tnes 41 29 514 13.157 34,420 66,281Food aid in cemals *0 5 635 5.079 8,334 5,477Foodproductionpercapirt 1987= 100 127 106 89 101 113 101Fertlizerc ion kglha 4.8 10.3 20.9 4.6 59.9 48.0Shar of agriculu in GDP % orGDP 34.8 32.5 36.0 163 26.3 15.7Housing S orGDP 4.9 6.8Average household size persons per household 3.1 ..
Urban * 35 ..
Fixed invesentE I sing %ofGDP 3.6 1.1Fad Ean power % ofGDP 2.1 3.6Energy consumpion per capita kg of oil aqiv. 46 42 35 257 364 1,595Housdeolds with electricity
Urban * of households .. .. .Rural ". ._. ..
Trswot and conuu nleal % of GDP 6.0 7.8 _ ..
Fixed investment amsport equipment " 6.7 2n2 ..
Tool road lagth thou. km II I 1 13INVESIhNT IN HMAN CAITAL
Population per physician persons 76,576 11.453 50,360 _ .. 3.277Populon per nurse 5,332 3,149 1.982 _ .. -
Populion perhospital bed - 650 .. 710 1,26) 1.016 604Orl whydyaton therapy (under-5) %of cases .. .. 50 37 38EducationGrCss eollmet ratoSconday % of school-ge pop. .. 4 4 18 41 53
Female .. 2 3 - 34Pupil-eacr rio: prmary pupls per ftacher 61 61 68 40 39Pupil-teacher ratio: seconday 19 22 27 - 20 _Pupilsreachinggrade4 %olcohort 67 53 71 _Repeatermte:pimary %oftotalenroll 16 18 21 _lliterac % of pop. (agl5 +) .. 59 - 50 41 19Female % of fim. (aP 5+) .. 69 _ 62 53
r= cicubaton prthou. gom . 12 .. 74W ad IernatioalEconomiCs D mt Apnl IM
211

MalaysiaMoo Sc reofnbnAeume group Net
Late s kygl ear recnt Upper- higherUnt of esltafle East middk income
,adkator mnsure 1970-75 1958t S 1985.93 Asia income groap
Priority Poverty IndicatorsPOVERTYUpper povcrty line local curr. .. .. . .. .
Headcount index %hofpop. 38 20 16 12Lower poverty line loal curr. .. ..
Keadcount indx % ofpop. 14 .. 2 9GNPpercapita USS 890 1.910 3,140 820 4350 23.680SHORTTERM INCOME INDICATORSUnskilled ueban wages local curr. .. ..
Unsillcd rural wages - 47 58 94Rurnl term of tradole .Consumr price index 1987=100 63 99 122Lower incomeFood 43 100 126.
Urban .Rural .
SOCIAL INDICATORSPublic expenditure on basic social services %ofGDP 6.0 6.7 6.8Gross enrollment ratiosPrinry % school age pop. 91 101 93 118 105 103Male - 92 101 93 123 .. 103Female " 89 100 94 115 .. 103
MortalityInfnt mortaity per thou. live births 42.0 28.0 12.6 355 35.8 7.0UnderS ortlity - .. .. 17.0 605 42.6 8.5
InumnizationMeasles % age group .. 20.0 79.0 93.0 82.0 82.5DPT '5.. 59.0 91.9 95.0 74.2 90.2
Cild nmlnutrition (under-5) .. 25.6 .. 24.1 .Life expectancyTotad yeas 63 68 71 68 69 77Femalc advantage ' 3.3 4.0 4.3 3.6 S.9 6.4
Tol ftility ate births perwonn 52 42 3.5 2.3 2.9 1.7Maunal mortalty raft per 100,000 live births .. 37 34 116
Supplementar Poverty IndicatorsExpentitnres on social seurity % of loal govr exp. .. ..
Social security covrage % cWn. acive pop. .. .. .Acces to alb waler: totd % of pop. 34.0 80.3 7B.4 67.1 86.7
Urban - 100.0 96.0 96.0 835 93.9Rural - 6.0 71.0 66.3 613 66.7
Access to health carm .. .. 88.0
Population growth rate GNP per capita growth rate Deveopment diamondb(annual avage. pn) (nnual avemrg pe ) Life expectany
2 ~ ~ ~ ~~I K na wGross2- 0- ~ I N $x-I 1 lpsl &I
1 -5 ~ ~ ~ pe
02-1
1970-75 1980-8S 1988-93 g1970-75 1980-85 1988-93 Access to safc wata
E] Malaysia Malasia- Upper-middle-ioe Uppemiddle-income
a. See io tucmical notd, p387. b. The dcvelopmnt diamond bad on four key indicas, shows thelavervp el of devekopmnt in the cmutrycmpard with its ince group. See the inodlion.
212

Malaysiameat Eu. regkiunfemegnup Next
Latet ingeyear negt) Upper- higherUnt of estimae Eat1 middle- wInse
lnic&agO xmeaure 197075 198945 1985-93 Asia Im.,ie gru
Resources mud ExpendituresHUMAN RESOURCIESPopulatlion (ure=1993) dhousands 12Z258 15,595 19.047 1.713.383 500.507 812.447Age depedency ratio rato 0.85 0.71 0.69 0.54 0.62 049Urban %ofpop. 37.7 45.9 52.1 31.3 71.2 77.9Population growth nate amuual % 2.4 2.5 2.5 IA4 1.7 0.6
Urban * 41 4.2 4.0 4.0 1.8 0.8Labor rorne (15r.64) dhousads 4.451 6.171 7.653 942.977 190.136 395.641Agdiculture lb of labor fanc 48 42Industry K17 19Female S33 35 35 4'1 29 38sFemales per 100 males
Urban numberr. ..
RuraNATURAL RESOUCESArea thou. sq. kin 329.75 329.75 329.75 16,367.91 21,848.14 32,146.15Density pop. per sq. kmn 37.17 47.29 56.34 I03.27 22.51 25.11Agricultural land lb of land area 14.32 14.94 14.94 44.21 41.26 42.80Change in agricultual land annual l 1.05 0.41 0.00 0.24 (LOS -0.48Agricultural land under inigazion l 6355 6.81 6.93 14.68 .84 13.96Pomust and woodland thou. sq. kmn. 0.22 0.18 4.06 3.04 10.56Deromstation (net) annual lb... 2.01 .. -
INCOMEHousehold incomec
Shar of top 20% of households lb Of incme 56 .. 4 .
Shaicofbottom 40% ofhouseholds I I. 13Share orbottzn 20% orhouschoDks K4 .. S.
?ENDITUEFood %aofGDP 21.7 ... .- 34
Staples -6A .4 .. 1.6Meat, fish, mfifl cheese, eggs 9.0 ... .. 3.8
Cereal imparts thou, metric taunes 765 2=22 3,288 30.036 48.947 77.530Food aid in cemeals 1 -4 447 S44 8Food prodmczionper capita 1987=100 63 95 133 115 102 95Fertilizer consumption kg/ha 52.7 124.6 196.7 76.4 67.8 150.0Shanuof aguiculturein GDP %oIG1DP 23.0 19.4 .. 17.1 3.0Housing %ofGDP 6.6 - ... .11.7
Average household size permon per houseold 6.0 5.2Urban K6.0 -
Fixed investmet housing b of ODP 3.7 -. .. .Fuel ant power lbofGODP 1.3 - ...- 2.0Energy consumptiou per capita kgofailequiy. 487 974 1.545 632 1,632 S,20Households with electricityUran lb ofbhouscholds .. 8.0. .
Rural .. 30.0Transport and commurdeatien %ofGDP 3.4 ... .. .Fixed investment trspaut equipmen 2.8 - ...- 2.1Totalrmad length timu. km 20 29 40
uzsmiINT HUMAN CArfALHealth
Pplation petphysician persons 4,283 3.158 2.414 1,063 .. 453Population pernus "1,267 SW0 474 1,490Popuatin per hosptal bed *299 389 432 612 395 145Oral rehydyrdon herapy (under-5) lb of cass ..- 47 32 51
Gross enrollment ratioSeconday %of school-agepop. 42 53 58 53 53 92Female p 38 53 59 47 .. 94Pupil-teacher ratio: primay pupils per teacher .. 24 20 23 25P.pil4eacherratio: -eonar 28 22 19 16Pupils scaching gradce4 % ofeohDrt .. 99 100 92Repeaterrfte: priu,ay % Of totwlenofl 0 0 6Iliteracy % ofpop. (agel15+e) 42 26 22 22 14
Female % offent(oVcl5+) .. 35 30 36 17Niew=r circulation per wt,. as 96 118 .. 125 32D
213

MaldivesMed Ser. eglneeugraup Neil
Late Singe yer recet - ---- m ir higheruas it of etmae St midWle- brsme
lndkaor m urt 117975 19f8S 1912493 Asia incme greu
Priority Poverty IndicatorsPOVERTYUpper poverty line local curr. .. ..
Headcouni index % of pop. .. .. .. 28Lower poverty line local curr. .. ..
Headcount index % of pop. .. .. .. .GNPpercapita USS .. .. 920 310 1.590 4.35DSHORT TERM INCOME INDICATORSUnskifled urban wages local curr. .. ..Unskilled nura wagesRuFl tenns of btadcConsumer price index 1987=100 .. ..Lower incomeFood' ..
UrbanRural
SOCAL INDICATORSPublic expenditure on basic social services % of GDP .. .. .. .. - _Gross enolet ratiosPdumay % school age pop. .. .. * 106 104 105
Male" .. .. .. 118 _ _
Female .. .. .. 93 _ .
MortalityInfant mnortity per thou. live birdis 121.0 94.0 57.9 83.7 39.0 35.8Under 5 mortality .. .. .. 1239 61.5 42.6
ImmunizationMcasles * ag: group .. 30.0 98.0 95.9 77.6 82.DPT .. 5.0 91.0 90.2 82.2 74.2
Child malnutrition (under-5) 5.. 6.1 60.4 -
LifrexpectancyTotal years 51 57 63 60 67 69Female advantage -26 -2.6 -2.6 0.4 5.9 5.9
Toa fertilty rtc birtis per woman 7.0 6.8 6.7 4.0 2.9 2.9Marnal morlity rate per 100.000 live births .. .. 480 420 _ -
Supplementary Poverty IndicatorsExpcnditums on social security % of towl gov'r xp. .. 13 1.0Social security covcrage % econ. active pop. .. - -
Access to safe watcr tol % ofpop. .. .. 70.3 69.S 8 6.7Urban .. 58.0 76.9 73.8 .. 93.9Rural .. 12.0 68.0 67.2 _ 66.7
Access to heIbh carc .. 25.0 75.0 95.8 .. .
Population growth rate GNP per capita growth rate Development diamonde(annual avage. percent) I (amual as , pant) miE ecn
4- 5
2 0 per -
O i | I | l I l l l -5 - - capita e /
-2 1I 1970-75 198085 1968-93 1970-75 198085 19M93 Acom tDsdew
[ Maldives- Lwedin eower-m
a See the technical note p387. b. lic development diamond, based on four key indicatr shows the aveage levd of dcvelopem in dbe contycompared with its nCome groUp. See the induction.
214

MaldivesMust Same reinjleM cen ompap N
IateU dug!. ear recent Low-er. higherCina/ of estimate somwi middl- brcase
Indicator nremre 11'70-75 1980-U5 19553 Asia income group
Resources and ExpendituresHUMAN RESOURCESPopurlation (morr=199) thtousans 137 184 238 1.193.503 1.096.665 500.507Age depedency mitto ratio 0.85 0.94 1.00 0.74 0.69 0.62Urban % of pop. 18.0 25.7 26.4 25.7 54.7 71.2Population growthraue annual % 2.5 3.1 1.2 2.1 1.6 1.7
Urt.wn 7.6 5.7 1.9 35 2.9 1.ILabor force (15464) thousands 51 66 78 437.138 459.196 190.136Agricriture of labor forcem..IndustryFemale 24 23 22 22 3'1 29Females per 100 males
Urban number...
NATURAL RESOURCESArea thou. sq. km 0.30 0.30 0.30 5.133A49 40,682.67 21A84.14Densit pop. per sq. kmn 456.67 613.33 768.22 227.55 26.52 22.51Agricultumi land % of land -mm 13.33 13.33 13.33 59.03 39.61 41.26Change in agrcultural lan mmual % 0.00 0.00 0.00 0.00 -0.13 0.08Agriculturaltand under irrigitioa S ... 29.34 12.66 8194Forests and woodland thou. sq. km .. 0.00 0.00 0.66 5SW 8.04Defoiutarion (net) annual S .. 0.00 -
INCOMEHousehold incomeShar of top 20% of households % or income .. -.--
Sham of botom 40% of househldsSham of bottm 20% olrhousholds
Food %ofGDP...
Meat. fish. mdilk chees, eggsCoema] inpni thou. metric tonnes 7 15 24 6.211 66.281 48.47food aid in creals S 2 2 1,624 5.477 544Fod production per capita 1987=100 116 110 89 III 101 1102Fertfiierconsumption kg/ha ...-. 70.2 48.0 67.8Shameooragricuituiin GDP %ofGDP .... A 2. 15.7 LOHoning % OfGMP...Aveage household size persns per household.....-.--
UrbanFixed investment housing S of GDP. .
Fued aDd poer %ofGDP...Energyconsumption per it kg of oil equiv. 15114 139 216 1.595 1.632Houseoihod with electricity
Urban % of households .
Rural Tninsport mud conumdmutIo Sof GDP.. Fixed investment transort eqluipment .
Tota road ongth thou. km .
1NVESTNMET IN HUAN wrAPIAHealthPopulation petpyici persons 30.250 15.266 14.40 2.850 3.277-Popainprnumse 572 624 15 S . -
Population per hospital bed *. 1,638 395O rebydyration therapy (undcr-5) S of cases~ 37 .. 51
EducationGross enrolment rtiooSecondary % of school-age pop. -.... 40 53 53Female ... .29..-
Pupil-teacher ratio: primary pupils per teaher 26 ... 61 .. 25Pupil-teachber ratio: secndary 13 ... 26Pupils maching grade 4 Of cohort...Repeater ratc: primar S Of total enrolln .
liracyq % OfPDp. (agelS.*) .. -54 19 14Female % of fem (age 154.) ..- 69 .. 17
Ncw=percirculafin tholL 92. I.113 26 74 125
215

MaliMost Same repleincome group Next
Laest single year recent Sub- hisgherUn;i of calmate Sehan Law- income
Indkaeor meaure 1970-75 1980-85 1988-93 Afrca income group
Priority Poverty IndicatorsPOVERTYUpper poverty line local curr. .. ..
Headcount index * of pop. .. ., .. .. 19Lower poverty line local cur. .. ..
Headowunt index * of pop. .. ..
GNP per capita USS 120 130 270 520 330 1.590SHORT TERM INCOME INDICATORSUnskilled urban wages local cum. .. ..Unskilled ndal wagesRural terns of tradeConsumerprice index 1987=100 .. ..Lower incomecFoodcUrban".........Rural
SOCUIL INDICATORSPublic expenditurm on basic social services * of GDP .. .. - .. ..GChss enrollment ratiosPrimary % school age pop. 24 23 25 67 108 104
Male 32 30 32 74 116Female 17 17 19 60 101
MortaityInfant morality per thou. live births 203.0 180.0 157.0 93.1 63.1 39.0Under 5 mortality .. .. 217.0 172.3 1OIA 61.5
ImmunizationMeasles Sage group .. 11.0 40.0 49.9 87.3 77.6DPr .. 18.0 35.0 51.9 89.9 82.2
Child malnutrition (under-5) .. .. .. .. 40.3Lifc expectncyTotal yeas 39 42 46 52 62 67Femaleadvantage p 3.1 3.2 3.2 3.3 2.1 5.9
Total fertility rate births per womn 7.1 7.1 7.0 62 3.6 2.9Maternal rnnhity rate per 100,000 live births .. .. .. .. _
Supplementary Poverty IndicatorsExpenditurs on social secutiy % of tol govt exp. .. .. 3.0 .. .Social scurity covCerge % econ. active pop. .. .. .. .. _Accesstosafe watec total % ofpop. .. 16A 48.8 .. 67.0
Urban 5 29.0 46.0 100.0 .. 78.7Rural S .. 10.0 36.0 .. 62.0
Access to health care .. 20.0 .. ..
Population growth rate GNP per capita growth rate Development diamnondb62 (amnus averag pe t) (anual avrage. perct) Life expectncy
4 -- 5
I -5O L~~~~~~~rLJ ~~~capit enrollment
-2 j-10197D-7S 190 1938-93 1970-75 198D85 1988-93 Acces to safe watr
m Mli - Mali- low-income - vriom
a Sec de technical noe p.3S7. b. The development dimond, based on four key indicats, shows the average levd of development in the countrycompared with its income group. See thd introduction.
216

MaliMost Same ,e,fulucouuaroup Next
LainsIngle year seemx sax ' gkurUni of anSeaM Sake., Laow- ucea
In&faor *.*r, 1970-75 980-as ma-93 Afrc Income grouResources and Expenditures
HUMAN RESOURCESPopulation (mnre=1993) thousands 6.169 7,915 10.135 SS8,973 3.091.764 1.096,665Age dependency mlui rado 0.94 0.97 0.99 094 0.67 0.69Urban otf pop. 16.2 21.0 25.7 29.8 27.6 54.7Population growth rate annual * 2.4 2.9 3.2 2.9 1.9 1.6
Urban 4.7 S.3 S.7 5.0 3.9 2.9Labr force (15-64) thousands 2,089 2.593 3.209 229.480 1.442452 459.196Agriculture %oflaborfonrc 17 86Industy 2 2Fcmale 17 17 16 36 33 31Females per 100 mnals
Urban amber .. ..
NATURAL RFSOUUCFSArea thou. sq. km 1.240.19 1,240.19 1,240.19 24,273.63 39,091.96 40,63L67Density pop. per sq. km 4.97 6.38 7.91 22.37 77.60 26.52Agicultural lnd % of land ama 26.10 26.29 26.39 S2.54 52.112 39.61Changcinaguiculluralland anmnal% 0.16 0.06 031 0.06 0.03 -0.13Agricultural land under irrigation * 0.36 0.58 0.65 0.83 13.02 12.66Fon:sts and woodland thou. sq. km .. 0.13 0.12 5.32 7.15 5.95Defoestafioa (net annual % Q 14 -INCOMEHousehold incomeSha eof top 20% of households * of income .. ..Share of bottom 40% of households .. ..Share of bottom 20% of bousebolds .. ..
EXPND[TUREF-od SofGDP .. 46.2 .. .. ..
Staples .. 18.0 .Meat, fish, milk, cheese eggs ".. 1.9 - ..-
CeCal impots thou. metric tonaes 120 273 33 13.1S7 34.420 66,281Food aid in cereals 107 266 34 S,079 8,334 5.477Food producfion percapita 197 =100 107 101 101 101 113 101Ferilizer consumption kg/ba 0.1 0.6 0.7 4.6 59.9 48.0Slam ofagdridttuuinaGDP %ofGDP 61.0 47A 4Z.4 163 26.3 15.7Housing %oOGDP .. 6.5Avenge houschold size persons per household .. ..
Urban Ftied investment housing *ofGOP .. 39 .. ..Fuelad ipower %ofGDP .. 5.0 .. ..-Eney consumption perr capita kg of oil eqiv. 19 23 20 257 364 1.595Households widh electricity
Urban % of oo-Acholds .. .. .. .. -_Rural-
Trnsport and co unlaloon Sof GDP .. 3.2 _ .. _ _Faed investment tmnsport equipment " .. 2.2 - .. _Toal rad lengdt thou. bu IS 13 IS .. .. .INVESTMENT IN HUMAN CAPITALHealthPopulabtion per physician pesons 44.609 Z7,199 21.177 .. 3.277Population per nurse 2,672 1,431 2.053Population per hospital bed 1,463 .. .. 1,269 1.016 604OMl wehydyrtion thwepy (under-5) S of cases a .. 41 37 38
Gross enuollmentratioSeconday %ofschool-agepop. 7 7 7 13 41 S3
Female i 3 4 S 5 34 _Pupil-terratio: piy pupils per mecher 41 34 61 40 39 .Pupil-teacherratio: scoday - 19 12 16 - 20Pupils reaching grad 4 * of cobort 69 72 - -Repeate:rxtc pizany % oFtolalr cli 23 30 27 _ -
teracy % of pop. (age 15+) .. 77 68 5D 41 19Female % of fie (age 154-) 85 76 62 53 -
New7 qptrpcrculation per tou.rgm. 0 1 4 12 74;ZrlM dBnt lenumuomi Econandcs lX7ua_M Apn I217
217

MaltaNora Snmenglrmu eole r Next
liststluh year rectat kanre Up,mb higherUnit qf estI e & Cenra midde- Ineome
lndIcaor mesurr 1970-75 1980-85 1988-93 Asia Lcome grsup
Priority Poverty IndicatorsPOVERTYUpper povety line local curm . ..
Headcount index of pop. .. ..Lowerpowetyline local curr. .. ..Headcount index % of pop. .. .. .. ..
GNP per capita USS 1$800 3,280 7.970 2,450 4.350 23.680
SHORT TERM INCOME lNDICATORSUnskilld urba wages local curr. .. ..Unskilkd uralf wages -
Rural Icrms ortradeConsumer price index 1987=100 58 98 114
Lower income -
Food's 37 ..
Rurd .
SOCIAL INrCATORSPublic expenditu on basic socaservices SofD? .. 11.5Garms eonlment ratiosPimay % scola age pop. 94 107 110 .. 105 103
Male - 96 109 114 .. .. 103Female - 92 104 105 .. .. 103
MnrulyInfant mortality pertou. live births 22.0 13.0 8.8 24.B 35.8 7.0Under5 mo yality 4 .. .. .. 6. 42.6 85
I_nntizadonMeases % ae group .. 10.0 86.0 - 82.0 82.5DPT - .. 37.0 85.0 _ 74.2 90.2
Child malnitrition (under-S) - .Life expectancy
Total ys 71 74 76 69 69 n7Femaeadvantage 4.3 4.5 45 8. 5.9 6.4
Totalreilityraft birhperwoman 2.1 2.0 2.1 2.1 2.9 1.7Mamtnal moraity rat per 100,00 live births .. 33 ..
Supplementary Powvty IndicatorsEapedinus on social security Iof total govtcxp. 31.6 35.B 34.7 _ .. .Soda securty covrap % econ active pop. .. ..
Acess to saf watru tsl * of pop. .. 100.0 100.0 _ 86.7Urban n .. t1.O 100.0 _ 93.9Rural - .. 100.0 100.0 _ 66.7
Acceso tDhali re .. 100.0 .. .. _D..
Population growth rate GNP per capita growth rate Development dimondb6+ (annua aveag percn) I (mual averg perQ Lfen t
2T h. J *j OMIGNP Gross
197D-75 198085 1988-93 | 1970-75 19S08 1988&93 Accesstosafewar
MaltaMala _-Uppri-mknc-iome Upper-owae --
a. See Upe r.nic i no r p3g7. b. Up dcp-opwmd diam-dc based on four key india-r% gum dc a e ivc ord idvlopment in dc eonrecompawd wib its iname grp. See the inoducto
218

MaltaMost SOmI r$nkflacoaue grup Nerd
Lass igkeyouw remS Nape Upper- sAthrUnit of eaEafe & Cosial middke. Income
Iudieaier macwre 1D78-75 1DM45 1988l43 Asia 1ncome__ gruPResonrces and Expenditures
HUMAN REOURCESPopulatlo (mnrenls93) thouuands 304 344 361 494.619 500.507 812.447Ape dopeency ratio ratio 0.52 0.51 0.50 0.57 0.62 0.49Urban % of pop. 80.4 85.5 88.6 64.8 71.2 77.9Populaton growth raft sonnet I 0.1 1.2 0.7 0.6 1.7 0.6
Urban 0.8 1.8 1.1 1 5 ii8 0.8Labor force (15-64) thousands 120 139 151 237.897 190.136 395,641Agriculture Solnoforce 6 5 -
Industry 42 42Female *22 22 24 47 29 38Females per 100 mates
Urban number...Rural
NATURAL RESURCESArea thou. sq. km 0.32 0.32 0.32 24,320356 21,848.14 32,146.15Densty pop. per sq.km 950.00 1,075.00 1,121.110 20.20 22.51 25.11Agrichulra land % of land are 40.63 40.63 40.63 .. 41.26 42190Change in agricultural load annual %-7.14 0.00 0.00 -1.28 0.08 4048Agricultural land underirrigption % 7.69 7.69 7.69 7.15 8184 13.96Forests and woodland thou. sq. kmn. 0.00 0.00 0.80 t.04 10.56Deforesation (net) annual 5,.. 0.00INCOMEHousehold income
Share of top 20% of households % Of'icm ..
Share of bottom 40% of households Share of bottom 20% of househokds...
EflEflFood % ofOGDP . 21.3 8.. . 4
Stapics ... .. .1.6
Meat fish, mit cheese eggs. . .. 318Cereal import thou. metric tones 149 132 136 34.452 48,947 77,530Food aidin cereals *6 9 .. 4,392 544 8Foodproductionperrcapita 1981=100 88 IOD 99 .. 02 95Fazdlizecomsuimptin kglha 21.7 55.7 92.3 41.7 67.8 150.0Sham ofagriculinre inOGDP % ofGDP 5.6 4.1 2.8 1335 tOHoning %ofGDP .. 4.8 . 6.0 .. 11.7Average household sirc persons per household...
UrbainFiEwd invesbuent housing %tOf GDP. . . 5.2 .5.0
Fuel aindpower %ofGDP .. 7 -. 12 .. 2.0Energycozzuinpdon per capitm kg of oilequiv. 908 1,151 2,107 2,959 1,632 5203Households with electricity
Urban S of households..-. Rural
Trmqxwmdammukaden%ofGDJP .. 122 ... .8.8
Fixd inesmen transport equipment. .. .. 2.1Total road lengh thou,kmi1
INVSFM 4TN HUMAN CAPITrALHealthPopulatin per physician Person 834 813 -362 .. 453Populadoaper norse U 18 104 .. 249Population per hasitalbed U93 ..- 136 395 145Oral rehydyration therapy (under-5) % of cases ...... 51ElKefinasGross erollment ratioSeconday % of schol-apepop. 75 78 85 .. 3 92
Female 69 77 82 ... 94Pupil-teacher ratio: prmr pupils per teachr 21 22 21 .. 25 Pupil4eacli.rsati: eonar 13 12 13 -
Pupils iwaching grade 4 % of cohort 82 99 ...-
Repvater ratpuiWmar % of total enroHl 1 3 1Illteac % ofpop. (agel5+) .. 16 .. 514"
Female S of frm.(agels.b) i.s8.. 17
Mncx 7 circulaton 29'o.a- 163 151 .. 25 32D
219

Martiniqueedst Sfrau rqiewblceu group Mart
lt rlsigtle YNr reu Lami upper. higherUnit of ertln,e Amnera 'aWl.. Income
luncd uMUre 1970-75 198045 158893 CarFbb*PW lincme group
Priority Poverty IndicatorsPOVENrYUpper poverty line local cuf. .. ..
Headcount index S of pop. .. ..
Lower poverty line loca cur. .. ..
Headcomnt index S of pop. .. ..
GNP per capita USS .. .. .. 2,930 4,350 23,680
SHORT TERM INCOME INDICATORSUnskilled urban wages local curr. .. ..
Unskilled nua wagesRural tans of tradeConsmerpuiceindex 1987=100 33 93 117Lower incomeFood" .. 93 116Urban
SOCIAL INDICATORSPublic expenditure on basic social services * of GDP .. ..
Gross enrollment raiosPrinry S6 school age pop. .. .. -. 107 105 103Male .. .. .. .. .. 103Female .. .. ., .. .. 103
MortalityIfant mortaity per thou. live births 35.0 14.0 7.8 43.0 35.8 7.0Under 5 mortality .. .. .. 52.2 42.6 8.5
lmauniuinMeadecs S age group .. .. .. 78.7 82.0 82.5DR .. .. .. 73.7 74.2 90.2
Child malnutrition (under-5)Life expebncyTotal years 69 74 76 69 69 77Fernleadvantagn 5.7 7.0 6.5 5.3 5.9 6.4
Tol fertilityrate birthsperwormn 4.1 2.1 2.0 3.1 2.9 1.7M al mortality rate per 100.000 live births .. ..
Supplementary Poverty IndicatorsExpenditures on social security S of totd gov't cxp. _ ..Social security coveage %econ. active pop. _ ..
Acss to safe watr total % of pop. _ .. .. 80.0 86.7ban .. 90.1 93.9
Rurl n _. .. 57.6 66.7Access to helth came
Populeifon growth rate GNP per capita growth rate Development dialnond(annual averagc. perclt) (annm avaagc, pent) ufe expectancy
4- - 5
0 ~~~~~~~~per primary
capita enrollment
-2 ~~~~~~~~~~~-101970-75 198085 198-3 1970-75 198085 198893 Aco tosafewater
a Mnmtuce Marinique- Uppr-middb-income - Upper-midde-income
a. See ae tmchnid nos p.387. b. The development dimnond, bared on four ky indicators shows the averag level of development in die countrycomaed wilb its incom group. See the intioduction.
220

MartiniqueNost Same regof.uiaccu e~ Naf
latest utiiliflhF SWat LANA !ppe IWhrUnit of -eRdatie America m&Mk& Income
Indkcalar -maunr 1970-75 JDU085 19885J3 Caribbean Incame gRoupResource and Expenditures
HUMAN RESOURCESPopulation (mare-1[993) thousandA 329 341 371 466,304 500,507 812,447Age dependency ratio ratio 0.88 0.56 0.52 0.66 0.62 0.49Urban % of pop. 71,2 86.0 92.2 71.2 71.2 77.9Population growth rate Annual lb 0.2 0.9 1.0 2.0 1.7 0.6
Urban 3.1 2.4 1.6 1.9 1.1 0.0Labor force (15-64) thousands Ill 149 157 169.1139 190,1I36 395.641Agriculture 'Thof labor forc 19 1 3Industry 20 18aFemale 39 43 44 27 29 3HFemales per I100 rmales
Urban number , ..
RuralNATURAL RESOURCESArea thou. sq. km 1.10 1.10 1.30 20,505.92 21,848.14 32,146.15Density pop. per sq. kcm 299.09 330.00 334.08 22.29 22.51 25.11Agricultural land lb of land ama 33.96 39.62 33.96 40.00 41.26 42.80Change in agricultural land annual lb 0.00 5.00 0.00 0.39 0.01 -0.48Agricultural land under irrigation lb 5.56 9.52 11.11 3.41 8.84 13.95Forests and woodland thou. sq. km .. 0.00 0.00 9.87 8.04 10.55Deforestation (net) annual lb... 0.50
INCOMEHousehold income
Shar of top 20% of householdrs l of income ..
Share of bottom 40% of households.,.Share of bottom 20% of households
EXPENDITUREFood lbofCGDP ... . .. AStaples ... .. .1.6
Meat risb, milk, cheese, eggsp .. .. 3.11Cereal imports thou. metric tons44 56 58 27.700 48.947 77.530Food aid in cereals .. 2 . 1.565 544 BFood prduction per capita 1997=100 117 110 98 101 102 95Fertilizer consumption kg/ha 256.1 359.5 583.2 16.1 67.1 150.0Share of agriculture in GDP lbof GDP 9.. . .0 8.0Homsing % of GDP ... .. . 11.7Average household size peisons per household...
UrbanFixed investment housing lbof GDP ... .. .5.0
Fuel and power lb of GDP ... .. .2.0
Energy consumptioni per capita kg of oil equiv. 997 666 649 913 1.632 5.203Households with electricity
Urban lb of households...Rural
Transport and eormnmnlcatlon lbof GIDP ... .. .8.8
Faxed investment transport equipment ... .. .2.1
Total mad length thou. km...
INVESTUMEN IN HUMAN CAPITALHealthPopulation per physician poisos 1.552 724 ... . 453Population per nursec..PopuJaticn per hospital bed 99 . 51i 395 145Oral rehydyration lhczapy (unde-5) lb of cases. .. 61 51EducationGross enlrollment ratioSecondary lb of school-age pop. ... .47 53 92
Female .-..... 94Pupil-teacher ratio. primnary pupils per teacher I6 1 11 26 25Pupil-teacher ratio:, secondary b18 1 3Pupils resthing grade 4 9b Of Cohort...Repearterrle primary % Of towa enroll 18 .-
Illiteracy % of pop. (ageIS+)..7. 154Feimale % of feum(agel54.) ..- .18 17
NewsaPr circulation pe thou po. 12 94 87 5 12 320woandkL Internatonal Economis Depotmet. April 99~5
221

MauritaniaMast Some iouihu -omu gip Next
ltrati year mcextS bkiRhrrVnk of . -, MI"m- egodma Sbona Low Ilncme
I.iker megua 1970-75 19845 1981493 Afia Income groupPriority Poverty Indicators
Upper poveny line local courr. .. .. , ,
Hoeadount Index % pep. of ,, ., ,, 19Loer povety line local cur. .. .. ..
Headcount Index % of pop. .. .. ..
GNP per capita USS 330 380 500 520 380 1,590SHORT TERM INCOME INDICATORSUnskilled utn wagos local courr. .. .. ..Unskfled nrl wagesRural ternu of Irade .. ,, .. ..
Consumerprice lndex 1987-100 .. N6 155 ..Lower income * ,,
Rura * .. .. .. ..,..
Rurm] """ SOCIAL INDICATORSPublic expenditum on buic socinl services * of GDP . .. 4.0 .. ..a n enrollment ratiosPrmaiy % Schooi age pop. 19 49 55 67 108 104Mdc * 24 60 63 74 116
omake * 13 39 48 60 101Mortality
Inra nmrWlity per dou. live births 142.0 117.0 99.2 93.1 63.1 39.0Under 5 mortality U ., 202.0 172.3 101.4 61.5
InmununatonMease % age group .. 55.0 33.0 49.9 87.3 77.6DPIr .. 21.0 28.0 51.9 89.9 82.2
Child alnuitrion (under-S) 0 .. 31.0 .. .. 40.3Life expectncy
Total yeas 43 47 52 52 62 67Enle advantage " 3.2 3.2 3.2 3.3 2.1 5.9
Toal ferdlity mte birt per woman 6.5 6.1 S.3 6.2 3.6 2.9MaI nu msotlity rate per 100,000 live births BOD 800 ,. .. 3
Supplementary Poverty IndicatorsExpenditures on socil seurity % Of totl gov't cxp. .. .. .. .. ..
Social security covge % econ. acive pop. .. .. .. .. ..
Acces to safe water total % of pop. 17.0 36.2 65.B .. 67.0Urba " 98.0 73.0 66.6 .. 78.7Rural 10.0 16.0 6S.2 .. 62.0
Acces to headli cae- . 30.0 _ _
Population growth rate GNP per capita growth rate Devopment dianondb(anual aveage, pcmet) (amun avage. percent) life expectany
4 5
GNP Gross2 0II I per primaiy
clqpila c~~~~nrollment
-2 ~~~~~~~~~~~~~~~I-1
1970-75 1910-Ul 1983-93 1970-75 1980-85 1983-93 Access to sfe water
LI] Maritnia _ Mauritania- Low-inme - Low-income
a. See the technical notes, p.387. b. The development diamond, based on four key indicators, sbows the avenge level of development in the counrycompared with its income grop. See he introduction.

MauritaniaMost Samte raglu/f cuue group Next
Laestw sIu%e yw earMen me- AblrnUnRt of Exit WAM SaIglon. In- Income
ludicae .asuKre 197(145 1P8S55 1911-93 Africa income goup
Resources and ExpendituresHUMAN RESOURCESPopulmIlon (murerl.a19) thousands 1371 1,766 ZI1G! 558.978 3,091.764 1.096,665Age dependency ratio ratio 0.86 0.93 0*98 0.94 0.67 0.69Urban % of pop. 20.3 33.2 51.0 29.8 27.6 S4.7Populdtion growth rate annual % 2.3 2.6 2.5 2.9 1.9 1.6
Urban *9.0 7.5 5.3 5.0 3.9 2.9Labor rorce (15-64) thusmads 472 590 744 229.480 1,442,452 459,196Agricultwre % of labor foce 77 69Industry *7 9Female 21 21 23 36 33 31iFemales per 1 00 mater
UrbaLn number 83 .
Rural *101 .
NATURAL RESOURCESAnea thou. sq. km 1,025.52 1,025.52 1,025.52 24X23.63 39,091.96 40,682.67Density pop. per sq- kin 1.34 1.72 2.05 22.37 77.60 26.52Agricultural land %. of' land nsa 33.48 33.48 33.49 52.54 52.82 39.61Change in agricultural land annual % 0.07 0.02 0,01 0.06 0.03 -0.13Agricultura land under irrigation 5 0.03 0.03 0.04 0.83 13.02 12.66Forests and woodland tho. sq. kmn. 0.01 0.01 5.32 7.15 5.95Deforestation (net) annal % .. 0.001 -.
DiCOMEHousehold income
Sham of top 20l%of houeholds %ocrinccn ... 20Sham of bottom 40% of households ... 40Shar of bottm 20% of households ... 20
EXPENDrrUREFood laofGDP...StaplesMeat fish, milk, cheese. egg
Cereal imports thou, metric tonnecs 113 304 286 13.157 34.420 66.281Food aid in cereals 48 13S 42 5.079 8.334 5,477Food production per capxta 1987=100 101 103 39 101 113 101Flcrilizereconumption kglha 0.0 0.1 0.0 4.6 59.9 48.0Sham of agrcultur in GDP S of GDP 26.7 20.0 25.1 16.3 26.3 15.7Housing % ofGDP...Averag household size pesons per household ... 5.3Urban SA..5.
Fixed investmet housing * of GDP...Fueland power %ofGDP...Energyconsumnption per caita kg of oil equiv. 120 122 ios 257 364 1,595Households with clricaity
urban % of households ... 14.0Rura d . 6.0
Transport and comununcatlon S ofOGDP...Fixed invesunemt transport equipmentTornlmad length tOm. km7n 7DINESFMEENT IN HUMAN CAPMAL
Population per physician persons 11,126 8,830 ... . 3,277Population per nure 3,750 1,203Popuatio per hospita bed Z904 1,302 .. 1,269 1,016 604Oral rehydyrafion therapy (auder..5) % Of css...54 37 38EducationGross enrollncnt ratioSecondery % of school-agepop. 4 15 14 is 41 53Female *0 8 10 .. 34
Pupil-fteacherado: primary pupilsper teacher 35 51 53 40 39Pupibtehcer ratio: secondary 24 24 20 .. 20Pupils macting gmad4 %Ofeoo 97 92 86Repeater rate: pnmary %Of towtcaleri 15 1s 20 .
mfifteacy % of pop. (agel15+) .. 73 66 so 41 19Female %off1em. (agelS+) .. 84 79 62 53
!t!n= ci=W1,fi. Per dwouopE. 2 .. 0 12 - 74
22$

I ir ij T 14 t I-it P 41 flt . t",|5 gte4I; i ri c.Sl _1
1 i I 218zg|7 ;2 2[X12 a~~~~~~~~~~~~~~~~~~~~~~~~~~~~
LI~~~~~~
- I 1 g |ccsn| Wi Cm 00.c. t sWOW
4; u f L.f CD *. -:
to0 . N.b :: t t
I - g~~~~~~~~~~~~~ qW)~~~~~~~9

MauritiusMost Sata regieu/imeu group Newt
Intuit slugle par recent Sub Upp-ff- higherzriuD of eladmme Sahfma moaidS- Incme
Indicator mteasure 1979-S 11894 1988-93 AiSlka hamem group
Resource anid ExpendituresHUMAN RESOURCESPopulatian (mre=1993) thousands 192 1.016 1.091 558,978 500,57 812Z447Age dependency ratio ratio 0.74 0.57 0.52 0.94 0.62 0.49Urban *of pop. 43A4 41.4 40.6 29.3 71.2 77.9Population growth rate annual % 1.5 1.0 1.0 2.9 1.7 0.6
Urban 2.2 0.5 1.0 :5.0 1.8 0.1Labor force (15-64) thousads 280 390 466 229,410 190,136 395.641Agrciclture % of 'nor force 3 1 28Industry 25 24253 iFemale 22 25273298Females per 100 mules
Urban number...Rural
NATURAL RESOURCESArea thou. sq. km 2.04 2.04 2.04 24,273.63 21,84.14 32Z146.15Density pop. per sq.t km 437.25 493.04 529.71 22.37 22.51 25.11Agricultural land % or land ara 55.67 56.16 55.67 52354 41.26 42180Change in agricultural land annual % 0.00 0.00) 0.00 0.06 0.03 -0.48Agricultural land under inigption Ii 13.27 14.91 15.04 0.13 8.84 13.96Forests and woodland thou. sq. km .. 0.00 0.00 5.32 8.04 10356Deforestation (net) annual % ... 0.17..-INCOMEHousehold income-Sham of top 20%ofhbouseluolds % of income 55 .
Sham of botom 40% of households -14 .
Shar of bottom 20% of households S
Food %ofGDP .. 17.0 ... .34
Staples .. 4.7 ... 1.6Meat, fih milk, choeese eggs. 6.6 3. .8.
Cerea imiparts thou metric tonnus 149 179 240 13.157 48.947 77,530Food aid in ccmals *22 9 5 5.079 544 8Food production per capita, 1957=100 82 93 84 101 102 95FertWiizr consumption kgfha 213.7 245A 235.7 4.6 67.8 150.0Share of agricultuem in GDP % of ODP 19.2 12.8 8.4 16.3 5.0Honusig % of GDP .. 13.7 ... .11.7
Average househod size persons per household 5.3 4.8Urban
Fixed investmet housing * of GDP 6.6 43 . . . .FuelmBudpower % of GDP .. 2.2 ... .2.0
Energy consumption per capita kg of'oil equiv. 344 345 391 257" 1,632 5,20Households with electricityUrban % of households ..
RuralTransport and canmunicatlon % of GDP .. 7.6 .. . . LFixed investDmet trasport eup nt-2.6 1.7 ... .2.1
Totalroad length thou.kIa 2 22INVESTMEJTIN HUMAN CAPITALHealthPopulation per physician perons 4.243 1,892 1.165 ... 453Population per nurse 611 578 .
Populton per hospital bed 303 299 .. ,26 395 145Oral rchydyration therapy (under-5) % of cases ... 7 37 51EdontaonGross enrollment ratioSecwndary %l of school-age pop. 39 51 54 IS 53 92
Female 35 48 56 ... 94Pupil-teacher ratio: primary pupils per teacher 26 22 21 40 25Pupil-teachr ratio: secondary 31 20 21..- Pupilsreachirg gradre4 %Ofocohort 96 98 99 . .-
Repeater rate: primary W. Of total enroll- 6 8Iliteracy % ofpop. (agel5+) .. 17 .. 501
Female % Of fm.(mgel5+) -. 23 .. 62 17 Nesapercirculafion a thoujaEL. 92 73 74 12 125 320
225

MexicoMort Same regmfnue group Next
bAteat gles yaw recet iadti Upp- higheruni of art istt Ameria middk- income
Indcator swrm 1970.75 19*045 1988-93 Cari bbean Luere group
Priority Poverty IndicatorsPOVERTYUpper poveay line local curr. .. 32.424Headount index % ofpop. .. 20 10
LoDWr poverty line local curm. .. 7,742Hcadcoun index % of pop. .. 10
GNPpercapita USS 1.590 2.180 3,610 2.930 4.350 23,680SHORT TERM INCOME INDICATORSUnskilled urban wages local curm. .. ..Unskilled naa wagesRural trms of uadceConsunerpricc index 1987=100 1 23 506 .. .. .Lower incomenFood .. 23 449
UrbanRural
SOCLLINDICATORSPublic expenditure on baic social srices % of GDP .. ..Gross enrollnnt mtiosPdmaty %bsIoolRgepop. 109 119 113 107 *05 103
Male - 112 120 114 .. .. 103Female " 106 117 il1 .. .. 103
MortalityInfant morality per thou. live birdhs 68.0 49.0 35A 43.0 35.8 7.0UnderS mortality .. .. 43.0 52.2 42.6 85
IununizationMeasles % age group .. 30.0 78.0 78.7 82.0 825DFr .. 26.0 64.0 73.7 74.2 90.2
Child malnutrition (nnder-5) .. .- 13.9Life expeancyToul years 63 68 71 69 69 77Fcmaleadvantage 4.7 6.1 6.1 53 5.9 6.4
Totalferility rate birts perwoman 6A 4.3 3.1 3.1 2.9 1.7Matemal mortlity rate per 100,000 live birhs .. 92
Supplementary Poverty IndicatorsExpendiures an social security % of toul gov't exp. 23.5 9.6 12ASocial secuity coverae % econ. active pop. .. _Access to safe water. tota % of pop. 62.0 80.0 77-5 80.0 86.7
Urban " 70.0 95.0 39.0 90.1 93.9Rural 49.0 47.0 49.0 57.6 66.7
Acc to heab rc .. 50.7 91.0 .
Population growth rate GNP per capita growth rate Development diamond .6 (amual aveag percent; l (anmu average, percent) L xwA
4-- 5-_
2 ~ ~ ~ ~ ~ ~ ~ ~ ~ ~ O~~~~~NPGrs
C mOm~~~~~~~n rent
-2 -101970-75 1980-85 1988-93 1970-7 8 198D-S 1988-93 tDsdewaw
12Mexico Mxc- Upper-mindde-idancomne Uppermiddlc-inwC
a. See the technical nwis, p.387. b. The development diamni, based on fourkey idiato shows the avrage lvd of devdopment in te eountrycompetd with its icme gmnup. See the Inroduction.
226

Mexicomost same rskwglunceue group Newt
Latetsi agueyea~r recent LaIS Upper- hivherUR&l of erifluae America middle- Income
Indicaor unsure if8-VS i9s-us 1M9553 Caribben Income group
Resources and ExpendituresHumMA RESOURCESPopulation (nare=1993) thousands 5.8,71 75,526 90.027 466.304 500.507 812,47Age dependenc rato ratio 1.01 0.82 0.69 0.66 0.62 0A49Urban % of"pp 62.8 69.6 74.2 71.2 71.2 77.9Populntion rowdhrate annual % 3.1 2.4 2.2 2.0 1.7 0.6Urban 4.3 3.3 2.9 1.9 1.8 0.3
Labor forc (15-64) thonusnds 17,928 26,081 33,362 169.839 190.136 395,641Agricultur % of labor force 40 37Industry 27 29Female 23 27 27 27 29 31eFernaics per 100 malesUrban number 103 .
Rural 92 .
NATURAL RESOURCESArea thou. sq. kmn 1,958.20 1,958.20 1,958.20 20,505.92 21,848.14 32Z146.15Density pop. per sq. km 30.06 38.57 44.97 22.29 22.51 25.11AgriciJILudIUI ea %oflundawas 51.52 51.97 51.99 40.00 41.26 42.80Change in agricultural land annua % 0.15 0.01 0.01 0.39 0.03 -0.41Agrictullur alnduwiderinrigation % 4.55 5.33 6.15 3A1 8.84 13.96Forests and woodland thou. sq. km .. 0.55 0.49 9.87 8.04 10.56Deforestation (net) annual % .. 1.30INCOMEHousehold incomecSharc of top 20% of households % of income 61 56 -Sbarcofbottom 40% of households t0 12Shamofbottomn20% of househuolds 3 4
Food % of GDP 29.0 22.0 ... .8.4
staples 6.8 ...... 1.6Meat, fish, milk, cheese, eggs 12.7 ...... 3.1
Ceirea imports thou. azrnie turmes 3,720 4,780 6,223 27,700 43,947 77,530Food aid in cemals .. 6 45 1,565 544 8Pod production per capiia 1987=1 00 93 102 95 101 102 95Ferwiizrmr consumnption kg/h 10.9 17.3 16.3 16.1 67.3 150.0Sham ofagrcultumein GDP %ofGDP 10.8 9.1 8.5 9.0 8.0HoLusig % ofGDP 6.4 5.1 - -- 11.7Averagp household size peron per household 6.0 5.5Urban 6.0..-.
Faxed investment housing S of GDP 6.3 4.4 ... .5.0
Fueland pover %oafGDP ...-... 2.0Energ consumption pe-r capita Irgof oil equiv. 169 1,362 1,439 913 1,632 5,203Householdls with electricityUrban S or'houscholds...
Transport and conmmuatioku S of GDP 6.0 7.'7 -. .Fixed investment tnuisportcequipmnent 2.2 3.0 ... .2.1
Total mad length thou.1km 193 224 237..-]INVESTMENT IN HUMAN CAPITALHealthPopulaton perphysician persons 1,426 1.186 ... .453
Population per nrse 1.37 a44.B". Popublaion per hospital bed 376D .. 29 517 395 145Orul rehydymtion hemapy (under-5) %ofeases ... 87 61 51-
Gros enrolment atioSeconday % ofschool-age pop. 34 53 55 47 53 92
Female 28 52 55 ... 94Pupil-tacher ratim prmary pupils per teacher 45 34 30 26 25Pupil-teacherratix secnday 18 18 17Pupilsreaching grade 4 % Ofcoo59 83 86Repeatermrte: Primary %oftotalenro11 11I 10 9Illitmery %of pop. (agel15+) 26 Is 13 15 14
Female %of kcm (agelS+) .. l i5 18 17 -
N kcukon ame tougP .. 132 116 85 125 320
227

Federated States of MicronesiaMort Sanme. ousre poagrup Nut
laze single ,Par reas Lawea higherUN of as naf. East WM & inc e
Inator meaure 1970-75 1950-9 1=95-93 As (ncLme groupPriority Poverty Indicators
POVERTYUpper povcrty line local curT. .. ..
Headcount index % of pop. .. .. .. 12Lower poverty line local curr. .. ..
Headount index % of pop. .. .. .. 9ONP per capita USS .. .. .. 820 1.590 4,350
SHORT TERM INCOME INDICATORSUnskilled urban wages local curr. .. ..
Unskilled mral wagesRural terms of tradeConsumer price index 1987=1(0 .. .
Lower incomne
UrbanRural
SOCIAL INDICATORSPublic expenditure on basic social scrvices %I of G3DP .. ..
CGoss erolment mctiorPrinmiy %schoolagepop. .. .. .. i18 104 105Mae - .. .. .. 123Female .. .. .. 115
MortalityInant mortaity per hu. live birs .. .. .. 3S.5 39.0 35.8UnderS momalily .. .. .. 60.5 61.5 42.6
ImunizationMasles % ae group .. .. .. 93.0 77.6 82.0DPr " .. .. .. 95.0 32.2 74.2
Child malnutrition (under-5) .. .. .. 24.1Life expctncyTotl years .. .. 68 67 69Female advantage - .. .. 3.6 5.9 5.9
Total fertiliy rate births per woman .. .. .. 2.3 2.9 2.9Maternal morulity rte per 100,000 live births .. .. .. 116
Supplementary Poverty IndicatorsExpenditures on social security % of total gov't exp. .. ..
Social seurity covea % econ. active pop. .. ..Access to safe water wtal 9 of pop. .. .. .. 67.1 .. 86.7
Urban .. .. . 83.5 .. 93.9Rumrl .. .. - 61.3 .. 66.7
Accss to health cam .. .. 75.0
Population gowth rate GNP per capita growth rate Development diamond'(annu6 awvnm pecent5 (annual avge, percent) Life e t
4 5
GNP Gomss2- I7 e 0- I t<.l per < primaty
capita enrolmenLK -5
-2 -101970-75 1980-85 19U343 1970-75 1980-35 1938-93 Access to saf wer
[ Federated Stats of Micmnesin Federatcd States of Micrmnesia- Lower-middle-income - Lower-middle-income
a. See the technical nots, p.387. b. The dedopment diamond. based on four key indicas, shows the aveg lvdel of delopment in de cumtrycompard with its income group. Se the introduction.
228

Federated States of Micronesiamat Same regilea/bcame group Nedt
Laces aiuglem per cNt LaWer- bliSterUnit of esmate Beet middl- Incolve
IudkWotr unsure 1970S7 1980-8 lI9SS9 Ad.1 Inceme grouResources and Expendituires
HUMAN RESOURCESPopulation (mre=-1993) thousads 7 1 91 105 1.713.883 1.096.665 500.507Age dependency ratio ratio ... . 0.54 0.69 0.62Urban % of pop. 24.6 25.3 27.4 31.3 54.7 71.2Populaziongrowth rate annnual % 3.0 1.8 1.8 I A 1.6 1.7
Urban h3.3 2.1 3.0 4.0 2.9 1.3Labor force (1544) thousands 99 127 155 942,977 459,196 190,136Agriculture lb of la1bor force . .. ..
IndustryFemale N23 27 27 41 31 29Females per 1 00 males
Urban number...RUM]
NATURALL RESOURCESArea thou. sq. km 0.70 0.70 0.70 16,367.91 40A682.67 21,848.14Density pop. per sq. kin 101A3 129.79 147.31 103.27 26.52 22.51Agricultural land lb of land area ... . 4.21 39.61 41.26Change in agricultural land annual lb. .. 0.24 -0.13 0.08Agricultural land under irrigaton %b. .. 14.68 12.66 8.84Forests and woodland thou. sq. kinam 0.00 0.00 4.06 5.95 8.04Deforetazion (net) annual lb... 0.00INCOMEHousehold income
Shum of top 20% of households lb of income...Sham of bottonm 40% of householdsShare of bottom 20% of households
Food lbofGDP...staplesMeat fish, milk, choeese eggs
Cecrenl imports thou. nzticl tmnes ... . 30.036 66.231 48,947Food aid incemcals - .. . 47 5.477 544Food production per cnpita 19187 100 ... . 115 101 102Fertilizer consumption kgla .... 76A4 49.0 6719Sham of agriculture in GDP lb of GDP ... . 17.1 15.7 8.0Housing % of GDP...Aveag household size personr per household . .. ..
UrbanFixed invesnene housing lbof GDP...Fuel andipower S ofOGDP . .. ..
Energy conumrption per capita kg oroil equiv. ... . 632 1,595 1,632Households with electricity
Urban of households...
Transport and conmunolaton lbof GDP - .. ..
Fixd investmnent tramsport equipmen . .. .
Total moad length thou. km...INVESTMENT IN HUMAN CAPITALHealthPopulatio per physician person ... 1,063 3,277Population per nureo.... 1,490Population per hospital bed - .. . 612 604 395Oral rehydyration therap (under-5) lbof cases ... .32 .. SEducatioGross enroilient ratioSecondary lb of school-age pop. ... . 53 53 53Female ... .47
Pupil-teacher ratio:- prmaty pupils per teacher ... .23 .. 25Pupil-teacher ratio: secondary - .. .16
Pupils maching gdrad4 % ofoDhort .-.. 92Repeatr raz: primary lbof totalcenrolil, . 6illfitercy lb of pop. (age 15+) ... .22 19 14Female % offezu.(OF lS+) ... . 36 .. 17
;;W dape tou.poo . . . 74 125wolil am lmmuonL ~CRDepartment, April1995
229

MoldovaMest SMew raog uCacesepowp Nat
iaert sige yefar rc.at Europe Loawer- hirgfUnaf of eutlnte & Ceantrl mide- lnceme
Indicator mzsure 1970-75 19804J5 198_ 93 Asia bancme graupPriority Poverty Indicators
POVERTYUpper poverty line local curr. .. ..Headcount indcx % or pop. .. .. .. .. .. .
Lower povcry line local curr. .. ..Headcountindex % or pop. .. ..
GNP per capita USS .. .. 1,060 2,450 1,590 4.350SHORT TERM INCOME INDICATORSUnskilled urban wages local curr. . ..Unskilled rurwa wagesRural terms of tradeCansunerprice index 1987=10 .. ..0Lower income 'Food' .. .. ..
UrbanRural
SOCIAL INDICATORSPublic expenditure on basic social services * of GDP .. .. 8.0Gross enrllment ratiosPrimay % schol agep p. - . 94 - 104 105Male * .. .. ..FemDte .. _...._
MortalityInrant mortity per thou. live births 37.0 28.0 25.0 24.8 39.) 35.8Under 5 motdality -._ 36.0 36.4 61.5 42.6
ImmunizationMcasles % age group .. _ .. .. 77.6 82.0DPr .. _ .. .. 82.2 74.2
Child malnutrtion (undcr-5)Life expecuncyTotal years 65 65 67 69 67 69Fcmale advantage - 6.9 6.6 8.1 8.8 5.9 5.9
Total fertlity rate births perwoman 2.6 2.5 2.1 2.1 2.9 2.9M nal mortaity rate per 100,000 live birds .. 64 34 - -
Supplementary Poverty IndicatorsExpenditures on social security * of totau govt exp. .. ..Social security coverage % ecn. active pop. .. .. .. ..Access to safe water total * of pop. .. 8. .. .. _ 16.7
Urban 99 . _ 39Rural .. .. .. .. _ 66.7
Access to health care _ .. .. _ ..
Population growth rate GNP per capita growth rate Development diamondb(annul avemge percent) 5- (annual averge. percent) life expectaicy
4- -
2 _ _ _ _ _ _ _ _
capita enwrolment
-2 -10 t-
197G-75 1980415 1981-93 1970-75 198085 1988-93 Accss to safe water
] Moldova - Mddovalower-middle-income Lower-middle-income
a. See the techical note p3B7. b. The developantdiauond, based on four key indicato.d shows the avage level of dvcelopment in the countrycompared with its inc group. See the inirduction.
230

MoldovaMort Same reglonll1come.grnp NW
Later: slngleygw recent 7funqi Lowe,. higherUa* of estimate a C.ante middle- inacm
Indkleajar measure 1970.75 198645 JUN.93 Asia becme troopResources and Expenditures
HUtMAN RESOURCESPopulatIon (mrc=19f3) thousands 3,839 4.214 4,40B 494.619 1,096.665 500.507Age dependncy ratio ratio 0.55 0.53 0.56 0.57 0.69 0.62Urban % of pop. 35.8 43.8 50,1 64.8 54.7 71.2Populadon growthrwte annual % 1.3 1.0 0.4 0.6 1.6 1.7Urban 3.5 2.8 2.0 1.5 2.9 1.8
Labor ferne (1544) thousands .. 2,080 2.052 237.897 459.196 190.136Agriculture I of labor force .. 36 37Industry .. 28 27 4 "2Femal . . 62 431 2Females per 100 nmals
Urban number...Rural ..
NATURAL RESOURCESArea thou. sq. km 33.70 33.70 33.70 24,320.56 40,682.67 21,848.14Density pop. perusq km 113.92 125.04 130.26 20.0 26.52 22351Agricultura land S orl'lzd ame 76.5 78.22 77.65 .. 39.61 41.26Change in agriculurn]a lan annual S . 0.35 -0.23 -1.28 -0.13 0.08Agricultural lnd under riniption % 6.18 10.43 12.19 7.15 12.66 8.84Forest and woodland thou. sq. km...n. 0.80 5.95 8.04Deforestaton (ct) annual % ..
INCOMEHousehold income
Share of top 20% of households % of income ..
Share of bottom 40l% of households...Share of bottom 20% of households...
Feood S of' CDP...Staples...Meat, fish, milk, cheese eggs..-
Cerea imiports thou, metric tonnes -.. 200 34.452 66,211 48,947Food mid in cereals ... 72 4,392 5,477 544FDod productionaper capita 1987=100 ...... 101 102Fertilizer consumption kgl&a.. 52.7 41.7 48.0 67.8Shartof agriculharein GDP % of GDP .. 2917 34.6 13.5 15.7 8.0Housing %ofGDP ... 4.7 6.0..-Avenge household size person par household ... 3.4Urban...
Flixed investment housing S Of GDP Ili.4. 5.'2Fuel and power % of GDP .. . L 1.2Energyconsumption percapita kg of oilequiv. Z.2130 1.345 2,959 1,595 1,632Househlds with elctricity
Urban % of households...Rural.d.
Transport anmd carnmmunlmtlon % of GDP...Fixed invcsuncent tranport equipmaent...Total road length thou. km 12 i8 20
INVESTMENT IN HUMAN CAPITALHealthPopulation per physician person 380 270 253 362 3,27Population pernus *116 92 91 249..-Population per hospital bed 91 82 81 136 604 395Oral wehydyration therap (undcr-5) % of camses. .. . 5 1EducationGrofs enroment ratioSecondaRy % of school-agepop. ... 81 .. 53 53Female
Pupil-teacher ratio: puinairy pupis per teacher. .. .. 25Pupi-teacher ratio: secondary...Pupils reaching grade 4 %Of cohort...Repeate rate primary % of tota carol]l..Ilitracy S of pop. (OFeIS+) 4 5 19 14Femaale % of fem (Sp IS+) 1.. . 7
NURPrcirculation pe thapou. WE . - ... 74 125WOrzd iani Unternadbi ECDonomCS DepartMent,, April 1995
231

MongoliaMeoi Samerewgeflneme group Next
Latet su ge a reent higherUnt of stmate Eas Loow- ineome
Indkcator _mesure 197175 19580S 198893 Asik Income group
Priority Poverty indicatorsPOVERTYUpper povert line loCal curr .. ..
Headwount index %orpop. .. .. .. 12 19Lower povcrty line local crr. .. ..
Headcounlindex % or pop. .. .. .. 9GNP per capita USS .. .. 390 820 380 1.590
SHORT TERM INCOME INDICATORSUnskilled urban wages local curr. .. ..
Unskilled rua wqas.Rurl term of tradeConsunmrprice indec 1937=100 .. ..
Lower incomlDoe
UrbanRural
SOCIAL INDICATORSPublic expenditure on basic social services % of GDP .. .. 4.1Gross enlment ratiosPrimay % schoola ppop. 108 103 89 118 108 104
Male III 102 96 123 116FemlIC 104 104 100 115 101
MoralityInfant mortity per tbou. live births 98.0 78.0 53.4 35.S 63.1 39.0UndreS mortlity 7.. .. 7.0 60.5 101.4 61.5
ImmunizationMeasles u age group .. 18.0 86.0 93.0 87.3 77.6DPT .. 83.0 84.0 95.0 89.9 8212
Child nmanutrition (under-) .. .. .. 24.1 40.3ULe expectancyTotal years 54 59 64 68 62 67Femaleadvantage 2.5 2.5 2.7 3.6 2.1 59
Total ferility rate births per woman 5.8 53 3.5 2.3 3.6 2.9Maternal morlity rate per 100,000 live births .. 140 140 116
Supplementary Poverty IndicatorsExpendituts on social security % of total gov'texp . .. 17.7Social security covemge % econ. active pop. .. ..
Access to safe wate. total % of pop. .. .. 66.0 67.1 67.0Urban 58.0 .. 7B.0 83.5 78.7Rurl M.. .. 50.0 61.3 62.0
Access w balth cam .. 100.0 100.0
Population growth rate GNP per capita growth rate Development diamondb
6t- (annual avrage. percent) 1 (annual aveage. pelcent) Life expcncy
4 5--
~~~~~ O~~~~~~NP Gross
_ m F I | =-= capita enrollment
-2 -10 cetDsfwac1970-75 1980-85 1988-93 1970-75 1980-85 1988-93 asafewarer
] Mongolia Mongolia- Low-inme - Low-income
a. See the- tedudcal notes, p397. b. The development diamond, basd on four key indicators shows the average level of development in due countrycompared with its inoome group. See the inroduction.
232

MongoliaMteat Same regafw/Inme grey NMx
lAirsg sigke juff remiusliglull of ezulinar East Law- inuome
Irsaaor meacru 1970.75 fl5585 1MB-f9 Aria ucerne rA"uPResource and Expenditures
HUMAN RESOURCESropuadon (mre=199) thousands 1,447 1,909 2.318 1,713,813 3,091.764 1.096,665Age depedency ratio rato Oil 0.33 0.74 0.54 0.67 0.69Urban S of pop. 48.7 55.0 59.7 31.3 27.6 54.7Population growth ratc annualS 2.8 2.8 2.2 IA 1.9 1.6
Urban 4.3 3.8 3.2 4.0 3.9 2.9Labor force (15464) thousands 668 894 1,120 942,977 l,442452 459,196Agriculture % of labor force 44 40 0Industry 2 1 21 03'
Female ~ ~ ~ ~ ~ ~ N45 46 46 41 33 3Females per 100 males
Urban number...Rural
NATURAL RESOURCESArea thou. sq. km 1,56650 1,566350 1.566.50 16,367.91 39,091.96 40,682.67Density pop. per sq. kmn 0.92 1.22 1.45 103.27 77.60 26.52Agricultural land % of land area 89.81 79.53 80.56 44.21 S2.82 39.61Change in agriculturmi land annual % 0.00 -0.02 0.16 0.24 0.03 -0.13Agricultural land under inigation % 0.02 0.05 0.06 14.68 18.02 12.66Forests and woodland thou. sq. km .. 0.15 0.14 4.06 7.15 5.95Defonstatiom (net) annual S-.. 0.87
INCOMEHousehold income
Shame of top 20% of households % of'icm ..
Sham of bottom 40% of households.Sham of bottom 20% of househoklds
Food % ofGDP *.. 37.1Staples ... 15.4Meat, fish, milk, dchse eggsp. 14.3
Cereal impnrt thou metric tommes 56 71 182 30,036 34A420 66.281Food aid in cereals . 9 447 8.334 5,477Food production per capita 1987=100 136 103 68 115 113 101Fertilizrn consumption kglha 0.0 0.2 0.1 76.4 59.9 48.0Shaseof agricultbncin GDP SofGDP .. 10.1 18.2 17.1 26.3 15.7Housing % ofGDP ... 13.9Average household size poisonis per household...
UrbanFixed investment housing S ol'GDP ... 5.4Fael and power % of GDP ... 3.8Energ cosumpdion per capita kg of il equiv. 753 1,21'1 1,019 632 364 1.595Households with elctnicityUrban S of households...Rura
Tmmpow am unonkoon%of GDP ... 2.9Fixed investamet transport equipment 1 . . 2Total road length thou km...INVFSSTMENT IN HUMAN CAPITALHealthPopuation per physician person 578 104 364 1.063 .. 3,277Population per nursec 252 217 .. 1,490Populontiper hospitalhbed 3105 90 15 612 1.016 604Oral ehydyration therapy (under-5) % of cases ... 65 32 38EducationGross ensulbuet ratiSeondary % or ohool-agpop. 81 90 77 53 41 53Female U 4 95 .. 47 34
Pupil-toacherratio: primary pupils per teacher 31 32 .. 23 39PupiI-tachr ratio.seconday i5 22 1 8 1 6 20Pupisreachinggradle4 % of cohort .... 92.Repeawrrt: priinmy Of towtaleroll I .. 6Illimacy S of pop. (age 15..) ... .22 41 19Female S orfem. (ap154) ... .36 53
NM =sre circulation pe thou~'. 77-- 93 92 - .. 74wo antm Inefo nalgu Ecnm ics L)eputMnt Apal Ly
233

MoroccoMeot Same Fglenleremp Nw
Lat shIle yewr menat MM-a Lower- higherUnitef Cabae & Noas middk. income
lediMar meosre 2970-75 1983 S 193t8-93 Arirka Income group
Priority Poverty IndicatorsPOVERTYUpper poverty line local cur. .. .. 2,569Headcoant index % of pop. .. 26 13
Lower poverty line local curr. .. .. 2.070Headcountinduz %ofpop. .. 17 7
GNP per capita USS 550 600 1.040 1.980 1.590 4.350SHORT TERtM UICOME INDICATORSUnskilled urban wages local cur. .. ..
Umskilled rural wagesRurlm terms ortradeCansumer price index 19B7=100 35 90 136Lower incomeFoao .. 91 125Urban
SOCIAL WNICATORSPublic expcnditure on basic social services % of GDP .. ..
Gross emollmatiosPrimary % uhool aB pop. 62 77 69 97 104 105
Male 78 94 90 103Femsle 45 60 57 90
MorlityInfant montaity per thou. live births 122.0 97.0 65.6 52.3 39.0 35.8Under 5 mortality .. .. 84.0 69.9 61.5 42.6
bhmunintionMeasls * age group .. .. 76.0 81.3 77.6 82.0DPr .. 44.0 79.0 84.0 82.2 74.2
Child malnutrition (under-5) .. .. 9.0lifeexpefncwTotal years 53 58 64 66 67 69Female advantage 3.1 3.4 3A 2.3 5.9 5.9
Total relity ate births per woma 6.9 5.1 3.6 4.7 2.9 2.9Mtena mortality rate per 10.000 live bits .. 327
Supplementary Poverty IndicatorsExpendibm on social securiy % of toal gov't ep. .. ..
Social security coveamge % con. active pop. .. ..
AccesstosafFewater otul %ofpop. 51.0 57.6 72.8 835 .. 86.7Urban * 92.0 100.0 100.0 98.7 .. 93.9RuWr - 28.0 25.0 50.0 69.0 .. 66.7
Accs to heath care .. .. 62A 87A
Population growth rate GNP per capita growth rate Development diamondb6 (ia averae pert) 5 (n averg prcient) lif r4 5
2- 1 O - [ § I t *=ts I GNP Gros
capita enrollment
197fl7 7 19704 7 19B :3 1970-75 198905 1988-93 Aass to safe water
Z Mor c coco- Lewe r-nddle-inddleco
a. See the tehnical notes. p387. b. The development dimond, based on fotur indicats, shows lve av ep kwl of dcvlopment in the countycompaed with its income gup. See th intoduction.
234

MoroccoMoo Some uegioanfaoem qp Next
latinl sIugrleifwu mosws HMW-M Lcww khighr
uisit qf srdalmo & Neig middle- lmuauIndicator soaran 1970-7S nflO-IS 1985-f3 4tWa. lucen Snaup
Resources and ExpendituresHIUMAN RESOURCESPopuhlatin (mre=1993) thousands 17,305 21,316 25,945 261,650 1,096,665 500,507Ago dopondoncy ratio railo 1.03 0.83 0.70 0.87 0.69 0.62Urban %olpop. 37.7 43.9 47.5 55.2 54.7 71.2Population growth rate ainnual Ii 2.S 2.4 2.2 2.7 1.6 1.7Urban 4.2 3.7 3.2 3.7 2.9 1.8
Labor rorce (15.64) thousands 4,656 6.676 8.567 71,333 459,196 190,136Agriculture 5. or labor force 52 46Industuy 2 1 25Female 16 20 21 I16 31i 29Females per 100 maslcsUrbakn number lOS IO0Rural 104 107
NATURAL RESOURCESArcs ftho. sq. km 446.55 446.55 446.55 11,021.26 40,682.67 21,848.14Density pop. per sq. km 38.75 43.85 56.83 23.10 26.52 22.51Agricultural land 5. of land aren 60.31 65.66 68.90 32.10 39.61 41.26Change inagricultural land annual % 1.08 0.13 -1.15 0.04 .0.13 0.08Agricultural land under irrigation 5. 3.94 4.25 4.16 30.59 12.66 1.34Forests: and woodland thou. sq. km .. 0.03 0.09 0.45 5395 1.04Deforestnian (net) mnual5 ... -1I45INCOMEHousehold incomeShreof top 20% orhouscholds % of income 49 39 46sham or bXomta40% of households 12 23 17Shame of bottom 20% of housholds "4 1 0 7 .
EXPENDITUREFood %efGDP .. 30.1... Staples .. 94Meat, flis, milk, cheese, eggs. 8.9...
Cereal imports thou. metric tonnes 1.50 2Z177 3,653 33.092 66.281- 41.947Food aid incereals N75 518 234 1.249 5.477 544Food prodwoton perocapita 1987100 85 91 96 102 101 102Fertilizer consumption kglha 612 10.4 104 89.9 48.0 67.8Sharc of agrculture in GDP 5.ofGODP 17.3 16.6 14.3 13.3 15.7 8.0Bowsing 5.of GDP 6.7 ..-
Average household size persons per household 6.0 5.9 5.7 .
Urban *5.0 .. 5.2Fixed investment- housing 5.of GD? . 4.1 -
Fuel and power SofGDP 1. .4Energy consumption percnpita kg oroiiequtiv. 198 256 2-99 1,097 1.595 1,632Households with electricityUrban 5. or households ... 90.0 .
Rural ... 13.0Tmnsportmandconnnunlallo 5.ofGDP .. 63 -
Fixed investmet transpoirt equipment .. 1.5 -
Total mad length to.k5058 59
INVESTENT IN HUMAN CAPIALHEalthPopulation per'physician person 13,100 15,536 4,710 .. 3,277Population per nursec. 918 Population per hospital bed 700 795 785 633 0 395Oral rehydyrasian therapy (under-5) 5.of casem.. 14 56 .. 51EdcamtIonGross emimemnt ratioSecondary % of school-age pop. 16 34 28 56 53 53Female 12 27 29 so
Pupil-teacher nstio primary pupils per teachr 42 28 28 26 .. 25PupD-teachcrr ato. secondary 24 19 1 5 21Pupils reaching gradce4 % of cohort 85 83 85 95Repeater raie: primnry %iftotal enmll 28 20 15illiteracy % ofpop. (agelS.t) 79 Ss 5 1 45 19 14Female 5Of fent (agels.+) .. 71 62 57 .. 17
Newsjercirculation merthou pop. 21 15 13 33 74 125woatnk Intemational Ecanom=c Departmenot, April I99
235

MozambiqueMNr Same P Neon
flair lamQ ~~ meant Sui k,h.rUnitqJ of caiaL. Sahk. low. Incoue
Indkufwor mSum JP1 473 198985 191813 AIMO3 icame groRpPriority Poverty Indicators
POVERTYUpper poverty line local curr, .. . .. ..
lHcndcount Index %of pop. .. .. .. ,. 19Lower poveny line localuca. 4. .. 44 ..
Headcount lndox % of pop. .. .. .. 4,
GNP par capita USS ,. 140 90 520 310 1,590
SHORT TERM INCOME INDICATORSUnskilled urban wageR local curr. .. .. .. .. .
Unskillod nnl wAgesRural tcrna of tradeConsLnier pdce Index 1987-100 27 851 ..LAwe Inome
UrbanRural
SOCIAL INDICATORSPublic expenditurm on basic socil services * orGDP 13.1 .. 4.
aross enrollment mtiPrimary % schoolapepop. 47 36 60 67 108 104Male .. 97 69 74 116Female .. 7S 51 60 101
MortaityInfant mortity per thou. live births 168.0 155.0 145.6 93.1 63.1 39.0Under 5 moalrity .. ., 282.0 172.3 IOIA 61.5
ImmunizatdonMeasles % ag group 4. 39.0 23.0 49.9 873 77.6DPTr 29.0 19.0 51.9 W9.9 82.2
Child nulnutrition (under-) .. 40.3Life expectancyTotal yeas 42 45 46 S2 62 67Female advamtage 3.2 3.3 3.1 3.3 2.1 S.9
Total fertility rate births per womnn 6.5 6.5 6.4 6.2 3.6 2.9Matenal moality ratC per 100.000 livc births 300 .. .. ..
Supplementary Poverty IndicttorsExpenditures on socia securty % of tot pvvt exp. .. .. .. .. ..
Social security covermge econ. ave pop. .. .. .. .. ..
Acess to safe wnlen total % of pop. .. 14.1 21.6 .. 67.0Urban .. 38.0 44.0 78.7Rural 2.0 9.0 17.1 .. 62.0
Access to health care 40.0 30.0 .. .. ..
Population growth rate GNP per capita growth rate Development diamondb(an6a avenge. pecent (u" - rnt) Ub expectac
4 5
GNP Gross2 0 Per -ar
-2 -101970-75 1980-85 1928-93 1970-75 193085 1I3893 Am to sat water
M Moznbique Monmbiqm- Low-income - Low-income
& See e hnical not p.3B7. b. Me d wvdopmen dimond, based an four key indicalor, shows the veage leved of d_vlgct in die counnycompard with its incme grp. See tbe inirodcion.
236

Mozambiquemest Some renfi lcoeii roMp Next
ZLZU *ffkl NWa receafl slab- - higherUniteof agijpge Sakam Laiw- Income
lad/c sfor meaitre 1970-75 1959, 1958-fl Africa Income graspResource and Expenditures
HUMAN RESOURCESPopulation (nnn1993) thousands 10,498 13,541 15,102 553,978 3,093,764 1.096.665Age dependency uraic ratio 0.89 0.88 0.92 0.94 0.67 0.69Urban lb of pop. 8.6 19A 31.2 29.8 27.6 S4.7Population growth rite annualS 2.2 2.3 [A 2.9 1.9 1.6
Urban *9.2 9.0 6.3 5.0 3.9 2.9Labor force (15-64) thousands 5,531 7,671 8.957 229,480 1.442.452 459.196Agriculture lb of labo force 85 84Industry e7 7 4 ~3 1Female s0 49473331Fenmies per 100 malesUrban n-mbarr 83Rural * .119
NATURAL RESOURCESArea thou. sq. km 801.59 801.59 801.59 24,273.63 39,091.96 40682.67Density pop. per sq. km 13.10 16.89 18.57 22.37 77.6D 26.52Agricultural land lb of land amea 60.04 60.06 60.17 52.54 52.82 39.61Change in agricultural land ainua % 0.00 0.02 0.11 0.06 0.03 -0.13Agricultural land under intigation % 0.08 0.20 025 0Om 18.02 12.66Forcsts and woodlad tOm. sq. kmn. 0.i9 0.17 532 7.15 5.95Deforestation (net) uanual lb... 0.75INCOMEHousehold income
Share of top 20% of households lb of income...Slam of bottom 40% of households*...Share of bottom 20% of houscholds
EXPENDITUREFood %cfGDP ... 29.3
Staples e8.. .7Meat, fish. milk. cheesei eggs ... 10.1
Cereal inipomr thou. metric tonnes 191 598 507 13.157 34.420 66.281Food aid in cerals 34 379 958 5,079 8.334 5.477Foodproduction per capita 1987 1 OD 140 101 88 101 113 101Fertilizer consumption Irglha 0.1 0.! 0.1 4.6 59.9 48.0Slime of' agriculture in GDP lbofGDOP .. 47.7 30.9 16.3 26.3 15.7Housing % of GDP 8.. .7Avemag household size person per household .. 4.3Urban
Fixed investnmet: housing lbof GDP ... 3.2Fuelsnd power %ofGDP ... 4.6Enegy consumption percapita kg of oilequiv. 75 39 43 257 364 1.595Households with electricityUrban % of households...Rural
Transport and commuunicatlon lbof GDP .. 10.0Fixed investment; Utrsport equipment ... 6.4TomalFood length thou. km 39 35s 35INVESTNMENT IN HUMAN CAPITALHealthPopulation per physician person 18.865 41,534 ... . 3,277Population pernursc 4.2811 5,715Population pcrbhospital bed S851 918 1.156 1.269 1.016 604IOral rhydyration therapy (under-I) lb of cassm.. 60 37 33EducatlomGross enollment ratioSecondary oof school*ag pop. 5 7 8 18 41 53
Female * .4 5 .. 34Pupil-teacher ratio: primary pupils per techer 6 62 53 40 39Pupil-teacher ratio: secondary 22 40 40 .. 20Pupils icachinggrdc 4 lbor'cobort A. .. 51Repeater rat primary b of tota emnrl 2s 24Illiteracy % of pop.(agel15+) .. 72 67 04 19"Fealne %Of felL (qcp + ..0 84 79 62 53 7
New7ajecircidation a thou.rP 86 5 12..7word bnk nmmfiaW BonoicgDeparment. APM I95
237

MyanmarMmw &me regioIncome group Nart
Watest sInglc yar cent higherUna of estname &kst law- Income
Indicator ecm re 1970.75 19004S 198843 Asia Incne group
Piority Povert IndicatorsPOVERTYUpper poverty line lIo cur .. ..C..
Headcountindex %ofpop. .. .. _ 12 19Lower poverty line local curr. .. ..
Headcount indx % of pop. .. 9. .. 9 .. ..
GNP pcr capita US$ .. .. .. 820 380 1.590
SHORT TERM INCOME INDICATORSUrskilled urban wages local curr. .. ..
Urskilled nual wagesRural trms of trdeConsumer price index 1987=100 49 73 369
Lower incomeFood'
Urban 74 432Rural
SOCIAL INDICATORSPublic expenditure on basic social services % oIfGDP .. 7_Gross enrollment ratosPrimna school age pop. 83 9°8 10 118 108 104
Male qR6 101 107 123 116Female 80 96 104 115 101
MortalityInfantuotrality perthou.livebirths 1220 106.0 81.6 3S5. 63.1 39.0Under5monmdity .. .. 111.0 60.5 101.4 61.5
ImmuniuationMkasles b age group .. .. 73.0 93.0 87.3 77.6DP .. 16 69.0 95.0 89.9 822
Child malnutrition (under-S) .. 42.0 32.4 24.1 40.3liFe expectancy
Total years 50 53 58 68 62 67Femde advntage" 3.1 3.2 3.3 3.6 2.1 S.9
Total fertility rate birhs per woman 5.8 4.9 4.1 2.3 3.6 2.9Mzernul motality rat per 100.000 ive births .. 150 .. 116 ..
Supplementary Poverty IndicatorsExpenditures on soial security % of total gov't exp. 0.2 0.3 OA.Social security covage % econ. acbve pop. .. .. _ .. ..
Access to safe wae total % of pop. 17.0 26.9 32.5 67.1 67.0Urban 31.0 36.0 42.6 83.5 78.7 Rundr 14.0 24.0 29.2 61.3 62.0 _
Access to halth cam .. 48.0
Population growth rate GNP per capita growth rate Development diamoneb
6+ (annual average, paet) 5ua a (e ay c,pelX7
4 --
2- 0 | * | E § | | | l l per I7<Fl | t p ptmy
capita enrollment7 P v l 772 97t5 19o5 1939 Access to safe waoe1970-75 198045 198-93 1970-75 19085 1988-93
f Myanmar Mymar- LoncDme Low-income
& Seethe tedhnicanolans. p.387. b.The drvelopmentdiamond.based onfourkeyindicmorsshows Ieaveagelevelof dvelopmentin thecountrycompared with its income group. See the intrnductionL
238

MyanmarMel Same regio Wisem grOup Nexw
Laters. year rewl- higherUnit f Stink EwE Law- income
Indicatar meacnr 1970.75 1989485 1988493 Asia lacoe. group
Resources and ExpendituresHUMAN RESOURCESPopulation (nre=1993) thousands 30.441 37,544 44,596 1,713,883 3,091.764 1,096,665Age dependrncy ratio ratio 0.80 0.76 0.71 0.54 0.67 0.69Urban % or pop. 23.9 24.0 25.6 31.3 27.6 54.7Population growth rate annual % 2.3 2.1 2.2 IA 1.9 1.6
Urban 3.3 2.1 3.3 4.0 3.9 2.9Labor force (15-64) thousands 13,559 16.699 19,338 942.977 1.442.452 459,196Agriculture % of lobor folce 56 53Industry 17 19Female 39 38 36 41 33 31Females per I00 males
Urban numbcr 103 102Rural 103 104
NATURAL RESOURCESArea thou. sq. km 676.58 676.58 676358 16,367.91 39.091.96 4D,682.67Density pop. per sq. km 44.99 55.49 6450 10327 77.60 26.52Agricultural land % of lad ana 15.73 15.86 15.81 44.21 52.82 39.61Change in agricultural land annual 0.14 0507 -0.17 0.24 0.03 -0.13Agricultura land underirrigation % 9.43 10.40 9.60 14.68 18.02 12.66Foits and woodland thou. sq. km .. 0.33 0.29 4.06 7.15 5.95Deloresiarion (net) annual % .. .. 1.29
INCOMEHousehold incomeSha ofr top 20O of households % of ineome 40 ..Sham of bonom 40% of housebolds ' 21 ..
Shar of bottom 20% of households S 8 ..
EXPENDrrUREFood % ofCP .. ..G
StapicsMcatl fish, milk. cheese. eggs
Cea imports thou. mctric tones 9 7 5 30,036 34.420 66.281Food aid in ereis 9 6 .. 447 8.334 5.477Foodproductionpercapim 1987=1WD I4 108 102 115 113 101Fertilizerconsumption kgIha 5.3 18.6 6.6 76.4 59.9 48.0Share of agricaltu in GDP %ofGDP 47.1 482 63.0 17.1 26.3 15.7HnusIg % of GDP .. ..
Average househlud size persons per household .. ..
Urban .Fixed investment housing % of GDP .. ..
Fue and power % ofCDP .. ..
Eargy consurnptiunpercapita kgofoilequiv. 47 60 39 632 364 1,595Households with electricityUrban * of households .. .. .. .. .Rural
Tansport and commwneatlon % of GDP .. ..
Fixed investment trmspot equipmentTotal road length thou. km 22 23
INVESTME IN HUMAN CAPITALHelDthPopulation pei physiian persons 8,819 3,743 12897 1,063 .. 277Population per nurse 3,053 903 1,241 1,490Population perhospital bed 1,176 1.17D 1,590 612 1.016 604Ora rehydyration therapy (under-5) % oflcases .. .. 19 32 38EdiuentlonGoss enrollment ratioSecondary %ofschool-agepop. 21 23 20 53 41 53
Female * 19 .. .. 47 34Pupil-teacher rado: primary pupils per tacher 52 .. .. 23 39Pupil-teacherzutio: sewnay * 39 24 20 16 20Pupils eaching grade 4 *ofcohort 49 .. .. 92Repeater rate: primy * of total enrol 20 .. .. 6Ifliteacy %ofpop.(agBlP45) 29 22 19 22 41 19
Fcmale % of fm (agc 1S+) 31 28 36 53NewsJap'er circulation perthbou. pop. 10 14 7 .. - 74wona u intrin Econonas Departmen Apr 1995
239

NanibiaMost Sen ngile/lacie graop Hen
bLaest single ye"r recent S_& Lower1 higherUR ef estimte Sehar mIM& Income
Inator sme 19709-75 198945 19183 Africa Inco r
Priority Poverty IndicatorsPOVERTYUpper poverty line local cur. .. ..Headcount index S of pop. .. ..
Lower poverty line local curr. .. ..
Headcount index %of pop. .. ..
GNP per capiw USS .. 1,050 1,820 520 1.590 4.350SHORT TERM INCOME INDICATORSUnsidlled urban wages local cuir. .. ..UnuDled rmral was_Ruralutk s of auk.Consumer price index 1987=100 78 208
Lower incomeFooe
UrbanRual.
SOCAL INDICATORSPublic expenditure on basic socal service % of GDP .. .Gross earunmnratiosPrimary % shool age pop. .. 124 67 104 105Malt .. .. 121 74Fecale .. .. 127 60 -
MoralityInfant morlity per ou. live biths 113.0 84.0 58.6 93.1 39D0 35.8UnderS mortality .. .. '79.0 172.3 61.5 42.6
ImmunizationMeasles % ag group .- - .. 49.9 77.6 82'0DPT 5 1. .. .. 51.9 82.2 74.2
Child nmalnutritian (underS) 'Life expectanc
TOt yeas 49 54 59 52 67 69Female advantage 2.5 2.5 2.5 3.3 5.9 5.9
Totalfetility rts birhs per woman 6.0 5.8 5.2 6.2 2.9 2.9Matrnal mortlity me per 100.000 live birdts .. ..
Supplementary Poverty IndicatorsExpenditucs on social security S of tIol gaexp. .. .. 6.9 .. .Soci s eculrit coverage S econ ac:tive pO,D. .. .. .. .. p.Access to safe wat totl % of pop. .. .. .. .. .. 86.7
Urban .. .. .. .. .. 93.9Rural .. .. .. .. .. 66.7
Acccss in health care .
Population growth rate GNP per capita growth rate Development diamondb
6' (anmual avene pecent) (annual Raarg, perent) Lr expectancy
4
|IGNP _ Gmss2- per -iarcapita
-21970-75 1980-US 1988-93 1970.75 1980-85 1988-93 Access to safewaer
[J Namibia _ Nantibia- Lo .nco-if wml - Lower-ridl-inome
a Seethe techical noa, p37. b. IT devopmna diamond, bsed on four key indiao shows th avne level ofdevelopmeat in dhe ountycopred with its incme grop. See te introduc
240
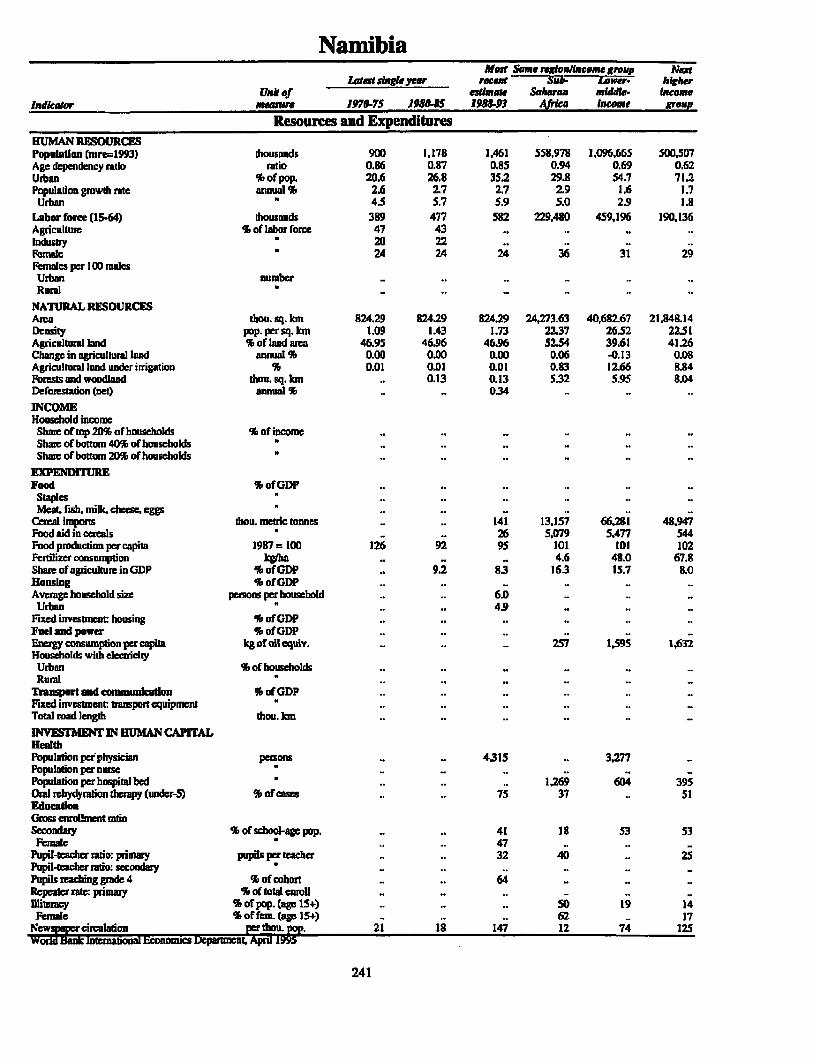
NamnibiaMost So,. reaio./lcoea group ALext
LaC snisINrle ar recent Sub- Lawn.- higherU.k of etilme Sahama middle- Income
Indkcator xmaurn l1979-75 198-US 1988-93 Africa Incomne -groupResources and Expenditures
HUMAN RESOURCESPopulation (nare=1993) thOUSAndS 900 1,178 1.461 558.978 1.096,665 500.507Age dependency rato ratio 0.86 0.87 0.85 0.94 0.69 0.62Urban % of pop. 20.6 36.8 35.2 29.8 54.7 71.2Population growth rate annualS% 2.6 2.7 2.7 2.9 1.6 1.7urban 3 4.5 5.7 5.9 5.0 2.9 1.3
Labor force (15.64) thousands 389 477 582 229,430 459.196 190.136Agriculture S of labor rorce 47 43... Industry 20 22 33'Femade *24 24246319Females per I1OD malesUrban number...Rural3
NATURAL RESOURCESArea thou. sq. kmn 824.29 824.29 324.29 24,273.63 40,682.67 21.848.14Density pop. per sq. kcm 1.09 1.43 1.73 22.37 26.52 22.51Agricultuilnd Sm %of lnd area 46.95 46.96 46.96 52.54 39.61 41.26Change in ngrculwurl land annualS% 0.00 0.00 0.00 0.06 -0.13 0.08Agricultural land under inrigation S 0.01 0.01 0.01 0.83 12.66 EL84Forcsts and woodland thou. sq. kmin 0.13 0.13 5.32 5.95 8.04Deforestation (net) annual S .. 0.34INCONEHousehold ianicm
Share of top 2D% or households S Of incoDMe .
Share of bottom 40% of households...Share of bottomn 20% of households...
EXPENDffUREFood % ofGDP...
Staples Meat, fish, mfilk cheese eggs
Ceral import thou. metric tours ... 141 13,157 66.281 48.947Food aid in cereals ... 26 5,079 5.477 544Food production per capita 1987= 100 126 92 95 101 101 102Fertilizer consumption kg/a .... 4.6 48.0 67.8Sham of agicukturein GDP %ofGDP. 9.2 8.3 16.3 15.7 tO0Housing S of GD?P..Average howsehold size persons per household ... 61D
Urban ... 4.9Fixed investment housing S of GDP..Fuel an power SofGDP...Energ consumpfion per caita kg of oil equiv. ... . 257 1,595 1,632Households with electricity
Urban Sof households...Runa]
Transport mDd conmununeatm *of GDP. .
Fixed investment transpor equipmentTotal road length thou. km...INVESTMEENT IN HUMAN CAPITALEHealthPopulation perephysician persons ... 4.315 .. 3.277Population per nursePopulation per hospital bed .... 1.269 604 395Oral rchydyration therapy (undcr-5) S of cases ... 75 37 .. SIRinmeaonGross enrollment ratioSeowndary % of school-age pop. ... 41 18 53 53Female-. . 47
Pupil-teacher ratio: primary pupiLs per teacher ... 32 40 7 2Pupil-teacher rw.ati:scondaryPupils reaching gradc 4 of cohort ... 64Repeate ratc pxinmay % of total enroil...Iliterac % ofpop. (am lS+) SD....5 19 14Fenule Sof fem. (age 15..) - . . 62 -- 17
Ner=ercircuiatoio pe tou. nom. 21 18 147 12 74 125wonamm jmmumi EcnomiDepvarmecnt. ApraI9I
241

NepalMast Same regiAoucin.ouw a p Next
least abih year recet kigiUni kwO eUtnmie South Law. jutesme
Indicator measure 1970-7S 19J0-S 198593 Asia hIcome group
Priority Poverty IndicatorsPOVERTYUpper poverty line locl curr. .. .. 3.2.Hcadcount indcx % ofpop. .. .. .. 2K 19
Lowerpovdty line oal curr. .. .. 2.520Headcount indcx % of pop. .. ..
GNPprcapita USS 120 160 190 310 380 1,590
SHORT TERM INCOME INDICATORSUnskilled hban wages local curr. .. ..Unskillcd nul wagesRural enms ortradeConsumer price index 1987=100 36 76 197
Lower incomleFoogt 24 73 178 .. ..UrbanRunrl
SOCIAL INDICATORSPubEc expenditure on basic social services % of GDP .. 3.1 1.8Gross enollment ratiosPrimauy %school age pop 51 82 102 106 108 104
Male 86 110 121 118 116Female 16 Sl 81 93 101
MortalityInfantmorWlity pr thoua.fivebirths 153.0 122.0 96A 83.7 63.1 39.0UnderS mortality .. .. 128.0 123.9 lOL4 61.5
lmunizatiouMeasles % age grOup .. 34.0 63.0 85.8 97.3 77.6DPO .. 32.0 74.0 90.2 99.9 82.2
Child malnutrition (under-5) 5 69.6 .. SOO 60.4 40.3LifeexpectyTotal years 43 48 54 60 62 67Fealeadvanitage -1.5 -1.5 -a8 0.4 2.1 5.9
Total fetlity rate births per woman 6.3 6.4 5.3 4.0 3.6 2.9Matwmal mortality rate per 100I,0O live birits .. .. .. 420
Supplementary Poverty IndicatorsExpenditures on social security of total govt exp. 0.6 0.7Social security coverage % eaeo. active pop. .. ..
Accesstosafewat total %of pop. 8.0 28.3 363 695 67.0Urban 85.0 71.0 62.0 73.8 78.7Rual * 5.0 25.0 38.0 67.2 62.0
Acwesstoleathcamc .. 10.0 .. 95.8
Population growth rate GNP p capita growth rate Development diamondl
- (aual avemra percent) (an|al avrg, percen) L e
4 5 5 -
2 GNP JGros
-2 1970-75 1980-85 l998-93 1970-75 1980-8S 1989-93 Acncsssafwater
f Nepal d Nepal- Low-inorxm Low-icoma
a. See the duical noles, p.387. b. The developmecnt diamond, based on four key indicas shows the aveae lcvel of devdopment in the coutarycompared with its income grup. Sea the introduction.
242

NepalMam Same regen/nceme groujp Mart
Lwet vi ingle Oem rween hiigherUnit Of ustlaaimie sonth Lo1w1 Income
Indicator measure 1.971-75 J.980-85 19M-93 Asia incoes grup
Resources and ExpendituresHUMAN RESOURCESPopulatim' (mrx-1993) thousads. 13.006 16.975 20.812 1.193.503 3.091.764 1.096.665Age dependency untie ratio 0.84 0.81 0.15 0174 0.67 0.69Urban % ofpop. 5.0 8.5 12.6 25.7 27.6 54.7Populaton growth rate annual Ii 2.5 2.6 2.6 2.1 1.9 1.6
Urban 7.0 7.5 7.2 3.5 3.9 2.9Labor force (1S-64) thousimnds 5.588 6.870 1.271 437.138 1,442452 459.196Agriculture %oflabor foree 93 93Industry I IFcanne 35 34 33 22 3'3 31Females per 100 males
Urban number 79 86Rurel 101 99
NATURAL RESOURCE3Arca uhou. sq. kmn 140.80 140.80 140.80 5,133.49 39,091.96 40.682.67Densiuy pop. per sl. kmn 92237 120.56 144.02 227355 77.60 26.52Agricultural land % of land are 30.16 31.48 31.83 59.03 5282 39.61Change in agriultural land annual % 0.34 0.42 0.02 0.00 0.03 -0.13Agricultural land under irnigation % 5.57 17.65 19.52 29.34 13.02 12.66Pomsrs and woodland thou. sq. kmi. 0.06 0.05 0.66 7.15 5.95Defuxestadon (net) annual I... 1.02INCOMEHorusehold icooin
Share of top 20% of households % of income . 40 . ..
Shar of bottom 4D% of housebolds '..22 . ..
Share of bottomn 2D% of households .. 9
Food % ofOGDP .. 52.0 . ..
staplesMmz fish, milk. cheese. cog
Cerel import tho. metric tounes 18 10 27 6,211i 34,420 66.28'1Food aid incmewas N6 9 15 1,624 8.334 5.477Food prodution per capitra 1917=100 105 97 104 Ill 113 201Feziilizeroansunplion kglha 3.0 10.1 21.1 70.2 59.9 48.0Sham of agriculture in GDP S of ODP 69.0 48.9 40.9 27A4 26.3 15.7Hoasing % ofOGDP .. 12.8 . .-
Avenge household size perons per hoDusehold 6.0 6.0urban .. 5.5
Fixed investment housing S of GDP'...Fueldsidpower SofCIDP .. 5.7Energy consumuption percapita kg of oilecquiv. 914 22 216 364 1.595Households wtub elecuricisy
Urban % of households .. 50.6Rural .. 4.6
Transport and cmnmuualcatlom S of GDP .. 1.1Fixed investncrnt transport equipmeintTotal road length thou.kmn 3 68INVESTMENT IN HUMAN CAPiAL
HealthPopulation per physician person 52,060 30,752 16,106 2,80 . 3,277Populatioanper nurse 17,950 4,75B 2.300Population per hospital bed 7,191 5.820 6.499 1,638 1,016 604Oral whydyralon therapy (under-5) % or'ac ... 14 37 38EduotlonGross enrolment ratioSecondary Sof school-agepop. 1 3 26 36 40 41 53
Female 4 1 2 23 29 34Pupil-teacher ratio: primary pupils per tahchr 29 31 39 6 1 39Pupil-teacher ratio: seconzy * 1 ... 26 20Pupils reahing grade 4 % Of cohort - .
Repeater ratf- prmary S of tota enroll - . 1. Illiteracy % of pop. (Spel5+) 81 71 74 54 41 19
Female * of fan.(age15+) .. 9 37 69 53News= circulation per thou.op 7FE 7 26 - 74wnould Bak nmralsonal Economics Depaitnet. April 199
243

NetherlandsMest Sameregluincemegroup
laid single Y recextunit of eulimne High-
IndIcetor measure 1970-75 198045 19J8-93 income
Priority Poverty IndicatorsPOVERTYUpper poverty line local cur.
Headwount index % or pop.Lower poverty line local cur.
Headcouns index % of pop.GNP per capita USS 6.670 9.190 20.950 23.610SHORT TERM INCOME INDICATORSUnskilled urban wages local cuor.Unskilled rural wagesRural terms of uadeConsumerpriceindex 1987=10D 61 101 114Lower incomeFoodo S .. 102 IIIUsbar.*. . ..Rural*......
SOCIAL INDICATORSPublic expenditure on basic social services % orGDPGross enrollnent ratiocPrimary % school age pop. 98 114 98 103
Male ' 98 113 96 103Fenale ' 99 115 99 103
MortalityInfant nortality pcr thou. live births 12.0 9.0 6.8 7.0Undcr 5 mortality ' .. .. 8.0 85
ImmunizationMeasles % ag group .. 80.0 94.0 82.5DPT .. 96.0 97.0 90.2
Child malnutrition (under-5)Life expectancyTotal years 74 76 77 77Femaleadvantage 5.9 6.6 6.0 6A
Totalfertilityrate birthaperwonan 2.0 1.5 1.6 1.7Matenl mortality rate per 100,000 live births .. 5 -
Supplementary Poverty IndicatorsExpenditures on social security % of total gov exp. 343 34.9 34.6Social scaiity covenge % econ. active pop.Accesstosafewaw.etotal % of pop. .. 100.0 100.0
Urban .. 00.0 100.0Rul 100.0 100.0
Access to health eawe 100.0 1.0
Population growth rate GNP per capita growth r..': Development diamondb(annual avage percent) (annual avenge. percent) Lifeaexpetancy
4 5-
2 0 Jflii~~~~~~~~~~~~~i-~~~ O~NP Grossper pinrmsy
IcaIL enrollment
-2 -101970-75 1980-85 1981-93 1970-75 1980-95 19B8-93 Acstosafewater
2 Netherlands _ Netherlands- High-i me High-income
a. See the tenica nowtes. p387. b. The developmnt diamond based on fbarkey indicators, shows the aveage leve of devdopment in die countycompaed with its inconm group. See the inoduction
244

NetherlandsMos Saet e cerp
LatestsbngXe yer recent Unit of e1sa11 ffgh-
Indicalor measureJ 1970-75 Z1951-g55 198J93 5ncome
Resources and ExpendituresHUMAN RESOURCESPopulation (mre=1993) thousands 13,653 14,492 15,2R0 812.447Age dependency ratio ratio 0.57 0.46 046 0.49Urban Ii of pop. 88.4 S8.5 88.9 779Pbpulation growth rate annual % 0.9 0.5 0.7 0.6
Urban 1.5 05 0.8 0.8Labor foc (lS.64) theosands 5,111 5,861 6.236 395,641Agriculture % of labor force 6 6Industry 35 31Female 29 31 33 38Feimales per 100 mnales
Urban number 100 99Rural r 94 94
NATURAL RESOURCESArea thou. sq. km 37.33 37.33 37.33 32,146.15Density pop. prrsq. bn 36574 38821 40638 25.11Agricultural land % of land area 61.58 5952 58.55 42.30Change in agricultural land annual -0.57 0.15 -025 -0.48Agicultural land under inigation $ 20.65 2625 28.20 13.96FoIsts and woodland tou. sq. km . 0.00 0.00 10.56Deforestation (net) annual % .0.30
INCOMEHousehold income
Sham of top 20% of households % of income 37Share of bottom 40% of households * 22Share of bontom 20% of households * 9
EXPbENDlITUREFood % of GDP 10.6 9.2 8.4 8.4
Staples 1.8 1.6 1A 1.6Meat. fish, mik, cheese, eggs r 5.0 4.0 3.8 3.3
Caeal imports thou. metic tonnes 8,838 5. 4,431 77.530Food aid in cerals .. .. .. 8Food production percapita 1987 =100 82 96 102 95Ferilizer consumption kgfa 304.9 347.1 273A 150.0Share f apicultum in GDP % of GDP .. .. 3.6Housing %ofGDP 7.9 12.1 10.8 11.7Averge houschold size pewns per household 3.2
UrbanFixed investmen housing %ofGDP 4.3 3.1 5.4 5.0Fuel and power * of GDP 2.4 4.0 23 2.0Energy consumption per capita kg of oil equiv. 4.360 4,228 4.533 5,203Households with electricityUrban % of householdsRural
Transport and cornmnkadon %ofGDP 6.1 6.6 6.5 8.8Faxed investannt transport equipment ' 2.6 2.9 2.7 2.1Total roadlegth hou. km 86 110 105
INVESTMIE IN HUMAN CAPITALHealthPopulation per physician persons 800 450 412 453Population per nurse 302 167Population per hospital bed ' 94 80 170 145Oral rehydyration therapy (under-5) S of casesEducatIonGrss enrollmemt ratioSecondary % ofschool-aepop. 88 104 97 92
Femal 84 102 96 94Pupil-teadcer ratio: primary pupils per teacher 28 19Pupil-teacher ratio: secondary 16 15Pupils maching grade 4 % of cohort 98 96Repuerate: primary * OfttaWl nlm1 2 2Illitracy % ofpop. (ago 15+) .. .. t
Female % of fnL (age S4+) .. - tNewsp circulton per thou e pOp 30 310 303 320world kank Inmemnnoal Econocs Depamen April 19Y5
245

Netherlanids AntillesMori Same re*gio Yncomegroup Next
Watusi"JOW lapW rueml Lain Upej - b4herUMb of utimate Amerika middk- Inome
Indicaeor meaure 1970.75 19*0 58 19J .93 Cadhbisn inomc grDap
Priority Poverty IndicatorsPOVERTYUpper povety line lod cuir.
Headcount indcx % ofpop. .. ..
Lower povesty line local curr. ..Headcount indcx % orpop. .. ..
GNP per capita USS .. 2.930 4.350 23,680SHORT TERM INCOME INDICATORSUnskiled uFbiu wages local curr.Unskilled nfrl wagesRural terms of tradeConsuma priceindex 1997=100 49 95 119Lowerincome ".Food'
Urban .. 94 141Rural
SOCL LINDICATORSPublic expenditure on basic social services % of GDP .. ..
Grins enrollment ratiosPrimoty %schoolagepop. .. .. .. 107 105 IMMale .. .. .. .. .. 103Female .. .. .. .. .. 103
MortlityInfant mortity per thou.live births 44.0 25.0 18.6 43.0 35.8 7.0Under S mortality 5.. .. .. 2.2 42.6 8.5
ImmunizationMeasles % ag group .. .. .. 78.7 82.0 82.5DPT* .. .. .. 73.7 74.2 90.2
Child mninutrition (under-5)Lif expectncy
Total yaus 66 71 73 69 69 77Fenale advanla' 5.B 5.0 5.0 5.3 5.9 6A
Totw fertility rate birfs pcr wwanm 2.7 2.3 2.1 3.1 2.9 1.7Matenal mortity rate per 100.000 live births - .. .. .. .
Supplementary Poverty 1ndicatorsExpenditueson socialseAmity % oftowalgoFtexp. 8.5 13.8 34.1Social sectuity covemage % econ. a"tive pop. .. ..
Access to safe water total % of pop. .. .. .. 80.0 86.7Udan '.. .. .. 90.1 93.9Rual 5 .. .. 7.6 66.7
Access to health carc '_._.._.._.._.._..
Population growth rate GNP per capita growth rate Development diamondb(annual average. p=et) (Mmmal up pezent)
4
2 G GNP Gross0 I per - ~~~~~~~~~~~~~~1primmy
c1apita enrollmnt0 ~~~~~~~~~~~~~-5
-2 -10 J
1970-75 1990-95 198B-93 1970-75 1980-85 1988-93 Acce, to saf watr
2 Nctherlands Antilles _ Netherlands Antiles- Upper-middlemincom -e Upper-middlce-incom
a. See the tecdnical noteS p.387. b. The development dianonrl bused on four key indicators shows the average leve of devlopmm in dz comtnycompared with its income group. See the introduction.
246

Netherlands AntillesUwet Lain reglienluaem egroup Nextf
Lanes clngleyw n~eant LT U i higherUnit of estimate Amerkca mulddk- Income
Indleoh.r imeaure 1970-75 198045 .1958-93 Caribbemn Income grompResources anid Expenditures
NEUMAN REOURCFS]Population (unre=-193) thousands 166 182 195 466.304 500.507 812,447Age dependency matio rAdio 0.64 0.52 OAR 0.66 0.62 0A49Urban % of pop. 67.9 67.9 69.1 71.2 71.2 77.9Population grawlb rate annual 1, 0.9 0.9 0.9 2.0 1.7 0.6
Urbakn 0.9 0.9 1.2 1.9 1.s 0.8Labor rorce. (IS-64) thousands ... . 169.839 190.136 395,641Agriculture S or labor force . ..
Industry '
Female ...... 27 29 31Females per 100 miales
Urban number . ..
RuralNATURAL RESOURCESArea thou. sq. kmn 0.m 0.80 0.80 203505.92 21,148.14 32446.15Density pop. per sq. km 207.50 227.50 241.94 22.29 22.51 25.11Agriculturml land St of land are 10.00 10.00 l0.00 40.00 41.26 42.80Change in agricultural land annual St o.0o 0.00 0.00 0.39 0.01 -0.41Agricultural land under irrigation %t. .. 3.41 8.84 13.96Forests and woodland thou. sq. km .. 0.00 0.00 9.87 8.04 10.56Deforestation (net) annual St... -0.51INCOMEHousehold incomeShare of top 20% of households % of income . ..
Shame of bottom 40% of householdsShare of bottom 20% of households
ElFENDITUREFood StofGDP ... .A. . t
Staples ... .. .1.6
Meat, fish, milk., cheese. eggs. .. .. 3.8Ceral imports thou, amtrie tonnes 27 28 32 27,700 411,947 77,530Food Aid in cereas .. 0 . 1,565 544 1Food production percapita 1917=10DO 436 251 136 101 102 95Fertilizer consumpdion kglh . .. 16.1 67.8 150.0Share of agriculture in GDP St of GDP ... . 9.0 8.0Housing StofGDP 11. . . . l.7Average household size persons per household . ..
Urban N. ..
Fixed invesunen housing %.Of GDP ... .. . 5.Fuel and power St of GDP ... .. . 2.0Energ consumption per capita kg of oil equiv. 23.367 10.038 10.678 913 1.632 5,203Households with elecuticity
Urban St of households . ..
RuralTransport and conmununlatlon St orGDP . .. .. .Fixed investment transport equipment ... .. . 2.1Total road length thou. kmn. ..
ENVEsTMENT IN HUtMAN CAPITALHealthPopulation per phiysician persons 1.325 ...... 453Populaton per nursePopulaton per hospital bed N I... 517 395 145Oral rehydyraton therapy (under-5) St of eases. .. 61 SiEducatlanGros enrllment ratioSecondary St Of SChDool-ag POP. ... 47 53 92Femal . ...-. 94
Pupil-teacher mdo: prnwuy pupils per teacher 36 .. 26 25Pupil-teacher ratio: secoondary 22 16I. Pupils neaching gmde 4 % of cohort . ..
Repeater ratm primary S Of total emtl . .
Uliftracy % Of pOp. (age 154-) 8 .. 51Female % of fem (agel15-a) ...... 17
Newt= ~ r eireuation pe thou. po. 325 294 289 95 125 320world jmk ltematonal Eonomisa±tznent April 1995
247

New CaledoniaMors Sameregi enbncome grou" Next
Leastsinglejer rcent r. Upper- higherUnit of eurtlaeu Eat middle. income
Indiafor measure 19709-75 1 P-aS 1988-93 Asia income groupPriority Poverty Indicators
POVERTYUpper pwveny line ocal cuar.Hcadcounitindex %ofpop. 12
Lower poveny line local cur.Headcount index 9 of pop . ,, 9
CNPpercapita US$ 820 4,350 23,680SHORT TERM INCOME INDICATORSUnskilled urban wages local curr. ,Unskilled nmtl wagesRural tcrms of t..deConsuntcrprice index 1987=100 98Lower incomnFootf 26
Urban 102 119Rural
SOCIAL INDICATORSPublic expendikuac on basic social scrvices % of GDPGross enrollment ratiosPrimary % school ag pop. 118 105 103Male .. .. .. 123 103Female * 115 103
MortlTityInfant mortality per thou. ive births 53.0 31.0 21.2 355 35.8 7.0Under 5 mortality . 60.5 42.6 8.5
ImmunizationMeasles S age group 15.0 93.0 82'0 82.DPT .. 76.0 95.0 74.2 90.2Mdid malnutriton (under-5) " 241Life expectancyTotal years 64 69 72 68 69 77Female advantage 5.0 5.0 5.0 3.6 5.9 6A
Total ferility rate births per woman 4.9 3.1 2.7 23 29 1.7Mmtemal mortality rate per I10.000 live births .. .. .. 116
Supplementary Poverty IndicatorsExpenditures on social security % of tot gov't exp. .. ..Social security coveage % econ. active pop. .. ..
Access to safe water total % Df pop. .. .. .. 67.1 86.7Urban * .. .. 83.5 93.9Ruml * .. .. 61.3 66.7
Access to hcalth cat " .. .. .. .. ....
Population growth rate GNP per capita growth rate Development diamond't(amnun average. prcent) (annua averge, pecnt) Life oetancy
4 5
2 0 __-_______°__-_____________ OGNP mpn
capita earollment0 _F],-2 -10 Acs osf o
1970-75 1980-85 1988-93 1970-75 1980-85 1918-93 A to safe waer
1 New Caiedonia - New CaledniaUppcr-iddle-income - Upper-middle-inoome
a. See die thical notes. p.387. b. The developnot diamond, based on four key indicators, shows the average level of development in the countrycompaed with its income group. See the introduction.
248

New CaledoniaMas: S e reg re N*
l itssuInML!, recedI Ufpper higherUN& of PEs .m f mkw hjg w e £m
Indicator seaslm 1970-75 1905 198893 Asxi Incern group
Resources and ExpendituresHUMAN RFSOURCESPopuilatIon (mrel993) thousands 133 15S 176 1,713,883 500.507 812,447Age dependency raio maio 0.77 0.67 0.58 0.54 0.62 0.49Urban %of pop. 52.9 57.9 61.2 31.3 71.2 77.9Population growlh rate annual l 4.2 1.6 1.5 1A 1.7 0.6Urban 4.5 2.5 2.2 4.0 1.8 0.8
Labor force (15.64) thousands ,, 942.977 190.136 395,641Agriculture % of labor forccIndusry'Fcmuak . , 41 29 38Femrals per 100 malesUrban number .. ..Rural
NATURAL RESOURCESAre. thou.sq.lam 18.58 18.58 18.58 16,367.91 21,848.14 32,146.15Density pop. per sq. km 7.16 8.34 9.32 103.27 22.51 25.11Agdcultural land * of land ama 14.44 15.21 12.53 44.21 41.26 42.80Change in agricullural land annual * 0.00 -A14 0.00 0.24 0.08 -0.48Agdcultural land under irrigation lb 14.68 8.84 13.96Forsts and woodland thou. sq. km 0.01 0.01 4.06 8.04 10.56Dcfowrstation (nct) annual * 0.00INCOMEHousehold incomeShare of top 20% of houscholds % or incomeShare of bottom 40% of householdsShare of bottom 20% of households
EXPENDITUREFeod %ofGDP .. ,. ,, .. .. 1AStaples .. .. .. .. .. 1.6MeaL fish milk, chcese, eggs .. .. .. .. .. 3.8
Cereal impams thou. metric tonics 17 26 32 30,036 48,947 77,530Food aid in ccerals .. .. .. 447 544 8Foodproductionpcrcapita 1987= lrJ 120 120 9B llS 102 95Fertilierconsumption kg/ha 2.4 1.4 4.8 76.4 t67.8 IS0.0Share of agriculture in GDP % of GDP .. .. .. 17.1 8.0Housing *bof GDP .. .. .. .. .. 11.7Average household size persons per household .. ..
UrbanFixed investment: housing *of GDP .. .. .. .. .. 5.0Fuel and power * of GDP .. .. .. .. .. 2.0Energy consumption per capita kg of oil equiv. 6.857 3,684 3.391 632 1.632 5.203Households with elecicity
Urban % of households .. .. _Rural
Transport and conmmunialon %of GDP .. .. _ .. .. 8.8Fixed investment tansport equipment .. .. .. .. 2.1Total road length tbou.In 5 6 kINVESTMENT IN HUMAN CAPITALHealthPopulaion per physician persons .. 1,580 .. 1,063 _ 453Population per nurse .. 429 1,490 .Populaion per hospital bed .. .. .. 612 395 145Oral rehydyraton therapy (under-5) * of cases .. .. .. 32 51EductionGross enrollment ratioSaeodary % of school-age pop. .. .. .. 53 53 92
Female .. .. .. 47 .. 94Pupil-teacher ratio: primary pupils per teacher 17 20 20 23 25Pupil-teacher ratio: secondary 1S 14 .. 16Pupils eaching grade 4 % of cohort 82 88 99 92Repeat rmte: pimay % of total enril 10 17 17 6Illiteracy % of pop. (agc 15+) .. .. .. 22 14
Female % offem.(agel-5+) .. .. .. 36 17Newspapercirculation rthouj pop. 135 123 133 .. 125 320Wond itor lnk Innza Econies DqM =t, AprU IVY25

New ZealandMot Sameo b N WINcoM frresp
atlltJ{I titru tUfnIf WIIJI Riak.
Indilcator "mue 19m7 1N 8 IM&93 le
Priority Poverty IndicatorsPOVERTYUpper poverly line lcal curr,Headcount Index % of pop,
Lower poverty lime loc.il curr,Headcounl indx % or pop.
GNP per capita USS 5.020 6,770 12.600 23.680SIIORT TERM INCOME INDICATORSUnskilled urMban wages local curr.Unskilled rural wags"Ruial tlens of trade r
Consunmer prce Index 1987u100 22 76 125Lower InconeiFood5 14 79 125UrbanRural
SOCIAL INDICATORSPublic expenditure on baic socila services % ofGDP.Grss enrallmcnt ratosPdmary %school BePpop. 106 107 104 103Male '107 108 104 103Ferakl 106 106 103 103
MortalityInfant rnortaEly per thou. live births 16.0 12.0 8.8 7.0Under 5 morality .. .. 12.0 8.5
ImmunizationMeasIe %s Ogroup .. 71.0 82.0 82.5DPr .. 72.0 81.0 90.2
Child nalnutiition (under-5)Life expctancyTotal years 72 74 76 77Femalcadvntap * 6.1 6.2 6.1 6A
Total fertility rate births per woman 2.8 2.0 2.2 1.7Matemal mortliry rate per 100,000 live births
Supplementary Poverly IndicatorsExpnediturs on dal soecurity % of total gov'texp. 23.5 29.7 37.3Social security coverapg econ. active pop.Access to safe water tota V. of pop. .. 100.0 97.0
Urban .. 100.0 100.0RunEa .. 100.0 81.8
Access to heath cam .. 100.0 100.0
Population growth rate GNP per capita growth rate Development dimondb(annual avage, parent) (annual avernge, pe=rnt) lifex t
2~~~~~~~~~~~~~~11 - O k" CP > pmm4 5
I ZZ=j ~~~~~~~~ U~NP Gros2 0*. e prinmay
O17 - F1 S * capita enrolent
-2-11970-75 190D-95 198B-93 1970-75 1980-85 1989-93 Acce to safe water
7 New Zend K New Zalnd- HEgl-ficome High-income
a. See te technical noe, p. 387. b. Te de dopme dimnd based on four keidicatr,, shows rdie avera level of elopment in tle couna ycoapeted with its income poup. See the introduction.
250

New ZealandMeat Same regiauuemegroup
Latestsingleyear _ recrantUnit o - estimate Hgh-
Indictor memsure 1970-75 195045 1955-93 incomeResources and Expenditures
HUMAN RESOURCESPopulpan (mre=1993) Ihousands 3.083 3,247 3,4B7 812,447Age dependency ratk ratio 0.63 0.53 0.53 0.49Urban % of pop. 82.1 83.7 85.6 77.9Population growth rate annual S 1.8 0.8 1.2 0.6
Urban 2.2 0.9 1.5 0.8Labor force (S164) thousands 1.240 1,430 1.624 395.641Agricultur % of labor focm 0 0Industry " 0 0Female 32 35 35 38Females per 100 males
Urban number .. 102Rural .. 8S
NATURAL RESOURCESArea thou. sq. km 270.99 270.99 270.99 32,146.15Density pop. per sq. km 11.38 11.98 12.71 25.11Agricutural land % of land mea 52.00 53.70 52.46 42.30Changc in agricultural land annual % 3A0 -056 -047 -0.48Agricultural land under irrigaion % 1.08 1.73 2.03 13.96Forests and woodland thou. sq. km .. .. 0.07 10.56Deforestation (net) annual % ..
INCOMEHousehold income
Sham of top 20% of households % crincomc 41 ,. 36Shirt of botnm 40% of househols I" .. 22Shre of bottom 20% of households 6 .. 9
EXPFNDITUREFood % of GDP .. 7.8 7.7 8.4Staples .. 1.5 1.7 1.6Meat,fish, milk, cheese,seggs ., 3.5 3.1 3.8
Ceeal insxrts thou. metric lonnes 188 77 282 77,530Food aid in cereals . .. .. 8Food pwduclion percapita 1987 100 89 107 97 95Fertilizerconsumption kg/ha 37.0 29.7 37.0 150.0Sbal of agriculta in GDP % Of GDP 10.4 8.8 7.3 ..Housing %ofGDP . 9.0 13.8 11.7Average household size pesons per household 3.6 3.0Urban .
Fimed invesmt housing * of CGDP 6.9 3.6 48 5.0Fud and power % of GDP .. 1.2 1.5 2.0Energy consumption per capita kg of oil equiv. 2.747 3,A48 4,299 5,203Households with electricityUrban % Df households ..
RuralTransport and counnunication %ofGDP .. 123 10.8 8.8Fixed investment tansport equipnen - 5.0 4.6 2A 2.1Total road length thou. nn 93 9^. 93
INVESTMT IN HUMAN CAPITALHealthPopulati.n per physician persons 873 608 .. 453Population per nuse * 153 144Population per bospital bed 99 .. 149 145Oral rhydyration tr-fapy (under-5) % of cascs .. .. ..EductionGross eanollment raboSeconday %ofschool-agepop. Bl 85 84 92Female 81 87 C5 94
Pupil-teacber rdo: primuy pupils per tacher 18 20 16Pupil-teacher mdo: secondary 29 19 15Pupils aching grade 4 '1 of cohort .. 97 98Repea rate: pimawy % of total enroll 3 3Illitacy *of pop. (agelIS3 .. .- t
Femac % of femn. (age 5+) .. .. tNeu irc ulation p thou. . 354 331 305 320
world mmt aenscational E nuim-cs LxTartFaCat. Apni 1
251

NicaraguaMail Sme re&lanineome greap Next
Laes single ear receng tatt higherunit of emitmat America Lown Income
ldka1or UWUre 1970-73 ia80o8s 198l&93 Caribbean Income group
Priority Poverty IndicatorsPOVERTYUpper poverty Iie local curr. .. ..Headcounlindex %orpop. .. .. .. .. 19Lower powrty line local curr. .. ..Headcount index % of pop. .. ..
GNP per capita USS 680 760 340 2.930 380 1.590SHORT TERM INCOME INDICATORSUnskilled wuban wagcs local curt. .. ..Unskilled nmal wagesRural terms of tradeConsumer priec index 1987100 0 1Lowecr income
UrbanRu.ul
SOCIAL INDICATORSPublic expenditure on basic social services %ofGDP .. ..Gross aerollment ti;osPrimay % school a pop. 82 101 102 107 IOB 104Mcl * 80 96 100 .. 116Female 85 107 104 .. 101
MortliyInfantm ouity per thou. live births 10D.0 86.0 50.6 43.0 63.1 39.0Under 5 mortality .. .. 72.0 52.2 101.4 61.5unnunizafionMeaslaes age group .. 30.0 54.0 78. 873 77.6DPI' .. 32.0 71.0 73.7 89.9 82.2
Child muakiutrition (under-5) .. 10.5 11.9 .. 40.3Ufe expectancyTotal years 55 59 67 69 62 67Femaleadvanta 3.1 7.2 3.7 5.3 2.1 5.9
Totalfcrilityrute birdisperwoman 6.8 6.0 4-9 3.1 3.6 2.9Maternal morality rae per 100,000 live births .. 65
Supplementary Poverty IndicatorsExpendiures on social security % of tota got exp. 16.4 3.3 10.3Socirl security covage * econ. active pop. .. ..Access to safe wafer total % of pop. 56.0 48.0 53.2 80.0 67.0
Urban * 100.0 76.0 77.8 90.1 78.7Rural 14.0 13.0 1.9 57.6 62.0
Access to health care _ .. .. .. .. .. ..
Population growth rate GNP per capita growth rate Development diamondb(annualmava, pcent) (amnual average, percent) Lifeexpe ny
4 -- 5
2 0KIiOiFI I U_ Gross
0 _ _ _ _ _ _ _ _ _ _ _ _ _ _ _ _ i.......i ~~~~~~~~~~~~~~~~ i : pt a enro llm ent
-2 -- 101970-75 1980-55 1988-93 1970-75 1980-85 1988-93 Access to safe water
I Ntcangua _ Nicagua- Low-incem - Lw-ibcomc
a. Sec thc teclmical notes p387. b. 7wh develop lt diaond based on four key indicaoxs. shows the average leve of devlopmt in tbe countrycompared with its income group. See the inovducton.
252

NicaraguaMoea Same regloaliacome group Nagi
Lastfligkyew rMcent Lti- hgharUnMt q r f esibnate Ainekae Low- Income
Indcator meaure 1970-75 1980185 1958-93 CaribbJe income POup
Resources and ExpendituresHUMAN RESOURCESPopulatlon (mre1993) thousands 2426 3.9 4,114 466,304 3,091.764 1.096,665Agc depcndency ratio rado 1.02 1.02 0.99 0.66 0.67 0.69Urban %orpop. 50.3 56.6 61.7 71.2 27.6 54.7Population growth rate annual % 3.2 2.8 3.8 2.0 1.9 1.6
Urban ' 4.6 4.0 4.8 1.9 3.9 2.9Labor force (15-64) thosands 722 993 1.354 169.839 1,442,452 459.196Agrculture ¶6 of labor force 49 47Industry 16 16Female * 21 23 26 2 33 31Females per 100 males
Urban number 128 128Rural ' 94 91
NATURAL RESOURCESArea thou. sq. km 130.00 130.00 130.00 20.505.92 39.091.96 40.682.67Density pop. per sq. krn 11.66 24.84 30.48 22.29 77.60 26.52Agricultural land % of land ama 49.09 54.05 57.04 40.0D 52.82 39.61Change in agricultural land annual ¶ 0.87 0.80 0.74 0.39 0.03 -0.13Agricultural land underirrigation % 1.15 1.29 1.30 3.41 18.02 12.66Forests and woodland thou. sq. km .. 0.07 0.06 9.87 7.15 5.95Deforcsttion (net) annual % .. .. 1.86INCOMEHousehold incomeShare of top 20% of households % of income 65 .. 55Sh reof boltom 40% of householdw * 9 .. 12Share of bottom 20% or households 3 .. 4
EXPENDITUREFood % of GDP .. ..
StaplesMeat, fish, milk chese, eggs
Cereal imports thou. motric tonnes 58 103 125 27,700 34.420 66.281Food aid in cereals * 3 43 85 1,565 8,334 5.477Foodproductionpercapita 1987=100 188 117 103 101 113 101Fertilizer consumnption kg/ha 3.3 9.8 4.6 16.1 59.9 48.0Share of agriculture in GDP % ofGDP 22.4 23.7 303 9.0 26.3 15.7Housing %ofGDP .. ..Aveage household size persons per' ousehold .. ..
UrbanFixed investment housing rofGDP .. ..Fuel and power % of GDP .. ..Encrgyconsumptionpercapita kgofoilequiv. 291 271 241 913 364 1.595Households with electricityUrban % of households .. ..Rural , .. ..
Transport and communIicaton % of GDP .. ..Fixed investment tmnsport equipment .Total road length thou. km 18 15 .. .. .. .
INVESTMENT IN HUMAN CAPITALHealthPopulation per physician persons 2,114 1.488 1.492 .. .. 3.277Population per nurse 5.. 30Populationperhospitalbed - 403 394 53B 517 1,016 604Ora rehydyration therapy (under-5) % of cases .. .. 4. 61 38EducationGross enrollnent ratioScondary % ofscmool-age pop. 24 39 44 47 41 53
Female 24 55 46 .. 34Pupil-racher ratio: primary pupils per teawhr 39 33 37 26 39Pupil-teacher ratio: secondary 41 30 40 .. 20Pupilsrachinggrade4 % of cohort 48 63 69 .. .. .
Rcpoazrratecpriry % oftotal enroll 14 IS 17Illiteracy % of pop. (age 15+) 43 13 .. 15 41 19Female %of fim. (age l5+) .. .. .. 18 53
Newspae circulation pe hu o.38 50 23 85 .. 74World Bank International Economncs Departm April 1995
253

NigerMast Same reglonecome group Next
Latestdog year _ reant SXb. higherUnit. climate Saham Lw.. incme.
hulAltor masure 1970-75 190485 1988493 Africa Income group
Priority Poverty IndicatorsPOVERTYUpper povaty line local curf .. ..
Headcount Idex % of pop. .. .. .. . 19Lwer poverq linc local curr. .. ..
HFeadcount index S of pop. .. ..
GNP per capia USS 230 220 270 520 380 1.590
SHORT TERM INCOME INDICATORSUnskilled urban wages local curr. .. ..
Unskilled rural wagesRuru terms of tadeCanisuimepriceindex 1987'100 39 III 83Lower incomeFood'e.. . ..UrbanRura E.
SOCLAL INDICATORSPublic expendiome on basic socidl services * of GDP .. ..
Gross enrollment ratiosPrimary * schol age pop. 20 26 29 67 10B 104Male 25 33 37 74 116Female 14 18 21 60 101
MortalityInfant moaltity per thou, livc births 167.0 146.0 122.0 93.1 63.i 39.0Under S nortality .. .. 320.0 1723 101.4 61.5
ImmunizationMeasles S age grup 16.0 24.0 49.9 B7.3 77.6DPT . 5.0 18.0 51.9 19.9 12.2
Child malnutrition (under-S) .. 49A .. .. 40.3Life expectancyTotal Ya3 39 42 47 52 62 67Fernaleadvaztagep 3.1 3.2 3.2 3.3 2.1 5.9
Total fertility rate births per woman BlI 8.1 7.3 6.2 3.6 2.9Matemal modality rat per 100,000 livc births 519
Supplementary Poverty IndicatorsExpenditures on social secirity % of lotl gov't cxp.Social security covemge % econ. active pop.Access to safweo to % of pop. 27.0 488 59A 67.0
Urban 36.0 48.0 100.0 78.7Rural f 26.0 49.0 52.0 62.0
Access to hWalth care . 48.0 30.0
Population growth rate GNP per capita growth rate Development diamondb6 - (annual avezagc, perent) 1 (annual aveage, perce:nt) life c.pctancy
4 -- 5
,-5 Gri C 7 GNP Gross
1970-75 1980-85 1938-93 1970-75 198045 1988-93 Acces to safewater
Nliger _ g5- Low-incme L-iA-kcoIe
a See the technicia note p37. b. The development diamond, based an four key indicato shows the average levd of development in he contrycompared with its incame grup. See the introduction.
254

NigerMost Sein reg uemem gem Net
Lavo singieear _ recent NSabI higherUNit of agldate Saha. Loaw income
Indlcator easure 1971-75 1945 1985-93 Africa Income group
Resources and ExpendituresHUMAN RESOURCESPopulion (mre=1993) thousands 4.771 6,608 8,550 558.97B 3,091,764 1,096,665Age dependency ratilo ratio 0.95 0.99 1.02 0.94 0.67 0.69Urban % ofpop. 10.6 13.8 16.3 29.5 27.6 54.7Populadon growth te annual %b 2.7 3.4 3.3 2.9 1.9 1.6
Urban * 6.8 5.3 5.6 5.0 3.9 2.9Labor ror. (15-64) thousands 2.590 3,203 3,908 229.480 1,442,452 459.196Agriculture llb of labor force 93 91 .. .Industry " 1 2F-r 4C 49 47 46 36 33 31i nales per IOD males
Urban number .. ..Rural .........
NATURAL RESOURCESArea thou. sq. km 1.267.00 1,267.00 1.267.00 24,273.63 39,091.96 40,682.67Density pop. per sq. km 3.77 S2 6.53 22.37 77.60 26.52Agricultumi land 1 of land ares 10.09 9.92 9.80 52.54 52.82 39.61Change in agricultural land annual S 0.02 -1.63 -0.60 0.06 0.03 -0.13Agricultural laud under irrigation % 0.14 0.24 0.36 0.83 18.02 12.66Forsts and woodand thou. sq.lkm .. 0.03 0.02 5.32 7.15 5.95Defomsacdon (net) annual * . .. 0.41INCOMEHousehold inconeShae of top 20% or households % of income .. ..Sham of bottom 40% of householdsSham of bottom 20% of households .. .. .
EXPENDITUREFaod % of GDP .. .. .. .
StaplesMea, fis milk. cheese, eggs
Canad imports to metric tomnes 17 300 136 13,157 34.420 66,281Foodaidincereals 73 221 26 5,079 8,334 5,477Food pmductionpercapita 1987=100 124 102 119 101 113 101Fentilizer consumption kgha 0.1 0.3 0.1 4.6 59.9 48.0Sham of agricultu rein GDP % of GDP 50.3 36.8 38.5 16.3 26.3 15.7Houing % of GDP .. ..
Aveage household size persons per household .. .. 6.1Urban .. .. 6.3
Fixed investment housing % of GDP .. ..GFad and power % of GDP .. ..
Enaer consumption per capitna kg of oil equiv. 25 42 38 257 364 1.595Households with electicity
Urban % of households .. .. .. .. .
RuralTrmnsport sind cmmnlatlon SofDP .. .. .. .. .. .
Fixed invesument transport cquipnt"n.Totalroadlength dion.Jn 7 18 20INVFS~MFT IN HUMAN CAPITALHealthPopulation per physician pesons 60.150 39.935 35.141 .. .. 3.277Population per nurse U 5.691 461 659Populationperhospitalbed 2.002 .. .. 1269 1,016 604Ond rehydyration therapy (ander-5) % of cases .. .. 17 37 38EdcaInGross enrollment ratioSecondary $ of school-age pop. 2 5 6 18 41 53Female * 1 3 4 34 *-
Pupil-teah ratio: primmy pupils per teacher 39 37 38 40 39Pupil-teacher ratio: secondary 24 26 35 .. 20Pupils reaching gade 4 Sofcohort 76 83 88 .. .Repealerrate prmary Softotaleaom 13 15 14 -.Illiteracy % of pop. (age 1i.) .. 79 72 50 41 19Fcmale % of fe (age 154-) .. 89 83 62 53
Newspaper circulation per thou. pop. 0 1 1 12 . 74Worid ank tIntmational Economics Departmenl, Ape t 995
255

NigeriaMeat S%m reioascome grewp NWxt
Last shat e., Menat SOa- AkhWUr t of uadaraa Shr laow- hcom
ladlkW 'usure 1970-75 1980-S J98J-93 411*a income group
Priority Poverty IndicatorsPOVERTYUpper poverty line local cur. .. ..
Hemicount index lb or pop. , .. ,. .. 19.Lwer poverty line local cur. .. ..
Headcount index I orpop. .. ..pGNPpercapita USS 510 950 300 520 380 1.590SHORT TERM INCOME INDICATORSUnskilled urban wages local cur. .. ..
Unsklled nmal wagesRural taerm of tradeConsumerprice index 19B7=100 17 RS 641Lower incomeFood' .. 92 65
UrbanRural
SOCIAL INDICATORSPublic expenditure on basic social service S of GDP .. .. .. .. .
Gross anrollme ratiosPuimmy % schol ge pop. 51 82 76 67 108 104
Male 47 91 85 74 116Female 27 73 67 60 101
Moralitylnfantotality perthuw.livebirths 111.0 99.0 82.6 93.1 63.1 39.0Under 5 mortality .. .. 191.0 172.3 IOIA 61.5imuninztion
Measles % aP group .. 9.0 34.0 49.9 87.3 77.6OPT .. 9.0 29.0 51.9 89.9 82.2
Child manntuition(under-S) 23.1 .. 43.0 * - 40.3tif expency
Toal Yes 43 46 51 52 62 67Feznaleadvntage 3.2 3.2 3.2 3.3 2.1 5.9
Total fertility rate births per woman 65 6.5 6A 6.2 3.6 2.9Matmal mninliy ras per 100,000 livebkiSs .. 1500 800
Supplementary Poverty IndicatorsExpenditures n socil security of totl gov'texp. .. ..
Social scurit covenge * coo.L acive pop. .. .. .. .. .
Access to sae water total % of pop. .. 36.0 40.0 .. 67.0Urban .. 60.0 52.0 .. 78.7Rurl ' .. 30.0 20.0 .. 62.0
Acoessfta lthcaBc .. 40. 67.0
Population growth rate GNP per capita growth rate Development dnamondb(amra averge. pect) 5 (anna avemg percent) Lccx! q
4 -- 5
CNPGrs2-
2[ -ot i<|=ov} 4t__qSper -aPita enrollment
-2 -101970-75 1980-15 198S-93 1970-75 19S0-85 1988-93 Acass to sfe water
m Nigeria - Nigeria- Low-income Low-income
a. See the techniad moms. p387. b. The developmn diamod, based on four key indicat show the avenge level of development in the countyconpaked with its income group. See Mbe inftodctinnL
256

NigeriaMast Same ir.gInfiIaeumegn,p No"
(Jultef - LIatet siqir year recent - Si. 1Wbrunkof e~~~~~stia rnt Sahuss LZ - luau.e
Iudkuior iMUwum 1 P70-75 1,5945- 1"930f Africa inco groeurwp
Resources and ExpendituresHUMAN RESOURCESPopulation (nxre=1993) thousads 62,710 ¶3.068 105,264 558.978 3,091.7 1,096,665Age dependency ratio usda 0.90 0.91 0.93 0.94 0.67 0.69Urban %orpop. 21.4 31.1 37.7 29.8 27.6 54.7Population growth mete animal 5 2.6 2.9 3.1 2.9 1.9 1.6
Urban 5.6 5.5 5.3 5.0 3.9 2.9Labor force (15-64) thousands 27,385 36.568 45,60 229,480 1,442,452 459,196Agriculture % of labor farc 70 68Industry HI I 1 2Female 37 36 34 36 33 3 1Females per 1 00 males
Urbain number...Rural
NATURAL RESOURCESArea thout. sq. km 923.77 923.77 923.77 24.273.63 39.091.96 40.682.67Density pop. per sq. kmo 67.95 89.92 110.53 22.37 77.60 26.52Agricultural land % of land amea 76.86 78.10 79.48 52.54 S2.82 39.61Clmnge in agricultural land annual % 0.14 0.32 0.07 0.06 0.03 -0.13Agriculturallanunder irripation 9, 1.16 1.19 1.22 0.33 18.02 12.66Forets and woodland thou. sq. km .. 0.17 0.16 5.32 7.15 5.95Deforestaton (net) annual % ... 0.73
INCOMEHousehold income
Shar of top 20% of households 5.orinconra. . 49Shar of bottm 40% or households I. . 5Shamof botom 2D%or'hauseolds ...
Food 5. or'GDP .. 39.6Staples .. 15.1Mea, fish, milk, cheese, eggs .. 12.3
Cereal imports, thou. unetricxtones 447 1.957 1,584 13. 157 34.420 66.281Fod aid ineereas *7 0 I 5.079 8.334 5.477Food production percapita 1987=1 00 127 104 129 101 113 101Fertilizer consumption kglha 0.8 4.1 7.8 4.6 59.9 48.0Shamcof agricultum in GDP %ofGDP 311 36.8 33.3 16.3 26.3 15.7Housing 5. of GDP .. 3.4Avenage household size persons per household ... 5.4
Urban 4.7 .. 4.8Fixed invesment housing 5.of GDP 2.2 0.6Fuel and power % ofGDP .. 1.1Energy consumption per capima kg of'oil equiv. 7 1 148 141 257 364 13595Households with electridity
Urban % of householdr ... 8.Rural ... .6
Transport and communication %If GOP .. 2.4Fixed investment: Iranort equipment 2.8 0.7Total road length thou.kini 103 109 113INVESTMIENT INE HUMN CAPiTALHealthPopulaton per phy'sician person 20,704 5.191 --. . 3,277Populatio per nurse U4.370 862Populationiper hospital bed ' 1,84 1,169 599 1.269 1,016 604Oral whydyrafion therapy (under-5) % of casem. - so 37 38
Gros enrllment ratioSecondary % of school-agepop. 8 29 20 18 41 53FemrAl 3 25 17 .. 34
Pupil-teachermitio: pwimax pupilsper teacher 34 44 39 40 39Pupil-teacher ratio: secondary 84 38 ... 20Pupils reaching grade 4 %orcoluort 65 69 8Repeater rate: primary 5. of total enroll -......-
Illiteracy 5. of pop. (age 15.) -57 49 5'0 41 1Femnike % offenL (agel15.I) -69 61 62 53-
E= M circulafian 2pe thou.rvM. It) 17 I8 12 -..
257

NorwayMon Sam regnAcome group
Lai:snle kyear recentUnR of dmcatf Hfigh-
Indicator mewsr,. 1970-75 1950485 195893 income
Priority Poverty IndicatorsPOVERTYUpper poverty line local curr.
Headcoumi index % or pop.Lower povedy line local curr.
Headcouma index % or pop.GNP per capita USS 7,240 13,950 25,970 23,680SHORT TERM INCOME INDICATORSUnskilled urban wagrs local curr.Unskillcd rural wagesRural terms ol'trdc ti.Consumerpriceindex 1987=100 37 86 126Lower income if
Foodo 24 85 15UrbanRural
SOCIAL INDICATORSPublic expenditure on basic social services % of GDP
ross erllment ratiosPrimary % school age pop. 101 94 99 103Male ' 101 94 99 103Femaie 101 94 99 103
MortalityInfant morality per thou. live births 12.0 8.0 7.8 7.0Under 5 mwrtality .. *. 9.0 8.5
ImmunizationMesles % age group .. 90.0 90.0 82.5DPT .. 85.0 89.0 90.2
Child mainuiition (under-5)Ufe expectancyTotal years 74 76 77 77Female advantage 6.2 6.6 6.7 6A
Total fertiity rate birts per woman 2.3 1.7 1.9 1.7Matrnal morality rate per 100.000 live birthis
Supplementary Poverty IndicatorsExpenditures on social secauity % of total gov't exp.Social security coveage % ccon. active pop. .. .. .Access to safe water total orpop. .. . 100.0
Urban * .. .. 100.0Rural "0 .. .. 1O0.0
Access to hcalth are .. .. 100.0
Population growth rate GNIP per capita growth rate Development diamond4(annual average. peent) W (annual average pent) Ufe expectany
4 -- 5
.J~~hi~~h~zi~~ GNP Grosper primary
O - | j I ,_ + , | * -5 -. capita enrollment0 1-~~~~~~~~~~~~~~~~~5
-2 -101970-75 1980-85 1988-93 1970-75 1980-85 1988-93 A stosaewat
Norway Norway- Higb-incomc - High-income
a. Se the technical notes. p387. . The delopment diamond, based on four key idicatrs, shows the average level of dvpmet in he countrycompared with its income group. See the introduction.
258

NorwayMost Same regionllncome group
Latest singleyear recentunit of eslimate High-
Indicator marre 1970-75 J980895 195-93 Income
Resources and ExpendituresHtMAN RESOURCESPopulation (mre=1993) thousands 4,007 4.153 4.298 812.447Age dependency ratio ratio 0.60 0.56 0.55 0.49Urban % of pop. 68.2 71.5 72.8 77.9Population gowth ratc annual % 0.7 0.3 0.5 0.6
Urban 1.5 0.6 0.7 0.8Labor force (15-64) thousands 1,780 2039 2.174 395.641Agriculturc % of labor force 10 8Industry 33 29Female 35 41 41 38Femnles per 100 males
Urban number 103 102Rural 94 94
NATURAL RESOURCESArca thou. sq. km 323.90 323.90 323.90 32146.15Dcnsity pop.persq.km 12.37 12.82 13.21 25.11Agricultural land %ofrland ana 2.93 3.12 3.27 42.80Change in agricultural land annual % 41.33 0.31 -0.69 -0.48Agriculturl land under irrigation % 4.45 9.40 9.67 13.96Forests andwoodland thou. sq. km .. .. 0.10 10.56Deforestation (net) annual S'INCOMEHousehold income
Sham of top 20% of households * of income 37Sham of bottom 40% ofhouseholds 19 .Share of bottom 20% of households 6 . .
EXPEDIUREFood % of GDP .. 9.8 9.5 BAStaples .. 1.2 1.2 1.6Meat, fisL, milk, ches, eggs - .. 5.0 5.0 3.8
Cereal imports thou. mctric tonnes 603 227 302 77.530Food aid in cereals '.. .. .. Foodpoductkonpercapita 1987=100 87 101 103 95Fertilizer consumption kg/hia 255.7 248.9 200.3 150.0Share of agriculture in GDP % of GDP 4.8 3.0 29Housing %ofGDP .. 9.1 9.5 11.7Average household size persons per household 2.9 2.7Urban 2.8 2.6
Fixed investment housing % of GDP 5.5 3.0 3.1 5.0Fuel and power fe of GDP .. 3.5 3.1 2.0Energy consumption per capita kg of oil equiv. 3.798 4.910 5.096 5,203Households with electricityUrban % of householdsRural
Tronsport and communikation % of GDP . 9.0 6.5 8.Fixed investment transport equipment f 6.5 4.6 6.5 2.1Total road length thou. kn 78 85 89
INVESTMENT IN HUMAN CAPITALielthPopulation per physician persons 723 411 .. 453Population per nurse 157 57Population per hospital bed 91 67 210 145Oral whhydyrtion therapy (under-5) % of casesEducationGross ernllment ratioSecondary % of school-age pop. 8B 97 103 92Female 88 99 104 94
Pupil-teacher rtio: primary pupils per teacher B 7 6Pupil-teacher ratio: secondary 12Pupils raching grdc 4 % of cohort 99 100 100Repeaterrat primary % oftotalenrol 0 0 0Illiteracy % of pop. (age 15+) .. .. tFemale % offem. (age 15+) .. .. t
Newsprcirculation pethou. o. 414 510 608 320;W0W 1d&W1k ntermational Econonuics Departinent, Aprti 1995
259

OmanMost- Same regIonlancoma groMp Next
Lastar!k ear pmenJ t1p- kek aier ree M1li UpAiW- higherUll of ctimate & North middle- income
Indiaotor magcare 197075 J 98&0-85 198Y893 Africa Income group
Priority Poverty IndicatorsPOVERTYUpper poverty linc local curr. .. ..
Headcount index * of pop. .. ..
Lower povcrty line local curr. .. ..
Hendcount index % of pop. .. ..
GNP per capita USS 1,310 6,430 4,850 1,980 4,350 23,680
SHORT TERM INCOME INDICATORSUnskilled urban wages local curr. .. ..
Unskilled rnul wagesRural terms of ra"de
Consumerpice index 1987=100 .. ..
Lower incorneFood'
UrbanRural
SOCIAL INDICATORSPublic expenditure on basic social serviees I' of GDP . .. 6.0Gross enrollment ratiosPrimary %schoolagepop. 44 B9 100 97 105 103
Male " 63 97 104 103 .. 103Emale 24 g0 96 90 .. 103
MortalityInfant mortaliy per thou. live births 145.0 56.0 29.0 52.3 35.8 7.0Undcr S mortaity .. .. 38.0 69.9 42.6 8.5
ImmunizationMeasles RV group .. 61.0 94.0 81.3 82.0 82.5DPI "5.. 56.0 96.0 84.0 74.2 90.2
Child malnutrition (under-5)Lire expectancy
Total yeas 49 63 70 66 69 77Female advanuge 2.4 3.0 4.2 2.3 5.9 6.4
Total ferflitynft - biitsperwoman 7.2 7.2 7.1 4.7 2.9 1.7MatdW nmrtality ratr per 100,000 live births .. .. _
Supplementary Poverty IndicatorsExpendtures on social security * of total govlt exp. .. ..
Social security covemge econ. active pop. .. ..
Acss to saf water total % of pop. 52.0 14.7 56.6 83.5 86.7.Urban 100.0 90.0 86.5 98.7 93.9Rural 48.0 10.0 46.6 69.0 66.7
Acess to health care .. 92.0 89.0 87.4
Population growth rate GNM per capita growth rate Development diamondb6 - (anmual average peent) (amal aveage, percet) fe expetancy
4 -5 --
[~~7] ~GNP Gross2 0 r-------- per i.primary
capita enrllmnict
-2 -- 10 0 _ _ _ _ _ _ _ _ _ _ _ _ _ _ _ _
1970-75 1980-85 1988-93 1970-75 1980485 1988-93 Accestosafewater
Oman Oman- Upper-middle-income Upper-middle-income
a. See the technical rne p.387. b. e development diamond. based on four key indicators, shows the average level of developmmt in the countrycompared with its income group. Sec the introduction.
260

Oman(Jail Ici~Laest slaxgle &ea - Mel 5m iwIedac.arS Nx
Vag of atin~~~~eflue A Norh middle. InsanetIndikatar measure 1970-75 1980-85 1988-93 lucermnes grup
Resources and ExpendituresHUMdAN RESOURCESPopulation (mreu1l93) thousands B47 1.397 1,983 261,650 500,507 812.447Age dependency ratio railo 0.90 0.96 1.00 0.87 0.62 0.49Urban Sor pop. 6.3 9.2 12.3 55.2 71.2 77.9Population growth rate annual % 3.2 4.8 4.2 2.7 1.7 0.6
Urban 116.7 8.3 7.9 3.7 1.i 0.13Labor force (15-64) thousands 206 361 439 71.333 190.136 395.641Agriculturm 9 of labor force 53 50Industry 20 22Female 7 8 916 29 33FemAles per 100 males
Urban number...Rural
NATURAL RESOURCESArea thou. sq. kcm 212A6 212.46 212.46 11.021.26 21.848.14 32,146.15Density pop. per sq. km 3.99 6.51 8.97 23.10 22.51 25.11Agricultural hand 96 of land are 4.33 4.93 5.00 32.10 41.26 42.80Change in agricultural land annual 96 0.10 0.00 0.19 0.04 0.08 -0.49Agricultural land under irrgation 96 3.28 3.92 5.46 30.59 8.34 13.96Forests and woodland thou. sq. ]cm . 0.04 0.04 0.45 8.04 10.56Deforestaiion (net) annual 96... 0.00INCOMEHousehold income
Share of top 20% of households 96 of income . .
Share of bottom 40% of houscholdsShare of bottom 20% of households
EXlENDrIUREFood 96 of GOP... 15.3 ... .4
Staples ... 3.6 ... 1.6Meat, fish, milk, cheese eggs... 6.4.. 3.8
Cereal imports thou. me-tric tonners 73 202 369 38.092 48.947 77,530Food aid in cereals .. . 1,249 544 8Food production per capita 1987h 100 ... . 102 102 95Fertiizer consumption kgba OA 2.8 7.5 39.9 67.8 150.0Showeof.gricultumein CDP % ofCDP 2.8 2.8 3.3 13.3 8.0Housing % of CDP ... 11.1 ... 11.7Average household size persons per household...
Urban ...
Fixed investmenot housing 96 of GDP ... 17...5.0Fdlantd power % of GDP ... 3.1 ... 2.0Entergy consumption per capita kg of oil equiv. 342 2,306 2,403 1,097 1,632 5S20Households with electricity
Urban 96 of households...Rural ...
Transpot and comntnnncatlon 96 of GDP... 35...88Faxed investment: transpoit equipment ... 237 2. .1
Tota road length' thou. km 422
INVESTMENT IN HUMAN CAPITALHealthPopulationper physician persons 9.288 1,911 1,202 ... 4S3Population per nurse - 3822 35Population per hospital bed .. 619 .. 633 395 145Oral rehydyration therpy (urder-5) 96 of casem.. 72 56 51EducationGross enrollment ratioSecondary % of school-Agepop. 1 33 57 56 53 92
Femalec 0 22 53 S0D. 94Pupil-teacher ratio: primary pupils per fteacer 27 27 27 26 25Pupil-teacher ratio: secondary 7 13 1s 21Pupilsrmaching gmde 4 % ofcobort 82 97 97 95Rcpcau tcrztcprimuary % of toualenmol 9 12 it -Illiteracy % of pop. (agels.r-) ... .45 14
Female % Of frm.(age 154.) ... .57 17New ciultion per thou. pp..37 41 33 125 320
woria kinternationaeparomentcsApal 1995
261

PakistanMosl Same reglennlcomCegrnup Naen
latestr ingle yar_ recent higherUni f'f estimate South Low- income
Indkcator meure 1970975 1980485 1988-93 Asia Income group
Priority Poverty IndicatorsPOVERTYUpper poverty line localcurt. .. 2.916 3.552
Headeount Index % of pop. .. 31 34 28 19Lower poverty line local curr. .. ..
Headcount Index %a of pop. .. ..
CNI percapita US$ 140 360 430 310 380 1.590SHORT TERM INCOME INDICATORSUnskilled urban wages local curr. 10 28 70Unskilled rural wagcs .. .. 48Rural terms of lradeConsumerprice Index 1987-100 43 92 171Lower income .. ..
Food 20 ..
UrbanRural
SOCIAL INDICATORSPublic expenditum on basic social services % of GDP .. ..
Gross enrollment ratiosPrimay % schoolagepop. 46 45 46 106 108 104
Male 63 57 59 118 116Female 28 31 31 93 101
Mortalitylafant mortality per thou. live binths 140.0 120.0 87.6 83.7 63.1 39.0Under 5 mortality .. .. 137.0 123.9 1OlA 61.5
ImmunizationMeasles % age group .. 23.0 77.0 85.8 87.3 77.6DPT .. 30.0 81.0 90.2 89.9 82.2
Child malnutrition (under-5) .. .. 40.4 60.4 40.3ufe expectncyTotal years 51 56 62 60 62 67Female advantage S -0.1 1.3 2.0 0.4 2.1 5.9
Total fertility rate births per woman 7.0 7.0 6.1 4.0 3.6 2.9Maternl mortlity rate per 100.000 live births .. 600 270 420
Supplementary Poverty IndicatorsExpenditures on social security % of total govt exp. 0.1 0.3 0.1Social security coverage % econ. active pop. .. ..
Access to safe water. total % of pop. 25.0 44.4 49.9 69.5 67.0.Urban 75.0 84.0 84.0 73.8 78.7Rural - 5.0 28.0 35.0 67.2 62.0
Access to health care m .. 64.0 85.0 95.8 .
Population growth rate GNP per capita growth rate Development diamondb6 ({annual average, patent) (anul avemge, percenL
6~~ 10~. (annual average. pereent) ~~Lifeexpectacy
4 5
0 m U_ 9 O - ; 1 GNP? Gross
0 I l l l l l l | S lcapita yenrollment
-2-11970-75 198045 1988-93 1970-75 1980-85 1988-93 Access to safe waLr
r- Pakistan wsa- Low-income Low-incomi
a See the technical notes, p.3%7. Ih Ihe developnt diamond, based on four key indicators, shows the averge level of development in the counrycompamrd with its income group. See the introduction.
262

_____ ____ ____ ____ PakistanMail Strata rqnaOIiceme u p Nut
UNIt .1_ e#!Leearecent higherUR& Of __!__ ~~allmaS. South Lu.'. incoern
IndiceAor macan 1970-75 J980-85 J988-93 AIs Lucerne groupResources and Expenditures
HIUMAN RESOURCE-SPopulation (nnuM1993) thousands 74.734 93,133 122,902 1.193,503 3,091.764 1.096,665Age dependency ratio mlio 0.94 0.89 0.93 0.74 0.67 0.69Urban % aor pop. 26.4 29.8 33.6 25.7 27.6 54.7Population growth raite annual '1 2.6 2.3 2.8 2.1 1.9 1.6
Urban 3.7 4.0 4A4 3.5 3.9 2.9Labor force (15.64) thousands 21.950 29.801 36,771 437,131 1,442,452 459.196Agriculture % of labor force 57 55Industry U I7 16female I 0 1 1 3 22 33 3 1Females. per 100 males
Urban number 79 83Rural 'I89 92
NATURAL RESOURCESArea thou, sq. km 796.10 796.10 796.10 5.133A49 39,091.96 40,682.67Density pop. per sq. km 93.88 123.27 149.99 227.55 77.60 26.52Agricultural lauid % of land attn 32.21 33.22 33.87 59.03 52.82 39.61Change in agricultural land mnnual % 1.12 1.11 0.00 0.00 0.03 -0.13Agricultural land under irrigation % 54.89 61.54 65.49 29.34 18.02 12.66Forests mnd woodland thou. sq. km .. 0.03 0.02 0.66 7.15 5.95Deforestation (net) ainnua Ii.. 3.40INCOMEHousehold inconme
Shameof top 20lIof househokds of inconme 42 46 40Sham of bottom 40% orhousehokLs 21 19 21Share of bottom 20% or households 8 S 8
EXPENDnITUFood % ofCGDP 46.1 28.1Staples 16.0 9.3Meat, fish, milk, cheese, eggs 14.0 8.4
Cereal imports thou, metric tonnes 1,349 982 2.893 6,212 34,420 66281Food aid in cereals 584 411 188 1.624 8,334 5,477Food productionperrcapita 1987=100 94 99 115 III 113 101Fecrtilizer consumption kg/ha 22.3 59.0 82.1 70.2 59.9 48.0Share of agriculture in ODP Ii of GDP 29.9 25.7 22.2 27A4 26.3 15.7Housing % of GDP 9.4 12A4Average household size persons per household 5.6 6.7
UJrban 5.9 6.7Fixed investmient housing Va of GDP 2.0 1.7Fuel and power %aof GDP 3.8 3.7Energ consumption per capita kcg of oil equiv. 117 174 226 216 364 1.595Households with electricityurban % of households .. 71.0Rural]
Transport and commnnnication Va of GDP 1.6 10.0Fixed investment transport equipment wi.6 1.7Total mad length thou. km 79 126 171INVESTMENT IN HUJMAN CAPITALHealthPopulaton per physician persons 4,524 3.014 .. 2,850 .. 3,277Population per nurse 7,023 6.050)Populationsper hospita bed U1,999 1,811 1.777 1.638 t.0 16 604Oral r,hydyration therapy (under-5) Va of eases ... 59 37 33EducationCross enrollment ratoSecondary % of school-agepop. is lB8 21 40 41 53Female 7 10 13 2934
Pupil-teacher ratio: primary pupils per teacher 40 39 41 61 39Pupil-teacher rtio: secondary 18 lB8 19 26 20Pupils maching grade 4 % of cohort 57 53 51Repeatr rate: primary Va Of totd al nol..."lliteracy % Of pop. (age 154-) 79 69 65 54 41 1Female % Of fcm. (agc 154-) .. 82 79 69 53
cimdadon m ~pethou. mep. 5 1 2 7 26 74
263

PanamaMost Snse "egoincllomame gup Next
l______ r rent - atlih - vwjt. higherUni o a- Latest tseimate Amrika sMile' incemr
Indicator mesure JW70&75 JYOOdS JWRJ93 Caribbean Inenme groupPriority Poverty Indicators
POVERTYUpper poveny llne local curr.Headcount Index % of pop. .. ..
Lower poverty line lcaCl cur. .. ..
Headcount Index % of pop. . ..
GNP per capita US$ 1.140 2.290 2,600 2,930 1,590 4.35(SHORT TURM INCOME INDICATORSUnskilled urban wages local curr. .Unskilled rual wagesRural manna of tradeConsunicrprice index 1987*l00 61 99 105
Lower IncomeFoods 38 ..Urban ., 97Rural
SOCIAL INDICATORSPublic eupenditurm on basic social services % of GDP . ..Gross enrollment mtiosPrimazy % schol age pop. 114 105 106 107 104 105Malc 116 107 10.Female I III 102 105
MortalityInfant mortality per thou. live binhs 43.0 30.0 24.2 43.0 39.0 35.8Under 5 mortality .. .. 28.0 52.2 61.5 42.6
ImmunizationMeasles % age group .. 72.0 99.0 78.7 77.6 B2.0DPT .. 70.0 36.0 73.7 82.2 74.2
Child malnutrition (under-S) .. 16.0 7.0Ufe expectancTotal yars 66 71 73 69 67 69Female advantage 3.0 4.5 4.2 5.3 5.9 5.9
Total fertility rate birso per woman 4.9 3.5 2.8 3.1 2.9 2.9Maternal morlity raue per 100.000 live births .. 90
Supplementary Poverty IndicatorsExpenditures on social security % of total govt cxp. 9.5 13.4 19.0Social securty coverage St ceon. active pop. .. ..Access to safe watcr: total * of pop. 77.0 82.3 82.6 80.0 .. 86.7
Urban 100.0 100.0 100.0 90.1 .. 93.9Rural 54.0 64.0 66.2 57.6 .. 66.7
Access to health care .2.0
Population growth rate GNP per capita growth rate Development diamondb
(annual avcmge. perent) (annul average, prcent) Life expectancy
GNP Gross2 - _ _ || 0 i 1pr puny rmm
Capita enrollment
-2 -11970-75 1980-85 1988-93 1970-75 1980-85 1988-93 Aces to safe water
E Panm _ Panama- Lower-middle-income Lower-middle-income
&. See the technical notes. p.387. b. The development diamond bLsed on four key indicators. shows the average level of development in the counoycompsred with its income goup. Soc die introduction.
264

PanamaMoest Somne regonAincene gromp Next
Vail - ~~Laeast singleyj'w recent iiT ii highiervnk of est~~~~~aimate Anmeria wni die- income
Indicator -measure 1979-75 1959-55 1988-93 Caribbean income groupResource and Expenditures
HUMAN RESOURCESPopulation (nrmul][93) thousands 1,723 2.167 2,538 466,304 1,096.665 500.507Age dependency ratio ratio 0.89 0.74 0.65 0.66 0.69 0.62Urban % of pop. 48.7 50.7 52.7 71.2 54.7 71.2Population growth rate annualS ±27 2±1 2.0 2.0 1.6 1.7
UrbaLn 0.3.1 2.5 2.6 1.9 2.9 1.8Labor force (15.64) thousands 530 760 944 169,339 459,196 190.136Agriculture % of labor force 37 32Industry i8 I3aFemale 26 27 28 27 33 29Females per 100 malesUrban number 130 IIIRural p 3 81I
NATURAL RESOURCESArea thou. sq. km 75.52 75M2 75352 20.505.92 40,682.67 21,848.34Densdty pop. per sq. km 22.82 28.69 32±95 22,29 26352 22.51Agricultural land % of land area 24.26 26.80 28.89 40.00 39.61 41.26Chnnge in agricultural land annual% 1.18 lAS 0.75 0.39 40.13 0.08Agricultural land under i.rigation % 1.27 1.50 1.49 3A1 12.66 8.84Forests and woodland thou. sq. km .. 0.04 0.0 9.37 5.95 8.04Deforestation (net) annualS ... 1.87
INCOMdEHousehold incomeShare of top 20% of households S of income 62 .. 60Share of bottom 40% of households 7 a. Share of bottom 20% of households 2 .. 2
WECI fIlMFood % orGDP .. 24.3
Staplesr. 4.5Meat, fish, milk, cheese, eggs .. 6.6...
Cereal import thou. metric twines 70 1.25 159 27,700 66.281 48.947Food aid in cereals *3 1 3 1,565 5,477 544Foodproduction per capita 1987=100 105 101 87 101 101 102Fertilizer consumption kglha 14.1 12.9 14.6 16.1 48.0 67.8Sham of.gricolture in GDP OfOGDP 11A 10.1 10.2 9.0 15.7 8.0Housing % of GDP .. 6.9Avegrag household size pessons per household 5.0 4.5
Urbain 5.0 4.4 Fmxed investment: housing S Of GDP 3.8 3.7 Fueland power %ofGDP .. 1.9 -
Energyconsumption per capita kg of oil equiv. 889 521 599 913 1,595 1.632Houscholds with clcctricityUrban S of households .. 90.7 -
Rural Transport undt conmunkcatlom Sof GDP .. 4.6Fixed investment trmnsnortequinunent 3.4 2.4Total road ength thou.kan 8 10 10
]INVESTMIENT IN HUMAN CAPIT-ALHealthPopulation per physician persons 1.676 994. 834 .. 3.277Population per nure U1,536 388Population per hospital bed U296 298 . 517 6034 395Oral .hydyraton tberpy (under-5) % of cases . 70 61 .51I
EducationGros enrol!ment ratioSecondarY % of schol-age pop. 55 59 60 47 53 53
Fnmale 57 63 62Pupil-teadher ratio: psmary pupils per teacher 27 25 23 26 .. 25Pupil-teachr ratio: secondary I'25 19 20 Pupils reardng gmde 4 Of ODoluo B5 88 35... Rtepcater rate'pmuimry Of towalearot 13 13 10 ...-
flitcrac' % of pop. (age 15+) k2 14 12 15 19 14Female% Of fem. (Br 5+) .. 14 12 13 -. 17
NwJrcirculation pe hou.op 76 113 90 85 74 125IZadlntelrnmational Economics Department. Apri MD%
205

Papua New GuineaMsan Sameregio.fincomegroup Nart
Latest sigble pair recent Lmib higherCn eof -twmame ERt middk- Income
Indlkucr enuare 1970-75 1984-85 1988-f3 Asia lnirme group
Priority Poverty IndicatorsPOVERTYUpper poverty linc local curr. .. ..Hcadcout hIdex %of pop. .. .. .. 12
Lower poventy line local curr. .. ..
Hcadoun Index I' of pop. .. .. .. 9GNPpercapita US$ 570 720 1.130 820 1.590 4.350SHORT TERM INCOME INDICATORSUnskilled urban wages local curr. .. ..
Unsidied rural wagesRura terms of trdeConsumer pdrc index 1987=1'0 47 92 138
Lower incomeFood' .. 95 135S
UrbanRual"
SOCIAL INDICATORSPublic expenditure on basic socia services % of GDP .. ..
Grss enrollment ratiosPriemy %schoolagepop. 56 *j0 73 lI1 104 105
Male 68 66 78 123Fenuae 43 53 66 115
MortalityInfamt rnlSity per thou. live births 100.0 72.0 66.6 35.5 39.0 35.8Under5 morlity * .. .. 95.0 60.5 61.5 42.6
ImmuniztionMeasles % age group .. 27.0 63.0 93.0 77.6 82.0DPI ' .. 40.0 64.0 95.0 82.2 74.2
Child malnutrition (under-5) ' .. 34.7 .. 24.1life expectancy
Total yean 48 52 56 68 67 69Fe le advantage 3 -0.1 1.5 1.5 3.6 5.9 5.9
Total ferility rate births per woman 6.1 5.6 5.0 23 2.9 2.9Matemal mAHity net per 100.000 live births .. 1000 700 116 . .
Supplementary Puverty IndicatorsExpenditures on social securiy % of total govt exp. 0.1 0.4 0.6Socia sccurity covege % econ. active pop. .. ..
Accesstosafewater totl %ofpop. 20.0 25.8 32.8 67.1 .. 86.7Urban 30.0 93.0 93.8 835 .. 93.9Rural ' 19.0 15.0 20.0 613 .. 66.7
Acss to helth cmu ' . 93.0 96.0 . ..
Population growth rate GNP per capita growth rate Development diamond'(aua avege, pect) (amual avemr, percent) Life expectancy
4 -- 5
2 ~ ~~~~~~~~~~ 0 ~~~~~~~~~~per piim
O 1- 1 1 1 1 I < l I l l I -5 \* capita i /rollment
-2 -10 ~ ~~ ~~~~~~~~~~~~~~~~~~~A== to safe water1970-75 1980-85 1988-93 1970-75 1980-15 1983-93
m ptl N'ewGnin _ Papua New Guinea- Lower-un idc-incorm - Lowe rmiddle bwomm
a. See th technical notes, p387. b. The development diamond. based on four key indicatns, shows the average level of development in the counnycompaed with its income group. See the indwction.
266

Papua New GuineaMost Snugl regleui'aemeg-reup NMt
Latestasnle year rentm La r high61erUnit of at1l111a East .ddl- hincme
Indicator measure 13970-751 195085 1 388-93 Asia Inc... group
Resources and ExpenditureHUMAN RESOURCESPopulallon {mureul"3) thousands 2,729 3.442 4,110 1.713.883 1.096.665 500.507Age dependency ratio ratio 0.82 0.78 0.74 0.54 0.69 0.62Urban % of pop. 11.9 14.0 l5.6 31.3 54.7 71.2Population gmowth rate annual Ia 2.4 2.2 2.3 1.4 1.6 1.7
Urban 6.0 3.6 3.6 4.0 2.9 I.ELabor force (15.64) thousands 1,245 1,458 1,623 942,977 459,196 190,136Agriculture % of labor force 1 2 1 1Industry 34 33fcmalc 32 34 35 4 1 31 29.Fcmales per I100 rmates
Urbakn number . ..
RuralNATURAL RESOURCESArea thou. sq. km 452.84 462.84 4162.894 16,367.91 40.682.67 21,848.14Density pop. per sq. km 5.90 7.44 8.68 103.27 26.52 22.51AgriculturW land % of land amu 1.01 1.04 1.09 44.21 39.61 41.26Change in agricultural land annual Ia 1.55 1.07 1.02 0.24 -0.13 0.01Agricultural land under inigalion S .... 14.61 12.66 8.34Forests and woodland thou. sq. kinm 037 0.36 4.06 5.95 1.04Deforestation (net) annual % .. 0.31INCOMEHousehold income
Share of top 20% of households S of income...Share of bottom 40% of householdsShare of bottom 20% of households
EXPENDITUREFood S of GDP 32.5 .
StaplesMeat, fish, miilk, cheese, eggs
Cereal imports thou. metric tonnes 92 172 227 30,036 66.28'1 4,8.947"Food aid in cereals ... 0 447 5,477 544Food productionper capita 1987=100 10! 104 97 115 101 102Fertilizer consumption kglha 12.0 11.3 25.9 76A4 49.0 67.8Share of agricultume in GDP Ia of GDP 29.7 33.8 26.0 17.1 15.7 8.0Housing % orGDP 5.9 .
Average household size perons per household...Urban
Fixed investmecnt housing F GDP...Fuel and power S orGDP...Energ consumption per capita kg of oil equiv. 204 240 238 632 1.595 1,632Households with clectricity
Urban % of households...Rural-
Transport and coniuniuucatiumn % of GDP 4.9 .
rixed investment: transport equipme-nt Total road length ithou.n km 20
INVESMENT IN HUMAN CAPITALHealthPopulation per physician persons I11,733 6,039 12,754 1,063 3,277Population per nursc 1,713 873 1.164 1.490PopuaiMon per hospital bed -202 207 297 612 604 395Ora rehydyrazion therapy (under-5) S of eases .... S 32 .5 1EducationGros enrollmient rfatiSecondary % of school-agepop. 12 1 1 1 2 53 53 53Female 7 S 1 0 47
Pupil-teacher ratio: primary pupils per teaher 32 31I 31 23 .. 25Pupil-tracher ratio: secodary 23 24 24 16Pupilsrearhing grade 4 % Of CohDt 87 .. 67 92Repeater mrateprimary Of totalenmul.. 0 6Ifliteracy * of pop. (aBP 154.) 68 Si 48 22 19 14Female % of fem. (agelS4) -. 68 62 36 .. 17
Newsja eir~ciz ation pe thou. Fop 7 13 16 - 74 125wormmm inamniu conoicsDepartment April195
267

ParaguayMost Seme regIenJliurm. groum Next
lasest sinkiljr,ar rnt hiter, higherUNa of eslPUJ Amerka mIdle- income
IndkIior measure 1970-75 198f0DS 1988-93 Caibbean income group
Priority Poverty IndicatorsPOVERTYUpper poveny line Iocal curt. .Headcount index % of pop. .. 22
Lowerpoverty line local cufr. .. ..
Hcadcount index % of pop. .. 4
GNP pcr capita USS 600 1,130 1.510 2,930 1.590 4.350SHORT TERM INCOME INDICATORSUnskilled ubn wages local curt. .. .
Unskilled rural wagesRural tcrms of tm..Consumer price Index 1987=100 15 62 362Lower incomenFOOda
Urban .. 56 353Rural
SOCIAL INDICATORSPublic cxpenditure on basic social services % of GDPGross cnrollmcnt rdosnmoary %lschoolagepop. 102 103 110 107 104 105Male 106 10S 112Female 97 100 109
MoralityInfant mortality per thou. live births 55.0 46.0 37.4 43.0 39.0 35.8Under 5 moralily .. .. 46.0 52.2 61.5 42.6
ImmunizationMeasles % age group .. 53.0 74.0 78.7 77.6 82.0DPT .. 58.0 79.0 73.7 82.2 74.2
Child malnutrition (under-5) .. 32.0 3.7ure cxpectanayTotal years 66 67 70 69 67 69Female advantage 3.9 3.9 3.8 5.3 5.9 5.9
Total ferility rte birt perwoman 5.7 4.8 42 3.1 2.9 29Maernal mortality rate per 100.000 livebhlhs .. 260 180
Supplementary Poverty IndicatorsExpenditus on social security * ofotalgov'tcxp. 13.4 29.0 16.0 -Social security coverage % econ. active pop. .. **Access to safe watcr total % of pop. 13.0 27.6 33.0 80.0 .. 86.)
Urban * 25.0 53.0 65.0 90.1 .. 93.9Ruwal 5.0 8.0 7.4 57.6 66.7
Access to health eamn__________________ _________________
Population growth rate GNP per capita growth rate Development diamondb6 (annual average. pereent) s04~ (annua av p ert)
45
* GNP G~~~~~~~~~~~c rosskm
0 n1 S1 H EiL - 5 \apita etI I
-2 -101970-75 1980-85 1988-93 1970-75 1980-85 1988W93 Access to sa waer
aaay - Pargay- Lower-middle-income - Lwer-middle-income
A. See di tical nos p.387. b. The clvdelopuw dimond, based on four key indica sbows the rc level of development in the countycompad with its ineome group. See the intoducto
268

ParaguayMoat Sane rexIouflhaome group Next
Litest sing/a 4yuar recent Latin Lower- higherUNik qI estImate America .Mbdl- Income
Indicator measre 1970975 1989-S 1988-93 Ceflbhean Lucemre grauipResources and Expenditures
H-UMAN RESOURCESPopulation (mirem1993) fthusands 2.682 3.693 4,701 466,304 1096,665 500.507Age dependenicy ratio ratIo 0.91 0.80 0.79 0.66 0.69 0.62Urban %or pop. 39.0 45.0 51.2 71.2 54.7 71.2Population growth mtdc annual Wa 2.6 3.3 3.0 2.0 1.6 1.7Urban "3.6 4.8 4.5 1.9 2.9 1.8
Labor force (15-64) thousands 882 1.223 1.532 169,839 459,196 190.136Agriculture Wa or labor force 5 1 49 .
Industry *20 2 1 2 2Femalec 2 1 2 12 23 2Females per 1 00 males
Urban number 117 109 .
Rural 97 92 .
NATURAL RESOURCESArea thou. sq. kcm 406.75 406.75 406.75 20.505.92 40,682.67 21.8411, t4Density pop. per sq. km 6.59 9.08 11.22 22.29 26.52 22.51Agricultural land Wa of land ama 40.91 50.34 60.33 40.00 39.61 41.26Change in agricultural had annual Wa 1.38 2.73 1.42 0.39 -0.13 0.08Agricultural land under inripaion Wa 0.34 0.33 0.28 3.41 12.66 8.84Forcsts and woodland thou. sq. kmn. 0.17 0.13 9.87 5.95 8.04Deforestr.tion (net) annual lb... 269 .
INCOMEHousehold inconmc
S harc of top 20W of households % of income .. 51 46Shareof bottDm 40% of households .. 14 16 .
Sharcof bottom20% of houweholds .. 5 6 .
EXPENDITUREFood %of GDP .. 23.1 ...
Staples .. 4.5 . ..
Meat, fish, milk, cheese, eggs I. 2.0 .
Cereal imports thou. mectric toanes 25 85 82 27,700 66,2811 48,947Food aid in cemals 10 4 1 1,565 5,477 544Foodproduction per capima 1987=100D 77 101 103 101 101 102Fertilizer consutnppdon kglba 0.1 0.6 0.9 16.1 48.0 61.8Share of agriculture in GDP Wa of GDP 36.9 28.9 26.4 9.0 15.7 8.0Housing % of GDP .. 15.8 . ..
Average household size persons per household 54 ..
Urban 5.0 . ..
Fixed investmient: housing W f GDP .. 16.1 .
Fuelanudpower WaofGDP .. 2.9 .
Encrgy consumption per capita kg of oil equiv. 107 174 214 913 1.59 1.632Households with electricityUrban Wa of households . .-.
Rum]lTransport and commnunIcatIon %aof GDP .7.6 .
Faxed investment tansport equipmient 4.3 4.4 .
Total road length thou.lkm 7 15 Is
INVESTMENT IN HUMAN CAPITALHealthPopulation per physician persons 2,297 1,516 1,262 .. 3,277Population per nurse 2,22 882-Population per hospital bed 599 .. 1.098 517 604 395Omalrehydyrationtherpy (uader-5) % of came .. 52 61 .5 IEducationGross enrollmeat ratioSeondarY % ofschool.age pop. 20 30 30 47 53 53
Female 20 30 3 1 .-
Pupil-teacher rato: primary pupils per teacher 29 25 23 26 .. 5iPupil-teacher ratio: secondary 1 .I...
Pupils reaching gradc4 % of cohort 70 75 8 1...Repeater mate: primary % of tota enroll 15 I11 9...Illiteracy Wa of pop. (age 15+) 20 12 10 15 91
Femnale %aof fem. (agel15+) .. 14 12 18s. 17Newspae circulation pe thou. po. 27 46 37 85 74 125world isank Interationa Economics Departrmnt Apnl 1m
269

PeruMost S3meregLo/lncomegroup Nal
sltest siogbe year roceoa 1d11flviwe higherUnk of eutra0ae America middle- Income
indicater mesure 197075 190485 1988-93 CarIbbean Income groupPriority Poverty Indicators
POVERTYUpper poverty line local cur. .. .. 617
Headcount index % orpop. .. .. 32Lowerpoverty line locl cur .. .. 315Headeount index % of pop. .. 12 22
ONP per capita US$ 1.000 930 1.490 2,930 1.590 4,350
SHORT TERM INCOME INDICATORSUnskilled urban wages local CUT. .. ..
Unskilled ural wagesRumal terms of tradc
Consumerprice index 1987=100 0 30 26,728.470Lowcr income N
Food'UrbanRual.
SOCIAL INDICATORSPublic expenditurm on basic social services % of GDP .. 3.6 2.4Gross enrollninnt adosPrimary % schol age pop. 113 122 119 107 104 105
Male c 114 125Femal a 99 120
MoalityInfant modality per thou. live birLhs 110.0 82.0 63.0 43.0 39.0 35.8Under 5 mortlity .. .. 92.0 52.2 61.5 42.6
ImmunizationMcasles ago group .. 32.0 81.5 78.7 77.6 82.0DPT .. 26.0 81.4 73.7 82.2 742
Child malnutrition (under-5) 16.1 13.4 10.8Life expectancyTotal yeas 56 60 66 69 67 69Female advantage 3A 3.7 3.8 13 S.9 S9
Total fertility rte births per woman 6.0 4.7 3.3 3.1 2.9 2.9Matemal mortality rate per 100,000 live births .. 314 - . .
Supplementary Poverty IndicatorsExpenditures on social security % of total gov't exp. .. ..
Social security covage % econ. activc pop. .. ..
Access to safe water total 'I of pop. 47.0 543 SSA 80.0 .. 86.7Urban I 72.0 73.0 77.6 90.1 .. 93.9Rural " 15.0 17.0 22.3 57.6 66.7
Access to health care "
Population growth rate GNP per capita growth rate Development diamond'(annual average. prrent) 0 (annual average peent) Lif expectancy
4 5
GNP Gros
capita enoillmt
-2 -0AM r ac1970-75 1980-85 1988-93 1970-75 1980-85 1981-93 Acstosafewser
EJPeru P cr-Lower-middle-inwome Lower- middle-income
a. See ft technical notes. p387 . b. Thc devclopment diamond, based on four key indicatos shows the aveae level of developnent in the coutrycompard with its income group. See the introducion.
270

Perumast Same resion/i scamsgroup Next
Lates single year recent LiI T iW higherUR&h of estimate America middle- income
Indkcator measure 1970.75 1950-55 1958493 Caribbean Imncoe ru
Resources and ExpendituresHUMAN RESOURCELSPopulation (mrt!-1993) thousarnds 15,161 19,518 22.886 466.304 1.096.665 500.507Ago dependency ratio ratio 0.88 0.78 0.67 0.66 0.69 0.62Urban Wiof pop. 61.5 67.3 71.2 71.2 54.7 71,2Population growth rule annual % 2.8 2.4 2.0 2.0 1.6 1.7
Urban 114.1 3.2 2.7 1.9 2.9 I.ILabor force (15-64) thousAnds 4,548 6,204 7.758 169,839 459,196 190.136Agriculture % of labor force 43 40Industry IS8 I aI'eniac 22 24 24 27 31 29Pennlesq per 100 FmalesUrban number 99 100Rural 200 96
NATURAL RESOURCESArea thou. sq. km I1.285.22 1,205.22 1,283.22 20,505.92 40.682.67 21,848.1l4Denisity pop. per sq. km 11.80 15.19 17.46 22.29 26.52 22.51Agricultural loud % orland arca 23.68 24.08 24.10 40.00 39.61 41.26Change in agricultural land annual % 0.03 0.02 0.00 0.39 -0.13 0.08Agricultural land under inrigation % 3.73 3.93 4.15 3.41 12.66 8.84Forests and woodland thou. sq. km .. 0.71 0.68 9.37 5.95 8.04Defomestation (net) annual % ... 0.39INCOMEHousehold incomeSham of top 20%of households S of inconec 61 .
Shame of bottomn 40% of households 7 .
Shame of bottom 20% of households 2 .
EXENDITUREFood % ofGDP ,. 24.2
staples .. 5.8Meat, fish, milk, cheese eggs .. 10.4
Cereal imports thou. metric tonnes 1.182 1,227 1,920 27,700 66.281i 4894'7Food aid in cereas 37 216 378 1,565 5,477 544Food production per capita 1987=1 00 110 93 86 101 101 102Fertilizer consumption kgiha 3.4 2.4 2.6 16.1 48.0 67.8Sham of agriculture in GDP % of GDP 16.4 10.2 11.0 9.0 15.7 8.0Housing % of GDP .. 10.4Average household size persons per household 4.8 .
Urban ' ~4.9 .
Fixed investment: homsing % of GDP .. 5.5Fadl and power *b of GDP .. 2.1Energy consumption per capita kg of oii equiv. 472 374 332 913 1,595 1.63'2Households with electricityUrban 5, of households .. 17.5Rural
Transport and comnmnIcation * of GDP .. 7.0Fixed investment: transport equipment . 3.5 2.2Tota road length thou. km 55 68 70I[NVESTMENT IN HUMAN CAPITALHealthPopulation per physician persons 1.900 1,078 943 .. 3,277Population per nursePopulation per hospital bed 400 594 710 517 604 395Oral wehydyratton therapy (under-5) % of eases ... 31 61 .. IEducationGross enrollment ratioSecondary % of school-age pop. 46 63 30 47 53 53
Female 41 60Pupil-teacher ratio: primary pupils per teacher 39 35 29 6. 25"Pupil-teacher ratio: secondary '1 24 21 20Pupilu rcaching gradc 4 % of cohort 82 84Repeater ratceprimary % of total cnroll 10 14Illiteracy % of pop. (age.lS+) 28 18 15 1s 1 9 14Female % of fem.(agel15+) .26 21 1 8 .1 7NLewr crcul~ad pEr thou. po. 9 1 82 71 es 74 125
WofidlJaDKMEOMDOnM =CiDepaMrtmnt Apri IVY5
271

PhilippinesMost Sore rioanlRncome Next
Latest flUgI. year recent Lower- hIgherVil of lesl ake Eat middle- ricame
Indkiaor _ searure 10.75 1980-O8S 19988-93 Ask icorme groMp
Priority Poverty IndicatorsPOVERTYUpper poverty line local cur. .. 4.890 6.334Headcoun:index %orpop. 57 65 62 12
Lower poveny line local curr. .. 2,520 3.072Headcountindex %ofpop. 35 28 24 9
ONP per capita US$ 370 520 850 820 1.590 4,350SHORT TERM INCOME INDICATORSUnskilled urban wages local curr. .. ..
Unskilled rural wagesRural terns ortrade
Consumerprice index 1987=100 21 96 194Lower income ,Fooda 9 97 168UrbanRural
SOCLIL INDICATORSPublic expenditure on basic social services % of GDP .. 1.5Gross enrollment ratiosPuinary %schoolagepop. 107 106 109 118 104 105Male .. 106 113 123Female .. 107 lII 115MorlityInfant mortlity pr thou. live biths 71.0 60.0 42.2 35.5 39.0 35.8Under S mortality .. .. 59.0 60.5 61.5 42.6
ImmunizadonMeasles % age group .. 49.0 85.0 93.0 77.6 82.0DPT i .. 52.0 88.0 95.0 82.2 74.2
Child malnuattion (under-S) .. 33.2 33.0 24.1 .. .Life expectancyTotal years 58 62 67 68 67 69Femae advantage 3.0 3.5 3.7 3.6 5.9 5.9
Total fetility rate births per woman 5.5 4.7 3.9 2.3 2.9 2.9matenal morulity rae per 100,000 live birts .. 80 76 116
Supplementary Povert IndicatorsExpenditures on social swuridy % oftoal gov't exp. 1.5 1.9 1.8Social security coverage econ. active pop. .. ..
Accesstosafewar total %ofpop. 50.0 54.2 8-6 67.1 .. 86.7Urban 67.0 53.0 92.8 83.5 .. 93.9Rurl' 20.0 54.0 72.2 61.3 .. 66.7
Acess t health cam _ .. .. .. .. .. ..
Population grwth rate | GNP per capita growth rate Development diamonde(annual average. percet (annul average, percent) iJfe expectancy
4 -S
2 0-e
2Ftrt7w 7, 4- | e =+ O . I Capita )~eDlcrlment
-2 -101970-75 91085 1988-93 1970-75 198045 1988-93 Access to safe waer
El Philippines Philippines- Lwer-niddlnosmme Lowe-middle-income
& See the technical notut p.38 7 . b. The development diamond, based on four key indicatos. shows the aveage level of develpment in the countycompard with its income group. See the intoducdon.
272

PhilippinesMfost Safm regie>llucaue greuip Next
laests:single year recent iaWii6 higherUna of stinmak BEat mddLe. incomne
ladleaser mowNM, 1970.75 1980495 J988-93 Aska Income RM'2
Resources and ExpendituresHUMAN RESOURCESPopulation (mme=199 3) thousands. 43.0120 54.668 64.800 1,713.883 1,096.665 500,507Ago dependency rmtio ratio 0.86 0.78 0.73 0.54 0.69 0.62Urba % of pop. 35.6 43.0 52.0 31.3 54.7 71.2Population growth rate annual %I 2.7 2.5 2.2 1.4 1.6 1.7
Urban 4.2 5.1 4.3 4.0 2.9 1.8L-abor rerie (15-64) thousands. 15,814 19.874 24.216 942.977 459.196 190.136Agriculture % oflabor force 53 52 IIndustry 316 16 2Remalc 33 32 31 42 312Females per I(10 mialesUrban * number lOS 110Rumal 96 98
NATURAL RESiOURCESArea . thou. sq. km 300.00 300.00 300.00 16,367.91 40,682.67 21,848.14Densily pop. per sq. km 14337 182.23 211.38 103.27 26.52 22.51Agricultural land % of landarma 28.53 33.91 35.11 44.21 39.61 41.26Change in agricultural land annual % 1.02 0.50 0.48 0.24 -0.13 0.08Agricultural land under irrigaton %12.23 14.24 15.09 14.68 12.66 8.84Forests and woodland thou. sq. km .. 0.11 0.03 4.06 5.9S 8.04Deforestation (net) annual i.... 333INCOMEHousehold incomec
Shameofrtop 20% of households % or incomec 56 48 48Share of botomn40%of households 14 1 5 17Share of bottom 20% of households 5 6 7
EXPENDiTUREFood % of CDP' 37.5 38.9
Staples 14.1 16.1 Mnt. rish, milkt. clhcese, eggs 15.5 15.0
Cereal imports thou, mectric monnes 824 1,524 2.03~ 30.006 66.281 48.947Food aid in cereals if89 68 53 447 5.477 544Food production per capita 1987=100 109 99 .97 115 101 102Fertilizer consumption kg/ha 26.7 28.0 47.4 76A4 48.0 67.8Share of agriculture in GDP %Of GDP 30.3 24.6 21.7 17.'! 15.7 8.0)Hodusin % of GDP 6.2 14.6... Average household size persons per household 5.9 .
Urban 6.0 . ..
Fixed investment: housing % of GDP 3.5 2.5Fuel and power % of GDP 1.6 4.0Energ consumption per capita kg of oil equiv. 241 259 328 632 1.595 1.632Households with electricity
Urban % of households...Rural
Transport mnd communication 'I of GDP 1.5 3.0Fixed investment tansport equipment 4.1 0.6Total road length thou. km 99 157 157INVESThIENT IN HUMAN CAPITALHealthPopulation per physician persons 9,080 6,552 8.037 1.063 3,277Population per nurse 2,680 2.683 .. 1.490Population per hospita bed 599 574 647 612 6104 3,95Oral rehydyratom themapy (under-5) * of cases ... 59 32 .. SEdcatIonGros enrollamet ratoSeconday % of school-age pop. 54 64 74 53 53 53Femae . 66 75 47
Pupil-teacher ratio: primary pupits pertwacher 29 3 1 36 23 .. 25Pupil-teachcr ratio.:secondary 3 1 3so5 16Pupils reaching grade 4 % ofcohort 78 77 85 -92Repevrrater:rpsinmay S Of oulemul. 2 2 6illUtracy % of pop. (BPel5+) 17 12 10 22 19 14Femiale % of fenm(agel15+) .. 13 11 36 .. 17
!~ = cmain hu p 16 40 50o. 74 125
273

PolandHart Soma rerlen/ineomegroup Next
L=tatest single ,ear recent Xairiope 7.i vir. higherUnt Of - animalt & Central middle- incene
ladkafor measure 1970.75 15980S 1f8&93 .4 fs Income graup
Priority Poverty IndicatorsPOVERTYUpper povety line local cuIT .. ..Hlcadeount index % of pop. .. ..
Lower poveny lime local cur. .. ..Headeount index %a of pop. .. ..
GNP per capita USS .. 2,020 2.260 2,450 1,590 4,350SHORT TERM INCOME INDICATORSUnskilled urban wages local eu. .. ..Unskilled rural wagesRural terms of tradeConsumer price index 1987=100 12 68 12,597Lower incomeFood .. 70 8.090UrbanRural
SOCIAL INDICATORSPublic expenditure on basic social services % of GDP .. ..Gross enrolnment ratiosPrimd % sehool age pop. 100 101 98 .. 104 105
Male 102 102 99Femnalc 99 100 97
MoralityInfant mortality per thou. live births 27.0 20.0 14.6 24.8 39.0 35.8Under 5 mortality .. .. 17.0 36.4 61.5 42.6
ImmunizationMeasles % age group .. 94.0 96.0 .. 77.6 82.0DPT .. 96.0 99.1 .. 82.2 74.2
Child malnutrition (under-5)Life expectancyTotal yars 70 71 71 69 67 69Feale advantage 3 7.1 8.0 9.0 8.8 5.9 5.9
Toul fertility rate births per woman 2.3 2.3 1.9 2.1 2.9 2.9Matenl mortality rate per I00,001livebirths .. 12
Supplementary Poverty IndicatorsExpenditumson social security % of total gov'tcxp. .. ..Social security coverage % CCiI. active pop. .. ..Accss to sale watcr: total % of pop. .. 89.1 100.0 .. .. 86.7
Urban ' 75.2 94.0 100.0 _ .. 93.9Rural * 12.1 82.0 100.0 .. .. 66.7
Acess to health carm - .. 100.0 100.0
Population growth rate GNP per capita growth rate Development diamondb(annual averg. percent) (annuiavegc,pcet)
4 -5
2 0~ _________________ _ GNP \ Grmoss2 -_______ O - I k I pcr I - - < I psiruay
capitl enmollment
-2 -101970-75 1980485 1988-93 1970-75 1980-85 198-93 Access to safe water
ZI Poland _ PolandLower-mniddle-incorze - Lower-middJeiacome
a. See the technical notes, p.387. b. The devlopment diamond. bLsed on four key indicas shows the avage level of deveopment in the coantrycompared with its income group. See the inutoduction.
274

PolandMfos Same r~eglmubcou. group Neut
___jjLSf1n;!qTrrwani liiruji YThser higherUnit of otat os mdl Income
luaticatar manure 1979.75 1950.5 1988.93 Asia Income group
Resonres and ExpendituresHIUMAN RESOURCIESPopulation (mrem1993) thousandsi 34,022 37,2031 38,303 494,619 1,096.665 500,507Age de-pendency ratio Mailo 0.5!I 0.54 0.52 0.57 0.69 0.62Urban % of pop. 55.4 60,3 63.8 64.8 54.7 71.3Populatilon growth rotie annual % 0.9 0.9 D.2 0.6 1.6 1.7Urban 2.0 1.6 0.9 1.5 2.9 1.8
Labor force (15-64) thousands 18,120 19,221 20,126 237,897 459.196 190.136Agriculture % of labor force 34 29Indursby 37 39Fbitmle 45 45 46 47 31 29Fomoles per IOU males
UrbaLn number 106 106Rural *101 96
NATURAL RESOURCESArea thou. sq. km 312.65 312.68 312.68 24.320.56 40,682.67 21.548.14Density pop. per sq. km 108.51 115.98 122.25 20.20 26.52 22.51Agriculiural land % ofilandamra 63.11 62.12 61.57 .. 39.61 41,26Change in agricultural land annual % -0.17 -0.13 -0.05 -1.28 -0,13 0.08Agricultural land under irrigation % 1.20 0.53 0.53 7.15 12.66 8.84Forests and woodlman thou. sq. km .. 0.09 0.09 0.80 5.95 8.04Defomestation (net) annualS ... -0.06
INCOMEHousehold incomeShun of top 207. of households % of income 33 34 36Share of bottom 40% of households 25 25 23Shum of bottom 20% of households *10 1 0 9
EXPENDITUREFood %of GOP 16.5 18.2
Staples 2.6 2.2Meat, fish, milk, cheese, eggsp 7.8 8.3 .
C'ereal imparts thou. metric taomes 4.075 Z.423 3.142 34,452 66,281 48,947Food aid in ceeas .. 65 200 4.392 5,477 544Food production per capita 1987=100 103 102 101 .. lO 102Feniflizer consumption kgiha 191.0 180.4 63.6 4117 45.0 67.8Sbanm of agriculture in GIDP %.of GDP .. 14.5 6.3 13.5 15.7 8.0Housing % of GIDP 4.5 4.0 .. 6.0Average household size persons per household 3.3 3.3Urban N 3.0 3.0
Fixed investment: housing 7. of GDP 3.6 3.7 . .Fuel and power % ofOGDP 1.1 0.9 .. 1.2Energy consumption per capita kg or oil equiv. 2.924 3.399 2.390 2.959 1.595 1,632Households with electricityUrban 7. of households...Rural
Transport and conumnnacatlon %.of GIDP 3.6 5.3Fixed investmient transport equipment if4.1 1.4Totairomd length thou. km n 301 361INVESTIMENT IN HUMAN CAPITALHealthPopulation per physician persons 700 510 450 362 3.277Population per nurse "255 208 189 249Population perrhospital bed 131 177 179 136 604 395Oral rehydyrouio therapy (unde-5) Sof cassum. . .. 51EdnotlonGross enrollment ratioSecondary % of school-agepop. 73 78 83 .. 53 53
Fcnmk ~ ~ ~ ~ ~ ~ *74 81 86Pupit-teacherramio:pumaypupils pcr teachr 21 is 17 ... 25Pupil-teacher ratio: secondary *14 16 20Pupils reaching grade 4 %OfcohbDrt 98 98 98Repeater mat primary % of total enroll 3 3 2Illiteracy % of pop. (agel15+) 2 ... 519" 14"
Female %Of fent (orels+) ... .. .17
News= circulation t hou. E 248 207 159 . 74 125worr] Mg eraso EconomcsDeatn, April 1 95
275

PortugalMost Same awgloxfincoioa group Next
Latl sliWgle7 ar reant - ir-w W-i Upper. higherUnitr f etimate & Central middle income
Indlictor mearare J97075 1980JS I19H-93 Axie income grow
Priority Povert IndicatorsPOVERTYUpper povery line local curr.
Headcount Index % of pop. .. ..Lower poveny line loal0 Cilt .. ..Headcooun index lb of pop. .. ..
GNP per capita USS 1.910 2,220 91130 2,450 4,330 23,680SHORT TERM INCOME INDICATORSUnskilled urban wages local curr. .. ..Unskilled rural wagesRural terms of trde*Consumerpriceindex t9r A100 I1 82 181
Lower IncomeFood .. 84 167
UrbanRural ..
SOCIAL INDICATORSPublic expenditure on basic soial services Ii of GDP .. ..Gross emromlent ratiosPrimary %schoolaBepCp. 113 124 120 .. IOS 103
Male 114 127 121 .. .. 103Female III 121 118 .. .. 103
MortalityInfant mortality per thou. live births 45.0 20.0 9.6 24.8 35.8 7.0UnderS mortality I .. .. 11.0 36.4 42.6 8.5
ImmunizationMeasles % age grup .. 70.0 96.0 .. 82.0 82.5DPT . 72.0 95.0 .. 74.2 90.2
Child malnutrition (under-5) .. ..Ufe expectancyTotal years 68 72 75 69 69 77Female advantage 6A 7.0 6.9 8.8 5.9 6.4
Total fertility rme births per woman 2.8 2.0 1.6 2.1 2.9 1.7Matermal mortalit rate per 100,000 live births .. 15
Supplenentary Poverty IndicatorsExpenditurecs on social security * of total gov't exp. .. ..Social security coveage * econ active pop. .. ..Access to safe water: total % of pop. .. 92.2 100.0 .. 86.7
Urban .. 97.0 100.0 .. 93.9Rural .. 90.0 100.0 .. 66.7
Access to heal care .. 100.0 .. .. ....
Population growth rate GNP per capita growth rate Development diamondb(annualxaveage percent) (amu.liaerage. percent) Lif ctanc
4
12 .G_O l NP 4 IGross
capit enrollment
-2 -101970-75 1980-85 1988-93 1970-75 1980-85 19B8-93 Acctoso& water
QIPortugal - Posnga- Upper-midde-income Upper-middle-incowme
a See the teehid noe, p387. b. The development diamond, based on four key indicat shows the average level of developnent in the countrycompaed wit its incoms group. Soe the introduetion.
276

Pt dugifalMen Same regIlwkomadueeuu n Nant
Lam ulnhlerar m~reet *iT U p v iher
Indicator Rmanur 197075 Il9J5 ZN&33 Asi luceneam greResources and Expenditures
HtUMAN RESOURCESPopulation (nureul[99S) ihouxmdu. 9,093 9,904 9.842 494,619 500,507 112,447Age dependency ratIo ratio 0.61 0.55 0.50 0.57 0.62 0.49Urban %of pop. 27.7 3124 34.8 64.8 71.2 77.9Population growth rute annual % 0.1 0.3 .0.1 0.6 i.7 0.6
Urbani 2.4 1.6 1.3 1.5 1.8 0.1Labor fores (15S64) thousands 3,875 4,63 4,859 23789 190.136 395,641Agriculture % of labor fcite 28 26Industry 635 37Female 3 1 36 37 47 29 38Femailes per 1 00 males
Urban number . lRural .. l
NATUPRAL RESOURCESArca thou. sq. km 92.39 92.39 92.39 24,320.6 21I141.14 32Z146.15Density pop. per sq. km 98.42 107.20 106.61 21020 22.51 25.11AgrlculLural land % of land arca 43.032 43.44 43.62 .. 41.26 42.80Change In agricultural land amnnua S 0.13 0.08 0.00 -1.28 0.08 448Agricultural land under ir-igation S 15.80 I5.77 15.75 7.115 8.84 13.96Forcsts and woodliand thou. sq. km .. 0.03 0.03 0.80 1.04 10.56Derformstation (nct) annual % .. -0.46 .
INCOMEHousehold incomeShare of top 20% of households S of income 56 .
Share of bottom 40% of households 2 1 Share of bottom 20% of households *7 .
EXPENDrJhItEFood %ofGDP . 24.1 19.4 ... AStaples 6 .6.0 3.3 ... 1.6Meat, fish, milk, cheese, eggsp. 10.8 11.3 ... 3.8
Cereal imports dou. metric tonnes 1.738 2.25 2,147 34A452 48,947 77,530Food aid in ccmals *90 255 .. 4.392 544 aFood production per capita 1987=100 105 90 100oo 102 95Fertilizer consumption kg/ha 62.9 60.3 64.3 41.7 67.8 150.0Share of agriculture in GDP S of'CGDP .. 8. 5.3 13.5 8.0 1Housing % ofUGDP 6.1 LI1 6.0 .. 11.7Average household size penons per household 4.0 .
UrbanFixed itvesttnienc housing S of GDP 50 33 6.3 5.i. 5.0Fuel and power %ofGDP .. 23 2.3 1.2 .. 2.0Energy consumption per capita kg of oil equiv. 1177 1.152 1.731 2,959 1,632 5,203Households with electricity
Urban S of households...
Transport and conmmunlcatlon S of GD?P. 9.0 10a. . 8.8Fixed ijavesutren transport equipment 1.8 2.2 3.1 ... 2.1Totalroad length thou. km 47 52 70INVFSTrMET IN HUMAN CAPITALHealthPopulation per physician poisos 1,061 402 .. 362 .. 4S3Population per nurse s 57 ... 249Population per hospital bed 193 .. 226 136 395 145iOral rehydyration ftherpy (under-5) % of css......51EducationGross enrolment ratioSecondary S of school-age pop. 53 56 68 . 53 92Female 52 597 74 ... 94
Pupil-teacherrauio: primary pupils per teache 20 17 14 .. 25Pupil-teacher ratio: secodary -22 14 1 1Pupils reaching gmade 4 5 of cohort 91 .
Repeawerrate: pinuiay Of towaienrofl II 1 7 14Illiteacy % of pop. (OF lS+) 29 IF, 15is1Female % of frm (agelS4-+) .. 23 19 .. 17
Newj= circulation a thou. gm. 67 42 47 .. 125 32D
277

Puerto RicoMail Same. iwto,i/lnfai jreuo r Nel
fatat shwe uiewni T i - -Ukji higherrim ft of . AstMlraf Anmri mniddl. Inceme
Indicafor ,m.au,. 1970.75 19595 1991JJ3 Caribbean Income groUp
Priority Poverty IndicatorsPOVIERTYVUpper poveny line local cur. .. ..Handcount Index 9b or pop. .. ..
Lower poverty linz local cur. .. ...Hadcount index 9boIpp. .. .. pop,
ONP per cupia USS 2.690 4,290 71'Q 2,930 4.350 23,610SHORT TERM INCOME INDICATORSUnskilled urban wages local curr. .. ..Unskilled rraml wagesRural terms or tmdc * .. ...
Consumer price Index 197.100 ,. ....Lower IncomeFood' " 36 97 139UrbanRural
SOCIAL INDICATORSPublic expenditure on bsic social services % of DP .. ..Gross enrollment rtilosPrinumy % school age pop. 107 94 . 107 105 103Male I.0
Fema 103Moraity
Infant morw ity perthou. live births 25.0 17.0 10.6 43.0 35.8 7.0Undcr 5 morWality S.. .. .. 2.2 42.6 8.5
ImmunizationMeasles * age goup .. .. .. 78.7 82.0 82.5DPFr . .. 73.7 74.2 90.2
Child mal.,utbition (under-5)Utfe V - cy
TotrA year 73 74 75 69 69 77Fer .go " 7.2 7.0 7.9 5.3 5.9 6.4
Ti Ie births per wonan 3.0 2.5 2.2 3.1 2.9 17Matt y ratc per 1 00,000 live births .. .. 21
Supplementary Poverty IndicatorsExp7 security % or totl govtexp. .. ..
Soci- wge % econ. active pop. .
Acces -T: lotd % of pop. .. .. .. 80.0 86.7L 82.8 .. .. 90.1 93.9Ri " 32.1 .. .. 57.6 66.7
Accetb r "eth care
Population growth rate GNP per capita growth rate Development diamondb
6 (anul avaaMge. percent) (anmual aveage, pcrcer. life exPectacy
4 -5 - 5 1
F- G~~~NP rs
E:= c~~~~~~~~~~~apt nrollmentI -s
-2-11970-75 19D10-5 1989-93 1970-75 1980-85 1988-93 Access to safe water
E Puerto Rico F Fuero Rico- Upper-middlemincome Upper-nmddle-income
a. See die technical motes p.387. b. Ilb dcvelopment diamond, based on four key indicartom shows the avcrag level of development i the countryconmard with its income group. Sce the introduction.
278

Puerto RicoMaue Sac regleulacem grasp Nazi
Latet single year recent La"~ Upper- k4gke(Ain tof -- fhise Ameria Middle frmem
Indicatr Hmeaur 197WS 1,80-as If8&93 Cari.bee baves group
______________ Resource and ExpendihtesmHUMAN RFSOURCESPopulutlun (ure=1993) thousands 2.993 3.366 3.616 466.304 500.507 812,447Age dependency ratio ratio 0.66 0.61 0.56 0.66 0.62 0A49Urban % of pop. 62.13 69.2 72.6 71.2 71.2 77.9Populadongrowth raw annua 5. (.9 1.0 0.8 2.0 1.7 0.6
Urban *3.4 1.6 1IA 1.9 1.8 0'sLabor rorce (15-64) thousands 928 1.100 1.312 169.839 190.136 395.641Agriculture % or labor roa..r.c.IndustryFemale 28 29 29 27 29 38Femnales per I100 males
Urban numiber III 113 .
Rural 103 103 .
NATURAL RESOURCESArea thou. sq. km 8.90) 2.90 8.90 20,505.92 21,848.14 32,146.15Density pop. per sq- km 336.29 378.20 403.09 22.29 22.51 25.11Agricultural land % of land atma 55.64 52.03 51.69 40.00 41.26 42.80Change in agrcultural land annual 5. -0.20 -0.65 -0GA3 0.39 0.08 -0.48Agricultura lan under irrigation % 7.91 8.46 8.52 3A41 8.84 13.96Forests and woodland tho. sq. km - 0.00 0.00) 9.87 3.04 10.56Deifesmidon (net) annual . ORD. .0
INCOMEHousehold incone
Sham of top 20% of households % of income . ..
Sham of bomtm 40% of households . ..
Shamc of bomtom 20% of households ... .---
EXENDiUTREFood %ofGJDP ..-. .- 8.4
Staples .--.. 1.6Meat, fish, milk, cheese, eggs .- ..- 3.3
Coed import thou. mettle tons . . 27.700 48.947 77.53Fbod aid in cereals .- .. 1.565 544 IFoodoDroduction per capita 1907=100 1078 89 S 101 102 95Fertilizer consumption kgtha . .. 16.1 6719 150.0Share ofagriculture in GDP %ofGlDP 3.3 i.i i.i 9.0 8.0 -Housing Sot GDP .-..- - II.?Average household size persons per household 4.2 3.7 .
Urban N4.0 ... .
Fixed investment housing Sof GDP -.. .-. 5.0Fuelaiud powe % ofGDP ... .. .2.0
Energyconsumption per capita kg oroil equiv. 3,217 1,954 2,018 913 1,632 5.203Households with electricity
Urban % ofhouscholds . .. ..
Rural . ..
Transport and commutleadon 5. f GDP ..... . .
Fixed investment trnsport equipment. .. .. 2.1Tota roadlength thou. kman 9 .
INVESTMENT IN HUMAN CAPITALHealthPopulation per physician perSon ... . . 453Population per nurse . ..
Population per hospita bed51 914Oral rehydyration therapy (uuder-5) S of cassu.m.. 61 51EducatIonGros enrollment ratoScotdary S ol'school,-ag pop. 78 74 .. 47 53 92
Femle.-..... - 94Pupil-teacher rato. primary pupils per teache 22... 26 25Pupil-teacher ratio: secondary... Pupils maching gmde 4 % of cobalt 87..Repeater rate primay 5. Of tot al u enoi. .-
Iliteracy % ofpop. (agels5+) 12 1 1 is 1 14Female % offtm (RVel5+) ... .18 17
Ne 7aercircuation per tha po. 138 178 141 as 125 320WrdBank Inftenmatna ECOonomis Dlepacuent, Apnil1995
279

QatarMeat Some reginowIume group
t eat saigk year reentUnit q atimtae High-
Indl ator m r _ 1970.75 1980485 1988-93 incomePriority Poverty Indicators
POVERTYUpper poverty line local curr.Hcadcount index 6 of pop.
Lower poverty line local curr.Headcount index * of pop.
GNP per capita US$ 8,590 18,400 15.030 23.68DSHORTTERM INCOME INDICATORSUnudklled urban wages local curr.Unskilled nial wagesRual tcins of tradeConsumerprice indcx 1987=100 .. 96 116Lower incofie.
UrbanRural
SOCIAL INDICATORSPublic expenditur on basic social services li of GDPGross enollment ratiosPrimauy % school age pop. 111 122 95 103
Male 116 124 98 103Fcmale c 107 119 91 103
MortalityInfant mortality per thou. live births 57.0 34.0 19.4 7.0Under S mortality .. .. .. 85
ImmunizationMeasles k apge groep .. 620 73.0 82.5DPI .. 71.0 81.0 902
Child malnutrition (under-5)Ufe expetny
Total yeau 63 68 72 77Fmale advantage 3.7 4.4 5.4 6.4
Total fcility rate births per woman 6.8 5.5 4.3 1.7Maenal mortality rae per 100.000 live births - 19
Supplementary Poverty IndicrtorsExpenditurs on social security % of toal govt cp. .. ..
Socid security coverage b econ. active pop. .. .. -
Accesstosdewaer total %ofpop. 97.0 91. 913Urban 100.0 98.0 100.0Rural 83.0 50.0 47.7
Access to helth care .. 95.0 100.0
Population growth rate GNP per capita growth rate Development diamonde
6 (annua a g pecet 1 (annual avege, perent) I expetncy
4 5
0- _- - per
-2-01970-75 1980-85 1988-93 1970-75 1980-85 1998-93 Acc to safe water
1 Qar Qatar- High-in e - High-income
a. See the tecmical no p.387. b. The deopment dimond based on four key indicatoms, shows th averaglevel of development in the wmutrycmpaed wil its income grup. See the intoductiaLo
280

QatarMze Saw reglonaliceegroup
Let zu0s eyear - recengUnit ef astmae N4gh-
lndicater mmvgre 197867S 1910.8S 1986593 Inome
Resources and ExpendituresHUMAN RESOURCESPopulation (mre=1993) thousands 171 358 524 812.447Age dependency ratio mdo 0.55 0.40 0.40 0.49Urban % of pop. 829 87.9 90.8 77.9Population growth rate annual * 8.6 8.9 2.6 0.6
Urban 9A 9.S 2.9 0.8Laborforce (1544 thousands 83 146 202 395.641Agriculture %oflabor roae 6 3Industry ' 28 28Female 4 7 8 3BFemalics per 100 males
Urbam numberRural
NATURAL RESOURCESArea thou.sq.km 11.00 11.00 11.00 32146.15Density pop. per sq. kin 15.55 32.55 46.40 25.11Agricultural land % of land nca 4.73 491 5.18 42.80Change in agricultural land annual % 0.00 0.00 0.00 -0.48Agricultural land underirnigation % 1.92 9.26 14.04 13.96Forsts and woodland thou. sq. km .. 0.00 0.00 10.56Deforestation (net) annual * .. .. .23INCOMEHousehold income
Share of top 20% of households % of incomeShare of bottom 40% of householdsShare of bottom 20% of households
EXPENDrrUREFood %ofGDP .. .. .. S.
Staples '. .. .. 1.6Meat, fish milk, cheese, eggs .. .. 8
Creal imports oua mentictoanes 12 97 128 77.S30Food aid in cercals .. 8Foodproducdonpercapita 1a97=1IO .. .. .. 9SFertilizer consumption kg/ha 3.9 10.7 26.3 150.0Share of agriculture in GDP %ofGDP _Houig %ofGDP .. .. _ 117Average household size persons per household .
UrbanFixed investment housing %ofGDP .. .. .. 5.0Ful and power %ofGDP .. .. _ 2.0Encrgy wnsumpdon per capita kg of oil equiv. 12.170 15.089 16,196 5.203Households with electicity
Usban % of households .
RuralTransport and ccmmukmatio % ofGDP .. .. .. 8.8Fixed investment tansport equipment L .. .. .. 2.1Total road length thou km .
INVESTMENT IN HUMAN CAPITAL
HealthPopulalion per physician prsons 1.947 1,361 665 4S3Population per nurse ' 558 485 16Populaionperhospitalbed ' 181 342 .. 145Oral rehydyration dmt py (undcr-5) * of Gases . .. 20EducaionGross nrollment ralioSecondaiy % of school-ag pop. 52 74 82 92
Femalc 56 79 83 94Pupil-teacher raio: primary pupils per teahr 17 10 7 .Pupil-teacher ratio: secondary ' 13 9 7Pupils reaching gade 4 % ofcohoxt 97 99 90Repeater mte primary % of total eno 22 11 7UGiteacy % of pop. (a 5+) .. 24Female %of km (aBP 15+) 28
N sankcircnation Echoonom. c 168 13s 320W crld iSculation1t3on2cs Depa0ment, Apr I9S
281

ReunionMest Sane egfemeJi em gret Net
Laing sinle year rmet tab. UPPer. higeUNi of 'L. ate Sduu MIde. Income
Ind;cakor waeure 1970-75 19189S 19J8-93 Arca income gptump
Priority Poverty IndicatorsPOVERTYUpper poverty line locml curr. ..
Headcount index % of pop. ..Lower povct line local curr.Hcadcount index % of pop. ..
GNPpercapita USS .. .. .. 520 4.350 23.680
SHORT TERM INCOME INDICATORSUnskilled urban wages local curr. ..Unskilled rual wagesRural lenns of trandeConsumerpriccindex 1987=lJO 39 95 124
Lower incomeFoodt' .. ..Urban .. 96 14.Rurml
SOCIAL INDICATORSPublic expenditure on basic socidal services % of GDP ..Gross enrollment ratiosPrimary % school age pop. .. _ .. 67 105 103Male ' .. 74 103FemWdc ".. _ .. 60 . 103
MortalityInfant motality pr thou. livc birts 41.0 14.0 7.8 93.1 35.8 7.0UnderS mortality .. .. .. 172.3 42.6 8.5
ImmunizadionMeasles % age gDup .. .. 49.9 82.0 8Z5DFr .. 1 .. 1.9 74.2 902
Child nalnutrition (under-5)Life xpctancy
ToW years 64 70 74 52 69 77Female advantage- 7.7 9.1 82 3.3 5.9 6.4
Tol fertility rate birts per woma 3.9 2.9 2.3 6.2 2.9 1.7Matenal mortity ram per 10.OOO live births .. 31
Supplementary Poverty IndicatorsExpcnditures on social security % of totl govt exp. .. .. ..
Social secity coveragc * ecozL active pop. .. .. .. _Acears to safe watr total % of pop. .. _ _ _ 86.7
Urban ' _ .. _ _ 93.9Rumal _ .. _ _ 66.7
Access to health care __ _ .. ____ _
Population growth rate | GNP per capita growth rate Development diamondb(anual avera pet)5 (nual ava percent) fe c
2 -* . O~~~~~~~~~~0 - U | per 4 %m P4
2 0 ON..P~ 9flfl3
0 -5
.2 -101970-75 19805 1981-93 1970-75 19S085 1918S93 Access to sa r
rJ Rdnio_ Riniols- Upper-middle-incomc - Upper-iddle-in me
a. Seete technikal nous. p.387. b. Tc development diauond, based on fiur key icors shows the avp lev of devopmnt in the c ycompaued with its income group. See heintodcion.
282

RuiunionMest Same regleuineeme gro&p Next
Latest jin gle yer rween SW7 74JIrW higherfin I of esftiate SeAkm, middle- incoern
Indiceir nmeaure 19'70-75 195945 1988-93 Africa Income grouipResources and Expenditures
HUMAN RESOURCESPopulatlou (mre=I993) thousans 483 550 633 5583978 500,507 8 1'2,447Age dependency ratio rude 0.83 0.63 0.55 0.94 0.62 0.49Urban % of pop. 49.1 59.5 66.2 29.8 71.2 77.9Populaton growth irate annnal Sb 0.9 I.7 1.6 2.9 1.7 0.6
Urbanl 3.2 3.3 2.7 5.0 1.8 0.8Laiborforce (1544) thousands 152 209 252 229.480 190.136 395.641Agriculture %of labor force 28 18 .
IndLstry a1 9 1 7 Female 27 33 34 36 29 38Females per 100 nudesUrban number . ..
NATURAL RESOURCESAma ~~~~~~~thou. sq. km 2.51 2.51 2.51 24.273.63 21,84B.14 32,146.1i5
Density pop. per sq.lckm 192.43 219.12 248.26 22.37 22.51 25.11AgrilcubHu land Sb of land area 22.40 26.00 24.40 52.54 41.26 42.80Clang. in agrcultural lan annual Sb 0.00 0.00 -3.17 0.06 0.08 -0.48Agricultural landwuder irrigation Sb 8.93 7.69 9.84 0.83 1.84 13.96Forests and woodfland thou. sq. km - 0.00 0.00 5.32 8.04 10.56Deforestation (one) annual Sb... 1.07INCOMEHouseholddinom
Share of top 20% of households Sb of income . ..
Shaw of bottom 40% of householdsShaow of bottom 20% of households
EXENDTUMEFood Sbof GDP 8.. . .4.B
Staples " .. .. .1.6
Meat fish, milk, cheese, eggs * .. .. .3.8
Ceral imponts thou. mectric tonnes 94 139 217 13,157 48,941 77,530Food aid incereals ... . 5.079 544 8Food poductioinper capita 1987=IOD 88 92 97 101 102 95Ferixilcconsmption kglh 233.3 219.6 247.2 4.6 67.81 150.0Sham of agricultum in GDP % of GDP ... . 16.3 8.0flunlug Sof GDP ... .. . 1137Average household size persons per household . ..
Fixed investment housing Sb of GD?P.. . .. 5.0Fuel and power Sb of GD?P.. . .. 2.0Energ consmption per capita kg of oil equiv. 350 722 6711 257 1,63'2 5.203Households with electricity
Urban S of households . ..
RuralTraupot and cunmuulcaUo S of GD?P.. . .. 8.RFixed investment tamnspon equipumen .. . . 2.1Total road length ithou. kmIan..
1NVEWTMENT IN HUMAN CAPITALHealthPopulation per physician persons 2.665 1.449 .-.. 453Population per nre259...Populaton per hospital bed 121 -.- 1.269 395 145"Oral rehydyration therapy (undert-5) Sb of cawses. . 37 51
GrossaenrolmetriodSecondamy Sb of school-ag pop. I. . 8 53 92
Female .--. .94
Pupil-teacherratim. psimazy pupilIs per teacher 26 1 9 .4025 -PUPl-fteacher ratio: secondary -22 1 6 . ..
Pupilreachi ngg d4 % of cohort .. 91-Repeaterratcpriiuary % of total enroll 22 1 6-... illitracy %bofpop. (agel15+) .. 21 so5 1 4
Female % Offtin.(agels+) .. -62 1 7ne=7 erckirlation pe thou. p. 56 89 88 12 125 320
wom mmic jnmatiaridDeparmen AMn 19*
293

RomaniaMost Sme regioenincume greup Next
LAtest single year recent Eiurope l-ewer. higherUnmt of atmate & Central middle- Income
Indicator mensure 1970175 1980-US 1988-93 Asia Income group
Priority Poverty IndicatorsPOVERTYUpper poverty line local curr. .. ..
Headcoun index % of pop. .. .. .. ..Lower poverty line local curf. .. .. ..Headcount index % of pop. .. .. .. ..
GNP pcr capita USS .. .. 1,140 2.450 1,590 4,350SHORr TERM INODME INDICATORSUskild wbt wages loca curr. .. .. .. ..
Umddiled mrl wagesRWDI trms of radeConsume pricc index 1987=100 .. .. .. .. ..
Lower incomePboe
Urban
SOCAL INDICATOiRSPublic expenditum on basic social services % of GDP .. .. .. .. ..
Gwrss cnollment ratiosPrimay school agc pop. 107 98 88 .. 104 105Male 108 98 8S ..Female 107 98 87 ..
MoralityInfan monfaliy per tdou. live births 40.0 26.0 23.0 24.8 39.0 35.8Under SmDortality .. .. 29.0 36.4 61.5 4Z6
InmuixtionMeaes % ag group .. 88.0 92.0 .. 77.6 82.0DPT * 95.0 97.0 .. 92.2 74.2
Child nalnmtxidon (under-5)Life expectnyToa years 69 70 70 69 67 69Female advantage 4.5 5.7 6.7 8.8 5.9 5.9
Tomlfertilityrat birthsper wanv 2.6 2.2 1.5 2.1 2.9 2.9Maternal mraility rate per IDO.000 live bihs .. S0 .. .. ..
Supplementary Poverty IndicatorsExpenditures on soi secuity % of total gov't cxp. .. 16.6 22.8 .. ..
Social security coverage S econ. actve pop. .. .. .. .. .. ..
Access to safe waer tubl % of pop. .. 95.0 100.0 .. .. 86.7Ura . 100.0 100.0 .. .. 93.9Rurid .. 90.0 100.0 .. .. 66.7
Access to health carem 100.0 . ..
Population growth rate GNP per capita growth rate Development diamondb(ann4a aveg. percent) 10 (amu-averag percent, fectacy
4 -- 5
GNP Gross2 -- *-- * O0 I I-.t,< _ ^ Prl < e Ipprimzy
capita / nrollment
-2-01970-75 1980.85 1988-93 1970-75 1980-85 1998-93 Acces to saM wate
2 Romania - Romania- Lower-middle-incom - Lowcr-middle-income
a See the technical notes p387. b. The developmenw iamond. based on four key indicalors. shows the average levd of devclopment in the countrycompared with its income gromp. See the intuction.
284

RomaniaMeo Suie reglpluJIucomnegrou Next
Lateest ingle Oear recnt Euope~ Dies igherCunitf estImate A Cent,. midl- incoern
Indicator measure 1970.75 .1980-U5 1.988493 Asia lucerner group
Raesurce and ExpendituiresHUMAN RESOURCESPopolatlon (mme=1993) fthusands 21,245 22.415 22,761 494,619 1,096,665 500.507Age dependency ratio ratio 0.53 0.52 0.51 0.57 0.69 0.62Urban % of pop. 46.2 51.1 54.6 64.8 54,7 71.2Population growth rate annual % 1.0 0.2 0.2 0.6 1.6 1.7
Urban 2.9 1.0 1.0 1.5 2.9 I.eLabor force(1-)thousands I1.107 11,418 12,082 237,897 459,196 190.136Agriculture Sof labor forte 40 31industry 37 43Female 45 46 47 47 3'1 29Females per 100 males
Urban number 100 .
Rural 15NATURAL RESOURCESArea thou. sq. km 237350 237.50 237.50 24,320.56 40.682.67 21,848.14Density pop. per sq. km 89.45 94.38 95.65 20.20 26.52 22.51Agricultural land % of land area 64.89 65.21 64.21 .. 39.61 41.26Change in agricultural land annual 1'0.11 0.19 -0.05 -1.28 -0.13 0.08Agricultural land under inigation % 9.86 19.68 20.96 7.15 12.66 8.84Forests and woodland thou. sq. km .. 0.06 0.06 0.80 5.95 8.04Deforestation (net) annual S .. 0.00INCOMEHousehold incomeShut or top 20% of households S of income ..
Shar or'bottm 40% of households;Shaacorbottom 20%ofhbousholds
EXPENDITREFood %ofGDP 19.1 .
Staples -4.1 --
Meat, fish, milk, cheese, egg 9.1 .
cecal hopons thou. metric tonane 1.28 33'1 2,649 34.452" 66.281 48.947Food aid in ceral 123 .. 180 4,392 5,477 544Food prduction per capita 1987= I00 92 115 87 .. 101 102Fertilizer consunmption kglha 80. 1 91.5 28.5 41.7 48.0 67.8Shiamof agiiculrrein GDPF SofGDP 14.6 14.0 20.5 13.5 15.7 8.0Housing S of GDP 3.7 ... 6.0Average household size peucos per household...
UrbanFixed invessmcnt housing %ofOGDP.. 36.52Fuel and power % ofGDP IA ... 1.2Energy consumption per capita kg of oil equiv. 2,351 2.818 1,785s 2,959 1,595 1,632Households with electricityUrban % of households...-Rural
Transport .. d communIcation Sof GDP 3.6 .. . --
Fixed investment twanspa equipment 2.11.Totalmrad length dhou. kin. 73 73
INVELSTMENT IN HUMALN CAPfTALHealthPbopuation per physician PriCSon 4 560 536 362 3.277PoprIaton per nurs 431 275 - 249Prpulatioa per hospiabed 120 112 127 136 604 395rjrsl rhydyrozon theapy (under-5) % of cae .. ... 5 1EducationGross enrolment ratioSecondary S of school-ag pop. 65 75 8so. 53 53Female 66 76 80
Pupil-maJchr ratio: primary pupils perteacher 20 .. 21 ... 25Pupil-reacher ratio: secoadary 17 14 14Pupilsrmaching gmde 4 % of cohort 90 -- 90 ...
Repeate rate: primairy % of total enroll . -4 -
illiteracy % of pop. agel5+) ... .5 19 14Female % Of em. (age 15*) -.. .- .17
NMewsqecirculation per tho. pop 129 161 330 . 74 125worl HM merMona EcnmuisDepaUnent AprdlI*5
285

Russian FederationMost Same regonxIncomegrop Nex
&ar rlle r recentf 7 EirFp Th er. higherUrnof estimate & Centrl middle- Income
Indlcor measmre 1970&75 1980-85 19W8-93 Asia income group
Priority Poverty IndicatorsPOVERTYUpper povery line local cur. .. ..
Headcount index % of pop. .. ..Lower povery Hr. local curr. .. ..Headcount index % of pop. .. ..
GNP per capita US$ .. .. 2.34D 2.450 1.590 4,350SHORT TERM INCOME INDICATORSUnskilled urban wqas local curr. .. ..Unskilled rura wagesRual tams of tudcConsumerprice index 1997=100 .. . 31.378Lower incomeFoo*e
UrbanRur'l
SOCIAL INDICATORSPublic expenditum on basic sociW services %ofG DP .. .. 7.6Gress enwllment rtiosPrimary %schoolagepop. .. .. 91 .. 104 105MaleFemale
MomltyInfant mortaty per thou. live births 2B.0 26.0 20.6 24.8 39.0 35.8UnderS mortality .. .. 31.0 36.4 61.5 42.6_nmizationMeasles % age group .. .. .. .. 77.6 82.0DPT .. .. .. .. B2.2 74.2
Child malnutrition (under-5)Life expectacy
Total yeas 68 68 67 69 67 69Femaleadvantage 10.4 11.3 11.9 8.8 5.9 5.9
Total fertlityrate birtts per woman 2.0 2.0 1.5 2.1 2.9 2.9Malenal morality rae per 100,000 live birdts .. 68
Supplementary Poverty IndicatorsExpenditurs on social security % of total govt exp. .. ..Social security covrawge S ccon. active pop. .. ..Access to safe wat total % of pop. .. .. .. _ .. 86.7
Urban .. .. .. _ .. 93.9Rural .. .. .. .. 66.7
Access to health cae _ .. .. .. .. .. ..
Population growth rate GNP per capita growth rate Development diamonde(anual avage. pecent) (amual ava e perl) Life r
4 -5
+ SNP / \ ~~~~~~~~~~Gross2 0 - Iper primy
0 m m I capita' enrollment
-2 -101970-75 1980-85 1988-93 1970-75 1980-85 1988-93 Access to safe water
M Russian Federadion - Russian Federation- Lower-middle-inome - Lower-middle-income
a. Sec th tchnical nos. p.387. b. hr development diamond, based on four key indcaors. shows the average level of developmcnt in the countrycompared with its income grxup. Soc the introductiorL
286

Russian Federationmost Seinergncanr Next
[At"s single year_ recn XrjTiw highierURnk of estwimae &Centra middle- income
Indkcator measure 1970.75 2980485 J988-93 Asiff knome groupResources and Expenditure
HUMAN RESOURCESPopulnatin (nirea193) thousands 134,233 142,317 148,6731 494,619 1.096.665 500.507Age depedency rado ratIo 0.47 D.. .57 0.69 0.62Urban % of pop. 664 7139 75.2 64,8 54.7 71.2Population growth rate annual % 0.6 0.6 0.6 0,6 1.6 1,7urban N1.8 1.1 1.1 1.5 2.9 1.8
Labor force (15-64) thousands .. 74.937 7Z.610 237.197 459.196 190.136Agricultume % oflabor force . 1 4 1 4industry420FPeroat S .. 4 47 3 1 29Feanleis per I100 males
Urban number...Rural
NATURAL RESOURCESArea thou. sq. kin 17,075A1 17.075A1 17,075.41 24.32,0.56 40,682.67 21.848.14Density pop. pe-r sq. km 7.86 8.33 8.66 20.20 26.52 22.51Agriculiural land % of lmd azea . ... 39.61 41.26Chanpein agriculmdlurlad annual5 .. -0.23 -1.26 -1.28 -0.13 0.08Agricultura land under inrigaton '1 1.67 2.66 2.81 7.15 12.66 8.84Forests and woodland thou. sq. Ian. . . 0.80 5.95 8.04Deforestation (net) annual Va,..
INCOMEHousehold intcomeShareof top 20% of households % of income . . 48Shaaeof bottom40% of households ... 14Shar of botom 20% of households ... 4EPMmfRFood % of GDP ... 1514
Staples ... 2.4Meal, fish, milk, cheese, eggsp.. 6.0
Cercal imports thor.n, mtric tonnis ... 11.238 34.452 66.281 48.947Food aid in cercals ... 1,124 4,392 5,477 544Food production per capita 1987= I00 ...... 101 102Fertilizer consumption kgtha ... 26.2 4137 48.0 67.8Shiameofagriculturcin GDP %ofGDP I. 11. 9.1 13.5 15.7 8.0Housing %Of GDP ... 3.1 6.0Average, household size persns per household ... 3.2
UrbanFixed investmnent: housing Va of GDP .. 5.7 5.2Furel and power % ofGDP ... 0.7 1.2Energy consumption per capita kg of oil equiv. ... 4.411 2,959 1.595 1.632Housbehlds. with electricity
Urban Va of households...Rural
Transport and comununicatlon %aof GDP ... 4.2Fixed invesment tranport equipmecnt ... 11.9Total mad length tho. kmn 638 783 934INVESTMENT IN HUMAN CAPITALHealthPopulation per physician persons 286 220 222 362 3,277population per nurs 95 9290 249Population per hospitalbed 81 73 78 136 604 39'5oral rehydyration therapy (wnder-5) Va Of cases . .. .. 51EducationGross enrolment ratioSecodary I, of school-age pop. ...... 53 53
FemalePupil-teacher ratio: primary pupils per teacherr. .. . 25Pupil-teachr rato: secodaryPupils machin gradce4 % Ofcohort...Repeater rate: primary Va of total enrll. ...-.
Illiteracy % of pop. (agelS.) ... 25 19" 14Female Va Of fern (age 15+)0 .. .- 17
Newsje circulation mr thou. go. ...... 14 125WrldaEnk Iatemratonal Economics [Depnnent. Apnt I S
287

RwandaMea Sae rFge,x &cuA egrou Ncxt
Lael sgle yer recaNt SU- bighrUng of na .d SE rAn Low- Income
ladlk atr at MJE70[7475 198-S 198&93 Afria Income prorlpPriority Poverty Indicators
POVERmUppepoveruP " e localcurf. 4.276 13.810 17.999Hedcountindta *ofpop. .. 40 53 .. 19
LowerpovertylHne local cur. 3,450 11.142 14,522Headcount indox % of pop. .. 20
GNPpcrccapita USS IWO 270 210 520 380 1.590SHORT TERM INCOME MNDICATORSUnskilled tan wages local curr. .. ..
Unsdilled or wapesRurd tem of b.adeConsunmr price index 1987=100 41 97 160Lower income
Urban 33 ...
RuralSOCIAL INDICATORSPublic expendihare on basic social services Sof GDP .. 3.3 4.1Gross emlluant ratiosPrimay % school age pop. 56 63 71 67 10 104male 61 64 72 74 116Female * S1 61 70 60 101 ..
MoralityInfant matnity perthou. live births 142.0 124.0 109.0 93.1 63.1 39.0Under Sn udwity .. .. 141.0 172.3 101.4 61.5
Ihmmrialionmeasles % age group 52.0 89.0 49.9 87.3 77.6DPr . 50.0 89.0 51.9 89.9 82.2
Child maluutition (under-5) .. 27.5 29.2 .. 40.3UfccxpeancyTota yers 45 46 47 52 62 67Famaeadvanage C 3.2 3A 3.0 33 2.1 5.9
Total ferdlity rate births per woman 8S3 8.1 6.4 6.2 3.6 2.9Maernal morhity rae per 100,000 live births .. 210 300
Supplementary Poverty IndicatorsExpenditures on social secuity S of tDtal goV a .. ......
Social scurity coverage % econ. active pop. .. .. .. .. .
Accesstos afe waetroml Sofpop. 670 61.1 64.2 .. 67.0Urban * 81.0 79.0 66.4 .. 78.7Rund * 66.0 60.0 64.0 .. 62.0
AcXS to helihd carc * .. 100.0 .. .. .. ..
Population growth rate GNP per capita growth rate Development diamondb(annud average. percent) -(annul average. percent) lfe ex!
4 5
I 1____________________ cINP Gro ssW-i ~~cait cnrllmicnt
-2 -101970-75 1980-85 1988-93 1970-75 1980-85 1988-93 Accesslosafewam
J Rwanda in Rwanda- Low-income ALow-income
a. cc thechnical nots. p3V7. b. The dedvlopment dianond, based on fiourkey indlcaton shows die average level of dovelopment in the cowarycompaed will its income grOUp. See the inboduction.
288

RwandaMost Soimi regonncugroup Next
lariat ingle year rencent ~Sib. -- kighwrunfi of estimate Slahww law- Iwuco
Indkator measure 1970-75 119805 1988-93 Aka meoam groupResources mid Expenditures
HUMAN RESOURCESPopulation (mre=1993) thousands 4,384 6.056 7,554 558.978 3,091.764 1.096.665Ago dependency ratlo ratlo 1.03 1.04 0.96 0.94 0.67 0.69Urban % of pop. 4.0 5.2 5.9 29.8 27.6 54.7Populadon growth rate annual % 3.2 3.2 2.6 2.9 1.9 1.6
Urban 7.3 5.1 4.4 5.0 3.9 2.9Labor force (1564) thousands 2,274 3,063 3.835 229.430 1,442,4S2 459,196Agriculture * of labor orce 93 93Industry 3 3Female 50 49 47 36 33 31Fcmales per 100 males
Urban number 94 ..Rurd " 114
NATURAL RESOURCESAea thou. sq. km 26.34 26.34 26.34 24.273.63 39,091.96 40.682.67Density pop. per sq. km 166A44 229.92 27933 22.37 77.60 26.52Agricultural land 9 of land ama 61.13 65.91 65.67 52.54 52.82 39.61Changeinagricultura land annual% *0.13 0.12 0.12 0.06 0.03, -0.13Agriculura land under irrigation % 0.27 0.25 0.25 0.83 18.02 12.66Forests and woodland thou. sq. km .. 0.00 0.00 5.32 7.15 5.95Deforesmdon (net) annual % .. .. 0.26INCOMEHousehold incomeShae of top 20% of households %olrincome .. 39Share of botom 40% of households .. 23Share of boutom 20% of households .. 10
EXPENDITUREFood % of GDP .. 244
Staplcs 8.. .6Meat, fish, milk, chee, eggs *. 8.6
Cereal inports thou. metric tonnes 17 33 115 13.157 34.420 66.28IFood aid in cereals 19 35 82 5,079 B,334 5.477Foodproductionpercapita 1987=100 105 118 80 101 113 101Fertilizer consumpionk kglha 02 .0.9 OA 4.6 59.9 48.0Share of agriculture in GDP %ofGDP 492 41.8 36.9 163 26.3 15.7Housing Sof GDP .. 12.8Averge household size peons per household .. .. 5.0 .. ..Urban .. .. 4.6
Fixed investment housing % of GDP .. 3.1Fuel mnd power % of GDP .. 5.2Energy consumption per capita kg of oil equiv. 22 44 27 257 364 1,595Hwseholds with eiectricity
Urban % of households .. .Rural ". .. ..
Transport mud ommuniation % of GDP .. 7.5Fixed investment transport equipment .. 3.1Total road kngth thou. kmn 6 12 13
WSMnTIN HUMAN CTALHeathPopulation per physician persons 59.956 37,153 73.796 .. .. 3,277Population per nurse 5 .62B 3.666 4.235Populaion per hospital bed "05 676 608 1,269 1,016 604Orlnwhydyrtn dtherapy (undcr-5) % ofeases .. c. 36 37 38EducationGross enrollment ratioSecondry % of school-age pop. 2 6 8 18 41 53
Female I 5 7 - 34Pupil-tacher ratio: primay pupils per teacher 5O 56 58 40 39Pupil-techer matio: secondary 13 .. .. .. 20Pupils reahing grade 4 f of ohort 69 78 74Repeaterrate primary %oftotale rrll 21 12 11llitracy % of pop. (age 15+) .. 55 50 SD 41 19Female % of fum. (age I+) .. 68 63 62 53
Newspap rcircuation erthou.pop. a. 0 0 12 .. 74WotBn Inmanonal Ecozonomics Departmnt. April 1995
289

St Kitts and NevisMeat Sateyrvglo uco roup Neaxt
Lasestsang3eepr rwet t UpperT higherUnitof ea -a _re Amewrca middle- income
Indiator ma..re 1970.75 J980-85 I9W8P3 Caribbea income group
Priority Poverty IndlcatorsPOVERTYUpper povcrty line local cuf. .. ..
Headcount indcx ' of pop. .. ..Lower poverty line loeal curr. .. ..
Hendcoun index % of pop. - ..
GNP per capita 1S * 1,680 4,410 2,930 4.350 23,680
SHORT TERM INCOME INDICATORSUnskilled urban wages locra car. .. ..Unskilled nural wagesRural terms of trade .. ..
Consumer price indcx 1987=100 .. 99 120Lower incormFood a
Urban H 99 IRural
SOCUIL INDICATORSPublic expenditure on basic social scevices %e of GDP .. ..Gross enrollent ratiosPrimary %schoolagepop. .. .. 98 107 105 103Male 1.. .. .. .. .. 03Female .. .. .. .. .. 103
MortalityInfant mortality per thou. live births .. .. .. 43.0 35.8 7.0Under S morality 5.. .. .. 2.2 42.6 8.5
ImmunizationMnsics % age group .. 85.0 99.0 78.7 82.0 825DPT .. 97.0 99.0 73.7 74.2 90.2
Child nalnutrition (under65)Life cxpctancyTotal yeCs .. .. .. 69 69 77Female advantage .. .. .. 53 5.9 6.4
Total fertility rate bihs per woman .. .. .. 3.1 2.9 1.7Matcmal mortlity rate per 100,000 live births .. ..
Supplementary Poverty IndicatorsExpcnditures on social security % of total govt exp. .. ..
Social security coverag % econ. activc pop. .. ..
Access to safe water total % of pop. .. .. .. 80.0 86.7Urban .. 100.0 .. 90.1 93.9Rural .. 100.0 .. 57.6 66.7
Access to health cm 9 .. 9.0 100.0
Population growth rate GNP per capita growth rate Devdopment diamondb(annual aveage percent) 10 (anmal average. peent) Lifi:aty
4 -- 5--
1GNP GmsP~~~~~ ~~primary
0apit\ enrollment
-2 -101970-75 1980-85 1988-93 1970-75 1980-5 1988-93 Access to safe war
[7 SL Kitts and Nevis _ SL Kitts and Nevis- Upper-middle-income Upper-middle-income
a See the technical noes, p.387. b. The development dianond, based on four key indicatons, shows the aage level of development in the countryconparee with its income group. See the introduction.
290

St. Kitts and NevisMolt Sain. r.,iarducwssmagniap NW:
unit of - imace Amenica midde. lacer..Indicator measure 1970.75 J07-8.5 1l1593 Caribben lacacs grolp
Resources and E xpenditu resHUMAN REOURCESPopulatioan (mroullPP3) thousiands 45 43 42 466,304 500,507 0 12,447Ago dependency mailo ratio .. 0.85 0.79 0.66 0.62 0.49urban % orpop. 35.0 37.4 41.3 71.2 71.2 77.9Populaition growth rawe annual 'l -0.9 -0.5 1.0 2.0 1.7 0.6
Urban -0.4 0.4 2.3 1.9 2.0 O.KLabor force (15.64) thounands ... . 169,839 190,136 395.641AgrIculture %Tor labor force...IndustryFemalek ,. 27 29 3KFemaleA per IOU0 males
Urban number..*Rural
NATURAL RESOURCESAmea thou. mq. km 0.36 0.36 0.36 20,505.92 71,848.14 31.146.15Density pop. per sq. km 225.00 11i9.44 115.55 22.29 22.51 25.11Agriculluml land 'I orfland arcai 41.67 41.67 41.67 410.00 41.26 42.80Change in agricultural land annual % 0.00 0.00 0.00 0.39 0.08 -0.48Agricultural land under irrigation % ... . 3.4 8.84 13.96Forests and woodland thou. sq. km .. 0.00 0.00 9.87 8.04 10.56Deforestaton (net) annual 'l%.. -0.15INCOMEHouschold income
Shame of top 20% or households 'bof incomen..Shat of bottom 40% of householdsShare of bottom 20% of households...
EXPENDFrUREFood % ofGCDP ... .. ,8.4
staples ... . .* .6Meat, fish, milk, cheese, eggs ... .. .3.8
Cereal imuports thou. metric tonnes 4 56 27,700 48.947 77.530Food Aid ineeceals *0 0 3 1,565 544 8Food production per capima 1987=0 ....- 101 102 95Fertilizer consumnption kglha 180.0 186.7 73.3 16.1 67.1 150.0Shar of agriculture in GD? % ofrGDP .. 7.8 5.2 9.0 8.0Housing %lOGDP I.. . ... 1.Average household size persons per household...
Urban Fixed investment housiaig % of GD?P.. . .. 5.0Fouel and power % orGDP ... .. . 2.0Energy consumption per capita kg of oil equiv. .. 395 476 913 1,632 5.203Households with electricity
Urbark 5 of households...Rural
Transport and comnmnunlation % ot GD?P.. . .. 8.8Fixed inmestmseat: tnanspart equipment ... .'. 2.1Total road length thou. km...INVESTMENT IN HUMAN CAPffALHealthPopulton per physician persons 3.357 2,160 ... . 453Population per nurs 281 126Populaton perhospital bed 176 116 .. 517 395 145Oral rehydyralion therpy (undcr-5) % of cases ... 5 61 5 1EducationGras enrollment ratioSecondary % of school-age pop. 1.. 03 47 53 92
Female .. .. 94Pupil-teache ratio: priayppils per tacker 29 21 26 2Pupil.teacherratio:seonaz . I 15Pupils reaching grade 4 % Of cDohot...Repeater rate: primary % of total enroll...Illiteracy % of pop. (age 15+) 2 ... 15 14"Female % of fen(agel15+) is..1 17
Ncw pprcirculatioa aerthou. aop 33 165 . 85 125 3 20'World ManIc international Economics DePart -Cl April 1995
291

St. LuciaMornitef -relnMtromeS egroap Newxt
Ukgrt atlqlevr medq l Ti Upper. *4rhwUN kV - - zamiae Amerika muiddleo Imcrwe
Indiealar macun 1970975 IPEOJS 19011.3 Carlbhwm Iincoei grwOpPriority Poverty Indicators
POVERTYUpper povcry line local curr .. .. ..Headcountindex I of pop. .. .. ..
Lower pave my lIno local curr. .. .. .Headcount Index % of pop. .. .
GNP per capita USS . .. 3.380 2,930 4,350 23.680SHORT TERM INCOME INDICATORSUnskilled urbnn wnps local crr. .. .. .. . ..UnsklCled nrual wagesRural ierim or tradeConsumer price index 1987-100 42 91 123 .. .Lower incomeeorFood" .. 87 121 ..
Urban 44 .. .. ..Rural ' .. .. .. .. ..
SOCIAL INDICATORSPublIe expenditum on baie soclal services of GDP .. .. .. .. ..Gross enrollment ratiosPrimwy % school age pop. . 107 105 103Male 103Female 0 ,, ,, , 103
MortalityInfant maorality per thou, Ihve births .. 43.0 35.8 7.0Under 5 nroalIty 0 .. .. 52.2 42.6 9.5
ImmunizationMeasles * age group .. 60.0 82.0 78.7 82.0 82.5DPT' .. 83.0 99.0 73.7 74.2 90.2
Child nalnutrition (under-S.Life expectancyTotal yeCS .. .. .. 69 69 77Female advantage .. .. .. 5.3 5.9 6.4
Tota fertility rate births per woman .. .. .. 3.1 2.9 1.7Maternal mnoaliy rate per 10D,000 live births .. .. .. .. ..
Supplementary Povert IndicatorsExpenditurcs on social security % of total gD't exp. .. .. .. ..Social security coverage % econ. active pop. .. .. .. .. ..Access to safe water. total % of pop. . . .. 80.0 86.7
Urban 4 .. 90.1 93.9Rurl ].. 57.6 66.7 ..
Access to heaith care 100.0 10.0 ...
Population growth rate GNP per capita growth rate Development diamondb6+ (annual average. prcent) 5 (Muu aveage. prcent) Life expetancy
4 5
2 0 __O_ _ _ _ _ _ _ _ _ _ I GNP GrosGper4 primary7 ] C 1 1 1 1 m | -5capita enrollmnt
0 III -5
-2 -101970-75 1980-85 1989-93 1970-75 1980-95 19843 Access tosaftewater
I St. Luca _ SL Lucia- Upper-niddle-income - Upper-miiddle-incotne
a. See the technical notes. p.3S7. b. liz devdeopnent diamond, based on ftur key indicatos, shows the average level of dcevlopment in the counLrycompamd with its income group. See dte intrduction.
292

St. Luciamost Sam. niion/inc.m. group Nod
IletalnEtbeysw ?#VWst Lama LUppe. higherlimit of alimate Ammm*ca midle- incoern
i'ndicator secure 19P70J-S 198"-8 MR8-93 Caribean buceure groupRescjrces and Expenditume
HUMAN RESOURCESrepultion (rnn=1993) thousands 108 125 142 466304 500,507 912,447Age dependceny ratio ratio .. 1.07 0.83 0.66 0.62 04Urban % of pop. 41. 44.0 47.3 71.2 71.2 77.9Population growth rare annual Wi 1.3 1.6 1.6 2.0 1.7 0.6Urban *1.8 Zs5 2.5 1.9 1.i 0.8
Labor force (15-64) thousands ...- 169,839 190,136 395,641Agricultur % of tabor force ..
IndustryFemale £...-27 29 38Females per 1 00 malesUrban number...Rurml
NATURAL RESOUTRCESArea thou. sq. km 0.62 0.62 0.62 20.50592 21,848.14 32.146. 15Density pop. pcr sq. km 174.19 201.16 225.35 22.29 22.51 25.11Agricultural land S of luri area 32.79 32.79 34.43 40.00 41.26 42.90Change in agricultural Land annual S 0.00 0.00 0110 0.39 0.08 40.48Agricultural land under irrigation % 5.00 5.00 4.76 3A41 8.84 13.96Forast and woodland thou. sq. kin .. 0.00 0.00 9197 8.04 10.56De-foretation (ne) annmal S .. 5.23INCOMEHousehold income
Share of bop 20 of households % of incomne...Share of botuom 40% of householdsShare of botton 20% of households
Food %oFODP . 28.2 BA. . .staples .. 5.9 ...- 1.6Meat,lfsh. milk.cheeseeggs -. 11.7.- 318
Cereal imports hou. mcetic tonnes 8 I5 1 3 27,700 48347 77,530Food aid in cereals 0 0 8 1,565 544 8Food production percapita 1987 100 84 98 120 101 102 95Fertilizer consumption kg/ha 205.0 93.9 309.5 16.1 67.8 150.0Share or agricultur in GDP S of GD?P 133 9.0 9.0 8.0Housing % ofUGDP 113S t.... 1.Avenge household size persons per household 4.6 .
Urbanrand invsm ent homsing Wiof GDP . 3.3 S.;...51Fuel andpower %ofGDP 3.5. .. 2.0Encrgy consumption per capita kg of oilecquiv. 231 361 373 913 11,632 5,203Households with electricityUrban % of households ...
RuralTransport and emamnnucatlon S of GDP 3. 1 ..... LFixed invemnac uAnsport equipment .6.3 ... .2.1
Total road length thou. km...INVSTMNTIN HUMAN CAPITAL
Population per physician person 5,316 3,506 ... .453
Population per nurs 683 .
Population per bospita bed 197 ..- 517 395 145Oral rehydyration therpy (under-5) Wi of cases ... 75 61 St1EducatIonGros enrollment ratioSecondary % of school-agepo .. . . 47 53 92
Female ... .. .94
PLupi-tweaer ratio: primary pupils perteacher 3 1 30 28 2'6 25Pupil-teacher ratio: secondary 18 19 i8Pupilsreaching grde 4 Of cohort. . 99 -.
Repeat rate: primroy s or tota enrol 7Iliteracy % of pop. (age 15+.) 18 -. I.1 14
Female S of fes (age 15+.) .. -. .. 17 Nwjnrr cirulatian pe thon- goP. 41 33 .. 5 125 320
293

St VincentMasi Same regionNncme group Nell
Latest singleyw recent Lain higcr-- AkherUnit of estimate America middle- income
Indiator secure 1970-75 191045 I988-93 Caribbean income group
Priority Poverty IndicatorsPOVERTYUpper povcrty line local cuir. .. ..
Hcadcount indcx % of pop. .. ..Lower poverty line local curr. .. ..
Headcount index % of pop. .. ..
GNP percapita USS 380 1,030 2,120 2.930 1.590 4,350SHORT TERM INCOME INDICATORSUnskilled urban wages local curr. .. ..Unskilled rural wages .. ..Rural terms of trade .. ..
Consumerpuicc index 1987=100 40 96 126Lower incomneFoodeUrbanRural
SOCIAL INDICATORSPublic expenditure on basic social services % of CiDP .. .. IOAGross enrolment ratiosPrimary school age pop. . .. .. 107 104 105
MaleFenale
MortalityInfant mortality per thou. live births .. .. .. 43.0 39.0 35.8UnderS rmortality .. .. .. 52.2 61.5 42.6
ImmunizationMeasles % age group .. 92.0 96.0 78.7 77.6 82.0DPT .. 86.0 98.0 73.7 52.2 74.2
Child malnutrition (under-5)Life expectancy
Total yars .. .. .. 69 67 69Female advantage .. .. .. 5.3 5.9 5.9
Toal fertilityrate births perwoman . .. .. 3.1 2.9 2.9Maternal orality rate per 100.000 live births .. .. .. .. .. .
Supplementary Poverty IndicatorsExpenditures on social security * of total gov't cxp. .. 1.5 0.0Social security coverage l econ. active pop. .. ..Access to safe water total * of pop. .. _ .. 80.0 .. 86.7
Urban * .. .0 90.1 .. 93.9Rural .. .. 57.6 .. 66.7
Access to health ca .. 80.0 80.0 .- .. .
Population growth rate GNP per capita growth rate Development diamondb6e (aumual average. pewent) 5 (annua avagc, Percent) Life expectacy
4 -- 5
GNP G/oss2 -.-...-- I...; 0 per primay
0 F1 i-i I | { | 2 | S capoita \ / enrollment
-2 --- 101970-75 198085 1988-93 1970-75 1980-85 1988-93 Access tosafe water
] SL. Vincent SL Vincent- Lower-middle-income - Lower-middle-income
a. Sec the edhnical notes, p.387. b. The development diamond, based on four key indicatos, shows the averagc lcvel of development in the countFycompared with its incore grup. See the intduction.
294

St. VincentMost Same regioufineemen grasq Neot
Latestsingleyea recent - LaWn Laws- higher-Uniteof estimae America middl- Income,
Indicato meWWte 11170-75 1950485 1955-.93 CriWbbean income groupResources and Expenditures
HUMAN RESOURCESPoplulaoin (mrenlW3) thousands 93 102 ItO 466.304 1.096.665 500.507Age dependreny ratio mtc o 0.72 0.69 0.66 0.69 0.62Urban % orpop. 20.6 34.2 44.6 71.2 54.7 71.2Population growth nile annual % 1.3 0.8 0.9 2.0 1.6 1.7
Urban 6.7 5.0 3.6 1.9 2.9 1.8Labor rorce (15-64) thousands ... . 169,839 459.196 190.136Agriculture % of' labor force...
ftmalc ... .27 31 29Fenmales per 100 males
Urban number...Rural
NATURAL RESOURCESAre-a thou. sq. km 0.39 0.39 0.39 20.505.92 40.68167 21,848.14Density pop. per sq. kmn 238.46 261354 279.42 22.29 26.52 22.51Agricultural land '1 of land amn 25.64 30.77 33.33 40.00 39.61 41.26Change in agricultural land amnual % 0.00 0.00 0.00 0.39 -0.13 0.08Agricultural land under irrigation % 10.00 8.33 7.69 3.41 12.66 8.84Forests and woodland thou. sq. km -. 0.00 0.00 9.87 5.9S 8.04Def'orestation (net) anul% -. 2.11INCOMEHousehold income
Sharm of top 20% of households 'I of incomte..-Share of bottom 40% of householdsShare of bottom 20% of households
Food % of GDP ... 39.7 .
Staples .- 8.3Meat, fish, milk, cheese, eggsp. 16A4
Cereal imnports thou. metric tonnes S 33 57 27.700 66.281 48,947Food aid inecereals 0 4 1.565 5.477 544Food production per capita 1987=100 LOi 126 122 101 101 102Fertilizer consumption kglha 4001.0 341.77 184.6 16.1 48.0 67.1Sham of agricultur in GDP S of GDP . 16.3 15.2 9.0 15.7 8.0Rtousing % ofGDP .. 12.1 - -. -
Average household size persns per household......- -
Urban Fixed investmecnt housing % of GDP . 3.4 -.-Fuel and power %ofGDP ... 4.2Energy consumption per capita kg of oil equiv. 151 176 200 913" 1.595 1,632Households with electricityUrban % of households...Rural
Transport and communication S of GDP .. . 2Fixd iBvestmnent transport equipmn... 6.4Tota mad length thou. kmn...INVESTMENT IN HUMAN CAPITALHlealthPopulation per physician persons 5.438 3,748 .- 3.277 -
Population per nurse 642 . .. .-
Populaton per hospital bed 198 . -517 604 395Oml rehydyrationthermpy (under-5) S of cases ... 99 61 -. 5 1EducationGross enrolment ratioSecondary % of school-age pop. -.-.. 47 53 53Female
Pupil-teaher ratio. primary pupils per teacher 1 8 18 20 26 . 25Pupil-teachrrado: secondary -22 18 27Pupilsreaching grade 4 of cohort...Repeater rate: primairy * Of tota enroll..Iiteacy S of pop. (age 15+) 4 I...1 19 14"Feanle Of frm (agel15+) ....- 18 .. 17
Newsppe circuation pe tou. po.. .85 74 125worwth aaK ntemauonal cnMomCS Diepartmet April 1VYn
295

Sao Tom6 and PrincipeMest Sce reg&niacome grep Nat
Last singkear mr n Sub, higherUnit Of esitrne Sehem Low income
inikct sesre ir7e-n aoJ-985 in -93 Africa fncome groupPriority Poverty Indicators
POVERTYUpper poverty line local curr. .. ..
Hcadcount index %olpop. .. .. .. .. 19Lower poverty line local curr. .. ..
Hadcunt inx % of pop. .. ..
GNP per capita USS 470 310 350 520 380 1,590
SHORT TERM INCOME INDICATORSUnskdlled urban wages local curr. .. ..
Unskiled rwual wagesRural terms of tradeCoasumerprice index 1987=100 .. .. .. .. .
Lower incomeFood .........
UirbanRural
SOCIAL INDICATORSPublic expeaditre on basic social servics * of GDP .. .. 23.1
Gross eniollment aosPrimary %scheolBagCpop. 67 108 104Male 74 116Female .. .. .. 60 101
MortalityInfnt moaity per tiou. live births .. .. 25.0 93.1 63.1 39.0UnderSn aity -. .. 44.0 172.3 101A 61.5
ImmunizationMeasles * age group .. 35.0 57.0 49.9 873 77.6
DPT U .. 42.0 77.0 51.9 89.9 82.2Child malnutrition (under-5) .. .. .. .. 40.3Lif cxpeancy
Total years .. _ 67 52 62 67Female advantage . 3.3 2.1 5.9
Total fertity rate birs per woman .. . .. 6.2 3.6 2.9Maternal mortality ra per 100,000 live births .. .
Supplementary Poverty IndicatorsExpenditues an social secity % of toal gov't exp. .. ..
Social security coverge % ecoxL actve pop. .. ..
Acces to safe water total * of pop. .. .. .. .. 67.0Urban .. .. .. .. 78.7Runl .. .. . .. 62.0
Access to bhald care .. .. -
Population growth rate GNP per capita growth rate Development diamondb(annul aveage, patent) (nnual average. percent) Ufec41sttulq
4-S
_ GNP Gmss
1 1 1 1 1 1 I i i ~~~~~~~~~~~~~~~~~~~capita enrollment-2 401| {Lj§||l n|3 n
1970-75 195085 1988-93 1970-75 1980-85 1982-93 Access tosafi water
[ Sao Tomd and Principe _ So Torna and Principe- Lnow-income - w-income
a. Sec the technical notes. p387. b. The dewlopment dia n based on fourkJey indicatos shows the avg level of development in th countycompared with its income group. See dth intnrducdon.
296

S'ao Tome' and PrincipeMost Lange reglousincaan group Next
Latest Ingkeyear recent Sub- hsigherunit of esiate Sakara law- income
Indicator measre 19701-75 1950-5 1988-93 Africa Income groulp
Resources and ExpendituresHUMAN RESOURCESPopulation (mre=1993) fthusands 81 104 122 558.978 3.091,764 I1.096,665Age dependency matio ratio .. 0.86 0.85 0.94 0.67 0.69Urbakn % of pop. 27.9 37.6 44.9 29.8 27.6 54.7Ppoulation growthmrte annual% 2.1 2.0 2.0 2.9 1.9 1.6
Urban 5.4 4.6 4.0 5.0 3.9 2.9Labor force (15-64) thousands 35 42 46 229.480 1,442,452 459.1%6Agricultur % of labor force...Industryfi!male *37 36 35 36 33 3'1Females per 100 males
Urban numnber...Rural...
NATURAL RESOURCESArea thou. sq. km 0.96 0.96 0.96 24,273.63 39,091.96 40,622.67Density pop. per sq. km 84.38 108.24 124.56 22.37 77.60 26.52Agricultural land % of land area 38.54 39.5 39.58 52.54 52.82 39.61Change in agricultural land mnudt S 0.00 2.70 0.00 0.06 0.03 -0.13Agricultural land under irripaton S .... 0.33 18.02 12.66Forests and woodland tomu. sq. km . 0.00 0.00 5.32 7.15 5.95Deformstation (net) mnudl S ... .00INCOMEHousehold incomeshare or top 2D% of households S of income...Share ofrbottmn 40% of householdsShmare of tn 20% or households
Food %ofGDP ... 43.3Staples ... 9.3Meat, fish, milk, cheese egg .. 21.6 . .-
Cerealimpoin thou. meuricton 4 10 9 13,157 34,420 66.281Food aid in cereals I. 0 6 5,079 8.334 5.477Foodproductioo per capita 1987=100 178 112 87 101 113 101Fertilizer consumption kg/ha ... .4.6 59.9 48.0ShareOfag2iC.lturinCGDP S of GDP ... 24.0 16.3 26.3 1517Housing S ofGDP ... 12.8Average household size persons per household .3.8
UrbanFixed invetment housing S Of GDP ... 0.6Fueland power % of GDP ... 5.2Energy consumption percapita kg of oil equiv. 74 125 189 257 364 1.595Households with clectrciayUrban % of bouvmseod...Rural
Transport and comnmunicaton % of GDP ... 6.3Fixed investment tranpor equipment ... 2.8Total road length thou. km.n.
INVESrh1ENT IN HUMAN CAPITALHlealthPopulation per physician psos4,294 1,957 1,883 ... 3.277Population per norse U1,126 282 190 -
Population per hospitalbed 37 .. 210 1.269 1.016 604Oral rehydyration therapy (under-5) S of cases so..5 37 38EducationGross earoilment ratioSecondary S of schol-age pop. I.....1 4 1 53Femle-..... - 34
Pupil-teacher ratio: primary pupils per techer 34 3'1 35 40 39Pupil-teacher ratio: secondary 1 3 21 23 -. 2DPupils reaching gmde 4 Of cohort .. 2Repearerrate: prnimay S Of tDtalenrol 21 29Illiteray S of pop. (age 15+) .. 43 33 so 41 19Female %Of fem (agelS-e) ..... 62 53Ne7er circulaition per thou. PopE.. . 12 .. 74
wol ank Intemathonal Eiconomucs Depettmen AprLi19
297

Saudi ArabiaMost Seams regnfla/one group Next
Laat si e year recent M -Eait - Upper higlherUit of es ,aie & Nrth mildt- income
luidater mawure_ 1970&75 1950485 198-93 Afrika income moup
Priority Poverty IndicatorsPOVERTYUpper poverty line local curr. .. ..
Headcount index % of pop. .. ..
Lower poverty line local curn. .. ..
Headcount indcx S of pop. .. ..
GNPpercapita USS 6.240 8.300 7,810 1,980 4.350 23.680
SHORT TERM INCOME INDICATORSUnsklled urban wage local cur. .. ..
Unskilled natl wages .Rural tenus of tradeConsumerprice index 1987=100 69 105 110Lower incomeFood.
UrbanRural
SOCIAL INDICATORSPublic expenditue on basic social services S of GDP .. .. 1.6Gss cnmrolt ratiosPrimay S school age pop. 58 69 78 97 105 103Mae ' 72 77 B1 103 .. 103Fenale ' 43 61 75 90 .. 103
MortalityInrant morality per thou. live births 1 05.0 58.0 27.8 52.3 35.8 7.0Undr S mortaly .. .. 38.0 69.9 42.6 8.5
humuniztiomMeasles Sage group .. 46.0 90.0 81.3 82.0 82.5DPr 50.. 50. 94.0 84.0 74.2 90.2
Child malnutition (under-5)Life expectancyTotal years 54 63 70 66 69 77Fenrleadvanage 3.1 2.7 3.1 2.3 5.9 6.4
Total fertibty rae binths perwoman 7.3 7.3 6.3 4.7 2.9 1.7Matenal moaity rare per 100.000 lie binbs .. 52
Supplementary Poverty IndicatorsExpenditurs on socil scu riqty of tot govt exp. .. ..
Socal security coverage % econ active pop. .. ..
Acces to sfe water tol S of pop. 64.0 96.5 94.7 835 86.7Urban 97.0 100.0 1004) 98.7 93.9Rural 5 56.0 88.0 73.7 69.0 66.7
Access to hbelth cam .. 90.0 98.0 87A
Population growth rate GNP per capita growth rate Development dianondb6 (annua average. peZftft) (annual avenge. Percent) tifr x bc
4 5 - S
GNP Gros-U pper-ie0 per prim a
capit enrollmnt
-2 -101970-75 1980-85 1968-93 1970-75 1980-5 1988-93 Access to safe water
FLI Saudi Arabia - Sandi Arabia- Upper-muiddle-income - Upper-niiddle-icoi
a. See the technicd nots p.-37. b. The devdopment diond. based ou furkey indicaos, shows fbe avcrage level of development in the countycompared with its income Sroup. See the introducio.
298

Saudi ArabiaMeat Same reegioufisfluep Next
LI ea at nle year recen M & i Uj 4herURnIV of - at Imae & Nvoah MidSe- Incme
IJIdICo#oF autuvre 1970.75 198945 1955493 AiX.o Incom. grou
Resoources and ExpendituresHUMAN RESOURCESPopulatIon114 (m1rc=-133) thousands 7.251 12.649 17.123 261.650 500.507 812.447Age dependency rato ratio 0.85 0.14 0.80 0.87 0.62 0A49Uirban S of pop. 58.7 73.0 79.0 55.2 71.2 77.9Populatin gmowth rate annual S 4.7 5.5 2.2 2.7 1.7 0.6
UrbnM 8.1 7.2 2.9 3.7 1.8 0.8Labor force (15-64) thousands 2.042 3.405 4.518 71,333 190.136 395.641Agricultume of labor foroe 56 48lndustiy 1 3 14Female 6 7 8 16 29 38Females per 100 males
Urban number...Rural
NATURAL RESOURCESArea thou. sq.lokm2Z149.69 2,149.69 2,149.69 11.021.26 21,348.14 32Z146.15Density pop. pcr sq.km 3.37 5.18 7.80 23.10 22.51 25.11Agricultura latnd Sof land area 40.32 ASAI 57.56 32.10 41.26 42.80Change in agticultural land annual S 0.05 5.63 0.06 0.04 0.03 -0.48Agticultura land under inigation % (147 0172 0.78 30.59 8.84 13.96Foress and woodland thou. sq. km .. 0.01 0.01 0.45 8.04 10356Deforestition (net) annual S ... .00
INCOMEHousehold incomec
Share of top 2D% of households % Of income .. ..
Share of bottom 40% of householdsShare of bottom 20% of households
EPNDITUREFood S of'GDP 1.. 3.9 ..- 8.4
Staples ... 3.6 ... 1.6MeaL fish. milk. cheese. eggs... 6.1 .. - 3.8
Cereal impnl thou mimic tonner 523 6.97'1 5.186 38.092 48947 77.530Foodaid in cereals ..... 1.249 544 8Food productionapercapita 1987=1 00 99 95 117 102 102 95Fealilizerconsumption kglha 0.1 3.5 4.4 89.9 67.3 150.0Shan: of agriculture in GDP % of GDP 1.0 4.4 5.9 13.3 1.0Housing %FOf DP ..- 13.1 ... 11-7Average household size perwon per household ..- . .-
UrbanFixed investment housing %ofOGDP .... 112..-.iFuel and power %ofGDP ... 13. . .Enet consumption per capita kg of oil equiv. 1,446 5.003 4.552 1.097 1,632 5.203Households. with cleccuiciay
Urban % of households .
RuralTransport and corrmunicaflon S of GDP ... 7.0 - . aFixed iniestment transport equipomen .. 2.9 .... 2.Tota road length thou. km 26 69
ENVESTMENT IN HUMAV1N CAPITALHealthPopulton per physician person 7,461 1.863 708 . 453Population per nuame N2.078 756 458 -. -
Population per hospital bed N 46 702 407 633 395 145Oral wehydyration therapy (uoder-5) S of cases ..- 90 56 51Educatioarms enrollumen ratoSecondmy % of school-age pop. 22 42 46 56 53 92Female Is1 33 41 s0o. 94
Pupil-tachear ratio: primary pupils per teacher 20 16 14 26 25Pupil-racber atio:secandary N15 14 1 2 21Pupils.eacintggrak 4 % ofcohort 92 93 93 95Repeatrrawe:prinn"y Sorftotaemaroi 15 1 2 1 0 Illiuac %bof pop. (agel5+) .. 42 31 45 14
FemaleC % Offtbm (BP lS+J 58 52 57 17New7r reireadon pe thou pop 14 36 4433 125 320
wodm icnnuama MEcoomcs IJeahment. AMri J1995
299

Senegalmlo Sam reg an/womecgroup Newt
Lalet single year rw stb- Lwera higherUnit of eallute Saha middle- iucome
Indkalar meausre 1970-75 19804J5 1988-93 Afica income group
Priority Poverty IndicatorsPOVERTYUpper poverty line lorul curr. , ..
Headcount index '% of pap. .,Lowcr poverty line local curr. ..
Headcount index l of pop. ..
GNP per capita USS 380 370 750 520 1,590 4.350SHORT TERM INCOME lNDICATORSUnskilled urban wages local curr. ..Unskilled runl wagesRural terms of wiadeConsumerprice index 1987=100 40 98 97Lower incomeFoodb 21Urban ' .. 102 95Rural
SOCIAL INDICATORSPublic axpenditure on basic social services % of GDP .. ..GMoss enrolment raiosPrimary % school agc pop. 41 56 56 67 104 10SMale 4B 6 7 67 74Femakl 34 46 50 60
MoralityIfant mortality per thou. live biths 122.0 87.0 66.8 93.1 39.0 35.8Under 5 mortality .. .. 120.0 172.3 61.5 42.6
ImnmunizationMeasles % age goup .. 40.0 59.0 49.9 77.6 82.0DPT .. 54.0 60.0 51.9 82.2 74.2
Child malnutrition (under-5) .. .. 20.1Life cxpectancyTotal yas 40 45 S0 52 67 69Female advantage 2.0 2.0 2.0 3.3 5.9 5.9
Total rtilty e birdts per woman 7.0 6.7 6.0 6.2 2.9 2.9M rnad mortality rate per 100,000 live birtis .. .. 933
Supplementary Poverty IndicatorsExpditures on social scrity 9b of ttal goVt exp. .. ..
Social security coveage % econ. active pop. _ ..Accss o safe watcr tot %ofrpop .. 52.7 51.2 .. .. 86.7
Urban 56.0 79.0 BSA .. .. 93.9Rral u.. 38.0 26.0 .. .. 66.7
Access lo health cam .. .. 40.0 .. _
Population growth rate GNP per capita growth rate Development dimonde (annual avaae percent) (annual avera pect) "if r
4 -5
GNP Gmer2 0 - I I l
.2 -101970-75 1980485 198-93 1970.75 1980.85 1998893 Access to rafe water
] Senegal Senegal- Lower-middle-income Lower-middle-income
a. Svc the technical ot p387. b. The dcvlopment dimDond. based on four kry indicators, shows the averg level of development in the countrycompaed with its incam grmu See the inurduciorn.
300

SenegalNieat Same. rqtnirnclnaugroop Nart
Leat sinleghyw iweat S.11i7 highierUnit of ealiwiute Saha"om middl- income
Indicatr menure 197075 195085 198-93 Africa Incom, gtroup
Resources and ExpendituresHUMAN RESOURCESPopulation (mnrc=I93) thousands. 4.806 6,375 7,902 558,978 1,096.665 500),507Age dependcncy ratio ratio 0.94 0,94 0.92 0.94 0.69 0.62Urban Wi of pop. 34.2 37.9 41.3 29.8 54.7 71.2Population growth rate annual % 2.9 2.8 2.5 2.9 1.6 1.7
Urban 3.4 3.9 3.7 5.0 2.9 1.8Labor rorce (15-64) thousandr. 2.245 2.897 3,393 229.4110 459.196 190,136Agricultuire Wi of labor force 82 82 IIndustry 6 6 .
Feinale 41 40 39 36 31 29Females per 100 males
Urban number . ..
Rural
NATURAL RESOURCESArea thou. sq. kmn 196.72 196.72 196.72 24,273.63 40,692.67 21,848.14Density pop. per sq. km 24.43 32.41 39.17 22.37 26.52 22.51Agricultural land S or land area 28.31 28.31 28.31 52.54 39.61 42.26Change in agricultural land annual % 0.00 0.00 0.02 0.06 -0.13 0.08Agricultural land under irrigation % 2.94 3.21 3.30 0.13 12.66 8.84Fomests mid woodland thou. sq. Ian. 0.08 0.08 5.32 5.95 3.04Deforesiation (tics) annual St,,. 0.66INCOMEHousehold income
Sharceof top 20%of households % of inwncm .. 59Share of bottom 40% of households I. .I1
Share of bottom 20% of households ",..4
EXPENDITUREFood % ofGDP .. 42.4 .
Staples .. 13.0 .
Meat. fish milk Cheese, eggs". 14.3 .
Cercal imports thou.nsric torme 2n0 557 579 13.157" 66.2811 48.947Food aid in ccrcals 27 131 71 5,079 5.477 544Food production percapita 1987= I00 258 82 79 101 101 102Fertilizer conisumption kg/ha 8.7 3.8 3.1 4.6 48.0 67.8Share of agriculture in GDP S of GDP 30.2 18.8 19.5 16.3 15.7 8.0Housing S of GlDP .. 9.8 Average household size penom per household . ..
Urban *7.6...-
Faxed investment housing S ofGDlP .3.9 .
Fuel and power S Of GOP .. 3.6 .
Encargyconsumiption per capita kg ofoil eqiaiv. 137 142 115'S 257 1,595 1.632Householdr with electrcity
Urban % of houselholds . ..
RuralTransport and commanuucatlon S of GDP .4.7 .
Fixed investment transport equipment K .1.3 .
Total roadlecngth then. km 14 14 15 INVESTNMENT IN HUMAN CAPITALHealthPopulation per physician pesnms 16.278 13,048 17.508 - 3.277Population per nurse1267562.. 6Population perhbospital bed *775 .. 1.371 1.266 604 ~ 395Ord rehydyration derapy (under-5) % of casem.. 27 37 .51I
EducationGros ednrolmnt ratoSecondary % of school-age pop. 10 14 16 1s 53 53
Female *6 9 11Pupil-teacher ratio: primary pupils per teache 42 46 59 40..5Pupil-teacher ratio: secondary 2 9 35 34Pupilsreachinggrade 4 % ofoohort .. 90 92Repeacr rate: primary %Of tolalenrll i8 16 16illiteracy % of pop. (ageLS+e) .. 68 62 so 19 14"
Female S of fem (agelS5+) - 81 75 62 .. 17n!wsav circultion pe thu.po. 5 8 6 12 74 125
woi aKInternatonal Economnics Departmenit, April1995
301

SeychellesMost Same regionAwncome group Next
Latest single year recent YSuii TUlper-6 higherUnit of atimate S k rum middle. income
Indkcator measure 1970-75 2950485 J988593 Africa income group
Priority Poverty IndicatorsPOVERTYUppcr povertly line local curr. .. ..Hetadoun index % of pop. .. ..
Lower poverty line local curr. .. ..Headcount index % of pop. .. ..
GNP er capita USS 870 2,480 6,280 520 4.350 23.680
SHORT TERM INCOME INDICATORSUnskillcd urban wages local curr. .. ..Unskilled mnal wages .. .. 484Rural terms of tradeConsumnerpriceindex 1987=100 42 97 115
Lower incomeFood" .. 96 III
UrbainRural
SOCAL INDICATORSPublic expenditum on basic social services % of GDP .. .. 10.1Gross enrollment ratiosPrimary % school age pop. .. .. _ 67 105 103Male .. .. .. 74 .. 103Fenmeac .. .. . 60 .. 103
MortalityInrant mortality per thou. live birft .. .. .. 93.1 35.8 7.0UnderS morlity .. .. .. 1723 42.6 8.5
ImmunizationMeasles 9' age group .. 90.0 89.0 49.9 82.0 82.5DPT .. 86.0 97.0 51.9 74.2 90.2
Child malnutrition (under-5) * 5.7Lifeexpectancy
Total years .. .. .. 52 69 77Fcmdeadvantage U .. .. .. 3.3 5.9 6.4
Tota fertiity rate births per woman .. .. r. 6.2 2.9 1.7Matenal mortality rate per 100.000 live births .. ..
Supplementar Poverty IndicatorsExpenditures on social security % of total gov't exp. .. ..Social security coverage 9 econ. active pop. .. ..Accsstosafewater total * orpop. .. .. 985 .. 86.7
Urban ' .. .. 100.0 .. 93.9Rural .. 95.0 97.5 .. 66.7 _
Access to health cae _ .. 99.0 99.0
Population growth rate GNP per capita growth rate Development diamondb(annual aveage, peent) (annual avenM pecent) Lif expecuwc
4 5
per I Imay
0- l_: | I I X IES-capita enroilment
-2 -101970.75 1980-85 1938-93 1970-75 1980-85 1988-93 Access to safe water
J Seycbelles SeychellesUpper-middle-income Uppr-middle-income
a Scethe technical non p387. b. The development diamond, based on four kcy indicators, shows the avemg level of development in th countrycompared with its income group. See the introduction.
302
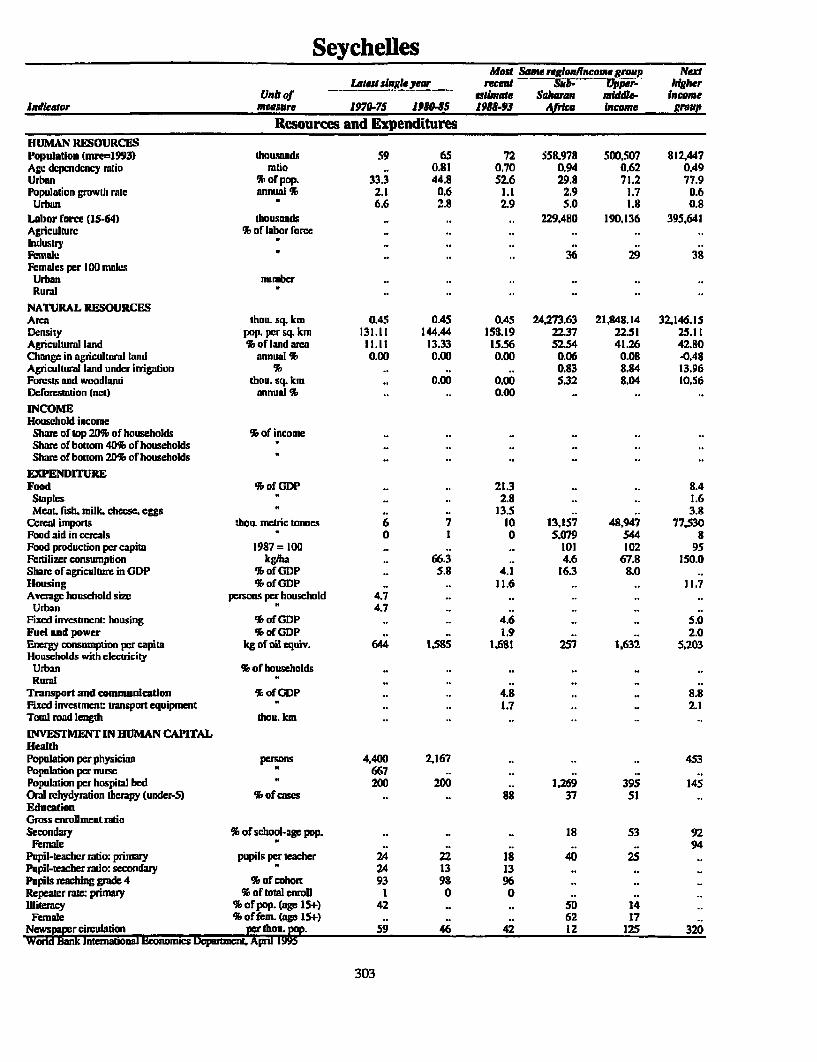
SeychellesMeat S... 'eglanif ume group Next
Latest single year recent Sib. Utnii. MakgerUnit of atmafes Sahara midde- laconlic
Indicaror vmeasre 1970-75 1950855 1915-93 Afla Income grow
Resource and ExpendituresHUMAN RESOURCESIPopuWatloa (mre=1993) thousandsi 59 65 72 55B.978 500.507 812,447Age dependency ratio ratio .. 0.81 0.70 0.94 0.62 0.49Urban 5' of pop. 33.3 44.8 52.6 29.8 71.2 77.9Population growth rate annual 5' 2.1 0.6 1.1 2.9 1.7 0.6
UrbaLn *6.6 2.8 2.9 5.0 1.8 0.8Labor force (15-64) thousands ... . 229,480 190,136 395,641Agriculture 5' of labor faorcc.IndustryFemale ... .36 29 38Females per 101) molesUrban number...Rural *
NATURAL RESOURCESArea thou. sq. km 0.45 0A45 0.45 24.273.63 21,348.14 32,146.15Density pop. per sq. km 131.11 144.44 158.19 22.37 22.51 25.11Agricultural land S of land arcn 11.11 13.33 15.56 52.54 41.26 42.80Change in agricultural land annual 5' 0.00 0.00 0.00 0.06 0.08 4048Agricultural land under irrigation 5'. .. 0.83 8.84 13.96Forests and woodland thou. sq. km .. 0.00 0.00 5.32 8.04 10.56Deforestation (net) annual 5'... 0.00INCOMEHousehold income
Share of top 20% of househoklds %'of income...Share of bottom 40% of householdsShare of bottom 20% of households
EXPENDITURtEFood % of GDP ... 21.3 . .8.4
Staples ... 2.8 ... 1.6Meat, fish, milk, cheese eggs ... 13.5 ... 3.3
Cereal imports thou. metric tonnes 6710 13,157 43.947 77,530Food aid in cereals 0 1 0 5,079 544 8Food produclion per capita 1987=100 ... . 101 102 95Fvtzlizcr consumpilon kglha . 66.3 -. 4.6 67.8 150.0Sharc of agriculturc inOGDP %ofGDP .. 5.8 4.1 16.3 tO0Housing % ofOGDP ... 11.6 11.. I.7Average household size pmersn per household 4.7 .
urban 4 &7 Fixed investment: housing 5' of GDP ... 4.6... 5.0Fuel and power % ofGDP ... 1.9 ... 2.0Energy consumption peir capta kg of oil equiv. 644 1,58 1.681 257~ 1.632 5.203Households with electricityUrban 5' of households...Rural
Transport and communleiatton 5'of GDP ... 4.8 .. 8.8Fixed investmient transport equipmient ... 1.7 ... 2.1Total moad length thou. km........-
I[NVESTME,NT IN HUMAN CAPITALHealthPopulation per physician persons 4,400 2,167 ... . 453Population per nuse 667..-Population per hospital bed 200 200 .. .26 395 145Oral rehydyration hierapy (under-5) 5'of cases ... 88 37 51EducationGross enrollment ratioSecondary % of school-age pop. is....1 53 92
Female ... .. .94
Pupil-tcadher-ratio: priiamy pupils.per teacher 24 22 18 40 25Pupil-teacher ratio: secondary 24 13 13 . .-
Pupils reahing grade4 % of cohort 93 98 9-6 . .
Repeater rate:primary % of total enroll 1 0 0miiercy % of pop. (agel15+) 42 ... 51) 14 -
Female 5' of fern. (age 15+) ... .62 17 -
Ncws~ r c'mdbdonyar thoug m. 59 46 42 1 2 125 320
303

Sierra Leone-hMil Same regkVleomue Iro.up Next
Ltaasbikeyr reaet SMD higherUR it of isftse Sarns Lwo Income
InWkor meaIMre IP70-75 1919 s 1958-93 Afra income groupPriority Poverty Indicators
POVERTYUpper poveny line local curr. .. ..
Headcount index %o pop. .. .. .. ., 19Lower poverty ine local curr. .. ..
Headcount index % of pop. .. ..
CGNPpercapita USS 240 320 140 520 310 1.590SHORT TERM INCOME INDICATORSUnsdllded urban wages local curt. .. ..
Unskilled nuaal wad wRural terms of tradeConsumer price index 1987=100 1 20 1.848Lower incone
DoOd5
Urban .. 20 475..Rural
SOCIAL INDICATORSPublic expenditure on basic social seices % of GDP .. 2A 3.6Gross enaroulm t raiosPrimay % school agc pop. 39 61 4d 67 108 104Malc * 47 73 56 74 116Female 30 50 39 60 101
MortalityInfamt nortaity per d .live births 193.0 139.0 163.6 93.1 63.1 39.0Under S mortaity .. .. 284.0 172.3 101A 61.5
luizatinMeasles % age group .. S8.0 67.0 49.9 87.3 77.6DPT .. 23.0 63.0 51.9 89.9 82.2
Child malnutrition (under-5) 31.0.. .. .. 40.3Life cxpecmnyTotal years 35 35 39 52 62 67Female advtapg 3.0 3.0 3.1 3.3 2.1 5.9
ToWl fertility rare birs per woman 6.5 6.5 6A 6.2 3.6 2.9Matenal morality mte per 100.000 live birds .. 4S0
Supplementary Pov"ert In(dicatorsExpenditures on social secuity % of total govtczp. .. 1.7 1.9Social secwity coveragc % econ. activc pop. .. .. .. .. ..
Acce to safe waw total % of pop. 12.0 26.0 43.0 .. 67.0Urbn 75.0 68.0 33A .. 78.7Rurla 1.0 7.0 21.8 .. 62.0
Access to hedth cam 362.
Population growth rate GNP per capita growth rate DeVelopment diamondb(annual avera perceat) 1 (annual avage. percent) 1,.b
~~~~~~~~~~~~~14- Le vi nc ne - IFn con
4 5
2 0 ~~~~~~~~~~~~~~~GNP Gross
[-t7m7r-1 capita eirollment
0 1-~~~~~~~~~~0
-21970-75 195085 19893-93 19170-75 1980-85 1988-93 Access to safe wate
FE sieava Leone - Sa en- Low-income - SWian Lone
aL SeC the Mtechnicalmos p.3l. b. T'he development diamond, based on four key indicator shows the averag level of developme nt I.th coutryCOMPAred with its income goup. See the mtnduction.
304

Sierra LeoneMorst ame rmgksufi ono e grumop NMI
Laid single pear recant -. -- highfbir(ull of - - am Aal Sahuaran Law. Luenme
Indicator measurep 1970.75 198045 Jfl&93 APit. incomne groupResources and Expenditur-es
HUMAN RES9OURCESPopuliatlon (mtremI99S) ihousands 2,931 3.663 4,460 558.978 3.091,764 1,096,665Ape dependency ratio railo 0.19 0.83 0.87 0.94 0.67 0.69Urban %ofpop. 21.1 28.3 34.6 29.8 27.6 54.7Population growth rot annual %1 2.0 2I5 2.5 2.9 1.9 1.6
Urban 4.9 5.2 4.8 5.0 3.9 2.9Labor forme (15.64) thousandsi 1,216 1.352 1,502 229,430 l,142,452 459,196Agriculture %1 of labor force 73 70Industry IS3 1 4PetunIa 35 34 32 36 33 liFemales. per I100 nmalm
Urban number,..Rura . .
NATURAL RESOURCELSArea thou. sq. km 71.74 71.74 71.74 24,273.63 39.091.96 40,682.67Density pop. per sq. kin 40.86 51.07 60.75 22.37 77.60 26.52Agricultural land %of land aice 37.36 38.15 38.31 52.54 52.82 39.61Change In agricultumal lman annual % 0.19 0.18 0.00 0.06 0.03 -0.13Agricultumal land under irrigation %1 0.49 1.02 1.24 0.33 13.01 12.66Forests and woodland thou. sq. Ian. 0.02 0.02 5.32 7.15 5.95Deforestation Intt) annual 91%.. 0h63INCOMEHousehold incomecShare of top 2D% of households % of income 53 .
Share of bottom 40% of households Is .
Share of buttonm 20% of households *6......
EXPENDITUREFood % ofGDP .. 47.7Staple U. 18.4MeaL rtsh. milk, clmcse, cggs .. 19.1
Cercal imports thou, metric tonnes 26 119 136 13,157 34,420 66281iFood aid in ccreals ta 2Zi 29 5,079 8,334 5,477Food producuion pcr capita 1987=I100 jig 97 88 101 113 101Fertilizer consumption kglha 1.1 1.3 0.5 4.6 59.9 48.0Share of agriculturc in GIDP S ofGCDP 32.5 43.3 35.0 16.3 26.3 15.7Housing %ofGDP .. 12.7Average household size persons per household 7.0 .
Urban 6.0 .
Fixed investmient: housing % of GDP .. 1.0Fuel and power S ofGODP .. 4.9Energy coDnsumption per capita kg of oil equiv. 77 78 72 257 364 1,595Households with electricity
Urban %ofi'ouseholds.,*Rurl
Transport and commnunication * of GDP .. 10.Fixed investment: transport equipment K2.0 1.0Total road length thou. km 7 8 9INVESTMENT IN HUMAN CAPITALHealthPopulaton par physician perons 18.544 13.640 ... . 3,277Population per nurse N 2917 1,091Populationperrhospital bed 1,103 823 .. 1,269 1,016 604iOral zehydyralion themapy (undcr-5) % of casem.. 60 37 38EducadionG~rous enrollment ratioSacondary % of school-agepop. 11 19 16 18 41 53R'.inae 7 12 12 .. 34
Pupil-wweache tio: primary pupits pertlewher 32 34 .. 40 39Pupil-teaher rato: secndary K20 33 18s. 20Pupils reaching grade 4 5 of cohortRepeaterrmte: primnay of total enrol .. ismiiercy % of pop. (agr l5+) -. 7 79 50 41 19"
FCMBIC %of fem. (agelS.+) .. 94 89 62 53anws circulatbona aEtoonomics3 1 7
Nwand rU circulationa 10 3n 2 12 .,Ap 7499
305

SingaporeHot Same rsgioudncam. gnRn
Unil qr -ric )h-lnduicallr mesure 1970.75 1980.85 1981^3 income
Priority Poverty IndicatorsI'OVRRTYUpper povony line local curr.. .. ..Hoadcount intex % or pop. ..
Lawer poverty llne local cur..HIoadcount Indox or pop.
GNP per cipilt USS 2,770 7,350 19,850 23.600ShIORT TERM INCOMIE INDICATORSUnskilled ubmn wageN local cuf.,Upqkllled rural wagonuRural Icrnwt of tradeConsumer price index 1987-100 72 IDI 116Lower IncomecroodM .. 12 108 .UrbanRural
SOCIAL INDICATORSPublic expenditure on basic social icos ' of G .. 10.0Gross enrollnmnt ratiosPrlmary %sehoolaegpop. 110 115 107 103Malc 113 117 lID 103Female 107 113 107 103
MortalityInfant modtality per thou. live births 19.0 10.0 5.8 7.0Under 5 moratliy .. .. 7.0 8.5
ImmunizadonMasles % age group .. 75.0 92.0 82.5DFT .. 78.0 91.0 90.2
Child malnutrit4on {under-5) 14.4Life expectncyTotal years 70 72 75 77Fcmale advantage 4A 5.4 5.0 6.4
Total fcrtility rat births per womn 2.6 1.7 1.7 1.7Matemal mortality rat per 100.000 live births .. 11 10
Supplementary Poverty IndicatorsExpenditures on social security * ortotal gov't exp. 1.7 1.5 2.0Social security coverage % ccon. aclive pop.Access to safe water: tolal % of pop. 100.0 100.0 100.0
Urban 100.0 100.0 100.0Rural ' 1000
Access to health cam '- .. 100A 100.0 ..
Population growth rate GNP per capita growth rate Development diamondb64 (annual average. percent) (annual average, percent) Life cxp
4 5
2 0 ~~~~~~~~~~~~~~~~~~~~~~~~~~per primary
7 1 }f wIl -5capita enrolment
-2 -10
1970-75 1980-85 1988-93 1970-75 1980-85 1988-93 Access to salowxr
C] Singapore Singapore-- High-income High-income
a See the echnical notes. p.387. b.ThIe development dianond, b d on four ky indicators, shows the avcge lcvel of devlopment in the counycompard with its incone group. See the induction.
306

SingaporeMast Same regiereImcme group
Ldra single year rwcentUnit of estam.ie High-
ludicator easure 1970-75 198045 1958-93 icome
Resources and ExpendituresHUMAN RESOURCESPopulation (mrc=1993) thousands 2,263 2.55h 2.790 S12447Age dependency ratio ratio 0.71 0.42 0.42 OA9Urban %of pop. 10D.0 100.0 100.0 77.9Populadon growth ratr annual % 1.7 1.2 1.0 0.6
Urban ' 1.7 1.2 1.0 0.8Labor rorce (15.64) thousands 909 1,226 1,325 395.641Agriculture % of labor force 3 2Industry * 34 38Female 31 33 31 38Females per 100 males
Urban numberRural
NATURAL RESOURCESArea thou. sq. km 0.62 0.62 0.62 32,146.15Density pop. persq. kgn 3,650.00 4,125.81 4.453.74 25.11Agricultura land % of lnd ama 13.11 8.20 1.64 4280Change in agricultural land nnual % .11.11 -16.67 0.00 -0.48Agricultural land der irrigation S .. .. .. 13.96Forests and woodland thou. sq. kn .. 0.00 0.00 10.56Deforestaton (ne) annual % .. .. 0.89
INCOMEHousehold income
Shamc of top 20% of households * of income .. 49Shasc of bottom 40% of households " .. i5Share of botom 20% of housedhds '. 5
EXPENDITUREFood %ofGDP 15.6 9.8 .. 8A
Staples .. .. .. 1.6Meat, fish. milk, cheese. eggs .. .. .. 3.8
Cemal imports thou. metric tonnes 727 907 798 77.530Food aid in crals 0 0 .. .. BFoodproductionpercapita 1987= 100 126 114 47 95Fertilizer consumplion kgtha 37S.0 1040.0 5600.0 150.0Shut of agriculture in GDP % of GDP 1.9 0.8 0.2Housing % of GDP 6.8 5.6 .. 11.7Averge houschold size persons per household SA 4.7
UrbanFixed investment: housing I of GDP 7.8 13.5 .. 5.0FuelOand power * of GDP .. .. .. 2.0Enry consumptio. percapita kg of oil equiv. 1.36 3056 5.563 5.203Households with eleiciity
Urban % of houreholdsRural
Transport and communication %of GDP 7.5 6.9 .. 8.1Fixed investment: tansport equipment 5.4 4.9 .. 2.1Toal road lengLh drou. kn 2 3 3
INVESTMENT IN HUMAN CAPITALHealthFPpulation per physician peesons 1.500 1.100 837 453Population per nurse 282 337Population per hospital bed 300 247 275 145Oral zbydyratiom therapy (under-5) % of casr-.EdidtionGrss enrollment ratioSecondary $ of school-age pop. 52 62 70 92
Female 52 64 71 94Pupil-teacher ratio: pimary pupils per eader 30 27 26Pupil-teadher ratio: secondary 24 22 20Pupilsreadhinggrade4 %ofcohort 99 100 100Repeaer ratc: pinmy % of total enroll IIllieracy % of pop. (age 15+) 31 14
Female Of ntal (age 15) - 21iewan circula;ion 2per thou. p. 189 361 337 320
World Bank Intrnaarinal Elcouxnocs. Dcpartmcufi. Apni
307

Slovak RepublicMmst Same regiefineonme group Next
Latest single year reant Europe [e- hIgierUnt of - estimate & Cent middb- Income
Indicator maesure 1970-75 198048S 1918-93 AsMa Income group
Priority Poverty IndicatorsPOVERTYUpper poverty line ICal cur. .. ..Headcount index % of pop. .. ..
Lower povenry line local curr. .. ..Headcount index %of pop. .. ..
GNP per capita USS 1.. 1950 2,450 1.590 4,350SHORT TERM INCOME INDICATORSUnskiled urban wages local curr. .. ..Unskilled mund wagesRural terms of tradeConsumer price index 117=100 .. .. 245
Lower incomeFooctUrbanRural
SOCIAL INDICATORSPublic expenditur on basic socidl services % of GDP .. .. .. .. . .Grs enmillmet ratiosPrimary % school age pop. .. 96 100 .. 104 105
MaleFemale
MortalityInfantlality per thou. live birtr 24.0 18.0 12.0 24.8 39.0 35.8Under 5 mortality .. .. 18.0 36A 61.5 42.6
ImmunizationMeasles g age grotp .. .. .. - 77.6 82.0DPT .. .. .. .. S.2 742
Child malnutrition (under-5)life expectancy
Total years 70 71 71 69 67 69Female advantage 6.7 7.9 B.9 3.8 5.9 5.9
Toal ferlity rate births perworan 2.5 2.3 1.9 2.1 2.9 2.9Matal m ality rae pcr IOD.ODO live births ..
Supplementary Poverty IndicatorsExpenditurcs on social security * of total gov't exp. .. .Sodc; security coverage * econ. active pop. .. .. ..Access to safe water total % of pop. .. .. 77.0 .. .. 86.7
Urban i .. .. .. .. 939Rural ' .. _ .. .. .. 66.7
Acoess to health care *m.. .. .. .. .. ..
Population growth rate GNP per capita growth rate Development difmondb6+ (annual avage percent) 5 (mual aveg, percento Li&f expeny
45
mGp Gross0 1 - ' ' 1 0-5§ _< q pr I priry
-2 -10Ac stosfwar1970-75 1980 1938-93 1970-75 19110-5 1988-93 c t Wae
W Sovak Republic _ Slovak Republic-lnwer-middlc-income L- a-riddbein
& See the technical notes, p.387. b. The development diamond. based on four key indicators, shows the avenge level of development in the countycompaed with its income gmeo. See the inlductioa
308

Slovak Republicmost Same regioulcamegngrup Nedt
Lateisto ybgeaw raceut Europe Lwer- higherUnit Of eatime & Cemmuw middle- hwo.e
lad kasor meuwnr 197075 195945 19U-fl Asia Incme grumpResources and Expenditures
HUMAN RESOURCESPopoulaton (mre=1993) thousands 4,736 5,140 5.313 494,619 1,D96.665 500,507Age- depedency ratio) radio 0.56 0.55 0.52 OX5 0.69 0aUrban S of pop. 46.3 54.2 57.9 64.8 54.7 71.2Population growth rawe annual S 0.9 0.7 0.4 0.6 1.6 1.
Urban 3.2 1.6 1.2 1L5 2.9 1.8L-abor force (1564A) thousands ... Z.350 237,197 459.196 190,136Agriculture % of labor forme ... 9inidustry ... 35Female . . 46 47 31l 29Females per 100 nudes
Urban number...Rural
NATURAL RESOURCESAre-a thou. sq. km ... .24.32036 40.62.67 21848.14Density pop. per sq. km ... . 20.20 26.5 2231Agricultural land S of land area ...... 39.61 41.26Change in agriculttura land annual S .-. -1.28 .0.13 0.03Agricultural land unde irrigaion S . . 7.15 12.66 8.84Forests and woodland thou. sq. km .. 0.02 0.02 0.30 5.95 3.04Deforestation (net) annual S ... 0.11INCOMEHousehold income
Sham of top 20% or housebolds % of iacme . . 22... Share of bottomn 40% of households S... 36 .
Shar of bottom 20% of househlds *17
WEN fURFood SofGDP...staplesMeat. fish. milk. cheese eggs
Cereal impotu thou. metric fa-es Si.. 5 34,452 66.21 4897Food aid in cereals ... , 4,392 5,477 544Food production per capita 1987=100 ...... 101 102Fertilizer consutmption kgia .... 41.7 48.0 6719Shar of aguiculturimunODP %ofGDP .. 6A 6.7 13.5 15.7 8.0Bainguf Sof GDP ..... 6.0 .
Avemrag household size person per household . .. ..
UrbanFixed investment hoesir Sof GDP... 52.-Fuel and pwer S Of GDP . .. i. Energ consmption per capita kg of oil equiv. ... . 2959 1.595 1.632Households with electricity
Urban S of households .. . ..
RuralTransort and eumunldcatlon Sk of CDP . .. ..
Fixd investment tanisport equipment ......-
Totalrmad length thou.lc ....an. .
INVESTNMETIN HUMLAN CAPfTALHealthPopulation per physician peron . 231 236 362 3,277-Population per nurse IQ... 15 249 ..-
PopultonpMrbospitalbed I. 11I11 136 604 395Oral rehydyration therapy (under-5) S orcases ..... . - 51EductionGross enrollment ratio)Secondary S of school-ag pop. .. 97 96 .. 53 53
Female -N . . . . -
Pupil-teacher ratio: primay pupils per teahe . . 22 ..- 25Pupil-teacher ratio: secondary ... 14 ---
Pupils reaching grade 4 5 ofeoobti ... .
Repeatcr rate puma*y Of toSmienroll ..... - -
ilireacy %*of pop. (ageIS4.) - .- 5 19 14Female % of km (BPel5+) ... . .. 17
cesu1~irculation pem6oumpp - .. 317 - 74 125;W;2ri Bmikfff~mcna EcnoiicDepaMMent April 1Y95
309

SloveniaMest Sme regqionlicome grasp Next
Lattsingleyaw recent Eawnpe upper- higherUni of snrem & C touI midrfe- incoome
Indricor meare 197075 19080S J988-93 Aska Incame grp
Priority Poverty IndicatorsPOVERTYUpper poverty line loc cui .. ..c..
Headcouni index % of pop. .. ..
Lower poverty line local curt. .. .. .. .Headcount index %of pop. .. .. .
GNP per capita USS .. .. 6.490 2,450 4,350 23,680
SHORT TERM INCOIME INDICATORSUnskilled urbn wages local cur. .. ..
Unskilled rural wagesRural tenrsof trade
Consumer price index 1997=100 .. .. .. .. .
Lower income
UrbanRural
SOCIAL INDICATORSPublic expenditure on basic social services '6 of GDP .. ..
Coss enmllment rainsPrimary % schol age pop. .. .. .. .. 105 103
Male . . 103
Feanale .. .. .. .. 103
MorolityInfant mortality per thou. live births 22.0 . 7.8 24.8 35.8 7.0Under5 mormaity .. - .. 36.4 42.6 8.
lmnmnizationMcasles * ap g . .. 82.0 82.5OPT .. _ . .. 74.2 902
Child malnutrition (under-5)LifeexpectancyTotal yeas 70 71 73 69 69 77Female advanuge 7.5 8.6 9J 8.8 5.9 6.4
Totalfer yrawe birdtsperwontan 2.2 2.0 1.5 2.1 2.9 1.7Maternal mortality rate per 100,000 live birfs .. ..
Supplementary Poverty lidicatorsExpendies on social security * of total govexp. .. .. _.Sodal scuity coverage % eoL active pop. .. .. _ ..
Acces to safe water total % of pop. .. .. 8 .. 96.7Urban .. .. _ .. 93.9
Rural .. .. _ .. 66.7 _
Acces to health cue
Population growth rate GNP per capita growth rate Development diamondb6e (annual avenv pcnt) 5 (nannu average, percent) 1i& r
4- 5
2 - . ~ - _ 0 9 S >\* | GNP ~Gross
,5t l capi \ / enrolirnt0D -5
-2 -101970-75 198W-85 1988-93 1970-75 1980-85 1988-93 sstosaewa
] Slovana slovcia- Upper-m iddle-in ome Upper-nddle-income
a. Sce the tchnical nots. p 387. b. The devlopment diamnd, based on fIur key indicato, shows dte average level of devdopmt in the ourycompared with itr ime group. See te introductionL
310

SloveniaMomt Swae ngleaImc... gru Nexd
rfleesl iI yer rcnt" Burap" Uppe'. higherUnit of est.mate A Cabal am Edd- hIcome
Indicator mesa tre 1970-7S 198045 1988-fl Aska Inca. group
Resources and ExpendituresHUMAN RESOURCEBSPopulatlon (mrur=1993) thousands 1.742 1.88 1 1.937 494,619 500.507 812,447Age dependency ratio ratio 0.55 0.49 0O45 0.57 0.62 D.49Urban ft of pop. 42A 53.8 61.7 64.8 71.2 77.9Pupuladion groth rate annual ft 0.8 0.5 0OA 0.6 1.7 0.6
Urban 34 2.7 1.9 1.5 1.8 0.8Labor foree (I5-64 thousands ... . 237.897 190.136 395.641Agriculture ft of labor force:. .
industryFemale .... 4729 38Females per 1100 males
Urban number...Rurat
NATURAL RESOURCESArmm thou. sq. km .. 20.25 20.25 24,320.56 21,848.14 32,146.15Density pop. per sq. km .. 90.95 95.27 20.20 22.51 25.11Agricultual land % of land --,ea .. 42.94 .. 41.26 42180Change in agrcultura lund annmal ft.. . -2.04 -1.28 0.08 -0.48Agricufltura land under irgtTionm ft.. 0123 7.15 2194 13.96Forests and woodland thou. sq. km .. 0.01 0.01 0.80 8.04 10.56Deomestation (net) annual ft... 0.00
INCOMEHousehold incomeSham of top 20% of households ft of income .
Share of bottom 40% of households-Share of bottom 20% of households
Food %ofGDP ... .. . 84Staples 1.. . . .I
Meat, fish, mfik, cheese eggsp .. .. 3.8Cereal ipmpat shot. metric tonnes .. 549 34.452 42.947 77,530Food ald in cereals 4,392 544 8Food production per capita 1987=100 ...... 102 95Fertilizer consumption kg/ha si 8.1 41.7" 67.8 150.0Shre of agriculture inGDP %ofGDP .- 4.9 13.5 LOHousing % ofGDP ...- 6.0 Ili1.Avrage househiold size pesons per household...
UrbanFlxd invesuuethousing %of GDP ... . 5. 5 i)Fuel and power % of GDP ... . 1.2 .. 2.DEnergy consumption per capita kg or' oil eq.iv. ... 1.531 2.959 1.632 5.2M3Households with electricity
Urban ft of househoklds . .. ..
RuralTranpor sm commdm[on%of GDP ...-.. 8.8
Fixed investimut trnusport equipment ...-... 2.1TotalroadlIength thou. km... -. .
INVFSFMENT IN HUMAN CAPITALHealthPopulation per physician peros .... 362 .. 453Population per nurse . 249 - -
Population per hospital bed ...- 136 395 145Ora wrhydyratio therapy (under-S) ft of casem...-. 51 -
EducationGrossenrollment rtioSecondary % of school-Age pop. ...... 53 92
Female. .. .. 94Pupil-macher rato: prinmay pupil per teacher I. .8 .. 25Pupil-teacer ratio: seondary - 16Pupils reaching grade 4 5Of cohort . ..
Repeate rate primay f of tota enroll ..- -
Illiftracy % of pop. (age 15.) ... .5 14Feniale % of fermage 15+) .-. .- 17
Nt circulation pe thou- W. .. 115 160 .. 25 320DwommInterntional Ecnoie Department April1995
311
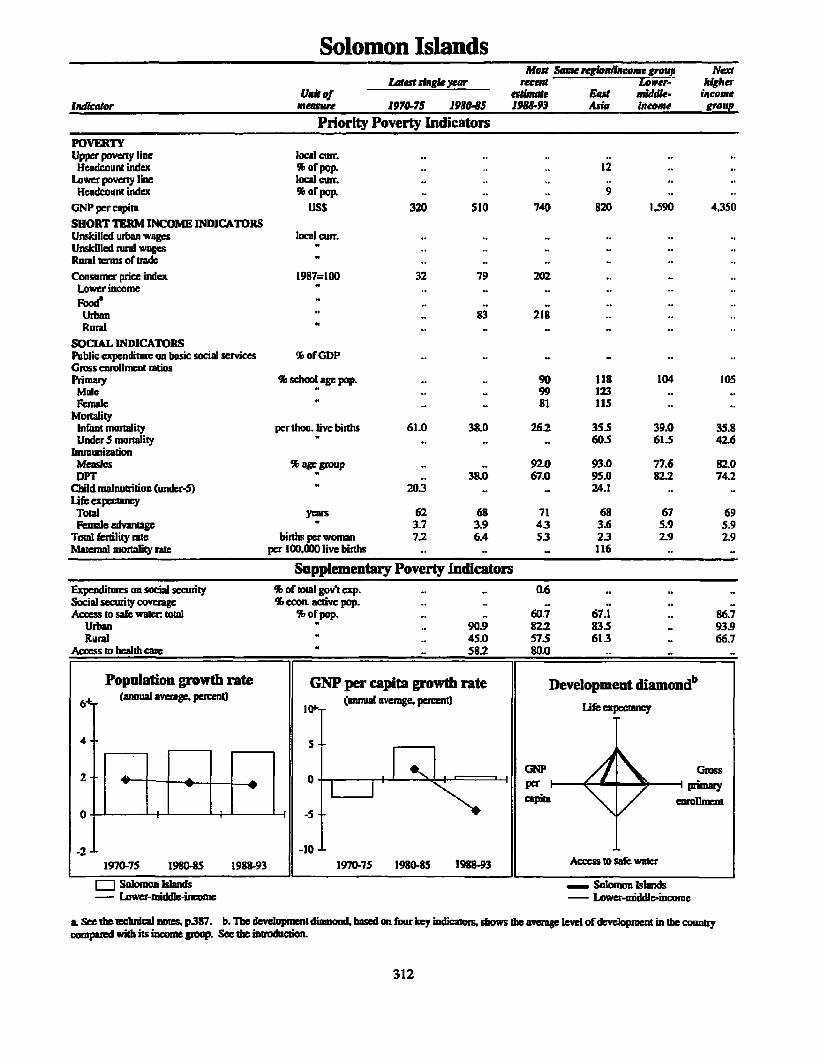
Solomon IslandsMost Sia rea/ncome grvup Ned
Laest singe year recent LMi>cri higherUnit of eqa Eart middk- income
ldikctor measure 19Y70-75 1980s 198193 Asia Income group
Priority Poverty IndicatorsPOVERTYUpper poveny line local cwr. .. ..
Headcount index % of pop. .. .. .. 12Lowerpoverty line local curr. ..
Headcount index % of pop. .. .. .. 9GNPpercapit US$ 320 510 740 820 1.590 4,350SHORTTERM INCOME INDICATORSUnskilled urban wages local curf. .. .. .. .. .
Unskilled murl wagesRural terms of tradeConsumer price index 1987=100 32 79 202Lower incomeFood .
Urban .. 83 218 9.Rural
SOCIAL INDICATORSPublic axpenditum an basic social services 9 of GDP .. ..
Cross enrollment ntiosFrimay % school agc pop. .. .. 90 118 104 105
Mole .. .. 99 123Female .. .. 81 115
MortalityInfant mortity per thou. live birfts 61.0 38.0 262 35.5 39.0 35.8Under 5 mntlity .. .. .. 605 613S 42.6
ImmmizatonMeasles %age grup .. .. 92.0 93.0 77.6 82.0DPT U .. 38.D 67.0 95.0 82.2 74.2
Child malnutrition (undcr-S) 20.3 . 24.1Ufe expctancyTotal yes 62 68 71 68 67 69Female advantmpg 3.7 3.9 43 3.6 5.9 5.9
Toaul ferility mt births per woman 7.2 6.4 53 23 2.9 2.9Matrneal moraity ratc per 100.000 live births .. .. .. 116
Supplementary Poverty IndicatorsExpenditures on social security S of roWa govt exp. .. .. 0.6 .. ..
Socia security coveagc % econ. active pop. .. .. .. .. ..
Access to sae wler totl % of pop. .. .. 60.7 67.1 .. 86.7Urban 90.9 22 83.5 .. 93.9Rura -. 45.0 575 613 .. 66.7
Acess to healih care .. 582 80.0 .
Population growth rate GNP per capita growth rate Development diamondb(anna] a2verge. percent) l (annual average. percent) lie apetancy
4-A
capia anilmient
-2 - -4 = ____ __ _lMI_ _
1970-75 198045 1988-93 1970-75 19B0-85 198"3 A osakwaw
W Solomon Islands Solomo lands- Lower-mi e-income Lower-midlincome
& See etechnical notes. p387. b. Tbch dlvdp tdi dbdvdonofokeyindicaums,ows dha levelofdcvdopment in thecountrycompaed with its income group. See the introduction.
312

Solomon IslandsMost Sme regien/lume group Next
LatssingamLyewyn recent avwer. I WAIFAunit of estimate Enst middle- Incoern
Indicator nmeaure 1970-75 195185S 1958-93 Asia lusam gr-oupResources and Expenditures
HUMAN RESOURCESPopulatIon (unre=1993) thousands 190 270 354 1.713J883 1.096.665 500.50Y7Age dependency ratio ratio 0.59 0."9 0.91 0.54 0.69 0.62Urban %of pop. 9.1 12.4 16.1 31.3 54.7 71.2Populadon grwth rate mnnual % 3.3 3.5 3.4 1.4 1.6 1.7
Urban 3.8 6.6 6.6 4.0 2.9 1.8Labor force (15-64) ihousands SO 123 144 942.977 459,196 190,136Agriculture % of labor rorce...IndustryFemale f38 37 37 4'1 3'1 29Femnales per IDUO males
Urban number 48 .
Rural 96 .
NATURAL RESOURCESArea thou. sq. km 28.90 28.90 28.90 16,367391 40.610267 21,848.14Density pop.jp,rrsq. km 6.57 9.34 11.84 103.27 26.52 22.51Agriculaural Land % of land wrea 3.18 3.36 3.43 44.21 39.61 41.26ChangeinnagriculLural Land annual % 0.0 1.00 0.00 0.24 40.13 0.08Agiicullural land under irrigaioun S .... 14.68 12.66 8.84Forets and woodland thou. sq. kmIanLO 0.03 4.06 5.95 8.04Deronmsttin (net) annual % .. 0.00INCOMEHousehold incomeSham of top 20% of households % of income...Sham of bottom 40% of householdsShare of bottom 20% of households
EXPENDflVRFood % ofGDP...
StaplesMeaM fish, milk, chese eggs
Cereal impor" thou. metric ans6 15 24 30.036 66281 48.947Food aid in cerea I .. 0 447 5,477 544Food production percapita 1997=100 113 115 90 115 101 102Fertilizr consumption kcgiha .... 76A4 48.0 67.8Sham of agrcultur in GDP S of GDP .... 17.1 15.7 tO0Honusig S of GDP .
Average household size persons per household 5A .
Urban ft5.4 .
Faxed investment housing SW of GD?P..F.ad and power %ofODP ..
BnMWgconsumption percapita kg ofollequiv- 937 IRS 164 632 1,595 1.632Households widh electiciy
Urban S of households . ..
RuralTransport and communIcatIon S of GiD? ..
Fixed invesmet: trasport equipme-ntTotal road length thou. km .a
DIVESTNENT IN HUMAN CAPITALHealthPopulation per physician penos 4.879 .. 6.5 1,063 3,277Populafion per nue 668 ..- 1,490 -
Population per hospital bed ft136 174 - 612 604 395Oral rehydyration therapy (under-5) % of cases ... 60 32 .51I
Gross enrollmecnt ratioSecondary * of school-age pop. ... 17 53 53 53
Female ... .47 .
Pupil-teacher ratio: primary pupils per teache 26 24 24 23 .. 25Pupll-tamcherrsatio: seconduy t18 1 9 17 16 -
PupilsrmachinggWade 4 % of cohort so 86 88 92Repcatcrraft:pimary %Of towalenrol 5 4 .. 6Illiercy % ofpop. (agelS+) .... 22 19 14
Female % of felL(agel5+) ... .36 . 17Nc!!,aperciuIation pe thouL4op. ...... 74 125
313

SomaliaMeat Same reginu comue greoup Nex
-Laestuingk yer mecen SiF hwgrUnl of esfl.mate Sachea Law- intome
Indialot msure 1970-75 1980-85 1988-93 Africa income groupPriority Poverty Indicators
POV1ERTYUpper poverty line local cur. .. ..
Hcadcounl index b of pop. .. .. .. .. 19Lower povety line local curr. .. .. .. .. ..
Headeount index % of pop. .. ..
GNP per capita USS .. .. .. 520 380 1,590
SHORT TERM INCOME INDICATORSUnskilled urban wages local curr. . .. .. .. .Unskilled ruml wagesRural terms of trade
Consumierpriceindex 1987=100 3 57 182 .. .. .Lower incomeFo&
Urban .. 62 .. .. .Rural
SOCL^1 INDICATORSPublic expenditure on basic social serviecs % of CDP .. ..
Grass enmilrlnt ratiosPrimiy % school ag pop. 59 15 104 67 108 104Male 76 20 105 74 116Female i 42 10 104 60 101 -
MorlityInfant morlity per dtou. live births 155.0 143.0 120.0 93.1 63.1 39.0Undrer5mortaity ' .. .. 203.0 172.3 101A 615
ImmunizationMeasles % age group .. 34.0 30.0 49.9 87.3 77.6Dfl T .. 22.0 18.0 51.9 f9.9 822
Child malnutrition (under-S) 23.0 .. .. .. 40.3ifec cxpctancyTotal yeas 41 43 47 52 62 67Female advantage 3.2 3.2 3.2 3.3 2.1 5.9
Total fertility rate birtis per woman 7.0 7.0 6.9 6.2 3.6 2.9Matrnal mortality rate per 100.000 live birdis .. 1100
Supplementary Poverty IndicatorsExpenditures on social sec.rity % of total govt exp. .. ..
Sociad security coveage S6 econ. active pop. .. ..
Accesstosafewatw total %ofpop. 15.0 33.3 56.0 .. 67.0Urban 17.0 58.0 50.0 .. 78.7Rural 14.0 22.0 55.0 .. 62.0
Acoess to health cam .. 20.0
Population growth rate GNP per capita growth rate Development diamnb6+ (mmualr averae pereent) (amual a ges percent) t;t
4 5
per -ielIFCW 51 | n 16 ~5 capita0 ~~~~~~~~~~~~-5
-2 -101970-75 1980-85 1988-93 1970-75 1980-8S I988-93 Acce tosatbwater
] Sorndia - SomainaLow-income Law-inom
a. See the technical noles. p.38 7 . b. The deveopmnt diamond. based on four ky indicats, shows the ae lcvd of devlopmentin tnh countrycompard with its income grop. See the introduction.
314

SomaliaMost Sen regienfuneome group Nen
Ltaestgi _year reent 3Sb- hi gherUVa f -o e stlate Saham Lwv. incae
Iniafator measre 1978-75 1980-S 1988J3 Afria income grnpResources and Expenditures
HUMAN RESOURCESP.pulalon (mrP1993) thousands 5,471 7.875 8,954 558W97! 3,091.764 1,096,665Age dependency ratio ratio 0.95 0.98 1.00 0.94 0.67 0.69Urban % of pop. 21.3 23.2 25.1 29.8 27.6 54.7Population growth race annual % 2.7 3.2 0.6 2.9 1.9 1.6Urbn 3.5 4.1 1.8 5.0 3.9 2.9
Labor frce (15.64) thousands 1,516 1.999 2.255 29,480 1,442,452 459.196Agticulture % of lbor force 77 76Industry 8 8Feale 41 40 38 36 33 31Fermles per 100 males
Urban number .. ..Rural N .. .. ..
NATURAL RESOURCESArea thou. sq. km 637.66 637.66 637.66 24,273.63 39,091.96 40,682.67Dnsily pop. per sq. km 858 12.35 13.96 22.37 77.60 26.52Agricultural la %orland ara 70.10 70.18 70.20 52.54 52.82 39.61Change in agrictural land annual % 0.01 0.01 0.00 0.06 0.03 -0.13Agricultual lnd under igation * 0.23 025 0.27 0.83 18.02 12.66Fomrstsandwoodland hou.sq.ki .. 0.01 0.01 5.32 7.15 5.95Deforestation (net) annual % .. .. 0.36
INCOMEHousehold incomeShm of top 20% of households 6 of income .. rShar of bottom 40% of bouseholdsShae of bottom 20% of households
Food % orGDP .. 38.9Staples .. 12.1Meat; fish, milk, cheese, eggs * .. 10.1
Cerealimiports thou. metric tonnes 169 180 228 13.157 34.420 66.281Food aid in cemals I IlI 248 318 5,079 8.334 5.477Fbdpop uctionpercapita 1987=100 108 93 55 101 113 101Fatdierconsumption kglha 0.1 0.1 0.1 4.6 59.9 48.0Shwe of agiculmmeinGDP %ofGDP 48.7 63.6 62.7 163 263 15.7Houi %ofrGDP . 11.9Aveage household size persons per household .. .Ulban
Fixed nvesuent housing % oFGDP .. 2.3Foad andpower %ofGDP .. 3.1Energy consumption per capita kg of oil equiv. 33 57 7 257 364 1,59SHouseholds with electricity
Urban % of households .. ..
RurnlTragopt o nd Qnnnmmicat %ofGDP .. 1.7Fixed investnent rnsport equipmet .. 4.6Totol road length thou. km 17 21 22 .
INVESTFMDT IN HUMAN CAPITAL
Population per physician persons 34,834 15.825 .. .. 3,277Fbpululion pernrs* .. 2.233 -
Populationperhospitalbed 931 - 1.481 1,269 1.016 604Oal rehydyration trpy (under-5) S of cases .. .. 78 37 38
Gross roment radoSecondary %ofschool-agepop. 6 10 .. 18 41 53
Female * 3 7 .. .. 34Pupil-acher ratio: primay pupils per teacher 57 19 .. 40 39Pupil-eachcr rdio: seondary 23 19 .. .. 20PNpils reachikg gade 4 % of cohort 50 63Repaler na primary % of tw enoll -
Ahiearney %ofpop.(agel5+) .. 83 76 50 i 19Female Soffem dagS 15+) .. 91 86 62 53
Newspilpe chwlation per thou. op. 1 1 1 12 .. 74
315

South AfricaMegst &me reonauincema group Next
Last single year reent Sii Ui higherUn* of e timate Salhran middle- income
ludicaler IIWSUH 1970-75 1"0-8S 198-93 fria Inceme gropPriority Poverty Indicators
POVERTYUpper poverty line local curr. .. .
Headcount index % of pop. .. ..
Lower poverty line local cur. .. ..
Headwount index % of pop. .. ..
GNP per capita US$ 1,540 2.010 2,980 520 4,350 23,680SHORT TERM INCOME INDICATORSUnskilled urban wages load cur. .. ..
Unskiled rural wages nRural erms or tradeConsuer price index 1987=100 7' 73 213
Lower incomeFooe 11 68 238
UrbanRural
SOCIAL INDICATORSPublic cxpnditure on basic social services % of GDP .. 2.2 3.0Gross enrollment rtiosPrimary %schoolagepop. 105 .. .. 67 105 103Male 105 .. . 74 .. 103Fmale 105 .. .. 60 .. 103
MortaityInfant mormlity pr thou. live births 76.0 63.0 52.0 93.1 35.8 7.0Under 5 monality .. .. 69.0 172.3 42.6 8.5
ImmunizationMeasles * age grup .. .. 63.0 49.9 82.0 82.5DPT n .. 67.0 51.9 74.2 90.2
Child malnutrition (under-5) n 43.0Life expecacy
ToWl years 54 58 63 52 69 77Fease advantage 6.0 6.0 6.0 3.3 5.9 6.4
Tol feulity rate birhs per woman 5.5 4.8 4.0 62 2.9 1.7Mautenal nrlity rate per 100,000 live births .. 84
Supplementary Poverty IndicatorsExpanditns on soial seccrity % of total goVt exp. .. ..
Social security coverag % econ. active pop. .. .Access to safe watecr total % of pop. .. .. . .. 86.7
Urban n .. 93.9Rural .. .. .. .. 66.7
Access to health care m .. .. .. .. ..
Population growth rate GNP per capita growth rate Development diamond.(annualaaverage.gprcent) S expcn
1 : X 1 1 C I m ~~~~~~~(anul averag. perent
4 -5
GNP Gross
r ti v tt n 1
~~~~~~~~~~~~~~~~~~~~~capita enrollment
-2 -101970-75 1980-85 1988-93 1970-75 1980-85 1988-93 Aces to sak watr
fl South Afica - South Africa- Upper-middleincome - Upper-middle-incomc
a. See the technical note p3S7. b. Tbs dedveloment diamond, based on four kcy indicatos,m shows the aveage level of dcvelopment in the countrycomann d with its income group. See the introduction.
316
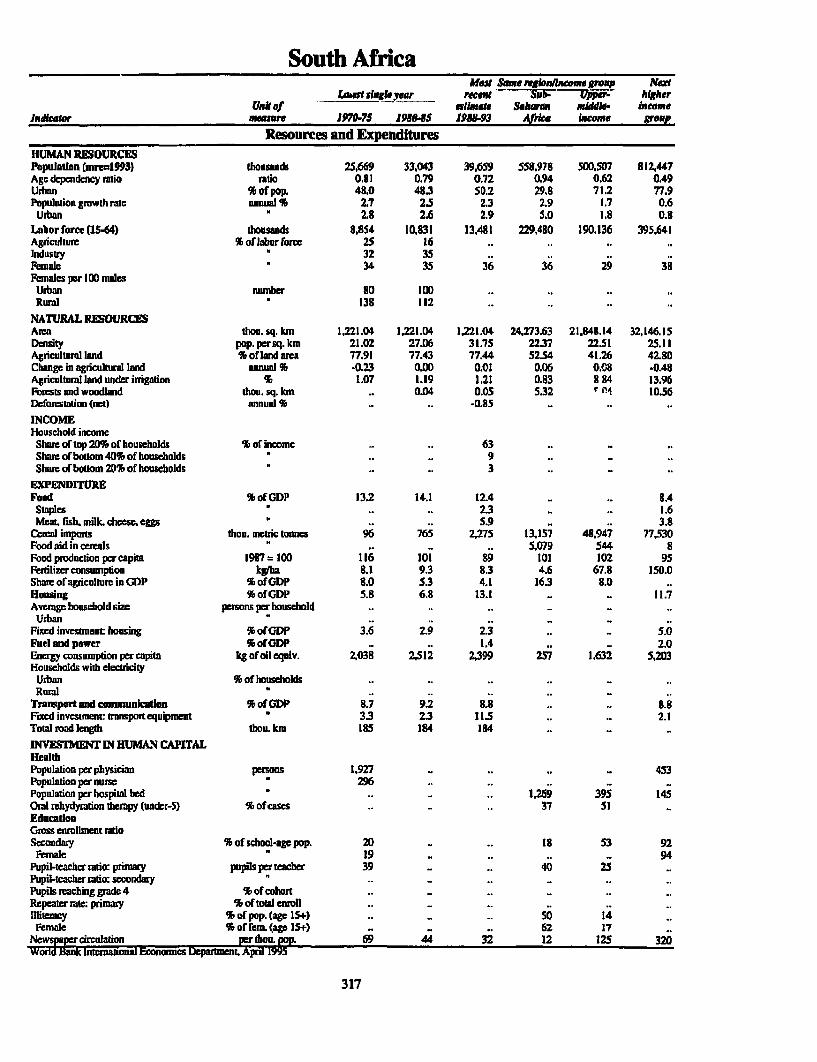
South Africamom Snag rqea/mneo. gpomp Newt
Uabaf ~~~Lasvit sngekyer rue at iFU#&r-vp higher
Indicator seiure 197075 1989-8 198-93 Afric fwees group
Reources aind ExpendituresHIUMAN REOURCESPopulaktion (mir=c9l31 thousands 25,669 33,043 39,659 553.978 500.507 312,447Age dependceny rfat ratio 0.11 0.79 0.72 0.94 0.62 0.49Urban % of pop. 48.0 48.3 50.2 29.8 71.2 77.9Population growth rate annual Ii 2.7 2.5 2.3 2.9 1.7 0.6
Urban 2.8 2.6 2.9 5.0 1.8 0.1Labor force (I5-64) thouand 3,854 10,831 13.481 229,480 190.136 395.641Agriculture % of labor force 25 16Industry 32 35Female 34. 35 36 36 29 38Females per I200 males
UrbaLn number 10 1100Rural *133 112
NATURAL RESOURCESArea tho. sq. km 1,221.04 1,221.04 1.221.04 24,273.63 21,843.14 32,146.15Density pop.perrsq.lkm 21.02 27.06 31.75 22.37 22.51 25.11Agricultural hand S of land arma 77.91 77A43 77.44 52.54 41.26 42.80Change in agricultual lan umuui S -0.23 0.00 0.01 CL06 0.08 -0.48Agricultura llanunder irrigation % 1.07 1.19 1.21 0.83 1 84 13.96Forests and woodland thou. sq. km .. 0.04 0.05 5.32 04 10.56Deforestation (net) annual S .. -0.85INCOMEHiousehold incomeShze or tap 20oofbhouseholds S of inwcm .. 63Shar of bostom 40Sofhousebolds '...9
Share of bottom 207' of households ... 3EXPENDITUXEFond of GDP 1332 14.1 12.4 ... .4
Staples a... 2.3 ... 1.6Meat fish, milk, cheese, eggs ... 5.9 ... 3.8
Cereal import thou. metric tonnes 96 765 2,275 13.15,7 41.947 77,530Food aid in ceias ... . 5.079 544 8Food production per capita 1917=100 116 101 899 101 102 95Fertilizer consumption kg/ha 8.1 9.3 8.3 4.5 67.8 150.0Share of agriculture in GDP S of GDP 8.0 5.3 4.1 16.3 8.0Henning SofGDP 5.8 6.8 13.1 I. . 1.7Average household size pewrsos per household...
UrbanPixed invesneat housing S of (lOP 3.6 2.9 2.3 .. 5.0Fueland power % ofGDP ... 1.4 ... 2.0Energy consumption percapxta kg of oil equiv. 2,038 2,512 299 257 1.632 5,203Households wihI electridcty
Urban S of households...Rural
Transportanecomnmunication SbofOGDP 8.7 9.2 8.8... LFixed investment nnportequipnmet 3.3 23 11.5 ... 2.1Totalmrad length thotu.km 285 184 114INVESTMIENT IN HUIMAN CAPITALHealthPopulation per physician persos t.927 ...... 453Population per nu=s 296 .
Populaton per hospital bed ... . 1.259 395 145"Oral rehydyration therpy (under-5) * Of cae .. .37 51EducationGross enrolment ratioSecodary S of school-age pop. 20 is..1 53 92
Female 19 ...... 94Pupil-teache ratio: prma pupils per teacher 39 ... 40 25Pupil-teacher ratioc eodrPupils reaching grade 4 5 Of cohort...Repeater rate primary % Of tota enroll...Illiteracy S of pop. (agel15+ ....-. S 14
Female S offkm (aplS+) ... .62 17
~~= .Mdrcalation aerthoun4o. 59 44 32 12 125 320
317

SpainMost Some reingimcomegr.up
Lasesinle year recantUnit qr imate High.
Indkator macurn 1970.75 1980-85 19u-n3 lncome
Priority Poverty IndicatorsPOVERTYrUpper poverty line local cuif.
Headcount Index % of pop,Lawer poverty line locial cun.
Headcount Index % of pop.GNP pcr capita USS 3.000 4.200 13.590 23.680SHORT TERM INCOME INDICATORSUnsidlled urban wages local cuin.Unudilled rral wagesRunld terms of trade .Consuncrpriceindex 1987=100 21 87 140
Lower incomeFood' N 13 86 129
UrbanN
SOCIL DICATORSPublic expenoitue on basic social services % of GDPG enroslment radosPrimary %schoolagepop. III 113 107 103Male III 113 107 103Female III 112 107 103
MortlitylIfant mortality per thou. live births 21.0 11.0 7.0 7.0Under S mern ity .. .. 9.0 8.5
ImmunizadonMeasles 8 age group .. 79.0 54.0 82.5DPI .. 79.0 73.0 90.2
Child nilnuairion (under-S)Life expectancy
Total yeas 73 76 78 77F=eral advantage 5.5 6.1 5.9 6.4
Total fertility rate birts per woman 2.9 1.9 1.2 1.7Matemal mortaity rate per 100.000 live births .. 10
Supplementary Poverly IndicatorsExpenditures on soci security of tot goVt cxp. 50S 38.6 36.7Social seurity covcragc l econ. acdve pop.Acoes to safe water tal S of pop. .. 100.0 100.0
Urban n . 100.0 100.0Rurl 100.0 100.0
Accss to health ca n 95.0
Population grwth rate GNP per capita growth rate Development diaMondb(annual aveage. pen ent5 (mnual avage, percent) ILie exptcy
45
2 ______________________ ~~~~~~~~~~~~~~~GNP G1125
per pimary
capita \r/Ument
-2 -101970-75 195085 1988-93 1970-75 1980G-5 1988-93 Acaess to saf water
r Sppin Spain- High-incme - Hgh-income
& Seethetechnical noes. p.387. b. The evelopmentdiamo based on fourkey indicatrs shows theavrage level of dvelopmentin the countrycompared witb its incone group. See th intduction.
318

SpainLeers recent peerfoul S A -aSoa nuqa
usa ft qf - - uu ftIu Hi).Indicator umsuvi 1970.75 191085 198893 Incae
Resources and ExpendituresHUMAN RESOURCESPopulation (mruw1993) thousnds 35.596 38.474 39.481 B12.447Ape drpendoncy ratio rio 0.60 0.54 0.47 0.49Urban or pop. 69.5 74.2 76.1 77.9Population growth rale annUal % 1.1 0.5 0.2 0.6
Urban N 2.1 0.9 0.5 0-.Laborfmrce(5!64) thouqnds 12,369 13.725 14.848 395.641Agrliculture af labor force 21 17lnduty 37 37Female 22 24 25 38Females per 100 maleSUrban number 108RUral 97
NATURAL RESOURCESArea tOt. sq. km 504.7 504.78 504.78 32,146.15Density pop. per sq. km 7052 76.22 78.08 25.11Agricultural land % of land arva 63.89 61.49 60.48 42.80Change in agricultural land annual 9 -0.49 0.27 -0.54 048Agricultural land under in;igadon * 8.83 10.47 11.27 13.96Fores and woodland thou, sq.kin .. 0.26 026 10.6Deforestation (net) annual % .. .. 0.00INCOMEHousehold incomeShae of op 20% of households % of incone 44 40 37Shme of botom 40% of households 17 19 22Shae of bottom 20% of householdsr 6 7 8
EXPEDNDrUFood SorGDP 21.9 17.3 12.3 8A
Staples 217 2.5 1.9 16Meat, ish, milk, cheese, eggs 12.1 9.7 7.1 3.8
Cerea imports tho. mnetric tonnes 4.760 4.139 4,955 77,530Food aid in ceralcs 8Foodproductionpercapial 1987= 100 79 9l 92 95Fertilizer consumption kgfha 43.9 56.5 50.8 150.0Share of agriculture in GDP I of GDP 5.9 35HousIng %ofCGDP 9.1 11.0 8.2 117Average household size persns per household 3.8 3.5
UrbanFixed invstment housing S ofGDP 6.1 32 5.0 5.0Fuel and power % of GDP 2.0 2.0 16 2.0Energy consumption per capita kg oroil equiv. 1,642 1.869 2373 5,203Households with electricity
Urban S of householdsRural
Transport and nmmurdcatLon S of GDP 7.2 9.6 10:2 L8Fixed investnent ansport equipment 2.1 1.9 2.6 2.1Total road length thou. km 216 319 324INVEBSTM IN HUMAN CAPFrALHedthPopulation per physician persons 745 315 279 453Population per nurse 2S8Population per hospital bed 192 211 145Out! rehydyration tbhrapy {under-5) % of casesEducatonGross enrollment ratioSecondary % of school-age pop. 73 99 108 92
Femnle 71 104 113 94Pupil-teacher ratio: primary pupils per teaher 21 25 21Pupil-teacherratio: seconday 22 21 17Pupils mahing grade 4 * of cohort 95 96 92Repcat rat primary % of totalemoU C. SIllitercy % ofpop. (age S4) 8 6 5Femak %ofkmnl (4agel ) . 8 7
Newspaqrcircuation per lboapM. 98 BO 104 320_wora nm hi-m moficnal _cona Department. Apri. 115
319

Sri LankaMeat S m J rw$iAeudaouui pop NorL___i s e _e *,, ZMeW hiMheN
Unit f .eatiee SeMi Low Incoamelu*sw -mare 1970.75 1914s Jl.9-10 Asia Income ,Mrp
Priority Poverty IndicatorsPOVUTYUpperpovmnyllno localu. .c .. 471Hoodcounilndex *ofpop. .. .. 22 2B 19
Lower povery llno blcl ourr. ..Hmadeount Index of pop. .. .. .. ..
ONPpercapka US$ 310 370 600 310 380 1,590SHORT TERM INCOME INDICATORSUnskilled ubm wages local w ur. .. ..Unskilled nurl wags.Rural lerms or trdrConmunhrpdceledex 1987.100 30 86 216
Lower IncmeFoodt 20 ..Urban N .. S6 219Rurl
SOCIAL INDICATORSPublic expnitum an ba socidl servIces at UDP .....Cros enrolnbent raPrimay *adhoolaBPpop. 77 103 107 106 108 104
Male * Bl 104 109 I1B 116Female 74 101 lOs 93 101
MflhIsyInfan morllty per tho. Ilve biros 56.0 35.0 17.4 83.7 63.1 39.0Under 5S moality S .. .. 19.0 123.9 101.4 61.5
ImmunaonMeses Sagegroup .. 18.0 79.0 85.8 87.3 77.6DPr .. 4.0 86.0 90.2 89.9 12.2
Child malnutrition (under-5) N .. 47.5 .. 60.4 40.3life expecncyTotal yes 65 69 72 60 62 67Female advtae 2.0 4.5 4.5 0.A 2.1 5.9
Tow] fketlity rate birth per womn 4.0 3.3 2.4 4.0 3.6 2.9Matemril mnlily rate per 100,000 live birh .. 90 .. 420
Supplementary Poverty IndicatorsExpendixturs on social security %of tofal gov't exp. .. ..
Social security covrae l econ. owe pop. .. ..
Acceus to safe watcr oa S of pop. 19.0 40.3 60.0 69.5 67.0Urbn 36.0 82.0 79.1 73.8 78.7Rural * 13.0 29.0 54.1 67.2 62.0
Access to bhelth c .. 90.0 90.0 95.8
Population growth rate GNP per capita gowth rate Development diamondb(anual average pern) 1 5 (annul avemge, percent) Life sxpectny
4 5
GNP Grass20
-2-01970-75 1918 198M-93 | 1970-75 1980-85 1988-93 Access to sfe water
- Sn Lanka Sri La1k- Low-ioncw Low-income
. Sce d technic nots, p.387. b. lh developmen dimod, bed on fourkey indicators, shows te averag lvel of devlopment in ie counyconmpaed with it cmc group. See the inbducion.
320

Sri LankaMost Same re8igmNcomee group Next
lAtest sbtge year - reant higherUnm of -- timatc Souh Low- inc.me
Indicator measure 19709-75 198-05 1989-93 Asia income roup
Resources and ExpendituresHUMAN RESOURCFSPopulution (mre=193) thousands 13,603 16,114 17,897 1,193,503 3,091,764 1,096,665Age dependency mtio ratio 0.77 0.64 0.59 0.74 0.67 0.69Urban % of pop. 22.0 21.1 22.0 25.7 27.6 54.7Populatdon growth rate annual 9 1.7 1.7 1.3 2.1 1.9 1.6Urban 1.8 1.2 2.2 3.5 3.9 2.9
Labor force (15-64) thousands 4,773 5.920 6.673 437.138 1,442,452 459,196Agricult are l of labor fore 54 53Industry 14 14Female 26 27 27 22 33 31Females per 100 malesUrban number 83 88Rural 97 99
NATURAL RESOURCFSArea thou. sq. km 65.61 65.61 65.61 5,133.49 39.091.96 40,6B2.67Density pop. per sq. km 207.33 245.60 269.29 227.55 77.60 26.52Agricultural land %of land area 36.35 35.82 36.27 59.03 52.82 39.61Change in agricultural land annual % -0.34 0.17 0.09 0.00 0.03 -D.13Agricultural land under irrigtion % 20.43 25.18 23.46 29.34 18.02 12.66Forests and woodland thou. sq. km .. 0.02 0.02 0.66 7.15 S.95Deforestation (net) annual % .. .. 1.42
INCOMEHousehold income
Share of top 20% of houscholds % of income 43 .. 39Share of bottom 40% of households 19 .. 22Sham of bottom 20% of households * 7 .. 9
EXPENDITUREFood %ofGDP 52.2 34.0Stapics 30.5 13.9Meat, fish, millk chcesl gs c 5.7 6.1 .. .. .
Cen:aliimports thou.mernictonnes 1.164 911 1.149 6.211 34.420 66.281Food aid in cereals 271 276 248 1,624 8,334 5,477Foodproductionpercapila 1987= IOD 100 117 93 111 113 101Fertilizer consumption kglha 30.8 84.4 73.4 70.2 59.9 4.0Share of agriculture in GDP %aof GDP 293 249 22.1 27.4 26.3 15.7Housing %ofEGDP 43 43 -Average household sizc pasons per household 6.0 4.9Uiban - 6.0 .
Faxed investment housing % of GDP 2.2 6.1Fueland power %ofGDP 1.7 2.3Energy consamption per capita kg of oil equiv. 77 87 110 216 364 1.595Households with electricity
Urban % of households .. 45.9Rural
Transport and communicatoon *of GDP 5.3 12.1 .Fn.ed investment transport cquipnent LS 3.4Total road length thou. km 26 25 26 _
]NVESTME1NT IN HUMAN CAPITALHealthPopulation per physician persons 5.947 5,613 .. 2.850 .. 3,Z77Population per nusc 1.288 1,311 .. _Population per hospital bed 302 342 369 1.638 1.016 604Oral rehydyration hepy (under-5) 56 of es .. .. 76 37 38EducationGross rollmnct rtioSecondary % of school-age pop. 48 63 74 40 41 53Female 49 66 77 29 34 _
Pupil-teacher ratio: primary pupils per teacher 15 16 29 61 39Pupil-teacher rtio: secondary .. .. 20 26 20Pupils rraching gade 4 % of cohort 83 98 95 .. .. .Repeatpraw:primary %lof alenroU iS 8 8 -
Illitercy %ofpop.(agelS4) 22 13 12 54 41 19Female %offrnt(agel5+) -- 19 17 69 53
Newr circulation per Ihou. pop. 41 24 27 26 74World Bank Interatona Economnics De_part t pril 19Y5
321

SudanMat Saw rqion/ll cosegroup Ncea
Wesn singe Yer ncent SRI- higherUnitof euJIwate Shalmn Ioa- Income
Indikator mesure 1970-7S )ImSS I198-93 Africa income group
Priority Poverty IndicatorsPOVERTYUpper poverty line local cur. , ..
Headcount index % of pop. .. .. .. .. 19Lower povety line local CUr. .. ..c
Headeount index * of pop. .. ..
GNPpercapita USS .. .. .. 520 380 1.590
SHORT TERM INCOME INDICATORSUnskilled ufban wages local curr. .. ..
Unskilled rurnl wagcsRural tenns of tradeConsumerprice index 1987=100 7 67 4.44.Lower income N .. 61 122Food'a
UrbanRural .. 62 118 -....
SOCIAL INDtCATORSPublic expenditure on basic social services % of GDP .. .. .. .. .
GCrss enrollment ratiosPrimary %schoolagepop. 47 50 50 67 10S 104Male f 59 58 56 74 116Female 34 41 43 60 101
MortalityInfant morality per thou. live births 110.0 92.0 76.6 93.1 63.1 39.0Under 5 mortality .. .. 128.0 1723 lOlA 61.5
ImmunizationMeasles % age group .. 6.0 58.0 49.9 873 77.6DPT .. 8.0 63.0 519 89.9 82.2
Cbild malnutriton (under-5) '5.. 52 .. .. 40.3Life expctancy
Total yeas 44 49 53 52 62 67Fcmae advanta 2.8 2.8 2. 3.3 2.1 5.9
Total fertility mre births per wonan 6.7 6A 5.7 62 3.6 2.9Matral morality rate per 100,000 live births .. 655
Supplementary Poverty IndicatorsExpenditurs on social secunity * of total gov't cxp. 0.9 2.2Socal security coveage S econ. active pop .. .. .. .. -.Aceesstosafewater to;l % ofpoDp. 50.0 44.8 .. .. 67.0
Urban 96.0 100.0 100.0 .. 78.7Rumrl 43.0 31.0 .. .. 62.0
Access to health care .. 70.0 70.0
Popuiation growth rate GNP per capita growth rate Development diamond6b(annual average. perce nt (annual average. percent) Lfc n q
4 -- 5
2- .__0-_____________I GNP P GraSS
a F 7rt'tt7 4l I l l l -5 . capita enrollment
-2 11970-75 1980-85 1981-93 1970-75 1980-85 1988-93 Aces tosae water
Sudan - Sudan- Low-income Low-income
a. See h technical note p.3B7. b. The developmcntdimnod based on four kmy indcalom. shows the avraenp level of development i thecountrycompawd with its income grmup. See the intuductioIL
322

SudanMost SaMe rezlenllneoue roup Nex
Latest singl .w reurin 5W- higher[unk of clgimae Satman Low- income
indicator macure fl79-75 19o8045 1988-93 Africa incoea g9row
Resources and ExpendituresHUMAN RESOURCESPopulation (mnre=1993) fthusands 16.012 21.462 26.641 558.978 3.091.764 1.096,665Age dependency ratio ratio 0.89 0.92 0.89 0.94 0.67 0.69urban S of pop. 18.9 21.0 23.8 29.8 27.6 54.7Population growth ride annual % 2.9 2.8 2.7 2.9 1.9 1.6
Urban 5.6 3.7 4.5 5.0 3.9 2.9Labor foree (15.64) thousands 5.328 6.991 8.855 229.480 1,442,452 459.196Agriculture % of labor force 74 7 1Industry 7 7Female 20 2 1 23 36 33 3 1Females per 100 males
Urban number 82 77Rural 112 l0g
NATURAL RESOURCESArea thou. sq. km 2,505.81 2,505.81 2.505.81 24,273.63 39,091.96 40,682.67Density pop. per sq. kmn 6.39 3.56 10.35 22.37 77.60 26.52Agricultural land % of land area 46.36 47.41 51.76 52.54 52.82 39.61Change in agricultura land annual % 0.09 1L85 0.06 0.06 0.03 -0.13Agricultural land under irrigation S 1.54 1.64 1.56 0.83 18.02 12.66Forest arid woodland thou. sq. kmn. 0.45 0.43 5.32 7.15 5.95Deforetation (aet) annual S .. 1.06
INCOMEHousehold incomeShaFm of top 20% of households % of income...Share of bottom 40% of householdsSham of bottom 20% of households
E.XPENDTREnFood %ofGDP .. 56.1StaplesMeat, fish, milk, cheese, eggs
Cereal imiports thouL me-tric tonmes 124 1.561 627 13.157 34A420 66.281Food aid in cereals 46 815 238 5.079 8.334 5.477Foodproduction per capita 1987 I00 139 117 102 101 113 101Fertilizer consumption kg/ha 0.9 0.8 0.6 4.6 59.9 48.0Share of agriculturw in GDP S of GDP 38A 27.4 32.11 16.3 26.3 15.7Housing % of GDP .. 13.0 . .-
Average househuid size persns per household 5.1 . ..-
Urban 51 7Fixed investrmert:housing % of GDP .. 1.8Fuel and power S ofGOP .. 4.0-...Encrgyeconsumption per capita kg of oil equiv. 59 64 68 257 364 1.595Households with electricity
Urban S of households..-..-Rtiral
Transport and eonuuunicatlon S or GDP .2.2
Fixed investment, transport equipment .2.2
Totalroad length thou. km 1 5 10 10iNVSTMNTIN HUMAN CAPITAL
HealthPopulation per physician person 14.029 9.964 ... . 3.277Population per nurse 957 1.230Population per hospital bed 967 1,108 939 1.269 1.016 604Or-l rehydymtion therpy (under-5) S of cases ... 47 37 38
Gross enrolment rtioSecondary of school-age pop ~ 14 20 22 18 41 53Fem1ale 8 17 20 -. 34
Pupil-teacher ratio: primary pupils per reacher 37 35 34 40 39 -
Pupl-teacher ratio: secondary S22 25 23 -. 20 Pupils rcaching grnte 4 S of eohor 81 .-
Repealer rate: primary S of total enroll 3 0Illitrc=y S of pop. (age 15+) .. 76 73 50 41 19Fcminle % of frnr.(agelS+) -. 90 88 62 53
Newspprcirculation pe thou, pop 9 12 24 12 .. 74world Banmk Internatonal Econoim-CS DepaimerL April 19.95
323

SurinameMast Same regleincome group NEat
Latest sigle year rcent Lain aivW higherUnit of 1iabnate America middle- income
Indicator measure 1970-75 1980-U5 1988-93 Caribbean income group
Priority Poverty IndicatorsPOVERTYUpper poverty line local curr. .. ..
Hcadcount index % of pop. .. ..
Lower poverty linc local curr. .. ..
Headcount index % of pop. .. ..
GNP per capita USS 1.470 .490 1.10 2930 1.590 4.350
SHORT TERM INCOME INDICATORSUnskilled utban wages local cur. .. ..
Unskilled nral wagesRuudl tcrns of trade
Consumcr price indcx 1987=100 23 55 580Lower income
Foot 14 254Urban 44 2S4Rurl.
SOCIAL INDICATORSPublic expenditure on basic social services % of GDP .. .. _Gress enmrlment ratiosPrimary % school age pop. 108 136 127 107 104 105
Male III 139 129 .. .. ..Female 105 133 125
Mortalityinfant mortality per thou. live birdis 49.0 39.0 27.2 43.0 39.0 35.3Under5mortality - .. .. - 52.2 61.5 42.6
ImmunizationMcasles % age group .. .. 65.0 78.7 77.6 82.0DPT .. 80.0 83.0 73.7 82.2 74.2
Child malnutrition (under-5) -Life expectancyTotal years 64 67 70 69 67 69Female advantage 4.8 49 5.0 5.3 5.9 5.9
Total fertilityrate birdisperwoman 5.3 3A 2.6 3.1 2.9 2.9Matenal mortality rte per 100,000 livc births .. 82 - -.
Supplementary Poverty IndicatorsExpenditurs on social seeurity % of toutl got exp. 5.6 85 _Soial security coverge % con. active pop. .. ..
Access to safwatr' total %ofpep. 835 - 80.0 .. 86.7Urban .. 71.0 82.1 90.1 .. 93.9Rural .. 94.0 .. 57.6 .. 66.7
Access to headlthcute .. 100.0 91.0
Population growth rate GNP per capita growth rate Development diamondb(annal average, percent) (annual averag. percent) Life expecuncy
4 5-
2 ~ ~ ~ ~ ~ ~ ~ ~ ~ ~ ~ ~ ~~OPGross2 ... 0 ~~~~~~~~~~~~~~~~~~~~~~~per pximmy
capita enrmilment0 E -]-5
-2 -1O1970-75 198045 19S8893 1970-75 1980-85 1988-93 Acess to safe watr
Suriname SurncLAower-middlehincome - Lwer-middle-income
a. See the technical notes, p387. b. TIe development diamond, based on four key indicators, shows the average level of development in the countrycompared with its income gmup. See the intmduction
324

SurinameMtat Same ragI.uilnnuu gu Next
lates sIgle year rteac Lai Eaves- kigherUn it of eufmafa America wmidl- incoern
Indkcator macune 1970-75 1950-85 1988-93 Caribbam income gmropResources and Expenditures
HUMAN RESOURCESPopulation (mrc=1"3) thousands 364 377 414 466.304 1.096,665 500,50Y7Age dependency ratio ratio 1.06 0.70 0.65 0.66 0.69 0.62Urban liof pop. 44.8 45.7 49.2 71-2 54.7 71.2Population growth rate annual li -0.4 1.2 1.2 2.0 1.6 1.7
Urban -0.9 1.6 2.4 1.9 2.9 1.3Labor force (1S-64) thousands 96 117 146 169.839 459,196 190,136Agriculture Va of labor force 22 20Industry 20 20Female 26 29 30 27 31 29Females per 100 muale
Urban numnber...Rural
NATURAL RESOURCESArea thou. sq. Ian 163.27 163.27 1632Z7 20,505.92 40,682.67 21,348.14Density pop. per sq. km 2.23 2.31 2.51 22.29 26.52 22.51Agricultural land Va of land area 01.37 0.52 0.57 40.00 39.61 41.26Change in agricultural land annual Va 1375 5.19 0.00 0.39 -0.13 0.0Agricultural land under irrigation % 56.90 67.90 67.42 3A1 12.66 3184Forest and woodland thou. sq. km .. 0.15 0.15 9.87 5.95 8.04Deforestation (net) anntual Va.. 0.09
INCOMEHousehold incomeShare of top 20% of households Va of inwnce......-Share of bottom 40% of householdsShare of bottom 20% of households
EXPEFood %ofGDP .. 71Staples .. 6.3Meat. fish, milk, cheese, egg . 10.6
Cerea imports dtou. mettric mannes 42 48 40 27,700 66,281i 48,947Food aid in cereuls I .. 28 1,565 5,477 544Food production percapita 1917= 100 75 I1I 87 101 101 102Fertilizer consumption kglha 48.3 143.9 32.6 16.1 48.0 67.8Shame of aguicuilturc in GDP %ofGDP 6.3 8B4 21.6 9.0 1537 8.0Housing % ofGDP .. 6.1 .. -
Average household size persons per household . ..
UrbanFixed investment housing Va of CDP .. 5.3Fuel and power Va of GDP .. 2.0.....-Energy consumption per capita kg orollequiv. 2,464 1,674 1,377 913 1.595" 1,632Households with electricity
Urban Va of househods ... .
RuralTransport and conunnunloation V of GDP .4.9
Fixed investment transport equipmn .. 1.6Total road engsh dhoutkma 3 9 9
ViVESTMENT IN HUMAN CAPITALHealthPopulation per physician pesons 24150 1,217 ... 3.277Population per muse 680 266Population per hopital bed 176 112 .. 51.7 604 395Omal whydymation dieapy (under-5) 9Vof cases ... 361 .51I
EducationGross enrllment ratioSecondary % of schoDl-age pop. 46 51 54 47 53 53
FeMale 51 .. 58Pupil-teacher ratio: primary pupils per teacher 31 25 23 26 . 25Pupil-teacher ratio. secondary 23 18.....-Pupils reaching grade 4 Va Of cohor . 92 . .--
Repealer rate: primar % Of totaemuo 24 22... Iliteracy % ofpop. (agel15+) .. 7 5 Is 19 14Female Vaoff&n.(age l5.e) .. 5 18s. 17
Mn=wae circulation pe dhoutr. 91 146 105 85 74 125
325

SwazilandMast Same regionAluenom graup Next
Latest singe year recent Su. lear, higherUst of estimate Saharan middle- income
Indicator meauare 1970-75 19804S 1988-93 Afrca income group
Priority Poverty IndicatorsPOVERTYUpper poverty line local cufr, ..
Hcadcount index 5' of pop. .. ..
Lower poveny line local cutr, ., ..
Headcount index % of pop. .. ..
GNPpercapita USS 640 S50 1.290 520 1,590 4,350SHORT TERM INCOME INDICATORSUnskilled urban wagEs local cur. .. ..
Unsckilled nwdl wagesRuraI trms of tradeConsumerprice index 1987=100 20 78 190
Lower incomecFood" 13 ..
UrbanRural
SOCIAL INDICATORSPublic expenditure on basic social services 5' of GDP .. ..
Gross emvilment ratiosPrinmry % schoolagepop. 99 107 115 67 104 105Male - 100 108 116 74Fernalc 97 106 114 60
MoralityInfant mortality per thou. live births 133.0 94.0 73.0 93.1 39.0 35.8Under S morality .. .. .. 172.3 61.5 426
ImmunizationMeasles * age group .. 49.0 .. 49.9 77.6 82.0DPT 61.0 51.9 82.2 74.2
Child malnutrition (under-5) r. 9.7 . *Life expectancyTotal years 47 52 58 52 67 69Femal advantage 4.5 4.6 4.6 33 5.9 5.9
Total fertility rate births per woman 6.5 6.0 4.8 62 2.9 29Matemal mortality rate per 100.000 livc bits .. 120
Supplementary Poverty IndicatorsExpenditures on social security % of total gov'texp. .. ..
Social security coverage % econ. active pop. .. ..Access to safe water total % of pop. .. 29.7 .. . . 86.7
Urban .. 100.0 .. .. .. 93.9Rural B .. 7.0 .. .. .. 66.7
Access to health cm .. 66.0 55.0
Population growth rate GNP per capita growth rate Development diamondb
6+ - (annual average pernt) 10- (anmual avera, perent) Ufe expectancy
4 - 5 O -
GNP Gros
2 0 ~~~~~~~~~~~~~~~~~~~~~~~~L--j per Iprimary
capita \ enrollment
02-1
1970i75 H90-85 1988-93 1970-75 1980-85 1988-93 Access to safe water
ED Swaziland SwazlandLower-iddle-income
a. Sec the echnical notes, p.387. b. The development diamond, based on four ke indicators, shows the avage level of devdopment in the countryomnpared with its income group. See the introduction.
326

SwazilandMost Sme regiabscme grOUip Next
Lust single ear mcent Sub- Lwer- higherUnit of =esimate Sharan middll- Income
Indicator meUaWrU 1970-75 1980-85 1988-93 Afrira income grMM
Resources and ExpendituresHUMAN RESOURCESPopulation (mre=1993) thousands 482 649 809 558,978 1.096,665 500.507Agc dependency ratio ratio 0.94 1.02 0.87 0.94 0.69 0.62Urban % of pop. 14.0 21.8 29.3 29.8 54.' 71.2Population growth rate annual % 2.8 3.0 2.8 2.9 1.6 1.7
Urban 9.1 6.7 6.2 5.0 2.9 1.8Labor force (15-4 thousands 220 273 330 229,480 459,196 190.136Agriculture % of labor force 77 74Industry 8 9Female 42 40 38 36 31 29Fcmales per 100 mnaesUrban number .. ..Rural
NATURAL RESOURCESArea tuou.sq.kkm 17.36 17.36 17.,6 24,273.63 40,682.67 21,848.14Dcnsity pop. persq.km 27.76 37.38 45.31 22.37 26.52 22.51Agriculturl land % of lnnd area 76.34 74.65 73.31 52.54 39.61 41.26Chanp in agriculturalland annual % -11.40 1.18 -0.08 0.06 -0.13 0.08Agricultuml land under irnigalion % 4.27 4.83 5.08 0.83 12.66 8.84Forests and woodland thou. sq. km .. 0.00 0.00 5.32 5.95 8.04Defouustadon (nct) annual % .. .. -0.10INCOMEHousehold incomeShare of top 20% of households % of income .. ..Shar of bottom 40% of householdsShae of bottom 20% of housebolds
EXPENDITUREFood % of GDP .. 26A.Staples .. 8.9Meal. fish, milk, cheese, eggs .. 9.2
Cee impors thou. metric tonnes 15 31 55 13.157 66.281 48.947Food aid in cereals I 1 40 5.079 5.477 544roodproductionper capita 1987=100 IOS 106 83 101 101 102Ferilizer consumption kg/ha 7.2 6.9 9.3 4.6 48.0 67.8ShareofagricultureinGDP %ofGDP 25.1 17.0 9.6 16.3 15.7 8.0Housing %orGDP .. 4.0Average household size persons pe household .. ..
Urban .Fried investunent housing % of GDP .. 33.Fuel and power % ofGDP .. 1.9Energy consumption per capita lkp of oil equiv. 284 314 283 257 1,595 1,632Households with electricity
Urban % of households .. ..
RuralTransport and connmnion 56 of GDP .. 9.9Fixed investment transport equipment .. 2.8Total oad lenglh thou. km 2 3 3
ENVESThET IN HUMAN CAPITALHealthPopulation per physician persons 8.058 18.540 8.857 .. 3.277Popubtionper rurse 531 1.037 216Population per hospitlu bed 296 .. . 1,269 604 395Oral rehydyration thepy (under-5) % of cases .. . 5 37 .. S5EduatonGross enrollment ratiSeconday % of school-ag pop. 32 42 48 18 53 53Femalc 29 41 47
Pupil-teacher ratio: primary pupils per teacher 38 34 33 40 .. 25Pupil-teache ratio: secandary 22 19 18 - .. .
Pupils maching grade 4 % of cohort 83 85 89 . .9
Repearerrate:primary % ofitotalenroi 10 14 15 5.iiteracy % of pop. (age 15+) . 32 Si 50 19 14Female % of fem. (age 5+) .. 34 .. 62 .. 17
Newspapercircuation permtourpop 10 15 15 12 74 125womisanic luiteratonal Economics iiCparaent Apnil 1995
327

SwedenMast Sme eJriuAa cemiegrn*
4La*s sXb,ale eer reecnaUnit of admab a Hlzlh
Indi r& er masure 1970-75 190O-85 1955.93 ineome
Priority Poverty IndicatorsPOVERTYUpper poverty linr local curr.
Headcount index $ of pop.Lower poverty lime local curr.Headcount index % of pop.
GNPpercapita USS 9.100 11.550 24.740 23.680
SHORTTERM INCOME INDICATORSUnsildled urban wages local cumr.Unskilled nnal wagesRuual terms of trade
Consumer price index 19S7=100 36 92 146LowerincomeFoodTM 21 90 120
UrbanRural .
SOCIAL INDICATORSPublic expenditui on basic social services % of GDPGross enrollmnent ratiosPrimary %schoolagepop. 101 98 101 103
Maic * 101 97 101 103Female ' 102 99 101 103
MoralityInfant mortality per thou. live births 10.0 7.0 S.0 7.0Under 5 moality .. .. 6.0 8.5
lnununizationMeasles age group .. 92.0 95.0 82.5DFTr .. 99.0 99.0 90.2
Child malnutrition (under-5)ife expectancyTotal yeats 75 76 78 77Female advantagp ' 5.9 5.7 6.4
Tot fertlty rae birtsperwoman 1.9 1.6 2.1 1.7Maternal mortlity rate per 100,000 live births .. 4
Supplementary Poverty IndicatorsExpenditues on social security % of tolal go'vtexp. 35.9 38.7 43.2Soci security coveap :on. active pop.Access to safe water total 9 of pop. .. .. IOOD
Urban .. .. 100.0Rural *.. .. IOO1 )
Access to health cam* .. 100.0 100.0
Population growth rte GNP per capita growth rate Development diamonde
6 (annual average. pmcat l (anual averg percent) life expectancy
4 5
GNP F Gross2 o'''''* ~~~~~~~~~~~~~~~~~~~L_j per primary
O- ____ =___ 7____ 1___-S-__ capita enrolme
0 .~~~~~~~~~~~~-5
-2 -101970-75 190 1988-93 1970-75 198045 1988-93 Acec IosafC water
a Sweden _ Sweden- Higncome - High-income
a. See the technical noles, p387. b. The deveIopmentdiamond, based on fourkey indica shows the avege levelofdvelopmetin thecounuycompared with its inome group. See the intoduion.
328

SwedenMost Same regieuluwcomne group
Latestsinglepear rweentUnk of etiHmate g-
Indicator measure 1970-75 19895 1988-93 IncomeResources and Expenditures
HUMAN RESOURCESPopulation (mreI1993) thousands 8,193 8,350 8,691 812,447Age dependency ratio ralio 0.56 0.55 0.56 0.49Urban % of pop. 82.7 83.1 83.1 77.9Population growth rate annual % 0.4 0.1 0.5 0.6Urban ' 0.8 0.1 0.5 0.8
Labor fome (15-64) thousands 3.923 4.237 4.360 395.641Agriculture % olbor force 7 6Industry 37 33Female ' 40 44 45 38Females per 100 malesUrban number 100 100Rural 85 86
NATURAL RESOURCESArea thou. sq. km 449.96 449.96 449.96 32,146.15Density pop. persq.km 18.21 1 56 19.22 25.11Agriculturai land % of land area 9.05 8.4q 8.12 42.80Change in agriculture land annual % -0.24 -3.24 -0.42 -0.48Agrcultural land under iigation % 1.21 2.83 3.44 13.96Forests and woodland thou. sq. km .. 0.28 0.28 10.56Deforestaion (net) annuai S .. .. -0.04INCOMEHousehold incomeShare of top 20% of households % of income 37 37Sha of bottom 40 of househlxds 3 20 21Shre of bottom 20% of households 7 8
Food *ofGDP .. 9.6 Ii 8.4Staples .. 1.7 1.5 1.6Meat, fish, milk, cheese, cggs .. 4.3 3.7 3.8
Cealimports thou.metrictonnes 110 III 202 77,530Food aid in cerals 3 .. .. .. 8Food production percapita 1987 I 00 101 119 101 95Fertilizer consumption kglha 140.9 120.1 89.1 150.0Shre of agriculuuu in GDP % of GDP .. 3.3 2.1Housing %ofGDP .. 13.9 12.0 11.7Avwa household size persons per household 2.4 2.3
Urban 2.4 2.3Fixed investment housing %of GDP 4.0 3.6 5.1 5.0Fuelaudpower %of GDP .. 3.2 2.1 2.0Enrg consamption per capita kgofoilcquiv. 4.821 5,702 5,385 5,203Households with ekctricity
Urban % of households ..
RuralTranspurt and eoanunuiaetion of GDP .. 8.2 8.9 8.Fixed investmnt transport equipment 1. 1.9 2.2 2.1Total road lenglh thou. km 125 136 134NVESTMENTIN HUMAN CAPITAL
RealMsPopulation per physician persons 735 387 368 453Popubtion per nume 145 95Populatio per hospial bed 67 68 161 145Oral wehydyratimn therapy (under-5) b of as ..EductionGross enoDlment ratioSecondary % of sodl-age pop. 78 86 91 92Faeule 82 91 93 94
Pupil-teacher ratio: prmary pupils per teacher 20 .. toPupil-teacher ratio: secondary 10Pupils reaching grade 4 % of cohort 99 99Repeaterrate primary oftotadmmUll 0 0 0Iitrcy % ofpop. (age i5+) .. .. t
Female % offem. (age 15+) .. .. tNewsa circulation a tbous po. 539 526 511 320World mmc Imanternonal Economies Depwtmcnb Apnl 1993
329

SwitzerlandMaor Samemregblenlce
LAte sge jyer rwetUna oif aIfmate Ho
Indkacer meMI& 197b7S 1950S 1988-93 incoe
Priority Poverty IndicatorsPOVERTUpper povedy line loal curr.Headcount Index % of pop. .. .. .
Lowerpovty line loca curt. .. .. ..
Headcount index % of pop.GNP per capita USS S,780 15,540 35,760 23,680SHORT TERM INCOME INDICATORSUnsdlled urban wage local curr.Unskilled ural wagesRural terms of tradeConsumrrprice index 1987=100 71 98 126Lower incomcFboda 47 98 116
UrbanRundl
SOCIAL INDICATORSPublic expendiaurm on basic socia services % of GDPGrass enralment ratosPgimuy %schoodagepop. .. .. lOS 103Male U .. .. 104 103Female .. .. 105 103
MortaityInfant morlity per thou. live births 13.0 8.0 6.0 7.0Under S mrtaity 8 8.0 8.S
Immunizationmeasles % age goup .. 90.0 82.5DFT .. .. 90.0 902
Child malnutrtion (under-5)Ufe expectancyTota yearc 74 76 78 77Feme advantage 6.2 6.7 C5 6.4
Toalfrertiltyrate bizthsperwoman 1.9 1.5 1.6 1.7Muanal morality ra per 100,ODO live bits .. 5 -.
Supplementaqr Poverty IndicatorsExpendtums on socinl security SoFtatalgov'texp. 48.1 49.9 .Social security coveragc ecorL active pop. - .. .Access to safe water. toal * of pop. _ .. 100.0
Urban . .. 100.0Rurl 1 .. 10D.0
Access to eath car 100.0 10D.0
Populaton growth rate GNP per capta growth rate Development diamond"(a4nal aveag pecn) (anmal averge pecent) Likex
4 -- 5
2 0- r ~ ; = = . I GNP GrssI ~~~per prir
capita \erIrlment
-2 -10 Acs osf ae1970-75 1980-85 1989-93 1970-75 1980-85 1988-93 Accesstosafewater
r- Switzluand - Switerland- Hgh-incom H H ighlinwome
a. See the technical nos. p387. b. lh. develop nructdi.nond. baud on fourhe indicats, shows the averg levd of deveopmene in die countycompared with its incom group. See tIme intoducdo
330

SwitzerlandMow Scae nglau,u/inrn roap
Lats ci aiqe yer ecasl'URokef ahal Hlgh.
Iniakor unsurc 1970-75 1980085 195893 bScoae
Resourc and ExpendituresHUMAN RESOURCESPopulation (mre=1993) thousands 6,339 6.536 7,052 812,447Age dependency tido ratio 0.54 0.46 0.46 0.49Urban % of pop. 55.7 58.3 60.3 77.9Populdation growth rate annual % 0.5 0.7 1.1 0.6
Urban - 0.9 1.1 1.5 0.8Labor force (15.64) thousands 3,026 3.173 3,200 395.641Agriculture % of labor force 7 6Industry 44 39Female * 35 37 36 38Femcles per 100 males
Urban number 103 104Rural 94 94
NATURAL RESOURCESArea thou. sq. km 41.29 41.29 41.29 32,146.15Density pop. pcr sq. km 153.52 158.29 169.02 25.11Agricultural land * of land area 50.79 50.82 39.97 4280Change in agricultual land annual % 0.00 O.00 -21.77 -0.48Agricultural land under irrigation % 1.24 1.24 1.53 13.96Forests and woodland thou. sq. km .. 0.01 0.01 10.56DEefowStation (net) annual U, .. .. -057
INCOMEHousehold income
Share of top 20% of households % of income .. 41Slae of bottom 40% of households 1.. 2Sl of bottom 20% of households *..
EXPEDITUREFood %ofGDP 12.9 12.7 11.0 8.4Staples .. .. 1.3 1.6Meat, rish, milk, chewe, eggs .. .. A 3.S
Cereal imports thou. metic tonnes 1.439 926 455 77,530Food aid in cenrals .. .. .. 8Food production per capita 1987= 100 93 1O0 98 95Ferilizer consnmption kg/ha 71.0 88.9 98.7 150.0Share of agriculture in CGDP % of GDP .. 3.6HousIng %ofGDP 11.6 12.4 IOA 11.7Average household size pcrsons per household 2.9 2.5Urian * 2.7 2.3
Fixed investment: housing ¶% of GDP .. .. 7. 5.0Fuudandpower %ofGDP 35 4.2 2.5 2.0Ene conumpin ppr capita kg of oil equiv. 2,332 3509 3,491 5.203Households with electricityUrban % of houeJholdsRural ". ..
Transport and conununlcaton % of GDP 6.5 6.9 7J S.Faxed investment transport equipment .. .. 2. 1Totalroadlengt thou.hn 62 71 71INVESTMENT IN HUMAN CAPiTALHeatPopulation per physician persons 696 703 641 453Populadon pernurse .. 130Population per hospital bed * 88 .. 95 14Ond rebydyradon therapy (mndcr-5) % of asesEdalonGrMss cwollmncst ratioSecondauy % of school-age pop. .. .. 91 92Fenale .. .. 88 94
Pupil-teacher ratio: primary pupils per teacherPupil-teacher ratio: secondaryPapils eachi grade 4 %ofcohort 93 99Repeatcrratr primay %oftotaleroll .. 2 2Dlikmacy % of pop. (ageS) .. .. tFemule % of fen. (age 5+) .. .. t
NeM 7 circulation per tou.pop. 406 492 378 320World BantmK Inlaonfl Eomononcs DIpartmC12, Apr I5
331

Syrian Arab RepublicMost Sase regerdrncom group NuLt
latest single ear rcent s Lwer higherUnh of estdmate & North middle- income
Indicator measure 1970-75 1980S 198M-93 Africa Income group
Priority Poverty IndicatorsPOVERTYUpper peverty line local cur, .. ..Headcount index % of pop. .. ..
Lower poverty line local u .. ....Headeount index Ii of pop. .. ..
GNP per capita USS .. .. .. 1.980 1,S90 4.350SHORT TERM INCOME INDICATORSUnskillcd urban wages local curr. .. ..Unskillcd rual wagesRural terms or tradeConsumerprice index 1987=100 15 46 236
Lower incomeFDodn 8 ..
Urban .. 43 23Ruml"
SOCLAL INDICATORSPublic expenditure on basic social services % of GDP .. ..Gross enrollment ratiosPrimazy % school age pop. 96 107 107 97 104 105
Male U 112 116 113 103Female 5 78 101 101 90
MortalityInfant morialty per thou. live birhs 88.0 59.0 37.3 52.3 39.0 35.8Under 5 mortlity .. .. 46.0 69.9 61.5 42.6
ImmunizationMeases % age grup .. 30.0 84.0 81.3 77.6 82.0DPT .. 26.0 89.0 84.0 82.2 74.2
Child malnutrition (under-5) .. 25.0Life expectalcyTotal yeas 57 63 68 66 67 69Fanule advantage 5 3.3 3.6 4.1 2.3 5.9 5.9
Total fertility rate births per woman 7.7 7A 5.8 4.7 2.9 2.9Matemal norality ratc per IIO0JO60live birtis .. 280 143
Supplementary Poverty IndicatorsExpcnditurs on social security % of total gov't exp. 4.9 7.9 1.5Social security coverage % econ. active pop. .. ..Aceesstosafewater total %ofpop. 71.0 701 79.3 835 .. 86.7
Urban ' 98.0 77.0 91.0 98.7 .. 93.9Rural 50.0 65.0 68.0 69.0 .. 66.7
Access to health care .. 80.0 99.0 S7.4
Population growth rate GNP per capita growth rate Development diamondb(annual av , pCIZeM (annual average. pecent) Life expccq y
4 5
2 --__ ___ 0- . ____. _ I GNP {oss
O- l l I 1 1 1 1 1 l l l -S . \capita enrollment
-2 -101970-75 1980-85 1988-93 1970-75 1980-85 1988-93 AcoessWto s K wer
] Synan Arab Republic _ Syrian Arab RepublicLower-middle-income LWer-iddleinom
a. Sec the tcchnical noes, p.387. b. Ihe deelopment diamnd. based on four key indicamou, shows te averg levd of deveopmet in the courmycompard with its inom group. See the introduction.
332

Syrian Arab RepublicMeal Same tksIen gp Next
b__jesvhsivLepar recent M l h war kghkerUnR of effimale & Nanh middle- Income
Indkalor meaure J970-73 159"5 1`988-0 A93.a income ureau
Resources and ExpendituresHUIMAN RFSOURCESlll%piatlen (mreul993) Ihousands 74438 10.348 13,696 261.650 1.096.665 500,507Ape dependency ratio Mlo 1.09 1.05 1.02 0.87 0.69 0.62Urban %orpop. 45.1 48.4 51.5 55.2 54.7 71.2Population growth ratc annual % 3.5 3.5 3.5 2.7 1.6 1.7Urban * 4.3 4.2 4.4 3.7 29 1.8
Laborforce(15-64) thousands 1,850 2,596 3,491 71,333 459,196 190,136Agriculture % of labor rorce 41 32Industry i 26 32Fcmule * 13 16 18 16 31 29Femles per 00 mabcsUrban number 93 92Rural 103 105
NATURAL RESOURCESArea thou. sq. km 185.18 185.18 115.18 11.021.26 40,682.67 21,948.14Density pop.persq.km 40.17 55.88 71.42 23.10 26.52 22.51Agriculturai land % of land arca 76.59 75.80 76.00 32.10 39.61 41.26Change in agricultural land annual % -2.82 -0.16 3.00 0.04 *0.13 0.08Agriculturl land under irrigation % 3.66 4.67 6.49 30.59 12.66 8.84Forests and woodland thou. sq. km . 0.00 0.01 0.4S 5.95 8.04Deforestation (net) annual % .. .. -4.49INCOMEHousehold incomeSha of top 20% of b eholds or income .. ..
Sham of botom 40% of householdsSham of bottom 20% of households
EXfAlTVFood %ofGDP 31.8 ..
Staples 5.3 ..
Meat, fish, milk, cheese, eggs * 8.0 ..
Cereal imports thou. metric tonnes 345 1.025 1.208 38,092 66.281 48,947Food aid in cereals n 47 32 IS 1,249 S.477 544Foodproduction percapita 1987=100 100 113 100 102 101 102Fertilizer consumption kiha 5.1 16A 24.1 89.9 48.0 67.8ShareofagricultureinGDP % ofGDP I8.0 21.0 29.8 133 15.7 8.0Housing Sof GDP 8.1 ..
Avcergc household size pesons per household 6.0 6.2Urban 6.0 5.9
Fixed investnment housing %of GDP 43 6.2 .. .. .
Fuel and power % Of GDP 3.3 ..
Eneg consunption per capita kg of il equiv. 495 812 798 1,097 1,595 1.632Households with electricity
Urban % of households .. .. .. .. .. ..Rural
Transport and cmmuscution Sof GDP 2.5 .. .. ..
Fixed investmen: trnusport equipment 5.0 1.6Total road length tou. Ion IS 29 31
INVESTMENT IN HUMAN CAPITALHeathPopulation per physician persons 3.900 2.163 1,178 .. 3,277Populaion prmuse n 1,791 1,423 -
Population per hospitd bed 1.000 874 938 633 604 395Oral rehydyaion thrapy (under-5) % ofcases .. .. 95 56 .. 51EducationGross enrollment ratioScconduy % of school-age pop. 43 60 50 56 53 53
Fnmale 28 49 43 soPupil-teache ratio: pimary pupils per teacher 34 26 24 26 .. 2SPupil-teachcrratio: secondary 20 I8 17 21Pupils reahing gmdr 4 % of ohobrt 91 96 9B 95 .. .Rpearm pimypimay %o tototalerll 10 7 7 .
DliitrAcy 'lofpop.(age lS+) 60 41 36 45 19 14Femaa % of fen. (age 1S+) .. S7 49 57 .- 17
New=pa ir cultion per thou. po.9 16 22 33 74 125
World Rmk lutcfnattponal erm 4cs D q9t623 A3 74W5F
333

TajikistanAMaJ Sna q isu/lncm!,egroQup Next
Unltetsnls yr recnt J__ h4jherUR& of ~ "t - - l aim e A Cairn!m Lo w' inCome
Indclaor mascru 197975 1 F80 jp aN-9a3 Asia lone*me KPOP
Priority Poverty IndlcatorsPOVERTYUppr poveny line local curr. .. ..
Hendeotmi index 9bofpop. .. . . 19Lower poveny line local curr. .. ..
HeAdeount Indox of pop. .. 1.GNP pr capita USS .. 470 2,450 380 1,590SHORT TRIM INCOME INDICATORSUnskilled ueban wages local curt. .. .Unskilled nnral wag.Rurl terms of trad.Consumer prce Index 1987-100 .. ..Lower incomc .. ..Food'". .... ..
UrbanRural .. .. .. .. ..
SOCIAL INDICATORSPublic expenditum on basic social services % ofGDP .. . 8.0Gross mrollmen ratiosPrimary l school agc pop. .. .. 78 .. 108 104Mle .. .. .. .. 116Female .. .. .. .. 101
MortalityInfant mortality per thou. live births 74.0 62.0 47.0 24.B 63.1 39.0Under 5 mortality N .. .. 83.0 36A 101.4 61.5
ImmunizationMeacles l age group .. .. .. .. B7.3 77.6DPT w .. .. .. .. 89.9 82.2
Child malnurition (under-5) .. 40.3life expectancy
Total years 63 66 70 69 62 67Female advantage 5.1 5.1 5.6 8.8 2.1 5.9
Totl fertility rate births per woman 6.5 5.5 4.8 2.1 3.6 2.9Matenal mortality rate per 100,000 live births .. 94 39
Supplementary Poverty IndicatorsExpenditures on social security 9 or totaI govt cIp. .. ..
Social security covea a:wn. active pop. .. ..
Acces to safe wat total *of pop. .. .. .. .. 67.0Urban .. .. .. .. 78.7Rural .. .. .. .. 62.0
Access to health care _ _.. _ .. .. .. .. ..
Population growth rate GNP per capita growth rate Development diamondb6 (mudal avage. percent) (annual average. percent) Lifeexp
4 5
OINP Gross2 0 FUt
O- | f f l | | ' | | I -5- capita enrollnent0 ~~~~~~~~~~~1-10
-2 11970-75 19804S5 198-93 1970-75 1980485 198-n93 Access tosafe waer
[l Tajidstan TajikistanLow-income Low-income
a Sec die techal noes, p387. b. Thc developmcnt diamond, bsCd on four key iniat shows the avege kevel of developmemn in the cwutycomparod with its income group. See the intrducdon.
334

TajikistanMust Saeieregl.fncoaeeregroup Next
Lao( sblec year recent Euarope higher,UnmI of esihues. & Canal Laws- hIcome
Indicator immure 1970-75 198045 1981-93 Asia Incomne group
Resources and ExpenditurevsHUMAN RESOURCESPopulation (mre-1993) thousands 3.442 4.55B 5.767 494.619 3.091.764 1,096.565Age dependency ratio ratIo 1.0D 0.87 0.89 0.57 0.67 0.69Urban % of pop. 35.5 33.2 32. 64.8 27.6 54.7Population growth rate annual % 3.2 2.1 3.0 0.6 1.9 1.6Urban H2A 2.2 3.0 1.5 3.9 2.9
Labor force (15-64) thousaknds .. 1,675 1.912 237,897 1,442.452 45S,A96Agriculture % of labor force .. 43 45Industry .. 21 21Femal H .c 46 47 33 3'1Females per 1 00 males
Urban number...Rural
NATURAL RESOURCESArea hou. sq. km 14310D 143.10 143.10 24,320.56 39,091.96 40,692.67Denity pop. pefrsq-.km 24.05 31.85 39.12 20.20 77.60 26.52Agriculturni land % of land area ... 30.81 .. 52.82 39.61Changcin agicutur Land annual % . 0.23 0.65 -1.28 0.03 -0.13Agricultural land under irrigation % 13.16 14.84 14.75 7.15 18.0 12.66Forests and woodland thou. sq. km ... . 0.80 7.15 5.95Deforestation (net) animal ...
INCOMEHousehold inconme
Share or top 20% or bourcholds % of income ..
Share or bottom 40% of householdsShare of bottom 20% of households
EXPMrDiUREFood %ofGDP...
StaplesMeat fish, milk, cheese eggs
Cerea imnpnr thou. mectric tonnes ... 450 34.452 34A420 66.281Fooulaid in cereals ... 72 4.392 8,34 5.477Food production per capita 1987 100 ...... 113 101Fertlizer consumption kgflha ... 30.9 41 7 59.9 48.0Sham of agriculture in GDP % of CDP .. 28.5 33.3 13.5 26.3 15.7Housing % of GDP ... 4.7 6.0Average household size persons per household ... 6.1
UrbanFixed investment housing %aof CDP 4... & 5.2Fuel and power %aofGDP ... 1.0 1.2Enegy consumption per capita kg of oi equiv. ... 634 2,959 364 1,595Households with electricity
Urban Va of households...Rural
Transport and conummication Vaof GDP...Fixed investment trnsport equipmentTota road length thou. km 17 19 30rwrsTNwr IN HUMAN CAPITALHealthPopuilation per physician persons 478 368 434 362 .. 3.277Populaton pernurse H162 137 142 249Pbpulaiion perllospicalbed H103 94 97 136 1,016 604Oral rehydyration therap (tnder-5) Va of case .. .. 38EducatIonGross enrollmnt ratioSecoondary % of school-agecpop. ...... 4 1 53Female ...... 34
Pupil-teacher ratio: primary pupils per teachr ... 1.. 39Pupil-teacher rafio: secondary ...... 20Puipils reaching Vadrc4 %orcohort. .
Repeater rat prinmar aof totalenroll.. illteacy % of pop. (agel15+) ... 2 5 41 1 9Female %Of fim (agels+) ...... 53itr 5circulation pe thou. po.a . ... 74
WdBakInternatona EcoOMICS Depnnent. Apr I199
335

TanuaaMost SBime regolenfiacm group NAl
Last single yea recnt Sib higherUNi Of ef'sa e Sahara LewI Income
lndkoler usure f 1970-75 19805 1985-93 A ee Income group
Priority Poverty IndicatorsPOVERTYUpper poverty line localur. .. ..cur
Headcount index % of pop. .. .. .. .. 19L1w povty line local curr. .. ..
Headcount index % of pop. . ..
GNPpercapita USS 170 290 90 520 380 1,590
SHORT TERM INCOME INDICATORSUnskilled urban wages local curr. .. ..
Unsildled nra wagesRuIra tums ortrde
Consuner price index 1987=100 8 58 364Lower incomeFood..
Urban .. 7 337_Rurda
SOCIALINDICATORSPublic expndituw on basic social services %orGDP .. ..
Grss eroient radosPrimay % shoo age pop. 53 72 68 67 108 104
Male - 62 73 69 74 116FN 1e 44 71 67 60 101
ModaliyInfant moraity per thou. live birts 125.0 98.0 84.2 93.1 63.1 39.0Under S mortality 0 .. .. 167.0 172.3 101.4 61.5
lr_mbztionMeasles % AP group .. 66.0 75.0 49.9 87.3 77.6DFPT .. 67.0 79.0 51.9 89.9 82.2
Chdld mbnutinon (undher) .. .. 28.0 .. 40.3Ure expccyTotdal yea 46 51 52 52 62 67Fcmale advantage 3.2 3.5 3.0 3.3 2.1 5.9
Tolfertiity e brts per women 6.8 6.7 5.8 6-2 3.6 2.9Materalmortity rit per 100.000 livebirfs .. 370
Supplementary Poverty Indicators
Expendiure on social secuity % of total go cxp. .. 0.5 .. _ .Social securiy coveg % econ acive pop. .. ..
Access to sat wtecr totlW % of pop. 39.0 52.6 52.1 .. 67.0Urban 0 88.0 83.0 75.0 .. 717.Rura 36.0 42.0 46A .. 62.0
Access to healih care .. 73.0 93.0 .. ..
Population growth rate yGNP per capita growth rate Development diamondi .(annual avera. pe t) 1 £avaage peret) Lif la w
45
2 E1ll1 -'zz+1IL--------= G INP Gros2 - Aer capita enmUmnt
02-11970-7S 198-85 1993-931970-75 1950-95 1988.93 Access to safe water
1970-75 1gSO80S 198B-93 1 1907 98 Igl-3 I
TDnani Tannnia- LowinLimencome
a. See the tchnica noars, p387. b. Tie dcvelopmet diund. on for ky indicats. lews th s kv of developmn in te countcom rd wit income goup. See the i uctin.
336

TanzaniMost Semi regfmnliucoue group Next
Later shrfgklear recet SuW k-- igherUnmit Of atm tnae Sahara Low'- hIcome
Imdktocrr measrwe 19703-75 19813-8 19U-93 Afrkca Income group
Resources and ExpendituresHUMAN RESOURCESPopulation (mure=1993) thousands 15.900 21.797 29.019 558.979 3.091.764 I.D96.665Age dependency ratio ratio 1.01 0.99 0.94 0.94 0.67 0.69Urban %or pop. 10.1 17.6 23.0 29.9 27.6 54.7Population groywth rate annual % 3.0 3.2 3.1 2.9 1.9 1.6
Urban 10.0 6A 6.3 5.0 3.9 2.9Labor force (1 5.64) thousands 8,226 10.913 13.771 229.480 1.442.452 459.196Agriculturc I' of labor force 83 86Industry *4 5Female 50 49 47 36 33" 31IFemales per 100 males
Urban number...Rural
NATURAL RESOURCESArea thou. sq. km 1945.09 945.09 945.09 24.273.63 39.091.96 40,682.67Dcnsity pop. pe-r sq. kmn 16.92 23.06 28.74 22.37 77.60 26.52Agricultural land % of land area 42.75 42.90 43356 52.54 52.12 39.61Change in agricultural land annual % 0.03 0.03 0.13 0.06 0.03 -0.13Agricultural land unde-r irrigation % 0.14 0.34 DAD0 0.83 18.02 12.66Forests and woodland thou. sq. km D. .31 0.34 5.32 7.15 5.95DeformsLation (net) annual % ... 1.22INCODMEHousehold incomeShareofxtop 20l%orhausrholds % of inomc 50o. 63Share of bottom 40% of households *16 ..
Share of bottom 2D% of households 6 .. 2
Food % of GDP . 55.0 -
Staples .. 27.4 ..-
Mea4 fish,nmilL cheesre.egs. 9.4 Cerea imports thou. nieuric tonnes 461 412 215 13,157 34,420 66,281Food aid in cereals 148 125 35 5.079 1.34 5,477Food production pcrcapiLa 1957=100 103 106 84 101 113 101Fertilizer conumption kgfla 0.8 1.0 1.2 4.6 59.9 48.0Sham of agrcultur in GDP % Of GDP 36.9 50.8 49.2 16.3 26.3 15.7Housing % of GDP . 6.9Average household size persons per household...
UrbanFaxed investment: housing %Iof GDP 2.1 1.7"Fenl and power % of GDP .2.2
Energy consumption per capita kg of oil equiv. 52 35 35 257 364 1.595Households with electricity
Urban % of households......-Rural
Transport and coamunication %of GDP .. 1.8Faxed imnvetmnt transport equipment 3.7 2.5 . .-
Total road length thou. kmn 40 82 83INVESTME3NT IN HIUMAN CAPITALHealthPopulation per physician persons 22.540 28,271 ... . 3.277Population per nurse 3.4104 7.991 ..... -Population per hospital bed .. 768 981 1,269 1.016 604Oral rehydyration therapy (under-5) * of cases ... 3 37 38 -
EducationGross enrollment ratioSecondary % of schIOl-Agepop. 3 3 5 18 41 5Female 2 2 4 -- 34
Pupil-reacher ratio: primary pupils per teacher 54 34 3 D39Pupil-teacher ratio: secoDndary 20 19 19 .. 20 Pupils mcaching grade 4 % ofcoohost 91 89 17... Repeaterraic: primary Of tow alenol 0 1 5Ilitercy % of pop. (age 15+) ..... 50 41 19
Female S of fan. (ag 15+) ..... 62 53 -
Newjiack circuation pe thu. pp.4 8 12 .. 74Worid IMK lmmamm E Fn-c-sDeparment April 199
337

ThailandMost Same reglmnfincomegroup Next
Ltest sik year recent EiIirI. higherUnit of essase EaSt middlk income
Indkator msawre w1970475 980#55 1988-93 Asia income group
Priority Poverty IndicatorsPOVERTYUpper poverty line local cuf. ..Hcadcountindex % of pop. 30 23 22 12
Lower poverty line local curr. .. ..
Hcadeount index % of pop. .. .. .. 9GNPpercapita USS 390 110 2.110 820 1.590 4.350SHORT TERM INCOME INDICATORSUnskilled urban wagcs local cuw. .. ..
Unskilled rural wagesRural tern:s of tradeConsumerpuiceindex 1987=100 47 96 132Lower incomeFood 31
Urban ' .. 98 144Rural
SOCIAL INDICATORSPublic expenditure on basic socidal services % of GDP .. 4.6Gross enrollment ratiosPrimary %school agepop. 83 96 97 118 104 105Male 87 100 92 123Fumale 80 97 88 115
MoralityInfant mortality per thou. litc births 65.0 44. 36.4 35.5 39.0 35.8Unda 5 mortality - -. 45.0 60.5 61.5 42.6
ImmunizationMcasles % age group _ 22.0 60.0 93.0 77.6 EL0DPT .. 47.0 69.0 95.0 822 74.2
Child nalnutrition (under-5) * .. 36.0 13.0 24.1Life expeancyTotal yea=s 60 65 69 68 67 69Female advantage 3.9 4.8 5.7 3.6 59 59
Tota fertility rate births per woman 5.0 3.0 2.1 2.3 29 2.9Matemal mortality rate per 100.000 tive births .. 270 .. 16.
Supplementary Poverty IndicatorsExpenditures on social security % of total gov't cxp. 4.0 29 3.8Social security covragc % econ. active pop. .. .. .. _Accesstosaflewaler tolai %ofpop. 25.0 67.3 72.1 67.1 .. 86.7
Urban 69.0 56.0 57.0 83.5 .. 93.9Rural 16.0 70.0 85.3 61.3 .. 66.7
Access to health m .. 30.0 59.0
Population growth rate GNP per capita growth rate Development diamonde(annual avenge,.percent) C (annuaavera c nt) i
4-1
E~~~j ~GNP '/ Gros2- 0per -- Mar
o I I i I L 1 1 l s . o capita \nrolinat
-2 -10±1970-75 1980-85 1981-93 1970-75 1980-85 1988-93 Access to safe water
E Tha ad Thiland- Lowernmidkle-income Lower-middle4income
a. See te technical note p387 . b. The development diamond, based on four key indicators, shows the aveag level of development in the countrycompauzd with its income group. See the introduction.
338

ThailandMesa Snme regrlflluncome group Net
Lates single year recent Lois17 higherUni of esdmaje East middle. Licome
Indicator measure 1970-75 1980-85 1988-93 Asia income group
Resources and ExpendituresHUMAN RESOURCESPopulation (mre=1993) thousands 41,359 50.793 58.064 1,713,883 1,096,665 500.507Agc deprndency mlio mtio 0.92 0.67 0.51 0.54 0.69 0.62Urban % of pop. 15.1 17.9 19.5 31.3 54.7 71.2Population growth rate annual % 2.9 1.7 1.7 1.4 1.6 1.7
Urban " 5.3 2.7 3.0 4.0 2.9 1.8Labor rorce (15464) thousands 20.491 26,657 31.063 942,977 459,196 190,136Agriculture 91. of labor force 75 71Industry 8 10Fcnale * 47 46 44 41 31 29FRmalec per 100 males
Urban number 103 106Ruml* 102 102
NATURAL RESOURCESArea thau. sq. km 513.12 513.12 513.12 16.367.91 40.682.67 21.848.14Dcnsity pop. per sq. km 80.60 91.99 111.2K 103.27 26.52 22.51Agricultural land % or land area 33.71 40.28 40.97 44.21 39.61 41.26Change in agricultural land annual % 2.00 2.62 -0.38 0.24 -0.13 0.08Agdcultural land under irrigation % 14.05 18.7 21.02 14.68 12.66 8.84Forects and woodland thou. sq. km .. 0.18 0.13 4.06 5.95 8.04Deforstation (net) annual 51. .. .. 3.34INCOMEHousehold incomeShare of top 20% of houseolds % of inemc 50 .. 51Shar of bottom 40% of househods 15 .. 16Share of bottom 20% of households 6 .. 6
EXPENDfLUREFood %ofGDP 31.4 19.2
Staples 9.7 4.6Meat. fish, milk, cheese, eggs U 10.7 8.3
Cereal imports diou. metric tonnes 62 174 638 30,036 66,281 48.947Food aid in cereals 2 4 60 447 5,477 544Foodproductionpercapita 1987=100 91 111 102 115 101 102Fertilizerconsumption kglha 10.5 21.1 52.3 76A 48.0 67.8SharrofagricultureinGDP %ofGDP 26.9 15.8 10.0 17.1 15.7 8.0Housing % ofGDP 4.2 4.6Averagehousehold size peuonisperhousehold 5.8 5.2
Urban * 5.8 4.9Fixed investment housing % of GDP 2.6 3.6Fuclandpower %ofGDP 2.1 2.1 .. .. .. .
Energy consumption per capita kg of oil equiv. 203 307 673 632 1,595 1.632Households with clectricity
Urban % of households .. ..
RuralTransport and communication S of GDP 5.0 8.5Fixed investment transport equipment 43 1.9Total road length thou. km 57 76 72INVESTCMNT IN HUMAN CAPITALHealthPopulation per physician persons 8394 5,872 4,421 1,063 3,277 .Population pernursc 1,167 1,813 910 1,490Population per hospital bed 899 651 609 612 604 395Oral rehydyration theapy (under-5) % of cases .. .. 43 32 S 51EducationGross enollnent ratioSecondary % of sdho-age pop. 26 30 33 53 53 53
Female * 23 28 32 47Pupil-teacher ratio: prinay pupils per eacher 28 19 17 23 .. 25Pupil-teacher rado: seconday U 32 18 18 16Pupils reaching grade 4 %of cohort 79 84 85 92Repeaer rate: pimary % of totw caoll 10 8 3 6litercy %ofpop.(agulp +) 21 9 7 22 19 14Fcmale % of fem (agc l5+) - 13 10 36 .. 17
Newspaperecirculation pertou . 22 86 73 .. 74 5World Bank Intenauional nomics Deprm Apil 1995
339

TogoMost Same rlnlncore group Next
ltest single year cent Sub - higherUuU of ensEmas Sahara. Lw- income
Indiealr measure 1970.75 1110485 1988-93 Afica Inceme group
Priority Poverty IndicatorsPOVERTYUpper poverty line local curr. .. ..
Headcount index % of pop. .. .1 . .. l9Lower poverty line local curr. .. ..
Headcount index % of pop. .. ..
GNP per capita USS 280 240 340 520 380 1.590SHORT TERM INCOME INDICATORSUnskilled uamn wages local cur. .. ..
Unskilled rura wagesRual terms or tradeConsuner price index 1987=l00 42 96 101Lower income .. ..
Fooe 27 ..
Urban ' .. 97 92Rural "m
SOCIAL INDICATORSPublic expenditure on basic social services % ofOD .. .. S5 5.5Gros enrollment ratiosPrimary % school age pop. 99 93 III 67 108 104
Male 130 114 134 74 116Female 61 71 87 60 101 -
MonalityInfant mnoaity per thou. live births 129.0 105.0 83.4 93.1 63.1 39.0UnderS mortaity .. .. 135.0 172.3 101.4 61.5
InununizationMeasles % age group .. .. 61.0 49.9 B7.3 77.6DFrT .. 9.0 73.0 51.9 89.9 82.2
Child malnutrition (under-5) .. 24.4 .. 40.3Life expectancy
Total years 45 50 55 52 62 67Femaleadvantage 3.2 3.4 3.6 3.3 2.1 5.9
Total fertility ratc births per woman 6.6 6.6 6.5 6.2 3.6 2.9Matanal mortality rate per 100.000 livc births .. 718 .. _
Supplementary Poverty IndicatorsExpenditures on social security % of total govltexp. .. 5.2Social security coverage % ecoIL active pop. .. ..
Access to safe water; total % of pop. 16.0 46.7 70.7 .. 67.0Urban 49.0 6S.0 100.0 .. 78.7Rural R 10.0 41.0 60.9 .. 62.0
Access to health care
Population growth rate GNP per capita growth rate Development diamondb4 (annuW avaerg puceat) 11, (annual aveage, percent) Lreexpectancy
4 -- 5 --
[ e S I _ ~~~~~~~~~~~~~~ ~~~ | ~~~GNP GM |1 1 1 1 1 1capita -Nenroment
-2 -10 1970-75 1980-85 1988-93 1970-75 198045 198893 Access to safe water
L] Togo _n Togo- Low-incomn - Low-income
a. See the technical notes. p387. b. The development dimn based an rourky indicators, sows the avege level of devopmt in the countryconpared with its iLcome group. See th inoduction.
340

TogoMai same. wgEwt!Lua.mageu Nazi
Late~St s klug. a recaN Sio- higherux1 it of mflu.l saleM. Law- income
Indadlgor nmeaure 1978-75 I NO.85 IJU.f rice! incme goResources and Expenditures
HUMAN RESOURCESPopulation (mre=-1993) thosands 2.285 3,MBK 3.885 558978 3.091.764 I.096.665Apa dcpendcncy ratio ratio 0.90 01.93 0.95 0.94 0.67 0.69Urban % of pop. 16.3 26.5 29.9 29.8 27.6 54.7Population growdh rate annual % 2.5 2.9 3.2 2.9 1.9 1.6
Urban 6.5 5.7 4.8 5.0 3.9 2.9Labor force (15464) thmousnds 998 1.244 3.503 229.480 1.44Z.4S2 459.196Agriculture % of labor rame 75 73Industry 9 3 0Female 39 37 36 36 33 31Fenmales per 100 mats
Urban number...Rurml
NATURtAL RESOURCESArea thou. sq. km 56.79 56379 56.79 244273.63 39,093.96 40,682.67Density pop. per sq. km 40.24 53.32 66.25 22.37 77.60 26.52Agricultural land % of land -ra 4.13 44.75 45.21 52.54 52.82 39.61Change in agricultural land annual S 0.21 0.21 0.00 0.06 0.03 -0413Agricultural land under infigation % 0.25 0.29 028 0.83 18.032 12.66Forests nd woodland thou. sq. km -. 0.02 0.01 5.32 7.15 5£95Deforestation (met annual ... 1.49INCOMEHouschold income
Sham of top20 of houscholds % of iacomue..Shamn of bottom 40% of households H. ..
Share ofTbottom 20% of householdsEXPENDITUREFood % of GDP ... 33.7
staples I. . 1.3 Mdeat. rish, mitt, cheese, eggsp .. 13.9
Ceral imports tho. metric tonnes 2 Si 63 13.157 34*420 66,291Food aid in ceream s I 1 23 3 5,079 8.34 5,477Foodproduction per capima 1987=100 126 306 113 101 113 101Fertilizer consumption kg/ha 1.0 4.0 5.0 4.6 59.9 48.0Sham or agriculture in GDP S of GDP 26.6 33.7 48.6 16.3 26.3 15.7Housing of GDP ... 8.5 -
Averag household size person per household 6.0... urban
Faxed investment housing S of GDP ... 5.0 Fuelandipower SofGDP ... 3.5 -
Energyconsumption per capita kg of oil equiv. 6 49 47 257 364 1.9Households with electricity
Urban S of households... -
Rural Transport and comnmunkeaton S of GDP ... 2.5Fixed investment transport equipment ..- 5.0 Totalmrad length thoumn 7 8-INVESTWME IN HUMAN CAPITALHealthPopulation per physician persons 28.938 8.725 . .. 3.277Populaton per nurse I'm,59 1,239Population per hospital bed 701 .. 665 1.269 1,01660Ora rebydyration therapy (under-5) S of eaes... 33 37 38EducaioGross enroilnent ratioSecondary S of school-age pop. 19 21 23 1 8 41 53
Female 9 10 12 .. 34Pupil-teacher ratio: primary pupils per teacher 60 46 59 40 39Pupil-teadherratio: secorsduy 44 23 28 - 20 Pupils maching grde 4 S oreobort 34 73 85as. Repeaiermtprimary % ofutotaenrogl 29 35 37Illiteracy % of pop. (agel5.) 84 62 57 s0 41 19Female S Of *fL (agel5+) - 75 69 62 53
NewjuPe circulbdom pE thoiL po. 3 4 3 12 .. 74BanldkK Iaenational Economics Department. Apo i$5
341

TongaMeat Sene regloanIiume grewp NM
Laest sbigle year remcet Leri- higherUnal of animate Ears middle- fncome
Indicator mreasure 1970-7S .19OJS 1988-93 Asia income group
Priority Poverty IndicatorsPOVERTYUpper poverty line local curr. .. ..
Headcount index % of pop. ,. .. .. 12Lower poverty line local curr. .. ..
Headcount index % of pop, .. .. .. 9GNP per capita USS .. 750 1,530 820 1.590 4,350SHORTTERM INCOME INDICATORSUnskilled uiban wages local curr. .. ..
Unskilld runl wagesRurai terms of trade
Consunmerprice index 1987=100 27 79 151Lower incomenhod' " 14 77 134 .. .
UrbamRural
SOCIAL INDICATORSPublic expenditure on basic social services Y of GDP .. .. .Gross enrollment ratiosPriramy %schoolagepop. .. .. 133 118 104 105
Male .. .. - 123Female .. .. .. 115
MoralityInfant nmlity per tou. live births .. .. .. 35.5 39.0 35.8Under 5 mortality .. .. .. 60.5 61.5 42.6
IrnmunizatonMeasles S age group .. 11.0 81.0 93.0 77.6 S2.0DPT .. 92.0 92.0 95.0 82.2 74.2
Child malnutrition (under-5) 24.1
LifcexpectncyTotal years .. .. .. 68 67 69Female advantage " .. .. .. 3.6 5.9 5.9
Totl frdlity rate birdts pcr wonun .. .. .. 2.3 2.9 2.9Matnal mrtality rate per 100D000 live birdts .. .. _ 116 ..
Supplementary Poverty IndicatorsExpenditues on soci security % oftoal govt exp. _ 1.2 0.8Scial security coveage % ecomi active pop. .. ..
Access to sal water total % of pop. 33.0 .. 95.6 67.1 .. 86.7Urban - 100.0 99.0 91.7 83.5 .. 93.9Rural 71.0 99.0 98.2 61.3 .. 66.7
Access to hcalth care - 80.0 10D.0
Population growth rate GNP per capita growth rate Development diamond .
(BmTal ave s or- pe ) l T(annua avege. percnt)
45
2 - 0 GNP Gross
[ 7 ~~~~~~~~~~~~~~capta cnroUmin0 I , I I ~~~~~~-5t
-21 -101970-75 198-8 1988-93 1970-75 1910-85 19fl.93 Acess to aft water
m Tonpg Tonga- Lower-middle-income - Lower-middlle-inaome
a. See the teebhicil nowa, p387. b. The develpmen diamond. based on four key indicato shows the average levW Of deveopment in the countrycomparwd with its income grOup. See the intoductionL
342

TongaMarl Sans reglow/icncee grnup Nedt
lat in alage year recent Lower- higherUn it of estIma*s Easft middl. Income
ludLentr measure1111 JPTO75 1MGiS 1988 *93 Asia IncOMe groupResources and Expenditures
HUMAN RESOURCESPopulation (mre=1993) thousands SB 9 1 91 1,713,883 1,096.665 500.507Age dependency metio ratio .. 0.68 0.69 0.54 0.69 0.62Urban % of pop. 20.3 29.1 38.7 31.3 54.7 71.2Population groth rate annual % 1.4 -0.2 1.2 1.4 1.6 1.7
Urban 1I4 3.6 4.4 4.0 2.9 1.8Labor force (1I-6) thousands ... . 942.977 459.196 190.136Agriculture % or labor force.m.IndustryFemale ... .41 3I 29Fem-ales per I100 males
Urbatn number...Rura
NATURAL RESOURICESArea fthu. sq. km 0.75 0.75 0.75 16,367.91 40.6fL.67 21.848.14Density pop. per sq. km 117.33 121.33 129.06 103.27 26.52 22.51Agricultuml land V. of land area 69.44 72.22 72.22 44.21 39.61 41.26Chang in agricultural land annual V. -3.95 0.00 0.00 0.24 -0.13 0.0Agricultural bind underx irrigation %.. .. 14.61 12.66 8.4Forests and woodland ftho. sq. km .. 0.00 0.00 4.06 5.95 8.04Deomorstaon (net) annual V.... 0.00INCOMEHouschold incomeShare oftop 20%ofhbousehokds % of incDein...Share of bottom 40% ofrhouseholds...Share of bottmn 20% of households
EXEDmmFood V.ofGDP...
Staples-Meat, fish, milk, cheese, eggs
Cereal impvorts thou. metric tonnes 666 30.036 66.281i 43,947Food a ida cereals 1 0 .. 47 5,477 544Poodproduction percapita 1937=1OU 150 104 85 115 101 102Fertilizer consumption kglha I. .9 - 76.4 48.0 67.8Share of agriculture in GDP V.of GDP 42A4 35.7 .. 17.1 15.7 8.0Housing V.ofGDP9. .
Average household size perons per household...Urban
fixed investmient housing V.of GDP...Fuel min power V. of GDP...Encrgycomnumdan per capita kg of oil equiv. 125 165 114 632 1.595 1,632Households with clectricity
Urban V. of households...Rural
Transport and comnmnicaton %ofGDP...Fixed investment transport equipment...Tota road length thou. km...]NVESTMENT IN HUMAN CAPITALHealthPoptlation per physician pawsns 3.727 1.60`7 2,021 1,053 3.27Population per nurse. 523 .. 1,490Population perhospital bed 368 274 .. 612 604 395Oral rehydyration therapy (under-5) V. of eases ... 40 32 .51I
EducationGross enrollment ratioSeconday % of school-age pop. .... 53 53 53Femal . .. 47
Pupil-readher ratio: prmary pupils pertlewber 28 23 21 23 .. 25Pupil-teaeherratio:seeondary 22 19 18 16 Pupilsrmaching grade 4 V.ofoohort .. 97 92 92Repeateratc:prinary V.of total enroll .. 8 4 61llitcrallY % ofpop. (agel15+) -.. .22 19 14Female %of fem. (age 150). .. 36 .. 17
Nrr2zm circu1sion per thou. po.. . 72 .. 74 125wom E2oK mmatind EonomiDepxartment, Apri l99
343

Trinidad and TobagoMen Same rqoonlnlcome grap Next
Lest single ya recent Uiiipper idgherUnit of ci a ten Amerka middde Income
lusdctoar measure 1970-75 1980585 1988593 Cars hews income group
Priority Poverty Indicators]POVERTYUpper poverty line local curf. .. ..Headcount index 5 or pop. .. ..
Lower poverty line local curr. .. ..Headeount index % of pop. .. ..
GNP pcr capita US$ 1,910 6.140 3,830 2,930 4.350 23,610
SHORT TERM INCOME INDICATORSUnskilled urban wages local curr. .. ..Unskilled url wagesRurnl tenus of tradeConsuner price index 1987=100 25 84 163
Lower incorme Food 11 76 22ZUrbanRural
SOCIAL INDICATORSPublic cxpenditure on basic social services * of GDP .. ..Goss enrollment ratiosPrimary %schoolagepop. 99 96 95 107 105 103
Malc 9 97 95 95 .. .. 103Fenale * 100 97 95 . .. 103
MorulityInfant mortality per thou. live births 42.0 31.0 17.6 43.0 35.8 7.0Under S mortait*y .. .. 21.0 52.2 42.6 8.5
ImmunizationMeasles % age group .. 10.0 70.0 73.7 82.0 82.5DPT .. 65.0 82.0 73.7 74.2 90.2
Child malnutrition (under-5)lir expectancy
Total years 66 69 72 69 69 77Fcmale advantae ' 4.7 5.0 4.7 5.3 5.9 64
Total fertility mtc birits per womn 3.5 3.2 2.4 3.1 2.9 1.7Matenal mortality rau per 100.000 live birfts .. 81 -
Supplementiry Poveryl IndicatorsExpendius on socia secunty % of total gott cxp. .. ..Social scity overage COn activC po. .. ..p.
Acess to safe watcr ttal S of pop. 93.0 97.3 95. 80.0 86.7Urban - 100.0 100.0 IW.0 90.1 93.9Rural 95.0 93.0 872 57.6 66.7
Access o health ca .. .. 99.0
Population growth rate GNP per capita growth rate Development dianonedb6+ - (anual average. pcent) 10 ( annual aveage, pcent) Life expctancy
4 S
2 G 0P ON Grossper I primary
0 - ____I __ I __I -5 * . capita enrollment
-2 -101970-75 1980-85 198-93 1970-75 1980-85 1988-93 Acess to safe waer
QJ Trinidad and Tobago Tnnidad and Tobago- Upper-middle-income Upper-middleincome
i Sece tc tchnical notes, p.387. b. The development dimond. based on four key indicators, shows the aveage level of development in the countrycompand with its income grup. See the intWduction.
344

Trinidad and TobagoMfost Sm. regS uNiucme reup Neut
Latet ingle year recent dis upper' higher(Jail of eumtn ie Auert. middle- incoern
Indiettor measure IW70-IS 198045 1988-93 Coibbeax Ineme grUmpResources and Expendituires
HUMAN RESOURCIESPopulation (inre=19113) thousands 1,012 1.160 1,278 466,304 500,507 812,447Ago dependency rlati ratio 0.76 0.67 0.63 0.66 0.62 0.49Urban % or pop. 63.0 66.2 70.7 712 71.2 77.9Populndon growdi rmt annualI% 0.8 1IA 1.1 2.0 1.7 0.6Urban 0.1 2.3 1.9 1.9 1.5 038
Labor force (15.64) thousands 364 450 531 169.839 190.136 395.641Agriculture Sof labor force 14 1 0Industry 37 39Female 21 30 30 27 29 38Femnales per 100 males
Urban number...Rural
NATUJRAL RFSOURCESArea thou. sq. km 5.13 5.13 5.13 20,505.92 21,848.14 32,146.15Density pop. per sq. km 197.27 226.12 246.30 22.29 22.51 25.11Agricultural land S of land area 24.56 25.15 25.93 40.00 41.26 42.80Change in agricultural land annual S 0.00 0.00 1.53 0.39 0.06 -0.48Agricultural land under irrigation 5 14.29 17.05 16.54 341 8.84 13.96Forests and woodland thou. sq. kinm 0.00 0.00 9.17 8.04 10.56Deforestation (net) annual S .. -2.16... INCOMEHousehold income
Share of top 20% of households S of incomec 50 .
Sbarreof bottom 40 of houscholds 1 3 Share of bottom 20% of households 4 .
EXPENDflUREFood SofGDP .. 12.2 ... .8.4
Staples .. 2.0 ... .1.6
Meat, fish. milk, cheese, eggs. 5.3 ... .3.8
Cereal imlnprts thou. mectric tonnes 218 196 232 27.700 48,947 77,530Food aid in cereals 0 ... 1,565 544 8Food production per capita 1987 I100 158 99 100 101 1012 95Fertilizer Lonsumption kglha 55.7 55.0 73.4 16.1 6739 150.0Share oi agricultur in GDP' S of GDP' 3.3 2.4 2.4 9.0 8.0HosLting %ofGDP'. 11.6 ..- .11.7
Aveange household size persons per household 5.0 4.5UJrban
F' xed investment housing S of GDP' 8.7 4.1 .... 5.0Fuel and power S of GDP'. 0.7 ... .2.0
Energy vnnsumptian per capita kg of oil equiv. 2.303 4.5S1 4.696 913 1.632 5203Households with e~uiicity
Urban % of households -. 91.6 -
Rural . ..
Transport and communkcallon SorGDI'. 7.7. .. 839Fixd investment tranport equipment 1.1 1.9 ... .2.1
Total road length thou. km 7 51NVESTM1ENT IN HUMAN CAPITALHealthPopulation per physician persons 2.207 943 ... .453
Population per nursew 201 253Population perbhospital bed 201 ... 517 395 145"Oral rehydyntion therpy (under-5) % of eases ... 75 61 51IEducationGros emlnrolmnt ratioSecondary % of school-agepop. 48 80 81 47 53 92
Female 51 79 82 -.- 94P.pil-teadhrratio: primary pupils per teadchr 3 1 22 26 26 25Pupil-teacher matio: secodary 39 19 20Pupils reaching grade 4 S ofcohort 74 95 100Repeate ram primary of tota enroll .. 5 Illiteracy %ofrpop. (agecis+) 8 4 I. 1 14
Female SOf fan.(agcl15+) .. 5 is 1 17New cittulaton per thou. po. 99 149 139 as 12S 320wonl ankternational Econormics Department Apri 1 995
345

TunisiaMHo Me wler nb4cme grup Ne
Last sisngeyear rmni MW-Evil LDWb highe.Unit of estImate d Nwth ddie* income
Indanor meiaure 1970-75 1984185 1998893 rIa Income grmap
Priority Poverty IndicatorsPOVERTYUpper poverty linc local curr. .. 182 252
Headeoun: index 1' of pop. .. 20 14Lowerpovenyline localcuir. .. 142 196Hcakodunt index % of pop. .. I1 7
GNP per capita USS 770 1.140 1,720 1,980 1.59D 4,350SNORT TERM INCOME INDICATORSUnskilled urban wages local curr. .. ..
Unskilled mml wagesRuran terms of tradcConsumer price index 1987=100 .. 87 146
Lower incomeFoot .. 89 145 .. _Urban'.........Rural
SOCIAL INDICATORSPublic expenditure on basic socid services % orGDP .. .. 4.5Gross enrollmmnt ratiosPrimary %schoolagc pop. 97 116 120 97 104 105
Male * 116 126 125 103Ftmale 78 106 115 90
MonaltyInfant mortadity par thou. live births 120.0 71.0 41.8 52.3 39.0 35.8UnderS monali*ty .. .. 52.0 69.9 61.5 42.6
ImmunizationMcasles % age group .. 65.0 80.0 81.3 77.6 82.0DPT .. 70.0 90.0 84.0 82.2 74.2
Child malnutition (undcr-5) 20.2 * 7.8Life excancy
Total yeas 56 63 68 66 67 69Fenmakeadvantage 1.0 1.0 3.9 23 5.9 5.9
Tot fertility rate births perwoman 62 4.9 3.1 4.7 2.9 2.9Maternal mortaiy tale per 100.000 live births .. 1000 127
Supplementary Poverty IndicatorsExpcnditures on social security % of total goVtexp. .. ..
Social security coveage % eoC. active pcp. .. .. 64.0Access to sfe water. total % of pop. 49.0 66A 67.4 83.5 .. 86.7
Urbman 92.0 96.0 94.7 98.7 _ 93.9Rural * 17.0 31.0 62.0 69.0 .. 66.7
Access to health cum .. 95.0 90.0 87A
Population growth rate GNP per capita growth rate Development diamondb(atmual age.percent) (amualaverage. percent) l&exp y
4 -
2 0 --
-2 1 101970-75 19S0-85 1918-93 | 1970-75 19B085 198893 Autosafew
Tisia Tuisia- Lower-nmiddle-inc m Lo miomie
a. See the kchnical notes, p387. b. The development diuwond based on four key indicators, shows tde avmp level of devdopmet in the countrycompared with its income group. See the introduction.

Tunisiamost Sam ngloa/aeoma rou Next
Ltoest single year recemt hWE*T iiL djJerUIna of estimate & North Mi&dv- Ineow
In&diaor secure 1970475 198045 1918&93 A.fl* Income group
Resources and ExpendituresHUMAN RESOURCESPopulation (nwre=1993) thousands 5.611 7,177 8.656 261,650 1.096,665 50D.507Age dependency railo matio 0.90 0.77 0.73 0.17 0.69 0.62Urban % of pop, 49.8 53.0 56.3 55.2 54.7 71.2Populadon grwth rate amnuali% 1.8 2.3 2.3 2.7 1.6 1.7Urban 4.0 3.0 3.2 3.7 2.9 i's
Laborlforce (15464) thousands 1,608 Z.224 2.819 71.333 459.196 190,136AgricultUre % orlItabor force 38 35Industry 31 36Female 16 23 25 16 3i 29Females per 100 males
Urban number 101 98Rural 99 101
NATURAL RESOURCESArea thou. sq. km 163.61 163.61 163.61 11,021.26 40,682.67 21.q4B. 14Density pop. per sq. km 34.29 43.87 51.68 23.10 26.52 22.51Agricultural land % or laud area 52.65 53.41 S7.43 32.10 39.61 41.26Chmange in agriculturml land annual 1 1.05 -0.60 7.66 0.04 -0.13 (LOUAgricultural laW ndwder irrigation Ii 1.53 2.51 2.60 30.59 12.66 8.84Fonusts and woodland fthu. sq. km .. 0.01 0.01 0.45 5.95 81)4Deforestation (act) annual* ... -1.95
INCOMEHousehold incomeShare of top 20% of households Wi of inwcm 42 .. 46Sharcof bostom40% ofhouseholds 15 .. 16Shar of bottom 20% ofhouseholds -6 .. 6
lmEnRFood % of GDP .. 26.5
Staples .. 4.9Mecat, fish, milk. dbm.cc eggs .. 9.6
Cereal imports. thou, metric tonnes 337 732 1,044 38,09 66,281i 48.947Food aid in cerels 59 192 100 1,249 5,477 544Food poduwtionper cptm 1987=100 114 103 103 102 101 102Fertilzer consumption kglha 6.4 11.3 12.2 89.9 48.0 67.0Sham of agricnlttumin GDP %orGDP 18.5 15.2 15.6 13.3 15.7 8.0Housing S orGDP .. 9.4Average household size persns per household 5.5 .
Urban 5.5 ..
Frxed invesbment:hauin % ofGDP . .Fuel and power %ofGDP .. 2.7Energ consumption per capita kg of oil equiv. 330 522 576 1,097 1,595 1.632"Househods with electricity
Urban S of households...Runtl
Trazspoflad cotuaunadon SoIf GDP .. 5.1Fixed hwvestinet urasport equipment .. 3.1Totalmad lengib dwou. km 18 26 29INVESTENT IN HUMAN CAPITALHealthPopulation per physicia person 51900 3,631 1.537 .. 3,277Population per nurs 942 953 299Populattion per hospita bed 400 470 347 633 604 395Oral rhydyzbatn therapy (under-5) S of cWss... 22 56 .51I
EduntaGross enollienat MDtiSeondary Wiof school-agepop. 21 39 43 56 53 53
Female * IS 32 42 50Pupil-teacherraino: prmary pupils perrewchrx 40 32 26 26 .. 25Pupi-teacher ratio: secondary ..-. 2 1Pupilsremchinggrde 4 of cobort 88 93 94 95Repeate rate.: primary % of total entoIl 19 20 20IIieacy % ofpop. (agcl5+) 62 42 35 45 19 14
Femal %of frm. (aget5+) 68 53 4457 .. 17Nes3 irarcutaottn pe thouLI:. 34 39 48 33 74 125
world Internatinal DepaSrtment. Apnil 1995
347

TurkeyMost tAme rqn ho:eAme qFEIp Next
fideSlGlP919W RtiroiW7eLwert AlglAein ifto dqf asale A CEasul middle- tncome
Jndicuar ruen Jw7e1 75 JflaT0 115 JJ08 -93 Aa linOme groupPriority Poverty Indlcators
POVERTYUpper poverty line local curr. .. .
Headcount index % of pop. .. .. .. .. ..Lower poveny line local corr. .. ..Haadcount Index R of PDP. .. ..
GNP par capita USS 900 1,060 2,970 2,450 1,590 4,350SHORT TERM INCOME INDICAD'ORSUnskilled urban wages local curr. .. ..Unskilled rural wagesRural temm of trde,Consurmerprice index 1987ul00 1 54 2,131
Lower Income
UrbanRurald
SOCIAL INDICATORSPublic expenditum on basic sodal services % of ODP ,. ..
Graos erollment radiosPdrmry %schoolagepop. log 113 110 ,, 104 105Male 124 117 115Female 94 110 110
MoraityInfant mortiy perthou.livebirths 138.0 102.0 62.4 24.8 39.0 35.8UnderS mortity .. .. 84.0 36A 61.5 42.6
lmmunizationMeasdes * a group ,, 45.0 64.0 .. 77.6 82.0DPT .. 64.0 72.0 .. 82.2 74.2
Chid malnutrition (uAndr-5) 'Life expecnyTotal yenrs 58 62 67 69 67 69Female advantage 4.1 4.6 4.1 8.8 59 5.9
Total fertility rate births per woman 5.0 4.1 3.3 2.1 2.9 2.9Mateal mortality raut per 100o00livebirths .. Z07 146
Supplementary Poverty IndicatorsExpndinres n social security % of total gov't cxp. 1.3 0.5 0.7Social security coveage ecoon. active pop. .. .. 78.2Access to safe water toal % or pop. 68.0 85.0 92.0 .. .. 86.7
Urban * 74.0 100.0 97.8 .. .. 93.9Rand 9 64.0 70.0 84.0 .. .. 66.7
Acces to helih cam _ .. .. 100.0
Population growth rate GNP per capita growth rate Development diamondb(annual average. wcent) I (annual avenge. perent) life expenncy
4 -S -
2- 0* n | w1 l I ~~~~~~~~~~~~~~~~GNP CamGss2. 0. per primary
0- l l l l l l I -5 rapita, \ / enrdlinent
-2 -10 1970-75 1980-85 1988-93 1970-75 1980-85 1988-93 AcEcS to sfe water
~_Turkey Turkey- Lower-middle-income - Lower-middle-incmre
a. Sec the techniial notes p.387. b. The developent diamolnd, based on four key indkatrs, shows the avge level ofrdevdopnent in the countrycompard with its incme group. See the introduaion.
348

TurkeyMost Same regbn/linc.sgm ap Next
fINes: :lugfeyear, rice Eiun Thii hiherunird of crlimarte A Cerniral middle- Incoern
Indicater macare 1970-75 19M80- fIVt-91 Asia Income grouip
Resources and ExpendituresHUMAN RESOURCESPopulation (mr19l93) thousands 40,025 5D.345 59.597 494,619 1.096.665 500,507Age dependency mdo rule 0.831 0.68 0.64 0.57 0.69 0.62Urbain % of pop. 41.6 52.5 65.6 64.8 54.7 71.2Population growth rate annual % 2.5 2.5 2.1 0.6 1.6 1.7Urban *4.1 5.9 4.5 3.5 2.9 1.8
Labor force (15.64) thousands 37.640 21.385 25.1.53 237.897 459.396 190,136Agriculturc % of labor force 65 58Industry N 34 1 7Female 37 34 34 47 3SI 29Females per 100 males
Urban number .. 88Ruram'. 3116
NATURAL RESOURCESArea thou. sq. km 779.45 779A45 779A45 24.320.56 40,682.67 23.848. 14Density pop. per sq. km 53.35 64.59 74.88 20.20 26.52 22.51Agricultural land S of land amc 49.33 49.54 51.77 - . 39.61 41.26Change in agricultural land annual % -0.95 1.37 .0.56 .1.21 .0.13 0.08Agricultural land under irrigation % 5.80 8.39 9.22 7.15 12.66 8.84Forests and woodlanad fthu. sq. km .. 0.20 0.20 0.80 5.95 8.04Derorestation (net) annual % .. 0.00INCOMEHouse-hold income
Shiam of top 20l%of houseolwds % of incomne 55 .
Sharc of bottom 40% of househuolds I I Share of bottom 20% of households 4 .
EXPENDITUREFeod of GDP .. 29.5 17AStaples .. 6.3 3.8Meat, fish, mTilk, cheese, eggs 1.0.6 6A4
Cer-eal imnports thou. meetuic tonnes 560 1.082 1A486 34.452 66.2811 48.947FDod aid in cereals 1 6 0 2 4,392 5.477 544Food production per capita 1987=100 92 94 97 .. 101 302Fertilizer consumption kg1ha 23.5 37A 48A4 41.7 48.0 67.8Share of agriculture in GDP S Of GDP 26.2 17A 13.6 13.5 15.7 8.0Housiag of ODP .. 9.2 16.2 6.0Averge household size personis per household 5.8 .
Urban 6.6 .
Fixed investment: housing % Of GDP 2.6 0.6 5.3 5.iFuel andipower % of GDP .. 4.9 2.9 132Energy consumption per capita kg of oil equiv. 669 782 983 2.959 1.595 1,63'2Households with electricity
Urban % of households...Rural
Transport and omamunleatlom U. of GODP .3.5 4tOFixed investment transport equipment .. 2.8 2.5Total road length thou. kmn 52 59 59INVESTMNTa IN HUMAN CAPIALHealthPopulation p;zphysician pesnsZ197 1,392 913 362 3.277Population per nurse N1,002 1.031 3,106 249Population perbhospital bed 499 488 406 136 604 395Oral rehydyration therapy (under-5) % of cases ... .. .51
EducationGross enrollment ratioSecondary S of school-age pop. 29 42 62 .. 53 53
Female 19 30 51Pupil-reacher ratio: primary pupils per teache. 34 3 1 29 ... 25Pupil-teacher ratio: secondary N3 1 24 26Pupils maching g:ade4 Sof colort 80o. 98Repeater ratc primary % Of total enroll .. 7Iiteramcy %of pop. (agelS+) 40 24 12 5 19 14Female % of fru. (agelIS+) .. 36 28 ... 17
Ne rp rirculaton to. .37 60 7 1 .. 74 125Worl 1a ternationa acnomucs AarMment.
349
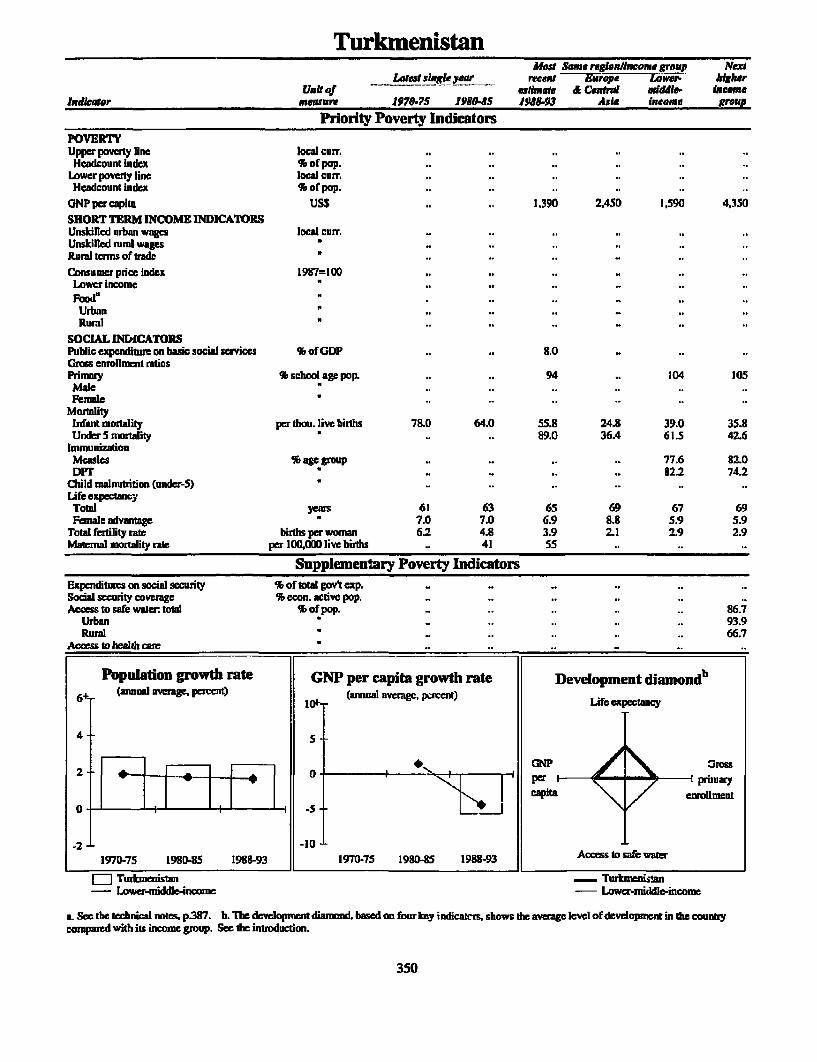
TurkmenistanMest Sm. reulnAincome grnup NexI
L[test slxgle >war reenit EI7epe LNneri higherUnit of esatimte & Ceunul mfddle- lnceme
lndktoer maure 1970.75 1,80-8s J988-93 Asia inctere prUP
Prlority Poverty IndicatorsPOVERTYUpper povery line local curr. .. ..
Headcount index % of pop. ..Lower povety line loCal curr. .. ..
Headcount index % of pop. ..
CNP per capita USS .. 1,390 2,450 1,590 4,350SHORT TERM INCOME INDICATORSUnskilled urban wages local curr. .. ..
Unsrkilld rurnl wagesRural terms of tradeConsumer price index 1987=100 .. ..
Lower income
UrbanRural
SOCIAL INDCATORSPublic expenditum on basic social sevices % of GDP .. .. 8.0Grass enrollment ratiosPrimary % schoDI age pop. .. .. 94 .. 104 105Male .. .. ..Female .
MoralityInfant mortality per thou. live births 78.0 64.0 55.8 24.8 39.0 35.8Under 5 mortality ' .. .. 89.0 36.4 61.5 42.6
ImmunizationMeasles % age group .. .. .. .. 77.6 82.0DPT .. .. .. .. 82.2 74.2
Child mlnutrition (under-S)Life expectancyTotal years 61 63 65 69 67 69Femae advantage 7.0 7.0 6.9 8.S 5.9 5.9
Total fertility rate births per woman 6.2 4.8 3.9 2.1 2.9 2.9Maternal mortality rate per 100,0D0 live births .. 41 55
Supplementary Poverty IndicatorsExpcnditurcs on social secuxity % of total gov't exp. .. ..
Social security coverage % econ. active pop. .. ..
Access to safe wauer. total % of pop. .. .. .. .. . 86.7Urban .. .. .. .. .. 93.9Rural .. .. .. .. .. 66.7
Acces to healt care
Population growth rate GNP per capita growth rate Development diamondb(annud averagc, percet) 0 (artal iav-rare percent) Life expectcy
45
* ~~~GNP Gs2 0 N ~~~~~~~~~~~~~~~~~~~~~~~~~per Primary
caplita enrolment
-2 -- 101970-75 1980-85 198W-93 | 1970-75 1980-85 1988-93 Access to safe water
E] Turmnenistan TurkmeniUtan- Lower-middle4noome -6middle-income
a Sec the technical notes. p387. b. ThedevelopmentdianKnd. based on fourkey indicaw, showrs theaverage level of developmentin the countrycontmp d with its income group. See the introduction-
350

TurkmenistanMaM Same regin/ncome grop ex
Laeast singeyerk recnt Xmjl.iI htherClub of eiS~-admate & Centrial mwiddle- Income
Indicatr measure 1.970-75 198045 198893 Asia income Cgrete
Resource and ExpendituresHUMAN RESOURCESPopulatIon (mrecl1S3) thousands 2,20 3.225 3.921 494.619 1.096.665 500.507Age dependency redio ratio 0.92 0.80 0.78 0.57 0.69 0.62Urban Ii of pop. 47.6 46.0 44.9 64.81 54.7 71.2Population growth rate annual 91 2.8 2.4 2.4 0.6 I.E 1.7Urban 2.7 1.9 2.4 1.5 2.9 1.8
Labor force (15.64) thousands .. 1,338 1.573 237.897 459.196 190,136Agriculture % of labor rorc . 40 44Industry .2 1 20Femal . . 50 47 31 29Females per 100 males
Urban number . ..
RuralNATURAL RESOURCESArmo thou. sq. km 488.10 488.10 488.10 24,320.56 40.682.67 2t.848.14Density pop. per sq. kcm 5.16 6.61 7.84 20.20 26.52 22.51Agricultural land %1 of land ara. . .. 39.61 41.26Change inagrieultural land annual % .. 0.52 -1.01 -1.2'8 -0.13 0.08Agriicultural land under irrigation %1 2.24 2.84 3AI 7.15 12.66 8.84Forests and woodland thou. sq. km .,. . 0.80 5.95 8.04Deforesttion (net) annual Wi. ..
INCOMEHousehold incomesham of top 2o% orhouseholds % of laconic. ..
Share of bottom 40% of householdsSham of bottom 20% of houeoldos .
EXEUrREFood %ofGDP . ..
staples i
Meat, fish, milk., cheese eggsCercal imporu thou, metric moanes ... 940 34.452 66,28'1 48.947Food aid in cereals... 2 4.392 5.477 544Food production per capita 1927 =100 ...... tOl 102Fertilizer consmption kg/a... 4.4 41.7 48.0 67.8Sham of agriculture in ODP %iof GDP .. 28.9 32.5 13.5 15.7 8.0IHuslug %ofGDP .4 7.64.7Averag household size persons per household ... 5.6
UrbanFixed investment: housing %iof GDP ... 4.9 5.2Foel and power % of GDP ... 1.0 1.2Energ consumption per capita kg or oil equiv. ... 2.268 2.959 1,595 1.632Households with electricity
Urban Wiorhouseholds . ..
RuralTrnsport andconnuulcallon Wiof GDP . ..
Fixed investment transport equipment . ..
Totlmoad lcngtlz thou.kIns 12 21 23
INVESTMENT IN HUMLAN CAPiALHealthPopulation per physician persns 382 301 278 362 3.277Population per nurse 131 III 91 249Population per hospital bed 98 94 85 136 604 3950.1 zehydyration therapy (under-5) Wi of cases ... ... 5 1EducatonCGros enrollment ratioSeeonday S of school-age pop. .... 53 53
FemalePupil-teacher ratio: primary pupils per teache 25. . ..
Pupil-techer rati: secondaryPupils reching grade 4 Ofecohort . ..
Repeater rate: primary % Of~ tD ..CWOIIIliteray % of pop. (agelS4) ..- 2 5 19 1 4Female %orffrm. (agel5s+) .-..... 1 7
Newspe circulation pe thou, o....... 74 125world I"=ik ntenuonl Economics Deparument, April 19951
351

UgandaMast Same r,wlelen me group Next
Laest Flask ye recent Sub- higherUnit of emu Salman Low- income
bIdkWmr asurn 1970475 191058 1 19893 nicome group
Priorty Poverty IndicatorsPOVERTYUpper poverty lns lcal curr. .. .. 6,0..
Headcount index 9 of pop. .. . 55 .. I 9Lowerpovet line loca cum. .. .. 3,000
Headcountindea % of pop. .. .. 19GNPpercaelta USS .. 110 t80 520 380 1.590SHORT TERM INCOME INDICATORSUnskilled urban wagps local curr. .. ..Unskilled ural wges"Rural tWms oftiade *.Consumierpnceindez 1997=100 .. 13 1.318
Lower income
UrbanRunl ".. I5 297
SOC L INDICATORSPublic expendituwe on basic social services S of GDP .. .. 5.5Gross erollment ratiosPrimary %schoolagepop. 44 70 71 67 108 104Male 53 66 .. 74 116Female 35 49 63 60 101
Moraityinfantmoraity per dou.livebirths 116.0 116.0 114.2 93.1 63.1 39.0under s monality .. .. 185.0 172.3 101.4 61.5
bnmunizalio,Measles Si a grolup .. 17.0 74.0 49.9 87.3 77.6DPT .. 14.0 77.0 51.9 899 82.2
Child nalnutriton (under65) .. .. 23.3 .. 40.3Lif expectancyTotal yeau 46 48 45 52 62 67Female ad rutage 3.2 3.3 2.5 3.3 2.1 5.9
Total fertility late birds per woman 6.9 7.0 7.2 6.2 3.6 2.9Maternalmortaity rats per 100.000 livc binsf .. 300 550
Supplementary Poverty IndicatorsExpendiitur on socia security % of tota govt exp. 0.0 1.6Soci socurity overagw S econ. dvC pop. .. ..
Access to safe watol * of pop. 22.0 15. 52 .. 67.0Urban 8.0 45.0 45.0 .. 78.7Rud 17.0 12.0 12.0 .. 62.0
Access to bualhcuu .. 42.0 71.0
Population growth rate GNP per capita growth rate Development diamonde6 I (annual aver ge. perent) Life r
4 5 --
o I 1,1 1,1 1 -5 capita /nroDnient
-2 -101970-75 1980-85 1998-93 1970-75 1980-8S 198B-93 Access to safe water
LI] Ugnda Ugnda- Low-incom Low-income
a See the chnical notes, p3W7. b. The development diaonnd, based on for key dicatrs, shows d aveag level of development in the countrycompaed with its income gop. See the introductionL
352

UgandaMosa t ae uonAlineome groap Nexl
Lat,sftsig/a ear- racanti 25i- higkerIMt ef ertimate Sdharlm Law- income
/nd:ator mearre 1970-75 1950-45 J988-93 AJrla Income groupResources and Expenditures
HUMAN RESOURCESPopulatlon (mre=1993) thousands 11,183 14,825 18,026 558,973 3.091,764 1.096,665Age dependency ratio mtio 1.00 1.02 1.04 0.94 0.67 0.69Urban % of pop. 8.3 9.9 12.0 29.8 27.6 54.7Population growtb rate annual 2' 2.6 2A 2.4 2.9 1.9 1.6
Urban 3.4 4.7 4.6 5.0 3.9 2.9LAbor fome (15-64) thousands 5.331 7,054 8,875 229,480 1.442,452 459,196Agriculturc % of labor forem 88 86Industry 4 4Fer, e 43 42 40 36 33 31Fer ales per 100 males
Urban numbcr .. ..
Rural n
NATURAL RESOURCESArea thou. sq. km 235.88 235.88 235.88 24,273.63 39.091.96 40.682.67Density pop. per sq. kn 47AI 62.85 74.58 22.37 77.60 26.52Agricultural land * of land area 36.10 42.07 42.93 52.54 52.82 39.61Cange in agricultura land annual % 2.02 1.20 0.23 0.06 0.03 -0.13Agricultural land underirrigation % 0.06 0.11 0.11 0.83 IB02 12.66Forcsts and woodland thou. sq. km .. 0.07 0.06 5.32 7.15 5.95Deforestation (net) annual % .. .. 0.96
INCOMEHousehold incomeShare of top 20% of households % of income 47 .. 42Sharcofbottom40%ofhouseholds ' 17 .. 21Share of bottom 20% of households 6 .. 9
EXPENDITUREFood 2 oflGDP .. .. 46.8
Staples * .. .. 25.4 .. _Meat. fish. miL cheese eggs .. .. 11.0
Ccral imporut thou. cnetrictonnes 6 16 76 13,157 34,420 66,281Food aid in ecreals 0 -31 59 5.079 8.334 5,477Foodproductionpercapita 1987=100 159 102 110 101 113 101Frtilizer consumption kg%ha 0.2 0.0 0.1 4.6 59.9 48.0Share of agriculture in GDP % of GDP 66.6 50.5 49A. 163 26.3 15.7Housing %ofGDP .. .. 12.0Avenge houschold size pCesonIS per household 4. . 4.8
Urban ' .. .. 4.1Faxed investment housing % of GDP .. .. 2.6Fuel and power % of GDP .. .. 1.7Energyconsumpdionpcrcapita kgofoilequiv. 43 24 23 257 364 1,595Households with eectricityUrban % of houscholds .. .. 349Rural .. .. 1.
Trnusport and conmunicatlon * of GDP .. .. 4.3Fixed investnent azsport equipment .. .. 2.6Total road length thou. km 26 22 29
INVESTMIE IN HUMAN CAPALHealthPopulation per physician persons 9.265 23.678 21.681 .. .. 3,277Population per nurse ,, 2,116Populationperhospitalbed 604 680 1,109 1269 1,016 604Oral rehydyration therapy (wuder-5) % of cases .. .. 45 37 38EducationGrss enrollment ratioSeconday % of schcol-age pop. 4 10 13 18 41 53Femae 2 5 35 .. 34
Pupil-teachcr ratio: primay pupils per tacler 34 36 .. 40 39Pupil-teachcrratio:secondary 23 23 18 .. 20Pupils reaching gmde 4 % of cohort .. .. .. ..
Repcaterrate:primary %oftotalenwll 10 10IljLc % of pop. (age lS+) .. 57 52 50 41 19Female % of fen. (agr 15+) .. 71 65 62 53
Newsper cireulamion aethou gm 7 2 5 12 .. 74
353

UkraineMoait Same regna/came group Next
latRfl:gla year reant Eit lower6- higherUnit of ettimate & Central mdll.- Income
Indkclor manure 19701-7S 190"85 1988&93 Asia leome groupPriority Poverty Indicators
POVERTYUpper poverty line local curr. .. ..
Heakcount index % of pop. .. ..Lower poverty line local curr. .. ..
Headcount index % of pop. .. ..
GNP per capita USS .. .. 2.210 2,450 1,590 4.350SHORT TERM INCOME INDICATORSUnskilled urban wages local curr. .. ..Unski led rural wagesRural terms of raderConsumcr price index 1987=100 .. ..
Lower incomeFood ? .. 91 101
UrbanRural
SOCIAL INDICATORSPublic expenditure on basic socidl serviccs 5 orGDP .. .. 8.0Gross enrollment ratiosPrimary % school age pop. .. .. .. .. 104 105
MaleFemale
MortalityInfant mortaliLy per thou. live births 22.0 20.0 16.0 24.8 39.0 35.8Under 5 ortality .. .. 26.0 36.4 61.5 42.6
ImmunizationMeasles % age group .. .. .. .. 77.6 82.0DPT n. .. .. .. 82.2 74.2
Child malnutrition (under-S)Life expectancyTotal ycars 70 69 69 69 67 69Female advantage - 8.7 9.3 9.9 3.8 5.9 5.9
Total fertility mte births per woman 2.0 2.0 1.6 2.1 2.9 2.9Maternal mortlity rate per 100.OD0 live birhs .. 45 33
Supplementary Poverty IndicatorsExpenditures on social security % of total gov't exp. .. ..
Social security coveragc 9 econ. active pop. .. ..
Access to safe water tota 9 of pop. .. 100.0 .. .. .. 86.7Urban .. 1000 .. .. .. 93.9Rural n .. 100.D .. .. .. 66.7
Access to alth care 100.0 100.0
Population growth rate GNP per capita growth rate Development diamonde(anmnal average, perent) (rnua avag percent)
(annuai average, percent) Life expectancy
4 -5
_ _ _ _ _ __ e GNP Gross2 *-- .............. . 0- I ', i per I _ prinmy
0 1 5 :opita en/ollment
-2 -101970-75 1980-5 1988-93 1970-75 1980-5 19893 Access to Safe WatCr
Ofl Ukrainc - krine- Lowa-nmddle-income Lower-niddle-income
a. See the technical notes. p.387. b. The developnnt diamond. based n fourkey indicators, sbows the avg lvl of dvlopment in the countrycompad with its incomc group. See the intmduction.
354

UkraineMost Same regian/income, group Next
Lates: single year -- recent -EIjriLeiiiii 6 higherUnit of estimate & Central mIddkt- Income
Indicator measure 1970.75 198945 1988-93 Asia LIncome group
Resources and ExpenditureHUMAN RESOURCESP-opulation (mre=1993) thousiands 49.016 50.9 14 5 1.551 494,619 1.096.665 500,507Age dependency ratio ratio 0.50 0.49 0.51 0.57 0.69 0.62Urban % orpop. 58.3 64.7 69.2 64.8 54.7 71.2Population growth rate annual % 0.7 0.4 0.0 0.6 1.6 I.7
Urban N2.0 1.3 0.9 1.5 2.9 I.ELabor force (1S-64) thousands .. 25.587 24,028 237,997 459.196 190.136Agriculture %l of labor focit . 21 21Industry .. 39 39FemaleN. .. 47 31 29Females per 100 malesUrban number...Rural
NATURAL RESOURCESArea fthu. sq. km 603.70 603.70 603.70 24,320.56 40,682.67 21,848.24Density pop. per sq. km 81.19 84.34 85.36 20.20 26.52 22.51Agricultural land % of land area 73.44 73.40 72.3?7. 39.61 41.26Chiange innagriculturalland annualS . 0.19 -0.09 -1.28 -0.13 0.08Agriculttur alhnod under rigaption % 3.49 5.78 6.21 7.15 12.66 8.84Forests and woodland thou. sq. km .. 0.09 0.09 0.80 5.95 8.04Deorestation (net) annual % .. -0.26 . .-
INCOMEHousehold incoeniShare of top 20% of householdis % of ineoni .... . .-
Share or bottom 40W, of households...Share or bottom 20% of households
EXENDITUREFood % ofGDP...StaplesMeat rish. milt cheese, eggs
Cereal imports thou. metric tonnes . 1.500 34.452 66.281 48,947Food aid in cereals N... 197 4.392 5.477 544Food productionperrcapita 1987 100 ...... 101 102Fertilizer consumption kg&a... 69.1 41.7 48.0 67.8Share of agricultureinaGDP % ofGDP .. 193 34.7 13.5 15.7 8.0Housing % of GDP ... 4.7 6.0Average household size persons per household ... 3.2
UrbanFixed investment: housing % of GDP ... 4.9 5.2Fuel andpower % of GDP ... 1.0 1.2..-Energy consumption per capita kg of oil equiv. ... 3.960 2,959 1.595 1.632Households with electricityUrban % of households...Rural...
Transport and conummlcatlon % of GDP...Fixed investment: trasport equipmientTotal road length thou. km 215 247 274 -
1INVESTMENT INHURMAN CAPITALHealthPopulation per physician person 312 242 224 362 3.277 -
Populaton per nurse N101 90 86 249 PopuLation per hospital bed 85 76 76 136 604 395OrAl rehydyrado therapy (under-5) S of cafses. .. .. 51EducationGros emnrolmnt ratioSecondary S of school-ag pop. ...... 53 53
Pupil-tcacher ratio: primary pupils per teacher ... .. .25
Pupil-teacher ratio: secondary Pupils reaching grade 4 % of cohort 99 89Repeater mate: primary % Of tota enrl . .. . .-
Illiteracy % of pop. (agel15+) ... 2 519 14Female % of fen(CagelS4.) -.. .. .17
Newsppr circulation pe thou. no. - ... .74 125worldo Brank intemnanonal Economics Lprict pi19
355

United Arab EmiratesMost Sme regoeflneome group
LatIN single year recentunit of eat s are Hs-
lIdkaor measure 1970-75 190-S JUl493 Income
Priority Poverty IndicatorsPOVERTYUpper poverty line local curr.
Icadcount indcx % of pop.Lower poverty line local cuir.
Headcount index % of pop.GNP per capita USS 14.,50 20.290 21.430 23.680SHORT TERM INCOME INDICATORSUnskilled urban wagcs local curr.Unskilled rumi wagesRural terms of tradeConsumer price index 1987=10 ..
Lower incomeFoot..
UrbanRural
SOCIAL INDICATORSPublic expenditure on basic social services % of GDP .Gross enrolment ratiosPriry % scIoolm age pop. 101 93 118 103Male 104 94 119 103Femalc 97 93 117 103
MortalityInfant mortality per thou. live births 57.0 32.0 13.2 7.0Under 5 mortality .. .. 21.0 8.5
InmmunizationMcasles S age group .. 49.0 66.0 32.5DPT .. 58.0 81.0 90.2
Child malnutuition (under-5)Life expectaCtyTotal years 63 69 74 77Fnrnale advantage " 3.7 4.3 2.4 6A
Total rertlitynmtc births perwoman 6A 5.2 4.2 1.7Maternal mortality rate per 100,000 live births
Supplementary Povert IndicatorsExpenditures on social security % of totlw gov'tcxp.Social security covcragc % econ. active pop.Access to safe water total * of pop. .. 100.0 100.0
Urban .. 100.0 100.0Rural .. 0.0 ID0
Acces tchealth cam .. 96.0 90.0
Population growth rate GNP per capita growth rate Development diamondb(annual averae pecet) (amual average. percent) Life expectancy
4 -- 5 --
2 t 1 O - +4 * GNP > > Gross2 -- 0
capita noteno -- I - - -5
-2 -10 -
1970-75 1980-85 198D-93 1970-75 1980-85 1988-93 Access to st wafr
W United Arab Emirates - United Arab Emirates- High-income igh-income
a. See the technical notes p387. b. The dcevlopment diamond based on four key indicators, shows thc avergc level of development in the couunycompared with its income group. Sce the intoduction.
356

United Arab EmiratesMeat Sam rFW5iAxeoUE grow
Unit ~~~Laze single yaw recantUnit of ~~ - etibsate Hih-
Indicator stesare 1970-75 198085 1988-93 lIcome
Resources and ExpendituresHUMAN RESOURCESPopulathin (mre=1993) thousands 505 1,379 1,807 812.447Age dependency ratio ralio 0.44 0.42 0.49 0.49Urban % of pop. 65A 769 82.8 77.9Populadon growth rate annual % 16A 6.1 2.6 0.6Urban 18.9 75 3.3 0.8
Labor force (15-64) thousands 267 613 831 395.641Agricultur % of labor force 9 5Industry 37 38Female * 4 6 7 38Females pcr 100 nalesUrban number 29Rural 40
NATURAL RESOURCESArm thou. sq. km 83.60 83.60 83.60 32.146.15Dcnsity pop.persq.km 6.04 16.50 21.06 25.11Agdictudral land % of land arca 2.57 2.81 2.86 42.80Change in agricultural land annual % 0.47 1.29 0.00 -0.48Agricultural land under irigation % 2.33 2.13 2.09 1396Forests and woodland thou. sq. km .. 0.00 0.00 10.56Deforcstaion (nct) annual 5 .. .. 0.00INCOMEHousehold incomeShare of top 20% of houscholds 9 of inomeShare of bottom 40% of householdsShare of bottom 20% or households
EXPENDITUREFood % of &DP .. .. .. IIAStaples .. .. .. 1.6Meat, fsh. milk. cheese, eggs .. .. .. 3.8
Ceal imports thou. netric tonnes 168 420 583 77.530Food aid in cereas .. .. .. 8Food production percapita 1987 = 100 .. .. .. 95Fertilir= consumption kgflh 4.2 16.0 72.4 150.0Share of agriculure in GDP % of GDP 0.8 1.5 2.2Housing %of'GDP .. .. .. 11.7Average household sizr peasons per household
UrbanFlixed invesutent housing S ofGDP .. .. .. 5.0Fuel and power % of GDP .. .. .. 2.0Energy consumption per capita kg of oil equiv. 3,915 10,986 16.878 5,203Housebolds with electricity
Urban % of householdsRuran
Transport and conmunlcaton % of GDP .. .. .. 8.8Fixed invesutent transport equipment .. .. .. 2.1Total mad lngth thou. kmINESTMENTPIN HUAN CAPITALHealthPopulation per physician perns 1,11S 1,015 1,095 453Population per nursc .. 390 S77 ..Population per hospital bed .. 331 .. 14SOral rchydyration theapy (under-5) % of cases .. .. 81EducationGrss enrollment ratioSecondary % of school-age pop. 33 59 69 92Female 29 63 73 94
Pupil-teacher ratio: primary pupls per teacher 1S 25 17Pupil-teacher ratio: secorxnry 9 14Pupils reaching grade 4 % of oohort 95 92 93Repeater rate: primary % of total enrol 1S 6 4liaeracy % of pop. (ap 15+) 47Female % of feot (age 15+)
News rciwulation Per thou p. 4 210 190 320Wodd Bdank Inmational Econoiiiics Departme_t Apnal995
357

United KingdomMast Some regioafricnnme growp
Iftest singte yar recantUnit of estimate /
Indicator mesure 1970.75 198-85 198193 IncomePriority Poverty Indicators
POVERTYUppcr poverty line local curr.Headcount index % of pop.
Lower poverty line local curr.Headcoun index % of pop.
GNP per capita USS 4.260 1,180 18,060 23.680SHORT TERM INCOME INDICATORSUnskilled urban wages local cutr.Unskilled rurn wagesRural terms of tradeConsumer price index 1987=100 34 93 139.Lower incomrnFood' 18 94 129
UrbanRural
SOCIAL INDICATORSPublic expenditure on basic social services %ofGDPGross enrollmnent ratiosPrimary % school age pop. 105 104 104 103
Male * 105 l04 104 103Fcmale ' 106 105 105 103
MortalityInfant mortality per thou. live births 17.0 1 1.0 6.8 7.0Under 5 mortality .. .. 8.0 8.5
IbnmunizationMeasles % age group .. 60.0 59.0 82.5D>PT " .. 44.0 85.0 90.2
Child malnutrition (under-5)Life expecancy
Total yas 72 74 76 77Female advantage ' 6.2 6.2 5.1 6.4
Total fertility rate births per woman 2.0 1.8 1.8 1.7Maternal mortality rate pcr 100.000 live births .. 7
Supplementary Poverty IndicatorsExpendirss on social security % of total gov't exp.Social security coverage 56 econ. active pop.Access to safe water total % of pop. .. 100. 99.6
Urban N .. 100.0 99.5Rural N .. 100.0 100.0
Access to healthcore 1c . 100.0
Population gowthi rate GNP per capita growth rate Development diamondt6i (annual average percent) (annual average. percent) Life expc
4 5
_ _ _ _ _ _ _ _ _ _ _ _ _ _ _ _ _ _ _ _ _ _ GN P G ros
pe r pnmary
capita enrolment
O ..I I. ,I S- . 5 t
-2 -101970-75 1980-85 191893 1970-75 1980-85 1988-93 Access to safe water
2 United Kingdom United KingdomHigh-income High-income
L See the technical notes. p.387. b- The development diamond, based on four key indicators, shows the avemage level of development in the countrycompared with its income group. See the introduction.
358

United KingdomMast Sume rql.onflncame group
_ a_at ___ 1___y9F recentUni. of aetimate High-
Indicator _fmeasrmm 197075 198&-8S 19184-3 income
Resources and ExpendituresHUMAN RESOURCESPepulation (ntre=1993) thousands 56,226 56,618 57,918 812,447Age dependency ratlo ratio 0.59 0.52 0.54 0.49Urban % of pop. 88.7 88.8 89.3 77.9Population growth rate annual % 0.2 0.1 0.3 0.6
Urban 0.3 0.1 0.4 0,8Labor rorwe (1564) thousands 25.991 27.432 27,821 395,641Agriculturc lb of Iabor force 3 3Industry 42 38Female - 37 39 39 3BFemales per 100 males
Urban numberRural
NATURAL RESOURCESArea thou. sq. km 244.88 244.88 244.88 32,146.15Density pop. persq. km 229.61 231.21 235.82 25.11Agricultural land Wi of land aea 76.84 75.20 73.34 42.80Change in agricultural land annual % -0.30 -0.19 -0.26 -0.48Agricultural land under irrigation % 0.46 0.84 0.61 13.96Fbrests and woodland thou. sq. km .. 0.02 0.02 10.56Deforestation (net) annual Wi .. .. -1.08INCOMEHousehold incomeShare of top 20% ofhouseholds % of inconecShare of bottom 40% of householdsSham of bottom 20% of households
EXPENDrUREFeod % of GDP 11.2 8.5 7.1 8BA
Staples 2.1 1.6 1.4 1.6Meat, fish, milk, cheese, cggs 5.3 3.9 3.2 3.8
Cereal imports thou. metric tonnes 7.853 3.521 3,534 77.530Food aid in cereals .- .. .. 8Foodproductionpercapita 1987=100 82 101 92 95Fertilizer consumption kglha 97.9 138.9 119.3 150.0Shae of agriculture in GDP % of GDP 2A 1.7 1.6Housing % of GDP 11.8 12.5 12.0 11.7Avemge houschold size persons per household 2.9 2.8
UrbanFixed investrnent: housing % of GDP 4.1 3.5 3.8 5.0Fuel and power % of GDP 2.8 3.2 2.2 2.0Ener consumption per capita kg of oil equiv. 3,591 3,586 3,718 5.203Households with electicity
Urban % of householdsRural
Transportandconmunicaten % ofGDP 8.1 10.1 10.8 8.Faxed investrnent: transport equipment 2.8 2.6 2.1 2.1Total road length thou. km 346 347 357
INVESTMENT IN HUMAN CAPITALHealthPopulation per physician persons 809 613 .. 453Populationapernutse - 242 120Population perhospitl bed - 10S 107 160 145Ora rehydyadon therapy (under-5) % of casesEduationGross enrollment ratioSecondary % of school-age pop. 83 84 86 92Fenale 83 86 88 94
Pupil-teacher ratio: primary pupils per teacher 21Pupil-teacherratio:secondary 16 14 13Pupils reaching grade 4 % of cohortRepeater rabu primary % of total enroll .. .. .llileray % of pop. (age 15+) *- - tFemale % of fem. (age IS+) .. .. t
News per circuladon thou. . 386 397 383 320world a2111C nteniatmi bwnotates Ixpmuner, kApa 95
359

United StatesMorg Sam. rcaio megrerp
Unk~ ~ vAtIaI par nreale Ygunit of udfmul. Higih-inamor m sWe _1970.75 19JO-JS 1988593 income
Priority Poverty IndicatorsPOVERTYUpper poverty line local curr.Headcount index Si of pop.
Lower poveRty line local curr.Headcount index % of pop.
ONP per capita USS 8.070 16,270 24.740 23.680
SHORT TERM INCOME INDICATORSUnskilled urban wages loed curr.Unskilled rural waes"Rural terns of tradeConsumerpriccindex 1987=100 47 95 127Lower income
Urban "35 93 125
RuralSOCIAL INDICATORSPublic expenditm on basic social services 5, of GDPGross enrollment ratiosPiimay % schoolagepop. 99 99 104 103Male 9.. n 104 103Female .. 100 103 103
MorlityInfwit mortatity per thou. live births 18.0 11.0 8.6 7.0Under 5 mortality .. 10.0 8.5
ImmunizadonMeasles % ae group .. 96.0 98.0 82.5DPT .. 37.0 97.0 90.2
Child nalnutrition (under-5)Life expecimayTotal yers 71 75 76 77Female advantage 7.8 7A 6.8 6.4
Total fertlity rate births per woman 2.0 1.8 2.1 1.7Matenal mortality rae per 10D.000 live birts .. 9
SupplementaMr Poverty IndicatorsExpendiures on social socurity 96 of total gov't exp. 30.6 24.1 22.5 .Social security coverage % eon active pop.Access to safe water. total * of pop. .. 100.0
Urban .. 100.0Rural .. 100.0
Access to health came .. 100.0 .. ..
Population growth rate GNP per capita growth rate Deveopment diamondb(anwal avemrge prcent) (annua averae pcent)ei
4 5
2 0 O -1 GNP Gmrss
~~~~ r-z-i ~~~~~~~~~~~~~~~~~capita eturoDment0 . ~~~~~~~~~-5
-2 -It)1970-75 1980-85 1988-93 197D-75 1980-85 198-933 AccessDosafewater
r United States United States- High-income High-income
a. See de technical notes. p.387. b. The development diamond. based on four key indicatr shows the av lemld of development in dte countrycompred with its income group. See dte intducion.
360

TTuited StatesMort Same reglonflncome group
LUIt sigleyeer recentlinkl of eusimate lish
indiator meaure 1970.75 1980-85 J908-93 Income
Resources and ExpendituresHUMAN RESOURCESPopulatIon (mre1993) thousands 215,972 238,466 257,36 812,447Age dependency ratlo ratio 0.55 0.51 0.53 0.49Urban % or pop. 73.7 74.5 75.8 77.9Populadon gmwth mra annual % 1.0 0.9 1.0 0.6Urban * 1.1 1.1 1.3 0.8
Labor force (15-64) thousands 97,852 116.B00 124,B00 395.641Agriculture %oflabor force 4 3Industry p 32 3 1Female 39 42 41 38Females per 100 malesUrban number 107 105Rural m 101 99
NATURAL RESOURCESArea thou. sq. km 9.W09A3 9.809.43 9,809.43 32. 146.15Density pop. pcr sq. kn 22.02 24.31 26.01 25.11Agriculturl land % of land arena 44.93 45.06 44.60 42.80Change in agriculturl land annual % 0.00 0.00 0.00 -OA8Agricultural Iand under irrigation % 3.83 4.60 4.75 13.96Forests and woodland thou. sq. km .. 2.99 2.96 10.56Deforstation (net) annual % .. .. 0.11INCOMEHousehold incomeShare of top 20% of households % of income 43Shamcofbotom40% of households * ISSham of bottom 20* of houseiolds 5
EXPENDrUREFood % of GDP 9.2 6.8 6.8 8.4Staples IA 1.2 1.1 1.6Met, rish, milk, cheese, eggs p 3.8 3.2 2.9 3.8
Cereal impons thou, metric tonnes 401 1,001 4,694 77,530Food aid in cereals 8Foodproductionpereapita 1987= 100 100 111 96 95Fertilizer consumplion k/ha 44.0 41.3 44.5 150.0Share of agriculture in GDP %bofGDP 3.3 2.1Housing *of GDP 12.6 12.7 13.0 11.7Average houseld size persons per household 3.1 2.7Urban 3.1
Fixed investnent housing * of GDP 3.3 4.1 4.3 5.0Fuel and power % of GDP 2.6 2.6 2.3 2.0Energy consumption per capita kg of oil equiv. 7.625 7,430 7,918 5,203Households with electricityUrban S of householdsRural
Transprl and con%lcaliou S of GDP 9.6 10.0 9.8 8.8Fixed investment transport equipment 1.7 2.3 1.6 2.1Total mad length tiou. km 6,206 6.242 6.243
INVESTMENT IN HUMAN CAPITALHealthPopulation per physicia persons 634 471 419 453Populanon per nurse ' 158 74Population per hospital bed - 127 171 194 145Oral rehydyation thrapy (under-5) o of casesEducationGross enrollment ratioSecondary % of school-age pop. 97 90 92Fcmale . 97 90 94
Pupil-eacher ratio: primazy pupils per teacher 17 20Pupil-teacier atio: secondary p 14 13Pupils reaching grade 4 % of eohort 95 93Repeater rami pimary % of total enrollIlliteracy * of pop. (age IS+) tFemale % of fenL (age lS+) t
n!!~~= cimfladon pr thouL p. 283 263 238 320Wodd BMK ln=afional Economics __PA_UUCfft. Aprfi IY9S
361

UruguayMeat Same reglnfiaemerouu Next
Ldet et cIicyear raCer ut i7sA Jpiw. AlgArUni of estimate America mUtte Iueneom
lukater ,.a., 1978-75 1ff) -85 19JJ-PS Cart)bea tIcome prowlPriorit,y Poverty Indicaters
POVfIIlTTUpper povsy line local culrn .. .. .. .. ..
Ileadeount index % of pop. .. ........Loew r poverty line local' curn .. ..,.. ..
Hleadcount Index 96 of pop. .. ........
CiP per capit USS I .410 1.500 3,930 2.930 4,350 23,690SHORT TERMl INCOME UINDICATORSUnskiled saban wages local curn. ... .. .. .. .Unskilled rural wages. . ....Rurlce'is clduades .. .. ..Consumer price index 1997.100 1 35 3,261 , ..Lower Income*..t... Food' .. .. ..
Urban " .. 33 2,325 . ..Rival * .. .. ..
SOCIL INDICATORSPubllc expen llture on basi socDia servAice S 1orCDP .. ..... *--dross enrollment redo.Primary * school age pop. 107 107 l0B 107 1OS 103
Mdec 107 107 10W .. .. 103Fsamde " 106 106 107 .. .. 103
MortlityInternt moaity per tou. live births 46.0 33.0 19A4 43.0 35.8 7.0Under S mortality ., .. 21.0 52.2 42.6 8.5
InmnnnhadonMimIcs S age group .. 17.0 92.0 73.7 B2.0 32.5DPI .. 57.0 33.0 73.7 74.2 90.2
Child malnutrition (under-5)*.........Life expectac
Totali years 69 71 72 69 69 77Female advantage 6.6 6.5 6A4 5.3 5.9 6A
Totalftility rate births per women 3.0 2.6 2.3 3.1 2.9 1.7rireplmnlityrate per 100.000 live births .. S6 36 . ..
Supplementar Povrerty IndicatorsExpenditures on social security * of total gov't exp. 43.9 42.0......Social security coverage * aeon, active pop. .. .. . ...Acceasstosafe wattotal %of pop. 93.0 84. .. 80.0 96.7 .
Urban 3 100.0 95.0 .. 90.1 93.9 .Rural 9 7.0 27.0 .. 57.6 6G.7 .
A ccess to huallh care _ _ _ _..__ _..__ _..__ _..__ _..__ _.._
Population growth rate GNP per capita growth rate Devrelopmneat dianlondb4 (usualavnue. eperenat) (annual average. percent) life expcay
2 O 0 CI XIGP Gross
0' l capita -SX
1970-75 1980-8S 1998-93 1970-75 1980-95 1989-93 Acesto safe water
WD Urlguay _ Uruguay-Upper-middle-income - Upper-middleincomhe
a. See due techical notes. p.387. b. The develpment diamond, balsed on four key indicato shows the average level of development in flue coutycompared with its income group. Sec the intrdcin.
362

UruguayNest Iii. rqloas taroma g,rmp Ned
Laks: "c .#frzfeLati ,a emUpji MhurUnt of uN.C America .1146. hnem.
Indicaor measure 197(145 1981)4 1988.93 Carl, baa Income lgropResource and Expenditures
HEUMAN RESOURCESPopulation (snreulSP3) thousamds 2Z829 3.008 3,149 466,30 500,507 832,447Age dependency ratio railo 0.60 0.61 0.59 0.66 0.62 0.49Urban % of pop. 83.1 87.2 89.7 71.2 712 77.9Population growth rat. annual 1' 0.2 Oh6 0.6 2.0 1.7 Oh
Urban 0.4 1.1 0.9 1.9 1.9 0.8Labor foree(15-M6) thousqands 1.106 1,171 3,252 169.839 190,136 395,641Agriculture %i or labor rorce 1 7 1 6Indus" 29 29Female 28 30 32 27 29 38Females. per 100] nices
Urban number 112 .
Rural 70 .
NATURAL RESOURCESArea thou. sq. km 177A41 177AI 177A41 20,505.92 11,8411.14 32,146.15Density pop. per sq. km 15.95 16.96 17.65 2.9 22.51 25.11Aguicum.ural land % of land ama 86.19 35.13 34.180 40.00 4126 42.80)Change in agricultural land annual ¶% 0.03 -0.22 0.00 0.39 0.08 -0.48Agricultumal loud under inigatin Wi 0.38 0.65 0.94 3.41 8.84 13.96Foresus and woodland thou. sq. km .. 0.01 0.01 9.817 8.04 10.56Deforestation (net) mnual Wi ..- 0.65INCOMEHousehold incomeShameof top 20% of househuolds Wiof incont. 46 48Shamtof bottom 40% of householcks. 1 6 isSham of bottom20% of households .. 6 6
EXPENDITUREFood % uf GDP 25.6 24A4 ... A8
Staples 5.5 5.3 ft. .1.6
Meat, fish, milk, cheese, eggs I0DA 9.9 .... 3.8Cereal imports thou. mezic twines 4 30 110 27.700 48.947 77,530Food aid inacae-ls 6 7 20 1,565 544 8FoDd production per capita 1987=100 109 107 lii 101 102 95Fertilizer consumption kglha 3.2 4.0 5.4 16.1 67.8 150.0Shamc of agneultumc in GDP Wi of GDP 15.2 13.6 9.0 9.0 8.0Housing %ofGDP 8.8 8.4 . .. 11.7Average household size pets ins per household 3.4 -
Urban 3.4 .
Fixed investmet housing Wi of GDP 3.1 5.2 ... 5.0Fuel mnd power WiofGDP 3SA 3.1 - ... 2.0Energ consumption per capita kg of oil equiv. 736 505 715 913 1,632 5.203Households wiith electricityUjrban S Of households .
RuralTransport and canm unleaton % of GDP 7.8 6.8 gi . .Fixed investment- transor equipment I 0 1.0 - ... 2.1Tori mad length thou. km 25 52 53
INVESTMEfNT EINHMAN C %PITAL.HealthPopulation per physician Permon 900 513 - ... 453Population per nurse 2i3i517 9 4Fopulationperhopital be 082157 9 4Oral rchydyration therpy (.nder-5) S or cus ..- 0 61 51EducationGross enrollment ratioSecondary % of school-age pop. 60 72 84 47 53 92Female 64 62 - ... 94
Pupil-macher ratio: pimnazy pupils per.eadher 20 25 21 26 25Pupil-teacher rato: secondaryPupilireaching grde 4 Sofcobort 96 96 98 ...-
RepeaternrL. prinary Of towalenroll 14 ii 9.-.Iliteracy % ofpop. (agrcl5t) 6 5 4 is 14Female %.of fm (BPe 1St) - 5 4 18 17
N r= r ciseulation per thou. pop 225 226 240 85 125 320WdBaKInternationa1 EcnMWcs DeparMent Aput 1995
363

UzbekistanMaost Sme reginlincoegroup Next
Latest sIngle year rcent aen. La iWW7 higherUnk of -. s,iate d Ceuntral middle- Income
Indkcator measure 1970-75 19J085 1980-93 Asia income group
Priority Poverty Indicators
POVERTYUpper poveny line local cur, .. ..
Headcount index I' of pop. .. ..
Lower poverty line local curr. .. ..
Headcount Index % or pop. .. ..
NPpercaplita USS *- .- 970 2.450 1,590 4,350
SHORT TERM INCOME INDICATORSUnskilled urban wages local cw. .. ..cUnrskilled rural wages *Rural tenms of trade .. *
Consumer price index 1987=100 .. ..
Lowcr imomeFood '
UrbanRural
SOCIAL INDICATORSPublic expendilure on basic social services % of GDP .. .. 8.0Grass enrollment ratiosPrimauy To scbool age pop. .. .. .. .. 104 105
Male .Female
MortalityInfant mortality per thou. live births 63.0 50.0 40A 24.8 39.0 35.8Under 5 mortality .. .. 66.0 36.4 61.5 4Z.6
InmnunizationMea.les % age group .. .. .. .. 77.6 82.0Dr .. .. .. .. 82.2 74.2
Child malnutrition (under-5)Ufe expectancyTotal yesa 64 66 69 69 67 69Female advantage 6. 6.1 6.1 8.8 5.9 5.9
Total fertility rate births per woman 6.0 4.7 3.1 2.1 2.9 2.9Matemal mortality rat per 100,000 live births .. 46 43
Supplementary Povertyl IndicatorsExpenditures on social security % of totll gov't exp. .. ..
Social security coverge % econ. ctive pop. .. ..
Access to safc water total % of pop. .. .. .. .. .. 86.7Urban 93.. .. .. .. .. 9Rural 66.. .. .. .. . 6.7
Access to health camn _ _.._.._.._.._.._..
Population growth rate GNP per capita growth rate Development diamond'b
6+- - (annual avemge pcem) (m. avenge. percent) Lifipexy
4 5
2 1 5 1 r ;, m 51l ~~~~~ ~~~~~~~~~~~~~~ ~GNP GW
2 p~~~~~~~~~~~~~~~~~~~cr np
o -s ~~~~~~~~~~~~~~~~~~~~~~~~capita enrollment
-2 -10- 1970-75 1910-85 1988-93 1970-75 1980-85 198-93 Acce to saf water
E Uzbeldstan - Uzbeist- Lwr-middle-incorn- Lower-widle-income
a See the technical nos. p.387. b. The development diamond, based on four key indicatos shows the averag level of development in the countrycompared with its inme group. See the introduction.
364

UzbekistanMost as aw,nifonflnceiua gresv Nant
LeaIngiralhyear Meeng tiaup ewer. higherUnfit of ealirae &r CalW middle. lace,..
IndIca1fr ueeaan 1970-715 195945 J98543 Asia income groupResources and Expenditures
HUMAN RESOURCESPopulatien (aurem1[993) thousands 13,931 19.112 21.860 494,619 1.096,665 500.507Age dependceny ratio ratio 0.96 0.81I 0.30 0.57 0.69 0.62Urban % of pop. 39.1 40.7 41.0 64.13 54.7 71.2Population growth rate annual % 3.1 2.6 2.3 0.6 1.6 i1.7
Urban 4.3 2.5 2.7 1.5 2.9 1.8Labor force (1544) thousads .. 6.619 8.285 237,897 459.196 190.136Agricultume % or labor rorce ,.38 43Industry .. 23 2 1Feon K..c.. 47 3 1 29Fenmlcs per I100 males
Urban nuntber...Rural
NATURAL RESURCESAreu thou. sq. km. 447A0 447.40 447.40 24,320.56 40.682.67 21,348.14Density pop. per sq. km 31.25 40.43 47.74 20.20 26.52 22.51Agricultural land lb orland arta ...... 39.61 41.26Change in agricultural land annual % . 0.26 0.05 -1.28 -0.13 0.03Agricultuml land tinder irrigation qhI 1.01 13.99 15.29 7.15 12.66 8.94P~brests and woodland thou. sq. km ... . 0.80 5.95 8.04Deforestation (net) annual%...INCOMEHousehold incomecShare of top 20% of households % of incomx. .c-
shar or bottom 40% of honueholdsShare of bottom 20% of households
Food %ofGDP...Staplt.s Mcal. fish, milk. cheese. eggs
Cereal imports thou. metric tonnes ... 4,151 34,452 66,281 48.947F,aod aid in cereals ... . 4,392 5,477 544Food production perrapita 1987=100 . .... 101 102Fertilizer consumption kgIa... 27.4 41.7 48.0 67.8Sham ofagricuhtumin GDP % ofGDP .. 28.0 23.0 13.5 15.7 8.0Housing % ofGDP ... 4.7 6.0Average household size persoas pe household .........-
urbanFixed investment: housing S Of GD? . 4.9 5.2Fuel and power % ofOD .. . 1.0 1.2Energy consumption per capita kg of oil equiv. ... 2,033 2.959 1.595 1.632Households with electricity
Urban % of households . ..
Rural Transport and commaunkcatlon S6 of GD?P.. .--
Fixed investmenc transport equipment Total road length thou. km 52 80 78 -
INVESTMENT IN HUMAN CAPITALHealthPopulation per physician persons 395 293 281 362 3,277Population per nurse -129 103 86 249Population per hospital bed K96 91 105 136 604 395Oral rehydyration therapy (under-5) % of cases .- ... . .S
EducationGross enrollmecnt ratioSecondary % of school-age pop. ...... 53 53
Fe~malePupil-teachr ratio: primary pupils per teachr 25. . ..
Pupil-teacher ratio: secondaryPupils reaching grade 4 % of cohort ....-
Repeater rate. primary % of total enrolMmatecy % of pop. agecIS+) ... 914"Female S of ran. (age 15..) ... 17
News= ciculahtion i Ua . ..- .. 74 125worl n iejnmuab as Deatet. p 10
365

VanuatuMost Same reuoon/Iaeeme group Next
Latest single year recent LowerW higlarUn it of climate Reas middle- Sncatn
Indicator measure 1970-75 195045 1Y98&93 AsIa Income group
Priority Poverty Indicators
POVERTYUpper poverty line local Ctifr. .. ..
lieadcount index % of pop. . 2 .. ..
Lower poverty line local cu. .. ...
Headwunt index % of pop. .. .. .. 9GNP per capita USS .. 920 1,230 820 1,590 4,350
SHORT TKRM INCOME INDICATORSUnskilled urban wagos local curr .. ..
Unskilled rural wages .. ..
Rural taint of trade
Consumerpriceindex 1987=100 .. 82 141Lower incomeFood" .. .. ..
Urban *Rural
SOCLVL INDICATORSPublic expenditure on basic social services S ofGDP .. ..
Gross enrollment ratiosPdimay %school age pop. .. .. 94 i18 104 105Male 1 .. .. .. 123Femnle .. .. .. 115
MortaityInfant mortaity per thou. live births 99.0 70.0 45.2 35.5 39.0 35.8UnderS mortality .. .. .. 60.5 615 42.6
ImmunizationMeasles S age group .. 25.0 46.0 93.0 77.6 82.0DpI .. 28.0 61.0 95.0 82.2 74.2
Child malnuitrition (under-5) .. 19.7 .. 24.1Ufe expectancyTotal yars 54 60 66 68 67 69Femtde advaagenr 3.3 3.7 3.8 3.6 5.9 5.9
Total fetility rte births per woman 6.5 5.3 4.6 2.3 2.9 2.9Matrnal mortality rate per 100,000 live birds .. . .. 116 - -
Supplementary Poverty IndicatorsExpenditums on social security 9 of total govt t cxp. .. 1.1 0.0Social security coveage % econ. active pop. .. ..
Accss to safe watr totl % of pop. .. .. 70.7 67.1 _ 86.7Urbam .. 100. 100.0 83.5 .. 93.9Rural - .. 54.0 64.0 61.3 .. 66.7
Access to health care .. 80.0 80.0
Population growth rate GNP per capita growth rate Development diamonde
6 - ( uena l average. pcent) 10+ (anal average. percent) lifT c =peacy
4 5
2 0- ~~~~~~~~~~~~~~~~~~~~~~~~~GNPW GMossper I -.$ Gcapita \ olaet
-2 -10r.t dewt19'O-75 1910-85 1991-93 1970-75 1980-85 1988-93
7 Vanuatu _ Vaunt- Lower-middle-incomne lower-m iddle-income
fiSee thetechnical os p.387. b. Te dveldopment diamond, basce on four key indicaos, shows the aveag level of development in the countrycompard with its incwm grup. See the intoduction.
366

VanuatuMost Sane reglon/income groujp Next
Latert single year recent 2-LIwir- higherUNi IIOf e als tate East middle- Incomel
Indicator measure 1970-75 1980-5 1988-13 Asla Income groupResources and Expenditures
HUMAN RESOURCESPopulation (mrec1993) thousands 102 132 161 1.713,383 1.096,665 500,507Age dependency ratio ratio 0.91 0.90 0.91 0.54 0.69 0.62Urban %orpop. 15.7 18.2 19.0 31.3 54.7 71.2Population growth rate annual '1 3.2 2,4 2.7 1.4 2.6 1.7
Urhan 6.6 2.7 3.6 4.0 2.9 1.8Labor force (15.64) thousands .... 94'2.977 459.196 190,136Agrculture % of labor forme...IndustryFemale .,. .41 31 29Females per 100 males
Urban number...Rumal
NATURAL RESOURCE?SArea ihou. sq. km- 12.19 12.19 12.29 16,367.91 40,632.67 22.848214Density pop. per sq. km 8.37 10.13 12.85 103.27 26.52 22.51Agricultural land % of land.nuca 10.34 13.95 13.86 44.21 39.61 41.26Change in agricultural land annual 91 5.00 0.00 0.00 0.24 -0.13 0.08Agricultunml land under irrigation %l 1.. . 4.68 12.66 8.14Forests and woodland thou. sq. km .. 0.01 0.01 4.06 5.95 8.04Defoestaatun (net) annual 91... 0.00INCOMEHousehold inicomeShore of top 20% of households 91 of income ..
Shoam of bottom 40% of households...Sham of bottom 20% of households...
EXPENDrrUItEFood % orGDP...
StaplesMeam dish, milk, cheese, eggs
Cereal imports thou. me-tric to-ns 6 1 1 10 30,036 66,281I 48.947Food aid in cereals -... 0 .447 5,477 544Food production per eapita 1987=I100 93 99 SI1 115 101 102Fertilizer consumption kg/ln .... 76.4 48.0 67.8Share of agriculture in UDP 91of GDP .. 29.5 20.0 17.1 15.7 8.0Hawsing %a f GDP...Average household size persons per household . .. .-
UrbanFixed investment housing 1of GDP...Fuel andipower %ofGDP...Energy consumption per capita kg of oil equiv. 353 295" 280 632 1.595 1.632Households with electricity
Uhrban 91 or' ouseholds...Rural...
Transport and conmtmictlaion 'bof GDP...Faxed investment transport equipment .-
Total mad length thou. kcm...
INVESTMENT IN HUMAN CAPITALHealthPopulaton per physician persons 3,480 5,448 8,080 1,063 3,277Population per nufse 294 472 .. 1.490Population per hospital bed -98 165 .. 612 604 395Oral rehydyration therapy (under-5) 91 Of caWse... 66 32 .. SEducationGross enrollment ratioSecondary 91of school-age pop. ... 17 53 53 53
Female U .. .47
Pupil-teacher ratio: primary pupils per teacher 24 21 3 1 23 .. 25Pupil-teacher ratio: secondary -15 15 19 16Pupilsreachng gradce4 % ofoDhort 83 85 .. 92Repeateraw priaray % or toraenroll ....
Mlitemey %of pop. (age 15+) ... 30 22 1 9 14Female % of fkna (age 15+) ... .36 .. 17
New M ccon perthou. poM. .. . 74 125wonaban miniaionl EonoicsDepartment. Apri Y9~5
367

VenezuelaMeos Same ragionfibcmem grfoup Nerxi
WiLstsingle ar rent h1 h ipae IgherUNit of eliwiale Amerka mddl- income
hndicaor m_uaro 197-75 191045 J189593 Caribbean Ineeme RjOUp
Priority Poverty IndicatorsPOVERTYUpper poverty line local curr. ..Headcount Index % of pop. .. 24 31
Lower povetly line local car.Headcount index % of pop. .l 22
GNP per capita USS 2.590 3,750 2,840 2,930 4,350 23,680
SHORT TERM INCOME INDICATORSUnsldlcd urban wages local curr. ..Unslled rural wages .Rural teffs of tradeConsumter price index 1987.100 24 70 818
Lower incomeFOOda 10.
UrbanRural
SOCIAL DIDICATORSPublic expendiure on basic socia services % of GDP .. 7.8 7.5Gross enrollment raiosPrinmy S schod age pop. 97 108 99 107 105 103Male 97 109 98 .. .. 103Female * 97 108 100 .. .. 103
MortalityInfant mortality per thou. live births 49.0 34.0 22.6 43.0 35.8 7.0Under 5 moriy .. .. 24.0 52.2 42.6 8.5
ImmunizationMeasles % age group .. 25.0 54.0 78.7 82.0 82.5DPT .. 27.0 54.0 73.7 74.2 90.2
Child nalnutriton (under-5) 0.. 1.2 5.9Wfe expectanyTotal years 66 69 72 69 69 77Femal advantg 5.6 5.9 5.8 5.3 5.9 6.4
Total fertility rate birtis per woman 4.9 4.0 3.2 3.1 2.9 1.7Matenal montlity rate per 100,000 hve births .. 65 200
Supplementary Poverty IndicatorsExpenditures on social sectudy % of tol goVt cxp. .. 5.7Socia security covapge econ. active pop. .. ..
Acoess to safe waier 1to * of pop. 75.0 84.8 89.3 90.0 86.7Urban 92.0 81.0 89.4 90.1 93.9Rual * 38.0 65.0 88.8 57.6 66.7
Accs to heald care _ _.._.._.._.._.._..
Population growth rate GNP per capita growth rate Development diamondh6 (annual average, peroent) 10.(nal avcrage. pcamt) Life expectiacy
4S
2 f 1 GNP Gross
capita e~~~~nroden
1970-75 198045 1981-93 1970-75 1910-85 1983-93 Accesstosate wer
O] Venezuela .inVeeczuela- Upper-middle-income - Upper-middle-income
a. See the tdmical noie p.387. b. ME develop_mt diamon based on four key indicators, shows the aveag levd of development in the countrycompacd With its income group. SeC the introduction.
368

VenezuelaUMo J%nte mreionneenaoeg'roap Net:
WIet single yer recent 2i1f 7J,pjiit-, higherunit of animate America middle- incomet
Indicato. measure 1979.75 195J8S 1ma-n3 Caribbean inicome group
Resources and ExpendituresHUMAN RESOURCESPopulation (mrauIP"3) thoumends 12,734 17,138 20.913 466.304 500,507 512,447Age dependency ratio mdc 0.87 0.74 0.69 0.66 0.62 0.49Urban 't'orpop. 77.8 87.3 91.5 71.2 71.2 77.9Population growth rate annual 'S 3.4 2.5 2.5 2.0 1.7 0.6
Urban 4.8 3.5 3.0 1.9 1.8 0.8lAbor farce (15.64) thousands 3,909 5,1171 7,490 169.839 190,136 395,641Agriculture % or labor force 2 1 1 6 Industry 27 28 .
Female 23 27 28 27 29 38Femnics per IOU males
Urban nujmber .. 103 .
Rural .. 87 ,
NATURAL RESOURCESArm thou. sq. an 912.05 912.05 912.05 20,505.92 21,848.14 32,146.15Density pop. per sq. km 13.96 18.79 22.37 22.29 22.51 25.11Agricultural land 'S or land atmn 23.08 24.06 24.62 40.00 41.26 42.90Change in agricultural land annual 'S 0.28 0.29 0.28 0.39 0.08 -0.48Agricultural land under irrigation 'S 0.44 0.8 1 0.87 341 8.84 13.96Forests and woodland thou. sq. km .. 0.52 0.46 9.87 8.04 10.56De-forestaton (net) annual 'S... 1.22INCOMEHousehold income
Shame of top 20% or households 'S or income 54 so 5Shazcvof bouom 40i%ofhouseholds 10 .. 14Shrc of boutom20% of households *3 .. 5
EXPENDITUREFood 'SorODP 19.2 26.0 ... . 4
Staples .. 4.3 ... .1.6
Mmi.L fish. mailk, cheese, eggs .. 4.9 ... .3.8
Cerea imports thou, metric tonries 1,299 2,795 2.314 27,700 48.947 77,530Food aid in cereals ... . 1,565 544 8Food production per capita 1987=100 106 99 105 10! 102 95Fertilizer consumption kgflh 6.9 22.5 15.8 16.1 67.8 150.0Share of agriculture in GDP 'S of GDP 5.0 5.8 5.0 9.0 8.0Housing % or'GDP 4.0 5.2. .. 11.7Average household size persns per household 6.0 5SA.
Urban .. 5.4 .
Fixed investment: housing %orGDP 5.9 1.9 ... .5.0
Fuel and power 'Sor oDP . .. . 2.0Energy consumption per capita kg of oil equiv. Z.225 2,)164 2.369 913 1.632 5,203Hauseholds with electricity
Urban 'S of households . ..
Transport and cotumumlcation S or GDP 6.1 6.7 ... .8.8
Fixed investmenctt transponi equipmecnt U3.1 2.8 ... .2.1
Total road length thou. km 62 63 78
INVESTMENT IN HUMAN CAPITALHealthPopulaton per physician persons 1,106 836 639 ... 453Population per nurse 447 314 332Population per hospital bed 3,016 371 388 517 395 145Oral rchydymaton therapy (under-5) 'S of cases ..- s0 6 1 51EducationGros emfnrolnt ratioSecondary % of school-age pop. 43 45 34 47 53 92Female 45 50 40 ... 94
Pupil-teacher ratio: primary pupils per teacher 30 33 23 26 25Pupil-teache-r ratio: secondary .120...Pupils reaching gmde 4 % Of cohort 72 83 92Repeater rat: primary 'S of total enroll 3 7 8Illitery %Sof pop. (age 15+) 24 14 7 i5 14
Female % of fer. (age 15+) .. 12 14 i8 17Newspaer ircuation pe hu o.84 258 296 95 125 320World Bank lnteniauonat Econoimcs Llepartment Apnll19YS
369

Viet NamMost Same regonincome group Next
latertsingloe lr r ent higherUnit of f estimlte East Low- income
Indicafor imuaSre 1_97097S J98eB.S 19N8-93 Asla income graup
Priority Poverty IndicatorsPOVERTYUpper poveny line local cur. ..
Hcadcounlindex % of pop. .. 12 19Lower poverty line local curr. .
Headcourl index % of pop. .. .. .. 9CNPpercapila US$ .. .. 170 820 380 1.590
SHORT TERM INCOME INDICATORSUnskilled urban wages local cur. ..
Unskillcd rural wagesRural tenns of trade .
Consumer pricc index 1987=100 .. ..
Lower incornc
Urban"Rural
SOCIAL INDICATORSPublic expcnditurc on basic social services % of GDP .. .. 7.9Gross enrollment ratiosPririy %schoolage pop. 119 102 108 118 108 104
MalC 125 105 101 123 116Femele 114 99 103 115 101
MortalityInfant mortality par thou. live births 106.0 63.0 41.0 35.5 63.1 39.0Under 5 mortlity .. .. 48.0 60.5 101.4 615
ImmunizationMeasles % age group .. 19.0 85.0 93.0 87.3 77.6DFI .. 42.0 83.0 95.0 89.9 82.2
Child malnutrition (under-5) 5 52.0 41.9 24.1 40.3Life expeclancyTotal years S0 59 65 68 62 67Femnae advantage 5.4 4.4 4.5 3.6 2.1 5.9
Total fcrtility rate birdh per woman 5.9 4.7 3.8 2.3 3.6 2.9Matcmal mortality rate per 100,000livebinhs .. 110 105 116
Supplementary Poverty IndicatorsExpenditures on social security % of total govt cxp. .. ..
Social security coverage % econ. ative pop. .. ..
Ac ssto safe water. totl % of pop. .. 452 50.2 67.1 67.0Urban .. 70.0 70.0 83.5 78.7Rural ° .. 39.0 33.0 61.3 62.0
Acess to health care .. 75.0 97.0
Population growth rate GNP per capita growth rate Development diamondb(amnual avaW. pecent) (annual average. percent) Life expectancy
4 -5
2 * 1l=i T F7 0 - __________ IGNP Gross
O- I l l l l l l l l -5- . Wper pvnnt
-2 -L-10 Acs Dgf a1970-75 195C I5 1981-93 1970-75 198D-85 1988-93 Ac kWZet
CD Viet Nam _ Viet Nam- Low-income - LoinoDme
a. See the tecducaI notesm p387. b. Thedevelopmnt dimond based on four key indats, sows the aage leve ordevropment in the countrycompared with its income group. See the introduction.
370

Viet NamMafot Same rwglonfincome group Next
Latetsnle m recent fhffhUnsUaf eatwd Ane ESW Low- income
indicator mSeagre 1970-75 198045 1988-93 Asia iucomne grourp
Resources and Expenditures
HUMAN RESOURCESPopuladion {mre=1993) IihousaRds 48,030 59,898 71.324 1.713,883 3,091.764 1,096,665Age dependency ratio railo 0.91 0.82 0.75 0.54 0.67 0.69Urban V. of(pop. 18.8 19.6 20A4 31.3 27.6 54,7Population growth rote annual V. 2.3 2.2 2.3 IA 1.9 1.6
Urban 2.9 2.6 3.2 4.0 3.9 2.9Labor force (15-64) thousands 22,326 28.755 35.701 942.977 1.442.452 4S9.196Agriculture V. of labor latce 72 67 .
Industry 9 1 2 Female 48 47 47 4 1 33 31Fenmales per 1OD nalcs
Urban nuniber . ..
RuralNATURAL RESOURCESArea thou. .iq. km 332.69 331.69 331.69 16,367.91 39,091.96 40,632.67Density pop. per esq. kcm 144.10 280.50 210.22 203.27 77.60 26.52Agricultural land %aofI[nd area 20.01 20.74 21.58 44.21 52.82 39.61Change in agricultural land annual V. 0.08 -2.32 4.06 0.24 0.03 -0.13Agricultural land under inigation V. 1536 26.22 26.48 14,68 18.0 12.66ForesLsmand woDdland thou. sq. km .. 0.10 0.06 4.06 7.15 5.95Djeforestation (net) annual V. ... .51INCOMEHousehold incomeShare of top 2D%of houschoiLds % o[incomne ... 44Share of bottom 40% of ho useholds ... 1 9Shame or bottom 20% of households ...
EXPENDITUREFood % OfGDP ... 19.8Staples... 3.6Meat, fish, nilt, cheese eggs . t.9
Cereal imports thou, metric tantes 1,050 426 289 30,036 34.420 66,281Food aid incereals 64 21 84 447 8.334 5,477Foodproduction percapita 1987 100 76 100 120 115 113 101Fertilizer consumption kg/ha 50.7 57.1 128.4 76A4 59.9 48.0Share ofnagriculture infGDP %ofGlDP ... 29.3 17.1 26.3 15.7Housing %ofGDP ... 4.7Average household size persons per household . ..
UrbanFixed investmient: housing V. of GDP -.. 4.9Fueladdpower %ofGDP ... 1.0Energy consumption per capita kg of oil equiv. 114 80 77 632 364 1.595Households with electricityUrban V. of households . ..
RuralTransport and communication V. of GlDP .. 62Fixed investme-nt: ranspon equipment N... 10.3-..Total road length thou. km . ..
INVESTAMEN IN HUMAN CAPITALHealthPopulation per physician personS 4.061 2,298 1.063 .. 3.277Population per nurse -4,306 1.245 402 1,490Ppoplation per hospital bed .. 71 263 612 1.016 604Oral rehydyratio therapy (under-5) V. of case . . 53 32 38EducationGross emnrlmet rdtioSecondary V. of swlool-age pop. 46 42 33 53 41 53
Female 45 40 .. 47 34PupA-teacher ratio: primary pupils per techJer .. 34 23 23Pupil-teacher ratio: secondary -27 A3 23 16 20DPupls reaching grade 4 % of cohont. 63 .. 92Repeater ratc primazy V. of total enroll. .. 6Illteacy V of pop. (age 15$ - 16 12 22 42 19FannIe % of fom (age IS+) .. 20 16 36 53
Nerr circulation pe thou. M. 9 8 . 74ied mnk hIuntmatnmal Econoinucs Departmnt,. Apol 199
371

Western SamoaMosl Same regio /income gro up Next
taint single year recent r.Wu- higherUnit of -. estiiaIe Easl middle- income
Ildicaior -- easure 1970.75 1780485 1988-93 Asia Income __grolep
Priority Poverty IndicatorsPOVERTYUpper poveny line local cuff. .. ..Hendcountindex % of pop. .. .. .. 12
Lnwer poverty linc local curr. .. ..Headcount indcx % of pop. 9
GNP per capita US$ .. .. 950 N20 1,590 4350SHORT TERM INCOME INDICATORSUnskilled urban wages local curr. .. .. .. ..Unskilled rural wagesrRural icrms or trade -
Consumer priic index 19B7=10D 25 90 145Lowcr incomeFood .. 91 120UrbanRural -
SOCIAL INDICATORSPublic cxpcndilure on basic social services % of GDP .. 2.8Gross enrollment ratiosPrimary % school agc pop. .. 136 118 104 105
Male 123Female .. .. .. 115
MortalityInfant mortality per thou. livc births . .. 35.5 39.0 35.8UnderS mortality - .. .. .. 60.5 61.5 42.6
ImmunizadonMeasles % age group .. 78.0 .. 93.0 77.6 82.0DPMT .. 84.0 .. 95.0 82.2 74.2
Child malnutrition (under-5) .. .. .. 24.1Lfie cxpcctancyTotal years .. 68 67 69Female advantage - .. .. .. 3.6 5.9 5.9
Total fertility rate births per woman .. .. .. 2.3 2.9 2.9Maternal mortality rate per 100,000 live births .. .. .. 116
Supplementary Poverty IndicatorsExpenditures on social security % of total gov't cip. .. ..
Social security coverage % econ. activc pop. .. ..
Accesstosafewater.total %ofpop. 43.0 .. 81.8 67.1 .. 86.7Urban - 86.0 75.0 100.0 83.5 .. 93.9Rumrl .. 67.0 76.9 61.3 .. 66.7
Access to bealthcam .. 100.0 100.0
Population growth rate GNP per capita growth rate Development diamondb6+-. (annual avceage, percent) (annual average. percnt) Lfe exp
4 5
* GNP Gross28 _ .. ._ 0 -1-- It l per primarI
or I 1 .. ~capita enrollment
-2 -to1970-75 1980-85 198-93 1970-75 1980-B5 1988493 Access to safe watcr
m Westem Samoa WeNYste Samoa- Lower-middle-income Lower-middle-income
a. See dhe techniad notes. p.387. b. The developmcnt diamond. based on four key indicators, shows the average level of development in the countrycompared with its income group. See the introduction.
372
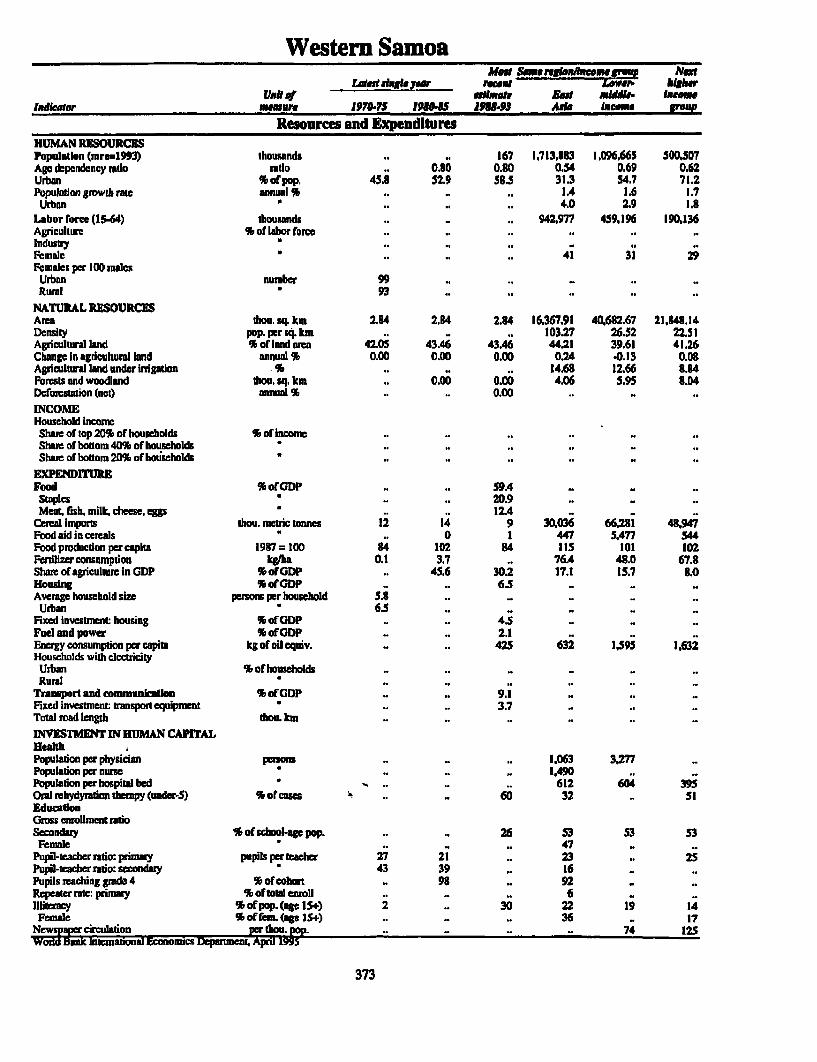
Western Samoa__ a___ _____r _____ "', iher
ViAhof irnflte Eras miNe. lucernludicator mmuere 1f07U5 itE11is JI9883 Axise luas gruu
Resources and ExpenditureHUMAN RESOURCESPopulation (nireul9P3) thousands 1.. 67 1,713,883 1,096,665 500,507Ago dependency mtio rato .. .80 0.80 0.54 0.69 0.62Urban % of pop, 45.9 52.9 59.5 31.3 54.7 71.2Populadiongrowth rmw oannu% ... . .4 1.6 1.7
Urban " .. . 4.0 2.9 1.8Labor force (15-64) thousands ... . 942,977 459.196 190,136Agricultuire 'I of labor force...Industry 3i ..
Fcmale i .. .4 32FemaWes per I3OD males
Urban number 99 .
Rural 393 .
NATURAL RESOURCESArea thou, sq. km 2.84 2.*4 2.84 16,367.93 40,682.67 21,848.14Density pop. per sq. km ... . 103.27 26.52 22.51Agricultural land % oflINndame 42.05 43.46 43.46 44.21 39.61 41.26Change In agricultural land annual % 0.00 0.00 0.00 0.24 .0.13 0.08Agricultural land under irrigation K, .... 14.68 12.66 8.94Formsts and woodland thou. sq. km .. 0.00 0.00 4.06 5.95 8.04Deforestation (net) annual 5 .. 0.00INCOMEHausehold incomecShare of top 20% of households % of incomen. .
ShaRe of bottom 40% of households3...Shaow of bottom 20% of hotisehelds f...
EXPENDITUREFood %orGDP ... S9A4staples 3... 20.9Meat, rAsh. milk, cheee, eggs S... 12.4
Cereal import thou. mectric tonnes 12 14 9 30.036 66I8 48,947~Ebod aid in cereas i..0 1 447 5.477 544Food producdon per capitiL 1987=100 34 102 84 115 101 102Pcrtilizerconsumdton kgflaa 0.1 3.7 .. 76A4 48.0 67.9Shar of agriclulmr in CDP %orGDP .. 416 30.2 17.1 15.7 9.0HoSdng %oCGDP ... 6.5Averag household size persn per househod 5.8 .
Urban -6.5 .
Fixed investment housing %V oGDP ... 4.5Feelaud power % ofGDP.. 2.1Energy conumption per capita kg of all equiv. ... 425 632 1,95 1,632Houswholds with clcctricityUrban % of househlxds...Rural ...
Transport and communlcatleu %ofOGDP ... 9.1Fixed investment irasport equipment 3* , 3.7Total road length thou m ..
INVETMENT IN HUMZAN CAPITALHealth Populadion per physician peron . . . 1.063 3,277Population per nuseim.... 1.490Population per hospital bed a'..... 612 604 395Oral rehydyration therapy (under-S) %orcases ... 60 32 .. IEducatlonGross enrollment rtiuoSecondary 5 of school-ag pop. ... 26 53 53 53FemaleI . .. 47 .
Pupil-teacher ratio: primary pupils per teachr 27 21 . 23 .. 2Pupil-teacher ratio: secondary 343 39 -16
Pupilsreadhing grde 4 %Of coben . 98 .. 92Repeatcratecprimay % Of tofaenrol .... 6llieracy % of pop- (MP IS+) 2 .. 30 22 19 14Female % of kn.(MP IS+) ... 36 .. 17
!t= circulationrthou.,-p . - .74..125
373

Republic of YemenMwi Same re*uAincme l PJexl
LsMreVin l ear rveeat MA ufJ higherUR& of ejrtIue I North Low- Ime
Indleatcr merilre JJ70-75 19U84IS 1M&P3 AIeN Incone graupPriority Poverty Indlcators
POVERTYUpper poveny line local curr. .. ..
Headcouint index %ofpop. .. .. 19Lower poverty liam local curr. .. ..Headcouni Index % of pop. .. ..
GNP per capita USS .. .. 520 1,980 380 1,590SHORT TERM INCOME INDICATORSUnskilled urban wages local curr. .. ..Unskilled naa wages *. ..Rural terms of trade ..
Consumer pricc index 1987=100 ..Lower income N
Urban .. ..Rural .
SOCIAL INDICATORSPublic expenditure on basic social services % of GDP .. ..Gross enrollmcnt ratiosPrimary %schoolagepop. 41 .. 76 97 108 104Male 63 .. 112 103 116FemJe* 17 .. 37 90 101
MoralityInfant mortlity per thou. live births 184.0 143.0 117,0 52.3 63.1 39.0Under 5 mortlity * .. .. 137.0 69.9 101.4 61.5
ImmunizationMeasles % age group .. .. 57.0 81.3 87.3 77.6DPT .. .. 62.0 84.0 89.9 82.2
Child malnutrition (undcr-5) .. .. 30.0 .. 40.3Lire expetncyTotal years 42 46 Si 66 62 67Female advanmae * .S 0.5 0.5 2.3 2.1 5.9
Total ferility rate birds per woman 7.6 7.6 7.5 4.7 3.6 2.9Maternal morality rate per 100,000 live birts .. 330
Supplementary Poverty IndicatorsExpenditures on social security % of total govt cxp. .. ..Social security covage % eon. active pop. .. ..
Access tosafe water total % of pop. .. .. .. 83.5 67.0Urban N .. .. .. 98.7 78.7Rural 69.0 62.0
Acss to health c .. 16.0 .. 87.4
Population growth rate GNP per capita growth rate Devlopment di.mondb(annul averagc. paent) ( ualw avenge, percat) Life expecac
4 5
2 - ________O_-_____ I GNP Grosstperr prtnay
O n~ 5 | scapita \ ro/uent
-2 ~~~~~~~~~~-10197D-75 1980-85 198S93 1970-75 198045 1988-93 Access to safer
E Republi of Yemen _ RepbLc ofYemaen- LOw-income Low-income
a. See the tchnical n p387. b. The development diamond, based on fourkey indica shows the aveage ivel ofde&vopmnt in te outycmpared with its income group. See the intodtioL
374

Republic of YemenMes Sam e rhoflh c'.' Next
oLatest Lsbagl9er - recnu MWi - higherV*lft of ear/at.r & NoYan LaoV income
hIdluelor meosur 197I0PT 5 191"05 J.l58893 Aftka Income group
Resources and ExpendituresHUMAN RESOURCESPopulatlon (emr1993) thousands 6,991 9,593 13,196 261,650 3,091,764 1,096,665Age dependency ratio mdio llS 1.06 0.99 0.87 0.67 0.69Urban %orpop. 16.4 24.4 31.7 S5.2 27.6 54.7Population growth rate annual % 2.0 3.1 5.5 2.7 1.9 1.6Urban " 5.8 6.6 8.5 3.7 3.9 2.9
Labor force (IS64) thousands 1.780 2.430 2.885 71.333 1.442,452 459,196Agrckulture % of labor force 66 59Industry " 10 IIFemale " 10 12 14 16 33 31Females per 100 malesUrban numberRural"
NATURAL RESOURCESAren thou. sq. km 527.97 527.97 527.97 11,021 .26 39,091.96 40,682.67Density pop. per sq. km 13.24 18.18 23.66 2i3.10 77.60 26.52Agricultural land % orland area 33.19 33.21 33.23 32.10 52.82 39.61Change in agricultural land annual % 0.07 0.03 0.00 0.04 0.03 -0.13Agricultural land under irrigation % 1.61 1.72 2.05 30.59 18.02 12.66Fowst aw woodand thou. sq. km 0.04 0.04 0,45 7.15 5.95Deforestation (net) annual % 0.00
INCOMEHousehold income
Sbare of top 20% of households % of incomeShut of bosom 40% of howseholdsShare of bottom 20% of households
EXPENDITUREFood %ofGDPStaplesMeat, fish, milk, cheese eggs
Cereal imports thou, metric tonnes 295 1.182 1,843 38.092 34,420 66,281Food aid in cereWls 34 59 21 1,249 8,334 5,477Foodproductionpercapita 1917 100 122 96 97 102 113 101Fertilizer consumption kg/ha 0.8 899 59.9 48.0Shau of agriculLure in GDP % of GDP 19.9 13.3 26.3 15.7Housig 96 of GDPAverage household size pesons per household .. .. ..Urban
Fixed investment housing % of GDP .. .. ..Fuel and power 9b of GDP .. .. ..Energy consumpdon per capita kg oFoil equiv. III 228 285 1,097 364 1,595Households with electricityUrban * of households .. .. .. .. .
RuralTransport and coasunucatlon % of GDP .. .. ..Fixed investnent: transport equipment .. .. ..Total road length thou. km 4 37 37
INVESTIENT IN HUMAN CAPITALHealthPopulation per physician person 34,791 5.561 .. .. .. 3,277Population per nuse 1.925 ..Populadonaperhospitalbed 1,155 .. 1,139 633 1,016 604Oral rehydyration theapy (under-5) * of cues .. .. 6 56 38EdnactlonGross aerollment ratioSecondaly % of school-age pop. 8 ., 31 56 41 53Fee 1 a. .. SO 34
Pupil-teache ratio: primay pupils per tacher 40 .. .. 26 39Pupil-teacher atio: secondary 21 . .. 21 20Pupilsk rcing grade 4 % of cohort .. .. .. gSRepeater ate: prinry % of total emnoll .. ..illiteracy % of pop. (age 15+) .. 68 62 45 41 19Female % of fmn. (age 15+) .. 74 57 53
circulation tm t.ouAr1. .. .. 3.. 74WorldBank intemaonat Economics LXBriMenL Apm I3
375

Federal Republic of YugoslaviaMest Same rIlac.is gmua Next
-1000114b yz _ rveent E er higherU(i qRf astimate Cronil middle. Icnme
IIator nru ,1 1970475 195l9S 8 J98593 Asila Income group
Priority Poverty IndicatorsPOVERTYUpper povery line local curr. ,
Hoadeount Index ;b or pop. .. ..Lower poveny line local curt. .. ..Headcount index l or pop. .. ..
UNP per capita USS .. .. .. 2.450 1I590 4,350SHORT TERM INCOME INDICATORSUnskilled urean wages local curr. .. ..
Unskilled nmral wagesRuml terms of trade ' .. ..
Consumer price Index 1917-10W .. ..Lower income
UrbanRural
SOCIAL INDILATORSPublic expendIure on basic socal services % of CDP .. ..Grass enrollnent ratiosPimay % school ag pop. 103 97 94 .. 104 105Maio 104 98 94FP le H 101 97 94
MonaityInfant moraity per thou.lin biths 47.0 34.0 19.6 24.8 39.0 35.1Under S mortaity .. .. 22.0 36.4 61.5 42.6
ImmunizadonMeales * age group .. 91.0 75.0 .. 77.6 82.0DPT .. 89.0 79.0 .. 82.2 74.2
Child manulhtri' 'eanderS)Life expecuawr
Total years 69 70 72 69 67 69Female OF, * 3.8 4.9 5.0 8.8 5.9 5.9
TotalOferti.t births per woman 2.4 23 2.0 2.1 2.9 2.9Materal mr per 100.000 live births .. 27
Supplementary Poverty Indicators
Expenditur 1' % of total gov't exp. .. ..
Soel secune aecon. acive pop. .. ..
Acces to mf % of pop. .. .. .. . .. 86.7Urban .. .. .. . .. 93.9Rural .. .. .. .. .. 66.7
Access to health ca-c _ .. .. ..
Population growth rate GNP per capita growth rate Devdopment diamondb(annl avange. percent) 10 (annual avrage. pnt) Life expectancy
4 5
GNP Al 2 . _ 0-1- II w pniay
m- m : ml -l -S \ / enrodiment
.2- -101970-75 1980-85 1988-93 1970-75 1980-85 1988-93 Acc ssafes wae
[l Federd Republic of Yugoslavia - Fcderl Reublic of YugoslviaLo- middle-income Lower-middle-income
a. See the technical nots p.387. b. lb deelopment din based on fourkey indiators, siws tm avagelvel of deveop ntin te conaycompard with its inwme group. Sce te introdwuion.
376

Federal Republic of YugoslaviamestsSamte regielincemoegreup Newt
atesitsingleyjeer recent Eunroe Lower- hig9herUnit of a.- etmate & Central mitddl- incopme
Indicator measure 1970-75 1980485 1988-93 Asia incense groupResources and Expenditures
HUMAN RESOURCESPopulaiton (rure=-1993) thousarnds 9,085 9,848 10.566 494.619 1.096.665 500,507Age dependency ratio ratio 0.5 1 0.48 0.50 0.57 0.69 0.62Urban Wi of pop. 43.0 49.7 55.1 64.8 54.7 71.2Population growth rate annual % 0.9 0.7 1.3 0.6 3.6 1.7urban 2.6 2.1 2.6 1.5 2.9 1.8
Labor force (15464) thousands 9.629 10.484 1 1.038 237.897 459,196 190.136Agriculture % of labor force 41 32Industry -3 1 33Female 37 38 39 47 3 1 29Females per 1 00 males
Urban nuumber 105 103 . ..
Rural -103 93 . ..
NATURLAL RESOURCESAwa thou. sq. kcm 25.33 25.33 25.33 24,320.56 40,682.67 21,848.14Density pop. pe-r sq. km 358.67 388.79 411.67 20.20 26.52 22.51Agricultural land % of lmnd area . .. 39.61 41.26Change in agricultural land annual S .... -1.28 -0.13 0.011Agricultural land under irrigation S .... 7.15 12.66 8.84Poicsts and woodland thou. sq. kmn. 0.03 0.03 0.80 5.95 8.04Deforestation (net) annual Wi - .. 0.22INCOMEHousehold incomeShare of top 20% of households S or income 40 .
Sham of bottom 40% ofhomseholds Ig ...
Share of bottonm 20% of households if7......-
E.XPENDfrURFood % of GDP 17.1 16.6 . ..
staples 3.7 2.7MMet Fish, miilk, cheese eggs 7.4 7.3..-- .
Cereal imports thou. mectric tonnes 27 136 122 34.452 66,28'1 48.947Food aid in cereals 337 4,392 5.477 S44Food prodnction per capita 1987=100 ... .101 102Fertilizer consumption kg/ha ... . 41.7 48.0 67.8Share of agriculture in G3DP %iof GDP ...- 13.5 15.7 8.0Housing % of GDP 4-9 5.5 -6.0
Average household size person per household 3.8 .
Urban 3.2 .
Fixed investment housing S of GiDP 6.1 3.7 .5.2
Fueluandpower %ofGDP 223 2.6 .. 1.2Enecrgy consumption per capita kg of oil equiv. 2Z748 4.111 2.353 2.959 1,595 1,632Households with electricityurban Wizf households...
Transport and conunuu.icalion Wi of GDP 5.5 6.9Fixed investment: airasport equipment 1.9 1.6Toararoad lenth thou. km l. 11 122INVESTME,NT IN HUMAN CAPITALtwlutPopulation per physician persons 425 274 225 362 327Populatonuper nume 180 128 49 249Populaton per hospital bed 85 71 71 136 604 395Oral rehydyration thempy (under-5) % of cases ... .. .51
EducationGros enrllment ratioSecondary Sof school-age pop. 76 8 I0 so 53 53Fennie i 72 79 79 --
Pupil-teacher ratio: primary pupils per teacher 26 ... . 25Pupil-teatchr ratio: secondary -20 -
Pupils reaciiing grade 4 % of cohort 99 99. .
Repeater rate: primary S of totial nrll 4 - .. .
illiteray S of pop. (age 15+) 17 9 75 19 14Female % of fcrm(agrel5+1 is 1 12 ... 17
nmwpaerirculation perthou. pop. 209 267 ... 74 125word an H-1Inrenmnonalw Economics Department. April 199-5
377

ZaireMort Same regleulemneRrop Next
Lvate single yar reent it" higkerUnit! esofate Sahw= Lao* inwme
lndicator measure 1970.75 198045 1988-93 Africa acoamc aretl
Priority Poverty IndicatorsPOVERTYUpper poveny line local curr. .. .
Headcount index % of pop. .. .. 19Lowcr poverty line local curr. .. .. .Headcount index % of pop. .. ..
GNP per capia USS 5.. .. 20 380 1,590
SHORT TERM INCOME INDICATORSUntkilled urban wagcs local curr. .. .. .. .. _UzLskilled mln wagesRural tr s of tradeConsumer pricc index 1987=100 0 36 13,452,6G
Lower incomeFood'M
UrbanRural
SOCIAL INDICATORSPublic expenditure on basic social scevices % of GDP .. 1.0 4.0 .. _Gross enrolirnint ratiosPrimary % school agc pop. 88 89 70 67 108 104Male 104 107 8D 74 116 .Female 72 71 60 60 101
MortalityInfantimortality per thou. live births 127.0 107.0 91.6 93.1 63.1 39.0Under 5 mortality .. .. 187.0 172.3 101.4 61S5irnmunizafionMeasles % age group .. 41.0 31.0 49.9 87.3 77.6DPT. 37.0 32.0 51.9 89.9 82.2
Child malnutrition (under-5) 28.8 20.0 25.0 _ 40.3Life expeancyTotal yars 46 S0 52 52 62 67Female advantage p 3.2 35 3.2 33 2.1 5.9
Total fertility rate births per woman 6.3 6.7 6.6 6.2 3-6 2.9Maternal mortality rate per 100.000 live births .. 500 600
Supplemnentary Poverty IndicatorsExpenditurms on social scurity % of otal govt exp. .._ ..Social scwity covea;ge % econ. acfive pop. .. ..
Accesstosafewater total %ofpop. 19.0 32.1 342 .. 67.0Urban 38.0 52.0 59.0 .. 78.7Rural 12.0 21.0 16.9 _ 62.0
Acces to health ca . 33.0 59.0 _
Population growth rate GNP per capita growth rate Development diamondb(annual averae pent) I (annua average. percent) Lfe u [
4 5 -5
2 0 _ _ _ _ _ _ _ _ _ _ _ _ _ _ Npe Gross
0 | | l | 1- K tF 2 1-F1- capita \ nrolmjt
-2 -10 1970-75 1980-85 198-93 1970-75 1980-85 198U93 Acc:sstosafwaler
J Zain _ Zaie- Low-income l-Lw-income
a. Sce Ide tehnical notcs,p3H7. b.Thdeveopmentdiamond basedonfourkeyindicatos sws theaverage kvd of dcvlopmentin tecountycompared widt its income group. See th intoduction.
378

ZaireMost Samse Preg&ualbaceme group Next
Latest sngl earm recent ----- higherUnit of aestafoe Saham, Low'. incoens
limdka tor nmeasre 1970-75 1195045 19584-3 Africa income group
Resource and ExpendituresHUMAN RESOURCESPop.latln (mre=1993) thousands 23,251 3 1.701 41.231 558.971 3.091.764 1,096.665Age dependency ratio ratio 0.92 0.98 1.02 0.94 0.67 0.69Urban 51 of pop. 29.5 27.9 28.7 29.11 27.6 54.7Population growth rate annual 5 2.7 3.2 3.3 2.9 1.9 1.6Urban 2.2 2.6 4.0 5.0 3.9 2.9
Labor (br (15-64) thousands 9,503 11,666 14.113 229.480 1.442.452 459.196Agricultur 51 of labor force 75 72 .
Industry 1 2 1 3 .
Female '40 37 35 36 33 31Females per 1 00 malesueba number - 93 .
Rurad. 113...
NATURAL RESOURCESArea thou. sq. km 2,344.86 2,344.86 Z,344.86 24273.63 39,091.96 40,682.67Density pop. per sq. km 9.92 13.52 t7.02 22.37 77.60 2632Agricultural land % of landamen 9.911 10.06 tO.I0 52.54 52.82 39.61aminge in agricuturwal land annual 51 0.00 0.22 0.09 0.06 0.03 40.13Agricultural land undeirirrigation 51. 0.04 0.05 0.83 18.02 12.66Fousts and woodland thou. sq. km .. 1.21 1.13 5.32 7.15 5-95Daefostution (act) arknual 51.. 0.62INCOMEHousehold incomeShar of top 2051 of households 51 of income.....Share of bottm 4051 of householdlsShut of bottom 2051 of househlds -
Food %ofGDP . 48.1Saples 4 .5 24.0..-Meat, fish, milk, cheese, eggs .. 7.3 8.2
cereal imprt thou, metric tonses 302 320 238 13.157 34.420 66.28IFood aid in cereals 1 138 27 5,079 8.334 5.477Food production per capita 1987 100 108 lot 101 101 113 101Fertilizer consumption kg&la 0.5 0.3 0.1 4.6 59.9 48.0Sime oragriculture in GfP SorGJDP 16.5 29.9 30.2 16.3 26.3 15i7Housing S ofUGDP .. 3.4 9.9-Average household size persons per household ... -. .-
Urban 6.0 . .. .-
Fixed investmet housing SorCIDP .. 2.2 1.8Fuel and power 51ofG P .. 1.0 3.2Energy contsumption per capita kg of oil equiv. 58 5 1 48 257 364 1,595Households with electricityUrban S of housholds.....-.Ruraud. .
Transpot and communIdcation % of GDP .. 1.7 4.5Fixed investment transport equipment -- 1.8 2.6ToWroiad lensgth thou. km 145 145 146
INVESTMENT IN HUMAN CAPITALHealthPpulation per physician persons 28.131 ...... 3,277Population per nurs= 6.7 15 ...-
Popultion perbospital bed 311 .. 702 1,269 1,016 604Oral rehydymlion therapy (under-5) 51 of case ... 46 37 38-
Gross enrollment riatoSecondary % of school-age pop. 16 23 is 1 41 53resale 8 14 ... 34
PupA-teacher ratio: rmr putpils per teacher 4 1 42 42 40 39Ppjteahcrratio. eodr .. .. 20Pupils reaching gmadc4 9bOf cobort 62 63 -
Re-peale rat primaiy % Of tota enroll 2 1 19 - .
ilitracy S of pop.{(agelS+) .. 34 28 s0 41 19Female S of fem. (aW I54) .. 47 39 62 53
N M dctiruation pe thou. gm. 3 2 3 12 -74
wo tematronatlm Economics Department. April 1Y
379

ZambiaAtost Same relaonineome group Next
'Ate-t single year reent Si higherUnit of estimate Saharan ow- inncme
Indkalor measure 1979-75 198045 1988.93 Afrka income group
Priority Poverty IndicatorsrovExRTYUpper poverty line local curr. .. 8.481Headcont index % of pop. 86 19
Lower poverty line local curr. .. .. 5.910Headcountindex %ofpop. 76
GNP percapit USS 600 330 380 520 380 1.590
SHORT TERM INCOME INDICATORSUndilled urban wges local curr. ..
Unskilled rural wagesRural mm of trde
Consumerpricc index 1987=100 9 46 12.764Lower income 45 4.77
Food' " 6 .. .
Urban .........Rural .. 46 4.676
SOCIAL INDICATORSPublic expenditure on basic social services % of GDP .. 3A.Gross cnrollnent ratiosPrimarn % school age pop. 97 99 104 67 108 104Male 105 105 109 74 116Female 88 93 99 60 101
MorlityInfant mortality per thou, live birts 100.0 88.0 103.0 93.1 63.1 39.0Under S mortaHty -.. . 203.0 172.3 101.4 61.5
ImmunizationMeasles % age g4p 55.0 76.0 49.9 87.3 77.6DPT . 4.7.0 79.0 51.9 89.9 82.2
Child manutrition (under-5) 24.1 265 26.S .. 403tife expccyancy
Total yeas 47 51 4S 52 62 67Female advantagc 3.3 2.3 1.6 3.3 2.1 5.9
Totr fcrtility rae birhs per woman 6.9 6.9 5.9 62 3.6 2.9Mawnal mortlity rate per 100.000 live birts .. ..
Supplementary Poverty IndicatorsExpendins on social secuity % oftotal govtep. .. 1.3 1.5Social security covemg % econ. active pop. .. ..
Accesstosaf watew.toal %of pop. 42.0 53.6 58.9 .. 67.0Urban 86.0 70.0 762 .. 78.7Rural 16.0 41.0 42.8 . 62.0
Access to health care .. 70.0 75.0 .. .. ..
Population growffi rate GNP per capita growth rate Development diamondb
6+ (annual averag percent) (annualaverag. p t) Lfctcy
4- 5-
2 GNP1 O-P Gross
0 [ [ I t | l | [ l *s ~~~~~~ L j capiu a enrollmuent0 IIE -5
-2 -10197D-75 1910-85 1981-93 1970-75 1980-85 1988-93 Acmcss to safe water
El &abi;a _ ZamrbiaLaWr-incom- Low-income
a. Seethe technical noes. p387. b- The dceelopment diaamd, based on four WY indicators, shows die avage level of devlopment in she countrycompared with its income group. Sec the introduction.
380

ZambiaMart Sam regi.n rm e grouF Now
Late sgW Year mae. higwUnit of eatOnal Schema Law. icome
Indiador macwr 1976.7S 19W0U 1988-93 Ale incm, gropResources and Expenditures
HUMAN RESOURCESPpultbon (mre=993) dIouisds 4,841 6,862 8.936 SS3973 3.091.764 1.096.66SAge dependency atio atio 0.96 1.04 1.00 0.94 0.67 0.69Urban S of pop. 34.8 40.9 42.1 29.8 27.6 54.7Populaion gmwlh rae annual % 2.9 3.6 3.3 2.9 1.9 1.6Urbn * 5.6 4.1 3.3 S.0 3.9 2.9
Labor force (1S64) dhousands 1.66S 2.242 2934 229.480 1,442.452 459.196Agricultu S of labor force 75 73 . ..
industry 9 10 .. .. .. -
Female i 23 28 30 36 33 31Fenale per 100 malesUrban number 87 93 .. .. _ -
Rual 123 124 .. .. -
NATURAL RESOURCESArea fthou. sq. km 752.61 7S2.61 752.61 24.273.63 39.091S6 40,682.67Density pop. per sq. km 6.43 9.12 11.49 22.37 77.60 26.52Agricultul land S of land ama 47.08 47.33 47.45 5254 52B2 39.61Change in agricultural land annual S 0.04 0.09 0.01 0.06 0.03 -0.13Agriultur land under inigption S 0.05 0.08 0.10 0.33 18.02 12.66FTrshs and woodland thou. sq. kin . 0.36 0.32 S.32 7.15 5.95Defoestation (net) annual % _ .. 1.06 .. ..
INCOMEHousehod income
Sham of top 20% of households % of income 63 .. S0Share of bottom 40% of households i 10 .. IS - -
Share of botwm 20% of houseboldsr 4 .. 6 .. .. _
flPENDffUREFood S of GDP 22.7 25. ..
Staplcs 5.9 55 ..Meat fish, milk. cheese. eggs i 10.0 12.3 -
Creal impmts thou. meric tannrs 164 201 353 13,17 34,420 66.231Foodaidincermas 5 116 535 S,079 8,334 5.477Foodpoductionpercapita 1987=100 153 103 113 101 113 101Feitilizer consumption kgba 1.5 23 2.4 4.6 59.9 4B.0Shameofagricultur inGDP %ofGDP 13.1 13.1 33.7 16.3 26.3 15.7Housing % of GDP 5.8 7.6 . .. ..
Average household size persons per household 4.0 - 5.5Urban - - 5.9
Fixed investment housing S of GDP 4.8 0.3 -
Fuelandpower % ofGDP 1.9 3.1Eneryconsumptionper cwita kgofoilequiv. 383 231 146 257 364 1.59SHouscholds with electricity
Urban % of households . . 39.0Rural .. .. 11.0 .. ..
Transport and conanunitlon % ofGDP 3.9 3.S ..
FLxed instment transport equipment 6.0 1.7 -
Total road length thou. km 36 37 39 .. .
INVESTMENT IN HUMAN CAPITALHeiathPopulation per physician rsMus 13.4S6 7.269 11.431 . 3.277Populadtonpernurse ' 1,698 758 610 -Population perhospital bed ' 300 288 . 1269 1,016 604Omu rehydymlion thrapy (under-5) S of ass - 90 37 31 -
EducationGross enmllment raioSecondary % of schol-ae pop. 1S 18 37 18 41 53
Female ' 10 13 32 - 34 .Pupil-teache rtio: primary pwispereacher 48 49 44 40 39 .Pupil-teacber ratio: secondary 3 23 23 28 - 20Pupik reachinggra de4 % of cohot 96 100 .t oRepealer tac primary % of total enroll 2 2 .. _- -
lliteracy Sofpop. (agelS+) .. 33 27 S0 41 19Female % of*m. (ap IS+) _ 41 35 62 53 -M r ws ciruaiaon per thoupop. 22 14 S 12 _ 74
World k lnteanonal Economics Deparmet April 1995
381

ZirmbabweMost Smureon/incmegr Next
La sngk oyear recent SUb higherUdt of - c ate Saran Leaw income
ladicaler m*eare 1970-75 iQIMS 198.93 Af9rica aicone group
Priority Poverty IndicatorsPovmtTnUpper poverty line local curr. .. .. 400Headcountindcx %ofpop. .. .. 26 .. 19
Lower povety line local o. .. 242Headount index % of pop. .. .. a
GNP per catla USS 590 620 520 520 380 1.590SHORT TERM INCOME INDICATORSUnskiled wubn wags local cuir. .. ..Unskilled ruad wagesRun! terms of tradeCansumerprice index 1987.100 24 78 318LAweincone .. 73 177FootrUrbanRural .. 77 184
SOCIAL IDICATORSPublic expendltumc on basic social services % of GDP .. ..
Gross enollment raiosPrimay % ssool a pop. 73 135 119 67 10% 104
Male 79 140 123 74 116Fecm 67 131 114 60 101
MotalityInfantmoortaifty perthou.livebiuts 93.0 76.0 66.6 93.1 63.1 39.0UnderS mortality .. .. 83.0 172.3 101.4 61.SIlmuniatonMeasles % age group 78.0 87.0 49.9 S 73 77.6DPI . 72.0 89.0 51.9 89.9 12.2
Child malnutrition (under-5) .. 14.0 10.0 .. 403 _life exp ctcyTotal yms 52 56 53 52 62 67Femraeadvantage , 3.5 3.3 2.6 33 2.1 5.9
Total fertility rate births per woman 7.2 6.2 4.9 62 3.6 2.9matera molity rate per 100.000 ivc births .. 145 s0
Supplementary Povery IlndicatorsExpenditures on social sxuxity % of total govfl cxp. .. 29 25 .. _Social secury cwoveg ecot. active pop. . .. .. .Access to sfe watr total S of pop. .. 31.4 353 _ 67.0Uran .. 100.0 100.0 78.7Rurad.. 10.0 135 _ 62.0
Access to alth ca o w 71.0 _ _ -
Population growth rate GNP per capita growth rate Development diamondb(annual avera pecnt) (a (1 avengr. percent) Uficaa n 9
45
ONP Grss
O0 FTFH tfl [ | l 4I -5- . capita e7eroUmnt
-2 -l01970-7S 1980-8S 1988-93 1970-75 1980-85 1988-93 Acccsstosaewat
F Zinbabwe Zimbabwe- Low-incmn - Dv-income
a. See the tical nots p337. b. Thc development diamond. bascd on fwur key inAtors, shows thm avera lvel of development in de contycompard wih its incom group. Sce the intrducton.
382

ZinmbabweMent Sams ruaafmucinsqreaW Nex
Lwa sin: s Ogi pe race 3i5- hiherU.ni of assa ue Schema Low'. income
IsaNea nmacsre 1.97(1-75 1980-1 1988-93 ArirIa inome groupRmuoumes and Expendfitues
nuJMN REOUCEPepulasio (mnre=199) thousands 6.143 5.392 10.739 552.978 3.091.764 1.096,665Agp Vdepndny ratio ratio 1.07 0.96 0.89 0.94 0.67 0.69Ujrban S of pop. 19.6 25.2 30.7 29.8 27.6 54.7Popuation growthrmte annualS 3.1 3.3 3.0 2.9 1.9 1.6
Urban 5.9 5.6 5.3 5.0 3.9 2.9Labor force (1544) thousads 2,575 3.410 4.286 229.480 1.442.452 459,196Agriculture % of 1aboforce 75 73Industr 1 0 10Femnale 37 36 34 36 33 3'1Females per 100 nmalsUrban numnber - 79RJura 122
NATURAL RESOURCESArea thou. sq. lou 390.76 390.76 390.76 24,273.63 39,091.96 40,682.67Density pop. per sq- km 15.72 21.48 26.68 22.37 77.60 26.52Agricultural land % of land amu 19.05 19.62 19.91 52.54 52.82 39.61Chang in agricultura lad annual % 0.04 0.69 0A42 0.06 0.03 -0.13AgricuitUral lan under irrigtio 5 0.95 2.53 2.92 0.83 18.02 12.66Forcsts and woodlu,d tho. sq. km .. 0.10 0.09 5.32 7.15 5395Deforetation (net) mual S . 0.66 -
INCOMEHousehiold income
Share of torp 20% of houshods % of icomnic... 62Share of bottm 40% ofrhouseholds I. .I1
St.=e of bottom 20% of households ... 4MmTIF
Food %ofGDP - 25.6Staples U .5.8..-
Mm tfish. mllk.cheescggs - 12.0 - -
Cmaulimpofs thou. metrc tones 57 153 538 13.157 34,420 66,2B1Food aid in cereals if- 131 900 5,079 2,334 5,477Foodpmducfion percapita 1987=100 147 134 94 101 113 101Pericurerconsumption kgib 20.0 22.4 17.8 4.6 5V.9 48.0Shutcof agcutatuein GDP %ofGDP 16.2 18.0 13A 16.3 26.3 15.7HoGusin Sof GDP .Average hwasehod size pesons per houseold . .. ..
UrbanFixed iavesbnetchouseng %of GDP .. 0.8Fuel and power % Of GDP .. 3.2Energ cixiuzptio per captita kg of oN equiv. 436 388 471 257 364 1.595Households Withk electricty
Urban %orhouseholds...Rural
Trnusport and conuwakea¶lon S of GDP . 339Fixed hivesnret transport equipment if.. 2.Total road leagt thou.km 81 78 78DIVESTMENT IN HUMAN CAPITALHealthPopulation per physican pros6.381 5.94 .-.. 3.277Population pernurse U649 998population per hospital bed if304 699 1.990 1.29 1.016 604Oral rebyymtion therapy (mnder-S) S Of cases... 77 37 38EdwauduGr oss nrolmet ratioSecondary % of chool-ag pop. 9 42 48 is 41 .53
Female 7 33 42 34 34Pupil-teacher ratio: primary Pupils per tamcher 41 40 38 40 39Popil-eacher ratio: secondary 189 28 30 .. 20 Pupilsncaching grade 4 of cohort 80 85 77RepeateratePrimarY Sortosalemu I ...
HIlteac S of POP. (age 15-) .. 38 33 so 41 19Female % OffEMu.(agBP +) .. 45 40 62 53
N", circulton flton. 19 24 1 9 1 2 .. 74
383

Table la Basic Indicators for Other EconomiesLife
Area GNP apecancy Adult IlliteracyPoplatlion fthousant per ca1la at bkih (percent)(kouandu of square (US$) (years) Feiiuale Turalmdd 1993 klmwnetes) 1993 1993 1990 1990
I AnieFe1nSaM Si 0 c ..
2 Andorm 61 0 d ..
3 Aruba 69 0 c ..
4 C'n" Islands 29 0 d .. ..5 Chnnel ldands 146 d6 Eitu .. 0 a .. ..
7 FaPcr I kbds 47 1 d .. ..
6 Fench Guiana 134 90 c .. ..
9 Gibdaltar 28 0 c .. ..
Io Greenland S7 342 d .. ..
IskoaMman 72 .. c .. ..
12 MRaa 381 0 c .. ..
I3 M i allslmnds SI 0 b .. .. 914 Mayontt 101 .. c .. ..
Is NanheMauniMwlulands 45 b _ _ b_16 SonMawio 24 0 d .. ..
17 Virgin linds (U.S.) 104 0 d .. ..
Ii WestEBankdGazam 6 b .. ..
a. Esfinued to be low-icomo ($695 or kss). b. Esdard to be bwer-middle income ($S696 to Z75). c. Estimated to beipper-middle-inoome ($2,716 to $3,625). d. Esimaed to be high-incwe (58.626 or mor).
384

Technical Notes
Sources and Methods
By drawing on data already reviewed by specialized interia- staff and resident missions in nany countries, such as thetional agencies dealing with education (UNESCO), health U.S. Agency for International Development and similar en-(WHO), and other social concerns, the World Bank starts tidies in Europe. Finally, the World Bank's own files providewith the most consistent and reliable series. Ihese agencies additonal data processed by country economists and residentgenerally collect statistics directly from the countries con- missions in the course of regular contacts with membercerned; the countries endeavor to apply standard U.N. pro- governments.cedures, definitions, and classifications while using their Social Indicators of Development provides a much fullerspecial country knowledge to fit the data. But the specialized explanation of these sources and methods and, where appro-international agencies rarely have the resources to collect priate, goes beyond conventional definitions to clarify someinformation universally each year: the available series are common misunderstandings.incomplete and sometimes inaccurate. The coordination Social change is measured at the level of the individual,processes involved and the delays in getting responses mean the household, and the community, as well as the nation as athat series tend to be less current in the specialized interna- whole. The numdraire is chosen for its appropriateness andtional agencies than in national agencies. Standard sources relevance to policy issues. Thus income is measured for bothfor this volume may therefore be supplemented by estimates individuals and households; population change is measuredfrom member governments and figures obtained directly for urban areas and the country as a whole. The position offrom countries. Another useful source is information pub- women and the impact of development on them is specifi-lished or provided by bilateral organizations which have field cally identified wherever possible.
Data Reliability
Despite considerable effort to standardize the data, statistical cannot be fully and unequivocally resolved. The data aremethods. coverage, practices, and definitions differ widely drawn from sources thought to be most authoritativc, butand the usual warnings about using the figures carefully still many of them are subject to considerable margins of error.apply. In addition, the statistical systems in many developing Readers are urged to rake these limitations into account ineconomies are still weak, and this affects the availability and interpreting the indicators, particularly when making com-reliability oftda Moreover, cross-country andcross-timecom- parisons across countries and economies.parisons always involve complex technical problems, which Most country data are drawn from regular administrative
385

files, although some come from special surveys or periodic gaps and weights are applied as necessary, using a suitablecensus inquiries. In the case of survey and census data, common numeraire. The methods used to compute groupfigures for intermediate years have to be interpolated or measures are broadly the same as those used in other statis-otherwise estimated from the base reference statistics. Like- tieal publications issued by the World Bank, as described inwise, because not all data are updated, some figures-espe- the technical notes to the World Development Indicatorscially thoserelating tocurrentperiods-may beextrapolated. (WDI) in the World Developmnent Report,Several indicators are derived from models based on assump- The same technique is applied to regional groupings intiDons about behavior and prevailing conditions. Issuesrelated this volume's table on Social and Economic Conditions andto the reliability of demographic indicators are reviewed in to thecomparatorgroups on country pages.iTe benchimark-the U.N.'s World Population Trends and Policies. Regular ing procedure underlying group measures requires that two-reports on sources of basic population data are given in the third of the data be available and that some weight beU.N.'s Population and vilat Statistics Report. assigned to each economy within the group. Uncurrent re-
Inevitably, a few series report numbers on the borderline porters (and those not providing ample history) are thenof acceptable quality and reliability. Although World Bank assumed to behave like the sample of the group that doesstaff try to delete clearly misleading numbers, borderline provide estimates. Foran economy reporting inadequate datafigures are usually included to give the benefit of the doubt in every year, World Bank staff must choose some arbitraryto the compiler and to provide a more general perspective. 1987 base value within a broad range of plausible estimates.They roust be viewed in the context of the other information Readers should kIeep in mind that the purpose is to maintainin the tables used to describe a country's situation. - an appropriate relationship across topics, despite myriad
The bibliography lists major sources for basic statistical country data issues and that nothing meaningful can beseries and social indicators. Data from these sources as well deduced about behavior at the country level by working backas those of the World Bank are reviewed in the World Bank's from group indicators. In addition, the weighting processSocio-Economic Data Division, which checks for consis- may result in discrepancies between summed subgroup fig-tency, combines reports fronm various sources. and creates ures and overall totals."derived" indicators-such as school persistence rates-us- Measures for the next higher income group are also given,ing information provided by other agencies. where possible. This is not meant to imply a linear path of
An important aim of Socl Indicators ofDevelopment is development but simply to illustrate differences betweento promote greater international comparability and consis- countries at various incomn. levels. High-income economiestency in social statistics, but sometimes this is achieved at the are compared to their own income group only. The regionalcost of precision. groups are defined by the World Bank and are not standard
geographic categories. They are shown here to suggest an-Group Aggregates other form of comparative analysis. See Appendix A for
tables listing country classification.Special problems arise in estimating group measures consis- Most indicators are weighted by population; some indica-tendy whether by income level or geographical region- tors use indicator specific weights for group totals. Data referover time and across topics. For a given group, data avail- to calendar years unless otherwise noted (although demo-ability varies across indicators, especially among low-in- graphic indicators refer to midyear).come countries, so estimation procedures are used to fill the
Explanation of Terms
POVERTY SHORT-TERM INCOME INDICATORS
Poverty lines Country-specific and not comparable across Unskilled urban vages: Weekly wages of casual labourerscountries; the upper poverty line is the cutoff for the poor; without other income sources.the lower pox mrty line is the cutoff for the very poor. Unskiled rural wages: Weekly wages of casual farm labour-Headcount index: Proportion of the population in each of the ers without any land, or without enough land lo meet theirabove categories. subsistence needs.GNP per capita: Estimates are for 1993 at current market Rural teM of trade: Wholesale prices of foodgrain dividedprices in U.S. dollars. calculated by the conversion method by wholesale prices for manufactured goods.used for the World Bank Atlas. Consumerprice index: Prices of goods and services used for
privaic consumption of households. The CPI for lower in-
386

come comprises the price index based on the poor's con- weight for age reference population, or the Gomez scale ofsumption basket. malnutrition. Note that for a few countries the figures are forFood price Index The index (including the urban/rural data children 3 or 4 years and younger.separately where available) are from the U.N. Statistical Life expectancy at birth: Number of years a newborn infantDivision. Since the overall CPI is more up-to-date than the would live if prevailing patterns of mortality at the dme offood price index, the data presented may represent different its birth were to stay the same throughout its life. The datayears and therefore may not be comparable. are from the UN Population Division. As an infant mortality
rate, the most recent estimate is a linear interpolation betweenSOCIAL INDICATORS projected 1990-94 and 1995-99 rates.
Totalfertility rate: Average number of children who wouldPublic expenditure on basic social services: Percentage be born alive to a woman during her lifetime, if she were toshare of primary education and health expenditure in GDP, bear children at each age in accordance with prevailingbased on national account estimates. For countries covered age-specific fertility rates. The data are from the UN Popu-by ICP, computed from the SNA defined details of GDP, lation Division. As an infant mortality rate, the most recentcollected for ICP Phase 11 (1975), Phase IV (1980) and estimate is a linear interpolation between projected 1990-94Phase V (1985). and 1995-99 rates.Primary enrollment ratiox. Gross enrollment of all ages at Maternal mortality: The number of deaths to women thatthe primary level as a percentage of school-age children as occur during childbirth per 100,000 live births. Becausedefined by each country. Although many countries consider deaths during childbirth are defined more widely in someprimary school-age to be 6- 11 years, others use different age countries to include abortion complications of pregnancy orgroups for the fifen former Soviet republics, it is 7-9 years. the period after childbirth, and because many pregnantGross enrollment may be reported in excess of 100 percent women die from lack of suitable health care, maternal mor-if some pupils are younger or older ttian the country's stand- tality is difficult to measure consistently and reliably acrossard range of primary school age. countries.Infant mortality rate: Number of deaths of infants under one Expenditures on social security: Compensation for loss ofyear of age per 1,000 live births in a given year. These data income to the sick and temporarily disabled, payments to theare from the UN Population Division. For the most recent elderly, the permanently disabled, mad the unemployed; fam-estimate, the rate is a linear interpolation between the pro- ily, maternity, and child allowances; and the cost of welfarejected 1990-94 and 1995-99 rates. services, such as care of the aged, the disabled, and children,Under-5 mortality rate: the probability of a new bom dying as percentage of total government expenditures.before reaching age 5, if subject to the current age-specific Social security coverage: Percentage of the "economicallymortality rates. The data are fromn UNICEF's State of the active" population covered by social security.World's Children )995, except-for countries for which the Access to safe water. Percentage of the population withUN Population Division estimate of the IMR is higher than reasonable access to safe water supply (includes treatedthe under-5 mortality rate estimated by UNICEF. For such surface waters or untreated but uncontaminated water suchcountries, the under-5 mortality rate is adjusted on the basis as that from springs. sanitary wells, and protected boreholes).of models. Because most of the under-5 mortality rates are In an urban area this may be a public fountain or standpostfrom another source than the infant mortality rate and life located not more tfian 200 meters away. In rural areas itexpbctancy at birth, mortality rate shown in the tables are not implies that members of the household do not have to spendalways consistentL a disproportionate part of the day fetching water. The defini-Immunization: Measures (as a percentage of the age group) tion of safe water has changed over time.the full vaccination coverage of children under one year of Access to health care: Percentage of the population that canage for two of the target diseases of the Expanded Pro- reach local health services by the usual means of transporta-granuned of Immunization - measles and DPI' (diphtheria, tion in no more than one hour. Note that facilities tend to beprtussis and tetanus). Coverage rates are supplied by mem- concentraed in urban areas. Some separate figures for ruralber states. Note that for some countries the ages at which areas show a much lower level of coverage and access.children are vaccinated may differ from the recommendedages. This is particularly true of European countries. HUJMAN RESOURCESChild malnutriton: Percentage of children under five yearswith deficiency or excess of nutrients that interferes with the Popukltion (U.N. and World Bank)children's health and genetic potential for growth. Methodsofassessment vary, butthe mostconmnonly used arelessthan Population: Estimates for mid-1993 are from variety of80 percent of the standard weight for age, less than minus sources, including the UN Population Division, nationaltwo standard deviations from the 50th percentile of the statistical offices, and World Bank country departments.
387

Note that refugees not permanently settled in the country of woodland area during 1981-1990. A ncgative sign indicatesasylum are generally considered to be part of the population of an increasse in the forcste area.their country of origin.AgC depe7ndency ralio: Ratio of the population defined as INCOMEdependenL (under 15 and ovcr 64 years) to the working-agepopulation (15-64,) times 100. Total houeschold Income: Income (botlh in cash and kind)Population growrth rate: Annual average growth rate (1970- accruing to percenLile groups of household ranked by total75, 1980-85, and 1992-93) calculated for mid-year total and households income. In somc cascs statistics obtained fromurban populations. other agencies are revised by World Bank staff.
Laborforce (ILO) EXPENDITURE
Total labor force: The "economically active" population; a Food (UN, FAO. World Bank)restrictive concept that includes the armed forces and theunemployed, but excludes homemakers and other unpaid Food (as percentage of GDP): Percentage sharc of food incaregivers. total household consumption expenditure, computed fromAgriculture: Labor force in farming, forestry, hunting and the SNA defined details of GDP, collected for ICP Phase IIIfishing as a percentage of total labor force. (1975), Phase IV(1980) and Phase V(1985). For countriesIndustry: Labor force in mining, manufacturing, construc- not covered by ICP, less detailed national accounts estimatestion. and electricity, water, and gas as a percentage of total are included, where available.labor force. Staples: Bread, cereals, potatoes and tubers: a major subitemFemale: Female laborforce as a percentage oftotal laborforce. of food relating to the consumption of carbohydrates.Labor force numbers in several developing countries reflect a Meat.fish, milk, cheese, eggs: A protein measure but exclud-significant underestimate of female participation rates. ing beans, nuts, and other high protein-content food product.Females per 100 males (15-64): Ratio of females to males in Cereal imports: Measured in grain equivalents and definedthe total population. The significant differences between the as comprising all cereals in the Standard International Tradeurban and rural gender ratios reflect migration patterns. Classification, revision 2, groups 041-046. Cereal imports
are based on calendar-year data.NATURAL RESOURCES (FAO) Food aid in cereals: Wheat and flour, bulgur, coarse grains,
and the cereal component of blended foods; based on dataArea: Total surface area in square kilometers, comprising for crop years reported by donor countries and internationalland area and all inland waters. organizations, including the International Wheat CouncilDensity: Population per square kilometer of total surface and the World Food Programme. Food aid information byarea. donors may not correspond to actual receipts by beneficiar-Agricultural land: Estimate of area used for crops, pastures, ies during a given period because of delays in transportationmarket and kitchen gardens, or lying fallow, as a percentage or recording, or because it is sometimes not reported to theof total land area (excluding area under inland water and FAO or other relevant international organizations.rivers). Food production per capita: The average annual quantity ofChange in agricultural land: Annual rate of change in agri- food produced per capita in 1990-93 in relation to thatcultural land. produced in 1979-81. Food is defined as comprising nuts,Agricultural kmld under irrigation: Areas provided with pulses, fruit. cereals, vegetables, sugarcane, sugar beets,water (including land flooded by river water) for crop pro- starchy roots, edible oils, livestock, and livestock products.duction or pasture improvement, whether these areas are Quantities of food produced are measured net of animal feed,irrigated several times or only once during the year stated. seeds for agriculture, and food lost in processing.(The dataFor some African countries, data on irrigation have been are weighted by value and not calorie cDntent which givesrevised recently on the basis of new studies. rise to different perspective depending on the relative shareForests and woodland: Land under natural or planted stands of low-value high-calorie carbohydrates versus high-valueof trees, whether productive or not, including land from lower-calorie livestock products).which forests have been cleared but that will be reforested in Fertilizer consumption: Total consumption of nitrogenous,the foreseeable future. Tropical country estimates are for phosphatic and potash fertilizers divided by the area ofnatural forest area only. Temperate country estimates in- agricultural land.clude plantation land. Share ofAgriculture in GDPP: Forestry, hunting, fishing, andDeforestation rate fnet): Annual rate of change of forests and agriculture; in developing countries with high level of sub-
sistence farming, much of agricultural production is either
388

not exchanged, or not exchanged for money. This increases ber of registered practitioners in the country. Note that thethe difficulty of mneasurirg the contribution of agriculture to definition of recognized medical practitioners differs amongCDP and reduces the reliability and comparability of such countries.numbers. Populationl per nurse: Nursing persons include auxiliary
nurss and paraptofessional personnel such as traditionalHousing birth attendants. Inclusion of auxiliary avid paraprofessional
personnel provides a morc realistic estimate of availableHousing (asapereentage ofGDP): Percentage, computed as nursing/health care ^verall.in food and reflecting actual and imputed household expen- Population per hospital bed' Number of hospital beds avail-diture outlays, such as actual and imputed rents and repair able in public and private, general and specialized hospital,and maintenance charges, as well as fuel and power for and rehabilitation centers. Hospitals are establishments per-heating, lighting, cooking, and so forth. manently staffed by at least one physician.Average household size: A group of individuals who share Oral rehydration therapy use: Percentage of diarrhea epi-living quarters and main meals. sodes in children under 5 years of age treated with oralFixed investment: housing: Percentage is computed as in rehydration salts or a physiologically appropriate householdfood. Includes all outlays, public and private, on residential solution.buildings, plus net changes in the level of inventory whichin this context relates primarily to work in progress. (A major Education (UNESCO)renovation or reconstruction would be included as capitalformation). Secondary school enrolbnent: Computed in the same manner
as the primary school ratio; the age group again var'es but isFuel andpower usually 12-17. For the 15 former Soviet republics, it is 10-18
years.Fuel and power (as percentage of GDP): Percentage is Pupil-teacher ratio: Number of pupils enrolled in schoolcomputed as in food. Includes electricity, gas, liquid and divided by the total number of teachers. In the case ofother fuels, and ice. secondary education, the ratio refers to pupils and teachersEnergy consumption per capita: Annual consumption of in general education only.commercial primary energy (coal, lignite, petroleum, natural Pupils reaching grade 4: Percentage of children startinggas, and hydro, nuclear, and geothermal electricity) in kilo- primary school and continuing until grade4, based on enroll-grams of oil equivalent per capita. ment records. The data are affected by repeaters.Household with electricity: Conventional dwellings with Repeater rate primary: Children in primary school whoelectricity in living quarters, as a percentage of all dwellings. repeat a grade as a percentage of all enrolled children.
Illiteracy rate: Defined here as the proportion of the popula-Transportation and communication tion 15 years of age and older who cannot, with under-
standing, both read and write a short simple statement onTransportationandcommunication(aspercentageofGDP): everyday life. This is only one of three widely acceptedPercentage is computed as infood. Includes the purchase of definitions and its application is subject to significant quali-motor cars. fiers in a number of countries. The data for the most recentFixed investment. transport equipment Computed as in estimates are mostly from the illiteracy estimates and projec-food. Includes all outlay, public and private, on transport tions prepared in 1989 by UNESCO. More recent informa-equipment, plus net changes in level of inventory. tion and a modified model have been used, therefore the dataTotal road length: Includes main paved and unpaved roads for 1990 are not strictly consistent with those published inas well as unclassified lower standard roads. previous years. For the 15 former Soviet republics, the esti-
mates are for 1989.INVESTMENT IN IUMAN CAPITAL Newspaper circukaion: Average circulation of a "daily, gen-
eal interest newspaper," defined as a news periodical pub-H.ealth (WHO) lished at least four times a week.
Population perphysician: Physicians includes the total num-
389

Selected References
Many of the statistics assembled in this volume come from grams of sectoral division.q or through special studies under-special agencies that have used questionnaires and surveys taken by Bank staff, such as the information on povertyto collect country data. In some cases, particularly for popu- lines This volume includes only a portion of the social indi-lation and related statistics, Bank staff revise these statistics cators available from source agencies. Additional data andwith more recent information they have obtained from the other indicators can be obtained fron th organizations listedcountry. Statistics are also generted through the work pro- below and from their recent publications.
porefly Institute for Resomurce DeveropmentrWestinghouse. 1987.Child Survival: Risks and the Road to Health. Columbia,
U.S.S.R Goskomstat. Various years. National Economy of Md.the USSR in 1991, Moscow. International Labour Office. 1984. Yearbook ofLabour Sta-
World Bank. 1992. ChIinc Strategiesfor Reducing Povert tistics. Genevain the 1990s. World Bank Country Study. Washington, . 1986. Labour Force Estimates and Projections, 1950-D.C. 2000. Geneva.
Living Standard Measurement Surveys. United Nations Department of International Economic andSocial Dimensions of Adjustment Surveys. Social Affairs. Various years. Popultion and ViWal Statis-World Bank data, tics Report. New York.
-. 1988. Mortality of Childr-n under Age 5: ProjectonsHuman Resources 1950-2025. New York.
. 1988. World Population Trends and Policies: 1987Bos, Eduard, My T. Vu, Ernest Massiah, and Rodolfo A. Monitoring Report, New York.
Bulatao. 1994. WorfdPopukionProjeCios 1994-1995ti- . The World Urbanization Prospects. 1994 Revisiontion (jbrdtcomhnpj Baltimore, Md. John Hopkins Urn WWt)F (forthcoming) U.N. Departnent of Economics and SocialPres Information and Policy Analysii New York..
Coale, AJ., and P. Demeny (with B. Vaughn). 1983. Re- .. World Popultion Prospects: The 1994 EditIon. U.N.gional Model Life TablesandStable Populations. 2nd ed. Deparunent of Economics and Social Information andNew York. Academic Press. Policy Analysis. New York. 1994.
Council of Europe. 1993. Recent Demographic Develop- U.N. Statistical Office. 1989. Demogrqphic Yearboot data.ments in Europe and North America. 1992. Council of United States Bureau of Census. 1984. Women ofthe World.Europe Press. USAID. Office of Women in DevelopmenL Washington,
Eurostat. 1993. Demographic Statistics. Luxembourg. Sta- D.C.tististical Office of the European Community.
390

_. Various years. World Population - Recent Estiwatesfor International Road Fedeation. 1991. World Road Statisticsthe Countries and Regions ofthe World Washington, D.C. 1960-J990. Washington, DC.U.S. Government Printing Office. Kravis, Irving Alan Heston. and Robert Summers. 1982.
U.S.S.R. Goskomstat. 1990. Demographic Yearbook of the World Product and Income: International Conmprisons ofUSSR, Moscow. Real Gross Product. United Nations and World Bank,
World Health Organization. 1991. Maternal Mortality - a Baltimore.Global Factbook, Geneva. Organization for Economic Cooperation and DevelopmenL
McGreevey, William. 1990. Social Security in Latin Amer- Department of Economics and Statistics. 1987. Purchas-lc: Issues and Options for the World Bank, World Bank ing Power Parities and Real Expenditures, 1985. Paris.Discussion Papers no. 110. Washington, D.C. U.N. Commission of the European Communities. 1987.
ILO data. World Comparisons of Purchasing Power and Real Prod-uctfor 1980. Phase IV. New York.
Natwol Resources and the Environment U.N. Department of Intemnational Economic and Social Af-fairs. 1983. Compendium of Human Settlement Statstics.
World Health Organization. 1976. World Health Satistics New York.Report, Volume 29. Geneva. _. Various years. Statistical Yearbook. New York.
-. 1987. Ihe International Drinking Water Supply and UNICEF. 1987. Staristics on Children in UNICEF AssistedSanitation Decade (as at December 1985). Geneva. Countries. New York.
. 1990. The International Drinking Water Supply and -. 1995. The State of the World's Children 1995. Oxford:Sanitation Decade ( as at December 1988). Geneva. Oxford University Press.
World Resources lstitute, International Institute for Envi- Wortd Bank. 1988.RoadDeterioration in Developing Coun-ronmental Development, United Nations Enviromnental tries: Causes and Remedies. Policy Study. Washington,Programme. 1988. World Resources, 1988/89 and D.C.1994095. New York. Basic Books, Inc. United Nations national accounts data.
Food and Agricultu Organization data. Government Ftnance Statistics (GFS), 1992. IM, Washing-WHO data. ton, D.C.
Inconme Investment in Hun Capital
Carlson, Beverly A., and Tessa M. Wardlaw. A Global, Ross, John, and others. 1993. Family Planing and Popula-Regional and CountryAssessment of Child Malnurition. tion. A Compendium of International Staisics. NewStaff Warldng Paper No. 7. New York. UNICEF. York: The Population CounciL
U.N. Administrative Committee on Coordination - Sub- UNESCO. 1989. Compendium of S=tistics on Illiteracy.comittee on Nutrition. 1994. Update on the Nutrition Paris.Situation. 1994. Geneva. __. Various years Statisticl Yearbook Paris.
U.N. Department of International Economic and Social Af- World Health Organization. 1986. World Health Saisticsfairs. Various years. Monthly Bulletin of Staistics. New Annual. Geneva.York. -. Programme for Control of Diarrhoeal Diseases. Sixth
World Bank. 1995. World Bank Atlas 1995. Washington, Programme Report, 1986-87. Geneva.D.C. . Programme for Control of Diarrhoeal DL-scs. Various
World Bank data. years. Interim Programme Report. Geneva._. Various years. Expanded Programme on Immunization.
Ependiture Information System. Summaryfor the WfO. Geneva.UNESCO data.
FAO. 1983. Food Aid in Figures. (December). Rome.
391

Classificatons of Economies
392

Table 1 Classfilcation or economies by income and region, 1995
Sub-Sahamn Africa Ask Europe and Central Asa Middle East and Noorh Africa
Eastand EastemIncon Southem East Ad and Eurweand Rest of Midle Norhgup Subroup Aft West Afrit Pacifc Souit Ask Central Asiff Eunpe East Africa Amnteis
Bunwidi Benin Cambodia Aightstan Albanla Yemen, Rep. Egypt, Aab GuyanComa.. Burkina Paso Cina Bmagladesh Arnmnia Rep. HaitiEribea Central African Lao PDR Bhutan Bosrda and HandurasEthopia Republic Mongolia India Hiezegovhna NicaraguaKenya Chad Myanmar Nepal GeorgiLesoho Cle d'lvore VietNam Paldstn TajikistanMadagascar Equatorial Sri LankaMalawi GuineaMorambique Gambia, The
LOUF Rwanda GhanaIncome Somala GuineaSudan Guhinea4issau
Tanzania liberiaUganda MaliZaire MauritaniaZaimbia NigerZimbabwe Nigeria
SloTomEand Pincdpe
Sierra LeoneTogo I
Angola Camern Fji Maldives Azebijn Turkey Iran, Islamic Algeria Belizelotswana Cape Verde Indonesia Bulgaria Rap. Morosco BoliviaDjibouti COngo Kiribati Croatia Isaq Tunisia ColambiaNamubia Senegal Korea Demn. Czech Jordan Cost RicaSwaziland Rep. Repubic Lebanon Cuba
Marshall Kazakhstan Syrimn Arab DouinicaIlands Kyrgyz Rep. Dominican
Micronesia Republic West Bank and RepublicPed. St. Latvia Gaza Fuador
N. Mariana I. Lithuania El SalvadorPapua New Macedoria Grenada
1ar Guinea FYRe GuatalaPlbfpins Moldoa JamaicaSolomon Pbland Panama
Islands Romania ParaguayThaiLnd Rwssb PeruTonga Fede' Atiom St VincentVanuatu Sovak and theWestern Samoa Republic Grenadins
Turkmeristan SurunmeUkranUzbeldstan
Middle- Yugoslvia,irons ___ _____ ______ ____ Fed. Rep. __..
Mauritius Gabon Amerian Belarus Gibraltar Bahrain Libya Antigua andMayotte Samoa Estoruia Greece Oman BarbudaReunion Guam Hungary hie of Man Saudi Arabia ArgentinaSeychelles Korea, Rep. Slovenia Mala ArubaSouth Afrsic Macao Portugal Barbados
Malaysia BrazilNew Caledonia Chile
French GuianaGuadeloupeMar&tique
Uppr Me2dcoNetherlands
AntillesPuerto Rico
l ~~~~~~~~~~~~~~~~~~~~~~~~~~~~~~~~~St. Kiftt and
Trinidada rdTobago
Uruguay
iasbuotak 170 27 23 26 8 27 6 10 538
393

Table 1 (coaenued
Sub-Sdrmn Afria Asia Europe and Central Asi .41 East and North AfriaEat wnd Eaton
Incme Southern EastAskand EurWeand Rest f Middfe Northgoup Subgrup Africa West Africa 1Wc South Ask Central Asi Europe East Africa Americas
Austalia Austria Canda1pa Begum Undted State
New Zealad Denmark
kdenOECD rkelandCuntries Italy
NetherlardsHig- Norwayhiome Sn
Sweden
UnitedKingdom
Brunei ___Andara sradl Batamas, TFefhidh Channel Kuwait Bemuda
NcnOECD Polrnesia Islands Qatar CayuanCountries Hong Kong Cprus United Arab ILdands
5pore Fawero Islands Emirteds VirginOAw CGenlmd iands (US)
-San M
Tat 2101 27 23 34 8 27 28 14 5 44
a. FormerYugaulavPRepublicofMcedonia.b. O0h Asian ecmwtans-Taiwan. China.
For opeational and analytical purposes the World Bank's main Definiflons of groupsciteion for classifying economnies is gmss national product (GNP) ThsntbIesclhllWoddBank.breDo.iies.andallodepercapita Every economy is classified as lw-income, Iddle-income ecnomies with populions of mome than 30,000.(subdivided into lower-middle and upper-niddle), or high-income.Otter analytical glOUps, based on geographic regions, expons, and Income group: Economies arc divided according to 1993 GNP perlevels of external debt, are also used. capita, calculated using the WorldBankAtlas method The gmups arc:
low-income. $695 or less; lower-middle-income, $6964S2,785;LSowmincome and middle-incomeecononmies are somefimes refeffed to upc'id1-nor $276965 n ibnoe '66o
as developng economes. The us of then ~ a. it. . usper-middle-income. 52.786-43,623; and high-income, $8,626 oras developing economics. Ihc use of the term iS convenient; it is notintended to imply that all economies in the group ar ecxperiencing morsimilar developmuentor that otber economies have reached a preferred The estimates for the republics of the former Soviet Union areor final stagp of delopment. Classification by income does not preliminary and their classificaton will be kept under eview.nercssarily refect development states.
394

Table 2 aamiflcatlon of economies by major export category and Indebtednss, 19fl
Low- md m,iddke-imeLau4ncme Midae-inw H fgincce
I Srverd Moderately Lkss Snmly Maduely las Not dhWsdGroup fndeqbkd indebled indebkd Indebted indebted debtWd by indebtdness OECD nmnOECD
Armenia BUloaria Hunapry Belarus Cansda Hong KogChina Polnd Ruiwa DIaP a Finland lellGeorp;a Fedeaton Ko1, Pep. Germany
Korea,Dn. Ieland ARep. Italy
lcyrgyz JapanRepubic Swede
--- annfact res Latvia Swituland
-Uthuania
MoldovaRomnaniaUlrine
______ UzbelislanAfghanistan Albania Mongla Argentina Che Bowwana A m Iceland Pirc IlandsBururdi Qnd Bolivia Papua New Guatemala Samoa New Zealand GreenlandCfe dlvoiue Malawi Cuba Guinea Namibia French GuianaEquatorial Togo Peru Paraguay Guadde peGuinea Zimbabwe S union
Elhiia IslandsGhan SL VmcentGuineal and theGuinea-Ifissau GxeradinesGuyana Surname
liberiaIEpon MdasdaSl
*.qtOIld Mal-J mfel Mau
products MyanmarNcaraguaNigerRwanda
and PrhinrpeSomaiSudanTanzaniaUgandaVietNamZaire
IZ_Za bia
NIgeiia Abla Algeia Bahrin BnmuCongo Gabon Ian, Islamic QataExhwim kaq Venezuela Rep. Uiled Arab-s s Libya Emiabtes
OfPfel Omark(mabdyoW Saudi Arabia
. ~~~~~~~~~~TrinidadandToago
Turkmenistan
Yemen, Rep. Ber.n hutan jmaica Anpgua and Barbados Ariba Unbied B_bmaa,TbheEgypt, Arab Bwkm Faso Jorda Baruda BRrE Cayan Kingdn Bemuda
Rep. Cabodia Panam Dominican Cape Verde Ilands CyprusGambiaThe Haiti Republic Djiboti MarFinique rndcNepal tesotho Greece ElSahlado Polbynsia
Westun F* KuwaitSamoa Grenada
Of sert.
SLKts andNevi
St Lucia
395

Table 2 (cnat nued)
Iaw- and midde-incomeLmz-inr.ome Middle-income High-income
Scrtiny Moderately Less Seuerdy Mademlely Less Not classifiedGroup indebled indebted indebted indebted indebted indebted by itdebtedness OECD nenOECD
Central Banglades&. Sri Lanka Brail Colombia Azerbaijan AustraliaAfrican Rep. Comoras Tajikistan Cameroon Costa Rica Dominica Austria
Kenya India Ecuador Indonesia Kazakhstan BelgiumLao PDR Pakistan Morocco Mexico Mahysih DenmarkMozambique Syrian Arab Philippine Mauritius France
Dirmrsified Sierra Leone Rep. Sena Netherlands Luxenbourgexporters Uruguay Tunisia Antilles Nethedands
Turkev Porugal NorwaySouth Africa SpainThailand United StatesYugoslavia,
_________ _________ _________ ~~~~ ~~~~~~Fed. Rep. _ _ _ __ _ _ _ _
Gibraltar Croatia Bosnia and AndorraCzeh -Channel
Republic Eritea IslandsMacedonia Guam San Marino
PYRe ksle of Man VirginNew Marshall Islands (US)
Not casifnd Caledonia slandstytn iSovak Mayottenctegory Republic Micronesiatq" ~~~~~~~~~ ~~~~~~~~~~~~Slovenia Fed. Sts.
NortherMarianIslands
Puerto RicoWest Baikand Gaza
Number qftInomies 2101 33 13 _ 11 18 20 59 17 21 18a. Other Asian econoies-Taiwan, China.b. Ecmais inwhkb no single export category accouns for more than 50 percent of total exporC. Former Yugoslav Republic of Macedonia.
Definitions of groups
Thesetablesclassify all WorldBank membereconomies, plus allother to GNP (80 percenl) and present value of debt service to expons (220economies with populations of more than 30,000. percent). Moderately indebted means either of the two key ratios
Major export category: Major exports arc those that account for 50 exceeds 60 percent of. but does not reach, the cridcal levels. Forperrntorn eof totl exports of goods and services from one economies thatdo not report detailed debt statistics to theWorld Bank
cetentgory. inlthe pcriod 1988-92. Ilc catcgories arr- nonfurI primary Debtor Reporting System, present-value calculation is not possible.category, in the period 1988-92. The categories arc: nonfuel pnmaryehdloyi se ocasiyte o-R(SITbC O. I 2 4. plus 68). fuels (SIT{: 3). manu facture (SITC 5 to 9, Instead the following methodology Is used to classify the non-DRSlesT 01, pius 68). (factor and nonfactor service receipts plus economi Severelyindebedmeansthreofforkeyratios(averaged
workerss re6) ittances) If no single category accounts for 50 percent over 1991-93) are above cridcal levels: debt to GNP (50 percent); debtOr moke of total expons) the sconomy is clao ified as df5er50ped n to exports (275 percent), debt service to exports (30 percent): and
o e o x , e y l i d e intst to exports (20 percent). Moderately indebted means three ofIndebtedness: Standard World Bank definitions of severe and four key ratios exceed 60 percent of, but do not reach, the criticalmoderate indebtedness, averaged over three years (1991-93) are used levels. All other classified low- and middle-income economies areto classify economies in this table Severely indebted means either of listed as lessindebted.
the two key ratios is above critical levels: present value of debt service
396
d36 096 9 A HE lg I'm g 9
0Is8Al I .1
91 1 g 9 z 9 ig go
31.6 b: W I 11
-1199 A 9 Ag2Iffis I Ag 9A 03
u3: uhi
1pi cdjius!
C& -C 8" Ea i'sWall nug� n"joild Is- If mi

=~~~~~~~~~~~~~~~~~~~ -*-- *E> a _ , ,- i .;!, .;; X r.;., -* -;
. .. <. ._:.. ._,..:*1 .- .r.: ...-|. I: _- 7 ; *E
E THE WORLD BANK / BANQUE MONDIALE / BANCO MUNDIAL
DATA ON CD-ROM AND DISKETTE
All data series in the annual publications described below are available in time series on W/rid*Data 1994: Worlk Bank Indwors on CD-ROM.This product feaLures over 700 time-seres indicators for the period 1960-92 for 209 countries, as well as the full text of Trfnek in DevelopingEconomic 1994. The CD-ROM cmploys the World Bans *srARs* retrieval system, which allows users to view and manipulate the data and toexport it to many di&rent program formats. WorkJ7Dta requires an IBM-ompatible computer rmnning DOs 2.1 or higher, a CD-ROM reader, andat least 512x of available memory.
The data series for the individual publications described below are also available in time series on 3.5-inch diskertes in the *STARS* retrieval sys-tem. *STARS* diskette products require an sM-compatible computer running DOS 2.1 or higher and 512K or more of available memory.
WORLD DEBT TABLES 1994-95
Provides complete and up-to-date dara on the debt and international capital flows of developing countries. This two-volume ser gives debt data for137 countries. Volume I analyzes and summarizes oeternal finance for developing countries. Data presented in both volumes are compiled fromthe World Bank's exclusive Debtor Reporting System. The tables give statistics by country on public and publicly guaranteed long-term debt. pri-vate nonguaranteed long-term debt. short-term dcbt, and [nuernational Monetay Fund credits. Indicators report on debt outstanding, undisburseddebt, commitments, disbursements, repayments of principal, net flows, interest payments, and net transfers. Also provided are data on the currencycomposition of long-term debr, debt restrucuing, and debt service pmjections. Aggregate dat are prescnted for all countries and for selectedgroups, including principal borrowers and highly indebted countrics. The Extract volume contains summaries in English, French, and Spanish.
TRENDS IN DEVELOPING ECONOMIES 1995
This annual collection of profiles of economic conditions in devcloping economies is onc of the World Bankes most eagerly awaited statistical pub-lications. The seventh edition analyzes the recent economic performance of approximately 115 economies. The reports describe each country's eco-nomic feaurcs, current socioeconomic issues. and prospes and summarize national development stmtegies Statistical tbles are designed to givefast access to key data on economic and social indicators and are accompanied by graphs. Most indicaors include data for the 1980s and for1992-94. The *srTAs* diskettes indlude time-series data for 1980-94, with links between data tables and text
TRENDS IN DEVELOPING ECONOMIES 1995 EXTRACTS: VOL. 1. EASTERN EUROPE ANDCENTRAL ASIA. VOL. 2. EMERGING CAPITAL MARKETS. VOL. 3. SUB-SAHARAN AFRICA
Three regonal extracts from Trends in Developing Economics present brief analytical descriptions and data on recent socioeconomic performanceand trends. Volume 1 covers 20 economies of Eastern Europe and the former Soviet Union. Volume 2 concentraes on 22 developing countrieswhere stock markers have grwn rapidly since the early 1980s and foreign invcstment has increased since 1989. Volume 3 presents individual pro-files of 40 Sub-Saharan African countries
WORLD DEVELOPMENT REPORT 1995
This seies, now in its eighteenth year, has been described as "the most influential document in setting the agenda for the development debatc."WV/m Deveopmrnt Report 1995 focuses on workers in an integating world. The Report evaluates development strategies for increasing incomes,opportnities for and threats to integration, the role of domestic labor market policies, and the experience of workers in countries going throughmajor changes from cental planning or protectionismL It indudes the World Development Indicator-staisc tables that provide instant accessro the most comprehensive and cuzrenr data available on social and ecnomic development in more than 200 economies, indcluding the countries ofthe former Soviet Union and the Eastern and Central European economnies. Topics range from agricultural production t inrmnational trade.
WORLD TABLES 1995
The most detailed colleccion of economic data published by the World Bak This edition provides economic, demographic. and social data forabout 164 economies plus basic indicLtors for an additional 45 economies. Thc time series spans 1973 to 1993. Data are organized by topic and bycounry. The topical pages reporr GNP, GDP. doimestc savings and invesrment, imnports and cxports, and other economic indicators for individualcountries, geographic regions, and income groups. The country pages consist of four-page tables for most of dte World Bank's members, presentingdata on GxP per capita, population, origin and use of resources. domestic prices, manuacturing activity, monetary holdings, central governmentfinances, foreign trae, balance of payments, and external debL
i 0t94---t
THE JOHNS HOPKINS UNIVERS I nternal DocueernetL. LUlni.t,COVER DESIGN BY BRIAN NOVE H B1-1951 ISBN 0-8018-5021-5

