
SO 6-2014 NGAY.........indd - Tập đoàn Dầu khí Việt Nam
80
-
Upload
khangminh22 -
Category
Documents
-
view
2 -
download
0
Transcript of SO 6-2014 NGAY.........indd - Tập đoàn Dầu khí Việt Nam


PETROVIETNAM JOURNAL IS PUBLISHED MONTHLY BY VIETNAM NATIONAL OIL AND GAS GROUP
Editor-in-chief
Dr. Sc. Phung Dinh Thuc
Deputy Editor-in-chief
Dr. Nguyen Quoc ThapDr. Phan Ngoc TrungDr. Vu Van Vien
Editorial Board Members
Dr. Sc. Lam Quang ChienDr. Hoang Ngoc DangDr. Nguyen Minh DaoBSc. Vu Khanh DongDr. Nguyen Anh DucMSc. Tran Hung HienDr. Vu Thi Bich NgocMSc. Le Ngoc SonEng. Le Hong ThaiMSc. Nguyen Van TuanDr. Le Xuan VeDr. Phan Tien VienDr. Nguyen Tien VinhDr. Nguyen Hoang Yen
Secretary
MSc. Le Van KhoaM.A. Nguyen Thi Viet Ha
Management
Vietnam Petroleum Institute
Contact Address
16th Floor, VPI Tower, Trung Kinh Street,Yen Hoa Ward, Cau Giay District, Ha NoiTel: (+84-04) 37727108Fax: (+84-04) 37727107Email: [email protected]: 0982288671
Designed by
Le Hong Van
Publishing Licence No. 100/GP-BTTTT dated 15 April 2013 issued by Ministry of Information and Communications
Cover photo: A geological structure in Phan Thiet, Binh Thuan Province. Photo: Le Khoa

3PETROVIETNAM - JOURNAL VOL 6/2014
PETROVIETNAM
Earlier, at the International Press Conference on Developments in the East Sea on 23 May 2014,
Dr. Do Van Hau, President and CEO of Petrovietnam, affirmed Petrovietnam was assigned by the Government of Vietnam to manage and carry out oil and gas activities in the exclusive economic zone and continental shelf of Vietnam. Vietnam has carried out petroleum exploration and production activities in the continental shelf and exclusive economic zone of Vietnam before 1975.
According to Dr. Nguyen Quoc Thap, during the past 40 years, Petrovietnam has carried out normal oil and gas exploration and production activities in the continental shelf and the exclusive economic zone of Vietnam, including Hoang Sa (the Paracels) and its surrounding areas. Petrovietnam has been and will continue co-operating with foreign petroleum companies to explore and produce oil and gas in the entire exclusive economic zone and continental shelf of Vietnam. Until now, Petrovietnam has signed over 100 contracts on oil and gas exploration and production, in which 61 contracts are still valid. The oil and gas exploration and production on the sea and the continental shelf of Vietnam have reached over 500,000km of 2D seismic survey, over 50,000km2 of 3D seismic survey and about 900 drilling wells. All the oil
and gas activities are conducted within the continental shelf and the 200 nautical mile exclusive economic zone of Vietnam.
From 1969 - 1970, Vietnam conducted 2D seismic survey of over 12,000km together with magnetic and airborne gravity surveys in the continental shelf of South Vietnam (the works were done by Ray Geophysical Mandrel). During 1973 - 1974, Vietnam co-operated with Western Geophysical and Geophysical Services Inc. (US) to conduct 2D seismic surveys. In which, WA74-HS project (3,373km) surveyed the offshore area of the Central Region of Vietnam that covered Hoang Sa archipelago of Vietnam, including the current oil and gas Blocks 141, 142, 143 and 144; and WA74-PKB project (5,328km) surveyed the Phu Khanh offshore area.
During the 1985 - 1993 period, Petrovietnam conducted seismic surveys in the Central offshore region using the Malugin ship (former Soviet Union); and co-operated with NOPEC (Norway) to conduct seismic, magnetic and gravity survey in the area of 100 to 150 latitude, including Hoang Sa archipelago and its surrounding areas. In 1993, the Hanoi University and the University of Paris VI used the Atalante ship (France) to conduct the “Ponagar” survey
On 16 June 2014, at the
International Press Conference
on Developments in the East Sea,
Dr. Nguyen Quoc Thap, Vice
President of Petrovietnam,
re-affirmed that all the oil and gas
activities of Vietnam have been
carried out entirely in Vietnam’s
continental shelf and exclu-
sive economic zone, which are
determined in accordance with the
1982 UN Convention on the Law of
the Sea.
Vietnam’s oil and gas exploration and production activities in the East Sea
Dr. Nguyen Quoc Thap, Vice President of Petrovietnam, spoke at the International Press Conference on Developments in the East Sea. Photo: PVN
6 PETROVIETNAM - JOURNAL VOL 6/2014
FOCUS
WPC is known as the "Olympics of the oil and gas industry" which includes all the content of
every sector of the petroleum industry, from scientific and technological advances in upstream and downstream to the role of natural gas and renewable energy sources, and the management of social, economic and environmental impacts of these energy sources.
As the largest international event in the world in the field of oil and gas, WPC is the venue for oil and gas companies from across the globe exhibit, display and introduce scientific and technical achievements as well as the most advanced technologies in the world in the oil and gas sector. This is also a forum where managers and leaders of oil and gas businesses and petroleum service providers meet to update and exchange experiences as well as to share the development trends of the oil and gas industry in the future.
With the theme “Responsibly Energising a Growing World”, the 21st WPC attracted the participation of more than 100 ministers and top-level managers, 5,000 delegates and 500 speakers. The exhibition was participated by 500 companies from over 50 countries and 25,000 visitors. The technical programme of WPC focused on 4 thematic blocks: exploration and production of oil and natural gas; refining, transportation and petrochemistry; natural gas processing, transportation and marketing, and sustainable management of the industry.
In the framework of this important event, Petrovietnam showcased an exhibition booth with the participation of 6 subsidiaries, including Petrovietnam Exploration Production Corporation (PVEP), Vietsovpetro Joint Venture, Petrovietnam Drilling and Wells Services Corporation (PV Drilling), Petrovietnam Technical Services Corporation (PTSC), Petrovietnam Gas Corporation - JSC (PV GAS), and Binh Son Refining and Petrochemical Company Limited (BSR). With a modern design, the Petrovietnam’s exhibition booth highlighted the Group’s capability and potential such as: oil and gas exploration and production, refinery and petrochemistry, gas industry, and high-quality petroleum technical services. On the opening day of the congress and exhibition, H.E. Mr. Vu Huy Hoang, Minister of Industry and Trade of Vietnam visited the exhibition booth of Petrovietnam and appreciated the participation of the Group in this important event.
On the sideline of the World Petroleum Congress and in the witness of Minister Vu Huy Hoang, on 16 June, 2014, Petrovietnam’s President and CEO Dr. Do Van Hau, Rosneft’s President, Chairman of the Management Board Igor Sechin, and General Director of Zarubezhneft Sergey Kudryashov signed a Memorandum of Understanding (MOU) in the field of geological exploration in offshore Blocks 125 and 126, some open blocks and other contracted blocks in the Phu Khanh basin, in the continental shelf of Vietnam. The signing of this MOU creates an important development
Petrovietnam attends the 21st
Dr. Do Van Hau, President and CEO of the
Vietnam Oil and Gas Group (Petrovietnam),
attended the 21st World Petroleum Congress
(WPC) held in Moscow from 16 - 20 June 2014.
Many important documents have been signed,
and meetings and working sessions with major
partners took place, contributing to
strengthening and promoting co-operation
between Petrovietnam and Russia’s oil and gas
companies.
World Petroleum Congress
Vietnam’s Minister of Industry and Trade Vu Huy Hoang witnessed the signing of MOU between Petrovietnam, Rosneft, and Zarubezhneft. Photo: PVN
NEWS
FOCUS
SCIENTIFIC & TECHNOLOGICAL PAPERS
11
20
24
28
34
48
53
62
57
69
70
71
72
Building porosity model of fractured basement reservoir based on integrated seismic and well data in Hai Su Den field, Cuu Long basin
Evaluation of water saturation in the low resistivity reservoir of Te Giac Trang field, Block 16-1, Cuu Long basin, offshore Vietnam
Microbubble drilling fluid (aphron): New technology for drilling in depleted reservoirs
Potential stratigraphic play in the Western Ha Long basin from 3D seismic inversion and regional geological context
Triethylamine template location within CoAlPO-34 type materials by high-resolution powder diffraction and single-crystal diffraction techniques
Synthesis of crude oil pour point depressants via polycondensation of cashew nut shell liquids
Competitive adsorption removal of sulphur compounds in gasoline using X zeolite
Corporate social responsibility - Comparative analysis from Petrovietnam and Vinatex
Using nanocomposites of chitosan and montmorillonite for adsorption of heavy metal ions from wastewater
PV GAS signed a MOU and framework contract with Shell to purchase liquefied natural gas (LNG)
First oil from Thang Long field
VPI-CPSE awarded a certificate of eligibility for environmental monitoring services
PVFCCo’s Petrochemical Manufacturing Facility supplies more than 5,000 drums of products to the market
CONTENTS

3PETROVIETNAM - JOURNAL VOL 6/2014
PETROVIETNAM
Earlier, at the International Press Conference on Developments in the East Sea on 23 May 2014,
Dr. Do Van Hau, President and CEO of Petrovietnam, affi rmed Petrovietnam was assigned by the Government of Vietnam to manage and carry out oil and gas activities in the exclusive economic zone and continental shelf of Vietnam. Vietnam has carried out petroleum exploration and production activities in the continental shelf and exclusive economic zone of Vietnam before 1975.
According to Dr. Nguyen Quoc Thap, during the past 40 years, Petrovietnam has carried out normal oil and gas exploration and production activities in the continental shelf and the exclusive economic zone of Vietnam, including Hoang Sa (the Paracels) and its surrounding areas. Petrovietnam has been and will continue co-operating with foreign petroleum companies to explore and produce oil and gas in the entire exclusive economic zone and continental shelf of Vietnam. Until now, Petrovietnam has signed over 100 contracts on oil and gas exploration and production, in which 61 contracts are still valid. The oil and gas exploration and production on the sea and the continental shelf of Vietnam have reached over 500,000km of 2D seismic survey, over 50,000km2 of 3D seismic survey and about 900 drilling wells. All the oil
and gas activities are conducted within the continental shelf and the 200 nautical mile exclusive economic zone of Vietnam.
From 1969 - 1970, Vietnam conducted 2D seismic survey of over 12,000km together with magnetic and airborne gravity surveys in the continental shelf of South Vietnam (the works were done by Ray Geophysical Mandrel). During 1973 - 1974, Vietnam co-operated with Western Geophysical and Geophysical Services Inc. (US) to conduct 2D seismic surveys. In which, WA74-HS project (3,373km) surveyed the off shore area of the Central Region of Vietnam that covered Hoang Sa archipelago of Vietnam, including the current oil and gas Blocks 141, 142, 143 and 144; and WA74-PKB project (5,328km) surveyed the Phu Khanh off shore area.
During the 1985 - 1993 period, Petrovietnam conducted seismic surveys in the Central off shore region using the Malugin ship (former Soviet Union); and co-operated with NOPEC (Norway) to conduct seismic, magnetic and gravity survey in the area of 100 to 150 latitude, including Hoang Sa archipelago and its surrounding areas. In 1993, the Hanoi University and the University of Paris VI used the Atalante ship (France) to conduct the “Ponagar” survey
On 16 June 2014, at the
International Press Conference
on Developments in the East Sea,
Dr. Nguyen Quoc Thap, Vice
President of Petrovietnam,
re-affi rmed that all the oil and gas
activities of Vietnam have been
carried out entirely in Vietnam’s
continental shelf and exclu-
sive economic zone, which are
determined in accordance with the
1982 UN Convention on the Law of
the Sea.
Vietnam’s oil and gas exploration and production activities in the East Sea
Dr. Nguyen Quoc Thap, Vice President of Petrovietnam, spoke at the International Press Conference on Developments in the East Sea. Photo: PVN

4 PETROVIETNAM - JOURNAL VOL 6/2014
FOCUS
to measure gravity, magnetic and seismic data and to take surface layer samples in Hoang Sa waters, the Centre and the Southeast region of Vietnam.
From 1996 until now, Petrovietnam and foreign oil and gas companies have carried out activities within the continental shelf and the 200 nautical mile exclusive economic zone of Vietnam, in total conformity with the 1982 UN Convention on the Law of the Sea (UNCLOS). Since 2007, Petrovietnam has carried out many 2D seismic survey projects: survey of Vietnam’s entire continental shelf (done by TGS NOPEC of Norway); survey of East Phu Khanh (done by PGS Singapore); surveys CSL-07, PV-08, PK-10, and PVN12 in Hoang Sa archipelago and its surrounding areas. Most recently, in April 2014, Petrovietnam in co-operation with Murphy Oil (US) has completed 2D seismic survey for 5,000km in the South of Hoang Sa archipelago.
Besides the survey and oil exploration activities in the fi eld, Petrovietnam has also conducted many researches and assessments of hydrocarbon potentials in the entire continental shelf and the exclusive economic zone of
The “Assessment of hydrocarbon potential of Vietnam’s territorial waters and continental shelf” project presided over and conducted by the Vietnam Petroleum Institute (under the Master Plan for “Basic survey and integrated management of marine resources until 2010 and vision to 2020") has been assessed as one of the projects which have made new and valuable contributions to petroleum geology. According to Dr. Phan Ngoc Trung, General Director of the Vietnam Petroleum Institute, from the basic survey studies conducted, the institute has created a reliable and constantly-updating scientific database of hydrocarbon potential and reserves in the territorial waters and the continental shelf of Vietnam to facilitate the formu-lation of policies and development strategies for oil and gas prospecting, exploration and production; and proposed measures for the State of Vietnam to manage and rationally exploit the marine resources in a scientific, effective and efficient manner, satisfying the requirements for sustainable economic development and contributing to safeguarding the national sovereignty and security.

5PETROVIETNAM - JOURNAL VOL 6/2014
PETROVIETNAM
PETROVIETNAM OPPOSES CHINA’S ILLEGAL OIL AND GAS ACTIVITIES
At the recent press conferences in Hanoi, Petrovietnam has strongly protested China’s illegal deployment of Haiyang Shiyou oil rig 981 on 2 May 2014 and China’s statement at 16 May 2014 press conference in Beijing that “57 oil blocks are located in disputed waters”.
Petrovietnam reaffi rms that China’s nine-dotted line claim is groundless, which is not recognised by the international community and its statement that Vietnam’s 57 oil blocks are located in the disputed waters is ill-founded and invalid. China has intentionally attempted to turn undisputed waters into disputed areas with its irrational claims. In reality, this area is located fully within Vietnam’s continental shelf and its 200 nautical mile exclusive economic zone.
This is not the fi rst time China carried out illegal activities violating Vietnam’s waters. For China’s previous violations, Vietnam has voiced its protest through diplomatic channels, debate together with other on-site communication measures to prevent China from violating Vietnam’s seas. Following are a number of activities carried out by China in violation of Vietnam’s continental shelf and exclusive economic zone that were protested and prevented by Vietnam.
In 2003, oil rig Katan III attempted to drill in the East of Block 113. This was strongly protested by Vietnam.
In 2006, China conducted 2D seismic survey near Tri Ton island of Vietnam using vessel Fen Dou 4. Vietnam’s law enforcement took preventive measures.
In 2007, China conducted 3D seismic survey with Western Geco’s ship. Petrovietnam summoned Western Geco’s representative to demand an end of this activity as it violdated Vietnam’s continental shelf and exlusive economic zone, and warned the survey vessel that it would not be allowed to participate in the bidding for projects in Vietnam.
During 2007 - 2008, China leased TransOcean’s drilling rig to carry out drilling activities in Hoang Sa areas. As a result of Petrovietnam’s strong opposition, TransOcean refused to co-operate with China in the drilling.
From June to August 2010, China leased Western Spirit vessel to conduct 3D seismic survey in Blocks 141-143 near Tri Ton island despite Vietnam’s protest. China’s vessels threatened Vietnam’s vessels using water cannons, sirens and turned the artillery guns towards Vietnam’s vessels.
In September 2010, Chinese ship Fen Dou 4 carried out activities about 80 - 90 nautical miles away from the East of Ly Son island. This led to an attempt by the Vietnam’s law enforcement vessels to prevent, call upon and drive the Chinese vessel to withdraw from this area.
From June to July 2011, Chinese research vessel, the Tanbaohao, conducted activities about 28 nautical miles from the West of Tri Ton island (Blocks 141 - 143). This led to an eff ort by the Vietnamese law enforcement vessels to prevent and drive away this Chinese vessel.
In 2012, the CNOOC released an illegal invitation of international bids for Vietnam’s 9 blocks in the Central region of Vietnam which was rejected by international oil and gas companies.
In Tu Chinh area, China illegally signed a petroleum contract for the WAB-21 area with Crestone Energy, which later transferred to Harvest. Until now, there are no activities undertaken by these companies.
Vietnam, including Hoang Sa and Truong Sa archipelagos (the Paracel and the Spratly islands), as well as Tu Chinh - Vung May. There have been various researches and reports made by local and international authors on assessment of the geological structure and hydrocarbon potential in Hoang Sa archipelago and the surrounding areas. The petroleum researches in this area have been presented by many Vietnamese and foreign authors at various international seminars and conferences, and were highly recognised and appreciated.
The leaders of Petrovietnam affi rmed Petrovietnam has been carrying out its normal oil and gas exploration and production activities in the continental shelf and the exclusive economic zone of Vietnam, including Hoang Sa archipelago and its surrounding areas. In the coming period, Petrovietnam together with foreign oil and gas companies will continue to carry out activities as normal in Vietnam’s continental shelf and 200 nautical mile exclusive economic zone as it has continually done during the past 40 years.
Nguyen Hoang

6 PETROVIETNAM - JOURNAL VOL 6/2014
FOCUS
WPC is known as the "Olympics of the oil and gas industry" which includes all the content of
every sector of the petroleum industry, from scientifi c and technological advances in upstream and downstream to the role of natural gas and renewable energy sources, and the management of social, economic and environmental impacts of these energy sources.
As the largest international event in the world in the fi eld of oil and gas, WPC is the venue for oil and gas companies from across the globe exhibit, display and introduce scientifi c and technical achievements as well as the most advanced technologies in the world in the oil and gas sector. This is also a forum where managers and leaders of oil and gas businesses and petroleum service providers meet to update and exchange experiences as well as to share the development trends of the oil and gas industry in the future.
With the theme “Responsibly Energising a Growing World”, the 21st WPC attracted the participation of more than 100 ministers and top-level managers, 5,000 delegates and 500 speakers. The exhibition was participated by 500 companies from over 50 countries and 25,000 visitors. The technical programme of WPC focused on 4 thematic blocks: exploration and production of oil and natural gas; refi ning, transportation and petrochemistry; natural gas processing, transportation and marketing, and sustainable management of the industry.
In the framework of this important event, Petrovietnam showcased an exhibition booth with the participation of 6 subsidiaries, including Petrovietnam Exploration Production Corporation (PVEP), Vietsovpetro Joint Venture, Petrovietnam Drilling and Wells Services Corporation (PV Drilling), Petrovietnam Technical Services Corporation (PTSC), Petrovietnam Gas Corporation - JSC (PV GAS), and Binh Son Refi ning and Petrochemical Company Limited (BSR). With a modern design, the Petrovietnam’s exhibition booth highlighted the Group’s capability and potential such as: oil and gas exploration and production, refi nery and petrochemistry, gas industry, and high-quality petroleum technical services. On the opening day of the congress and exhibition, H.E. Mr. Vu Huy Hoang, Minister of Industry and Trade of Vietnam visited the exhibition booth of Petrovietnam and appreciated the participation of the Group in this important event.
On the sideline of the World Petroleum Congress and in the witness of Minister Vu Huy Hoang, on 16 June, 2014, Petrovietnam’s President and CEO Dr. Do Van Hau, Rosneft’s President, Chairman of the Management Board Igor Sechin, and General Director of Zarubezhneft Sergey Kudryashov signed a Memorandum of Understanding (MOU) in the fi eld of geological exploration in off shore Blocks 125 and 126, some open blocks and other contracted blocks in the Phu Khanh basin, in the continental shelf of Vietnam. The signing of this MOU creates an important development
Petrovietnam attends the 21st
Dr. Do Van Hau, President and CEO of the
Vietnam Oil and Gas Group (Petrovietnam),
attended the 21st World Petroleum Congress
(WPC) held in Moscow from 16 - 20 June 2014.
Many important documents have been signed,
and meetings and working sessions with major
partners took place, contributing to
strengthening and promoting co-operation
between Petrovietnam and Russia’s oil and gas
companies.
World Petroleum Congress
Vietnam’s Minister of Industry and Trade Vu Huy Hoang witnessed the signing of MOU between Petrovietnam, Rosneft, and Zarubezhneft. Photo: PVN

7PETROVIETNAM - JOURNAL VOL 6/2014
PETROVIETNAM
in the strategic co-operation relationship between Petrovietnam and its Russian partners. Along with the contracts in Vietnam, Rosneft, Zarubezhneft and other Russian oil and gas companies continue extending the co-operation with Petrovietnam in Russia and consider potential opportunities for co-operation in third countries.
During the time participating in WPC, the Petrovietnam leader also had meetings and bilateral working sessions with the senior leaders of Russia’s major oil and gas corporations and international oil and gas partners.
On 16 June, at Zarubezhneft’s exhibition booth, Mr. Sergey Kudryasov, General Director of Zarubezhneft, received the Vietnamese Minister of Industry and Trade and Petrovietnam’s President and CEO. During the meeting, Minister Vu Huy Hoang highly appreciated the results of co-operation between Petrovietnam and Zarubezhneft in the framework of Vietsovpetro and Rusvietpetro joint ventures.
On 17 June, Dr. Do Van Hau had a meeting with Mr. Vitaly Markelov, Vice Chairman of the Gazprom Management Committee. At the meeting, the two sides had a candid discussion on current problems in the implementation of oil and gas joint venture projects in the continental shelf of Vietnam and Russia. In addition, the two sides exchanged views on promoting co-operation in other fi elds such as refi nery and petrochemistry, training and use of gas as motor fuel.
On this occasion, Petrovietnam and Gazprom EP International also signed a Joint Operation Agreement and a Joint Condensate Sales Agreement. These are two fi nal documents to legally complete the participation
of Gazprom EP International in the gas project of Blocks 05-2 and 05-3. At a meeting after the signing ceremony, the two sides discussed Vietgazprom’s programme of activities at the blocks in the continental shelf of Vietnam. Specifi cally, the two sides agreed to speed up the implementation of the necessary works for additional drilling campaign to increase reserves in Bao Vang and Bao Den fi elds. In addition, Petrovietnam’s President and CEO agreed the way to develop and implement the automobile fuel project and shared the opinion to early seek opportunities for joint investment in third countries.
On 20 June, the Petrovietnam delegation had a meeting with Mr. Alexander Dyukov - Chairman of the Management Board and CEO of Gazprom Neft, a subsidiary of Gazprom Group. Currently, Gazprom Neft is negotiating with Petrovietnam and Vietnam’s ministries and agencies on its participation in the project to expand and upgrade Dung Quat Refi nery. Dr. Do Van Hau appreciated Gazprom Neft’s eff orts and requested it to reach early agreement on the project’s technical plans as the basis for preparation of documents to submit to the government. In addition, the two sides discussed expansion of co-operation in the fi eld of exploration and production in Russia.
Also, on the sideline of the 21st WPC, Petrovietnam’s President and CEO also met and exchanged with leaders of Exxon Mobil, Chevron, Shell, JGC, and PDVSA...
The mission of Petrovietnam to Russia has made important contributions to advancing the Vietnam - Russia comprehensive strategic partnership, in which favourable conditions are created for the development of the oil and gas sector.
Manh Hoa
Dr. Do Van Hau, Petrovietnam’s President and CEO at a working meeting with Gazprom Neft’s leaders. Photo: PVN

8 PETROVIETNAM - JOURNAL VOL 6/2014
FOCUS
The Petrovietnam Scientifi c and Technological Council
held the 1st meeting of its 2014 - 2016 tenure in Hanoi on 4 June 2014. The Council adopted the Regulation on organisation and activities of the Council for the new tenure; and discussed important issues such as the implementation of Petrovietnam restructuring plan, the focal tasks for the 2014 - 2015 period; announcements of the petroleum geology in the East Sea; security and safety of off shore petroleum activities in the current situation.
Opening the meeting, Dr. Nguyen Quoc Thap, Vice President of Petrovietnam and Chairman of Petrovietnam Scientifi c and Technological Council, emphasised: "The scientifi c and technological activities in the Group have always
been identifi ed as one of the important measures to promote the production and business of Petrovietnam. The Petrovietnam Scientifi c and Technological Council has an advisory role to the Group leaders for the diffi culties and problems and the orientation of scientifi c research of the entire Group”. Dr. Nguyen Quoc Thap also requested the Council’s members to further exert their role and responsibility in order to actively make scientifi c and intellectual contribution to the activities of the Council and the development of Petrovietnam.
With regard to the restructuring plan, the Council reckoned that the focal tasks for 2014 - 2015 are to complete the equitisation and transformation of 2 units, i.e. Petrovietnam Ca Mau Fertilizer Company Limited (PVCFC) and Binh
Petrovietnam Scientific and Technological Council
At the 1st meeting of its
2014 - 2016 tenure, the Petroviet-
nam Scientifi c and Technological
Council spent considerable time
discussing and evaluating the results
of more than one year implementing
the Plan for Petrovietnam restruc-
turing in accordance with the Prime
Minister’s Decision No. 46/QD- TTg.
On the focal tasks of the 2014 - 2015
period, Petrovietnam will continue
to carry out drastic restructuring
activities, implement the divestment
plan most effi ciently, and equitise
some key units before 2015.
FOCUSES ON RESTRUCTURING THE GROUP
Dr. Do Van Hau, President and CEO of Petrovietnam, spoke at the meeting. Photo: Le Khoa

9PETROVIETNAM - JOURNAL VOL 6/2014
PETROVIETNAM
Son Refi ning and Petrochemical Company Limited (BSR); and to prepare the conditions for equitisation of Petrovietnam Power Corporation (PV Power) before 2015. As for the biofuel projects, the Council suggested the Group instruct to accelerate the development of a distribution network, disseminate information and enhance awareness of the benefi ts of using biofuel, thereby enabling the continued development of the projects. The Council also proposed that no more member companies grade IV be established and the Group quickly divest from the existing member companies grade IV, except those approved to be maintained.
Concerning announcements of the petroleum geology in the East Sea, Chairman of the Vietnam Petroleum Association Ngo Thuong San proposed that in the coming period, Vietnam should expand basic surveys, aggregate the state research programmes with international involvement, and have them published in the world magazines. At the same time, international petroleum workshops and conferences should be organised periodically with the broad participation of foreign scholars. It would also be necessary to co-operate with some large foreign publishers for publication of the result of researches conducted by Vietnam.
Regarding the safety and security of petroleum activities in the East Sea, the Group has established and safeguarded the safety zone and corridor of off shore petroleum installations, as well as set up emergency response mechanisms. In view of the increasingly
complex evolvements in the East Sea, the Scientifi c and Technological Council reckoned that it is important to strengthen the steering committees for emergency situations; regularly update plans to respond to emergency circumstances that may compromise security and safety; closely co-ordinate with Vietnam's law enforcement forces to ensure the security and safety of petroleum activities; and pro-actively, timely and eff ectively respond to any emergency circumstances that may arise.
Delivering the key-note address at the meeting, Dr. Do Van Hau, President and CEO of Petrovietnam, asked for the Council’s detailed opinions on the overseas investment projects of the Group as well as the guidelines for handling the biofuel plants invested by Petrovietnam’s member companies, especially measures to increase the design capacity. Dr. Do Van Hau also suggested the Vietnam Petroleum Institute boost co-operation with the research institutions at home and the Group’s researches be published in the prestigious international journals. Regarding petroleum security in the East Sea, the Petrovietnam’s leader noted the Council should consider and propose solutions for the Group to report to the Government in order to strengthen the security of the off shore petroleum projects. He also requested the Council, scientists, experts and managers to actively contribute opinions to the formulation of Petrovietnam’s Development Strategy until 2025, and orientations towards 2035, in which the goals for development of the key production and business areas shall be clearly defi ned and the resources for development projected. Le Khoa
Petrovietnam has contributed 7.24 billion kWh of electricity to the national grid in fi rst 5 months of 2014. Photo: PV Power

10 PETROVIETNAM - JOURNAL VOL 6/2014
FOCUS
Petrovietnam has over-fulfi lled all its goals for the fi rst 5 months of 2014. In the reviewed period,
Petrovietnam has been constructing 17 exploration wells (in which 9 wells have been completed and 8 wells are ongoing), made one new petroleum discovery (HRN-1X, Block 102 - 106/10); and put one new fi eld into operation (Diamond fi eld). Total oil and gas production reached 11.56 million tons, which is equal to 112% of the 5-month plan, and 45% of the yearly plan. Of this fi gure, oil accounted for 7.08 million tons, and gas 4.48 billion m3. Besides, Petrovietnam has contributed 7.24 billion kWh of electricity to the national grid, produced and provided 695 thousand tons of urea fertiliser and 2.39 million tons of various petroleum products. By the end of May 2014, Petrovietnam has earned a total revenue of 301.2 trillion VND and contributed to the State Budget 71.7 trillion VND.
Thrift practice and waste combat are seriously deployed across the Group. All member units have implemented the Programme of Action for expenditure reduction and lower production costs. As a result, in 5 months of 2014, the Group has cut costs by 300 billion VND, equaling to 116% of the fi ve-month plan.
In the coming period, Petrovietnam will develop the Strategy for development and the strategy for overseas
investment until 2025 and orientations towards 2035. At the same time, Petrovietnam will continue to seriously implement the Prime Minister’s Decision No. 46/QD-TTg approving the restructuring plan for Petrovietnam during the 2012 - 2015 period as well as urge and supervise its subsidiaries to implement the restructuring plan for the 2012 - 2015 period. Petrovietnam will continue to strictly control the progress of exploration, fi eld development and production projects both at home and abroad, ensuring the fulfi llment of plans to increase oil and gas reserves and production in 2014. In June, Petrovietnam will put 3 new fi elds into production, namely Thang Long - Dong Do (Blocks 01 & 02/97), Dua (Block 12W), and Cendor (Phase 2, Block 304, Malaysia). Besides, it will supervise and closely monitor the second overall maintenance of Dung Quat Refi nery, and ensure the safe operation of gas transportation systems, power plants, and fertiliser plants...
Under the yearly plan for 2014, Petrovietnam has set the goal to produce 26.63 million TOE (the Government assigned target is 25.71 TOE), 15.7 billion kWh of electricity, 1.585 million tons of urea, and 4.762 million tons of petroleum products. Petrovietnam will strive to earn a total revenue of 673.3 trillion VND and contribute 144.5 trillion VND to the State Budget.
According to the report on production and business results of the fi rst 5 months of 2014, the Vietnam National Oil and Gas
Group (Petrovietnam) has produced a total of 11.56 million tons of oil equivalent (7.08 million tons of crude oil and 4.48 billion m3
of gas), earning a total revenue of 301.2 trillion VND. Petrovietnam will continue to strictly control the progress of exploration,
fi eld development and production projects both at home and abroad, thus ensuring the fulfi lment of plans to increase oil and gas
reserves and production in 2014.
Pham Hong
PETROVIETNAM EARNED OVER 300 TRILLION VNDPETROVIETNAM EARNED OVER 300 TRILLION VNDin revenue in fi rst 5 months of 2014in revenue in fi rst 5 months of 2014

11PETROVIETNAM - JOURNAL VOL 6/2014
PETROVIETNAM
1. Introduction
Pre-Tertiary fractured basement (referred to below as “fractured basement”) is an important type of hydrocarbon-bearing reservoirs off shore Vietnam. In the last decade, thanks to advanced seismic technology, seismic imaging of fracture zones associated with faults within the basement has signifi cantly improved. Seismic attributes can, therefore, be widely applied to identify and outline good fracture zones inside the basement as well as to predict some of the main characteristics of existing fracture systems, such as dip and azimuth [2, 4].
Currently, the application of seismic attributes and well data for fractured basement studies in Vietnam could be classifi ed in two groups. Based on detailed analysis of diff erent seismic attributes the authors of the fi rst group [1 - 4] have proved the possibility of using seismic attributes in the identifi cation and outlining of good fracture zones inside the basement as well as in the prediction of fracture systems’ characters. The authors of the second group [5] have tried to build geological model of the fractured basement based on integrated seismic attributes and well data using ANN and Co-Kriging technique without detailed analysis of the applied seismic attributes.
This paper demonstrates the good results of combining the ideas of both author groups in the construction of a porosity model for the Hai Su Den fractured basement reservoir. The workfl ow of porosity model building for
the Hai Su Den basement is consistent with two steps. In the fi rst step, meaningfull seismic attributes have been selected based on a detailed analysis of the possibility for basement fracture imaging and characterisation. The second step builds a porosity model by integrating the ANN and Co-Kriging technique. The fi nal model has a good correlation with blind test well results and a high degree of reliability.
2. Hai Su Den fi eld overview and study method
2.1. Hai Su Den fi eld overview
The Hai Su Den oil fi eld is located in Block 15-2/01 of Cuu Long basin, off shore the South of Vietnam (Fig.1). The Hai Su Den structure is an anticlinal drape over a basement high, which is elongated along the NE-SW direction. At the Early Miocene, Oligocene and basement levels the structure is intersected by a series of E-W to NW-SE and NE-SW faults (Figs.2 & 3).
Previous studies in the area suggested that the granitoid basement in Block 15-02/01 is considered to be Cretaceous Deo Ca suite granitoid. It is possibly constituted of the Cretaceous-Paleogene mafi c, intermediate and felsic dykes (Deo Ca, Cu Mong, Phan Rang suites). The basement could be strongly hydrothermal altered. Secondary minerals were formed and fi lled fractures and/or partly replaced primary minerals. The most common alterations are sericitisation, calcitisation of plagioclase, kaolinisation of potassium feldspar, chloritisation of
BUILDING POROSITY MODEL OF FRACTURED BASEMENT RESERVOIR BASED ON INTEGRATED SEISMIC AND WELL DATA IN HAI SU DEN FIELD, CUU LONG BASINNguyen Anh Duc1, Nguyen Huy Ngoc2, Nguyen Lam Anh3
1Petrovietnam Exploration Production Corporation (PVEP), 2Petronas Carigali Sdn Bhd (PCSB), 3Research and Design Institute - Vietsovpetro
The Pre-Tertiary fractured basement is an important hydrocarbon-bearing reservoir in Vietnam. Due to their very small matrix porosity, basement rocks become reservoirs only when they are strongly fractured, consequently it is a big challenge to construct the porosity model for the basement. Based on the good seismic imaging of the Hai Su Den basement, diff erent seismic attributes have proved to be eff ective tools in basement fracture characterisation, and the integration of 3D seismic attributes, well data and other geological information by using Artifi cial Neural Network (ANN) and Co-Kriging techniques has been demonstrated as a good way to construct porosity model for the Hai Su Den fractured basement reservoir. The accuracy of the model has been verifi ed by well results.
Key words: Fractured basement, Pre-Tertiary, porosity, permeability, Hai Su Den fi eld.
Summary

12 PETROVIETNAM - JOURNAL VOL 6/2014
PETROLEUM EXPLORATION & PRODUCTION
biotite and hornblende. There are some veins of zeolite observed on core [8].
Seven wells have been drilled into the Hai Su Den basement, which are HSD-1X, HSD-2X/ST, HSD-3X, HSD-4X, HSD-5XP, VD-1X and VD-2X. HSD-1X drilled in Block B in September 2007 has a maximum fl ow rate of more than 20,000 bop while VD-1X, which was drilled before in the same basement block and is only about 600 metres away from HSD-1X surface location, was dry. These results show very complicated reservoir characters of the Hai Su Den fractured basement.
Source rock consists of mainly shales of the Oligocene D sequence with high TOC and HI values, which are considered good to excellent oil-prone source rocks. The lacustrine shales of Early Oligocene E sequence are also considered as having good source rock potential.
Trap: The fractured basement reservoir is known to be formed in the Hai Su Den prospect from existing well control. Multiple trending faults are present within the neighbourhood of the structure. This fault pattern suggests the presence of a complex of shear and extensional fractures.
Seal: Thick shales of the D Sequence are main seals for the clastic reservoirs of the E Sequence and/or basement reservoirs. Intra-formational shales, interbedded within sandstones in the E, C and BI sequences may also be potential seals, or have partially sealing capacity for the immediately underlying sandstone reservoirs.
Reservoir: The fractured/weathered granite basement is the primary reservoir objective in the Cuu Long basin, from which hydrocarbon has been produced from fractured zones within the pre-Tertiary basement. The secondary reservoir objectives are the
F ig.1. Hai Su Den oil fi eld location map
Fig.2. Stratigraphy and main deformation phases in Block 15-02/01, Cuu Long basin
Fig.3. Depth structural map of Hai Su Den basement top with results of FMI interpretation. The azimuths of fractures interpreted by FMI data are consistent with fault direction
interpreted by seismic data

13PETROVIETNAM - JOURNAL VOL 6/2014
PETROVIETNAM
reservoirs within the Oligocene fl uvio-deltaic sandstones and the Lower Miocene sandstones, from which oil has been discovered.
In the Hai Su Den basement, three fault systems with E-W, NE-SW and NW-SE directions are strongly developed and fractures associated with these fault
systems interpreted by FMI data are consistent with the interpreted faults in their characters (Fig.3). Within the Hai Su Den basement, the role of the E-W fault system was also highlighted by the previous studies [2] as the main faults related with oil fl ow zones inside the basement.
2.2. Study method
Several methods have been applied to build the porosity model for fractured basement in Cuu Long basin including Halo model/Advanced Halo model, DFN (Discrete Fracture Network) and ANN [5]. The Halo model has been widely applied in Vietnam, which much depends on the fault interpretation and assumes that the porosity remains unchanged along the interpreted fault planes. In the Hai Su Den basement, the Halo model method has been used at the beginning, but the results were too optimistic, therefore the advanced Halo model method has been tested. The diff erence between the Halo model and advanced Halo model methods is mainly related to applying seismic attributes to take into account the discontinuity of reservoir quality along the interpreted fault planes. Besides, DFN is also a method which can create the connectivity between faults and fracture systems from the geological information of an area. This method requires several information of a fracture system including orientation, aperture, intensity, location, mineralogy, hydraulic and mechanical properties [9]. However, DFN has the same disadvantage as the Halo model since it does not refl ect the heterogeneity of fracture systems. In order to promote the role of seismic attributes in porosity model building process, ANN has been applied [5]. This method is able to combine seismic and
Fig.4. Comparison of diff erent seismic data in Hai Su Den basement [4]
Fig.6. Rel ative acoustic impedance (RAI) gives much better images inside basement elements than the original seismic data
Fig.5. Good tie of dipping refl ection events inside the Hai Su Den basement with synthetic seismogram (red fi lled curve) and fracture porosity (Green curve) derived
from well log data by using BASROCK software

14 PETROVIETNAM - JOURNAL VOL 6/2014
PETROLEUM EXPLORATION & PRODUCTION
well data to produce a porosity model which refl ects the vertical and horizontal porosity variation trends. The main weakness of the current method applying ANN in Cuu Long basin is the lack of a detailed analysis of the applied seismic attributes in imaging and characterisation of fracture systems.
The quality of 3D seismic data of the Hai Su Den basement is good and could clearly image fracture associated faults. Fig.4 shows a comparison between 4 seismic data versions of the Hai Su Den area (2006 PSTM, 2007 Kirchoff PSDM, 2007 Beam PSDM and 2009 Beam PSDM), which were the result of applying diff erent processing sequences. It is clear that the 2009 Beam PSDM data has better quality while it could clearly image dipping elements inside the basement. Beam migration can enhance the signal to noise ratio, especially enhance steeply dipping events, handle multi-arrival ray paths and preserve steep dipping refl ection, hence providing a clear image of the basement [1]. By using synthetic seismograms, it’s clearly to see that the dipping refl ections inside the basement have good tie with fracture zones generated from logging data. The synthetic seismogram in Fig.5 shows good consistency between seismic and well data.
To avoid the above mentioned weakness of current application of the ANN method, under the condition that good seismic imaging of fracture systems was achieved in the Hai Su Den fractured basement, an integration of ANN and Co-Krigi ng techniques was used for porosity model building for Hai Su Den fractured basement reservoir with the following workfl ow:
- Detailed analysis of seismic attributes, which could image and characterise fracture systems inside the basement to select meaningful fracture porosity and the optimum seismic attribute set.
- Porosi ty model building using ANN with the selected seismic
attribute set and fracture porosity estimated by BASROCK software.
- Porosity model building using Co-Kriging to inte-grate seismic attributes, fracture porosity and other well data and fracture characters collected in the region.
3. Possi bility of using seismic attributes to build po-
rosity model of the fractured basement reservoir in
Hai Su Den fi eld
Recently, many seismic attributes have been successfully applied to image and characterise the fracture systems inside the basement. Among them, the following seismic attributes have been highlighted in diff erent publications from the previous studies [1 - 4, 7]: Relative acoustic impedance (RAI), Variance (Coherency), Curvatures,
Fig.7. Verti cal section of diff erent seismic attributes showing diff erent quality in imaging of fracture zones inside the Hai Su Den basement. A: Variance; B: Ant-Tracking;
C: Cosine of Phase; D: Envelope
Fig.8. Vertical section of diff erent seismic attributes showing diff erent quality in imaging of fracture zones inside the Hai Su Den basement. A: RMS Amplitude;
B: Gradient magnitude; C: Sweetness; D: Refl ection intensity
A
C D
B

15PETROVIETNAM - JOURNAL VOL 6/2014
PETROVIETNAM
RMS amplitude, Envelope , Ant-trac king, Cosine o f phase, Gradient magnitude, Sweetness and refl ection intensity.
Based on our study results, the relative acoustic impedance is the most important attribute. At fi rst, the seismic inversion process normally increases the signal to noise ratio, consequently it improves dipping refl ection events inside the basement. Fig.6 shows this advantage in the Hai Su Den basement. Secondly, RAI is a layer property, which is diff erent from the surface property of the original seismic data, it, therefore, directly refl ects the fracture zones inside the basement, which are characterised by lower density and lower seismic velocity (Lower RAI) compared to the fresh basement. For the Hai Su Den basement the RAI was selected as the input data instead of the original seismic data to assess other seismic attributes.
To select the meaningful fracture porosity and optimum seismic attribute sets, the seismic attribute analysis is performed in two steps:
- Qualitative analysis to select the meaningful fracture porosity: The qualitative analysis is based on visual inspection of seismic attributes in im-aging of fracture systems and qualita-tive correlation between seismic attri-butes and fracture porosity.
- Quantitative analysis to select optimum seismic attribute set: The quantitative analysis calculates and ranks correlation coeffi cients between seismic attributes and well fracture po-rosity. The optimum seismic attribute set is selected by the highest correla-tion coeffi cient among diff erent com-bination of the seismic attributes.
3.1. Quali tative analysis of seismic
attributes
3.1.1. Variance and curvature
These attributes are well known in fault and fracture imaging for sediment section and top of the basement [1, 3, 7], but for inside the basement these attributes become too noisy to image the fracture systems. Fig.7 presents the
vertical section of the variance attribute for inside the Hai Su Den basement. It is clear that the attribute anomalies exist everywhere and many of them are vertical dipping events; they are, therefore, probably related to noise. These attributes were not selected for further quantitative analysis.
3.1.2. Ant-Tracking
Ant-tracking is a well known attribute for fault mapping and fracture system characterisation for both sediment and inside-basement sections [3]. Based on this attribute we can successfully predict azimuth, dip angle, density and intersection between diff erent fracture systems (Fig.7B). But it is diffi cult to identify and outline high fractured zones inside the basement using this attribute. In principle the Ant-tracking will gain the weak
Fig.10. Comparison between gradient magnitude and HSD-5XP well fracture porosity (red curve) on both section and depth slices
Fig.9. Comparison betw een sweetness and HSD-5XP wel l fracture porosity (red curve) on both section and depth slices

16 PETROVIETNAM - JOURNAL VOL 6/2014
PETROLEUM EXPLORATION & PRODUCTION
seismic events, therefore it does not preserve the true amplitude and reduce discontinuity along fault plane, which is an unexpected eff ect in fracture porosity model building. In Fig.7B we can see good fault imaging, but the anomaly intensity is similar everywhere in the section and it is hard to be correlated with variation of fracture porosity with depth.
3.1.3. Cosine of phase
Similar to the Ant-Tracking attribute, Cosine of instantaneous phase could be applied for inside fault imaging and fracture systems characterisation (Fig.7C), but it is hard to be correlated with fracture porosity.
3.1.4. Envelope
Envelope or instantaneous amplitude is the complex seismic trace, which is related to the intensity of AI contrast between fractured and fresh basement and thickness of the fracture zones, it could, therefore, not only image good fracture zones inside the basement but also be used for fracture system characterisation. Fig.7D presents the section of the Envelope attribute for the Hai Su Den basement. In this fi gure we can see that strong Envelope anomalies exist in diff erent areas and reduce with depths. The strong envelope anomaly zones are also consistent with location of good oil fl ow basement wells. This attribute was defi nitely selected for quantitative analysis.
3.1.5. RMS Amplitude
RMS Amplitude computes Root Mean Squares on
instantaneous trace samples over a specifi ed window. Similar to the Envelope attribute it could be used for both identifi cation and outline of good fracture zones inside the basement as well as fracture system characterisation. Fig.8A presents RMS amplitude section in the Hai Su Den Basement.
3.1.6. Gradien t magnitude
The magnitude of the instantaneous gradient computed in three-dimensions of the sample neighbourhood. This attribute can highlight the lineament of faults and indicate zones of high-fractured density, thus enhance the signature of fractured zones inside the basement (Fig.8B).
3.1.7. Sweetne ss
The sweetness attribute is calculated using the following formula: “Sweetness = Env/sqrt (Inst. Freq)”, it refl ects both the contrast between the fractured and fresh basement and the fracture zones thickness itself. Within a fractured zone, the frequency is also reduced due to attenuation of energy. Fig.8C is the sweetness section for the Hai Su Den basement.
3.1.8. Refl ect ion Intensity
Refl ection intensity is the average amplitude over a specifi ed window multiplied with the sample interval. Visually, refl ection intensity can help to highlight the lineament of faults and indicate zones of high fracture density (Fig.8D).
3.2. Quantitative analysis of the
selected seismic attributes
The latest six seismic attributes and RAI were chosen for quantitative analysis to select the optimum seismic attributes for further porosity model building using ANN.
Based on the quantitative analysis, the three following seismic attributes were selected as the optimum fracture porosity attributes.
3.2.1. Sweetness
Fig.9 shows a comparison between the sweetness attribute and well fracture porosity in both
Fig.11. Comparison between refl ection intensity and HSD-5XP well fracture porosity (red curve) on both section and depth slices

17PETROVIETNAM - JOURNAL VOL 6/2014
PETROVIETNAM
vertical section and diff erent depth slices. It is clear to see that the seismic attribute (blue colour) is consistent with the well data not only in location of good fracture zones, but also with dip and azimuth of the fracture systems.
3.2.2. Gradient magnitude
Gradient magnitude attribute has a good tie with the well fracture porosity in location of good fracture zones and in dip and azimuth of diff erent fracture systems (Fig.10).
3.2.3. Refl ection Intensity
Similar to the Sweetness and Gradient magnitude attributes, Refl ection Intensity also has a very good tie with the well data (Fig.11).
4. Porosity model building using
ANN and Co-Kriging techni que
4.1. ANN
ANN is applied to integrate the selected seismic attributes with well fracture porosity to predict the distribution of porosity within basement.
ANN is a tool for automatically fi nding the relationship between multiple known par ameters and a single unknown parameter. The behaviour of a neural network is defi ned by the way its individual computing elements are connected and by the strength of those connections, or weights. The weights are automatically adjusted by training the network according to a specifi ed learning rule until it properly performs a desired task.
Supervised ANN is an algorit hm that takes multiple inputs and returns one or several outputs. These inputs may match with log values, seismic attributes, surface values or properties from the same cell. Each input is multiplied by a weight; the result is summed and passed through a nonlinear function to produce an output [5].
The set of 03 selected seismic attributes (Reflection Intensity, Gradient Magnitude, and Sweetness) was run in supervised mode using ANN and well fracture porosity was used as training data. We can observe that this optimum seismic attribute set has a good correlation coeffi cient (as 0.76) with well porosity, therefore the result of predicted porosity by ANN is highly reliable. Figs.12 and 13 show a very good consistence of well fracture porosity with the fracture porosity predicted by using ANN.
Fig.13. Porosity model and depth slices using ANN of Hai Su Den fractured basement
Fig.12. Vertical section of porosity model using ANN. The red curves are well fracture porosity

18 PETROVIETNAM - JOURNAL VOL 6/2014
PETROLEUM EXPLORATION & PRODUCTION
4.2. Co-Kriging technique
Based on the result of predicted fracture porosity model using ANN, Co-Kriging steps have been taken to correct the trend and extent of fractures in the model by well parameters, fracture parameters and tectonic elements of the study area. In this process, the model was used as a secondary variable, while porosity data of wells was used as a primary variable. In addition, a distribution of fractures in the secondary porosity model was also governed by geo-tectonic parameters such as dip, azimuth, major and minor values of fault systems or fractured zones [5].
Co-Kriging is a method that is used for simulation of oil-fi eld by interpolating algorithms, which based on the analysis of error changes with distances. Co-Kriging solution is used to integrate the primary variable with secondary variables by calculating correlation coeffi cients and the experimental variogram statistics function. Figs.14 and 15 present a very good correlation between well fracture porosity (red curves) and the fracture porosity model of the Hai Su Den basement, which was built by integrating ANN and Co-Kriging techniques.
In order to assess the reliability of the porosity model, a series of correlations were carried out. The distribution and the relationship between well fracture porosity and porosity received from ANN and Co-Kriging show a very high degree of correlation (Fig.16).
5. Conclusions
The quality of Hai Su Den 3D 2009 Beam PSDM seismic data is
Fig.15. Porosity model and depth slices using Co-Kriging technique of Hai Su Den fractured basement
Fig.16. Comparison between secondary porosity modelling using Co-Kriging technique and well’s porosity on section
Fig.14. Vertical section of porosity model using Co-Kriging technique of Hai Su Den fractured basement

19PETROVIETNAM - JOURNAL VOL 6/2014
PETROVIETNAM
good for the basement; as a result many seismic attributes could have positive results in qualitative and quantitative analysis for identifi cation and outlining of good fracture zones inside the basement and for characterisation of the fracture systems.
The seismic attribute set which can optimise fracture porosity has been selected, consisting of the three following attributes: Refl ection Intensity, Gradient Magnitude, Sweetness.
In the case of good seismic data as in the Hai Su Den fi eld, integration of ANN and Co-Kriging techniques was proved as a good method to build fracture porosity model for the fractured basement reservoir.
References
1. J.N.Ogbechie. Fracture modelling and fl ow behaviour in shale gas reservoirs using Discrete Fracture Networks. 2011: p. 27 - 29.
2. Mai Thanh Ha. Seismic attribute analysis and its applications on data from the Canada, Mexico, USA, and Vietnam. University of Oklahoma. 2010: p. 30 - 32.
3. Nguyen Huy Ngoc, Sahalan B.Aziz, Nguyen Anh Duc. The application of seismic attributes for reservoir characterization in Pre-Tertiary fractured basement, Vietnam - Malaysia off shore. Interpretation. February 2014; 2(1).
4. Nguyen Huy Ngoc, Nguyen Quoc Quan, Hoang Ngoc Dong, Pham Huy Long, Tran Nhu Huy. Application
of “From seismic interpretation to tectonic reconstruction” methodology to study Pre-Tertiary fractured granite basement reservoir in Cuu Long basin, Southeast Vietnam off shore. AAPG International Conference and Exhibition, Rio de Janeiro, Brazil. 15 - 18 November, 2009.
5. Nguyen Huy Ngoc, Nguyen Quoc Quan, Hoang Ngoc Dong, Nguyen Do Ngoc Nhi. Role of 3D seismic data in prediction of high potential areas within Pre-Tertiary fractured granite base-ment reservoir in Cuu Long basin, Vietnam off shore. AAPG International Conference and Exhibition, Calgary, Alberta, Canada. 12 - 15, September, 2010.
6. Nguyen Lam Anh. Integration of well and seismic data in building 3D geological model for fracture reservoir of White Tiger oil fi eld. The 2nd International Conference “Fracture basement reservoir”, Vung Tau, Vietnam. September, 2008.
7. T.Taner. Seismic attributes. CSEG Recoder. 2001: p. 50.
8. Trịnh Xuân Cường, Hoàng Văn Quý. Mô hình hóa đá chứa móng nứt nẻ. Tạp chí Dầu khí. 2008; 5: trang 12 - 18.
9. W.J.Schmidt, Nguyễn Văn Quế, Phạm Huy Long. Tiến hóa kiến tạo bể Cửu Long, Việt Nam. Tuyển tập Báo cáo Hội nghị Khoa học - Công nghệ: Viện Dầu khí Việt Nam 25 năm xây dựng và trưởng thành. 2003: trang 87 - 109.

20 PETROVIETNAM - JOURNAL VOL 6/2014
PETROLEUM EXPLORATION & PRODUCTION
1. Introduction [1 - 3, 6 - 10]
The Early Miocene sequence is the second big oil zone after the basement section and oil is produced from low resistivity sandstone reservoirs of the Bach Ho formation in the Te Giac Trang, Bach Ho, Rong, and Su Tu Den fi elds.
The Te Giac Trang fi eld is located in Block 16-1 of the Cuu Long basin, approximately 120km from Vung Tau city. The Hoang Long Joint Operating Company (HLJOC) is licensed to operate this block. The fi eld targets multi-pay objectives within the primary target Early Miocene Bach Ho formation (BI.1 sequence) sandstones and the secondary target Late Oligocene Tra Tan formation (C sequence) sandstones.
The Te Giac Trang fi eld is divided into H-1, H-2, H-3, H-4 and H-5 by fault blocks and lies along a south-plunging regional scale anticlinal trend, crossed by E-W faults and a subordinate set of SW-NW faults.
The Early Miocene (BI) sequence is subdivided into Late Bach Ho (BI.2) and Early Bach Ho (BI.1). The Late Bach Ho sediments were deposited in shallow and open marine environments. The Early Bach Ho, deposited in coastal, fl uvial, deltaic and shallow marine environments, is subdivided into three units: ULBH, ILBH5.1 and ILBH5.2. Well log practice identifi ed low resistivity contrast subsequences. Low-resistivity pay is generally characterised by pay zones that cause deep resistivity log curves to read from 0.5 to 5Ω.m. This is often attributed to a combination of shale content, mineralogy, microporosity, grain size and bed thickness.
Low-contrast pay implies a lack of resistivity contrast between pay sands and adjacent shales or wet zones. This problem is most commonly seen when the resistivity tool encounters a zone that contains fresh water (or water of low salinity). As salinity decreases, the electrical pathway through a body of water becomes weaker and more dispersed, thus causing the water to become less conductive (or conversely, more resistive). Therefore, while the resistivity of the pay zone may not be low, the resistivity of the water leg is high enough to make it diffi cult to distinguish between pay and wet zones. However, in the Te Giac Trang fi eld the water salinity is very high, in this case low contrast pay implies a lack of resistivity contrast between pay sands and adjacent shales.
A number of factors have been found to act on the logging tool to produce low resistivity or low contrast pays, including the following:
- Bed thickness: some pay zones are simply too thin to be resolved by the logging tool.
- Mineralogy: conductive minerals (such as pyrite, glauconite, hematite, or graphite, smectite, illite, chlorite, kaolinite) or rock fragments can have a pronounced eff ect on resistivity response.
- Structural dip: dipping beds produce signifi cant excursions on the resistivity log when orientation between the tool and the bed deviates from normal.
- Clay distribution: classifi ed as either dispersed, structural, or laminated - all capable of holding bound water.
EVALUATION OF WATER SATURATION IN THE LOW RESISTIVITY RESERVOIR OF TE GIAC TRANG FIELD, BLOCK 16-1, CUU LONG BASIN, OFFSHORE VIETNAMCu Xuan Bao, Pham Thi Thuy, Bui Huu Phuoc, Nguyen Quan PhongHoang Long - Hoan Vu JOC’s
It is well known that there is a series of oil fi elds in the Cuu Long basin that were discovered in low resistivity Early Miocene sequences, and the Te Giac Trang fi eld is a case that challenges formation evaluation for water saturation of the pay sands in the reservoirs. It is believed that the low resistivity is a result of the eff ects of many factors such as thin beds, the low degree of sand compaction, the presence of highly conductive minerals (pyrite etc.), and montmorillonite that signifi cantly increases the surface conductivity, sorting of the sand and type of cement.
In the Te Giac Trang fi eld, for the water saturation calculation, an approach was used with the traditional shaly sand model and modifi ed Archie equation constants. The said method combined with the results of pressure pretests allows us to minimise the uncertainty of the estimated water saturation for these low resistivity pay sands.
Key words: Early Miocene, low resistivity, J function, clay, thin bed, water saturation, pressure, high permeability, low permeability, Te Giac Trang fi eld.
Summary

21PETROVIETNAM - JOURNAL VOL 6/2014
PETROVIETNAM
- Water salinity: high salinity interstitial water causes low resistivity within the pay zone, while low salinity water can cause low contrast pays.
- Grain size: very fi ne grain size can lead to high irreducible water saturation.
Any combination of the above: often a combination of inter-related factors causes the logging tool to read lower resistivity than normal inside a pay zone.
In the Te Giac Trang fi eld, probably the most common cause of low resistivity pay is the simple combination of thin beds containing highly conductive shales (and their associated bound water), along with thin pay sands which are below the vertical resolution of the logging tool, as shown in Fig.1, below, of conventional core through a laminated interval in the Early Miocene sequence. It is observed that there were certain amounts of conductive mineral such as pyrite found in the core sample, which defi nitely play some role in the low resistivity nature of the Early Miocene reservoirs.
The presence of clay causes a conductive path due to the presence of an excess of cations clinging to negatively charged clays. The movement of cations along the surface of the clay constitutes an electrical path. The larger surface area of clays presents more Cation Exchange Capacity,
thus lowering the resistivity of the hydrocarbon sands. The Table 1 shows the abundant presence of all the clay minerals, particularly smectite that is the main cause of low resistivity in the hydrocarbon zones.
In the Early Miocene reservoirs in the Te Giac Trang fi eld, the sandstones are thinly interbedded with the low resistivity shales. It is commonly observed that the sandstones thicknesses are less than the tool’s vertical resolution. Even with thicker sand layers, the resistivity readings are normally aff ected by bedded claystones. As a result, the resistivity readings of the oil bearing sandstones are lower than they should be. Pyrite is a very good conductive matrix. If pyrite was present in the formation, the measured resistivity of the formation would be aff ected by conductive pyrite. Traces of pyrite have been observed in low Miocene sequence. This is an additional factor causing the low resistivity values in hydrocarbon zones.
All of the list above cause low resitivity contrast pay. Even if all of the above data were taken into account for saturation calculation, it would not necessarily provide more accurate estimates of water saturation due to a lot of uncertainties. The Model Saturation - Height Pc from J function is to be used in this case.
2. Using J function to calculate water saturation in Te
Giac Trang fi eld [1 - 4]
J function is a master curve that can be used to represent reservoirs of similar rock type. In the Te Giac Trang fi eld, based on the permeability range of the test samples, there are two kinds of J functions that have been created from quality-controlled refi ned legacy porous plate data. Power law regressions of form were fi tted to “high permeability” and “low permeability”
Fig.1. Core through a laminated interval in the Te Giac Trang fi eld
MD
(m)
Kaolinite
(%)
Chlorite
(%)
Illite
(%)
Smectite
(%)
Mixed
layer of
illite-
smectite
(%)
2,799.0 16.7 12.6 10.6 57.9 2.2
2,827.0 20.5 36.4 24.6 14.0 4.5
2,839.5 46.8 17.2 12.0 18.1 5.9
2,914.0 24.6 16.7 25.8 28.2 4.7
2,934.0 32.4 22.4 14.7 26.5 4.0
Table 1. The result of XRD analysis for clay fraction (< 2 microns)

22 PETROVIETNAM - JOURNAL VOL 6/2014
PETROLEUM EXPLORATION & PRODUCTION
In Fig.2, the permeability J function extrapolation by setting Pc = 0.01 psi at Sw = 100%.
J functions are as below:
Low Permeability (< 1,300mD)
High Permeability (> 1,300mD)
Both of the J functions are converted to Height above the free water level as below:
Where:
ρw: Water density gradient (0.428psi/ft),
ρo: Oil density gradient (0.29psi/ft),
σ x cosθres: Adhesion force at reservoir conditions (σ = 14 - 20dynes/cm, θ = 30o),
H: Vertical height above free water level (FWL) by excess pressure (ft),
Sw: Water saturation (%).
MD (m) Quartz
(%)
K-Feldspar
(%)
Plagioclase
(%)
Mica and/or
other clays
(%)
Kaolinite
and/or
Chlorite
(%)
Calcite
(%)
Epidote
(%)
Pyrite
(%)
Sylvite
and
Halite
(%)
2,839.5 49.5 16.6 14.3 5.8 11.1 1.3 1.0 0.4
3,066.5 43.3 11.2 25.8 3.2 13.6 1.3 1.0 0.4
3,116.5 28.9 11.1 17.7 15.4 24.4 1.0 0.9 0.5
3,174.5 40.8 30.1 17.2 2.1 6.6 1.5 0.7 0.9 0.3
3,181.0 43.4 23.5 21.2 2.0 7.6 1.2 0.7 0.4
3,220.0 70.2 5.9 4.3 12.4 5.0 0.6 0.6 0.6 0.6
3,297.5 43.2 15.3 19.2 2.0 17.0 0.8 1.2 0.9 0.5
3,415.0 57.8 13.5 15.2 3.4 8.3 0.7 0.6 0.5
3,425.0 60.3 13.3 15.0 2.1 7.7 0.6 0.6 0.4
Table 2. The results of XRD analysis for SWC show conductive mineral
No Oil gravity
(oAPI)
Water
resistivity 25oC
(Ω.m)
Salinity 25oC
(ppm)
1 41.7 0.1100 59,259
2 39.8 0.0779 90,269
3 39.4 0.1536 40,533
4 39.1 0.1195 54,098
5 39.9 0.0738 96,579
6 40.5 0.0871 78,748
7 35.8 0.0641 115,487
Table 3. The water-mud fi ltrate samples analysis salinity
Fig.2. Relationship between J function and saturation
..
..
Fig.3. Excess pressure above FWL
.

23PETROVIETNAM - JOURNAL VOL 6/2014
PETROVIETNAM
The above fi gure shows us, if a shaly sand model is applied to compute water saturation taking into account all of the data, the average water saturation in pay zone is 59.8% and this result is higher than water saturation from Excess Pressure integrated with conventional log model, average water saturation (36.5%) in the pay zone. This value’s greater accuracy is confi rmed by DST results with Qo = 6,099 barrels of oil per day (choke 80/64” without formation water free).
3. Conclusion
In conclusion, the complexity of clay distribution, bed thickness, mineralogy, depositional environment and rock heterogeneity can play a major role in causing low resistivity contrast in the Early Miocene reservoirs which will lead to wrong water saturation estimation by using the shaly sand model. HLJOC introduced a method which uses the Excess Pressure integrated with conventional log derived information to indicate reliable water saturation that is vital to identify high grade zones to perforate and to ensure maximum production and ultimate recovery.
References
1. Hoang Long JOC. Geological fi nal well reports, Block 16-1, Cuu Long basin. 2006 - 2012.
2. Mark Deakin Petrophysics. Integrated petrophysics for reservoir characterisation. Petrophysics Pty Ltd Copyright. 2008.
3. Roger Griffi ths, Andrew Carnegie. Evaluation of low resistivity pay in carbonates - A breakthrough. SPWLA 47th Annual Logging Symposium, Mexico. 4 - 7 June, 2006.
4. Alton Brown Consultant. Improved interpretation of wire line pressure data. AAPG Bulletin. 2003; 87(2): p. 295 - 311.
5. Djebbar Tiab, Erle C.Donaldson. Petrophysics (second edition): Theory and practice of measuring reservoir rock and fl uid transport properties. Gulf Professional Publishing. 2004.
6. Shigeaki Asakura, Takezaki Hitoshi, Masahiro Miwa, Osamu Kobayashi, Masayoshi Suzuki, Masatoshi Nishi. A new interpretation model using nuclear magnetic resonance log for micritic reservoirs. SPE 68084, SPE Middle East Oil Show, Bahrain. 17 - 20 March, 2001.
7. B.A.Kulikov, Tran Xuan Nhuan. A theoretical model of reservoir resistivity to be used in the low resistivity productive reservoir in the Miocene deposits of the Rong fi eld. Conference on “The Vietnam Oil and Gas Industry on the Event of the 21th century”. 2000.
8. Malcolm Rider. The geological interpretation of well logs (second edition). Whittles Publishing, Sutherland, Scotland. 1996. 280p.
9. Pierre Berger. Detecting hydrocarbons in low resistivity environments. Schlumberger - South East Asia Unit Interpretation Group Jakarta, Indonesia. 1991.
10. G.E.Archie. The electrical resistivity log as an aid in determining some reservoir characteristics. Trans of the AIME. 1942; 146(1): p. 54 - 62.
11. G.M.Hamada, M.N.J.Al-Awad, M.S.Almalik. Log evaluation of low-resistivity sandstone reservoirs. SPE-70040. SPE Permian Basin Oil and Gas Recovery Conference, Midland, Texas. 15 - 17 May, 2001.
12. Saha Souvick. Low resistivity pay: Ideas for solution. SPE 85675. Nigeria Annual International Conference and Exhibition, Abuja, Nigeria. 4 - 6 August, 2003.
13. E.M.Shokir. Prediction of the hydrocarbon saturation in low resistivity formation via artifi cial neural network. SPE-87001. SPE Asia Pacifi c Conference on Integrated Modelling for Asset Management, Kuala Lumpur, Malaysia. 29 - 30 March, 2004.
14. G.M.Hamada, M.S.Al-Blehed, M.N.Al-Awad, M.A.Al-Saddique. Petrophysical evaluation of low-resistivity sandstone reservoirs with nuclear magnetic resonance log. Journal of Petroleum Science and Engineering. 2001; 29(2): p.129 - 138.
Fig.4. Saturation estimated in the low resistivity zone

24 PETROVIETNAM - JOURNAL VOL 6/2014
PETROLEUM EXPLORATION & PRODUCTION
1. Introduction
Lost circulation happens due to the diff erence between the hydrostatic pressure of the drilling fl uid and the reservoir pressure, leading to fl uid penetration into cracks. In the case of operating processes, if no solution is found for this problem, drilling processes must be suspended, resulting in considerable economic damage.
An alternative, which is recently developed and is widespread, is the underbalanced drilling technique. This method, however, requires extremely expensive equipment and special protective measures. Amongst other special drilling solutions developed for operating in depleted zones, one novel drilling solution, using a particular drilling fl uid, has attracted the attention of drilling specialists and companies.
The fl uid, known as “aphron-based drilling fl uid”, is water-based of low density and reduced cost. Aphron drilling fl uid can be prepared by mixing surfactants, viscosity polymers and stabilisers to form aphron with a particular structure that can withstand high pressures without being destroyed.
An aphron was fi rst found by Sebba in 1984 [1] and was described in more detail in his next report in 1987 [2].
2. Structure of aphrons
The structure of an aphron is illustrated in Fig.1. Unlike conventional air bubbles which are covered by a single thin layer of surfactants, an aphron has a more complex structure. The air core of aphrons is enveloped by a substantially stable tri-layer. This tri-layer consists of an inner surfactant fi lm, covered by a viscous water shell, and the outer layer is a bi-layer of surfactants. This tri-layer structure could not only greatly enhance the stability of aphrons, but also make aphrons hydrophilic. The hydrophilic boundary of aphrons makes the micro bubbles compatible with bulk water solution and lowers the attractive forces between them.
MICROBUBBLE DRILLING FLUID (APHRON): NEW TECHNOLOGY FOR DRILLING IN DEPLETED RESERVOIRSNguyen Tuan Anh1, Ta Quang Minh1, Vu An1, Phan Trong Hieu1
Hoang Mai Chi1, Tran Thanh Phuong1, Nguyen Thi Thu Hien1, Vu Thiet Thach2
1Vietnam Petroleum Institute, 2Hanoi University of Mining and Geology
Lost circulation is a severe problem in drilling processes, especially in depleted zones. Microbubble (aphron) drilling fl uid is a novel technology that possesses excellent advantages compared with other lost circulation prevention methods. The three-layer structure of microbubbles not only lessens the density of fl uids, but also acts as stable bridging materials by which cracks in depleted zones could be sealed eff ectively. These features result in successfully reducing lost circulation. Though possessing an excellent potential for preventing lost circulation, this kind of fl uid has not yet been studied in Vietnam. This paper will briefl y introduce the topic of microbubble drilling fl uid, including the structure and composition of aphron, how this fl uid works and recent developments of this technique in drilling oil fi elds around the world.
Key words: Aphron, microbubble drilling fl uid.
Summary
Fig.1. Structure of an aphron

25PETROVIETNAM - JOURNAL VOL 6/2014
PETROVIETNAM
In contrast to conventional bubbles, which do not survive long past a few hundred psi, aphrons have been found to survive compression to at least 4,000psig (27.7MPa) for signifi cant periods of time [3]. When a fl uid containing bubbles is subjected to a sudden increase in pressure above a few hundred psi, the bubbles initially shrink in accordance with Boyle’s Law. Aphrons are no exception. However, conventional bubbles begin to lose air rapidly via diff usion through the bubble membrane, and the air dissolves in the surrounding aqueous medium. Aphrons also lose air, but they do so very slowly, shrinking at a rate that depends on fl uid composition, bubble size, and rate of pressurisation and depressurisation.
A very important criterion for aphron stability is shell viscosity. The middle shell must have a minimum viscosity in order to prevent the phenomenon known as the “Marangoni eff ect” that causes diff usion of water out of the shell into the bulk liquid [4, 5]. This thins and destabilises the shell. The rate of transfer of water is inversely proportional to shell viscosity. Therefore, addition of a viscosifi er such as biopolymer is required. The viscosifi er also serves to slow the fl ow of bulk fl uid into loss zones. Because of the small amount of air incorporated in the base fl uid (only 15% v/v at ambient temperature and atmospheric pressure) the density of aphron based fl uid is similar to the density of the base fl uid [6].
When aphron based fl uid circulated through the system, rapid compression and decompression occurred. As shown in Fig.2, rapid compression of an aphron drilling fl uid from 0MPa to 20.79MPa, followed by decompression back to 0 MPa, did not break the special structure of aphrons and resulted in essentially full regeneration of the aphrons. Rapid pressure cycling of aphron drilling fl uids leaves most aphrons intact. Hence, the density of aphron fl uids was maintained at about 0.8 to 0.9 [7].
3. Fluid invasion control
The encapsulated air within an aphron is compressed when circulated down hole. The micro-bubble volume decreases and internal pressure increases to an extent approximately proportional to the external pressure being applied. Once the drilling bit exposes a depleted formation, aphrons are brought together within the openings of low-pressure zones. There, a portion of the energy stored within each aphron is released, causing it to expand. The expansion continues until the internal and external pressures on the wall of the aphron are in balance. As the micro-bubbles are crowded into formation openings, external Laplace forces increase dramatically, causing aggregation, rather Fig.2. Surviving of aphrons at compression and decompression [7]
(1)
(2)
(3)
(4)
(5)
Compression
0MPa 15x
Compression
20.79MPa 40x
Compression
20.79MPa 40x
Decompression
0MPa 40x
Decompression
0MPa 15x

26 PETROVIETNAM - JOURNAL VOL 6/2014
PETROLEUM EXPLORATION & PRODUCTION
than coalescence, of the microbubbles, resulting in a solid-free bridge without adding solid lost circulation materials [6].
The eff ectiveness of the seal formed by the aphrons is dependent on the size of the openings and the degree of hydrophobicity of the aphron outer shell. Small openings and strongly hydrophobic/lipophilic aphrons promote sealing. Conversely, very large openings, e.g. fractures, will generate little or no capillary pressure and, hence, no seal may be possible except at the fracture tip [6].
Aphrons bridging mechanism is illustrated in Fig.3.
4. Composition of a typical aphron drilling fl uid
Components of a typical aphron drilling fl uid are shown in Table 1 [7].
As presented in Table 1, water or brine incorporated with surfactants and polymers will form stabilised aphron drilling solution.
Some properties of aphron drilling fl uid are described in Table 2.
5. Field experience of applying aphron drilling fl uid
Brookey described the fi rst use of aphrons in a drilling fl uid application in 1998. In this case, the microbubbles were created as a minor phase in a water-based fl uid. This system was used as a means of controlling lost circulation and minimising formation damage in a low pressure vugular dolomite reef zone. The microbubbles allowed the zone to be drilled to required TD, logged and drill stem-tested; this had not been possible previously [8].
This new system was applied in South America in an area where six wells were drilled using various fl uids and techniques, including underbalanced drilling. Because of severe depletion, lost circulation and borehole instability, none of these wells was successfully drilled to TD. In contrast, the application of aphron technology in this fi eld resulted in no drilling fl uid losses and excellent wellbore stability even in previously troublesome shale sections. After drilling the fi rst three wells in this fi eld, the operator was able to eliminate the intermediate string and drill from surface casing to TD successfully [9].
Kinchen describes drilling in a highly vugular, fractured dolomite zone with good success, even
coring with this fl uid. Besides lost circulation control, these wells came on to full production in 4 days versus 30 to 60 days average in previous wells drilled with various fl uid programs [10].
Gregoire chronicles a program of drilling with an aphron drilling fl uid and controlling losses in a fractured granite zone, which resulted in open-hole production almost instantaneously without treatment. Besides instant cleanup, the production rates were much higher than had been seen before with any other drilling fl uid [11].
Although aphron technology has been successfully used in about 300 wells over a period of several years, it was desirable to develop a deeper understanding of the way aphron drilling fl uids work and to utilise laboratory techniques for optimising fi eld applications. A two-year research and development program was undertaken under the auspices of the U.S. Department of Energy (DOE) to obtain
Fig.3. Aphrons bridging mechanism [3]
Component Function
Fresh water or brine Continuous phase Soda ash Hardness buffer Biopolymer blend Viscosifier Polymer blend Filtration control agent and thermal stabiliser pH buffer pH control Sufactants Aphron generator Biocide Biocide
Table 1. Components of a typical aphron drilling fl uid
Fluid properties Unit Expected quantity
Density - 0.86 - 0.9 Plastic viscosity cP 16 - 21 Yield point lb/100ft2 47 - 52 API Fluid loss cc/30min 11 Low-shear-rate viscosity (0.6s-1) cp 120,000
Table 2. Some properties of aphron drilling fl uid [3]

27PETROVIETNAM - JOURNAL VOL 6/2014
PETROVIETNAM
laboratory evidence for the capability of aphron drilling fl uids - primarily the polymer water-based system - to limit fl uid invasion in permeable formations with minimal formation damage, and to provide a sound scientifi c basis for this behavior [12].
6. Lost circulation in Bach Ho and Rong oil fi elds
At depleted zones in the Bach Ho and Rong oil fi elds, reservoir pressure is lower than hydrostatic pressure and the reservoirs have cracks of various sizes (including macro and micro cracks). Therefore, lost circulation always happens in drilling processes with diff erent levels at these depleted zones. According to the drilling history in the Rong oil fi eld written by Vietsovpetro engineering for the period of ten years (1988 - 1998), there were 71 occurrences of lost circulation, with severe and complete loss accounting for 74,7%. However, until the present, there has been no eff ective treatment given for these problems.
The oil production has decreased in recent years, requiring drilling specialists and companies to fi nd solutions to lost circulation problems. With the outstanding properties which have been studied and examined globally, aphron drilling fl uid could be an excellent technique for depleted zones in the Bach Ho and Rong oil fi elds.
7. Conclusions
Aphron drilling fl uids have shown the capability of eff ectively preventing loss of circulation in depleted zones. The applicability of this technique has been reported in seminars held by the Society of Petroleum Engineers, and it has been applied in some countries such as Yemen, Brazil and Mexico.
In Vietnam, this technique has not been studied and applied yet. Nonetheless, with excellent properties, aphron drilling fl uid shows great potential for drilling at depleted zones in the Bach Ho or Rong oil fi elds, in which the oil production has declined sharply.
References
1. Felix Sebba. Preparation of biliquid foam compositions. US Patent No 4486333. 4 December, 1984.
2. Felix Sebba. Foams and biliquid foams-aphrons. John Wiley and Sons, New York. 1987: p. 46 - 127.
3. Catalin D.Ivan, Frederick B.Growcock, James
E.Friedheim. Chemical and physical characterization of aphron-based drilling fl uids. SPE 77445, presented at the SPE Annual Technical Conference and Exhibition, Texas. 29 September - 2 October, 2002.
4. J.S.Clunie, J.F.Goodman, P.C.Symons. Solvation forces in soap fi lms. Nature. 1967; 216: p.1203 - 1204.
5. L.E.Scriven, C.V.Sternling. The marangoni eff ects. Nature. 1960; 187: p. 186 - 188.
6. Arkadiy Belkin, Maribella Irving, R.O’Connor, Miranda Fosdick, Tatiana Luz Hoff , Frederick Bruce.Growcock. How aphron drilling fl uids work. SPE-96145, presented at SPE Annual Technical Conference and Exhibition, Dallas, Texas. 9 - 12 October, 2005.
7. Frederick B.Growcock, Arkadiy Belkin, Miranda Fosdick, Maribella Irving, B.O´Connor, Tom Brookey. Recent advances in aphron drilling fl uids. SPE-97982, presented at IADC/SPE Drilling Conference, Miami, Florida. 21 - 23 February, 2006.
8. Tom Brookey. Micro-bubbles: New aphron drill-in fl uid technique reduces formation damage in Horizontal wells. SPE-39589, presented at SPE International Symposium on Formation Damage Control, Lafayette, Louisiana. 18 - 19 February, 1998.
9. Francisco Ramirez, Roberto Graves, Julio Montilva. Experience using microbubbles - Aphron drilling fl uid in mature reservoirs of lake Maracaibo. SPE-73710, presented at SPE International Symposium and Exhibition on Formation Damage Control, Lafayette, Louisiana. 20 - 21 February, 2002.
10. D.Kinchen, M.A.Peavy, T.Brookey, P.Rhodes. Case history: Drilling techniques used in successful redevelopment of low pressure H2S carbonate formation. SPE-67743, presented at SPE/IADC Drilling Conference, Amsterdam, Netherlands. 27 February - 1 March, 2001.
11. Michael Gregoire, Nick Hilbig, Mark Stansbury, Saleh Al-Yemeni, Fred Growcock. Drilling fractured granite in Yemen with solids-free aphron fl uid. Presented at IADC World Drilling Conference, Rome, Italy. 9 - 10 June, 2005.
12. Fred Growcock. Enhanced wellbore stabilization and reservoir productivity with aphron drilling fl uid technology. DOE award number DE-FC26-03NT42000, fi nal report. October 2005.

28 PETROVIETNAM - JOURNAL VOL 6/2014
PETROLEUM EXPLORATION & PRODUCTION
1. Introduction
The study focused on the Western part of Ha Long basin within the geographic boundary of Block 101-100/04 of Vietnam. The basin, opened in rifting setting in early Tertiary time (Eocene - Oligocene) with a boundary faults to the North West. In late Tertiary time (Miocene to recent), the passive margin marine setting is dominant over the region. An obvious wrenching inversion has
occurred recently from late Miocene, resulting in several present day structural closures which have been the main targets for exploration drilling to date [8].
A representative section across the Eastern part of Ha Long basin (Fig.1) clearly illustrates the petroleum play concept. Oil and minor gas/condensate have been discovered and produced in this region mainly from the reservoirs of Phu Tien, Dinh Cao and Phu Cu. Main source
POTENTIAL STRATIGRAPHIC PLAY IN THE WESTERN HA LONG BASIN FROM 3D SEISMIC INVERSION AND REGIONAL GEOLOGICAL CONTEXT Nguyen Du Hung1, Hoang Viet Bach1, Ngo Van Quan1, Pham Vu Chuong1, Phan Van Trung2, Nguyen Quoc Quan3
1Petrovietnam Exploration Production Corporation, 2Black Gold Consulting Service Co. Ltd, 3Vietgazprom
There appears to be an actively working hydrocarbon system in the Western Ha Long basin (Beibuwan basin) during the Tertiary. All large conventional structures appeared leaking due to the late inversion tectonic activity. The only remain risk is the presence of a commercially sizable trap within the fetch area. With the latest 3D conventional seismic data and inversion products controlled by the information from two recent wells, a detailed litho-facial and depositional environment interpretation was carried out. The results outlined a series of areas with good reservoir potential multi-stack sand fairway surrounded and interbedded by the highly source potential lacustrine shale. These potential stratigraphic traps all have a high risk of lateral sealing. However, with the recent signifi cant oil discoveries in similar settings and trap style in the Albert basin, East Africa, these stratigraphic plays become very attractive targets and are worthy of further studies and exploration.
Key words: Potential stratigraphic play, Western Ha Long basin.
Summary
Fig.1. Ha Long petroleum system concept section [2, 7]

29PETROVIETNAM - JOURNAL VOL 6/2014
PETROVIETNAM
rocks in the Eastern part of Ha Long basin are the Eocene lacustrine shales of Phu Tien formation. In the Eastern part of the study area, in addition to Phu Tien shales, the organic rich mudstones of Oligocene Dinh Cao formation are also considered matured source rocks since they are buried in the deeper depocenter [2].
2. Well rock physics and forward
modelling
Database for the study (Fig.2) consists of 3D seismic cubes (~700km2) acquired in 2007. The seismic dataset was pre-stack time migration processed. Final full stack and partial stacks (near, mid, far) were made available. Digital wireline data from only two wells Well-A and Well-B were accessible. The whole seismic cube was then pre-stack inversion processed by DownUnder GeoSolutions in 2011 [1]. Several cubes of inversion products were then utilised for this study.
The cross-plot of elastic properties of the two wells against depth (Fig.3) shows a clear separation between reservoirs (sandstones, siltstones) and non-reservoir rocks (calcareous siltstones, siltstones and clays) on P-Impedance (AI) domain. The only exception is the carbonaceous claystones encountered at the bottom section of Well-B. These claystones appear even “softer” than the sandstones. However, they are reversely located in Vp/Vs domain that appears even higher than the other claystones and shale. Pre-stack inversion products, which utilise both AI/VpVs, are therefore, a very robust and reliable tool for lithology (in this case is reservoirs) prediction.
The follow-on stochastic AI/VpVs cross-plot (Fig.4) with the modelled fl uid substitution again confi rmed the good separation between reservoir and
Fig.2. Database and objects
Fig.3. Well elastic properties depth trend [1]
Fig.4. Stochastic well modelling [1]

30 PETROVIETNAM - JOURNAL VOL 6/2014
PETROLEUM EXPLORATION & PRODUCTION
non-reservoir rocks. Therefore, in actual inversion products interpretation, high net-to-gross (NTG) gas sand prediction (red) was summed with the low net-to-gross gas/high net-to-gross oil prediction (pink) to make a new cube named reservoir probability prediction. This cube is the best representation of the reservoirs’ clear distinction from the other non-reservoir rocks.
It is also noted that the high net-to-gross gas is clearly delineated in the AI/VpVs domain. If good gas sand is actually present, it must be a very bright anomaly on this prediction cube. And in the pre-stack seismic domain, strong AVO class III should be obvious. The low net-to-gross gas sand/high net-to-gross oil sand is overlapped with the water wet (brine) sand. I n the conventional pre-stack domain, moderate amplitude and mild diff erence between far and near should be expected.
3. Depositional environment and
litho-facial interpretation
Depositional environment has been interpreted independently and conventionally based on regional and well data of Well-A and Well-B. Four GDE maps were produced for four stratigraphic intervals in an attempt to depict the gross depositional elements (Fig.5). Litho-facies were then interpreted on several stratal slices of the previously made reservoir prediction cube within each gross interval. The anomalies of high probability of reservoir (sand) presence were then outlined and stacked and overlain on the gross isopach map (Fig.6) for fi nal GDE interpretation.
GDE map (Fig.7) shows two main sedimentary sources from the West and the North-Northwest and another secondary source from the East-Southeast. Due to variation of
Fig.5. Well correlation and GDE defi nition
Fig.6. Slicing for inversion anomalies overlain on isopatch
Fig.7. Gross depositional environment interpretation

31PETROVIETNAM - JOURNAL VOL 6/2014
PETROVIETNAM
accommodation space and the source supply, the fl uvial and delta system has been shifted to back/forward to shallower/deeper locations in the lacustrine. High energy environment from the West formed good reservoirs (point bars, mouth bars, and channel sands). Good reservoirs might also exist in a fan system at the Northwest dip side. Lateral seal, there, might be good owing to smeared shale along the boundary fault.
Fig.9 shows a Southwest-Northeast cross section through Well-A, Well-B and two heavy stack anomalies areas BH-Lead and PH-Lead. Inversion reservoir prediction (upper-left) shows high probability of several stack sands deposited at BH-Lead and PH-Lead consistent with the previous litho-facial interpretation. The other section (lower-left) shows that there is low probability of good sand bearing gas presence in these two lead areas. The conventional near and far stacks (Fig.10) both show strong amplitude which highly related to the contrast between interbeded sand/shale interfaces expected at BH-Lead and DB-Lead. Far stack is just slightly stronger than the near stack. This does not support the presence of gas bearing sand. Oil sand, however, may still be present.
Fig.10 illustrates how a slice (T31+01) is tracking in section view along the inversion anomaly (reservoir probability) including the gas sand #2 encountered at Well-B. Fig.11 shows the maximum anomaly maps within the slice and its depth map. Small anomalies are observed at Well-A and Well-B which are very likely related to the gas pays founded at both wells at this level (top-right). No other
Fig.8. Inversion’s prediction Southwest-Northeast cross section
Fig.9. Conventional partial stack Southwest-Northeast cross section
Fig.10. Inversion slice tied to well data

32 PETROVIETNAM - JOURNAL VOL 6/2014
PETROLEUM EXPLORATION & PRODUCTION
anomaly which may associate to high net/gross gas bearing sand on the whole 3D area was observed (top-right). The anomaly at BH-Lead and PH-Lead looks most bright (top-left), predicting a higher probability of good sand reservoir presence.
Fig.12 shows equivalent slicing of the T31+01 on the conventional partial stack data for additional interpretation. Far minus near slice (top-left) suggests more coal deposited in the South East of TL-Lead. Carbonaceous claystones are also expected down-dip of PH-Lead. The brighter anomaly on near stack (bottom-right) over the far (top-right) is also a better illustration of the above interpretation. Less coal is present at Well-B area as observed from the well data.
4. Analog geological model
An analog geological model is proposed which is the Albert lake basin at the border between Uganda and the Democratic Republic of Congo within the East African rift valley setting (Fig.13). The depositional setting is the lacustrine environment as in the Ha Long basin while the size is relatively similar. The analog proposed for PH-lead is the Kingfi sher oil fi eld (Figs.14. & 15 show the log correlation between the fi rst two wells Kingfi sher-1A and Kingfi sher-2 at the pay interval. It can be obviously seen that Well-A and Well-B also show the same log motif, general net/gross ratio suggesting a similar depositional environment as those at Kingfi sher wells.
5. Conclusions
Litho-facial and environment interpretations based on inversion products indicate the presence of a multi-stack good sand fairway
Fig.11. Inversion slice anomalies interpretation
Fig.12. Partial seismic slices interpretation
Fig.13. Analog basin - Albert lake in East Africa [4]

33PETROVIETNAM - JOURNAL VOL 6/2014
PETROVIETNAM
developed and concentrated in four lead areas.
Conventional partial stack seismic also indicates that coal and carbonaceous claystones are widely deposited surrounding the PL-lead and TL-Lead.
Good sand fairway surrounded and interbedded by a lacustrine dominant carbonaceous claystones of Dinh Cao formation (already confi rmed source rock potential) suggests these leads are very favoured in terms of hydrocarbon charging.
The analog from the Kingfi sher oil fi eld on similar settings in the Albert basin, East Africa supports the up-dip fault/stratigraphic sealing mechanism for this type of hydrocarbon trap.
Fig.14. Analog fi eld - Kingfi sher oil fi eld [4]
Fig.15. Kingfi sher discovery - well data [4, 5]
Further fault seal analysis and updated basin modelling are recommended. However, this new stratigraphic play concept is obviously potential in the petroliferous Ha Long basin.
References
1. DownUnder GeoSolutions. Block 101-100/04 off shore Northern Vietnam QI fi nal report. 2012.
2. Baojia Huang, Xianming Xiao, Dongsheng Cai, R.W.T.Wilkins, Mingquan Liu. Oil families and their source rocks in the Wexinan Sub-basin. Organic Geochemistry. 2011; 42(2): p. 134 - 145.
3. Ikon Sciences. Ha Mai-1X rock physics study. 2010.
4. Paul Logan, Steve Curd, Bob Downie, Janie Weston, Dave Shaw. Exploration on the frontier: Towards an understanding of the Albert basin. AAPG International Conference and Exhibition, Cape Town, South Africa. 26 - 29 October, 2008.
5. PVEP, Black Gold Consulting Service Co. Ltd. Block 101-100/04, Off shore Vietnam, 3D special seismic Interpretation for Litho-facial Environment. Technical report. 2013.
6. Santos. 101-Ha Mai-1X well geological completion report. 2009.
7. Salamander. 101-Cat Ba-1X well geological completion report. 2011.
8. Salamander. Block 100-100/04 evaluation report. 2012.
9. Tullow Oil plc. Overview presentation. www.tullowoil.com.
10. Vietnam Petroleum Institute. 101-Cat Ba-1X well petrographic, biostratigraphic, geochemical, PVT analysis reports. 2011.

34 PETROVIETNAM - JOURNAL VOL 6/2014
PETROLEUM PROCESSING
1. Introduction
Aluminophosphate framework structures analogous to the naturally occurring mineral Chabazite were fi rst synthesised in 1984. Lok et al. of Union Carbide
[1] synthesised a series of silicon-substituted aluminophospahte materials (SAPO’s) and this was followed by the substitution of divalent metal ions into the AlPO framework, where the Al3+ is replaced by divalent Co, Mn, Zn, Mg, Fe, etc, forming MeAlPO’s. These materials still command large amounts of interest today, particularly in the area of shape selective-catalysis [2, 3].
Of particular interest are the chabazitic (CHA) systems, i.e. the structure types -34, -44, and -47, diff ering only in chemical composition and the template species used in synthesis, and type -18 (AEI) which has a similar structure diff ering only in how the double six-rings stack (Fig.1). These systems are known to be eff ective catalysts for the conversion of methanol to light olefi ns, in particular being selective for ethene over higher olefi ns [4 - 6] which attracted considerable attention. Initially type-34 materials were prepared using tetraethylammonium hydroxide (TEAOH) as the template [1] but, since this initial synthesis several other templates have been successfully used, including morpholine [7, 8], piperidine [9] and triethylamine [10, 11]. Most of the resultant synthesis gels react under similar conditions, while some require changes in temperature, pH and time to form the specifi c
structure. In this study all the structures are of the AlPO-34 type synthesised using triethylamine as the structure-directing agent.
TRIETHYLAMINE TEMPLATE LOCATION WITHIN CoAlPO-34 TYPE MATERIALS BY HIGH-RESOLUTION POWDER DIFFRACTION AND SINGLE-CRYSTAL DIFFRACTION TECHNIQUESRichard Alexander1, Nguyen Khanh Dieu Hong2
1University College London, 2Ha Noi University of Science and Technology
Fig.1. A section of the CHA (Chabazite) type framework is given in (a) as found in structure types -34, -44, and -47. (b) Shows the AEI
structure as in type -18. The main diff erence is in the stacking of the double 6-rings. The Co/Al sites are shown in blue
Fig.2. Structure of the template species triethylamine. The nitrogen site is shown in blue, the carbon in green and the hydrogen’s are white
(a) (b)
A detailed structural study into the eff ects of substituted cobalt concentration within the aluminophosphate material CoAlPO-34 on the uptake of the template within the framework structure has been performed. The structure is classed as “small pore”, with an aperture of ca 3.8Å, and has a structure analogous to that of the naturally occurring mineral Chabazite. Both high-resolution powder diff raction (HRPD) and single-crystal diff raction (SCD) techniques in the form of micro-crystal diff raction facilities at the Daresbury Synchrotron Source have made it possible to collect high-quality diff raction data for the range of crystalline CoAlPO-34 samples. The results showed the template location and ordering within the structure at the various substituted cobalt concentrations up to the Co:T site ratio of 1:6 expected to produce two template molecules per cage. The location of the single organic template molecule within the microporous framework is clearly shown.
Key words: Template, location, high resolution X-ray diff raction, single-crystal difraction.
Summary

35PETROVIETNAM - JOURNAL VOL 6/2014
PETROVIETNAM
Uncertainty over the factors infl uencing the synthesis of these materials still exists; the presence or absence of a heteroatom within the synthesis gel can radically alter the structure of the resulting material. The relationship between the template and cobalt concentration is explored through the Triethylamine-templated CoAlPO-34 structure. Lewis et al [16] showed computationally that this system contains 2 template molecules per cage, but little crystallographic information has been obtained [16]. Several authors have calculated the number of template molecules located within the Chabazite-type cage of heteroatom-substituted AlPO-34 by employing single-crystal or thermogravimetric studies [14]. Usually one or two templates are found per cage; depending on which template was used and the type of heteroatom substituted into the framework, this number can vary.
Results for morpholine show that 2 templates are usually found per cage [12, 13]. However Marchese et al [13] showed that there are 1.5 molecules of morpholine per cage but also two molecules of water; this suggests that 50% of the cages might be occupied by 2 molecules of morpholine; the rest will have 1 molecule of morpholine and 4 molecules of water. If triethylamine
is used as the templating agent, thermogravimetric analysis of the synthesised SAPO-34 in the presence of HF shows there are two template molecules present per cage. Computational studies [17] have shown that
2 triethylamine molecules can fi t comfortably within the cage. Synthesis of heteroatom-substituted AlPO-34 with tetraethylammonium hydroxide [2, 12, 18] and 1-propylamine [7] showed only one template molecule per chabazite cage.
Lewis et al [16] reported that, energetically, it is preferential for two template molecules to be found in each cage. The calculations show a signifi cant increase in stability over a single template occupation. Xu et al [14] synthesised CoAPSO-34 and SAPO-34 using triethylamine in the presence of HF; thermogravimetric analysis showed the presence of two molecules per cage. Using computational techniques they also showed that two triethylamine molecules fi t comfortably inside the chabazite cage. There are however, only limited single-crystal data reported for heteroatom-substituted AlPO-34 synthesised from in the absence of HF [16].
In paper we will compare the number and locations of the template molecules within the chabazite cages as a function of cobalt concentration. The CoAlPO-34 structures were synthesised with triethylamine as the structure-directing agent (Fig.2).
The structure of chabazite is comprised of double six-rings, with 3 sets of four rings attached to each six-membered ring (6-membered with respect to the number of T-atoms, a conventional notation used when describing such structures). Two of these secondary units join together to form a cage structure with intersecting 8-membered ring channels. The cage units then join together to form the 3-dimensional microporous network, (Fig.3). The 8-rings channels have a pore aperture of approximately 3.8 x 3.8Å.
One of the problems with the detailed structural characterisation of these materials is that they rarely form large enough single crystals for study using standard laboratory single-crystal diff raction techniques. As a result of this, many of the related structures have been solved by the combination of powder diff raction and single-crystal data, as well as computer simulations in some cases [19 - 25]. However, with the advent of micro-single-crystal diff raction facilities such as Station 9.8 at the Daresbury Synchrotron Radiation Source, it is now routinely possible to collect diff raction data from crystals as small as 15 x 15 x 15μm. For this study, however even crystals of this size were not available for all the samples prepared, necessitating the use of both single microcrystal diff raction and high-resolution powder diff raction
Co2+ concentration
(%) at synthesis Powder Single crystal
10 Yes No 15 Yes Yes 20 Yes Yes 25 Yes No
Table 1. Summary of the crystal size obtained for each sample prepared. Powder samples are defi ned here as having a particle
size smaller than 15 x 15 x 15μm
Fig.3. A model of the CHA (Chabazite) type framework. The Co/Al sites are shown in blue, the phosphorus in purple and the bridging
oxygen atoms are red

36 PETROVIETNAM - JOURNAL VOL 6/2014
PETROLEUM PROCESSING
techniques to identify the number of templates and their location inside the CoAlPO-34 structure. The prepared samples are summarised in Table 1.
2. Experimental
2.1. Synthesis
Samples of the CoAPlO material were synthesised hydrothermally using triethylamine as the template species. In this case a solution was fi rst made from the
Co(acetate)2 and some of the water. The aluminium source was combined with 85% phosphoric acid and the remaining water; this was thoroughly stirred before the addition of the cobalt acetate solution. The resultant gel was mixed until homogenous and the template was added at the fi nal stage.
The gel was then mixed again until homogenous and then sealed in a PTFE liner within a stainless steel autoclave and heated under autogenous pressure at 170°C for 4 days. The product is recovered by fi ltration and the blue crystallites were dried at 100°C for 24 hours. The gel compositions used for the cobalt concentrations are given in Table 2. Phase purity was checked by powder diff raction recorded with a Siemens D500 diff ractometer. The diff raction patterns are shown in Fig.4. All patterns are similar to that of the mineral chabazite, indicating the only phase presents being the Chabazite-related
CoAlPO-34 material. The peak positions also match those expected as in the Atlas of Zeolite Structures [26]. When studied using an optical microscope the samples split into two groups, with cubic blue crystals, where large crystals are formed, consistent with previous Chabazite-type samples. Fine powders are obtained in the second case. Optical pictures of the samples are shown in Fig.5.
2.2. Data collection
2.2.1 Single-crystal diff raction data collection
As some single crystals of the prepared material were available, single-crystal diff raction was used to locate the template molecules inside the CoAPO-34 framework and provide supporting data to the powder analysis. Single crystal analysis of all prepared samples was not possible, as crystals of suffi cient size were not always obtained. The data for the crystals were collected on Station 9.8 of Daresbury SRS using a Bruker SMART CCD area detector diff ractometer equipped with
Co Al P H2O Template
0.10 0.90 1 60 2.0 0.15 0.85 1 60 2.0 0.20 0.80 1 60 2.0 0.25 0.75 1 60 2.0
5 15 25 35 45 55 65
2 Theta (Degrees)
10% Cobalt15% Cobalt20% Cobalt25% CobaltCHA std
Inte
nsity
(AU
)
Fig.5. Optical images showing the diff erent crystalline sizes obtained. Picture upper shows the distinct single crystals obtained for the 15% and 20% cobalt substituted
CoAPlO-34 samples. Picture lower is representative of the fi ne powder obtained in all other concentrations for substituted cobalt CoAlPO-34 material
Fig.4. XRD patterns for CoAlPO-34 synthesised with diff ering cobalt concentrations. Intensities are arbitrary and the spectra have been off set vertically for clarity
Table 2. Gel compositions (moles) used in the synthesis of CoAPlO-34 with diff erent cobalt concentrations

37PETROVIETNAM - JOURNAL VOL 6/2014
PETROVIETNAM
a silicon (111) crystal monochromator. A hemisphere of data was collected in each case at a temperature of 150K, employing a wavelength of 0.6892Å. The data were analysed via a least-squares refi nement combined with direct methods, using the SHELXTL/SHELX-97 suite of programs [29].
2.2.2. High-resolution powder diff raction data collection
High-resolution powder diff raction data were collected on station 2.3 at the Daresbury SRS [28]. The data were collected at room temperature in capillary mode. The step size was 0.01° and the time for each step was 4s; the data were collected from 6 to 70° 2θ with a wavelength of 1.30029Å. Two patterns were collected and the data summed. The data were analysed by Rietveld profi le refi nement using XRS-82, the X-ray Rietveld system suite of programs [30].
2.3. Data analysis
In order to maintain consistency and allowing for the fact that a single crystal is not always representative of the overall bulk sample, all the cobalt-substituted concentrations were refi ned using the Rietveld method, with the single-crystal studies in support. As the powder patterns obtained for each sample closely matched, each pattern was refi ned from the same initial starting model. This model was taken from the single-crystal data and was used to provide the atoms only for all the powder samples and also the initial cell dimensions and space group. The space group R3 was used for each of the structures.
The fi rst step for the refi nement with XRS-82 is the estimation and subtraction of the background; this is done by linear interpolation between selected points before subtraction. This more eff ectively models the background function, particularly in this case the slight “hump” due to the amorphous scattering from the glass/quartz typically found when the samples are analysed in capillary mode. A pseudo-Voigt function was used to describe the peak shape [30]. In the initial stages, refi nement of the peak shape function was performed before the inclusion of cell parameters and zero-point error. Once all these parameters had converged, the framework atomic coordinates were refi ned. In order to achieve a stable refi nement, a few constraints were applied. In particular, the Al-O and P-O distances were restrained to 1.77Å and 1.53Å, with esd’s of 0.02 and 0.01 respectively. The former distance is longer than the standard Al-O bond distance to take into account the cobalt substitution on the aluminium sites. Associated with this were some bond angle restraints, i.e. the O-P-O
and O-Al-O angles were restrained to 109° (esd 0.80) and the Al-O-P restrained to 145° (esd 8.0). After successfully refi ning the framework, a 3-dimensional electron density map was generated to reveal the location of the template molecules within the structure. With the template species now included within the model, again with restraints, (distances N-C 1.48Å, esd 0.01, and C-C 1.54Å, esd 0.01. Angles C-N-C 110°, esd 1.0. and N-C-C 109°, esd 1.0.), further refi nement was performed to accurately determine the template location. The hydrogen atoms on the template were geometrically placed.
2 Theta Degrees
Inte
nsity
(A
U) Observed
CalculatedDifference
Fig.7. Best fi t between calculated XRD pattern employing XRS-82 program for HRPD data of the 10% Co sample of CoAlPO-34. Collected at station 2.3, SRS, Daresbury Laboratory,
using a wavelength of 1.30029Å
Fig.6. The observed electron density map clearly shows the template location within the cage. The framework has been
overlaid for clarity and shows the Al/Co positions in blue

38 PETROVIETNAM - JOURNAL VOL 6/2014
PETROLEUM PROCESSING
In the fi nal cycles of refi nement a further electron density map was generated to check for any density unaccounted for within the structure. At this point it also becomes possible to remove the framework bond restraints; all atomic and displacement parameters were then refi ned to convergence. The initial cell and space
group information and the starting coordinates for the framework atoms were provided by the high quality single-crystal data collected for the 15% cobalt-substituted CoAlPO-34 material. The framework coordinates were directly transferred to the Rietveld refi nement for the 15% cobalt-substituted CoAlPO-34 HRPD data. This structure model was refi ned to completion and the fi nal framework atom positions were then used as the starting model for the subsequent powder refi nements for all other substituted cobalt concentrations.
3. Results and discussion
3.1. High-resolution powder diff raction study of 10%
cobalt in CoAlPO-34
The structure was refi ned from a starting model as described above using XRS-82, in the space group R3.
The fi nal refi ned unit cell parameters were a = 13.857Å and c = 14.872Å. The fi nal model was refi ned to convergence, producing fi nal agreement factors (esd’s) given in Table 3. The observed, calculated and diff erence profi les are shown in Fig.7. The generated diff erence Fourier map (diff erence election density map generated to help locate the template species) was generated after the framework atom positions and displacement parameters were refi ned. The generated 3-dimensional map clearly identifi es the positions of the template carbon atoms in the chabazitic cage, and suggests only one template per cage (Fig.6). The coordinates for the carbon atoms were then added to the model and their locations refi ned to convergence. With the template molecule accurately located, the model was refi ned to convergence with the hydrogen atoms being placed last, geometrically. The fi nal bond distances and angles are all chemically reasonable, with the fi nal wRp closely matching the expected value. The fi nal R factors are shown in Table 3 and the fi nal diff erence X-ray profi le is shown in Fig.6.
With the structure being refi ned in the space group R3 there are only 2 T atom positions, and as such it is not
Atom Pair Bond Length (Å) Bond Angle Degrees
P1 - O1 1.53 O1 - P1 - O2 108.8 P1 - O2 1.51 O1 - P1 - O3 110.7 P1 - O3 1.51 O1 - P1 - O4 110.8 P1 - O4 1.50 O2 - P1 - O3 109.2
O2 - P1 - O4 109.7 O3 - P1 - O4 107.4
Al1 - O1 1.78 O1 - Al1 - O2*A 108.7
Al1 - O2*A 1.73 O1 - Al1 - O3*A 108.5
Al1 - O3*A 1.77 O1 - Al1 - O4*A 111.9 Al1 - O4*A 1.69 O2*A - Al1 - O3*A 110.7 O2*A - Al1 - O4*A 108.2 O3*A - Al1 - O4*A 108.6 P1 - O1 - Al1 147.9
P1 - O2 - Al1*A 153.3
P1 - O3 - Al1*B 150.3
P1 - O4 - Al1*C 144.1 N1 - C1 1.51 C1 - N1 - C1*A 113.1 C1 - C2 1.55 N1 - C1 - C2 112.0
Atom x y z Occupancy Uiso
P1 0.44153 0.33860 0.22688 1.00000 1.40665
Al1 0.67258 0.56636 0.23528 0.91000 2.88348 Co1 0.67258 0.56636 0.23528 0.08900 2.88348
O1 0.54232 0.45136 0.20221 1.00000 4.97041 O2 0.34700 0.31442 0.16321 1.00000 4.97041
O3 0.46982 0.24673 0.21967 1.00000 4.97041 O4 0.40550 0.33933 0.32213 1.00000 4.97041
N1 0.66667 0.44467 0.74130 0.33333 3.79955 C2 0.69171 0.46220 0.63769 1.00000 3.79955
Table 4. Selected bond lengths and angles for the as-synthesised 10% CoAlPO-34 framework material
Table 3. Atom x, y, z coordinates and isotropic thermal parameters for the as prepared 10% CoAlPO-34. The cobalt occupancy here refi nes to 8.9%
Fig.8. View of the 10% CoAlPO-34 structure, showing the position and orientation of the template within the cage structure. Al/Co
sites are shown in blue

39PETROVIETNAM - JOURNAL VOL 6/2014
PETROVIETNAM
possible to assign separate positions to the Al and Co ions; therefore the Al site was refi ned with a partial occupancy of Al and Co (with (Al + Co) = 1). The cobalt content was refi ned and the fi nal value matched closely the amount incorporated in the initial synthesis gel. The atomic coordinates and bond lengths and angles are given in Tables 3 and 4 respectively. The fi nal structure derived from the Rietveld analysis clearly shows the presence of a highly ordered single template molecule contained within the cage of the framework. The atom coordinates and selected bond lengths are shown in Tables 4 and 5 respectively.
3.2. High-resolution powder diff raction study of 15%
cobalt in CoAlPO-34
The initial cell dimensions were again refi ned along with the zero-point correction before refi ning the structural model. The fi nal framework atomic coordinates from the 10% CoAlPO-34 refi nement provided the starting point and this model was then refi ned in the same manner as the 10% data, in the space group R3, with the template molecule located by the diff erence electron density map generated once the framework atoms had stabilised. The fully refi ned and converged Rietveld diff erence patterns are shown in Fig.10. The fi nal refi ned unit cell parameters were, a = 13.832Å c = 14.921Å. The cobalt content cobalt refi ned to 16.6%. The template was easily located from the generated 3-dimensional density map, and again shows a single template molecule occluded within the chabazitic cage (Fig.11). Again a good correlation between the fi nal wRp and the expected value was obtained and the bond distances and angles are all acceptable and chemically reasonable. Final agreement factors are shown in Table 5. The atom coordinates and selected bond lengths and angles are shown in Tables 6 and 7 respectively.
3.3. High-resolution powder diff raction study of 20%
Cobalt in CoAlPO-34
The refi nement followed the previously established route in the space group R3. The refi ned cell parameters obtained for the 20% CoAlPO-34 material are a = 13.831Å, and c = 14.933Å. The diff erence profi le is shown in Fig.12 and the fi nal agreement R-factors are given in Table 8.
The structural model obtained is shown in Fig.13. Again we fi nd evidence for only a single triethylamine template molecule within the structural chabazitic cage. The atomic coordinates and selected bond distances and angles are given in Tables 9 and 10 respectively.
5 15 25 35 45 55 652 Theta Degrees
Inte
nsity
(AU
)
ObservedCalculatedDifference
40 45 50 55 60 65 702 Theta Degrees
Fig.9. View of the 10% CoAlPO-34 structure showing the position of the single triethylamine template molecule.
The Al/Co sites are shown in blue
R Factor Value
Profile, (Rp) 0.242
Profile, Weighted, (wRp) 0.144
Profile, Statistically Expected, (Re) 0.135
Table 5. Final agreement factors for the 15% cobalt-substituted CoAlPO-34 material
Fig.11. View of the 15% CoAlPO-34 structure, showing the position of the single triethylamine template molecule. The Al/Co sites are
shown in blue
Fig.10. HRPD data for the 15% Co sample of CoAlPO-34, showing the best fi t between calculated XRD pattern and observed
data, employing XRS-82 program. Collected at station 2.3, SRS, Daresbury Laboratory using a wavelength of 1.30029Å

40 PETROVIETNAM - JOURNAL VOL 6/2014
PETROLEUM PROCESSING
3.4. High-resolution powder diff raction
study of 25% cobalt in CoAlPO-34
The atomic coordinates and selected bond angles and distances are given in Tables 12 and 13 respectively and are all chemically reasonable and what we would expect. The fi nal structural model obtained is shown in Fig.15 and clearly shows the location of the single template molecule within the cage structure.
With all the structures solved and refi ned in the space group R3, the inclusion of the centre of inversion at the centre of the chabazite cage places a symmetry-equivalent triethylamine template molecule on either side of this in order to conform to the overall symmetry of the system. However this places the two equivalent, adjacent molecules very close together, resulting in N... N separation distances shorter than an actual bond length rather than the separation of 2 adjacent groups. The separation distances are shown in Figs.16 and 17.
By lowering the symmetry for the refi nement from R3 to R3 we will remove the inversion point, and therefore subsequent data analysis in this revised symmetry should eliminate the second equivalent template molecule. To achieve this we went back to the two initial single crystal-studies at 15% and 20% substituted CoAlPO-34. These along side a representative powder data set, were re-analysed in the lower symmetry space group R3.
3.5. Single-crystal study of CoAlPO-34
material
Single-crystal data were collected on station 9.8 at the Daresbury SRS as described earlier and solved by direct
Atom x y z Occupancy Uiso
P1 0.44351 0.33840 0.22358 1.00000 1.29710 Al1 0.67072 0.56249 0.23301 0.83300 1.04874
Co1 0.67072 0.56249 0.23301 0.16600 1.04874 O1 0.54138 0.45126 0.19611 1.00000 2.24358
O2 0.34605 0.31291 0.16285 1.00000 2.24358 O3 0.47424 0.24780 0.21279 1.00000 2.24358
O4 0.41138 0.33711 0.32124 1.00000 2.24358 N1 0.66670 0.33330 0.73384 0.33333 3.79955
C1 0.68452 0.24229 0.76079 1.00000 3.79955 C2 0.70463 0.19545 0.67334 1.00000 3.79955
Atom Pair Bond Length (Å) Bond Angle Degrees
P1 - O1 1.52 O1 - P1 - O2 107.9 P1 - O2 1.51 O1 - P1 - O3 110.1
P1 - O3 1.52 O1 - P1 - O4 111.9 P1 - O4 1.52 O2 - P1 - O3 109.1
O2 - P1 - O4 110.5 O3 - P1 - O4 106.9
Al1 - O1 1.77 O1 - Al1 - O2*A 107.8 Al1 - O2*A 1.73 O1 - Al1 - O3*A 107.9
Al1 - O3*A 1.76 O1 - Al1 - O4*A 112.8 Al1 - O4*A 1.73 O2*A - Al1 - O3*A 109.4
O2*A – Al1 - O4*A 109.1 O3*A - Al1 - O4*A 109.5
P1 - O1 - Al1 143.3 P1 - O2 - Al1*A 153.8
P1 - O3 - Al1*B 147.1 P1 - O4 - Al1*C 149.4
N1 - C1 1.46 C1 - N1 - C1*A 112.7 C1 - C2 1.54 N1 - C1 - C2 105.8
Table 6. Atom x, y, z coordinates and isotropic displacement parameters for the as prepared 15% CoAlPO-34. The cobalt occupancy here refi nes to 16.6%
Table 7. Selected bond lengths and angles for the as-synthesised 15% CoAlPO-34 framework material
5 15 25 35 45 55 65 752 Theta Degrees
Inte
nsity
(AU
)
ObservedCalculatedDifference
Fig.12. HRPD data for the 20% CoAlPO-34 sample, showing the best fi t between calculated XRD pattern and observed data, employing XRS-82 program. Collected
at station 2.3, SRS, Daresbury Laboratory using a wavelength of 1.300291Å
R Factor Value
Profile, (Rp) 0.259 Profile, Weighted, (wRp) 0.141
Profile, Statistically Expected, (Re) 0.156
Table 8. Final agreement factors for the 15% cobalt-substituted CoAlPO-34 material
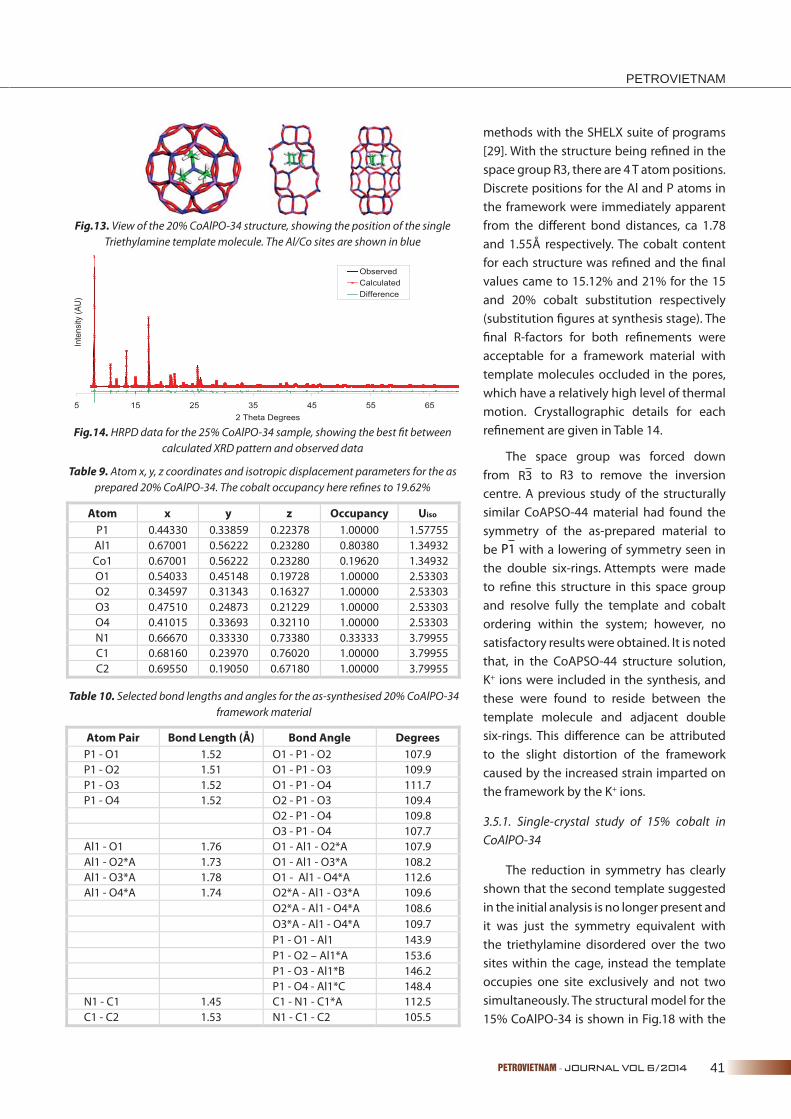
41PETROVIETNAM - JOURNAL VOL 6/2014
PETROVIETNAM
methods with the SHELX suite of programs [29]. With the structure being refi ned in the space group R3, there are 4 T atom positions. Discrete positions for the Al and P atoms in the framework were immediately apparent from the diff erent bond distances, ca 1.78 and 1.55Å respectively. The cobalt content for each structure was refi ned and the fi nal values came to 15.12% and 21% for the 15 and 20% cobalt substitution respectively (substitution fi gures at synthesis stage). The fi nal R-factors for both refi nements were acceptable for a framework material with template molecules occluded in the pores, which have a relatively high level of thermal motion. Crystallographic details for each refi nement are given in Table 14.
The space group was forced down from R3 to R3 to remove the inversion centre. A previous study of the structurally similar CoAPSO-44 material had found the symmetry of the as-prepared material to be P1 with a lowering of symmetry seen in the double six-rings. Attempts were made to refi ne this structure in this space group and resolve fully the template and cobalt ordering within the system; however, no satisfactory results were obtained. It is noted that, in the CoAPSO-44 structure solution, K+ ions were included in the synthesis, and these were found to reside between the template molecule and adjacent double six-rings. This diff erence can be attributed to the slight distortion of the framework caused by the increased strain imparted on the framework by the K+ ions.
3.5.1. Single-crystal study of 15% cobalt in CoAlPO-34
The reduction in symmetry has clearly shown that the second template suggested in the initial analysis is no longer present and it was just the symmetry equivalent with the triethylamine disordered over the two sites within the cage, instead the template occupies one site exclusively and not two simultaneously. The structural model for the 15% CoAlPO-34 is shown in Fig.18 with the
5 15 25 35 45 55 652 Theta Degrees
ObservedCalculatedDifference
Inte
nsity
(AU
)
Atom x y z Occupancy Uiso
P1 0.44330 0.33859 0.22378 1.00000 1.57755 Al1 0.67001 0.56222 0.23280 0.80380 1.34932 Co1 0.67001 0.56222 0.23280 0.19620 1.34932 O1 0.54033 0.45148 0.19728 1.00000 2.53303 O2 0.34597 0.31343 0.16327 1.00000 2.53303 O3 0.47510 0.24873 0.21229 1.00000 2.53303 O4 0.41015 0.33693 0.32110 1.00000 2.53303 N1 0.66670 0.33330 0.73380 0.33333 3.79955 C1 0.68160 0.23970 0.76020 1.00000 3.79955 C2 0.69550 0.19050 0.67180 1.00000 3.79955
Atom Pair Bond Length (Å) Bond Angle Degrees
P1 - O1 1.52 O1 - P1 - O2 107.9 P1 - O2 1.51 O1 - P1 - O3 109.9 P1 - O3 1.52 O1 - P1 - O4 111.7 P1 - O4 1.52 O2 - P1 - O3 109.4 O2 - P1 - O4 109.8 O3 - P1 - O4 107.7 Al1 - O1 1.76 O1 - Al1 - O2*A 107.9 Al1 - O2*A 1.73 O1 - Al1 - O3*A 108.2 Al1 - O3*A 1.78 O1 - Al1 - O4*A 112.6 Al1 - O4*A 1.74 O2*A - Al1 - O3*A 109.6 O2*A - Al1 - O4*A 108.6 O3*A - Al1 - O4*A 109.7 P1 - O1 - Al1 143.9 P1 - O2 – Al1*A 153.6 P1 - O3 - Al1*B 146.2 P1 - O4 - Al1*C 148.4 N1 - C1 1.45 C1 - N1 - C1*A 112.5 C1 - C2 1.53 N1 - C1 - C2 105.5
Fig.13. View of the 20% CoAlPO-34 structure, showing the position of the single Triethylamine template molecule. The Al/Co sites are shown in blue
Fig.14. HRPD data for the 25% CoAlPO-34 sample, showing the best fi t between calculated XRD pattern and observed data
Table 9. Atom x, y, z coordinates and isotropic displacement parameters for the as prepared 20% CoAlPO-34. The cobalt occupancy here refi nes to 19.62%
Table 10. Selected bond lengths and angles for the as-synthesised 20% CoAlPO-34 framework material

42 PETROVIETNAM - JOURNAL VOL 6/2014
PETROLEUM PROCESSING
20% data shown in Fig.19. The fi nal atomic coordinates are given in Tables 15 and 16 for the 15% and 20% CoAlPO-34 structures respectively.
Hydrogen atoms located on the organic template molecule were given idealised positions using the HFIX/AFIX commands within SHELX. All the other atoms, as is the case for both refi nements, were refi ned with anisotropic displacement parameters with no constraints. Fractional co-ordinates and Uiso for the 15% cobalt structure are given in Table 15.
3.5.2. Single-crystal study of 20% cobalt in CoAlPO-34
Further to resolving the number and location of the template molecules within the structure, distinct cobalt
ordering was also found. The cobalt in these systems substitutes on the aluminium T sites located on the bottom of the double six-rings, shown in Fig.20.
3.6. High-resolution powder diff raction data
The structure was again refi ned as described above using XRS-82, but this time from a starting model in the space group R3. This reduction doubles the T atom site refi nement and also shows some cobalt ordering within the system. The fi nal refi ned unit cell parameters were a = 13.832 and c = 14.933. The fi nal model was refi ned to convergence, producing fi nal agreement factors given in Table 18. The observed, calculated and diff erence profi les are shown in Fig.21.
With the lower symmetry the diff erence electron density map was generated as before in order to locate the template molecule. The map clearly showed the presence of only a single template molecule in the framework. This was added to the model and the refi nement taken to completion. A second map was generated to check for any residual electron density unaccounted for. This fi nal map confi rmed only one organic molecule in the structure, as no large electron density peaks were discovered. The fi nal structural model is presented in Fig.22. The fi nal agreement R-factors are given in Table 17. Again we see similar cobalt ordering from the HRPD data to that found in the single
Atom Pair Bond Length (Å) Bond Angle Degrees
P1 - O1 1.51 O1 - P1 - O2 106.8 P1 - O2 1.50 O1 - P1 - O3 111.7 P1 - O3 1.51 O1 - P1 - O4 112.1 P1 - O4 1.51 O2 - P1 - O3 108.2
O2 - P1 - O4 110.7 O3 - P1 - O4 107.1
Al1 - O1 1.75 O1 - Al1 -O2*A 106.6 Al1 - O2*A 1.74 O1 - Al1 - O3*A 108.0
Al1 - O3*A 1.83 O1 - Al1 - O4*A 114.2 O2*A - Al1 -O3*A 110.2
O2*A - AL1 -O4*A 107.6 O3*A - Al1 -O4*A 110.0
P1 - O1 - Al1 142.3 P1 - O2 -Al1*A 153.1
P1 - O3 -Al1*B 146.1 P1 - O4 - Al1*C 147.7
N1 - C1 1.51 C1 - N1 - C1*A 110.4 C1 - C2 1.55 N1 - C1 - C2 110.4
Atom x y z Occupancy Uiso
P1 0.44519 0.34279 0.22306 1.00000 0.87196 Al1 0.67061 0.56453 0.23484 0.77637 1.32738
Co1 0.67061 0.56453 0.23484 0.22313 1.32738 O1 0.54072 0.45600 0.19719 1.00000 1.98367
O2 0.35017 0.31757 0.16043 1.00000 1.98367 O3 0.47553 0.25181 0.21206 1.00000 1.98367
O4 0.40997 0.33967 0.31989 1.00000 1.98367 N1 0.66670 0.33330 0.64072 0.33333 3.79955
C1 0.67604 0.23430 0.67234 1.00000 3.79955 C2 0.74936 0.26420 0.75869 1.00000 3.79955
Table 13. Selected bond lengths and angles for the as-synthesised 25% CoAlPO-34 framework
Table 12. Atom x, y, z coordinates and isotropic displacement parameters for the as prepared 25% cobalt inclusion. The cobalt occupancy here refi nes to 22.3%
Fig.15. View of the 25% CoAlPO-34 structure showing the position of the single triethylamine template molecule.
The Al/Co sites are shown in blue
R Factor Value
Profile, (Rp) 0.248 Profile, Weighted, (wRp) 0.145
Profile, Statistically Expected, (Re) 0.115
Table 11. Final agreement factors for the 25% CoAlPO-34 composition

43PETROVIETNAM - JOURNAL VOL 6/2014
PETROVIETNAM
-crystal analysis, with the cobalt selectively substituting for aluminium on only the bottom of the double six-rings (Fig.23). The atomic coordinates, occupancies and displacement parameters are shown in Table 18.
3.7. Eff ect of cobalt concentration on cell parameters
As the incorporation of cobalt into the aluminophosphate framework in place of aluminium increases, as well as putting a strain in the structure, we would also expect the inclusion of a greater amount of the template acting as a charge balance. The framework strain is due to the diff ering bond lengths between aluminium and cobalt. For each substituted cobalt, four Al-O bonds (1.73Å) are replaced by four much longer (1.94Å) Co-O bonds. This cobalt inclusion into the aluminophosphate framework has been shown to have adverse eff ects, and can lead to the collapse of the structure upon calcinations once the template is removed [15].
Cobalt Concentration 15% 20% Chemical formula C0.86Al0.73Co0.13N0.14O3.43P0.86 C0.86Al0.70Co0.16N0.14O3.43P0.86
Formula weight 121.02 121.69
Temperature 150(2)K 150(2)K
Wavelength 0.6872Å 0.6872Å
Crystal system, space group Trigonal, R3 Trigonal, R3
Unit cell parameters a = 13.837(2) Å α = 90° a = 13.808(2) Å α = 90°
b = 13.837(2) Å β = 90° b = 13.808(2) Å β = 90°
c = 14.765(3) Å γ = 120° c = 14.881(3) Å γ =120°
Cell volume 2448.2(7)Å3 2457.2(8)Å3
Z 21 21
Calculated density 1.724g/cm3 1.727g/cm3
q range for data collection 2.1° - 29.3° 2.2 - 30.5°
Completeness to q = 29.3° 93.3% 94.8%
Reflections collected 5693 5926
Independent reflections 2552 (Rint = 0.1339) 3014 (Rint = 0.1409) Reflections with F2 > 2� 2,168 2,138
Structure solution direct methods direct methods Final R indices [F2 > 2s] R1 = 0.0706, wR2 = 0.1954 R1 = 0.0754, wR2 = 0.2007 R indices (all data) R1 = 0.0772, wR2 = 0.2042 R1 = 0.0985, wR2 = 0.2192 Goodness-of-fit on F2 1.034 1.033 Largest and mean shift/su 0.000 and 0.000 0.029 and 0.025 Largest diff. peak and hole 1.26 and -0.79 e 0.76 and -0.82 e Å−3
Table 14. Crystallographic details for CoAlPO-34
Fig.16. The N… N separation distance for the crystallographically equivalent template molecule located either side of the centre of inversion. This distance is measured at 1.932Å for the 10% cobalt
material
Fig.18. View of the 15% CoAlPO-34 structure refi ned in R3. 2 views of 2 cage units are shown for clarity, and to show clearly
the template location and orientation. There is only one template molecule per cage
Fig.17. N… N separation distances of 1.502Å, 2.068Å and 2.485Å for 15%, 20% and 25% substituted CoAlPO-34 respectively
Refi nement method Full-matrix least-squares on F2
15% Cobalt 20% Cobalt 25% Cobalt

44 PETROVIETNAM - JOURNAL VOL 6/2014
PETROLEUM PROCESSING
Atom x y z Uiso Occupancy
P1 1.22875(14) 0.22330(13) 1.02728(9) 0.0236(4) 1 P2 1.55892(13) 0.66163(13) 0.91215(10) 0.0236(5) 1 Al1 1.00445(13) 0.22897(13) 1.03231(9) 0.0222(7) 0.686 Co1 1.00445(13) 0.22897(13) 1.03231(9) 0.0222(7) 0.314 Al2 1.32917(12) 0.43799(12) 0.90759(10) 0.0242(6) 1 O1 1.1100(5) 0.1953(5) 1.0132(4) 0.0444(15) 1 O2 1.3096(4) 0.3222(4) 0.9725(4) 0.0429(13) 1 O3 1.4574(4) 0.5529(4) 0.9407(4) 0.0408(13) 1 O4 1.2227(5) 0.4699(5) 0.9334(4) 0.0404(13) 1 O5 1.5850(5) 0.6585(5) 0.8140(4) 0.0475(16) 1 O6 1.6547(4) 0.6787(5) 0.9733(4) 0.0489(15) 1 O7 1.2619(6) 0.2584(6) 1.1259(4) 0.0475(16) 1 O8 1.2459(5) 0.1258(5) 1.0042(4) 0.0484(16) 1 N1 1.0000 0.0000 0.671(7) 0.44(7) 0.333 C1 1.121(3) 0.082(3) 0.719(3) 0.34(3) 1 C2 1.234(5) 0.116(4) 0.7775(19) 0.43(4) 1
Atom x y z Uiso Occupancy
P1 0.89214(9) 0.32821(8) 1.23175(7) 0.0251(3) 1
P2 1.32743(8) 0.43581(8) 1.34911(6) 0.0240(3) 1
Al1 0.89633(7) 0.55975(8) 1.22765(6) 0.0261(3) 0.652
Co1 0.89633(7) 0.55975(8) 1.22765(6) 0.0261(3) 0.348
Al2 1.10314(8) 0.44224(8) 1.35520(6) 0.0207(3) 1
O1 0.7811(2) 0.5717(3) 1.2627(2) 0.0406(9) 1
O2 1.0068(2) 0.6553(3) 1.2939(2) 0.0410(9) 1
O3 0.8624(2) 0.4176(3) 1.2494(2) 0.0398(9) 1
O4 0.9819(3) 0.3462(3) 1.2946(3) 0.0510(12) 1
O5 1.2127(3) 0.4207(3) 1.3304(3) 0.0513(12) 1
O6 1.4210(3) 0.5559(3) 1.3339(3) 0.0545(13) 1
O7 1.3321(3) 0.4045(4) 1.4458(2) 0.0458(11) 1
O8 0.9212(4) 0.3235(3) 1.1343(2) 0.0492(12) 1
N1 1.0000 0.0000 1.239(3) 0.40(3) 0.333
C1 1.079(2) 0.1390(10) 1.2399(17) 1.00(3) 1
C2 1.1172(12) 0.2213(17) 1.1490(8) 0.301(12) 1
Table 15. Fractional x, y, z coordinates, Uiso and occupancy for as-prepared 15% CoAlPO-34 material. Note the Cobalt substitution refi ned to 15.7%
Table 16. Fractional x, y, z coordinates Uiso and occupancy for as-prepared 20% CoAlPO-34 material. Note the cobalt concentration refi ned to 17.4%
Fig.19. Views of the 20% CoAlPO-34 structure refi ned in R3. 2 views of 2 cage units are shown for clarity, and to show clearly the tem-plate location and orientation. Again only one template molecule
per cage is found, as seen with the 15% cobalt sample
Fig.20. Distinct cobalt ordering can be seen in both the 15 (left) and 20% (right) cobalt samples, where the cobalt substitutes for
aluminium in only one of the double six-rings

45PETROVIETNAM - JOURNAL VOL 6/2014
PETROVIETNAM
In this work, however, we are comparing the level of template inclusion within the structure against the substituted cobalt concentration; instability upon calcination is therefore of little concern. Four diff erent cobalt concentrations have been presented, and all studies have shown the inclusion of only one template within the chabazitic cage at all these varying concentrations. The cell parameters and the volumes obtained are shown in Table 19.
Although the cell dimensions change, particularly the c axis, there is an insignifi cant change in the cell volume. We would expect to see some increase in cell volume if two template molecules were to be included at higher Cobalt concentrations. The cell volume here remains almost constant, suggesting only minor changes to accommodate the larger cobalt loading on the framework and not the gradual introduction of a second template molecule to the chabazitic cage.
4. Conclusions
From the range of samples produced we were able to collect high quality data both from HRPD and a limited concentration range with microcrystal diff raction. From this we found evidence both in the original R3 space group and the subsequent reduction to R3 that only a single triethylamine template molecule was occluded within the cages.
The template molecule was quite easily found in the density map as it was not badly disordered, unusual for these systems as the template normally has a high thermal motion. However, it is clear that the template does partially occupy two sites within the chabazitic cage, but not at the same time due to the separation distance between the two nitrogen atoms. Lowering the symmetry confi rms this. In the work by Lewis et al [16] it was stated that, with the triethylamine template, the Chabazite phase is only likely to form when the Co:T site ratio reaches 1:6, this in turn gives 2 templates. However the ratio in this work is around 1:12 Co:T sites and we fi nd only on template molecule in the as-prepared phase pure Chabazite. Some cobalt ordering was discovered in the double
R Factor Value
Profile, (Rp) 0.269
Profile, Weighted, (wRp) 0.163
Profile, Statistically Expected, (Re) 0.156
Table 17. Final agreement factors for the 20% CoAlPO-34 material, in the lower symmetry space group R3
5 15 25 35 45 55 652 Theta Degrees
ObservedCalculatedDifference
40 45 50 55 60 65 702 Theta Degrees
Inte
nsity
(AU
)
Atom X Y Z Occupancy Uiso
P1 0.44312 0.34092 0.22437 1.000 0.13048
P11 0.66598 0.55806 0.44402 1.000 0.13048
Al1 0.66816 0.56288 0.23265 1.000 0.87540
Al11 0.44436 0.34122 0.43552 0.666 0.87540
Co11 0.44436 0.34122 0.43552 0.333 0.87540
O1 0.54532 0.44984 0.18927 1.000 0.24889
O11 0.78312 0.57832 0.45904 1.000 0.24889
O2 0.34454 0.31510 0.16780 1.000 0.24889
O21 0.64840 0.63339 0.50696 1.000 0.24889
O3 0.46439 0.24220 0.21888 1.000 0.24889
O31 0.58359 0.43860 0.46695 1.000 0.24889
O4 0.41930 0.35605 0.32117 1.000 0.24889
O41 0.65088 0.58198 0.34616 1.000 0.24889
N1 0.66670 0.33330 0.72844 0.333 3.79955
C1 0.74622 0.29823 0.75922 1.000 3.79955
C2 0.79239 0.26784 0.67595 1.000 3.79955
Table 18. Atom x, y, z coordinates and isotropic displacement parameters for the as-prepared 20% CoAlPO-34 material. The cobalt occupancy here refi nes
to 20%, i.e a Co:Al site ratio of 1:5
Fig.21. HRPD data for the 20% CoAlPO-34 material refi ned in the lower space group R3. Showing the best fi t between calculated and observed XRD patterns employing XRS-82. Collected at station 2.3, SRS, Daresbury Laboratory using a
wavelength of 1.300291Å
Fig.22. Views of 20% CoAlPO-34 structure refi ned in R3. The template location is shown clearly, confi rming only one template molecule per cage

46 PETROVIETNAM - JOURNAL VOL 6/2014
PETROLEUM PROCESSING
six-rings, and was highlighted once the symmetry had been lowered to the space group R3. We see the cobalt substituting for aluminium only on the lower of the double six-rings. Eff orts to resolve this further in P1 produced no satisfactory results. To conclude, this systematic study over a range of triethylamine templated CoAlPO-34 materials does provide more evidence for the inclusion of only 1 triethylamine molecule per cage. We found only a single template molecule within the cage and no signifi cant change in cell dimensions or volume, which could indicate changes like the inclusion of a second molecule.
References
1. Edith M. Flanigen, Brent M. Lok, R. Lyle Patton, Stephen T. Wilson. Aluminophosphate molecular sieves and the periodic table. Studies in Surface Science and Catalysis. 1986; 23: p. 103 - 112.
2. Stephen T.Wilson, Edith M.Flanigen. Synthesis and characterization of metal aluminophosphate molecular sieves. Zeolite Synthesis. 1989; 398, p.329 - 345.
3. John Meurig Thomas, Robert Raja, Gopinathan Sankar, Robert G.Bell. Molecular sieve catalysts for the regioselective and shape- selective oxyfunctionalization of Alkanes in air. Accounts of Chemical Research. 2001; 34(3): p.191 - 200.
4. A.D.Smith, B.C.Cowie, G.Sankar, J.M.Thomas. Use of YB66 as monochromator crystals for soft-energy EXAFS. Journal of Synchrotron Radiation.1998; 5: p. 716 - 718.
5. Heinz Berndt, Andreas Martin, Yue Zhang. Study on the nature and the redox properties of cobalt species located in CoAPO molecular sieves. Microporous Materials. 1996; 6(1): p. 1 - 12.
6. Masashi Inoue, Pongtorn Dhupatemiya, Suphot Phatanasri, Tomoyuki Inui. Synthesis course of the Ni-SAPO-34 catalyst for methanol-to-olefi n conversion. Microporous and Mesoporous Materials. 1999; 28(1): p. 19 - 24.
7. A.M.Prakash, S.Unnikrishnan. Synthesis of SAPO-34: high silicon incorporation in the presence of morpholine as template. Journal of the Chemical Society, Faraday Transactions. 1994; 90(15): p. 2291 - 2296.
8. D.K.Chakrabarty, Sunil Ashtekar, A.M.Prakash, S.V.V.Chilukuri. Substitution of silicon and metal ions in small pore aluminophosphate molecular sieves with chabazite structure: synthesis and MASNMR study. Studies in Surface Science and Catalysis. 1997; 105: p. 517 - 524.
9. Emil Dumitriu, Abdelkrim Azzouz, Vasile Hulea, Doina Lutic, Henri Kessler. Synthesis, characterization and catalytic activity of SAPO-34 obtained with piperidine as templating agent. Microporous Materials. 1997; 10(1-3): p. 1 - 12.
10. C.Urbina de Navarro, F.Machado, M.López, D.Maspero, J.Perez-Pariente. A SEM/EDX study of the cobalt distribution in CoAPO-type materials. Zeolites. 1995; 15(2): p. 157 - 163.
11. R.Vomscheid, M.Briend, M.J.Peltre, P.P.Man, D.Barthomeuf. The role of the template in directing the Si distribution in SAPO zeolites. The Journal of Physical Chemistry. 1994; 98(38): p. 9614 - 9618.
12. M.M.Harding, B.M.Kariuki. Microcrystal structure determination of AlPO4-CHA using synchrotron radiation. Acta Crystallographica Section C: Crystal Structure Communications. 1994; 50(6): p. 852 - 854.
Co concentration (%) At synthesis Co concentration % Refined a/Å c/Å Volume/Å3
10 8.9 13.858 14.872 2473.4 15 16.6 13.832 14.921 2472.3 20 19.62 13.831 14.933 2473.9 25 22.31 13.832 14.932 2474.1
Table 19. Cell parameters and volumes for CoAlPO-34 structures with diff ering substituted cobalt concentrations
Fig.23. View of the structure refi ned in R3. The cobalt ordering is highlighted as blue spheres

47PETROVIETNAM - JOURNAL VOL 6/2014
PETROVIETNAM
13. L.Marchese, A.Frache, E.Gianotti, G.Martra, M.Causà, S.Coluccia. ALPO-34 and SAPO-34 Synthesised by using morpholine as templating agent. FTIR and FT-Raman studies of the host-guest and guest-guest interactions within the zeolitic framework. Microporous and Mesoporous Materials. 1999; 30(1): p.145 - 153.
14. Y.Xu, Peter J.Maddox, John W.Couves. The synthesis of SAPO-34 and CoSAPO-34 from a triethylamine–hydrofl uoric acid-water system. Journal of Chemical Society, Faraday Transactions. 1990; 86(2): p. 425 - 429.
15. J.M.Bennett, B.K. Marcus. The crystal structures of several metal aluminophosphate molecular sieves. Studies in Surface Science and Catalysis. 1988; 37: p. 269 - 279.
16. D.W.Lewis, C.R.A.Catlow, J.M.Thomas. Infl uence of organic templates on the structure and on the concentration of framework metal ions in microporous aluminophosphate catalysts. Chemistry of Materials. 1996; 8(5): p.1112 - 1118.
17. G.Nardin, L.Randaccio, E.Zangrando. Lead clustering in a zeolite X. Zeolites. 1995; 15(8): p. 684 - 688.
18. P.A.Wright, S.Natarajan, J.M.Thomas, R.G.Bell, P.L.Gaiboyes, R. H.Jones, J.S.Chen. Solving the structure of a metal-substituted aluminum phosphate catalyst by electron microscopy, computer simulation, and X-ray powder diff raction. Angewandte Chemie International Edition in English. 1992; 31(11): p.1472 - 1475.
19. D.E.Akporiaye, H.Fjellvåg, E.N.Halvorsen, J.Hustveit, A.Karlsson, K.P.Lillerud. UiO-7: A new aluminophosphate phase solved by simulated annealing and high-resolution powder diff raction. The Journal of Physical Chemistry. 1996; 100(41): p. 16641 - 16646.
20. M.Goepper, J.L.Guth. Synthesis and characterization of AIPO4-14A molecular sieves. Zeolites. 1991; 11(5), p. 477 - 482.
21. Adeola F.Ojo, Lynne B.McCusker. AIPO4-based molecular sieves synthesized in the presence of di-n-propylamine: Are the structures related? Zeolites. 1991; 11(5): p. 460 - 465.
22. Asiloé J.Mora, Andrew N.Fitch, Michael Cole, Rajan Goyal, Richard H.Jones, Hervé Jobic, Stuart W.Carr.
The structure of the calcined aluminophosphate ALPO4-5 determined by high-resolution X-ray and neutron powder diff raction. Journal of Materials Chemistry. 1996; 6(11): p. 1831 - 1835.
23. Graham Cheetham, Marjorie M.Harding. VPI-5: Structure refi nement with single crystal synchrotron radiation diff raction data. Zeolites. 1996; 16(4): p. 245 - 248.
24. Javier de Oñate Martinez, Lynne B.McCusker, Christian Baerlocher, Günter Engelhardt. VPI-5 at 90˚C: a synchrotron powder diff raction study. Microporous and Mesoporous Materials. 1998; 22(1-3): p.127 - 134.
25. R.J.Cernik, W.Clegg, C.R.A.Catlow, G.Bushnell-Wye, J.V.Flaherty, G.N.Greaves, I.Burrows, D.J.Taylor, S.J. Teat, M.Hamichi. A new high-fl ux chemical and materials crystallography station at the SRS Daresbury. 1. Design, construction and test results. Journal of Synchrotron Radiation. 1997; 4: p. 279 - 286.
26. W.M.Meier, D.H.Olson, Ch.Baerlocher. Atlas of zeolite structure types. Butterworth-Heinenmann. 1996.
27. C.C.Tang, M.C.Miller, E.J.MacLean. SRS station 2.3 manual. Council for the Central Laboratory of the Research Councils. 1998.
28. G.M.Sheldrick. SHELX-97. Universtiy of Gottingen. 1997.
29. Ch.Baerlocher, XRS-82. The X-ray rietveld system. ETH, Zurich. 1982.
30. D.E.Cox, J.B.Hastings, W.Thomlinson, C.T.Prewitt. Application of synchrotron radiation to high resolution powder diff raction and rietveld refi nement. Nuclear Instruments and Methods in Physics Research. 1983; 208(1 - 3): p.573 - 578.
31. Philip A.Barrett, Gopinathan Sankar, C.Richard, A.Catlow, John Meurig Thomas. Investigation of the structural stability of cobalt-containing AlPO-44 microporous materials. Journal of Physics and Chemistry of Solids. 1995; 56(10): p.1395 - 1405.

48 PETROVIETNAM - JOURNAL VOL 6/2014
PETROLEUM PROCESSING
1. Introduction
With a high content of paraffi n, c.a. 17 - 30wt%, of which 50% or more are high (solid) paraffi n, Vietnamese crude oil is classifi ed as paraffi nic crude oil and has a high pour point, typically in the range of 27 - 38oC. This high pour point may cause some serious problems in production, transportation, and storage; and pose the need for use of an eff ective pour point depressant (PPD) additive. In general, a PPD is a high molecular weight substance that may eff ectively disperse and hinder the growth of oil’s paraffi n crystals when adsorbing on them. Ideally, the structure of PPD consists of (i) a paraffi n-like part, which can co-crystallise with paraffi n components of crude oil; and (ii) a polar part, which limits the level of co-crystallisation [1, 2]. Copolymers of alkyl acrylates and maleic anhydride are common PPDs used in practice [3 - 5].
Cashew nut shell liquid (CNSL) is a cheap, renewable and abundantly available raw material in Vietnam as it is a by-product of the cashew industry. The chemical composition analysis of typical CNSL [6] (Table 1) shows that it contains a major part of anacardic acid and cardol, which can act as reagents for a variety of reactions for the manufacture of a large number of
products, including inhibitors, detergents, dispersants, and EP additives [7].
It is widely accepted that anacardic acid with proper thermal treatment yields four types of cardanols, which almost have the ready-made chemical structure of an additive. The chemical structures of cardanols found in CNSL are shown in Fig.1 [8]. It is observed that the C15 linear side chains of cardanols off er excellent solubility in
SYNTHESIS OF CRUDE OIL POUR POINT DEPRESSANTS VIA POLYCONDENSATION OF CASHEW NUT SHELL LIQUIDSQuach Thi Mong Huyen, Nguyen Vinh KhanhHo Chi Minh City University of Technology, Vietnam National University
The polycondensation of cashew nut shell liquid (CNSL) with formaldehyde was carried out in order to synthesise a pour point depressant (PPD) for paraffi nic crude oils. Experimental results showed that the obtained CNSL-formaldehyde novolac resin gave good performance, decreasing the pour point of crude oil by as much as 15oC. In addition, it was also showed that there is an optimum molecular weight value of the synthesised polymer, with which the ability for depression of pour point of crude oil is expected as maximum. Thus, it is believed that with proper molecular weight control, CNSL could be polymerised into a good PPD for local crude oil.
Key words: Pour point depressant, paraffi nic crude oil, cashew nut shell liquid, polycondensation, novolac resin.
Summary
Component Content in CNSL (%)
Cardanol (%) 1.20 Cardol (%) 11.32 2-methyl cardol (%) 2.04 Polymer (%) 20.30 Anacardic acid 64.93
Table 1. Typical chemical composition of CNSL
Fig.1. Cardanols obtained from distillation of anarcadic acids in CNSL
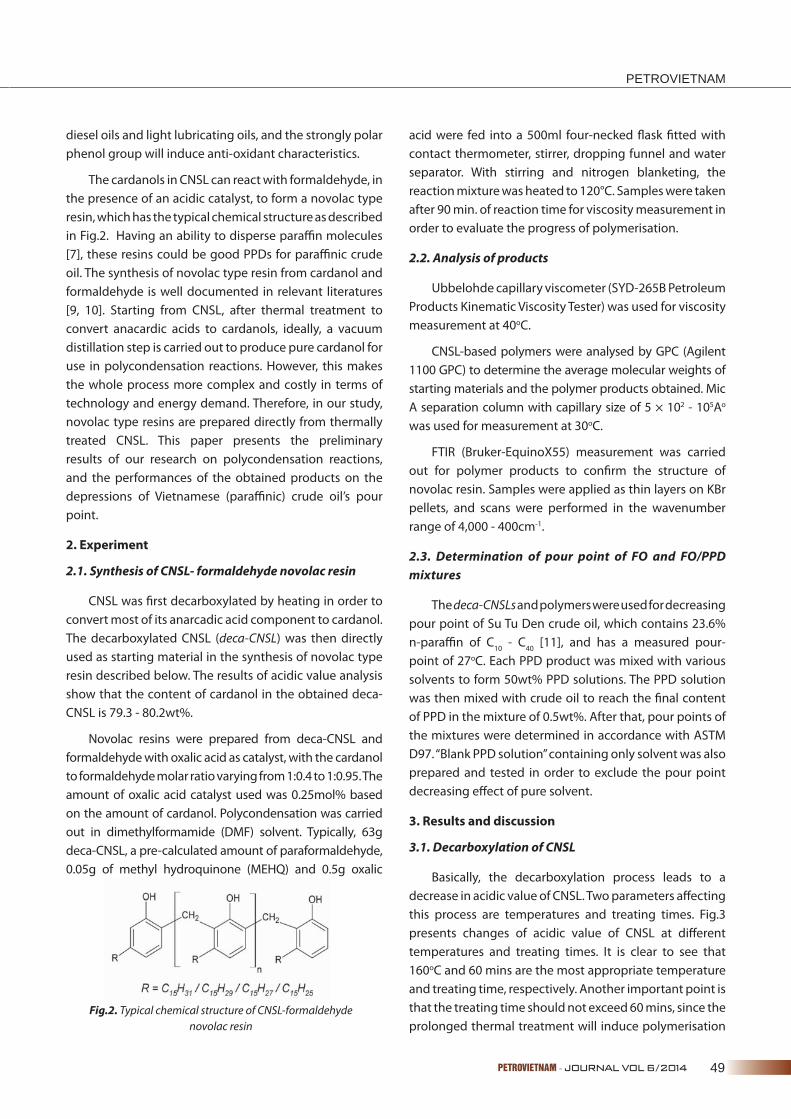
49PETROVIETNAM - JOURNAL VOL 6/2014
PETROVIETNAM
diesel oils and light lubricating oils, and the strongly polar phenol group will induce anti-oxidant characteristics.
The cardanols in CNSL can react with formaldehyde, in the presence of an acidic catalyst, to form a novolac type resin, which has the typical chemical structure as described in Fig.2. Having an ability to disperse paraffi n molecules [7], these resins could be good PPDs for paraffi nic crude oil. The synthesis of novolac type resin from cardanol and formaldehyde is well documented in relevant literatures [9, 10]. Starting from CNSL, after thermal treatment to convert anacardic acids to cardanols, ideally, a vacuum distillation step is carried out to produce pure cardanol for use in polycondensation reactions. However, this makes the whole process more complex and costly in terms of technology and energy demand. Therefore, in our study, novolac type resins are prepared directly from thermally treated CNSL. This paper presents the preliminary results of our research on polycondensation reactions, and the performances of the obtained products on the depressions of Vietnamese (paraffi nic) crude oil’s pour point.
2. Experiment
2.1. Synthesis of CNSL- formaldehyde novolac resin
CNSL was fi rst decarboxylated by heating in order to convert most of its anarcadic acid component to cardanol. The decarboxylated CNSL (deca-CNSL) was then directly used as starting material in the synthesis of novolac type resin described below. The results of acidic value analysis show that the content of cardanol in the obtained deca-CNSL is 79.3 - 80.2wt%.
No volac resins were prepared from deca-CNSL and formaldehyde with oxalic acid as catalyst, with the cardanol to formaldehyde molar ratio varying from 1:0.4 to 1:0.95. The amount of oxalic acid catalyst used was 0.25mol% based on the amount of cardanol. Polycondensation was carried out in dimethylformamide (DMF) solvent. Typically, 63g deca-CNSL, a pre-calculated amount of paraformaldehyde, 0.05g of methyl hydroquinone (MEHQ) and 0.5g oxalic
acid were fed into a 500ml four-necked fl ask fi tted with contact thermometer, stirrer, dropping funnel and water separator. With stirring and nitrogen blanketing, the reaction mixture was heated to 120°C. Samples were taken after 90 min. of reaction time for viscosity measurement in order to evaluate the progress of polymerisation.
2.2. Analysis of products
Ubbelohde capillary viscometer (SYD-265B Petroleum Products Kinematic Viscosity Tester) was used for viscosity measurement at 40oC.
CNSL-based polymers were analysed by GPC (Agilent 1100 GPC) to determine the average molecular weights of starting materials and the polymer products obtained. Mic A separation column with capillary size of 5 × 10² - 105Ao was used for measurement at 30oC.
FTIR (Bruker-EquinoX55) measurement was carried out for polymer products to confi rm the structure of novolac resin. Samples were applied as thin layers on KBr pellets, and scans were performed in the wavenumber range of 4,000 - 400cm-1.
2.3. Determination of pour point of FO and FO/PPD
mixtures
The deca-CNSLs and polymers were used for decreasing pour point of Su Tu Den crude oil, which contains 23.6% n-paraffi n of C10 - C40 [11], and has a measured pour-point of 27oC. Each PPD product was mixed with various solvents to form 50wt% PPD solutions. The PPD solution was then mixed with crude oil to reach the fi nal content of PPD in the mixture of 0.5wt%. After that, pour points of the mixtures were determined in accordance with ASTM D97. “Blank PPD solution” containing only solvent was also prepared and tested in order to exclude the pour point decreasing eff ect of pure solvent.
3. Results and discussion
3.1. Decarboxylation of CNSL
Basically, the decarboxylation process leads to a decrease in acidic value of CNSL. Two parameters aff ecting this process are temperatures and treating times. Fig.3 presents changes of acidic value of CNSL at diff erent temperatures and treating times. It is clear to see that 160oC and 60 mins are the most appropriate temperature and treating time, respectively. Another important point is that the treating time should not exceed 60 mins, since the prolonged thermal treatment will induce polymerisation
Fig.2. Typical chemical structure of CNSL-formaldehyde novolac resin

50 PETROVIETNAM - JOURNAL VOL 6/2014
PETROLEUM PROCESSING
of CNSL. Fig.4 shows the variation of viscosity of CNSL with temperatures at diff erent durations of treatment. As the decarboxylation proceeds, the viscosity of CNSL gradually declines due to lower viscosity of cardanol compared to that of anarcadic acid [12]. However, after about 60 mins, a slight increase of viscosities could be observed at all temperatures.
3.2. Synthesis of CNSL-formaldehyde novolac resin
As for the polycondensation of deca-CNSL to form novolac type resin, it was observed during the experiment that the reaction was exothermic, with relatively fast increase in viscosity of the product. Even though methyl hydroquinone was used to prevent self-polymerisation of unsaturated alkyl side chains of CNSL, the viscosity of the reaction mixture was found to hugely increase after 2 hours of reaction time, which was calculated after the addition of the fi nal drop of formaldehyde. This seems to suggest that the polymerisation of CNSL side chains is inevitable as the polycondensation is prolonged at high temperature. Since it was aimed to determine the eff ect of the polycondensation product in decreasing the pour point of crude oil, only the sample products obtained before 2 hours of reaction were further used for pour point measurements.
FTIR spectrums of deca-CNSL and the product obtained by polycondensation are shown in Fig.5. It can be observed from Fig.5 that new characteristic peaks appear at wavenumbers 1,640cm-1 and 1,614cm-1; and the shift and deformation of peak at 1,076cm-1 (for deca-CNSL) to 1,094cm-1 (for the product) which are due to the C=O stretching from methylol groups. At the same time, the peaks at 3,010cm-1, 1,590cm-1 and 778cm-1 all remain unaff ected. All these facts are identical with those given in previous studies [13] and indicate that the polymerisation has occurred via substitution of methylol groups rather than through the double bonds of the side chains.
During the polycondensation, with increasing content of paraformaldehyde, the viscosity of the reaction mixtures was found to increase (Fig.6), which means the molecular weight of obtained novolac resins increases. GPC measurement results reveal that molecular weights increase from 350g/mol to 9,000g/mol and 25,000g/mol, for the reaction mixtures with the CNSL/paraformaldehyde ratio of 1:0.4 and 1:0.9, respectively. The signifi cance of these results is that the molecular weight of the novolac resin product could be eff ectively controllable with varying ratios of the reactants.
Fig.4. Variation of viscosity of CNSL with temperatures and time of decarboxylation process
Fig.3. Variation of acidic value of CNSL with temperatures and time of decarboxylation process
Fig.5. FTIR spectrums of (a) deca-CNSL and (b) novolac resin product
Fig.6. Viscosity of reaction mixture at diff erent CNSL/paraformaldehyde ratios

51PETROVIETNAM - JOURNAL VOL 6/2014
PETROVIETNAM
3.3. Pour point depressing ability of CNSL - formaldehyde
novolac resins
As the direct dissolution of the resin into crude oils is proved to be a diffi cult process due to poor solubility and high viscosity of the crude oil, CNSL-formaldehyde novolac resins were fi rst dissolved in a specifi c solvent prior to mixing with the crude oil. The choice of proper solvent is of great importance. A polar solvent (DMF) and a non-polar solvent (xylene) were tested for the dissolution of novolac resins. Table 2 presents the pour point depression capability of diff erent dissolved resins for Su Tu Den crude oil. It could be seen that DMF dissolved resins show signifi cantly better performance compared to xylene dissolved ones. When 0.5% DMF dissolved resin is added to Su Tu Den crude oil, the pour point could drop by 12 - 15oC, whereas a decrease of only 3 - 6oC in pour point of crude oil was observed for xylene dissolved resins. It is also important to notice that the solvents themselves, despite their low freezing points, do not have any pour point depressing ability, as the blank samples have the same pour points as the crude oil. This could be explained by the fact that solvent molecules, with much more smaller size compared to crude oil molecules, could not
prevent the crystallisation and growth of large crystalline of paraffi n molecules of the crude oil. Also, the small size molecules cannot induce any spatial arrangement to separate paraffi n crystalline or to prevent the formation of a paraffi n crystalline network in crude oil.
In our previous study, SEM observations of the crystallised surfaces of crude oil/PPD mixtures were carried out and shown in Fig.7 [16]. The surface of crude oil without PPD (Fig.7a) is covered with large paraffi n crystals, while in the case of crude oil with PPD (Fig.7b), paraffi n molecules seem to be unable to form a network and hardly crystallise, resulting in a smaller size and lower numbers of crystals. This could be attributed to the ability of the PPD novolac resin molecules in adsorbing on and then dispersing the paraffi n microcrystallines in the crude oil. Linear alkyl chains of the resins (“R” in Fig. 2) could adsorb on the surface of paraffi n microcrystalline, while bulky phenolic groups, connected via methylene bridges, could well separate the microcrystallines apart. As the result, the fl uidity of crude oil/PPD mixture is maintained, at much lower temperature, compared to the neat crude oil.
Solvent Type of resins Pour point (oC) Solvent Type of resins Pour point (oC)
DMF
No resin 27
Xylene
No resin 27 1:0.4 resin 15 1:0.4 resin 24 1:0.5 resin 15 1:0.5 resin 24 1:0.6 resin 12 1:0.6 resin 24 1:0.7 resin 12 1:0.7 resin 24 1:0.8 resin 12 1:0.8 resin 21 1:0.9 resin 12 1:0.9 resin 21
Table 2. Pour point depression ability of diff erent dissolved resins, mixed to Su Tu Den crude oil at 0.5wt%
Fig.7. SEM photographs of surface of (a) freezed neat crude oil and (b) freezed crude oil/CNSL-novolac resin(a) (b)

52 PETROVIETNAM - JOURNAL VOL 6/2014
PETROLEUM PROCESSING
4. Conclusions
Polycondensation of CNSL with paraformaldehyde, forming novolac resin, seems to be a promising method in production of pour point depressants. CNSL-formaldehyde novolac resins, with a content of 0.5wt%, could reduce the pour point of paraffi nic crude oil by 12 - 15oC. It is also worth noticing that the pour point depressing capability of a resin is a function of its molecular weight. This makes the tailoring of resin’s molecular weight an eff ective measure to obtain a PPD of desired ability. Furthermore, the signifi cance of solvent employed to dissolve PPD prior to mixing with crude oil could not be neglected, and further investigations will be carried out to clarify the role of solvent and the mechanism that governs the depression of pour point of the crude oil.
References
1. G.A.Holder, J.Winkler. Wax crystallization from distillate fuels - Part I: Cloud and pour point phenomena exhibited by solutions of binary n-paraffi n mixtures. Journal of the Institute of Petroleum. 1965; 51(499): p. 228 - 234.
2. G.A.Holder, J.Winkler. Wax crystallization from distillate fuels - Part II: Mechanism of pour depression. Journal of the Institute of Petroleum. 1965; 51(499): p. 235 - 252.
3. Hemant P.Soni, Dinakar P.Bharambe. Synthesis and evaluation of polymeric additives as fl ow improvers for Indian crude oil. Iranian Polymer Journal. 2006; 15(12): p. 943 - 954.
4. A.M.Al-Sabagh, M.R.Noor El-Din, R.E.Morsi, M.Z.Elsabee. Styrene-maleic anhydride copolymer esters as fl ow improvers of waxy crude oil. Journal of Petroleum Science and Engineering. 2009; 65(3-4): p. 139 - 146.
5. Srushti Deshmukh, D.P.Bharambe. Synthesis of polymeric pour point depressants for Nada crude oil (Gujarat, India) and its impact on oil rheology. Fuel Processing Technology. 2008; 89(3): p. 227 - 233.
6. F.L.Tobiason, Chris Chandler, F.E.Schwarz. Molecular weight-intrinsic viscosity relationships for phenol-formaldehyde novolak resins. Macromolecules. 1972; 5(3): p. 321 - 325.
7. Mary C.Lubi, Eby Thomas Thachil. Cashew nut shell liquid (CNSL) - a versatile monomer for polymer synthesis. Designed Monomers and Polymers. 2000; 3(2): p. 123 - 153.
8. A.S.Patil, V.A.Pattanshetti, M.C.Dwivedi. Functional fl uids and additives based on vegetable oils and natural products: a review of the potential. Journal of Synthetic Lubrication. 1988; 15(3): p. 193 - 211.
9. Ranjana Yadav, Archana Devi, Garima Tripathi, Deepak Srivastava. Optimization of the process variables for the synthesis of cardanol-based novolac-type phenolic resin using response surface methodology. European Polymer Journal. 2007; 43(8): p. 3531 - 3537.
10. Minakshi Sultania, J.S.P.Rai, Deepak Srivastava. Studies on the synthesis and curing of epoxidized novolac vinyl ester resin from renewable resource material. European Polymer Journal. 2010, 46(10): p. 2019 - 2032.
11. Nguyen Phuong Tung, Nguyen Thi Phuong Phong, Bui Quang Khanh Long, Pham Viet Hung, Nguyen Quang Vinh, Vu Tam Hue. The use of advanced physical analytical instruments in investigation crude oil paraffi n crystallization under magnetical and chemical treatments. Petrovietnam Review. 2001; 4: p. 31 - 39.
12. J.Denis. Pour point depressants in lubricating oils. Lubrication Science. 1989; 1(2): p. 103 - 129.
13. Dileep Tiwari, Archana Devi, Ramesh Chandra. Synthesis of cardanol based phenolic resin with aid of microwaves. International Journal of Drug Development & Research. 2011; 3(2): p. 171 - 175.
14. Michael Feustel, Heidi Grundner, Dirk Leinweber, Elisabeth Wasmund. Use of cardanol aldehyde resins as asphalt dispersants in crude oil. US Patent No. US20040050752. 2004.
15. Luiz Fernando.Moreira, Elizabete Fernandes Lucas, Gaspar González. Stabilization of asphaltenes by phenolic compounds extracted from cashew-nut shell liquid. Journal of Applied Polymer Science. 1999; 73(1): p. 29 - 34.
16. Quach Thi Mong Huyen, Nguyen Ngoc Minh Chau, Nguyen Bui Huu Tuan, Dao Thi Kim Thoa, Nguyen Vinh Khanh. Synthesis routes for potential pour point de-pressants from cashew nut shell liquids. Journal of Catalysis and Adsorption. 2012; 1: p. 176 - 183.

53PETROVIETNAM - JOURNAL VOL 6/2014
PETROVIETNAM
1. Introduction
As a positive attempt to cope with the alarming degradation of air quality in today’s industrialised world, many environmental regulations have been issued, exerting a great deal of control over the enormous emissions discharged from the relentless operation of billions of transportation means and factories, in which sulphur oxides remain a major concern. Nowadays, most of the sulphur compounds are removed from petroleum-based feedstocks by the hydrodesulphurisation (HDS) process which usually operates at severe conditions, such as elevated temperature (300 - 340°C) and high pressure (20 - 100atm). This process can reduce the sulphur content in gasoline to less than 30ppmw. However, it is diffi cult to reduce the sulphur content in diesel to less than 15ppmw. In order to enhance the effi ciency of the sulphur removal process to meet the required standards, the reactor volume or the catalyst activity must be at least three times larger than those currently used in refi neries [1]. Such an increase in the reactor volume will unfavourably aff ect operating cost and capital. Moreover, another major problem associated with the deep HDS of gasoline is the signifi cant reduction of octane number due to the saturation of aromatics and olefi ns in naphtha from fl uid catalytic cracking, which also means higher hydrogen consumption. Obviously, more eff ective and aff ordable methods to produce ultra low levels of sulphur compounds in transportation fuels are needed.
There are several new techniques which have been developed as alternatives to conventional HDS. One of these is the adsorption process, which is considered to be a promising major advanced economical desulphurisation
process due to its ambient operating conditions. However, a great challenge for this approach is to select a suitable sorbent of high selectivity and sulphur capacity. A wide variety of sorbents are commonly used for adsorption purposes such as activated carbon, silica-based sorbents, zeolites, and metal exchanged/impregnated activated carbon/zeolites/mesoporous materials [2 - 5]. Yet the capacity reported was not satisfactorily high. During 2003 and 2004, Hernandez and co-workers [6] found that adsorbents based on Y-Zeolites exchanged with Ni, Cu or Ag cations have good capacity for thiophene adsorption in benzene via strong π-complexation bonding, which is stronger than Van der Waals interaction but can be easily broken by manipulating temperature and pressure.
In our previous study [7], in a binary system, it was found that the concentration of the exchanged metal in the zeolite and the type of sulphur containing compound strongly infl uenced the removal of sulphur compounds in gasoline. The present study deals with ternary systems of isooctane, benzene, and 3-MT/BT using Ni2+ exchanged zeolite as adsorbent.
2. Experimental section
The experimental process was described in detail in [7]. Briefl y, batch liquid adsorption experiments were carried out in a 15cm3 vial. The ratio of fuel to adsorbent was fi xed at 85 [8] with constant stirring. The equilibrium time was set at 8h [9]. Once the system reached equilibrium, samples were withdrawn by using syringe and then analysed by gas chromatography (HP 5890 Series 2) with FID detector and HP-5 column (30m x 0.32mm x 0.25mm fi lm thickness).
COMPETITIVE ADSORPTION REMOVAL OF SULPHUR COMPOUNDS IN GASOLINE USING X ZEOLITENguyen Anh DungHanoi University of Mining and Geology
The paper presents the results of sulphur removal from gasoline in a ternary system, i.e. benzene, 3-Methylthiophene (3-MT)/Benzothiophene (BT) and isooctane. These results indicate that the presence of aromatic compounds strongly reduces the effi ciency of the removal of sulphur in gasoline. Moreover, it is found that the exchanged zeolite exhibits higher activity than the original and the type of sulphur containing compound plays an important role in the adsorption of sulphur in gasoline. A discussion on the obtained results is also presented.
Key words: Adsorption, removal of sulphur, zeolite, gasoline.
Summary

54 PETROVIETNAM - JOURNAL VOL 6/2014
PETROLEUM PROCESSING
3. Results and discussion
3.1. Eff ect of aromatic content on sulphur compounds
adsorption
As discussed above, in view of large aromatic content (benzene used as the model aromatic compound), we believed that there was a competition between aromatic (benzene) and sulphur (3-MT orBT) compounds getting adsorbed on zeolites. In order to obtain a clearer picture on the eff ect of aromatics in the desulphurisation of transportation fuels, experiments using a small range of benzene concentration (0 - 15% by weight) in a solution of isooctane and 2,000ppmw (0.2% by weight) sulphur containing compound (3-MT and BT) content were conducted. NiX zeolite with the highest metal loading (7.48%wt Ni) and the original NaX zeolite were chosen for testing. The results are shown in Figs.1 and 2.
Results in Figs.1 and 2 illustrated a dramatic reduction in the sulphur uptake with increasing aromatics
concentration. The drastic drop on adsorption capacity was found to be approximately 85% for 3-MT and 80% for BT at benzene concentration of 6%. As benzene concentration increased further, the further reduction in adsorption capacity was not signifi cant. The infl uence of aromatic content could be explained from the fact that benzene can compete with 3-MT and BT for entering zeolite pores and adsorbing on the active sites of the zeolite. Even with benzene presented as co-adsorbate, the exchanged zeolite still exhibited a higher affi nity towards sulphur compounds than the original one. In other words, the interaction between sulphur compounds and the exchanged zeolite seemed to be ruled by π-complexation. Therefore, it could be safely concluded that the π-complexation sorbent is more favourable in desulphurisation application.
3.2. Competitive adsorption between sulphur
compounds and benzene on zeolites
Results for sulphur compounds and benzene adsorption on NiX (7.48%wt Ni) and original NaX zeolites from diff erent concentrations of benzene (0 - 15% by weight) in solution of isooctane and 2,000ppmw sulphur containing compound content are presented in Table 1 and 2 giving more insights about the impact of aromatics on the sulphur removal process. In addition, Table 1 and 2 also show selectivity (given in terms of number of moles of sulphur compounds and benzene adsorbed on zeolites) for sulphur compounds and benzene, helping to estimate how sulphur compounds were more favoured over benzene in mixture solution.
As seen from Table 1 and Fig.3, in case of low aromatic content (2%wt), the selectivity of 3-MT and BT over benzene was 1.40 and 1.37, respectively, for π-complexation sorbent (NiX zeolite). Meanwhile, at this benzene concentration, for original zeolite (NaX), the selectivity was 0.42 for 3-MT and 0.90 for BT. This result confi rmed the benefi cial eff ect of exchanged zeolite on the adsorption selectivity of sulphur compounds in the presence of
Fig.2. Eff ect of competitive benzene adsorption on BT adsorption on NiX (7.48%wt Ni) and NaX
Fig.1. Eff ect of competitive benzene adsorption on 3-MT adsorption on NiX (7.48%wt Ni) and NaX

55PETROVIETNAM - JOURNAL VOL 6/2014
PETROVIETNAM
benzene. The high values of selectivity at low benzene concentration (up to 2%wt) also implied that sulphur compounds have higher strengths of π-complexation bonds than benzene. However, when increasing the aromatic content, experimental data showed a signifi cant decrease of selectivity and an eff ective shifting of the balance to benzene. These less-than-one values imply that zeolites are more subjective to be occupied by benzene than by sulphur compounds at this high level of benzene concentration. It could be explained that at these concentrations, despite sulphur compound’s high strength of π-complexation bonds, the surface of zeolite had been completely saturated by benzene molecules, leaving very few active sites available for sulphur compounds to be bound. However, at any benzene
concentration, the selectivity of sulphur containing compound over benzene of the exchanged sorbent (NiX) is higher than that of the original one (NaX).
Considering the eff ect of sulphur-containing compound on the removal of sulphur from gasoline (Fig.3, Tab le 1 and 2), the type of sulphur-containing compounds strongly aff ected the adsorption capacity of the studied zeolites. As it can be seen, at low concentration of benzene, the adsorbent showed higher selectivity to BT than 3-MT. However, at high concentration of benzene (higher than 6%wt), there was not much diff erence between the 3-MT selectivity and BT selectivity. This result was in good consistence with our previous results in binary systems where the higher affi nity of the aromatic ring played crucial role in the adsorption of S-containing compound.
Zeolite Benzene content
(%wt)
Absorbed 3-MT
(mmol/g-sorbent)
Adsorbed Benzene
(mmol/g-sorbent)
Selectivity
(S3MT/Benzene)
NiX (7.48%wt Ni)
0% 0.645 - - 1% 0.492 0.161 3.06 2% 0.356 0.254 1.40 3% 0.173 0.506 0.34 6% 0.108 0.561 0.19 9% 0.098 0.549 0.18
12% 0.095 0.589 0.16 15% 0.091 0.585 0.16
NaX
0% 0.681 - - 1% 0.389 0.298 1.28 2% 0.230 0.478 0.42 3% 0.150 0.556 0.27 6% 0.087 0.594 0.15 9% 0.078 0.607 0.13
12% 0.074 0.607 0.12 15% 0.075 0.635 0.12
Table 1. Selectivity of 3-MT over benzene in ternary system using NiX (7.48%wt Ni) and NaX zeolites
Zeolite Benzene content
(%wt)
Absorbed BT
(mmol/g-sorbent)
Adsorbed Benzene
(mmol/g-sorbent)
Selectivity
(SBT/Benzene)
NiX (7.48%wt Ni)
0% 0.842 - - 1% 0.657 0.145 4.48 2% 0.482 0.350 1.37 3% 0.350 0.475 0.74 6% 0.150 0.695 0.22 9% 0.089 0.702 0.13
12% 0.070 0.768 0.09 15% 0.065 0.750 0.09
NaX
0% 0.805 - - 1% 0.538 0.272 1.95 2% 0.387 0.422 0.90 3% 0.298 0.518 0.58 6% 0.144 0.634 0.23 9% 0.075 0.718 0.10
12% 0.048 0.744 0.06 15% 0.046 0.766 0.06
Table 2. Selectivity of BT over benzene in ternary system using NiX (7.48%wt Ni) and NaX zeolites

56 PETROVIETNAM - JOURNAL VOL 6/2014
PETROLEUM PROCESSING
As a fi rst step to illustrate the eff ect of benzene adsorption on the removal of sulphur-containing compounds in gasoline, the total amount of BT and 3-MT adsorbed on zeolites in the presence of benzene is depicted in Fig.4. It can be seen that, the total amount of BT and 3-MT adsorbed is the same on both zeolites when there is no Benzene in the system. This can be explained by the saturation of adsorbate on the adsorbent because the adsorption time was kept quite long. The benefi t of π-complexation in the sorbent (NiX) is observed at any concentration of benzene in the system, especially in the range of 1 to 6 %wt.
4. Conclusions
The presence of aromatic compounds strongly infl uences the adsorption of sulphur containing compound on NaX and NiX zeolites. The adsorption capacity decreases with increasing benzene concentration. The rate of decrease is especially high at low benzene concentrations (less than 3%). However, when the concentration of benzene reaches a certain level, the rate of sulphur-containing compound adsorption only decreases slightly.
Similar to binary systems, the adsorption of sulphur on the studied zeolites depended on the type of S-containing compounds. The capacity to adsorb BT is higher than 3-MT, which might be the result of higher affi nity of the aromatic rings in the BT structure.
References
1. Xiaoliang Ma, MichaelSprague, Chunshan Song. Deep desulfurization of gasoline by selective adsorption over nickel-based adsorbent for fuel cell applications. Industrial & Engineering Chemistry Reserch. 2005; 44(15): p. 5768 - 5775.
2. S.Mikhail, T.Zaki, L.Khalil. Desulfurization by an economically adsorption technique. Applied Catalysis A: General. 2001; 227(1 - 2): p. 265 - 278.
3. Scott G.McKinley, Robert J.Angelici. Deep desulfurization by selective adsorption of dibenzothiophenes on Ag+/SBA-15 and Ag+/SiO2. Chemical Communications. 2003; 20: p. 2620 - 2621.
4. Chunshan Song. An overview of new approaches to deep desulfurization for ultra-clean gasoline, diesel fuel and jet fuel. Catalysis Today. 2003; 86(1 - 4): p. 211 - 263.
5. S.Velu, S.Watanabe, X.Ma, C.Song. Development of selective adsorbents for removing sulfur from gasoline for fuel cell applications. American Chemical Society. 2003; 48(2): p. 56 - 57.
6. Ralph T.Yang, Arturo J.Hernández-Maldonado, Frances H.Yang. Desulfurization of transportation fuels with zeolites under ambient conditions. Science. 2003; 301 (5629): p. 79 - 81.
7. Nguyễn Anh Dũng, Cao Thu Hằng. Nghiên cứu loại lưu huỳnh trong xăng bằng phương pháp hấp phụ sử dụng zeolit X. Tạp chí Dầu khí. 2012; 11: trang 38 - 43.
8. J.Chansa. Removal of sulfur compounds from transportation fuels by adsorption. The Petroleum and Petrochemical College, Chulalongkorn University, Bangkok, Thailand. 2004.
9. S.Pringprayong. Adsorptive removal of sulfur compounds from transportation fuels using zeolitic adsorbents. The Petroleum and Petrochemical College, Chulalongkorn University, Bangkok, Thailand. 2006.
00.5
11.5
22.5
33.5
44.5
5
1% 2% 3% 6% 9% 12% 15%
Sele
ctiv
ity
%wt Benzene
NiX(3MT/Benzene)NaX(3MT/Benzene)NiX(BT/Benzene)NaX(BT/Benzene)
0
0.2
0.4
0.6
0.8
1
1.2
1.4
1.6
0% 1% 2% 3% 6% 9% 12% 15%
(BT+
3MT)
ads
orbe
d (m
mol
/g so
rben
)t
%wt Benzene
BT+3-MT/NiX
BT+3-MT/NaX
Fig.3. Adsorption selectivity of adsorbents at diff erent benzene concentrations
Fig.4. Eff ect of Benzene adsorption on BT+3MT adsorption on NiX (7.48%wt Ni)
57PETROVIETNAM - JOURNAL VOL 6/2014
PETROVIETNAM
1. Introduction
During the last couple of years, Corporate Social Responsibility (CSR) has become the “new catching phrase” in the business world not only in developed countries but also in developing countries. Its initiatives have been materialised and due to the broad, dialectical concept, there are various defi nitions of CSR depending on diff erent institutions, organisations and companies but all include numerous of social, environmental and ethical issues:
- “The continuing commitment of business to behave ethically and contribute to economic development while improving the quality of life of the workforce and their families as well as of the local community and society at large” (World Business Council for Sustainable Development).
- “A concept whereby companies integrate social and environmental concerns in their business operations and in their interaction with their stakeholders on a voluntary basis” (The European Commission).
- “Operating a business in a manner that meets or exceeds the ethical, legal, commercial and public expectations that society has of business” (Business for Social Responsibility).
In Vietnam, the government is recently taking up CSR-relevant issues as a public policy area. This research aims to explore how the CSR concept is applied in the
context of Vietnam through the cases of Petrovietnam and Vinatex. Petrovietnam and Vinatex are selected among other national groups because of three criteria: (i) their importance to the national economy; (ii) their utilisation of a wide range of natural resources and social capitals; (iii) scope of activities covering globally (in order to defi ne international impacts on business philosophy related to CSR). The main objectives of the research are to: (i) document their views and perception of CSR; (ii) address the similarities and divergences between CSR principles and approaches; and (iii) examine to what extend social programmes are perceived in the corporate CSR philosophy.
2. Theoretical framework
This section is intended to give concepts and basic assumptions to the important questions as well as suggest the way to make sense of data, and help to connect a single study to the immense base of knowledge [6]. Social contract theory, social justice theory, rights theory, deontological theory and the theory of the triple bottom line are the framework that this research is situated in.
The social contract theory is that a society contains a series of explicit and implicit contracts between individuals, organisations, and institutions. These contracts are evolved so that exchanges could be made between parties in an environment of trust and harmony. According to this, corporations enter into these contracts
CORPORATE SOCIAL RESPONSIBILITY - COMPARATIVE ANALYSIS FROM PETROVIETNAM AND VINATEXTu Vi SaVietnam Oil and Gas Group
Corporate social responsibility (CSR) is one of the key concepts in the study of mutual relations between business and society. Demand for responsible business behaviour has expanded all over the world in the 21st century. Vietnam as a developing country also has typical motivations and initiatives for CSR. This research aims to explore the CSR perception and practices of Vietnamese companies through the cases of two national groups: the Vietnam National Oil and Gas Group (Petrovietnam) and the Vietnam National Textile and Garment Group (Vinatex), highlighting various concepts and themes such as business ethics, social responsiveness and public policy in order to provide authentic insights into the business philosophy in the country.
Key words: Corporate social responsibility, Petrovietnam, Vinatex, Altruistic CSR, Strategic CSR.
Summary

58 PETROVIETNAM - JOURNAL VOL 6/2014
PETROLEUM ECONOMICS & MANAGEMENT
with other members of the society, and receive resources, goods, and societal approval to operate in exchange for good behaviour.
The social justice theory focuses on fairness and distributive justice. The theory argues that a fair society is one in which the needs of all its members are considered, not just those with power and wealth. As a result, corporate managers need to consider how these goods can be most appropriately distributed in the society.
The rights theory means that while the shareholders of a corporation have certain property rights, this does not give them a license to override the basic human rights of employees, local community members, and other stakeholders.
The deontological theory deals with the belief that everyone, including corporate managers, has a moral duty to treat everyone else with respect, including considering their needs.
The Theory of the Triple Bottom Line states that it is necessary for a company to take into account not only fi nancial outcomes but also environmental and social performance starting from the base (bottom)
and three objectives (triple-line) that are social justice, environmental quality and economic prosperity.
The below fi gure provides a further view on the fact while corporations have always been the “engines” for economic development; they also need to be more pro-active in balancing this drive with social benefi ts.
A multiple corporate social responsibility is conceptualised with a pyramid construct in which the total social responsibilities of business embody the economic, legal, ethical and discretionary categories, with an early emphasis on the economic, legal, ethical aspects as the mandatory responsibilities and later a concern for discretionary factors as in Fig.2 [3].
Economic responsibility entails profi tability for shareholders, good jobs for employees and quality products for customers. Legal responsibility refers to compliance with laws and playing by “the rules of the game”. Ethical responsibility involves doing what is right, fair and avoiding harm or mandatory fulfi lment of a fi rm’s economic, legal, and ethical responsibilities. Discretionary responsibility in a voluntary basis consists of (i) Altruistic responsibility-fulfi lment of an organisation’s philanthropic
responsibilities, irrespective of whether the business will reap fi nancial benefi ts or not; (ii) Strategic responsibility-fulfi lment of philanthropic responsibilities simultaneously benefi ting the bottom line.
The above section reviews the CSR initiatives through important theories in order to see the path for the concept to emerge and how it has been refl ected in the literature. The latter will discuss the major trends and tries to explore the driving forces beyond CSR practices during the management phase in the two cases.
3. Comparative analysis
Petrovietnam is the leading national group in Vietnam, making an average annual growth of 18 - 20% with a total turnover equal to 20% of the entire country’s GDP and contributing approximately 25 - 30% of the State Budget revenues. Petrovietnam is now focusing on fi ve key areas of operation: oil and gas exploration and production; refi nery/petrochemicals; gas industry; power generation and high-quality petroleum
Discretionary Responsibility
Strategic Altruistic
Ethical Responsibility
Legal Responsibility
Economic Responsibility
VoluntaryCorporate SocialResponsibility
MandatoryCorporate lResponsibility
Pure Philanthropy
Socialbenefit
Combined Social andEconomic Benefit
Economic BenefitPure Business
Fig.2. The social responsibilities categories [3]
Fig.1. A convergence of interests between business and society [3]

59PETROVIETNAM - JOURNAL VOL 6/2014
PETROVIETNAM
technical services. It is in cooperation with various international petroleum companies in the implementation of 60 petroleum contracts in Vietnam and 17 contracts in 14 countries.
Energy for national development is set as the mission of Petrovietnam and the group identifi es its business philosophy respectively to key stakeholders (as in Table 1). This illustrates a crucial point in the company’s business due to its strong eff ects to the decision making process, the management policies taken and the consequential actions undertaken. It also infl uences the choices of business partners that might work in compliance with Petrovietnam’s policy.
Awareness of CSR is being promoted among managers and employees, and underlined to the public as well as the community. Petrovietnam always considers this not only as the political task of the leading national group but also the unique traditional culture of Petrovietnam. A set of policies related to CSR has been systematically established and concretely integrated in the business action plans via (i) co-operation programmes with provinces, cities, ministries and government agencies, (ii) internal legal documents, annual reports, and CSR reports; and (iii) the yearly approved budget (with hundreds of billions VND). Together with eff ective production and business operations, Petrovietnam has contributed 1752.3 billion VND to the social security programmes in 2011 - 2013 period.
Vinatex was established in 1995 as a complex owned by companies including the Vietnam Textile and Garment Group (the mother company), the centres for research
and training and nearly 120 sub-companies. These sub-companies are joint stock companies doing business in diff erent fi elds, e.g. producing textile and garments and providing commercial services. They also have their distribution systems including wholesaler and retailers. Vinatex has had a commercial relationship with more than 400 corporations and companies from 65 countries and territorial regions. Its export value has accounted for over 20% of the total export turnover of the Vietnamese textile and garment industry. The average growth rate is 10% per year, its export value is more than one billion USD in 2011 and the income is approximately 1.8 billion USD [15].
In recent years, Vinatex has been seeking for feasible solutions in order to enhance business effi ciency. Among these, integrating CSR into its development strategy is considered as the competitive factor to call for overseas importers because this concept is gaining acceptance among trading partners and investors, adhering to international agreements and the global society. It could be a positive business case for companies in developing countries in the global supply chain.
The following table presents a variety of CSR performance indicators and classifi es current CSR programmes in the groups.
4. Discussion
The similarity between the CSR practices of Petrovietnam and Vinatex is their major contribution to the society and economic development is widely recognised. Petrovietnam, for instance, has expanded an integrated gas sector with focus given to the development of the national gas industry infrastructure, especially in the North and the Centre of the country. In the case of Vinatex, setting up new spinning, weaving and knitting, fi bre and synthetic factories means creating more jobs and promoting regional production, trade and commerce. Over the years in Vietnam there has been a stable trend for the government to provide benefi ts and well-fare for the people and the community. Getting involved in the social activities might turn companies into political as well as economic agents [4]. In fact, the two groups have fully implemented mandatory CSR (ethical,
Society Take the lead in social welfare and social programmes
Customers and partners Share profits and responsibilities Employees Take care of material and spiritual life of employees Safety and environment Safety for the human beings and property, environmental protection and sustainable development
Table 1. Petrovietnam business philosophy [14]
0100200300400500600700800
2006 2007 2008 2009 2010 2011 2012
Fig.3. Revenues of Petrovietnam 2006 - 2012 [7] Unit: thousand billion VND

60 PETROVIETNAM - JOURNAL VOL 6/2014
PETROLEUM ECONOMICS & MANAGEMENT
legal, and economic responsibilities) and voluntary CSR through specifi c altruistic and strategic themes as their response to a diversity of internal and external pressures from stake holders in the long-term and/or short-term.
On the other hand, diff erent approaches are observed through the spectrum of policies, strategies, missions and core values of these two groups.
The elements of the Social justice theory expressing a company’s responsibilities to behave ethically on a fairness and distributive basis to protect the environment, improve the quality of life of the employees, the local community and the society are connected with the mission of Petrovietnam. The basics of Petrovietnam’s CSR principles are to ensure unity, sharing and mutually assisting community. As a result, it helps to enhance agreements and equality towards a harmonious and civilised society.
Whereas Vinatex has demonstrated susceptibility to market-based CSR pressure that closely links to the Theory of the Triple Bottom Line. Joining the global market
does not only bring opportunities (better trade facilities, reduction of tariff s and barriers) but also challenges when international standards are introduced. As a result, companies have to conform to global norms with respect to environment and labour standards. Vinatex with an eff ort to enhance competitiveness (through CSR programmes) and promote export- oriented business has received orders from top apparel and textile importers (from US, Japan, and EU) and they are estimated to grow approximately 20% year by year. These foreign investors tend to be concerned about the fundamentals (macro-economic performance, governance, and political risks) plus their reputation in markets where high standards are seen as desirable [8]. This is the context in which market driven cycle for CSR is demonstrating how standards can be raised for sound business reasons.
5. Conclusions
In many ways, CSR can be considered as a debate. From the classical economics point of view, the whole economy/society is the place where individuals “freely
Company Example of social programmes Altruistic vs. Strategic CSR
Petrovietnam
Contribute to government’s charitable funds and programmes launched by the Central Committee of Vietnam Fatherland Front, Vietnam Veterans Association, etc.
Altruistic: charitable and in-kind donation themes.
Partnership to build schools and accommodation for local teachers in the uplands; provide undergraduate/postgraduate scholarships for poor students, excellent students of universities.
Altruistic: educational and learning theme.
Conduct programmes on clean energy, conversion of salt water into fresh water for island people.
Strategic: Renewable energy/environmental theme.
Provide financial supports to local communities. Strategic: Supporting the Anti-Poverty Programmes.
Build houses of Great Unity, build hospitals, health care centres and medical facilities for local people.
Altruistic: community development theme (Improving access to basic human needs).
Create jobs for off-springs of former veterans, wounded soldiers, families of national revolutionary martyrs, etc. Establish "Petrovietnam Mutual Assistance Fund" to assist the staff (including retired officers) who face with difficulties, sickness and diseases, etc.
Altruistic: Gratitude theme, corporate culture.
Vinatex
Implement buyer code, international certifications such as SA 8000; ISO 14000, etc.
Strategic: create the trust of customers, partners/competition theme.
Support the poor in mountainous areas, borders and islands, and disadvantaged families across the country.
Altruistic: charitable and in-kind donation themes.
Organise family festivals for employees. Altruistic: corporate culture to create the loyalty/faith of employees.
Human blood donor, Helmets for kids, etc. Altruistic: community’s health, safety theme.
Provide Vinatex’s products to people in remote/upland areas, launch the “Vietnamese people use Vietnamese goods” campaign.
Strategic: promote potential/target markets, boost domestic consumption.
Table 2. CSR programmes and corresponding classifi cation

61PETROVIETNAM - JOURNAL VOL 6/2014
PETROVIETNAM
pursue their private goals” [1]. The main function of business is to maximise profi ts and that corporation is not “the right person to solve social problems… such problems should be left to government. Moreover, “violent cities, deteriorating schools, pollution, poverty and other problems are the ingredients of economic stagnation, not corporate welfare” [4]. Another argument is that CSR is “a public relation ploy designed to divert attention away from the destructive social consequences of corporate activities” or it is “driven by certain groups in the West and not the (supposed) intended benefi ciaries in the global South” [5] and the conceptualisation might not be relevant to developing countries context.
However, from the liberal perspective, corporations are “social enterprises” to provide goods and services, as well as to secure livelihoods. They are expected to have responsibilities to the society, community development and environmental protection. Besides, corporations are having ever greater impacts on the society as their technological and economic capacities grow. They are not responsible for solving all social problems but for the problems and social issues induced by their activities.
It can be seen in the cases of Petrovietnam and Vinatex that embarking on social responsibility for corporate development strategy implies a new way of doing business to accommodate expectations of the business sector in Vietnam.
References
1. Alex Callinicos. Imperialism and global political economy. Polity Press, Malden MA 02148, USA. 2009.
2. Donna J.Wood. Corporate social performance revisited. The Academy of Management Review. 1991; 16(4): p. 691 - 718.
3. Dima Jamali. The case for strategic corporate social responsibility in developing countries. Business and Society Review. 2007; 112(1): p. 1 - 27.
4. Jonathan M.Harris, Timothy A.Wise, Kevin P.Gallagher, Neva R.Goodwin. A survey of sustainable
development: Social and economic dimensions. Frontier issues in Economic Thought, Neva R.Goodwin, Series Editor, Island Press, Washington, USA. 2001.
5. Jem Bendell, Kate Kearins. The political bottom line: the emerging dimension to corporate responsibility for sustainable development. Business Strategy and the Environment. 2005; 14(6): p. 372 - 383.
6. Britha Mikkelsen. Methods for development work and research - A new guide for practitioners (second edition). Sage Publications, London, UK. 2005.
7. Nguyen Xuan Thang. Overview of Vietnam Oil and Gas Group. Internal Training Course “Introduction on petroleum industry”. 22 - 24 April, 2013.
8. Nigel Twose, Ziba Cranmer. Responsibility breeds success. World Bank Publication. 2002.
9. Raynard Peter, Maya Forstater. Corporate social responsibilities: Implications for small and medium enterprises in developing countries. United Nations Industrial Development Organization - UNIDO, Vienna, Austria. 2002.
10. Petrovietnam Annual Reports 2013. 2013.
11. Vietnam Petroleum Institute. The speed-up corporate strategy for Petrovietnam to 2015 vision to 2025. 2010.
12. United Nations Industrial Development Organization. UNIDO’S Corporate Social Responsibility (CSR) Programme. www.unido.org.
13. http://www.usig.org
14. http://www.pvn.vn
15. http://www.vinatex.com.vn
16. http://www.vietrade.gov.vn/en/

62 PETROVIETNAM - JOURNAL VOL 6/2014
PETROLEUM SAFETY & ENVIRONMENT
1. Introduction
Common technologies for heavy metal removal are membrane separation, ion exchange, electro-deposition, and chemical precipitation. These methods prove to be costly and inept, especially in removing trace amounts of heavy metals [2]. Another disadvantage is the production of sludge or mud, which requires proper disposal and confi nement [3]. On the other hand, adsorption eff ectively removes contaminants in wastewater with high solute loadings and even at dilute concentrations (< 100mg/L). Use of natural adsorbents like peat, banana pith, rice hull and chitosan proves to be economical and eff ective in removing a variety of contaminants [2, 4].
Chitosan contains reactive hydroxyl (-OH) groups and amino (-NH2) groups that have the potential to bind heavy metals. Pure chitosan tends to agglomerate and form a gel in aqueous media, rendering most of the hydroxyl and amino groups inaccessible for metal binding. Coating chitosan as a thin layer onto an immobilisation support increases the accessibility of its binding sites, and improves the mechanical stability [5, 6]. Montmorillonite has a net negative surface charge and has little or no affi nity to anionic, in there, chitosan, a natural biopolymeric cation, is an excellent candidate to modify montmorillonite for the adsorption. Recent research works have shown
that chitosan/montmorillonite composites represent an innovative and promising class of sorbent materials. Gecol et al. investigated the removal of tungsten species from water using chitosan coated montmorillonite biosorbent [7, 8]. Chang and Juang studied the adsorption of tannic acid, humic acid, and dyes from water using the composite of chitosan and activated clay [9]. However, studies about the removal of heavy metal ions by chitosan/montmorillonite nanocomposites as an adsorbent are very scarce. Therefore, in this study chitosan/montmorillonite (CTS/MMT) nanocomposite was synthesised, characterised, and the adsorption kinetics and isotherms for Cu2+, Cd2+ from water solution onto nanocomposite with chitosan and montmorillonite.
2. Materials and method
2.1. Materials
Chitosan of medium molecular weight (average molecular weight MvZ 92,700g mol-1), used in this work was bought from Aldrich Chemicals. This chitosan was obtained by deacetylation of chitin from crab shells and it had a degree of deacetylation of 80%. Glacial acetic acid (HAC) obtained from Sigma-Aldrich® Co. LLC. was used as the solvent for chitosan. The montmorillonite, with a cationic exchange capacity (CEC) of 92.7mequiv/100g,
USING NANOCOMPOSITES OF CHITOSAN AND MONTMORILLONITE FOR ADSORPTION OF HEAVY METAL IONS FROM WASTEWATERPham Xuan NuiHanoi University of Mining and Geology
In this study, chitosan/montmorillonite nanocomposites were synthesised from chitosan and montmorillonite by dispersion of montmorillonite into chitosan solution which was prepared by dissolving the chitosan in an aqueous acetic acid solution. The resulting nanocomposites were characterised by XRD (X-ray diff raction), FTIR (Fourier transform infrared) and SEM (scanning electron microscopy) measurements. Batch equilibrium experiments of Cu (II) (Cu2+) and Cd (II) (Cd2+) ions adsorption were carried out on chitosan/montmorillonite nanocomposites. Models of adsorption isotherms were applied to describe the adsorption isotherms of heavy metal ions by nanocomposite. The relationship between adsorbing capacity (qe) and equilibrium mass concentration (Ce) is in accordance with the isothermal adsorption equation of Langmuir. Two kinetic models, including pseudo-fi rst-order and pseudo-second-order, were used to analyse the heavy metal ions adsorption process. The pseudo-second-order chemical reaction kinetics provide the best correlation of the experimental data, therefore the adsorption dynamic follows the laws of pseudo-second-order kinetics.
Key words: Chitosan/montmorillonite nanocomposites, copper, cadmium, kinetic, adsorption isotherm.
Summary

63PETROVIETNAM - JOURNAL VOL 6/2014
PETROVIETNAM
was supplied by Sigma-Aldrich®Co. LLC .Analytical grade of Cu(NO3)2.2.5H2O, Cd(NO3)2 were procured from China.
2.2. Film preparation
Formation of chitosan/montmorillonite nanocomposites: chitosan solution was prepared by dissolving chitosan in a 2% (v/v) aqueous acetic acid solution at a concentration of 2wt% followed by centrifuging to remove the insoluble material. Montmorillonite was fi rst swelled by 50ml distilled water and then added to 50ml chitosan solution with montmorillonite contents of 1 wt% followed by stirring at 60oC for 6 hours. After that, chitosan/montmorillonite solutions were cast on a plastic dish at 60oC for 24 hours. They were termed chitosan/montmorillonite - 1% (1 is concentration of montmorillonite).
2.3. Characterisation of the composite fi lm
IR spectra of the samples were characterised using a FTIR Spectrophotometer (IMPAC-410) in KBr pellets in the range of 4,000 - 400cm-1. XRD analyses of the powered samples were performed using an X-ray diff ractometer with Cu anode (D8-Advance, Bruker), running at 40kV and 40mA, scanning from 0.5o to 5o at 3o/min. The scanning electron microscope (SEM) were measured using a Hitachi S-4800.
2.4. Adsorption kinetic studies
Single metal solutions of Cu2+, Cd2+ were prepared with concentrations of 100mg/L and with pH 5 - 6. The three-necked fl ask is fi lled with 0.3g nanocomposite of chitosan/montmorillonite and 30mL of metal solution. The metal solution was agitated using thermostated shaker with a shaking of 200rpm and the pre-determined contact times ranged from 1 min. up to 90 min. The fi ltrate was analysed using atomic absorption spectroscopy (AAS)
method to determine Cu2+, Cd2+.The adsorption capacity was calculated:
Where:
Co is the initial metal concentration (mg/L);
Ce is the fi nal or equilibrium concentration (mg/L);
V is the volume of the metal solution (mL);
W is the weight of chitosan/montmorillonite (g).
2.5. Adsorption isotherm studies
Single metal solutions of Cu2+, Cd2+ with concentrations of 10 - 120mg/L, were utilised for isotherm studies. The experiments were performed using 0.3g of chitosan/montmorillonite in 30mL of the metal solution in the three-necked fl ask. Solutions with an initial pH 6 were agitated using a shaking of 200rpm for 90 min. at room temperature.
3. Results and discussion
3.1. IR analysis of nanocomposites
Fig.2 shows the IR spectra that were obtained for montmorillonite, chitosan, and the biopolymer clay nanocomposite prepared from 1% montmorillonite and chitosan, in the 4,000 - 450cm-1 wavenumber range. The band at 3,446cm-1, 1,638cm-1, 1,042cm-1, 791cm-1, 466cm-1corresponding to the vibration bands of the silicate and the vibration band (Al-O) at 921cm-1 remain unaff ected in the nanocomposite. The other bands of the nanocomposite at 2,923cm-1, 1,324cm-1 are consistent with those observed in the fi lm of pure chitosan, while the vibration bands at 3,443cm-1, 1,575cm-1, 1,042cm-1 in the starting chitosan is overlapped with the bands of the silicate. The vibration band at 1,560cm-1 corresponding to
Agitate Chitosan Solution
CH 3COOH - chitosan Solution 1
Acetic acid 2%
Mixing 1 Montm
Chitosan /montmorillonite mixing
1. Water
2. Solution 1
Agitated at 60 oC
6 hours
60 oC, 24 hours
Cast on a IR, SEM
XRD Nanocomposite
Fig.1. Procedure of synthesis material from chitosan and montmorillonite
qe =
(Co - Ce)V
W

64 PETROVIETNAM - JOURNAL VOL 6/2014
PETROLEUM SAFETY & ENVIRONMENT
the deformation vibration of the protonated amine group in the chitosan fi lm is shifted toward stronger frequency values 1,575cm-1 in the nanocomposite, indicating the electrostatic interaction between such groups and the negatively charged sites in the clay structure. Beside, the bands attributed to the intercalated chitosan (C-H stretching on methyl (2,931cm-1) and methylene (2,878cm-1) groups) are observed in the spectra of the nanocomposite [10].
3.2. X-ray diff raction analysis of nanocomposites
The nanocomposite was analysed by XRD and the power patterns of montmorillonite are presented in Fig.3. A typical diff raction peak of montmorillonite is 6.94o, responding to a basal spacing of 14.87Ao. After intercalation with chitosan, this peak disappears. The movement of the typical diff raction peak of montmorillonite to lower angle (3o) indicates the formation of the fl occulated-intercalated nanostructure. It is reported that the formation of fl occulated structure in chitosan/montmorillonite nanocomposites is due to the hydroxylated edge-edge interaction of the silicate layers [11]. The intensity of the peak decreases and even disappears, indicating the formation of an intercalated-exfoliated structure in chitosan/montmorillonite nanocomposites. According to the results of XRD and FTIR, it can be concluded that almost all chitosan were intercalated into the montmorillonite interlayer and destroyed the crystalline structure of montmorillonite.3446
1638
531913
3450
1560
2923
2855
3443
2931;2878
1575
921
530
Lin
(C
ps)
0
100
200
300
400
500
600
700
1 10 20 30 40
d=3.9
12
d=2.9
88
d=2.4
44
d=4.4
09
d=31.3
95
d=34.9
26
d=7.7
10
d=3.5
17
d=2.5
15
(b) 2-Theta ( o)
Lin
(Cps
)
0
100
200
300
400
500
1 10 20 30 40
d=4.
466
d=3.
034
d=2.
566
d=7.
143
d=14
.872
(a) 2-Theta ( o )
(a)
(b)
(c)Fig.2. IR spectra of montmorillonite (a), chitosan (b), the nanocomposite chitosan/montmorillonite 1% (c)
Fig.3. XRD power patterns of the montmorillonite (a), the nanocomposite chitosan/montmorillonite 1% (b)

65PETROVIETNAM - JOURNAL VOL 6/2014
PETROVIETNAM
3.3. Scanning electron microscope (SEM) of materials
In the SEM image (Fig.4c) stacked fl akes (stacks of multilayers of montmorillonite) and fl occulated fraction of montmorillonite were observed. The nanocomposite clearly shows intercalated morphology with strong fl occulation. Some stacks of montmorillonite multilayers appears. This result is consistent with the conclusion of XRD. The formation of a fl occulated structure in the
nanocomposite is due to the hydroxylated edge-edge interaction of the silicate layers because of the hydrogen-bonding interaction between the silicate hydroxylated edge groups and the amino or hydroxyl functional groups in chitosan chains.
3.4. Adsorption isotherms
Tables 1 and 2 show the adsorption capacity of the nanocomposite at diff erent heavy metal ions concentrations and 25oC for samples. The adsorption capacity of the nanocomposite increases corresponding to level the metal ions concentration.
It can be seen from tables 1 and 2 that the sharp increase in adsorption capacity from 75 to 120mg/L and 50 to 100mg/L for Cu2+ and Cd2+, respectively. However, only a slight increase in the adsorption capacity of the nanocomposite can be observed with further increase of the initial concentration of metal ions.
The adsorption process can be generally expressed by two isotherm equations, namely, the Langmuir and the Freundlich equations [12], which are represented by the following equations, respectively:
Where qm (mg/g) and b (L/mg) are Langmuir isotherm coeffi cients. The value of qm represents the maximum adsorption capacity. Kf (mg/g) and n are Freundlich constants. The linear plot of Ce/qe versus Ce is drawn for the Langmuir model of the adsorption of Cu2+ (Fig.5), and Cd2+ (Fig.6).
(a)
(b)
(c)
Fig.4. SEM image of chitosan (a); SEM image of montmorillonite (b); SEM image of chitosan/montmorillonite 1% nanocomposite (c)
Co (mg/l) 10 50 75 100 120 150 Ce (mg/l) 0.54 5.68 16.36 36.31 53.45 53.55 qe (mg/g) 3.15 14.77 19.55 21.23 22.18 22.05 Ce/qe 0.17 0.38 0.84 1.71 2.41 2.42
Co (mg/l) 10 50 75 100 120 Ce (mg/l) 0.10 0.84 2.44 6.66 16.44 qe (mg/g) 3.30 16.38 24.19 31.11 34.52 Ce/qe 0.03 0.051 0.10 0.214 0.476
Table 1. Adsorption of Cu2+ ion at diff erent concentration. Adsorption experiments-sample dose 0.3g/100mL; pH 6;
temperature 25oC; equilibrium time 120min.
Table 2. Adsorption of Cd2+ ion at diff erent concentration. Adsorption experiments-sample dose 0.3g/100mL; pH 6;
temperature 25oC; equilibrium time 120 min.
Ceqe
=1
bqm+
Ceqm
qe = KfCe1/n

66 PETROVIETNAM - JOURNAL VOL 6/2014
PETROLEUM SAFETY & ENVIRONMENT
The applicability of Langmuir isotherm suggests the monolayer coverage of the ions on the surface of nanocomposite. The linearisation of the equation and the values of R2 for Cu2+ and Cd2+ are 0.9999; 0.999, respectively. The qm values for the adsorption of Cu2+ and Cd2+ are 23.81 and 35.71 mg/g, respectively. The qm value for the adsorption of Cu2+ by waste banana pith is 20.29 mg/g [13]. So, the chitosan/montmorillonite nanocomposite can be used as an alternative-adsorbing agent in heavy metal ions wastewaters. Figs 7 and 8 show that the values R2 of Freundlich model for Cu2+ and Cd2+ are 0.9148 and 0.907.
Therefore, the adsorption of Cu2+ and Cd2+ on the chitosan/montmorillonite nanocomposite do not follow the Freundlich isotherm.
3.5. Adsorption kinetics
Two simplifi ed kinetic models including pseudo-fi rst-order and pseudo-second-order equations are analysed. A simple kinetic model that describes the process of adsorption is the pseudo-fi rst-order equation. It was suggested by Lagergren [14] for the adsorption of solid/liquid systems and its formula is given as
Where k1 is the pseudo-fi rst-order rate constant (mim-1), qe and qt are the amounts of metal ions adsorbed (mg/g) at equilibrium and at time t (min.). After integration with the initial condition qt = 0 at t = 0, Eq. (1) can be obtained:
y = 0.0426x + 0.1453R² = 0.9999
0
0.5
1
1.5
2
2.5
3
0 20 40 60
Ce
/qe
(g
/L)
Ce
(mg/l)
Fig.5. Langmuir plot for the adsorption of Cu2+ ion by the nanocomposite
Fig.6. Langmuir plot for the adsorption of Cd2+ ion by the nanocomposite
y = 0.4274x + 1.6127R² = 0.9148
0
0.5
1
1.5
2
2.5
3
3.5
-2 0 2 4 6
ln (
qe
)
ln (Ce)
Fig.7. Freundlich plot for the adsorption of Cu2+ ion by the nanocomposite
dqedt = k1(qe - qt) (1)
(2) log (qe - qt) = logqe -k1t
2.303
y = 0.463x + 2.542R² = 0.907
00.5
11.5
22.5
33.5
44.5
-4 -2 0 2 4
ln (
qe
)
ln(Ce)
Fig.8. Freundlich plot for the adsorption of Cd2+ by the nanocomposite

67PETROVIETNAM - JOURNAL VOL 6/2014
PETROVIETNAM
Pseudo-second-order model is based on adsorption equilibrium capacity and it can be expressed as [15]:
When the initial condition is qt = 0 at t = 0, integration leads to Eq. (3)
Where k2 (g/mg.min) is the rate constant of the pseudo-second-order adsorption. The linear plots of log (qe - qt) versus t and (t/qt) versus t are drawn for the pseudo-fi rst-order and the pseudo-second-order models, respectively. The rate constants k1 and k2 can be obtained from the plot of experimental data. Figs.9 and 10 show the pseudo-fi rst-order and pseudo-second-order models for the adsorption of Cu2+ by chitosan/montmorillonite nanocomposite.
Figs.11 and 12 show the pseudo-fi rst-order and pseudo-second-order models for the adsorption of Cd2+ by chitosan/montmorillonite nanocomposite.
As seen from the Figs above, the correlation coeffi cients (R) of the pseudo-fi rst- order model are 0.9714 and 0.9869 for Cu2+ and Cd2+, respectively. For the pseudo-second-order, the correlation coeffi cients (R) are 0.998 and 0.993 for Cu2+ and Cd2+, respectively.
Therefore, the adsorption of Cu2+ and Cd2+ on chitosan/montmorillonite nanocomposite are better described by the pseudo-second-order than by the pseudo-fi rst-order. This result also indicates that the adsorption rate of metal ions depends on the concentration of metal ions at the absorbent surface at equilibrium.
4. Conclusions
The chitosan/montmorillonite nanocomposites were prepared from chitosan and montmorillonite. The results show that the relationship between adsorbing capacity (qe) and equilibrium mass concentration (Ce) is in accordance with the isothermal adsorption equation of Langmuir. Two kinetic models, including the pseudo-fi rst-order and pseudo-second-order, were used to analyse the heavy metal ions adsorption process. The pseudo-second-order chemical reaction kinetics provide the best correlation of the experimental data, therefore the
y = -0.0217x + 2.9266R² = 0.9714
0
0.5
1
1.5
2
2.5
3
3.5
0 50 100
ln (
qe
-q
t)
Time (min.)
y = -0.0091x + 3.4022R² = 0.9869
00.5
11.5
22.5
33.5
4
0 50 100
ln(q
e-q
t)
Time (min.)
(3)
qt=1
k2qe2
1qe
1+
Fig.11. Pseudo-fi rst-order model for the adsorptionof Cd2+ ion by chitosan/montmorillonite nanocomposite
Fig.10. Pseudo-second-order model for the adsorption of Cu2+ ion by chitosan/montmorillonite nanocomposite
Fig.9. Pseudo-fi rst-order model for the adsorption of Cu2+ ion by chitosan/montmorillonite nanocomposite
Fig.12. Pseudo-second-order model for the adsorption of Cd2+ ion by chitosan/montmorillonite nanocomposite
dqedt = k2(qe - qt)2

68 PETROVIETNAM - JOURNAL VOL 6/2014
PETROLEUM SAFETY & ENVIRONMENT
adsorption dynamics follow the laws of pseudo-second-order kinetics. The nanocomposite can thus be eff ectively used as an adsorbent for the removal of heavy metal ions from wastewaters.
References
1. Wei Tan, Yihe Zhang, Yau-shan Szeto, Libing Liao. A novel method to prepare chitosan/montmorillonite nanocomposites in the presence of hydroxy-aluminum oligomeric cations. Composites Science and Technology. 2008; 68. p. 2917 - 2921.
2. Srinivasa R.Popuri, Y.Vijaya, Veera M.Boddu, Krishnaiah Abburi. Adsorptive removal of copper and nickel ions from water using chitosan-coated PVC beads. Bioresource Technology. 2009; 100(1): p. 194 - 199.
3. M.Rhazi, J.Desbrierères, A.Tolaimate, M.Rinaudo, P.Vottero, A.Alagui. Contribution to the study of the complexation of copper by chitosan and oligomers. Carbohydrate Polymers. 2002; 43(4): p. 1267 - 1276.
4. A.Septhum, A.Rattanaphani, J.B.Bremner, V.Rattanaphani. An adsorption study of Al (III) ions onto chitosan. Journal of Hazardous Materials. 2007; 148(1-2): p. 185 - 191.
5. Meng-Wei Wan, Ioana G.Petrisor, Hsuan-Ting.Lai, Daeik Kim, Teh Fu Yen. Copper adsorption through chitosan immobilized on sand to demonstrate the feasibility for in situ decontamination. Carbohydrate Polymers. 2004; 55(3): p. 249 - 254.
6. Meng-Wei Wan, Chi-Chuan.Kan, Buenda D.Rogel, Maria Lourdes P.Dalida. Adsorption of copper (II) and lead (II) ions from aqueous solution on chitosan-coated sand. Carbohydrates Polymers. 2010; 80(3): p. 891 - 899.
7. Hatice Gecol, Erdogan Ergican, Parfait Miakatsindila. Biosorbent for tungsten species removal from
water: eff ects of co-occurring inorganic species. Journal of Colloid and Interface Science. 2005; 292(2): p. 344 - 353.
8. Hatice Gecol, Parfait Miakatsindila, Erdogan Ergican, Sage R.Hiibel. Biopolymer coated clay particles for the adsorption of tungsten from water. Desalination. 2006; 197(1-3): p. 165 - 178.
9. Min-Yun Chang, Ruey-Shin Juang. Adsorption of tannic acid, humic acid, and dyes from water using the composite of chitosan and activated clay. Journal of Colloid and Interface Science. 2004; 278(1): p. 18 - 25.
10. C.Paluszkiewicz, E.Stodolak, M.Hasik, M.Blazewicz. FT-IR study of montmorillonite-chitosan nanocomposite materials. Spectrochimica Acta Part A: Molecular and Biomolecular Spectroscopy. 2011; 79(4): p. 784 - 788.
11. Suprakas Sinha Ray, Kazuaki Okamoto, Masami Okamoto. Structure-property relationship in biodegradable poly (butylene succinate)/layered silicate nanocomposites. Macromolecules. 2003; 36(7): p. 2355 - 2367.
12. K.Periasamy, C.Namasivayam. Removal of Nickel (II) from aqueous solution and nickel plating industry wastewater industry using an agriculture waste: peanut hull. Waste Manage. 1995; 15(1): p. 63 - 68.
13. C.Namasivayam, N.Kanchana. Waste banana pith as adsorbent for colour removal from wastewaters. Chemosphere. 1992; 25 (11): p. 1691 - 1705.
14. S.Lagergren. About the theory of so-called adsorption of soluble substances. Kungliga Svenska Vetenskapsakademiens Handlingar. 1898; 24(4): p. 1 - 39.
15. Y.S.Ho, G.McKay. Pseudo-second order model for sorption processes. Process Biochemistry. 1999; 34(5) p. 451 - 465.

69PETROVIETNAM - JOURNAL VOL 6/2014
PETROVIETNAM
On 16 June 2014, the Petrovietnam Gas Corporation (PV GAS) and Shell signed a
memorandum of understanding (MOU) on development of Son My LNG import terminal project (Binh Thuan province ) and a framework contract to purchase LNG for Thi Vai LNG import terminal project (Ba Ria - Vung Tau). The signing ceremony was witnessed by Prime Minister Nguyen Tan Dung and Dutch Prime Minister Mark Rutte.
The LNG import terminals in Son My and Thi Vai are two signifi cant projects of PV GAS in its strategy to diversify gas supply as well as to make up for gas shortages in the coming years, contributing to ensuring national energy security and national food security. The LNG import terminal project in Thi Vai has a capacity of 1 million tons/year and is scheduled to come into operation in 2017. Son My project, which has a capacity of over 3.6 million tons/year, is expected to start operation between 2019 - 2020. The framework contract for LNG sale and purchase between PV GAS and Shell is also one of the fi rst LNG purchase deal to ensure the supply of LNG to the import terminal project in Thi Vai.
Shell is one of the largest oil companies in the world, with extensive operations from upstream, midstream to downstream. Being a pioneer in the fi eld of LNG with 50 years of experience, Shell currently owns one of the largest
global networks of LNG supply and a similar track record of LNG transportation capacity. Today, Shell is the world’s biggest LNG shipping operator, managing and operating 43 LNG carriers, or about 12% of the world’s fl eet.
In addition, Shell is one of the leading companies in technology as well as in the capacity to manage, operate and develop LNG projects, particularly the fl oating LNG project (FLNG) named Prelude in Australia. Shell is the fi rst company in the world to carry out a FLNG project. FLNG is Shell’s latest achievement in the development of new technology in the oil and gas industry, consolidating its leading position in technology development and improvement to deliver more value.
PV GAS signed a MOU and framework contract with Shell to purchase liquefied natural gas (LNG)
Hong Hanh
Prime Minister Nguyen Tan Dung and Dutch Prime Minister witnessed the signing a MOU between PV GAS and Shell. Photo: PVN
On 22 May 2014, President Truong Tan Sang received a delegation of ExxonMobil Corporation
at the Presidential Palace.
At the meeting, ExxonMobil’s leaders informed the Vietnamese President of the outcomes of joint projects between the US fi rm and the Vietnam Oil and
Gas Group (Petrovietnam), and voiced their hope that the projects will bring about practical benefi ts for both sides. The American fi rm pledged that once co-operation agreements are signed, human resources and other assets will be mobilised to accelerate this year’s collaboration programmes with its Vietnamese partner.
President Truong Tan Sang highly valued US fi rms’ contributions to further increasing two-way trade between the two countries, and highlighted the US side’s support for Vietnam’s participation in the Trans-Pacifi c Partnership (TPP) agreement negotiations. The President affi rmed that Vietnam supports co-operation activities with US businesses in the fi eld of oil and gas. President Truong Tan Sang expressed his hope that investors from the US and other countries will prosper from their investment in Vietnam, and suggested that ExxonMobil and Petrovietnam focus on realising trade deals this year.
Vietnam, US co-operation in the field of oil and gas
Nguyen Hoang
President Truong Tan Sang and ExxonMobil’s leaders. Photo: VNA
PETROVIETNAM NEWS

70 PETROVIETNAM - JOURNAL VOL 6/2014
NEWS
On 20 June 2014, Cuu Long Joint Operating Company (Cuu Long JOC) and PTSC Mechanical
and Construction Limited Company (PTSC M&C) signed an EPCI contract for the Su Tu Vang Southwest project.
The Su Tu Vang Southwest project is the target of fi eld development in off shore Block 15-1, which is invested by Cuu Long JOC. The scope of the project includes engineering, procurement, construction, transportation and installation, hook up and commissioning of the Su Tu Vang Southwest processing platform with a total weight of 2,000 tons. Upon receiving the Letter of Intent from Cuu Long JOC on 12 November 2013 requesting EPCI services for the project, PTSC M&C has expeditiously mobilised all resources to implement the project.
So far, the works of construction and off shore installation of the Su Tu Vang Southwest’s jacket have been completed safely, meeting the quality requirement and schedule. The fabrication of the topside is being
speedily carried out in PTSC M&C’s construction site, and its completion, load-out, transportation, and off shore installation are scheduled for September 2014. PTSC M&C has completed the engineering, procurement, construction, transportation and installation of Su Tu Vang Southwest’s jacket within 106 days, making one of the records for rapid jacket fabrication in Vietnam’s oil and gas industry.
PTSC M&C signs EPCI contract for Su Tu Vang Southwest with Cuu Long JOC
Hong Van
Cuu Long JOC and PTSC M&C signed an EPCI contract. Photo: PTSC
At 17:29 hours on 6 June 2014, Lam Son Joint Operating Company
(Lam Son JOC) formally opened the TL-8P well from Thang Long fi eld (of Blocks 01 and 02/97, Cuu Long basin) with a fl ow rate of approximately 2,000 barrels of oil per day. The next wells (TL-1P, 4P, 3P, 7P, and 5P) were, in turn, put into operation in the evening and at night on the same day, bringing Thang Long fi eld’s total production rate to about 8,000 barrels of oil per day.
Lam Son JOC is the investor and operator of Thang Long and Dong Do fi elds. The fi eld development plan for Thang Long and Dong Do includes 2 wellhead platforms (WHP), and a fl oating production, storage
and offl oading unit (FPSO). The launch of Thang Long and Dong Do’s production is very important as they contribute to ensuring the national energy security and the completion of PVEP/Petrovietnam’s oil and gas production plan for 2014.
Thang Long and Dong Do wellhead platforms, which are suitable for small fi elds, were safely fabricated within 18 months, within the approved budget and using nearly 100% local services. For FPSO PTSC Lam Son, exactly 24 months after PTSC took over from the withdrawing foreign contractor and signed an EPCI contract with Lam Son JOC, the FPSO was ready to receive the fi rst oil fl ow. The success in putting Thang Long fi eld into operation has opened a new direction, an optimal strategy for the development of small fi elds in the future. The use of local contractors has brought cost-effi ciency to the investor, and through this project local contractors have been able to show their capacity to master technology, manage and implement projects, no longer being dependent on foreign contractors.
First oil from Thang Long fieldOn 18 May 2014, DM-
4XP well in the Diamond fi eld (Block 01 & 02, off shore Viet-nam) produced the fi rst oil with a fl ow rate of 3,700 bar-rels per day. After DM-4XP well, the next three wells (DM-1P, 2P, 3P) will soon be put into opera-tion, expectedly bringing the total fl ow rate of the entire Di-amond fi eld to approximately 9,000 barrels of oil per day.
Petronas Carigali Vietnam Limited (PCVL) is the investor and operator of the Diamond fi eld. The Petrovietnam Explo-ration Production Corpora-tion (PVEP) has worked closely with the contractors to com-plete all the work items of the project in time and with good quality after only 16 months of execution. In particular, the discovery of MI-65 has allowed higher catches and brought the total estimated recover-able reserves to increase by 22 - 28% compared to the original forecast. Binh Minh
First commercial oil flow from Diamond field
Thang Long fi eld fi rst oil fl ow arrived at FPSO PTSC Lam Son. Photo: PVEP
Vu Dinh

71PETROVIETNAM - JOURNAL VOL 6/2014
PETROVIETNAM
At the 5th National Conference on Environmental Monitoring on 19 June 2014, the Vietnam
Environment Administration (Ministry of Natural Resources and Environment) awarded certifi cates of eligibility for environmental monitoring services to 3 Vietnamese units. In particular, the Vietnam Petroleum Institute’s Branch - the Research and Development Centre for Petroleum Safety and Environment (VPI-CPSE) is the fi rst unit to be awarded the certifi cate, with serial no.
VIMCERTS 001, in accordance with the Minister of Natural Resources and Environment’s Decision No.1154/QD-BTNMT dated 18 June 2014. Earlier, VPI-CPSE has been inspected by the Vietnam Environment Administration and appraised by the Ministry of Natural Resources and Environment’s Appraisal Council in compliance with the procedures stipulated in Decree No. 27/2013/ND-CP and Circular No. 42/2013/TT-BTNMT.
Speaking at the conference, Dr. Hoang Nguyen, Deputy Director in charge of VPI-CPSE, said the award of certifi cates was in line with the policy of the Ministry of Natural Resources and Environment’s leaders and will facilitate healthy competition among the environmental monitoring units. The quality of fi eld monitoring and sample analysis in the labs will be tightly controlled to ensure that the real quality of the environment at the monitored area is refl ected.
This certifi cate contributes to affi rming VPI-CPSE’s position and capacity in the fi eld of environmental monitoring, especially sample taking for environmental monitoring at onshore and off shore constructions in the oil and gas industry.
VPI-CPSE awarded a certificate of eligibility for environmental monitoring services
During a state visit to Vietnam, on 19 May 2014, Azerbaijan’s President Ilham Aliyev had talks with President Truong Tan Sang and met the Party’s General Secretary Nguyen Phu Trong, Prime Minister Nguyen Tan Dung, and National Assembly Chairman Nguyen Sinh Hung. The leaders focused discussion and agreement on measures to promote all aspects of Vietnam - Azerbaijan relations, especially in economic, trade and investment areas. In particular, it was proposed that Azerbaijan create favourable conditions for Petrovietnam’s eff ective and long-term investment and co-operation in Azerbaijan.
On the same day in Hanoi, Dr. Do Van Hau, President and CEO of
Petrovietnam received the leaders of the State Oil Company of the Azerbaijan Republic (SOCAR). On behalf of the State and the Government of Vietnam, Vice Minister of Industry and Trade Tran Tuan Anh awarded the Friendship Order of the Socialist Republic of Vietnam to Mr. Khoshbakht Yusifzadeh Baghi Oglu, SOCAR’s First Vice President, for his important contribution to the development in the fi eld of oil and gas of the two countries.
Mr. Khoshbakht affi rmed that he would continue to positively contribute to the consolidation and development of the excellent friendship and co-operation between Vietnam and Azerbaijan, particularly in the fi eld of oil and gas.
Vietnam and Azerbaijan beef up energy co-operation
A signing ceremony was recently held in Ho Chi Minh City for Dai Hung drilling rig and calm buoy repair con-tract between Petrovietnam Exploration Production Corporation POC (PVEP POC) and Dung Quat Shipbuilding Industry Company Ltd. (DQS).
Dai Hung drilling rig has a length of 108.2m, width 67.36m, and height 68.60m. This is one of the most impor-tant rig for exploration and production of PVEP-POC. Dai Hung rig is expected to arrive at Dung Quat Shipyard in early October 2014 and the repair will take about 180 days.
Signing ceremony for FPU DH-01 and calm buoy repair contract
Tran Huong
Mr. Bui Cach Tuyen, Deputy Minister of Natural Resources and Environment, awarded the certifi cate to CPSE. Photo: VPI
Thanh Kim
Quoc Thinh

72 PETROVIETNAM - JOURNAL VOL 6/2014
NEWS
Petrovietnam Fertilizer and Chemical Corporation (PVFCCo) announced that its Petrochemical
Manufacturing Facility in Ba Ria - Vung Tau has been offi cially operational since the beginning of 2014. Until now, the Facility has provided more than 5,000 drums of special petrochemical products to customers, earning about 60 billion VND in revenues. At full capacity, the Facility can generate approximately 300 billion VND in annual revenues.
The Facility has a production capacity of 25,000 drums/year, processing and manufacturing specialised chemicals, chemical products for oil and gas production,
and chemicals used in oil refi neries. The Facility was built on the basis of an agreement between PVFCCo and Baker Hughes Petrolite to manufacture specialised chemicals and chemical products used in oil production and refi nery in accordance with Baker Hughes’ manufacturing and quality management process. Previously, these chemicals and chemical products had to be imported 100% from the United States, UK, and other European countries. This is the fi rst specialised chemicals and chemical products facility invested by a member company of the Vietnam National Oil and Gas Group in order to supply specialised chemicals to oil and gas companies operating in Vietnam.
The construction of the Petrochemical Manufacturing Facility started in late 2013 in Dong Xuyen Industrial Park, Rach Dua Ward, Vung Tau City, Ba Ria - Vung Tau Province. The Facility has been equipped with modern machinery and equipment from Japan, Germany, and the United States, complying with strict requirements of Baker Hughes’ manufacturing process for specialised chemicals and chemical products. Besides, the Facility has also been rated by Baker Hughes as meeting its standards on equipment, technology, laboratory, safety devices, fi re control and environment.
PVFCCo’s Petrochemical Manufacturing Facility supplies more than 5,000 drums of products to the market
Dinh Khoi
PVFCCo’s Petrochemical Manufacturing Facility has a production capacity of 25,000 drums/year. Photo: DPM
The Petroleum Equipment Assembly & Metal Structure Joint Stock Company (PVC-MS) signed
two contracts on 6 June 2014 in Hanoi with PV Engineering and Phu Dat - Vinh Da consortium of contractors for supply of materials for Thai Binh 2 Thermal Power Plant.
Accordingly, PV Engineering will supply to PVC-MS steel sheets < 40mm, worth nearly 38 billion VND, and steel sheets ≥ 40mm, worth nearly 34 billion VND. Phu Dat - Vinh Da consortium of contractors will provide shaped steels H < 500mm, worth more than 64.6 billion VND and shaped steel H ≥ 500mm, worth more than 40.3 billion VND. These contracts are a part of the tender package for “supply of materials, fabrication and installation of steel structure” for the turbine hall and the central control building of Thai Binh 2 Thermal Power Plant Project. Apart from this package, PVC-MS is assigned to perform the package of installing the turbine/generator of Unit 2 and other ancillary items.
PVC-MS is working closely with the contractors to accelerate the procurement of materials. It is expected that the company will carry out fabrication works in August 2014, and launch installation works in late October 2014.
PVC-MS accelerates the procurement of materials for Thai Binh 2 Thermal Power Plant
Minh An
PVC-MS signed contract with PV Engineering. Photo: PVC

73PETROVIETNAM - JOURNAL VOL 6/2014
PETROVIETNAM
The fi rst half-year of 2014 is a period of quasi-stable oil demand growth trend in the global markets.
This trend is linked with the US and OECD economic recovery performances. However, oil price fl uctuation in recent days generally depends on the risk of increased tensions in Ukraine and in the Pacifi c region.
The West Texas Intermediate (WTI) for delivery in July was down 21 UScents to 103.37USD a barrel after rallying 86 UScents in New York on 29 May, but at the same time Brent North Sea crude for July gained 4 UScents to 110.01 a barrel in morning trade. According to the US Department of Energy, overall US inventories are rising,
but gasoline supplies are falling in early June and this decline in gasoline supplies is attributed to the summer driving season in America.
In Europe, the oil price rising is due to the uncertainty of the Russia’s gas export linked with the escalating fi ghting between government troops and East - Ukraine separatist partisans. Investors fear the confl ict will disrupt supplies and send energy prices soaring at month’s end.
For 2014, world demand could increase by 1.4 million barrels/day and oil supply outside the OPEC could increase by 1.6 million barrels/day. These estimates suggest that the supply - demand balance in 2014 would be similar to that in 2013 and OPEC could be able to manage the market. The future price of crude oil depends on this future balance.
The state of the world economy directly aff ects the demand for energy and for oil.
Commodity Units Price Change % change Contract
Crude oil WTI USD/barrel 102.71 -0.87 -0.84% July 2014 Brent USD/barrel 109.41 -0.56 -0.51% July 2014 TOCOM crude oil JPY/kL 65,950 -250.00 -0.38% October 2014 Nymex natural gas USD/million Btu 4.54 -0.02 -0.37% July 2014 RBOB gasoline USD/gallon 299.80 +0.15 +0.05% July 2014 Nymex heating oil USD/gallon 288.82 -3.17 -1.09% July 2014 ICE gasoil USD/million tons 893.75 -12.50 -1.38% July 2014 TOCOM kerosene JPY/kL 80,420 -290.00 -0.36% December 2014
14 April 2014 May 2014
June 2014
(estimated) OPEC reference basket 105.44 105.44 108.49 Arab light - Saudi Arabia 105.80 103.50 109.06 Basrah light - Iraq 103.16 101.08 107.03 Bonny light 37o - Nigeria 112.22 107.70 111.78 Es Sider - Libya 109.42 108.70 112.71 Girasol - Angola 110.21 105.06 111.82 Iran heavy - Iran 105.40 104.50 108.04 Kuwait export - Kuwait 104.21 101.05 107.48 Marine - Qatar 105.44 104.08 107.65 Merey - Venezuela 96.06 93.37 98.96 Murban - UAE 108.35 103.52 110.19 Oriente - Ecuador 95.47 93.25 99.13 Saharan blend 44o- Algeria 110.36 106.50 112.89 Minas 34o - Indonesia 107.22 101.52 106.52 Fateh 32o - Dubai 105.55 101.34 107.80 Isthmus 33o - Mexico 102.59 104.05 110.10 Tia Juana light 31o - Venezuela 109.67 112.38 116.00 Brent 38o - UK 107.84 108.00 112.78 Urals - Russia 108.06 107.03 111.77
Table 1. Oil & gas prices in 2014 third quarter contracts
Sources: www.bloomberg.com
Table 2. Oil prices from big global suppliers in second quarter of 2014 (USD/Bbl)
Sources: Oil & Gas Journal 23 June 2014, www.oil-prices.net
GLOBAL MARKETGLOBAL MARKET

74 PETROVIETNAM - JOURNAL VOL 6/2014
OIL & GAS MARKET
Any improvement in economic performance will soon be refl ected as an increase in demand for oil. Conversely, a recession will soon be refl ected as a decrease in demand for oil. Hence, the important factors for the future of the oil market are how quickly the industrialised countries come out of recession and how fast their economies grow. But oil demand of these countries is not expected to grow that much; for some could decline in the coming years. Therefore, the more critical factor would be the economic performance of the developing countries and the rest of the world because the future growth of world oil demand will be in these countries.
Public policy, such as mandatory speed limits, standards and specifi cations for the effi cient use of energy and oil, mandatory substitution of oil by other energies, government subsidies, etc… are also other factors which
signifi cantly infl uence the demand.
Environmental issues in all countries increasingly direct public policy aimed at reducing the consumption of oil, though most of these policies will have a medium to long-term impact.
Oil intensity fell about 50% for industrialised countries between 1979 and 2007. A similar trend is observed for the developing and emerging economies but it is not very clear. The oil intensity of GDP of these countries remained high during their economic development phase but stabilised and has been declining since the 1990s.
Global gas supply outlook
BP’s Energy Outlook 2030 forecasts that global gas supply will reach 459 billion ft3/day (4,7 trillion m3/year) by
Crude oil, 1,000 b/d Gas, bcf
Feb. Jan. Feb. Jan.
Argentina 538 539 91.3 101.6 Bolivia 48 48 63.0 63.0 Brazil 2,150 2,140 63.4 68.4 Canada 3,500 3,484 397.0 395.0 Colombia 1,010 1,020 30.0 30.0 Ecuador 520 530 1.0 1.0 Mexico 2,501 2,506 183.3 200.3 Peru 165 170 34.5 36.7 Trinidad 82 75 123.1 124.2 United States 8,033 8,005 2,004.0 2,215.5 Venezuela 2,420 2,460 60.0 60.0 Other Latin America 89 89 4.0 4.0 Western Hemisphere 21,056 21,066 3,054.6 3,299.7 Austria 17 17 4.0 4.0 Denmark 168 161 11.1 13.8 France 15 15 0.1 0.1 Germany 49 33 28.0 28.0 Italy 106 100 24.0 24.0 Netherlands 25 23 120.0 120.0 Norway 1,621 1633 328.4 349.6 Turkey 45 45 1.5 1.5 United Kingdom 921 845 105.3 115.0 Other Western Europe 9 9 2.3 2.3 Western Europe 2,976 2,881 624.7 658.3
Azerbaijan 987 844 67.1 95.3 Croatia 11 11 4.5 4.5 Hungary 12 12 6.0 6.0 Kazakhstan 1,610 1,642 116.5 130.7 Romania 81 81 20.0 20.0 Russia 10,542 10,506 2,058.8 2,327.2 Other FSU 396 375 490.9 568.6 Other Eastern Europe 51 52 20.9 20.9 Eastern Europe and FSU 13,690 13,523 2,784.7 3,173.2
Algeria 1,100 1,080 230.0 230.0 Angola 1,610 1,650 4.0 4.0 Cameroon 61 61 2.0 2.0 Congo (former Zaire) 28 28 - -
Crude oil, 1,000 b/d Gas, bcf
Feb. Jan. Feb. Jan.
Congo (Brazzaville) 290 290 - - Egypt 680 680 105.0 105.0 Equatorial Guinea 255 255 0.1 0.1 Gabon 260 260 0.3 0.3 Libya 360 500 25.0 25.0 Nigeria 1,980 1,920 70.0 70.0 Sudan 470 470 - - Tunisia 58 58 9.0 9.0 Other Africa 315 315 9.1 9.1 Africa 7,467 7,567 454.5 454.5
Bahrain 49 49 32.0 32.0 Iran 2,850 2,780 465.0 465.0 Iraq 3,600 3,090 28.0 28.0 Kuwait 2,780 2,780 40.0 40.0 Oman 951 959 94.0 94.0 Qatar 700 720 350.0 350.0 Saudi Arabia 9,850 9,760 250.0 250.0 Syria 30 30 14.0 14.0 United Arab Emirates 2,740 2,720 165.0 165.0 Yemen 150 130 - - Other Middle East 1 1 19.7 22.1 Middle East 23,701 23,019 1,457.7 1,460.1
Australia 355 328 140.0 154.9 Brunei 131 119 35.7 36.5 China 4,214 4,152 381.0 402.2 India 779 783 97.4 108.5 Indonesia 800 787 202.0 202.0 Japan 16 13 9.8 10.4 Malaysia 507 500 183.7 203.6 New Zealand 36 40 13.0 13.7 Pakistan 86 87 114.4 127.9 Papua New Guinea 30 30 0.5 0.5 Thailand 233 225 118.9 130.4 Other Pacific 28 28 109.3 111.5 Asia Pacific 7, 875 7,752 1,469.7 1,566.1
Total world 76,435 75,478 9,813.9 10,579.9
OPEC 30,510 29,990 1,688.0 1,688.0
Table 3. Worldwide crude oil and gas production in fi rst 2 months of 2014
Sources: Oil & Gas Journal, 12 May 2014

75PETROVIETNAM - JOURNAL VOL 6/2014
PETROVIETNAM
2030, representing an annual growth rate of 2%, the fastest of any fossil fuel.
BP says shale gas will feature heavily, accounting for 37% of overall gas supply growth over the period. But the greatest increment in conventional gas production in the developing world is a lot bigger than that seen in shale gas. The conventional non-OECD supply will come from the Middle East, set to add 31 billion ft3/day over the period, with developments in Africa - such as the clutch of prospective LNG export projects off East Africa-adding 15 billion ft3/day, BP reckons.
Most of the shale gas growth will be in North America, primarily the US, but with Canada and Mexico also making signifi cant contributions. North America will account for 54 billion ft3/day of the 74 billion ft3/day global shale gas output in 2030. Outside North America, China will be the most successful shale gas developer - going from essentially nothing now to around 6 billion ft3/day in 2030. By contrast, the EU will be producing just 2.4 billion ft3/day. There are some obstacles to signifi cant development in Europe, including environmental and political objections, legal bans in some countries on hydraulic fracturing, and lack of service sector capacity. In North America, BP reckons burgeoning shale gas supplies will tip the region - initially just the US - into becoming a net exporter of gas in the form of LNG by 2017. Overall, Bp expects North American LNG exports to reach 8 billion ft3/day by 2030, equivalent to around 61 million tons/year. This estimate puts BP at the higher end of recent projections for North American LNG export capacity, but is actually just a quarter or roughly 32 billion ft3/day of the total notional capacity that US project developers alone have submitted for government approval. BP sees notional North American LNG export volumes dictated instead both by available gas output and by the consequent narrowing in the spread between cheap domestic gas and international prices, which would render some projects uneconomic.
Australia
Analysts reckon the Australian onshore greenfi eld development would cost about 40 billion USD. Santos says its 7.8 million tons/year Gladstone LNG remains on
track for fi rst production in 2015, while the 6.9 million tons/year ExxonMobil-operated PNG LNG plant in Papua New Guinea, in which it owns 13.5%, starts up in 2014.
Based on projects now in operation and those committed or under construction, Australia’s LNG exports are forecast to increase from about 20 million tons/year now to more than 63 million tons annually by 2016 - 2017, which would make it the world’s biggest LNG exporter after Qatar (Table 3). But the industry is being rocked by delays and budget blowouts that have made Australian schemes the most expensive in the world.
India’s LNG construction
In 2013, Gail India commissioned India’s third LNG import terminal, with a nameplate capacity of 5 million tons/year, at Dabhol in the western state of Maharashtra, Janvier. Three days later, Petronet LNG, the country’s biggest importer of the super-cooled fuel, said it will open the country’s fourth terminal at Kochi, in the south in the second quarter of 2013, adding to its Dahej terminal in Gujarat.
About half a dozen more companies, including France’s GDF and Royal Dutch Shell - which already operates the Hazira terminal in the Western state of Gujarat - are also scrambling to add new terminals, while others like BP and Japan’s Mitsui are considering boosting Indian regasifi cation capacity, which the government last year forecast would expand four-fold to 50 million tons/year by March 2017 from 13.6 million tons at the
Sources: Oil & Gas Journal, 5 May 2014
Project 2014 2015 2016 2017 2018 2019 2020
North West Shell 16.3 16.3 16.3 16.3 16.3 16.3 16.3 Darwin 3.6 3.6 3.6 3.6 3.6 3.6 3.6 Pluto 4.3 4.3 4.3 8.6 12.9 12.9 12.9 Gorgon - 15.6 15.6 20.0 20.0 20.0 20.0 Queensland Curtis LNG 8.5 8.5 8.5 8.5 8.5 8.5 8.5 Australia Pacific LNG - 4.5 9.0 9.0 9.0 9.0 9.0 Fisherman’s Landing - 1.9 3.8 3.8 3.8 3.8 3.8 Wheatstone - - 8.6 8.6 8.6 8.6 8.6 Ichthys - - 8.4 8.4 8.4 8.4 8.4 Prelude - - - 3.6 3.6 3.6 3.6 Sunrise - - - 4.0 4.0 4.0 4.0 Browse - - - 12.0 12.0 12.0 12.0 Arrow LNG - - - 4.0 8.0 8.0 8.0 Boneparte - - - 2.0 2.0 2.0 2.0 Gladstone LNG 7.8 7.8 7.8 7.8 7.8 7.8 7.8 Total 40.5 62.5 85.9 120.2 128.5 128.5 128.5
Table 4. Australian LNG Projects 2014 - 2020Unit: Million tons/year

76 PETROVIETNAM - JOURNAL VOL 6/2014
OIL & GAS MARKET
end of 2012. Key suppliers such as Qatar Petroleum are meanwhile trying to gain a foothold by mulling purchases of stakes in existing players.
The frenzy is being driven by long-term forecasts that gas demand in Asia’s third-largest economy will continue to outstrip domestic production on growing consumption by refi neries, and power and petrochemicals plants. Analysts at Jeff eries & Co said in November they reckon domestic output will likely average 90 million - 103 million m3/day (3.2 - 3.6 billion ft3/day) until March 2015. Gas demand is forecast to rise to 473 million m3/day by March 2017 from 293 million m3/day in March 2013. With no new major supply coming on stream until 2017, at the earliest, gas shortages will increase. These are already crippling growth in fertiliser output, and leading to chronic power shortages.
In the medium term, LNG is seen as the most likely way of bridging the supply-demand gap. India’s import will rise to 77 million m3/day (about 21 million tons/year of LNG) by March 2015, as the government moves to ease existing bottle-necks that include lack of regasifi cation capacity and pipeline infrastructure, as well as low domestic prices that make imports uneconomic.
Domestic output has been falling for the past 24 months. Analysts say the problem stems from lack of exploration spending because of the government policy of keeping gas prices artifi cially low to help power and fertiliser plants, which have to sell their output at subsidised rates.
Gas prices vary from 4.20 - 5.70USD/million Btu while spot LNG prices have been as high as 17USD/million Btu.
Oil Minister Veerappa Moily said that India needs to step up gas use as it is a relatively clean fuel. India hopes to increase its current share from 9% in its primary energy basket to the current global average of 23%. New Delhi also plans to focus on unconventional sources like shale gas and expects soon to introduce a policy on domestic shale exploration.
India is also studying pipeline imports, with the proposed Turkmenistan - Afghanistan - Pakistan - India project potentially supplying 38 million m3/day by 2018. But analysts are dubious, given political instability in transit countries.
With dependence on LNG set to grow, importers are rushing to tie up supplies by acquiring stakes in proposed
export projects in East Africa, and through long- and medium- term purchase agreements.
In the past 13 months, Gail has nailed down 6 million tons/year starting in April 2017, including 3.5 million tons/year from Cheniere Energy’s Sabine Pass, the only proposed US export project with approval to supply to countries without free trade agreements with the US like India. Petronet has also said it is seeking long-term deals.
Algeria
Algeria is the third largest gas supplier to Europe and a signifi cant LNG exporter in the world with a capacity of 9 billion m3/year (870 million m3/day) of gas and 60,000 barrels/day of condensate. Deliveries to Italy via the Transmed are usually 70 - 75 million m3/day and to Spain via the Medgas and Maghreb - Europe pipelines are unaff ected by global economic crises, and the long-term ramifi cation of Algerian petroleum could be huge. The economy of Algeria remains heavily skewed toward hydrocarbons, which account for roughly 45% of GDP, 98% of exports and up to two-thirds of state revenue, so security measures for the infrastructure of Algerian petroleum industry are vital.
In 2013, Algeria’s parliament had amended hydrocarbons legislation to focus taxes more on company profi ts than turnover, and cancel an unpopular windfall profi ts tax, while the government is preparing to launch new licensing round focused on unconventional resources. The giant Hassi R’Mel gas fi eld in the Northern part of the country remains the centrepiece of gas export infrastructure, but is set to decline by the 2020s, potentially jeopardising Algeria’s role as gas exporter unless the drop can be off set by tight gas and shale gas.
Lack of infrastructure and red tape are already holding up major gas projects in the southwest, and the threat of terrorism and higher security costs must now be added to the problems. The GR5 pipeline designed to link Southwestern fi elds to Hassi R’Mel, fi nally got the go-ahead last October and should be operational by November 2015.
Algeria is also making little headway in the booming Asian LNG market, prompting a growing realisation within Sonatrach that it may have to soften on oil-linked gas pricing to incorporate an element

77PETROVIETNAM - JOURNAL VOL 6/2014
PETROVIETNAM
of spot indexation to secure Asian buyers. In 2011 Algeria sold 200,000 tons of LNG across Asia, out of total exports of 12.5 million tons. Around 12.2 million tons went to Europe, where gas demand continues to decline. But with global competition set to increase over the next few years as new LNG export schemes come on line in Australia, the US, and potentially East Africa and the Eastern Mediterranean, Sonatrach needs to up its game. A new export plant at Skidda is due on stream this year and another at Arzew by 2015 with a combined capacity of 10,000,000 tons/year that should theoretically hoist Algeria’s name place capacity to 60 million tons/year. But Algiers will likely have to close some older facilities, given that its LNG sales are less than one-quarter of that volume and no LNG contracts are yet linked to the new capacity.
Azerbaijan gas export
Azerbaijan’s campaign to become a major gas exporter to Europe, cutting into sales from its giant Russian neighbour, is underpinned by the knowledge that new Caspian discoveries will augment supplies from its massive Shaz Deniz fi eld which has reserves of 1.2 trillion m3 of gas and 240 million tons of condensate for years to
come. But it is still far from clear how much extra gas these fi elds will produce and how long it will take to bring them on stream.
Deliveries from Shaz Deniz Phase 2 to Europe via a new southern corridor across Turkey are due to kick off in 2017, with 10 million m3/year earmarked for EU customers and 6 billion m3/year for Turkey. According to Gulmira Rzaeva, energy security researcher at Baku’s Centre for Strategic Studies of the President of Azerbaijan, Baku hopes to double gas exports to the EU to 20 billion m3/year by 2020 - 2025 - although that pales in comparison with Russian exports to Europe of 112.7 billion m3 in 2012.
BP, Chevron, Total, RWE Dea (Germany) are the dominant overseas players in Azerbaijan, which operates their blocks with state oil company Socar. Azerbaijan is planning a 14 billion USD gas, oil and petrochemicals complex near the capital Baku that will include a gas-processing plant with a design capacity of up to 15 billion m3/year. The complex, producing ethylene, propylene, and polyethylene, is not expected to start up before 2020.
Ha Phong (introduction)

The Asian Institute of Technology (AIT), in co-operation with the Vietnam Petroleum Institute (VPI), is now offering the Professional Master Programme in Geo-Exploration and Petroleum Geo-Engineering (GEPG).
Practical curriculum offered with flexibility to suit participants’ schedule
Overseas internship and research
Work with experienced VPI experts at an outstanding research facility with PVT, Cores, Geochemistry, Petrography, Lithology and Biostratigraphy laboratories system
Renowned lecturers from institutes/universities around the world e.g. Oklahoma (USA), Chulalongkorn (Thailand), Kyoto University (Japan), Schlumberger, Hanoi University of Mining and Geology, etc.
Since its launch in 2008 in Ho Chi Minh City - Vietnam, 5 GEPG courses have been successfully organised to date and attracted enthusiastic participants from many oil and gas companies
in Vietnam such as PVEP, Cuu Long JOC, Lam Son JOC, Con Son JOC, Thang Long Truong Son JOC, Chevron, Hoang Long - Hoan Vu JOCs, Pearl Oil, Phu Quy POC, Schlumberger, PV Drilling & Baker Hughes, Rosneft, Fairfield, Nippon Oil and Salamander Energy, etc. With a practical study programme focusing on exploration and production, experienced lecturers and state-of-the-art study facilities, GEPG has always received positive evaluation from its graduates. We are pleased to announce that the GEPG programme will be held at VPI’s head office - 173 Trung Kinh Street, Yen Hoa Ward, Cau Giay District, Ha Noi.
The Vietnam Petroleum Institute (VPI) - the leading science research & development subsidiary of Petrovvvietnam, reputed for high quality training course provider - and the Asian Institute of Technology - the premier international postgraduate institution of engineering and management - believe that knowledge and skills improvement are the key to achieve development goals and success.
PROFESSIONAL MASTER PROGRAMME IN GEO-EXPLORATION & PETROLEUM GEO-ENGINEERING
For more information about our Programme, please visit our website www.vpi.pvn.vn or contact our address as below: Vietnam Petroleum Institute - Centre for Petroleum Training and Information (CPTI) 14th floor, 173 Trung Kinh St, Yen Hoa Ward, Cau Giay Dist., Ha Noi Tel: 84-4-37843061/Ext:1444; Fax: 84-4-37844156, Email: [email protected].
Note: The course is off ered in English with a minimum length of 1 year
Note: Flexible schedule, graduation in December
STRUCTURE AND DELIVERY
PME-GEPG
programme
Course work Internship/Research Graduation 1st
semester 2nd
semester Inter-semester
Location AIT Vietnam VPI AIT Vietnam VPI Southeast Asia AIT Program (credit) 12 crd Course work 12 crd Course work 9 crd internship/research
Semester Time Content Duration
1st August - December
Fundamentals of Geo-exploration
12 crd Petroleum reservoir engineering Drilling and well completion operation Decision analysis & risk management in oil and gas industry
2nd January - May
Exploration geophysics
12 crd Petrophysics Petroleum production Engineering Petroleum geochemistry Practical lab session at VPI
Inter-semester June - December Internship/Research 9 crd
CURRICULUM

TENTATIVE TRAINING COURSES AT VIETNAM PETROLEUM INSTITUTE IN 2014No Course Code Tentative time Venue
A DOCTORATE TRAINING PROGRAMME
Major: PETROLEUM ENGINEERING 62 52 06 04 3 - 4 years HN B SHORT-TERM TRAINING PROGRAMME
I Petroleum E&P field
1 Well log interpretation and reserve calculation EXP_4025 4 days HN 2 Basic/Advanced training on Geology - Geophysics EXP_1007 3 days HN/HCM 3 Geological structure interpretation (Lang Son - Loc Binh - Mau Son field trip) EXP_4032 5 days HN 4 Fractures and faults analysis (Do Son - Hai Phong field trip) EXP_4005 5 days HN 5 Lithological facies and sedimentary environment (Cat Ba field trip) EXP_3003 7 days HN 6 Sequenced stratigraphy (field trip) EXP_3001 5 days HN 7 Hydrocarbon exploration methods EXP_1001 5 days HN 8 Petroleum production engineering, advanced EXP_2009 3 days HN 9 Hydrocarbon system and conditions for hydrocarbon accumulations in fractured basement EXP_2012 5 days HN
10 Seismic data interpretation, basic EXP_2015 5 days HN 11 Seismic data interpretation, advanced EXP_2015 5 days HN 12 Geochemistry for petroleum exploration, basic EXP_1002 3 days HN 13 Geochemistry in petroleum exploration, advanced EXP_2010 4 days HN 14 Flow Assurance EXP_4030_E 5 days HN 15 Well-Test Analysis EXP_4031_E 5 days HN 16 Well log interpretation, advanced EXP_2016 5 days HN/HCM 17 Identification of stratigraphic boundaries and reservoirs by geophysical methods EXP_2022 5 days HN 18 (Well log) processing and interpretation for gas - condensate bearing section EXP_2014 5 days HN 19 Seismic study of AVO inversion EXP_4027 5 days HN 20 Core Analysis/PVT Analysis PRD_2007 2 days HCM 21 Well log analysis and measured parameter justification in potential/reserve calculation EXP_2025 5 days HN/HCM 22 Seismic data interpretation in reserve calculation EXP_2026 5 days HN/HCM 23 Application of sequenced stratigraphy and seismic stratigraphy in hydrocarbon potential assessment EXP_2027 5 days HN/HCM 24 Introduction to Petrel software in Geology - Geophysics EXP_2028 5 days HN II Petrochemistry, petroleum refining and processing
25 Petrochemical processing DWN_1002 3 days HCM 26 Biofuels DWN_1005 3 days HCM III Safety and environment in oil and gas
27 Risk management in oil and gas industry HSE_1002 3 days HCM 28 Introduction to the legislation on safety, health and environment in oil and gas industry HSE_1003 2 days HN/HCM 29 Identification and management of risk in oil and gas industry HSE_1002 3 days HCM/HN 30 Oil spill response in petroleum operations HSE_2003 3 days HCM 31 Labour environment monitoring in oil and gas industry HSE_1005 2 days HCM 32 Control of solid and hazadous waste in oil and gas industry HSE_1004 2 days HCM 33 Environment monitoring techniques HSE_1006 2 days HN IV Petroleum economics and management
34 Petroleum contracts and E&P investment project evaluation EBA_3002 5 days HN 35 Disputes in international petroleum contracts: Litigation skills at economic arbitration/court EBA_3001 6 days HN 36 Petroleum project management EBA_1006 5 days HN 37 Enterprise risk management EBA_1007 5 days HN/HCM 38 Materials/goods management EBA_1008 4 days HN 39 Training on fostering knowledge and professional skills to Controller and Supervisory board members EBA_2004 5 days HN 40 Law in foreign trade and commercial disputes settlement by arbitration EBA_2014 6 days HN V English
41 English for petroleum industry ENG_5002 60 hours HN 42 English for TOEIC (450-500) ENG_1001_I 60 hours HN 43 English for TOEFL ENG_2001 60 hours HN 44 English for IELTS (5.0) ENG_3001_I 60 hours HN VI Other fields
45 Anti-corrosion and metal protection for oil and gas constructions (basic) MDS_1001 2 days HN/HCM 46 Determination of corrosion rate by electrochemical impedance method MDS_1002 3 days HN 47 Introduction to petroleum industry for non-professionals INT_1001 2 days HN/HCM 48 Writing and presentation skills in scientific research SSK_1006 3 days HN/HCM 49 Procurement professionals SSK_1014 2 days HN/HCM 50 Training for internal controllers SSK_2002 5 days HN/HCM 51 Management skills for middle managers SSK_1004 7 days HN 52 Awareness and interpretation of ISO/ISO 14001:2004 and OHSAS 18001:2007 GEN_1007 2 days HN/HCM 53 Internal audit of ISO/ISO 14001:2004 and OHSAS 18001:2007 GEN_1011 2 days HN/HCM
Note:
- Customized agenda and topics at your requirement- Available for in-house training provision- For any further information, please contact address as below: Center for Petroleum Training and Information
14th fl oor, VPI Tower, 173 Trung Kinh Str., Yen Hoa Ward, Cau Giay Dist., Ha Noi Email: [email protected]; Tel: 84-4-37843061/1420 ÷ 1424; Fax: 84-4-37844156