Smart Model/Package for Home Based Solar Grid System ...
113
University of Southern Queensland Faculty of Health, Engineering and Sciences Smart Model/Package for Home Based Solar Grid System Design A dissertation submitted by David Armstrong in fulfilment of the requirements of ENG4111 and 4112 Research Project towards the degree of Bachelor of Engineering (Honours) (Electrical/Electronic) Submitted October 2019
-
Upload
khangminh22 -
Category
Documents
-
view
0 -
download
0
Transcript of Smart Model/Package for Home Based Solar Grid System ...

University of Southern Queensland
Faculty of Health, Engineering and Sciences
Smart Model/Package for Home Based Solar Grid
System Design
A dissertation submitted by
David Armstrong
in fulfilment of the requirements of
ENG4111 and 4112 Research Project
towards the degree of
Bachelor of Engineering (Honours) (Electrical/Electronic)
Submitted October 2019

ii
Abstract
This project aims, through modelling and programming, to determine and recommend an optimal and
cost-effective solar home system (SHS) for a small, medium, medium/large and large household located
in Australia. The project was initiated through a thorough literature review of available solar panels,
batteries, controllers and inverters and the technology that supports them. Background research
commenced with an analysis of suitable and available photovoltaic panels, batteries, controllers and
inverters that could be used in the modelling and program development. Further to this location data and
household usage data was collected and analysed for modelling purposes. For modelling the system
Australia wide average load profiles for small, medium, medium/large and large households were
constructed based on data from the Australian Bureau of Statistics, Australian Energy Market
Commission and Energy Australia. These load profiles were used to determine the appropriate system
size based on their usage.
From the results it was found that the all average house sizes can accommodate all the possible systems,
the optimal Solar Home System for a Queensland, Victorian and Tasmanian was split between the 5 kW
“median” priced system and the 10 kW “cheaper” system. The choice between then would come down to
personal economic preference of shorter payback or higher return on investment. For New South Wales,
Western Australia and the Northern Territory the “cheaper” 10 kW system was the recommended system.
South Australia was split between the “cheaper” 10 kW system and the “cheaper” 3 kW system, again
economic preference would be the deciding factor. The Australian Capital Territory returned a
recommendation of the “cheaper” 10 kW system.
The final part of the research was to develop smart model/package to assist a consumer with guidance on
purchasing a solar home system. For this user data is entered into an Excel based system and tested
against the average load profiles modelled. The user also has the option to enter all their loads for the
household which can result in a more accurate recommendation. The system then displays the results of a
recommended performance and economically optimized system including photovoltaic cells, batteries,
controller and inverter. Average price and optimal installation angle are also displayed.

iii
University of Southern Queensland
Faculty of Health, Engineering and Sciences
ENG4111/ENG4112 Research Project Limitations of Use
The Council of the University of Southern Queensland, its Faculty of Health, Engineering & Sciences, and the staff of the University of Southern Queensland, do not accept any responsibility for the truth, accuracy or completeness of material contained within or associated with this dissertation.
Persons using all or any part of this material do so at their own risk, and not at the risk of the Council of the University of Southern Queensland, its Faculty of Health, Engineering & Sciences or the staff of the University of Southern Queensland.
This dissertation reports an educational exercise and has no purpose or validity beyond this exercise. The sole purpose of the course pair entitled “Research Project” is to contribute to the overall education within the student’s chosen degree program. This document, the associated hardware, software, drawings, and other material set out in the associated appendices should not be used for any other purpose: if they are so used, it is entirely at the risk of the user.

iv
University of Southern Queensland
Faculty of Health, Engineering and Sciences
ENG4111/ENG4112 Research Project
Certification I certify that the ideas, designs and experimental work, results, analyses and conclusions
set out in this dissertation are entirely my own effort, except where otherwise indicated
and acknowledged.
I further certify that the work is original and has not been previously submitted for
assessment in any other course or institution, except where specifically stated.
David Armstrong
Student Number:
Signature
Date

v
Acknowledgements
I would like to thank Associate Professor Paul Wen for his supervision and support throughout my
research.
Finally, I would like to thank my patient wife Alexandra and my children Niamh, Oliver and Elliot for
allowing me to complete my years of study.

vi
Contents Abstract ......................................................................................................................................................... ii Acknowledgements ....................................................................................................................................... v
List of figures ............................................................................................................................................. viii List of Tables ............................................................................................................................................... ix
Abbreviations and definitions ....................................................................................................................... x
Chapter 1 Introduction ........................................................................................................................... 1
1.1 Aims .................................................................................................................................................... 1
1.2 Objectives............................................................................................................................................ 1
1.3 Australian standards ............................................................................................................................ 1
1.4 Consequential effects/ethics ................................................................................................................ 2
Chapter 2 Literature Review .................................................................................................................. 3
2.1 Introduction ......................................................................................................................................... 3
2.2 Solar Energy........................................................................................................................................ 4
2.3 Photovoltaic technology ...................................................................................................................... 5
2.3 Battery technology .............................................................................................................................. 9
2.4 Charge controllers ............................................................................................................................. 11
2.4.1 Charger Controller Types............................................................................................................... 11
2.5 Power inverters ................................................................................................................................. 13
2.6 Solar levels ........................................................................................................................................ 13
2.7 Economics ......................................................................................................................................... 15
Chapter 3 Methodology ....................................................................................................................... 19
3.1 Outline of Methodology .................................................................................................................... 19
3.2 Modelling locations .......................................................................................................................... 19
Chapter 4 Testing and Evaluation ........................................................................................................ 23
4.1 Preliminary testing ............................................................................................................................ 23
4.2 Residential home size data gathering ................................................................................................ 23
4.2.1 Small home data gathering ............................................................................................................. 25
4.2.2 Medium home data gathering ........................................................................................................ 26
4.2.3 Large home data gathering ............................................................................................................. 27
4.2.4 Roof space calculations .................................................................................................................. 27
4.3 Modelling appliance loads ................................................................................................................ 29
4.3.1 Heating and Cooling ...................................................................................................................... 30
4.3.2 Water heating ................................................................................................................................. 31

vii
4.3.3 Dishwashers ................................................................................................................................... 33
4.3.4 Dryers ............................................................................................................................................. 34
4.3.4 Washing machines ......................................................................................................................... 35
4.3.5 Fridges and Freezers ...................................................................................................................... 36
4.3.5 Lighting .......................................................................................................................................... 37
4.3.6 Televisions ..................................................................................................................................... 39
4.3.7 Other electrical devices .................................................................................................................. 40
4.4 Modelling Solar Home System Components .................................................................................... 41
4.4.1 Batteries ......................................................................................................................................... 41
4.4.2 PV panels ....................................................................................................................................... 46
4.4.3 Charge controllers .......................................................................................................................... 52
4.4.4 Power inverters .............................................................................................................................. 53
4.5 Modelling load profiles and system sizes ......................................................................................... 54
4.6 Optimisation ...................................................................................................................................... 60
4.7 Optimisation results and conclusions ................................................................................................ 61
4.7.1 Small house (3kW) ........................................................................................................................ 63
4.7.2 Medium house (5kW) .................................................................................................................... 66
4.7.3 Medium/Large house (7kW) .......................................................................................................... 69
4.7.4 Large house (10kW) ...................................................................................................................... 72
4.7.5 Results and recommendations ........................................................................................................ 75
Chapter 5 Program Development ........................................................................................................ 83
5.1 Package Script Development ............................................................................................................ 83
Chapter 6 Conclusions ......................................................................................................................... 84
6.1 Summary of Outcomes ..................................................................................................................... 84
6.2 Academic Contribution ..................................................................................................................... 85
6.3 Future Work ...................................................................................................................................... 86
6.4 Evaluation of Aims and Objectives .................................................................................................. 86
6.5 Professional Reflection ..................................................................................................................... 87
Chapter 7 Appendix ............................................................................................................................. 88
Appendix A: Project Specification ......................................................................................................... 88
Appendix B: Risk Assessment ................................................................................................................ 89
Appendix C: Timeline ............................................................................................................................. 91
Appendix D: References ......................................................................................................................... 92
Appendix E: Program QR Code ............................................................................................................. 98
Appendix F: Program screenshots .......................................................................................................... 99

viii
List of figures Figure 1: Off grid system model (Off Grid Solar System, 2019) ................................................................. 3 Figure 2: Off grid system model (CLEAN ENERGY REVIEWS, 2019) .................................................... 4 Figure 3: Decrease in price and increase in production of solar energy (Shahan, Z. and Shahan, Z., 2019) 5 Figure 4: Charge controllers. (This Grandpa Blogs.,2019) ......................................................................... 13 Figure 5: Australian solar radiation levels (ABC News., 2019) ................................................................. 14 Figure 6: Australian cities and towns used in research (Mapsofworld.com. (2019) ................................... 22 Figure 7: Australian weekly energy use by household size (Aemc.gov.au, 2019). .................................... 23 Figure 8: Example of Project Sunroof (Google.com, 2019) ....................................................................... 28 Figure 9: Typical household usage of power. (Sa.gov.au., 2019) ............................................................... 30 Figure 10: Cost Per Warranted kWh chart .................................................................................................. 42 Figure 11: Risk assessment control methods .............................................................................................. 89 Figure 12: Risk assessment matrix.............................................................................................................. 89 Figure 13: Risk assessment consequence matrix ........................................................................................ 90 Figure 14: Gantt chart timeline ................................................................................................................... 91 Figure 15: QR code ..................................................................................................................................... 98 Figure 16: Program- inputs selection .......................................................................................................... 99 Figure 17: Program- house size selection ................................................................................................... 99 Figure 18: Program- state selection .......................................................................................................... 100 Figure 19: Program- city selection ............................................................................................................ 100 Figure 20: Program- economic preference selection ................................................................................ 101 Figure 21: Program- investment amount selection ................................................................................... 101 Figure 22: Program- averages based system recommendation ................................................................. 102 Figure 23: Program- inputting loads ......................................................................................................... 102 Figure 24: Program- inputting loads continued ........................................................................................ 103 Figure 25: Program- final personal load-based recommendation ............................................................. 103

ix
List of Tables Table 1: Australian standards for home solar systems (installations) (Lgenergy.com.au., 2019) ................ 2 Table 2: Major Australian cities latitude list (Australiantownslist.com, 2019) ............................................ 7 Table 3 : Most efficient PV panels in Australia (CLEAN ENERGY REVIEWS, 2019) ............................. 7 Table 4: Battery types and specifications (Diouf, B & Pode, R., 2015) ..................................................... 11 Table 5: Solar radiation levels (Bom.gov.au, 2019) ................................................................................... 15 Table 6: Average electricity costs (Canstar Blue, 2019). ............................................................................ 18 Table 7: Feed in tariff (Canstar Blue, 2019). .............................................................................................. 18 Table 8: Energy Australia average usage figures (Energy Australia, 2019) .............................................. 23 Table 9: AEMC residential power by state. (AEMC, 2019) ....................................................................... 24 Table 10: Residential power usage calculations ......................................................................................... 25 Table 11: Floor size (m2) of Australian households (Commbank.com.au, 2019) ....................................... 27 Table 12: Example weights of PV panels. (Matasci, S., 2019) ................................................................... 28 Table 13: Air conditioning sample figures. (Data.gov.au., 2019) ............................................................... 31 Table 14: Electric water heating sample figures. (Data.gov.au., 2019) ...................................................... 32 Table 15: Dishwashers sample figures. (Data.gov.au., 2019) ..................................................................... 33 Table 16. Clothes dryers sample figures. (Data.gov.au., 2019) .................................................................. 34 Table 17: Washing machine sample figures. (Data.gov.au., 2019) ............................................................ 35 Table 18: Fridges and freezers sample figures. (Data.gov.au., 2019) ........................................................ 36 Table 19: Incandescent bulb sample figures. (Data.gov.au., 2019) ............................................................ 37 Table 20: Fluorescent bulb sample figures. (Data.gov.au., 2019) .............................................................. 38 Table 21: Television sample figures. (Data.gov.au., 2019) ........................................................................ 39 Table 22: Miscellaneous devices sample figures. ....................................................................................... 40 Table 23: Battery list and descriptions ........................................................................................................ 43 Table 24: Panel list and descriptions........................................................................................................... 47 Table 25: Excerpt of Table 5. ..................................................................................................................... 52 Table 26: Charge controllers ....................................................................................................................... 53 Table 27: Inverters ...................................................................................................................................... 54 Table 28: Small residence modelling .......................................................................................................... 54 Table 29: PV selection for 3kW system ...................................................................................................... 55 Table 30: Battery selection for 3kW system ............................................................................................... 56 Table 31: Inverter selection for 3kW system .............................................................................................. 56 Table 32: Solar charge controller selection for 3kW system ...................................................................... 57 Table 33: Medium house load profiles ....................................................................................................... 57 Table 34: Large house load profiles ............................................................................................................ 58 Table 35: System price comparison ............................................................................................................ 58 Table 36: Load profile and chosen components ......................................................................................... 59 Table 37: Small house optimisation most expensive system ...................................................................... 63 Table 38: Small house optimisation median expensive system .................................................................. 64 Table 39: Small house optimisation cheapest expense ............................................................................... 65 Table 40: Medium house optimisation most expensive .............................................................................. 66 Table 41: Medium house optimisation median expense ............................................................................. 67 Table 42: Medium house optimisation cheapest expense ........................................................................... 68 Table 43: Medium house optimisation most expensive .............................................................................. 69 Table 44: Medium house optimisation median expense ............................................................................. 70 Table 45: Medium house optimisation cheapest expense ........................................................................... 71 Table 46: Large house optimisation most expensive .................................................................................. 72

x
Table 47: Large house optimisation median expense ................................................................................. 73 Table 48: Large house optimisation cheapest expense ............................................................................... 74 Table 49: Tabulated optimisation results for Queensland ........................................................................... 75 Table 50: Tabulated optimisation results for New South Wales ................................................................. 76 Table 51: Tabulated optimisation results for Victoria ................................................................................ 77 Table 52: Tabulated optimisation results for Western Australia................................................................. 78 Table 53: Tabulated optimisation results for Tasmania .............................................................................. 79 Table 54. Tabulated optimisation results for the Northern Territory .......................................................... 80 Table 55: Tabulated optimisation results for South Australia .................................................................... 81 Table 56: Tabulated optimisation results for the Australian Capital Territory ........................................... 82
Abbreviations and definitions
ABS Australian Bureau of Statistics AC Alternating Current
A/C Air Conditioning
DC Direct Current IRR Internal Rate of Return
kW Kilowatt
kWh Kilowatt hours LCOE Levelled Cost of Electricity
LED Light Emitting Diode
Li-Ion Lithium Ion
NiCad Nickel Cadmium
NiFe Nickel Iron
NiMH Nickel Metal Hydride
NPV Net Present Value PV Photovoltaic ROI Return on Investment SHS Solar Home System

1
Chapter 1 Introduction
1.1 Aims
The aim of this project is to develop a program that will recommend a solar home system for use in a
residential setting. In the last 15 years there has been an increase in the amount of knowledge and
understanding about the consequences of climate change on the environment. There has also been a
global rise in the number of residential homes adopting technologies that help to reduce our negative
effect on the environment (Boxwell, M., 2010). Whilst this problem and solution are global based this
research and proposal are centred around Australia. Australia has a geographical position and climate that
lends itself to the use of solar photovoltaic (PV) panels to produce energy. On the small scale most houses
should be equipped with the ability to generate all or at least some of its own electricity, and as the prices
of PV cells and the necessary equipment for home solar systems decreases it is hoped that programs like
the one being researched here will help the consumer make informed decisions.
1.2 Objectives
The objective of this project is to develop a model or package to recommend an ideal solar home system
based on an individual’s specific set of criteria/circumstances. Data gained from the various elements of
the solar home system will be used as databases for the software package to draw on to give its
recommendation. Data such as load requirements, battery type, PV cell type/size, solar controller, power
inverter and associated costs will form the basis of the databases. The software package will also consider
the economics of the systems and its recommendation will reflect this.
1.3 Australian standards
The following Table outlines the legal standards required for home generated solar systems with grid
connection. As this project is purely based in theory and will use only software for modelling these
standards are outside the scope of the project and are not considered.

2
Table 1: Australian standards for home solar systems (installations) (Lgenergy.com.au., 2019)
1.4 Consequential effects/ethics
For this project the use of Electricity supplier data will be used for load descriptions and estimations of
profiles. Due to corporate confidentiality, only some data is available to the public. This will restrict the
level of accuracy of the load profiles derived. All the data pertaining to household equipment loads has
been supplied by the Australian Bureau of Statistics, Australian Energy Market Commission, Energy
Australia and the manufacturers data sheets.
StandardAS/NZS 5033 Installation of photovoltaic (PV) arraysAS/NZS 3000 Electrical Wiring RulesAS 1768 Lightning ProtectionAS/NZS 1170.2 Wind LoadsAS4777 Grid Connections of Energy Systems via InvertersAS 4509 Stand-alone power systemsIEC61730 Class A Solar PanelsIEC61215 or IEC61646 Solar PanelsAS 4086 Secondary batteries
Application

3
Chapter 2 Literature Review
2.1 Introduction
Home based solar power generation and storage (referred to here as a Solar Home System or SHS) is the
method by which solar radiation energy is captured via photovoltaic panels and converted in to DC
electricity. The DC electricity can be used to power some electrical devices directly (Gwamuri, J &
Mhlanga, S., 2019) which requires some modification to the exiting home wiring and the use of specific
DC powered equipment. The most common methodology of powering the home is by use of an inverter
to convert the DC electricity (either directly from the panels or from the battery bank) into AC electricity
for use with most domestic wiring and appliances. There are several ways in which a SHS can be
arranged and the design is based on the load requirements of the individual system. The two systems this
literature review addresses are the Off-Grid and Grid Connected systems.
The off-grid system is comprised of a PV array for solar energy capture, charge controller for correct
charging of the batteries, battery bank based on the load size and a DC/AC power inverter. All electricity
for the home is collected and stored during the day. The ideal setup has the instantaneous electricity
generated from the PV cells converted directly to AC power for use with the home appliances and the
unused DC electricity is stored via the battery pack for use when the sun is not shining.
Figure 1: Off grid system model (Off Grid Solar System, 2019)

4
The grid-connected system has a similar setup with a PV array for DC electricity, charge controller and
battery bank all the same as the off-grid system. The system would ideally power household appliances
directly via an inverter and unused energy stored in the battery pack. Once the battery pack is fully
charged excess harness electricity is fed back into the grid and the owner of the system would receive
financial reimbursement (Ali, W, Farooq, H, Rehman, AU, Awais, Q, Jamil, M & Noman, A., 2019).
Figure 2: Off grid system model (CLEAN ENERGY REVIEWS, 2019)
2.2 Solar Energy
Solar energy has been described as the best renewable source of energy as it is seemingly limitless. Its
energy can be used directly to power devices or indirectly and stored in various forms (Davis, K., 2019).
Environmental concerns and the reduction of air pollutants produced in electricity generation has been the
prevalent push behind the adoption of solar energy as a power source. PV technology has been around
since the 1950s where it was first used to power American satellites and spaceships in orbit, but in the last
20 years the technology has seen a steep rise in the rate of development alongside a rise in
implementation of the systems. (Timilsina, G, Kurdgelashvili, L & Narbel, PA, 2012) discusses the pre-
2011 global contribution of solar PV systems to the energy supply amounted to 40 GW with 1095 MW
coming from concentrated solar power and with this uptake of the technology it is likely that solar could
supply approximately 11% of the global energy demand by 2050.
While it is true, and a deterrent for some, that solar energy systems can be more expensive than other
renewable energy systems, continued progress in the technology and a greater number of producers has
seen a drastic decrease in the costs of the systems (Erdinc, O & Uzunoglu, M, 2012). Figure 3 shows the

5
cost of solar systems decreasing drastically over the past 30 years while the amount of solar production
has increased sharply over the last 10 years, this can be attributed directly to worldwide movements in
support of renewable energy and because of government policies and incentives (Liu, H, Azuatalam, D,
Chapman, AC & Verbič, G, 2019).
Figure 3: Decrease in price and increase in production of solar energy (Shahan, Z. and Shahan, Z., 2019)
2.3 Photovoltaic technology
The photovoltaic cell relies on the photovoltaic effect which is described by (Science.nasa.gov., 2019) as
the phenomenon by which sunlight is directly converted into electricity at the atomic level. The materials
that exhibit photovoltaic effect can absorb photons of light and release electrons, the free electrons are
then captured and in doing so electric current is created.
The discovery of the photovoltaic effect was first documented by the French physicist, Edmund Bequerel
in 1839. He found that when gold or platinum plates were submerged in a solution, then exposed to
uneven solar radiation, an electrical current was generated. It was not until 1883 that the American
inventor Charles Fritz created the first photovoltaic cell with a <1% efficiency. This was followed in 1927
with the development of the copper and semiconductor copper oxide photovoltaic cell, again with < 1%
efficiency. Not until the development of the silicon photovoltaic cell in 1941 were researchers able to

6
reach a level of 6% efficiency in direct sunlight and was able to be increased to 11% by the research
department of Bell laboratories in 1954 (Singh, GK, 2013).
While the use of photovoltaics for solar energy capture is good, it is only as good as the amount of sun
that is hitting the panels. The accurate placement the PV array to have maximum solar radiation
absorption is essential to gain maximum harvesting of this energy. As (Handoyo, EA, Ichsani, D &
Prabowo, 2013) discussed the optimal angle of incident, which is described as “the angle that a line (as a
ray of light) falling on a surface or interface makes with the normal drawn at the point of incidence”
(Merriam-webster.com, 2019) is a direct function of latitude, weather data and type of energy demand.
(Kern, J & Harris, I, 1975) went further to discuss and define that the amount of solar radiation able to be
collected via the PV panel changes throughout the year as the seasons change and that the position of the
sun in the sky and the orientation of the surface determine the radiation received. The tilt angle of the PV
panel is measured between the PV panel and a horizontal surface (x direction) or the angle measured
between the PV panel and a vertical surface (y direction). For the PV panels to generate the most power
they must be facing towards the sun. For the off-grid system where there is a battery bank and the PV
panels are attached to a fixed structure, it is ideal to set the angle of tilt to optimise their performance
when there is the least sunlight that way the chosen angle should be sufficient throughout the year. For the
grid connected system is it recommended that the PV panels are mounted (to a fixed structure) with a tilt
angle that is equal to the latitude of the installation site to gain the maximum output
(Solarcalculator.com.au, 2019).
Below, Table 2 shows the different latitude throughout Australian major and capital cities. This Table will
be used in the calculations and design of the project.

7
Table 2: Major Australian cities latitude list (Australiantownslist.com, 2019)
Panel efficiency also plays a large role in the amount of energy captured. As cell technology has increased
so has the efficiency of the PV panel.
Table 3 : Most efficient PV panels in Australia (CLEAN ENERGY REVIEWS, 2019)
No City Province/State Latitude1 Adelaide South Australia 34°56′S2 Brisbane Queensland 27°28′S3 Cairns Queensland 16°56′S
4 Canberra Australian Capital Territory 35°18′S5 Darwin Northern Territory 12°27′S6 Geelong Victoria 38°09′S7 Gold Coast Queensland 28°01′S8 Hobart Tasmania 42°53′S9 Mandurah Western Australia 32°32′S
10 Melbourne Victoria 37°49′S11 Newcastle New South Wales 32°55′S12 Perth Western Australia 31°57′S13 Port Hedland Western Australia 20°19′S
14 Rockhampton Queensland 23°23′S
15 Sydney New South Wales 33°52′S16 Townsville Queensland 19°15′S17 Wollongong New South Wales 34°26′S
8
A major contributing factor for PV panel efficiency is the temperature coefficient. (Ceylan, İ, Yilmaz, S,
İnanç, Ö, Ergün, A, Gürel, AE, Acar, B & İlker Aksu, A, 2019) describes the relationship between the PV
panels temperature and its ability to generate energy i.e. the hotter the panel gets from solar exposure and
reflected heat the less energy can be produced. The efficiency of PV systems is generally determined
under standard test conditions (25 °C cell temperature, 1000 W/m2 solar radiation and 1.5 air mass),
(Office, C., 2019).
The amount of energy harnessed per year by PV arrays is given in Equation (1)
𝐸𝐸𝑡𝑡𝑡𝑡𝑡𝑡 = 𝑃𝑃𝑆𝑆𝑆𝑆𝑆𝑆 ∗ 𝑓𝑓𝑚𝑚𝑚𝑚𝑚𝑚 ∗ 𝑓𝑓𝑑𝑑𝑑𝑑𝑑𝑑𝑡𝑡 ∗ 𝑓𝑓𝑡𝑡𝑡𝑡𝑚𝑚𝑡𝑡 ∗ 𝐻𝐻𝑡𝑡𝑑𝑑𝑡𝑡𝑡𝑡 ∗ 𝜂𝜂𝑡𝑡𝑣𝑣𝑖𝑖𝑖𝑖𝑖𝑖 ∗ 𝜂𝜂𝑑𝑑𝑚𝑚𝑣𝑣 ∗ 𝜂𝜂𝑑𝑑𝑚𝑚𝑣𝑣𝑠𝑠𝑠𝑠 (1)
(Photovoltaic-software.com, 2019)
Where:
• 𝐸𝐸𝑡𝑡𝑡𝑡𝑡𝑡 is the average yearly output in Wh
• 𝑃𝑃𝑆𝑆𝑆𝑆𝑆𝑆 is the rated output of the array under standard testing conditions in W
• 𝑓𝑓𝑚𝑚𝑚𝑚𝑚𝑚 is the manufacturing tolerance factor
• 𝑓𝑓𝑑𝑑𝑑𝑑𝑑𝑑𝑡𝑡 is the factor due to static dirt on the panel
• 𝐻𝐻𝑡𝑡𝑑𝑑𝑡𝑡𝑡𝑡 is the yearly irradiation value of the location in kWh/m2
• 𝜂𝜂𝑡𝑡𝑣𝑣𝑖𝑖𝑖𝑖𝑖𝑖 is the efficiency of the system between the PV array and the inverter (cables, etc)
• 𝜂𝜂𝑑𝑑𝑚𝑚𝑣𝑣 is the efficiency of the inverter
• 𝜂𝜂𝑑𝑑𝑚𝑚𝑣𝑣𝑠𝑠𝑠𝑠 is the efficiency of the system between the inverter and switchboard (cables, etc)
Equation (2) is used to determine the panel efficiency based on the standard testing conditions and
average panel temperatures.
𝑓𝑓𝑡𝑡𝑡𝑡𝑚𝑚𝑡𝑡 = 1 + 𝛾𝛾 ∗ �𝑇𝑇𝑝𝑝𝑝𝑝𝑛𝑛𝑒𝑒𝑓𝑓𝑓𝑓 − 𝑇𝑇𝑠𝑠𝑠𝑠𝑠𝑠� (2)
Where:
• 𝑓𝑓𝑡𝑡𝑡𝑡𝑚𝑚𝑡𝑡 is the temperature factor
• 𝛾𝛾 is the value of the temperature coefficient per ℃
• 𝑇𝑇𝑡𝑡𝑚𝑚𝑚𝑚𝑒𝑒𝑒𝑒𝑒𝑒 is the average daily panel temperature in ℃
• 𝑇𝑇𝑠𝑠𝑡𝑡𝑠𝑠 is the panel temperature in standard test conditions in ℃ (25℃)

9
A solar panel’s temperature coefficient is a measure of how much or little a panel’s production is lowered
in hot temperatures. Based only on the lowest temperature coefficient available in a panel, the list below
shows the best performing manufacturers on the market:
1. Panasonic (-0.26)
2. Silevo (-0.27)
3. Hanwha Q CELLS (-0.28)
4. SunPower (-0.29)
5. LG (-0.3)
A solar panel’s materials warranty (or equipment warranty) protects against equipment failure due to
environmental factors or manufacturing defects. Based only on the longest materials warranties available
from solar companies, the list below shows the best performing manufacturers on the market:
1. LG (25 years)
2. Panasonic (25 years)
3. Silfab (25 years)
4. Solaria (25 years)
5. SunPower (25 years)
These factors will play a role in the modelling of the systems.
2.3 Battery technology
There are many options, some more wild than others when it comes to energy storage, but for the solar
home system batteries are the method of choice. Battery technology has undergone major evolutionary
steps in the recent past and what was once out of reach for most consumers is now common place. The
most developed battery technologies are Lead-Acid, Nickle Metal Hydride (Ni-MH), Nickle Cadmium
(Ni-Cd) and Lithium ion (Li-ion).
The lead-acid battery was, and still is in certain circumstances, the storage type of choice. The problem
with lead-acid is its shorter life span, in comparison to other battery types. When tied into a solar home
system with PV panels lasting 25 years plus and LED lights lasting approx. 15yrs (Diouf, B & Avis, C.,
2019) a life cycle of 200-300 cycles is not adequate. The short lifespan of lead-acid batteries can have
steep financial consequences over the life of the system. While it may be true that lead-acid batteries can
last up to 10 years (Diouf, B & Pode, R., 2015) if treated correctly in practise their lifespan depends
10
different parameters such as number of cycles, depth of cycles, external temperatures and the charge and
discharge currents. Lead-acid is used in solar home systems, but users could be faced with changing their
batteries up to 8 times during the life of the system.
In an off-grid PV system the lifespan of the solar panel is more than 25 years and at least 50,000 hrs for
an LED. In order to improve the longevity of such a system, the lifetime of the battery should level up
from the bottom to match that of the LED lamps by reaching the 15 years target, about 5000 cycles at
80% depth of discharge.
Lithium-ion (Li-ion) is the newest of the available battery technologies for solar home systems
(Goodenough, JB & Park, K-S., 2013). It is expected that Li-ion and Lead-acid battery market should
continue to grow over the next several years, but Li-ion is certain to overtake lead-acid in home solar
systems where lifespan and power density is critical. Li-ion batteries are beginning to revolutionize the
PV industry and renewables in general (Nassereddine, M, Rizk, J, Nagrial, M & Hellany, A., 2018) as
their pricing drops as more competitors come onto the market.
The development of parallel industries using Li-ion rechargeable batteries such as electric automobiles,
electric bikes and consumer electronics (phones etc) have created an increased effect on research and
development of these batteries which has now made them ideal candidates for storage in off-grid and grid
tied renewable energy. (Valsala, KD, Premkumar, K & Beevi, AB., 2019), discusses the advantages of
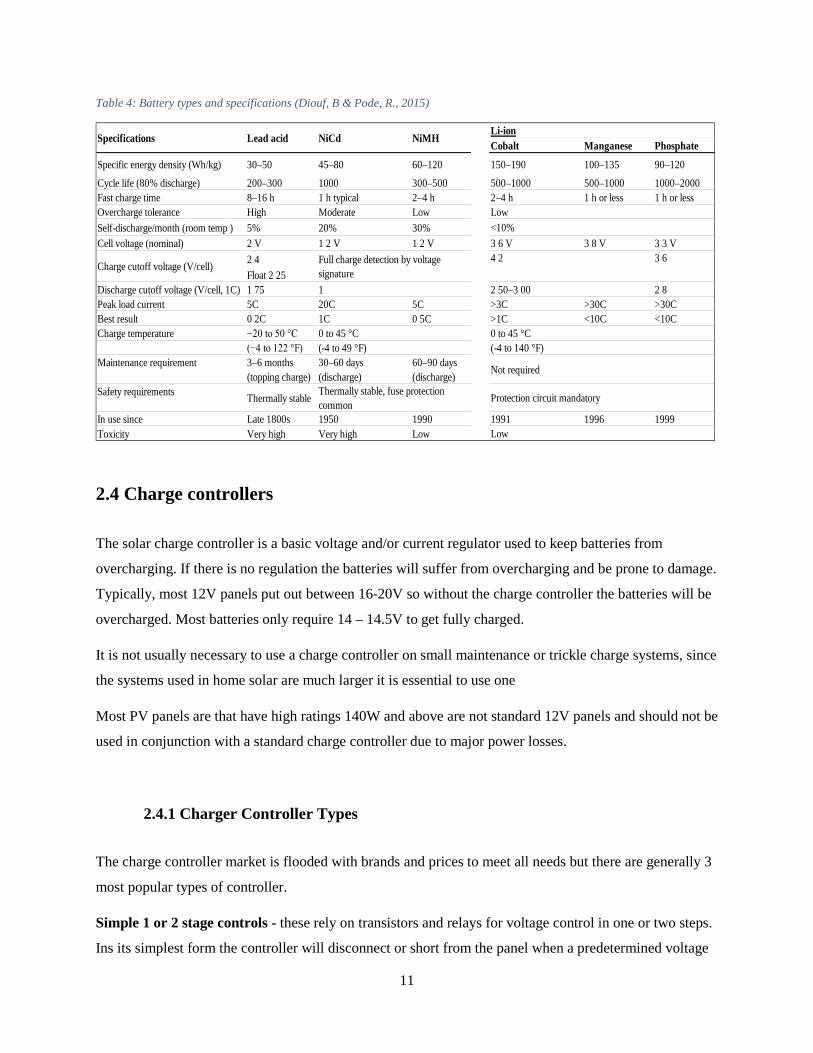
lead-acid batteries in home storage but as seen below in Table 4 Li-ion batteries far exceed Lead acid
when it comes to the fundamental characteristics of longer life cycle and lower life cycle cost. The price
per cycle can be less than Lead-acid when taking into consideration their lifespan. So, what seems like a
higher investment upfront may in the long term be far more financially beneficial to the user.
11
Table 4: Battery types and specifications (Diouf, B & Pode, R., 2015)
2.4 Charge controllers
The solar charge controller is a basic voltage and/or current regulator used to keep batteries from
overcharging. If there is no regulation the batteries will suffer from overcharging and be prone to damage.
Typically, most 12V panels put out between 16-20V so without the charge controller the batteries will be
overcharged. Most batteries only require 14 – 14.5V to get fully charged.
It is not usually necessary to use a charge controller on small maintenance or trickle charge systems, since
the systems used in home solar are much larger it is essential to use one
Most PV panels are that have high ratings 140W and above are not standard 12V panels and should not be
used in conjunction with a standard charge controller due to major power losses.
2.4.1 Charger Controller Types
The charge controller market is flooded with brands and prices to meet all needs but there are generally 3
most popular types of controller.
Simple 1 or 2 stage controls - these rely on transistors and relays for voltage control in one or two steps.
Ins its simplest form the controller will disconnect or short from the panel when a predetermined voltage
Cobalt Manganese Phosphate
Specific energy density (Wh/kg) 30–50 45–80 60–120 150–190 100–135 90–120Cycle life (80% discharge) 200–300 1000 300–500 500–1000 500–1000 1000–2000Fast charge time 8–16 h 1 h typical 2–4 h 2–4 h 1 h or less 1 h or lessOvercharge tolerance High Moderate LowSelf-discharge/month (room temp ) 5% 20% 30%Cell voltage (nominal) 2 V 1 2 V 1 2 V 3 6 V 3 8 V 3 3 V
2 4Float 2 25
Discharge cutoff voltage (V/cell, 1C) 1 75 2 8Peak load current 5C 20C 5C >3C >30C >30CBest result 0 2C 1C 0 5C >1C <10C <10CCharge temperature −20 to 50 °C
(−4 to 122 °F)3–6 months 30–60 days 60–90 days(topping charge) (discharge) (discharge)
Safety requirements Thermally stable
In use since Late 1800s 1950 1990 1991 1996 1999Toxicity Very high Very high Low
Thermally stable, fuse protection common Protection circuit mandatory
Low
(-4 to 49 °F) (-4 to 140 °F)Maintenance requirement Not required
1 2 50–3 00
0 to 45 °C 0 to 45 °C
Low<10%
Charge cutoff voltage (V/cell) Full charge detection by voltage signature
4 2 3 6
Specifications Lead acid NiCd NiMHLi-ion

12
is reached. While it is a very robust controller it is a very old technology and not recommended for home
solar systems.
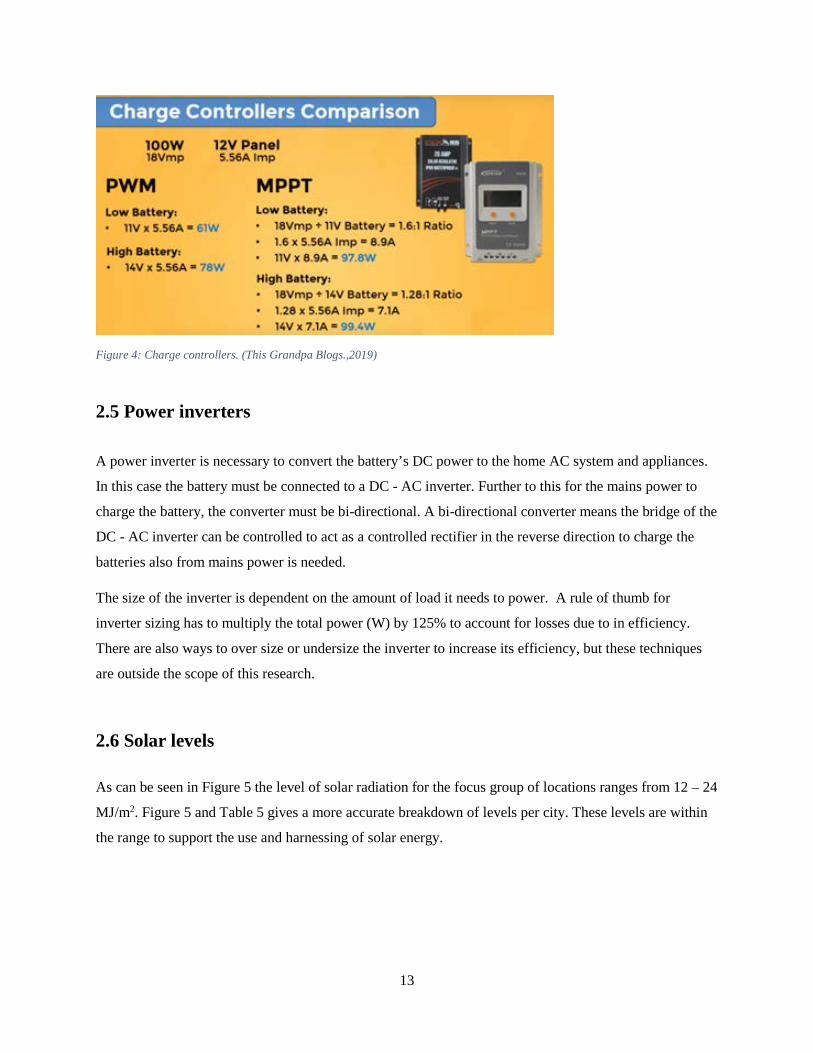
3-stage and/or PWM – Very popular to the point of nearly industry standard. Pulse Width Modulation
(PWM) is often used as one method of float charging. Rather than send a steady output from the
controller, it sends out a series of short charging pulses to the battery, like a very fast “on/off” switch. The
battery’s state of charge is constantly checking to determine how fast and at what width the charging
pulses need to be.
Maximum power point tracking (MPPT) – These are the most efficient of the charge controller with up
to 98% efficiency seen on some models (Nassereddine, M, Nagrial, M, Rizk, J & Hellany, A., 2019).
MPPT is digital tracking by the charge controller. It compares the output of the panels to the battery
voltage. It then calculates the highest power the panels can produce to charge the batteries. It then uses
this to convert it to the highest voltage to push the maximum amperage into the battery. Modern MPPT’s
are 93-97% efficient in this conversion and typical power gains in the Winter months are 20 – 45% and
10 – 15% in the Summer months.
MPPT's are most effective under these conditions:
Winter, and/or cloudy
• Cold weather - solar panels work better at cold temperatures, but without an MPPT you are losing
most of that. Cold weather is most likely in winter - the time when sun hours are low, and you
need the power to recharge batteries the most.
• Low battery charge - the lower the state of charge in your battery, the more current an MPPT puts
into them - another time when the extra power is needed the most. You can have both conditions
at the same time.
• Long wire runs - If you are charging a 12-volt battery, and your panels are 100 feet away, the
voltage drop and power loss can be considerable unless you use very large wire. That can be very
expensive, but if you have four 12-volt panels wired in series for 48 volts, the power loss is much
less, and the controller will convert that high voltage to 12 volts at the battery. That also means
that if you have a high voltage panel setup feeding the controller, you can use much smaller wire.
(Mohanty, P, Karnamadakala, RS, Gujar, M, Kolhe, M & Nazmin Azmi, A., 2015)
13
Figure 4: Charge controllers. (This Grandpa Blogs.,2019)
2.5 Power inverters
A power inverter is necessary to convert the battery’s DC power to the home AC system and appliances.
In this case the battery must be connected to a DC - AC inverter. Further to this for the mains power to
charge the battery, the converter must be bi-directional. A bi-directional converter means the bridge of the
DC - AC inverter can be controlled to act as a controlled rectifier in the reverse direction to charge the
batteries also from mains power is needed.
The size of the inverter is dependent on the amount of load it needs to power. A rule of thumb for
inverter sizing has to multiply the total power (W) by 125% to account for losses due to in efficiency.
There are also ways to over size or undersize the inverter to increase its efficiency, but these techniques
are outside the scope of this research.
2.6 Solar levels As can be seen in Figure 5 the level of solar radiation for the focus group of locations ranges from 12 – 24
MJ/m2. Figure 5 and Table 5 gives a more accurate breakdown of levels per city. These levels are within
the range to support the use and harnessing of solar energy.

14
Figure 5: Australian solar radiation levels (ABC News., 2019)
15
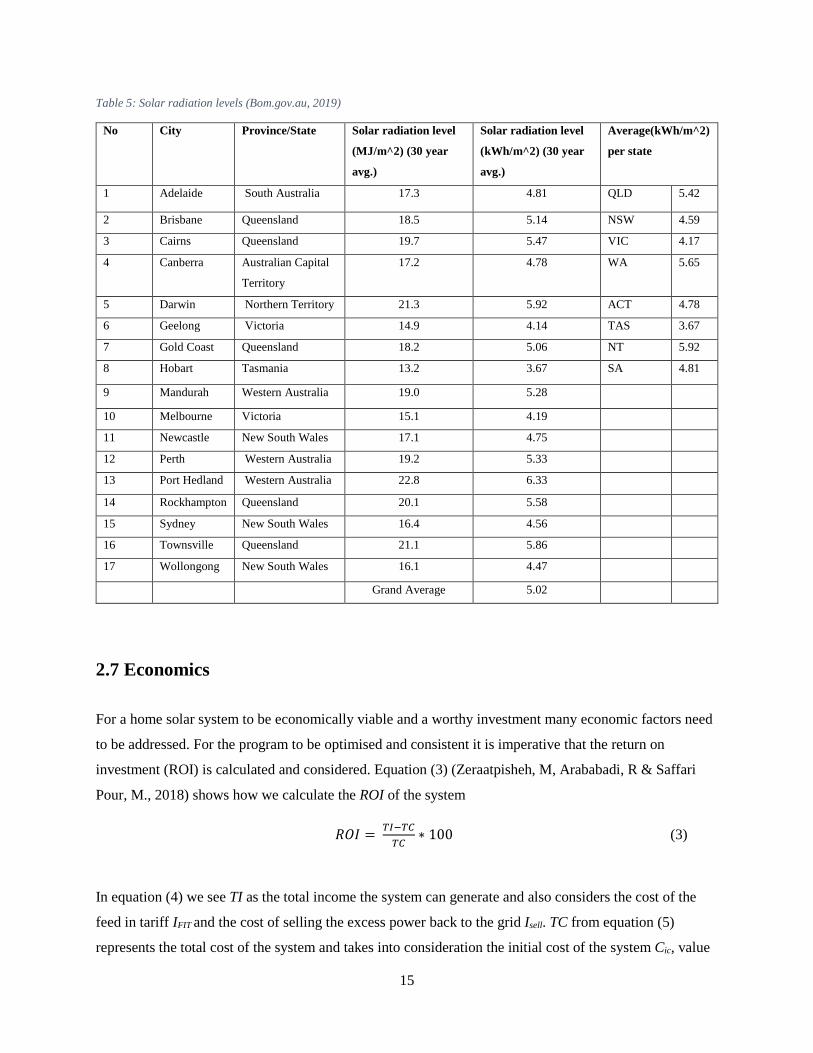
Table 5: Solar radiation levels (Bom.gov.au, 2019)
No City Province/State Solar radiation level
(MJ/m^2) (30 year
avg.)
Solar radiation level
(kWh/m^2) (30 year
avg.)
Average(kWh/m^2)
per state
1 Adelaide South Australia 17.3 4.81 QLD 5.42
2 Brisbane Queensland 18.5 5.14 NSW 4.59
3 Cairns Queensland 19.7 5.47 VIC 4.17
4 Canberra Australian Capital
Territory
17.2 4.78 WA 5.65
5 Darwin Northern Territory 21.3 5.92 ACT 4.78
6 Geelong Victoria 14.9 4.14 TAS 3.67
7 Gold Coast Queensland 18.2 5.06 NT 5.92
8 Hobart Tasmania 13.2 3.67 SA 4.81
9 Mandurah Western Australia 19.0 5.28
10 Melbourne Victoria 15.1 4.19
11 Newcastle New South Wales 17.1 4.75
12 Perth Western Australia 19.2 5.33
13 Port Hedland Western Australia 22.8 6.33
14 Rockhampton Queensland 20.1 5.58
15 Sydney New South Wales 16.4 4.56
16 Townsville Queensland 21.1 5.86
17 Wollongong New South Wales 16.1 4.47
Grand Average 5.02
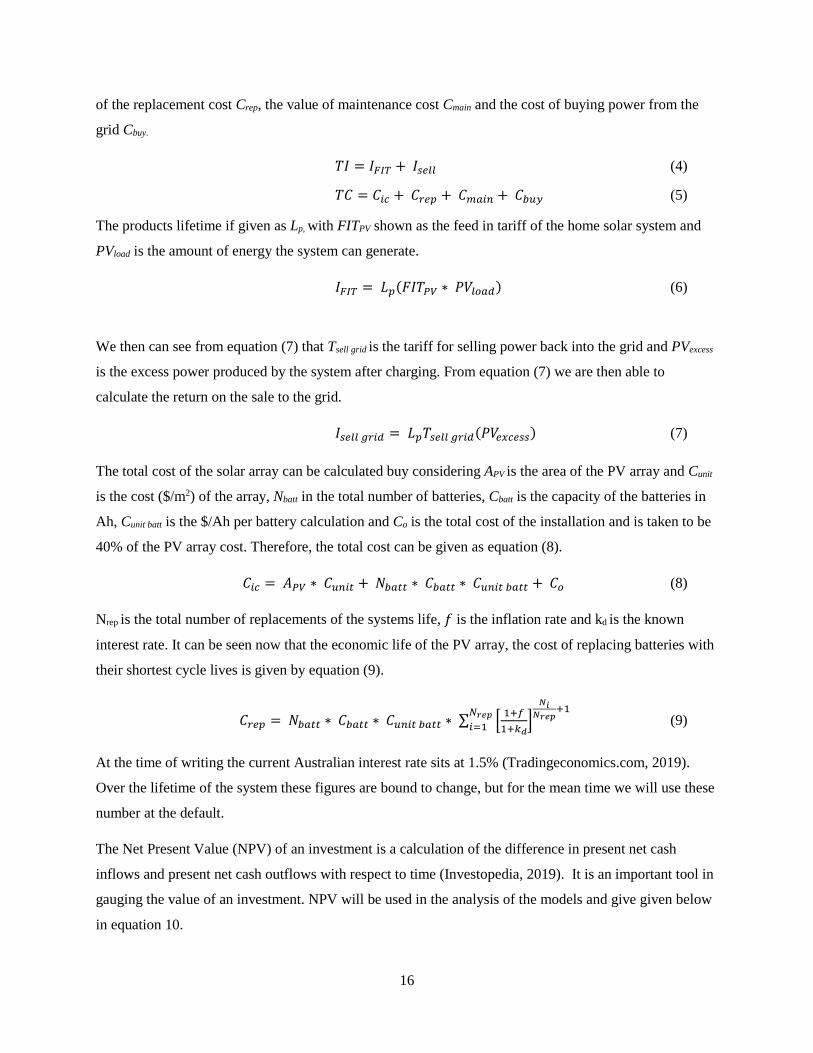
2.7 Economics
For a home solar system to be economically viable and a worthy investment many economic factors need
to be addressed. For the program to be optimised and consistent it is imperative that the return on
investment (ROI) is calculated and considered. Equation (3) (Zeraatpisheh, M, Arababadi, R & Saffari
Pour, M., 2018) shows how we calculate the ROI of the system
𝑅𝑅𝑅𝑅𝑅𝑅 = 𝑆𝑆𝑇𝑇−𝑆𝑆𝑇𝑇𝑆𝑆𝑇𝑇
∗ 100 (3)
In equation (4) we see TI as the total income the system can generate and also considers the cost of the
feed in tariff IFIT and the cost of selling the excess power back to the grid Isell. TC from equation (5)
represents the total cost of the system and takes into consideration the initial cost of the system Cic, value
16
of the replacement cost Crep, the value of maintenance cost Cmain and the cost of buying power from the
grid Cbuy.
𝑇𝑇𝑅𝑅 = 𝑅𝑅𝐹𝐹𝑇𝑇𝑆𝑆 + 𝑅𝑅𝑠𝑠𝑡𝑡𝑡𝑡𝑡𝑡 (4)
𝑇𝑇𝑇𝑇 = 𝑇𝑇𝑑𝑑𝑠𝑠 + 𝑇𝑇𝑑𝑑𝑡𝑡𝑡𝑡 + 𝑇𝑇𝑚𝑚𝑚𝑚𝑑𝑑𝑚𝑚 + 𝑇𝑇𝑏𝑏𝑏𝑏𝑏𝑏 (5)
The products lifetime if given as Lp, with FITPV shown as the feed in tariff of the home solar system and
PVload is the amount of energy the system can generate.
𝑅𝑅𝐹𝐹𝑇𝑇𝑆𝑆 = 𝐿𝐿𝑡𝑡(𝐹𝐹𝑅𝑅𝑇𝑇𝑃𝑃𝑃𝑃 ∗ 𝑃𝑃𝑃𝑃𝑡𝑡𝑡𝑡𝑚𝑚𝑑𝑑) (6)
We then can see from equation (7) that Tsell grid is the tariff for selling power back into the grid and PVexcess
is the excess power produced by the system after charging. From equation (7) we are then able to
calculate the return on the sale to the grid.
𝑅𝑅𝑠𝑠𝑡𝑡𝑡𝑡𝑡𝑡 𝑔𝑔𝑑𝑑𝑑𝑑𝑑𝑑 = 𝐿𝐿𝑡𝑡𝑇𝑇𝑠𝑠𝑡𝑡𝑡𝑡𝑡𝑡 𝑔𝑔𝑑𝑑𝑑𝑑𝑑𝑑(𝑃𝑃𝑃𝑃𝑡𝑡𝑒𝑒𝑠𝑠𝑡𝑡𝑠𝑠𝑠𝑠) (7)
The total cost of the solar array can be calculated buy considering APV is the area of the PV array and Cunit
is the cost ($/m2) of the array, Nbatt in the total number of batteries, Cbatt is the capacity of the batteries in
Ah, Cunit batt is the $/Ah per battery calculation and Co is the total cost of the installation and is taken to be
40% of the PV array cost. Therefore, the total cost can be given as equation (8).
𝑇𝑇𝑑𝑑𝑠𝑠 = 𝐴𝐴𝑃𝑃𝑃𝑃 ∗ 𝑇𝑇𝑏𝑏𝑚𝑚𝑑𝑑𝑡𝑡 + 𝑁𝑁𝑏𝑏𝑚𝑚𝑡𝑡𝑡𝑡 ∗ 𝑇𝑇𝑏𝑏𝑚𝑚𝑡𝑡𝑡𝑡 ∗ 𝑇𝑇𝑏𝑏𝑚𝑚𝑑𝑑𝑡𝑡 𝑏𝑏𝑚𝑚𝑡𝑡𝑡𝑡 + 𝑇𝑇𝑡𝑡 (8)
Nrep is the total number of replacements of the systems life, 𝑓𝑓 is the inflation rate and kd is the known
interest rate. It can be seen now that the economic life of the PV array, the cost of replacing batteries with
their shortest cycle lives is given by equation (9).
𝑇𝑇𝑑𝑑𝑡𝑡𝑡𝑡 = 𝑁𝑁𝑏𝑏𝑚𝑚𝑡𝑡𝑡𝑡 ∗ 𝑇𝑇𝑏𝑏𝑚𝑚𝑡𝑡𝑡𝑡 ∗ 𝑇𝑇𝑏𝑏𝑚𝑚𝑑𝑑𝑡𝑡 𝑏𝑏𝑚𝑚𝑡𝑡𝑡𝑡 ∗ ∑ � 1+𝑓𝑓1+𝑘𝑘𝑑𝑑
�𝑁𝑁𝑖𝑖
𝑁𝑁𝑟𝑟𝑒𝑒𝑟𝑟+1𝑁𝑁𝑟𝑟𝑒𝑒𝑟𝑟
𝑑𝑑=1 (9)
At the time of writing the current Australian interest rate sits at 1.5% (Tradingeconomics.com, 2019).
Over the lifetime of the system these figures are bound to change, but for the mean time we will use these
number at the default.
The Net Present Value (NPV) of an investment is a calculation of the difference in present net cash
inflows and present net cash outflows with respect to time (Investopedia, 2019). It is an important tool in
gauging the value of an investment. NPV will be used in the analysis of the models and give given below
in equation 10.

17
𝑁𝑁𝑃𝑃𝑃𝑃 = ∑ 𝑠𝑠𝑡𝑡(1+𝑑𝑑)𝑡𝑡
𝑆𝑆=1𝑡𝑡 𝑇𝑇0 (10)
The equation defines T as the time period, Ct as the net cash flow at time T, C0 as the total investment and
r as the discount rate applied (rate earned by alternative investment). A high NVP is desirable as it
represents a high future value of the investment.
The Internal Rate of Return is another important factor of economic optimisation. In its simplest form it is
the rate of return that brings the NPV to equal zero. It relies on the same formula as NPV.
𝑅𝑅𝑅𝑅𝑅𝑅 = 𝑁𝑁𝑃𝑃𝑃𝑃 = ∑ 𝑠𝑠𝑡𝑡(1+𝑑𝑑)𝑡𝑡
𝑆𝑆=1𝑡𝑡 𝑇𝑇0 = 0 (11)
A high IRR is the desirable quantity for this calculation.
The Levelled Cost of Electricity (LCOE) is the final calculation used in the optimisation process. The
LCOE calculates the cost of electricity produced by the system over its lifetime (25 years) by total costs
of the system by the total amount of energy produced.
𝐿𝐿𝑇𝑇𝑅𝑅𝐸𝐸 = ∑ (𝑇𝑇𝑖𝑖𝑖𝑖𝑖𝑖∗𝑇𝑇𝐶𝐶𝐹𝐹+(𝑀𝑀 & 𝑂𝑂)−𝑆𝑆𝑡𝑡𝑡𝑡𝑖𝑖𝑡𝑡=1
∑ 𝑘𝑘𝑘𝑘ℎ 𝑡𝑡𝑡𝑡𝑑𝑑 𝑏𝑏𝑡𝑡𝑚𝑚𝑑𝑑𝑖𝑖𝑡𝑡=1
(12)
T is defined as time (25 years), Iinv is the initial investment, CRF is the capital recovery factor, M&O the
maintenance and operations costs and Dep is the depreciated value. A LCOE equal to or less than the
price of grid supplied energy is desirable.
The grid supplied electricity has many providers offering many differing deal and pricing schemes.
Origin Energy is the largest supplier (4.2 Million) of residential energy and therefore the pricing tariffs
will be based off their current prices and averaged where necessary. Origin Energy does not service the
Northern Territory so for this case we will use Jacana Energy as the supplier.
18
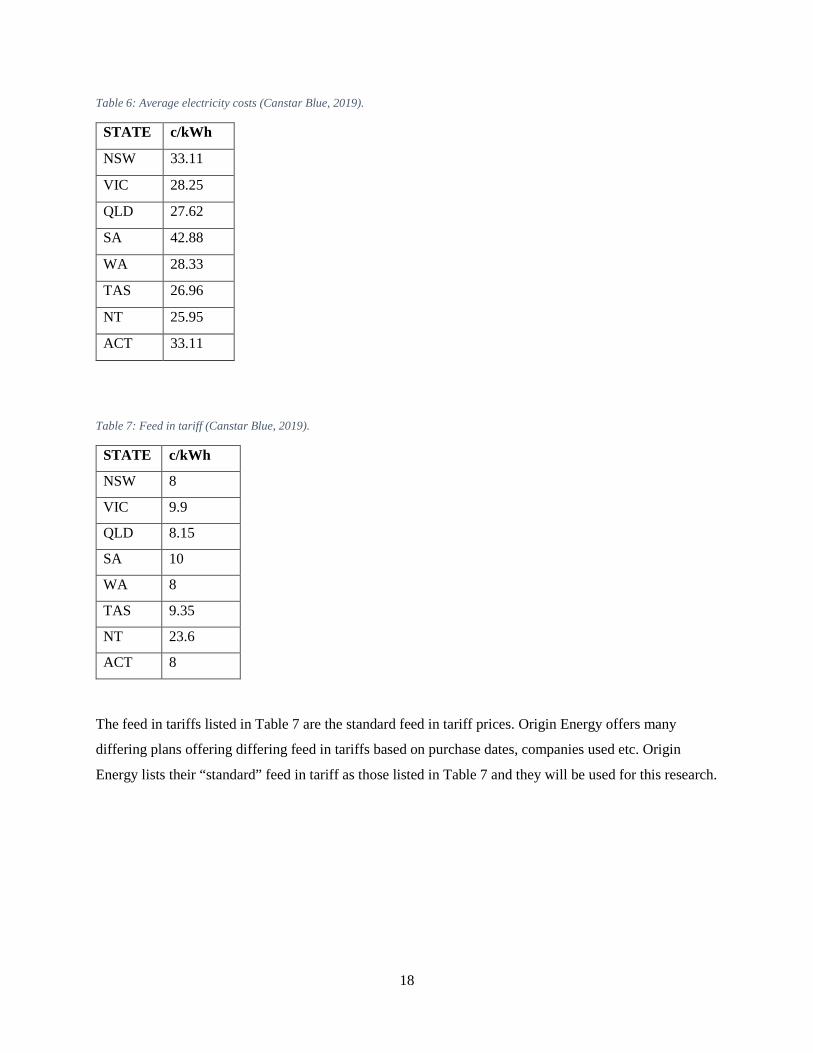
Table 6: Average electricity costs (Canstar Blue, 2019).
STATE c/kWh
NSW 33.11
VIC 28.25
QLD 27.62
SA 42.88
WA 28.33
TAS 26.96
NT 25.95
ACT 33.11
Table 7: Feed in tariff (Canstar Blue, 2019).
STATE c/kWh
NSW 8
VIC 9.9
QLD 8.15
SA 10
WA 8
TAS 9.35
NT 23.6
ACT 8
The feed in tariffs listed in Table 7 are the standard feed in tariff prices. Origin Energy offers many
differing plans offering differing feed in tariffs based on purchase dates, companies used etc. Origin
Energy lists their “standard” feed in tariff as those listed in Table 7 and they will be used for this research.

19
Chapter 3 Methodology
3.1 Outline of Methodology
3.2 Modelling locations
17 locations have been chosen to give a wide selection of variance in solar radiation levels and climates.
All of the chosen sites lie on the coasts of Australia and close to large population sites. This has been
done for an increased level of data available in larger cities and towns. These sites also have their own
unique characteristics as seen in Table 8.
Part 11A Resources check1B Literature review1C Collect load data1D Collect data for batteries1E Collect data for PV panelsPart 22A State analysis2B City and town choice2C Climate analysisPart 33A Small house profile3B Medium house profile3C Large house profile3D Loads by State3E Loads and production by State and house sizePart 44A Data gathering for heating/cooling4B Data gathering for appliances4C Data gathering for water heating and other appliances4D Data gathering for cooking/lighting4E Data gathering for PV panel/batteriesPart55A Prepare table of results and implicationsPart 66A Develop software package of recommendation of ideal systemPart 77A Disertaion draft for feedback7B ENG4902 Proffesional Pracitce 27C Final dissertaion and submission
Package Development
Write up/Disseratation
Conclusions
Start Up Phase
Location Modelling
Load Profile Modelling
Data Collection and Analysis

20
Table 8: Location data (Power.larc.nasa.gov, 2019)
Queensland
Brisbane: Sub-tropical warm, humid climate with an average of less than 4 days without sun per month.
Cairns: Tropical, humid hot climate with the highest number of rain days per month.
Townsville: Tropical warm climate with monsoon type rain season from December through to April.
Rockhampton: Sub-tropical and located on the Tropic of Capricorn with low levels of rain and high temperatures.
Climate data from 1999 - 2017 BOM and NASA
Adelaide Jan Feb Mar Apr May Jun Jul Aug Sept Oct Nov Dec Avg Darwin Jan Feb Mar Apr May Jun Jul Aug Sept Oct Nov Dec AvgRain days 4.7 3.6 5.9 8.1 12.5 15 16 16 14 10 8.1 7.1 10.1 Rain days 21 20.4 20 9.3 2.2 0.6 0.4 0.6 2.3 7 12.4 16.9 9.42Temp max 30.3 30.3 27.2 23 18.5 15 14 15 18 21 25.3 27.7 22.1 Temp max 30 29.4 30 30 29.7 29 29 30.3 32 33 32 30.7 30.4Temp min 15.1 15.5 13.8 11 9 6.8 5.9 6 7.3 8.8 11.4 13.3 10.3 Temp min 27 27.2 27 26 24.2 22 22 23.1 25.5 27 28 27.8 25.6No Sun days 2.3 3.15 5.09 3.7 3.48 1.9 3.5 3.2 4 3.2 2.18 4.93 3.39 No Sun days 6.2 6.88 6.9 5 5.38 1.1 3.3 1.35 1.59 2 3.33 6.75 4.14Sunsine hours 326 285 267 219 167 138 149 186 204 257 273 295 230 Sunsine hours 177 162 211 261 298 297 313 319 297 291 252 214 258
Brisbane Jan Feb Mar Apr May Jun Jul Aug Sept Oct Nov Dec Avg Geelong Jan Feb Mar Apr May Jun Jul Aug Sept Oct Nov Dec AvgRain days 12.2 13.3 14.2 12 9.5 9.7 7.3 6 7.8 8.7 11.3 13.3 10.4 Rain days 7 5.8 8.2 12 13 16 17 16.7 16 14 10.3 9 12Temp max 27.5 27.1 26.1 24 22.1 20 19 20 23 24 25.5 26.9 23.8 Temp max 23 23.6 22 19 15.8 13 12 13.1 14.7 17 19.2 21.3 17.9Temp min 22.8 22.8 21.8 20 17.5 15 14 14 16 18 20 21.6 18.7 Temp min 14 14.8 14 12 10.3 8.5 7.5 7.49 8.3 9.4 11.2 12.5 10.8No Sun days 3.68 6.65 6.23 5.9 5.58 5.3 6.4 5.3 3.7 3.7 4.47 3.49 5.04 No Sun days 1.9 4 3.5 4.5 6.9 3.8 4 4.04 3.69 3.7 3.11 4.99 4.01Sunsine hours 264 223 233 234 236 198 239 267 270 276 270 260 247 Sunsine hours 267 229 223 186 143 120 136 164 183 223 225 264 197
Cairns Jan Feb Mar Apr May Jun Jul Aug Sept Oct Nov Dec Avg Gold Coast Jan Feb Mar Apr May Jun Jul Aug Sept Oct Nov Dec AvgRain days 18.1 18.4 18.4 19 14 9.1 8.8 8.2 7.1 8.1 11.8 14.1 12.9 Rain days 14 14.6 15 12 11.6 11 8.3 7.2 8.8 9.5 12 12.7 11.4Temp max 28.1 27.4 26.3 25 23.4 22 22 23 25 28 28.7 29.1 25.6 Temp max 28 27.7 27 25 22.1 20 19 20.3 23.1 25 26.3 27.7 24.2Temp min 22.6 22.7 21.8 20 18.6 16 16 16 18 19 21 22.1 19.5 Temp min 22 22 21 19 16.1 14 12 12.7 14.9 17 19.1 20.8 17.5No Sun days 6.88 7.15 4.72 6.3 3.86 4.5 4.1 7.8 3.3 5 5.52 5.84 5.41 No Sun days 3.7 6.65 6.2 5.9 5.58 5.3 6.4 5.33 3.7 3.7 4.47 3.49 5.04Sunsine hours 211 174 202 204 211 216 229 251 261 273 255 233 227 Sunsine hours 264 223 233 234 236 198 239 267 270 276 270 260 247
Canberra Jan Feb Mar Apr May Jun Jul Aug Sept Oct Nov Dec Avg Hobart Jan Feb Mar Apr May Jun Jul Aug Sept Oct Nov Dec AvgRain days 7.3 6.7 6.9 7.3 8.4 9.8 11 11 10 10 9.8 7.7 8.84 Rain days 10 8.6 11 11 11.5 12 14 14.1 15.5 15 12.6 12.1 12.3Temp max 27.9 26.7 23.8 19 14.7 11 9.9 11 15 18 21.8 25.1 18.7 Temp max 21 20.8 19 16 12.5 10 9.5 10.3 12 14 16.4 18.4 14.9Temp min 12.9 13 10.9 7.9 4.85 2.6 1.4 1.6 3.6 5.7 8.87 10.9 7.02 Temp min 9.4 9.62 8.8 7 5.52 3.9 3.3 3.34 3.96 5.1 6.7 8.07 6.23No Sun days 5.04 4.68 6.95 5.7 4.2 5.1 3.9 3.8 3.7 3.8 5.11 5.47 4.77 No Sun days 3.6 3.54 5.6 5.8 3.76 5.1 4.9 4.55 2.62 3.3 3.72 6.01 4.37Sunsine hours 295 254 251 219 186 156 180 217 231 267 267 291 234 Sunsine hours 257 226 211 177 149 132 152 180 195 233 234 248 199
Mandurah Jan Feb Mar Apr May Jun Jul Aug Sept Oct Nov Dec Avg Port Hedland Jan Feb Mar Apr May Jun Jul Aug Sept Oct Nov Dec AvgRain days 2.9 2.2 4.5 6.8 11.3 14 17 16 15 9.2 5.6 3.5 9.04 Rain days 5.1 7.1 4.4 1.9 3.3 3.1 2.1 1.2 0.9 0.8 0.6 1.8 2.69Temp max 28 28.5 26.8 24 20.7 18 17 17 18 20 23 25.7 22.1 Temp max 35 34.1 34 33 29.5 27 26 27.3 29.7 33 34 34.6 31.4Temp min 18.6 19.2 18.2 17 14.8 13 12 12 12 13 14.9 16.9 15.1 Temp min 28 27.6 27 25 20.8 18 16 17.2 19.7 23 25 26.6 22.8No Sun days 3.55 3.33 2.52 2.2 5.06 2.7 2.4 4.1 3 3.5 3.84 2.04 3.18 No Sun days 5.2 3.53 4.8 2.7 5.07 4.4 5.8 3.3 3.33 3.1 3.8 3.49 4.04Sunsine hours 357 308 298 249 207 177 183 216 231 288 318 345 265 Sunsine hours 211 174 202 204 211 216 229 251 261 273 255 233 227
Melbourne Jan Feb Mar Apr May Jun Jul Aug Sept Oct Nov Dec Avg Rockhampton Jan Feb Mar Apr May Jun Jul Aug Sept Oct Nov Dec AvgRain days 8.7 6.6 9.3 11 12.2 14 14 15 14 13 11.3 10 11.6 Rain days 11 12.3 10 6.6 6.2 5 5.2 4.3 4.1 6.5 7.8 9.8 7.43Temp max 26.3 26.5 24 20 15.9 13 12 13 15 18 21.2 23.9 19 Temp max 31 29.9 29 27 24.7 22 22 23.2 26 28 29.2 30.3 26.8Temp min 13.1 13.5 12.5 9.9 7.9 6 5 5.2 6.2 7.6 9.76 11.3 8.99 Temp min 24 23.8 23 21 17.8 15 14 14.6 16.9 20 21.4 23.1 19.4No Sun days 2.97 3.69 4.71 3.9 6.46 4.2 4.5 3.2 3.5 4 4.2 6.47 4.32 No Sun days 5.4 7.1 5.8 7.6 5.07 3.2 4.8 5.27 6.54 3.3 5.91 4.65 5.39Sunsine hours 267 229 223 186 143 120 136 164 183 223 225 264 197 Sunsine hours 211 174 202 204 211 216 229 251 261 273 255 233 227
Newcastle Jan Feb Mar Apr May Jun Jul Aug Sept Oct Nov Dec Sydney Jan Feb Mar Apr May Jun Jul Aug Sept Oct Nov Dec AvgRain days 3.08 4.51 3.45 3.4 3 3.2 2.2 1.9 1.9 2.2 3.46 2.69 2.91 Rain days 12 12.9 13 11 12.2 11 10 8.4 8.8 11 12.7 11.2 11.2Temp max 28.2 27.1 25.2 23 19.3 17 16 17 20 23 24.7 26.8 22.2 Temp max 27 25.8 24 22 19.1 16 16 17 19.5 22 23.3 25.3 21.4Temp min 19.2 19.2 17.8 15 12.7 10 9.1 9.4 12 14 15.8 17.7 14.3 Temp min 19 19.6 18 16 13.5 11 9.8 10.1 12 14 16 17.8 14.8No Sun days 7.4 6.05 7.16 10 4.54 4.4 5.6 6.3 5.1 3.9 5 3.7 5.77 No Sun days 6.6 5.83 7.8 9.8 3.55 3.9 5.1 6.09 4.83 4.1 5.38 3.8 5.57Sunsine hours 236 202 214 207 195 177 205 245 237 245 228 245 220 Sunsine hours 236 202 214 207 195 177 205 245 237 245 228 245 220
Perth Jan Feb Mar Apr May Jun Jul Aug Sept Oct Nov Dec Avg Townsville Jan Feb Mar Apr May Jun Jul Aug Sept Oct Nov Dec AvgRain days 2.9 2.2 4.5 6.8 11.3 14 17 16 15 9.2 5.6 3.5 9.04 Rain days 12 12.6 9.7 5.3 3.6 2.4 1.9 1.5 1.3 2.9 4.9 7.3 5.42Temp max 29.5 30 28.1 25 21.5 19 17 17 18 21 24.4 27.1 23.1 Temp max 30 29.8 29 28 26.2 24 24 25 27.3 29 30 30.8 27.8Temp min 18.8 19.5 18.3 16 14.3 13 11 11 12 13 15 17.1 15 Temp min 25 24.7 24 22 19.5 17 16 17 19.3 22 23.2 24.4 21.1No Sun days 3.04 3.45 2.98 3 4.8 3.6 3 3.7 2.5 3.8 2.94 1.96 3.24 No Sun days 9.5 7.16 4.1 6.8 3.53 4.8 4.3 6.59 4.75 4 7.34 6.34 5.76Sunsine hours 345 330 288 249 207 177 183 216 231 288 318 345 265 Sunsine hours 240 222 225 237 225 234 252 273 288 294 285 270 254
Wollongong Jan Feb Mar Apr May Jun Jul Aug Sept Oct Nov Dec AvgRain days 13.8 13.7 14.5 11 10.8 9.7 8.5 7.8 9.3 11 13.6 13 11.4Temp max 27.6 26.2 24.1 21 17.7 15 14 15 18 21 23.3 25.8 20.8Temp min 16.9 17 15.4 13 10.1 7.8 6.5 6.8 8.9 11 13.3 15.2 11.8No Sun days 6.41 5.01 7.63 9.4 4.42 4.7 5 5.7 4.2 5 7.01 5.31 5.8 Sunsine hours 236 202 214 207 195 177 205 245 237 245 228 245 220

21
Gold Coast: Sub-tropical humid climate warmer than average winters and hot summers with frequent storms.
New South Wales
Newcastle: Humid sub-tropical climate prone to strong Westerly winds and heavy rains in the colder months.
Sydney: Warm sub-tropical with cool to cold winters and hot summer months. Stable climate with no extreme weather changes between the seasons
Wollongong: Oceanic climate with sub-tropical influences prone to windy winter months.
Australian Capital Territory
Canberra: Oceanic climate with the warmest months at the beginning of the year and frosts common through the winter.
Victoria
Melbourne: Oceanic climate with changeable weather conditions throughout the year due to its location. Prone to cold winter months with high winds and storm fronts.
Geelong: Stable climate with 4 distinct seasons. It is classed as a temperate oceanic climate with cool winters and warm summers.
Tasmania
Hobart: Mild temperate oceanic climate. Of the cities observed Hobart has the lowest hours of sunlight through the winter months but the highest number of sunlight hours through the summer.
South Australia
Adelaide: Mediterranean climate. Cool to cold winters and warm dry summers. Experiences days of extreme temperatures.
Western Australia
Mandurah/Rockingham: Mediterranean climate with dry hot summers and cool wet winters. Is susceptible to days of extreme heat.
Perth: Perth is classed as a hot summer Mediterranean climate experiencing hot dry summers and cool, wet but mild winters.
Port Hedland: Port Hedland experiences a semi-arid climate with a tropical savanna influence meaning a very hot and very dry climate experiencing just over 300mm of rain per annum.
Northern Territory
Darwin: Darwin is classed as a tropical savanna climate with a distinct wet and dry season.
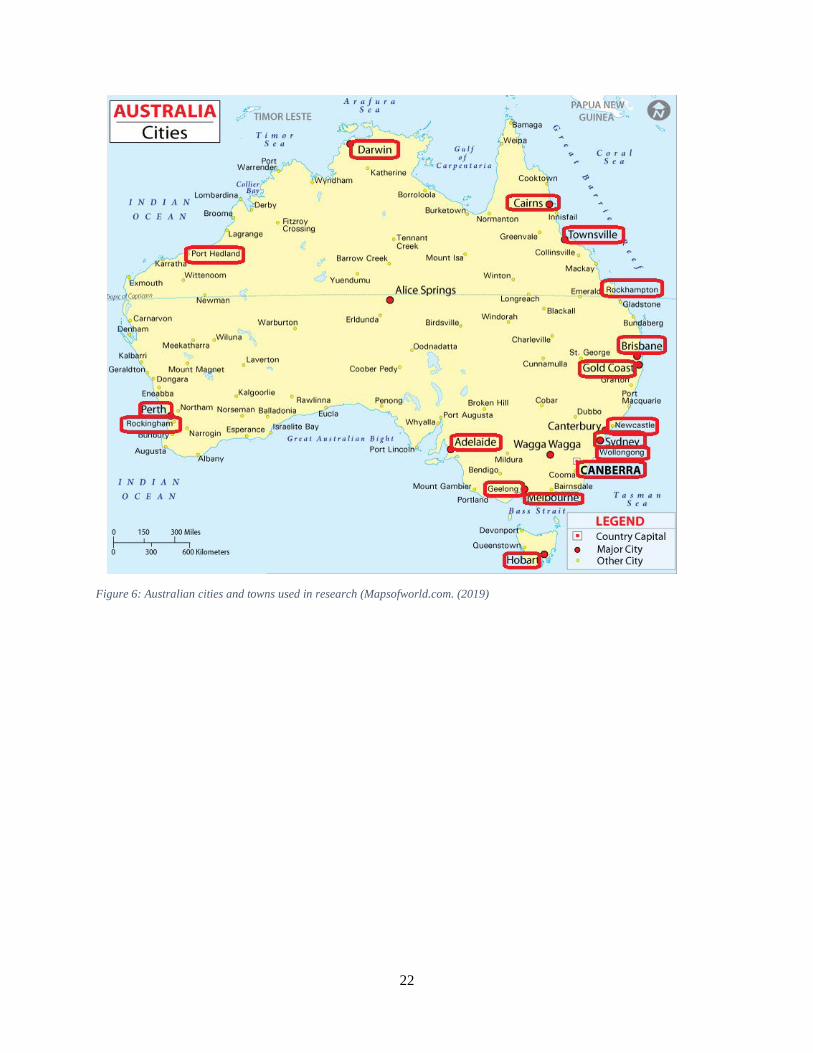
22
Figure 6: Australian cities and towns used in research (Mapsofworld.com. (2019)

23
Chapter 4 Testing and Evaluation
4.1 Preliminary testing
For the setting up of the tests for this program development many factors need to be considered. What this
section will do is define the data that will be used in the program. Firstly, the size of the homes will be
assessed, followed by the available sizes of systems for the home sizes. Once these are completed load
considerations i.e. actual appliances data will be acquired, battery type and cost and finally panel type and
cost will all be collected and used in building the database for the program.
4.2 Residential home size data gathering
Figure 7: Australian weekly energy use by household size (Aemc.gov.au, 2019).
Table 8: Energy Australia average usage figures (Energy Australia, 2019)
88.4
146.0 143.6126.0
180.0
20.040.060.080.0
100.0120.0140.0160.0
Small Medium Large Average Per Day
kWh
DWELLING TYPE
Weekly Electricity Usage
Household size without swimming pool
Average daily consumption benchmark (kWh)
1 person 12.302 people 15.403 people 18.404 people 21.505 people 24.506 people 27.60

24
The data acquired from the Australian Energy Market Commission in Figure 7 shows that the average
daily usage for a small house hold with 1 to 2 people is 12.6 kWh. Whereas the data from Energy
Australia gives the average of 1 to 2 people as 13.85 kWh. Further to this data acquired from the
Australian Energy Market Commission is seen below in Table 9 gives roughly the same figures lending to
the accuracy of the data.
Table 9: AEMC residential power by state. (AEMC, 2019)
State Persons per household
kWh kWh per day
Queensland 1/hh 4030 11.04 2/hh 5331 14.61 3/hh 6633 18.17 4/hh 7934 21.74 New South Wales 1/hh 4422 12.12 2/hh 5548 15.20 3/hh 6673 18.28 4/hh 7799 21.37 Australian Capital Territory
1/hh 5939 16.27
2/hh 7219 19.78 3/hh 8500 23.29 4/hh 9780 26.79 Victoria 1/hh 4028 11.04 2/hh 4835 13.25 3/hh 5642 15.46 4/hh 6449 17.67 South Australia 1/hh 4398 12.05 2/hh 5306 14.54 3/hh 6213 17.02 4/hh 7121 19.51 Tasmania 1/hh 6862 18.80 2/hh 8733 23.93 3/hh 10064 27.57 4/hh 12475 34.18 Western Australia 1/hh 4107 11.25 2/hh 5140 14.08 3/hh 6173 16.91 4/hh 7206 19.74 Northern Territory 1/hh 6266 17.17 2/hh 7806 21.39 3/hh 9345 25.60 4/hh 10885 29.82
Using these data sets we can then deduce an accurate usage of each type of dwelling. By taking the data
from every state, household type and per person usage we come up with the values displayed in Table 10.
25
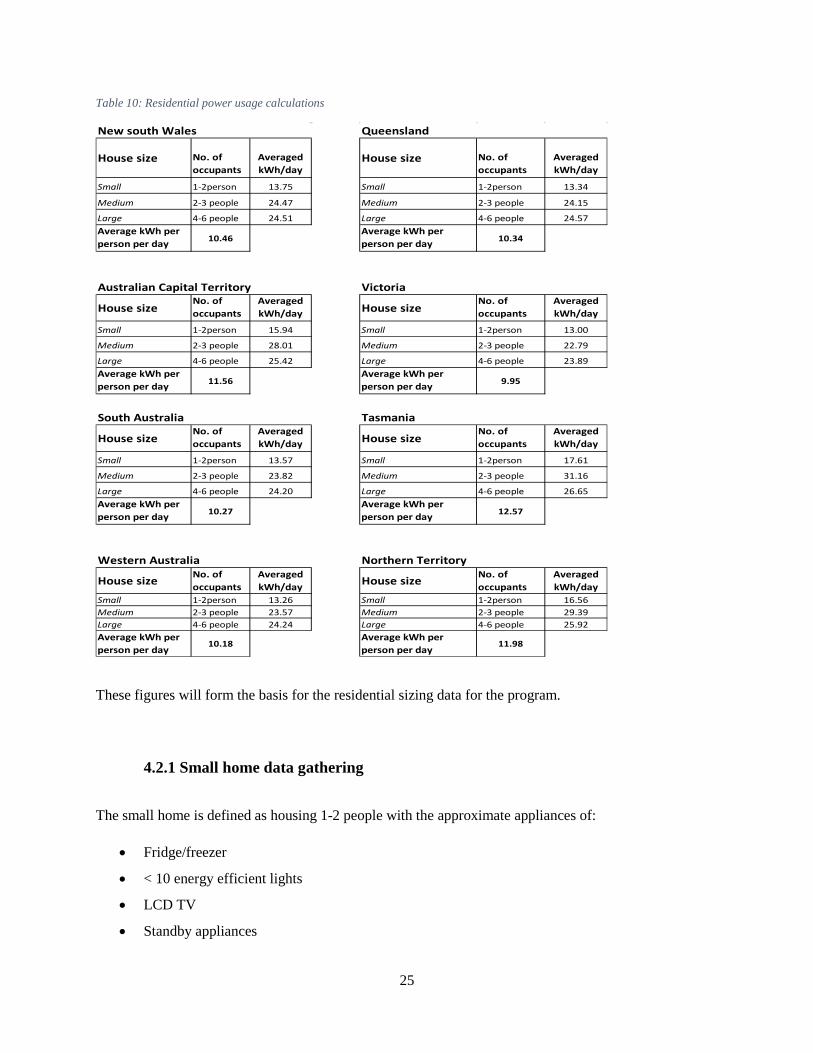
Table 10: Residential power usage calculations
These figures will form the basis for the residential sizing data for the program.
4.2.1 Small home data gathering
The small home is defined as housing 1-2 people with the approximate appliances of:
• Fridge/freezer
• < 10 energy efficient lights
• LCD TV
• Standby appliances
New south Wales Queensland
House size No. of occupants
Averaged kWh/day
House size No. of occupants
Averaged kWh/day
Small 1-2person 13.75 Small 1-2person 13.34
Medium 2-3 people 24.47 Medium 2-3 people 24.15
Large 4-6 people 24.51 Large 4-6 people 24.57Average kWh per person per day 10.46
Average kWh per person per day 10.34
Australian Capital Territory Victoria
House sizeNo. of occupants
Averaged kWh/day House size
No. of occupants
Averaged kWh/day
Small 1-2person 15.94 Small 1-2person 13.00
Medium 2-3 people 28.01 Medium 2-3 people 22.79
Large 4-6 people 25.42 Large 4-6 people 23.89Average kWh per person per day 11.56
Average kWh per person per day 9.95
South Australia Tasmania
House sizeNo. of occupants
Averaged kWh/day House size
No. of occupants
Averaged kWh/day
Small 1-2person 13.57 Small 1-2person 17.61
Medium 2-3 people 23.82 Medium 2-3 people 31.16
Large 4-6 people 24.20 Large 4-6 people 26.65Average kWh per person per day 10.27
Average kWh per person per day 12.57
Western Australia Northern Territory
House size No. of occupants
Averaged kWh/day House size No. of
occupantsAveraged kWh/day
Small 1-2person 13.26 Small 1-2person 16.56Medium 2-3 people 23.57 Medium 2-3 people 29.39Large 4-6 people 24.24 Large 4-6 people 25.92Average kWh per person per day
10.18Average kWh per person per day
11.98

26
• Washing machine (1 load per week)
• Dishwasher (2 loads per week)
• 2 Laptops
• 1 Air conditioner
(Energy Matters, 2019)
4.2.2 Medium home data gathering
The medium home is defined as housing 2-4 people with the approximate appliances of:
• Fridge/freezer
• 10 - 20 downlights
• LCD TV
• Standby appliances
• Washing machine (3 - 5 loads per week)
• Dishwasher (up to 5 loads per week)
• 3 laptops
• 3 Air conditioners
(Energy Matters, 2019)

27
4.2.3 Large home data gathering
The large home is defined as housing 4-6 people with the approximate appliances of:
• 2 Fridge/freezer
• 20+ Halogen lights
• Multiple LCD TVs
• Standby appliances
• Washing machine (5+ loads per week)
• Dishwasher (5+ loads per week)
• Clothes drier (5+ loads per week)
• 4+ laptops
• 4+ Air conditioners
• Pool pump
(Energy Matters, 2019)
4.2.4 Roof space calculations
To calculation the size of a dwellings is somewhat difficult as this dimension is seldom mentioned in
house data. The floor space is usually given in square meters and is usually known by the house owner or
is easy to find out. For this research we will be using floor space data as an approximation of roof space
as the two figures should be relative to each other.
Table 11: Floor size (m2) of Australian households (Commbank.com.au, 2019)
STATE House Apartment
NSW 230 129.5
VIC 242.8 131
QLD 227.3 125.5
SA 214.3 152.3
WA 242.5 123
TAS 195.5 129.8
NT 203 154.5
ACT 197 95.8

28
As a guide, and will be seen in the coming sections, residential PV panels have a relatively uniform shape
and size with average dimensions of 3 feet (0.914m) by 5 feet (1.524m) or 15 square feet (1.393m2) total.
So, a simple calculation of dividing the known square meterage of the floor size by 1.393 will give a good
estimation of the number of panels that can fit on the roof space.
It should be noted that Google earth has a side project called Project Sunroof that is dedicated to this
function, using GPS and 3D modelling they are able to tell you the size of your roof from your address. It
is also of note that this function is limited to the USA at the time of writing.
Figure 8: Example of Project Sunroof (Google.com, 2019)
The weight of the solar installation is another relevant factor of a home solar system. Available weights
will be used and displayed in the program.
Table 12: Example weights of PV panels. (Matasci, S., 2019)
Solar panel Brand Weight (kgs)
SolarWorld 18 - 21
LG 17
Canadian Solar 18 - 23
Hyundai 17 - 19
Hanwha SolarOne 18 - 19
Hanwha Q CELLS 19

29
Trina 19 - 23
SunPower 15 - 19
Axitec 18 - 19
Kyocera 20 - 21
The calculation of structural stability of the roof structure is outside of the scope of this project.
4.3 Modelling appliance loads
The electricity use of the average home is based greatly on the number of occupants living in the dwelling
but also the number and type of appliances and further to this how they are used. To construct an accurate
program, it is necessary to obtain as much information as possible on the most commonly used
appliances, this includes different brands.
Where possible extensive lists have been made and samples are displayed in Tables that follow. Most of
the larger appliances and heaviest users of power in a residence have their own lists created, for the
smaller appliances an “about average” max power figure has been used based on preliminary research
into these appliances.

30
Figure 9: Typical household usage of power. (Sa.gov.au., 2019)
Figure 9 outlines the classifications used in the data collection i.e. Heating and cooling, Water heating
(electric only), other appliances, fridges/freezers, lighting, cooking and stand-by power.
The following Tables will make up the data sets used to build the program.
4.3.1 Heating and Cooling
Australia currently has over 3500 air conditioners available for purchase. These range from the low kW
split systems to large volume residential ducted systems many of which are able to both heat and cool the
house. Is has been assumed based on preliminary research that home heating in the regions that require it
will be accomplished by the use of Ducted Gas heating systems (which is not included in this research) or
reverse cycle air conditioning. Both heating and cooling figures have been included in these data sets. An
example of the data being used to the data set is seen in Table 13. The list is comprised of the basic model
data and cooling and heating power usage.

31
Table 13: Air conditioning sample figures. (Data.gov.au., 2019)
Brand Model No. Cooling kW Heating kW
TOSHIBA RAS-B10UFV-A & RAS-10SAVR-A
2.4 3.2
TOSHIBA RAS-B13UFV-A & RAS-13SAVR-A2
3.5 4.1
TOSHIBA RAS-B16UFV-A & RAS-16UAVR-A
4.5 5
TOSHIBA RAS-B18UFV-A/RAS-18SAV2-A 4.9 5.8
DAIKIN FDYQN180LB / RZQ180L 18 20
DAIKIN FDYQN200LB / RZQ200LY 20 22.4
ACTRON AIR CAY470T / EVY470T 45.77 47.37
ACTRON AIR PKY470T 45.77 47.37
ACTRON AIR CAY470T 45.77 47.37
ACTRON AIR CAY470T / EVY470T 45.77 47.37
ACTRON AIR PKY470T 45.77 47.37
SPECIALIZED ENGINEERING
APC024VA3B 24.6 23.8
SPECIALIZED ENGINEERING
APH024VA3B 24.6 23.8
SolAir World SWWR-35GW 3.5 3.8
MEC MWA09I 2.6 2.8
MEC MWA12I 3.5 3.85
MEC MWA18I 5.2 5.85
MEC MWA24I 6.3 6.3
GREE GWH09MB-K3DNA2H(DRED) 2.6 2.8
GREE GWH09MB-K3DNA4H(DRED) 2.6 2.8
DAIKIN RMKS140L 14
DAIKIN RMKS160L 15.5
DAIKIN RMXS140L 14 16
DAIKIN RMXS160L 15.5 17.5
4.3.2 Water heating
There are many types of water heating options available in Australia, electric storage – electricity used for
water heating, gas storage – natural or LPG used for water heating, gas instantaneous – natural or LPG
used for water heating, heat pump – which moves heat rather than generates (like a fridge) and solar –
which uses solar energy to heat the water.
As the country becomes more climate conscious many have adopted the preference of purchasing more
energy efficient and climate friendly water heating options (Liu, H, Azuatalam, D, Chapman, AC &
Verbič, G, 2019). Solar hot water systems have been in use in Australia since 1953, these systems use a

32
solar collector panels to harness the heat energy which is then transferred into the water flowing through
its internal pipe system. Since this project is focussed on solar energy capture and use the research will
focus on using electric storage as its water heating system
Table 14: Electric water heating sample figures. (Data.gov.au., 2019)
Brand Model No. Gross Store Cap Power(kW)
The Silver Bullet 300SDB 300 4.0
The Silver Bullet 300SCB 300 4.0
The Silver Bullet 300SDB 300 4.0
The Silver Bullet 300STD 300 4.0
RHEEM 32518003-0 180 2.0
RHEEM 32518005-0 180 2.0
HJ COOPER LC18054020 180 2.0
RHEEM 14809013T 90 1.0
RHEEM LPVE 90L 90 1.0
RHEEM 14813513T 135 2.0
RHEEM 14818013T 180 2.0
RHEEM 14818015T 180 2.0
RHEEM 148180xxT 180 2.0
RHEEM 15813513T 135 2.0
RHEEM 15813515T 135 2.0
RHEEM 158135xxT 135 2.0
RHEEM 15818013T 180 2.0
RHEEM 15818015T 180 2.0
RHEEM 158180xxT 180 2.0
RHEEM 15827015T 270 3.0
VULCAN 691045Cx 49 1.0
Qudos MPE315 324 4.0
Qudos MPS315 324 4.0
Qudos Qudos 324 4.0

33
4.3.3 Dishwashers
The following Table shows the sample of dishwashers available in Australia.
Table 15: Dishwashers sample figures. (Data.gov.au., 2019)
Brand Model No C.E.C Power usage (kW) PARMCO TD6W-F1 448 1.23 PARMCO TD6S-F1 448 1.23
PARMCO TD6W-F1 448 1.23 VERSO TD6S-F1 448 1.23 VERSO TD6W-F1 448 1.23 VERSO TD6W-F1 448 1.23 AWARD DW458S 294 0.81 PARMCO PD6-P*F-1 311 0.85
PARMCO PD6-PSF-1 311 0.85 PARMCO PD6-PWF-1 311 0.85
ASKO D5424 385 1.05 EUROTAG W60A1A401 274 0.75 EUROTAG W60A1A401A 274 0.75 EUROTAG W60A1A401F 274 0.75
DELONGHI DEDW65** 227 0.62 DELONGHI DEDW650S 227 0.62 DELONGHI DEDW654FI 227 0.62
Ariston LFF 8M122 AUS 263 0.72 Ariston LFF 8M122 Series 263 0.72 Ariston LFF 8M122 X AUS 263 0.72
Indesit DFP 58M94 A AUS 263 0.72 Indesit DFP 58M94 A **
AUS 263 0.72
Indesit DFP 58M94 A NX AUS
263 0.72
Ariston LFD 11S123 OX AUS
282 0.77
Everdure DWF146PC 320 0.88

34
4.3.4 Dryers
The following Table shows the sample of clothes available in Australia.
Table 16. Clothes dryers sample figures. (Data.gov.au., 2019)
Brand Model No C.E.C Power usage (kW) NOUVEAU NDR4 180 0.49
Tuscany T-GDZ60-09E 265 0.73
ACQUA GY-ESD60W 265 0.73 TRIESTE ED-D6KG 265 0.73
Ariston ARMF 125 193 0.53 Ariston ARMF125 (AUS) 193 0.53 Ariston ARMF125 (AUS)1 193 0.53 MIELE TDA 150 C 292 0.80
LG TD-C902H 170 0.47 MIELE TKB350WP 158 0.43 BOSCH WTY88701AU 165 0.45
LG TD-C801H 148 0.41 ASKO T884XLHP 154 0.42
FISHER & PAYKEL DE8060P* 355 0.97
FISHER & PAYKEL DE8060P2 355 0.97 Cell-Sun TVD60-08E 269 0.74 Cell-Sun TVD60-08EF 269 0.74 Cell-Sun TVD60-09E 269 0.74 Cell-Sun TVD60-09EF 269 0.74 Eurotech ED-CD6KG 262 0.72
SAMSUNG ELECTRONICS DV70H4400CW 309 0.85 Galanz DC-80S1U 326 0.89 Galanz DC-80S3U 326 0.89
Sheffield PLA1329 150 0.41 PYE CD06ELEC 269 0.74

35
4.3.4 Washing machines
The following Table shows the sample of washing machines available in Australia.
Table 17: Washing machine sample figures. (Data.gov.au., 2019)
Brand Model No C.E.C Power usage (kW) Haier XQJ50 31A 480 1.32
INDESIT W93 240 0.66
INDESIT WE12 277 0.76 INDESIT WD11 327 0.90
SMEG S750 380 1.04 SMEG S650 377 1.03
MALBER 6 231 0.63 CANDY CB 103 TR 654 1.79
ASKO W6444 180 0.49 ASKO W6564 180 0.49 ASKO W6984 180 0.49 ASKO W6884 180 0.49
WHIRLPOOL WTWE75AW1 620 1.70 WHIRLPOOL WTWE85IG1 462 1.27
WHIRLPOOL WTWE85IW1 462 1.27 WHIRLPOOL WTWE85IW1 /
WTWE85IG1 462 1.27
Brav GreenTech10A 432 1.18
Panasonic NA-F85H3W** 730 2.00 Panasonic NA-F85H3WAU 730 2.00 Panasonic NA-F85H3WNZ 730 2.00
Fisher & Paykel WH8060P* 295 0.81 Fisher & Paykel WH8060P2 295 0.81
FISHER & PAYKEL WH8060P* 295 0.81
FISHER & PAYKEL WH8060P1 295 0.81 Lemair LW5 420 1.15

36
4.3.5 Fridges and Freezers
Research into available fridges and freezers with in Australia was conducted. A sample of the thousands
that are available is seen in Table 18.
Table 18: Fridges and freezers sample figures. (Data.gov.au., 2019)
Brand Model No C.E.C Power usage (kW) TUSCANY BD-155 284 0.78 TRIESTE DF1-15 320 0.88
FISHER & PAYKEL H160S 304 0.83 FISHER & PAYKEL H160SL 304 0.83 FISHER & PAYKEL H220SL 348 0.95 FISHER & PAYKEL H220X 348 0.95 FISHER & PAYKEL H280SL 392 1.07 FISHER & PAYKEL H280X 392 1.07 FISHER & PAYKEL H510SL 586 1.61 FISHER & PAYKEL H510X 586 1.61 FISHER & PAYKEL H701SL 703 1.93 FISHER & PAYKEL H701X 703 1.93 FISHER & PAYKEL H215X 345 0.95 FISHER & PAYKEL H275X 393 1.08 FISHER & PAYKEL H320X 424 1.16 FISHER & PAYKEL C270L 362 0.99 FISHER & PAYKEL C270R 362 0.99 FISHER & PAYKEL C270RS 362 0.99 FISHER & PAYKEL P120L 296 0.81 FISHER & PAYKEL P120LS 296 0.81 FISHER & PAYKEL P120R 296 0.81 FISHER & PAYKEL P120RS 296 0.81 FISHER & PAYKEL E150L 386 1.06 FISHER & PAYKEL E150R 386 1.06 FISHER & PAYKEL E210L 481 1.32

37
4.3.5 Lighting
Incandescent lighting choices available for house hold use are shown in the sample below.
Table 19: Incandescent bulb sample figures. (Data.gov.au., 2019)
Brand Model No Lamp power (W) Power usage (kW) OSRAM 45860 SP 20W LL 20 0.02 OSRAM 45860 WFL 20W LL 20 0.02
OSRAM Decostar 51 Long Life 20W 20 0.02 UBL 28W Tungsten Halogen 28 0.028 UBL UBL Halogen Lamps 28 0.028 UBL 42 W Tungsten Halogen 42 0.042 UBL UBL Halogen Lamps 42 0.042 UBL 70W Tungsten Halogen 70 0.07
UBL UBL Halogen Lamps 70 0.07 Sylvania 21697 20 0.02 Sylvania 21698 20 0.02 Sylvania MR16 SUPERIA
ECOPLUS 20W 20 0.02
Sylvania 21699 35 0.035 Sylvania 21701 35 0.035 Sylvania MR16 SUPERIA
ECOPLUS 35W 35 0.035
Olsent B35AHV-28CL 28 0.028 Olsent B35BHV-28CL 28 0.028 Olsent B35SHV-28CL 28 0.028 Olsent B35THV-28CL 28 0.028 Olsent B35XHV-28CL ( X=S, A,
T,B) 28 0.028
Olsent P45AHV-28CL 28 0.028 Olsent P45BHV-28CL 28 0.028 Olsent P45SHV-28CL 28 0.028 Olsent P45THV-28CL 28 0.028
Olsent P45XHV-28CL ( X=S, A, T,B)
28 0.028

38
Fluorescent lighting options are outlined in Table 20.
Table 20: Fluorescent bulb sample figures. (Data.gov.au., 2019)
Brand Model No Bulb power (W) Power usage (kW) ecobulb ecobulb 15W B22 HPF 2700K 15 0.015 ecobulb ecobulb 20W B22 HPF 2700K 20 0.02 ecobulb ecobulb 15W B15 HPF 2700K 15 0.015 ecobulb ecobulb 15W E14 HPF 2700K 15 0.015 ecobulb Ecobulb 12V 15W 2700K 15 0.015
ecobulb Ecobulb 12V 15W 2700K 15 0.015 ecobulb Ecobulb 12V 15W 2700K 15 0.015 ecobulb 12W ECOBULB B15 HPF
2700K 12 0.012
ecobulb 12W ECOBULB B22 HPF 2700K
12 0.012
ecobulb 12W ECOBULB E14 HPF 2700K
12 0.012
ecobulb 12W ECOBULB E27 HPF 2700K
12 0.012
ecobulb 12W ECOBULB HPF 2700K 12 0.012
CROMPTON CFR-80/15WES 3000K 15 0.015 CROMPTON CTT9WBCW 9 0.009 CROMPTON CTT9WESW 9 0.009 CROMPTON CTT9WW 9 0.009 CROMPTON CTT13WBCW 13 0.013 CROMPTON CTT13WESW 13 0.013
CROMPTON CTT13WW 13 0.013 CROMPTON CTT9WBCC 9 0.009 CROMPTON CTT9WC 9 0.009 CROMPTON CTT9WESC 9 0.009 CROMPTON CTT13WBCC 13 0.013 CROMPTON CTT13WC 13 0.013
CROMPTON CTT13WESC 13 0.013

39
4.3.6 Televisions
The following Table shows the sample of televisions available in Australia.
Table 21: Television sample figures. (Data.gov.au., 2019)
Brand Model No C.E.C Power usage (kW) TEAC LED2402FV 96 0.26 TEAC LEDV2416FV 96 0.26
KONKA KDL55JT611A 354 0.97 Bang & Olufsen BeoVision Avant 55 618 1.69
VEON V55FHD 404 1.11 VEON V39FHDC 189 0.52
Bang & Olufsen BeoVision Avant 1136 3.11 Bang & Olufsen BeoVision Avant 85 1136 3.11
Changhong LED65C5500I 372 1.02 SHARP LC-32LE360X 126 0.35
Millennius MLED65F03D3DS 650 1.78 HISENSE 65K680UAD 512 1.4 HISENSE 40K220PW 174 0.48 HISENSE 55K680UAD 476 1.3
RV Media 41969 85 0.23 RV Media 42307 92 0.25 HISENSE 32K220W 144 0.39 Panasonic TH-48AX670Z 404 1.11 Panasonic TH-55AX670Z 495 1.36 HISENSE 42K320UW 237 0.65
WINTAL 32LED15HD 96 0.26 WINTAL 42LED15FHD 163 0.45 WINTAL 50LED15FHD 235 0.64 SHARP LC32LE265 116 0.32 SHARP LC-32LE265X 116 0.32

40
4.3.7 Other electrical devices
The list of other various devices found in most home is covered here. All power (kW) figures have been
taken from their maximum figures to ensure acceptable load predictions and reduce the chance of under
sizing.
Table 22: Miscellaneous devices sample figures.
Device Power (W) Power usage (kW) Ceiling fan 70 0.07
Clock radio 2 0.00 Coffee machine 1400 1.40
Range hood 30 0.03 PC 800 0.80
Water pump 300 0.30 DVD player 60 0.06
Kettle 3000 3.00 Stove/hob 1000 1.00 Blender 400 0.40
Gaming console 200 0.20 Garage door opener 400 0.40
Hair dryer 2500 2.50
Router 15 0.02 Surround system 400 0.40
Iron 1000 1.00 Printer 30 0.03 Laptop 100 0.10
Microwave 170 0.17
Oven 2200 2.20 Pedestal fan 60 0.06
Phone charger 7 0.01 Rice cooker 500 0.50 Slow cooker 180 0.18
Hair straightener 300 0.30
Induction hob 1800 1.80 Power tool 1000 1.00
Toaster 1800 1.80 Treadmill 900 0.90
Vacuum cleaner 700 0.70 Electric toothbrush 12 0.01
Dehumidifier 280 0.28 Electric shaver 15 0.02 Home phone 70 0.07
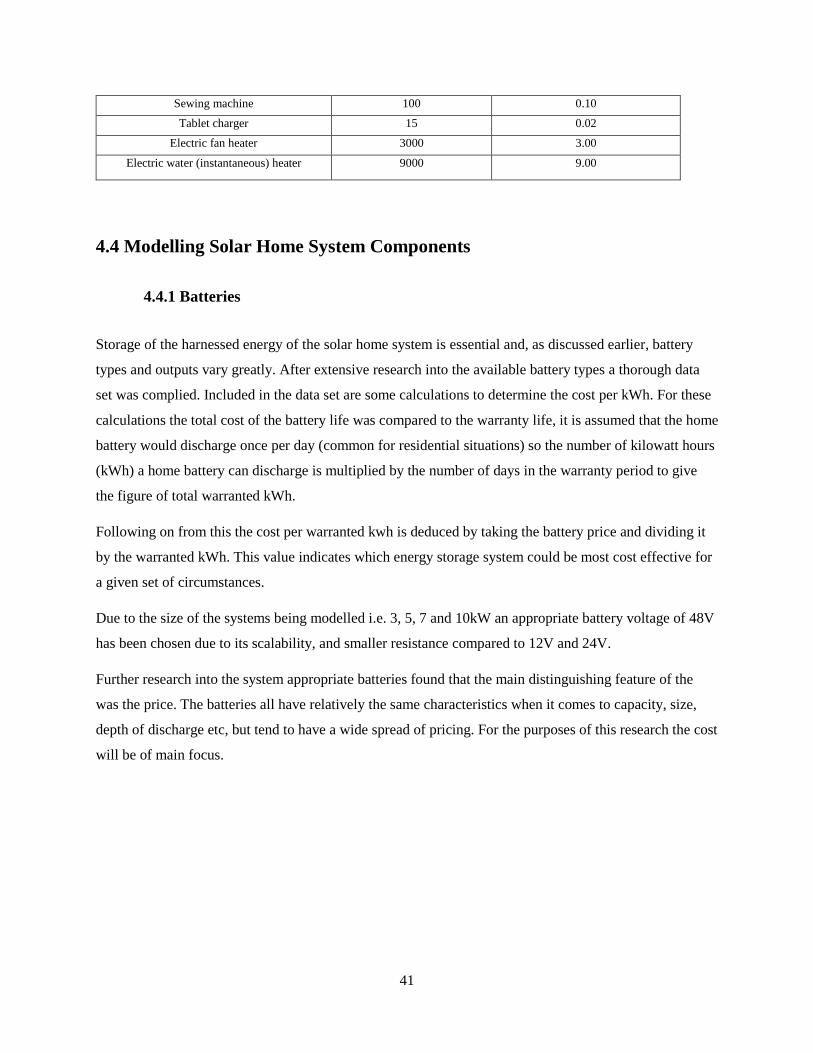
41
Sewing machine 100 0.10 Tablet charger 15 0.02
Electric fan heater 3000 3.00
Electric water (instantaneous) heater 9000 9.00
4.4 Modelling Solar Home System Components
4.4.1 Batteries
Storage of the harnessed energy of the solar home system is essential and, as discussed earlier, battery
types and outputs vary greatly. After extensive research into the available battery types a thorough data
set was complied. Included in the data set are some calculations to determine the cost per kWh. For these
calculations the total cost of the battery life was compared to the warranty life, it is assumed that the home
battery would discharge once per day (common for residential situations) so the number of kilowatt hours
(kWh) a home battery can discharge is multiplied by the number of days in the warranty period to give
the figure of total warranted kWh.
Following on from this the cost per warranted kwh is deduced by taking the battery price and dividing it
by the warranted kWh. This value indicates which energy storage system could be most cost effective for
a given set of circumstances.
Due to the size of the systems being modelled i.e. 3, 5, 7 and 10kW an appropriate battery voltage of 48V
has been chosen due to its scalability, and smaller resistance compared to 12V and 24V.
Further research into the system appropriate batteries found that the main distinguishing feature of the
was the price. The batteries all have relatively the same characteristics when it comes to capacity, size,
depth of discharge etc, but tend to have a wide spread of pricing. For the purposes of this research the cost
will be of main focus.


43
Table 23: Battery list and descriptions
Product Name Battery Type Price excl. installation ($AUD approx.)
Power Nominal Storage
All-in-One Soltaro 5kw / 13.5kWh
Li-Ion $15,000 5kW Steady, 15.5kW Peak (100ms)
13.5kWh
All-in-One Soltaro 5kw / 4.5kWh
Li-Ion $7,150 5kW Steady, 15.5kW Peak (100ms)
4.5kWh
All-in-One Soltaro 5kw / 9kWh
Li-Ion $11,500 5kW Steady, 15.5kW Peak (100ms)
9kWh
Akasol neeoQube Li-Ion $12,000.00 5kW 5.5kWh
Alpha-ESS Storion SMILE 5 – 5.5kWh
Li-Ion $9,042 2.8kW nominal output 5.7 kWh
Alpha-ESS Storion SMILE 5 -11kWh
Li-Ion $13,992 4.6kW nominal output 11.5 kWh
Alpha-ESS Storion SMILE 5 -16.5kWh
Li-Ion $17,220 4.6kW nominal output 17.2 kWh
Aquion Aspen 48S-2.2 Aqueous Hybrid Ion
$2,200 0.68kW steady, 1kW peak (stacks with each
additional 2.2kWh pack)
2.2kWh
Arvio Sirius Capacitor Module
Graphene super capacitor with
Li-ion
$4,686.00 4.8kW steady, 12kW peak
3.55kWh
BMZ ESS3.0 Li-Ion $7700 8kW steady, 16kW 3sec peak
6.74kWh
BYD B Box Pro 13.8 Li-Ion $9,600.00 12.8kW 13.8 kWh
BYD B-Box RES Li-Ion $7,500.00 10 kW steady 10.24 kWh
DCS PV 10.0 Li-Ion
5.12kW continuous / 10.24kW peak (10 mins)
10.42kWh
DCS PV 13.5 Li-Ion $9,990.00 7.5kW continuous / 15kW peak (10 mins)
13.52kWh
Delta Hybrid E5 Li-Ion $6,600.00 3kW steady 6kWh
Eguana Evolve Li-Ion $17,530 5 kW steady, 6kW (30 minutes), 8.5kW (3
seconds).
13kWh
ELMOFO E-Cells ALB52-106
Li-Ion $8,190.00 5kW steady, 40kW peak 5.5kWh
Enphase AC Battery Li-Ion 2,000.00 260W per battery (stacks with each additional
battery)
1.2kWh
Fronius Solar Battery Li-Ion $19,930.00 4kW steady 12kWh
GCL E-KwBe 5.6 Li-Ion $3,650.00 3kW steady 5.6kWh
GenZ 48V 3kWh Li-Ion $3,450 3kW 3kWh (per module)
Hansol AIO 10.8 Li-Ion $13,540 6.6 kW steady 10.8 kWh
Hansol AIO 7.2 Li-Ion $11,550 6.6 kW steady 7.2 kWh
Hybrid "Home" Plus Lead Crystal $11,000 3kW steady, 5kW peak 9.84kWh
Leclanche Apollion Cube
Li-Ion $9200 3.3kW steady, 6.5kW peak
6.7kWh
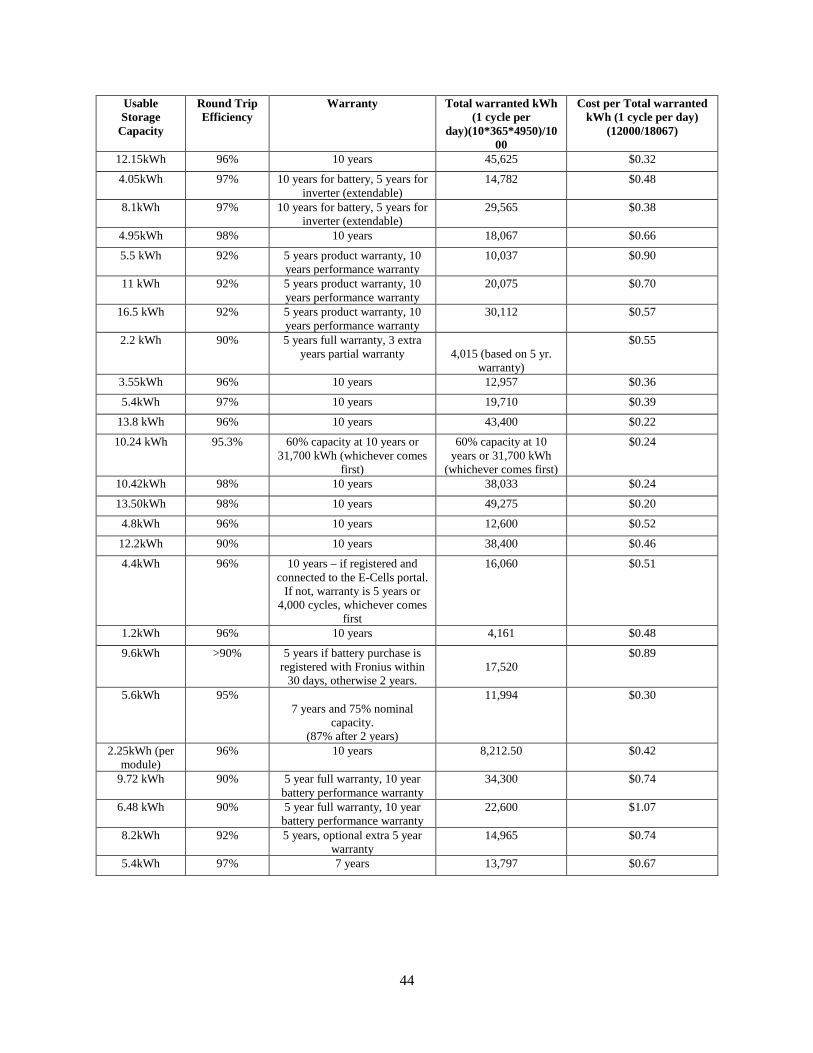
44
Usable Storage
Capacity
Round Trip Efficiency
Warranty Total warranted kWh (1 cycle per
day)(10*365*4950)/1000
Cost per Total warranted kWh (1 cycle per day)
(12000/18067)
12.15kWh 96% 10 years 45,625 $0.32
4.05kWh 97% 10 years for battery, 5 years for inverter (extendable)
14,782 $0.48
8.1kWh 97% 10 years for battery, 5 years for inverter (extendable)
29,565 $0.38
4.95kWh 98% 10 years 18,067 $0.66
5.5 kWh 92% 5 years product warranty, 10 years performance warranty
10,037 $0.90
11 kWh 92% 5 years product warranty, 10 years performance warranty
20,075 $0.70
16.5 kWh 92% 5 years product warranty, 10 years performance warranty
30,112 $0.57
2.2 kWh 90% 5 years full warranty, 3 extra years partial warranty
4,015 (based on 5 yr.
warranty)
$0.55
3.55kWh 96% 10 years 12,957 $0.36
5.4kWh 97% 10 years 19,710 $0.39
13.8 kWh 96% 10 years 43,400 $0.22
10.24 kWh 95.3% 60% capacity at 10 years or 31,700 kWh (whichever comes
first)
60% capacity at 10 years or 31,700 kWh
(whichever comes first)
$0.24
10.42kWh 98% 10 years 38,033 $0.24
13.50kWh 98% 10 years 49,275 $0.20
4.8kWh 96% 10 years 12,600 $0.52
12.2kWh 90% 10 years 38,400 $0.46
4.4kWh 96% 10 years – if registered and connected to the E-Cells portal.
If not, warranty is 5 years or 4,000 cycles, whichever comes
first
16,060 $0.51
1.2kWh 96% 10 years 4,161 $0.48
9.6kWh >90% 5 years if battery purchase is registered with Fronius within
30 days, otherwise 2 years.
17,520
$0.89
5.6kWh 95% 7 years and 75% nominal
capacity. (87% after 2 years)
11,994 $0.30
2.25kWh (per module)
96% 10 years 8,212.50 $0.42
9.72 kWh 90% 5 year full warranty, 10 year battery performance warranty
34,300 $0.74
6.48 kWh 90% 5 year full warranty, 10 year battery performance warranty
22,600 $1.07
8.2kWh 92% 5 years, optional extra 5 year warranty
14,965 $0.74
5.4kWh 97% 7 years 13,797 $0.67
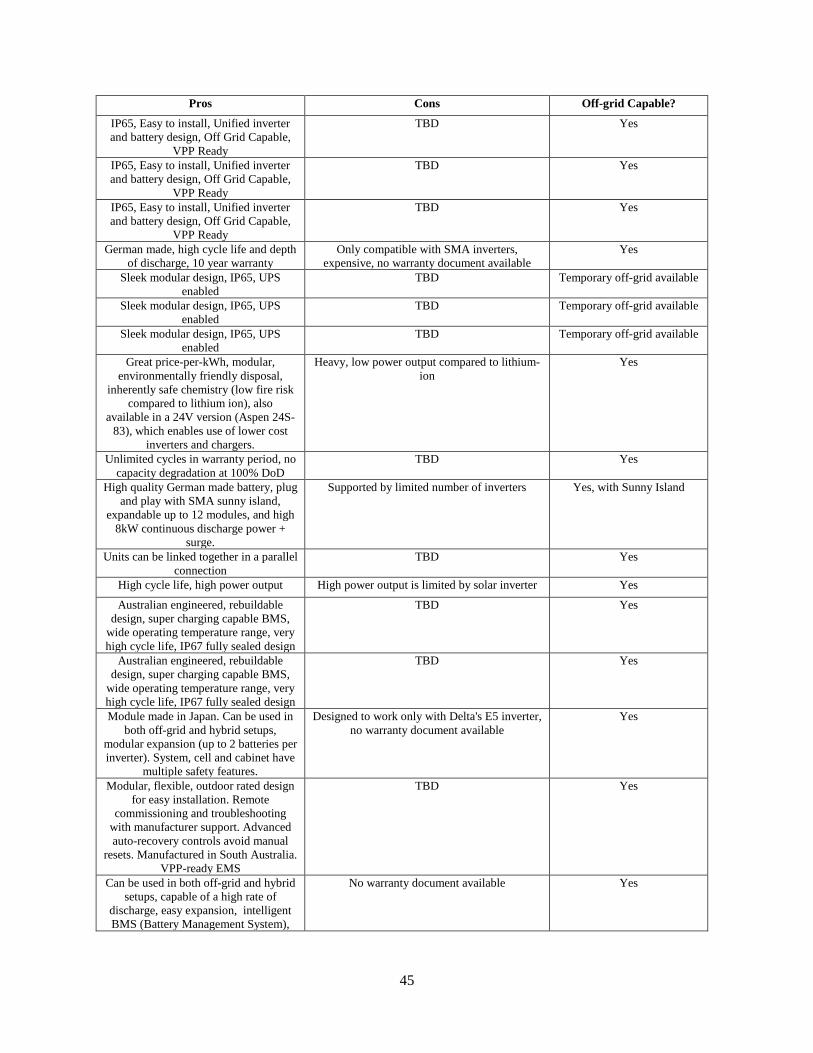
45
Pros Cons Off-grid Capable?
IP65, Easy to install, Unified inverter and battery design, Off Grid Capable,
VPP Ready
TBD Yes
IP65, Easy to install, Unified inverter and battery design, Off Grid Capable,
VPP Ready
TBD Yes
IP65, Easy to install, Unified inverter and battery design, Off Grid Capable,
VPP Ready
TBD Yes
German made, high cycle life and depth of discharge, 10 year warranty
Only compatible with SMA inverters, expensive, no warranty document available
Yes
Sleek modular design, IP65, UPS enabled
TBD Temporary off-grid available
Sleek modular design, IP65, UPS enabled
TBD Temporary off-grid available
Sleek modular design, IP65, UPS enabled
TBD Temporary off-grid available
Great price-per-kWh, modular, environmentally friendly disposal,
inherently safe chemistry (low fire risk compared to lithium ion), also
available in a 24V version (Aspen 24S-83), which enables use of lower cost
inverters and chargers.
Heavy, low power output compared to lithium-ion
Yes
Unlimited cycles in warranty period, no capacity degradation at 100% DoD
TBD Yes
High quality German made battery, plug and play with SMA sunny island,
expandable up to 12 modules, and high 8kW continuous discharge power +
surge.
Supported by limited number of inverters Yes, with Sunny Island
Units can be linked together in a parallel connection
TBD Yes
High cycle life, high power output High power output is limited by solar inverter Yes
Australian engineered, rebuildable design, super charging capable BMS,
wide operating temperature range, very high cycle life, IP67 fully sealed design
TBD Yes
Australian engineered, rebuildable design, super charging capable BMS,
wide operating temperature range, very high cycle life, IP67 fully sealed design
TBD Yes
Module made in Japan. Can be used in both off-grid and hybrid setups,
modular expansion (up to 2 batteries per inverter). System, cell and cabinet have
multiple safety features.
Designed to work only with Delta's E5 inverter, no warranty document available
Yes
Modular, flexible, outdoor rated design for easy installation. Remote
commissioning and troubleshooting with manufacturer support. Advanced auto-recovery controls avoid manual
resets. Manufactured in South Australia. VPP-ready EMS
TBD Yes
Can be used in both off-grid and hybrid setups, capable of a high rate of
discharge, easy expansion, intelligent BMS (Battery Management System),
No warranty document available Yes

46
developed in Australia using Kokam cells
Simple installation, easy to add more batteries to increase storage capacity.
Very low power output per battery No
High cycle life, good power output Can only be installed indoors, relatively short warranty compared to other lithium-ion
batteries, expensive. 3 Phase only,
Yes
Low cost, comes in multiple colours, lightweight
Low cycle life Capable, but designed for on-grid
5 years application in the Australian outback, self-managed, and modular.
TBD Yes
All in one with Samsung batteries. Easy to install.
The system, apart from the batteries, only has a 5 year warranty.
Yes
All in one with Samsung batteries. Easy to install.
The system, apart from the batteries, only has a 5 year warranty.
Yes
Unique technology, inherently safe battery chemistry
Relatively low cycle life compared to other battery types, heavy
Yes
German made, high quality solar battery storage, plug and play with SMA sunny
island, expandable up to 12 modules
Supported by limited number of inverters Yes, with Sunny Island or Struder inverter/charger
4.4.2 PV panels
Research into the available options of available solar panels for residential use reaped thousands of
available models, types, sizes. For use in this research a list of the top 14 panels was created. The list was
based on consumer reviews, availability within Australia and warranty. The chosen panel each has
variations of available power (wattage) within the model range in order to future proof the solar home
system design the largest (most powerful) model has been used.
The efficiency of the panels ranges from 15.5% to 20.4% with an average of 18.6%.
Table 24 below shows the full list and details of the chosen panels for use in the project.

47
Table 24: Panel list and descriptions
Brand Capacity (kW) No. of panels Panels (W) Cost per panel
Inverter capacity (kW)
LG Neon 2 3 9 330 $499.00 3
5 15 330 5 7 21 330 7 10 30 330 10
Sun Power P20 series 3 9 327 $495.00 3 5 15 327 5 7 21 327 7 10 31 327 10
Trina Solar HoneyM Plus 3 10 310 $234.00 3 5 16 310 5 7 23 310 7 10 32 310 10
Winaico M6 PERC 3 10 290 $295.00 3
5 17 290 5 7 24 290 7 10 34 290 10
REC Twin peak 2 mono 3 10 315 $260.00 3
5 16 315 5
7 22 315 7 10 32 315 10
Q cells Q Peak duo 3 9 330 $275.00 3
5 15 330 5 7 21 330 7
10 30 330 10 Jinko Solar Eagle PERC 3 10 315 $243.00 3
5 16 315 5 7 22 315 7 10 32 315 10
JA Solar JAM60D09/BP 3 9 325 $255.00 3
5 15 325 5 7 22 325 7 10 31 325 10

48
Seraphim Eclipse 3 9 325 $299.00 3 5 15 325 5 7 22 325 7
10 31 325 10 Canadian Solar SuperPower CS6K-MS 3 10 305 $247.00 3
5 16 305 5 7 23 7 10 33 305 10
Phono Solar PS325M-24/T 3 9 325 $228.00 3
5 15 325 5 7 22 7 10 31 325 10
SunTech 3 10 315 $429.00 3 5 16 315 5 7 22 7 10 32 315 10
Hyundai Solar RG Series 3 10 310 $226.00 3
5 16 310 5 7 23 10 32 310 10
Tindo 3 10 300 $251.00 3
5 17 300 5
7 23 77 10 33 300 10
Energy output kWh/year by state
Brand QLD NSW VIC WA TAS NT SA ACT
LG Neon 2 5875.55 4975.79 4509.65 6114.04 3967.62 6406.74 5203.44 5170.92 9792.59 8292.98 7516.08 10190.07 6612.71 10677.89 8672.40 8618.20 13709.62 11610.18 10522.51 14266.10 9257.79 14949.05 12141.36 12065.48
19585.17 16585.97 15032.16 20380.14 13225.41 21355.79 17344.80 17236.40
5822.14 4930.56 4468.65 6058.46 3931.55 6348.49 5156.14 5123.91

49
Sun Power P20 series
9703.56 8217.59 7447.75 10097.43 6552.59 10580.82 8593.56 8539.85 13584.99 11504.63 10426.85 14136.41 9173.63 14813.15 12030.98 11955.79 20054.03 16983.02 15392.02 20868.03 13542.02 21867.03 17760.02 17649.02
Trina Solar HoneyM Plus
6132.73 5193.59 4707.04 6381.66 4141.29 6687.17 5431.20 5397.26 9812.37 8309.74 7531.26 10210.66 6626.06 10699.46 8689.92 8635.61 14105.28 11945.25 10826.19 14677.82 9524.97 15380.48 12491.76 12413.69 19624.74 16619.47 15062.53 20421.31 13252.13 21398.93 17379.84 17271.22
Winaico M6 PERC
5737.07 4858.52 4403.36 5969.94 3874.11 6255.74 5080.80 5049.05 9753.02 8259.48 7485.71 10148.90 6585.99 10634.75 8637.36 8583.38 13768.97 11660.44 10568.06 14327.86 9297.86 15013.76 12193.92 12117.71 19506.04 16518.95 14971.42 20297.80 13171.97 21269.50 17274.72 17166.75
REC Twin peak 2 mono
6231.65 5277.35 4782.96 6484.59 4208.09 6795.02 5518.80 5484.31
9970.63 8443.76 7652.74 10375.34 6732.94 10872.04 8830.08 8774.89 13709.62 11610.18 10522.51 14266.10 9257.79 14949.05 12141.36 12065.48 19941.26 16887.53 15305.47 20750.69 13465.87 21744.07 17660.16 17549.78
Q cells Q Peak duo
5875.55 4975.79 4509.65 6114.04 3967.62 6406.74 5203.44 5170.92 9792.59 8292.98 7516.08 10190.07 6612.71 10677.89 8672.40 8618.20
13709.62 11610.18 10522.51 14266.10 9257.79 14949.05 12141.36 12065.48 19585.17 16585.97 15032.16 20380.14 13225.41 21355.79 17344.80 17236.40
Jinko Solar Eagle PERC
6231.65 5277.35 4782.96 6484.59 4208.09 6795.02 5518.80 5484.31 9970.63 8443.76 7652.74 10375.34 6732.94 10872.04 8830.08 8774.89 13709.62 11610.18 10522.51 14266.10 9257.79 14949.05 12141.36 12065.48
19941.26 16887.53 15305.47 20750.69 13465.87 21744.07 17660.16 17549.78 JA Solar JAM60D09/BP
5786.53 4900.40 4441.32 6021.41 3907.51 6309.66 5124.60 5092.57 9644.21 8167.33 7402.20 10035.68 6512.51 10516.11 8541.00 8487.62 14144.85 11978.75 10856.56 14718.99 9551.69 15423.62 12526.80 12448.51 19931.37 16879.15 15297.88 20740.40 13459.19 21733.29 17651.40 17541.08
Seraphim Eclipse
5786.53 4900.40 4441.32 6021.41 3907.51 6309.66 5124.60 5092.57 9644.21 8167.33 7402.20 10035.68 6512.51 10516.11 8541.00 8487.62 14144.85 11978.75 10856.56 14718.99 9551.69 15423.62 12526.80 12448.51 19931.37 16879.15 15297.88 20740.40 13459.19 21733.29 17651.40 17541.08
Canadian Solar SuperPower CS6K-MS
6033.82 5109.82 4631.12 6278.73 4074.50 6579.31 5343.60 5310.20 9654.10 8175.71 7409.79 10045.97 6519.19 10526.89 8549.76 8496.32 13877.77 11752.58 10651.58 14441.08 9371.34 15132.41 12290.28 12213.47 19911.59 16862.40 15282.70 20719.81 13445.83 21711.71 17633.88 17523.67

50
Phono Solar PS325M-24/T
5786.53 4900.40 4441.32 6021.41 3907.51 6309.66 5124.60 5092.57 9644.21 8167.33 7402.20 10035.68 6512.51 10516.11 8541.00 8487.62
14144.85 11978.75 10856.56 14718.99 9551.69 15423.62 12526.80 12448.51 19931.37 16879.15 15297.88 20740.40 13459.19 21733.29 17651.40 17541.08
SunTech 6231.65 5277.35 4782.96 6484.59 4208.09 6795.02 5518.80 5484.31
9970.63 8443.76 7652.74 10375.34 6732.94 10872.04 8830.08 8774.89 13709.62 11610.18 10522.51 14266.10 9257.79 14949.05 12141.36 12065.48
19941.26 16887.53 15305.47 20750.69 13465.87 21744.07 17660.16 17549.78 Hyundai Solar RG Series
6132.73 5193.59 4707.04 6381.66 4141.29 6687.17 5431.20 5397.26 9812.37 8309.74 7531.26 10210.66 6626.06 10699.46 8689.92 8635.61 14105.28 11945.25 10826.19 14677.82 9524.97 15380.48 12491.76 12413.69 19624.74 16619.47 15062.53 20421.31 13252.13 21398.93 17379.84 17271.22
Tindo 5934.90 5026.05 4555.20 6175.80 4007.70 6471.45 5256.00 5223.15
10089.33 8544.29 7743.84 10498.86 6813.09 11001.47 8935.20 8879.36 13650.27 11559.92 10476.96 14204.34 9217.71 14884.34 12088.80 12013.25 19585.17 16585.97 15032.16 20380.14 13225.41 21355.79 17344.80 17236.40
Brand Roof area (m^2) System cost (panels only)
Efficiency (%)
LG Neon 2 15.4 $4,491.00 19.3% 25.7 $7,485.00 35.07 $10,479.00 51.4 $14,970.00
Sun Power P20 series 14.68 $4,455.00 20.4% 24.46 $7,425.00 34.24 $10,395.00
50.55 $15,345.00 Trina Solar HoneyM Plus 16.4 $2,340.00 19.20%
26.2 $3,744.00 38.26 $5,382.00 52.4 $7,488.00
Winaico M6 PERC 16.63 $2,950.00 18.64%
28.28 $5,015.00 39.92 $7,080.00

51
56.55 $10,030.00 REC Twin peak 2 mono 16.70 $2,600.00 19.20%
26.72 $4,160.00 36.74 $5,720.00 53.44 $8,320.00
Q cells Q Peak duo 15.17 $2,475.00 19.60%
25.28 $4,125.00
35.39 $5,775.00 50.55 $8,250.00
Jinko Solar Eagle PERC 16.37 $2,430.00 19.24%
26.19 $3,888.00 36.01 $5,346.00
52.38 $7,776.00 JA Solar JAM60D09/BP 14.99 $2,295.00 18.20%
24.99 $3,825.00 36.65 $5,610.00 51.64 $7,905.00
Seraphim Eclipse 17.59 $2,691.00 19.11%
29.31 $4,485.00 42.99 $6,578.00 60.58 $9,269.00
Canadian Solar SuperPower CS6K-MS 16.37 $2,470.00 18.63% 26.19 $3,952.00 37.65 $5,681.00 54.01 $8,151.00
Phono Solar PS325M-24/T 17.46 $2,052.00 16.75%
29.11 $3,420.00 42.69 $5,016.00 60.15 $7,068.00
SunTech 19.40 $4,290.00 15.50%
31.05 $6,864.00
42.69 $9,438.00 62.09 $13,728.00
Hyundai Solar RG Series 16.37 $2,260.00 18.90%

52
26.19 $3,616.00 37.64 $5,198.00 52.38 $7,232.00
Tindo 16.67 $2,510.00 18.00%
28.34 $4,267.00 38.34 $5,773.00 55.01 $8,283.00
Table 24 above uses the figures from Table 5 as the basis for the calculations of energy output per state.
The calculation takes:
𝐸𝐸𝑛𝑛𝑒𝑒𝐸𝐸𝐸𝐸𝐸𝐸 𝑜𝑜𝑜𝑜𝑠𝑠𝑝𝑝𝑜𝑜𝑠𝑠 𝑝𝑝𝑒𝑒𝐸𝐸 𝑠𝑠𝑠𝑠𝑝𝑝𝑠𝑠𝑒𝑒 = (𝑛𝑛𝑜𝑜. 𝑜𝑜𝑓𝑓 𝑝𝑝𝑝𝑝𝑛𝑛𝑒𝑒𝑝𝑝𝑠𝑠 ∗ 𝑝𝑝𝑝𝑝𝑛𝑛𝑒𝑒𝑝𝑝 𝑝𝑝𝑜𝑜𝑝𝑝𝑒𝑒𝐸𝐸(𝑊𝑊) ∗ 365) / 1000 (12)
Using this equation will provide a more accurate load profile and system recommendation from the final
program.
Table 25: Excerpt of Table 5.
Average(kWh/m^2) per state
QLD 5.42
NSW 4.59
VIC 4.16
WA 5.64
ACT 4.77
TAS 3.66
NT 5.91
SA 4.80
4.4.3 Charge controllers
Research into solar charge controllers was conducted and produced a wide variety of quality and price
with the available units. On assessing which controllers to use with which system it was found that the
smallest system being researched (3 kW) produced 62.5A when connected to a 48V battery pack. Based
on this the smallest solar controller used will be 70A.
One of the first hurdles encountered was unit availability in Australia. None of the controllers able to be
used with the systems i.e. > 62.5A, where manufactured in Australia. Many smaller systems are but these
are not applicable. Based on the availability a flat rate of $150 AUD has been added to all models to
cover the cost of shipping.

53
Also, the available units come in generic size of 70A, 80A, 85A and 100A. Calculations for prices of each
system are based from these sizes, for example the 10kW system requires approximately a 260A solar
charge controller prices have been calculated using a multiple of the same controller i.e. 3 * 100A
controllers or 4 * 70A controllers to give an indication of best value.
Table 26: Charge controllers
Brand Amps Charge
format
Price
(shipped)
For 3kW
(78A*)
For 5k
(130A*)
For 7kW
(182A*)
For 10kW
(260A*)
Renology Rover Li 100 MPPT $1,002.00 $1,002.00 $2,004.00 $2,004.00 $3,006.00
KR 100 MPPT $1,104.00 $1,104.00 $2,208.00 $2,208.00 $3,312.00
AIMS Power 100 MPPT $1,096.00 $1,096.00 $2,192.00 $2,192.00 $3,288.00
CAE 100 MPPT $1,072.00 $1,072.00 $2,144.00 $2,144.00 $3,216.00
Victron SmartSolar 85 MPPT $1,298.00 $1,298.00 $2,596.00 $3,894.00 $5,192.00
Studer VarioTrack 80 MPPT $1,185.00 $1,185.00 $2,370.00 $3,555.00 $4,740.00
EPEVER 80 MPPT $875.00 $875.00 $1,750.00 $2,625.00 $3,500.00
Ipanda 80 MPPT $1,080.00 $1,080.00 $2,160.00 $3,240.00 $4,320.00
KR 80 MPPT $1,072.00 $1,072.00 $2,144.00 $3,216.00 $4,288.00
AIMS Power 80 MPPT $1,003.00 $1,003.00 $2,006.00 $3,009.00 $4,012.00
Outback Flexmax 80 MPPT $923.00 $923.00 $1,846.00 $2,769.00 $3,692.00
Victron SmartSolar 70 MPPT $920.00 N/A $1,840.00 $2,760.00 $3,680.00
SMK Solar 70 MPPT $873.00 N/A $1,746.00 $2,619.00 $3,492.00
Studer Variostring 70 MPPT $1,699.00 N/A $3,398.00 $5,097.00 $6,796.00
$875.00 $1,746.00 $2,004.00 $3,006.00
*Note all Amps have had an additional 25% added to allow
for current spikes
4.4.4 Power inverters
Research into the inverters available for residential use yielded a short list of available items that are able
to meet the requirements of the project. The 4 sizes (3, 5, 7 and 10kW) of systems require an inverter to
convert the DC electricity from the panels and battery into AC for domestic use. All of the inverters are
single phase as is norm of most Australian homes. Prices have been converted from overseas currencies to
Australian dollars and no shipping cost has been factored in.
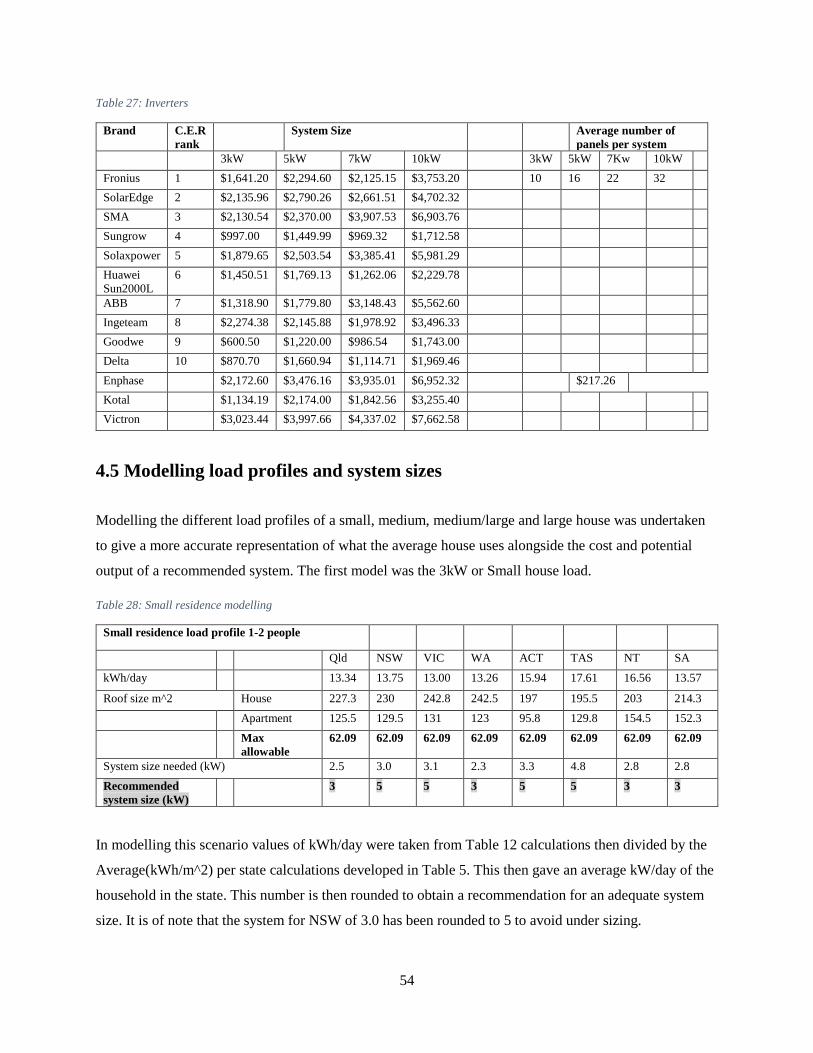
54
Table 27: Inverters
Brand C.E.R rank
System Size
Average number of panels per system
3kW 5kW 7kW 10kW 3kW 5kW 7Kw 10kW
Fronius 1 $1,641.20 $2,294.60 $2,125.15 $3,753.20 10 16 22 32
SolarEdge 2 $2,135.96 $2,790.26 $2,661.51 $4,702.32
SMA 3 $2,130.54 $2,370.00 $3,907.53 $6,903.76
Sungrow 4 $997.00 $1,449.99 $969.32 $1,712.58
Solaxpower 5 $1,879.65 $2,503.54 $3,385.41 $5,981.29
Huawei Sun2000L
6 $1,450.51 $1,769.13 $1,262.06 $2,229.78
ABB 7 $1,318.90 $1,779.80 $3,148.43 $5,562.60
Ingeteam 8 $2,274.38 $2,145.88 $1,978.92 $3,496.33
Goodwe 9 $600.50 $1,220.00 $986.54 $1,743.00
Delta 10 $870.70 $1,660.94 $1,114.71 $1,969.46
Enphase
$2,172.60 $3,476.16 $3,935.01 $6,952.32
$217.26 Kotal
$1,134.19 $2,174.00 $1,842.56 $3,255.40
Victron
$3,023.44 $3,997.66 $4,337.02 $7,662.58
4.5 Modelling load profiles and system sizes
Modelling the different load profiles of a small, medium, medium/large and large house was undertaken
to give a more accurate representation of what the average house uses alongside the cost and potential
output of a recommended system. The first model was the 3kW or Small house load.
Table 28: Small residence modelling
Small residence load profile 1-2 people
Qld NSW VIC WA ACT TAS NT SA
kWh/day
13.34 13.75 13.00 13.26 15.94 17.61 16.56 13.57
Roof size m^2 House 227.3 230 242.8 242.5 197 195.5 203 214.3 Apartment 125.5 129.5 131 123 95.8 129.8 154.5 152.3 Max
allowable 62.09 62.09 62.09 62.09 62.09 62.09 62.09 62.09
System size needed (kW) 2.5 3.0 3.1 2.3 3.3 4.8 2.8 2.8 Recommended system size (kW)
3 5 5 3 5 5 3 3
In modelling this scenario values of kWh/day were taken from Table 12 calculations then divided by the
Average(kWh/m^2) per state calculations developed in Table 5. This then gave an average kW/day of the
household in the state. This number is then rounded to obtain a recommendation for an adequate system
size. It is of note that the system for NSW of 3.0 has been rounded to 5 to avoid under sizing.

55
Sizing of panels based on Table 26 was then used to determine the prices of the PV components of the
3kW of the system. The most expensive, least expensive and median expensive were calculated and can
be seen in Table 31.
Next the appropriate battery size was extracted from the data of Table 25, there were seven batteries that
met the criteria of capacity. Again most, least and median expensive were deduced. The same of the
inverter and solar controller was conducted.
Table 29: PV selection for 3kW system
3kW System
Panel Brands per system size (3kW) Price LG Neon 2 $4,491.00 Sun Power P20 series
$4,455.00
Trina Solar HoneyM Plus $2,340.00 Winaico M6 PERC
$2,950.00
REC Twin peak 2 mono $2,600.00 Q cells Q Peak duo $2,475.00 Jinko Solar Eagle PERC $2,430.00 JA Solar JAM60D09/BP $2,295.00 Seraphim Eclipse
$2,691.00
Canadian Solar SuperPower CS6K-MS $2,470.00 Phono Solar PS325M-24/T $2,052.00 SunTech
$4,290.00
Hyundai Solar RG Series $2,260.00 Tindo $2,510.00
Most expensive
$4,491.00 Least expensive
$2,052.00
Average expense
$2,492.50 Closest to the average Q cells Q Peak duo $2,475.00 Tindo $2,510.00

56
Table 30: Battery selection for 3kW system
Battery Brands per system size (3kW) Price
Delta Hybrid E5 $6,600.00 GCL E-KwBe 5.6
$3,650.00
GenZ 48V 3kWh $3,450.00 Hybrid "Home" Plus
$11,000.00
Redflow Zcell $12,600.00
SunGrow SBP4K8
$3,500.00 Trinabess Powercube
$9,790.00
Most expensive
$12,600.00
Least expensive
$3,450.00 Average expense
$6,600.00
Closest to the average Delta Hybrid E5 $6,600.00
Table 31: Inverter selection for 3kW system
Solar inverter brands per system size (3kW) Price
Fronius $1,641.20 SolarEdge
$2,135.96
SMA
$2,130.54 Sungrow
$997.00
Solaxpower
$1,879.65 Huawei Sun2000L
$1,450.51
ABB
$1,318.90
Ingeteam
$2,274.38
Goodwe $600.50
Delta
$870.70 Enphase
$2,172.60
Kotal
$1,134.19 Victron $3,023.44
Most expensive
$3,023.44 Least expensive
$600.50
Average expense
$1,641.20 Closest to the average Fronius $1,641.20

57
Table 32: Solar charge controller selection for 3kW system
Solar charge controller brands per system size (3kW)
Price
Renology Rover Li
$ 1,002.00 KR
$ 1,104.00
AIMS Power
$ 1,096.00 CAE $ 1,072.00 Victron SmartSolar $ 1,298.00 Studer VarioTrack
$ 1,185.00
EPEVER $ 875.00 Ipanda
$ 1,080.00
KR $ 1,072.00 AIMS Power
$ 1,003.00
Outback Flexmax
$ 923.00
Most expensive
$ 1,298.00 Least expensive
$ 875.00
Average expense
$ 1,072.00 Closest to the average CAE $ 1,072.00 KR $ 1,072.00
Once the system for a small home was completed the medium and large home were under taken. During
modelling of the medium home it became apparent that another system be incorporated. A 7kW system
was then developed and calculated and used when the recommended system from Table 35 was greater
than 5kW but substantially less than 10kW, this is labelled as the medium/large house system.
Table 33: Medium house load profiles
Medium residence load profile 2-4 people
Qld NSW VIC WA ACT TAS NT SA kWh/day
24.15 24.47 22.79 23.57 28.01 31.16 29.39 23.82
Roof size m^2 House 227.3 230 242.8 242.5 197 195.5 203 214.3 Apartment 125.5 129.5 131 123 95.8 129.8 154.5 152.3 Max allowable 62.09 62.09 62.09 62.09 62.09 62.09 62.09 62.09 System size needed (kW) 4.5 5.3 5.5 4.2 5.9 8.5 5.0 5.0
Recommended system size (kW) 5 7 7 5 7 10 5 5

58
Table 34: Large house load profiles
Large residence load profile 4 - 6 people
Qld NSW VIC WA ACT TAS NT SA
kWh/day
24.57 24.51 23.89 24.24 25.42 26.65 25.92 24.20 Roof size m^2
House 227.3 230 242.8 242.5 197 195.5 203 214.3
Apartment 125.5 129.5 131 123 95.8 129.8 154.5 152.3
Max allowable 62.09 62.09 62.09 62.09 62.09 62.09 62.09 62.09 System size needed (kW) 4.5 5.3 5.7 4.3 5.3 3.7 4.4 5.0
Recommended system size (kW) 5 7 7 5 7 5 5 5
A strange anomaly became apparent when completing these calculations in some cases the medium sized house with 2-4 people was found to use less than the large house model, the reason for this is unknown but worthy of future investigation.
The final price comparisons for the systems was compiled in Table 35.
Table 35: System price comparison
Small 3kW Small house
Expensive sys $21,412.44 Median sys
$11,823.20
Cheapest sys
$6,977.50
Med 5kW Medium house
Expensive sys $34,086.66 Median sys
$19,978.00
Cheapest sys
$13,536.00
Med 7kW Medium/Large house
Expensive sys $30,022.02 Medium sys
$20,205.15
Cheapest sys
$15,506.54
Large 10kW Large house
Expensive sys $71,003.58 Median sys
$34,175.20
Cheapest sys
$19,286.58
Table 36 displays the completed models for the Small house (3kW) system, Medium house (5kW)
system, Medium/Large house (7kW) system and the Large house with a 10kW system.


61
The total saving per year is then calculated from equation 15.
𝑇𝑇𝑜𝑜𝑠𝑠𝑝𝑝𝑝𝑝 𝑣𝑣𝑝𝑝𝑝𝑝𝑜𝑜𝑒𝑒 𝑠𝑠𝑝𝑝𝑣𝑣𝑒𝑒𝑠𝑠 = 𝑃𝑃𝑝𝑝𝑝𝑝𝑜𝑜𝑒𝑒 𝑜𝑜𝑓𝑓 𝑘𝑘𝑊𝑊ℎ 𝑠𝑠𝑜𝑜𝑝𝑝𝑠𝑠 + 𝑃𝑃𝑝𝑝𝑝𝑝𝑜𝑜𝑒𝑒 𝑜𝑜𝑓𝑓 𝑠𝑠𝑜𝑜𝑝𝑝𝑝𝑝𝐸𝐸 𝑠𝑠𝑜𝑜𝑛𝑛𝑠𝑠𝑜𝑜𝑐𝑐𝑒𝑒𝑠𝑠 (15)
The next consideration was to calculate the Net Present Value(NPV) of the considered systems. The NPV
gives a calculated (equation 10) worth of an asset based on a series of time and cash flow. The initial cash
flow for the calculation is taken for the “Installed” value of the system against the cash flows of money
generated by the system and money expended by the system (maintenance, replacement) over the period
of 25 years (the longest warranty of a component). A discount rate is also applied which is approximately
what one would expect from any other investment.
The Internal Rate of Return (equation 11) can then be calculated. IRR and NPV are used to grade
economic attractiveness of an investment for an investment to be worthwhile the IRR should be as high as
possible while the NPV should be as low as possible.
The system payback time is also calculated, this is when the overall system goes into profit. Ideally the
time should be as soon as possible across the project’s lifetime.
𝑆𝑆𝐸𝐸𝑠𝑠𝑠𝑠𝑒𝑒𝑐𝑐 𝑝𝑝𝑝𝑝𝐸𝐸𝑝𝑝𝑝𝑝𝑠𝑠𝑘𝑘 = 𝑆𝑆𝑡𝑡𝑡𝑡𝑚𝑚𝑡𝑡 𝑠𝑠𝑡𝑡𝑠𝑠𝑡𝑡𝑠𝑠𝑇𝑇𝑚𝑚𝑠𝑠ℎ 𝑑𝑑𝑚𝑚𝑓𝑓𝑡𝑡𝑡𝑡𝑖𝑖𝑠𝑠
(16)
The Return on Investment is calculated from equation 3 to show the gain or loss on the investment.
Finally the Levelled Cost of Electricity (LCOE) is calculated to give the measure of the price of
electricity produced/consumed by the system, over the life of the system. Ideally its value would be less
than the equivalent value of electricity purchased from the grid, but in terms of investment, that is not
always required.
4.7 Optimisation results and conclusions
Below will outline the results, comparisons and conclusions of the optimisation of the systems. Whilst
completing this optimisation a few assumptions have been made:

62
1. Yearly maintenance costs are $10. It is assumed the panels would be cleaned by the home owner
at the cost of cleaning products only.
2. Grid connection cost is $800. This is based on the one off charge by Ergon energy to connect new
Solar Home Systems to the grid.
3. The lifetime of the system is 25yrs. This is based on the longest warrantied component of the
system; replacement costs of other components have been factored into the calculations.
4. Installation charge of $1.40/W. This is the average rate for installations within Australia.
5. The max size of the 10kW system is 62.09m2 the smallest roof size outlined in section 4.2 is
95.8m2. All house sizes (small, medium and large) are able to support any system size (3, 5, 7 and
10kW).
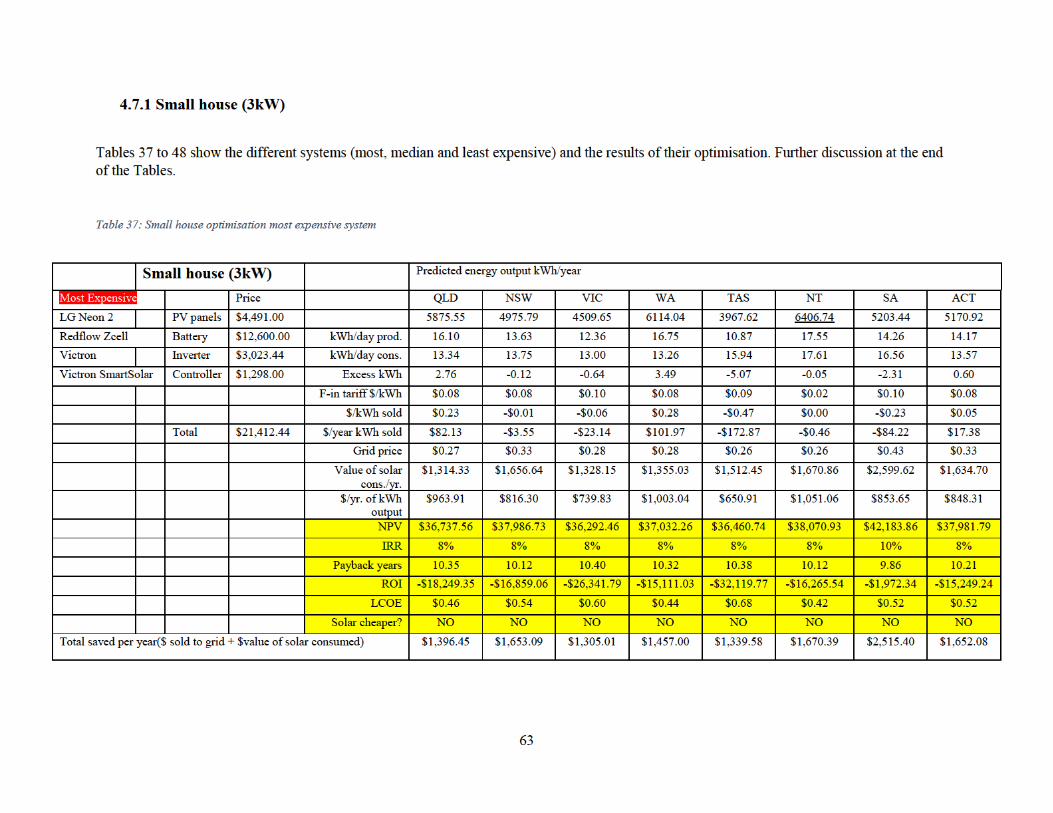
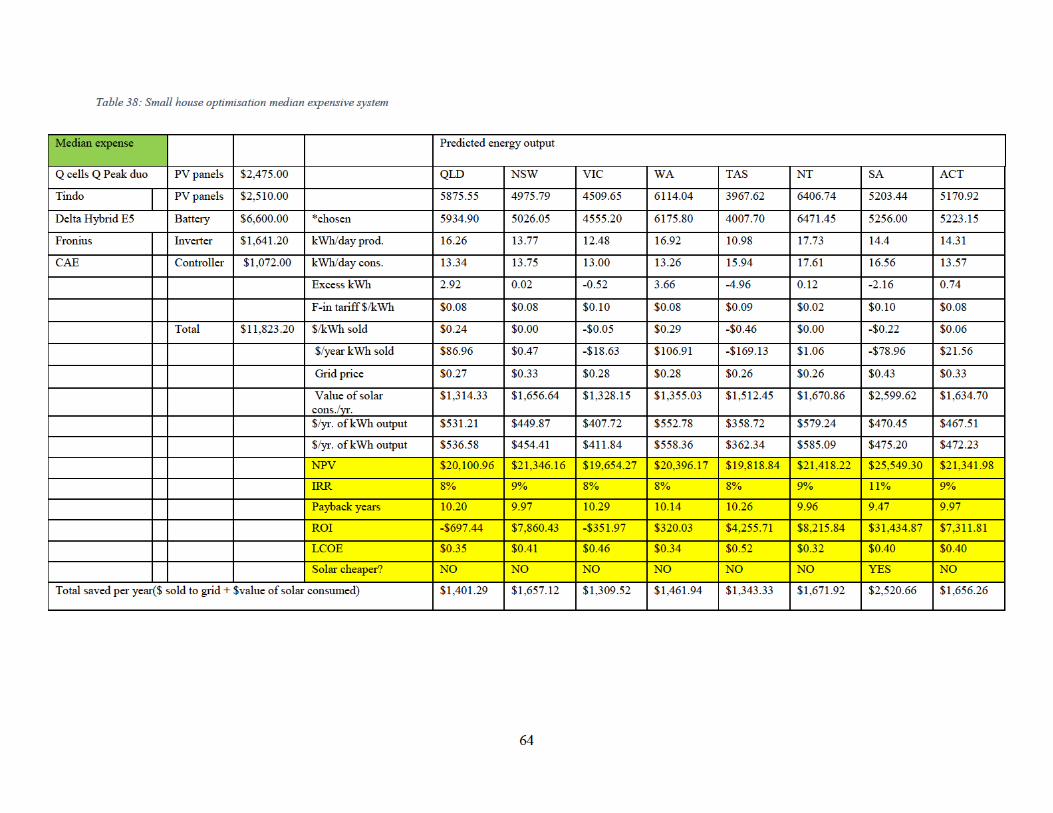
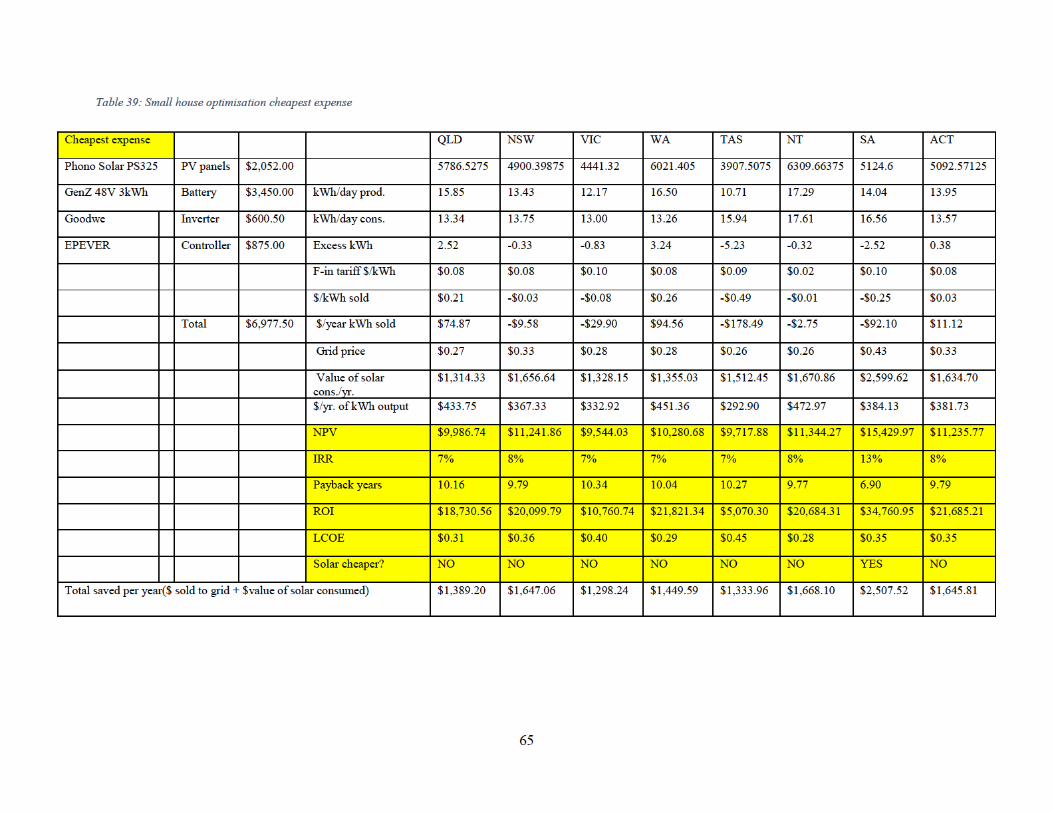

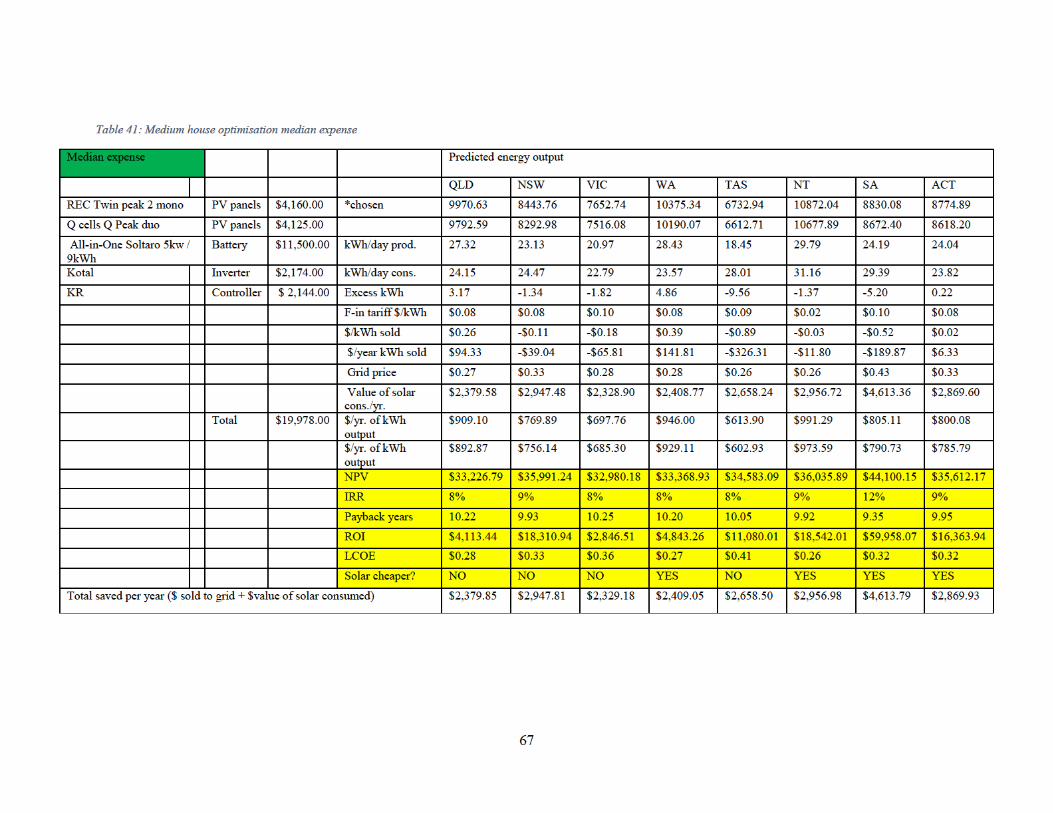
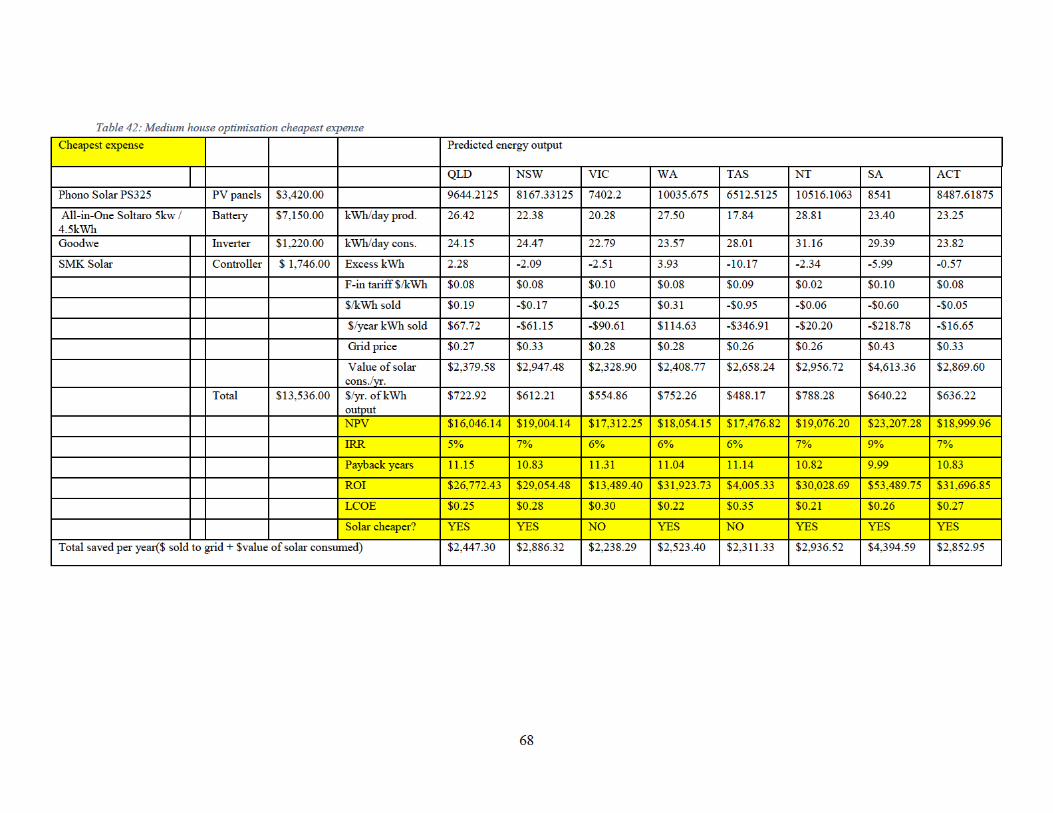

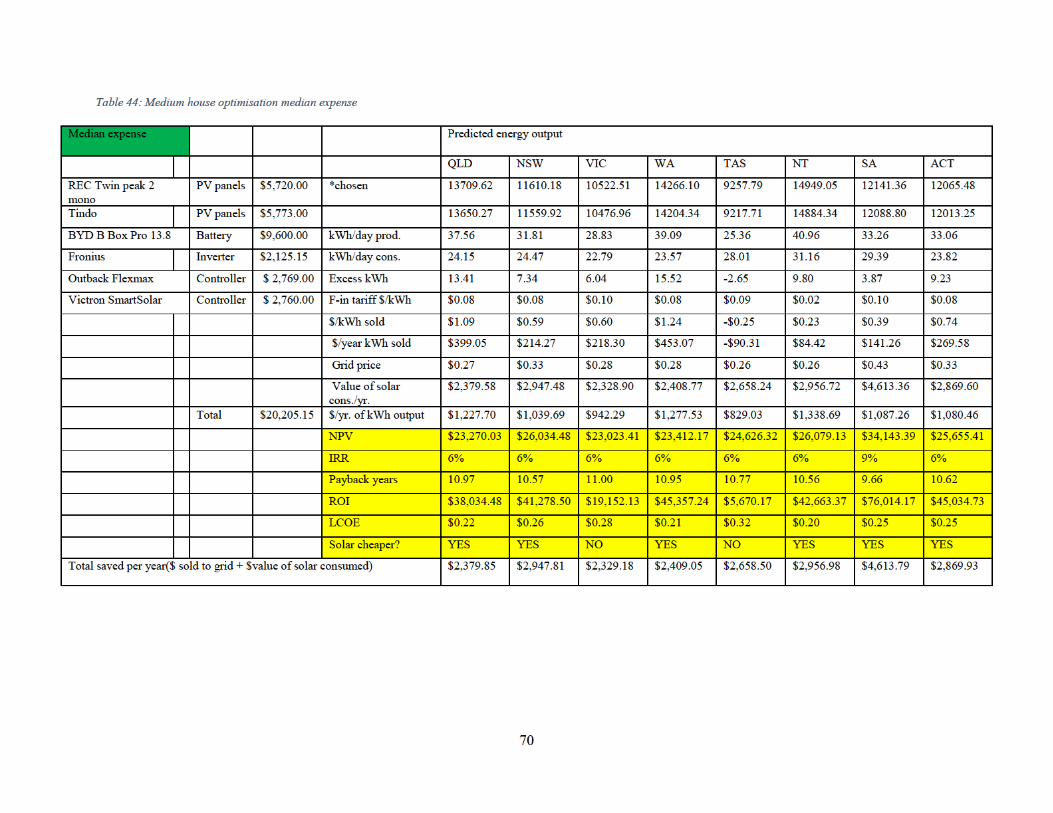
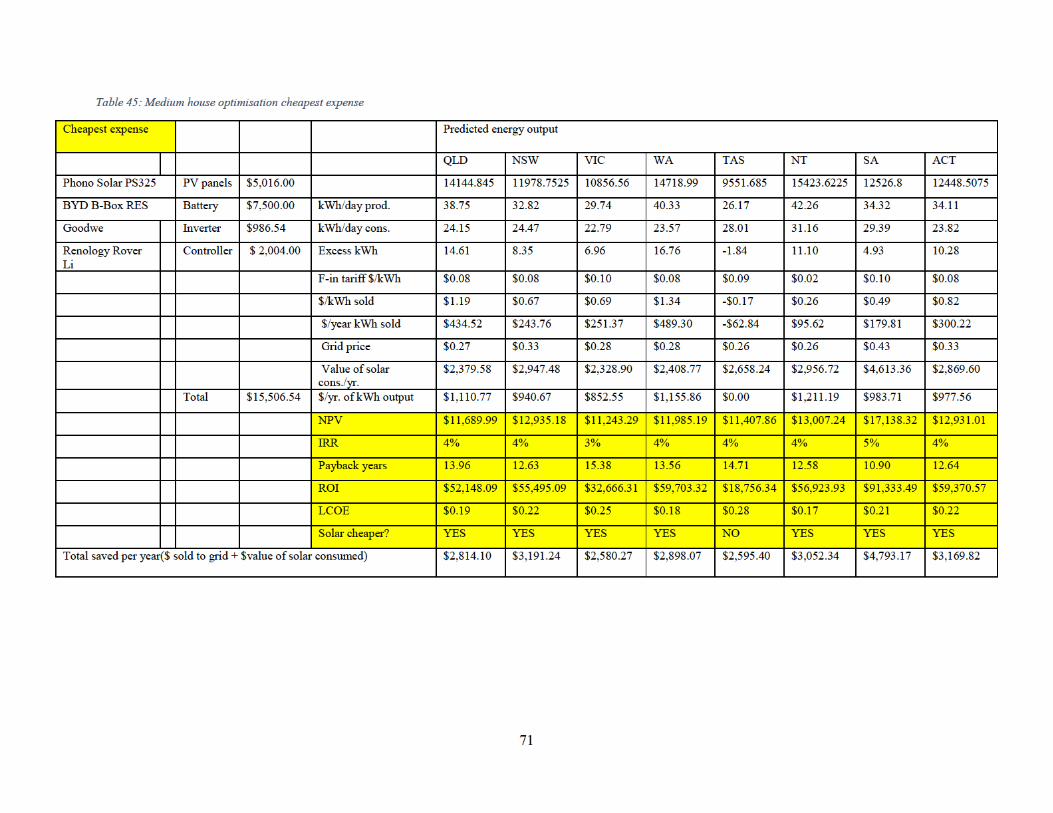


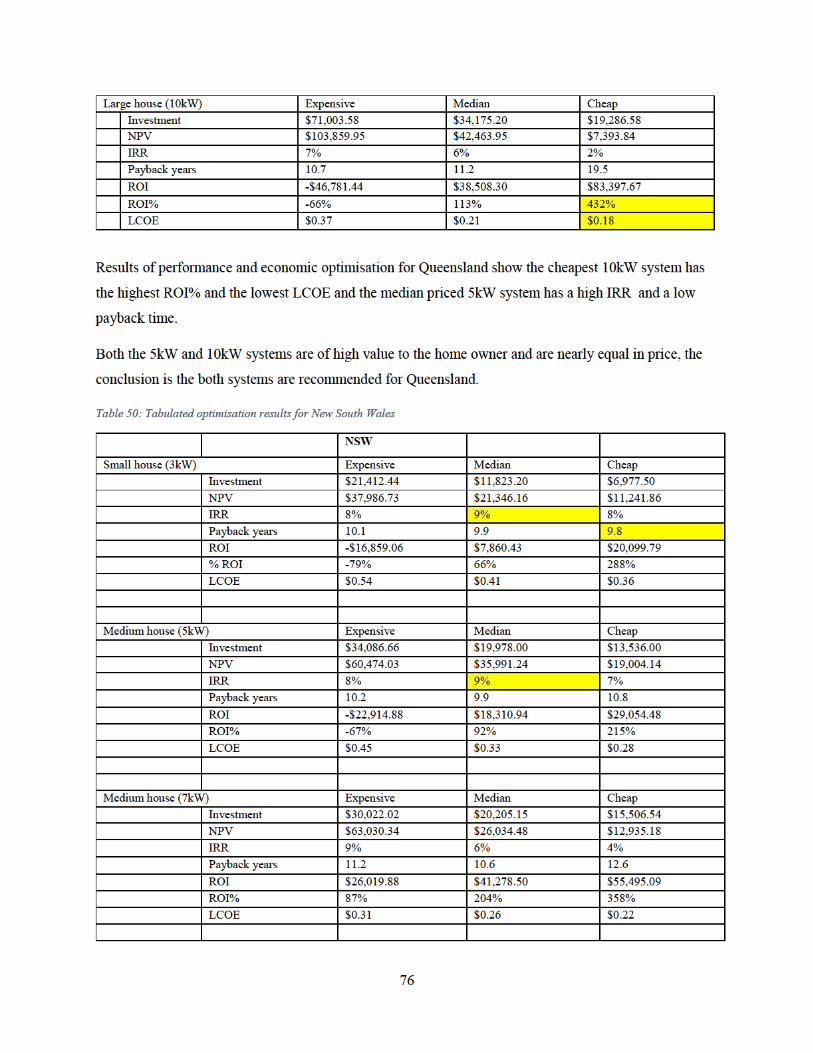


83
Chapter 5 Program Development
5.1 Package Script Development
The Excel base model/program was built based on all the datasets that had been used and collected for the
manual optimisation process. The program begins with the user entering their data via drop down menus.
Number of occupants, State, Closest city and Economic Preference are some of the selections the user
has. From there Excel scripting was used to calculate the user’s energy consumption based on load
profiles, Angle of incidence and finally a recommendation of a system that meets their specific
requirements.
The other, more in depth option is after the initial inputs outlined above the user would input every
possible appliance load in the home, the number of units and average hours used per day. For example a
user could select their specific washing machine brand then model and finally its usage per day and the
total kWh for the appliance would be calculated. After all appliance data is entered the program would
output a more accurate recommendation for a Solar Home System.
Screenshots of the above description and application can be seen in Appendix F.
Appendix E is a QR code link to an operational version of the program
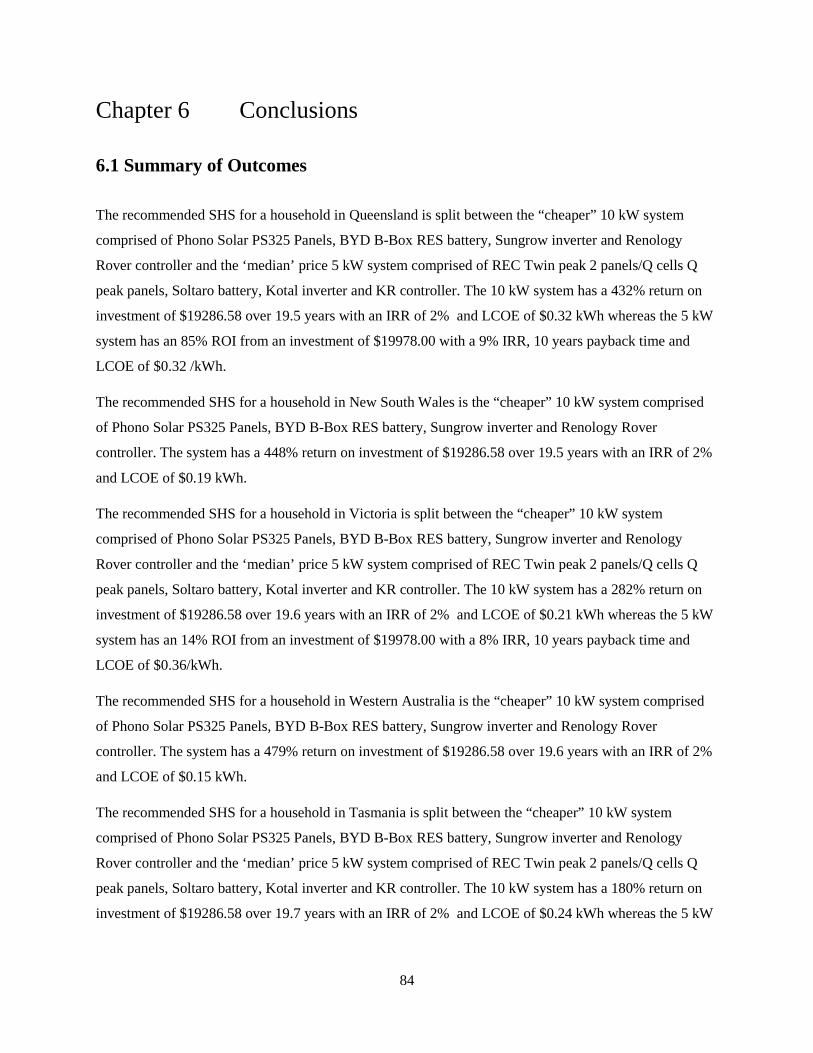
84
Chapter 6 Conclusions
6.1 Summary of Outcomes
The recommended SHS for a household in Queensland is split between the “cheaper” 10 kW system
comprised of Phono Solar PS325 Panels, BYD B-Box RES battery, Sungrow inverter and Renology
Rover controller and the ‘median’ price 5 kW system comprised of REC Twin peak 2 panels/Q cells Q
peak panels, Soltaro battery, Kotal inverter and KR controller. The 10 kW system has a 432% return on
investment of $19286.58 over 19.5 years with an IRR of 2% and LCOE of $0.32 kWh whereas the 5 kW
system has an 85% ROI from an investment of $19978.00 with a 9% IRR, 10 years payback time and
LCOE of $0.32 /kWh.
The recommended SHS for a household in New South Wales is the “cheaper” 10 kW system comprised
of Phono Solar PS325 Panels, BYD B-Box RES battery, Sungrow inverter and Renology Rover
controller. The system has a 448% return on investment of $19286.58 over 19.5 years with an IRR of 2%
and LCOE of $0.19 kWh.
The recommended SHS for a household in Victoria is split between the “cheaper” 10 kW system
comprised of Phono Solar PS325 Panels, BYD B-Box RES battery, Sungrow inverter and Renology
Rover controller and the ‘median’ price 5 kW system comprised of REC Twin peak 2 panels/Q cells Q
peak panels, Soltaro battery, Kotal inverter and KR controller. The 10 kW system has a 282% return on
investment of $19286.58 over 19.6 years with an IRR of 2% and LCOE of $0.21 kWh whereas the 5 kW
system has an 14% ROI from an investment of $19978.00 with a 8% IRR, 10 years payback time and
LCOE of $0.36/kWh.
The recommended SHS for a household in Western Australia is the “cheaper” 10 kW system comprised
of Phono Solar PS325 Panels, BYD B-Box RES battery, Sungrow inverter and Renology Rover
controller. The system has a 479% return on investment of $19286.58 over 19.6 years with an IRR of 2%
and LCOE of $0.15 kWh.
The recommended SHS for a household in Tasmania is split between the “cheaper” 10 kW system
comprised of Phono Solar PS325 Panels, BYD B-Box RES battery, Sungrow inverter and Renology
Rover controller and the ‘median’ price 5 kW system comprised of REC Twin peak 2 panels/Q cells Q
peak panels, Soltaro battery, Kotal inverter and KR controller. The 10 kW system has a 180% return on
investment of $19286.58 over 19.7 years with an IRR of 2% and LCOE of $0.24 kWh whereas the 5 kW

85
system has an 55% ROI from an investment of $19978.00 with a 8% IRR, 10 years payback time and
LCOE of $0.41/kWh
The recommended SHS for a household in the Northern Territory is the “cheaper” 10 kW system
comprised of Phono Solar PS325 Panels, BYD B-Box RES battery, Sungrow inverter and Renology
Rover controller. The system has a 459% return on investment of $19286.58 over 19.47 years with an
IRR of 2% and LCOE of $0.15 kWh.
The recommended SHS for a household in South Australia is split between the “cheaper” 10 kW system
comprised of Phono Solar PS325 Panels, BYD B-Box RES battery, Sungrow inverter and Renology
Rover controller and the ‘cheaper’ price 3 kW system comprised of Phono Solar PS325 panels, GENZ
battery, Goodwe inverter and EPEVER controller. The 10 kW system has a 710% return on investment of
$19286.58 over 19 years with an IRR of 3% and LCOE of $0.18 kWh whereas the 3 kW system has an
498% ROI from an investment of $6977.50 with a 13% IRR, 10 years payback time and LCOE of
$0.35/kWh.
The recommended SHS for a household in the Australian Capital Territory is the “cheaper” 10 kW system
comprised of Phono Solar PS325 Panels, BYD B-Box RES battery, Sungrow inverter and Renology
Rover controller. The system has a 477% return on investment of $19286.58 over 19.48 years with an
IRR of 2% and LCOE of $0.18 kWh
These recommendations are based solely on what an investor/home owner would consider desirable traits.
The system with the highest number of desirable traits is the recommended system. Personal investment
choice would play a large role the final decision on the system.
A possible generalisation that could be made from these results is that the 10 kW “cheaper” system is the
system best suited across all states due to its mention in all results. The suitability of this system is due in
part to is battery price being very low for its output. Other considerations would be to assess if corners
been cut in manufacturing on the cheaper priced components, but further research would be needed to
validate these generalisations.
6.2 Academic Contribution
The research questions that this project aims to achieve is to develop methods of evaluating the
considerations for designing a solar home system. The final program was developed from the techniques
of manual performance and economic optimisation via model creation.
86
The final program is aimed at assisting consumers with little knowledge of the renewable solar industry to
make more informed choices when it comes to investing in a personal solar home system. It is also hoped
that a program like this may help increase the uptake of these technologies as it has the ability to take
away a lot of the unknowns and misinformation that surround the subject.
6.3 Future Work
The first piece of future work is to continue testing the Excel model to further refine the outputs and
recommendations of the systems. Of greater importance is to conduct a validation study of my program
against an industry available alternative. The program works and give valid recommendations but without
validation testing these results are not conclusive.
One scenario of future work that is recommended would be the use of large scale battery banks for
industrial applications. Residential and industrial/commercial use have different load characteristics and
available space for housing batteries. The smaller Li-ion battery packs are ideal for indoor wall mounting
within home whereas industrial/commercial applications could employ the use of dedicated climate
controlled battery rooms capable of housing 10’s or 100’s of batteries or battery packs. Battery packs
could be designed for load specific use to reap most of the energy stored within.
Another future work could be the around the end of life of the Solar Home System components. Research
into ways to lessen their negative impact on the environment after years positive impact. Correct disposal
and sustainable processes of manufacturing parts should be a topic further developed.
One final concept is the ability to allow the PV panels to continue to produce energy in heavy pollution.
Similar to producing energy on cloudy days or even while raining the concept of a pollution proof PV
panel is worth investigating.
6.4 Evaluation of Aims and Objectives
The aims and objective of this project was to develop a program to assist a consumer in Australia in
choosing a solar home system based on their specific needs, uses and location. On completion I believe I
have achieved this aim by manually modelling state wide household load profiles, researching, analysing
and optimising all the data required for this program. The built Excel program allows a user to input their
personal data, economic preferences, location and household loads (or choose from the state average) and

87
the result is a recommend solar home system comprising of PV panels, battery, inverter, controller and
installation angle to assist in making informed decisions. From this result I believe I have achieved the
aims and objectives outlined at the commencement of this project.
6.5 Professional Reflection
Reflecting on this project some improvements to the research could have been greater access to accurate
load data. The data used for the project has mostly come from averages not actual meter reading that can
be expanded out for greater accuracy. Every effort was made to obtain this data but unfortunately it was
not made available due to privacy laws. I believe the data used to be accurate and stands as a good
reference for the project and its outcomes.
There is a large factor of future uncertainly with the costs involved in the research. Rising price of
electricity and the falling price of technology involved in solar home systems could hinder some of the
“25 year life time” calculations.

88
Chapter 7 Appendix Appendix A: Project Specification
ENG4111/4112 Research Project Project Specification
For: David Armstrong
Title: Smart model/package design for home base solar power grid
Major: Electrical/Electronic engineering
Supervisor: Dr Paul Wen
Enrolment: ENG4111 – EXT S1, 2019 ENG4112 – EXT S2, 2019
Project Aim: To develop a Smart model/package for a home-based solar power grid system
Programme: Version 1, 25th February 2019
1. Investigate current techniques related to off-grid / grid connected power systems.
2. Model a variety of off-grid systems for differing load profiles and different
system configurations.
3. Analyse results and provide the best optimised solution for a small, medium and large household (regardless of season) with varying locations.
4. Provide a conclusion that details a comparison between techniques and
performance in efficiency and capacity for each scenario / load profile / life span.
5. Develop a model or package which will recommend an ideal solar system which provides the best return on investment with a reasonable time expectancy


91
Appendix C: Timeline
Figure 14: Gantt chart timeline
David Armstrong61031355
1 2 3 4 5 6 7 8 9 10 11 12 13 14 15 16 17 18 19 20 21 22 23 24 25 26 27 28 29 30 31 32 33 34 35PART 1 - Start Up Phase1A: Resources check1B: Literature review1C: Collect load data1D: Collect data for batteries1E: Collect data for solar panelsPART 2 - Location Modelling2A: State analysis2B: City and town choice2C: Climate analysisPART 3 - Modelling Load Profiles3A: Small house profile3B: Medium house profile3C: Large house profile3D: Loads by State3E: Loads and production by State and house sizePART 4 - Data Analysis4A: Data gathering for heating/cooling4B: Data gathering for appliances4C: Data gathering for water heating and other appliances4D: Data gathering for cooking/lighting4E: Data gathering for PV panel/batteriesPART 5 - Conclusions5A: Prepare table of results and implicationsPART 6 - Package Development6A: Develop software package for recomenation of ideal systemPART 7 - Write up/Dissertation7A: Dissertation draft for feedback7B: ENG4902 Proff. Prac. 27C: Final dissertation and submission
Activity Week (week 1 commences 25 Feb. 2019)
Semester 1 ENG4111 Exams/Break Semester 2 ENG4112Break Break

92
Appendix D: References
ABC News. (2019). The annual average daily solar exposure across Australia. [online] Available at:
https://www.abc.net.au/news/2018-11-23/australias-sunniest-jurisdiction-1/10545422 [Accessed 29 May
2019].
Aemc.gov.au. (2019). [online] Available at: https://www.aemc.gov.au/sites/default/files/2018-
12/2018%20Price%20Trends%20-%20Final%20Report%20-%20CLEAN.PDF [Accessed 22 May 2019].
AEMC. (2019). Retail. [online] Available at: https://www.aemc.gov.au/energy-system/retail [Accessed 26
May 2019].
Ali, W, Farooq, H, Rehman, AU, Awais, Q, Jamil, M & Noman, A 2019, 'Design considerations of stand-
alone solar photovoltaic systems', in 2018 International Conference on Computing, Electronic and
Electrical Engineering, ICE Cube 2018, <https://www.scopus.com/inward/record.uri?eid=2-s2.0-
85061933355&doi=10.1109%2fICECUBE.2018.8610970&partnerID=40&md5=9084ed02a2067493282e
20c2b103ac66>.
Australiantownslist.com. (2019). Complete list of towns in Australia (Excel, SQL & CSV download).
[online] Available at: https://www.australiantownslist.com/ [Accessed 6 Apr. 2019].
Bom.gov.au. (2019). Climate information for solar energy, Bureau of Meteorology. [online] Available at:
http://www.bom.gov.au/climate/data-services/solar-information.shtml [Accessed 5 June. 2019].
Boxwell, M 2010, Solar Electricity Handbook: A Simple, Practical Guide to Solar Energy - Designing
and Installing Photovoltaic Solar Electric Systems, Greenstream Publishing.
93
Canstar Blue. (2019). Electricity Costs Per kWh | QLD, SA, VIC, NSW Rates – Canstar Blue. [online]
Available at: https://www.canstarblue.com.au/electricity/electricity-costs-kwh/ [Accessed 13 May 2019].
Ceylan, İ, Yilmaz, S, İnanç, Ö, Ergün, A, Gürel, AE, Acar, B & İlker Aksu, A 2019, 'Determination of the
heat transfer coefficient of PV panels', Energy, vol. 175, pp. 978-85.
CLEAN ENERGY REVIEWS. (2019). Top 10 Solar Panels - Latest Technology 2019. [online] Available
at: https://www.cleanenergyreviews.info/blog/2017/9/11/best-solar-panels-top-modules-review [Accessed
6 Apr. 2019].
CLEAN ENERGY REVIEWS. (2019). How solar power works, on-grid, off-grid and hybrid. [online]
Available at: https://www.cleanenergyreviews.info/blog/2014/5/4/how-solar-works [Accessed 1 Apr.
2019].
cleantechnica.com, (2018). sSolar-panel-prices-continue-falling-quicker-expected-cleantechnica-
exclusive/ [Accessed 2 Apr. 2019].
Commbank.com.au. (2019). Australian home sizes fall to 20-year low. [online] Available at:
https://www.commbank.com.au/guidance/newsroom/commsec-home-size-report-201711.html [Accessed
27 May 2019].
Data.gov.au. (2019). Search. [online] Available at: https://data.gov.au/dataset/ds-dga-559708e5-480e-
4f94-8429-c49571e82761/distribution/dist-dga-4b512c09-7ae7-4f0b-8e5f-c6402afdac96/details?q=
[Accessed 28 May 2019].
Davis, K. (2019). Why Is A Solar Energy The Best Renewable Energy Source? - Power From Sunlight.
[online] Power From Sunlight. Available at: https://www.powerfromsunlight.com/solar-energy-best-
renewable-energy-source/ [Accessed 19 Aug. 2019].
94
Diouf, B & Avis, C 2019, 'The potential of Li-ion batteries in ECOWAS solar home systems', Journal of
Energy Storage, vol. 22, pp. 295-301.
Diouf, B & Pode, R 2015, 'Potential of lithium-ion batteries in renewable energy', Renewable Energy, vol.
76, pp. 375-80.
Effect of Tilt Angle Orientation on Photovoltaic Module Performance. Available from:
https://www.researchgate.net/publication/260532829_Effect_of_Tilt_Angle_Orientation_on_Photovoltaic
_Module_Performance [accessed Apr 05 2019].
Energy Australia. (2019). Plans. [online] Available at:
https://www.energyaustralia.com.au/home/electricity-and-gas/plans [Accessed 25 May 2019].
Energy Matters. (2019). Renewable Energy News - Solar, Storage, Wind And More. [online] Available
at: https://www.energymatters.com.au/renewable-news/ [Accessed 27 May 2019].
Erdinc, O & Uzunoglu, M 2012, 'Optimum design of hybrid renewable energy systems: Overview of
different approaches', Renewable and Sustainable Energy Reviews, vol. 16, no. 3, pp. 1412-25.
Goodenough, JB & Park, K-S 2013, 'The Li-Ion Rechargeable Battery: A Perspective', Journal of the
American Chemical Society, vol. 135, no. 4, pp. 1167-76.
Google.com. (2019). Project Sunroof. [online] Available at: https://www.google.com/get/sunroof
[Accessed 27 May 2019].
Gwamuri, J & Mhlanga, S 2019, DESIGN OF PV SOLAR HOME SYSTEM FOR USE IN URBAN
ZIMBABWE.

95
Handoyo, EA, Ichsani, D & Prabowo 2013, 'The Optimal Tilt Angle of a Solar Collector', Energy
Procedia, vol. 32, pp. 166-75.
Investopedia. (2019). Net Present Value (NPV). [online] Available at:
https://www.investopedia.com/terms/n/npv.asp [Accessed 12 Aug. 2019].
Kamjoo, A, Maheri, A, Putrus, G & Dizqah, A 2012, OPTIMAL SIZING OF GRID-CONNECTED
HYBRID WIND-PV SYSTEMS WITH BATTERY BANK STORAGE.
Kern, J & Harris, I 1975, 'On the optimum tilt of a solar collector', Solar Energy, vol. 17, no. 2, pp. 97-
102.
Lgenergy.com.au. (2019). What Australian Standards are applicable to the installation of solar power
systems? [online] Available at: https://www.lgenergy.com.au/faq/did-you-know/what-australian-
standards-are-applicable-to-the-installation-of-solar-power-systems [Accessed 3 Apr. 2019].
Liu, H, Azuatalam, D, Chapman, AC & Verbič, G 2019, 'Techno-economic feasibility assessment of grid-
defection', International Journal of Electrical Power and Energy Systems, vol. 109, pp. 403-12.
Mapsofworld.com. (2019). Cities in Australia | Map of Australia Cities - Maps of World. [online]
Available at: https://www.mapsofworld.com/australia/cities/ [Accessed 29 May 2019].
Matasci, S. (2019). 2019 Average Solar Panel Size and Weight | EnergySage. [online] Solar News.
Available at: https://news.energysage.com/average-solar-panel-size-weight/ [Accessed 27 May 2019].

96
Merriam-webster.com. (2019). Definition of ANGLE OF INCIDENCE. [online] Available at:
https://www.merriam-webster.com/dictionary/angle%20of%20incidence [Accessed 6 Apr. 2019].
Mohanty, P, Karnamadakala, RS, Gujar, M, Kolhe, M & Nazmin Azmi, A 2015, 'PV System Design for
Off-Grid Applications', in vol. 196, pp. 49-84.
Nassereddine, M, Rizk, J, Nagrial, M & Hellany, A 2018, Battery sustainable PV solar house: Storage
consideration for off grid.
Off Grid Solar System - Small Off-Grid System Manufacturer from Ahmedabad. (2019). [online]
Available at: https://www.woltsolarproducts.com/off-grid-solar-system.html [Accessed 1 Apr. 2019].
Office, C. (2019). Standard Test Conditions (STC): definition and problems - Sinovoltaics - Your Solar
Supply Network. [online] Sinovoltaics - Your Solar Supply Network. Available at:
https://sinovoltaics.com/learning-center/quality/standard-test-conditions-stc-definition-and-problems/
[Accessed 25 Apr. 2019].
Photovoltaic-software.com. (2019). How to calculate output energy of PV solar systems? [online]
Available at: https://photovoltaic-software.com/principle-ressources/how-calculate-solar-energy-power-
pv-systems [Accessed 25 Apr. 2019].
Power.larc.nasa.gov. (2019). ArcGIS Web Application. [online] Available at:
https://power.larc.nasa.gov/data-access-viewer/ [Accessed 16 May 2019].
Sa.gov.au. (2019). SA.GOV.AU - Home energy use. [online] Available at:
https://www.sa.gov.au/topics/energy-and-environment/using-saving-energy/home-energy-use [Accessed
28 May 2019].

97
Science.nasa.gov. (2019). How do Photovoltaics Work? | Science Mission Directorate. [online] Available
at: https://science.nasa.gov/science-news/science-at-nasa/2002/solarcells [Accessed 2 Apr. 2019].
Shahan, Z. and Shahan, Z. (2019). Solar Panel Prices Continue Falling Quicker Than Expected
(#CleanTechnica Exclusive) | CleanTechnica. [online] CleanTechnica. Available at:
Singh, GK 2013, 'Solar power generation by PV (photovoltaic) technology: A review', Energy, vol. 53,
pp.1-13.
Solarcalculator.com.au. (2019). Optimal angle for solar panels in Australia. [online] Available at:
https://solarcalculator.com.au/solar-panel-angle/ [Accessed 6 Apr. 2019].
This Grandpa Blogs. (2019). Solar Charge Controller: PWM vs MPPT Compared. [online] Available at:
https://thisgrandpablogs.com/solar-charge-controller/ [Accessed 29 May 2019].
Timilsina, GR, Kurdgelashvili, L & Narbel, PA 2012, 'Solar energy: Markets, economics and policies',
Renewable and Sustainable Energy Reviews, vol. 16, no. 1, pp. 449-65.
Tradingeconomics.com. (2019). Australia Interest Rate | 2019 | Data | Chart | Calendar | Forecast | News.
[online] Available at: https://tradingeconomics.com/australia/interest-rate [Accessed 13 May 2019].
Valsala, KD, Premkumar, K & Beevi, AB 2019, 'Development of battery intervention power supply for
solar roof top installations', Environmental Progress and Sustainable Energy.
Zeraatpisheh, M, Arababadi, R & Saffari Pour, M 2018, 'Economic Analysis for Residential Solar PV
Systems Based on Different Demand Charge Tariffs', Energies, vol. 11, no. 12

98
Appendix E: Program QR Code
Figure 15: QR code

99
Appendix F: Program screenshots
Figure 16: Program- inputs selection
Figure 17: Program- house size selection

100
Figure 18: Program- state selection
Figure 19: Program- city selection

101
Figure 20: Program- economic preference selection
Figure 21: Program- investment amount selection

102
Figure 22: Program- averages based system recommendation
Figure 23: Program- inputting loads

103
Figure 24: Program- inputting loads continued
Figure 25: Program- final personal load-based recommendation