Slow Calcium Signals after Tetanic Electrical Stimulation in Skeletal Myotubes
10
Slow Calcium Signals after Tetanic Electrical Stimulation in Skeletal Myotubes Jose ´ M. Eltit, Jorge Hidalgo, Jose ´ L. Liberona, and Enrique Jaimovich Centro de Estudios Moleculares de la Ce ´lula, Instituto de Ciencias Biome ´dicas, Facultad de Medicina, Universidad de Chile, Santiago, Chile ABSTRACT The fluorescent calcium signal from rat myotubes in culture was monitored after field-stimulation with tetanic protocols. After the calcium signal sensitive to ryanodine and associated to the excitation-contraction coupling, a second long- lasting calcium signal refractory to ryanodine was consistently found. The onset kinetics of this slow signal were slightly modified in nominally calcium-free medium, as were both the frequency and number of pulses during tetanus. No signal was detected in the presence of tetrodotoxin. The participation of the dihydropyridine receptor (DHPR) as the voltage sensor for this signal was assessed by treatment with agonist and antagonist dihydropyridines (Bay K 8644 and nifedipine), showing an enhanced and inhibitory response, respectively. In the dysgenic GLT cell line, which lacks the a1 S subunit of the DHPR, the signal was absent. Transfection of these cells with the a1 S subunit restored the slow signal. In myotubes, the inositol 1,4,5- trisphosphate (IP 3 ) mass increase induced by a tetanus protocol preceded in time the slow calcium signal. Both an IP 3 receptor blocker and a phospholipase C inhibitor (xestospongin C and U73122, respectively) dramatically inhibit this signal. Long-lasting, IP 3 -generated slow calcium signals appear to be a physiological response to activity-related fluctuations in membrane potential sensed by the DHPR. INTRODUCTION The voltage-sensitive calcium channels belong to the ion channel super-family that includes K 1 and Na 1 selective channels as well. The pharmacological and electrophysio- logical diversity of these calcium channels is due mainly to the abundance of the a1 subunit isoforms and their as- sociation to a manifold of modulating subunits. In mam- mals, . 10 different genes encode for isoforms of the a1 subunit (Catterall, 2000). Historically, these channels have been classified according to the type of calcium current, its specific blocker, or its location. In skeletal muscle, the Cav1.1 calcium channel, also called a1 S or dihydropyridine receptor (DHPR), is the main type present. Electrophysio- logically it can be characterized by the L-type current and presents binding sites for dihydropyridines (Ertel et al., 2000; Catterall, 2000). The DHPR molecule was first purified from the transverse tubule (T tubule) of skeletal muscle (Curtis and Catterall, 1984). The whole receptor is a pentamer and the main subunit is the a1 subunit, whose structure resembles the pore forming subunit of the Na 1 channel (Catterall, 2000; Wolf et al., 2003). Although most of the membrane potential sensor studies have been done in either Na 1 or K 1 channels, the molecule domains involved in the voltage sensor are conserved in all of the voltage-gated cation channels and this knowledge can be extrapolated to the calcium channel (Catterall, 2000). The movement of the charged residues evidenced by the gating current gives support to the notion of a conformational change in the protein that shifts the open channel probability during membrane depolarization. This change is relevant during the T tubule depolarization and allows for the cross- talk between the DHPR and ryanodine receptor (RyR) (located in the sarcoplasmic reticulum), which is associated to the excitation-contraction (EC) coupling mechanism. Cumulative evidence demonstrates that the II-III loop of a1 S is the site of physical interaction between the DHPR and RyR1 (Tanabe et al., 1990; Grabner et al., 1999; Proenza et al., 2002). A detailed study of high potassium depolarization-induced calcium signals in myotubes has shown that, in addition to the well-established ryanodine-sensitive (fast) calcium signal related to EC coupling, there is a second (slow) calcium signal, which is refractory to ryanodine and it has besides the cytoplasmic component a marked nuclear component (Jaimovich et al., 2000; Estrada et al., 2001). The fast and slow signals share their dependency on DHPR activation as well as being independent of extracellular calcium. Thus, the calcium released in both situations originates from in- tracellular stores. When high potassium is used as the depolarization activator, the onset of the slow calcium signal is inhibited by the presence of either U73122 (phospholipase C (PLC) inhibitor), xestospongin C (inositol 1,4,5-tri- sphosphate receptor (IP 3 R) blocker), or 2-aminoetoxiphenil borate. These results suggest the involvement of IP 3 R in the slow calcium signal (Estrada et al., 2001). The cytosolic increase of IP 3 and diacylglycerol must reflect PLC activity and as a consequence, the elicited IP 3 will activate the release of Ca 21 from intracellular stores as a depolarization-dependent process. In addition, it will prime Ca 21 -dependent metabolic pathways, such as extracellular Submitted October 9, 2003, and accepted for publication January 22, 2004. Address reprint requests to Enrique Jaimovich, Centro de Estudios Moleculares de la Ce ´lula, Instituto de Ciencias Biome ´dicas, Facultad de Medicina, Universidad de Chile, Casilla 70005, Independencia 1027, Santiago 6530499, Chile. Tel.: 562-678-6510; Fax: 562-735-3510; E-mail: [email protected]. Ó 2004 by the Biophysical Society 0006-3495/04/05/3042/10 $2.00 3042 Biophysical Journal Volume 86 May 2004 3042–3051
Transcript of Slow Calcium Signals after Tetanic Electrical Stimulation in Skeletal Myotubes

Slow Calcium Signals after Tetanic Electrical Stimulation inSkeletal Myotubes
Jose M. Eltit, Jorge Hidalgo, Jose L. Liberona, and Enrique JaimovichCentro de Estudios Moleculares de la Celula, Instituto de Ciencias Biomedicas, Facultad de Medicina, Universidad de Chile,Santiago, Chile
ABSTRACT The fluorescent calcium signal from rat myotubes in culture was monitored after field-stimulation with tetanicprotocols. After the calcium signal sensitive to ryanodine and associated to the excitation-contraction coupling, a second long-lasting calcium signal refractory to ryanodine was consistently found. The onset kinetics of this slow signal were slightlymodified in nominally calcium-free medium, as were both the frequency and number of pulses during tetanus. No signal wasdetected in the presence of tetrodotoxin. The participation of the dihydropyridine receptor (DHPR) as the voltage sensor for thissignal was assessed by treatment with agonist and antagonist dihydropyridines (Bay K 8644 and nifedipine), showing anenhanced and inhibitory response, respectively. In the dysgenic GLT cell line, which lacks the a1S subunit of the DHPR, thesignal was absent. Transfection of these cells with the a1S subunit restored the slow signal. In myotubes, the inositol 1,4,5-trisphosphate (IP3) mass increase induced by a tetanus protocol preceded in time the slow calcium signal. Both an IP3 receptorblocker and a phospholipase C inhibitor (xestospongin C and U73122, respectively) dramatically inhibit this signal. Long-lasting,IP3-generated slow calcium signals appear to be a physiological response to activity-related fluctuations in membrane potentialsensed by the DHPR.
INTRODUCTION
The voltage-sensitive calcium channels belong to the ion
channel super-family that includes K1 and Na1 selective
channels as well. The pharmacological and electrophysio-
logical diversity of these calcium channels is due mainly to
the abundance of the a1 subunit isoforms and their as-
sociation to a manifold of modulating subunits. In mam-
mals, .10 different genes encode for isoforms of the a1
subunit (Catterall, 2000). Historically, these channels have
been classified according to the type of calcium current, its
specific blocker, or its location. In skeletal muscle, the
Cav1.1 calcium channel, also called a1S or dihydropyridine
receptor (DHPR), is the main type present. Electrophysio-
logically it can be characterized by the L-type current and
presents binding sites for dihydropyridines (Ertel et al.,
2000; Catterall, 2000). The DHPR molecule was first
purified from the transverse tubule (T tubule) of skeletal
muscle (Curtis and Catterall, 1984). The whole receptor is
a pentamer and the main subunit is the a1 subunit, whose
structure resembles the pore forming subunit of the Na1
channel (Catterall, 2000; Wolf et al., 2003). Although most
of the membrane potential sensor studies have been done in
either Na1 or K1 channels, the molecule domains involved
in the voltage sensor are conserved in all of the voltage-gated
cation channels and this knowledge can be extrapolated to
the calcium channel (Catterall, 2000).
The movement of the charged residues evidenced by the
gating current gives support to the notion of a conformational
change in the protein that shifts the open channel probability
during membrane depolarization. This change is relevant
during the T tubule depolarization and allows for the cross-
talk between the DHPR and ryanodine receptor (RyR)
(located in the sarcoplasmic reticulum), which is associated
to the excitation-contraction (EC) coupling mechanism.
Cumulative evidence demonstrates that the II-III loop of
a1S is the site of physical interaction between the DHPR and
RyR1 (Tanabe et al., 1990; Grabner et al., 1999; Proenza
et al., 2002).
A detailed study of high potassium depolarization-induced
calcium signals in myotubes has shown that, in addition to
the well-established ryanodine-sensitive (fast) calcium signal
related to EC coupling, there is a second (slow) calcium
signal, which is refractory to ryanodine and it has besides
the cytoplasmic component a marked nuclear component
(Jaimovich et al., 2000; Estrada et al., 2001). The fast and
slow signals share their dependency on DHPR activation as
well as being independent of extracellular calcium. Thus, the
calcium released in both situations originates from in-
tracellular stores. When high potassium is used as the
depolarization activator, the onset of the slow calcium signal
is inhibited by the presence of either U73122 (phospholipase
C (PLC) inhibitor), xestospongin C (inositol 1,4,5-tri-
sphosphate receptor (IP3R) blocker), or 2-aminoetoxiphenil
borate. These results suggest the involvement of IP3R in the
slow calcium signal (Estrada et al., 2001).
The cytosolic increase of IP3 and diacylglycerol must
reflect PLC activity and as a consequence, the elicited IP3will activate the release of Ca21 from intracellular stores as
a depolarization-dependent process. In addition, it will prime
Ca21-dependent metabolic pathways, such as extracellular
Submitted October 9, 2003, and accepted for publication January 22, 2004.
Address reprint requests to Enrique Jaimovich, Centro de Estudios
Moleculares de la Celula, Instituto de Ciencias Biomedicas, Facultad de
Medicina, Universidad de Chile, Casilla 70005, Independencia 1027,
Santiago 6530499, Chile. Tel.: 562-678-6510; Fax: 562-735-3510; E-mail:
� 2004 by the Biophysical Society
0006-3495/04/05/3042/10 $2.00
3042 Biophysical Journal Volume 86 May 2004 3042–3051

signal-regulated kinase phosphorylation, increased by de-
polarization (Powell et al., 2001; Carrasco et al., 2003).
These results indicate that in muscle cells there are at least
two calcium releasing mechanisms activated by depolariza-
tion, a fast one linked through RyR to EC coupling and
a slow one, mediated by IP3, which is detectable in the nu-
cleus as well as in the cytoplasm. Therefore, the differential
localization of IP3 receptors will provide for a differential
signaling response to depolarization events, particularly if
the depolarization signal, as it occurs in muscle, has the
distinct feature of being repetitive in nature with varying
frequencies. The physiological role of the slow calcium
signal in the nucleus remains to be clarified, but it appears to
be involved in the activation of transcription factors and the
eventual control of gene expression mediated by calcium
(Carrasco et al., 2003).
In this work we present a detailed study of the calcium
signaling evoked by an extracellular field electrical stimu-
lation. We performed the procedure using electrical rather
than high potassium stimulation, because it yields a closer
representation of the physiological condition found during
tetanic stimulation. We tested the hypothesis whether DHPR
as a voltage sensor (Araya et al., 2003) is mediating both
types of calcium signals, the fast one dependent on RyR and
the slow one evoked through PLC activation.
MATERIALS AND METHODS
Cell cultures
Neonatal rat myotubes were cultured as previously described by Jaimovich
et al. (2000). Briefly, muscle tissue from the hind limbs of from 12- to 24-h
postnatal rat pups was mechanically dispersed and then treated with 0.2%
(wt/vol) collagenase for 15 min at mild agitation. The suspension was
filtered through Nytex membrane or lens tissue paper and spun down at low
speed. A 10- to 15-min preplating was done for enrichment of myoblasts,
then cells were plated at densities of 3.5 3 105/dish (35 mm) and 9.5 3
105/dish (60 mm) for Ca12 measurements and IP3 binding, respectively.
Plating media was DMEM-Ham’s F-12, 10% bovine serum, 2.52% fetal calf
serum, 100 mg/l penicillin, 50 mg/l streptomycin, and 2.5 mg/l amphotericin
B. For fluorescence measurements, the cells were plated on round coverslips
pretreated with a 1% gelatin solution placed in the culture dishes for 30 min.
To eliminate remaining fibroblasts, 10 mM of cytosine arabinoside was
added at the third day of culture. After 36 h in culture, fetal calf serum
concentration was reduced to 1.8% (vol/vol) to induce differentiation.
Myotubes in the dish, some spontaneously contracting, with an estimated
purity .90%, were visible after the fifth day of culture and they were used
for experiments after 6–8 days in culture. DMEM-F12 medium, bovine
serum, and fetal bovine serum were from GIBCO BRL (Carlsbad, CA).
Cytosine arabinoside, penicillin, streptomycin, and amphotericin B were
from Sigma-Aldrich (St. Louis, MO).
Cell lines
We used the mutant mouse cell line GLT (muscular dysGenic, mdg/mdg,
line transfected with the large T antigen), and the wild-type muscle cell line
NLT, prepared from dysgenic and normal littermate cultures, respectively
(Powell et al., 1996). A GLT-a1 cell line was derived from a stable-
transfected clone of the GLT cell with the a1S DHPR subunit that was
selected by neomycin resistance as recently described in our laboratory by
Araya et al (2003). The expression of the a1S-DHPR subunit in the GLT-a1
cell line was studied by Western blot and immunohistochemistry (Araya
et al., 2003). We also used the 1B5 cell line, which was a generous gift from
Dr. Paul Allen. The 1B5 cells were allowed to grow to 50–80% confluence
and then the serum composition of the medium was changed to 2% horse
serum to induce cell differentiation and fusion to yield multinucleated
myotubes. Cells were plated following the same procedures used for primary
cultured myotubes.
Cell pretreatment
Before a specific experiment, the cells were incubated from 30 to 60 min
with 10 mM tetrodotoxin (TTX) (Sigma-Aldrich), 10–30 mM ryanodine
(Sigma-Aldrich), 1 mMnifedipine (Sigma-Aldrich), 2 mM (�)S-Bay K 8644
(RBI, Natick, MA), 5 mM xestospongin C (Calbiochem, La Jolla, CA), or 30
mMU73122 (Sigma-Aldrich), in Krebs buffer (145 mMNaCl, 5 mMKCl, 1
mM CaCl2, 1 mM MgCl2, 10 mM HEPES-Na, 5.6 mM glucose, pH 7.4).
Then, the cells were loaded with fluo-3-acetoximethylester (Fluo-3 AM,
Molecular Probes, Eugene, OR) in the Krebs buffer in the presence of the
given pharmacological agent for another 20 min. The coverslips were
mounted in a 1-ml capacity chamber and washed three times and incubated
in Krebs solution (also in the presence of the drug) leaving the cells ready for
stimulation. Alternatively, for the free calcium condition, after incubation
with the dye and washout, the cells were switched to a free-calcium saline
(145 mM NaCl, 5 mM KCl, 0.5 mM EGTA, 2 mMMgCl2, 10 mM HEPES-
Na, 5.6 mM glucose, pH 7.4). For the control condition, cells were subjected
to the same procedure but only with vehicle instead of the drug.
ELECTRICAL STIMULATION
Slow calcium signal acquisition
The 1-ml chamber with the cells was placed in the stage of an
inverted microscope equipped with epifluorescence illumi-
nation by a 100-W mercury lamp (Olympus T041, New
Hyde Park, NY). The side port is connected to a CCD cooled
camera (MCD600, Spectra Source Instruments, Westlake
Village, CA); the full or partial image acquisition is com-
puter-controlled through macros that operate the software
provided by the manufacturer. The same program controls
the generation of the electrical pulse train by a stimulator in
which the modifications of frequency, number of pulses,
duration of each pulse, and intensity are easily controlled.
These pulses were delivered to the dish by a pair of platinum
electrodes placed within 3 mm of each other. The electrode
assembly is set 1–2 mm over the cells with a micromanip-
ulator, leaving those that are in focus between the two wires.
A filter wheel (Lambda 10-2, Sutter Instruments, Novato,
CA) works as a shutter of fluorescence illumination and is
also controlled by the image acquisition software. In this
system we cannot capture images during the tetanic stimu-
lation, so that the shutter was always in the closed position
and once the protocol of stimulation ended, a sequence of 80
images, each of 200-ms exposure, were acquired every 6.6 s.
Thus illumination was limited to the exposure time plus
some mechanical timing overhead, which allowed the lowest
possible rate of dye bleaching. Image processing was done
off-line with the public domain ImageJ software (Rasband,
Calcium Signals by Tetanic Stimulation 3043
Biophysical Journal 86(5) 3042–3051
1997); curvefitting and graphs were performed with Origin
6.0 (OriginLab, Northampton, MA).
Fast calcium signal measurements
For the acquisition of the calcium signal during the tetanus
stimulation, the CCD camera is inadequate. So the light
corresponding to the center of the visual field of the micro-
scope was collected on the side port of the microscope by an
optic fiber and attached to a photodiode amplifier assembly
whose output was connected to an A/D converter (Labmaster
DMA, Scientific Solutions, Mentor, OH). The rise time for
this system is 0.5 ms; therefore, in these experiments the
output was filtered to 2 KHz with an 8-pole Bessel filter
(Frequency Devices, Haverhill, MA) and digitized at 10
KHz. In this way, we were able to sample the fast fluorescent
transients from a cell during a single pulse or a tetanus
protocol.
Measurements of IP3 mass changes in response toelectrical stimulation
The IP3 mass measurement was performed in myotubes
cultured in 60-mm dishes. To obtain a homogeneous elec-
trical stimulation of all the cells in the dish, we built a
stimulation device that consists of a row of six platinum
wires intercalated 1 cm apart with alternate polarity across
a circular plastic holder that fits in the dish. The two
terminals were connected to a stimulator unit with manual
control of the frequency, intensity, and duration of each
pulse. The square pulses were monitored displaying the
signal in an oscilloscope. To verify the effectiveness of this
stimulation system, the cells were subjected to low frequency
stimulation (0.2 Hz) and the generalized cell contraction was
visually monitored under the microscope. This electrode
arrangement can induce an effective cell contraction in
.85% of the cells in the dish.
The IP3 measurement was performed as previously
described by Jaimovich et al. (2000). Briefly, myotubes
were rinsed and preincubated for 20 min in Krebs buffer;
after the electrical stimulation, at the times indicated, the
Krebs buffer was aspired, followed by the addition of 0.8 M
ice-cold perchloric acid, and freezing with liquid nitrogen.
Samples were allowed to thaw and cell debris was spun
down for protein determination (Hartree, 1972). The
supernatant was neutralized with a solution of 2 M KOH,
0.1 M 2-[n-morpholinoethanesulfonic] acid, and 15 mM
ethylenediaminetetraacetic acid (EDTA). These extracts
were kept frozen until required for IP3 mass determination
by a radio-receptor assay (Liberona et al., 1998). Briefly,
a crude rat cerebellum membrane preparation was obtained
after homogenization in 50 mM Tris-HCl, pH 7.7, 1 mM
EDTA, 2 mM b-mercaptoethanol, and centrifugation at
20,000 3 g for 15 min. This procedure was repeated three
times, and the final pellet was resuspended in the same
solution plus 0.3 M sucrose and then frozen at �80�C until
use. The membrane preparation was calibrated for IP3binding with 1.6 nM 3H-IP3 (D-[2-3H]-myo-inositol 1,4,5-trisphosphate), specific activity 21.0 Ci/mmol (DuPont/
NEN, Boston, MA), and 2–120 nM cold IP3 (Sigma-
Aldrich). The sample analysis was performed in a similar
way but an aliquot of the neutralized supernatant was added
instead of cold IP3. The 3H-IP3 radioactivity remaining
bound to the cerebellar membranes was measured in
a Beckman LS-6000TA liquid scintillation spectrometer
(Beckman Instruments, Fullerton, CA).
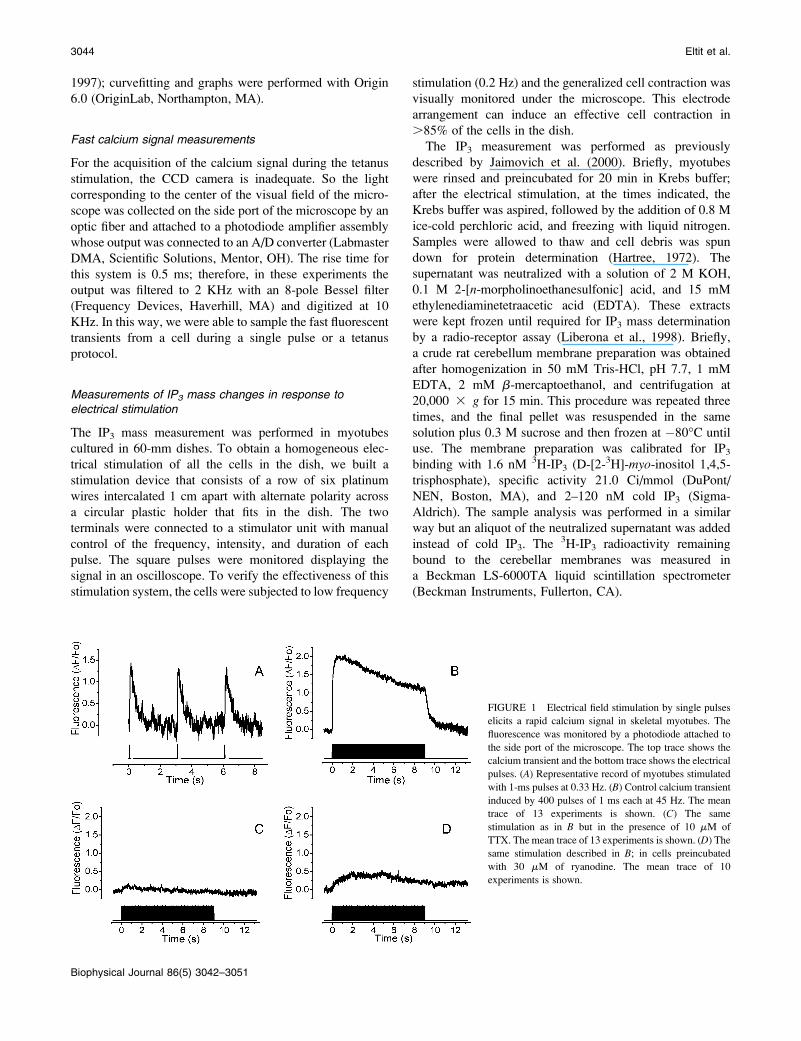
FIGURE 1 Electrical field stimulation by single pulses
elicits a rapid calcium signal in skeletal myotubes. The
fluorescence was monitored by a photodiode attached to
the side port of the microscope. The top trace shows the
calcium transient and the bottom trace shows the electrical
pulses. (A) Representative record of myotubes stimulated
with 1-ms pulses at 0.33 Hz. (B) Control calcium transient
induced by 400 pulses of 1 ms each at 45 Hz. The mean
trace of 13 experiments is shown. (C) The same
stimulation as in B but in the presence of 10 mM of
TTX. The mean trace of 13 experiments is shown. (D) Thesame stimulation described in B; in cells preincubated
with 30 mM of ryanodine. The mean trace of 10
experiments is shown.
3044 Eltit et al.
Biophysical Journal 86(5) 3042–3051

Image and data analysis
The captured image sequence for an experiment was baseline
corrected by subtraction of a prestimulus fluorescent image.
The mean intensity of a 25 3 25 pixel region of interest
located either in the nucleus or the cytoplasm was collected
to represent F(t). The signal was normalized as fF(t)�F(0)g/F(0) and fitted to the logistic function providing values for
maximum fluorescence and half-time for rise, t1/2. The
photodiode signal from the falling phase of a single transient
was fitted to a single exponential decay function. Data of nexperiments were expressed as mean 6 SE and analyzed by
unpaired Student’s t-test, and one-way ANOVA followed by
the Dunnet’s post test. A P value,0.05 was considered to be
statistically significant.
RESULTS
Electrical pulses induce a TTX and ryanodine-sensitive fast calcium signal
Single twitch events were obtained by a low-frequency
(0.33 Hz) 1-ms stimulus protocol. Fig. 1 A shows the single
calcium transients obtained with such protocol. The shape of
this calcium transient closely corresponds to those pre-
viously reported (Kubis et al., 2003; Kasielke et al., 2003).
Kinetically, the calcium transient induced by low-frequency
stimulation has a single exponential decay with a time
constant of 0.3256 0.019 s (Table 1). At a higher frequency
of stimulation (45 Hz, Fig. 1 B) the calcium fluorescence
initially peaked to 2.01 6 0.19 DF/Fo; then the plateau
decayed slowly during the stimulation protocol (9 s). Once
the stimulation was over, calcium decreased to basal levels
with a time course that shows no statistical difference when
compared to that for a single pulse. The fact that there are no
differences in decay kinetics implies that the mechanisms for
intracellular calcium store refilling were not altered by the
high-frequency stimulation. To verify that the electrical
protocol induced action potentials that in turn activated the
intracellular calcium release mechanism, the voltage-de-
pendent sodium channels were blocked with TTX. Under
these conditions, there is no calcium rise induced by either
the 0.33-Hz or the 45-Hz stimulation protocols (14 and 13
total inhibition, respectively, out of a total of 15 experiments
for each condition, Fig. 1 C). To define whether in our
experimental conditions the action potentials activated
a RyR-dependent intracellular calcium release, we exposed
myotubes to 30 mM ryanodine, a concentration that is in-
hibitory of release through its receptor. Under these con-
ditions, close to 80% of the calcium signal was blocked
(Fig. 1 D).
Slow calcium signal induced byelectrical stimulation
As described above, during electrical stimulation the
myotubes show a fast calcium transient that appears to be
mediated by RyR activation. Once the stimulus is over,
calcium rapidly returns to the basal level, but a few seconds
TABLE 1 Parameters for the decay of the calcium transient
Frequency (Hz) (DF/Fo)max Decay time constant t (s)
0.33 1.48 6 0.14 0.325 6 0.019
45 2.01 6 0.19 0.439 6 0.068
No significant differences were found (n ¼ 5).
FIGURE 2 Slow calcium signal induced by electrical field stimulation.
A sequence of images was taken with the CCD camera attached to the
epifluorescence microscope side port equipped with the correct filters to
capture the Fluo-3 AM fluorescence to monitor the intracellular Ca12 level.
The fast calcium transient is not shown because the images were taken after
the end of the stimulus, but in some cases, the tail of the fast component is
visualized. The cells were stimulated with 400 pulses of 1 ms each at 45 Hz.
The overall signal transient may last nearly 5 min. (A) Increase of intra-
cellular calcium induced by electrical stimulation when the cell is in nominal
free extracellular calcium (0 calcium saline plus 0.5 mM EGTA). (B) The
quantification of the slow calcium signal in the presence (solid circles) andabsence (open circles) of extracellular calcium. The analyzed regions of
interest were from nuclear zones of the cells and were quantified with ImageJ
software. The mean of 12 independent experiments 6 SE is shown and the
bottom trace shows the moment of the stimulus application.
Calcium Signals by Tetanic Stimulation 3045
Biophysical Journal 86(5) 3042–3051

later, a long lasting calcium signal starts to rise (Fig. 2 A).The nuclear regions show a slightly higher fluorescence than
the cytoplasmic region during this slow calcium transient but
kinetically, nuclear and cytoplasmic components show the
same behavior. A likely source for this difference may be
explained by a dissimilar distribution of Fluo-3 between both
compartments. In this work, the signal from a nuclear region
of interest was routinely used. When the cells were stim-
ulated with 400 pulses of 1 ms duration at 45 Hz, the slow
calcium signal shows a half-time (t1/2) for maximal calcium
increase of 54.34 6 4.56 s in the presence of extracellular
calcium and of 98.406 7.92 s in the nominally calcium-free
saline (Fig. 2 B, Table 2). The maximal fluorescence change
reached was very similar in both conditions (0.735 6 0.079
and 0.733 6 0.046 DF/Fo for calcium and calcium-free
media, respectively). The presence or absence of chamber
perfusion did not alter significantly the slow calcium signal,
indicating that the amount of perturbation produced by the
field stimulation was local and transient.
To identify a relationship between the stimulation pro-
tocols and the slow calcium signal, cells were exposed to 400
(1-ms) pulses at three different frequencies (10, 45, and 90
Hz; Fig. 3 A). All these experiments were performed in the
absence of extracellular calcium. Interestingly, both at 10
and 90 Hz there is a similar response with a t1/2 of 51.03 6
21.62 and 49.30 6 3.14 s, respectively; both kinetics are
faster than those found at 45 Hz.
When the cells were stimulated with a different number of
pulses (100, 400, or 600 pulses at 45 Hz), the slow calcium
transient increased its rate of rise, as in a dose-dependent
event (Fig. 3 B). The stimulation with 100 pulses, apart from
a small tail signal, did not show a slow response. On the
other hand, at 400 and 600 pulses, t1/2 values of 98.406 7.92
and 28.316 1.57 s were found and the maximal fluorescence
increased by 51.3% (from 0.733 6 0.046 to 1.109 6 0.069
DF/Fo). These results point toward a functional relationship
between the putative membrane depolarization sensor and
the slow calcium response with a threshold level for the
number of depolarizing events required to elicit the response.
The slow calcium signal was blocked by TTX andwas insensitive to ryanodine
As shown above, during high-frequency stimulation the cells
triggered action potentials. To block the action potential
generation by the field stimulation, the cells were exposed to
10 mM TTX in the presence of extracellular calcium. In this
series of experiments the slow calcium signal was com-
pletely absent (Fig. 4 A), suggesting that the action potential
and not the extracellular electrical stimulation by itself is the
trigger for the slow calcium signal. To study the role of RyRs
in calcium release from intracellular stores during the slow
calcium signal, cells were exposed to 10 and 30 mM
ryanodine in the absence of extracellular calcium. Neither 10
nor 30 mM ryanodine affected the slow calcium signal (Fig.
4 B). Moreover, the latter shows a slightly enhanced slow
calcium response. An additional source of evidence to
support the notion that RyR was not involved in the slow
calcium signal came from the electrical stimulation of cells
from the 1B5 line, where the slow calcium signal was still
present (data not shown).
The DHPR is the membrane potential sensorfor the slow calcium signal
When primary myotubes were exposed to nifedipine in
a calcium-free medium, the slow calcium signal was com-
pletely blocked (Fig. 5 A). Similar results were obtained
using diltiazem and verapamil (data not shown). On the other
hand, when myotubes were pretreated with the stimulatory
dihydropyridine agonist (�)S-Bay K 8644, in the absence of
extracellular calcium (Fig. 5 A), the slow calcium signal
became faster than in the control condition (t1/2 ¼ 37.27 6
2.56 and t1/2 ¼ 98.40 6 7.92 s, respectively) together with
a slight increase (20%) in the maximal fluorescence (Table
2). These results suggest that the active conformation of the
DHPR is involved in the intracellular transduction to ori-
ginate the slow calcium signal in response to high-frequency
stimulation. To further verify the role of the DHPR as a
voltage sensor, when a skeletal muscle cell line derived from
dysgenic mice (GLT cell line) was subjected to the electrical
protocol (Fig. 5 B), the lack of the a1S subunit of the DHPR
was sufficient to abolish the slow calcium response. As a
positive control, a cell line derived from wild-type mice
(NLT cells) shows a slow calcium signal resembling that of
primary myotubes. Furthermore, when a GLT clone stable-
transfected with the DHPR-a1S subunit was exposed to the
electrical stimulation the slow calcium signal was recovered,
showing that the DHPR is essential to elicit the slow calcium
signal.
TABLE 2 Slow calcium signal properties under different conditions
Calcium Calcium-free TTX Ryanodine* Nifedipine* Bay K*
t1/2 54.34 6 4.56 (12) 98.40 6 7.92y (12) NS (7) 66.61 6 5.17z (10) NS (13) 37.27 6 2.56§ (16)
(DF/Fo)max 0.735 6 0.079 (12) 0.733 6 0.046 (12) NS (7) 0.974 6 0.073z (10) NS (13) 0.880 6 0.044z (16)
Values given represent mean 6 SE (n); NS, no signal.
*Experiments performed in calcium-free media.yP , 0.01 vs. calcium condition.zP , 0.05 vs. calcium-free condition.§P , 0.01 vs. calcium-free condition.
3046 Eltit et al.
Biophysical Journal 86(5) 3042–3051

Both PLC and IP3 are involved in the slowcalcium signal
A role of both PLC and IP3 has previously been described for
potassium depolarization-induced slow calcium signals
(Jaimovich et al., 2000; Estrada et al., 2001). We measured
the kinetics of IP3 mass increase induced by electrical sti-
mulation protocols. In Fig. 6 A, the comparative kinetics
between IP3 mass and calcium after electrical depolarization
is shown. The mass of IP3 shows a transient increase with
a maximum 75 s after the end of stimulation, corresponding
to a few seconds before the slow calcium signal peak was
reached.
When the cells were exposed to 5 mM xestospongin C,
a known blocker of IP3R (Gafni et al., 1997), the maximum
fluorescence of the slow calcium signal diminished from
0.733 6 0.046 to 0.225 6 0.045 DF/Fo (Fig. 6 B). This is69.3% less than the control condition (Fig. 6 B).To evaluate the role of PLC in the slow calcium signal,
cultures were exposed to U73122, a PLC inhibitor, and then
exposed to the electrical stimulation. This inhibitor dim-
inished the maximal fluorescence from 0.980 6 0.077 to
0.3776 0.049 DF/Fo, which is a decrease of 61.5% from the
control value (Fig. 6 C).
DISCUSSION
Our laboratory has previously shown that in myotubes,
potassium depolarization elicits a fast, ryanodine-sensitive
calcium transient related to EC coupling. This signal is
followed by a second slow calcium transient, unrelated to
FIGURE 3 Variations in the frequency or number of pulses modify the
shape of the slow calcium signal. The following protocols of electrical
stimulation were used. (A) Different frequencies: the cells were exposed to
400 pulses of 1 ms at 10 Hz (squares), 45Hz (circles), or 90 Hz (triangles).(B) Different number of pulses: myotubes were exposed to 100 (squares),
400 (circles), or 600 (triangles) pulses of 1 ms at 45 Hz. All experiments
were performed in the absence of extracellular calcium (0.5 mM EGTA
added). The mean of at least 12 independent experiments 6 SE is shown.
The lower trace shows the duration of the stimulus protocol.
FIGURE 4 The slow calcium signal is blocked by TTX and is refractory
to ryanodine. The myotubes were exposed to 400 pulses of 1 ms at 45 Hz.
(A) The experiments were performed in normal saline with calcium (solidcircles) and 10 mM TTX (solid squares). The mean of at least seven in-
dependent experiments 6 SE is shown. (B) The fluorescence signals after
the exposure to 10 mM (open squares) and 30 mM (open circles) of ryano-
dine, and the control condition without extracellular calcium (0.5 mM
EGTA, open triangles), are shown. The mean of at least 10 independent
experiments 6 SE is shown. The lower trace shows the timing of the
stimulation protocol.
Calcium Signals by Tetanic Stimulation 3047
Biophysical Journal 86(5) 3042–3051

contraction, that depends on IP3 receptors and can be related
to regulation of gene expression (Jaimovich et al., 2000;
Powell et al., 2001; Carrasco et al., 2003). Recently, a role
for DHPRs as voltage sensors for the slow calcium signal
induced by high potassium depolarization was proposed
(Araya et al., 2003). In contrast to the electrical stimulation,
the high potassium depolarization clamps the membrane
voltage to a depolarized condition (Jaimovich and Rojas,
1994). When the voltage-gated channels are subjected to
a prolonged period of depolarization, they will transit from
closed to open and later to inactivated conformational states
(Bezanilla, 2000) where, despite the positive membrane
potentials, the channels will remain nonconductive until the
resting potential is recovered. The model for the DHPR
voltage sensing in skeletal muscle proposed by Rios and
collaborators (Rios and Pizarro, 1991) gives a reference
framework to follow the operational state of the channel. In
it, the channel may be present in either active or inactive
conformations. The closed-to-open transition in the active
conformation gives rise to a Q1 type of charge movement
and the closed-to-inactive conformation (nonconductive)
gives rise to a Q2 type of charge movement. We do not know
which conformational state or transition of the DHPR
conveys the signaling for the slow calcium response, but
the use of an external electrical field as stimulus to generate
action potentials allows us to cycle the DHPR through its
voltage-dependent kinetic states. Also, in contrast to the high
potassium depolarization, it gives us the option of eliciting
a controlled number of effective stimuli to the cell, which
may mimic in part the motor unit activity.
To verify that the stimulation by itself was insufficient to
elicit this type of response, we tested two different protocols,
low-frequency and tetanic high-frequency stimulations. In
both conditions the calcium transient induced during
stimulation was completely blocked by TTX, showing that
action potentials, and not the extracellular electrical field
itself, trigger EC coupling. Moreover, the fast calcium
transient was blocked by ryanodine as expected from the
known physiological role of ryanodine receptors in EC
coupling.
We have shown here that a tetanic stimulation generates
an action potential-dependent slow calcium response. In our
experimental conditions, we need .200 pulses (each pulse
of 1 ms) with at least a 10-Hz repetition rate to obtain the
characteristic slow response. The onset of this response
occurs near 20–50 s after the end of the stimulation protocol
and lasts for at least 5 min. Considering that the signal
obtained by high potassium depolarization starts 3–4 s after
the stimulus and lasts for 20–30 s (Jaimovich et al., 2000;
Araya et al., 2003), it suggests that this delayed but enhanced
slow calcium response originates from the activated rather
than the inactivated state of the DHPR. In an effort to
understand the relationship between stimulation frequency
and slow calcium signals, we stimulated the myotubes with
400 pulses at 10, 45, and 90 Hz. Surprisingly, the onset
kinetics for the slow signal at 10 and 90 Hz shows a very
similar response, which is in both cases faster than the one
present at 45 Hz. A plausible explanation for this result is
that at 10 Hz the cell has enough time between pulses to
repolarize completely, so that all the pulses elicit an action
potential and the DHPR will be sensing each action potential
and be reprimed afterwards. In contrast, at 45 Hz, even if the
cell may generate all action potentials driven by the sodium
channel, the DHPR, which has slower kinetics, may not fully
recover from inactivation, becoming unable to sense every
depolarization event, resulting in a delayed signal. On the
FIGURE 5 The DHPR is the membrane potential sensor for the slow
calcium signal. Myotubes were stimulated with 400 pulses of 1 ms at 45 Hz.
(A) The myotubes in nominally zero calcium (open circles) were exposed to1 mM of (�)-S-Bay K 8644, a DHPR activator (open squares), and 1 mM
nifedipine (open triangles). The mean for each condition of at least 13
independent experiments 6 SE is shown. (B) Myotubes derived from the
dysgenic skeletal muscle cell line (GLT, open squares), the wild-type mice
derived cell line (NLT, open circles), and a GLT clone stable-transfected
with the DHPR-a1S subunit (GLT-a1, open triangles) were exposed to the
same stimulation protocol as described in A. The experiments were
performed in the absence of extracellular calcium. The mean of at least
six independent experiments 6 SE for each condition is shown. The lower
trace indicates the time of stimulation.
3048 Eltit et al.
Biophysical Journal 86(5) 3042–3051

other hand, at 90 Hz the cells may not generate all the action
potentials (not enough time for sodium reactivation), which
mimics a lower frequency stimulation.
The increase in the slow calcium response associated with
the number of pulses at the same frequency of delivery
indicates a temporal summation over the kinetics for the
underlying process. This dose response-like phenomenon
suggests that the effect on the voltage sensor can be additive
at the cell level to allow modulation of the slow calcium
response.
Interestingly, the nominal absence of extracellular calcium
does not block the signal, implying that calcium comes from
intracellular stores. The comparison of the calcium-free with
the control condition shows that the absence of external
calcium delays the signal without a change in the maximum
fluorescence value. The kinetic differences between these
two conditions may be explained by calcium influx during
the beginning of the slow signal. Alternatively, the low
calcium condition may shift the voltage activation curve of
the DHPR (Brum et al., 1988), leaving fewer channels
available for the active state. This will have a slow down
propagation effect along the transductional pathway. One
fact that supports the second explanation is that the maxi-
mum fluorescence in both conditions remains the same.
Under our experimental conditions, the slow calcium
signal induced by electrical field stimulation is not blocked
by ryanodine. This finding agrees well with the measured
slow calcium responses in 1B5 cells (skeletal muscle cell line
without RyR, data not shown), showing that as previously
demonstrated for high potassium depolarization (Estrada
et al., 2001), calcium released through IP3Rs is responsible
for the slow signal. The observed increase in t1/2 and peak
amplitude of the slow calcium signal at high ryanodine con-
centrationmay be related to the subconductance state at which
the channel is left by the blocker that in turn could prime
the overall calcium response.
To study in more detail the participation of the DHPR in
the signal transduction path of the slow calcium signal, cells
were exposed to an antagonist (nifedipine) and an agonist
(�)S-Bay K dihydropyridine (Hockerman et al., 1997). In
low calcium, nifedipine will have an additive effect of
shifting the DHPR to the inactive state (Rios and Pizarro,
1991; Squecco et al., 2004), also seen as a decrease in force
generation (Dulhunty and Gage, 1988). Our results show that
nifedipine completely blocks the slow calcium signal,
FIGURE 6 PLC and IP3R are involved in the slow calcium signal. (A) The
kinetics of IP3 production induced by electrical stimulation is shown (open
circles). Myotube cultures were exposed to 400 pulses of 1 ms at 45 Hz.
Then IP3 mass was measured as described in Materials and Methods. Each
time point indicates the mean 6 SE of three independent experiments. The
difference in the response is statistically significant (**, P , 0.01) in
comparison to the control condition. Superimposed is shown the slow
calcium signal in the same temporal scale (solid squares) for the mean of 12
independent experiments 6 SE for the same condition. (B) The slow
calcium signal induced by electrical stimulation in the conditions described
above was measured in the presence of the IP3R blocker xestospongin C
(solid squares); the control condition in the absence of extracellular calcium
(0.5 mM EGTA) is shown (open squares). The mean of at least 12
independent experiments6 SE is shown. (C) Inhibition of the slow calcium
signal in the presence of the PLC inhibitor U73122 (solid squares). The
signal obtained for the control condition is also shown (open squares). Ineach case, the mean of at least 12 independent experiments 6 SE is shown.
The lower trace indicates the timing for the stimulation protocol.
Calcium Signals by Tetanic Stimulation 3049
Biophysical Journal 86(5) 3042–3051

supporting the notion that this molecule’s voltage sensor
is the structural feature that interfaces the membrane de-
polarization and the release of calcium through the IP3R to
generate the slow calcium signal. Interestingly, Bay K
strongly accelerates the slow calcium signal t1/2 with an
increase of the maximum fluorescence (Table 2), which
correlates well with its known action of increase in open
channel probability (Hess et al., 1984). This agent also shows
a voltage-dependent antagonistic action, shifting and low-
ering the crisscrossing point to the left of the voltage axis
(Artigas et al., 2003). In our experimental conditions, the
fraction of the sensors bound to the drug in an inactivated
conformation will reduce the availability of the Q1 receptors,
but the remaining activated channels (charge 1) will have
a favored kinetics toward the open state, enhancing the
transductional effect on the slow calcium signal onset.
Another fact that supports the DHPR role in the slow
calcium signal is the complete absence of response in
electrically stimulated myotubes derived from the dysgenic
cell line (GLT). In contrast, myotubes derived from both the
normal cell line (NLT) and the cells stable-transfectedwith the
a1S subunit to the GLT cell line (GLT-a1) present the slow
calcium response.All together, this data strongly suggests that
the active conformation of the DHPR induced by membrane
depolarization activates in turn the IP3 signal transduction
mechanism for the development of the slow calcium signal.
Previous reports from our laboratory have shown that the
potassium depolarization induces the IP3 increase by PLC
activation that in turn activates the IP3R involved in the slow
calcium release (Jaimovich et al., 2000; Estrada et al., 2001).
Also we have reported that IP3Rs are present in the skeletal
myotubes; interestingly enough, they are placed in the peri-
nuclear region and the sarcoplasmic reticulum (Jaimovich
et al., 2000; Powell et al., 2001). This placement may explain
the cytosolic and nuclear components of the slow calcium
signal induced by electrical stimulation. To verify the role of
the PLC in the slow calcium signal induced by electrical
stimulation, wemeasured the kinetics of IP3mass production.
The IP3 curve shows a twofold increase inmasswith respect to
the control condition, which correlates very well with the
calcium signal kinetics described in this work (Fig. 6 A). Thisresult gives additional support to the notion that IP3 may be
the second messenger involved in development of slow
calcium signals. The comparison of the kinetics of IP3 mass
previously described for potassium depolarization with those
described here presents some differences that may reflect the
procedural origin of those kinetics. The potassium-induced
change has two peaks, one at 2–3 s and another at 15 s after the
onset of depolarization. Then, the IP3 amount returns to the
basal levels between 50 and 60 s in the high-potassium
condition (Jaimovich et al., 2000). Meanwhile, the electri-
cally stimulated cells present a single component that starts
after 30 s and finishes 100–125 s after the stimulus ends.
These kinetic differences do explain the different shapes of
slow calcium signals for both conditions.
To further evaluate the role of IP3 as the agonist in the
generation of the slow calcium signal, myotubes were
exposed to xestospongin C, an IP3R blocker; this agent
strongly inhibited the maximum fluorescence (69.3% with
respect to the control condition, Fig. 6 B). In addition,
treatment of myotubes with U73122, an inhibitor of PLC,
also strongly inhibited the signal. These results support the
idea of PLC activation after electrical stimulation. The
inhibitory effect found with these agents points toward the
participation of both PLC and IP3 as the main mechanism for
calcium release during the slow calcium signal induced by
electrical stimulation, corroborating what was previously
described for potassium depolarization (Estrada et al., 2001).
Kinetically, in the presence of inhibitors there appears to
be a shorter delay for the onset of the slow calcium rise
compared with control conditions. This observation sug-
gests, on one hand, that an IP3-insensitive component may
be present and, on the other, that the IP3 system is also
necessary to explain the delay observed in these signals.
Recently we have described (Araya et al., 2003) how the
high potassium-induced slow calcium signal is pertussis
toxin-sensitive, indicating the possible participation of the
trimeric Gi protein as a molecular transducer between DHPR
and PLC. The PLC family includes 11 isoenzymes that have
been divided into four groups: four PLC-b, two PLC-g, four
PLC-d, and the recently identified PLC-e. Each PLC group
has different modules that give a singular activation
mechanism (Rebecchi and Pentyala, 2000; Rhee, 2001). In
particular, all PLC-b isoforms can be activated by both Gaq
or Gbg released from the Gi trimer. One speculative
mechanism of depolarization-induced PLC activation would
involve the participation of Gbg and PLCb, but further
studies must be performed to elucidate this process.
In summary, this work clearly shows that the slow calcium
signal is an event driven by DHPR in response to repetitive
activation of its intrinsic voltage-sensing structure. This slow
signal does not contribute to the cell contraction; indeed, the
maximal fluorescence obtained for the slow signal is less
than one-half that obtained during the fast calcium transient
in the same experiment (data not shown). Thus, the cytosolic
calcium concentration reached during the RyR-dependent
signal is much larger than the concentration reached during
the IP3R-dependent signal. Nevertheless, the extended time
course of the slow calcium signal, in particular at the
nucleus, may modulate the calcium-dependent signal path-
ways involved in cellular homeostasis and adaptation to
environmental changes relayed by the degree of electrical
activity at the sarcolemma.
The authors thank Monica Silva for cell culture preparation and Susana
Vargas and Roni Silvestre for preliminary data.
Financial support from a Comision Nacional de Investigacion Cientıfica y
Tecnologica predoctoral fellowship to J.M.E. and a Fondo Nacional de
Investigacion en Areas Prioritarias project grant (15010006) is also
acknowledged.
3050 Eltit et al.
Biophysical Journal 86(5) 3042–3051

REFERENCES
Araya, R., J. L. Liberona, J. C. Cardenas, N. Riveros, M. Estrada, J. A.Powell, A. Carrasco, and E. Jaimovich. 2003. Dihydropyridine receptorsas voltage sensors for a depolarization-evoked, IP3R-mediated, slowcalcium signal in skeletal muscle cells. J. Gen. Physiol. 121:3–16.
Artigas, P., G. Ferreira, N. Reyes, G. Brum, and G. Pizarro. 2003. Effects ofthe enantiomers of BayK 8644 on the charge movement of L-type Cachannels in guinea-pig ventricular myocytes. J. Membr. Biol. 193:215–227.
Bezanilla, F. 2000. The voltage sensor in voltage-dependent ion channels.Physiol. Rev. 80:555–592.
Brum, G., R. Fitts, G. Pizarro, and E. Rios. 1988. Voltage sensors of thefrog skeletal muscle membrane require calcium to function in excitation-contraction coupling. J. Physiol. 398:475–505.
Carrasco, M. A., N. Riveros, J. Rios, M. Muller, F. Torres, J. Pineda, S.Lantadilla, and E. Jaimovich. 2003. Depolarization-induced slowcalcium transients activate early genes in skeletal muscle cells. Am.J. Physiol. Cell Physiol. 284:C1438–C1447.
Catterall, W. A. 2000. Structure and regulation of voltage-gated Ca21
channels. Annu. Rev. Cell Dev. Biol. 16:521–555.
Curtis, B. M., and W. A. Catterall. 1984. Purification of the calciumantagonist receptor of the voltage-sensitive calcium channel from skeletalmuscle transverse tubules. Biochemistry. 23:2113–2118.
Dulhunty, A. F., and P. W. Gage. 1988. Effects of extracellular calciumconcentration and dihydropyridines on contraction in mammalianskeletal muscle. J. Physiol. 399:63–80.
Ertel, E. A., K. P. Campbell, M. M. Harpold, F. Hofmann, Y. Mori,E. Perez-Reyes, A. Schwartz, T. P. Snutch, T. Tanabe, L. Birnbaumer,R. W. Tsien, and W. A. Catterall. 2000. Nomenclature of voltage-gated calcium channels. Neuron. 25:533–535.
Estrada, M., C. Cardenas, J. L. Liberona, M. A. Carrasco, G. A. Mignery,P. D. Allen, and E. Jaimovich. 2001. Calcium transients in 1B5 myo-tubes lacking ryanodine receptors are related to inositol trisphosphatereceptors. J. Biol. Chem. 276:22868–22874.
Gafni, J., J. A. Munsch, T. H. Lam, M. C. Catlin, L. G. Costa, T. F.Molinski, and I. N. Pessah. 1997. Xestospongins: potent membranepermeable blockers of the inositol 1,4,5-trisphosphate receptor. Neuron.19:723–733.
Grabner, M., R. T. Dirksen, N. Suda, and K. G. Beam. 1999. The II–IIIloop of the skeletal muscle dihydropyridine receptor is responsible forthe bi-directional coupling with the ryanodine receptor. J. Biol. Chem.274:21913–21919.
Hartree, E. F. 1972. Determination of protein: a modification of the Lowrymethod that gives a linear photometric response. Anal. Biochem. 48:422–427.
Hess, P., J. B. Lansman, and R. W. Tsien. 1984. Different modes of Cachannel gating behaviour favoured by dihydropyridine Ca agonists andantagonists. Nature. 311:538–544.
Hockerman, G. H., B. Z. Peterson, B. D. Johnson, and W. A. Catterall.1997. Molecular determinants of drug binding and action on L-typecalcium channels. Annu. Rev. Pharmacol. Toxicol. 37:361–396.
Jaimovich, E., R. Reyes, J. L. Liberona, and J. A. Powell. 2000. IP3receptors, IP3 transients, and nucleus-associated Ca21 signals in culturedskeletal muscle. Am. J. Physiol. Cell Physiol. 278:C998–C1010.
Jaimovich, E., and E. Rojas. 1994. Intracellular Ca21 transients induced byhigh external K1 and tetracaine in cultured rat myotubes. Cell Calcium.15:356–368.
Kasielke, N., G. J. Obermair, G. Kugler, M. Grabner, and B. E. Flucher.2003. Cardiac-type EC-coupling in dysgenic myotubes restored withCa21 channel subunit isoforms a1C and a1D does not correlate withcurrent density. Biophys. J. 84:3816–3828.
Kubis, H. P., N. Hanke, R. J. Scheibe, J. D. Meissner, and G. Gros. 2003.Ca21 transients activate calcineurin/NFATc1 and initiate fast-to-slowtransformation in a primary skeletal muscle culture. Am. J. Physiol. CellPhysiol. 285:C56–C63.
Liberona, J. L., J. A. Powell, S. Shenoi, L. Petherbridge, R. Caviedes, andE. Jaimovich. 1998. Differences in both inositol 1,4,5-trisphosphate massand inositol 1,4,5-trisphosphate receptors between normal and dystrophicskeletal muscle cell lines. Muscle Nerve. 21:902–909.
Powell, J. A., M. A. Carrasco, D. S. Adams, B. Drouet, J. Rios, M. Muller,M. Estrada, and E. Jaimovich. 2001. IP3 receptor function andlocalization in myotubes: an unexplored Ca12 signaling pathway inskeletal muscle. J. Cell Sci. 114:3673–3683.
Powell, J. A., L. Petherbridge, and B. E. Flucher. 1996. Formation of triadswithout the dihydropyridine receptor a-subunits in cell lines fromdysgenic skeletal muscle. J. Cell Biol. 134:375–387.
Proenza, C., J. O’Brien, J. Nakai, S. Mukherjee, P. D. Allen, and K. G.Beam. 2002. Identification of a region of RyR1 that participates inallosteric coupling with the a1S (CaV1.1) II–III loop. J. Biol. Chem.277:6530–6535.
Rasband, W. S. 1997. ImageJ, National Institutes of Health, Bethesda,Maryland. http://rsb.info.nih.gov/ij.
Rebecchi, M. J., and S. N. Pentyala. 2000. Structure, function, and controlof phosphoinositide-specific phospholipase C. Physiol. Rev. 80:1291–1335.
Rhee, S. G. 2001. Regulation of phosphoinositide-specific phospholipaseC. Annu. Rev. Biochem. 70:281–312.
Rios, E., and G. Pizarro. 1991. Voltage sensor of excitation-contractioncoupling in skeletal muscle. Physiol. Rev. 71:849–908.
Squecco R., C. Bencini, C. Piperio, and F. Francini. 2004. L-Type Ca21
channel and ryanodine receptor cross-talk in frog skeletal muscle.J. Physiol. 555:137–157.
Tanabe, T., K. G. Beam, B. A. Adams, T. Niidome, and S. Numa. 1990.Regions of the skeletal muscle dihydropyridine receptor critical forexcitation-contraction coupling. Nature. 346:567–569.
Wolf, M., A. Eberhart, H. Glossmann, J. Striessnig, and N. Grigorieff.2003. Visualization of the domain structure of an L-type Ca21 channelusing electron cryo-microscopy. J. Mol. Biol. 332:171–182.
Calcium Signals by Tetanic Stimulation 3051
Biophysical Journal 86(5) 3042–3051