
Slides for Chapter 20 - Software Quality Engineering: Testing ...
28
Tian: Software Quality Engineering Slide (Ch.20) 1 Software Quality Engineering: Testing, Quality Assurance, and Quantifiable Improvement Jeff Tian, [email protected] www.engr.smu.edu/∼tian/SQEbook Chapter 20. Defect Classification and Analysis • General Types of Defect Analyses. • ODC: Orthogonal Defect Classification. • Analysis of ODC Data. Wiley-IEEE/CS Press, 2005 Slides V2 (2007)
-
Upload
khangminh22 -
Category
Documents
-
view
0 -
download
0
Transcript of Slides for Chapter 20 - Software Quality Engineering: Testing ...

Tian: Software Quality Engineering Slide (Ch.20) 1
Software Quality Engineering:
Testing, Quality Assurance, and
Quantifiable Improvement
Jeff Tian, [email protected]/∼tian/SQEbook
Chapter 20. Defect Classification and
Analysis
• General Types of Defect Analyses.
• ODC: Orthogonal Defect Classification.
• Analysis of ODC Data.
Wiley-IEEE/CS Press, 2005 Slides V2 (2007)

Tian: Software Quality Engineering Slide (Ch.20) 2
Defect Analysis
• Goal: (actual/potential) defect↓ or quality↑
in current and future products.
• General defect analyses:
. Questions: what/where/when/how/why?
. Distribution/trend/causal analyses.
• Analyses of classified defect data:
. Prior: defect classification.
. Use of historical baselines.
. Attribute focusing in 1-way and 2-way
analyses.
. Tree-based defect analysis (Ch.21).
Wiley-IEEE/CS Press, 2005 Slides V2 (2007)

Tian: Software Quality Engineering Slide (Ch.20) 3
Defect in Quality Data/Models
• Defect data ⊂ quality measurement data:
. As part of direct Q data.
. Extracted from defect tracking tools.
. Additional (defect classification) data may
be available.
• Defect data in quality models:
. As results in generalized models (GMs).
. As r.v. (response/independent variable)
in product specific models (PSMs).
– semi-customized models ≈ GMs,
– observation-based: r.v. in SRGMs,
– predictive: r.v. in TBDMs.
– (SRGMs/TBDMs in Ch.22/21.)
Wiley-IEEE/CS Press, 2005 Slides V2 (2007)

Tian: Software Quality Engineering Slide (Ch.20) 4
General Defect Analysis
• General defect analyses: Questions
. What? identification (and classification).
– type, severity, etc.,
– even without formal classification.
. Where? distribution across location.
. When? discovery/observation
– what about when injection? harder
– pre-release: more data
– post-release: more meaningful/sensitive
. How/why? related to injection
⇒ use in future defect prevention.
• General defect analyses: Types
. Distribution by type or area.
. Trend over time.
. Causal analysis.
. Other analysis for classified data.
Wiley-IEEE/CS Press, 2005 Slides V2 (2007)

Tian: Software Quality Engineering Slide (Ch.20) 5
Defect Analysis: Data Treatment
• Variations of defect data:
. Error/fault/failure perspective.
. Pre-/post-release.
. Unique defect?
. Focus here: defect fixes.
• Why defect fixes (DF):
. Propagation information.
. Close ties to effort (defect fixing).
. Pre-release: more meaningful.
(post release: each failure occurrence.)
Wiley-IEEE/CS Press, 2005 Slides V2 (2007)

Tian: Software Quality Engineering Slide (Ch.20) 6
Defect Distribution Analysis
• Distribution: what, where, etc.
• What: Distribution over defect types.
. Ties to quality views/attributes (Ch.2).
. Within specific view: types/sub-types.
. Defect types ⇐ product’s “domain”.
. IBM example: CUPRIMDSO.
• Important observation:
. Skewed distribution, or 80:20 rule
⇒ importance of risk identification
for effective quality improvement
. Early indicators needed!
(Cannot wait after defect discoveries.)
Wiley-IEEE/CS Press, 2005 Slides V2 (2007)

Tian: Software Quality Engineering Slide (Ch.20) 7
Defect Distribution Analysis
Error Description # ofType Errors
A permission denied 2079B no such file or directory 14C stale NFS file handle 4D client denied by server config. 2E file does not exist 28631F invalid method in request 0G invalid URL in req. connection 1H mod mime magic 1I request failed 1J script not found or unable to start 27K connection reset by peer 0
all types 30760
• Web example: Table 20.1 (p.341)
. defect = “error” in web community.
. dominance of type E “missing files”.
. type A: further information needed.
. all other types: negligible.
Wiley-IEEE/CS Press, 2005 Slides V2 (2007)
Tian: Software Quality Engineering Slide (Ch.20) 8
Defect Distribution Analysis
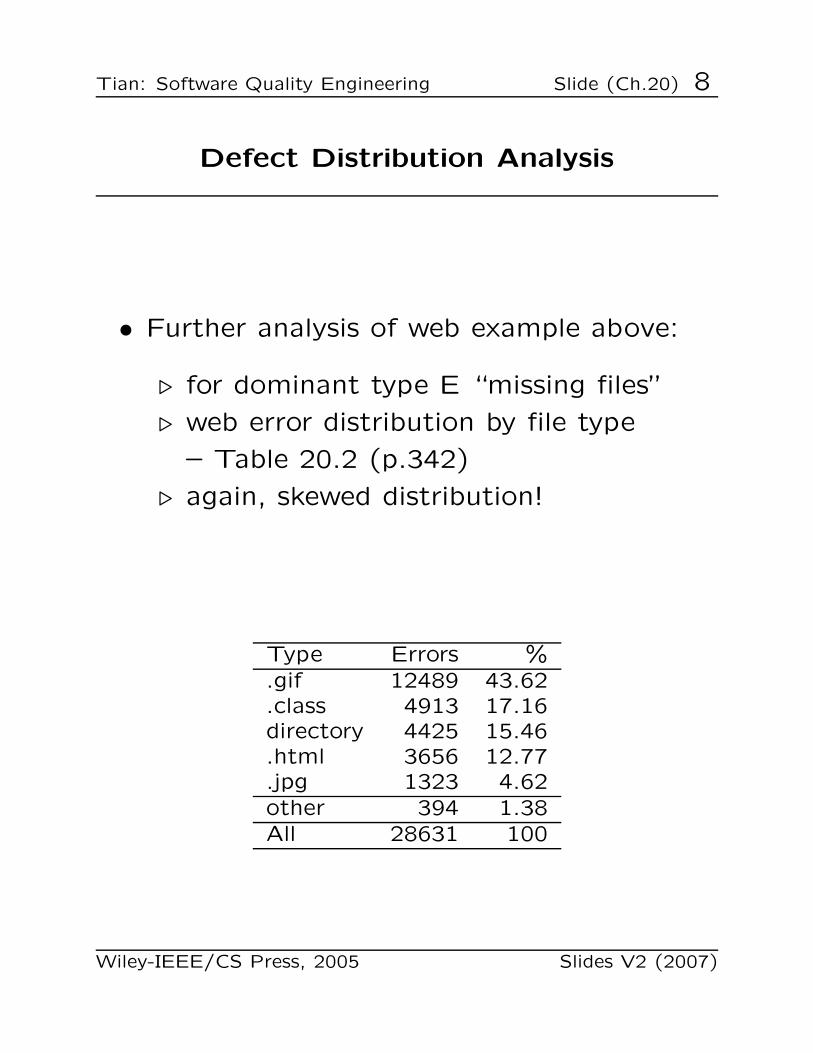
• Further analysis of web example above:
. for dominant type E “missing files”
. web error distribution by file type
– Table 20.2 (p.342)
. again, skewed distribution!
Type Errors %.gif 12489 43.62.class 4913 17.16directory 4425 15.46.html 3656 12.77.jpg 1323 4.62other 394 1.38All 28631 100
Wiley-IEEE/CS Press, 2005 Slides V2 (2007)
Tian: Software Quality Engineering Slide (Ch.20) 9
Defect Distribution Analysis
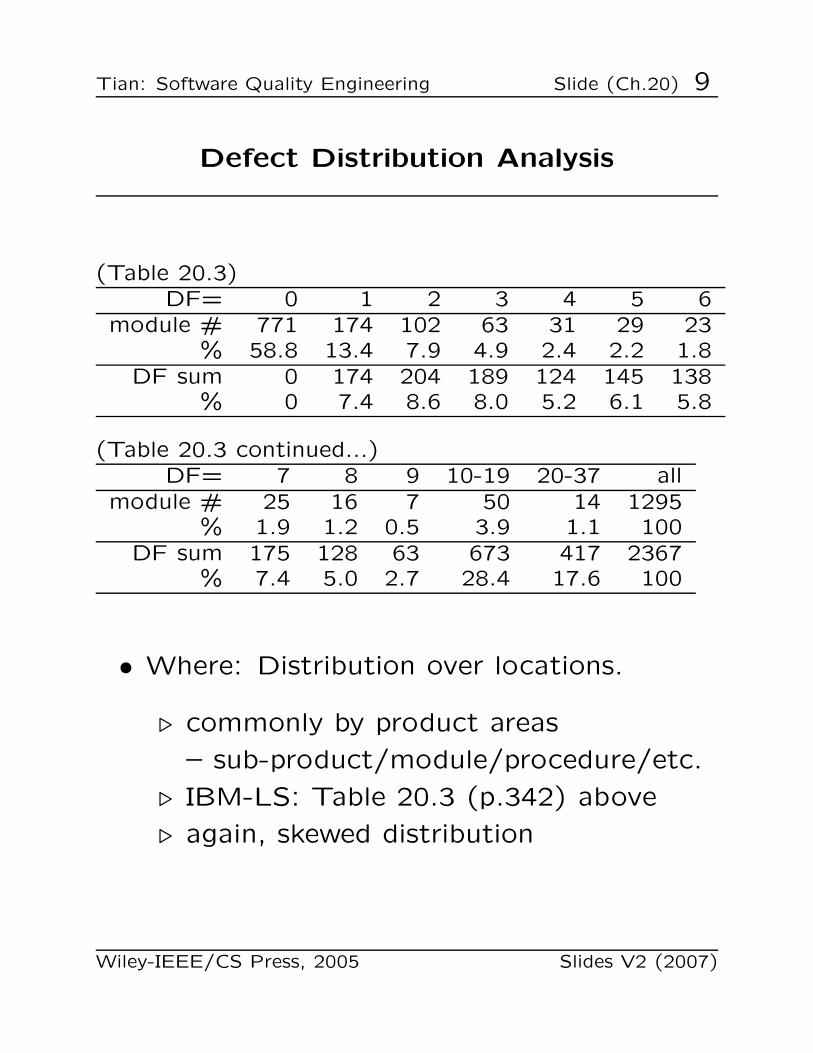
(Table 20.3)DF= 0 1 2 3 4 5 6
module # 771 174 102 63 31 29 23% 58.8 13.4 7.9 4.9 2.4 2.2 1.8
DF sum 0 174 204 189 124 145 138% 0 7.4 8.6 8.0 5.2 6.1 5.8
(Table 20.3 continued...)DF= 7 8 9 10-19 20-37 all
module # 25 16 7 50 14 1295% 1.9 1.2 0.5 3.9 1.1 100
DF sum 175 128 63 673 417 2367% 7.4 5.0 2.7 28.4 17.6 100
• Where: Distribution over locations.
. commonly by product areas
– sub-product/module/procedure/etc.
. IBM-LS: Table 20.3 (p.342) above
. again, skewed distribution
Wiley-IEEE/CS Press, 2005 Slides V2 (2007)

Tian: Software Quality Engineering Slide (Ch.20) 10
Defect Distribution Analysis
(Table 20.4)DF = 0 1 2 3 4 5 6
module # 23 131 112 120 99 94 68% 2.3 13.2 11.3 12.1 9.9 9.4 6.8
DF sum 0 131 224 360 396 470 408% 1.67 2.86 4.60 5.06 6.01 5.21 4.47
(Table 20.4 continued...)DF = 7 8 9 10-19 20-49 >50 all
module # 50 38 32 147 68 13 995% 5.0 3.8 3.2 14.8 6.8 1.3 100
DF sum 350 304 288 2109 2040 910 7824% 3.89 3.68 3.07 26.96 26.07 11.63 100
• IBM-NS: Table 20.4 (p.343) above
– yet another skewed defect distribution
• Extension: distribution by other locators
– e.g., types of sources or code, etc.
Wiley-IEEE/CS Press, 2005 Slides V2 (2007)

Tian: Software Quality Engineering Slide (Ch.20) 11
Defect Trend Analysis
• Trend as a continuous function:
. Similar to Putnam model (Ch.19)
– but customized with local data
. Other analysis related to SRE
– defect/effort/reliability curves
– more in Ch.22 and related references.
. Sometimes discrete analysis may be more
meaningful (see below).
• Defect dynamics model:
. Important variation to trend analysis.
. Defect categorized by phase.
. Discovery (already done).
. Analysis to identify injection phase.
Wiley-IEEE/CS Press, 2005 Slides V2 (2007)

Tian: Software Quality Engineering Slide (Ch.20) 12
Defect Trend Analysis
Inj. Removal PhasePhase R S D C T P AllRequirements 10 22 8 0 5 2 47Specification 10 20 2 0 1 33Design 52 120 32 5 209Coding 198 320 46 564Testing 58 7 65Post-release 2 2All 10 32 80 320 415 63 920
• Defect dynamics model: Table 20.5 (p.344)
. row: where (phase) injected
. column: where (phase) removed/discovered
. focus out-of-phase/off-diagonal ones!
Wiley-IEEE/CS Press, 2005 Slides V2 (2007)

Tian: Software Quality Engineering Slide (Ch.20) 13
Defect Causal Analysis
• Defect causal analyses: Types
. Causal relation identified:
– error-fault vs fault-failure
– works backwards
. Techniques: statistical or logical.
• Root cause analysis (logical):
. Human intensive.
. Good domain knowledge.
. Fault-failure: individual and common.
. Error-fault: project-wide effort focused
on pervasive problems.
• Statistical causal analysis:
≈ risk identification techniques in Ch.21.
Wiley-IEEE/CS Press, 2005 Slides V2 (2007)

Tian: Software Quality Engineering Slide (Ch.20) 14
ODC: Overview
• Development
. Chillarege et al. at IBM
. Applications in IBM Labs and several
other companies
. Recent development and tools
• Key elements of ODC
. Aim: tracking/analysis/improve
. Approach: classification and analysis
. Key attributes of defects
. Views: both failure and fault
. Applicability: inspection and testing
. Analysis: attribute focusing
. Need for historical data
Wiley-IEEE/CS Press, 2005 Slides V2 (2007)

Tian: Software Quality Engineering Slide (Ch.20) 15
ODC: Why?
• Statistical defect models:
. Quantitative and objective analyses.
. SRGMs (Ch.22), DRM (Ch.19), etc.
. Problems: accuracy & timeliness.
• Causal (root cause) analyses:
. Qualitative but subjective analyses.
. Use in defect prevention.
• Gap and ODC solution:
. Bridge the gap between the two.
. Systematic scheme used.
. Wide applicability.
Wiley-IEEE/CS Press, 2005 Slides V2 (2007)

Tian: Software Quality Engineering Slide (Ch.20) 16
ODC: Ideas
• Cause-effect relation by type:
. Different types of faults.
. Causing different failures.
. Need defect classification.
. Multiple attributes for defects.
• Good measurement:
. Orthogonality (independent view).
. Consistency across phases.
. Uniformity across products.
• ODC process/implementation:
. Human classification.
. Analysis method and tools.
. Feedback results (and followup).
Wiley-IEEE/CS Press, 2005 Slides V2 (2007)

Tian: Software Quality Engineering Slide (Ch.20) 17
ODC: Theory
• Semantic classification:
. defect classes for a product
. related-to/explain process
. akin to event measurement
. sufficient condition:
– spanning set over process
– formed by defect attributes
• Classification for cause-effect or views:
. cause: type, trigger, etc.
. effect: severity, impact, etc.
. failure vs fault (internal cause) views
. additional causal-analysis-related:
source, where/when injected.
. sub-population: environment data.
Wiley-IEEE/CS Press, 2005 Slides V2 (2007)

Tian: Software Quality Engineering Slide (Ch.20) 18
ODC Example: Table 20.6 (p.347)
Label Name Possible values or categories & labelsimp impact c=capability, u=usability, p=performance,
r=reliability, in=installation, ma=maint.,im=implementation, mi=migration,sec=security, ser=service, std=standard
trig trigger i=installation, m=migration, s=stress,a=ad-hoc, b=backup, c=communications,f=file i/o, co=coexistence,e=exception, ss=startup/shutdown,hc=h/w config., sc=s/w config.,o=normal operation
sev severity range from 1 (highest)to 4 (lowest) in severity
wk week week detected, from project startftype fix s=specification, hld=high-level design,
type lld=low-level design, c=code,b=build process, o=other product
act action a=add, d=delete, c=changesrc code b=base, v=vendor, n=new, c=changed,
source i=incremental, s=scaffolded,p=previous defect fix
inj phase p=previous release, s=specification,injected hld=high-level design, lld=low-level design,
c=coding, ut=unit test, ft=function test,st=system test, d=customer usage
Wiley-IEEE/CS Press, 2005 Slides V2 (2007)

Tian: Software Quality Engineering Slide (Ch.20) 19
ODC Attributes: Failure-View
• Defect trigger:
. Associated with verification process
– similar to test case measurement
– collected by testers
. Trigger classes
– product specific
– black box in nature
– pre/post-release triggers
• Other attributes:
. Impact: e.g., IBM’s CUPRIMDSO.
. Severity: low-high (e.g., 1-4).
. Detection time, etc.
Wiley-IEEE/CS Press, 2005 Slides V2 (2007)

Tian: Software Quality Engineering Slide (Ch.20) 20
ODC Attributes: Cause/Fault-View
• Defect type:
. Associated with development process.
. Missing or incorrect.
. Collected by developers.
. May be adapted for other products.
• Other attributes:
. Action: add, delete, change.
. Number of lines changed, etc.
Wiley-IEEE/CS Press, 2005 Slides V2 (2007)

Tian: Software Quality Engineering Slide (Ch.20) 21
ODC Attributes: Cause/Error-View
• Key attributes:
. Defect source: vendor/base/new code.
. Where injected.
. When injected.
• Characteristics:
. Associated to additional causal analysis.
. (May not be performed.)
. Many subjective judgment involved
(evolution of ODC philosophy)
• Phase injected: rough “when”.
Wiley-IEEE/CS Press, 2005 Slides V2 (2007)
Tian: Software Quality Engineering Slide (Ch.20) 22
Adapting ODC for Web Error Analysis
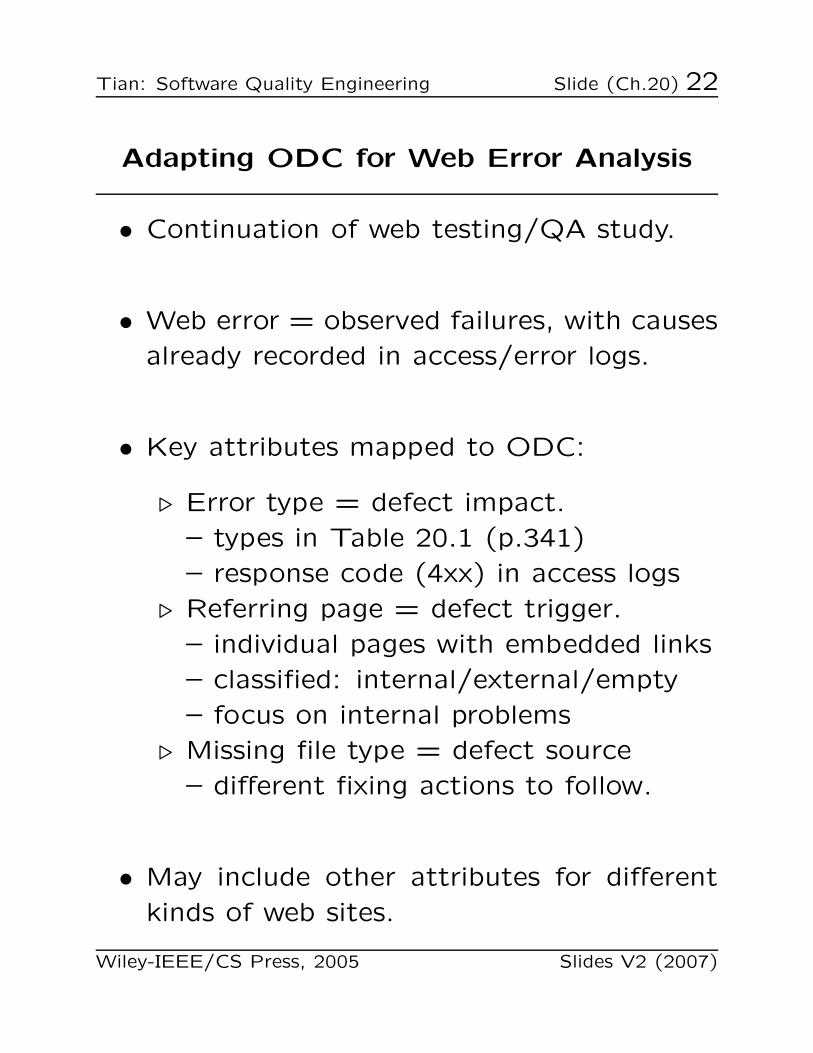
• Continuation of web testing/QA study.
• Web error = observed failures, with causes
already recorded in access/error logs.
• Key attributes mapped to ODC:
. Error type = defect impact.
– types in Table 20.1 (p.341)
– response code (4xx) in access logs
. Referring page = defect trigger.
– individual pages with embedded links
– classified: internal/external/empty
– focus on internal problems
. Missing file type = defect source
– different fixing actions to follow.
• May include other attributes for different
kinds of web sites.
Wiley-IEEE/CS Press, 2005 Slides V2 (2007)

Tian: Software Quality Engineering Slide (Ch.20) 23
ODC Analysis: Attribute Focusing
• General characteristics
. Graphical in nature
. 1-way or 2-way distribution
. Phases and progression
. Historical data necessary
. Focusing on big deviations
• Representation and analysis
. 1-way: histograms
. 2-way: stack-up vs. multiple graphics
. Support with analysis tools
Wiley-IEEE/CS Press, 2005 Slides V2 (2007)

Tian: Software Quality Engineering Slide (Ch.20) 24
ODC Analysis Examples
Capability
Document’n
Install’n
Maint’lity
Migration
Perfor’ce
Reliability
Security
Service
Standards
Usability
NA
0 50 100 150 200
Defects (failures) by impact areas
• 1-way analysis: Fig 20.1 (p.349)
. Defect impact distribution for an IBM
product.
. Uneven distribution of impact areas!
⇒ risk identification and focus.
Wiley-IEEE/CS Press, 2005 Slides V2 (2007)

Tian: Software Quality Engineering Slide (Ch.20) 25
ODC Analysis Examples
••
••
•
••
•
•
• •
•
••
•
•
•
•
•
•
•
•
•
•
•
•
day
#err
ors
or #
hits
/10
0 5 10 15 20 25
010
0020
0030
0040
00
••
••
•
••
••
•
•
•
• •
••
••
•
•
••
• ••
•
#hits/10type E errors
• 1-way analysis: Fig 20.2 (p.350)
. web error trend analysis.
. context: compare to usage (reliability).
. stable operational reliability
Wiley-IEEE/CS Press, 2005 Slides V2 (2007)

Tian: Software Quality Engineering Slide (Ch.20) 26
ODC Analysis Examples
Impact Severity1 2 3 4
Capability 2 12 13 1Documentation 0 1 14 10Installability 0 6 6 4Maintainability 0 6 19 7Migration 0 0 0 1Performance 1 1 3 0Reliability 27 96 66 7Security 1 3 3 0Service 0 0 4 4Standards 0 1 2 1Usability 0 10 44 19
• 2-way analysis: Table 20.7 (p.351)
. Defect impact-severity analysis.
. IBM product study continued.
. Huge contrast: severity of reliability and
usability problems!
Wiley-IEEE/CS Press, 2005 Slides V2 (2007)

Tian: Software Quality Engineering Slide (Ch.20) 27
ODC Process and Implementation
• ODC process:
. Human classification
– defect type: developers,
– defect trigger and effect: testers,
– other information: coordinator/other.
. Tie to inspection/testing processes.
. Analysis: attribute focusing.
. Feedback results: graphical.
• Implementation and deployment:
. Training of participants.
. Data capturing tools.
. Centralized analysis.
. Usage of analysis results.
Wiley-IEEE/CS Press, 2005 Slides V2 (2007)

Tian: Software Quality Engineering Slide (Ch.20) 28
Linkage to Other Topics
• Development process
. Defect prevention process/techniques.
. Inspection and testing.
• Testing and reliability:
. Expanded testing measurement
– Defects and other information:
– Environmental (impact)
– Test case (trigger)
– Causal (fault)
. Reliability modeling for ODC classes
Wiley-IEEE/CS Press, 2005 Slides V2 (2007)