DATA QUADRANT REPORT - Software Testing
39
September 2021 DATA QUADRANT REPORT Software Testing 11 Products Included 190 Reviews
-
Upload
khangminh22 -
Category
Documents
-
view
0 -
download
0
Transcript of DATA QUADRANT REPORT - Software Testing

September 2021
DATA QUADRANT REPORT
Software Testing11
Products Included
190Reviews

Table ofContentsData Quadrant.................................................................................................................. 4
Category Overview ......................................................................................................5
Vendor Capability Summary ................................................................................ 6
Vendor Capabilities...................................................................................................... 9
Product Feature Summary .................................................................................. 21
Product Features ........................................................................................................25
How to Use the ReportInfo-Tech’s Data Quadrant Reports provide a comprehensive evaluation of popular products in theSoftware Testing market. This buyer’s guide is designed to help prospective purchasers makebetter decisions by leveraging the experiences of real users.
The data in this report is collected from real end users, meticulously verified for veracity,exhaustively analyzed, and visualized in easy to understand charts and graphs. Each product iscompared and contrasted with all other products in the category to create a holistic, unbiased viewof the product landscape.
Use this report to determine which product is right for your organization. For highly detailed reportson individual products, see Info-Tech’s Product Scorecard.
Software Testing Data Quadrant Report
2
SoftwareDirectorySOFTWARE TESTINGSOFTWARE
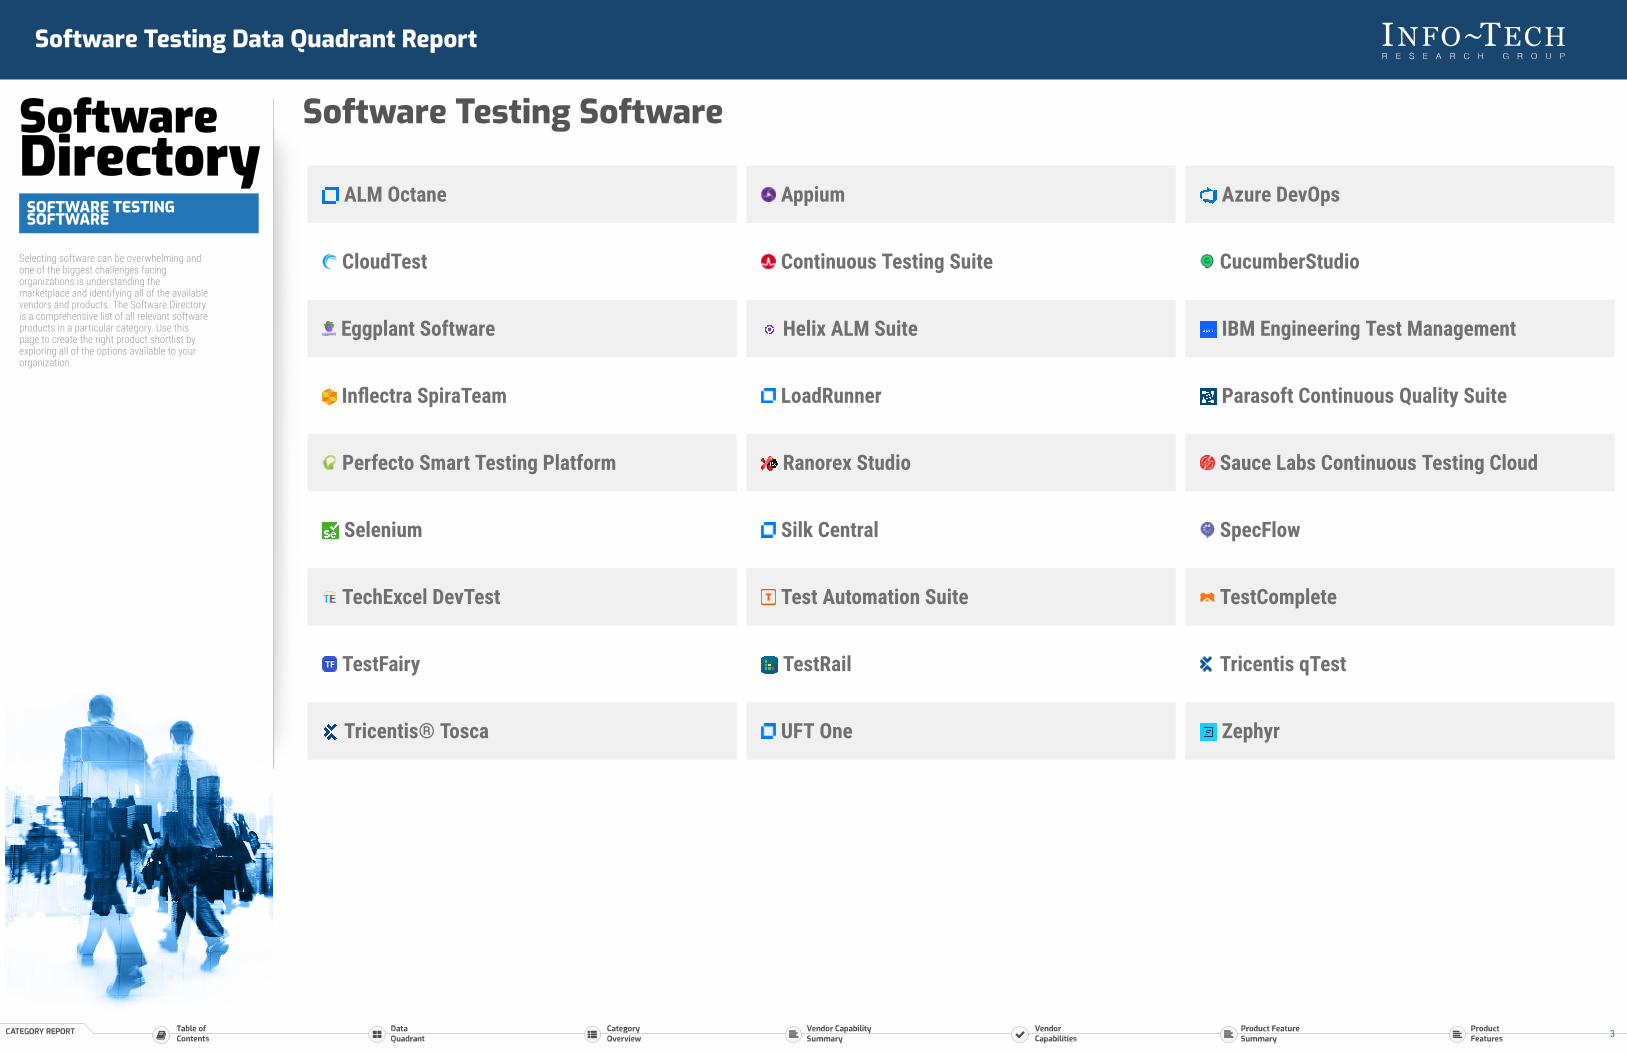
Selecting software can be overwhelming andone of the biggest challenges facingorganizations is understanding themarketplace and identifying all of the availablevendors and products. The Software Directoryis a comprehensive list of all relevant softwareproducts in a particular category. Use thispage to create the right product shortlist byexploring all of the options available to yourorganization.
Software Testing Software
ALM Octane Appium Azure DevOps
CloudTest Continuous Testing Suite CucumberStudio
Eggplant Software Helix ALM Suite IBM Engineering Test Management
Inflectra SpiraTeam LoadRunner Parasoft Continuous Quality Suite
Perfecto Smart Testing Platform Ranorex Studio Sauce Labs Continuous Testing Cloud
Selenium Silk Central SpecFlow
TechExcel DevTest Test Automation Suite TestComplete
TestFairy TestRail Tricentis qTest
Tricentis® Tosca UFT One Zephyr
Software Testing Data Quadrant Report
3
Software Testing Data Quadrant Report
SOFTWARE REVIEWS
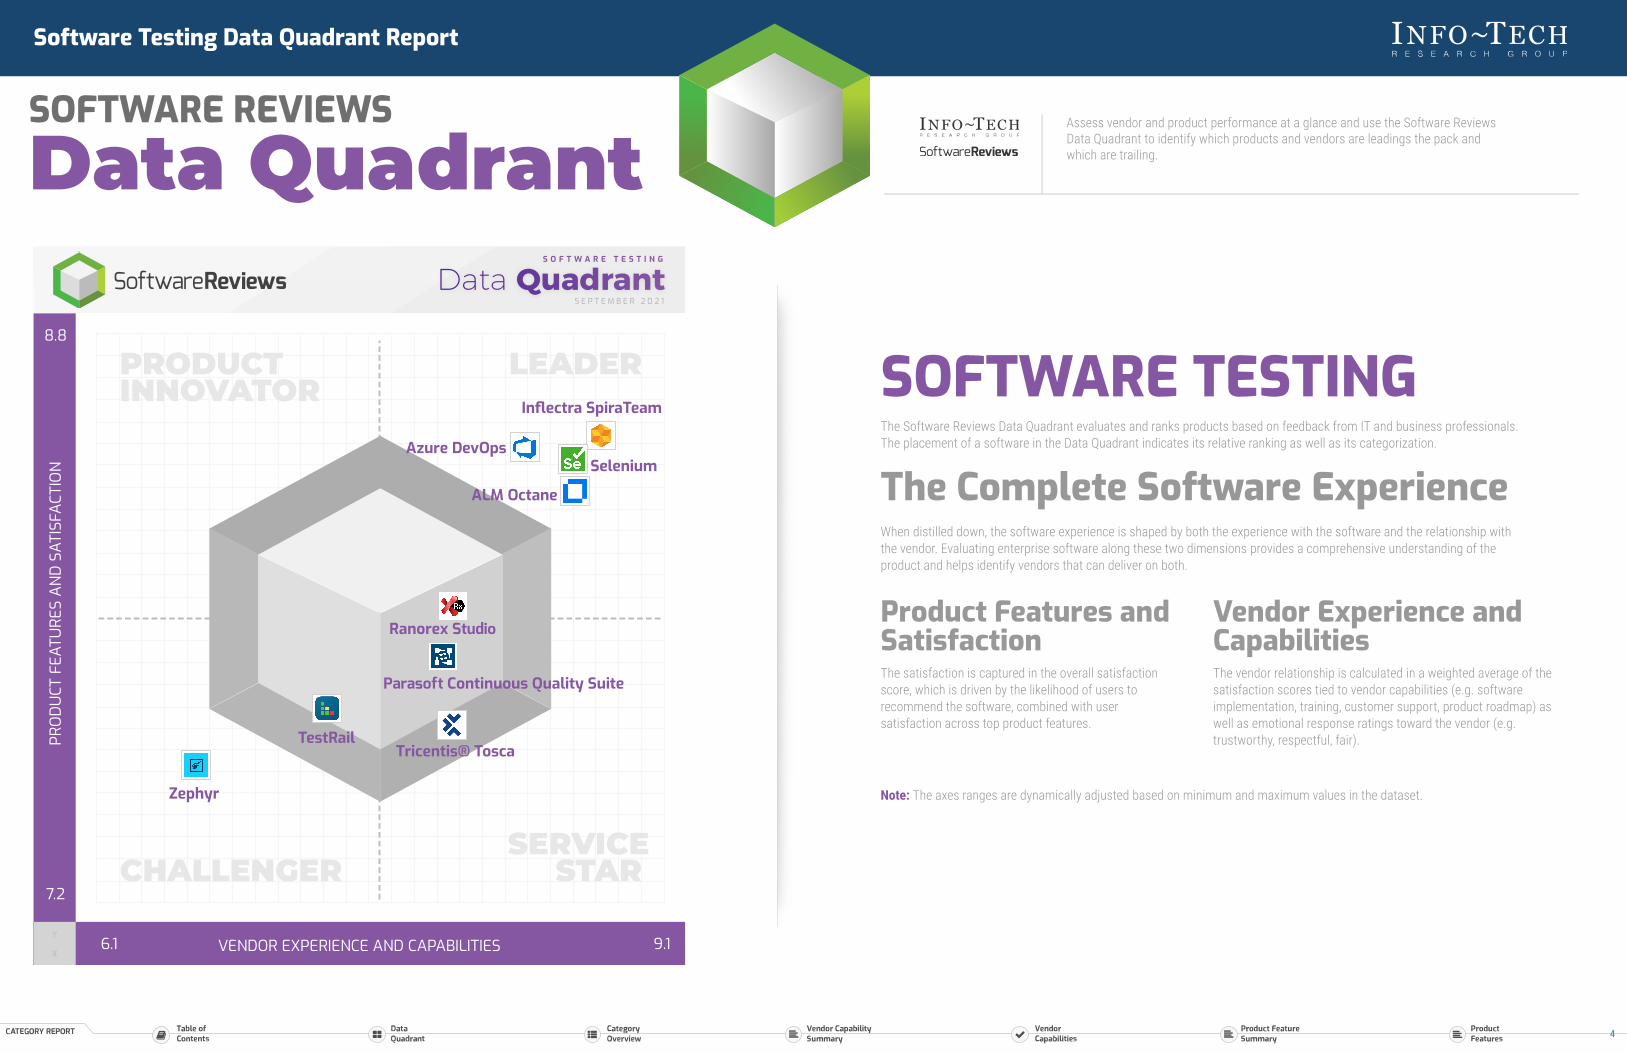
Data QuadrantAssess vendor and product performance at a glance and use the Software ReviewsData Quadrant to identify which products and vendors are leadings the pack andwhich are trailing.
8.8
PRO
DUCT
FEA
TURE
S AN
D SA
TISF
ACTI
ON
7.2
6.1 VENDOR EXPERIENCE AND CAPABILITIES 9.1
Product Features andSatisfactionThe satisfaction is captured in the overall satisfactionscore, which is driven by the likelihood of users torecommend the software, combined with usersatisfaction across top product features.
SOFTWARE TESTINGThe Software Reviews Data Quadrant evaluates and ranks products based on feedback from IT and business professionals.The placement of a software in the Data Quadrant indicates its relative ranking as well as its categorization.
The Complete Software ExperienceWhen distilled down, the software experience is shaped by both the experience with the software and the relationship withthe vendor. Evaluating enterprise software along these two dimensions provides a comprehensive understanding of theproduct and helps identify vendors that can deliver on both.
Vendor Experience andCapabilitiesThe vendor relationship is calculated in a weighted average of thesatisfaction scores tied to vendor capabilities (e.g. softwareimplementation, training, customer support, product roadmap) aswell as emotional response ratings toward the vendor (e.g.trustworthy, respectful, fair).
Note: The axes ranges are dynamically adjusted based on minimum and maximum values in the dataset.
S O F T W A R E T E S T I N G
S E P T E M B E R 2 0 2 1
PRODUCTINNOVATOR
LEADER
CHALLENGERSERVICE
STAR
Y
X
ALM Octane
Azure DevOps
Inflectra SpiraTeam
Parasoft Continuous Quality Suite
Ranorex Studio
Selenium
TestRailTricentis® Tosca
Zephyr
4
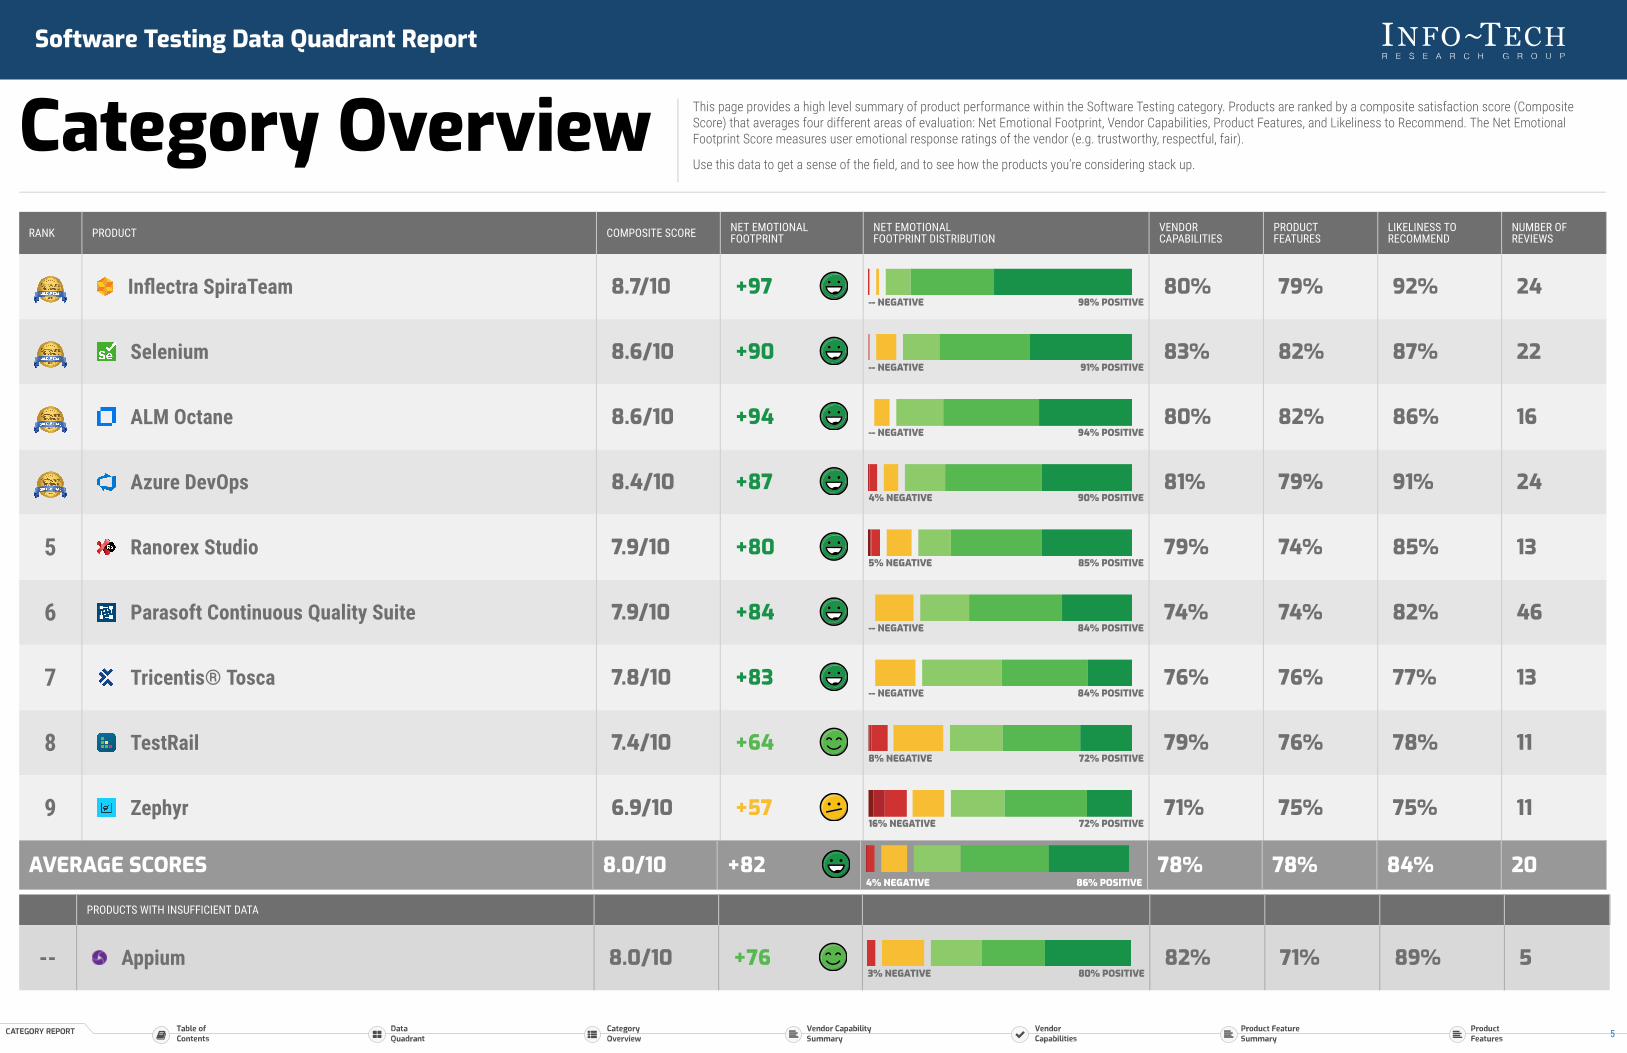
Category Overview This page provides a high level summary of product performance within the Software Testing category. Products are ranked by a composite satisfaction score (CompositeScore) that averages four different areas of evaluation: Net Emotional Footprint, Vendor Capabilities, Product Features, and Likeliness to Recommend. The Net EmotionalFootprint Score measures user emotional response ratings of the vendor (e.g. trustworthy, respectful, fair).
Use this data to get a sense of the field, and to see how the products you’re considering stack up.
RANK PRODUCT COMPOSITE SCORE NET EMOTIONALFOOTPRINT
NET EMOTIONALFOOTPRINT DISTRIBUTION
VENDORCAPABILITIES
PRODUCTFEATURES
LIKELINESS TORECOMMEND
NUMBER OFREVIEWS
Inflectra SpiraTeam 8.7/10 +97-- NEGATIVE 98% POSITIVE
80% 79% 92% 24
Selenium 8.6/10 +90-- NEGATIVE 91% POSITIVE
83% 82% 87% 22
ALM Octane 8.6/10 +94-- NEGATIVE 94% POSITIVE
80% 82% 86% 16
Azure DevOps 8.4/10 +874% NEGATIVE 90% POSITIVE
81% 79% 91% 24
5 Ranorex Studio 7.9/10 +805% NEGATIVE 85% POSITIVE
79% 74% 85% 13
6 Parasoft Continuous Quality Suite 7.9/10 +84-- NEGATIVE 84% POSITIVE
74% 74% 82% 46
7 Tricentis® Tosca 7.8/10 +83-- NEGATIVE 84% POSITIVE
76% 76% 77% 13
8 TestRail 7.4/10 +648% NEGATIVE 72% POSITIVE
79% 76% 78% 11
9 Zephyr 6.9/10 +5716% NEGATIVE 72% POSITIVE
71% 75% 75% 11
AVERAGE SCORES 8.0/10 +824% NEGATIVE 86% POSITIVE
78% 78% 84% 20
PRODUCTS WITH INSUFFICIENT DATA
-- Appium 8.0/10 +763% NEGATIVE 80% POSITIVE
82% 71% 89% 5
Software Testing Data Quadrant Report
5

Category Overview This page provides a high level summary of product performance within the Software Testing category. Products are ranked by a composite satisfaction score (CompositeScore) that averages four different areas of evaluation: Net Emotional Footprint, Vendor Capabilities, Product Features, and Likeliness to Recommend. The Net EmotionalFootprint Score measures user emotional response ratings of the vendor (e.g. trustworthy, respectful, fair).
Use this data to get a sense of the field, and to see how the products you’re considering stack up.
RANK PRODUCT COMPOSITE SCORE NET EMOTIONALFOOTPRINT
NET EMOTIONALFOOTPRINT DISTRIBUTION
VENDORCAPABILITIES
PRODUCTFEATURES
LIKELINESS TORECOMMEND
NUMBER OFREVIEWS
AVERAGE SCORES 8.0/10 +824% NEGATIVE 86% POSITIVE
78% 78% 84% 20
PRODUCTS WITH INSUFFICIENT DATA
-- IBM ETM 7.0/10 +872% NEGATIVE 90% POSITIVE
58% 64% 71% 5
Software Testing Data Quadrant Report
6
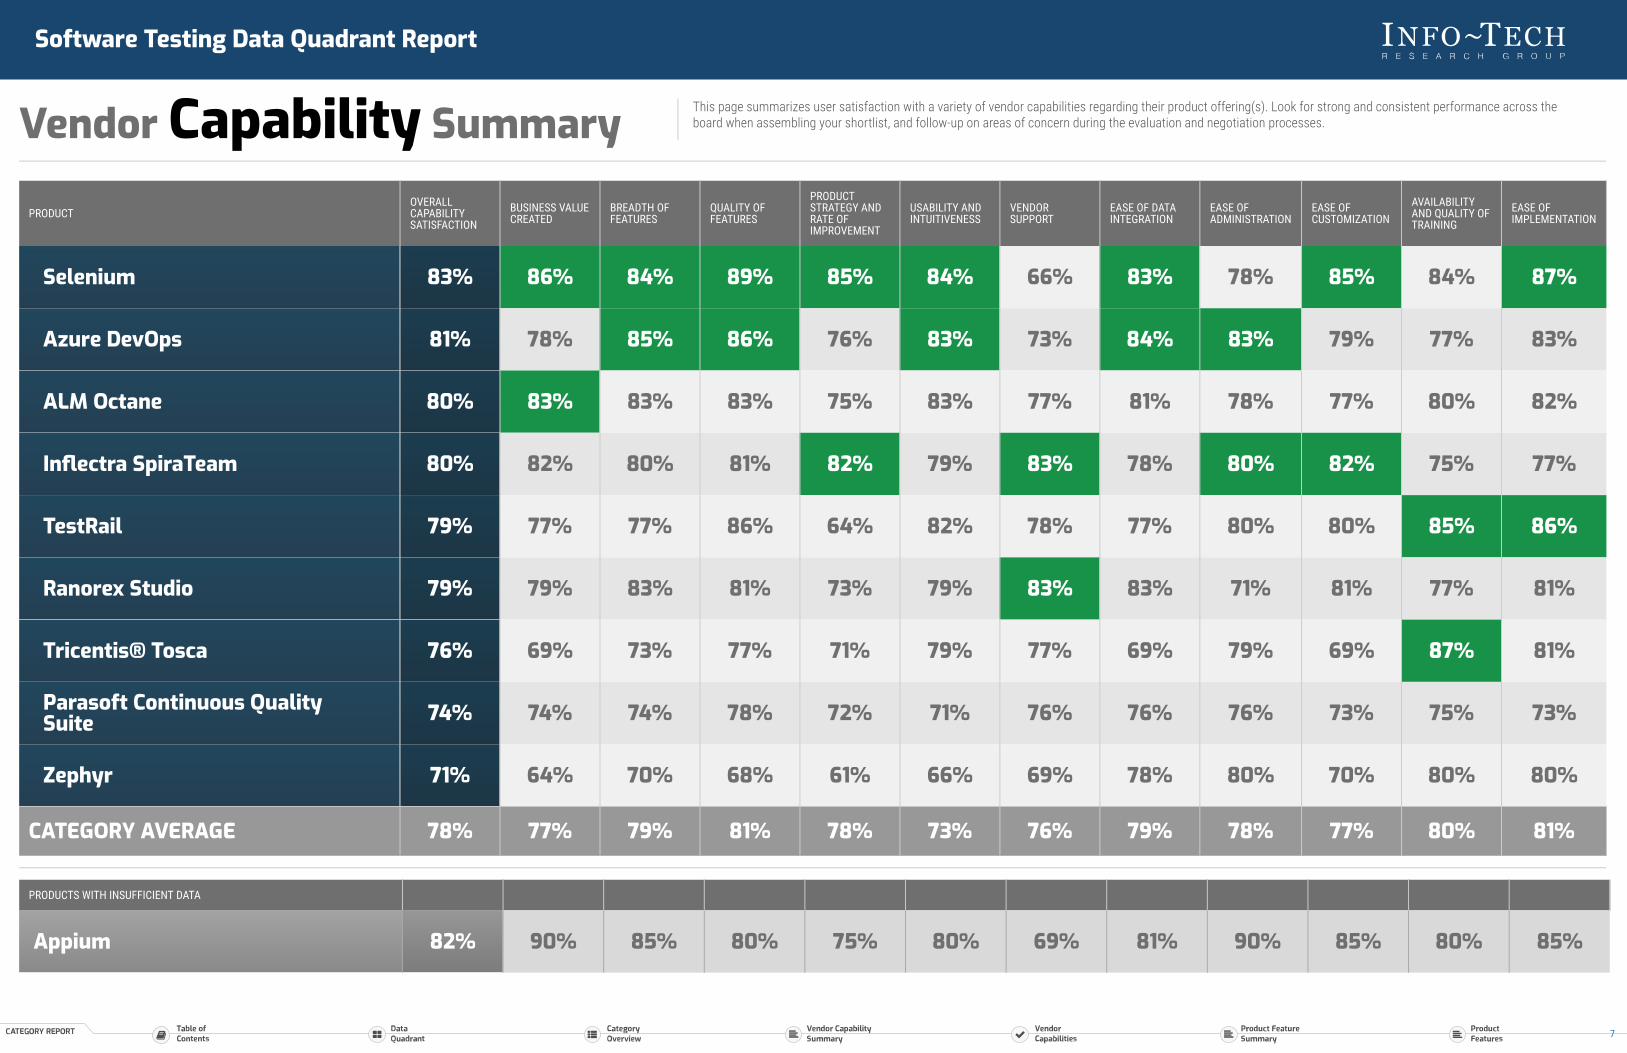
Vendor Capability Summary This page summarizes user satisfaction with a variety of vendor capabilities regarding their product offering(s). Look for strong and consistent performance across theboard when assembling your shortlist, and follow-up on areas of concern during the evaluation and negotiation processes.
PRODUCTOVERALLCAPABILITYSATISFACTION
BUSINESS VALUECREATED
BREADTH OFFEATURES
QUALITY OFFEATURES
PRODUCTSTRATEGY ANDRATE OFIMPROVEMENT
USABILITY ANDINTUITIVENESS
VENDORSUPPORT
EASE OF DATAINTEGRATION
EASE OFADMINISTRATION
EASE OFCUSTOMIZATION
AVAILABILITYAND QUALITY OFTRAINING
EASE OFIMPLEMENTATION
Selenium 83% 86% 84% 89% 85% 84% 66% 83% 78% 85% 84% 87%
Azure DevOps 81% 78% 85% 86% 76% 83% 73% 84% 83% 79% 77% 83%
ALM Octane 80% 83% 83% 83% 75% 83% 77% 81% 78% 77% 80% 82%
Inflectra SpiraTeam 80% 82% 80% 81% 82% 79% 83% 78% 80% 82% 75% 77%
TestRail 79% 77% 77% 86% 64% 82% 78% 77% 80% 80% 85% 86%
Ranorex Studio 79% 79% 83% 81% 73% 79% 83% 83% 71% 81% 77% 81%
Tricentis® Tosca 76% 69% 73% 77% 71% 79% 77% 69% 79% 69% 87% 81%
Parasoft Continuous QualitySuite 74% 74% 74% 78% 72% 71% 76% 76% 76% 73% 75% 73%
Zephyr 71% 64% 70% 68% 61% 66% 69% 78% 80% 70% 80% 80%
CATEGORY AVERAGE 78% 77% 79% 81% 78% 73% 76% 79% 78% 77% 80% 81%
PRODUCTS WITH INSUFFICIENT DATA
Appium 82% 90% 85% 80% 75% 80% 69% 81% 90% 85% 80% 85%
Software Testing Data Quadrant Report
7

Vendor Capability Summary This page summarizes user satisfaction with a variety of vendor capabilities regarding their product offering(s). Look for strong and consistent performance across theboard when assembling your shortlist, and follow-up on areas of concern during the evaluation and negotiation processes.
PRODUCTOVERALLCAPABILITYSATISFACTION
BUSINESS VALUECREATED
BREADTH OFFEATURES
QUALITY OFFEATURES
PRODUCTSTRATEGY ANDRATE OFIMPROVEMENT
USABILITY ANDINTUITIVENESS
VENDORSUPPORT
EASE OF DATAINTEGRATION
EASE OFADMINISTRATION
EASE OFCUSTOMIZATION
AVAILABILITYAND QUALITY OFTRAINING
EASE OFIMPLEMENTATION
CATEGORY AVERAGE 78% 77% 79% 81% 78% 73% 76% 79% 78% 77% 80% 81%
PRODUCTS WITH INSUFFICIENT DATA
IBM Engineering Test Management 58% 70% 65% 75% 60% 55% 50% 55% 70% 40% 45% 55%
Software Testing Data Quadrant Report
8
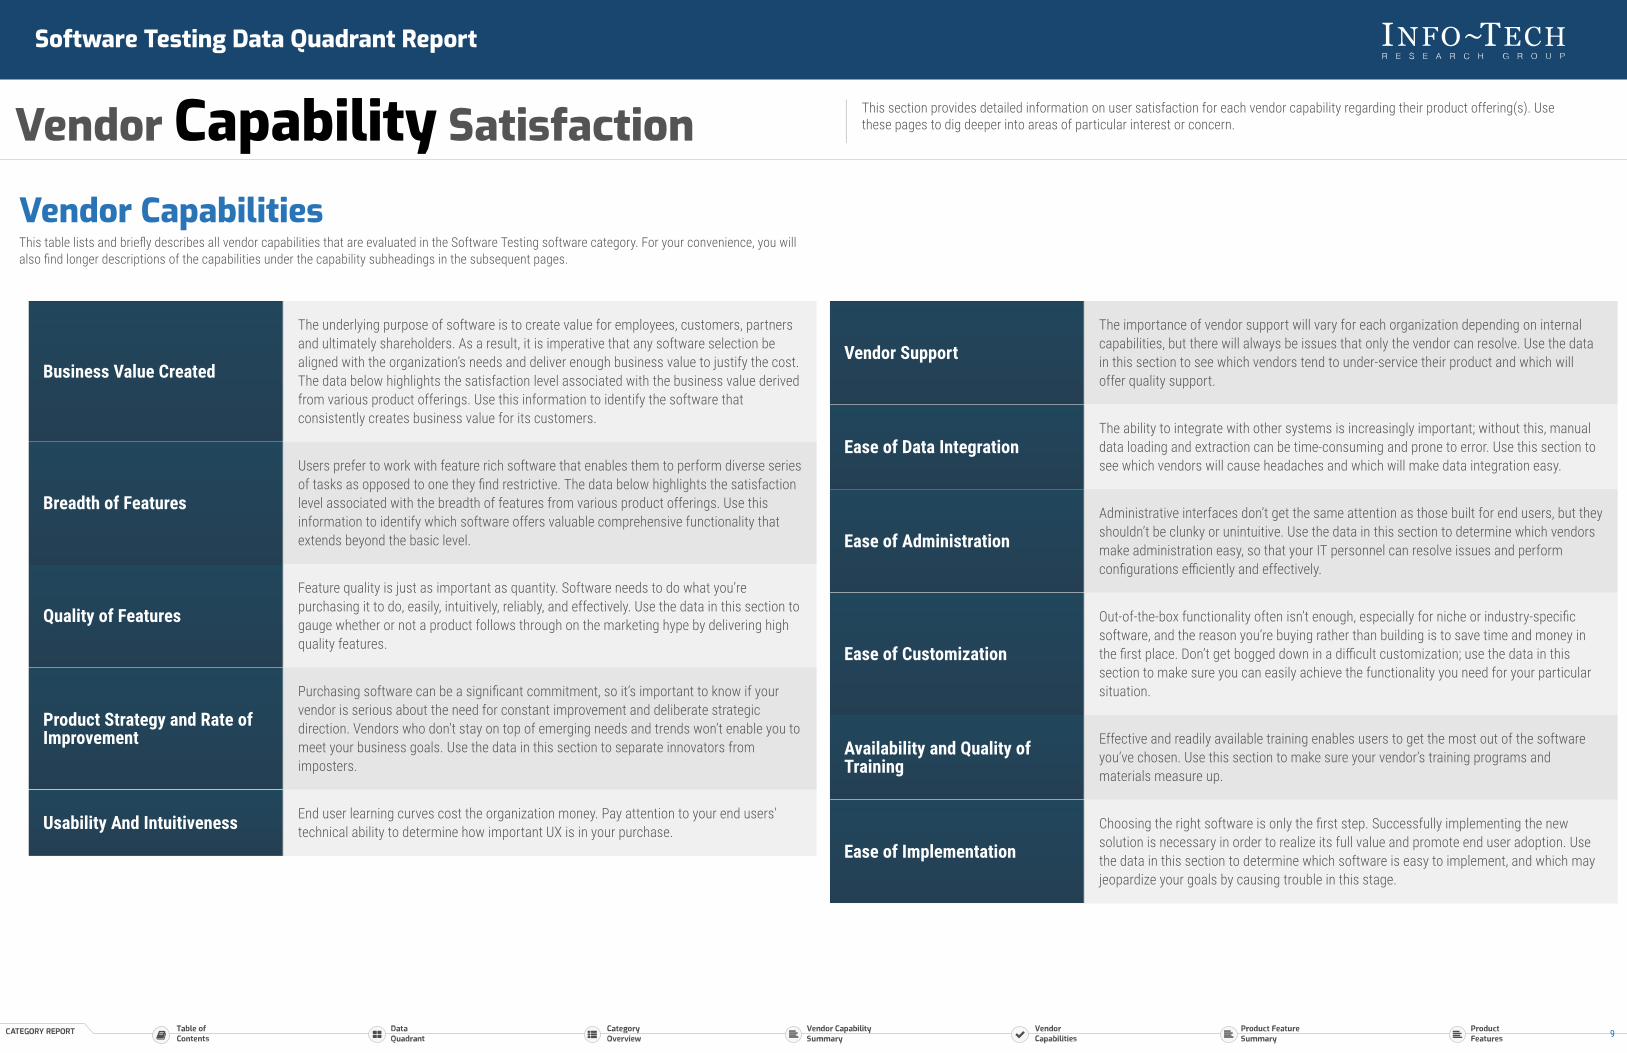
Vendor CapabilitiesThis table lists and briefly describes all vendor capabilities that are evaluated in the Software Testing software category. For your convenience, you willalso find longer descriptions of the capabilities under the capability subheadings in the subsequent pages.
Business Value Created
The underlying purpose of software is to create value for employees, customers, partnersand ultimately shareholders. As a result, it is imperative that any software selection bealigned with the organization’s needs and deliver enough business value to justify the cost.The data below highlights the satisfaction level associated with the business value derivedfrom various product offerings. Use this information to identify the software thatconsistently creates business value for its customers.
Breadth of Features
Users prefer to work with feature rich software that enables them to perform diverse seriesof tasks as opposed to one they find restrictive. The data below highlights the satisfactionlevel associated with the breadth of features from various product offerings. Use thisinformation to identify which software offers valuable comprehensive functionality thatextends beyond the basic level.
Quality of Features
Feature quality is just as important as quantity. Software needs to do what you’repurchasing it to do, easily, intuitively, reliably, and effectively. Use the data in this section togauge whether or not a product follows through on the marketing hype by delivering highquality features.
Product Strategy and Rate ofImprovement
Purchasing software can be a significant commitment, so it’s important to know if yourvendor is serious about the need for constant improvement and deliberate strategicdirection. Vendors who don’t stay on top of emerging needs and trends won’t enable you tomeet your business goals. Use the data in this section to separate innovators fromimposters.
Usability And Intuitiveness End user learning curves cost the organization money. Pay attention to your end users’technical ability to determine how important UX is in your purchase.
Vendor Support
The importance of vendor support will vary for each organization depending on internalcapabilities, but there will always be issues that only the vendor can resolve. Use the datain this section to see which vendors tend to under-service their product and which willoffer quality support.
Ease of Data IntegrationThe ability to integrate with other systems is increasingly important; without this, manualdata loading and extraction can be time-consuming and prone to error. Use this section tosee which vendors will cause headaches and which will make data integration easy.
Ease of Administration
Administrative interfaces don’t get the same attention as those built for end users, but theyshouldn’t be clunky or unintuitive. Use the data in this section to determine which vendorsmake administration easy, so that your IT personnel can resolve issues and performconfigurations efficiently and effectively.
Ease of Customization
Out-of-the-box functionality often isn’t enough, especially for niche or industry-specificsoftware, and the reason you’re buying rather than building is to save time and money inthe first place. Don’t get bogged down in a difficult customization; use the data in thissection to make sure you can easily achieve the functionality you need for your particularsituation.
Availability and Quality ofTraining
Effective and readily available training enables users to get the most out of the softwareyou’ve chosen. Use this section to make sure your vendor’s training programs andmaterials measure up.
Ease of Implementation
Choosing the right software is only the first step. Successfully implementing the newsolution is necessary in order to realize its full value and promote end user adoption. Usethe data in this section to determine which software is easy to implement, and which mayjeopardize your goals by causing trouble in this stage.
Software Testing Data Quadrant Report
Vendor Capability Satisfaction This section provides detailed information on user satisfaction for each vendor capability regarding their product offering(s). Usethese pages to dig deeper into areas of particular interest or concern.
9
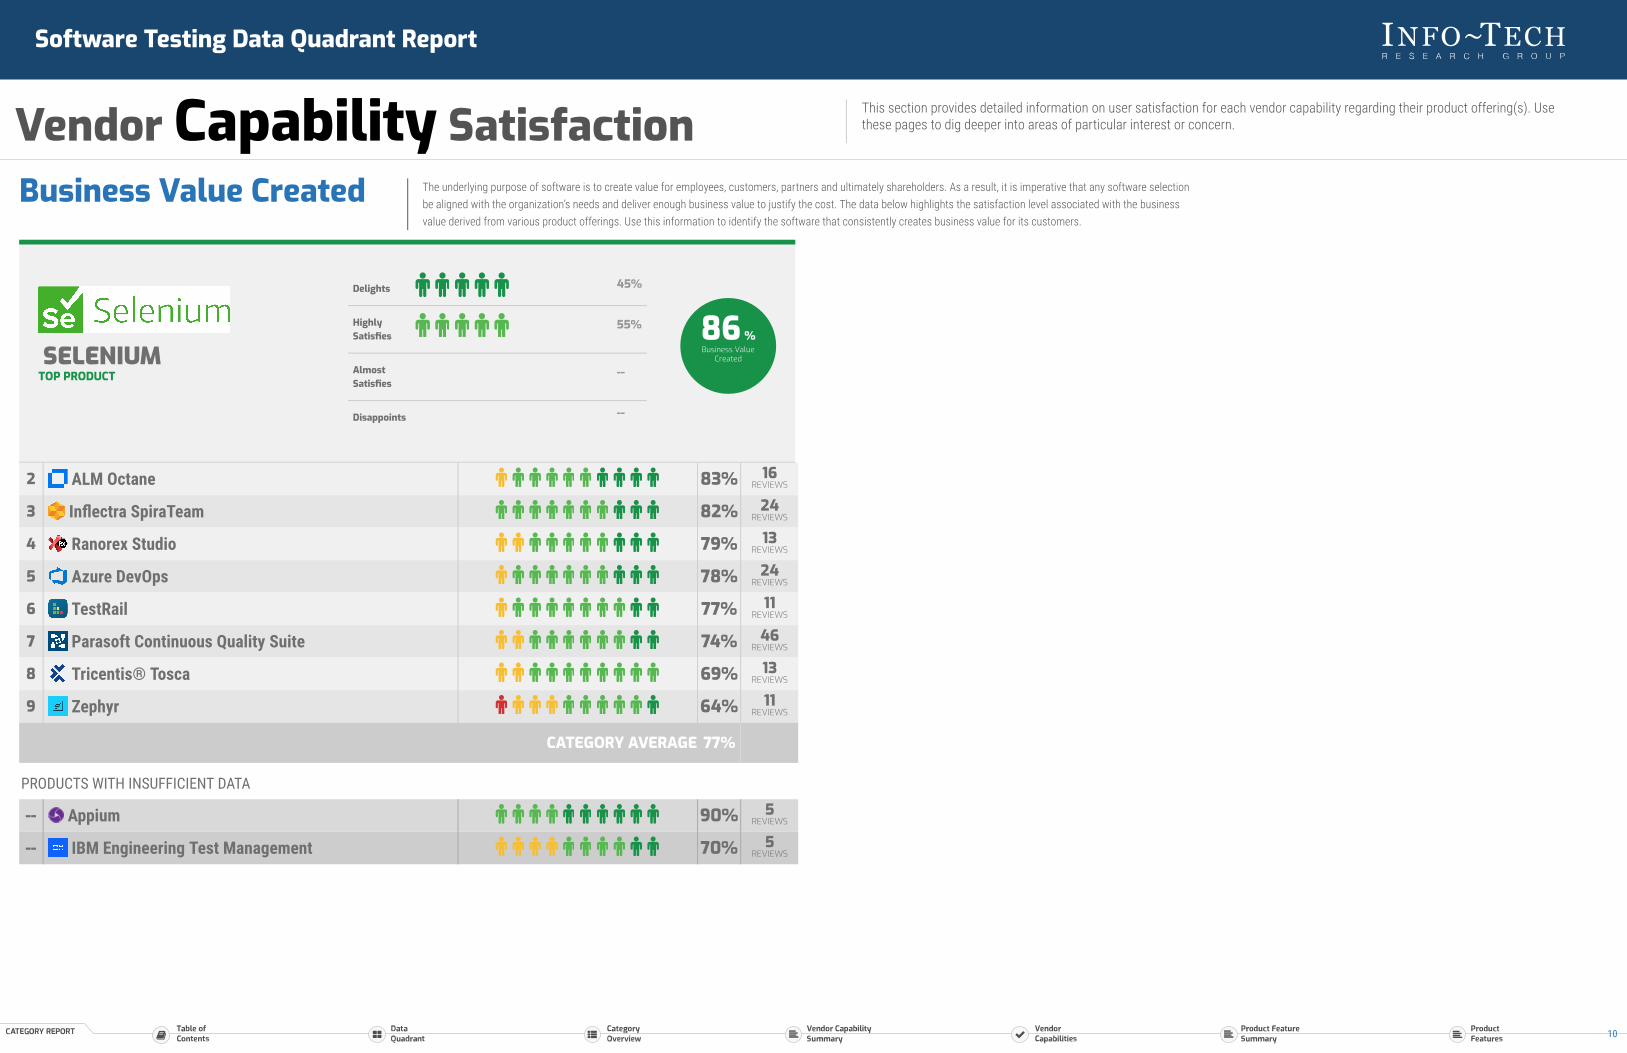
Business Value Created The underlying purpose of software is to create value for employees, customers, partners and ultimately shareholders. As a result, it is imperative that any software selection
be aligned with the organization’s needs and deliver enough business value to justify the cost. The data below highlights the satisfaction level associated with the business
value derived from various product offerings. Use this information to identify the software that consistently creates business value for its customers.
PRODUCTS WITH INSUFFICIENT DATA
-- Appium 90% 5REVIEWS
-- IBM Engineering Test Management 70% 5REVIEWS
2 ALM Octane 83% 16REVIEWS
3 Inflectra SpiraTeam 82% 24REVIEWS
4 Ranorex Studio 79% 13REVIEWS
5 Azure DevOps 78% 24REVIEWS
6 TestRail 77% 11REVIEWS
7 Parasoft Continuous Quality Suite 74% 46REVIEWS
8 Tricentis® Tosca 69% 13REVIEWS
9 Zephyr 64% 11REVIEWS
CATEGORY AVERAGE 77%
SELENIUMTOP PRODUCT
Delights 45%
HighlySatisfies
55%
AlmostSatisfies
--
Disappoints --
86 %Business Value
Created
Software Testing Data Quadrant Report
Vendor Capability Satisfaction This section provides detailed information on user satisfaction for each vendor capability regarding their product offering(s). Usethese pages to dig deeper into areas of particular interest or concern.
10
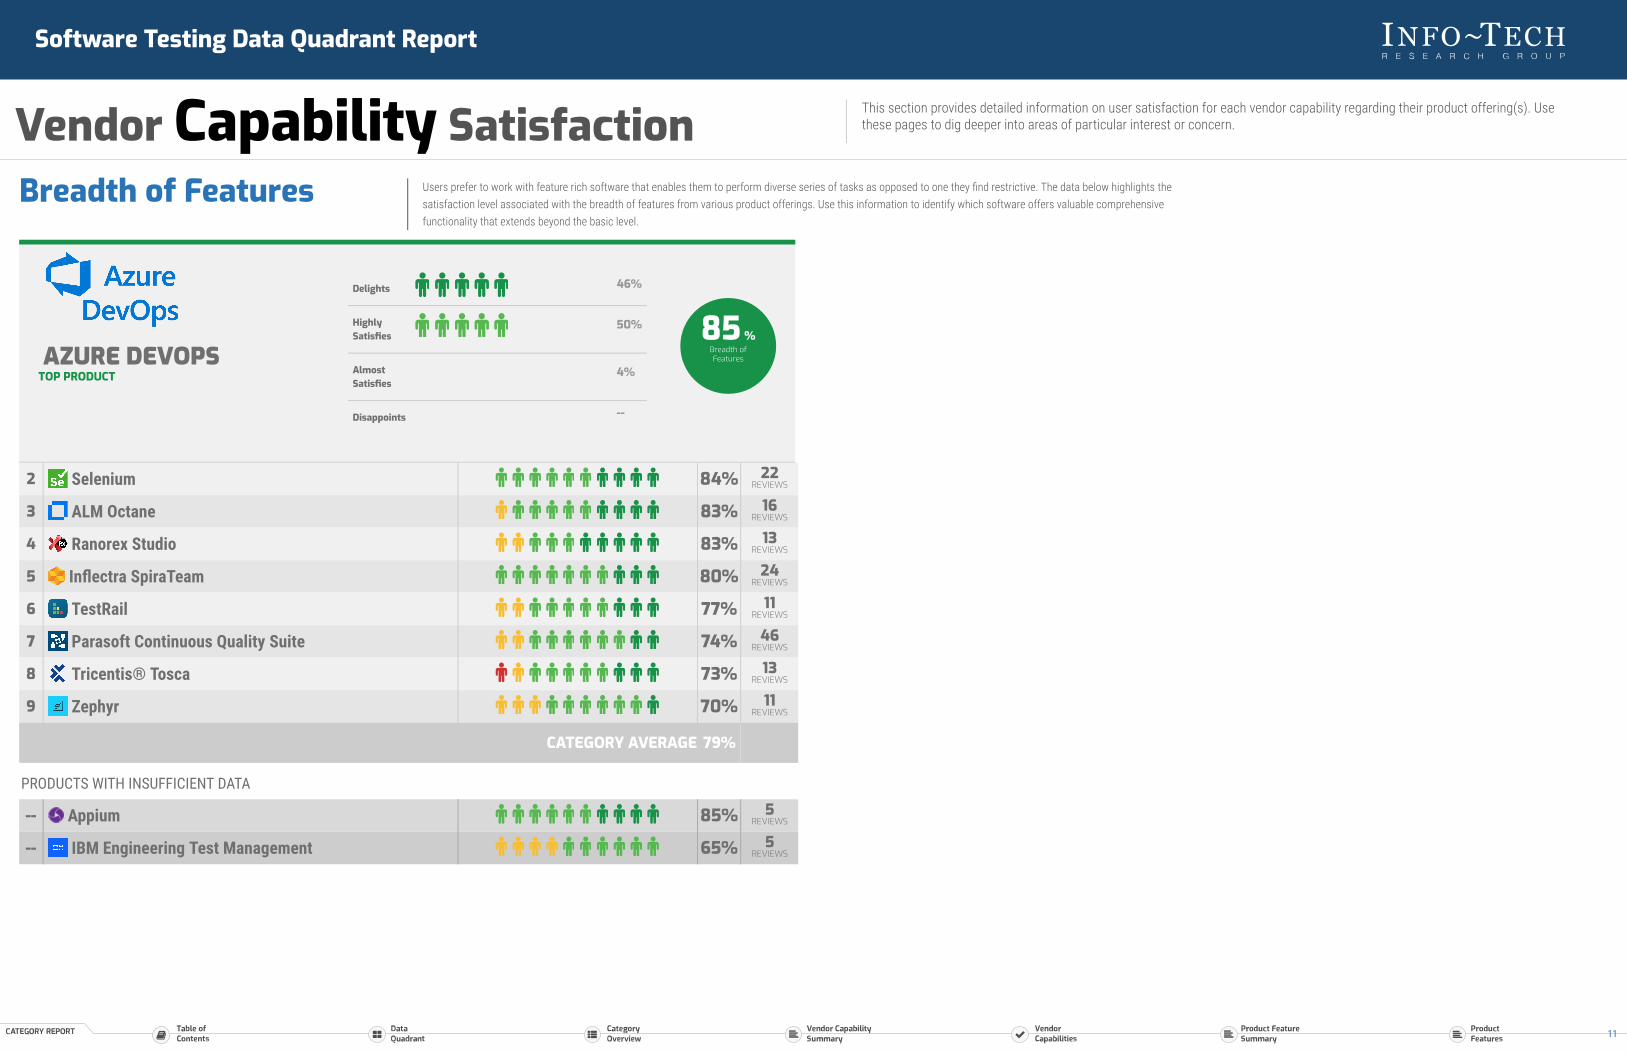
Breadth of Features Users prefer to work with feature rich software that enables them to perform diverse series of tasks as opposed to one they find restrictive. The data below highlights the
satisfaction level associated with the breadth of features from various product offerings. Use this information to identify which software offers valuable comprehensive
functionality that extends beyond the basic level.
PRODUCTS WITH INSUFFICIENT DATA
-- Appium 85% 5REVIEWS
-- IBM Engineering Test Management 65% 5REVIEWS
2 Selenium 84% 22REVIEWS
3 ALM Octane 83% 16REVIEWS
4 Ranorex Studio 83% 13REVIEWS
5 Inflectra SpiraTeam 80% 24REVIEWS
6 TestRail 77% 11REVIEWS
7 Parasoft Continuous Quality Suite 74% 46REVIEWS
8 Tricentis® Tosca 73% 13REVIEWS
9 Zephyr 70% 11REVIEWS
CATEGORY AVERAGE 79%
AZURE DEVOPSTOP PRODUCT
Delights 46%
HighlySatisfies
50%
AlmostSatisfies
4%
Disappoints --
85 %Breadth ofFeatures
Software Testing Data Quadrant Report
Vendor Capability Satisfaction This section provides detailed information on user satisfaction for each vendor capability regarding their product offering(s). Usethese pages to dig deeper into areas of particular interest or concern.
11

Quality of Features Feature quality is just as important as quantity. Software needs to do what you’re purchasing it to do, easily, intuitively, reliably, and effectively. Use the data in this section to
gauge whether or not a product follows through on the marketing hype by delivering high quality features.
PRODUCTS WITH INSUFFICIENT DATA
-- Appium 80% 5REVIEWS
-- IBM Engineering Test Management 75% 5REVIEWS
2 Azure DevOps 86% 24REVIEWS
3 TestRail 86% 11REVIEWS
4 ALM Octane 83% 16REVIEWS
5 Inflectra SpiraTeam 81% 24REVIEWS
6 Ranorex Studio 81% 13REVIEWS
7 Parasoft Continuous Quality Suite 78% 46REVIEWS
8 Tricentis® Tosca 77% 13REVIEWS
9 Zephyr 68% 11REVIEWS
CATEGORY AVERAGE 81%
SELENIUMTOP PRODUCT
Delights 59%
HighlySatisfies
36%
AlmostSatisfies
5%
Disappoints --
89 %Quality of Features
Software Testing Data Quadrant Report
Vendor Capability Satisfaction This section provides detailed information on user satisfaction for each vendor capability regarding their product offering(s). Usethese pages to dig deeper into areas of particular interest or concern.
12

Product Strategy andRate of Improvement
Purchasing software can be a significant commitment, so it’s important to know if your vendor is serious about the need for constant improvement and deliberate strategic
direction. Vendors who don’t stay on top of emerging needs and trends won’t enable you to meet your business goals. Use the data in this section to separate innovators from
imposters.
PRODUCTS WITH INSUFFICIENT DATA
-- Appium 75% 5REVIEWS
-- IBM Engineering Test Management 60% 5REVIEWS
2 Inflectra SpiraTeam 82% 24REVIEWS
3 Azure DevOps 76% 24REVIEWS
4 ALM Octane 75% 16REVIEWS
5 Ranorex Studio 73% 13REVIEWS
6 Parasoft Continuous Quality Suite 72% 46REVIEWS
7 Tricentis® Tosca 71% 13REVIEWS
8 TestRail 64% 11REVIEWS
9 Zephyr 61% 11REVIEWS
CATEGORY AVERAGE 73%
SELENIUMTOP PRODUCT
Delights 45%
HighlySatisfies
50%
AlmostSatisfies
5%
Disappoints --
85 %Product Strategy
and Rate ofImprovement
Software Testing Data Quadrant Report
Vendor Capability Satisfaction This section provides detailed information on user satisfaction for each vendor capability regarding their product offering(s). Usethese pages to dig deeper into areas of particular interest or concern.
13
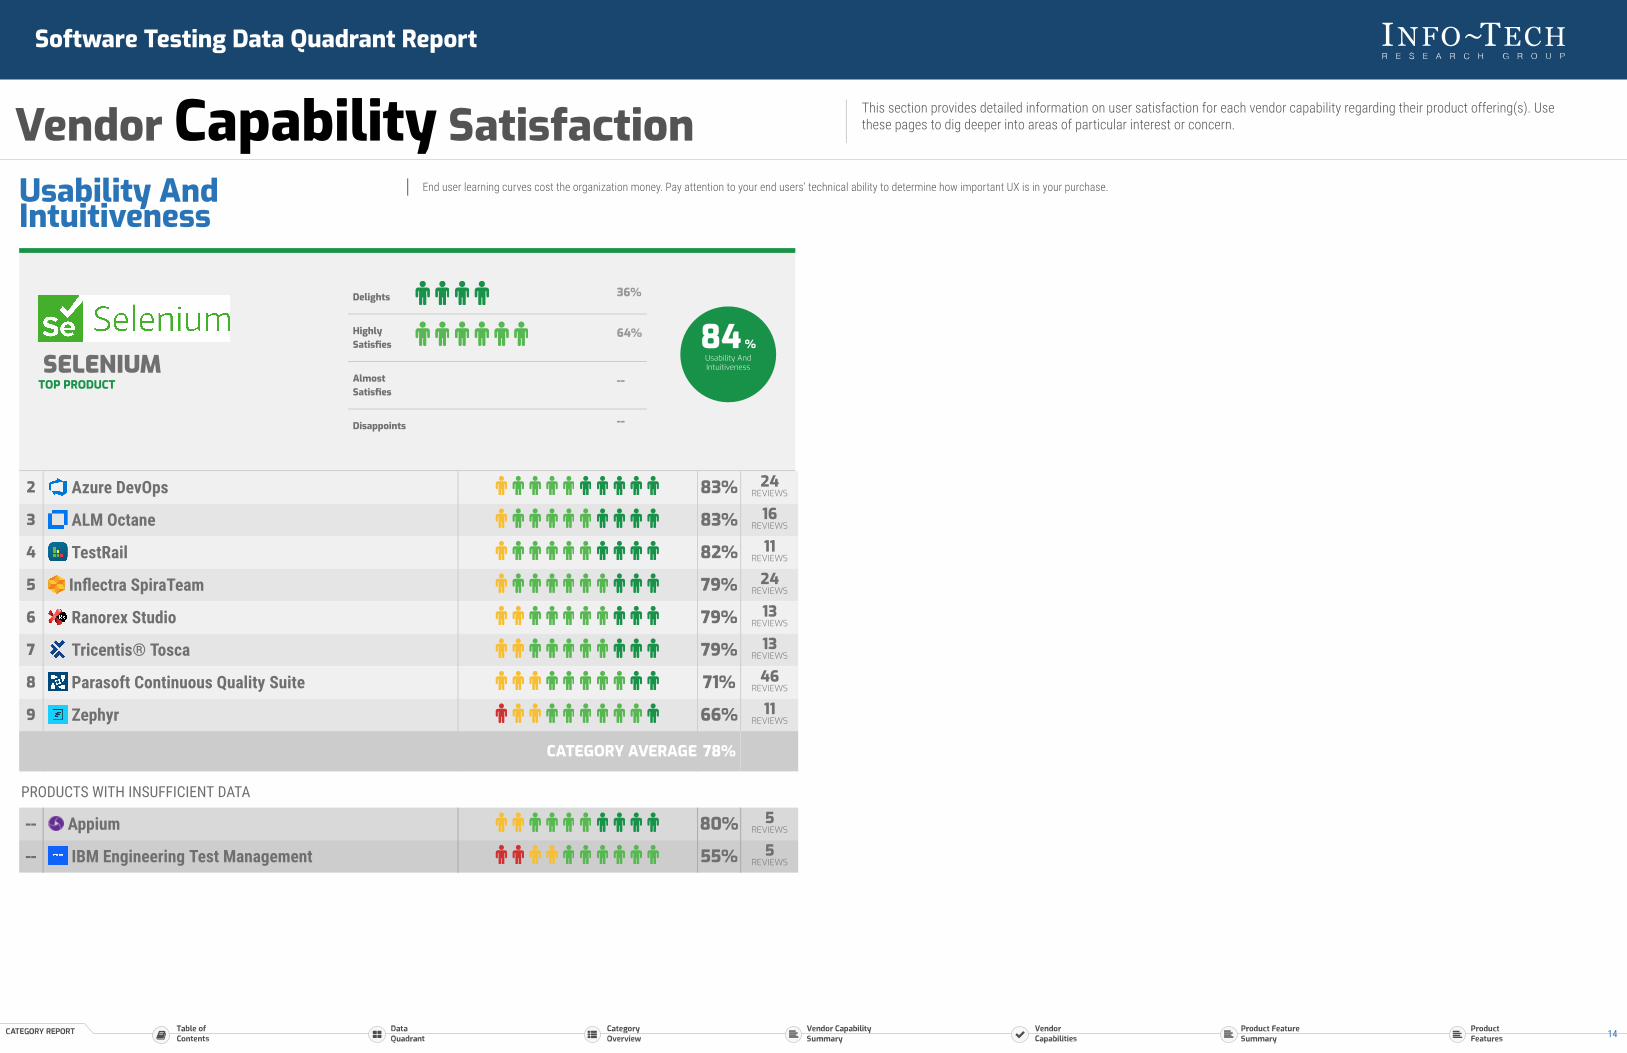
Usability AndIntuitiveness
End user learning curves cost the organization money. Pay attention to your end users’ technical ability to determine how important UX is in your purchase.
PRODUCTS WITH INSUFFICIENT DATA
-- Appium 80% 5REVIEWS
-- IBM Engineering Test Management 55% 5REVIEWS
2 Azure DevOps 83% 24REVIEWS
3 ALM Octane 83% 16REVIEWS
4 TestRail 82% 11REVIEWS
5 Inflectra SpiraTeam 79% 24REVIEWS
6 Ranorex Studio 79% 13REVIEWS
7 Tricentis® Tosca 79% 13REVIEWS
8 Parasoft Continuous Quality Suite 71% 46REVIEWS
9 Zephyr 66% 11REVIEWS
CATEGORY AVERAGE 78%
SELENIUMTOP PRODUCT
Delights 36%
HighlySatisfies
64%
AlmostSatisfies
--
Disappoints --
84 %Usability AndIntuitiveness
Software Testing Data Quadrant Report
Vendor Capability Satisfaction This section provides detailed information on user satisfaction for each vendor capability regarding their product offering(s). Usethese pages to dig deeper into areas of particular interest or concern.
14
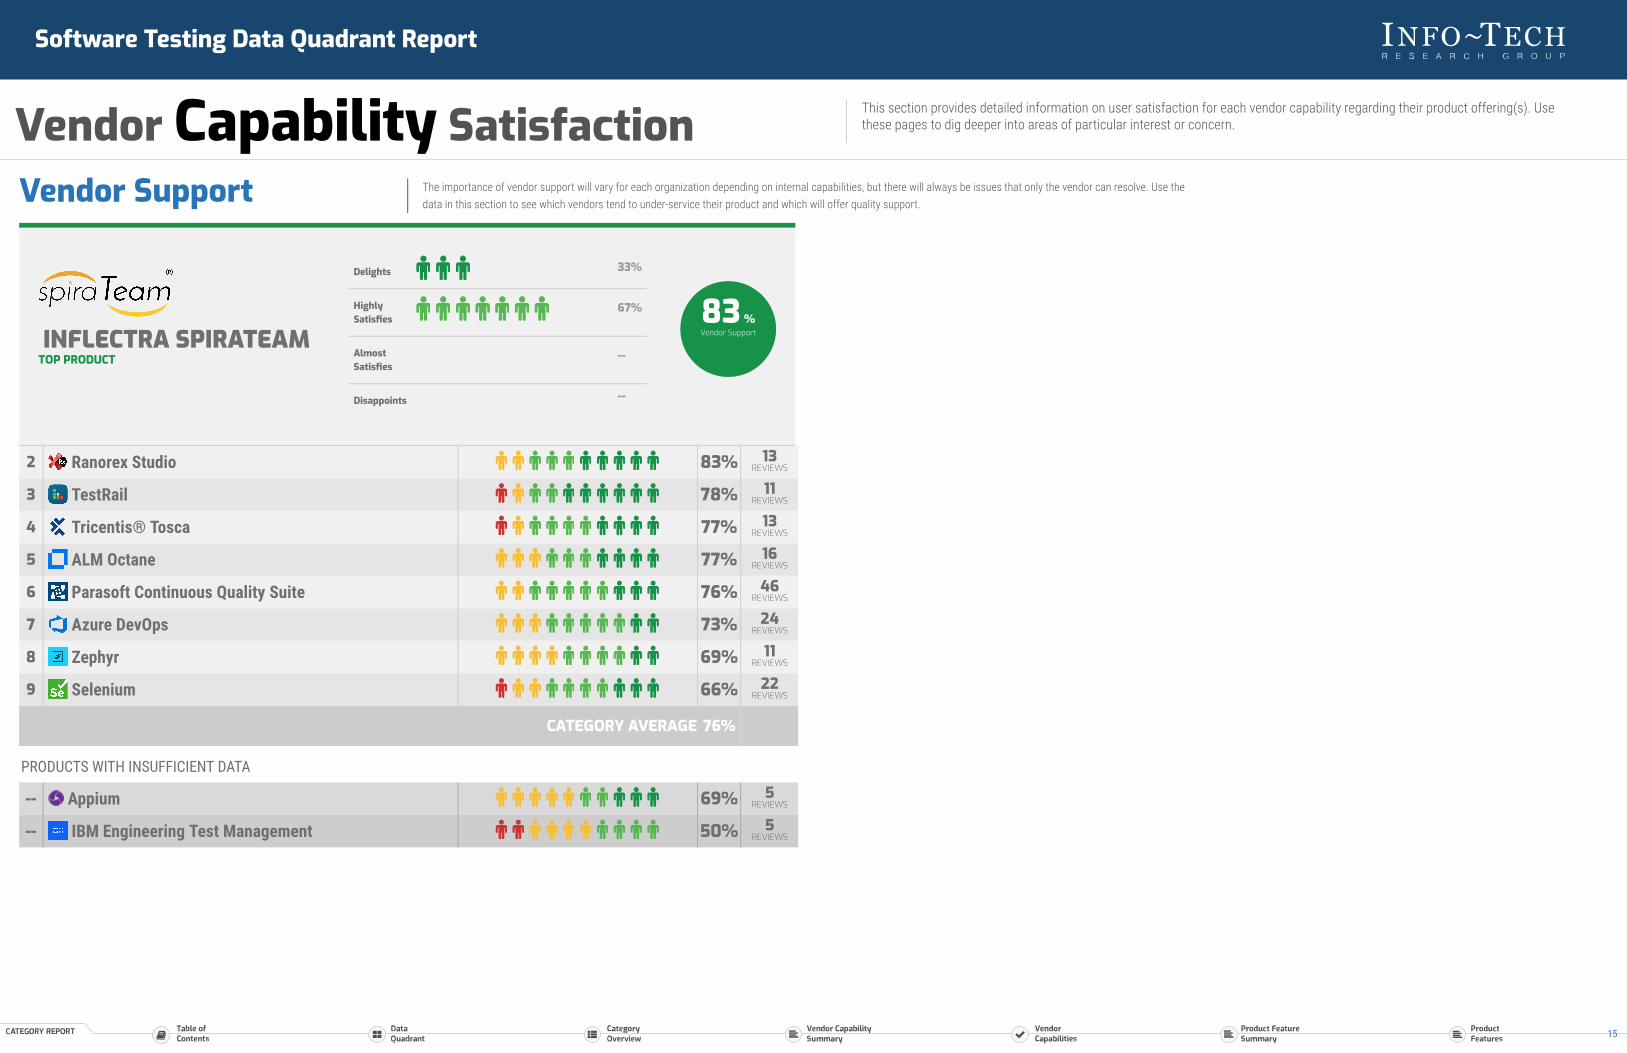
Vendor Support The importance of vendor support will vary for each organization depending on internal capabilities, but there will always be issues that only the vendor can resolve. Use the
data in this section to see which vendors tend to under-service their product and which will offer quality support.
PRODUCTS WITH INSUFFICIENT DATA
-- Appium 69% 5REVIEWS
-- IBM Engineering Test Management 50% 5REVIEWS
2 Ranorex Studio 83% 13REVIEWS
3 TestRail 78% 11REVIEWS
4 Tricentis® Tosca 77% 13REVIEWS
5 ALM Octane 77% 16REVIEWS
6 Parasoft Continuous Quality Suite 76% 46REVIEWS
7 Azure DevOps 73% 24REVIEWS
8 Zephyr 69% 11REVIEWS
9 Selenium 66% 22REVIEWS
CATEGORY AVERAGE 76%
INFLECTRA SPIRATEAMTOP PRODUCT
Delights 33%
HighlySatisfies
67%
AlmostSatisfies
--
Disappoints --
83 %Vendor Support
Software Testing Data Quadrant Report
Vendor Capability Satisfaction This section provides detailed information on user satisfaction for each vendor capability regarding their product offering(s). Usethese pages to dig deeper into areas of particular interest or concern.
15

Ease of Data Integration The ability to integrate with other systems is increasingly important; without this, manual data loading and extraction can be time-consuming and prone to error. Use this
section to see which vendors will cause headaches and which will make data integration easy.
PRODUCTS WITH INSUFFICIENT DATA
-- Appium 81% 5REVIEWS
-- IBM Engineering Test Management 55% 5REVIEWS
2 Selenium 83% 22REVIEWS
3 Ranorex Studio 83% 13REVIEWS
4 ALM Octane 81% 16REVIEWS
5 Inflectra SpiraTeam 78% 24REVIEWS
6 Zephyr 78% 11REVIEWS
7 TestRail 77% 11REVIEWS
8 Parasoft Continuous Quality Suite 76% 46REVIEWS
9 Tricentis® Tosca 69% 13REVIEWS
CATEGORY AVERAGE 79%
AZURE DEVOPSTOP PRODUCT
Delights 42%
HighlySatisfies
54%
AlmostSatisfies
4%
Disappoints --
84 %Ease of DataIntegration
Software Testing Data Quadrant Report
Vendor Capability Satisfaction This section provides detailed information on user satisfaction for each vendor capability regarding their product offering(s). Usethese pages to dig deeper into areas of particular interest or concern.
16
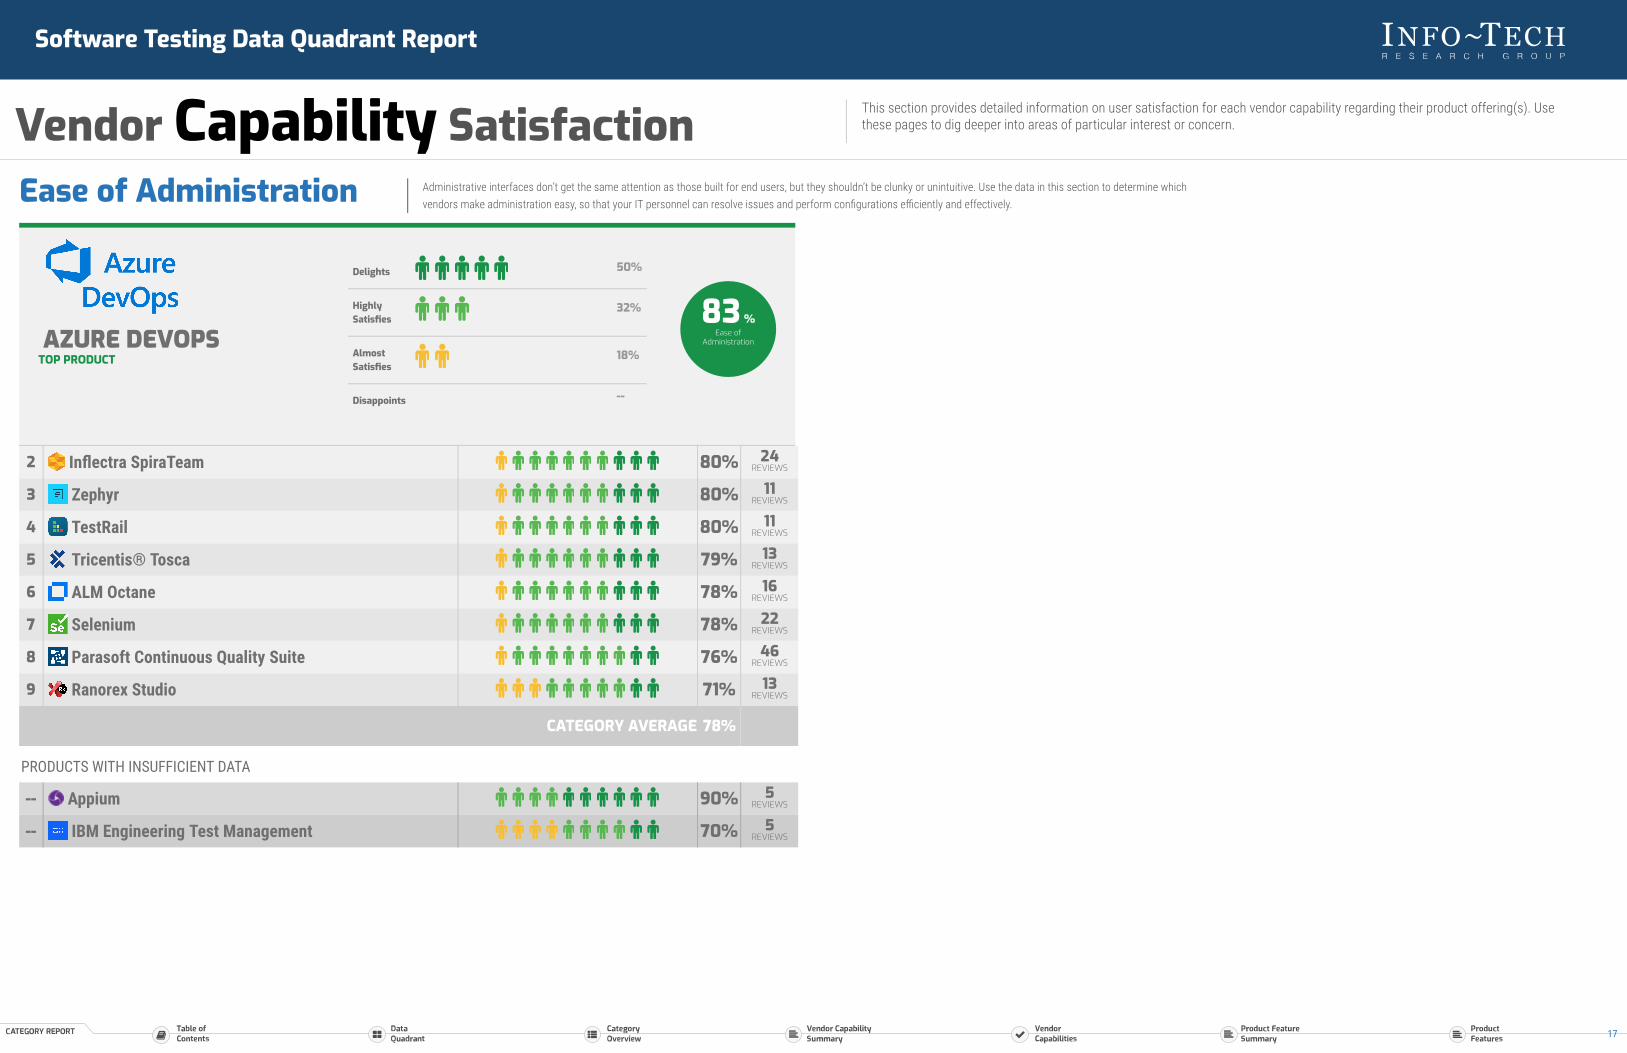
Ease of Administration Administrative interfaces don’t get the same attention as those built for end users, but they shouldn’t be clunky or unintuitive. Use the data in this section to determine which
vendors make administration easy, so that your IT personnel can resolve issues and perform configurations efficiently and effectively.
PRODUCTS WITH INSUFFICIENT DATA
-- Appium 90% 5REVIEWS
-- IBM Engineering Test Management 70% 5REVIEWS
2 Inflectra SpiraTeam 80% 24REVIEWS
3 Zephyr 80% 11REVIEWS
4 TestRail 80% 11REVIEWS
5 Tricentis® Tosca 79% 13REVIEWS
6 ALM Octane 78% 16REVIEWS
7 Selenium 78% 22REVIEWS
8 Parasoft Continuous Quality Suite 76% 46REVIEWS
9 Ranorex Studio 71% 13REVIEWS
CATEGORY AVERAGE 78%
AZURE DEVOPSTOP PRODUCT
Delights 50%
HighlySatisfies
32%
AlmostSatisfies
18%
Disappoints --
83 %Ease of
Administration
Software Testing Data Quadrant Report
Vendor Capability Satisfaction This section provides detailed information on user satisfaction for each vendor capability regarding their product offering(s). Usethese pages to dig deeper into areas of particular interest or concern.
17
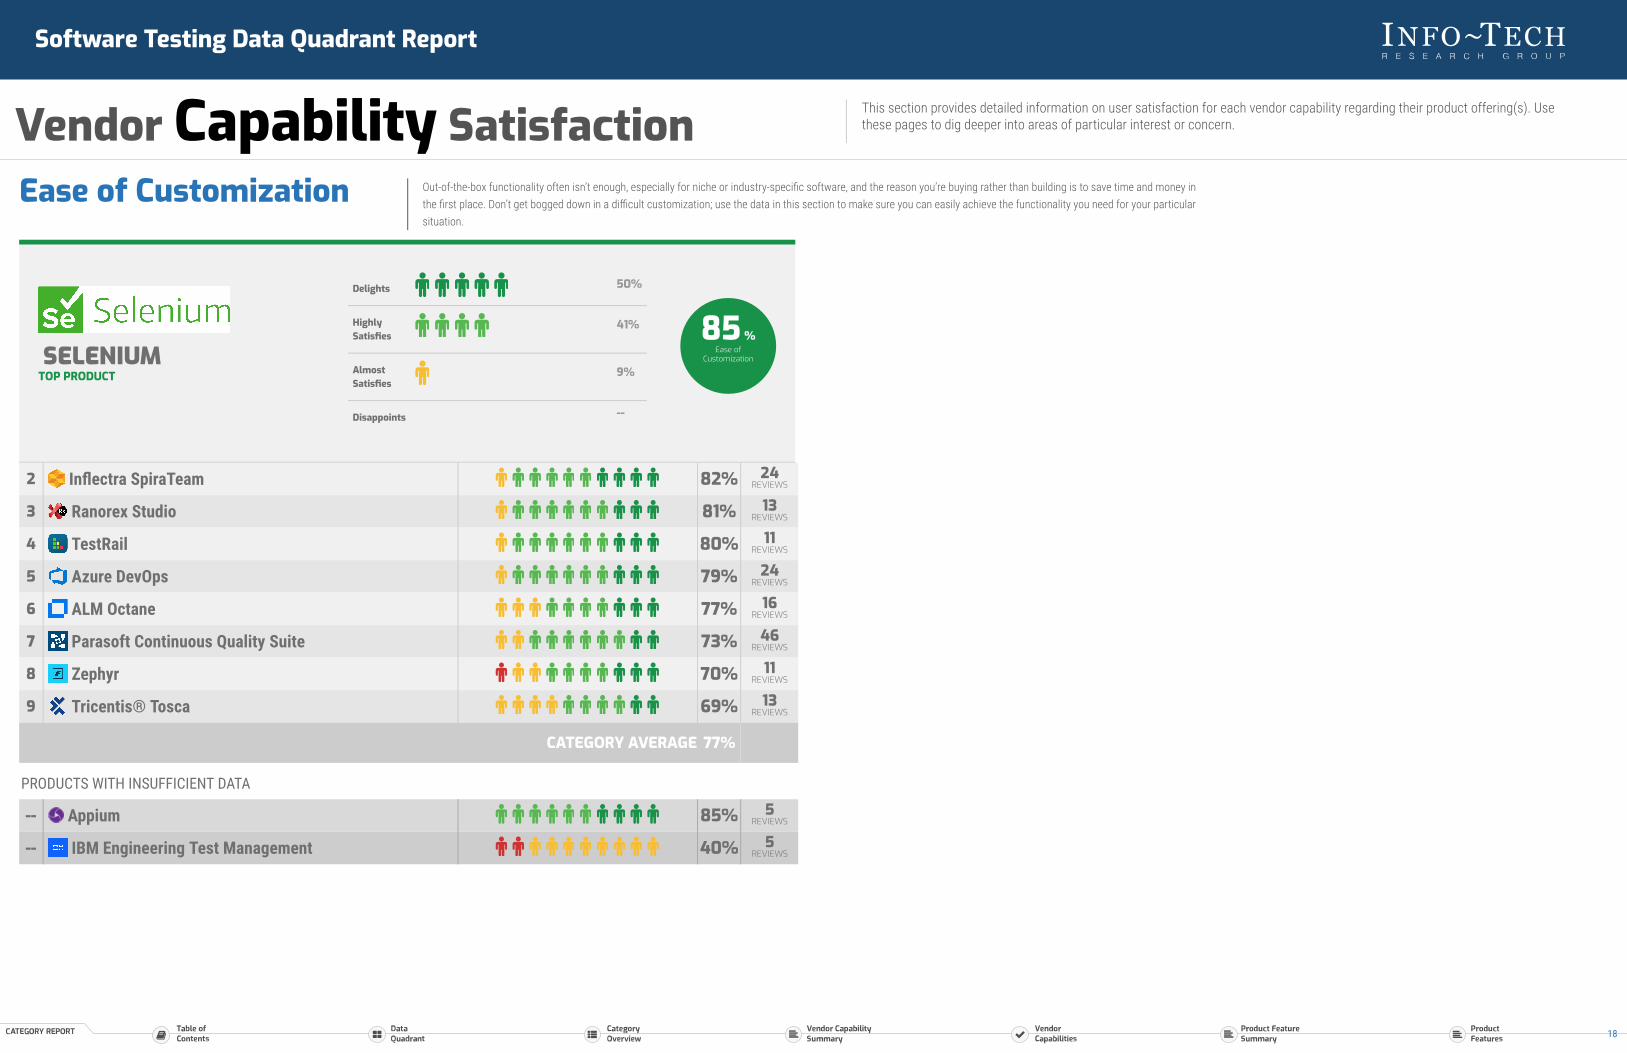
Ease of Customization Out-of-the-box functionality often isn’t enough, especially for niche or industry-specific software, and the reason you’re buying rather than building is to save time and money in
the first place. Don’t get bogged down in a difficult customization; use the data in this section to make sure you can easily achieve the functionality you need for your particular
situation.
PRODUCTS WITH INSUFFICIENT DATA
-- Appium 85% 5REVIEWS
-- IBM Engineering Test Management 40% 5REVIEWS
2 Inflectra SpiraTeam 82% 24REVIEWS
3 Ranorex Studio 81% 13REVIEWS
4 TestRail 80% 11REVIEWS
5 Azure DevOps 79% 24REVIEWS
6 ALM Octane 77% 16REVIEWS
7 Parasoft Continuous Quality Suite 73% 46REVIEWS
8 Zephyr 70% 11REVIEWS
9 Tricentis® Tosca 69% 13REVIEWS
CATEGORY AVERAGE 77%
SELENIUMTOP PRODUCT
Delights 50%
HighlySatisfies
41%
AlmostSatisfies
9%
Disappoints --
85 %Ease of
Customization
Software Testing Data Quadrant Report
Vendor Capability Satisfaction This section provides detailed information on user satisfaction for each vendor capability regarding their product offering(s). Usethese pages to dig deeper into areas of particular interest or concern.
18

Availability and Qualityof Training
Effective and readily available training enables users to get the most out of the software you’ve chosen. Use this section to make sure your vendor’s training programs and
materials measure up.
PRODUCTS WITH INSUFFICIENT DATA
-- Appium 80% 5REVIEWS
-- IBM Engineering Test Management 45% 5REVIEWS
2 TestRail 85% 11REVIEWS
3 Selenium 84% 22REVIEWS
4 ALM Octane 80% 16REVIEWS
5 Zephyr 80% 11REVIEWS
6 Ranorex Studio 77% 13REVIEWS
7 Azure DevOps 77% 24REVIEWS
8 Parasoft Continuous Quality Suite 75% 46REVIEWS
9 Inflectra SpiraTeam 75% 24REVIEWS
CATEGORY AVERAGE 80%
TRICENTIS® TOSCATOP PRODUCT
Delights 62%
HighlySatisfies
23%
AlmostSatisfies
15%
Disappoints --
87 %Availability and
Quality of Training
Software Testing Data Quadrant Report
Vendor Capability Satisfaction This section provides detailed information on user satisfaction for each vendor capability regarding their product offering(s). Usethese pages to dig deeper into areas of particular interest or concern.
19

Ease of Implementation Choosing the right software is only the first step. Successfully implementing the new solution is necessary in order to realize its full value and promote end user adoption. Use
the data in this section to determine which software is easy to implement, and which may jeopardize your goals by causing trouble in this stage.
PRODUCTS WITH INSUFFICIENT DATA
-- Appium 85% 5REVIEWS
-- IBM Engineering Test Management 55% 5REVIEWS
2 TestRail 86% 11REVIEWS
3 Azure DevOps 83% 24REVIEWS
4 ALM Octane 82% 16REVIEWS
5 Ranorex Studio 81% 13REVIEWS
6 Tricentis® Tosca 81% 13REVIEWS
7 Zephyr 80% 11REVIEWS
8 Inflectra SpiraTeam 77% 24REVIEWS
9 Parasoft Continuous Quality Suite 73% 46REVIEWS
CATEGORY AVERAGE 81%
SELENIUMTOP PRODUCT
Delights 52%
HighlySatisfies
43%
AlmostSatisfies
5%
Disappoints --
87 %Ease of
Implementation
Software Testing Data Quadrant Report
Vendor Capability Satisfaction This section provides detailed information on user satisfaction for each vendor capability regarding their product offering(s). Usethese pages to dig deeper into areas of particular interest or concern.
20

Product Feature Summary MANDATORY FEATURES
This page summarizes user satisfaction with a variety of product features. While strong and consistent performance across the board is desirable, you may be willing totolerate low scores on features that don’t impact your primary use case or core objectives. Use this high-level data to help plan and structure your product evaluation.
PRODUCTOVERALLFEATURESATISFACTION
ALMINTEGRATION
ANALYTICS ANDREPORTING
ARTIFACTMANAGEMENT
ARTIFACTTRACEABILITY AUDIT LOG TEST CASE
GENERATORTEST COVERAGEANALYSIS TEST PLANNING
TEST RUNWORKFLOWMANAGER
TEST SCRIPTEDITOR
ALM Octane 82% 81% 88% 80% 81% 78% 83% 83% 85% 80% 84%
Selenium 82% 84% 85% 76% 79% 83% 81% 86% 83% 80% 85%
Inflectra SpiraTeam 79% 83% 77% 80% 83% 79% 76% 75% 79% 80% 79%
Azure DevOps 79% 85% 79% 76% 85% 83% 73% 71% 77% 79% 78%
Tricentis® Tosca 76% 80% 77% 77% 75% 77% 71% 75% 73% 75% 85%
TestRail 76% 75% 77% 78% 68% 73% 81% 75% 84% 73% 80%
Zephyr 75% 69% 73% 69% 75% 78% 75% 73% 80% 80% 82%
Parasoft Continuous Quality Suite 74% 71% 73% 74% 77% 74% 73% 75% 73% 77% 78%
Ranorex Studio 74% 72% 81% 50% 77% 80% 73% 81% 75% 70% 85%
CATEGORY AVERAGE 78% 78% 79% 73% 78% 78% 76% 77% 79% 77% 82%
PRODUCTS WITH INSUFFICIENT DATA
Appium 71% 75% 63% 58% 75% 83% 67% 75% 67% 83% 69%
Software Testing Data Quadrant Report
21
Product Feature Summary MANDATORY FEATURES
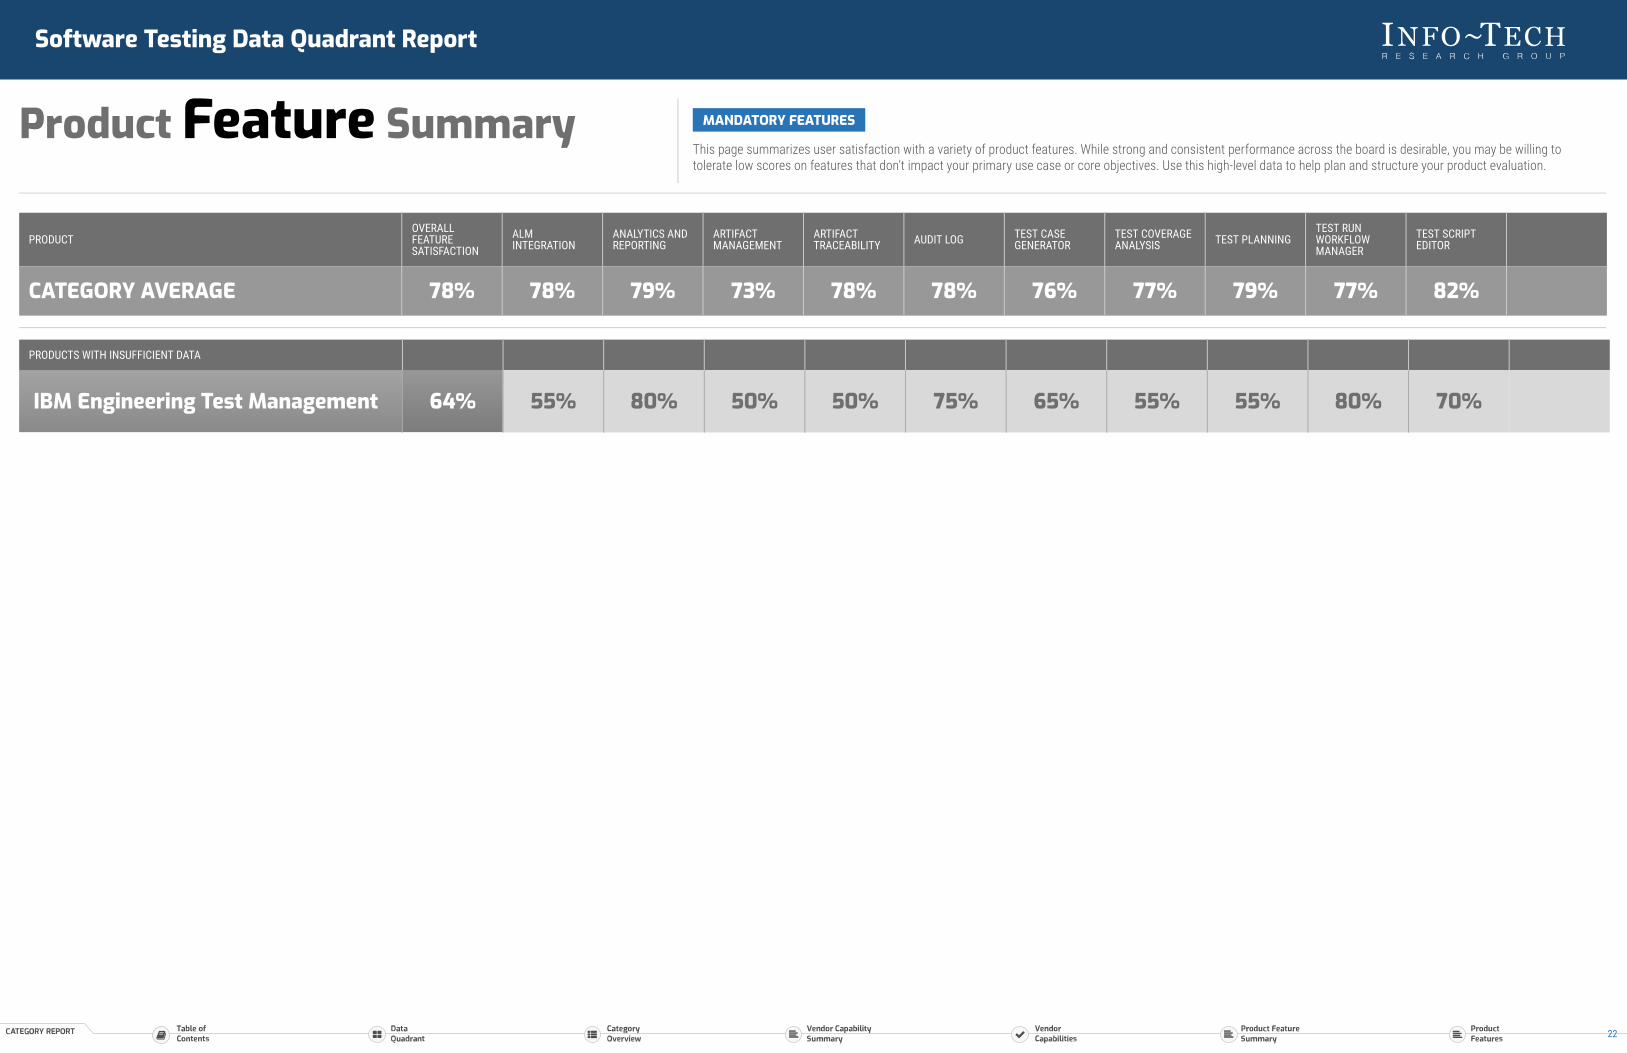
This page summarizes user satisfaction with a variety of product features. While strong and consistent performance across the board is desirable, you may be willing totolerate low scores on features that don’t impact your primary use case or core objectives. Use this high-level data to help plan and structure your product evaluation.
PRODUCTOVERALLFEATURESATISFACTION
ALMINTEGRATION
ANALYTICS ANDREPORTING
ARTIFACTMANAGEMENT
ARTIFACTTRACEABILITY AUDIT LOG TEST CASE
GENERATORTEST COVERAGEANALYSIS TEST PLANNING
TEST RUNWORKFLOWMANAGER
TEST SCRIPTEDITOR
CATEGORY AVERAGE 78% 78% 79% 73% 78% 78% 76% 77% 79% 77% 82%
PRODUCTS WITH INSUFFICIENT DATA
IBM Engineering Test Management 64% 55% 80% 50% 50% 75% 65% 55% 55% 80% 70%
Software Testing Data Quadrant Report
22
Product Feature Summary STANDARD FEATURES
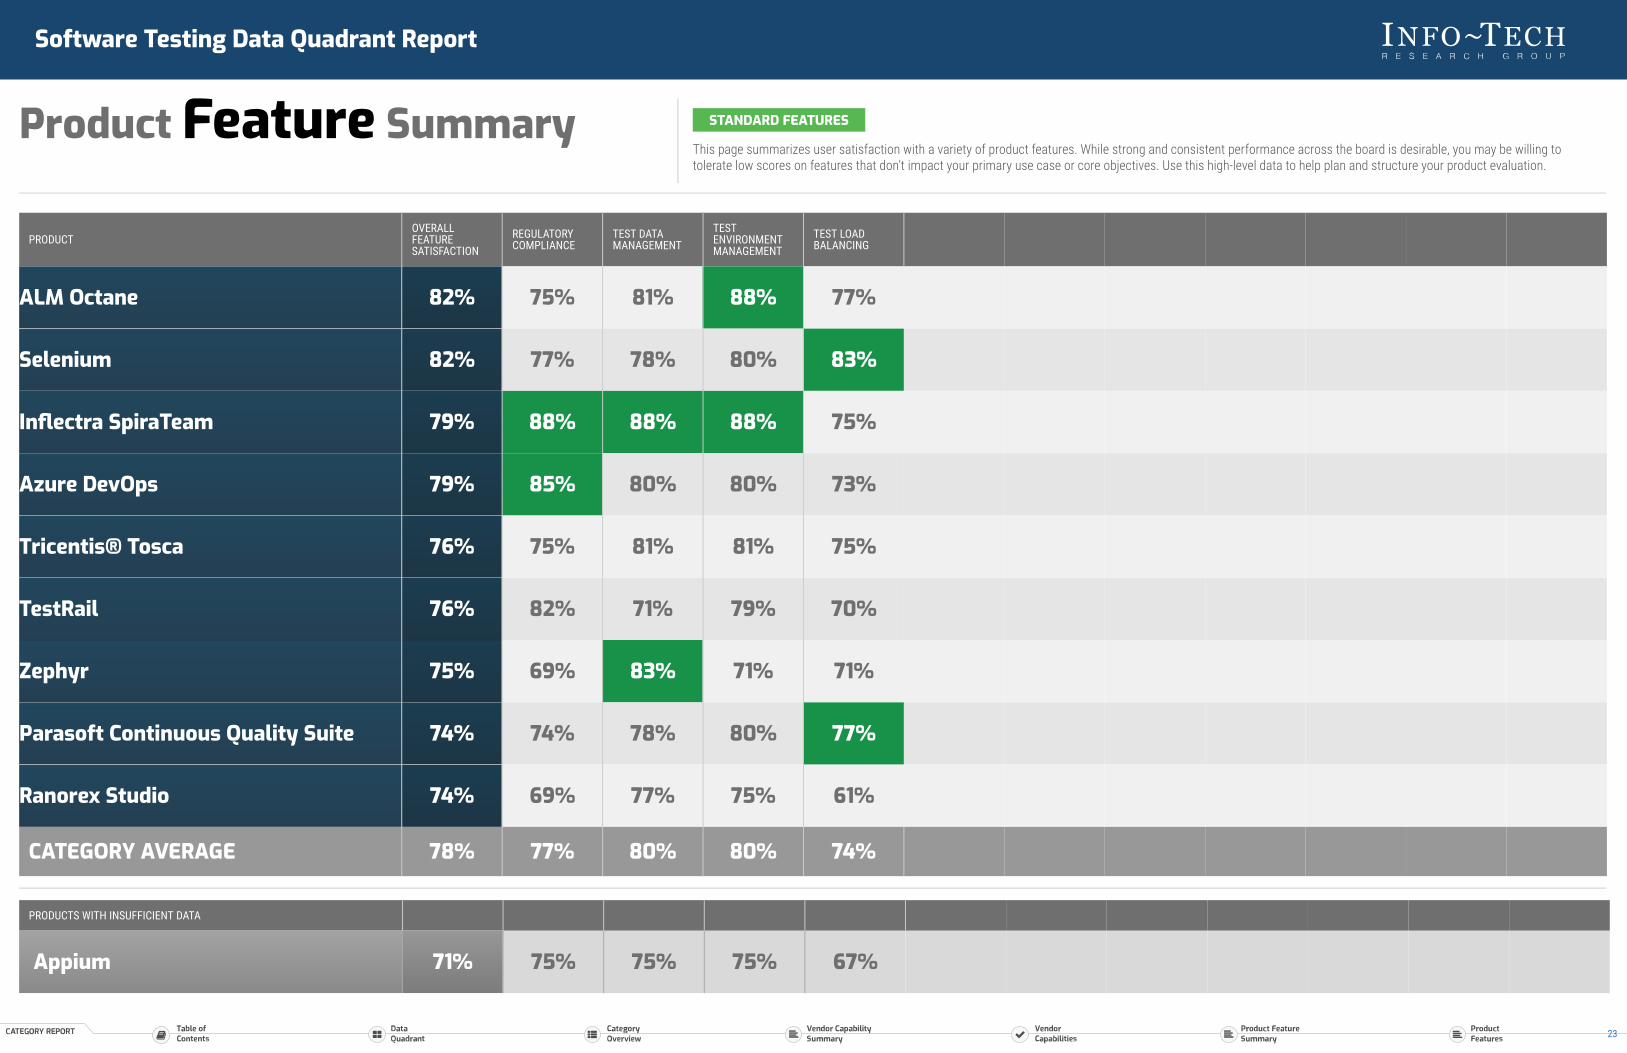
This page summarizes user satisfaction with a variety of product features. While strong and consistent performance across the board is desirable, you may be willing totolerate low scores on features that don’t impact your primary use case or core objectives. Use this high-level data to help plan and structure your product evaluation.
PRODUCTOVERALLFEATURESATISFACTION
REGULATORYCOMPLIANCE
TEST DATAMANAGEMENT
TESTENVIRONMENTMANAGEMENT
TEST LOADBALANCING
ALM Octane 82% 75% 81% 88% 77%
Selenium 82% 77% 78% 80% 83%
Inflectra SpiraTeam 79% 88% 88% 88% 75%
Azure DevOps 79% 85% 80% 80% 73%
Tricentis® Tosca 76% 75% 81% 81% 75%
TestRail 76% 82% 71% 79% 70%
Zephyr 75% 69% 83% 71% 71%
Parasoft Continuous Quality Suite 74% 74% 78% 80% 77%
Ranorex Studio 74% 69% 77% 75% 61%
CATEGORY AVERAGE 78% 77% 80% 80% 74%
PRODUCTS WITH INSUFFICIENT DATA
Appium 71% 75% 75% 75% 67%
Software Testing Data Quadrant Report
23

Product Feature Summary STANDARD FEATURES
This page summarizes user satisfaction with a variety of product features. While strong and consistent performance across the board is desirable, you may be willing totolerate low scores on features that don’t impact your primary use case or core objectives. Use this high-level data to help plan and structure your product evaluation.
PRODUCTOVERALLFEATURESATISFACTION
REGULATORYCOMPLIANCE
TEST DATAMANAGEMENT
TESTENVIRONMENTMANAGEMENT
TEST LOADBALANCING
CATEGORY AVERAGE 78% 77% 80% 80% 74%
PRODUCTS WITH INSUFFICIENT DATA
IBM Engineering Test Management 64% -- 75% 70% --
Software Testing Data Quadrant Report
24
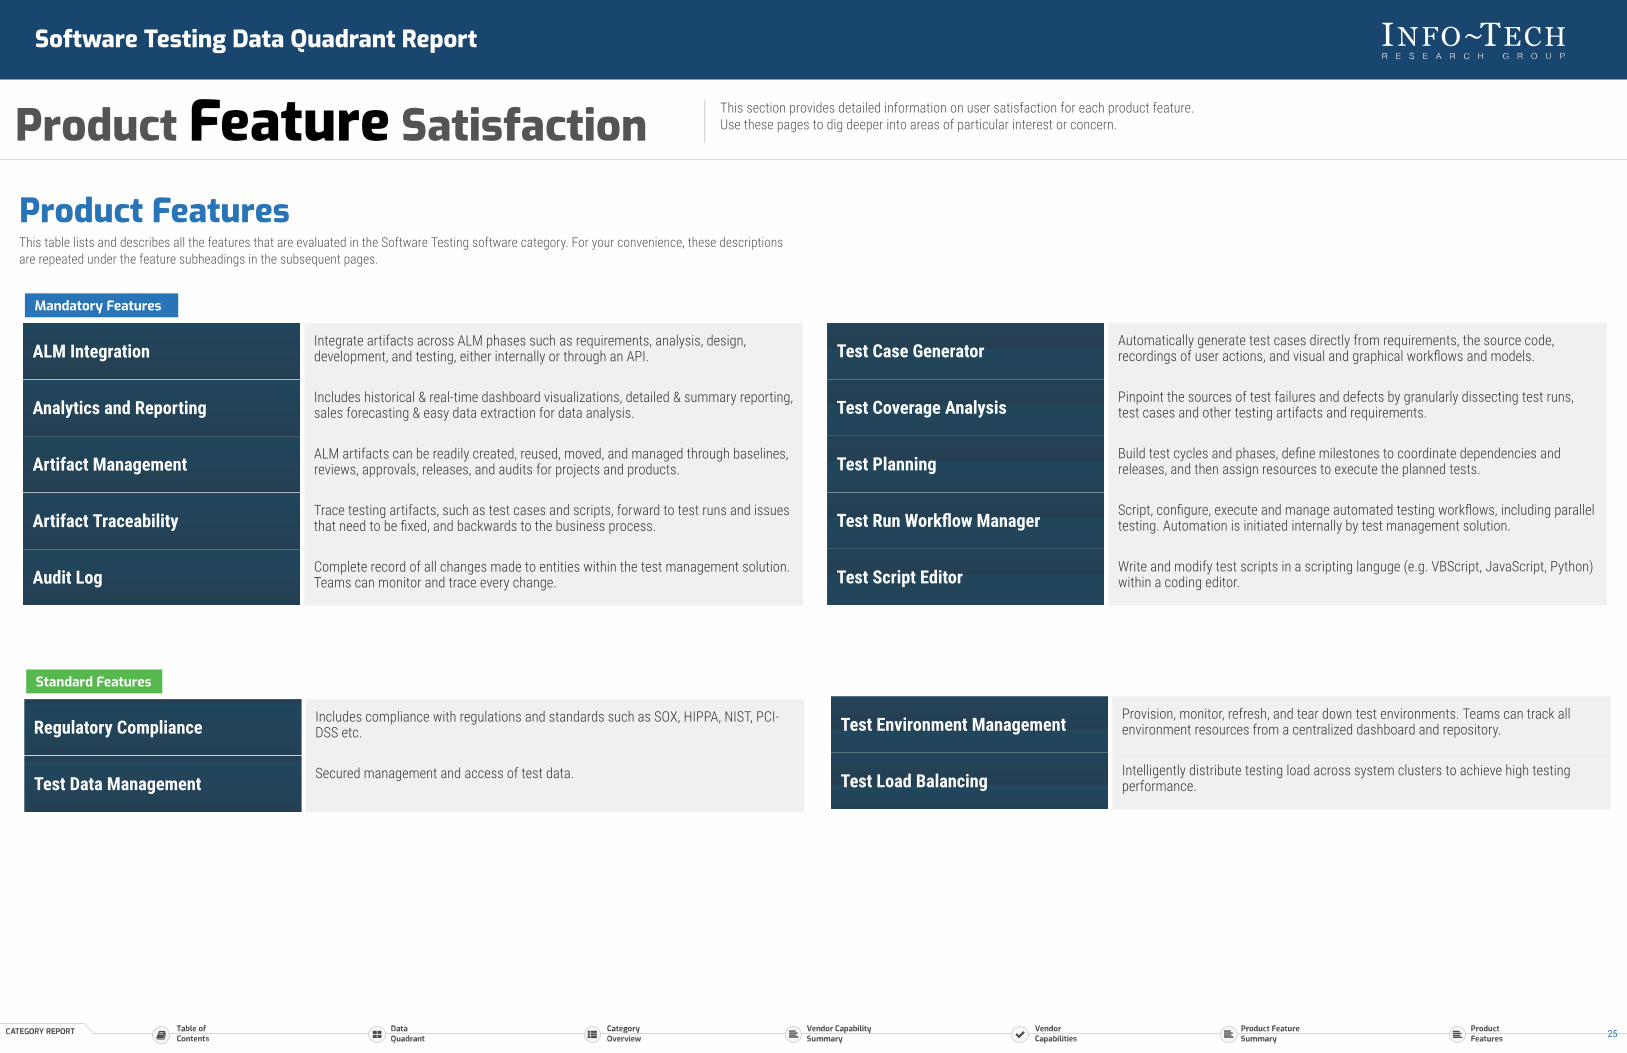
Mandatory Features
ALM IntegrationIntegrate artifacts across ALM phases such as requirements, analysis, design,development, and testing, either internally or through an API.
Analytics and ReportingIncludes historical & real-time dashboard visualizations, detailed & summary reporting,sales forecasting & easy data extraction for data analysis.
Artifact ManagementALM artifacts can be readily created, reused, moved, and managed through baselines,reviews, approvals, releases, and audits for projects and products.
Artifact TraceabilityTrace testing artifacts, such as test cases and scripts, forward to test runs and issuesthat need to be fixed, and backwards to the business process.
Audit LogComplete record of all changes made to entities within the test management solution.Teams can monitor and trace every change.
Test Case GeneratorAutomatically generate test cases directly from requirements, the source code,recordings of user actions, and visual and graphical workflows and models.
Test Coverage AnalysisPinpoint the sources of test failures and defects by granularly dissecting test runs,test cases and other testing artifacts and requirements.
Test PlanningBuild test cycles and phases, define milestones to coordinate dependencies andreleases, and then assign resources to execute the planned tests.
Test Run Workflow ManagerScript, configure, execute and manage automated testing workflows, including paralleltesting. Automation is initiated internally by test management solution.
Test Script EditorWrite and modify test scripts in a scripting languge (e.g. VBScript, JavaScript, Python)within a coding editor.
Standard Features
Regulatory ComplianceIncludes compliance with regulations and standards such as SOX, HIPPA, NIST, PCI-DSS etc.
Test Data ManagementSecured management and access of test data.
Test Environment ManagementProvision, monitor, refresh, and tear down test environments. Teams can track allenvironment resources from a centralized dashboard and repository.
Test Load BalancingIntelligently distribute testing load across system clusters to achieve high testingperformance.
Product FeaturesThis table lists and describes all the features that are evaluated in the Software Testing software category. For your convenience, these descriptionsare repeated under the feature subheadings in the subsequent pages.
Software Testing Data Quadrant Report
Product Feature Satisfaction This section provides detailed information on user satisfaction for each product feature.Use these pages to dig deeper into areas of particular interest or concern.
25
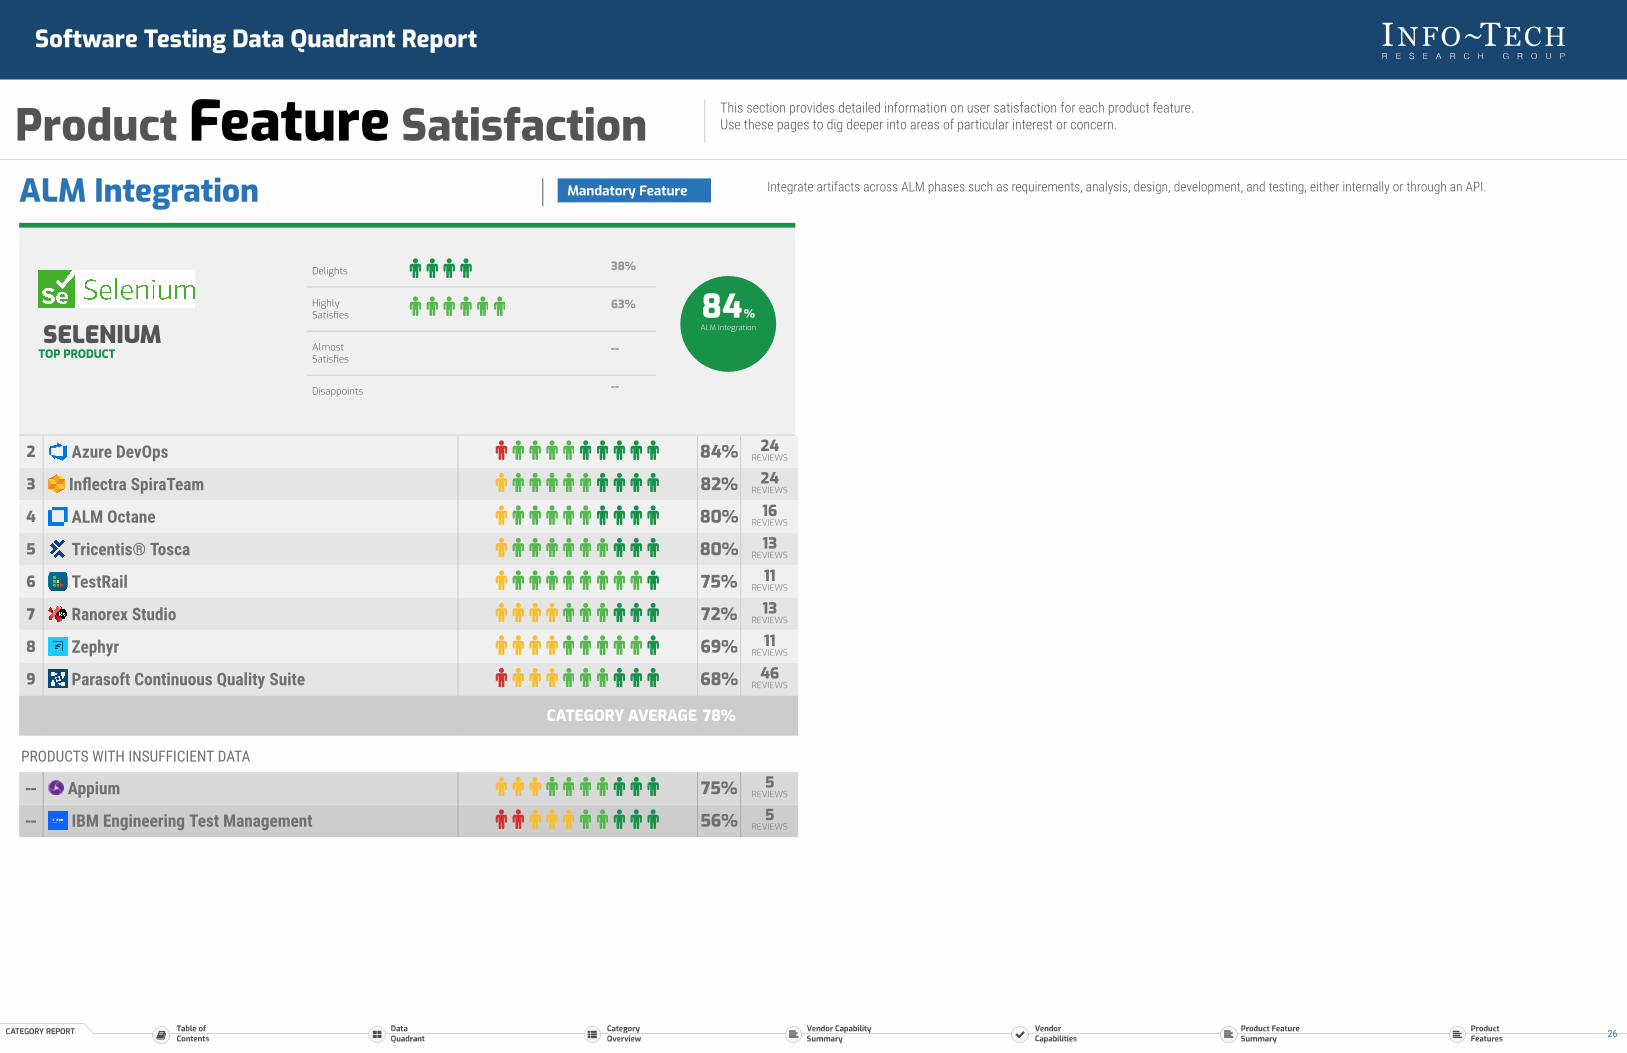
ALM Integration Integrate artifacts across ALM phases such as requirements, analysis, design, development, and testing, either internally or through an API.Mandatory Feature
PRODUCTS WITH INSUFFICIENT DATA
-- Appium 75% 5REVIEWS
-- IBM Engineering Test Management 56% 5REVIEWS
2 Azure DevOps 84% 24REVIEWS
3 Inflectra SpiraTeam 82% 24REVIEWS
4 ALM Octane 80% 16REVIEWS
5 Tricentis® Tosca 80% 13REVIEWS
6 TestRail 75% 11REVIEWS
7 Ranorex Studio 72% 13REVIEWS
8 Zephyr 69% 11REVIEWS
9 Parasoft Continuous Quality Suite 68% 46REVIEWS
CATEGORY AVERAGE 78%
SELENIUMTOP PRODUCT
Delights 38%
HighlySatisfies
63%
AlmostSatisfies
--
Disappoints --
84%ALM Integration
Software Testing Data Quadrant Report
Product Feature Satisfaction This section provides detailed information on user satisfaction for each product feature.Use these pages to dig deeper into areas of particular interest or concern.
26
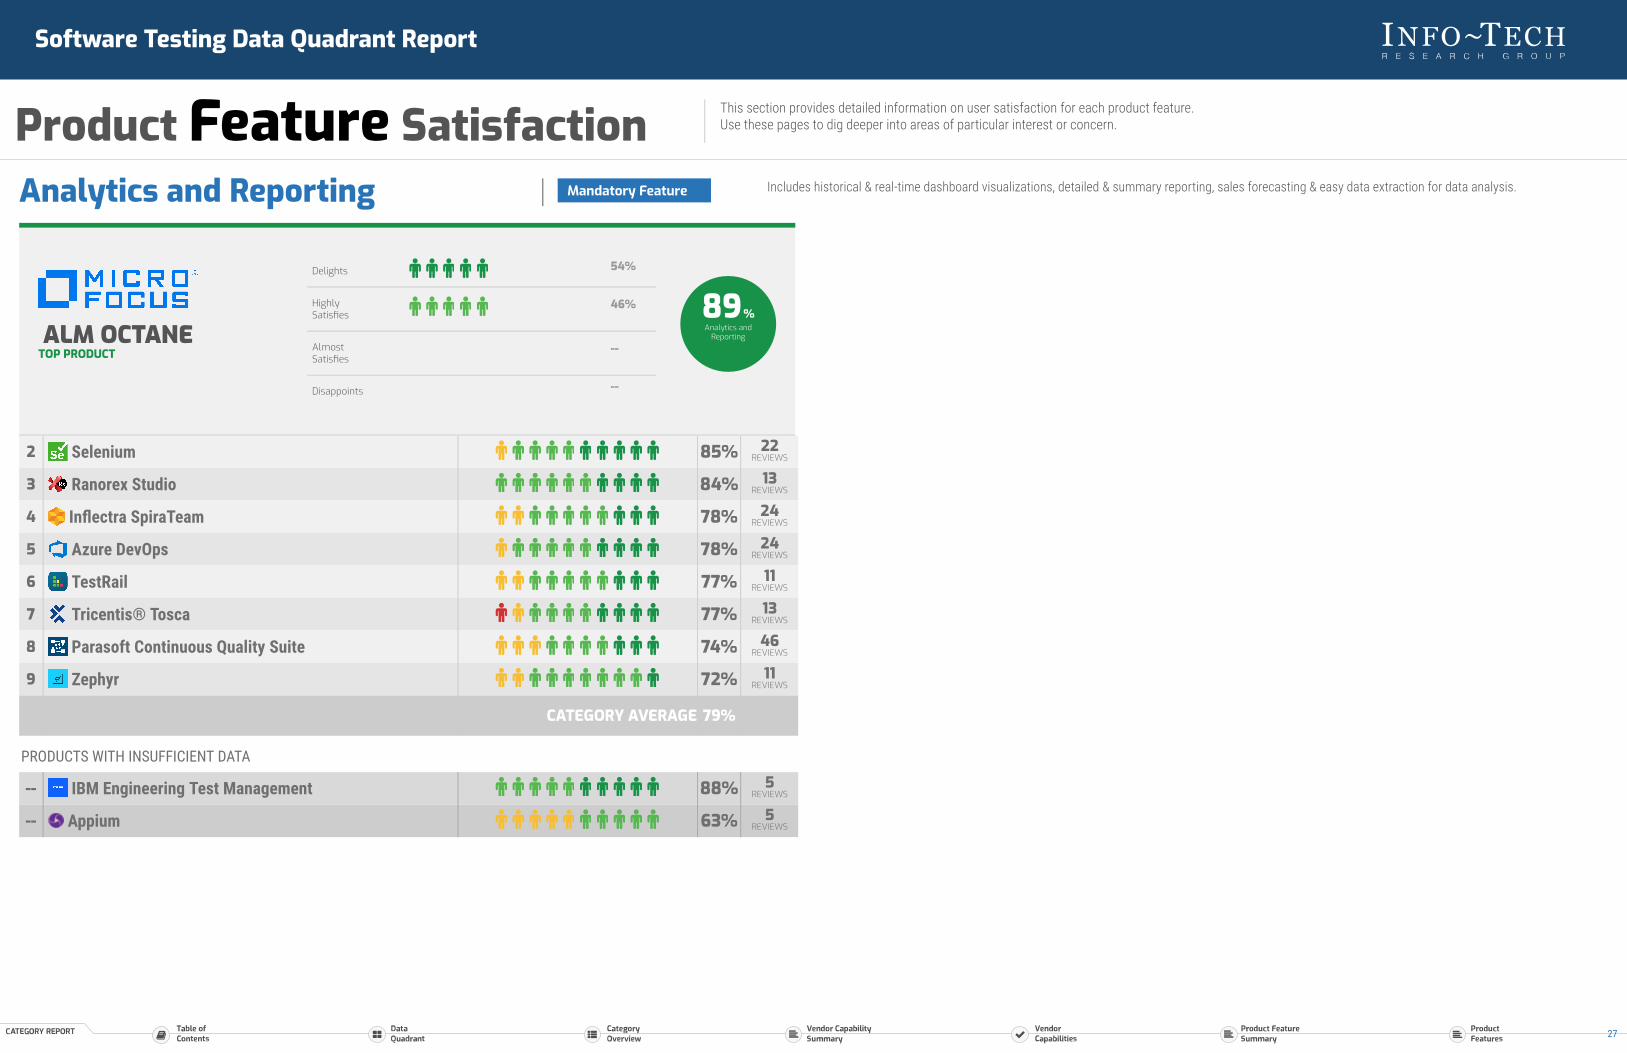
Analytics and Reporting Includes historical & real-time dashboard visualizations, detailed & summary reporting, sales forecasting & easy data extraction for data analysis.Mandatory Feature
PRODUCTS WITH INSUFFICIENT DATA
-- IBM Engineering Test Management 88% 5REVIEWS
-- Appium 63% 5REVIEWS
2 Selenium 85% 22REVIEWS
3 Ranorex Studio 84% 13REVIEWS
4 Inflectra SpiraTeam 78% 24REVIEWS
5 Azure DevOps 78% 24REVIEWS
6 TestRail 77% 11REVIEWS
7 Tricentis® Tosca 77% 13REVIEWS
8 Parasoft Continuous Quality Suite 74% 46REVIEWS
9 Zephyr 72% 11REVIEWS
CATEGORY AVERAGE 79%
ALM OCTANETOP PRODUCT
Delights 54%
HighlySatisfies
46%
AlmostSatisfies
--
Disappoints --
89%Analytics and
Reporting
Software Testing Data Quadrant Report
Product Feature Satisfaction This section provides detailed information on user satisfaction for each product feature.Use these pages to dig deeper into areas of particular interest or concern.
27

Artifact Management ALM artifacts can be readily created, reused, moved, and managed through baselines, reviews, approvals, releases, and audits for projects and products.Mandatory Feature
PRODUCTS WITH INSUFFICIENT DATA
-- Appium 58% 5REVIEWS
-- IBM Engineering Test Management 42% 5REVIEWS
2 TestRail 79% 11REVIEWS
3 ALM Octane 78% 16REVIEWS
4 Tricentis® Tosca 77% 13REVIEWS
5 Selenium 76% 22REVIEWS
6 Parasoft Continuous Quality Suite 76% 46REVIEWS
7 Azure DevOps 74% 24REVIEWS
8 Zephyr 67% 11REVIEWS
9 Ranorex Studio 50% 13REVIEWS
CATEGORY AVERAGE 73%
INFLECTRASPIRATEAM
TOP PRODUCT
Delights 33%
HighlySatisfies
61%
AlmostSatisfies
6%
Disappoints --
82%Artifact
Management
Software Testing Data Quadrant Report
Product Feature Satisfaction This section provides detailed information on user satisfaction for each product feature.Use these pages to dig deeper into areas of particular interest or concern.
28

Artifact Traceability Trace testing artifacts, such as test cases and scripts, forward to test runs and issues that need to be fixed, and backwards to the business process.Mandatory Feature
PRODUCTS WITH INSUFFICIENT DATA
-- Appium 75% 5REVIEWS
-- IBM Engineering Test Management 42% 5REVIEWS
2 Inflectra SpiraTeam 83% 24REVIEWS
3 ALM Octane 80% 16REVIEWS
4 Selenium 79% 22REVIEWS
5 Ranorex Studio 78% 13REVIEWS
6 Parasoft Continuous Quality Suite 76% 46REVIEWS
7 Zephyr 75% 11REVIEWS
8 Tricentis® Tosca 73% 13REVIEWS
9 TestRail 68% 11REVIEWS
CATEGORY AVERAGE 78%
AZURE DEVOPSTOP PRODUCT
Delights 47%
HighlySatisfies
42%
AlmostSatisfies
11%
Disappoints --
84%Artifact
Traceability
Software Testing Data Quadrant Report
Product Feature Satisfaction This section provides detailed information on user satisfaction for each product feature.Use these pages to dig deeper into areas of particular interest or concern.
29

Audit Log Complete record of all changes made to entities within the test management solution. Teams can monitor and trace every change.Mandatory Feature
PRODUCTS WITH INSUFFICIENT DATA
-- Appium 83% 5REVIEWS
-- IBM Engineering Test Management 75% 5REVIEWS
2 Selenium 83% 22REVIEWS
3 Ranorex Studio 80% 13REVIEWS
4 Inflectra SpiraTeam 78% 24REVIEWS
5 Zephyr 78% 11REVIEWS
6 Tricentis® Tosca 77% 13REVIEWS
7 ALM Octane 77% 16REVIEWS
8 Parasoft Continuous Quality Suite 75% 46REVIEWS
9 TestRail 73% 11REVIEWS
CATEGORY AVERAGE 78%
AZURE DEVOPSTOP PRODUCT
Delights 35%
HighlySatisfies
65%
AlmostSatisfies
--
Disappoints --
84%Audit Log
Software Testing Data Quadrant Report
Product Feature Satisfaction This section provides detailed information on user satisfaction for each product feature.Use these pages to dig deeper into areas of particular interest or concern.
30
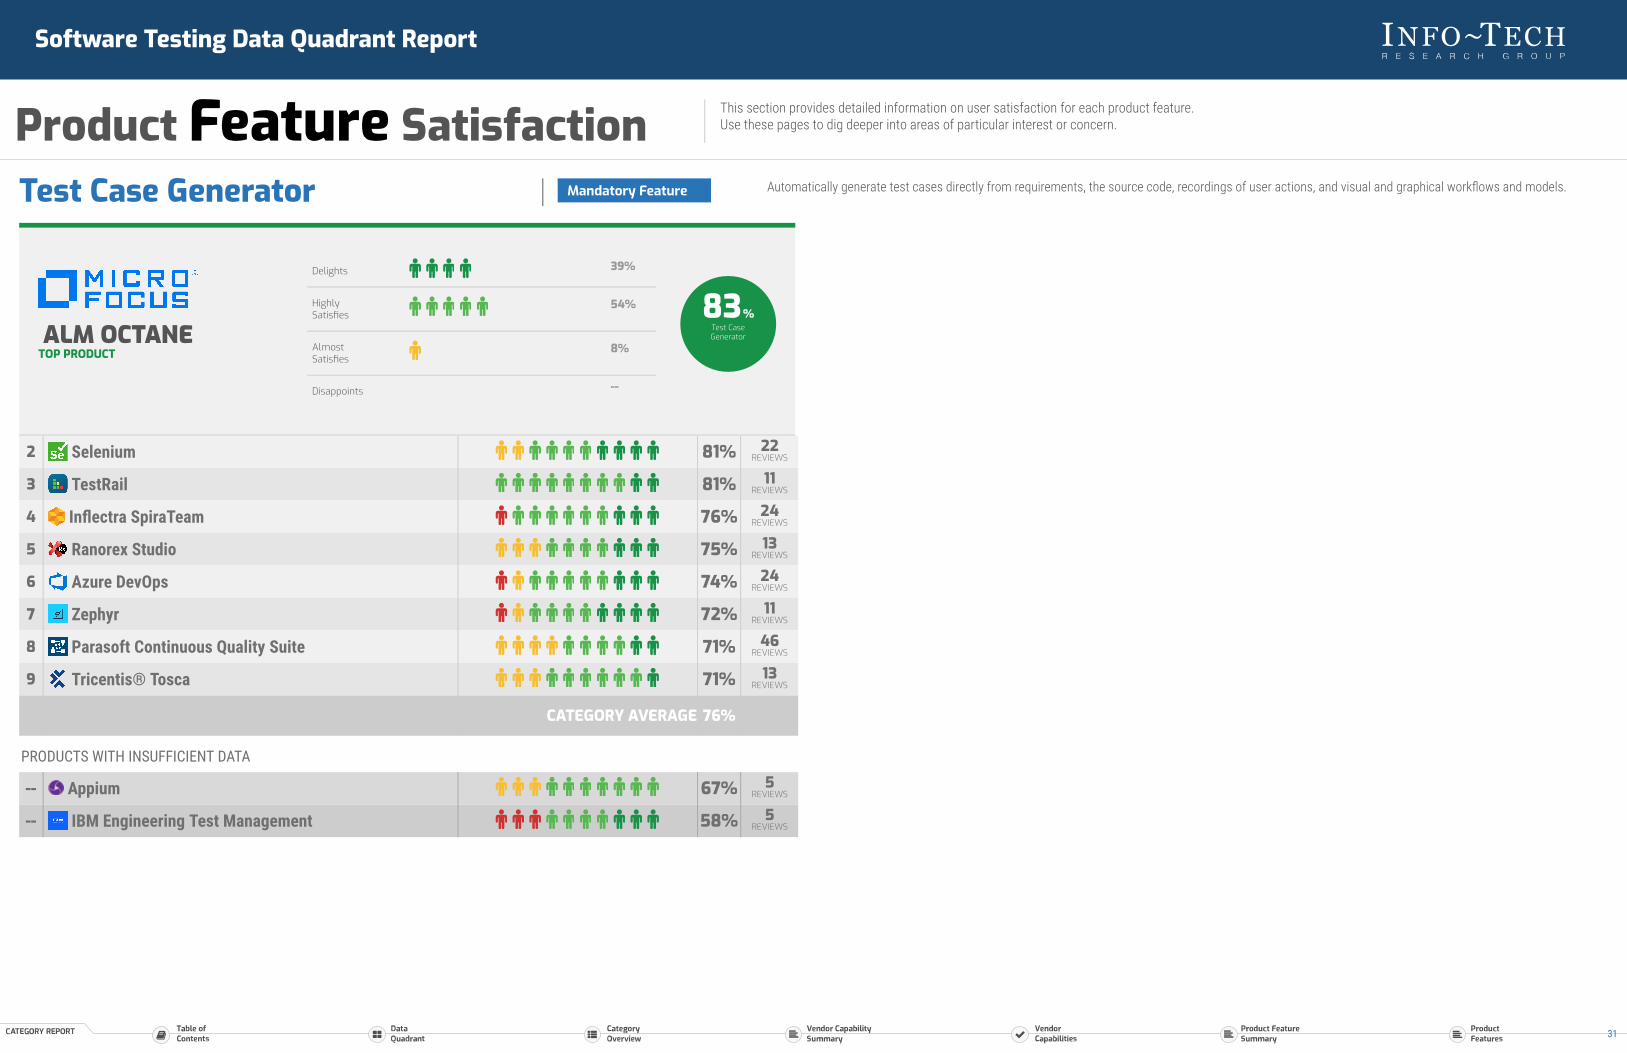
Test Case Generator Automatically generate test cases directly from requirements, the source code, recordings of user actions, and visual and graphical workflows and models.Mandatory Feature
PRODUCTS WITH INSUFFICIENT DATA
-- Appium 67% 5REVIEWS
-- IBM Engineering Test Management 58% 5REVIEWS
2 Selenium 81% 22REVIEWS
3 TestRail 81% 11REVIEWS
4 Inflectra SpiraTeam 76% 24REVIEWS
5 Ranorex Studio 75% 13REVIEWS
6 Azure DevOps 74% 24REVIEWS
7 Zephyr 72% 11REVIEWS
8 Parasoft Continuous Quality Suite 71% 46REVIEWS
9 Tricentis® Tosca 71% 13REVIEWS
CATEGORY AVERAGE 76%
ALM OCTANETOP PRODUCT
Delights 39%
HighlySatisfies
54%
AlmostSatisfies
8%
Disappoints --
83%Test CaseGenerator
Software Testing Data Quadrant Report
Product Feature Satisfaction This section provides detailed information on user satisfaction for each product feature.Use these pages to dig deeper into areas of particular interest or concern.
31
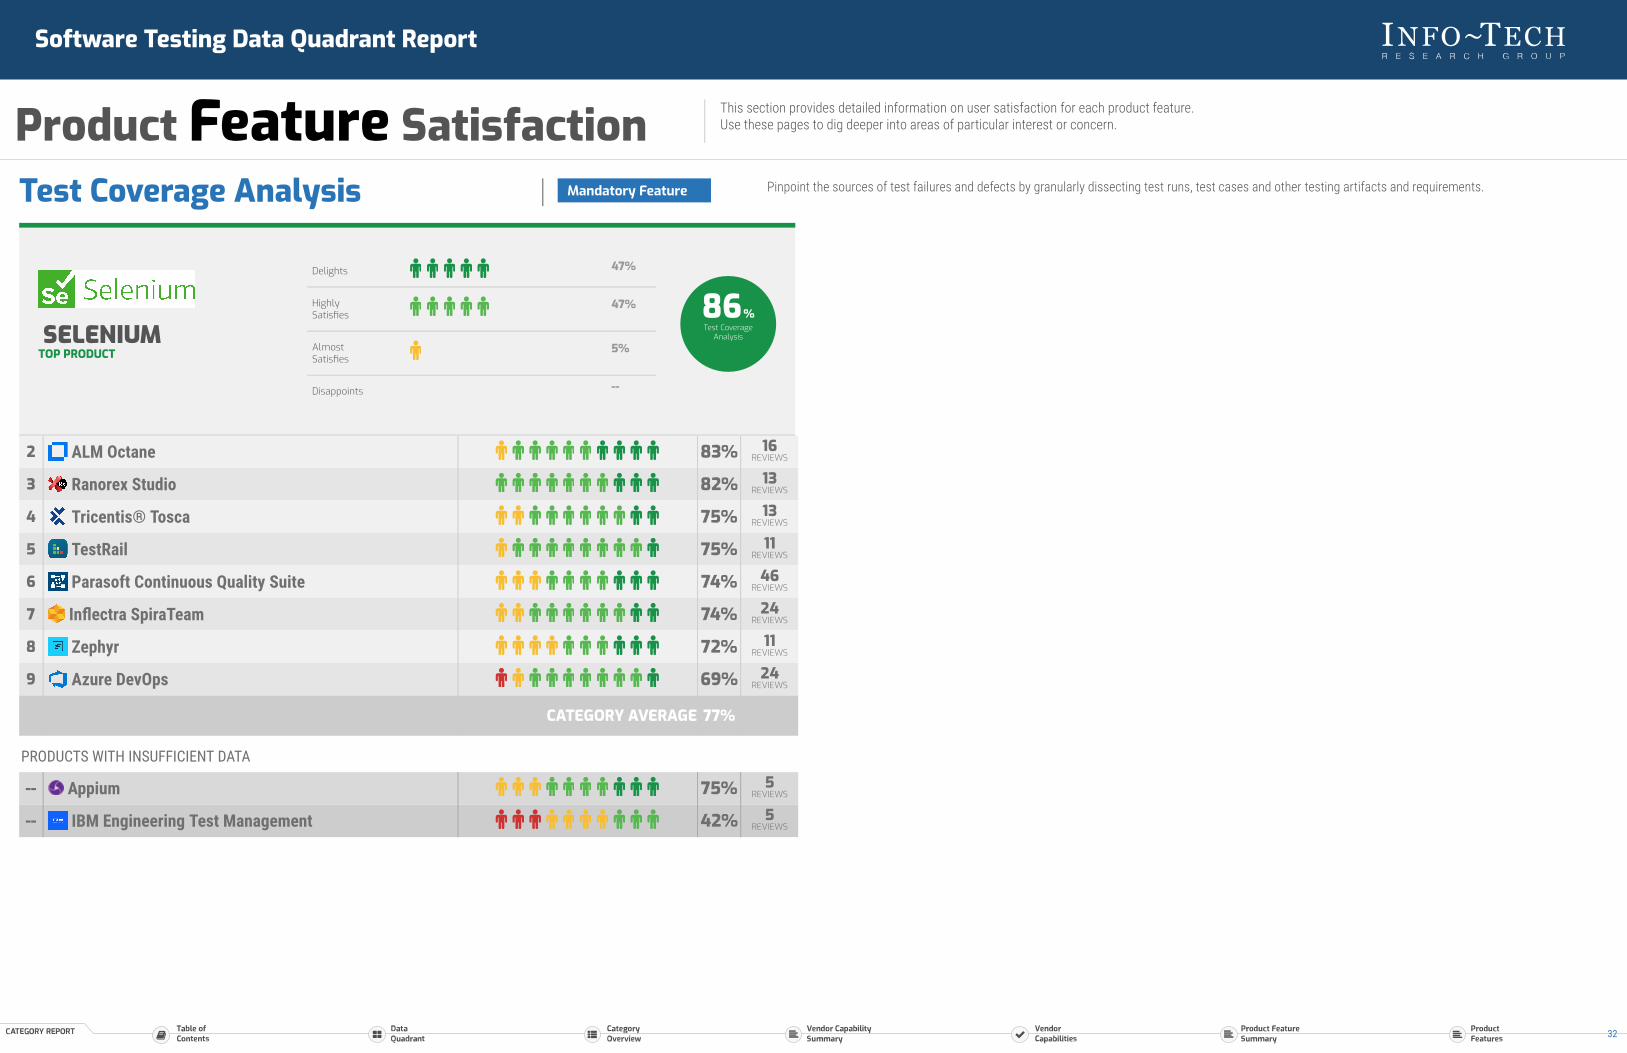
Test Coverage Analysis Pinpoint the sources of test failures and defects by granularly dissecting test runs, test cases and other testing artifacts and requirements.Mandatory Feature
PRODUCTS WITH INSUFFICIENT DATA
-- Appium 75% 5REVIEWS
-- IBM Engineering Test Management 42% 5REVIEWS
2 ALM Octane 83% 16REVIEWS
3 Ranorex Studio 82% 13REVIEWS
4 Tricentis® Tosca 75% 13REVIEWS
5 TestRail 75% 11REVIEWS
6 Parasoft Continuous Quality Suite 74% 46REVIEWS
7 Inflectra SpiraTeam 74% 24REVIEWS
8 Zephyr 72% 11REVIEWS
9 Azure DevOps 69% 24REVIEWS
CATEGORY AVERAGE 77%
SELENIUMTOP PRODUCT
Delights 47%
HighlySatisfies
47%
AlmostSatisfies
5%
Disappoints --
86%Test Coverage
Analysis
Software Testing Data Quadrant Report
Product Feature Satisfaction This section provides detailed information on user satisfaction for each product feature.Use these pages to dig deeper into areas of particular interest or concern.
32

Test Planning Build test cycles and phases, define milestones to coordinate dependencies and releases, and then assign resources to execute the planned tests.Mandatory Feature
PRODUCTS WITH INSUFFICIENT DATA
-- Appium 67% 5REVIEWS
-- IBM Engineering Test Management 56% 5REVIEWS
2 Selenium 83% 22REVIEWS
3 ALM Octane 83% 16REVIEWS
4 Inflectra SpiraTeam 80% 24REVIEWS
5 Zephyr 78% 11REVIEWS
6 Azure DevOps 76% 24REVIEWS
7 Tricentis® Tosca 73% 13REVIEWS
8 Ranorex Studio 73% 13REVIEWS
9 Parasoft Continuous Quality Suite 72% 46REVIEWS
CATEGORY AVERAGE 79%
TESTRAILTOP PRODUCT
Delights 55%
HighlySatisfies
27%
AlmostSatisfies
18%
Disappoints --
84%Test Planning
Software Testing Data Quadrant Report
Product Feature Satisfaction This section provides detailed information on user satisfaction for each product feature.Use these pages to dig deeper into areas of particular interest or concern.
33
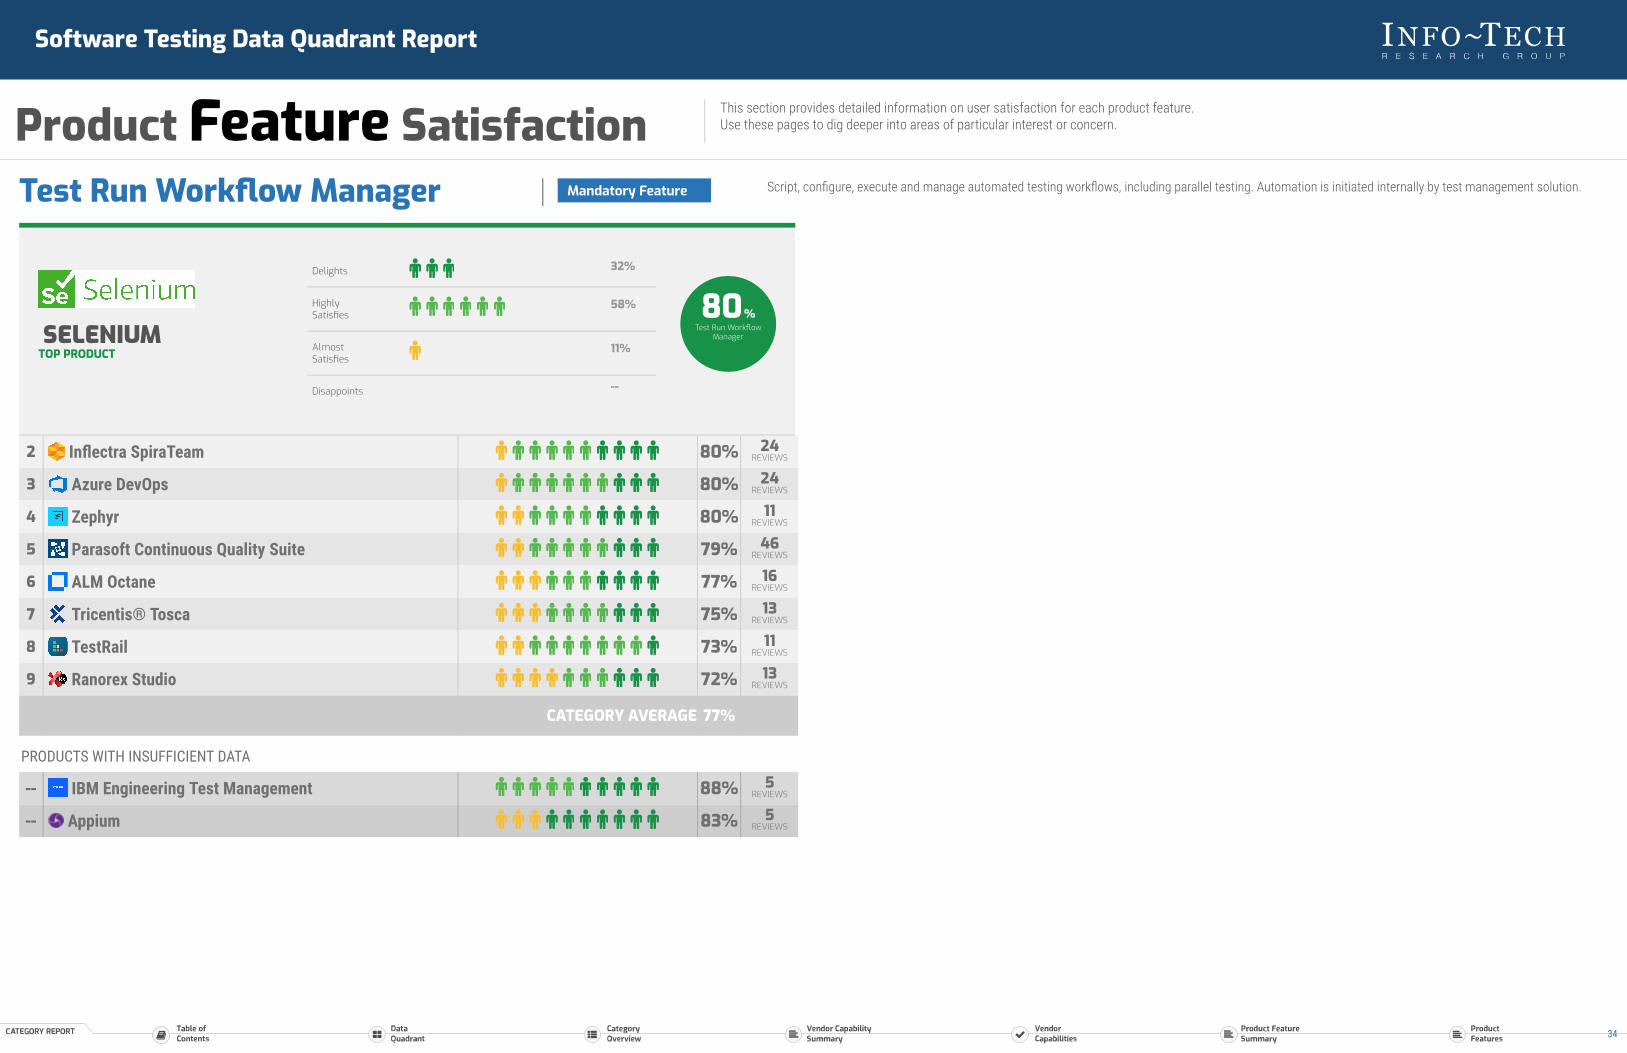
Test Run Workflow Manager Script, configure, execute and manage automated testing workflows, including parallel testing. Automation is initiated internally by test management solution.Mandatory Feature
PRODUCTS WITH INSUFFICIENT DATA
-- IBM Engineering Test Management 88% 5REVIEWS
-- Appium 83% 5REVIEWS
2 Inflectra SpiraTeam 80% 24REVIEWS
3 Azure DevOps 80% 24REVIEWS
4 Zephyr 80% 11REVIEWS
5 Parasoft Continuous Quality Suite 79% 46REVIEWS
6 ALM Octane 77% 16REVIEWS
7 Tricentis® Tosca 75% 13REVIEWS
8 TestRail 73% 11REVIEWS
9 Ranorex Studio 72% 13REVIEWS
CATEGORY AVERAGE 77%
SELENIUMTOP PRODUCT
Delights 32%
HighlySatisfies
58%
AlmostSatisfies
11%
Disappoints --
80%Test Run Workflow
Manager
Software Testing Data Quadrant Report
Product Feature Satisfaction This section provides detailed information on user satisfaction for each product feature.Use these pages to dig deeper into areas of particular interest or concern.
34
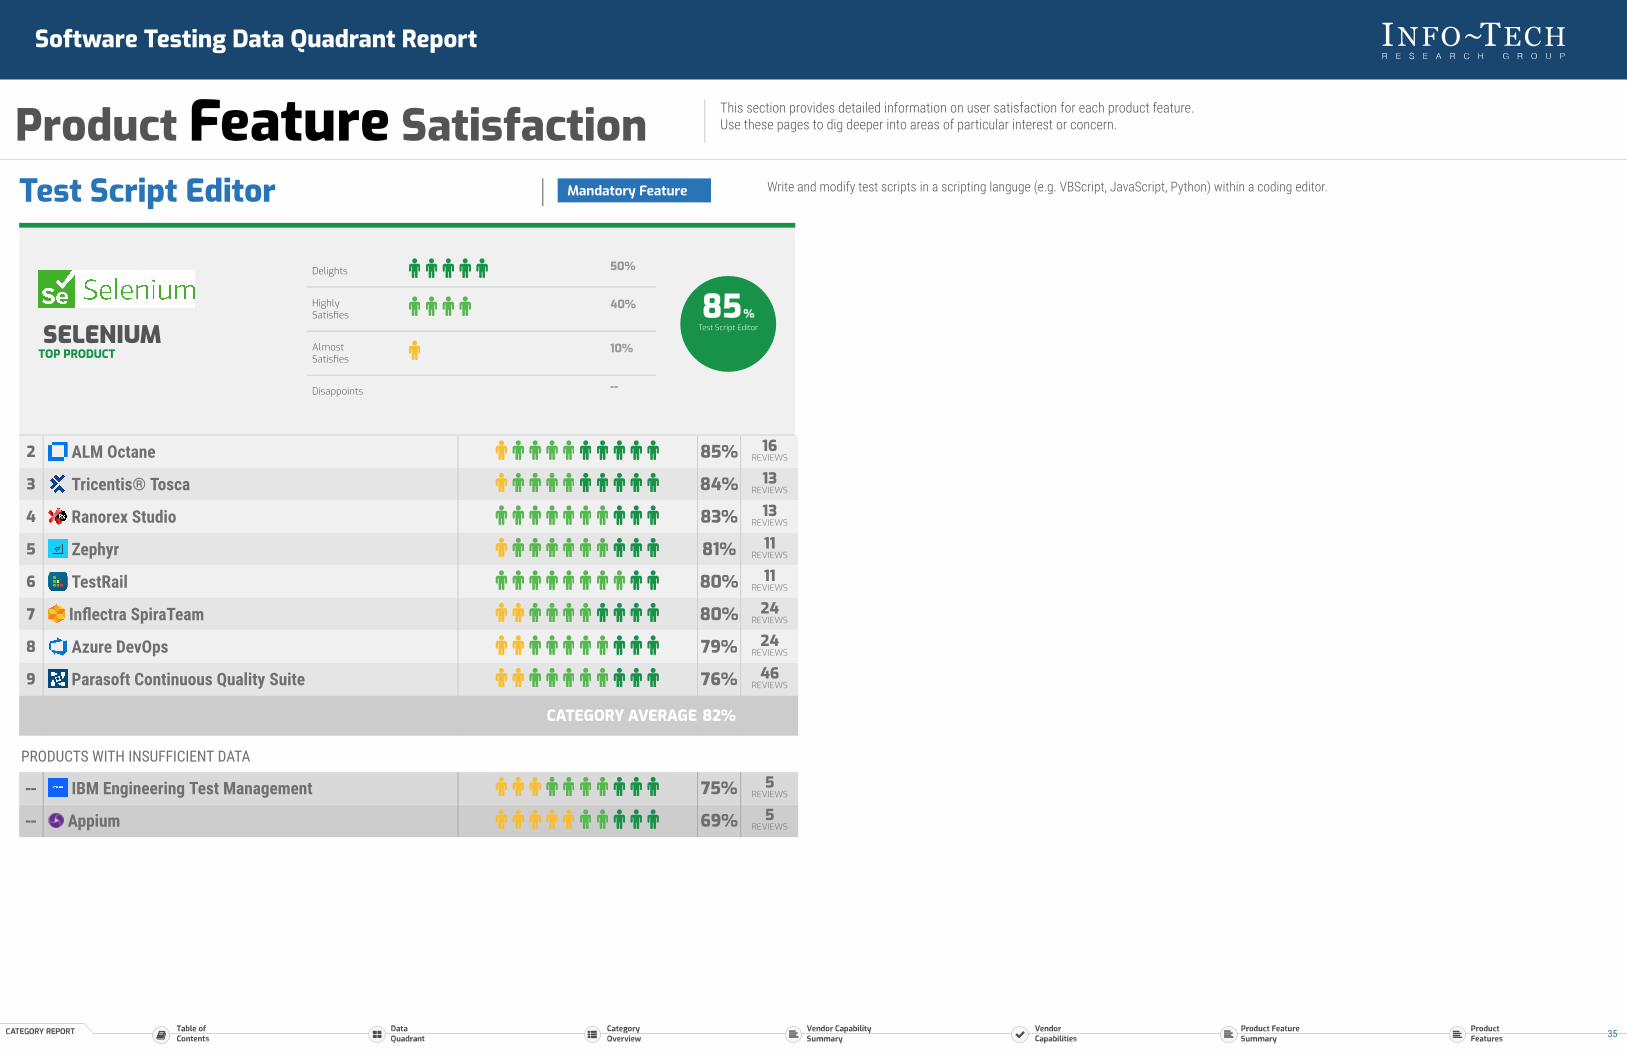
Test Script Editor Write and modify test scripts in a scripting languge (e.g. VBScript, JavaScript, Python) within a coding editor.Mandatory Feature
PRODUCTS WITH INSUFFICIENT DATA
-- IBM Engineering Test Management 75% 5REVIEWS
-- Appium 69% 5REVIEWS
2 ALM Octane 85% 16REVIEWS
3 Tricentis® Tosca 84% 13REVIEWS
4 Ranorex Studio 83% 13REVIEWS
5 Zephyr 81% 11REVIEWS
6 TestRail 80% 11REVIEWS
7 Inflectra SpiraTeam 80% 24REVIEWS
8 Azure DevOps 79% 24REVIEWS
9 Parasoft Continuous Quality Suite 76% 46REVIEWS
CATEGORY AVERAGE 82%
SELENIUMTOP PRODUCT
Delights 50%
HighlySatisfies
40%
AlmostSatisfies
10%
Disappoints --
85%Test Script Editor
Software Testing Data Quadrant Report
Product Feature Satisfaction This section provides detailed information on user satisfaction for each product feature.Use these pages to dig deeper into areas of particular interest or concern.
35
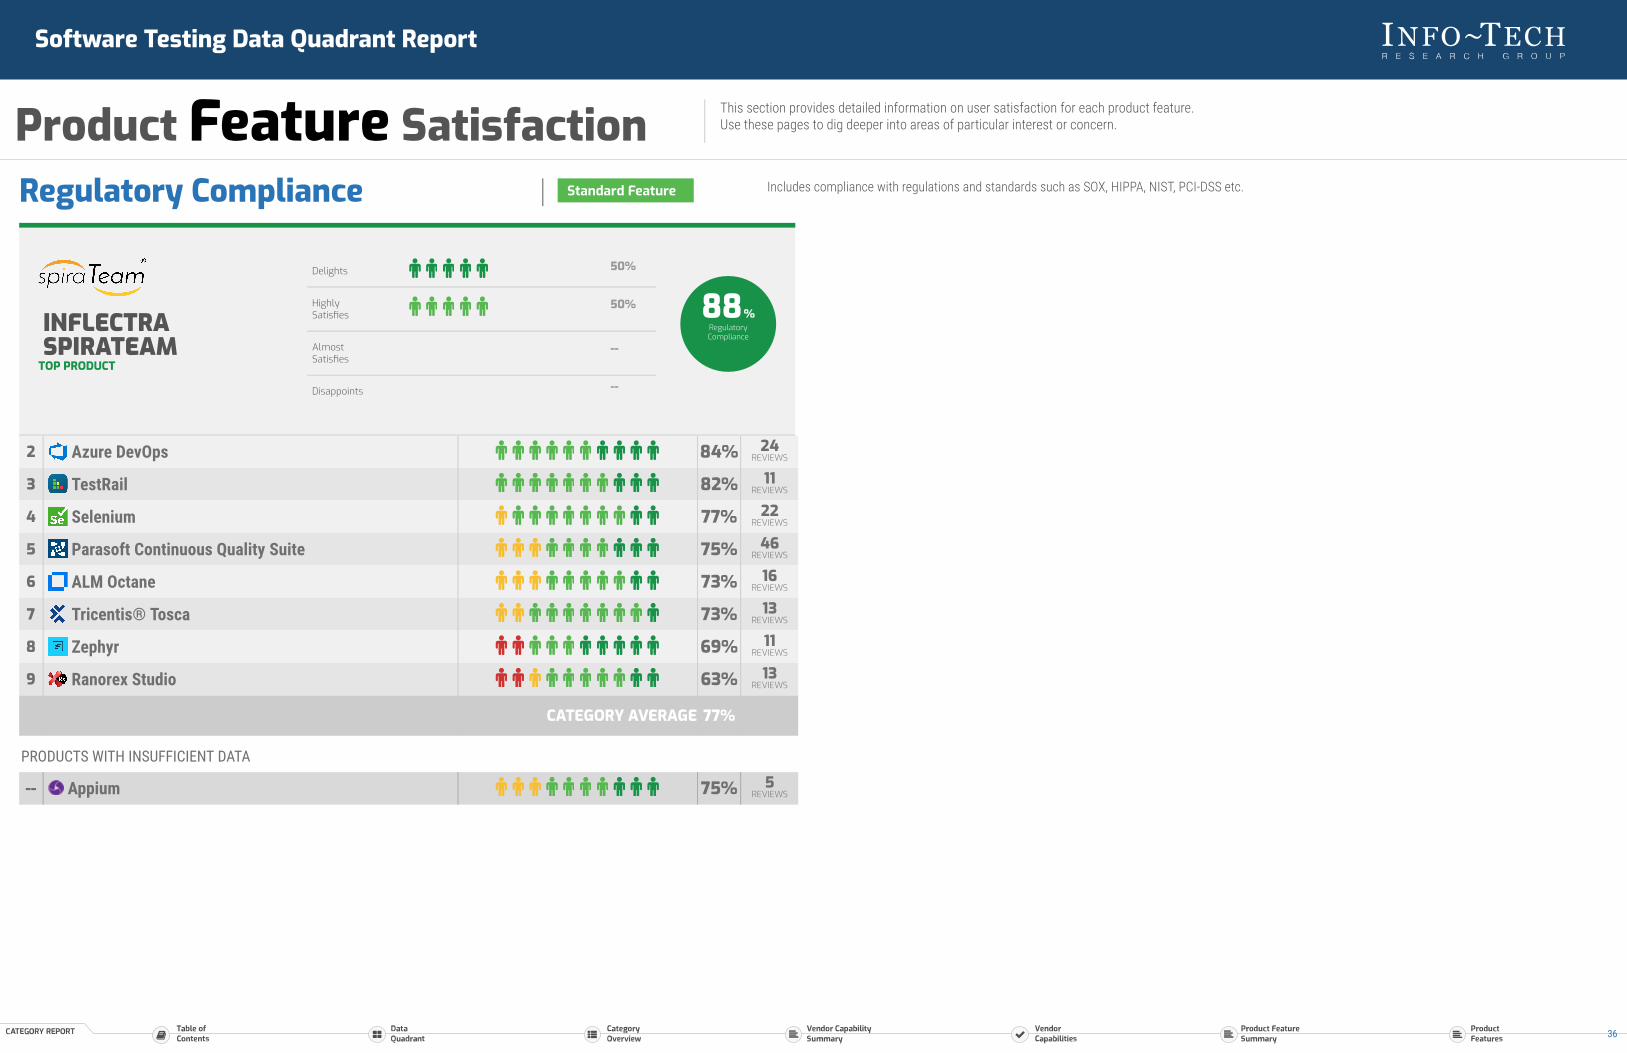
Regulatory Compliance Includes compliance with regulations and standards such as SOX, HIPPA, NIST, PCI-DSS etc.Standard Feature
PRODUCTS WITH INSUFFICIENT DATA
-- Appium 75% 5REVIEWS
2 Azure DevOps 84% 24REVIEWS
3 TestRail 82% 11REVIEWS
4 Selenium 77% 22REVIEWS
5 Parasoft Continuous Quality Suite 75% 46REVIEWS
6 ALM Octane 73% 16REVIEWS
7 Tricentis® Tosca 73% 13REVIEWS
8 Zephyr 69% 11REVIEWS
9 Ranorex Studio 63% 13REVIEWS
CATEGORY AVERAGE 77%
INFLECTRASPIRATEAM
TOP PRODUCT
Delights 50%
HighlySatisfies
50%
AlmostSatisfies
--
Disappoints --
88%RegulatoryCompliance
Software Testing Data Quadrant Report
Product Feature Satisfaction This section provides detailed information on user satisfaction for each product feature.Use these pages to dig deeper into areas of particular interest or concern.
36

Test Data Management Secured management and access of test data.Standard Feature
PRODUCTS WITH INSUFFICIENT DATA
-- Appium 75% 5REVIEWS
-- IBM Engineering Test Management 75% 5REVIEWS
2 Zephyr 83% 11REVIEWS
3 Tricentis® Tosca 81% 13REVIEWS
4 Azure DevOps 80% 24REVIEWS
5 ALM Octane 80% 16REVIEWS
6 Selenium 78% 22REVIEWS
7 Parasoft Continuous Quality Suite 76% 46REVIEWS
8 Ranorex Studio 75% 13REVIEWS
9 TestRail 71% 11REVIEWS
CATEGORY AVERAGE 80%
INFLECTRASPIRATEAM
TOP PRODUCT
Delights 50%
HighlySatisfies
50%
AlmostSatisfies
--
Disappoints --
88%Test Data
Management
Software Testing Data Quadrant Report
Product Feature Satisfaction This section provides detailed information on user satisfaction for each product feature.Use these pages to dig deeper into areas of particular interest or concern.
37

Test Environment Management Provision, monitor, refresh, and tear down test environments. Teams can track all environment resources from a centralized dashboard and repository.Standard Feature
PRODUCTS WITH INSUFFICIENT DATA
-- Appium 75% 5REVIEWS
-- IBM Engineering Test Management 75% 5REVIEWS
2 ALM Octane 88% 16REVIEWS
3 Parasoft Continuous Quality Suite 81% 46REVIEWS
4 Selenium 80% 22REVIEWS
5 Tricentis® Tosca 79% 13REVIEWS
6 TestRail 79% 11REVIEWS
7 Azure DevOps 79% 24REVIEWS
8 Ranorex Studio 71% 13REVIEWS
9 Zephyr 71% 11REVIEWS
CATEGORY AVERAGE 80%
INFLECTRASPIRATEAM
TOP PRODUCT
Delights 50%
HighlySatisfies
50%
AlmostSatisfies
--
Disappoints --
88%Test Environment
Management
Software Testing Data Quadrant Report
Product Feature Satisfaction This section provides detailed information on user satisfaction for each product feature.Use these pages to dig deeper into areas of particular interest or concern.
38
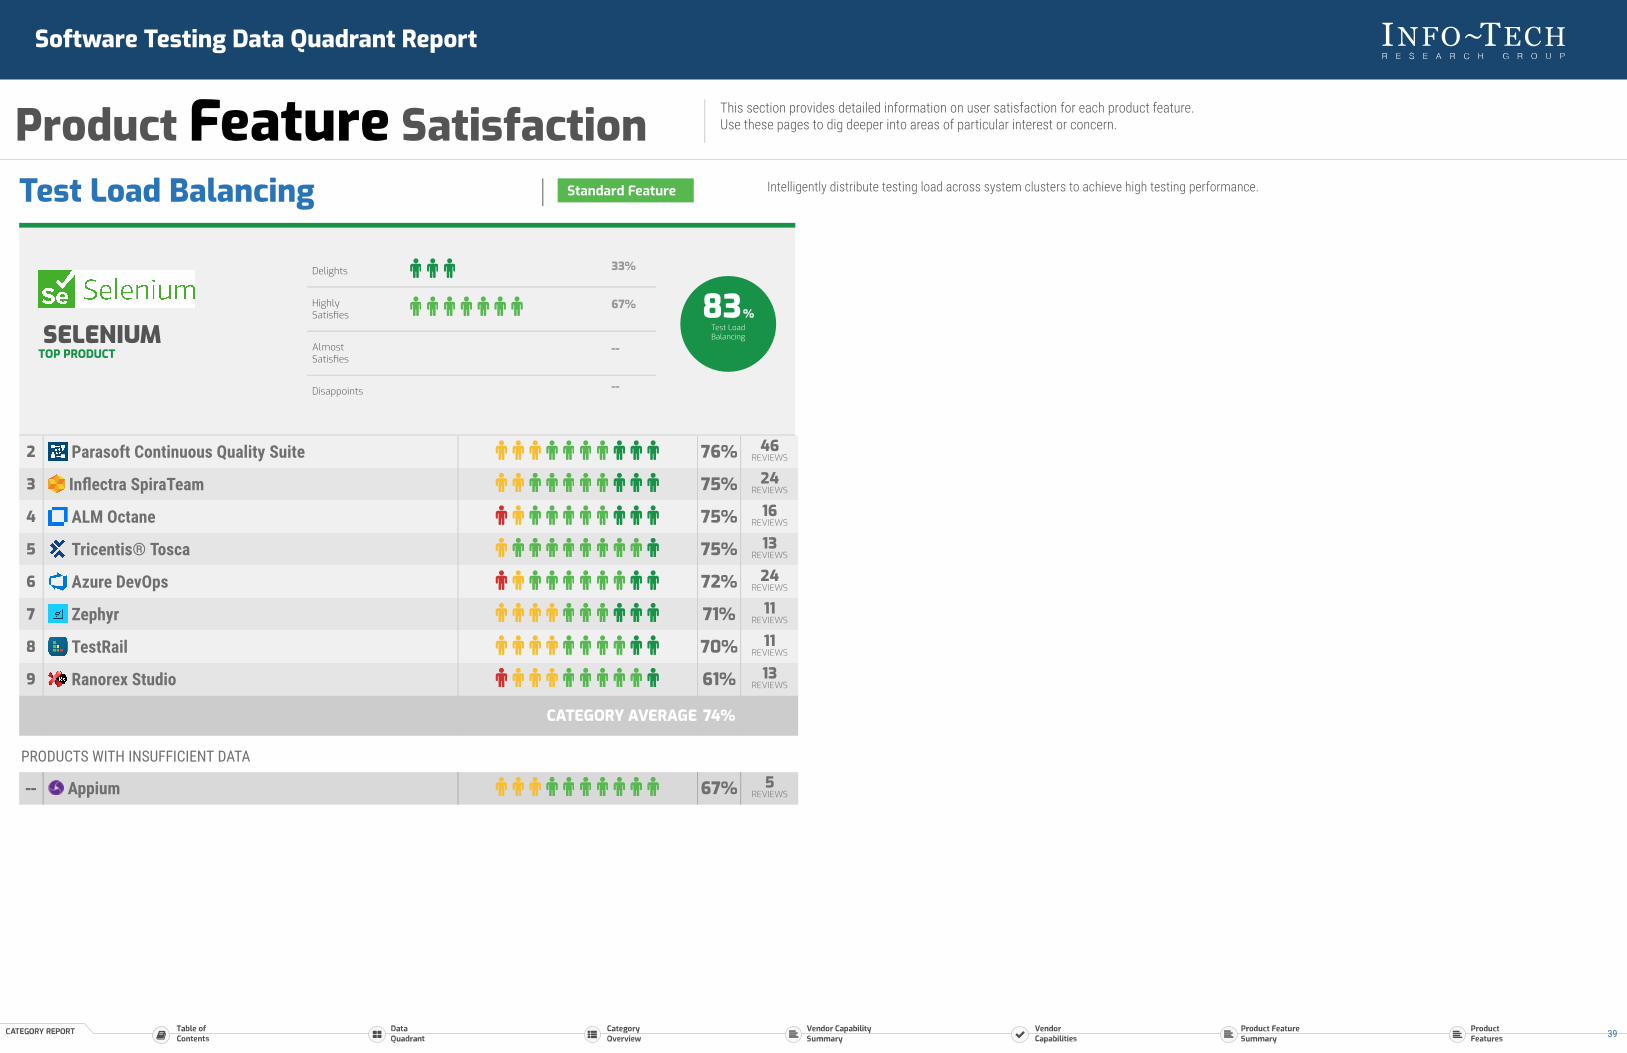
Test Load Balancing Intelligently distribute testing load across system clusters to achieve high testing performance.Standard Feature
PRODUCTS WITH INSUFFICIENT DATA
-- Appium 67% 5REVIEWS
2 Parasoft Continuous Quality Suite 76% 46REVIEWS
3 Inflectra SpiraTeam 75% 24REVIEWS
4 ALM Octane 75% 16REVIEWS
5 Tricentis® Tosca 75% 13REVIEWS
6 Azure DevOps 72% 24REVIEWS
7 Zephyr 71% 11REVIEWS
8 TestRail 70% 11REVIEWS
9 Ranorex Studio 61% 13REVIEWS
CATEGORY AVERAGE 74%
SELENIUMTOP PRODUCT
Delights 33%
HighlySatisfies
67%
AlmostSatisfies
--
Disappoints --
83%Test LoadBalancing
Software Testing Data Quadrant Report
Product Feature Satisfaction This section provides detailed information on user satisfaction for each product feature.Use these pages to dig deeper into areas of particular interest or concern.
39