Sketch\ star-metric: Comparing Data Streams via Sketching
12
Sketch ?-metric: Comparing Data Streams via Sketching R ESEARCH R EPORT Emmanuelle Anceaume IRISA / CNRS, Rennes, France [email protected] Yann Busnel LINA / Universit´ e de Nantes, Nantes, France [email protected] Abstract—In this paper, we consider the problem of estimating the distance between any two large data streams in small- space constraint. This problem is of utmost importance in data intensive monitoring applications where input streams are generated rapidly. These streams need to be processed on the fly and accurately to quickly determine any deviance from nominal behavior. We present a new metric, the Sketch ?-metric, which allows to define a distance between updatable summaries (or sketches) of large data streams. An important feature of the Sketch ?-metric is that, given a measure on the entire initial data streams, the Sketch ?-metric preserves the axioms of the latter measure on the sketch (such as the non-negativity, the identity, the symmetry, the triangle inequality but also specific properties of the f -divergence). Extensive experiments conducted on both synthetic traces and real data allow us to validate the robustness and accuracy of the Sketch ?-metric. Index Terms—Data stream; metric; randomized approxima- tion algorithm. I. I NTRODUCTION The main objective of this paper is to propose a novel metric that reflects the relationships between any two discrete probability distributions in the context of massive data streams. Specifically, this metric, denoted by Sketch ?-metric, allows us to efficiently estimate a broad class of distances measures between any two large data streams by computing these distances only using compact synopses or sketches of the streams. The Sketch ?-metric is distribution-free and makes no assumption about the underlying data volume. It is thus capable of comparing any two data streams, identifying their correlation if any, and more generally, it allows us to acquire a deep understanding of the structure of the input streams. Formalization of this metric is the first contribution of this paper. The interest of estimating distances between any two data streams is important in data intensive applications. Many different domains are concerned by such analyses includ- ing machine learning, data mining, databases, information retrieval, and network monitoring. In all these applications, it is necessary to quickly and precisely process a huge amount of data. For instance, in IP network management, the analysis of input streams will allow to rapidly detect the presence of outliers or intrusions when changes in the communication patterns occur [1]. In sensors networks, such an analysis will enable the correlation of geographical and environmental informations [2], [3]. Actually, the problem of detecting changes or outliers in a data stream is similar to the problem of identifying patterns that do not conform to the expected behavior, which has been an active area of research for many decades. For instance, depending on the specificities of the domain considered and the type of outliers considered, different methods have been designed, namely classification-based, clustering-based, nearest neighbor based, statistical, spectral, and information theory. To accurately ana- lyze streams of data, a panel of information-theoretic measures and distances have been proposed to answer the specificities of the analyses. Among them, the most commonly used are the Kullback-Leibler (KL) divergence [4], the f -divergence introduced by Csiszar, Morimoto and Ali & Silvey [5], [6], [7], the Jensen-Shannon divergence and the Battacharyya distance [8]. More details can be found in the comprehensive survey of Basseville [9]. Unfortunately, computing information theoretic measures of distances in the data stream model is challenging essentially because one needs to process streams on the fly (i.e, in one- pass), on huge amount of data, and by using very little storage with respect to the size of the stream. In addition the analysis must be robust over time to detect any sudden change in the observed streams (which may be the manifestation of routers deny of service attack or worm propagation). We tackle this issue by presenting an approximation algorithm that constructs a sketch of the stream from which the Sketch ?-metric is computed. This algorithm is a one-pass algorithm. It uses very basic computations, and little storage space (i.e., O (t(log n + k log m)) where k and t are precision parameters, m is an upper-bound of stream size and n the number of distinct items in the stream). It does not need any information on the size of input streams nor on their structure. This consists in the second contribution of the paper. Finally, the robustness of our approach is validated with a detailed experimentation study based on synthetic traces that range from stable streams to highly skewed ones. The paper is organized as follows. First, Section II reviews the related work on classical generalized metrics and their ap- plications on the data stream model while Section III describes this model. Section IV presents the necessary background
-
Upload
mines-telecom -
Category
Documents
-
view
5 -
download
0
Transcript of Sketch\ star-metric: Comparing Data Streams via Sketching

Sketch ?-metric: Comparing Data Streams viaSketching
RESEARCH REPORT
Emmanuelle AnceaumeIRISA / CNRS, Rennes, [email protected]
Yann BusnelLINA / Universite de Nantes, Nantes, France
Abstract—In this paper, we consider the problem of estimatingthe distance between any two large data streams in small-space constraint. This problem is of utmost importance indata intensive monitoring applications where input streams aregenerated rapidly. These streams need to be processed on the flyand accurately to quickly determine any deviance from nominalbehavior. We present a new metric, the Sketch ?-metric, whichallows to define a distance between updatable summaries (orsketches) of large data streams. An important feature of theSketch ?-metric is that, given a measure on the entire initial datastreams, the Sketch ?-metric preserves the axioms of the lattermeasure on the sketch (such as the non-negativity, the identity,the symmetry, the triangle inequality but also specific propertiesof the f -divergence). Extensive experiments conducted on bothsynthetic traces and real data allow us to validate the robustnessand accuracy of the Sketch ?-metric.
Index Terms—Data stream; metric; randomized approxima-tion algorithm.
I. INTRODUCTION
The main objective of this paper is to propose a novelmetric that reflects the relationships between any two discreteprobability distributions in the context of massive data streams.Specifically, this metric, denoted by Sketch ?-metric, allowsus to efficiently estimate a broad class of distances measuresbetween any two large data streams by computing thesedistances only using compact synopses or sketches of thestreams. The Sketch ?-metric is distribution-free and makesno assumption about the underlying data volume. It is thuscapable of comparing any two data streams, identifying theircorrelation if any, and more generally, it allows us to acquirea deep understanding of the structure of the input streams.Formalization of this metric is the first contribution of thispaper.
The interest of estimating distances between any two datastreams is important in data intensive applications. Manydifferent domains are concerned by such analyses includ-ing machine learning, data mining, databases, informationretrieval, and network monitoring. In all these applications,it is necessary to quickly and precisely process a hugeamount of data. For instance, in IP network management,the analysis of input streams will allow to rapidly detectthe presence of outliers or intrusions when changes in thecommunication patterns occur [1]. In sensors networks, such
an analysis will enable the correlation of geographical andenvironmental informations [2], [3]. Actually, the problemof detecting changes or outliers in a data stream is similarto the problem of identifying patterns that do not conformto the expected behavior, which has been an active area ofresearch for many decades. For instance, depending on thespecificities of the domain considered and the type of outliersconsidered, different methods have been designed, namelyclassification-based, clustering-based, nearest neighbor based,statistical, spectral, and information theory. To accurately ana-lyze streams of data, a panel of information-theoretic measuresand distances have been proposed to answer the specificitiesof the analyses. Among them, the most commonly used arethe Kullback-Leibler (KL) divergence [4], the f -divergenceintroduced by Csiszar, Morimoto and Ali & Silvey [5], [6],[7], the Jensen-Shannon divergence and the Battacharyyadistance [8]. More details can be found in the comprehensivesurvey of Basseville [9].
Unfortunately, computing information theoretic measures ofdistances in the data stream model is challenging essentiallybecause one needs to process streams on the fly (i.e, in one-pass), on huge amount of data, and by using very little storagewith respect to the size of the stream. In addition the analysismust be robust over time to detect any sudden change inthe observed streams (which may be the manifestation ofrouters deny of service attack or worm propagation). Wetackle this issue by presenting an approximation algorithmthat constructs a sketch of the stream from which the Sketch?-metric is computed. This algorithm is a one-pass algorithm.It uses very basic computations, and little storage space (i.e.,O (t(log n+ k logm)) where k and t are precision parameters,m is an upper-bound of stream size and n the number ofdistinct items in the stream). It does not need any informationon the size of input streams nor on their structure. This consistsin the second contribution of the paper.
Finally, the robustness of our approach is validated with adetailed experimentation study based on synthetic traces thatrange from stable streams to highly skewed ones.
The paper is organized as follows. First, Section II reviewsthe related work on classical generalized metrics and their ap-plications on the data stream model while Section III describesthis model. Section IV presents the necessary background

2
that makes the paper self-contained. Section V formalizesthe Sketch ?-metric. Section VI presents the algorithm thatfairly approximates the Sketch ?-metric in one pass andSection VII presents extensive experiments (on both synthetictraces and real data) of our algorithm. Finally, we conclude inSection VIII.
II. RELATED WORK
Work on data stream analysis mainly focuses on efficientmethods (data-structures and algorithms) to answer differentkind of queries over massive data streams. Mostly, thesemethods consist in deriving statistic estimators over the datastream, in creating summary representations of streams (tobuild histograms, wavelets, and quantiles), and in comparingdata streams. Regarding the construction of estimators, aseminal work is due to Alon et al. [10]. The authors haveproposed estimators of the frequency moments Fk of a stream,which are important statistical tools that allow to quantifyspecificities of a data stream. Subsequently, a lot of attentionhas been paid to the strongly related notion of the entropyof a stream, and all notions based on entropy (i.e., norm andrelative entropy) [11]. These notions are essentially related tothe quantification of the amount of randomness of a stream(e.g, [12], [13], [14], [15], [16], [17]). The construction ofsynopses or sketches of the data stream have been proposedfor different applications (e.g, [18], [19], [20]).
Distance and divergence measures are key measures instatistical inference and data processing problems [9]. Thereexists two largely used broad classes of measures, namely thef -divergences and the Bregman divergences. Among them,there exists two classical distances, namely the Kullback-Leibler (KL) divergence and the Hellinger distance, that arevery important to quantify the amount of information thatseparates two distributions. In [16], the authors have proposeda one pass algorithm for estimating the KL divergence of anobserved stream compared to an expected one. Experimentalevaluations have shown that the estimation provided by thisalgorithm is accurate for different adversarial settings forwhich the quality of other methods dramatically decreases.However, this solution assumes that the expected stream is theuniform one, that is a fully random stream. Actually in [21],the authors propose a characterization of the informationdivergences that are not sketchable. They have proven that anydistance that has not “norm-like” properties is not sketchable.In the present paper, we go one step further by formalizinga metric that allows to efficiently and accurately estimate abroad class of distances measures between any two large datastreams by computing these distances uniquely on compactsynopses or sketches of streams.
III. DATA STREAM MODEL
We consider a system in which a node P receives a largedata stream σ = a1, a2, . . . , am of data items that arrivesequentially. In the following, we describe a single instance ofP , but clearly multiple instances of P may co-exist in a system(e.g., in case P represents a router, a base station in a sensor
network). Each data item i of the stream σ is drawn from theuniverse Ω = 1, 2, . . . , n where n is very large. Data itemscan be repeated multiple times in the stream. In the followingwe suppose that the length m of the stream is not known. Itemsin the stream arrive regularly and quickly, and due to memoryconstraints, need to be processed sequentially and in an onlinemanner. Therefore, node P can locally store only a smallfraction of the items and perform simple operations on them.The algorithms we consider in this work are characterized bythe fact that they can approximate some function on σ with avery limited amount of memory. We refer the reader to [22] fora detailed description of data streaming models and algorithms.
IV. INFORMATION DIVERGENCE OF DATA STREAMS
We first present notations and background that make thispaper self-contained.
A. Preliminaries
A natural approach to study a data stream σ is to modelit as an empirical data distribution over the universe Ω, givenby (p1, p2, . . . , pn) with pi = xi/m, and xi = |j : aj = i|representing the number of times data item i appears in σ. Wehave m =
∑i∈Ω xi.
1) Entropy: Intuitively, the entropy is a measure of therandomness of a data stream σ. The entropy H(σ) is minimum(i.e., equal to zero) when all the items in the stream are thesame, and it reaches its maximum (i.e., log2m) when allthe items in the stream are distinct. Specifically, we haveH(σ) = −
∑i∈Ω pi log2 pi. The log is to the base 2 and
thus entropy is expressed in bits. By convention, we have0 log 0 = 0. Note that the number of times xi item i appearsin a stream is commonly called the frequency of item i. Thenorm of the entropy is defined as FH =
∑i∈Ω xi log xi.
2) 2-universal Hash Functions: In the following, we in-tensively use hash functions randomly picked from a 2-universal hash family. A collection H of hash functionsh : 1, . . . ,M → 0, . . . ,M ′ is said to be 2-universal iffor every h ∈ H and for every two different items i, j ∈ [M ],Ph(i) = h(j) ≤ 1
M ′ , which is exactly the probability ofcollision obtained if the hash function assigned truly randomvalues to any i ∈ [M ]. In the following, notation [M ] means1, . . . ,M.
B. Metrics and divergences
1) Metric definitions: The classical definition of a metricis based on a set of four axioms.
Definition 1 (Metric) Given a set X , a metric is a functiond : X ×X → R such that, for any x, y, z ∈ X , we have:
Non-negativity: d(x, y) ≥ 0 (1)Identity of indiscernibles: d(x, y) = 0⇔ x = y (2)
Symmetry: d(x, y) = d(y, x) (3)Triangle inequality: d(x, y) ≤ d(x, z) + d(z, y) (4)
In the context of information divergence, usual distancefunctions are not precisely metric. Indeed, most of divergence

3
functions do not verify the 4 axioms, but only a subset of them.We recall hereafter some definitions of generalized metrics.Definition 2 (Pseudometric) Given a set X , a pseudometricis a function that verifies the axioms of a metric with theexception of the identity of indiscernible, which is replaced by
∀x ∈ X, d(x, x) = 0.
Note that this definition allows that d(x, y) = 0 for somex 6= y in X .Definition 3 (Quasimetric) Given a set X , a quasimetric isa function that verifies all the axioms of a metric with theexception of the symmetry (cf. Relation 3).Definition 4 (Semimetric) Given a set X , a semimetric isa function that verifies all the axioms of a metric with theexception of the triangle inequality (cf. Relation 4).Definition 5 (Premetric) Given a set X , a premetric isa pseudometric that relax both the symmetry and triangleinequality axioms.Definition 6 (Pseudoquasimetric) Given a set X , a pseu-doquasimetric is a function that relax both the identity ofindiscernible and the symmetry axioms.
Note that the latter definition simply corresponds to apremetric satisfying the triangle inequality. Remark also thatall the generalized metrics preserve the non-negativity axiom.
2) Divergences: We now give the definition of two broadclasses of generalized metrics, usually denoted as divergences.
a) f -divergence: Mostly used in the context of statisticsand probability theory, a f -divergence Df is a premetric thatguarantees monotonicity and convexity.Definition 7 (f -divergence) Let p and q be two Ω-pointdistributions. Given a convex function f : (0,∞) → R suchthat f(1) = 0, the f -divergence of q from p is:
Df (p||q) =∑i∈Ω
qif
(piqi
),
where by convention 0f( 00 ) = 0, af( 0
a ) = a limu→0 f(u), and0f(a0 ) = a limu→∞ f(u)/u if these limits exist.
Following this definition, any f -divergence verifies bothmonotonicity and convexity.Property 8 (Monotonicity) Given κ an arbitrary transitionprobability that respectively transforms two Ω-point distribu-tions p and q into pκ and qκ, we have:
Df (p||q) ≥ Df (pκ||qκ).
Property 9 (Convexity) Let p1, p2, q1 and q2 be four Ω-pointdistributions. Given any λ ∈ [0, 1], we have:
Df (λp1 + (1− λ)p2||λq1 + (1− λ)q2)
≤ λDf (p1||q1) + (1− λ)Df (p2||q2).
This class of divergences has been introduced in indepen-dent works by chronologically Csiszar, Morimoto and Ali &Silvey [5], [6], [7]. All the distance measures in the so-calledAli-Silvey distances are applicable to quantifying statisticaldifferences between data streams.
b) Bregman divergence: Initially proposed in [23], thisclass of generalized metrics encloses quasimetrics and semi-metrics, as these divergences do not satisfy the triangle in-equality nor symmetry.Definition 10 (Bregman divergence) Given F a continuously-differentiable and strictly convex function defined on a closedconvex set C, the Bregman divergence associated with F forp, q ∈ C is defined as
BF (p||q) = F (p)− F (q)− 〈∇F (q), (p− q)〉 .
where the operator 〈·, ·〉 denotes the inner product.In the context of data stream, it is possible to reformulate
this definition according to probability theory. Specifically,Definition 11 (Decomposable Bregman divergence) Let p andq be two Ω-point distributions. Given a strictly convex functionF : (0, 1] → R, the Bregman divergence associated with Fof q from p is defined as
BF (p||q) =∑i∈Ω
(F (pi)− F (qi)− (pi − qi)F ′(qi)) .
Following these definitions, any Bregman divergence ver-ifies non-negativity and convexity in its first argument, butnot necessarily in the second argument. Another interestingproperty is given by thinking of the Bregman divergences asan operator of the function F .Property 12 (Linearity) Let F1 and F2 be two strictly convexand differentiable functions. Given any λ ∈ [0, 1], we havethat
BF1+λF2(p||q) = BF1
(p||q) + λBF2(p||q).
3) Classical metrics: In this section, we present severalcommonly used metrics in Ω-point distribution context. Thesespecific metrics are used in the evaluation part presented inSection VII.
a) Kullback-Leibler divergence: The Kullback-Leibler(KL) divergence [4], also called the relative entropy, is a robustmetric for measuring the statistical difference between twodata streams. The KL divergence owns the special featurethat it is both a f -divergence and a Bregman one (withf(t) = F (t) = t log t).
Given p and q two Ω-point distributions, the Kullback-Leibler divergence is then defined as
DKL(p||q) =∑i∈Ω
pi logpiqi
= H(p, q)−H(p), (5)
where H(p) = −∑pi log pi is the (empirical) entropy of p
and H(p, q) = −∑pi log qi is the cross entropy of p and q.
b) Jensen-Shannon divergence: The Jensen-Shannon di-vergence (JS) is a symmetrized and smoothed version ofthe Kullback-Leibler divergence. Also known as informationradius (IRad) or total divergence to the average, it is definedas
DJS(p||q) =1
2DKL(p||`) +
1
2DKL(q||`), (6)
where ` = 12 (p+q). Note that the square root of this divergence
is a metric.

4
c) Bhattacharyya distance: The Bhattacharyya distanceis derived from his proposed measure of similarity betweentwo multinomial distributions, known as the Bhattacharyacoefficient (BC) [8]. It is defined as
DB(p||q) = − log(BC(p, q)) where BC(p, q) =∑i∈Ω
√piqi.
This distance is a semimetric as it does not verify the triangleinequality. Note that the famous Hellinger distance [24] equalto√
1−BC(p, q) verifies it.
V. SKETCH ?-METRIC
We now present a method to sketch two input data streamsσ1 and σ2, and to compute any generalized metric φ betweenthese sketches such that this computation preserves all theproperties of φ computed on σ1 and σ2. Proof of correctnessof this method is presented in this section.
Definition 13 (Sketch ?-metric) Let p and q be any two n-point distributions. Given a precision parameter k, and anygeneralized metric φ on the set of all Ω-point distributions,there exists a Sketch ?-metric φk defined as follows
φk(p||q) = maxρ∈Pk(Ω)
φ(pρ||qρ) with ∀a ∈ ρ, pρ(a) =∑i∈a
p(i),
where Pk(Ω) is the set of all partitions of an Ω-element setinto exactly k nonempty and mutually exclusive cells.
Remark 14 Note that for k > Ω, it does not exist a partitionof Ω into k nonempty parts. By convention, we consider thatφk(p||q) = φ(p||q) in this specific context.
In this section, we focus on the preservation of axiomsand properties of a generalized metric φ by the correspondingSketch ?-metric φk.
A. Axioms preserving
Theorem 15 Given any generalized metric φ then, for anyk ∈ Ω, the corresponding Sketch ?-metric φk preserves allthe axioms of φ.
Proof: The proof is directly derived from Lemmata 16,17, 18 and 19.
Lemma 16 (Non-negativity) Given any generalized metric φverifying the Non-negativity axiom then, for any k ∈ Ω, thecorresponding Sketch ?-metric φk preserves the Non-negativityaxiom.
Proof: Let p and q be any two Ω-point distributions. Bydefinition,
φk(p||q) = maxρ∈Pk(Ω)
φ(pρ||qρ)
As for any two k-point distributions, φ is positive we haveφk(p||q) ≥ 0 that concludes the proof.
Lemma 17 (Identity of indiscernible) Given any generalizedmetric φ verifying the Identity of indiscernible axiom then, forany k ∈ Ω, the corresponding Sketch ?-metric φk preservesthe Identity of indiscernible axiom.
Proof: Let p be any Ω-point distribution. We have
φk(p||p) = maxρ∈Pk(Ω)
φ(pρ||pρ) = 0,
due to φ Identity of indiscernible axiom.Consider now two Ω-point distributions p and q such that
φk(p||q) = 0. Metric φ verifies both the non-negativity axiom(by construction) and the Identity of indiscernible axiom (byassumption). Thus we have ∀ρ ∈ Pk(Ω), pρ = qρ, leading to
∀ρ ∈ Pk(Ω),∀a ∈ ρ,∑i∈a
p(i) =∑i∈a
q(i). (7)
Moreover, for any i ∈ Ω, there exists a partition ρ ∈ Pk(Ω)such that i ∈ ρ. By Equation 7, ∀i ∈ Ω, p(i) = q(i), and sop = q.
Combining the two parts of the proof leads to φk(p||q) =0⇐⇒ p = q, which concludes the proof of the Lemma.
Lemma 18 (Symmetry) Given any generalized metric φverifying the Symmetry axiom then, for any k ∈ Ω, thecorresponding Sketch ?-metric φk preserves the Symmetryaxiom.
Proof: Let p and q be any two Ω-point distributions. Wehave
φk(p||q) = maxρ∈Pk(Ω)
φ(pρ||qρ).
Let ρ ∈ Pk(Ω) be a k-cell partition such that φ(pρ||qρ) =maxρ∈Pk(Ω) φ(pρ||qρ). We get
φk(p||q) = φ(pρ||qρ) = φ(qρ||pρ) ≤ φk(q||p).
By symmetry, considering ρ ∈ Pk(Ω) such that φ(qρ||pρ) =
maxρ∈Pk(Ω) φ(qρ||pρ), we also have φk(q||p) ≤ φk(p||q),which concludes the proof.
Lemma 19 (Triangle inequality) Given any generalized met-ric φ verifying the Triangle inequality axiom then, for anyk ∈ Ω, the corresponding Sketch ?-metric φk preserves theTriangle inequality axiom.
Proof: Let p, q and r be any three Ω-point distributions.Let ρ ∈ Pk(Ω) be a k-cell partition such that φ(pρ||qρ) =maxρ∈Pk(Ω) φ(pρ||qρ).
We have
φk(p||q) = φ(pρ||qρ)≤ φ(pρ||rρ) + φ(rρ||qρ)≤ maxρ∈Pk(Ω)
φ(pρ||rρ) + maxρ∈Pk(Ω)
φ(rρ||qρ)
= φk(p||r) + φk(r||q)
that concludes the proof.
B. Properties preserving
Theorem 20 Given a f -divergence φ then, for any k ∈ Ω,the corresponding Sketch ?-metric φk is also a f -divergence.
Proof: From Theorem 15, φk preserves the axioms of thegeneralized metric. Thus, φk and φ are in the same equivalenceclass. Moreover, from Lemma 22, φk verifies the monotonicity

5
property. Thus, as the f -divergence is the only class ofdecomposable information monotonic divergences (cf. [25]),φk is also a f -divergence.
Theorem 21 Given a Bregman divergence φ then, for any k ∈Ω, the corresponding Sketch ?-metric φk is also a Bregmandivergence.
Proof: From Theorem 15, φk preserves the axioms of thegeneralized metric. Thus, φk and φ are in the same equivalenceclass. Moreover, the Bregman divergence is characterized bythe property of transitivity (cf. [26]) defined as follows. Givenp, q and r three Ω-point distributions such that q = Π(L|r) andp ∈ L, with Π is a selection rule according to the definition ofCsiszar in [26] and L is a subset of the Ω-point distributions,we have the Generalized Pythagorean Theorem:
φ(p||q) + φ(q||r) = φ(p||r).
Moreover the authors in [27] show that the set Sn of alldiscrete probability distributions over n elements (X =x1, . . . , xn) is a Riemannian manifold, and it owns anotherdifferent dually flat affine structure. They also show thatthese dual structures give rise to the generalized Pythagoreantheorem. This is verified for the coordinates in Sn and forthe dual coordinates [27]. Combining these results with theprojection theorem [26], [27], we obtain that
φk(p||r) = maxρ∈Pk(n)
φ(pρ||rρ)
= maxρ∈Pk(n)
(φ(pρ||qρ) + φ(qρ||rρ))
= maxρ∈Pk(n)
φ(pρ||qρ) + maxρ∈Pk(n)
φ(qρ||rρ)
= φk(p||q) + φk(q||r)
Finally, by the characterization of Bregman divergence throughtransitivity [26], and reinforced with Lemma 24 statement, φkis also a Bregman divergence.
In the following, we show that the Sketch ?-metric preservesthe properties of divergences.
Lemma 22 (Monotonicity) Given any generalized metric φverifying the Monotonicity property then, for any k ∈ Ω, thecorresponding Sketch ?-metric φk preserves the Monotonicityproperty.
Proof: Let p and q be any two Ω-point distributions.Given c < N , consider a partition µ ∈ Pc(Ω). As φ ismonotonic, we have φ(p||q) ≥ φ(pµ||qµ) [28]. We split theproof into two cases:
Case (1). Suppose that c ≥ k. Computing φk(pµ||qµ)amounts in considering only the k-cell partitions ρ ∈ Pk(Ω)that verify
∀b ∈ µ,∃a ∈ ρ, b ⊆ a.
These partitions form a subset of Pk(Ω). The maximal value ofφ(pρ||qρ) over this subset cannot be greater than the maximalvalue over the whole Pk(Ω). Thus we have
φk(p||q) = maxρ∈Pk(Ω)
φ(pρ||qρ) ≥ φk(pµ||qµ).
Case (2). Suppose now that c < k. By definition, we haveφk(pµ||qµ) = φ(pµ||qµ). Consider ρ′ ∈ Pk(Ω) such that ∀b ∈µ,∃a ∈ ρ′, b ⊆ a. It then exists a transition probability thatrespectively transforms pρ′ and qρ′ into pµ and qµ. As φ ismonotonic, we have
φk(p||q) = maxρ∈Pk(Ω)
φ(pρ||qρ)
≥ φ(pρ′ ||qρ′)≥ φ(pµ||qµ) = φk(pµ||qµ).
Finally for any value of c, φk guarantees the monotonicityproperty. This concludes the proof.Lemma 23 (Convexity) Given any generalized metric φverifying the Convexity property then, for any k ∈ Ω, thecorresponding Sketch ?-metric φk preserves the Convexityproperty.
Proof: Let p1, p2, q1 and q2 be any four Ω-point distri-butions. Given any λ ∈ [0, 1], we have:
φk (λp1 + (1− λ)p2||λq1 + (1− λ)q2)
= maxρ∈Pk(Ω)
φ(λp1ρ + (1− λ)p2ρ||λq1ρ + (1− λ)q2ρ
)Let ρ′ ∈ Pk(Ω) such that
φ(λp1ρ′ + (1− λ)p2ρ′ ||λq1ρ′ + (1− λ)q2ρ′
)= maxρ∈Pk(Ω)
φ(λp1ρ + (1− λ)p2ρ||λq1ρ + (1− λ)q2ρ
).
As φ verifies the Convex property, we have:
φk (λp1 + (1− λ)p2||λq1 + (1− λ)q2)
= φ(λp1ρ′ + (1− λ)p2ρ′ ||λq1ρ′ + (1− λ)q2ρ′
)≤ λφ(p1ρ′ ||q1ρ′) + (1− λ)φ(p2ρ′ ||q2ρ′)
≤ λ(
maxρ∈Pk(Ω)
φ(p1ρ||q1ρ)
)+ (1− λ)
(max
ρ∈Pk(Ω)φ(p2ρ||q2ρ)
)= λφk(p1||q1) + (1− λ)φk(p2||q2)
that concludes the proof.Lemma 24 (Linearity) The Sketch ?-metric definition pre-serves the Linearity property.
Proof: Let F1 and F2 be two strictly convex and dif-ferentiable functions, and any λ ∈ [0, 1]. Consider the threeBregman divergences generated respectively from F1, F2 andF1 + λF2.
Let p and q be two Ω-point distributions. We have:
BF1+λF2k(p||q) = max
ρ∈Pk(Ω)BF1+λF2
(pρ||qρ)
= maxρ∈Pk(n)
(BF1(pρ||qρ) + λBF2
(pρ||qρ))
≤ BF1k(p||q) + λBF2k
(p||q)As F1 and F2 two strictly convex functions, and taken a
leaf out of the Jensen’s inequality, we have:
BF1k(p||q) + λBF2k
(p||q)≤ maxρ∈Pk(Ω)
(BF1(pρ||qρ) + λBF2
(pρ||qρ))
= BF1+λF2k(p||q)
6
that conclude the proof.This concludes the proof that the Sketch ?-metric preserves
all the axioms of a metric as well as the properties of f -divergences and Bregman divergences. We now show how toefficiently implement such a metric.
VI. APPROXIMATION ALGORITHM
In this section, we propose an algorithm that computesthe Sketch ?-metric in one pass on the stream. By definitionof the metric (cf., Definition 13), we need to generate allthe possible k-cell partitions. The number of these partitionsfollows the Stirling numbers of the second kind, which is equalto S(n, k) = 1
k!
∑kj=0(−1)k−j
(kj
)jn, where n is the size of
the items universe. Therefore, S(n, k) grows exponentiallywith n. Unfortunately, n is very large. As the generatingfunction of S(n, k) is equivalent to xn, it is unreasonablein term of space complexity. We show in the following thatgenerating t = dlog(1/δ)e random k-cell partitions, whereδ is the probability of error of our randomized algorithm, issufficient to guarantee good overall performance of our metric.
Our algorithm is inspired from the Count-Min Sketch al-gorithm proposed in [19] by Cormode and Muthukrishnan.Specifically, the Count-Min algorithm is an (ε, δ)-approxi-mation algorithm that solves the frequency-estimation prob-lem. For any items in the input stream σ, the algorithmoutputs an estimation fv of the frequency of item v suchthat P|fv − fv| > εfv < δ, where ε, δ > 0 are given asparameters of the algorithm. The estimation is computed bymaintaining a two-dimensional array C of t×k counters, andby using t 2-universal hash functions hi (1 ≤ i ≤ t), wherek = 2/ε and t = dlog(1/δ)e. Each time an item v is readfrom the input stream, this causes one counter of each line tobe incremented, i.e., C[hi(v)] is incremented by one for eachi ∈ [1..t].
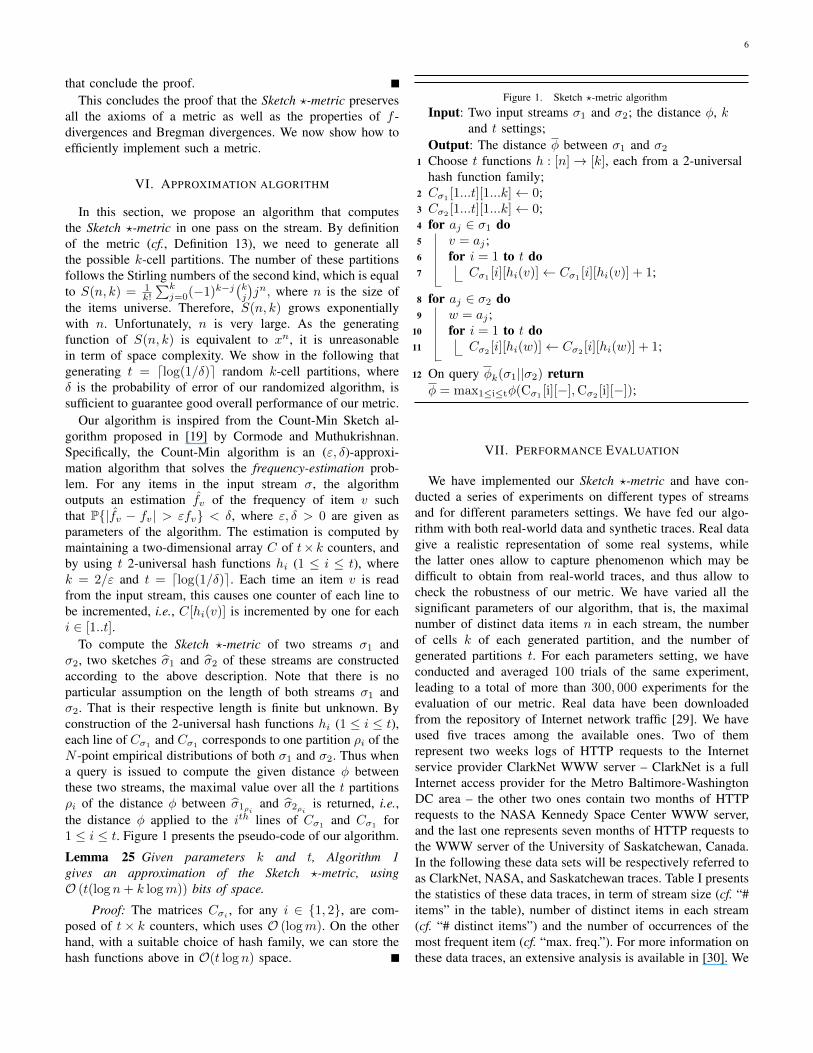
To compute the Sketch ?-metric of two streams σ1 andσ2, two sketches σ1 and σ2 of these streams are constructedaccording to the above description. Note that there is noparticular assumption on the length of both streams σ1 andσ2. That is their respective length is finite but unknown. Byconstruction of the 2-universal hash functions hi (1 ≤ i ≤ t),each line of Cσ1 and Cσ1 corresponds to one partition ρi of theN -point empirical distributions of both σ1 and σ2. Thus whena query is issued to compute the given distance φ betweenthese two streams, the maximal value over all the t partitionsρi of the distance φ between σ1ρi
and σ2ρiis returned, i.e.,
the distance φ applied to the ith lines of Cσ1and Cσ1
for1 ≤ i ≤ t. Figure 1 presents the pseudo-code of our algorithm.
Lemma 25 Given parameters k and t, Algorithm 1gives an approximation of the Sketch ?-metric, usingO (t(log n+ k logm)) bits of space.
Proof: The matrices Cσi , for any i ∈ 1, 2, are com-posed of t× k counters, which uses O (logm). On the otherhand, with a suitable choice of hash family, we can store thehash functions above in O(t log n) space.
Figure 1. Sketch ?-metric algorithmInput: Two input streams σ1 and σ2; the distance φ, k
and t settings;Output: The distance φ between σ1 and σ2
1 Choose t functions h : [n]→ [k], each from a 2-universalhash function family;
2 Cσ1[1...t][1...k]← 0;
3 Cσ2[1...t][1...k]← 0;
4 for aj ∈ σ1 do5 v = aj ;6 for i = 1 to t do7 Cσ1 [i][hi(v)]← Cσ1 [i][hi(v)] + 1;
8 for aj ∈ σ2 do9 w = aj ;
10 for i = 1 to t do11 Cσ2
[i][hi(w)]← Cσ2[i][hi(w)] + 1;
12 On query φk(σ1||σ2) returnφ = max1≤i≤tφ(Cσ1 [i][−],Cσ2 [i][−]);
VII. PERFORMANCE EVALUATION
We have implemented our Sketch ?-metric and have con-ducted a series of experiments on different types of streamsand for different parameters settings. We have fed our algo-rithm with both real-world data and synthetic traces. Real datagive a realistic representation of some real systems, whilethe latter ones allow to capture phenomenon which may bedifficult to obtain from real-world traces, and thus allow tocheck the robustness of our metric. We have varied all thesignificant parameters of our algorithm, that is, the maximalnumber of distinct data items n in each stream, the numberof cells k of each generated partition, and the number ofgenerated partitions t. For each parameters setting, we haveconducted and averaged 100 trials of the same experiment,leading to a total of more than 300, 000 experiments for theevaluation of our metric. Real data have been downloadedfrom the repository of Internet network traffic [29]. We haveused five traces among the available ones. Two of themrepresent two weeks logs of HTTP requests to the Internetservice provider ClarkNet WWW server – ClarkNet is a fullInternet access provider for the Metro Baltimore-WashingtonDC area – the other two ones contain two months of HTTPrequests to the NASA Kennedy Space Center WWW server,and the last one represents seven months of HTTP requests tothe WWW server of the University of Saskatchewan, Canada.In the following these data sets will be respectively referred toas ClarkNet, NASA, and Saskatchewan traces. Table I presentsthe statistics of these data traces, in term of stream size (cf. “#items” in the table), number of distinct items in each stream(cf. “# distinct items”) and the number of occurrences of themost frequent item (cf. “max. freq.”). For more information onthese data traces, an extensive analysis is available in [30]. We

7
Data trace # items # distinct items max. freq.NASA (July) 1,891,715 81,983 17,572NASA (August) 1,569,898 75,058 6,530ClarkNet (August) 1,654,929 90,516 6,075ClarkNet (September) 1,673,794 94,787 7,239Saskatchewan 2,408,625 162,523 52,695
Table ISTATISTICS OF REAL DATA TRACES.
Figure 2. Logscale distribution of frequencies for each real data trace.
have evaluated the accuracy of our metric by comparing foreach data set (real and synthetic), the results obtained with ouralgorithm on the stream sketches (referred to as Sketch in thelegend) and the ones obtained on full streams (referred to asRef distance in the legend). That is, for each couple of inputstreams, and for each generalized metric φ, we have computedboth the exact distance between the two streams and the oneas generated by our metric. We now present the main lessonsdrawn from these experiments.
Figure 3 and 4 shows the accuracy of our metric as a func-tion of the different input streams and the different generalizedmetrics applied on these streams. All the histograms shownin Figures 3(a)–4(e) share the same legend, but for readabilityreasons, this legend is only indicated on histogram 3(c). Threegeneralized metrics have been used, namely the Bhattacharyyadistance, the Kullback-Leibler and the Jensen-Shannon diver-gences, and five distribution families denoted by p and q havebeen compared with these metrics.
Let us focus on synthetic traces. The first noticeable re-mark is that our metric behaves perfectly well when the twocompared streams follow the same distribution, whatever thegeneralized metric φ used (cf., Figure 3(a) with the uniformdistribution, Figures 3(b), 3(d) and 3(f) with the Zipf distribu-tion, Figure 3(c) with the Pascal distribution, Figure 3(e) withthe Binomial distribution, and Figure 3(g) with the Poissonone). This result is interesting as it allows the sketch ?-metric to be a very good candidate as a parametric method formaking inference about the parameters of the distribution thatfollow an input stream. The general tendency is that when thedistributions of input streams are close (e.g, Zipf distributionwith different parameter, Pascal and the Zipf with α = 4), thenapplying the generalized metrics φ on sketches give a good
estimation of the distance as computed on the full streams.Now, when the two input distributions exhibit a totally
different shape, this may have an impact on the precision ofour metric. Specifically, let us consider as input distributionsthe Uniform and the Pascal distributions (see Figure 3(a)and 3(c)). Sketching the Uniform distribution leads to k-cellpartitions whose value is well distributed, that is, for a givenpartition all the k cell values have with high probability thesame value. Now, when sketching the Pascal distribution, therepartition of the data items in the cells of any given partitionsis such that a few number of data items (those with highfrequency) populate a very few number of cells. However,the values of these cells is very large compared to the othercells, which are populated by a large number of data itemswhose frequency is small. Thus the contribution of data itemsexhibiting a small frequency and sharing the cells of highlyfrequent items will be biased compared to the contribution ofthe other items. This explains why the accuracy of the sketch?-metric is slightly lowered in these cases.
We can also observe the strong impact of the non-symmetryof the Kullback-Leibler divergence on the computation of thedistance (computed on full streams or on sketches) with a clearinfluence when the input streams follow a Pascal and Zipf withα = 1 distributions (see Figures 3(c) and 3(b)).
Finally, Figure 3(h) summarizes the good properties of ourmethod whatever the input streams to be compared and thegeneralized metric φ used to do this comparison.
The same general remarks hold when considering real datasets. Indeed, Figure 4 shows that when the input streamsare close to each other, which is the case for both (Julyand August) NASA and (August and September) ClarkNettraces (cf. Figure 2), then applying the generalized metricsφ on sketches gives good results w.r.t. full streams. Whenthe shapes of the input streams are different (which is thecase for Saskatchewan w.r.t. the 4 other input streams), theaccuracy of the sketch ?-metric decreases a little bit but in asmall proportion. Notice that the scales on the y-axis differsignificantly in Figure 3 and in Figure 4
Figure 5 presents the impact of the number of cells pergenerated partition on the accuracy of our metric on both syn-thetic traces and real data. It clearly shows that, by increasingk, the number of data items per cell in the generated partitionshrinks and thus the absolute error on the computation of thedistance decreases. The same feature appears when the numbern of distinct data items in the stream increases. Indeed, whenn increases (for a given k), the number data items per cellaugments and thus the precision of our metric decreases. Thisgives rise to a shift of the inflection point, as illustrated inFigure 5(b), due to the fact that data sets have almost twentytimes more distinct data items than the synthetic ones. Asaforementioned, the input streams exhibit very different shapeswhich explain the strong impact of k. Note also that k has thesame influence on the Sketch ?-metric for all the generalizeddistances φ.

8
0
0.5
1
1.5
2
2.5
3
3.5
4
Uniform
Zipf - α=1
Zipf - α=2
Zipf - α=4
Pascal
Binomial
Poisson
Met
ric
val
ue
q =
(a) p = Uniform distribution
0
0.5
1
1.5
2
2.5
3
3.5
4
Uniform
Zipf - α=1
Zipf - α=2
Zipf - α=4
Pascal
Binomial
Poisson
Met
ric
val
ue
q =
(b) p = Zipf distribution with α = 1
0
0.5
1
1.5
2
2.5
3
3.5
4
Uniform
Zipf - α=1
Zipf - α=2
Zipf - α=4
Pascal
Binomial
Poisson
Met
ric
val
ue
q =
Ref - Bhattacharyya distanceSketch - Bhattacharyya distance
Ref - Kullback-Leibler divergenceSketch - Kullback-Leibler divergence
Ref - Jensen-Shannon divergenceSketch - Jensen-Shannon divergence
(c) p = Pascal distribution with r = 3 and p = n2r+n
0
0.5
1
1.5
2
2.5
3
3.5
4
Uniform
Zipf - α=1
Zipf - α=2
Zipf - α=4
Pascal
Binomial
Poisson
Met
ric
val
ue
q =
(d) p = Zipf distribution with α = 2
0
0.5
1
1.5
2
2.5
3
3.5
4
Uniform
Zipf - α=1
Zipf - α=2
Zipf - α=4
Pascal
Binomial
Poisson
Met
ric
val
ue
q =
(e) p = Binomial distribution with p = 0.5
0
0.5
1
1.5
2
2.5
3
3.5
4
Uniform
Zipf - α=1
Zipf - α=2
Zipf - α=4
Pascal
Binomial
Poisson
Met
ric
val
ue
q =
(f) p = Zipf distribution with α = 4
0
0.5
1
1.5
2
2.5
3
3.5
4
Uniform
Zipf - α=1
Zipf - α=2
Zipf - α=4
Pascal
Binomial
Poisson
Met
ric
val
ue
q =
(g) p = Poisson distribution with p = n2
0
0.5
1
1.5
2
2.5
3
3.5
4
0 5 10 15 20 25 30 35 40 45 50
Met
ric
valu
e
r parameter
Ref - Bhattacharyya distanceSketch - Bhattacharyya distance
Ref - Kullback-Leibler divergenceSketch - Kullback-Leibler divergence
Ref - Jensen-Shannon divergenceSketch - Jensen-Shannon divergence
(h) p = Uniform distribution and q = Pascal distribution, as a functionof its parameter r (p = n
2r+n).
Figure 3. Sketch ?-metric accuracy as a function of p and q (or r for 3(h)). Parameters setting is as follows: m = 200, 000; n = 4, 000; k = 200; t = 4where m represents the size of the stream, n the number of distinct data items in the stream, t the number of generated partitions and k the number of cellsper generated partition.

9
0
0.05
0.1
0.15
0.2
0.25
NA
SA (A
ug)
NA
SA (Jul)
C.N. (A
ug)
C.N. (Sep)
Saskatchewan
Met
ric
val
ue
q =
Ref - Bhattacharyya distanceSketch - Bhattacharyya distanceRef - Kullback-Leibler divergenceSketch - Kullback-Leibler divergenceRef - Jensen-Shannon divergenceSketch - Jensen-Shannon divergence
(a) p = NASA webserver (August)
0
0.05
0.1
0.15
0.2
0.25
NA
SA (A
ug)
NA
SA (Jul)
C.N. (A
ug)
C.N. (Sep)
Saskatchewan
Met
ric
val
ue
q =
(b) p = NASA webserver (July)
0
0.05
0.1
0.15
0.2
0.25
NA
SA (A
ug)
NA
SA (Jul)
C.N. (A
ug)
C.N. (Sep)
Saskatchewan
Met
ric
val
ue
q =
(c) p = ClarkNet webserver (August)
0
0.05
0.1
0.15
0.2
0.25
NA
SA (A
ug)
NA
SA (Jul)
C.N. (A
ug)
C.N. (Sep)
Saskatchewan
Met
ric
val
ue
q =
(d) p = ClarkNet webserver (September)
0
0.05
0.1
0.15
0.2
0.25
NA
SA (A
ug)
NA
SA (Jul)
C.N. (A
ug)
C.N. (Sep)
Saskatchewan
Met
ric
val
ue
q =
(e) p = Saskatchewan University webserver
Figure 4. Sketch ?-metric accuracy as a function of real data traces. Parameters setting is as follows: k = 2, 000; t = 4.

10
0
0.5
1
1.5
2
2.5
3
3.5
4
10 100 1000 10000 100000
Met
ric
valu
e
k parameter
Ref - Bhattacharyya distanceSketch - Bhattacharyya distance
Ref - Kullback-Leibler divergenceSketch - Kullback-Leibler divergence
Ref - Jensen-Shannon divergenceSketch - Jensen-Shannon divergence
(a) Sketch ?-metric accuracy as a function of k. We havem = 200, 000; n = 4, 000; t = 4; r = 3
0
0.05
0.1
0.15
0.2
0.25
10 100 1000 10000 100000
Met
ric
valu
e
k parameter
Ref - Bhattacharyya distanceSketch - Bhattacharyya distanceRef - Kullback-Leibler divergenceSketch - Kullback-Leibler divergenceRef - Jensen-Shannon divergenceSketch - Jensen-Shannon divergence
(b) Sketch ?-metric accuracy between data trace extracted from ClarkNet-work (August) and Saskatchewan University, as a function of k
Figure 5. Sketch ?-metric between the Uniform distribution and Pascal withparameter p = n
2r+n(Figures 5(a) and 6(a)), and between data trace extracted
from ClarkNetwork (August) and Saskatchewan University (Figures 5(b)and 6(b)).
Figure 6 shows the slight influence of the number t ofgenerated partitions on the accuracy of our metric. The reasoncomes from the use of 2-universal hash functions, whichguarantee for each of them and with high probability thatdata items are uniformly distributed over the cells of anypartition. As a consequence, augmenting the number of suchhash functions has a weak influence on the accuracy of themetric. Figure 7 focuses on the error made on the Sketch ?-metric for five different values of t as a function of parameterr of the Pascal distribution (recall that increasing values ofr – while maintaining the mean value – makes the shapeof the Pascal distribution flatter). Figures 7(b), 7(d), and 7(f)respectively depict for each value of t the difference betweenthe reference and the sketch values which makes more visiblethe impact of t. The same main lesson drawn from thesefigures is the moderate impact of t on the precision of ouralgorithm.
VIII. CONCLUSION AND OPEN ISSUES
In this paper, we have introduced a new metric, the Sketch?-metric, that allows to compute any generalized metric φ onthe summaries of two large input streams. We have presented asimple and efficient algorithm to sketch streams and compute
this metric, and we have shown that it behaves pretty wellwhatever the considered input streams. We are convinced ofthe undisputable interest of such a metric in various domainsincluding machine learning, data mining, databases, informa-tion retrieval and network monitoring.
Regarding future works, we plan to characterize our metricamong Renyi divergences [31], also known as α-divergences,which generalize different divergence classes. We also planto consider a distributed setting, where each site would be incharge of analyzing its own streams and then would propagateits results to the other sites of the system for comparison ormerging. An immediate application of such a “tool” wouldbe to detect massive attacks in a decentralized manner (e.g.,by identifying specific connection profiles as with wormspropagation, and massive port scan attacks or by detectingsudden variations in the volume of received data).
REFERENCES
[1] B. K. Subhabrata, E. Krishnamurthy, S. Sen, Y. Zhang, and Y. Chen,“Sketch-based change detection: Methods, evaluation, and applications,”in Internet Measurement Conference, 2003, pp. 234–247.
[2] Y. Busnel, M. Bertier, and A.-M. Kermarrec, “SOLIST or How To LookFor a Needle in a Haystack?” in the 4th IEEE International Conferenceon Wireless and Mobile Computing, Networking and Communications(WiMob’2008), Avignon, France, October 2008.
[3] M. Chu, H. Haussecker, and F. Zhao, “Scalable information-drivensensor querying and routing for ad hoc heterogeneous sensor networks,”International Journal of High Performance Computing Applications,vol. 16, no. 3, pp. 293–313, 2002.
[4] S. Kullback and R. A. Leibler, “On information and sufficiency,” TheAnnals of Mathematical Statistics, vol. 22, no. 1, pp. 79–86, 1951.[Online]. Available: http://dx.doi.org/10.2307/2236703
[5] I. Csiszar, “Eine informationstheoretische ungleichung und ihre anwen-dung auf den beweis der ergodizitat von markoffschen ketten,” Magyar.Tud. Akad. Mat. Kutato Int. Kozl, vol. 8, pp. 85–108, 1963.
[6] T. Morimoto, “Markov processes and the h-theorem,” Journal of thePhysical Society of Japan, vol. 18, no. 3, pp. 328–331, 1963.
[7] S. M. Ali and S. D. Silvey, “General Class of Coefficients of Divergenceof One Distribution from Another,” Journal of the Royal StatisticalSociety. Series B (Methodological), vol. 28, no. 1, pp. 131–142, 1966.
[8] A. Bhattacharyya, “On a measure of divergence between two statisticalpopulations defined by their probability distributions,” Bulletin of theCalcutta Mathematical Society, vol. 35, pp. 99–109, 1943.
[9] M. Basseville and J.-F. Cardoso, “On entropies, divergences, and meanvalues,” in Proceedings of the IEEE International Symposium on Infor-mation Theory, 1995.
[10] N. Alon, Y. Matias, and M. Szegedy, “The space complexity of approx-imating the frequency moments,” in Proceedings of the twenty-eighthannual ACM symposium on Theory of computing (STOC), 1996, pp.20–29.
[11] T. Cover and J. Thomas, “Elements of information theory,” Wiley NewYork, 1991.
[12] A. Chakrabarti, G. Cormode, and A. McGregor, “A near-optimal al-gorithm for computing the entropy of a stream,” in In ACM-SIAMSymposium on Discrete Algorithms, 2007, pp. 328–335.
[13] S. Guha, A. McGregor, and S. Venkatasubramanian, “Streaming andsublinear approximation of entropy and information distances,” in Pro-ceedings of the Seventeenth Annual ACM-SIAM Symposium on DiscreteAlgorithms (SODA), 2006, pp. 733–742.
[14] A. Chakrabarti, K. D. Ba, and S. Muthukrishnan, “Estimating entropyand entropy norm on data streams,” in In Proceedings of the 23rdInternational Symposium on Theoretical Aspects of Computer Science(STACS). Springer, 2006.
[15] A. Lall, V. Sekar, M. Ogihara, J. Xu, and H. Zhang, “Data streamingalgorithms for estimating entropy of network traffic,” in Proceedingsof the joint international conference on Measurement and modeling ofcomputer systems (SIGMETRICS). ACM, 2006.

11
0
0.5
1
1.5
2
2.5
3
3.5
4
0 2 4 6 8 10 12 14 16 18 20
Met
ric
valu
e
t parameter
Ref - Bhattacharyya distanceSketch - Bhattacharyya distance
Ref - Kullback-Leibler divergenceSketch - Kullback-Leibler divergence
Ref - Jensen-Shannon divergenceSketch - Jensen-Shannon divergence
(a) Sketch ?-metric accuracy as a function of parameter t. We havem = 200, 000; n = 4, 000; k = 200 and r = 3
0
0.05
0.1
0.15
0.2
0.25
0 2 4 6 8 10 12 14 16 18 20
Met
ric
valu
e
t parameter
Ref - Bhattacharyya distanceSketch - Bhattacharyya distance
Ref - Kullback-Leibler divergenceSketch - Kullback-Leibler divergence
Ref - Jensen-Shannon divergenceSketch - Jensen-Shannon divergence
(b) Sketch ?-metric accuracy between data trace extracted from ClarkNet-work (August) and Saskatchewan University, as a function of t
Figure 6. Sketch ?-metric between the Uniform distribution and Pascal withparameter p = n
2r+n(Figures 5(a) and 6(a)), and between data trace extracted
from ClarkNetwork (August) and Saskatchewan University (Figures 5(b)and 6(b)).
[16] E. Anceaume, Y. Busnel, and S. Gambs, “AnKLe: detecting attacks inlarge scale systems via information divergence,” in Proceedings of the
9th European Dependable Computing Conference (EDCC), 2012.[17] E. Anceaume and Y. Busnel, “An information divergence estimation over
data streams,” in Proceedings of the 11th IEEE International Symposiumon Network Computing and Applications (NCA), 2012.
[18] M. Charikar, K. Chen, and M. Farach-Colton, “Finding frequent items indata streams,” Theoretical Computer Science, vol. 312, no. 1, pp. 3–15,2004.
[19] G. Cormode and S. Muthukrishnan, “An improved data stream summary:the count-min sketch and its applications,” J. Algorithms, vol. 55, no. 1,pp. 58–75, 2005.
[20] G. Cormode and M. Garofalakis, “Sketching probabilistic data streams,”in Proceedings of the 2007 ACM SIGMOD international conference onManagement of data, 2007, pp. 281–292.
[21] S. Guha, P. Indyk, and A. Mcgregor, “Sketching information diver-gences,” Machine Learning, vol. 72, no. 1-2, pp. 5–19, 2008.
[22] Muthukrishnan, Data Streams: Algorithms and Applications. NowPublishers Inc., 2005.
[23] L. M. Bregman, “The relaxation method of finding the common pointof convex sets and its application to the solution of problems in convexprogramming,” USSR Computational Mathematics and MathematicalPhysics, vol. 7, no. 3, pp. 200–217, 1967.
[24] E. Hellinger, “Neue begrundung der theorie quadratischer formen vonunendlichvielen veranderlichen,” J. Reine Angew. Math., vol. 136, pp.210–271, 1909.
[25] I. Csiszar, “Information Measures: A Critical Survey,” in Transactionsof the Seventh Prague Conference on Information Theory, StatisticalDecision Functions, Random Processes. Dordrecht: D. Riedel, 1978,pp. 73–86.
[26] I. Csiszar, “Why least squares and maximum entropy? an axiomaticapproach to inference for linear inverse problems,” The Annals ofStatistics, vol. 19, no. 4, pp. 2032–2066, 1991.
[27] S.-I. Amari and A. Cichocki, “Information geometry of divergence func-tions,” Bulletin of the Polish Academy of Sciences: Technical Sciences,vol. 58, no. 1, pp. 183–195, 2010.
[28] S.-I. Amari, “α-Divergence Is Unique, Belonging to Both f -Divergenceand Bregman Divergence Classes,” IEEE Transactions on InformationTheory, vol. 55, no. 11, pp. 4925–4931, nov 2009.
[29] the Internet Traffic Archive, “http://ita.ee.lbl.gov/html/traces.html,”Lawrence Berkeley National Laboratory, Apr. 2008.
[30] M. F. Arlitt and C. L. Williamson, “Web server workload characteriza-tion: the search for invariants,” SIGMETRICS Performance EvaluationReview, vol. 24, no. 1, pp. 126–137, 1996.
[31] A. Renyi, “On measures of information and entropy,” in Proceedings ofthe 4th Berkeley Symposium on Mathematics, Statistics and Probability,1960, pp. 547–561.

12
0
0.2
0.4
0.6
0.8
1
1.2
1.4
0 5 10 15 20 25 30 35 40 45 50
Met
ric
valu
e
r parameter
Ref - Bhattacharyya distanceSketch - t = 4Sketch - t = 7
Sketch - t = 10Sketch - t = 14Sketch - t = 17
(a) Value of Bhattacharyya distance
0.1
0.15
0.2
0.25
0.3
0.35
0.4
0 5 10 15 20 25 30 35 40 45 50
ε e
rror
val
ue
r parameter
Sketch - t = 4Sketch - t = 7Sketch - t = 10Sketch - t = 14Sketch - t = 17
(b) Difference with Bhattacharyya distance
1
1.5
2
2.5
3
3.5
4
0 5 10 15 20 25 30 35 40 45 50
Met
ric
valu
e
r parameter
Ref - Kullback-Leibler divergenceSketch - t = 4Sketch - t = 7
Sketch - t = 10Sketch - t = 14Sketch - t = 17
(c) Value of Kullback-Leibler divergence
0
0.05
0.1
0.15
0.2
0.25
0.3
0 5 10 15 20 25 30 35 40 45 50
ε e
rror
val
ue
r parameter
Sketch - t = 4Sketch - t = 7Sketch - t = 10Sketch - t = 14Sketch - t = 17
(d) Difference with Kullback-Leibler divergence
0.1
0.15
0.2
0.25
0.3
0.35
0.4
0.45
0.5
0.55
0.6
0 5 10 15 20 25 30 35 40 45 50
Met
ric
valu
e
r parameter
Ref - Jensen-Shannon divergenceSketch - t = 4Sketch - t = 7
Sketch - t = 10Sketch - t = 14Sketch - t = 17
(e) Value of Jensen-Shannon divergence
0
0.05
0.1
0.15
0.2
0.25
0.3
0.35
0 5 10 15 20 25 30 35 40 45 50
ε e
rror
val
ue
r parameter
Sketch - t = 4Sketch - t = 7Sketch - t = 10Sketch - t = 14Sketch - t = 17
(f) Difference with Jensen-Shannon divergence
Figure 7. Sketch ?-metric estimation between Uniform distribution and Pascal with parameter p = n2r+n
, as a function of k, t and r.