SKETCH-BASED QUERIES IN MOBILE GIs-ENVIRONMENTS
128
SKETCH-BASED QUERIES IN MOBILE GIs-ENVIRONMENTS BY David Caduff Dipl.-Ing. HTL, Basel Institute of Technology and Management, 1998 Dipl.-Ing. FH-NDS, Base1 Institute of Technology and Management, 2000 A THESIS Submitted in partial Fulfillment of the Requirements for the Degree of Master of Science (in Spatial Infonnation Science and Engineering) The Graduate School The University of Maine December, 2002 Advisory Committee: Max J. Egenhofer, Professor of Spatial Infonnation Science and Engineering, Advisor Silvia Nittel, Assistant Professor of Spatial Information Science and Engineering Werner Kuhn, Associate Professor of Geoinformatics, University of Miinster, Germany
-
Upload
independent -
Category
Documents
-
view
0 -
download
0
Transcript of SKETCH-BASED QUERIES IN MOBILE GIs-ENVIRONMENTS

SKETCH-BASED QUERIES IN
MOBILE GIs-ENVIRONMENTS
BY
David Caduff
Dipl.-Ing. HTL, Basel Institute of Technology and Management, 1998
Dipl.-Ing. FH-NDS, Base1 Institute of Technology and Management, 2000
A THESIS
Submitted in partial Fulfillment of the
Requirements for the Degree of
Master of Science
(in Spatial Infonnation Science and Engineering)
The Graduate School
The University of Maine
December, 2002
Advisory Committee:
Max J. Egenhofer, Professor of Spatial Infonnation Science and Engineering, Advisor
Silvia Nittel, Assistant Professor of Spatial Information Science and Engineering
Werner Kuhn, Associate Professor of Geoinformatics, University of Miinster, Germany

O 2002 David Caduff
All Rights Reserved

LIBRARY RIGHTS STATEMENT
In presenting this thesis in partial fulfillment of the requirements for an advanced degree
at The University of Maine, I agree that the Library shall make it freely available for
inspection. I further agree that permission for "fair use" copying of this thesis for
scholarly purposes may be granted by the Librarian. It is understood that any copying or
publication of this thesis for financial gain shall not be allowed without my written
permission.
Signature:
Date: December 6,2002
SKETCH-BASED QUERIES IN MOBILE CIS-ENVIRONMENTS
By David Caduff
Thesis Advisor: Dr. Max J. Egenhofer
An Abstract of the Thesis Presented in Partial Fulfillment of the Requirements for the
Degree of Master of Science (in Spatial Information Science and Engineering)
December, 2002
Recent achievements in the field of mobile computing and wireless
communication promise data retrieval anywhere and anytime. This development provided
the basis to expand GIs technology to handheld devices, such as personal digital
assistants (PDAs). Although traditional GIs technology is well suited for desktop
workstations, it needs to be adapted in order to satisfy the requirements of users using
handheld computing devices. This adaptation is necessary because the usability of
traditional GISs depends on characteristics of desktop computers, such as their relatively
large user interfaces (e.g., displays, keyboards, pointing devices), considerable computing
resources (i.e., CPU, memory, storage, operating systems), and high bandwidth network
connectivity. Small devices possess few of these characteristics, hence, requiring new and
efficient methods for interaction with spatial databases.
We propose a concept that supports sketch-based querying in mobile GIs
environments. This concept combines newest techniques for spatial querying and mobile
technologies. Such a combination is beneficial for users because it allows them to
formulate queries by drawing the desired configuration with a pen on the touch-sensitive
PDA screen, and consequently avoids typing complex statements in some SQL-like query
language. Client-server architectures in mobile environments are characterized by low
and fluctuating bandwidth, and by frequent disconnections. We discuss client-server
strategies in mobile environments, suggest an adaptive client-server architecture for geo-
mobile querying, and analyze the performance. It is shown that adaptation to the mobile
environment is necessary in order to ensure efficiency of geo-mobile queries.
ACKNOWLEDGMENTS
Hidden between lines and figures of this thesis is a story. It is a story of adventure,
sacrifice, incertitude, friendship, maturation, and most importantly, gratitude. One of the
pleasures of finally finishing is this opportunity to express my gratitude to the people who
deserve it.
From the formative stages of this thesis to the final draft, I owe gratitude to my
advisor, Dr. Max J. Egenhofer. His sound advice and carefil guidance were invaluable as
I attempted to examine ways to extend sketch-based querying from desktop environments
to people's everyday lives.
I would also like to thank my other committee members, Dr. Silvia Nittel and Dr.
Werner Kuhn. Their advice and patience is appreciated. Many thanks also to the staff in
the SIE department for their tireless efforts.
In the course of my studies here in Orono, I have been fortunate to interact with
many people who have influenced me greatly. They have helped me one way or another,
in my attempt to complete a M.S, and deserve my gratitude.
I would like to thank my best friend and roommate, Kostas. Those days in Rhodes
and the long nights of work, technical, political, philosophical, and sometimes more on-
earth discussions at 37 Middle Street will not be forgotten.
I would also like to thank Chris for his scientific input, his help in coping with local
customs, and the numerous times he knocked on my door early in the morning. Similarly,

I want to thank my former officemate Greg, and all the friends I have made along the
way.
Finally, I would like to thank my family for their support. I am greatly indebted to
my sisters and my brother who not only supported me through long phone calls, but also
provided several opportunities to see familiar faces far from home. Above all, I cannot
fully express my gratitude to my parents, whose unbounded support in every stage of my
life made my adventure a success. Their values define who I am.
This work was partially supported by NSF grant 115-9613646, a research contract
with Lockheed Martin Management and Data Systems, and by a graduate assistantship
from the University of Maine.

TABLE OF CONTENTS
... .................................................................................................. ACKNOWLEDGMENTS 111
LIST OF TABLES ............................................................................................................. bc
LIST OF FIGURES ............................................................................................................. x
Chapter
1 INTRODUCTION ...................................................................................................... 1
1.1 Mobile GIs Environments .................................................................................. 1
1.1.1 The Impact of Mobile Appliances ................................................................... 3
1.1.2 The Benefit of Wireless Communication ........................................................ 4
1.1.3 Mobile Infornlation Retrieval .......................................................................... 6
1.2 A Geo-Mobile Query System .............................................................................. 7
1.2.1 Goal ................................................................................................................. 7
...................................................................................................... 1.2.2 Approach 8
............................................................... 1.2.3 Research Questions and Hypothesis 9
............................................................................................. 1.3 Intended Audience 1 1
...................................................................................... 1.4 Organization of Thesis 1 1
2 MOBILECOMPUTING .......................................................................................... 14
2.1 PDAs ................................................................................................................. 15
2.1.1 Screen Real Estate ......................................................................................... 17
................................................................................................... 2.1.2 Battery Life 1 8
........................................................................... 2.1.3 Wireless Communication 2 0
........................................ 2.2 Client-Server Computing in Mobile Environments 2 1
................................................................................... 2.2.1 The Wireless Medium 22
2.2.2 The Mobile Host ............................................................................................ 23
2.2.3 Paradigms of Mobile Client-Server Computing ............................................ 25

2.2.3.1 Mobile-Aware Adaptation ..................................................................... 25
2.2.3.2 Extended Client-Server Model .............................................................. 28
2.2.3.3 Mobile Data Access .............................................................................. 30
........................................................................................................... 2.3 Summary 31
3 AN ARCHITECTURE FOR GEO-MOBILE QUERYING .................................... 33
3.1 Guidelines for Geo-Mobile Querying ............................................................... 34
3.1.1 Functional Partitioning .................................................................................. 35
3.1.1.1 DataFlow .............................................................................................. 37
......................................................................................... 3.1.1.2 Control Flow 40
3.1.2 Non-Functional Partitioning ......................................................................... 42
3.1.2.1 Hardware Factors .................................................................................. 44
3.1.2.2 Network Factors .................................................................................... 45
3.2 The Geo-Mobile Query-by-Sketch Architecture ............................................... 47
3.2.1 The Mobile Client ......................................................................................... 47
3.2.2 The Server ..................................................................................................... 49
........................................................................................ 3.2.3 The Mobile Sketch 50
3.2.3.1 Components of the Mobile Sketch ........................................................ 50
...................................................... 3.2.3.2 Mobile Sketch Generation Scheme 5 1
....................................................................... 3.2.3.3 Levels of Representation 53
3.2.4 Mobile-Aware Adaptation Strategy .............................................................. 55
3.2.4.1 Complementary Distribution of the Query Process .............................. 55
3.2.4.2 Adaptation Policy .................................................................................. 56
3.3 Summary ........................................................................................................... 59
4 QUERY PROCESSING AND TRANSMISSION COST ANALYSIS ................. 60
4.1 Framework ........................................................................................................ 60
4.1.1 Properties of the Mobile Sketch .................................................................... 60
................................................................................ 4.1.1.1 Sketch Complexity 61
4.1.1.2 Quantitative Aspects ............................................................................. 63

4.1.2 Transmission Cost Model .............................................................................. 65
................................................................................................... 4.2 Methodology 6 7
............................................................................................................... 4.3 Results 69
................................................................................................ 4.4 Interpretation 7 1
.......................................................................... 4.4.1 Quantitative Characteristics 71
...................................................................... 4.4.2 Transmission Time in Context 72
4.5 Optimizing the Geo-Mobile Adaptation Process ........................................ 75
4.6 Summary ........................................................................................................... 77
................... 5 USER INTERFACE DESIGN AND INTERACTION METAPHOR 78
5.1 The Nature of Geo-Mobile Queries .................................................................. 79
........................................................................ 5.2 Mobile Users and Mental Maps 81
............................................................................... 5.3 User Interface Components 83
...................................................................................................... 5.3.1 Metaphor 8 4
...................................................................................................... 5.3.2 Interaction 85
.............................................................................................. 5.3.2.1 Pen Usage 86
.................................................................................. 5.3.2.2 Hardware Buttons 87
........................................................................... 5.3.2.3 Embodied Interaction 8 8
.................................................................................................... 5.3.3 Appearance 89
.................................................................................... 5.4 User Interface Prototype 90
.................................................................... 5.4.1 Query Formulation Mechanism 90
............................................................................... 5.4.1.1 The Sketching Area 91
................................................................................... 5.4.1.2 The Control Area 91
....................................................................... 5.4.1.3 The Pan-and-Zoom Area 92
5.4.2 Visualization Mechanism .............................................................................. 93
..................................................................................................... 5.5 Guided Tour 9 3
5.6 Summary ........................................................................................................... 95
.............................................................. 6 CONCLUSIONS AND FUTURE WORK 96
6.1 Summary ........................................................................................................... 96
vii

6.1.1 Users. Mobile Technology. and GISs ........................................................... 97
6.1.2 Geo-Mobile Information Retrieval ................................................................ 97
6.2 Major Results .................................................................................................... 98
6.3 Future Work .................................................................................................... 100
6.3.1 Using Architecture as Model for Future Research ...................................... 100
6.3.2 People's Sketching Behavior in Mobile Environments .............................. 101
6.3.3 Context Dependency ................................................................................... 102
6.3.3.1 Spatial Context Dependency ............................................................... 103
6.3.3.2 Context Dependency of Application Adaptation ................................ 103
6.3.3.3 Task-Based Context Dependency ....................................................... 104
6.3.4 Geo-Mobile Spatial Analysis ...................................................................... 105
REFERENCES ................................................................................................................ 107
BIOGRAPHY OF THE AUTHOR ................................................................................. 114

LIST OF TABLES
Table 4.1 Quantitative characteristics of the sketches ...................................................... 69
Table 4.2 Average file size for the levels of representation .............................................. 74
Table 4.3 Transmission time for GSM and GPRS infrastructures .................................... 74
Table 4.4 Lookup table of expected transfer times for dynamic adaptation ..................... 76
Table 5.1 Potential operations and triggering gestures ..................................................... 89

LIST OF FIGURES
Figure 2.1 Power consumption and Performance of mobile devices ................................ 19
Figure 2.2 The mobile environment .................................................................................. 21
Figure 2.3 States of a mobile host and transition operations between the states .............. 23
Figure 2.4 Range of mobile-aware adaptation strategies .................................................. 26
Figure 2.5 The classic client-server model ........................................................................ 29
Figure 2.6 The extended client-server model .................................................................... 29
Figure 3.1 Partitioning hctionality ............................................................................ 3 6
Figure 3.2 The functional objects ...................................................................................... 36
Figure 3.3 Data flow for object processing ....................................................................... 38
Figure 3.4 Data flow for the generation of the digital sketch ........................................... 39
Figure 3.5 Allocation of functional objects to system entities .......................................... 40
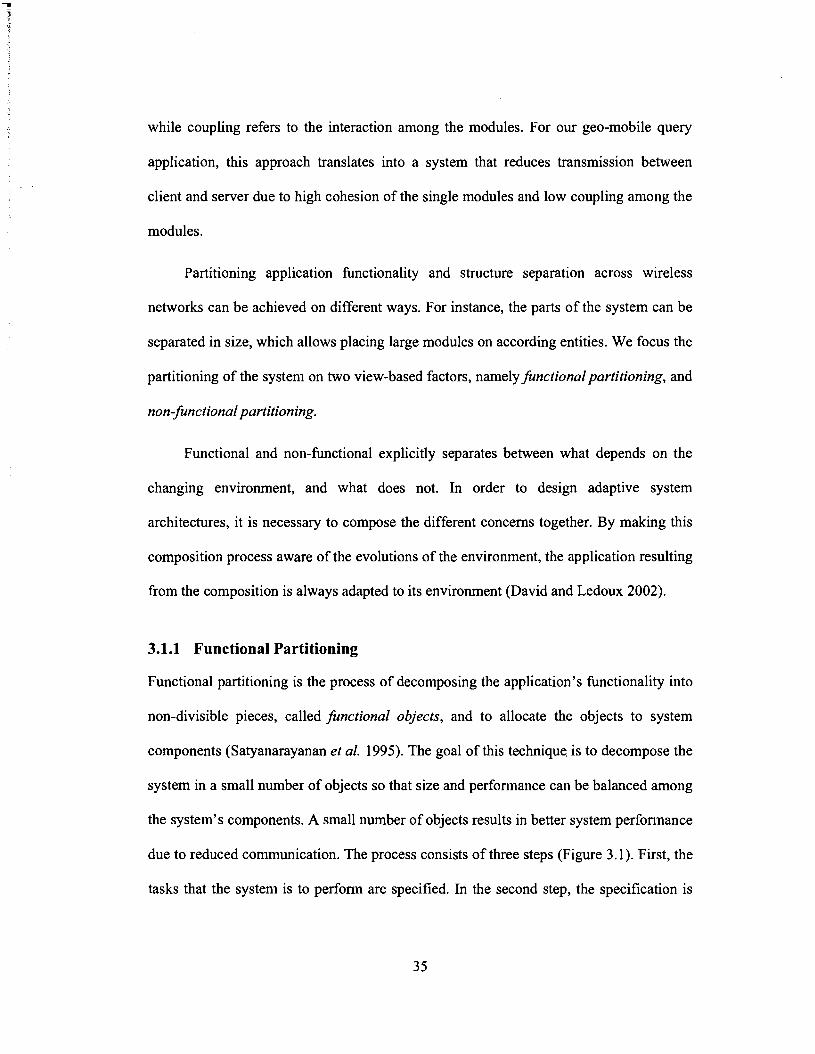
Figure 3.6 Query-by-sketch sequence diagram ................................................................. 42
Figure 3.7 The architecture of the mobile client ............................................................... 48
Figure 3.8 Generation scheme for the multiple representations of the mobile
............................................................................................................... sketch 53
Figure 3.9 Mobile-aware adaptation strategy .................................................................... 56
Figure 3.10 Example of a discrete utility curve ................................................................ 57
Figure 3.1 1 Discrete adaptation model ............................................................................. 58
Figure 4.1 Possible types of objects in sketched scenes (Blaser 1998) ............................. 62
Figure 4.2 Number of occurrences of stroke types per sketch (Blaser 1998) ................... 63
Figure 4.3 Number of objects per sketch (Blaser 1998) ................................................... 64
Figure 4.4 Number of binary spatial relations (Blaser 1998) ............................................ 65

Figure 4.5 Components of message latency ...................................................................... 67
Figure 4.6 File structure consisting of static and dynamic part ........................................ 67
............................. Figure 4.7 The three sketches used for the transmission cost analysis 68
Figure 4.8 File sizes for the three mobile sketches and the average ................................. 70
Figure 4.9 Transmission time as function of file size and data rate .................................. 70
.......................................... Figure 4.10 File size as a function of the representation level 72
Figure 5.1 User interface of PDAs .................................................................................... 86
Figure 5.2 User interface components of the geo-mobile query application .................... 90
........................................................................................... Figure 5.3 Zoom and pan area 92
Figure 5.4 Scrapbook-like result browsing mechanism .................................................... 93
Figure 5.5 Dialogs for configuration of user profile ......................................................... 94
Figure 5.6 Users describe the spatial configuration they are looking for in terms of
a sketch ............................................................................................................ 95

Chapter 1
INTRODUCTION
Emerging technologies are changing the future use of geographic information, moving
geographic infonnation systems (GISs) from the office desktops into the users' hands
(Egenhofer 1992). The combination of mobility, wireless connectivity, and the basic
functionality of GISs (i.e., storing, retrieving, analyzing, and displaying cartographic
data) creates a mobile GIs environment, which enables ubiquitous information retrieval.
The objective of this thesis is to investigate basic issues associated with infonnation
retrieval in mobile GIs environments and to develop methods to support recent
development in spatial data retrieval, such as sketch-based querying. In this scope, we
explore client-server architectures for mobile computing, introduce the mobile sketch, a
transmission method that supports sketch-based queries for mobile GISs, and propose an
adaptive architecture for sketch-based query systems in mobile GIs environments.
1.1 Mobile GIs Environments
Mobile geographic information systems are the high-tech equivalent of paper maps.
Because GISs are tightly attached to computer technology, they have been in existence in
much the same form for many years. In the traditional form, a GIs suffers from a number

of problen~s (Egenhofer 1993; Pitoura and Bhargava 1994; Satyanarayanan 1 996b). First,
GISs are integrated in static environments and, therefore, they are difficult and expensive
to move. This relates to a second problem: because GISs are static they lack flexibility.
For example, GISs exist as applications on desktop computers, but, unlike maps, such
systems (i.e., GIs application and supporting hardware) are highly immobile. Third, GISs
are typically connected to powerful databases that support management of large amounts
of data, requiring network facilities to extract information that is of interest.
Mobile GISs provide the facility to extract particular sets of information where it is
needed (i.e., work site, current location). Making GISs mobile offers users greater
flexibility, allowing them to quickly produce results that are tailored to their needs.
However, mobile GISs go further as they provide access to data whenever and wherever
the user is (Cappelletti 1998). Related operations, such as querying spatial data,
performing spatio-temporal analysis or modeling, become possible on the go.
One potential area of application for mobile GIs is disaster management in the
field. For instance, consider disaster response in case of hurricanes that cause
infrastructure to collapse (e.g., bridges, buildings, railroads). The formulation of spatial
queries that allow efficient disaster management require exact and accurate descriptions
of spatial configurations, which is inherently a difficult task if performed solely on the
basis of existing maps (Egenhofer 199 1). Another requirement of such applications is an
architecture that assures immediate response times in order to ensure security for
residents.
As an example, take the hazardous areas in hurricane-prone regions whose
condition may change rapidly, depending on the movement of the hurricane and the

damage it caused. Residents rely on fast and accurate decisions by specialists; however,
such decisions require analysis based on up to date input, which is often not available in a
static environment. If the query is performed in a mobile environment, specialists will be
able to take faster decisions, which are more accurate and thus, more efficient.
1.1.1 The Impact of Mobile Appliances
Recently, technical advances in the development of portable devices, such as handheld
organizers, Personal Digital Assistants (PDAs), or cell phones, have provided the basis
for a ubiquitous supply of information (Abowd and Mynatt 2000). Such devices are small
and portable, so they have become pernlanent companions in many people's every day
lives. While the purpose of these devices was initially the management of personal
information, they have quickly become a generic source of information (Burkhardt et al.
2001), shifting traditional GISs from the traditional desktop environment into the users'
hands. This development manifests itself in a wide variation of spatially related, mobile
applications for mobile devices (GIs-Lounge 2002). These applications provide users
with opportunities to display, query, and manipulate spatial data anywhere anytime.
Spatially related applications are available for a wide spectrum of mobile
appliances including laptop computers, handheld devices, and PDAs. Laptop computers
have been used as typical clients for mobile GISs; however, developments in PDA
technology shifted the attention from the heavyweight laptop computers to lighter PDAs
(Korte 2000). In this context, the issues discussed in this thesis may be applied to any
mobile device, because these devices share an intrinsic set of defining characteristics:
they are portable, they are currently resource poor, and they rely on finite energy sources.
We will focus, however, only on devices that are small enough to fit into the palm of

person's hand. To refer to this family of portable devices, we use the tenns Personal
Digital Assistant (PDAs), mobile devices, and handheld organizers interchangeably.
The range of GIs-related applications for mobile devices has become broader over
the last five years. It ranges from providing tourists with infom~ation about points of
interests, travelers with route descriptions, and mobile workforces with interactive maps
(Cheverst et al. 2000; Pascoe et al. 2000), to mapping technologies for locating
individual addresses or contacts (Marcus and Chen 2002). Companies use mobile GISs as
part of their management in order to provide a comprehensive view of where work crews
are located, what tools, parts, and support they need where and when, and what work is
coming next. Therefore, mobile GISs are ideal tools for managing crews of fieldworkers
efficiently. Applications on the market allow for complete analyses and optimizations of
a company's field service chain, which results in better organization of logistics and
communication of real-time, spatially related information. Such improvements have
significant economic benefits.
1.1.2 The Benefit of Wireless Communication
Managing the vast amounts of geographic data and processing queries against spatial
databases requires support from powerful servers (Barbar6 1999; Imielinski and
Badrinath 1994). Since the CPU power of PDAs, due to the dependency on battery
power, lags far behind the common desktop environments (Welch 1995), PDAs alone are
typically an insufficient platfom~ for mobile GIs. Instead, mobile GISs must rely on
client-server architectures in order to ensure productivity and efficiency. In a client-server
relationship between two computers, the client is the part that makes a service request
from another entity, the server, which fulfills the request. Client-server architectures

require a link between the two entities so that they can communicate with each other by
exchanging messages over a computer network.
While the growth in physical network bandwidth has been tremendous in the past
decade, most wireless products provide only low bandwidth (Pitoura and Bhargava
1994). Third-generation protocols, such as the Universal Mobile Telecommunications
System UMTS, are expected to increase the use of broadband technology in wireless
network environments (Walkley 2001). Higher bandwidth pron~ises new services for
mobile devices, such as video conferencing and multimedia services without the need of
physical wiring. Such broadband wireless communication has potential of creating an
environment in which a roaming user has the same services as at home or in the office.
Clearly, wireless technology plays an increasing role in people's lives. Mobile GIs
will benefit from this development, allowing new approaches to enter the field. Yet,
unlike wired networks, where the available bandwidth is essentially constant,
communication in wireless networks varies in quality, depending on factors such as
location, coverage, bandwidth, etc. Hence, it is important for applications in wireless
networks to rely on Quality of Service (QoS) parameters, which adapt the quality of a
system to the preferences of the user (Satyanarayanan et al. 1995). For the remainder of
this thesis we assume that future mobile GISs will benefit from wireless broadband
communication protocols and that such applications will be guided by QoS constraints, in
order to cope with the varying quality in wireless networks.

1.1.3 Mobile Information Retrieval
One of the key operations in GISs is the retrieval of spatial information. Conventional
query languages, such as the SQL, use text-based statements. While they work well
within data domains where data can easily be stored in tables, they lack expressiveness
and flexibility within more complex domains, such as images, maps, or other spatially
related, multi-dimensional data (Egenhofer 1991, 1992; Egenhofer and Frank 1991).
Images and especially maps, however, are an integral part of most GISs and, therefore,
query methods for GISs need to be sufficiently expressive and efficient. For mobile GISs,
particular attention needs to be paid to query languages that are responsive to bandwidth
fluctuations, frequent disconnections, and various constraints of the mobile device, such
as limited input bandwidth.
Recent research activities in visual information retrieval systems investigated novel
techniques to query spatial data more efficiently (Blaser 2000; Egenhofer 1996). Visual
information retrieval systems stress the use of visual tools to formulate a query. Unlike
the SQL-based approach, these systems focus more directly on the end result, since an
example of a user's query can be used as a formulation of a query statement.
This thesis studies visual information retrieval techniques, specifically sketch-based
queries, in the context of mobile GISs. As a framework and foundation, we use a sketch-
based user interface for information retrieval systems (Blaser 2000), which allows users
to formulate a query in form of a sketch that represents the spatial scene users want to
find in a spatial database. GIs applications on PDAs are unlikely to have all relevant data
sources readily available in the device; hence, another critical aspect of information
retrieval in mobile GIs environments is the response time. The scope of this thesis is to

investigate the workflow and dataflow for sketch-based information retrieval systems in
client-server architectures. We focus on the query formulation, because the resulting
concepts and findings are generic and, therefore, valid for a wide range of applications.
The presentation and analysis of the results, on the other hand, are application-specific
and, therefore, should be investigated separately.
1.2 A Geo-Mobile Query System
The use of PDAs as a tool for retrieving spatial data is becoming increasingly popular
(Artem 2000), allowing the transfer of certain portions of GIs technology from the
desktop into the users' hands. Sketch-based query systems on PDAs promise to be an
appropriate approach for easy access to spatial data resources in mobile environments.
Users who want to use their PDAs as spatial-query-by-sketch interfaces, however, cannot
do that easily, because of restrictions such as complex interfaces, and limited bandwidth.
This thesis attempts to answer question arising in this context. The following sections
describe the goal, the approach, key research questions, and the hypothesis of this thesis.
1.2.1 Goal
The main goal of this thesis is to extend the theoretical foundation of sketch-based
querying (Blaser 2000; Egenhofer 1996) from static to mobile environments. In this
context we want to demonstrate the suitability of PDAs as appropriate tools to perfonn
geo-mobile queries. Another goal of this thesis is to investigate the interplay between
mobile clients, wireless networks, and static servers, and prove the practicability of
Spatial-Query-by-Sketch (Egenhofer 1996) in dynamic use configurations. We
investigate the relationship between response times, file size of the sketch to be

transmitted, and the available bandwidth, in order to guarantee usability of such
applications in mobile environments. Finally, we propose a client-server architecture that
supports application adaptation in order to overcome the limitation of mobile
environments.
1.2.2 Approach
Client-server architectures in mobile environments differ from the classical, wired
architectures in many aspects (Satyanarayanan 1996a). Hence, the first phase of this
thesis is concerned with identifjring constraints of mobility that affect both system and
user behavior, so that properties of geo-mobile query systems can be defined. In the
second phase, these properties are applied to designing adaptive client-server architecture
that allows efficient geo-mobile querying of spatial data under varying conditions of the
mobile environment.
Adaptation in a mobile client-server environment consists of three main steps: (1)
resource monitoring, (2) an adaptation strategy, and (3) the adaptation process (Katz
1994). Resource monitoring is concerned with identifjring vital resource parameters for
the application, while the adaptation strategy defines how these parameters influence
adaptation for a specific system. Finally, the adaptation process controls the functionality
of the application. Adaptation includes both the client and the server; therefore, we use a
mobile sketch for guiding the adaptation process. The mobile sketch propagates the level
of adaptation from the client to the server and contains a symbolic representation of the
sketched scene, which is used for completion of the query process.

1.2.3 Research Questions and Hypothesis
Wireless communication promises unrestricted mobility and ubiquitous access to data
anytime. This promise, however, requires a suitable infrastructure in terms of mobile
devices, wireless networks, and sophisticated applications. Visual query techniques
promise to be an efficient way to enhance interaction in mobile GIs environment.
Specifically, the research focus is on sketch-based queries and mobile client-server
architectures. This combination raises several key questions for this thesis:
Question 1 : What are the challenges imposed by mobility on the development of a geo-
mobile query system?
We are interested in the combination of mobile technology and visual query
techniques for GISs. Which factors that influence sketch-based querying in mobile
environments? How do these factors influence user behavior? What are appropriate
strategies to overcome these challenges? These questions are relevant, because they help
us understand the complexity of geo-mobile information retrieval systems.
Question 2: How to separate concerns of geo-mobile query systems in mobile GIs
environments?
Separation of concerns is an important aspect in software engineering, especially
when dealing with complexity (Ghezzi et al. 199 1; Gruia-Catalin et al. 2000). Concerns
allow us to break a system down into manageable pieces that can be investigated
separately. Other important issues that can be alleviated by separating concerns are such
questions as: What functionality needs to be allocated to what host? What parameters are
important to adapt applications to the mobile environment?

Question 3: How to eflciently condense a spatial sketch in adaptive client sewer
architectures?
We are investigating characteristics of digital sketches in mobile environments in
order to determine integral properties of geo-mobile query systems. Which tasks do users
perfonn during the query process, in order to assemble a typical sketch for a spatial query
statement? What are the specific processes that require server support? These questions
are relevant, because their answers may influence the way the application adapts to the
mobile environment, or the configuration of mobile spatial query systems, or the
dependence of user modalities on the application's context.
Question 4: How can we ensure efficiency of geo-mobile queries in terms of response
time?
Response time is crucial to guarantee usability of any application. Nielsen (1994)
defines the standard guidelines for response times as: (1) instantaneous response time, ( 2 )
response time for uninterrupted flow of thought, and (3) response time for keeping the
user's attention. The instantaneous response time is 0.1 seconds, which is the limit for
having the user feel that the system is reacting instantaneously. The limit for the user's
flow of thought to stay uninterrupted is about 1.0 second. Even though users will notice
the delay, they do not lose the feeling of operating directly on the data. The response time
for keeping the user's attention is about 10 seconds. For longer delays, users will want to
perform other tasks while waiting for the computer to finish. These standard guidelines
define a framework that allows designing strategies that ensure usability of geo-mobile
query applications.

These questions confirm that finding methods that adapt query systems to the
mobile environment is necessary. Furthennore, partitioning the hctionality without
decreasing expressiveness and clarity of the query statement is an important foundation
for a geo-mobile information retrieval system. Consequently, the hypothesis of this thesis
is:
In order to guarantee the typical expectation on response time (i.e.
approximately 10 seconds) with today S common wireless bandwidth (i.e.,
20 Kbps) one needs to choose the lowest representation for transmitting
the mobile sketches.
1.3 Intended Audience
The intended audience of this thesis is any researcher or software developer interested in
the design of mobile geographic infom~ation retrieval systems that utilize multi-modal
query techniques, especially those interested in sketch-based techniques. The thesis may
also be of interest to a more general audience, including geographers, GIs professionals,
software developers, and database researchers, since it discusses the challenges
associated with the development of mobile GISs.
1.4 Organization of Thesis
This thesis first identifies the problem and then attempts to provide answers to the
research questions postulated in Section 1.2.3. The remainder of the thesis is organized as
follows:
Chapter two reviews mobile computing and describes the difficulties related to the
transition of GISs from the desktop into the users' hands. The first part discusses current

PDA technology and its typical characteristics, while the second part sheds light on
current research in the field of client-server computing for mobile environments. This
discussion shows that the transition of sketch-based querying from static to mobile
environments is not straightforward and that the design of geo-mobile applications is
influenced by many factors.
Chapter three defines a set of guidelines for geo-mobile querying based on methods
of separation of concerns, namely functional and non-functional partitioning. These
guidelines provide the base for answering the question of what type of functionality
should be assigned to what host. We propose an adaptive architecture that supports the
specific requirements of sketch-based geo-mobile querying. In addition, we introduce the
mobile sketch, an abstraction of the digital sketch (Blaser 2000) that supports adaptation.
Finally, we discuss the adaptation strategy, involved parameters, and the adaptation
algorithm.
Chapter four evaluates the model proposed in chapter five in terms of a
transmission cost analysis. For this purpose, typical properties of a digital sketch are
discussed and the communication network is analyzed. Based on these findings, a set of
three sketches is defined. The three sketches serve as basis for investigations related to
the file size of mobile sketches at different levels of representation, and the resulting
transmission cost. Finally, the results are interpreted, and an attempt is made to optimize
the adaptation strategy of the mobile client.
The fifth chapter discusses user interface design for portable devices and the issues
involved, including hardware resources, human-machine fit, and workflow patterns. The
discussion is focused on design issues for sketch-based user interface. Next, the chapter

provides a comparison of user modalities in geo-mobile environments, and explores
important interface components associated with geo-mobile information retrieval
systems.
Chapter six summarizes the findings of this thesis, draws conclusions and presents
further research directions.

Chapter 2
MOBILE COMPUTING
When users move, they do not want to unplug their computer from some local area
network, transport it, and plug it back to the local area network at their destination.
Instead, they want to rely on wireless network communication that provides the ability to
retain network connection even while moving. This paradigm is called mobile or
nomadic computing (Cappelletti 1998). In the recent past, technical advances in wireless
communication provided the basis to expand GIs technology to handheld devices, such
as personal digital assistants.
Although traditional GIs technology is well suited for desktop workstations, it is
not well suited for handheld computing devices. This is because the usability of
traditional GISs depends on characteristics of desktop computers, such as their relatively
large user interfaces (e.g., displays, keyboards, pointing devices), considerable computing
resources (i.e., CPU, memory, storage, operating systems), and high bandwidth network
connectivity. Small devices possess few of these characteristics. While processor speed
and memory increase steadily, other characteristics cannot be improved and will always
remain a challenge. For instance, the small physical size of PDAs limits the maximum

size of their screens, which can be no larger than the dimensions of the machine in which
it is embedded.
The remarkable growth of the personal digital assistant market over the past five
years shows that people are willing to adapt to physical limitations of portable devices, in
the hope for unrestricted mobility (Wakley 2001). Small portable devices are growing in
popularity as GIs information terminals, and users except to be able to access and
interact with the same functionality available at their desktops. Hence, designers must
consider how to bridge the feature gap between desktops and handheld devices. The
following sections describe some of the issues associated with handheld technology and
mobile GIs.
2.1 PDAs
Palmtop devices are designed with the high-level goals of mobility, wearability, and
simplicity. To achieve mobility and wearability means to restrict the device to a certain
size, which, in turn, affects simplicity. For instance, input devices, as we know them from
desktop environments (e.g., keyboard, mouse), are not available on PDAs, simply
because their physical size would severely restrict wearability and mobility. Instead, most
PDAs have a pen, a touch-sensitive screen, and a set of hardware buttons that allow input
generation.
Some PDAs rely on miniaturized QWERTY keyboards (Webopedia 2001), which
are either implemented with the hardware or as part of the operating system utilities.
Christopher Shole invented the QWERTY keyboard more than 130 years ago in an
attempt to slow down typing, and thus reducing jamming among the hammers of the
typewriters (Diamond 1997). The miniaturization process of handheld devices made
typing even more difficult and slower. To alleviate data input some companies came up
with detachable, foldable keyboards, which can be attached to the PDA, and allow typing
in a desktop-like fashion.
The newest generation of detachable keyboards uses laser technology to project a
virtual keyboard on a surface (Hewett 2002). This technique avoids that the user has to
carry the keyboard, however, using such accessories requires a static user configuration.
For instance, users need to put the PDA down on a table or a desk and attach or project
the keyboard before they can start typing. It is obvious that this technique restricts the use
of PDAs to a certain range, and is therefore not appropriate for tasks that require a high
degree of mobility.
Another input technique often used on PDAs is handwriting recognition.
Handwriting recognition has its own set of drawbacks. For instance, each individual user
has a very unique writing style and look, which requires advanced recognition algorithms
for accurate interpretation of inputted text. The small form factor of PDAs restricts the
available writing space too, which makes it difficult to enter text as phrases or whole
sentences. An alternative solution to handwriting is Graffiti (Palm 2001). The basic
principle of Graffiti is that instead of having the PDA learn how users write, users must
learn how to write in a shorthand alphabet that simplifies each letter and makes them
more distinguishable from one another. Users then input text one letter at a time. Thus
there is no need to provide space to write sentences or even complete words.
The easiest form of human information transfer is speaking. The future of PDA
input may be speech recognition software. But speech recognition comes with its own set

of problems. For instance, how would PDAs identify its owner's voice among all the
noise created in a busy street or in a shopping mall? Unlike cell phones, which basically
just transmit detected vibrations in the air from point A to point B, and leave the
processing of the signal to the user at point B, PDA applications have to make sense of
the input. Nevertheless, talking is more natural than writing, and the ever-increasing
processing power and memory of PDAs will allow integrating sophisticated and reliable
speech recognition software, which support user specific speech recognition.
2.1.1 Screen Real Estate
The operating systems for most popular PDAs (i.e., Palm OS, Windows CE) rely on
Graphical User Interfaces (GUIs). Graphical interaction is characterized by its use of
space; GUIs organize infonnation over the screen area, so that the focus of action and
attention can move around the screen from place to place or can even be in multiple
places simultaneously.
The use of two-dimensional interaction instead of a command line, makes it
possible to exploit further areas of human ability as part of the interactive experience,
including peripheral attention, pattern recognition and spatial reasoning, information
density, and visual metaphors. Although newer PDA displays have high resolutions and
color support, the limited screen size still remains. The lack of screen space requires
implementation of new methods to enhance usability and screen readability.
One technique to improve usability focuses on making interaction more efficient by
using sonically enhanced buttons. The underlying hypothesis is that presenting
infonnation about buttons in sound increases their usability and allows their size to be

reduced (Brewster 2001). Future research needs to investigate ways to exploit human
abilities and enhance user interaction with small screen devices.
2.1.2 Battery Life
Mobile appliances rely on a finite energy source, usually a battery. The weight and the
volume of the battery determine its lifetime. A rule of thumb for the endurance of a
battery that bases on current technology is that one pound produces approximately 20
Watt-hours (Jones et al. 2001). Hence, the simplest solution to increase the lifetime of a
battery is to increase the size of the battery. Increasing the size, however, means
increasing the weight of the handheld device, which, in turn would compromise
portability.
Another solution to this dilemma is to minimize the power consumption. In order to
minimize the power consumption, we need to understand what parameters influence it.
Power consumption (P) on the computational level is dependent on three factors: the
Capacitance (C), the Voltage (V), and the Clock Frequency V), and is defined as
P = C v 2 f ( F ~ M and Satyanarayanan 1999; Katz 1995). Lower power consumption is
achieved by reducing any of the factors: C, V, or f: Reducing C, and V results in
hardware design changes (e.g., semiconductors, integrated circuits, transmission
modules) that influence users indirectly, since the perceived performance of the handheld
is still the same. Reducing the clock frequency, in contrast, influences the processing
power and, hence, has direct influence on the way users perceive performance.
Figure 2.1 shows the processor performance and energy consumption for three
portable devices currently available (i.e., Palm Xc with 33MHz, PocketPC with 233MHz,
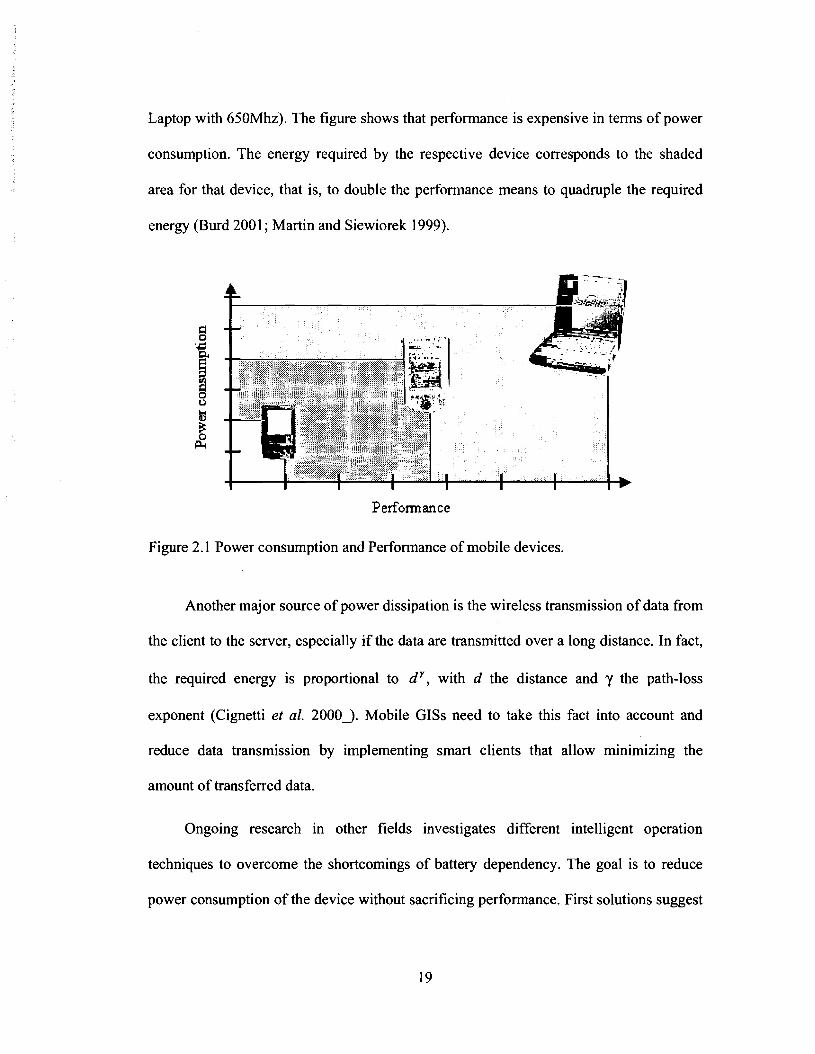
Laptop with 650Mhz). The figure shows that performance is expensive in terms of power
consumption. The energy required by the respective device corresponds to the shaded
area for that device, that is, to double the performance means to quadruple the required
energy (Burd 200 1 ; Martin and Siewiorek 1999).
Perform an c e
Figure 2.1 Power consumption and Performance of mobile devices.
Another major source of power dissipation is the wireless transmission of data from
the client to the server, especially if the data are transmitted over a long distance. In fact,
the required energy is proportional to d Y , with d the distance and y the path-loss
exponent (Cignetti et al. 2000J. Mobile GISs need to take this fact into account and
reduce data transmission by implementing smart clients that allow minimizing the
amount of transferred data.
Ongoing research in other fields investigates different intelligent operation
techniques to overcome the shortcomings of battery dependency. The goal is to reduce
power consumption of the device without sacrificing performance. First solutions suggest

techniques such as the use of directional and smart antenna arrays, operations at lower
signal-noise ratios, or clock frequency adaptation to task requirements (Rabaey 200 1).
2.1.3 Wireless Communication
Spatial data are characterized by the vast amount of storage space it requires. Therefore,
GISs rely on one or more databases, which allow centralized storage and provide easy
access as well as management facilities. While stationary GIs workstations use wired
networks to access these repositories, mobile GISs require wireless networks. Although
wireless networks currently offer low bandwidth, third generation wireless technology
(i.e., UMTS) promise larger bandwidth, from which mobile GIs could benefit (Walkley
2001).
Wireless communication faces more obstacles than wired communication, which
lead to several problems (Imielinski and Badrinath 1994; Porta et al. 1996;
Satyanarayanan 1996a). The three major problems are low bandwidth, frequent
disconnections, and higher security risks. For instance, wireless networks communicate
by modulating radio waves, and are linked to the wired network infrastructure by
stationary transceivers. As the signal travels from the transceiver to the mobile client, it
interacts with the surrounding environment, which results in lower bandwidth, higher
error rates, and more frequent disconnections. These factors can in turn increase
communication latency resulting from retransmissions, retransmission time-out delays,
error control protocol processing, and short disconnections.
As can be seen from this example, mobility increases tensions between autonomy
and interdependence. On the one side we have the resource poorness of mobile devices,

which argues for reliance on static servers, and on the other side we have the dynamic
property of the device and unreliable networks, which argue for self-reliance. As a result,
mobile GIS clients need to be adaptive and balance concerns, in order to achieve optimal
usability and performance. The challenge for designers of mobile GIS applications is to
figure out what functionality is required where, and what adoption routines are necessary
to perform specific tasks.
2.2 Client-Server Computing in Mobile Environments
Client-server computing in mobile environments typically involves a wireless medium
and two distinct types of hosts: a mobile host and afixed host (Figure 2.2) (Pitoura and
Bhargava 1994; Satyanarayanan 1996a). The fmed host communicates with the mobile
host through a wireless interface that is provided by a base station. The geographical area
covered by a base station is called a wireless cell. As users move around, they are likely
to move from one wireless cell to another. The process during which a mobile host enters
a new cell is called hand-ofl
n Wireless cells .- ___--- -/-
~ - - -- -- --.
Mobile H O S ~ , ,
0 L I I
! - Base Station 1
Figure The mobile environment.

2.2.1 The Wireless Medium
The two main types of networking infrastructure that enable mobile computing are
terrestrial cellular networks and satellite networks (Brewer et al. 1998; Cooper 1996).
While the growth in physical network bandwidth has been tremendous, technology for
wireless communication achieves only a fraction thereof (Satyanarayanan 1996a).
Frequent disconnections, a much greater variation in bandwidth, and areas without
coverage characterize wireless communication (Pitoura and Bhargava 1994; Rao 2000).
The much greater variation in network bandwidth leads to different degrees of
connectivity. For the purpose of this overview, we distinguish three connection levels:
connected, disconnected, and weakly connected.
The level of connectivity is determined by the available bandwidth. Disconnections
and weak connections occur frequently in wireless networks. While disconnections in
wired networks are treated as failures, mobile hosts should be able to operate even under
low or no connection with the fvted network. This requires the host to adapt to the
available bandwidth by adjusting the available functionality. The transitions between the
different states are based on a set of protocols, which includes a connection protocol, a
weak connection protocol, and a disconnection protocol. The states, the transitions
between the states and the supporting protocols are depicted as an activity diagram in
Figure 2.3.

Figure 2.3 States of a mobile host and transition operations between the states.
The connection protocol is executed when the connection with the server is fully
re-established and the application resumes normal operation mode. The weak connection
protocol is executed before the connection changes to weakly connected. The weak
connection protocol configures the application to restrict network traffic to a minimum.
Finally, the disconnection protocol is executed before the mobile host is detached from
the server. The set of protocols prepare the application for bandwidth changes by
adapting the available functionality. This approach supports smooth workflow and finally
leads to a gain in performance.
2.2.2 The Mobile Host
The range of mobile hosts for sketch-based queries includes PDAs (e.g., the Palm series
or PocketPC), palmtop computers (e.g., HP Jornada or Psion) with wireless interfaces,
and cell-phone-like devices with touch-sensitive screens (e.g., Nokia Communicator).
Mobility imposes several constraints on these mobile hosts. The most prominent impacts
are the small size, the limited screen real estate, the currently finite source of energy, and
the higher degree of vulnerability (e.g., loss, damage, or theft). Furthermore, the physical
characteristics of mobile devices require a miniaturization of the hardware components,
which in turn leads to limited processing power. Regardless of future technology
advances, mobile hosts will always have limited resources compared to static hosts
(Satyanarayanan 1996a).
A mobile host may assume different roles in a client-server environment. One
extreme is to design it as a "dumb terminal" that only supports a user interface but no
application logic. The other extreme is to design it as a relatively independent component
with enough intelligence to perform part of the computation locally on the client. Both
approaches have benefits and disadvantages. For instance, a "dumb terminal" offers
lower costs in terms of power consumption for computations, but higher costs in terms of
power consumption for the communication with the fixed host as virtually all input needs
to be transmitted over the wireless network. The second approach supports autonomous
operations during partial and total disconnections, which limits bandwidth use, but
complicates data replication and preservation of integrity between the two entities.
Allowing a mobile host to operate partly autonomously leads to reduced communication
between fixed and mobile host, which is crucial considering the finite energy source and
the frequency of disconnections.
Mobile client-server-based applications often rely on information about their users
to optimize processing. For instance, information systems use personal information to
determine which data to cache before disconnection. The personal information about
users is typically stored in a user profile. The user profile may include personal settings

and preferences, as well as information about usage and mobility patterns. As a result, the
user profile may convey infonnation that can be used to derive the context for specific
applications, or adaptation of architectural strategies. For instance, in infonnation
retrieval systems, user profiles may be utilized to govern and optimize the querying
process.
2.2.3 Paradigms of Mobile Client-Server Computing
Research on mobile client-server computing focuses on three distinct categories whose
paradigms can be categorized into mobile-aware adaptation, extended client-server
model, and mobile data access (Jing et al. 1999). The following sections briefly examine
the nature of each paradigm and the benefits of the various techniques with respect to
sketch-based queries.
2.2.3.1 Mobile-Aware Adaptation
The circumstances of a mobile client operating in a wireless network change frequently.
As a result, clients often face wide variations in network conditions and local resource
availability when accessing data remotely. The variation of conditions intensifies the
tension between autonomy and interdependence that is characteristic of all distributed
systems. In order to balance the tension between client and server in mobile
environments, systems and applications are required to adapt to the dynamics of the
mobile environment and the limitations of mobile computing resources (Katz 1994). The
set of strategies and techniques that mobile systems use to adapt to the properties of
mobile environments are covered by the paradigm of mobile-aware adaptation (Jing et
al. 1999).

In Satyanarayanan (1996b), the range of mobile aware adaptation is delimited by
two extremes (Figure 2.4). At one extreme, adaptation is entirely the responsibility of
individual applications. This approach is called laissez-faire adaptation, which
essentially means that applications avoid the need for support from the operating system.
This approach, however, lacks a central negotiation unit to resolve incompatible resource
demands of different applications. The other extreme is called application-transparent
adaptation and places the entire responsibility for adaptation on the operating system.
This approach is backward compatible with existing applications since the applications
work in mobile environments without any modifications. The system functions as central
unit for resource negotiation and control. Yet, this approach has the shortcoming that in
some situations the adaptation by the system may be inadequate or counterproductive.
Laissez-faire (no system support)
Application-transparent (no changes to applications)
Figure 2.4 Range of mobile-aware adaptation strategies.
Application-transparent adaptation strategies are typically employed to hide mobile
issues from applications and to emulate services (i.e., file server, web server, etc.) on the
mobile computers. Such architectures usually involve a local proxy that runs on the
mobile host and provides an interface to regular server services to the application. The
role of the proxy is to alleviate undesirable effects caused by the mobile nature of the
working environment. A file system proxy, for instance, may be used to make existing
applications work with no modification in mobile environments. The proxy logs all

updates to the file system during disconnections and replays the log on reconnection.
Similarly, a local web proxy may enable Web browsing applications to function over
wireless links without imposing changes on browsers and servers. Web pages can be pre-
fetched and cached on the mobile host in order to support disconnected browsing.
The range between the two extremes (i.e., laissez-faire and application-transparent
strategy) is referred to as application-aware adaptation. Application-aware adaptation
consists of a spectrum of collaborative solutions between applications and the operating
system. These solutions support a partnership between applications and system that
permits applications to determine the best adaptation for a given set of properties of the
mobile environment, while still preserving the ability of the system to monitor resources
and enforce allocation decisions.
The central aspect of application-aware adaptation is that applications can react to
changes of the mobile resources. One way to realize the application-aware adaptation is
through reciprocal assistance between the system and individual applications. The system
monitors resource levels, notifies applications of relevant changes, and enforces resource
allocation decisions. The application, on the other hand, decides how to best adapt when
notified. For instance, a video player application may implement adaptation by scaling
back quality (e.g., resource consumption) if the application performance is poor.
Application-aware adaptation may appear in three different flavors, which can be
characterized based on where the adaptive application logic is located. The first approach
is called client-based adaptation and allows the application on mobile clients to react to
the resource changes. The second approach is labeled client-server application
adaptation, which means that both client and server might host applications that can

adapt to the changes. While the first two solutions distribute the task of adaptation
between client and server, the last approach utilizes a proxy server that is located in the
fixed network to support application specific adaptation. This approach is called proxy-
based application adaptation. Application-specific proxy servers have been used as
mediators between existing servers and heterogeneous mobile clients (Brewer et al. 1998;
Brooks et al. 1996; Jing et a1. 1999). In addition, proxies in fixed networks can perform
aggressive computation and storage on behalf of mobile clients.
Client-based application adaptation, client-server application adaptation, and
proxy-based application adaptation can be complementary for a client-server information
system. For instance, client-based application adaptation and proxy-based application
adaptation can be used together in a single infonnation retrieval system. This approach
has the ability to deal with issues imposed by mobility, while simultaneously providing
the means to deal with intrinsic characteristics of information systems, such as processing
memory-intense queries.
2.2.3.2 Extended Client-Server Model
The second paradigm of mobile client-server computing is called the extended client-
server model. This paradigm characterizes the impact of mobile computing constraints by
examining their effects on the classic client-server model. Infonnation systems based on
the client-server model rely on a server that holds a complete copy of one or more
databases. Clients can access data on any server with which they can communicate. A
fundamental assumption of the client-server model is that the locations of clients and
servers do not change, that the connection is pennanent, and therefore communication is

ensured at all times. Consequently, the functionality is statically partitioned between
client and server (Figure 2.5) (Satyanarayanan 1996b).
Mobile Fixed Host Network
Figure 2.5 The classic client-server model.
The classic client-server model does not provide the means to cope with the
constraints of mobility. For instance, the resource limitations of clients may require
certain operations normally performed on the client to occasionally be performed on
resource-rich servers. Conversely, the need to cope with uncertain connectivity may
require clients to sometimes emulate the hnctions of a server. As a result, the distinction
between clients and servers may have to be temporarily distorted. This requirements lead
to the extended client-server model, whose principle is visualized in Figure 2.6.
Mobile Host
Figure 2.6 The extended client-server model.
Fixed Network
The extended client-server model can be implemented in different ways. An
extreme case is called the thin client architecture. This approach transfers most

application logic and functionality from clients to stationary servers. In the thin client
architecture, applications in stationary server are usually mobile-aware and optimized for
mobile client devices. This architecture is especially suitable for dumb ternlinals or small
PDA applications. The other extreme case is a full-client architecture, which means that
the client emulates server-functions and, therefore, is able to minimize the uncertainty of
connectivity and communications.
The approach that unites the two extremes is called flexible client-server
architecture. The great advantage of the flexible client-server architecture is that the roles
of clients and servers and application logic can be dynamically relocated and performed
on mobile and stationary hosts. A central aspect of any flexible client-server architecture
is the use of mobile objects, also known as mobile agents. Mobile objects are roaming
entities that enable client functions to run not only on mobile hosts, but also on stationary
hosts. Equally, mobile hosts may download server code and execute it locally. Flexible
client-server architectures are appropriate for settings that require minimal bandwidth
consumption since it has the ability to dynamically distill and refine application data.
2.2.3.3 Mobile Data Access
Mobile data access enables the delivery of server data and the maintenance of client-
server data consistency in a mobile and wireless environment. Ongoing research
investigates strategies and techniques to ensure efficient and consistent data access
despite the limitations of wireless enviromlents, such as weak connectivity and resource
constraints. These strategies can be characterized by delivery modes, data organizations,
and consistency requirements. Among the proposed strategies for mobile data access are
concepts like server data dissemination by broadcasting disks (Acharya et al. 1995;

Inlielinski and Badrinath 1994), and client cache management using automated hoarding
(Kuenning and Popek 1997).
The main purpose of mobile data access strategies is to deliver data hosted on
servers to mobile clients. Consequently, applications based on mobile data access
strategies typically implement mobile awareness using application-transparent strategies.
This approach is based on the fact that if data are available on the client, there is no need
to change the application, which consequently leads to the application-transparent
approach.
Despite the fact that mobile data access strategies may well be a viable strategy for
sketch-based querying, some serious issues remain. The most prominent issue is that
processing sketch-based queries is a CPU-intense task, which advocates for server
support. Mobile data access strategies have the goal to ensure client-server data delivery
and consistency and, thus, enable applications to work without server support. Another
major concern is the vast amount of data, which is an intrinsic characteristic of
geographic information systems. The cost to transfer spatial data fiom the server to the
client exceeds the costs of transferring the query statement to the server and the results
back to the client by far. As a result, mobile data access strategies cannot be considered
an appropriate approach for spatially based mobile infonnation retrieval systems.
2.3 Summary
Mobile appliances and wireless technology allow people to access infonnation, including
spatially based infonnation, anytime anywhere. Mobile computing inherently poses some
interesting challenges in ternls of hardware resources. For instance, keyboard and mouse

are not available as input devices anymore, and thus, alternative methods need to be
implemented. Other central challenges are the limited screen real estate, the battery
dependency, and wireless communication. In addition, the classic client-server model as
applied in wired networks needs to be adapted in order to cope with the scarce resources
of mobile equipment and peculiarities of wireless networks. This chapter reviewed client-
server computing in mobile environments, discussing possible architectural strategies and
their advantages and disadvantages. The combination of mobile technology, wireless
communication and sketch-based query interfaces unites both mobility and increased
input bandwidth. Hence, this concept is the method of choice for querying spatial
information in mobile environments.

Chapter 3
AN ARCHITECTURE FOR GEO-MOBILE QUERYING
The software architecture of a program or computing system is the structure or structures
of the system, which comprise software components, the externally visible properties of
those components (i.e., the user interface), and the relationships among them (Bass et al.
1997). The design of architectures for geo-mobile applications may be described as the
challenge to unite two domains that are based on opposite principles. On one hand, we
have the handheld device with its limited resources (i.e., energy supply, CPU, memory),
while on the other hand, we have the vast amounts of spatial data that inherently require a
powerful processing infrastructure. A typical approach to solve this problem is to
implement client-server architectures that partition user interface, data structures, and
logic layers among the components of the system. This concept provides flexible options
for deploying back-end content with resource-poor front-end mobile devices.
This chapter introduces the concepts of separation of concerns, emphasizing the
sketching process and the processing of the query. An important issue in this context is
the question of which type of functionality should be assigned to which host. The
resulting considerations establish the basis for a set of design guidelines for geo-mobile
client-server architectures. In the following section we propose an adaptive architecture

that supports the specific requirements of sketch-based geo-mobile querying and
introduce the mobile sketch as the technique of choice for adaptation. Finally, we discuss
the adaptation strategy, involved parameters, and the adaptation algorithm.
3.1 Guidelines for Geo-Mobile Querying
In order to successfully design and implement software systems, it is important to
understand the complexity of the application in terms of its vital parts (i.e., system
components, data flow, user interaction, communication with other parts). Classic
software engineering attempts to overcome this complexity by applying the principle of
separation of concerns. Separation of concerns is a key aspect in software engineering
and refers to the realization of system concepts as separate units (Ghezzi et al. 1991).
Concerns are the primary motivation for organizing and decomposing software into
manageable and con~prehensible parts. Many kinds of concerns are relevant at different
stages of the software lifecycle. For instance, abstraction is a special case of separation of
concerns that separates important aspects from unimportant aspects, which is of major
importance throughout the whole development process. If we combine concerns we are
unable to overcome the complexity of the global problem. Separation of concerns results
in separation of responsibilities in dealing with separate issues. This approach allows
defining distinct modules, plus the interface between them.
The development of the geo-mobile query system follows a bottom-up approach.
We first deal with the details of each module, then combine the modules to one coherent
system. The objective is to create a system with high cohesion inside the modules and
low coupling between the modules. Cohesion describes the interaction within a module,
while coupling refers to the interaction among the modules. For our geo-mobile query
application, this approach translates into a system that reduces transmission between
client and server due to high cohesion of the single modules and low coupling among the
modules.
Partitioning application functionality and structure separation across wireless
networks can be achieved on different ways. For instance, the parts of the system can be
separated in size, which allows placing large modules on according entities. We focus the
partitioning of the system on two view-based factors, namely functionalpartitioning, and
non-functional partitioning.
Functional and non-functional explicitly separates between what depends on the
changing environment, and what does not. In order to design adaptive system
architectures, it is necessary to compose the different concerns together. By making this
composition process aware of the evolutions of the environment, the application resulting
from the composition is always adapted to its environment (David and Ledoux 2002).
3.1.1 Functional Partitioning
Functional partitioning is the process of deconlposing the application's functionality into
non-divisible pieces, called functional objects, and to allocate the objects to system
components (Satyanarayanan et al. 1995). The goal of this technique, is to decompose the
system in a small number of objects so that size and perfonnance can be balanced among
the system's components. A small number of objects results in better system performance
due to reduced communication. The process consists of three steps (Figure 3.1). First, the
tasks that the system is to perform are specified. In the second step, the specification is

decomposed into functional objects. The third step allocates functional objects onto
system components.
Specification Abstraction Level
Granularity
, . -. . - . , . . . - -, 1 0o i 6' 11 System-Components Allocation ...... I L ......
Figure 3.1 Partitioning functionality.
The tasks of the Spatial-Query-by-Sketch system are specified in Egenhofer (1996)
and Blaser (2000). For our purpose, we desist of the system-allocation step of the
functional partitioning process and replace it with the data flow and control flow analysis, '
that is, we merely use functional partitioning to define the modules (i.e., functional
objects) of the system at a high level. This approach supports allocation of functionality
to system components based on interaction and communication, which is an important
aspect of mobile client-server applications (Imielinski and Badrinath 1994). The granular
objects are sketch parsing, object processing, digital sketch generation, and query
processing (Figure 3.2).
Client . il -I
Server Side
Figure 3.2 The functional objects.

3.1.1.1 Data Flow
The purpose and value of the data flow analysis is primarily data discovery, not process
mapping (Gane and Sarson 1979; Marco 1978). The results of a data flow analysis are
manifold and provide a hierarchical breakdown of the system. It shows movement of
infonnation at a high level between a system and its environment, as well as data
movement at a lower level between the individual modules of the system. The main
objective of the data flow analysis of Spatial-Query-by-Sketch is to document how
infonnation flows within the system and to define the boundaries of the single modules of
the system in order to design a plan on how to partition the client and the server.
The main purpose of the first functional object, sketch parsing, is to generate a
simplified stroke from the user input. This operation reduces the amount of data, and
consequently the costs of transmission. Therefore, it needs to be located on the client and
a data flow analysis becomes needless.
Guideline I : Sketch parsing is a highly interactive task that simplijies user
input and reduces the amount of data. As a result, sketch parsing
is assigned to andpeflormed on the mobile client.
Similarly, the purpose of the query-processing object is to assess the similarity
between the digital sketch and a set of sketches in the database. Query processing is a
CPU- and memory-intense task that necessitates according infrastructure.
Guideline 2: Query processing requires only limited user input, but extensive
communication with the database containing the data set, as well

as comprehensive resources in terms of CPU and memory.
Consequently, it is allocated to the server.
These considerations leave two functional objects left for the data flow analysis,
that is, the object processing and the generation of the digital sketch. The simplified
strokes from the sketch parser are the input for the second functional object, the object
processing. The object processing analyses the stroke and yields a command that is
instantly executed, or a data object (i.e., ASCII text, symbol, line, or region) that is added
to the digital sketch (Figure 3.3). In addition, the process extracts the kernel and
centerline of the objects and adds them to the digital sketch. Kernel and centerline are
vital components of the digital sketch and are needed during the evaluation of the spatial
relations (i.e., topology, direction, and metric), as well as during the query processing.
Figure 3.3 Data flow for object processing.

The second functional object that is relevant for the data flow analysis is the
generation of the digital sketch (Figure 3.4). The first step in this process generates the
association graph that defines the set of binary spatial relations among the sketched
objects. The association graph generation is a computing intense task and the resulting
binary relations together with the contained information (i.e., topology, direction, and
metric) attribute considerably to the digital sketch in tenns of memory consumption. A
large digital sketch results in increased traffic between client and server, and thus
contradicts the general principle of reducing data flow between the two parties. This
observation advocates placing the generation process for the digital sketch on the server,
if the available resources on the mobile client are insufficient.
Guideline 3:
- - i
\) ( Region --
1 . I -
- - - I '
i
Object processing and the generation of the association graph
are tasks that may be dynamically allocated to client or sewer.
Therefore, a collaborative mobile-aware adaptation strategy is
suitable as system architecture.
(Metric ?
' ( Binary ( Relations , + Sketch Legend:
Data Object
0 DataProcess - Data Store
Figure 3.4 Data flow for the generation of the digital sketch.

The data flow analysis produces a coarse plan on how to map the functional objects
onto system components (Figure 3.5). The first important discovery of the analysis is that
two functional objects, sketch parsing and query processing, need to be assigned to the
client and to the server, respectively. The second discovery is that the two other
hc t iona l objects, the object processing and the generation of the digital sketch, are
responsible for data exchange between client and server and need to be carefully
partitioned.
Client
Server Side
Figure 3.5 Allocation of functional objects to system entities.
In order to glue the functional objects together in a distributed system, an efficient
data exchange mechanism is required. This mechanism and the refinement of the function
allocation are investigated in the next section, based on a control flow analysis.
3.1.1.2 Control Flow
Control flow governs the way different activities are synchronized in the system. The
flow of control within the system can be derived from interaction diagrams, such as
sequence diagrams or collaboration diagrams defined in the Unified Modeling Language
(UML) (Lau 2000; Rumbaugh et al. 1998). These diagrams represent control flow as

directed graphs and inform about the messages that are exchanged between the
controlling entities.
Control flow analysis determines input parameters and involved parties at different
stages. Based on the findings of the analysis, the functionality can be partitioned between
client and server. However, it is impossible to model all interactions within a system
(Rumbaugh et al. 1998), and therefore, the focus is on the modeling of the central
interactions or interactions that shed light on the important aspects of the system.
The sequence diagram in Figure 3.6 shows the controlling entities in the sketch-
based query process (i.e., user, sketch parsing, object processing, digital sketch
generation, and query processing unit). The focus is on the object processing and the
generation of the digital sketch. The diagram shows that, once the sketched objects
correspond to the spatial scene in the user's mental model, interaction is basically
reduced to adjusting query-processing parameters. For instance, the user may adjust the
relevance of a specific binary relation, or the weights for the characteristics of the
similarity assessment process (i.e., completeness, geometry, topology). These parameters
are set by the user on the client, and influence processes that are performed by the system
on the client and on the server. As a result, they need to be part of the data transmitted to
the server.
Guideline 4: Users control object processing and the generation of the
association graph at different levels. As a result, a user profile
and the preferences for the query processing need to be
transmitted to the server along with the sketched objects.
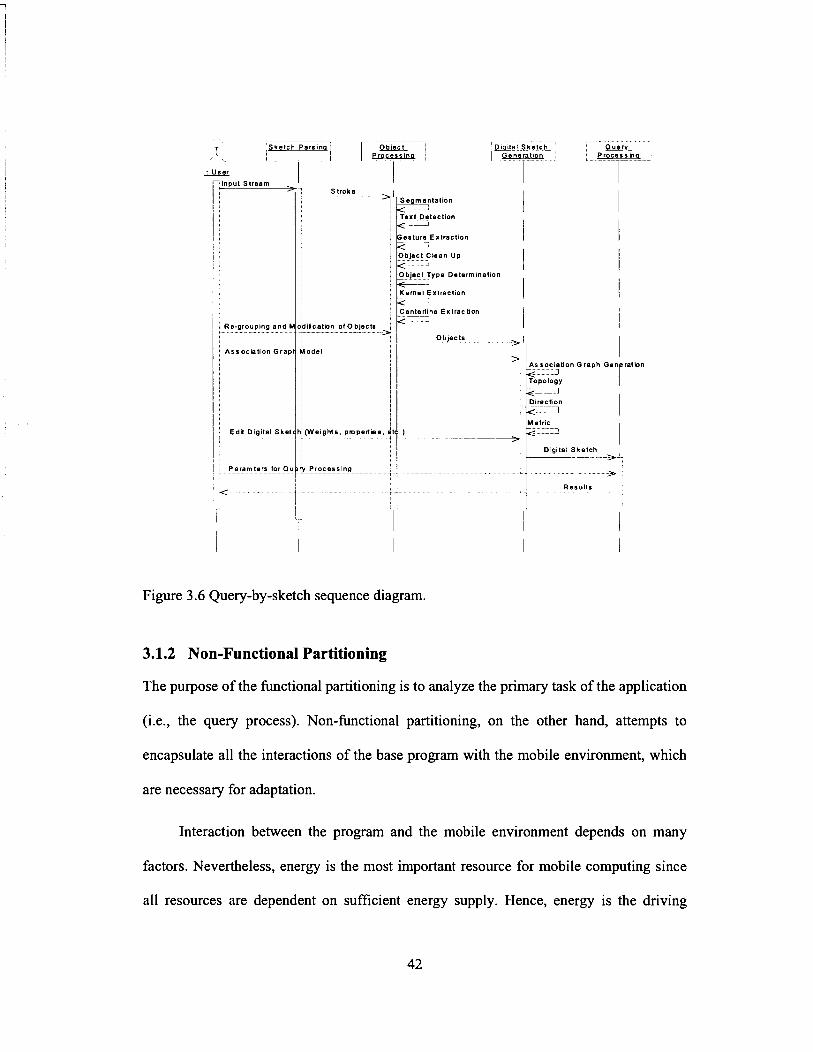
-z Sketch Parslnq
User - I I Input Stream I
17 Re-grouplng and odtficat~on of 0 bjects 4
Paramtmrs for Q u Processlng
D ~ a ~ t a l Sketch !&QlL I Fenerat~om , Processma
I I Segmjntatlon . - Text Detechon c
~msturm Extractr - - - C-
)bject Ctman Up .
Objects > 1 I I 7 ksocl;bon Graph
I Topology
Figure 3.6 Query-by-sketch sequence diagram.
3.1.2 Non-Functional Partitioning
The purpose of the functional partitioning is to analyze the primary task of the application
(i.e., the query process). Non-functional partitioning, on the other hand, attempts to
encapsulate all the interactions of the base program with the mobile environment, which
are necessary for adaptation.
Interaction between the program and the mobile environment depends on many
factors. Nevertheless, energy is the most important resource for mobile computing since
all resources are dependent on sufficient energy supply. Hence, energy is the driving

force in mobile-aware adaptation. There is growing consensus that advances in battery
technology and low-power circuit design cannot, by themselves, meet the energy needs of
future mobile computers, therefore, systems must also be involved in order to overcome
battery limitations (Ellis 1999; Flinn and Satyanarayanan 1999). As a result, applications
need to adapt to the available energy resources.
To guide such adaptation, the operating system monitors energy supply and
demand, and distributes the available resources among the applications. When energy is
plentiful, the set of parameters that controls application behavior is biased toward a good
user experience; when it is scarce, the behavior is biased toward energy conservation
(Welch 1995).
The set of parameters and the way they influence applications are dependent on the
type of the application. For instance, a video-streaming application may have the same
set of parameters as a computing intense application. Nevertheless, in terms of
performance, the streaming application is much more dependent on network-based
factors than on hardware factors.
The restricting entity in a mobile environment is the wireless client
(Satyanarayanan 1996a). Therefore, we assume that server support is abundant and focus
our analysis of involved parameters on factors related to the mobile client. Adaptation
parameters in a mobile environment are manifold and can be categorized either as
hardware-related or network-related. The following section identifies the parameters
involved in the query process for each category, and investigates the influence that the
parameters have on the application.

3.1.2.1 Hardware Factors
Hardware factors include the hardware resources of the mobile client (i.e., CPU, memory,
disk cache space). The hardware resources need to meet the application's system
requirements. Furthermore, application adaptation requires the application take the
current state of the resources into account in order to adapt its functionality. The main
factors for geo-mobile querying are CPUspeed and utilization, and memory usage.
CPU speed and utilization
The Central Processing Unit (CPU) defines how fast the mobile client works. It is the
main brain of the computer, where the infonnation is processed and the calculations are
done. The CPU may be a dynamic element that is able to change its speed in order to
adapt to the available energy resources. Moreover, the CPU is responsible for running
multiple applications, which means that its utilization may change frequently, depending
on the workload. Therefore, the application needs to adapt to changes in CPU speed and
utilization.
Memory Usage
Memory refers to the place in the computer that stores instructions and other files
potentially needed for immediate processing of a task at hand. Memory usage describes
the level of workload imposed on the system by the currently running applications. Geo-
mobile querying requires adequate memory in order to execute the steps involved in the
query process. If memory resources do not meet these requirements, the application needs
to scale its functionality appropriately.

Guideline 5: CPU and memory usage are vital parts of the mobile execution
environment, and influence the response time for a query. In
order to guarantee correct execution and user ji-iendliness, the
application needs to adapt to changing CPU and memory
parameters.
3.1.2.2 Network Factors
Network factors comprise properties related to the wireless link between the mobile client
and the server. The network environment is a set of parameters such as bandwidth,
latency, energy, cost, signal strength, and location. Some parameters (such as cost of
communication, latency and bandwidth) are well known and also relevant to fixed
networks. Mobility, however, introduces large variations in these parameters as well as
some new parameters (Jones et al. 2001; Kravets and Krishnan 2000). Examples include
signal quality, location, and energy.
While the operating system takes care of low-level transmission issues (i.e.,
bandwidth allocation, packet loss rate, and frame size adaptation), the application is
responsible for high-level adaptation to the available network resources. Consequently,
the geo-mobile querying application is network aware and avoids the following
characteristics: blatant consumption of the available bandwidth (i.e., no unnecessary
message transmission), high latency (i.e., long user-perceived response time), and
unrecoverable disconnection (i.e., fault tolerance). The relevant network resources
parameters for network-aware application-adaptation are bandwidth and latency.

Bandwidth
Technically, bandwidth describes the difference, in Hertz (Hz), between the highest and
lowest frequencies of a transmission channel. However, as typically used, it expresses the
amount of data that can be sent through a given communication circuit. Bandwidth, in a
wireless environment, may be characterized as a dynamic resource that depends on the
available wireless infrastructure at the current location of the mobile client. Geo-mobile
query by sketch requires server support, and thus, bandwidth is a crucial parameter to
guide adaptation. Furthermore, the application needs to be able to adapt to every setting
(i.e., connected, weakly connected, and disconnected).
Latency
Latency refers to the time it takes for a data packet to move across a network connection.
While a packet is being sent, there is latent time where the sending computer waits for a
confirmation that the packet has been received. Latency may vary quickly in wireless
networks, since the signal is exposed to a variation of influences (i.e., interference).
Guideline 6: Latency and bandwidth are the two main factors that determine
the throughput for a specljic connection. Fast responses and thus
userfiiendliness is dependent on appropriate usage of available
throughput. Therefore, the application needs to adapt to the
actual throughput.
The guidelines discussed in this section and the basic rule of distributed systems to
keep a low level of communication between the client and the server (Satyanarayanan

1996a) guarantees retrieval effectiveness, which is the primary criterion of performance.
These considerations form the base for the architecture of the geo-mobile query system.
3.2 The Geo-Mobile Query-by-Sketch Architecture
The architecture of the geo-mobile query-by-sketch application is based on application-
aware adaptation and the extended client-server model. Since client and server share the
responsibility of executing spatial queries, the adaptation logic resides on both, client and
server. The idea of this client-server adaptation strategy is that the application on the
mobile client is able to react to changes of the resources in the mobile environment. The
request for adaptation is then propagated to the server in order to adjust the server's
functionality.
3.2.1 The Mobile Client
The mobile client is central part of the query system. In addition to the user interface, it
also hosts the adaptation logic. The architecture of the mobile client consists of the
operating system running on top of the hardware, a middleware layer that acts as a
mediator between system resources and the applications, and the geo-mobile querying
application (Figure 3.7).
The role of the operating system and the middleware layer is to monitor scarce
resources, and to respond to external events. The resource monitor keeps track of the
resources, allocates the available resources among competing applications, and notifies
the applications of changes to these resources. In contrast, the role of the application is to
adapt to changing conditions by using the information and resources provided by the

resource monitor. The application reacts to the changes by switching to a different level
of functionality that guarantees best performance.
The change in resources affects both the user interface and the generation of the
query statement. The user interface adapts to the change by enabling or disabling a
specific set of functions for the current level of adaptation, while the query statement is
issued in form of a mobile sketch. The mobile sketch is a digital representation of the user
input, that is, the sketched scene, and reflects the effects of adaptation to available
resources in terms of informative content and metadata of the sketched scene. The data
transfer between client and server and the request for adaptation on the server is based on
a transfer mechanism that utilizes the mobile sketch as control protocol. The mobile
sketch and its structure are further discussed in section 3.2.3.
I I
I Operating System I Legend:
--+ Operate
L-$ Information
Figure 3.7 The architecture of the mobile client.

An important requirement for the mobile client is support of concurrency.
Concurrency is the ability of a system to execute multiple independent processes
simultaneously. This ability is vital for adaptive mobile applications since the operating
systems must monitor and manage a broad range of resources such as network
bandwidth, memory cache space, and battery power, while at the same time executing the
application itself.
3.2.2 The Server
The server is the core of the retrieval mechanism and is responsible for processing the
query against the database. The role of the server in the adaptation process is passive
because the client monitors the mobile environment and decides the extent of adaptation.
For every query statement (i.e., mobile sketch) transmitted, the server identifies the level
of representation and executes the appropriate tasks.
The query process is partitioned in such a way that the steps on the client and the
steps on the server are conlplementary and result in a digital sketch that can be processed
against a database. For instance, a mobile client with poor resources parses the user input,
creates the mobile sketch, and transmits it instantly to the server. The server resumes the
querying process and generates the objects, creates the digital sketch, processes the query
against the database, and finally prepares the result for presentation to the user.
Sketch-based queries typically generate a set of results, which the server prepares
for presentation to the user. The presentation of the result is based on a set of parameters
of the mobile environment in order to guarantee efficient result browsing. Such

parameters include screen size of the mobile client, color depth, etc. These parameters are
captured in form of a user profile on the client and transmitted to the server.
3.2.3 The Mobile Sketch
The mobile sketch is essentially a digital representation of the user's mental map of a
spatial scene. Simultaneously, the mobile sketch coordinates the workflow between client
and server. It reflects important characteristics that are required to derive the digital
sketch on the server, which is the final, meaningful representation of a sketch used for
querying spatial databases (Blaser 2000).
3.2.3.1 Components of the Mobile Sketch
The mobile sketch is an abstraction of the digital sketch since its main goal is to
efficiently capture the vital properties of the sketch at different levels of object
representation. The main objective of this approach is to reduce the amount of data
transmitted between client and server. The structure of the mobile sketch consists
basically of four distinct sections. The following is a high level specification of the
different sections.
Mobile Sketch Signature: A mobile sketch begins with a signature containing
general information such as creation time, document size, and history. The most
important information conveyed by the mobile sketch signature, however, is the
level of representation of the mobile sketch. This information enables the server
. to perform the remaining steps that are necessary to create the digital sketch.
Hardware Profile: This profile contains system-specific information describing
the properties of the mobile client. For instance, mobile clients may differ in

terms of screen size, color depth, and resolution. This information is crucial for
effective presentation of the query results on the mobile client.
User Profile: The user profile contains preferences that are set by the user on
the mobile client. Such information includes the selected association graph
model for the digital sketch, weights for binary relations, and thresholds for
result presentation.
Data Section: The data section reflects the sketch that the user draws on the
touch-sensitive screen. Unlike the other three sections, which remain essentially
the same for all adaptation levels, the content of this section may change
depending on the chosen level of representation of the mobile sketch (Section
3.2.3.3).
The purpose of the four sections of the mobile sketch is to enable the server to
complete the generation of the digital sketch, support the query process, and supply
parameters for a valuable presentation of the results. The next section discusses the
generation scheme used to create the mobile sketch.
3.2.3.2 Mobile Sketch Generation Scheme
The scheme used to generate the mobile sketch may be described as a lossy compression
technique applied on the digital sketch. Lossy compression techniques involve a
compression such that if expanded less information may be available then what was in
the original (Sayood 2000). In return, such techniques generally obtain much higher
compression ratios than is possible with lossless compression. Unlike most compression
techniques, however, no decomposition and no compression algorithms are required to

create multiple representations and reduce the amount of data of the mobile sketch. The
degree of complexity (i.e., the actual object representation) of the mobile sketch is
directly dependent on the number of steps involved in the creation of the sketch. This
approach reduces not only the amount of data, but also the required infrastructure to
create the mobile sketch. Therefore, it is the ideal approach for an adaptive application on
a mobile client.
The sketch generation scheme is based on the functional objects of the query
process: sketch parsing, object processing, and digital sketch generation. The general idea
is that each of the three functional objects generates a mobile sketch at a different
computational level, as depicted in Figure 3.8. The mobile client selects an appropriate
level of adaptation based on the available resources in the mobile environment, that is,
the application running on the handheld device determines what steps are ideally
perfomled on the mobile client given the set of parameters for the actual mobile
environment. Accordingly, the selected level of adaptation defines the level of
representation of the mobile sketch, since only the selected steps of the query process are
executed. After the mobile sketch is generated, it is sent to the server where the
generation of the mobile sketch is completed. Subsequently, the mobile sketch is
converted into a digital sketch that can be used for the query against the database.

Client I 1 I I I I I
MS: Mobile Sketch
Figure 3.8 Generation
Server Side
scheme for the multiple representations of the mobile sketch.
3.2.3.3 Levels of Representation
The mobile sketch produced by the generation scheme may reflect any of the three
different levels of representation. The term multiple representations in GISs refers to
changes in geometric and topological structure of a digital object that may occur with the
changing resolution at which that object is encoded for computer storage, analysis and
depiction (Buttenfield 1993). Accordingly, level of representation in our context does not
refer to spatial details, since the sketched scene is the same for both, mobile sketch and
digital sketch. Instead, it refers to qualitative and quantitative aspects (i.e., objects type,
binary relations) of the mobile sketch compared to the digital sketch. The following
description of the representation levels explains these differences.
MS I-Simpl@ed Line Strokes: Simplified line strokes are the lowest
representation possible in a mobile sketch. Simplified line strokes basically
consist of connected, time-stamped points (i.e., x- and y-coordinate, and
creation time) as drawn by the user on the touch-sensitive user interface.
Consequently, this level of representation requires the least powerful
infrastructure and produces the smallest amount of data.

MS 2-Geographic Objects: This representation reflects the user input in terms
of geographic objects (i.e., lines and regions), ASCII text, or symbols. The
geographic objects consist of interconnected line segments and a set of
properties. However, this level of representation contains no information about
spatial relations among the sketched objects. The significant difference
compared to the lowest representation level is the higher degree of computing
resources required to process user input and to generate the objects and its
properties.
MS 3-Digital Sketch: This level of representation corresponds to the digital
sketch, as used for the query processing. It consists of a set of distinguishable
sketched object and the corresponding spatial relations between them. The
attributes and properties of the single object are the same as in the previous
representation. The generation of the association graph of binary spatial
relations and the assessment of topological, metrical, and directional attributes
requires appropriate CPU and memory resources, and is therefore executed only
if the resources are available. Furthermore, the amount of data increases
drastically with the addition of the binary relations.
The mobile sketch facilitates an adaptive geo-mobile system architecture that
guarantees both, an appropriate level of workload on the client and an amount of data that
corresponds to the available network bandwidth. In order to achieve such adaptation to
the mobile environment, we need to define a strategy that guides the adaptation.

3.2.4 Mobile-Aware Adaptation Strategy
Mobile-aware adaptation involves dynamic partitioning of the functionality between
mobile host and server. By varying the partition of duties, however, we also vary the
functionality of the user interface and above all, the quality of data produced on the
mobile host. Consequently, adaptation involves the trading of data quality and user
experience for resource consumption. The proposed architecture captures this notion of
data degradation through three different levels of representation of the data produced on
the mobile client (i.e., the mobile sketch).
3.2.4.1 Complementary Distribution of the Query Process
The representation levels define the degree to which data delivered to the server requires
further processing. The lowest representation level results when resources on the mobile
client are scarce and thus, full server support is required. The second level of
representation applies when processing power, memory, and energy supply are abundant,
but wireless communication with the server is not reliable or not existent. Finally, the
application on the mobile client produces the highest level of representation if both, the
handheld device and the wireless network provide sufficient resources. Figure 3.9
illustrates the distributed query process and the three possible scenarios.

I Client I
I I
Wireless Network
Server
Figure 3.9 Mobile-aware adaptation strategy.
The choice of an appropriate adaptation level is based on predefined policies.
Adaptation policies capture different system behavior in a flexible and customizable
manner. The policies govern a discrete adaptation algorithm, which allows applications to
move up along step or staircase shaped utility functions, rounding off the assigned value
to the lower discrete adaptation level. The adaptation algorithm is discussed in the next
section.
3.2.4.2 Adaptation Policy
In order to adapt to a changing environment, a system must evaluate its present situation
and try to change the situation to another configuration that guarantees acceptable
performance. Therefore, the role of the adaptation policy is central to capturing the
application specific responses to resource availability. Due to the difficulty in obtaining
an analytic expression that takes into account all possible parameters (e.g., CPU cycles,
memory LIO operations, jitter); profile-based modeling is used to approximate the
mapping of the available resources to the application functionality.

We propose a profile-based, discrete adaptation policy, which allows applications
to move up along step or staircase-shaped utility curves, rounding of the assigned
parameters to the lower discrete parameter value (Figure 3.10). Discrete adaptation
requires complete increments of single steps to support multiple representations. It
considers the portion of a step to determine a discrete representation for the mobile
sketch.
hX
Resource
Figure 3.10 Example of a discrete utility curve.
The user profile defines the relation between the single steps of the utility curve,
that is, it defines the thresholds that guide the transition fiom one step of the utility curve
to the next. We utilize a compression factor (i.e., low, middle, high) to divide the
resource in three sections, each representing a representation level for the mobile sketch.
The compression factor divides the resource in a 1:2:3 (i.e., low: middle: high) ratio. The
application adapts the thresholds for the steps every time the user changes the
compression factor.
We define two spaces that reflect the available resources with respect to the
multiple representations; a resource space, R, and a performance space, P. R is

dimensioned by resource characteristics in the mobile environment, which define the
operational spectrum of the application. Based on the discussion in Section 3.1.2, we
utilize a two-dimensional resource space that includes system characteristics (i.e., CPU
power and memory) and network properties (i.e., bandwidth and latency). Each axis
reflects the resources assigned to the application by the middleware.
P is dimensioned along user-oriented parameters and includes three acceptance
regions (i.e., representations of the mobile sketch). The acceptance region for a specific
representation, AR, of P is defined as the region in which the application is considered to
be working properly with the current parameters. The adaptation model is illustrated in
Figure 3.1 1.
Sketch representation
Resource A space
System resources
Figure 3.1 1 Discrete adaptation model.

The application adapts its functionality every time it detects changes in the
parameters received from the resource monitor. In addition, three protocols guide
adaptation in case of abrupt changes of the wireless connection (i.e., a Disconnected
Protocol, a Weak Connection Protocol, and a Connected Protocol). The disconnected
protocol redirects the user input into a file that is stored locally. As soon as the
connection is reestablished, the Connection Protocol or Weak Connection Protocol
checks for such files and prepares them for transmission to the server.
3.3 Summary
Performing geo-mobile queries on hand-held mobile devices is a difficult problem. There
are a number of challenges inherent to the device, its wireless network, and the
application itself. While the system can control a number of parameters to address these
challenges, it must be structured carefully to avoid unnecessary complexity. Our system
separates adaptive capabilities of the mobile sketch based on the functionality of the
application for the currently available resources.

Chapter 4
QUERY PROCESSING AND
TRANSMISSION COST ANALYSIS
The amount of information contained in the different representations of the mobile sketch
increases from representation level to representation level. In this chapter, we examine
how the data file size of the mobile sketch changes as a result of the representation level.
Furthermore, we investigate how the data size of the sketch is related to the transmission
speed, which is crucial for efficient communication in network-based systems.
4.1 Framework
The framework to study the performance of the mobile sketch consists of two
components. The first component deals with the properties of the sketched scene and
establishes the foundation for the estimation of the size of the mobile sketch. The second
component deals with the communication cost model, which explains assumptions
related to the network and the transmission mechanism.
4.1.1 Properties of the Mobile Sketch
The sketched scene is basically a collection of objects, relations, and annotations that are
drawn by the user on the touch-sensitive screen. While annotations are isolated entities

and belong only to one object, objects and their relations describe the spatial
configuration in a comprehensive fashion. In order to investigate how objects and
relations influence the configuration of the mobile sketch, we need to know what
properties characterize a sketched scene. The considerations in this chapter are based on a
survey of people's sketching habits, which was conducted in order to establish the
theoretical framework for sketching spatial queries (Blaser 1998; Blaser 2000).
4.1.1.1 Sketch Complexity
Drawn objects are the primary elements in a sketch and are typically abstract and
generalized representations of their real-world counterpart (Blaser 2000). Examples
thereof include entities such as buildings, road systems, or railroads. A sketched scene
described by a collection of abstract objects, however, may reflect any arbitrary level of
con~plexity. The number of strokes per object increases if the sketch complexity
increases, or if unusual objects are drawn. Therefore, the level of complexity directly
influences the size of the mobile sketch.
The summary of the sketched objects that appear in the sketching survey shows a
multitude of object classes, ranging from common objects like buildings and road
systems, to more complex objects, as for instance topographic features. Figure 4.1 shows
the object classes ranked according to the average number of occurrences per sketch. The
two major object classes (i.e., buildings and road systems) contribute 53% of all objects
contained in the sketch. The first four classes, which additionally include directions and
syn~bols, contribute 72%, and the first nine object classes make up for 90% of the sketch.
The remaining object classes are present in sketches only occasionally.
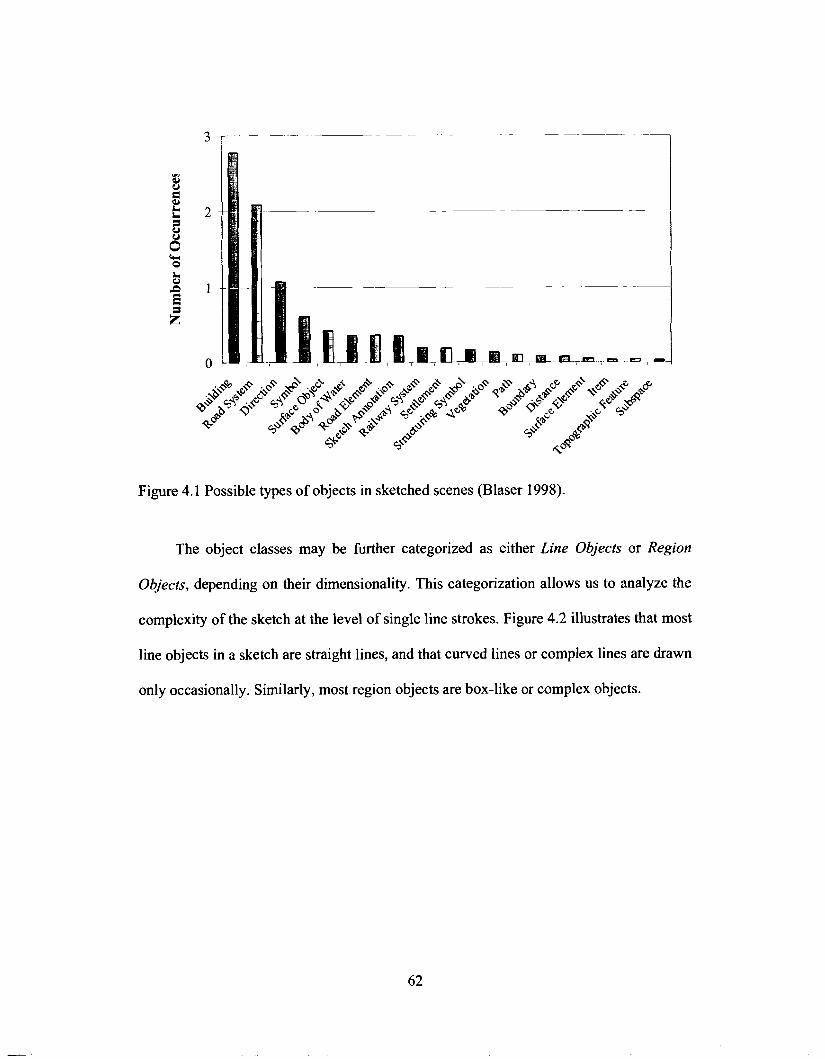
Figure 4.1 Possible types of objects in sketched scenes (Blaser 1998).
The object classes may be further categorized as either Line Objects or Region
Objects, depending on their dimensionality. This categorization allows us to analyze the
complexity of the sketch at the level of single line strokes. Figure 4.2 illustrates that most
line objects in a sketch are straight lines, and that curved lines or complex lines are drawn
only occasionally. Similarly, most region objects are box-like or complex objects.

7
- r e Objects 1- ORegion Objects
- - J
Figure 4.2 Number of occurrences of stroke types per sketch (Blaser 1998).
4.1.1.2 Quantitative Aspects
A sketched scene may reflect any arbitrary spatial configuration present in the users'
mental map. As a result, it is difficult to establish an accurate estimation of the
quantitative aspects of the sketched scene. Nevertheless, the quantitative aspects of the
sketch may be characterized based on three essential aspects: the number of objects per
sketch, the number of strokesper object, and the number of binary relations present in the
sketch.
Number of Objects per Sketch
The number of objects per sketch is an important quantitative aspect of a sketched scene.
Objects are instances or logical entities in a sketch and substantially define the semantic
of the sketch. The typical number of objects per sketch is 14 and the standard deviation is
3.3, which is 23% of all the objects in the sketch.

Number of Objects per Sketch
Figure 4.3 Number of objects per sketch (Blaser 1998).
Number of Line Strokes
Sketched objects typically consist of only a few line strokes. Most sketched objects have
only two strokes, however, the average number of strokes per object is 6.5 with a
standard deviation of 3.5 lines strokes, which corresponds to 53%. The number of objects
per sketch and the amount of strokes per object results in an average total number of 89.9
strokes per sketch. The standard deviation is 45, which is about 50%.
Number of binary relations per sketch
The similarity assessment between two sketched scenes is based on an association graph
consisting of a set of binary relations, which establishes the relations among the single
objects in the sketch, and hence, captures the properties of the spatial configuration. The
number of binary relations contained in the set influences the size of the mobile sketch
substantially. The worst-case scenario includes all possible binary relations (Equation
4.1), which causes the association graph to grow by 0 ( n 2 ) , with n being the number of
objects contained in the sketch.

In a best-case scenario, the association graph consists of a subset of binary
relations. In this case, the number of binary relations in the association graph is linearly
dependent on the number of objects contained in the sketch. Consequently, the
association graph grows by ~ ( n ) . Figure 4.1 visualizes the relation between the two
cases and shows that the relevance of the quantitative characteristics of the association
graph as a factor for the amount of data contained in the mobile sketch.
1 11 2 1 31 41 51 61
Number of Objects
Figure 4.4 Number of binary spatial relations (Blaser 1998).
4.1.2 Transmission Cost Model
In this section we discuss the framework for the transmission cost analysis of geo-mobile
queries. We define transmission cost as the time that is required to send a sketch from a
mobile client to the server over a wireless link. This part of the query process involves
the wireless link, which is the intrinsic bottleneck of mobile client-server computing. In

contrast, the time required to pre-process sketches on the mobile client and the time
required for completion of the query on the server will converge due to advancements in
mobile computing units (Pitoura and Bhargava 1994; Satyanarayanan 1996a).
Transmission cost may also be described as message latency. Message latency is
the sum of transmission time and propagation latency (Figure 4.5). The first component
(i.e., transmission time) is defined as the time that is required to get all bits accepted by
the receiver. The transmission time is dependent on the available bandwidth, network
protocols, and the quality of the link. For instance, the message latency in packet data
networks is the sum of statistical multiplexing, serialization delay, and forwarding delay.
The second component, propagation latency, is defined as the time that one bit
needs to reach its destination, and depends on the distance between sender and receiver,
and on the communication medium. For our purpose, we focus on the amount of data and
bandwidth, and assume that transn~ission protocols take care of results of queuing effects
within the network, which affect message latency (e.g., loss, jitter). Hence, we assume
that the transmission cost is equal to the transmission time and that the transmission time
is a linear h c t i o n of the size of the data and the bandwidth.
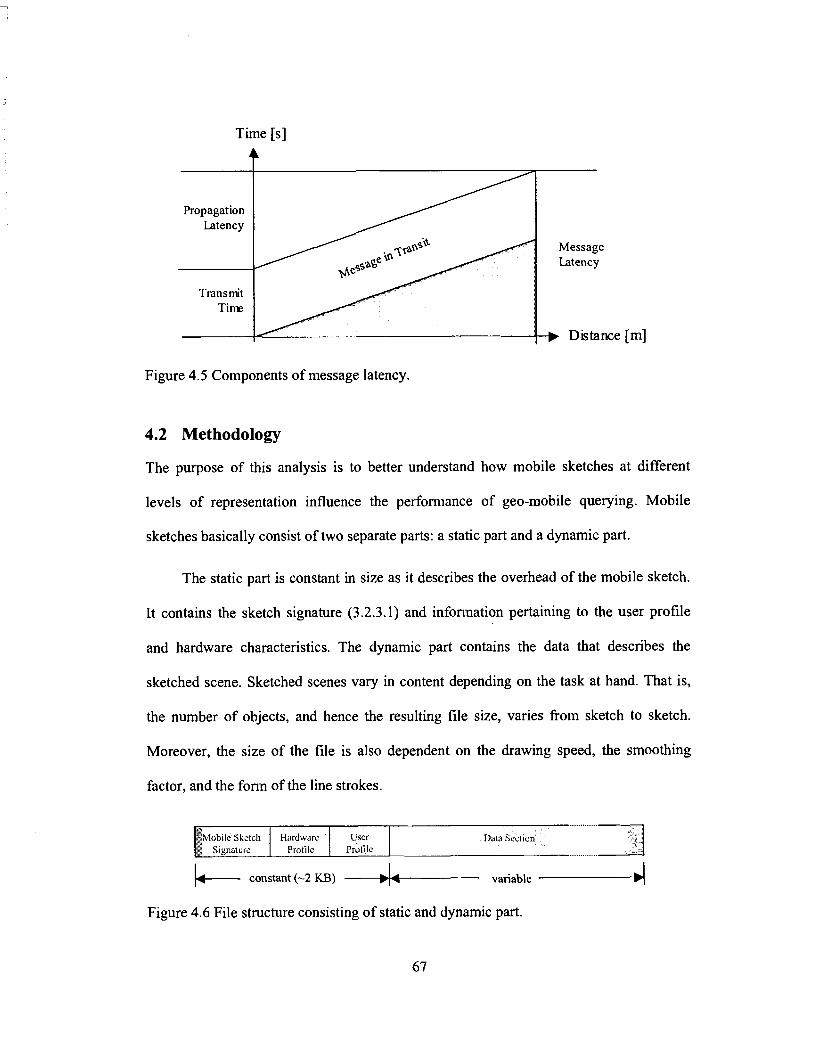
Time [s]
.r
Figure 4.5 Components of message latency.
4.2 Methodology
The purpose of this analysis is to better understand how mobile sketches at different
levels of representation influence the perfomlance of geo-mobile querying. Mobile
sketches basically consist of two separate parts: a static part and a dynamic part.
The static part is constant in size as it describes the overhead of the mobile sketch.
It contains the sketch signature (3.2.3.1) and information pertaining to the user profile
and hardware characteristics. The dynamic part contains the data that describes the
sketched scene. Sketched scenes vary in content depending on the task at hand. That is,
the number of objects, and hence the resulting file size, varies from sketch to sketch.
Moreover, the size of the file is also dependent on the drawing speed, the smoothing
factor, and the form of the line strokes.
h- constant (-2 KB) -A- variable 4 Figure 4.6 File structure consisting of static and dynamic part.
Data Scct~on Mobtie Sketch Hardwarc Profile
User Profile

The assessment of the size of the files to be transmitted to the server was performed
using the prototype implementation of the geo-mobile query application (Chapter 3), and
the prototype implementation of the sketch-based query processor (Blaser 1999). The
base of the assessment is a set of three sketches that represent various levels of
complexity and quantitative characteristics. The three sketches incorporate typical sketch
characteristics according to the findings described in Section 4.1.1. The first sketch
(Sketch 1) represents a simple spatial configuration enclosing only a few elements. The
second sketch (Sketch 2) contains the number of elements of an average sketch, and the
last sketch (Sketch 3) contains a large number of elements. This setup translates into the
three sketches depicted in Figure 4.7.
Sketch 1 Sketch 2 Sketch 3
Figure 4.7 The three sketches used for the transmission cost analysis.
At the lowest level of representation (i.e., MSl), a mobile sketch consists
essentially of a set of individual line strokes. Therefore, the focus for the configuration of
the mobile sketch at this level is on the total number of strokes per sketch.
The second level of representation (i.e., MS2) contains additional information
about objects created from the original strokes. Hence, the criteria for drawing the three

sketches at this level are the total number of objects and the type of the objects (i.e., lines
and regions showing various levels of complexity).
The highest level of representation (i.e., MS3) contains the association graph of
binary relations among the objects, which conveys implicit information about the sketch
setup. For the purpose of this analysis, we investigate two cases of the association graph
setup. First, we assess the resulting file size in a best-case scenario, which means that the
association graph is reduced to a minimum and thus yields the smallest file size. The
second case represents the worst-case scenario, which generates an association graph that
includes all possible binary relations among the objects. The resulting quantitative
properties for each sketch at each representation level are summarized in Table 4.1.
Strokes per Object
Line Straight 3 4 5 Curved 1 1 1 Complex 1 I 1
Region Box 3 4 5 Complex 1 2 3 Square 1 1 1 Circle 1 1 1 Oval 1 1 1
gMS3: Binary Relations Best Case 12 15 18 - Worst Cae 66 105 153
Table 4.1 Quantitative characteristics of the sketches.
4.3 Results
The results of the analysis are summarized in Figure 4.8 and Figure 4.9. Figure 4.8 shows
the resulting file sizes of the three sketch configurations with respect to the level of

representation of the mobile sketch. In addition to the three original sketches, it shows the
average file size for each level of representation. Figure 4.9 shows the transmission time
for all four cases as a function of file size and transmission rate.
-
Sketch 1
10 Sketch 2
10 Sketch 3
1. Average
MS3: Best Case --
190.09
240.80
378.34
269.74
Figure 4.8 File sizes for the three mobile sketches and the average.
MS3: Worst Case
Figure 4.9 Transmission time as function of file size and data rate.

4.4 Interpretation
The following two sections interpret the results fiom two different points of view. The
first point of view assesses file size characteristics with respect to the levels of
representation. The second aspect sets the transmission time in relation to currently
available wireless technology.
4.4.1 Quantitative Characteristics
The file size of mobile sketches is a function of several factors (e.g., representation level,
sketch composition, user profile). The association graph, however, influences the amount
of data contained in a mobile sketch substantially, and may be considered the main factor
for the resulting file size.
The results described in Section 4.3 show that the file size increases gradually
between the mobile sketch containing the simplified line strokes, the sketch containing
the geographic objects (i.e., about 9 to 12%), and the sketch containing a subset of the
association graph (i.e., around 19% to 22% compared to the sketch containing the
geographic objects). Conversely, the file size increases significantly (i.e., approximately
100%) between the mobile sketch containing a reduced set of binary relations and the
sketch containing the full association graph. Figure 4.10 shows the file size for all three
sketches as a function of the representation level, which illustrates this behavior.
Consequently, the selection of the appropriate association graph is crucial for the
resulting file size, and needs to be considered accordingly.

MSl M S2 MS3: Best Case MS3: Worst Case
Figure 4.10 File size as a function of the representation level.
4.4.2 Transmission Time in Context
In order to understand the influence of the file size and the resulting transmission time on
the query process, and hence on the end-user, we need to put these numbers into the
context of the currently available wireless infrastructure.
Today's wireless infrastructure can generally be categorized as Wireless Private
Area Networks (WANs), Wireless Local Area Networks (WLANs), and Wireless Wide
Area Networks (WWANs). Geo-mobile query systems may theoretically be implemented
in networks in any of these categories. For our analysis, however, we focus on WWANs
only, because, the available bandwidth in W A N s (e.g., Bluetooth with a data rate of 1
Mbps) and WLANs (e.g., IEEE 802.11 offers 2 Mbps, IEEE 802.11b up to 11 Mbps) is
far larger than the file size of mobile sketches. The transn~ission time in these types of
wireless networks shrinks to a fraction of a second, and hence, becomes irrelevant to the
end-user.

The available bandwidth in WWANs, however, is an issue for geo-mobile queries
since it is rather limited. For instance, in the United States the predominant wireless
protocol, High Speed Circuit Switched Data (HSCSD), operates with bearers that offer a
bandwidth of 9.6 Kbps. In the ideal case, four of these bearers are bundled together to
form a 39.6Kbps channel for communication. The Global System for Mobile
Communication (GSM) offers approximately the same bandwidth as HSCSD, while the
bandwidth for the General Packet Radio Service (GPRS) is slightly better, depending on
the number of available bearers (i.e., 8 bearers a 2 1.4Kbps). As a result, the transmission
of mobile sketches using HSCSD, GSM, or GPRS may result in long waiting periods for
the end-user.
For instance, the average file size of the three sketches for the different levels of
representation ranges from 200KI3it up to 520KI3it (Table 4.2). Given the transmission
rates for WWANs range from 9.6Kbps (GSM with one bearer) to 17 1.2Kbps (GPRS with
8 bearers a 21.4Kbps), we obtain transmission times ranging from 10 seconds to 55
seconds for GSM, and from 1.2 second to 3.1 seconds for GPRS (Table 4.3). While the
first example (i.e., GSM) shows clearly that file size is an issue, the transmission times
for the second example (i.e., GPRS) seem to satisfy our needs. However, these numbers
are purely theoretical since they do not include any delays deriving from queuing effects
within the network. Hence, even with GPRS, file size is an important issue when
transmitting mobile sketches in wireless networks.

Byerage file size of the Mobile Sketch (in Kbit)' MSI : 199.04 MS2: 222.35
MS3: Best Case: 269.74 MS3: Worst Case: 522.46
Table 4.2 Average file size for the levels of representation.
Table 4.3 Transmission time for GSM and GPRS infrastructures.
These two examples illustrate the variation of transmission rates present in
WWANs. Wireless technology for WWANs will become more sophisticated and reliable
in the future, offering similar bandwidth as today's WPANs and WLANs. A first
example that testifies the impressive growth in bandwidth for WWANs is the Universal
Mobile Telecommunications System (UMTS), which is not largely implemented yet, but
promises bandwidths of lMbps and more. Wireless WANs, however, are influenced by
many factors, which affect their stability. As a result, applications that rely on WWAN
infrastructure need to ensure quality of service despite fluctuating bandwidth.
The transmission cost analysis shows that for the transmission of a typical sketch
over today's typical WWANs, the lowest level of representation yields best transmission
times. Interesting in this context is the fact is that the lowest level of representation yields
file sizes that are approximately 60% less than the file size of the digital sketch
containing all binary relations. The analysis shows also that the transmission times are
good enough to guarantee response times that keep the user's attention (i.e., 10 seconds).
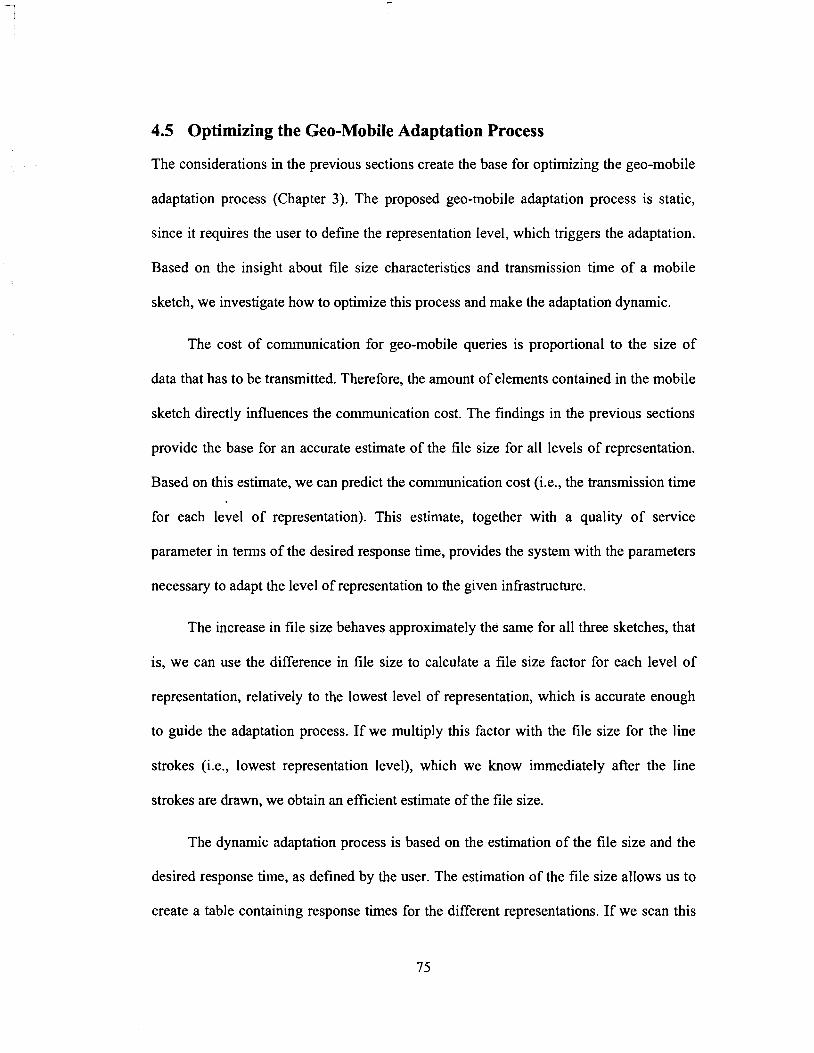
4.5 Optimizing the Geo-Mobile Adaptation Process
The considerations in the previous sections create the base for optimizing the geo-mobile
adaptation process (Chapter 3). The proposed geo-mobile adaptation process is static,
since it requires the user to define the representation level, which triggers the adaptation.
Based on the insight about file size characteristics and transmission time of a mobile
sketch, we investigate how to optimize this process and make the adaptation dynamic.
The cost of communication for geo-mobile queries is proportional to the size of
data that has to be transmitted. Therefore, the amount of elements contained in the mobile
sketch directly influences the communication cost. The findings in the previous sections
provide the base for an accurate estimate of the file size for all levels of representation.
Based on this estimate, we can predict the communication cost (i.e., the transmission time
for each level of representation). This estimate, together with a quality of service
parameter in terms of the desired response time, provides the system with the parameters
necessary to adapt the level of representation to the given infrastructure.
The increase in file size behaves approximately the same for all three sketches, that
is, we can use the difference in file size to calculate a file size factor for each level of
representation, relatively to the lowest level of representation, which is accurate enough
to guide the adaptation process. If we multiply this factor with the file size for the line
strokes (i.e., lowest representation level), which we know immediately after the line
strokes are drawn, we obtain an efficient estimate of the file size.
The dynamic adaptation process is based on the estimation of the file size and the
desired response time, as defined by the user. The estimation of the file size allows us to
create a table containing response times for the different representations. If we scan this
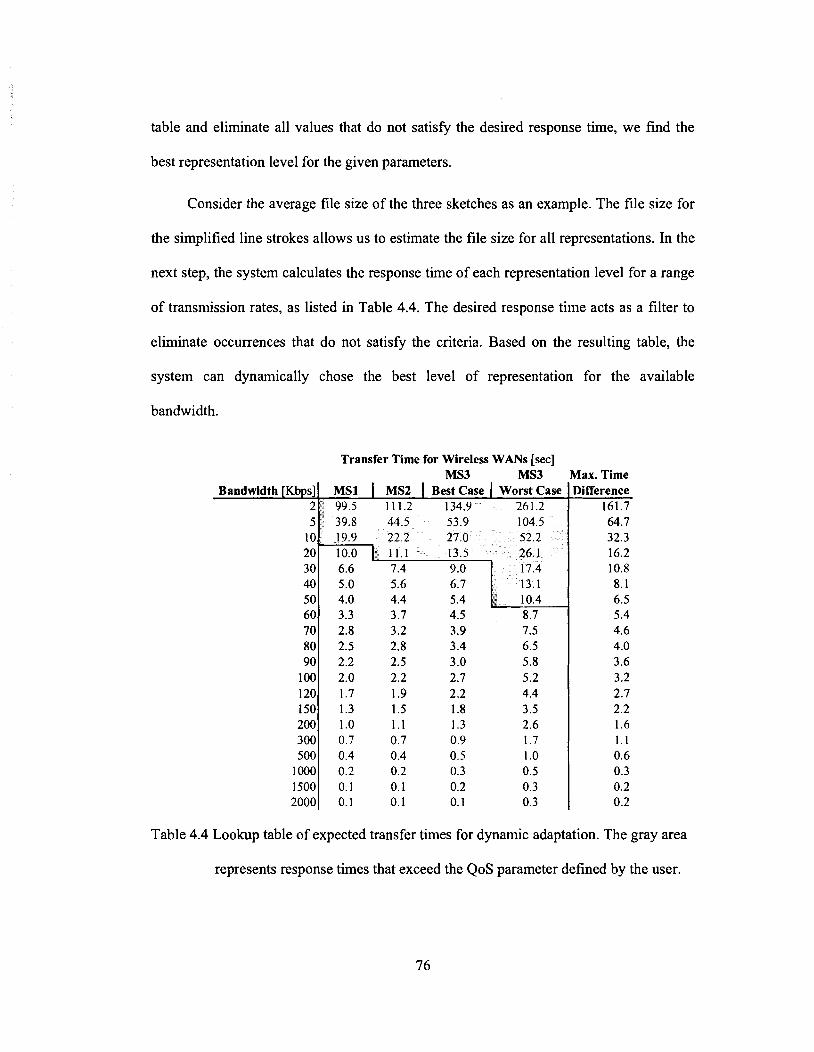
table and eliminate all values that do not satisfy the desired response time, we find the
best representation level for the given parameters.
Consider the average file size of the three sketches as an example. The file size for
the simplified line strokes allows us to estimate the file size for all representations. In the
next step, the system calculates the response time of each representation level for a range
of transmission rates, as listed in Table 4.4. The desired response time acts as a filter to
eliminate occurrences that do not satisfy the criteria. Based on the resulting table, the
system can dynamically chose the best level of representation for the available
bandwidth.
Transfer Time for Wireless WANs [sec] MS3 MS3
Bandwidth [ ~ b ~ s ] l MS1 I MS2 I Best Case ( Worst Case 21 99.5 1 1 1.2 134.9 261.2
lax. Time Iifference
161.7 64.7 32.3 16.2 10.8 8.1 6.5 5.4 4.6 4.0 3.6 3.2 2.7 2.2 1.6 1 . 1 0.6 0.3 0.2 0.2
Table 4.4 Lookup table of expected transfer times for dynamic adaptation. The gray area
represents response times that exceed the QoS parameter defined by the user.

The hypothesis of this thesis, as stated in the introduction, was: In order to
guarantee the typical expectation on response time (i.e. approximately 10 seconds) with
today's common wireless bandwidth (i.e., 20 Kbps) one needs to choose the lowest
representation for transmitting the mobile sketches. Based on the values in Table 4.4, we
can see that the lowest level of representation yields transmission times that are within
the response time for keeping the user's attention. Hence, we have sufficient evidence
that the hypothesis is true.
4.6 Summary
This chapter evaluated the model of geo-mobile querying (Chapter 3). For this purpose, a
set of sketches was created that satisfy general characteristics of digital sketches, and the
file size for each of these sketches was derived. The results show that the file size for the
different representations changes similarly for all three sketches, and that the resulting
transmission times are good enough to guarantee response times that keep the user's
attention, which confirms our hypothesis. Further analysis of the results puts the file sizes
into the context of the wireless infrastructure, and explains the implications of file size,
bandwidth, and response time for WWANS. Based on these findings, we finally propose
a dynamic adaptation strategy that adjusts the level of representation based on Quality of
Service parameters and an estimation of the file size.

Chapter 5
USER INTERFACE DESIGN AND
INTERACTION METAPHOR
The virtual and physical area of interaction between user and computer is called the user
interface (UI) (Encyclopedia Britannica 1996). While today's desktop computers have
enough CPU power to run computation-intensive user applications and support
sophisticated user interfaces, their mobile counterparts are confronted with a series of
unique challenges for UI design and development.
UI design for portable devices involves many issues, beginning from hardware
resources, such as screen real estate, available I/O channels, and processing resources,
over human-machine fit and adaptation to social organization and workflow patterns. The
user interface is key to productivity and thus, the design process must ensure usable, safe,
and efficient systems for people. Each user category has its own characteristics; some
users are highly mobile and independent (e.g., tourists using an electronic tour guide)
while others operate in specific regions (e.g., land surveyors collecting data on the field);
some users have limited attention capacity (e.g., ecologists observing animal behavior)
while others focus on processing digital information (e.g., student browsing the web), yet
all categories rely on mutually adapted interaction mechanism to ensure flawless

workflow. This chapter focuses on design issues for sketch-based query applications,
compares user modalities in geo-mobile environments, and explores different interface
components associated with geo-mobile information retrieval systems.
5.1 The Nature of Geo-Mobile Queries
In order to understand usability and design issues in mobile GIs environments, it is
important to know about the users and their preferences. As handheld computing
appliances are typically envisioned as tools within businessperson's domain, designers
assume related scenarios. However, user interface design is highly dependent on human
abilities, backgrounds, cognitive styles, personalities, and the task itself. A teenager using
a PDA is a long way fiom a GIs technician collecting data on the field using the same
type of PDA. Similarly, a computer expert using a PDA to find his way around in a new
environment is a long way from a history professor relying on an electronic tour guide
while visiting a modem art museum. The nature of the task, or more specifically, the
nature of mobile spatial queries influences user behavior, and thus, it is important to
identify the characteristics of the task.
People from different domains use portable devices in different ways, which can be
classified based on the degree of mobility. Kristoffersen and Ljungberg (1999) suggest
three categories of mobility: wandering (where the user wanders around with no specific
destination as part of their day to day work), traveling (where the user spends some time
traveling in a vehicle in order to get to a particular location), and visiting (where the user
may spend some time in different locations). Accordingly, the technology used is
classified into three categories: mobile, portable, and desktop-based. However, these
classifications focus on the mobility of users and devices respectively, and do not
consider the amount of mobility required to perfornl a specific task. The primary factor
that influences the design of user interfaces for portable devices is the amount of mobility
required to execute the task. Hence, the form factor of the device and the task that users
need to accomplish dictate the degree of desktop behavior that should be retained in
mobile applications. These considerations lead to the conclusion that the task-dependent
usage pattern, rather than the degree of mobility of user and device, should be
characterized and categorized (Pascoe et al. 2000).
Usage patterns in mobile computing are categorized in two distinct categories:
static an mobile. Mobile usage patterns are identified based on four distinct
characteristics; a dynamic user configuration, limited attention capacity, high-speed
interactions, and context dependency. These four characteristics help defining the
properties of the user interface.
Users will want to perfornl spatial queries whenever and wherever they like, but
they will not always be able to sit or have a desk available. Yet, they still want to retrieve
information, no matter whether they are standing, walking, or crawling; hence, the user
configuration for mobile spatial queries is dynamic.
The purpose of spatial queries is to retrieve some sort of map representing a spatial
configuration that corresponds to observations in the field or to the users' mental model.
Unlike in some other fieldwork activities, as for instance data collection on animal
behavior, which is sometimes performed during a prolonged period of time, users are not
forced to keep constant attention on the subject. The spatial scene of interest is not likely
to change its state instantly and therefore, users rely on snapshot-like observations, which

means that their attention is focused on the task objective and on the user interface rather
than the actual subject (i.e., the spatial scene).
High-speed interaction is required for tasks where observed subjects are highly
animated or otherwise likely to change their state instantly. The very nature of the query
subject (i.e., the spatial scene) implies that no such interaction is required to perform
sketch-based spatial queries, given that the observed spatial scene is static.
Context dependency means that the task requires additional input information, as
for instance, the location, either of the user or the query subject. Sketch-based spatial
queries are not explicitly context dependent, since they do not require location as
additional input parameter. For instance, users can query remote sites of interest while
seating in a restaurant for lunch.
In summary, only one characteristic (i.e., dynamic user configurations) qualifies
spatial querying as a mobile task. The conclusion of these considerations is that the task
of querying spatial data in mobile environments is to be categorized as a static task in a
mobile environment. Therefore, the user interface for spatial queries by sketch in static
environments (Blaser 2000) needs to be adapted merely in terms of adoption to the new
device resources and the dynamic user configuration in order to be usable in mobile
environments.
5.2 Mobile Users and Mental Maps
Everyone has images of different regions of the world that are the result of a progressive
mix of factual data, incomplete information, and personal bias or subconscious
prejudices. This process is called cognitive mapping and is defined as a series of

psychological transformations by which an individual acquires, codes, stores, recalls, and
decodes infonnation about the relative locations and attributes of phenomena in his
everyday spatial environment (Downs and Stea 1975). The result of this process is a
mental map, which is defined as a person's organized representation of some part of the
spatial environment. Visual spatial queries are highly dependent on mental maps because
they support users in sketching the query subject, i.e., the spatial scene.
Users often have a reasonably well-defined mental map of what they are looking
for in their mind. Nevertheless, mental maps are abstractions of reality and therefore, they
vary in quality. A mental map is the result of available observations, and the amount of
available observations is the accumulation of observation users make from day to day.
Hence, mental maps of places that users visit every day, as for instance their work place,
are much more accurate and vivid than places visited only occasionally (Lynch 1960). In
order to improve the quality of their mental maps, users need to acquire, code, and store
new infonnation about reality in that particular place.
When users perform spatial queries in mobile environments, two distinct scenarios
apply. In the first scenario, the subject of a spatial query is a place or region within the
users' perceptual space, while in the second scenario the subject is a place or region
within the cognitive space. Perceptual space refers to what can be seen or observed
through the senses at one time, whereas cognitive spaces include larger-scale spaces,
which cannot be captured directly with our sensors. Cognitive spaces relate perceptual
images to the cognitive factors of belief, knowledge, and memory. Hence, cognitive
space is free of any constraints of physical space (Freundschuh and Egenhofer 1997).
In the first scenario, the subject of a spatial query is part of the environment
surrounding the user. This implies that users may update and improve their existing
mental maps at any time by simply wandering around and adding absent information.
Consequently, the query subject (i.e., the spatial sketch) may be described much more
detailed and accurate, which leads to more expressive query statements and finally betters
the results.
The second scenario may be compared to spatial querying in static environments
(e.g., office, meeting room) where the user draws a spatial scene solely based on a mental
map. This scenario argues that the same characteristics and properties apply in static as in
mobile environments. Nevertheless, the design of geo-mobile user interfaces for spatial
queries needs to consider that sketches from mobile users may be much more detailed.
Hence, geo-mobile user interfaces need to offer adequate functionality that allow efficient
communication of real-time observations and modification of query parameters (i.e.,
weights for scene completeness, geometry, topology, metric, etc.).
5.3 User Interface Components
The nature of sketch-based spatial queries deternines how much functionality from
desktop applications should be retained for portable devices. User interface design needs
also to consider a basic user profile. The target audience for mobile sketch-based
querying applications is the regular PC user, who typically has an intermediate level of
experience. We do not assume that users have any extensive experience with spatial
infonnation systems; however, we do assume that users are familiar with the task of
querying spatial data. The requirements to the user interface resulting from this basic user
profile are the following: fast access to the application, ergonomically efficient layout,

and rapid compilation and editing of spatial sketches. The following subsections discuss
the elements of user interfaces that are crucial to achieve these requirements, and
consequently, ensure effective communication between user and application.
5.3.1 Metaphor
Metaphors allow understanding one thing in terms of another, a concept that is essential
for mapping users intentions onto abstract digital structures. Metaphors use fundamental
terms, images and concepts to help users interact with applications. A single metaphor
usually cannot meet the challenge of continuous, complex communication. Choosing a
metaphor means deciding on the ontology of the user interface, i.e., on the concepts that
users will have to master, the objects and operations they got to see, and the work
distribution between them and the computer (Kuhn 1995). For instance, consider the
metaphor of personal digital assistance implemented on many handheld devices. The
metaphor for the entire product consists of a set of metaphors, one for each single
application, which together allow overcoming the complexity of the system. The PDA
metaphor might be characterized based on the underlying concepts: the calendar or date
book metaphor (When?), the to-do list metaphor (What?), and the address book metaphor
(Who?). Geo-mobile query applications on PDAs expand the concept of personal digital
assistance with facilities that assist users answering questions related to locations
(Where?).
The user interface for spatial queries by sketch on PDAs relies on a sketchpad
metaphor that emulates the basic functionality offered by a pen and a piece of paper. In
fact, sketching on a PDA comes very close to sketching on a real sketchpad. The small
size of a PDA allows users to handle it much like they would handle the sketchpad. For

instance, users can hold the PDA in one hand while sketching, or put it down on a table
and then sketch. Hence, the physical characteristics make the PDA almost invisible for
the user, which is a feature characteristic of human-centered products (Norman 1998). In
addition to the basic functionality, the user interface incorporates editing facilities,
multiple views of the sketch (i.e., the graphical view of the sketch vs. an interpreted view
of meaningful objects), and polymorphous characteristics of the pen (e.g., drawing and
editing with the same device) that enhance the natural sketching process.
5.3.2 Interaction
People use a basic set of input channels (i.e., pointing, writing, typing, talking, sketching,
and gesturing) and output channels (i.e., seeing and hearing) when they interact with
desktop computers (Blaser 1997, 2000). The same modalities apply when users interact
with portable devices. However, most portable devices are dedicated to a specific task
and the input and output methods are optimized for a particular use. Dedicated devices
integrate the device itself as part of the interaction metaphor, which increases computer
transparency essentially. Computer transparency is defined as the degree to which the
physical form of a computer's input and output devices promotes intuitive interaction.
Thus, high transparency is an important quality of user interfaces.
Traditional interaction with PDAs is through a pointing device (i.e., a pen) on a
touch-sensitive screen, and a few hardware buttons (Figure 5.1). The pen is used for
direct manipulation of objects displayed on the screen, much like a mouse on a PC. The
fundamental principle in direct manipulation interfaces is to represent explicitly the
objects that users will deal with (e.g., icons, menus) and to allow users to operate on these
objects directly. This concept facilitates comprehension and provides speedy access and

movement among data, functions, tasks, activities, and roles depicted in the interface
model.
Touch-sensitive screen
Hardware buttons
Figure 5.1 User interface of PDAs.
In general, PDAs take advantage of a touch-sensitive screen to facilitate direct
manipulation. The touch sensitive screen is the primary way to collect data, and to
navigate through and manipulate objects in a graphical user interface. In addition, it is the
critical element in the bi-directional communication process between user and computer.
The following paragraphs discuss critical components of interaction with PDAs.
5.3.2.1 Pen Usage
A pen is the physical device that a person uses when writing, drawing or pointing on the
touch-sensitive screen of a handheld device. The pen has two main functions:
1. It is a pointing device. Users can use the pen as they would use a mouse to
navigate the application's user interface, select tools, and move or resize objects.

2. It is an input device for digital ink. The digital ink is part of the sketch and may be
converted to lines or regions, or to text. For example, users can annotate sketched
objects with the pen, much as they would on a sketchpad.
The pen is an absolute pointer instead of relative pointer, like a mouse. The mouse
was designed purely to give two-dimensional positional information. Its design restricts
movement of the hand and arm to allow only this pointing movement. Using a pen
requires that the user move his entire aml, not just fingers or wrist. Hence, it becomes
important to physically group related controls and minimize the travel distance between
ways to access features commonly used together.
The second h c t i o n of the pen is to act as an input device that lays down ink. In
support of the sketchpad metaphor, drawing and writing on a touch-sensitive surface
should look and feel the same as pen on paper. The ink should flow naturally, without
intenuption or delay and it should also be rendered precisely and smoothly. Slow
rendering interrupts the users' thought and sketching process, while high rendering
instills confidence in the user that the digital pen on the touch-sensitive screen correspond
to regular pen and paper.
5.3.2.2 Hardware Buttons
Most PDAs incorporate a set of hardware buttons in their cases to which events can be
attached. Candidate events are actions that users will either want to use frequently, or be
able to perform while not looking at the screen. Documents presented on the small screen
of a PDA often require zooming and panning facilities to virtually enlarge the screen
area. The integration of the hardware buttons as navigational tools for the sketch may

replace scroll bars as part of the graphical user interface and hence, save precious screen
space.
5.3.2.3 Embodied Interaction
The physical interaction with handheld devices is still quite restricted when compared to
desktop workstations. However, portable devices are metaphorically related to similar
non-computational devices and hence, open up new ways of interacting with applications.
For instance, a PDA is very close to a paper artifact, such as a notebook. When people
use a notebook, they not only write or sketch on it, but they also flip it, bend it, thumb
and crease its pages. People have highly developed dexterity and skills that support
manipulation of such artifacts.
The physical size of handheld devices allows users to easily hold the device in one
hand, which permits to treat the body of the device as part of its user interface (Hinckley
et al. 2000), (Fishkin et al. 2000). Such embodied interfaces may be able detect gestures
if it comprises a set of sensors (e.g., tilt sensor, touch sensor, proximity range sensor) that
track orientation and movement of the portable device, and whether the user actually
touches it or not. Based on this information, functions like switching between portrait and
landscape display modes, or scrolling the display using tilt may be implemented. Sketch-
based interfaces for mobile GIs applications benefit from embodied interaction in
numerous ways. Table 5.1 lists operations perfomled in sketch-based query applications
and the gestures that potentially could initiate the operations.

Operation Gesture Initiate new sketch Squeeze or shake the PDA Pan Tilt PDA in corresponding direction Zoom inlout Free hand touches the top/bottom of the PDA Switch display orientation Rotate device (i.e., landscape, portrait mode)
Table 5.1 Potential operations and triggering gestures.
5.3.3 Appearance
Effective layouts exploit one of the most powerful perceptual coding mechanisms
available: position within the two-dimensional space (Cleveland 1985). An effective
layout uses the dominant visual variables such as size, position, and value, to manipulate
the perceptual prominence of each item and thus influences the order of processing of
individual pieces of information. One problem with handheld devices is the lack of screen
space that is due to physical restrictions. Because the screen is small it may become
cluttered with information. Hence, effective layout design is an important component of
the user interface.
The user interface for spatial query by sketch is designed based on the sketchpad
metaphor. Its appearance ensures interface transparency, data transparency, and media
transparency. Interface transparency refers to the degree to which the user interface
promotes the experience of immersion. Data transparency implies that users are freed
from the limitations imposed by a particular data structure, and media transparency
denotes the degree to which conceptually separate groups of data can be combined
visually.

5.4 User Interface Prototype
The prototype of the user interface is implemented on a Palm Pilot IIIc. The Palm Pilot
IIIc has 8Mbyte of memory and a 160 to 160 pixel large display. The prototype
comprises much of the functionality included in Sketcho (Blaser 2000). However, it
adapts the user interface to fit the restrictions of mobile GIS environments. The user
interface implements a query formulation mechanism, and a visualization mechanism for
the results. The following sections discuss the main features of the two mechanisms.
5.4.1 Query Formulation Mechanism
The query formulation mechanism is implemented as a multi-modal user interface
allowing the composition of a spatial sketch by the drawing and labeling of spatial
objects (i.e., lines and regions), and the setting of sketching and querying parameters
(e.g., speed, smoothening levels). The available screen space is divided into a sketching
area, an area for application specific push buttons, and a status line area for feedback
(Figure 5.2). In addition, the Palm Pilot PDA series has a built-in area for graffiti-style
handwriting input and a hardware button to display the menu bar.
I 1 I 1 1 1 Zoom and Pan area
Figure 5.2 User interface components of the geo-mobile query application.
90

5.4.1.1 The Sketching Area
The sketching area is the part of the touch-sensitive screen where the user draws the
sketch (i.e., the spatial configuration). When the user puts down the pen on the screen, the
digital ink begins to flow, that is, the location of the pen is recorded and represented as a
point, which eventually form a stroke. When the user lifts the pen, the stroke is
simplified, analyzed and a color is assigned. The use of color is an integral part of the
user interface since it conveys implicit information and supports the sketching process
(Shubin et al. 1996).
The sketching area of the user interface implements two different views to ensure
media transparency. The first view represents the sketch as the user draws it, while the
second view shows the object types contained in the sketch, that is, it shows the sketch as
a collection of regions and lines. The two views are not different levels of abstractions,
but rather represent different models of the same data, which are complementary and
bring out correlations and disparities in terms of intended object types. In a single view,
users may need to mentally extract and remember object types they wish to draw.
Multiple views provide insight into the character of the sketch and enhance mapping the
mental map to the user interface.
5.4.1.2 The Control Area
The control area is the part of the touch-sensitive screen that is used for directing the
workflow of the application. The interface supports erasing, selecting, and editing such
that these operations do not interrupt the sketching task. To achieve smooth workflow,
these operations are made available via explicit push buttons, which allow selecting the
operation mode. An important aspect of user interface design is to always allow users to

be in control. In order to achieve this property, a status line is implemented, which
infonns the user of the current state of the application.
Beside the control area on the touch-sensitive screen, the Palm Pilot IIIc comprises
a pre-defined button that is used to display the menu bar. The menu dialogue architecture
on Palm Pilots is similar to the architecture users know from desktop environments. This
improves the learning process and ensures easy navigation. Each option in the menu bar
is associated with a pull-down menu that enables users to gain access to the settings
panels. The settings panels control three levels of settings: the user preferences (i.e.,
drawing speed, object-closure distance, etc.), the application settings (i.e., stroke
smoothening level), and the query preferences (i.e., weights for geometry, metric, etc.).
5.4.1.3 The Pan-and-Zoom Area
The zoom and pan area integrates the available hardware buttons as part of the user
interface for the application. This concept allows saving screen space for the sketch since
no scroll bars are needed. The user may change the assignment of operations to specific
buttons, so that the configuration best fits the characteristics of the user (e.g., dominant
left or right hand).
Pan left Pan right
Zoom in Zoom out
Figure 5.3 Zoom and pan area.

5.4.2 Visualization Mechanism
After the sketch is drawn, the user initiates the spatial query. During the query
processing, the sketched scene is compared to all scenes in the database. The scene
similarity assessment yields a set of results, which are most similar to the sketched scene.
This set is returned to the user and presented on the PDA in a scrapbook-like fashion. The
prototype implements a bi-modal visualization mechanism for the display of members of
the retrieval set, allowing users both,
1. to view thumbnail images, ranked in order of potential relevance, of a set
retrieved documents, together with the descriptive indexing fields, and
2. to view a full size image of a single selected document together with any brochure
text associated with it.
1 List navigation
Figure 5.4 Scrapbook-like result browsing mechanism.
5.5 Guided Tour
This guided tour explains the steps involved in a typical geo-mobile query. The task of
geo-mobile querying consists of three steps: (I) configuration of the user profile, (2)
formulation of the query statement, and (3) presentation of the results. In the first step,

the user configures the application so that it meets his personal drawing preferences (i.e.,
drawing speed and snap distances) and the required processing preferences (i.e.,
smoothing factor, query response time, preferred level of representation, and properties of
the result presentation) (Figure 5.5).
Figure 5.5 Dialogs for configuration of user profile.
The second step consists of the definition of a spatial scene according to the user's
mental model, that is, the user describes what he is looking for (Figure 5.6). Depending
on the representation level (i.e., MSl, MS2, or MS3), the scene may be edited in order to
refine the query statement.

Figure 5.6 Users describe the spatial configuration they are looking for in ternls of a
sketch.
When the sketched scene corresponds to the mental model, the user sends the query
statement to the server. The server recognizes the level of representation and resumes the
query process where the client left off. The similarity of the sketched scene to the scene
contained in the databases is assessed and the results generated. Finally, the server
prepares the results for presentation and transmits them to the client, where they are
presented to the user.
5.6 Summary
This chapter discussed the user interface design issues of geo-mobile sketch-based query
systems. The focus was on the nature of geo-mobile queries, the mental map of the user,
and on the user interface design and prototype. The prototype implementation provided
evidence for the practicability and usefulness of the sketch-based queries on handheld
devices. It also shows that sketch-based user interfaces are helpful for mobile users that
wish to retrieve spatially related infornlation using their PDA.

Chapter 6
CONCLUSIONS AND FUTURE WORK
This thesis investigates the implications of mobility on sketch-based information retrieval
systems. Important issues in this context include challenges related to mobile technology,
wireless communication, and the architectural structure of information retrieval systems
in such environments. The first part of this chapter is structured according to the structure
of the thesis and provides an overview of the research. The second part highlights the
major results, and finally, the last section discusses future research topics and lists
questions that have been raised through this work.
6.1 Summary
The main objective of this thesis was to identify the major factors that influence the
extension of sketch-based query techniques from static to dynamic mobile environments.
The thesis follows a top-down approach in that it first identifies characteristics of mobile
computing and the challenges involved therein, creates an architectural framework that
permits efficient sketch-based querying in mobile GIs environments, and finally
evaluates the processing of geo-mobile queries based on the proposed architecture.

6.1.1 Users, Mobile Technology, and GISs
User interaction in spatially related, mobile applications follows the rules and
methodologies of human computer interaction. Interaction with handheld devices in
mobile GIs environments, however, differs from interaction with GISs on desktop
computers in many aspects. The result of this discussion is that single input channels (i.e.,
pointing, writing, or talking) are seldom expressive enough to describe complex spatial
configurations.
Multi-modal user interfaces, such as sketch-based interfaces, enable to capture
implicit infom~ation and hence, alleviate this problem. The first step in developing new
solutions that integrate novel query techniques and mobile applications is to recognize
and understand how mobile appliances are used. The most prominent discovery in this
context is that the usage pattern for geo-mobile queries is not fundamentally different
from the usage pattern for sketch-based query applications running on desktop
workstations. Although users roam around in mobile environments, they still define
query statement while sitting or standing still, and not while moving.
6.1.2 Geo-Mobile Information Retrieval
Mobile environments are highly dynamic and hence, resource availability changes
frequently. The proposed architecture for geo-mobile infomlation retrieval is based on
application-aware adaptation and the extended client-server model. In our approach,
client and server share the responsibility of executing spatial queries and adapting to the
mobile environment. The application chooses an appropriate level of adaptation based on
resource profiles communicated by a resource monitor. The factors that influence
adaptation are related to hardware resources (i.e., CPU and memory) on one side, and to

resources of the wireless link (i.e., bandwidth and latency) on the other side. The
adaptation logic resides on both, client and server, and a mobile sketch is used for
coordination of adaptation and execution of the complementary distributed steps involved
in the query process.
The mobile sketch produced by the generation scheme reflects adaptation on three
different levels. The representation levels define the degree to which data delivered to the
server requires further processing. The lowest representation level results when resources
on the mobile client are scarce and thus, fill server support is required. The second
representation level applies when processing power and memory are abundant, but
wireless communication with the server is poor. Finally, the mobile client produces the
highest level of representation if both, the mobile host and the wireless network provide
sufficient resources.
6.2 Major Results
The major results generated during the investigation of extending sketch-based
information retrieval from static to mobile environments are as follows:
Identification of typical user behavior and integral characteristics of sketch-
based querying in mobile environments.
User behavior in mobile environments diverges from user behavior in static
environments in many ways. The most prominent characteristics are frequent, but
short sessions, and dynamic user configurations. The usage pattern, however, depends
on the specific domain and on the context of use. The discussion identifies that the
task of querying spatial data in mobile environments needs to be categorized as a

static task in a mobile environment. Consequently, we may rely on the theoretical
foundation for sketch-based queries as derived by Blaser (2000).
Application adaptation and the extended client-server model alleviate the
difficulties impressed by dynamic environments upon geo-mobile information
retrieval systems.
Mobile environments require geo-mobile information retrieval systems to adapt to the
changing resource in order to guarantee retrieval efficiency. The architecture of the
geo-mobile infornlation retrieval system is based on an adaptive client-server
concept. The strategy of this concept is that the application on the mobile client is
able to react to changes of the resources in the mobile environment. The request for
adaptation is then propagated to the server in order to adjust the server's hctionality
The mobile sketch is an efficient mechanism to guide application adaptation.
The primary task of the mobile sketch is to represent the user's mental map of a
spatial scene in a digital form. It reflects important characteristics that are required to
derive the digital sketch on the server. Simultaneously, the mobile sketch coordinates
the workflow between client and server. The digital sketch is generated on the mobile
client and guides adaptation through three levels of representation. The server
recognizes the level of representation and resumes the execution of the query process.
Adaptation to the mobile environment is necessary to ensure efficiency of geo-
mobile querying.
The transmission cost analysis shows that only the lowest level of representation
yields transmission times that are good enough to guarantee response times that keep
the user's attention when transmitting a typical sketch with today's typical wireless
bandwidth. The lowest level of representation yields file sizes that are approximately
60% less than the file size of the digital sketch containing all binary relations. This
discovery indicates that usability of geo-mobile querying is not guaranteed in any
case. Hence, adaptation to the mobile environment is necessary to ensure efficiency.
6.3 Future Work
Our work introduces a new adaptive approach for geo-mobile querying about which
many questions remain unanswered and many variations and extensions remain to be
explored. Listed below are several areas that look especially attractive for future
exploration.
6.3.1 Using Architecture as Model for Future Research
The proposed architecture defines a model for expanding GIs functionality to mobile
environments. The design of the model focuses on the transmission time to submit
sketch-based query statements from a mobile client to a server. Based on this framework,
future work may implement a prototype that allows comprehensive testing in a wireless
environment. Such testing could be used to further refine the file size estimation process,
and for additional investigations in terms of usability and efficiency of geo-mobile query
systems.
Another interesting aspect for future research is the estimation of the total response
time. The total response time for geo-mobile queries is the sum of the time it takes to
submit the query from the client to the server, the time needed to process the query on the

server, and the time that is required to send the query results back to the user. The most
prominent questions in this context are:
How can we estimate the total response time of geo-mobile queries in order to
achieve total response times that ensure efficiency of geo-mobile querying?
What are appropriate methods for result presentation and the delivery of the
results to the mobile client (e.g., scrapbook, progressive transmission of query
results)?
How can user profile and hardware profile of the mobile client be used to
enhance the querying process?
Can we enhance efficiency of geo-mobile queries with file streaming
techniques?
Are indexing techniques beneficial for geo-mobile querying and how can we
integrate them in the query process?
6.3.2 People's Sketching Behavior in Mobile Environments
The theoretical framework for this thesis is derived from research investigating sketch-
based queries in static environments. While the majority of these findings certainly apply
to geo-mobile querying, further research is required to identify characteristics specific to
people's sketching behavior in mobile environments. For instance, color can be used to
drastically enhance the informative content of a sketch in different ways. While it can be
used to recognize relations between distinct objects (i.e., aggregations of line strokes), it
can also be used to analyze sketched objects on a semantic level. A possibility for such an

approach is to analyze the sketched scene based on a color scheme that defines different
conceptual level. For instance, using different colors for a subway under ground and a
road on the surface affects the expressiveness of the sketch substantially.
Another important aspect to consider when investigating sketching in mobile
environments is the nature of the sketch itself. Traditionally, we would assume that
people sketch in a bird's eye view. However, this excludes the possibility for the user to
sketch what he sees, which is a perspective view of the surrounding environment.
Providing users with the opportunity to sketch what they see is a challenging task that
raises several motivating questions:
What are the different types of sketches people draw in a mobile environment
and what are their characteristics?
How can we generate a digital sketch that can be processed against a database
fiom the different types of sketches?
How can we visualize the invisible, as for example landscape contours, in order
to further enhance the sketch?
6.3.3 Context Dependency
Context dependency may generally be defined as the environment of something that
establishes or classifies its meaning. Geo-mobile information retrieval may well benefit
from its context in different ways. The next sections describe three fonns of context
dependency that could enhance the efficiency and increase the perfomlance of the
information retrieval system.

6.3.3.1 Spatial Context Dependency
Sketched scenes, as discussed in this work, describe spatial scenes according to the users'
mental model. Adding context dependency to the spatial sketch can play an important
role in processing the query against a database. For instance, knowledge about the scale
of the sketch augments the expressiveness of the sketch significantly, and consequently,
results in more accurate results. Spatial context dependency is a function of
manipulability and size of space, and locomotion. Adding information about the current
location, path, orientation, direction, and heading of the user could further refine these
parameters. Important questions that need further research are:
Is there any relation between the sketched scene and the immediate spatial
environment?
How can spatial context dependency be captured efficiently?
What interfaces best support context dependency and how can these interfaces
be combined with interfaces for geo-mobile querying?
6.3.3.2 Context Dependency of Application Adaptation
The proposed architecture for geo-mobile querying abstracts context dependency of the
adaptation process to hardware- and network-related factors. Application adaptation,
however, is highly context dependent since it is influenced by many more factors. Such
factors include device characteristics (i.e., screen, input devices), location (i.e., physical
location, proximity to other devices and people), and environment (i.e., lighting, noise,
social situation, other tasks user is perfonning, users' disabilities).

For instance, specific device characteristics, especially screen size, color depth, and
resolution, could be used to restrict characteristics of the query results. Furthermore, the
application may benefit from location awareness by sensing other devices in its
proximity. Such knowledge can be used to overcome weak links to the server, or to share
common resources. Another example of adaptation is a dynamic, selective combination
of suitable multi-modal interface tools, which reflect the properties of the mobile
environment. For exan~ple, the application selects an audio interface in a car or disables it
when the background noise is too loud.
These examples show the potential of adding context-dependency to geo-mobile
application adaptation. The combination of system level parameters and environmental
parameters provides valuable input to resource management. Important questions in this
context include:
How can sensor technology and handheld appliances be combined to add
environment awareness to geo-mobile infom~ation retrieval systems?
How can these parameters be integrated in an adaptation concept?
6.3.3.3 Task-Based Context Dependency
Another way to enhance geo-mobile information retrieval is to define the dependency
between the sketched scene and the task the user wants to perform. For instance, a worker
in the field who is in charge of the town's water supply wants to retrieve information
about the location of the pipes under ground in a specific location. The sketched scene
that he compiles on the touch-sensitive screen of his handheld device reflects the spatial
situation as perceived from his point of view. The challenge in this context is to

communicate to the information retrieval system what kind of data is required, in this
case, a map of the pipes under ground. Integrating task-based ontologies and geo-mobile
information retrieval could enhance the quality of the query statement, i.e., the sketch,
considerably, and therefore increase the efficiency of the query process.
Kuhn (2002) proposes a method to derive ontologies of geographic domains from
natural language texts that describe human activities. The method takes the content of the
ontologies from textual descriptions of the task at hand. Such ontologies for geographic
information could also be applied to describe task-specific feature attribute catalogs,
which, if integrated in the user interface, could be part of the sketched scene. While this
approach seems promising, it also raises a number of difficult questions:
How do ontologies influence the formulation and the processing of geo-mobile
queries?
What are efficient techniques to combine task-based ontologies and geo-mobile
queries?
What are the formalisms that allow adapting the query process dynamically to a
task-based ontology?
6.3.4 Geo-Mobile Spatial Analysis
Geo-mobile spatial analysis is a technique for analyzing spatial configurations and
supporting decisions in the field. While such solutions promise fast and efficient analysis
in mobile environments, research in this field faces many challenges in terms of system
requirements, formalism of the sketched scene, and especially techniques that translate
the sketched scene into a statement that can be used for spatial analysis. To find solutions

that address these challenges adequately there are many issues that need to be
investigated:
How do people describe tasks related to spatial analysis in mobile
environments?
What is the theoretical foundation that allows integrating sketches and spatial
analysis?
What system architectures are necessary to perform geo-mobile spatial
analysis?
What modalities are appropriate to formulate statements for geo-mobile spatial
analysis?
REFERENCES
G. D. Abowd and E. D. Mynatt (2000) Charting Past, Present, and Future Research in
Ubiquitous Computing. ACM Transactions on Computer-Human Interaction 7(1):
29-58.
S. Acharya, R. Alonso, M. Franklin, and S. Zdonik (1995) Broadcast Disks: Data
Management for Asymmetric Communication Environments. in: 1995 ACM
SIGMOD International Conference on Management of Data: SIGMOD '95, San
Jose, CA.
G. Artem (2000) Management of Geographic Information in Mobile Environments. MS,
University of Jyvaskyla, Jyvaskyla, FIN.
D. Barbara (1999) Mobile Computing and Databases-A Survey. IEEE Transactions on
Knowledge and Data Engineering 1 l(1): 108- 1 18.
L. Bass, P. Clements, and R. Kazman (1997) Software Architecture in Practice. vol. 1.
1st ed., Addison-Wesley, Boston, MA.
A. Blaser (1998) Geo-Spatial Sketches: A study of people's sketching behavior and
strategies. University of Maine, National Center for Geographic Information and
Analysis, Orono, ME, Technical Report, July 1998.
A. D. Blaser (1997) User Interaction in a Sketch-Based GIs User Interface. in:
International Conference C 0 S I T ' 9 7, Laurel Highlands, PA.
A. D. Blaser (1 999) Prototype Application Sketcho! University of Maine, Department of
Spatial Information Science and Engineering and National Center for Geographic
Infom~ation and Analysis, Orono, ME, Technical Report TR99-1, February 22,
1999.
A. D. Blaser (2000) Sketching Spatial Queries. Ph.D., University of Maine, Orono, ME.
E. A. Brewer, R. H. Katz, E. Arnir, H. Balakrishnan, Y. Chawathe, A. Fox, S. D. Gribble,
T. Hodes, G. Nguyen, V. N. Padmanabhan, M. S t e m , S. Seshan, and T.

Henderson (1998) A Network Architecture for Heterogeneous Mobile
Computing. IEEE Personal Communications Magazine.
S. A. Brewster (2001) Overcoming the Lack of Screen Space on Mobile Computers.
Department of Computing Science, Glasgow University, Glasgow, April 2001.
C. Brooks, M. S. Mazer, S. Meeks, and J. Miller (1996) Application-Specific Proxy
Servers as HTTP Stream Transducers. in: 4th International World Wide Web
Conference: WWW-4.
T. D. Burd (2001) Energy-Ef#cient Processor System Design. Ph.D., University of
California, Berkeley.
J. Burkhardt, H. Hem, S. Hepper, K. Rindtorff, and T. Schaeck (2001) Pervasive
Computing: Technology and Architecture of Mobile Internet Applications,
Addison Wesley Professional.
B. P. Buttenfield (1993) NCGIA Research Initiative 3 - Multiple Representations.
National Center for Geographic Information and Analysis, Buffalo, Closing
Report, April.
L. Cappelletti (1998) Mobile Computing - Beyond Laptops. in: SIGDOC197, Snowbird,
Utah, USA.
K. Cheverst, N. Davies, K. Mitchell, A. Friday, and C. Efstratiou (2000) Developing a
Context-aware Electronic Tourist Guide: Some Issues and Experiences. in:
Proceedings of CHI 2000, Netherlands.
T. L. Cignetti, K. Komarov, and C. S. Ellis (2000) Energy Estimation Tools for the Palm.
in: ACM MSWiM 2000: Modeling, Analysis and Simulation of Wireless and
Mobile Systems.
W. S. Cleveland (1985) The Elements ofGraphing Data, Advanced Books and Software,
Monterey, CA.
M. Cooper (1996) A Layman's Guide to Cellular. Annual Review of Communications:
993-997.

P.-C. David and T. Ledoux (2002) Dynamic Adaptation of Non-Functional Concerns. in:
USE2002 - First International Workshop on Unanticipated Software Evolution,
Malaga, Spain.
J. Diamond (1997) The Curse of QWERTY. Accessed: April 2002,
http://208.245.156.153/archive/output.cfm?ID=1092.
R. M. Downs and D. Stea (1975) Image and environment: cognitive mapping and spatial
behaviour. in: Image and Environment; cognitive mapping and spatial behaviour,
E. Arnold, (Ed.), London.
M. Egenhofer (1991) Deficiencies of SQL as a GIs Query Language. in: Cognitive and
Linguistic Aspects of Geographic Space: An Introduction, vol. 63, pp. 477-492,
D. M. Mark and A. U. Frank, (Eds.), Kluwer Academic Publishers, Dordrecht,
Boston and London.
M. Egenhofer and A. U. Frank (1991) Query Languages for Geographic Information
Systems. National Center for Geographic Infom~ation and Analysis, Orono, ME.
M. Egenhofer (1992) Why not SQL! International Journal of Geographical Information
Systems 6(2): 71-85.
M. Egenhofer (1 993) What's Special about Spatial?--Database Requirements for Vehicle
Navigation in Geographic Space. in: SOGMOD '93, Washington.
M. Egenhofer (1996) Spatial-Query-by-Sketch. in: VL '96: IEEE Symposium on Visual
Languages, Boulder, CO.
C. S. Ellis (1999) The case for higher-level power management. in: 7th IEEE Workshop
on Hot Topics in Operating Systems, Rio Rico, AZ.
K. P. Fishkin, A. Gujar, B. L. Harrison, T. P. Moran, and R. Want (2000) Embodied User
Interfaces for Really Direct Manipulation. Communications of the ACM 43(9):
75-80.
J. Flinn and M. Satyanarayanan (1999) Energy-aware adaptation for mobile applications.
in: Symposium on Operating Systems Principles, Charleston, SC.

S. Freundschuh and M. Egenhofer (1997) Human Conceptions of Spaces: Implications
for GIs. Transactions in GIS 2(4): 36 1-375.
C. Gane and T. Sarson (1979) Structured Systems Analysis, Prentice-Hall, Englewood
Cliffs, NJ.
C. Ghezzi, M. Jazayeri, and D. Mandrioli (1991) Fundamentals of Software Engineering,
Upper Saddle River, NJ.
GIS-Lounge (2002) Mobile and Field GIs. Accessed: June 2002,
http://gislounge.com/1Vmobilegis.shtrnl.
R. Gruia-Catalin, G. P. Picco, and A. L. Mutphy (2000) Software Engineering for
Mobility: A Roadrnap. ACM Computing Suweys: 243-258.
J. Hewett (2002) Red laser projects virtual keyboard. Accessed: May 2002,
http://optics.org/articles/news/8/3/26/1.
K. Hinckley, J. Pierce, M. Sinclair, and E. Horvitz (2000) Sensing Techniques for Mobile
Interaction. in: ACM UIST 2000 Symposium on User Interface Software &
Technology.
T. Imielinski and B. R. Badrinath (1994) Mobile Wireless Computing: Challenges in
Data Management. Communications of the ACM 37(10): 18-28.
J. Jing, A. Helal, and A. Elmagarmid (1999) Client-Server Computing in Mobile
Environments. ACM Computing Suweys 3 l(2): 1 17- 157.
C. E. Jones, K. M. Sivalingam, P. Agrawal, and J.-C. Chen (2001) A Survey of Energy
Eficient Network Protocols for Wireless Networks. Wireless Networks 7(4): 343-
358.
R. H. Katz (1994) Adaptation and Mobility in Wireless Information Systems. IEEE
Personal Communications l(1): 6-1 7.
R. H. Katz (1995) Portable Computer: System Design and Packaging Issues. University
of California, Berkeley, October 1995.
G. B. Korte (2000) The GIS Book. 5 ed., OnWord Press, Florence, KY.

R. Kravets and P. Krishnan (2000) Application-driven power management for mobile
communication. Wireless Networks 6(4): 263-277.
S. Kristoffersen and F. Ljungberg (1999) Mobile Use of IT. in: 22nd Conference on
Information Systems Research Seminar in Scandinavia: IRIS 22, Keuruu, Finland.
G. H. Kuenning and G. J. Popek (1997) Automated Hoarding for Mobile Computers. in:
ACM Symposium on Operating Systems Principles: SIGOPS.
W. Kuhn (1995) 7+/-2 Questions and Answers about Metaphors for GIs Users. in:
Cognitive Aspects of Human-Computer Interaction for Geographic Information
Systems, vol. 83, pp. 113-122, T. L. Nyergers, (Ed.) Kluwer Academic Publishers,
Dordrecht, The etherl lands.
W. Kuhn (2002) Ontologies in support of activities in geographical space. International
Journal of Geographical Information Science 15(7): 61 3-63 1.
Y.-T. Lau (2000) The Art of Objects : object-oriented design and architecture. vol. 1 ,
Addison-Wesley Longman, Inc., Upper Saddle River, NJ.
K. Lynch (1960) The Image of the City, Technology Press Harvard University,
Cambridge, Massachusetts.
T. D. Marco (1 978) Structured Analysis and Systems Specifications, Yourdon Inc.
A. Marcus and E. Chen (2002) Designing the PDA of the Future. Interactions l(1): 34-
44.
T. L. Martin and D. P. Siewiorek (1999) The Impact of Battery Capacity and Memory
Bandwidth on CPU Speed-Settings: A Case Study. in: ISLPED, San Diego, CA,
USA.
J. Nielsen (1994) Response Times: The Three Important Limits. in: Usability
Engineering Morgan Kaufmam, San Francisco, CA.
D. A. Norman (1 998) The Invisible Computer, First MIT Press, Cambridge, MA.
Palm (2001) How to Enter Data into a Palm Handheld. Accessed: February 2002,
http://www.palm.com~products/input~.

J. Pascoe, N. Ryan, and D. Morse (2000) Using While Moving: HCI Issues in Fieldwork
Environments. ACM Transactions on Computer-Human Interaction 7(3): 417-
437.
E. Pitoura and B. Bhargava (1994) Building Information Systems for Mobile
Environments. in: Proceedings of the Third International Conference on
Information and Knowledge Management, Gaithesburg, MD.
T. F. L. Porta, K. K. Sabnani, and R. D. Gitlin (1996) Challenges for nomadic computing:
Mobility management and wireless comn~unications. Mobile Networks and
Applications 1 : 3- 1 6.
J. M. Rabaey (2001) Wireless Beyond the Third Generation - Facing the Energy
Challenge. in: ISLPED, Huntington Beach, CA, USA.
S. K. Rao (2000) An Architecture for Adaptable Wireless Networks. Master of Science,
Massachusetts Lnstitute of Technology.
J. Rumbaugh, I. Jacobson, and G. Booch (1998) The unifzed modelling language
reference manual. vol. 1. 1 ed., Addison-Wesley Longrnan, Inc., Reading,
Massachusetts.
M. Satyanarayanan, B. Noble, P. Kumar, and M. Price (1995) Application-Aware
Adaptation for Mobile Computing. School of Computer Science, Carnegie Mellon
University, Pittsburgh, PA, Technical Report CS-94- 183, October.
M. Satyanarayanan (1996a) Fundamental Challenges in Mobile Computing. in:
Symposium on Principles ofDistributed Computing.
M. Satyanarayanan (1996b) Mobile Information Access: Accessing Information on
Demand at any Location. IEEE Personal Communications 3(1): 26-33.
K. Sayood (2000) Introduction to Data Compression. 2 ed., Academic Press, A Harcourt
Science and Technology Company, San Diego, CA.
H. Shubin, D. Falck, and A. G. Johansen (1996) Exploring Color in Interface Design.
Interactions 3(4): 37-48.

M. Walkley (200 1) An Overview of the Wireless Infrastructure and Handset Markets.
Dain Rauscher Inc., Atlanta, Institutional Research, January 10,2001.
Webopedia (2001) QWERTY keyboard. Accessed: Nov 2002,
http:Nwww.webopedia.comtTERM/Q/QWERTY-keyboard.html.
G . Welch (1995) A Survey of Power Management Techniques in Mobile Computing
Operating Systems. SIGOPS-OSR ACM Operating Systems Review 29(4): 47-56.

BIOGRAPHY OF THE AUTHOR
David Caduff was b o n ~ in Ilanz, Switzerland on February 18, 1974. He was raised in
Degen, in Canton Grison, Switzerland. From 1990 to 1995 he worked as a land surveyor
with Cavigelli&Partners in Ilanz. In 1996 he began studies for a B.S. degree in the
department of Geodesy and Geoinfonnatics at the Institute of Technology and
Management in Basel, Switzerland. He concluded studies in 1998 earning Leica's award
for the best diploma thesis of the year in the field of Geodetic Science. From 1999 to
2000 he studied at the department of Computer Science in the same place, concluding
with a B.S. in Computer Science.
In 2000 he worked as a software developer with GEONOVA AG, Basel, BL,
Switzerland, before beginning studies leading to a MS at the University of Maine at
Orono, USA. Currently, he is working as a teaching assistant in the department of Spatial
Information Science at the University of Maine. David is a candidate for the Master of
Science degree in Spatial Infonnation Science and Engineering from The University of
Maine in December, 2002.