Size distribution, density and disturbance in two Mediterranean gorgonians: Paramuricea clavata and...
12
Journal of Applied Ecology 2008, 45, 688–699 doi: 10.1111/j.1365-2664.2007.01419.x © 2007 The Authors. Journal compilation © 2007 British Ecological Society Blackwell Publishing Ltd Size distribution, density and disturbance in two Mediterranean gorgonians: Paramuricea clavata and Eunicella singularis Cristina Linares 1,2 *, Rafel Coma 1 , Joaquim Garrabou 3 , David Díaz 4 and Mikel Zabala 5 1 Centre d’Estudis Avançats de Blanes (CEAB-CSIC), Accés Cala Sant Francesc 14, E-17300 Blanes, Girona, Spain; 2 Institut de Ciències del Mar (ICM-CSIC), Passeig Marítim 37– 49, E-08003 Barcelona, Spain; 3 COM-Station Marine d’Endoume, Rue de la Batterie des Lions, 13007 Marseille, France; 4 Instituto Español de Oceanografía, C/Moll de Ponent s/n, 07015 Palma de Mallorca, Spain; and 5 Departament d’Ecologia, Facultat de Biologia, Universitat de Barcelona, Diagonal 645, 08028 Barcelona, Spain Summary 1. Gorgonians are long-lived engineering species and their conservation is crucial to maintaining the biodiversity of marine communities. The slow dynamics displayed by these species make them especially vulnerable when faced with increasing disturbances. 2. The sessile nature and structural role of gorgonians provide several ecological similarities with trees, allowing the application of different approaches developed by forest ecology studies to overcome the constraint of long time-scales to collect valuable dynamic data. Using these approaches, we examined the distribution and demography of two representative Mediterranean gorgonian species, Paramuricea clavata and Eunicella singularis, along a regional spatial scale as well as their response to disturbances. 3. The regular spatial distribution and the upper distribution limit of E. singularis suggest that this species is more tolerant to a wide range of environmental conditions than P. clavata, which exhibited a more asymmetrical spatial distribution and variation in the upper distribution limit on the latitudinal scale. 4. Size distributions of both species showed contrasting population dynamics. The size distribution of E. singularis was characterized by initial stages of populations (0–10 cm) in contrast to the scarcity of this stage displayed by P. clavata. This suggests differences in recruitment between species. Furthermore, only P. clavata populations displayed a strong negative correlation between density and biomass with a slope close to –3/2, indicating a self-thinning mechanism and therefore the existence of a carrying capacity. This result and the trajectories of disturbed populations below the self-thinning line revealed this approach as a useful method to identify the effects of biological or physical disturbance. 5. Synthesis and applications. The approaches used in this study provide insights into management needs in face of the difficulty of having to deal with the population dynamics of very slow-growing threatened species. In particular, gorgonian populations can be used as an indicator of the effects of climatic anomalies on the coralligenous community. Key-words: conservation, demography, NW Mediterranean Sea, octocoral, partial mortality, self-thinning, spatial distribution Journal of Applied Ecology(2007) doi: 10.1111/j.1365-2664.2007.0@@@@.x Introduction The increase in frequency and impact of anthropogenic disturbances has led to diversity losses and changes in ecosystem functioning of a wide range of marine ecosystems (Botsford, Castilla & Peterson 1997; Gray 1997; Vitousek et al. 1997; Roberts & Hawkins 1999). Long-lived species displaying slow growth, late maturity and low fecundity are among those most affected by strong disturbances (Musick 1999) and, generally, their presence is crucial to maintaining the organiza- tion and diversity of the communities in which they dwell (Mills, Soule & Doak 1993; Jones, Lawton & Schachak 1994). *Correspondence author. E-mail: [email protected]
-
Upload
independent -
Category
Documents
-
view
0 -
download
0
Transcript of Size distribution, density and disturbance in two Mediterranean gorgonians: Paramuricea clavata and...
Journal of Applied Ecology
2008,
45
, 688–699 doi: 10.1111/j.1365-2664.2007.01419.x
© 2007 The Authors. Journal compilation © 2007 British Ecological Society
Blackwell Publishing Ltd
Size distribution, density and disturbance in two
Mediterranean gorgonians:
Paramuricea clavata
and
Eunicella singularis
Cristina Linares
1,2
*, Rafel Coma
1
, Joaquim Garrabou
3
, David Díaz
4
and Mikel Zabala
5
1
Centre d’Estudis Avançats de Blanes (CEAB-CSIC), Accés Cala Sant Francesc 14, E-17300 Blanes, Girona, Spain;
2
Institut de Ciències del Mar (ICM-CSIC), Passeig Marítim 37–49, E-08003 Barcelona, Spain;
3
COM-Station Marine d’Endoume, Rue de la Batterie des Lions, 13007 Marseille, France;
4
Instituto Español de Oceanografía, C/Moll de Ponent s/n, 07015 Palma de Mallorca, Spain; and
5
Departament d’Ecologia, Facultat de Biologia, Universitat de Barcelona, Diagonal
645, 08028 Barcelona, Spain
Summary
1.
Gorgonians are long-lived engineering species and their conservation is crucial to maintainingthe biodiversity of marine communities. The slow dynamics displayed by these species make themespecially vulnerable when faced with increasing disturbances.
2.
The sessile nature and structural role of gorgonians provide several ecological similarities withtrees, allowing the application of different approaches developed by forest ecology studies toovercome the constraint of long time-scales to collect valuable dynamic data. Using theseapproaches, we examined the distribution and demography of two representative Mediterraneangorgonian species,
Paramuricea clavata
and
Eunicella singularis
, along a regional spatial scale aswell as their response to disturbances.
3.
The regular spatial distribution and the upper distribution limit of
E. singularis
suggest that thisspecies is more tolerant to a wide range of environmental conditions than
P. clavata
, which exhibiteda more asymmetrical spatial distribution and variation in the upper distribution limit on thelatitudinal scale.
4.
Size distributions of both species showed contrasting population dynamics. The size distributionof
E. singularis
was characterized by initial stages of populations (0–10 cm) in contrast to thescarcity of this stage displayed by
P. clavata
. This suggests differences in recruitment betweenspecies. Furthermore, only
P. clavata
populations displayed a strong negative correlation betweendensity and biomass with a slope close to –3/2, indicating a self-thinning mechanism and thereforethe existence of a carrying capacity. This result and the trajectories of disturbed populations belowthe self-thinning line revealed this approach as a useful method to identify the effects of biologicalor physical disturbance.
5.
Synthesis and applications
. The approaches used in this study provide insights into managementneeds in face of the difficulty of having to deal with the population dynamics of very slow-growingthreatened species. In particular, gorgonian populations can be used as an indicator of the effectsof climatic anomalies on the coralligenous community.
Key-words:
conservation, demography, NW Mediterranean Sea, octocoral, partial mortality,self-thinning, spatial distribution
Journal of Applied Ecology
(2007) doi: 10.1111/j.1365-2664.2007.0@@@@.x
Introduction
The increase in frequency and impact of anthropogenicdisturbances has led to diversity losses and changes inecosystem functioning of a wide range of marine ecosystems
(Botsford, Castilla & Peterson 1997; Gray 1997; Vitousek
et al
.1997; Roberts & Hawkins 1999). Long-lived species displayingslow growth, late maturity and low fecundity are among thosemost affected by strong disturbances (Musick 1999) and,generally, their presence is crucial to maintaining the organiza-tion and diversity of the communities in which they dwell(Mills, Soule & Doak 1993; Jones, Lawton & Schachak 1994).
*Correspondence author. E-mail: [email protected]
Demographic approaches for gorgonian conservation
689
© 2007 The Authors. Journal compilation © 2007 British Ecological Society,
Journal of Applied Ecology
,
45
, 688 –699
In temperate marine habitats, most gorgonians are long-livedengineering species displaying slow population dynamics thatmake them especially vulnerable to anthropogenic disturbances(Garrabou & Harmelin 2002; Coma
et al
. 2004; Linares
et al
.2007). Thus, knowledge of their demographic characteristicsis the first step to developing a reliable conservation plan.Obtaining demographic data on large temporal and spatialscales could allow us to establish a baseline to determine themagnitude and intensity of disturbances and to anticipate thefuture trajectories of disturbed populations. Unfortunately,data regarding the life-history traits of most long-livedmarine species are difficult to acquire, especially over the largetemporal scales that are most appropriate given their long lifespans (Hughes & Connell 1999).
The sessile nature and structural role of gorgonians makethem ecologically similar to trees. The application of severaltheoretical and methodological advancements developedthrough forest ecology studies may therefore prove usefulfor the study of disturbances that are affecting these marinespecies.
Forest ecologists have overcome the constraint of requiringlong time-scales to collect valuable data on populationdynamics by using static size distributions to provide usefulinsights into many important macro-ecological phenomena(Niklas, Midgley & Hand 2003). Although they cannot beused to predict future growth or health accurately (Condit
et al
. 1998), size distributions coupled with measurements ofplant density have been used to explore specific demographicdynamics in response to past disturbances (Niklas, Midgley& Hand 2003). Furthermore, by assuming a substitution ofspace for time (Pickett 1989), this method can be used toreconstruct the expected population dynamics.
Another approach used extensively in forest ecology hasbeen the assessment of density-dependence on populationdynamics by means of examining the relationship betweensize/biomass and density. Ecologists have long recognized theeffects of intra- and interspecies competition and how it canalter the shape of populations in saturated landscapes asthey approach the carrying capacity of the ecosystem(Shinozaki & Kira 1956). Competition emerges in the formof a negative density-dependent effect when populationsbecome sufficiently dense. The exploration of self-thinningmechanisms in gorgonian populations and their size dis-tribution curves can allow us to predict population responsesto environmental changes when long-term monitoringcannot be conducted.
Two mass mortality events during the summers of 1999 and2003 affected Mediterranean gorgonians severely at a regionalscale (about 1000 km; Cerrano
et al
. 2000; Perez
et al
. 2000;Garrabou
et al
. 2001; Linares
et al
. 2005; Coma
et al
. 2006).Furthermore, a relationship between the occurrence of theseepisodes and climatic anomalies has been suggested whichwould imply an increase of these events as a result of globalclimate change (Cerrano
et al
. 2000; Coma
et al
. 2000; Perez
et al
. 2000; Garrabou
et al
. 2001; Coma & Ribes 2003).Therefore, an extensive survey was launched between 2002and early 2003 in order to evaluate the health of the shallowest
gorgonian populations along the Mediterranean Spanishcoast after the 1999 mass mortality event and to collectqualitative and quantitative demographic data aboutMediterranean gorgonian populations along a regionalspatial scale.
There were a number of goals of this study. First, to obtainreference data of density, size and injuries from the shallowestpopulations (which are more vulnerable to climatic anomalies)of two of the more abundant gorgonian species in the NWMediterranean, the red gorgonian
Paramuricea clavata
(Risso, 1826) and the white gorgonian
Eunicella singularis
(Esper, 1791), at a regional spatial scale; and secondly, tocharacterize the gorgonian populations in an attempt toexplain the current distribution patterns, emphasizing upperdepth distribution limit. Finally, to explore the applicabilityof classic forest ecology approaches to these marine species byexamining size distribution and self-thinning mechanismsto obtain an insight into the occurrence of recent or pastdisturbances to predict future population trajectories.
Materials and methods
D ISTRIBUTION
SURVEYS
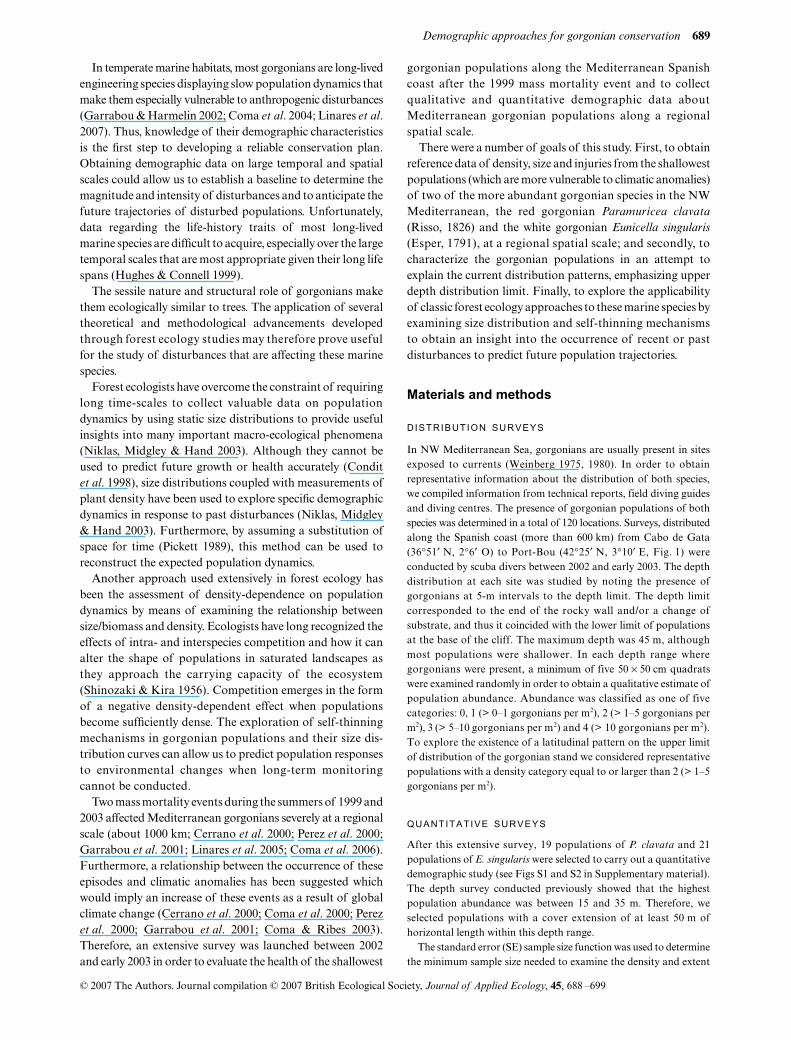
In NW Mediterranean Sea, gorgonians are usually present in sitesexposed to currents (Weinberg 1975, 1980). In order to obtainrepresentative information about the distribution of both species,we compiled information from technical reports, field diving guidesand diving centres. The presence of gorgonian populations of bothspecies was determined in a total of 120 locations. Surveys, distributedalong the Spanish coast (more than 600 km) from Cabo de Gata(36
°
51
′
N, 2
°
6
′
O) to Port-Bou (42
°
25
′
N, 3
°
10
′
E, Fig. 1) wereconducted by scuba divers between 2002 and early 2003. The depthdistribution at each site was studied by noting the presence ofgorgonians at 5-m intervals to the depth limit. The depth limitcorresponded to the end of the rocky wall and/or a change ofsubstrate, and thus it coincided with the lower limit of populationsat the base of the cliff. The maximum depth was 45 m, althoughmost populations were shallower. In each depth range wheregorgonians were present, a minimum of five 50
×
50 cm quadratswere examined randomly in order to obtain a qualitative estimate ofpopulation abundance. Abundance was classified as one of fivecategories: 0, 1 (> 0–1 gorgonians per m
2
), 2 (> 1–5 gorgonians perm
2
), 3 (> 5–10 gorgonians per m
2
) and 4 (> 10 gorgonians per m
2
).To explore the existence of a latitudinal pattern on the upper limitof distribution of the gorgonian stand we considered representativepopulations with a density category equal to or larger than 2 (> 1–5gorgonians per m
2
).
QUANTITATIVE
SURVEYS
After this extensive survey, 19 populations of
P. clavata
and 21populations of
E. singularis
were selected to carry out a quantitativedemographic study (see Figs S1 and S2 in Supplementary material).The depth survey conducted previously showed that the highestpopulation abundance was between 15 and 35 m. Therefore, weselected populations with a cover extension of at least 50 m ofhorizontal length within this depth range.
The standard error (SE) sample size function was used to determinethe minimum sample size needed to examine the density and extent
690
C. Linares
et al.
© 2007 The Authors. Journal compilation © 2007 British Ecological Society,
Journal of Applied Ecology
,
45
, 688 –699
of injury of the colonies at each site. In a previous study the minimumsample size for
E. singularis
was estimated to be of 1·75 m
2
and 50colonies, when the variance of the density and extent of injury stabilizedat approximately 5–10% of the mean (Coma
et al
. 2006). For
P. clavata
, preliminary sampling was conducted at one of the sitesby examining 17 m
2
using 50
×
50 cm quadrats placed randomly onthe substrate between 17 and 22 m depth. The SE as a proportion ofthe mean of density decreased quickly with increasing sample sizeand their stabilization was obtained at a sample size of 1·5 m
2
,where the variance became approximately 10% of the mean. The SEas a proportion of the mean of the extent of injury of the colo-nies also decreased quickly with increasing sample size, remain-ing at a variance about 15–20% of the mean from a sample size of50–60 colonies (R. Coma, unpublished data).
Density was estimated by means of examining all colonies within50
×
50 cm quadrats or in a belt transect plotted randomly throughthe site on scuba diving. The method used was selected in order toaccommodate the extreme variability of density (mainly in
E. singularis
),with the objective of measuring at least the minimum sample size interms of colony number. For each colony, we measured maximumheight and the extent of injury of colony surface (i.e. denudedaxis or overgrowth by other organisms, Harmelin
et al
. 1999). For
P. clavata
, both descriptors were used to estimate the live biomass ofeach colony following a previously adjusted function relating maximumheight and biomass (Coma
et al
. 1998), which was corrected forthe proportion of injured surface (Linares
et al
. 2005). Data on thevariation of the extent of injury of the colonies among localities andwith depth were arc-tan transformed and analysed using one-way
Fig. 1. Map of the study area. Explored sites without gorgonian (solid circles; n = 45), Paramuricea clavata populations (open triangles; n = 23),Eunicella singularis populations (open squares; n = 67)
Demographic approaches for gorgonian conservation
691
© 2007 The Authors. Journal compilation © 2007 British Ecological Society,
Journal of Applied Ecology
,
45
, 688 –699
analysis of variance (
anova
) tests. Pearson’s product–moment correla-tion (Sokal & Rohlf 1995) was used to examine the relationship ofthe different demographic parameters estimated with depth.
S IZE
D ISTRIBUTION
AND
SELF
-
THINNING
ANALYSIS
The size distribution curve was analysed in terms of descriptivestatistics using skewness and kurtosis. Skewness (g
1
) is a measure ofthe symmetry of a distribution using its mean. If skewness is significant,the distribution is asymmetric. Positive skewness indicates theprevalence of small size classes in the population, while negativeskewness points to the dominance of large size classes. Kurtosis (g
2
)is a measure of the peakedness of a distribution near its centralmodel. A significant value of kurtosis indicates that the variablehas longer tails than those for a normal distribution and thereforethe prevalence of a particular size class in the population. Skewnessand kurtosis coefficients are significant if g
1
per SES (standarderror of skewness) or g
2
per SEK (standard error of kurtosis) isgreater than 2 (Sokal & Rohlf 1995).
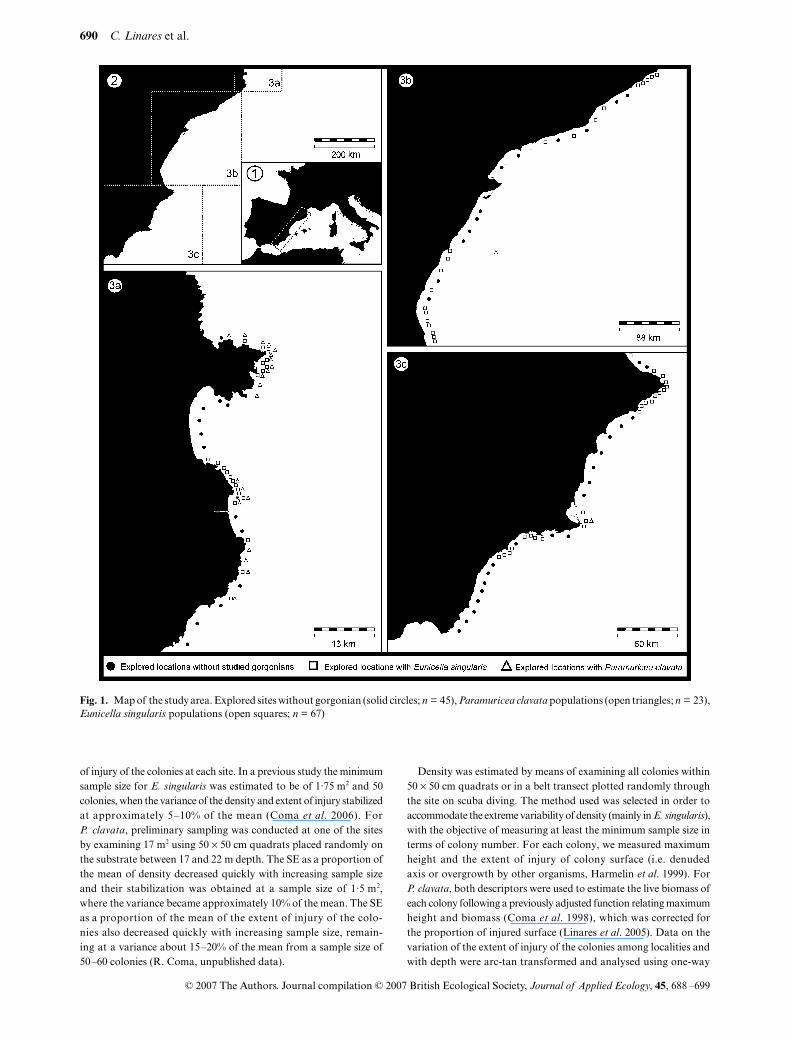
To determine occurrence of self-thinning, we plotted the log meanbiomass (in the case of
E. singularis
we used the log mean heightbecause currently we do not have a height–biomass relationship) vs.the log of density. These plots also allowed us to explore the existenceof past or current disturbances on populations. In non-disturbedpopulations subjected to self-thinning by intraspecific competition,an ideal trajectory (Fig. 2) may be traced from foundation to themature state: starting in the lower right corner of the plot with alarge number of colonies of small size, first moving vertically(growing without loss of density) to reach the biomass saturationpoint, next moving to the upper-left corner along the expected line(slope of –3/2 for density–biomass relationship and slope of –1/2 fordensity–height relationship, Yoda
et al
. 1963; White 1981) under aself-thinning process by means of colony growth and density decline(Adler 1996). However, if populations are affected by disturbance,we expect both their position to be displaced far below the self-thinning line due to a loss in both density and biomass (Fig. 2).
The validity of these assumptions was tested on data from aprevious monitoring of two
P. clavata
populations affected by the 1999mass mortality event at Port-Cros National Park (France) conductedbefore, just after and again 4 years after the event (Linares
et al
. 2005).
Results
LAT ITUDINAL
D ISTRIBUTION
Among the 120 locations explored along the 600 km coastlineof the studied area, we found
E. singularis
populations in 67locations and
P. clavata
populations in 23 locations. The twospecies were found together in 18 locations and neitherspecies was observed in 45 locations (Fig. 1).
The species differed in the patterns of distribution alongthe latitudinal gradient.
E. singularis
was distributed more orless regularly, whereas
P. clavata
showed more contagious andasymmetric distribution with populations more common innorthern than in the southern areas (Fig. 1).
UPPER
DEPTH
D ISTRIBUTION
L IMIT
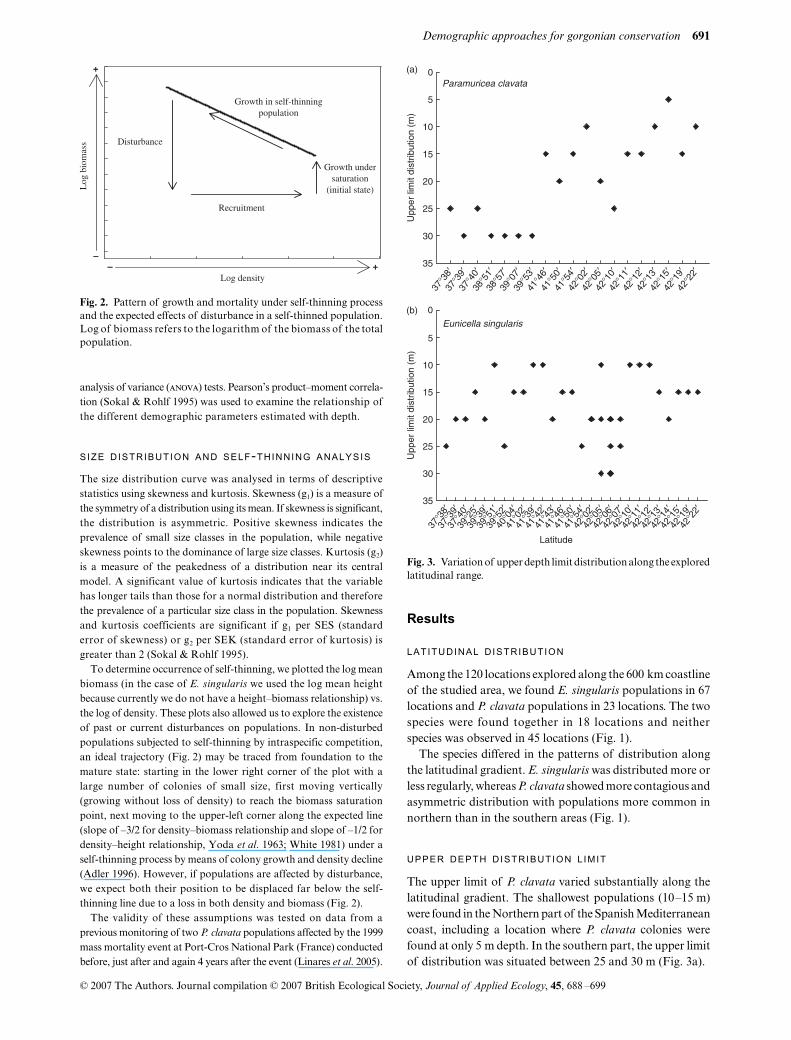
The upper limit of
P. clavata
varied substantially along thelatitudinal gradient. The shallowest populations (10–15 m)were found in the Northern part of the Spanish Mediterraneancoast, including a location where
P. clavata
colonies werefound at only 5 m depth. In the southern part, the upper limitof distribution was situated between 25 and 30 m (Fig. 3a).
Fig. 2. Pattern of growth and mortality under self-thinning processand the expected effects of disturbance in a self-thinned population.Log of biomass refers to the logarithm of the biomass of the totalpopulation.
Fig. 3. Variation of upper depth limit distribution along the exploredlatitudinal range.
692
C. Linares
et al.
© 2007 The Authors. Journal compilation © 2007 British Ecological Society,
Journal of Applied Ecology
,
45
, 688 –699
The upper limit of distribution of
E. singularis
also rangedbetween 10 and 30 m but did not show any clear pattern alongthe latitudinal range (Fig. 3b).
PARTIAL
AND
TOTAL
MORTALITY
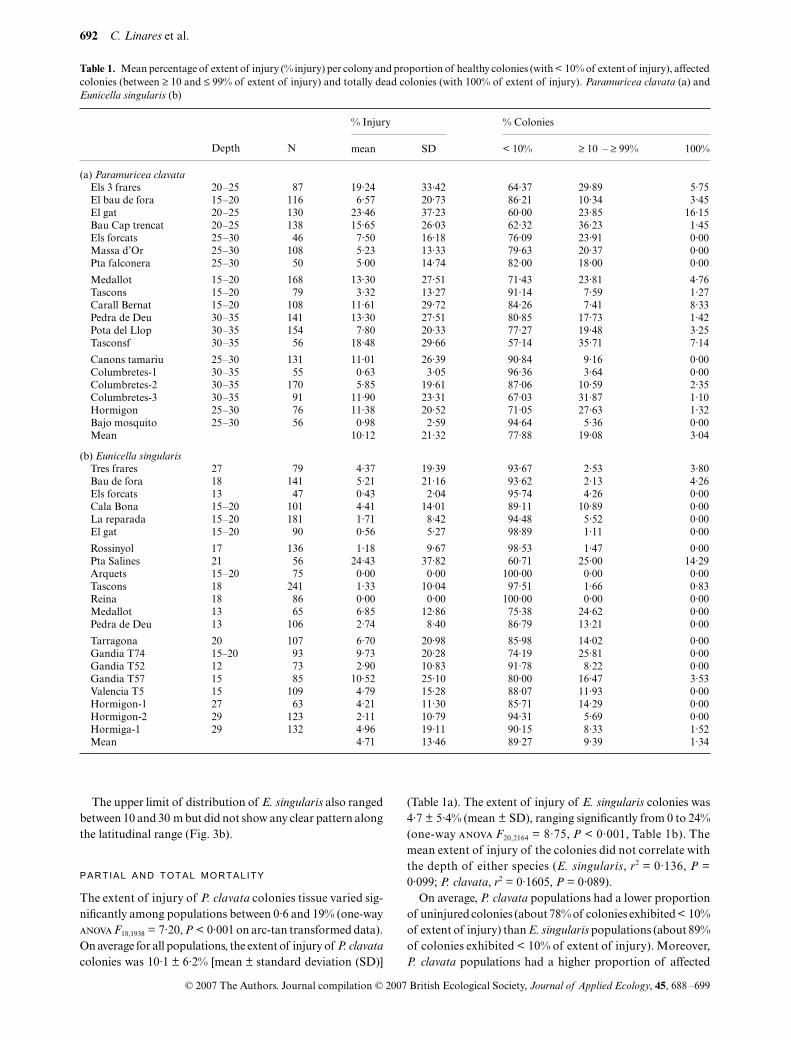
The extent of injury of P. clavata colonies tissue varied sig-nificantly among populations between 0·6 and 19% (one-wayanova F18,1938 = 7·20, P < 0·001 on arc-tan transformed data).On average for all populations, the extent of injury of P. clavatacolonies was 10·1 ± 6·2% [mean ± standard deviation (SD)]
(Table 1a). The extent of injury of E. singularis colonies was4·7 ± 5·4% (mean ± SD), ranging significantly from 0 to 24%(one-way anova F20,2164 = 8·75, P < 0·001, Table 1b). Themean extent of injury of the colonies did not correlate withthe depth of either species (E. singularis, r2 = 0·136, P =0·099; P. clavata, r2 = 0·1605, P = 0·089).
On average, P. clavata populations had a lower proportionof uninjured colonies (about 78% of colonies exhibited < 10%of extent of injury) than E. singularis populations (about 89%of colonies exhibited < 10% of extent of injury). Moreover,P. clavata populations had a higher proportion of affected
Table 1. Mean percentage of extent of injury (% injury) per colony and proportion of healthy colonies (with < 10% of extent of injury), affectedcolonies (between ≥ 10 and ≤ 99% of extent of injury) and totally dead colonies (with 100% of extent of injury). Paramuricea clavata (a) andEunicella singularis (b)
Depth N
% Injury % Colonies
mean SD < 10% ≥ 10 – ≥ 99% 100%
(a) Paramuricea clavataEls 3 frares 20–25 87 19·24 33·42 64·37 29·89 5·75El bau de fora 15–20 116 6·57 20·73 86·21 10·34 3·45El gat 20–25 130 23·46 37·23 60·00 23·85 16·15Bau Cap trencat 20–25 138 15·65 26·03 62·32 36·23 1·45Els forcats 25–30 46 7·50 16·18 76·09 23·91 0·00Massa d’Or 25–30 108 5·23 13·33 79·63 20·37 0·00Pta falconera 25–30 50 5·00 14·74 82·00 18·00 0·00
Medallot 15–20 168 13·30 27·51 71·43 23·81 4·76Tascons 15–20 79 3·32 13·27 91·14 7·59 1·27Carall Bernat 15–20 108 11·61 29·72 84·26 7·41 8·33Pedra de Deu 30–35 141 13·30 27·51 80·85 17·73 1·42Pota del Llop 30–35 154 7·80 20·33 77·27 19·48 3·25Tasconsf 30–35 56 18·48 29·66 57·14 35·71 7·14
Canons tamariu 25–30 131 11·01 26·39 90·84 9·16 0·00Columbretes-1 30–35 55 0·63 3·05 96·36 3·64 0·00Columbretes-2 30–35 170 5·85 19·61 87·06 10·59 2·35Columbretes-3 30–35 91 11·90 23·31 67·03 31·87 1·10Hormigon 25–30 76 11·38 20·52 71·05 27·63 1·32Bajo mosquito 25–30 56 0·98 2·59 94·64 5·36 0·00Mean 10·12 21·32 77·88 19·08 3·04
(b) Eunicella singularisTres frares 27 79 4·37 19·39 93·67 2·53 3·80Bau de fora 18 141 5·21 21·16 93·62 2·13 4·26Els forcats 13 47 0·43 2·04 95·74 4·26 0·00Cala Bona 15–20 101 4·41 14·01 89·11 10·89 0·00La reparada 15–20 181 1·71 8·42 94·48 5·52 0·00El gat 15–20 90 0·56 5·27 98·89 1·11 0·00
Rossinyol 17 136 1·18 9·67 98·53 1·47 0·00Pta Salines 21 56 24·43 37·82 60·71 25·00 14·29Arquets 15–20 75 0·00 0·00 100·00 0·00 0·00Tascons 18 241 1·33 10·04 97·51 1·66 0·83Reina 18 86 0·00 0·00 100·00 0·00 0·00Medallot 13 65 6·85 12·86 75·38 24·62 0·00Pedra de Deu 13 106 2·74 8·40 86·79 13·21 0·00
Tarragona 20 107 6·70 20·98 85·98 14·02 0·00Gandia T74 15–20 93 9·73 20·28 74·19 25·81 0·00Gandia T52 12 73 2·90 10·83 91·78 8·22 0·00Gandia T57 15 85 10·52 25·10 80·00 16·47 3·53Valencia T5 15 109 4·79 15·28 88·07 11·93 0·00Hormigon-1 27 63 4·21 11·30 85·71 14·29 0·00Hormigon-2 29 123 2·11 10·79 94·31 5·69 0·00Hormiga-1 29 132 4·96 19·11 90·15 8·33 1·52Mean 4·71 13·46 89·27 9·39 1·34
Demographic approaches for gorgonian conservation 693
© 2007 The Authors. Journal compilation © 2007 British Ecological Society, Journal of Applied Ecology, 45, 688 –699
(> 10% of extent of injury) or dead colonies (19% and 3%for P. clavata in contrast to 9% and 1% for E. singularis,respectively, Table 1a,b).
DENSITY AND MEAN COLONY HEIGHT
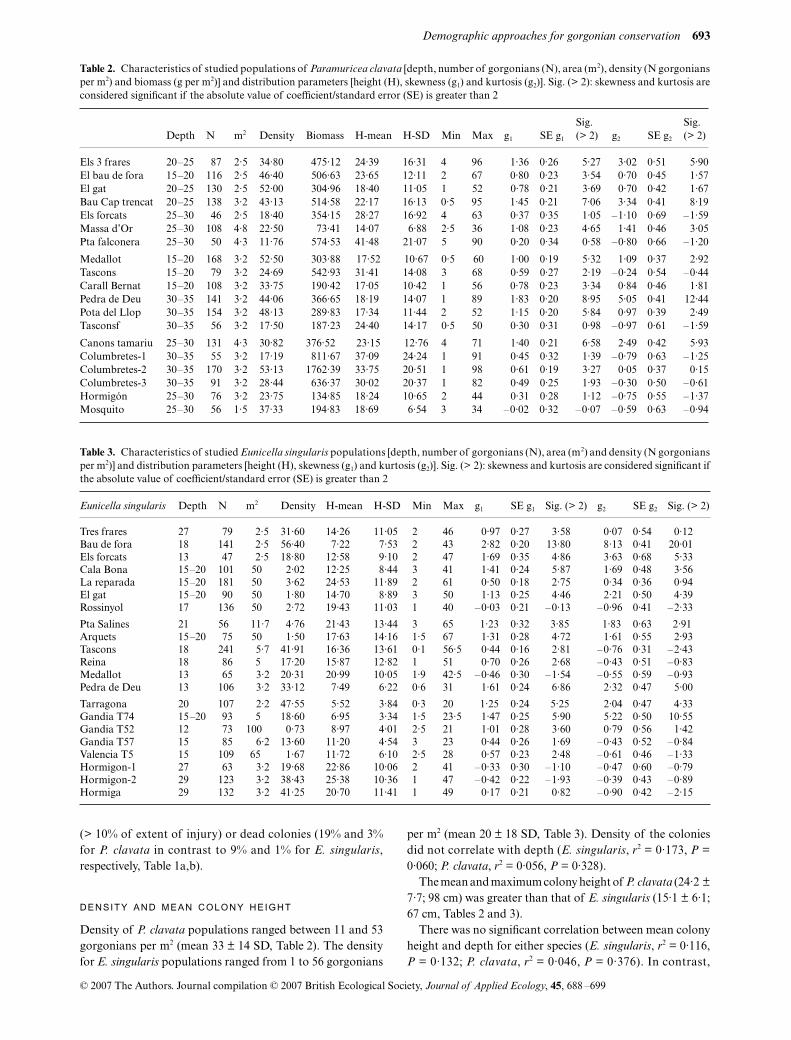
Density of P. clavata populations ranged between 11 and 53gorgonians per m2 (mean 33 ± 14 SD, Table 2). The densityfor E. singularis populations ranged from 1 to 56 gorgonians
per m2 (mean 20 ± 18 SD, Table 3). Density of the coloniesdid not correlate with depth (E. singularis, r2 = 0·173, P =0·060; P. clavata, r2 = 0·056, P = 0·328).
The mean and maximum colony height of P. clavata (24·2 ±7·7; 98 cm) was greater than that of E. singularis (15·1 ± 6·1;67 cm, Tables 2 and 3).
There was no significant correlation between mean colonyheight and depth for either species (E. singularis, r2 = 0·116,P = 0·132; P. clavata, r2 = 0·046, P = 0·376). In contrast,
Table 2. Characteristics of studied populations of Paramuricea clavata [depth, number of gorgonians (N), area (m2), density (N gorgoniansper m2) and biomass (g per m2)] and distribution parameters [height (H), skewness (g1) and kurtosis (g2)]. Sig. (> 2): skewness and kurtosis areconsidered significant if the absolute value of coefficient/standard error (SE) is greater than 2
Depth N m2 Density Biomass H-mean H-SD Min Max g1 SE g1
Sig. (> 2) g2 SE g2
Sig. (> 2)
Els 3 frares 20–25 87 2·5 34·80 475·12 24·39 16·31 4 96 1·36 0·26 5·27 3·02 0·51 5·90El bau de fora 15–20 116 2·5 46·40 506·63 23·65 12·11 2 67 0·80 0·23 3·54 0·70 0·45 1·57El gat 20–25 130 2·5 52·00 304·96 18·40 11·05 1 52 0·78 0·21 3·69 0·70 0·42 1·67Bau Cap trencat 20–25 138 3·2 43·13 514·58 22·17 16·13 0·5 95 1·45 0·21 7·06 3·34 0·41 8·19Els forcats 25–30 46 2·5 18·40 354·15 28·27 16·92 4 63 0·37 0·35 1·05 –1·10 0·69 –1·59Massa d’Or 25–30 108 4·8 22·50 73·41 14·07 6·88 2·5 36 1·08 0·23 4·65 1·41 0·46 3·05Pta falconera 25–30 50 4·3 11·76 574·53 41·48 21·07 5 90 0·20 0·34 0·58 –0·80 0·66 –1·20
Medallot 15–20 168 3·2 52·50 303·88 17·52 10·67 0·5 60 1·00 0·19 5·32 1·09 0·37 2·92Tascons 15–20 79 3·2 24·69 542·93 31·41 14·08 3 68 0·59 0·27 2·19 –0·24 0·54 –0·44Carall Bernat 15–20 108 3·2 33·75 190·42 17·05 10·42 1 56 0·78 0·23 3·34 0·84 0·46 1·81Pedra de Deu 30–35 141 3·2 44·06 366·65 18·19 14·07 1 89 1·83 0·20 8·95 5·05 0·41 12·44Pota del Llop 30–35 154 3·2 48·13 289·83 17·34 11·44 2 52 1·15 0·20 5·84 0·97 0·39 2·49Tasconsf 30–35 56 3·2 17·50 187·23 24·40 14·17 0·5 50 0·30 0·31 0·98 –0·97 0·61 –1·59
Canons tamariu 25–30 131 4·3 30·82 376·52 23·15 12·76 4 71 1·40 0·21 6·58 2·49 0·42 5·93Columbretes-1 30–35 55 3·2 17·19 811·67 37·09 24·24 1 91 0·45 0·32 1·39 –0·79 0·63 –1·25Columbretes-2 30–35 170 3·2 53·13 1762·39 33·75 20·51 1 98 0·61 0·19 3·27 0·05 0·37 0·15Columbretes-3 30–35 91 3·2 28·44 636·37 30·02 20·37 1 82 0·49 0·25 1·93 –0·30 0·50 –0·61Hormigón 25–30 76 3·2 23·75 134·85 18·24 10·65 2 44 0·31 0·28 1·12 –0·75 0·55 –1·37Mosquito 25–30 56 1·5 37·33 194·83 18·69 6·54 3 34 –0·02 0·32 –0·07 –0·59 0·63 –0·94
Table 3. Characteristics of studied Eunicella singularis populations [depth, number of gorgonians (N), area (m2) and density (N gorgoniansper m2)] and distribution parameters [height (H), skewness (g1) and kurtosis (g2)]. Sig. (> 2): skewness and kurtosis are considered significant ifthe absolute value of coefficient/standard error (SE) is greater than 2
Eunicella singularis Depth N m2 Density H-mean H-SD Min Max g1 SE g1 Sig. (> 2) g2 SE g2 Sig. (> 2)
Tres frares 27 79 2·5 31·60 14·26 11·05 2 46 0·97 0·27 3·58 0·07 0·54 0·12Bau de fora 18 141 2·5 56·40 7·22 7·53 2 43 2·82 0·20 13·80 8·13 0·41 20·01Els forcats 13 47 2·5 18·80 12·58 9·10 2 47 1·69 0·35 4·86 3·63 0·68 5·33Cala Bona 15–20 101 50 2·02 12·25 8·44 3 41 1·41 0·24 5·87 1·69 0·48 3·56La reparada 15–20 181 50 3·62 24·53 11·89 2 61 0·50 0·18 2·75 0·34 0·36 0·94El gat 15–20 90 50 1·80 14·70 8·89 3 50 1·13 0·25 4·46 2·21 0·50 4·39Rossinyol 17 136 50 2·72 19·43 11·03 1 40 –0·03 0·21 –0·13 –0·96 0·41 –2·33
Pta Salines 21 56 11·7 4·76 21·43 13·44 3 65 1·23 0·32 3·85 1·83 0·63 2·91Arquets 15–20 75 50 1·50 17·63 14·16 1·5 67 1·31 0·28 4·72 1·61 0·55 2·93Tascons 18 241 5·7 41·91 16·36 13·61 0·1 56·5 0·44 0·16 2·81 –0·76 0·31 –2·43Reina 18 86 5 17·20 15·87 12·82 1 51 0·70 0·26 2·68 –0·43 0·51 –0·83Medallot 13 65 3·2 20·31 20·99 10·05 1·9 42·5 –0·46 0·30 –1·54 –0·55 0·59 –0·93Pedra de Deu 13 106 3·2 33·12 7·49 6·22 0·6 31 1·61 0·24 6·86 2·32 0·47 5·00
Tarragona 20 107 2·2 47·55 5·52 3·84 0·3 20 1·25 0·24 5·25 2·04 0·47 4·33Gandia T74 15–20 93 5 18·60 6·95 3·34 1·5 23·5 1·47 0·25 5·90 5·22 0·50 10·55Gandia T52 12 73 100 0·73 8·97 4·01 2·5 21 1·01 0·28 3·60 0·79 0·56 1·42Gandia T57 15 85 6·2 13·60 11·20 4·54 3 23 0·44 0·26 1·69 –0·43 0·52 –0·84Valencia T5 15 109 65 1·67 11·72 6·10 2·5 28 0·57 0·23 2·48 –0·61 0·46 –1·33Hormigon-1 27 63 3·2 19·68 22·86 10·06 2 41 –0·33 0·30 –1·10 –0·47 0·60 –0·79Hormigon-2 29 123 3·2 38·43 25·38 10·36 1 47 –0·42 0·22 –1·93 –0·39 0·43 –0·89Hormiga 29 132 3·2 41·25 20·70 11·41 1 49 0·17 0·21 0·82 –0·90 0·42 –2·15
694 C. Linares et al.
© 2007 The Authors. Journal compilation © 2007 British Ecological Society, Journal of Applied Ecology, 45, 688 –699
maximum height increased with depth for both species(E. singularis, r2 = 0·926, P < 0·05; P. clavata, r2 = 0·904,P < 0·05).
SIZE DISTRIBUTIONS
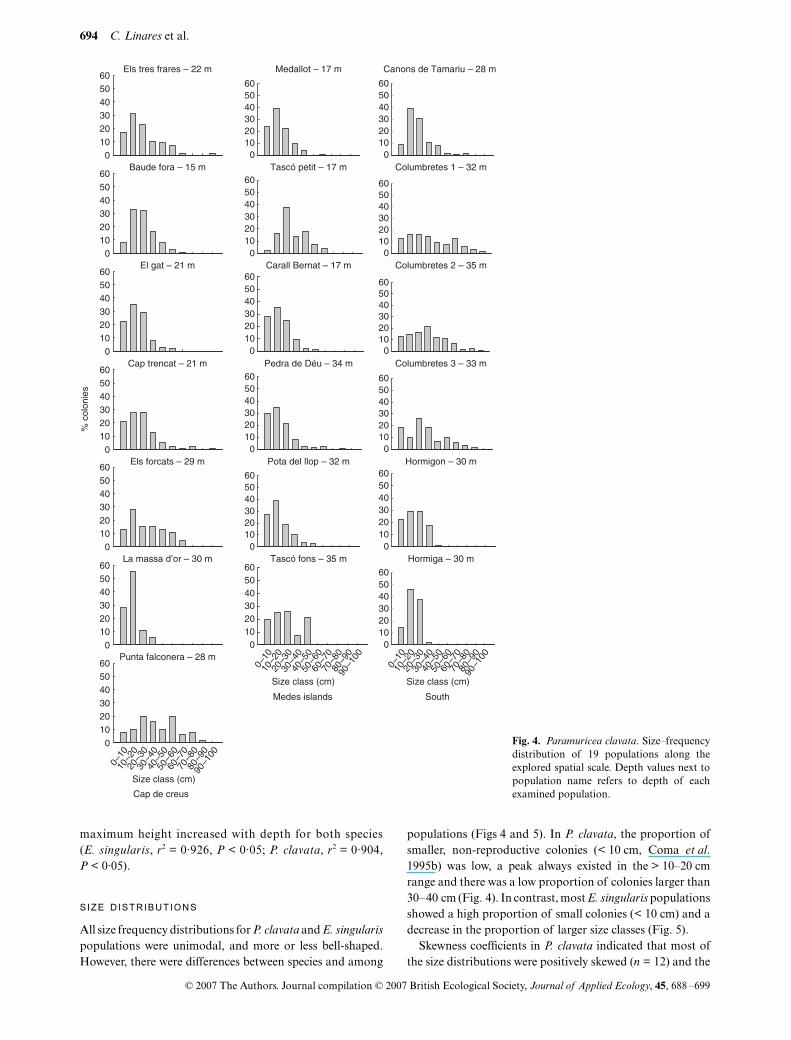
All size frequency distributions for P. clavata and E. singularispopulations were unimodal, and more or less bell-shaped.However, there were differences between species and among
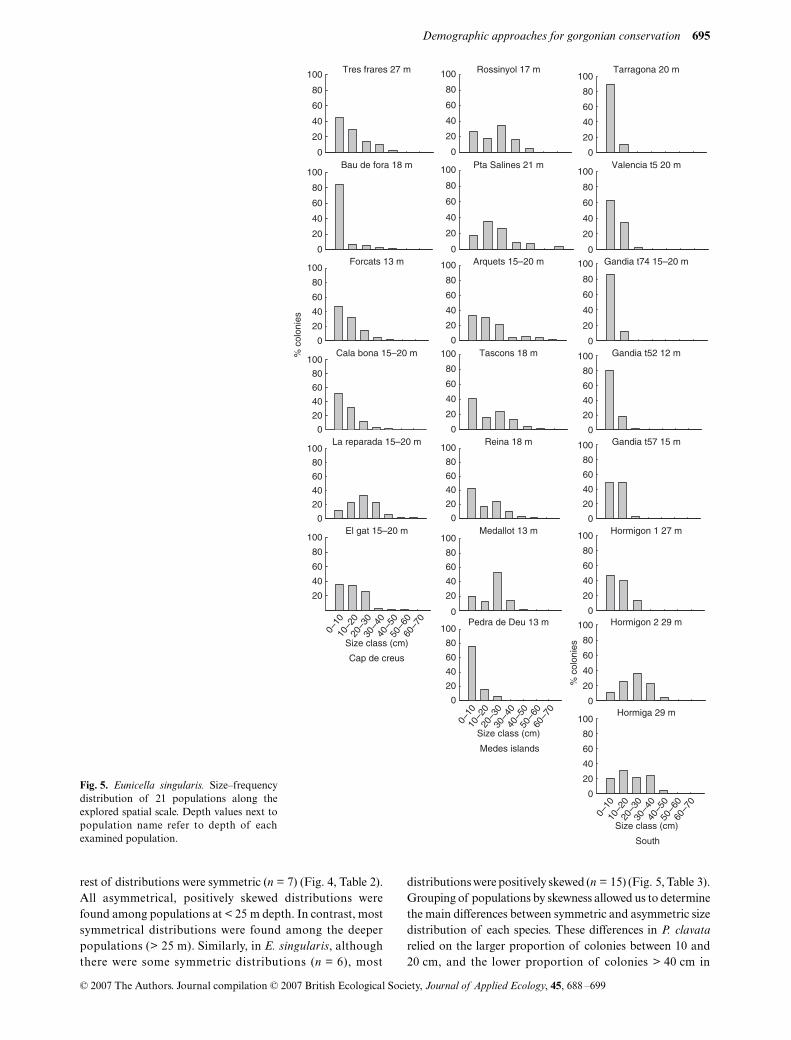
populations (Figs 4 and 5). In P. clavata, the proportion ofsmaller, non-reproductive colonies (< 10 cm, Coma et al.1995b) was low, a peak always existed in the > 10–20 cmrange and there was a low proportion of colonies larger than30–40 cm (Fig. 4). In contrast, most E. singularis populationsshowed a high proportion of small colonies (< 10 cm) and adecrease in the proportion of larger size classes (Fig. 5).
Skewness coefficients in P. clavata indicated that most ofthe size distributions were positively skewed (n = 12) and the
Fig. 4. Paramuricea clavata. Size–frequencydistribution of 19 populations along theexplored spatial scale. Depth values next topopulation name refers to depth of eachexamined population.
Demographic approaches for gorgonian conservation 695
© 2007 The Authors. Journal compilation © 2007 British Ecological Society, Journal of Applied Ecology, 45, 688 –699
rest of distributions were symmetric (n = 7) (Fig. 4, Table 2).All asymmetrical, positively skewed distributions werefound among populations at < 25 m depth. In contrast, mostsymmetrical distributions were found among the deeperpopulations (> 25 m). Similarly, in E. singularis, althoughthere were some symmetric distributions (n = 6), most
distributions were positively skewed (n = 15) (Fig. 5, Table 3).Grouping of populations by skewness allowed us to determinethe main differences between symmetric and asymmetric sizedistribution of each species. These differences in P. clavatarelied on the larger proportion of colonies between 10 and20 cm, and the lower proportion of colonies > 40 cm in
Fig. 5. Eunicella singularis. Size–frequencydistribution of 21 populations along theexplored spatial scale. Depth values next topopulation name refer to depth of eachexamined population.
696 C. Linares et al.
© 2007 The Authors. Journal compilation © 2007 British Ecological Society, Journal of Applied Ecology, 45, 688 –699
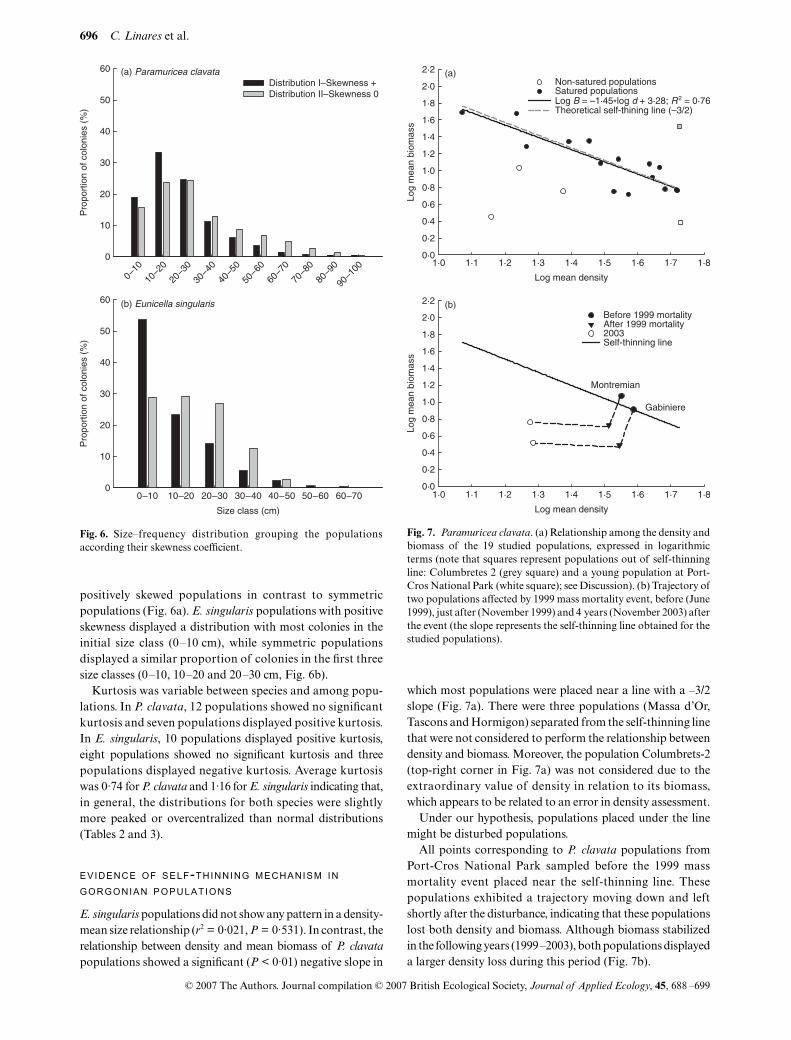
positively skewed populations in contrast to symmetricpopulations (Fig. 6a). E. singularis populations with positiveskewness displayed a distribution with most colonies in theinitial size class (0–10 cm), while symmetric populationsdisplayed a similar proportion of colonies in the first threesize classes (0–10, 10–20 and 20–30 cm, Fig. 6b).
Kurtosis was variable between species and among popu-lations. In P. clavata, 12 populations showed no significantkurtosis and seven populations displayed positive kurtosis.In E. singularis, 10 populations displayed positive kurtosis,eight populations showed no significant kurtosis and threepopulations displayed negative kurtosis. Average kurtosiswas 0·74 for P. clavata and 1·16 for E. singularis indicating that,in general, the distributions for both species were slightlymore peaked or overcentralized than normal distributions(Tables 2 and 3).
EVIDENCE OF SELF-THINNING MECHANISM IN GORGONIAN POPULATIONS
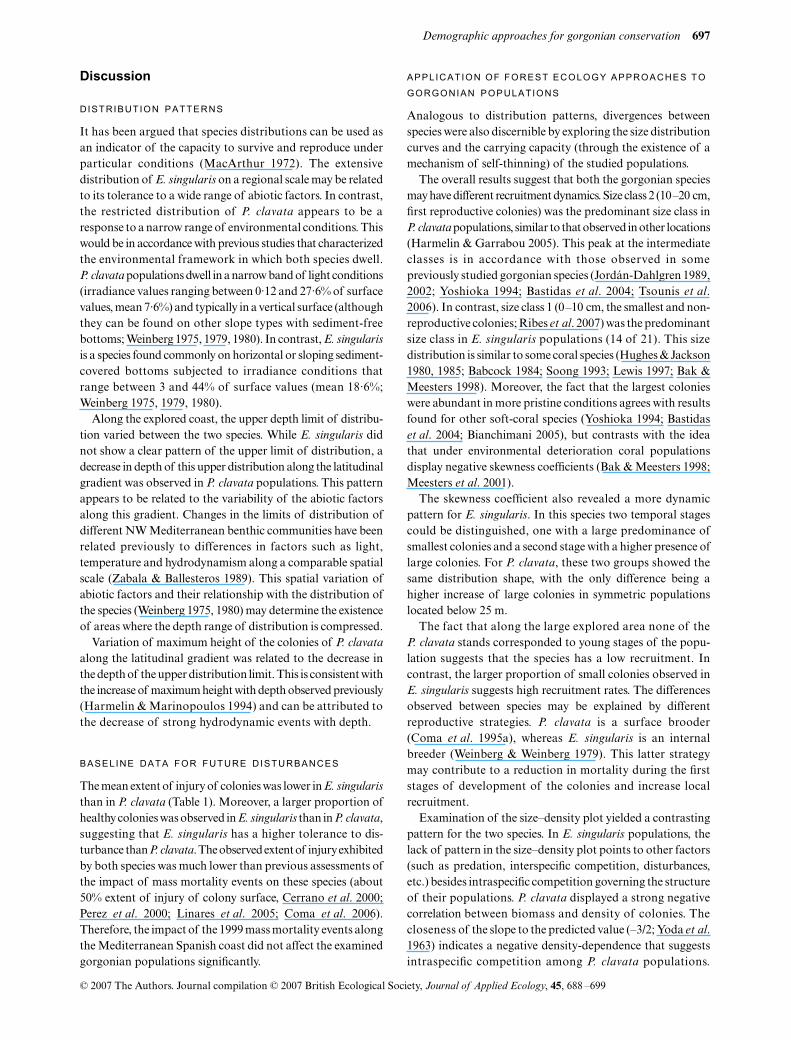
E. singularis populations did not show any pattern in a density-mean size relationship (r2 = 0·021, P = 0·531). In contrast, therelationship between density and mean biomass of P. clavatapopulations showed a significant (P < 0·01) negative slope in
which most populations were placed near a line with a –3/2slope (Fig. 7a). There were three populations (Massa d’Or,Tascons and Hormigon) separated from the self-thinning linethat were not considered to perform the relationship betweendensity and biomass. Moreover, the population Columbrets-2(top-right corner in Fig. 7a) was not considered due to theextraordinary value of density in relation to its biomass,which appears to be related to an error in density assessment.
Under our hypothesis, populations placed under the linemight be disturbed populations.
All points corresponding to P. clavata populations fromPort-Cros National Park sampled before the 1999 massmortality event placed near the self-thinning line. Thesepopulations exhibited a trajectory moving down and leftshortly after the disturbance, indicating that these populationslost both density and biomass. Although biomass stabilizedin the following years (1999–2003), both populations displayeda larger density loss during this period (Fig. 7b).
Fig. 6. Size–frequency distribution grouping the populationsaccording their skewness coefficient.
Fig. 7. Paramuricea clavata. (a) Relationship among the density andbiomass of the 19 studied populations, expressed in logarithmicterms (note that squares represent populations out of self-thinningline: Columbretes 2 (grey square) and a young population at Port-Cros National Park (white square); see Discussion). (b) Trajectory oftwo populations affected by 1999 mass mortality event, before (June1999), just after (November 1999) and 4 years (November 2003) afterthe event (the slope represents the self-thinning line obtained for thestudied populations).
Demographic approaches for gorgonian conservation 697
© 2007 The Authors. Journal compilation © 2007 British Ecological Society, Journal of Applied Ecology, 45, 688 –699
Discussion
DISTRIBUTION PATTERNS
It has been argued that species distributions can be used asan indicator of the capacity to survive and reproduce underparticular conditions (MacArthur 1972). The extensivedistribution of E. singularis on a regional scale may be relatedto its tolerance to a wide range of abiotic factors. In contrast,the restricted distribution of P. clavata appears to be aresponse to a narrow range of environmental conditions. Thiswould be in accordance with previous studies that characterizedthe environmental framework in which both species dwell.P. clavata populations dwell in a narrow band of light conditions(irradiance values ranging between 0·12 and 27·6% of surfacevalues, mean 7·6%) and typically in a vertical surface (althoughthey can be found on other slope types with sediment-freebottoms; Weinberg 1975, 1979, 1980). In contrast, E. singularisis a species found commonly on horizontal or sloping sediment-covered bottoms subjected to irradiance conditions thatrange between 3 and 44% of surface values (mean 18·6%;Weinberg 1975, 1979, 1980).
Along the explored coast, the upper depth limit of distribu-tion varied between the two species. While E. singularis didnot show a clear pattern of the upper limit of distribution, adecrease in depth of this upper distribution along the latitudinalgradient was observed in P. clavata populations. This patternappears to be related to the variability of the abiotic factorsalong this gradient. Changes in the limits of distribution ofdifferent NW Mediterranean benthic communities have beenrelated previously to differences in factors such as light,temperature and hydrodynamism along a comparable spatialscale (Zabala & Ballesteros 1989). This spatial variation ofabiotic factors and their relationship with the distribution ofthe species (Weinberg 1975, 1980) may determine the existenceof areas where the depth range of distribution is compressed.
Variation of maximum height of the colonies of P. clavataalong the latitudinal gradient was related to the decrease inthe depth of the upper distribution limit. This is consistent withthe increase of maximum height with depth observed previously(Harmelin & Marinopoulos 1994) and can be attributed tothe decrease of strong hydrodynamic events with depth.
BASELINE DATA FOR FUTURE DISTURBANCES
The mean extent of injury of colonies was lower in E. singularisthan in P. clavata (Table 1). Moreover, a larger proportion ofhealthy colonies was observed in E. singularis than in P. clavata,suggesting that E. singularis has a higher tolerance to dis-turbance than P. clavata. The observed extent of injury exhibitedby both species was much lower than previous assessments ofthe impact of mass mortality events on these species (about50% extent of injury of colony surface, Cerrano et al. 2000;Perez et al. 2000; Linares et al. 2005; Coma et al. 2006).Therefore, the impact of the 1999 mass mortality events alongthe Mediterranean Spanish coast did not affect the examinedgorgonian populations significantly.
APPLICATION OF FOREST ECOLOGY APPROACHES TO GORGONIAN POPULATIONS
Analogous to distribution patterns, divergences betweenspecies were also discernible by exploring the size distributioncurves and the carrying capacity (through the existence of amechanism of self-thinning) of the studied populations.
The overall results suggest that both the gorgonian speciesmay have different recruitment dynamics. Size class 2 (10–20 cm,first reproductive colonies) was the predominant size class inP. clavata populations, similar to that observed in other locations(Harmelin & Garrabou 2005). This peak at the intermediateclasses is in accordance with those observed in somepreviously studied gorgonian species (Jordán-Dahlgren 1989,2002; Yoshioka 1994; Bastidas et al. 2004; Tsounis et al.2006). In contrast, size class 1 (0–10 cm, the smallest and non-reproductive colonies; Ribes et al. 2007) was the predominantsize class in E. singularis populations (14 of 21). This sizedistribution is similar to some coral species (Hughes & Jackson1980, 1985; Babcock 1984; Soong 1993; Lewis 1997; Bak &Meesters 1998). Moreover, the fact that the largest colonieswere abundant in more pristine conditions agrees with resultsfound for other soft-coral species (Yoshioka 1994; Bastidaset al. 2004; Bianchimani 2005), but contrasts with the ideathat under environmental deterioration coral populationsdisplay negative skewness coefficients (Bak & Meesters 1998;Meesters et al. 2001).
The skewness coefficient also revealed a more dynamicpattern for E. singularis. In this species two temporal stagescould be distinguished, one with a large predominance ofsmallest colonies and a second stage with a higher presence oflarge colonies. For P. clavata, these two groups showed thesame distribution shape, with the only difference being ahigher increase of large colonies in symmetric populationslocated below 25 m.
The fact that along the large explored area none of theP. clavata stands corresponded to young stages of the popu-lation suggests that the species has a low recruitment. Incontrast, the larger proportion of small colonies observed inE. singularis suggests high recruitment rates. The differencesobserved between species may be explained by differentreproductive strategies. P. clavata is a surface brooder(Coma et al. 1995a), whereas E. singularis is an internalbreeder (Weinberg & Weinberg 1979). This latter strategymay contribute to a reduction in mortality during the firststages of development of the colonies and increase localrecruitment.
Examination of the size–density plot yielded a contrastingpattern for the two species. In E. singularis populations, thelack of pattern in the size–density plot points to other factors(such as predation, interspecific competition, disturbances,etc.) besides intraspecific competition governing the structureof their populations. P. clavata displayed a strong negativecorrelation between biomass and density of colonies. Thecloseness of the slope to the predicted value (–3/2; Yoda et al.1963) indicates a negative density-dependence that suggestsintraspecific competition among P. clavata populations.
698 C. Linares et al.
© 2007 The Authors. Journal compilation © 2007 British Ecological Society, Journal of Applied Ecology, 45, 688 –699
However, the mechanism remains unclear, because inthese thinned populations more extant colonies should beexpected.
The populations found below the self-thinning line maycorrespond to young populations or to disturbed populations.A young population of P. clavata was found during finalsurveys of other areas in the NW Mediterranean Sea, indicatingthe occurrence of young populations at very low frequency.Representation of the data for this young population (Fig. 7)provided additional evidence that self-thinning may be arelevant mechanism affecting population dynamics.
The effects of the 1999 mass mortality event at Port-CrosNational Park agree with the expected placement of disturbedpopulations below the self-thinning line. In our study, thegorgonian populations that had distributions under the self-thinning line (e.g. Tascó population) were subjected mostprobably to high levels of mortality due to the high frequencyof divers in a marine protected area (Coma et al. 2004) orpopulations where the environmental characteristics of thesites (e.g. high hydrodynamism) do not allow colonies reachinglarger size classes (e.g. Massa d’Or and Hormigon populations).
In summary, wide-ranging studies combining measures ofdensity and size are useful to obtain the state of the populationof long-lived marine invertebrates in order to make preliminaryassessments of their distribution and health status and also toinfer which populations have been affected by disturbance.The demographic approaches used in this study have allowedus to obtain essential baseline data of two of the most commongorgonian species in the NW Mediterranean Sea along aregional spatial scale. The study has revealed different biologicalfeatures of both species and different influence by environ-mental factors. The contrasting population dynamics mayimply differences in vulnerability of both species. Consequently,although further studies are required to achieve a completeunderstanding of demographic characteristics of thesespecies, our study suggests that shallow P. clavata populationsrequire major conservation efforts to protect them fromfuture disturbance events.
Acknowledgements
The authors gratefully acknowledge the helpful assistance of J. C. Calvin, B.Hereu, M. Alvarez, G. Mas, P. López and A. Marí in the field and the valuablecomments and help of S. Sabaté and M. Ribes during different aspects of themanuscript. We are grateful to J. M. Gili for continuous support during thestudy. This study was funded by research grants CTM2004-03120/MAR andCTM2006-01463/MAR from the ‘Ministerio de Educación y Ciencia’ of Spain.
References
Adler, F.R. (1996) A model of self-thinning through local competition.Proceedings of the National Academy of Sciences USA, 93, 9980–9984.
Babcock, R.C. (1984) Reproduction and distribution of two species ofGoniastrea (Scleractinia) from the Great Barrier Reef province. CoralReefs, 2, 187–195.
Bak, R.P.M. & Meesters, E.H. (1998) Coral population structure: the hiddeninformation of colony size–frequency distributions. Marine Ecology ProgressSeries, 162, 301–306.
Bastidas, C., Fabricius, K.E. & Willis, B.L. (2004) Demographic processes inthe soft coral Sinularia flexibilis leading to local dominance on coral reefs.Hydrobiologia, 530, 433–441.
Bianchimani, O. (2005) Évaluation Des Effets Des Aires Marines Protégées Surles Populations de Corail Rouge (Corallium Rubrum): le Cas des RéservesMarines Françaises. DU d’Environment Et Pollution. Université de laMéditerranée, Centre d’Océanologie de Marseille, Marseille.
Botsford, L.W., Castilla, J.C. & Peterson, C.H. (1997) The management offisheries and marine ecosystems. Science, 277, 509–515.
Cerrano, C., Bavestrello, G., Bianchi, C.N., Cattaneo-vietti, R., Bava, S.,Morganti, C., Morri, C., Picco, P., Sara, G., Schiaparelli, S., Siccardi, A. &Sponga, F. (2000) A catastrophic mass-mortality episode of gorgonians andother organisms in the Ligurian Sea (NW Mediterranean), summer 1999.Ecology Letters, 3, 284–293.
Coma, R., Linares, C., Ribes, M., Diaz, D., Garrabou, J. & Ballesteros, E.(2006) Consequences of a mass mortality event on the populations of thegorgonian Eunicella singularis (Cnidaria: Octocorallia) in Menorca(Balearic Islands, NW Mediterranean). Marine Ecology Progress Series,327, 51–60.
Coma, R., Pola, E., Ribes, M. & Zabala, M. (2004) Long-term assessment ofthe patterns of mortality of a temperate octocoral in protected and unprotectedareas: a contribution to conservation and management needs. EcologicalApplications, 14, 1466–1478.
Coma, R. & Ribes, M. (2003) Seasonal energetic constraints in Mediterraneanbenthic suspension feeders: effects at different levels of ecological organization.Oikos, 101, 205–215.
Coma, R., Ribes, M., Zabala, M. & Gili, J.M. (1995a) Reproduction and cycleof gonadal development in the Mediterranean gorgonian Paramuriceaclavata. Marine Ecology Progress Series, 117, 173–183.
Coma, R., Ribes, M., Zabala, M. & Gili, J.M. (1998) Growth in a modularcolonial marine invertebrate. Estuarine Coastal Shelf Science, 47, 459–470.
Coma, R., Ribes, M., Zabala, M. & Gili, J.M. (2000) Seasonality in coastalbenthic ecosystems. Trends in Ecology and Evolution, 15, 448–453.
Coma, R., Zabala, M. & Gili, J.M. (1995b) Sexual reproductive effort in theMediterranean gorgonian Paramuricea clavata. Marine Ecology ProgressSeries, 117, 185–192.
Condit, R., Sukumar, R., Hubbell, S. & Foster, R.B. (1998) Predictingpopulation trends from size distributions: a direct test in a tropical treecommunity. American Naturalist, 152, 495–509.
Garrabou, J. & Harmelin, J.G. (2002) A 20-year study on life-history traits of aharvested long-lived temperate coral in the NW Mediterranean: insightsinto conservation and management needs. Journal of Animal Ecology, 71,966–978.
Garrabou, J., Perez, T., Sartoretto, S. & Harmelin, J.G. (2001) Mass mortalityevent in red coral Corallium rubrum populations in Provence region (France,NW Mediterranean). Marine Ecology Progress Series, 217, 263–272.
Gray, J.S. (1997) Marine biodiversity: patterns, threats and conservation needs.Biodiversity and Conservation, 6, 153–157.
Harmelin, J.G. & Garrabou, J. (2005) Suivi d’une population de Paramuriceaclavata (Risso, 1826) (Cnidaria, Octocorallia, Gorgonacea) dans le parcnational de Port-Cros (Méditerranée, France): comparaison des états 1992 et2004 sur le site de la Galère. Scientific Reports Port-Cros National Park,France, 21, 175–191.
Harmelin, J.G. & Marinopoulos, J. (1994) Population structure and partialmortality of the gorgonian Paramuricea clavata (Risso) in the North-Western Mediterranean (France, Port-Cros Island). Marine Life, 4, 5–13.
Harmelin, J.G., Sartoretto, S. & Francour, P. (1999) Mise en Place d’uneStratégie de Suivi de l’Ichtyofaune et des Peuplements de Gorgonaires del’Archipel de Riou. Contrat Ville de Marseille, Direction de L’environnementet Des Déchets and Centre d’Océanologie de Marseille, Centre d’Océanologiede Marseille, Publications Marseille, Marseille.
Hughes, T.P. & Connell, J.H. (1999) Multiple stressors on coral reefs: along-term perspective. Limnology and Oceanography, 44, 932–940.
Hughes, T.P. & Jackson, J.B.C. (1980) Do corals lie about their age? Somedemographic consequences of partial mortality, fission and fusion. Science,209, 713–715.
Hughes, T.P. & Jackson, J.B.C. (1985) Population dynamics and life histories offoliaceous corals. Ecological Monographs, 55, 141–166.
Jones, C.G., Lawton, J.H. & Shachak, M. (1994) Organisms as ecosystemengineers. Oikos, 69, 373–386.
Jordán-Dahlgren, E. (1989) Gorgonian community structure and reef zonationpatterns on Yucatán coral reefs. Bulletin of Marine Science, 45, 678–696.
Jordán-Dahlgren, E. (2002) Gorgonian distribution patterns in coral reefenvironments of the Gulf of Mexico: evidence of sporadic ecologicalconnectivity? Coral Reefs, 21, 205–215.
Lewis, J.B. (1997) Abundance, distribution and partial mortality of the massivecoral Siderastrea siderea on degrading coral reefs at Barbados, West Indies.Marine Pollution Bulletin, 34, 622–627.
Linares, C., Coma, R., Diaz, D., Zabala, M., Hereu, B. & Dantart, L. (2005)
Demographic approaches for gorgonian conservation 699
© 2007 The Authors. Journal compilation © 2007 British Ecological Society, Journal of Applied Ecology, 45, 688 –699
Immediate and delayed effects of a mass mortality event on gorgonianpopulation dynamics and benthic community structure in the NW Mediter-ranean Sea. Marine Ecology Progress Series, 305, 127–137.
Linares, C., Doak, D., Coma, R., Diaz, D. & Zabala, M. (2007) Life history andpopulation viability of a long-lived marine invertebrate: the octocoralParamuricea clavata. Ecology, 88, 918–928.
MacArthur, R.H. (1972) Geographical Ecology. Princeton University Press,Princeton, NJ.
Meesters, E.H., Hilterman, M., Kardinaal, E., Keetman, M., de Vries, M. &Bak, R.P.M. (2001) Colony size–frequency distributions of scleractiniancoral populations: spatial and interspecific variation. Marine EcologyProgress Series, 209, 43–54.
Mills, L.S., Soule, M.E. & Doak, D.F. (1993) The keystone-species concept inecology and conservation. Bioscience, 43, 219–224.
Musick, J.A. (1999) Ecology and conservation of long-lived marine animals.American Fisheries Society Symposium, 23, 1–10.
Niklas, K.J., Midgley, J.J. & Hand, R.H. (2003) Tree size frequency distributions,plant density, age and community disturbance. Ecology Letters, 6, 405–411.
Perez, T., Garrabou, J., Sartoretto, S., Harmelin, J.G., Francour, P. & Vacelet,J. (2000) Mortalité massive d’invertébrés marins: un événement sansprécédent en Méditerranée nord-occidentale. Life Sciences, 323, 853–865.
Pickett, S.T.A. (1989) Space for time substitution as an alternative forlong-term studies. Preston’s ergodic conjecture: the accumulation ofspecies in space and time. Long-Term Studies in Ecology (ed. G.E. Likens),pp. 110–135. Springer-Verlag, New York.
Ribes, M., Coma, R., Rossi, S. & Michelli, M. (2007) The cycle of gonadaldevelopment of Eunicella singularis (Cnidaria: Octocorallia): trends onsexual reproduction in Mediterranean gorgonians. Invertebrate Biology,in press.
Roberts, C.M. & Hawkins, J.P. (1999) Extinction risk in the sea. Trends inEcology and Evolution, 14, 241–246.
Shinozaki, K. & Kira, T. (1956) Intraspecific competition among higher plants.VII. Logistic theory of the C–D effect. Journal of Institute Polythecnics,Osaka City University, 12, 69–82.
Sokal, R. & Rohlf, F.J. (1995) Biometry. The Principles and Practice of Statisticsin Biological Research, 3rd edn. Freeman, New York, New York.
Soong, K. (1993) Colony size as a species character in massive reef corals. CoralReefs, 12, 77–83.
Tsounis, G., Rossi, S., Gili, J.M. & Arntz, W. (2006) Population structure of anexploited benthic cnidarian: the case study of red coral (Corallium rubrum L.).Marine Biology, 149, 1059–1070.
Vitousek, P.M., Mooney, H.A., Lubchenco, J. & Melillo, J.M. (1997) Humandomination of Earth’s ecosystems. Science, 277, 494–499.
Weinberg, S. (1975) Écologie des octocoralliares communs du substrat dursdans la région de Banyuls-sur-mer. Bijdragen Tot de Dierkunde, 45, 50–70.
Weinberg, S. (1979) Mediterranean Octocorallian communities and the abioticenvironment. Marine Biology, 49, 41–57.
Weinberg, S. (1980) Autoecology of shallow-water octocorallia from Medit-erranean rocky substrata. II. Marseille, Cote d’Azur and Corsica. BijdragenTot de Dierkunde, 50, 73–86.
Weinberg, S. & Weinberg, F. (1979) The life cycle of a gorgonian Eunicellasingularis (Esper, 1794). Bijdragen tot de dierkunde, 48, 127–140.
White, J. (1981) The allometric interpretation of the self-thinning rule. Journalof Theoretical Biology, 89, 475–800.
Yoda, K., Kira, T., Ogawa, H. & Hozumi, K. (1963) Self-thinning in over-crowded pure stands under cultivated and natural conditions. Intra-specificcompetition among higher plants. Journal of Biology, Osaka City University,14, 107–129.
Yoshioka, P.M. (1994) Size-specific life history pattern of a shallow watergorgonian. Journal of Experimental Marine Biology and Ecology, 184, 111–122.
Zabala, M. & Ballesteros, E. (1989) Surface-dependent strategies and energyflux in benthic marine communities or, why corals do not exist in theMediterranean. Scientia Marina, 53, 3–17.
Received 3 March 2007; accepted 29 August 2007Handling Editor: Chris Frid
Supplementary material
The following supplementary material is available for thisarticle.
Fig. S1. Paramuricea clavata. Map of the quantitativelyexamined populations
Fig. S2. Eunicella singularis. Map of the quantitativelyexamined populations
This material is available as part of the online article from:http://www.blackwell-synergy.com/doi/full/10.1111/j.1365-2664.2007.01419.x.(This link will take you to the article abstract.)
Please note: Blackwell Publishing is not responsible forthe content or functionality of any supplementary materialssupplied by the authors. Any queries (other than missingmaterial) should be directed to the corresponding author forthe article.