Size and Value Premium in International Portfolios: Evidence from 15 European Countries
18
Finance a úvěr-Czech Journal of Economics and Finance, 61, 2011, no. 2 173 JEL Classification: G11, G12, G14 Keywords: international asset pricing, Fama and French factor model Size and Value Premium in International Portfolios: Evidence from 15 European Countries * Nawazish MIRZA – Center for Research in Economics and Business, Lahore School of Economics ([email protected]) – corresponding author Ayesha AFZAL – Lahore School of Economics ([email protected]) Abstract The current study evaluates the performance of the Fama and French three-factor model in a global setting with stocks selected from 15 European countries. We employed the multi- variate regression approach after sorting six portfolios according to size and book-to- -market. The constituent stocks were selected to represent each country of our sample. In order to homogenize the returns we used the spot exchange rates of non-euro-area coun- tries to convert prices into euros. Since we were analyzing on a global portfolio level we used the MSCI EMU index as the proxy for the market portfolio. Daily returns were em- ployed for a period of five years from January 2002 to December 2006. The results were not very encouraging for the three-factor model. Except for one portfolio, the three-factor model failed to explain the variations in returns, and even in the single portfolio that demonstrated size and value premiums, the market premium was insignificant. Our find- ings are consistent with Griffin (2002), who suggested that the three-factor model is do- mestic in nature and performs poorly for global portfolios. 1. Introduction Diversifying across borders has emerged as a useful investment strategy in the last two decades. However, this has been extensively discussed in the financial literature since the early work of Grubel (1968), Levy and Sarnat (1970), and Solnik (1974). The gains from international diversification can be attributed to lower corre- lation of stocks across markets than within one market. The lower correlation is due to the varying industry structure across countries. This entails a booster in expected returns, simultaneously optimizing the risk level. Owing to increasing integration of global markets, the cross correlations of stocks between countries must be increasing, yet we cannot discard international diversification as a valid investment strategy. Globalization has opened new avenues for portfolio managers and for risk manage- ment, making international diversification possible. Therefore, a model that can ex- plain returns in an international scenario is very much needed to support investment decisions. The Fama and French (FF) three-factor model has emerged as an alternative explanation in the ongoing debate on asset pricing. FF started with the observation that two classes of stocks have performed better than the market as a whole, namely, stocks with small market capitalization and stocks with a high book-to-price (market) value. Since these stocks have yielded higher returns than the market, FF commented * The authors like to thank Professor Carole Gresse and Professor Herve Alexandre, University of Paris (Dauphine) for valuable comments and Ms Mawal Sara Saeed (MBA class of 2011), Lahore School of Economics, for her assistance in data collection.
-
Upload
independent -
Category
Documents
-
view
1 -
download
0
Transcript of Size and Value Premium in International Portfolios: Evidence from 15 European Countries
Finance a úvěr-Czech Journal of Economics and Finance, 61, 2011, no. 2 173
JEL Classification: G11, G12, G14 Keywords: international asset pricing, Fama and French factor model
Size and Value Premium in International Portfolios: Evidence from 15 European Countries* Nawazish MIRZA – Center for Research in Economics and Business, Lahore School
of Economics ([email protected]) – corresponding author Ayesha AFZAL – Lahore School of Economics ([email protected])
Abstract The current study evaluates the performance of the Fama and French three-factor model in a global setting with stocks selected from 15 European countries. We employed the multi-variate regression approach after sorting six portfolios according to size and book-to- -market. The constituent stocks were selected to represent each country of our sample. In order to homogenize the returns we used the spot exchange rates of non-euro-area coun-tries to convert prices into euros. Since we were analyzing on a global portfolio level we used the MSCI EMU index as the proxy for the market portfolio. Daily returns were em-ployed for a period of five years from January 2002 to December 2006. The results were not very encouraging for the three-factor model. Except for one portfolio, the three-factor model failed to explain the variations in returns, and even in the single portfolio that demonstrated size and value premiums, the market premium was insignificant. Our find-ings are consistent with Griffin (2002), who suggested that the three-factor model is do-mestic in nature and performs poorly for global portfolios.
1. Introduction Diversifying across borders has emerged as a useful investment strategy in
the last two decades. However, this has been extensively discussed in the financial literature since the early work of Grubel (1968), Levy and Sarnat (1970), and Solnik (1974). The gains from international diversification can be attributed to lower corre-lation of stocks across markets than within one market. The lower correlation is due to the varying industry structure across countries. This entails a booster in expected returns, simultaneously optimizing the risk level. Owing to increasing integration of global markets, the cross correlations of stocks between countries must be increasing, yet we cannot discard international diversification as a valid investment strategy. Globalization has opened new avenues for portfolio managers and for risk manage-ment, making international diversification possible. Therefore, a model that can ex-plain returns in an international scenario is very much needed to support investment decisions.
The Fama and French (FF) three-factor model has emerged as an alternative explanation in the ongoing debate on asset pricing. FF started with the observation that two classes of stocks have performed better than the market as a whole, namely, stocks with small market capitalization and stocks with a high book-to-price (market) value. Since these stocks have yielded higher returns than the market, FF commented * The authors like to thank Professor Carole Gresse and Professor Herve Alexandre, University of Paris
(Dauphine) for valuable comments and Ms Mawal Sara Saeed (MBA class of 2011), Lahore School ofEconomics, for her assistance in data collection.

174 Finance a úvěr-Czech Journal of Economics and Finance, 61, 2011, no. 2
that this phenomenon is explained by the existence of a size as well as a value pre-mium in addition to the market risk premium as posited by the traditional CAPM.
To account for these two premiums, FF constructed two more risk factors out-side of market risk. They used SMB (small minus big) to address size risk and HML (high minus low) for value risk. High book-to-market ratio stocks are termed value stocks, while low book-to-market stocks are termed growth stocks. The size factor measures the additional returns investors receive for investing in stocks with com-paratively small capitalization. A positive SMB factor represents higher returns for small-cap stocks than for big stocks. The value factor captures the premium investors will get from investing in stocks with a high book-to-market ratio. A positive HML signifies higher returns for value stocks than for growth stocks. The three-factor model has gained in popularity because it is perceived to have the highest explanatory power among the numerous variables that have been tested in the financial literature and has consistently yielded a high R2 – sometimes as high as 95%.
The discrepancies in the CAPM have contributed to the success of alternative explanations. Moreover, the global integration of economies and financial markets has created a new arena for investors and portfolio managers. Thus, for a model to hold it must not only be able to survive in the domestic market, but it should also be true for international or global portfolios. Fama and French (1998) advocate a global version of their model. They studied 13 world markets during 1975–1995 and show- ed that value stocks tend to show higher returns than growth stocks. They sorted the portfolios according to book-to-market ratio, and in 12 out of the 13 countries value stocks outperformed growth stocks. Similar results were observed for emerging markets. They commented that the international CAPM does not explain the value premium in international markets.
Although the framework of FF is simple, considerable empirical controversy exists about the interpretation of their risk factors. Some researchers propose that the existence of the book-to-market premium is due not to investors’ compensation for risk bearing, but rather to investor overreaction (Lakonishok, Shleifer, and Vishny, 1994; Haugen, 1995). They suggest that investors overreact to corporate news and exaggerate their estimates about future growth. Consequently, value stocks tend to be underpriced, while growth stocks are overpriced. Another group of critics relates the success of the FF model to empirical gimmicks (Ferson, Sarkissian, and Simin, 1999). They suggest that the explanatory power of the three-factor model is due to econometric regularities. This could be due to inherent biases or data snooping exag-gerating the results for the three-factor model. Berk (1995) suggests that the way in which portfolios for high book-to-market and size are constructed implies that they are expected to yield high returns regardless of any economic interpretation.
The purpose of this paper is to analyze Fama and French’s proposition on as-set pricing in an international setting, notably in monetarily integrated markets. The European Union (EU) can be regarded as the most integrated global economy. The creation of the European Monetary Union has harmonized the economies of the participating countries. The common euro currency prevailing in most EU coun-tries has eliminated foreign exchange risk and this has further spurred the financial integration process. Common policy rules and legislations have eased the environ-ment for investment. Furthermore, the development of Euronext has provided
Finance a úvěr-Czech Journal of Economics and Finance, 61, 2011, no. 2 175
a common platform for investors. The merger of Euronext with the NYSE in April 2007 has further enhanced the ability of investors to participate simultaneously in North America and Western Europe. Given this monetary and financial integration, it would be interesting to observe the factors that drive asset prices in the EU. This paper makes multiple contributions to the existing literature on asset pricing, with important policy implications. First, we propose a unique methodology based on ex-change rate-adjusted returns for portfolio sorting to calculate international SMB and HML premiums. Second, our results suggest the existence of some global risk premi-um factor beyond traditional market, size, and value premiums. Lastly, we report that for our sample period, growth stocks outperform value stocks in synthetic interna-tional portfolios, which suggests a growth-based investment strategy. Therefore, investment without borders warrants the use of additional risk factors to explain the variation in international stock returns.
The rest of the paper is organized as follows. Section 2 will present some exist-ing literature on the three-factor model, Section 3 will describe the research meth-odology, the data employed, and the variables, Section 4 summarizes the empirical results, and Section 5 concludes.
2. Literature Review As mentioned earlier, the FF three-factor model has been widely discussed in
the empirical literature as an alternative to the CAPM. Researchers have reported evidence both for and against the three-factor model. This section summarizes some of the research that has been done in both domestic and international markets.
Fama and French (1992) examined a cross-section of stock returns and pre-sented additional factors – the size and value premium – to clarify the return anoma-lies that the CAPM was unable to explain. They used non-financial firm data from the NYSE, AMEX, and NASDAQ from 1962 to 1989. They suggested that if asset pricing is rational, then the additional risk factors of size and book-to-market seem to describe the average returns. Fama and French (1993) extended the Fama and French (1992) research by applying a time series regression approach to stocks and bonds. The analysis was extended to both stocks and bonds. The monthly average returns on stocks and bonds were regressed on five factors: excess returns on the market port-folio, portfolios sorted by size, portfolios sorted by book-to-market, the term premium, and the default premium. They found that the first three factors were significant for stocks, while the last two were significant in explaining returns on bonds. They confirmed the existence of the size and value premium in US returns and commented that the three-factor model better explains the risk-return puzzle.
Black (1993) criticized the three-factor model and commented that the observ-ed relationship between stock returns and the size and value premium was a result of data mining. He suggested that since the significant results for tests of the FF three- -factor model are mere chance, such results are not likely to be sustained in a different data set with a different time period. A similar notion was addressed by Kothari, Shanken, and Sloan (1995), who criticized the three-factor model for survivorship bias. They argued that the significant book-to-market relation is due to survivorship bias. Those firms which ceased to exist in the sample period could have had a high book-to-market ratio with low returns, and if they are included the significance of
176 Finance a úvěr-Czech Journal of Economics and Finance, 61, 2011, no. 2
book-to-market might diminish or even be eliminated. The survivorship criticism was rejected by Chan, Jegadeesh, and Lakonishok (1995). They compared Compustat data with CRSP and suggested that when the firms of the two data bases were matched, not enough firms were found to be missing from Compustat. The missing firms were immaterial enough to have a significant impact on Fama and French’s (1992) results. Furthermore, they created another survivorship-bias-free data set for a similar period and observed a significant relation between returns and book-to-market. They con-firmed that the survivorship-bias argument could not cast doubts on the FF three- -factor model.
Out-of-sample evidence was provided by Glen et al. (1995), Halliwell et al. (1999), Murgia et al. (2000), and Drew and Veeraraghavan (2003). Glen et al. (1995) examined a cross section of asset returns for 18 developing countries. They conclud-ed that in addition to beta, two factors – size and trading volume – have the highest explanatory power in most of the countries. Dividend yield and earnings-to-price were also significant, but in slightly fewer countries. Lastly, they proposed that ex-change rate risk is an important determinant of asset returns. Halliwell et al. (1999) replicated Fama and French’s (1993) study on Australian data. Their results sug-gested some premium to small size and high book-to-market stocks. Murgia et al. (2000) investigated the relationship between risk factors and returns for Italian stocks. They found that changes in the market index, changes in oil prices, the default pre-mium, changes in interest rates, and the SMB and HML factors represented viable factors for asset returns in the Italian setting and the SMB and HML factors are priced even if other macroeconomic variables are added. Drew and Veeraraghavan (2003) studied the explanatory power of a single index model with that of the FF three-factor model in Hong Kong, Korea, Malaysia, and the Philippines. They con-cluded that the size and value premiums were present in these markets and the three- -factor model better explained the variations in returns for these markets. They commented that the premium is compensation for the risk that is not accounted for by the CAPM.
The three-factor model has also been tested with respect to asset pricing in an international setting. Griffin (2002) examined the viability of domestic or country- -specific and international versions of the FF three-factor model in explaining equity returns. The equity data used was from the US, Canada, Japan, and the UK. He used the portfolio intercept approach and found that none of the models completely ex-plained the returns. However, out of the domestic and international versions, the do-mestic model seemed to be better at explaining equity returns in both the portfolio and the stand-alone context. This finding ran against the notion of the use of the FF three-factor model for international asset pricing. Moerman (2005) used Griffin’s (2002) methodology to analyze the performance of the three-factor model in the euro area between 1991 and 2002 – a period that could be regarded as the most important era in the European integration process. The results, based on R2, suggested that the country-specific model is more valid, while the FF three-factor model does not hold for the euro area. Thus, he rejected the capacity of the three-factor model to ex-plain returns in a broader setting. Zhang (2006) evaluated various asset-pricing models in an international setting. The results favored the pricing of exchange rate risk in a conditional international CAPM framework. The author could not deduce a result in favor of the global version of the size and value factors. Similar results were re-
Finance a úvěr-Czech Journal of Economics and Finance, 61, 2011, no. 2 177
ported by Doidge et al. (2006), who found evidence of an exchange risk premium in a sample of non-financial firms from over 18 countries. However, Lee et al. (2009) reported evidence in favor of the size and book-to-market factors. They investigated the risks priced in equities using a discounted cash flow model of cost-of-equity esti-mation in the G7 countries. They suggested the firm variables of size, book-to-mar-ket, leverage, and idiosyncratic volatility.
3. Research Methodology As mentioned before, diversification plays a vital role in risk management and
thus constitutes an important part of investment decisions. The globalization of world economies and monetary integration has significantly reduced transaction costs and made it possible for portfolio managers to include overseas assets in their holdings. The international markets provide a platform of infinite choices for investments, and investors have to make the optimal choice based on their preferences and the tradeoff between risk and return. Since the risk-return relationship developed in theoretical models mostly caters for local markets, and we face mixed empirical evidence on their performance, it is necessary to see how well these models explain our expected re-turns if we form international portfolios. The aim of this research is to test the per-formance of the FF three-factor model in Europe – a zone that has more monetary and economic integration than any other part of the world.
On January 1, 2002 most of the European countries adopted the euro as a sin-gle currency. This has not only enhanced the level of integration, but also reduced foreign exchange issues for investors. Theoretically, the currencies of these countries have long been pegged against the euro, but its coming into force practically elimi-nated foreign exchange exposure for the participating countries. Therefore, we start our sample period on January 1, 2002 and extend it for five years till December 31, 2006. Another reason that justifies our time period selection is the events of Sep-tember 11, 2001. The post-September 11 world has a completely different investment scenario. Its attributes and investment behaviors are more cautious and risk-averse. Thus, it is likely that if the sample period includes both pre- and post-September 11 data, the difference in investment characteristics could create a potential bias in the re-sults.
In every study of international diversification, the first concern is differences in currency. One cannot compare directly a return or a risk from one country’s port-folio with that from another country’s portfolio if each portfolio is still denominated in its own currency (Fletcher, 2000). Although a majority of our sample countries have adopted the euro as their currency, there are a few which have not. Therefore, we convert all prices into the euro based on the historical spot exchange rate. Hence, we observe the portfolios from the point of view of a euro-dominated investor (Elton and Gruber, 1995).
3.1 Model Specification Fama and French opt for a multifactor asset-pricing model and their three-
-factor model is an extension of the single-factor CAPM. Besides the traditional beta, it includes two additional factors to account for the size and value premium. Mathe-matically, we can represent the three-factor model as
178 Finance a úvěr-Czech Journal of Economics and Finance, 61, 2011, no. 2
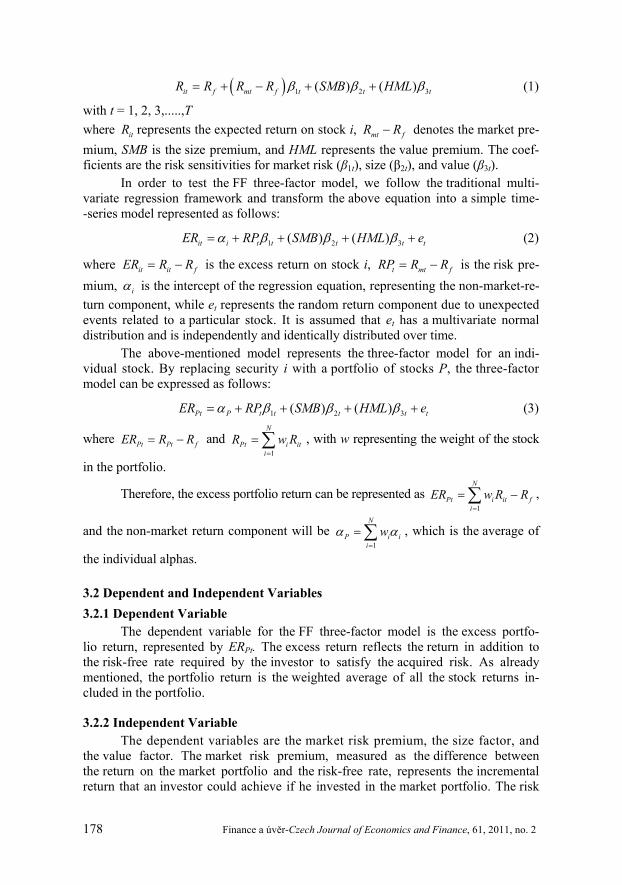
( ) 1 2 3( ) ( )it f mt f t t tR R R R SMB HMLβ β β= + − + + (1)
with t = 1, 2, 3,.....,T where itR represents the expected return on stock i, mt fR R− denotes the market pre-mium, SMB is the size premium, and HML represents the value premium. The coef-ficients are the risk sensitivities for market risk (β1t), size (β2t), and value (β3t).
In order to test the FF three-factor model, we follow the traditional multi-variate regression framework and transform the above equation into a simple time- -series model represented as follows:
1 2 3( ) ( )it i t t t t tER RP SMB HML eα β β β= + + + + (2)
where it it fER R R= − is the excess return on stock i, t mt fRP R R= − is the risk pre-mium, iα is the intercept of the regression equation, representing the non-market-re-turn component, while et represents the random return component due to unexpected events related to a particular stock. It is assumed that et has a multivariate normal distribution and is independently and identically distributed over time.
The above-mentioned model represents the three-factor model for an indi-vidual stock. By replacing security i with a portfolio of stocks P, the three-factor model can be expressed as follows:
1 2 3( ) ( )Pt P t t t t tER RP SMB HML eα β β β= + + + + (3)
where Pt Pt fER R R= − and 1
N
Pt i iti
R w R=
= ∑ , with w representing the weight of the stock
in the portfolio.
Therefore, the excess portfolio return can be represented as 1
N
Pt i it fi
ER w R R=
= −∑ ,
and the non-market return component will be 1
N
P i ii
wα α=
= ∑ , which is the average of
the individual alphas.
3.2 Dependent and Independent Variables 3.2.1 Dependent Variable
The dependent variable for the FF three-factor model is the excess portfo- lio return, represented by ERPt. The excess return reflects the return in addition to the risk-free rate required by the investor to satisfy the acquired risk. As already mentioned, the portfolio return is the weighted average of all the stock returns in-cluded in the portfolio.
3.2.2 Independent Variable The dependent variables are the market risk premium, the size factor, and
the value factor. The market risk premium, measured as the difference between the return on the market portfolio and the risk-free rate, represents the incremental return that an investor could achieve if he invested in the market portfolio. The risk
Finance a úvěr-Czech Journal of Economics and Finance, 61, 2011, no. 2 179
premia is same in both the CAPM and the three-factor model. However, the three- -factor model has two other variables. SMB, or the size premium, captures the ad-ditional return offered by small companies vis-à-vis big companies. Similarly, HML relates the impact of the value premium to the expected returns.
The theoretical foundations of the SMB and HML factors are intuitively ap-pealing. Small companies are more sensitive to various risk factors owing to their less diversified business and even lower financial flexibility as compared to bigger firms. Therefore, investors should require a risk premium when investing in small- -cap firms. The HML factor associates a higher risk with value stocks than with growth stocks. A high book-to-market ratio depicts a large deviation in the book value of a firm from its market value, indicating that the market is not placing a high value on its stocks. This could be due to current distress or investors’ expectations about future prospects making such companies vulnerable to business as well as financial risk and making it logical for investors to demand a premium on such stocks.
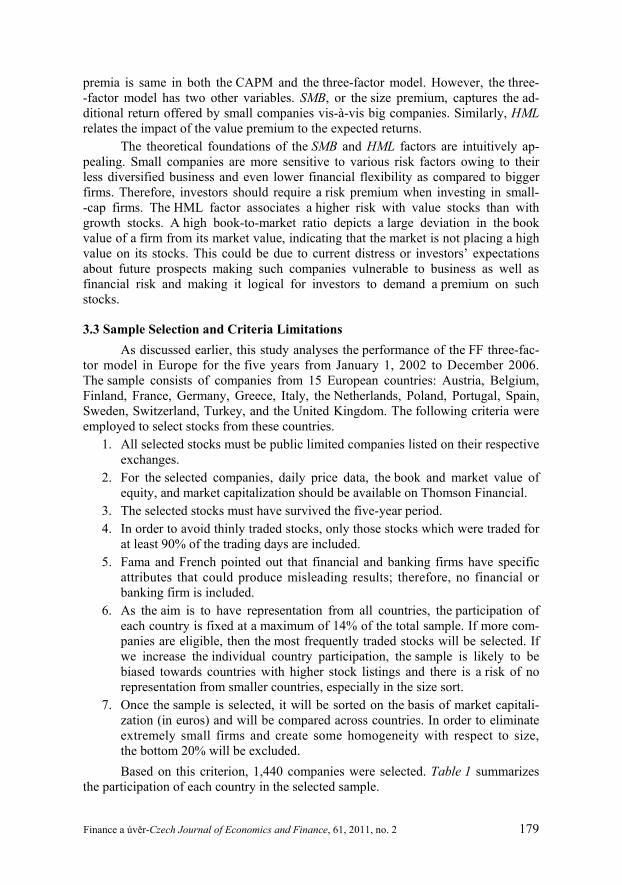
3.3 Sample Selection and Criteria Limitations As discussed earlier, this study analyses the performance of the FF three-fac-
tor model in Europe for the five years from January 1, 2002 to December 2006. The sample consists of companies from 15 European countries: Austria, Belgium, Finland, France, Germany, Greece, Italy, the Netherlands, Poland, Portugal, Spain, Sweden, Switzerland, Turkey, and the United Kingdom. The following criteria were employed to select stocks from these countries.
1. All selected stocks must be public limited companies listed on their respective exchanges.
2. For the selected companies, daily price data, the book and market value of equity, and market capitalization should be available on Thomson Financial.
3. The selected stocks must have survived the five-year period. 4. In order to avoid thinly traded stocks, only those stocks which were traded for
at least 90% of the trading days are included. 5. Fama and French pointed out that financial and banking firms have specific
attributes that could produce misleading results; therefore, no financial or banking firm is included.
6. As the aim is to have representation from all countries, the participation of each country is fixed at a maximum of 14% of the total sample. If more com-panies are eligible, then the most frequently traded stocks will be selected. If we increase the individual country participation, the sample is likely to be biased towards countries with higher stock listings and there is a risk of no representation from smaller countries, especially in the size sort.
7. Once the sample is selected, it will be sorted on the basis of market capitali-zation (in euros) and will be compared across countries. In order to eliminate extremely small firms and create some homogeneity with respect to size, the bottom 20% will be excluded. Based on this criterion, 1,440 companies were selected. Table 1 summarizes
the participation of each country in the selected sample.
180 Finance a úvěr-Czech Journal of Economics and Finance, 61, 2011, no. 2
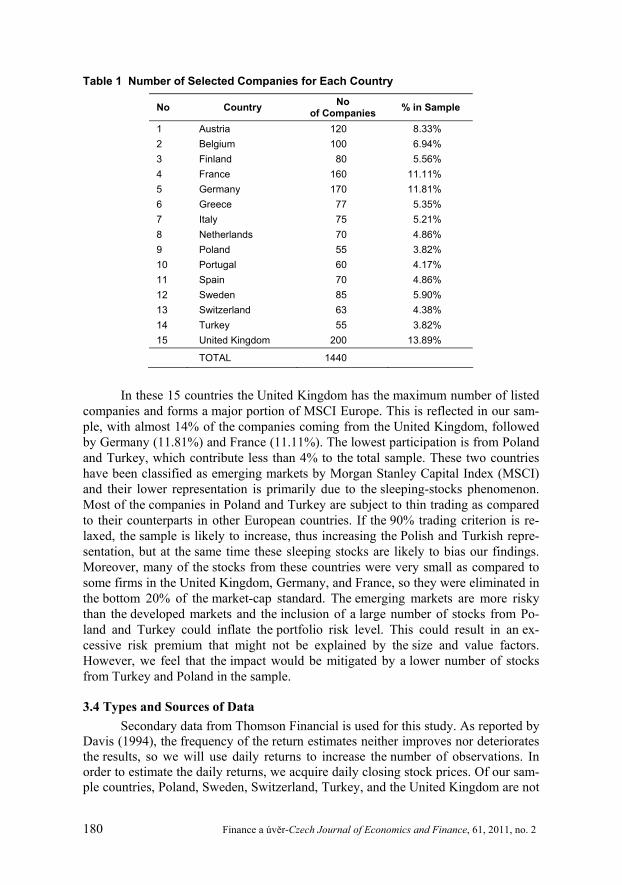
Table 1 Number of Selected Companies for Each Country
No Country No of Companies % in Sample
1 Austria 120 8.33% 2 Belgium 100 6.94% 3 Finland 80 5.56% 4 France 160 11.11% 5 Germany 170 11.81% 6 Greece 77 5.35% 7 Italy 75 5.21% 8 Netherlands 70 4.86% 9 Poland 55 3.82% 10 Portugal 60 4.17% 11 Spain 70 4.86% 12 Sweden 85 5.90% 13 Switzerland 63 4.38% 14 Turkey 55 3.82% 15 United Kingdom 200 13.89%
TOTAL 1440
In these 15 countries the United Kingdom has the maximum number of listed
companies and forms a major portion of MSCI Europe. This is reflected in our sam-ple, with almost 14% of the companies coming from the United Kingdom, followed by Germany (11.81%) and France (11.11%). The lowest participation is from Poland and Turkey, which contribute less than 4% to the total sample. These two countries have been classified as emerging markets by Morgan Stanley Capital Index (MSCI) and their lower representation is primarily due to the sleeping-stocks phenomenon. Most of the companies in Poland and Turkey are subject to thin trading as compared to their counterparts in other European countries. If the 90% trading criterion is re-laxed, the sample is likely to increase, thus increasing the Polish and Turkish repre-sentation, but at the same time these sleeping stocks are likely to bias our findings. Moreover, many of the stocks from these countries were very small as compared to some firms in the United Kingdom, Germany, and France, so they were eliminated in the bottom 20% of the market-cap standard. The emerging markets are more risky than the developed markets and the inclusion of a large number of stocks from Po-land and Turkey could inflate the portfolio risk level. This could result in an ex-cessive risk premium that might not be explained by the size and value factors. However, we feel that the impact would be mitigated by a lower number of stocks from Turkey and Poland in the sample.
3.4 Types and Sources of Data Secondary data from Thomson Financial is used for this study. As reported by
Davis (1994), the frequency of the return estimates neither improves nor deteriorates the results, so we will use daily returns to increase the number of observations. In order to estimate the daily returns, we acquire daily closing stock prices. Of our sam-ple countries, Poland, Sweden, Switzerland, Turkey, and the United Kingdom are not

Finance a úvěr-Czech Journal of Economics and Finance, 61, 2011, no. 2 181
members of the euro area, so to homogenize their returns with those of the euro area countries we convert the daily stock prices of these countries into euros based on the daily exchange rates. We need euro exchange rates for the Polish zloty, the Swed-ish krona, the Swiss franc, the Turkish lira, and the British pound.
Observation of the true market portfolio within the framework of various as-set-pricing models is not possible, and for empirical studies synthetic market port-folios are used. We mimic the market portfolio by using the MSCI EMU index. Our sample consists of stocks from various countries, so a domestic index is not a good measure of the market return and we need an international index. MSCI EMU is a good proxy, since our sample countries are participants in this index.
A risk-free asset is one which yields a certain return. In practice, no such as-sets exist and investors use government-issued securities as risk-free assets and their returns as the risk-free rate. However, even if these securities are default remote, they are not entirely risk free and at the very least are subject to inflation risk. For our analysis, we use the EURIBOR overnight rate as a risk-free proxy.
3.5 Estimation of Variables 3.5.1 Daily Portfolio and Market Returns
The portfolio returns are the weighted average returns of the individual stocks. The returns for the portfolio will be estimated as follows:
1
N
Pt i iti
R w R=
= ∑ , and 1
tit
t
PR LN
P−
⎡ ⎤= ⎢ ⎥
⎣ ⎦
where Pt and Pt–1 are the closing prices on days t and t-1. These individual returns are then weighted according to their contribution in the portfolio to obtain the portfolio returns.
Similarly, the return on the market portfolio, represented by the return on
the MSCI EMU index, will be1
( )( )
tmt
t
MSCI EMUR LN
MSCI EMU −
⎡ ⎤= ⎢ ⎥
⎣ ⎦, with MSCI(EMU)t and
MSCI(EMU)t–1 as the closing index values on days t and t-1. The portfolio and mar-ket returns are then used to estimate the excess portfolio returns and market risk premium.
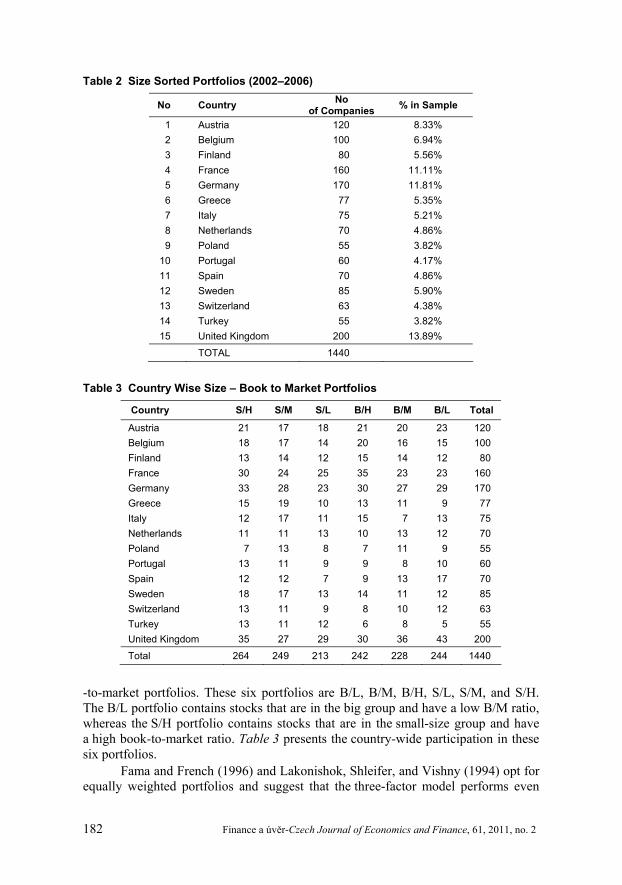
3.5.2 Size and Book-to-Market Portfolios The selected sample stocks are ranked by market capitalization (price times
share) to denominate the size from 2002 to 2006, taking December 31 of each year as the reference point. The median of the sample is used to split the stocks into two categories, namely, Big (B) and Small (S). Table 2 presents the biggest, median, and smallest capitalization stocks in the sample.
The book-to-market (B/M) ratio is calculated by dividing the book value of the equity by the market value of the equity on December 31 for each year of the sam-ple. The stocks are then ranked and categorized into three B/M groups based on the break points of bottom 30% – Low (L), middle 40% – Medium (M), and top 30% – High (H). We form six portfolios on the intersection of the two size and three book-
182 Finance a úvěr-Czech Journal of Economics and Finance, 61, 2011, no. 2
Table 2 Size Sorted Portfolios (2002–2006)
No Country No of Companies % in Sample
1 Austria 120 8.33% 2 Belgium 100 6.94% 3 Finland 80 5.56% 4 France 160 11.11% 5 Germany 170 11.81% 6 Greece 77 5.35% 7 Italy 75 5.21% 8 Netherlands 70 4.86% 9 Poland 55 3.82%
10 Portugal 60 4.17% 11 Spain 70 4.86% 12 Sweden 85 5.90% 13 Switzerland 63 4.38% 14 Turkey 55 3.82% 15 United Kingdom 200 13.89%
TOTAL 1440
Table 3 Country Wise Size – Book to Market Portfolios
Country S/H S/M S/L B/H B/M B/L Total
Austria 21 17 18 21 20 23 120 Belgium 18 17 14 20 16 15 100 Finland 13 14 12 15 14 12 80 France 30 24 25 35 23 23 160 Germany 33 28 23 30 27 29 170 Greece 15 19 10 13 11 9 77 Italy 12 17 11 15 7 13 75 Netherlands 11 11 13 10 13 12 70 Poland 7 13 8 7 11 9 55 Portugal 13 11 9 9 8 10 60 Spain 12 12 7 9 13 17 70 Sweden 18 17 13 14 11 12 85 Switzerland 13 11 9 8 10 12 63 Turkey 13 11 12 6 8 5 55 United Kingdom 35 27 29 30 36 43 200
Total 264 249 213 242 228 244 1440
-to-market portfolios. These six portfolios are B/L, B/M, B/H, S/L, S/M, and S/H. The B/L portfolio contains stocks that are in the big group and have a low B/M ratio, whereas the S/H portfolio contains stocks that are in the small-size group and have a high book-to-market ratio. Table 3 presents the country-wide participation in these six portfolios.
Fama and French (1996) and Lakonishok, Shleifer, and Vishny (1994) opt for equally weighted portfolios and suggest that the three-factor model performs even

Finance a úvěr-Czech Journal of Economics and Finance, 61, 2011, no. 2 183
better in equally weighted settings than in value-weighted portfolios. Therefore, we use equally-weighted portfolios to compute the portfolio returns.
3.5.3 Market Premium SMB and HML Factors The market premium will be estimated as the difference between the return on
the MSCI EMU index and the EURIBOR overnight rate. As mentioned before, this factor is similar to the CAPM, but for the three-factor model it shares risk factors with SMB and HML. It will be estimated as follows:
t mt fRP R R= −
SMB captures the risk factor in the returns related to firm size. It is the dif-ference between the simple average of the equally weighted returns on the three small stock portfolios and the three big portfolios. Mathematically
3 3
S S S B B BL M H L M HSMB
⎡ ⎤ ⎡ ⎤+ + + +⎣ ⎦ ⎣ ⎦= −
HML accounts for the risk factor that is related to firm value. It is the dif-ference between the return on the portfolio of high B/M stocks and the return on the portfolio of low B/M stocks, constructed to be neutral vis-à-vis size. It can be represented as follows
2 2
S SB BH H L LHML
⎡ ⎤ ⎡ ⎤+ +⎣ ⎦ ⎣ ⎦= −
Given that the data frequency is daily, all our estimates will be on per day basis.
3.6 Hypotheses The regression model was applied to test the validity of the FF three-factor
model. This model is tested for the six size and book-to-market portfolios. The ex-cess return on each portfolio will be regressed on the risk premium and the size and value factors. The model is 1 2 3( ) ( )it i t t t t tER RP SMB HML eα β β β= + + + +
Since this is a multivariate regression model, the following hypotheses (alter-native) will be tested.
1
2 1
3 2
4 3
: 0: 0: 0: 0
P
t
t
t
HHHH
αβββ
≠≠≠≠
Where Pα represents the regression intercept and 1tβ , 2tβ , and 3tβ represent risk sensitivities. The three-factor model will hold if the intercept is not significant (statistically zero) and the three slope coefficients are significant (statistically dif-ferent from zero).

184 Finance a úvěr-Czech Journal of Economics and Finance, 61, 2011, no. 2
Table 4 Descriptive Statistics of Daily Returns (2002–2006) (in %)
B/H B/L B/M S/H S/L S/M
Mean 0.05 0.03 0.03 0.03 0.05 0.07 Median 0.09 0.08 0.08 0.07 0.08 0.10 Maximum 3.79 3.60 2.74 2.34 2.59 1.88 Minimum -3.25 -2.96 -3.03 -3.66 -3.57 -4.04 Std. Dev. 0.69 0.74 0.69 0.64 0.58 0.56
Table 5 Descriptive Statistics of MSCI-EMU Daily Returns (2002–2006) (in %)
Mean Median Maximum Minimum Std. Dev.
MSCI 0.02 0.06 5.56 -5.07 1.10
4. Empirical Results and Analysis 4.1 Descriptive Statistics
The daily returns between January 2002 and December 2006 were computed on the six sorted portfolios. Table 4 presents the descriptive statistics of these port-folios.
For the sample period, the S/M portfolio offered the highest average daily return (0.07%), followed by S/L and B/H (0.05%). The maximum per day return was yielded by big stocks having high book-to-market ratios (3.79%) and the minimum daily return in the observation period was offered by small stocks with medium book- -to-market ratios.
The daily standard deviations were on the higher side, with 0.74% for B/L stocks being the maximum and 0.58% for the S/L portfolio being the minimum. The higher standard deviations for all these portfolios demonstrate a high risk profile for the sample stocks. The graphical representation reveals that the returns are highly volatile in the first year of the sample. This is the period preceding the September 11 events in the United States. Therefore, it is logical that the financial markets were in turmoil and investment decisions were sensitive to rumors, resulting in highly vola-tile stock markets. Table 5 documents similar characteristics for the MSCI EMU index returns. The average daily returns are even more volatile than the six size- and value-sorted portfolios.
The mean average daily returns on the index portfolio are 0.02%, with a maxi-mum of 5.5% and a minimum of -5.0% and with a standard deviation of 1.1%. The ob-servation of the market portfolio is similar to the sorted portfolios and it is evident that the turbulence that was apparent in the size and book-to-market portfolios can also be observed in the returns of the market portfolio. From 2002 to 2006 the aver-age daily market risk premium was dominant as compared to the size and value pre-mium. It is interesting to note the magnitude of the average value premium, which is negative but very low. This is because the average value premium on our small stocks (S/H – S/L) was lower than the value premium on the big stocks (B/H – B/L), mainly due to the higher average returns yielded by small stocks with low book-to- -market ratios. Therefore, we can conclude that on average the growth stocks outper-formed the value stocks. However, the size premium was positive, with small stocks
Finance a úvěr-Czech Journal of Economics and Finance, 61, 2011, no. 2 185
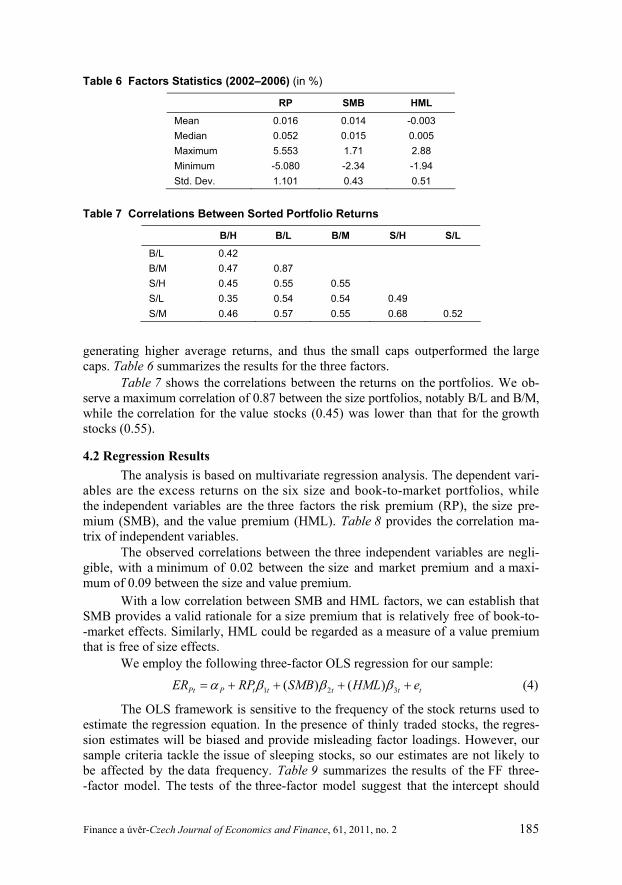
Table 6 Factors Statistics (2002–2006) (in %)
RP SMB HML
Mean 0.016 0.014 -0.003 Median 0.052 0.015 0.005 Maximum 5.553 1.71 2.88 Minimum -5.080 -2.34 -1.94 Std. Dev. 1.101 0.43 0.51
Table 7 Correlations Between Sorted Portfolio Returns
B/H B/L B/M S/H S/L
B/L 0.42 B/M 0.47 0.87 S/H 0.45 0.55 0.55 S/L 0.35 0.54 0.54 0.49 S/M 0.46 0.57 0.55 0.68 0.52
generating higher average returns, and thus the small caps outperformed the large caps. Table 6 summarizes the results for the three factors.
Table 7 shows the correlations between the returns on the portfolios. We ob-serve a maximum correlation of 0.87 between the size portfolios, notably B/L and B/M, while the correlation for the value stocks (0.45) was lower than that for the growth stocks (0.55).
4.2 Regression Results The analysis is based on multivariate regression analysis. The dependent vari-
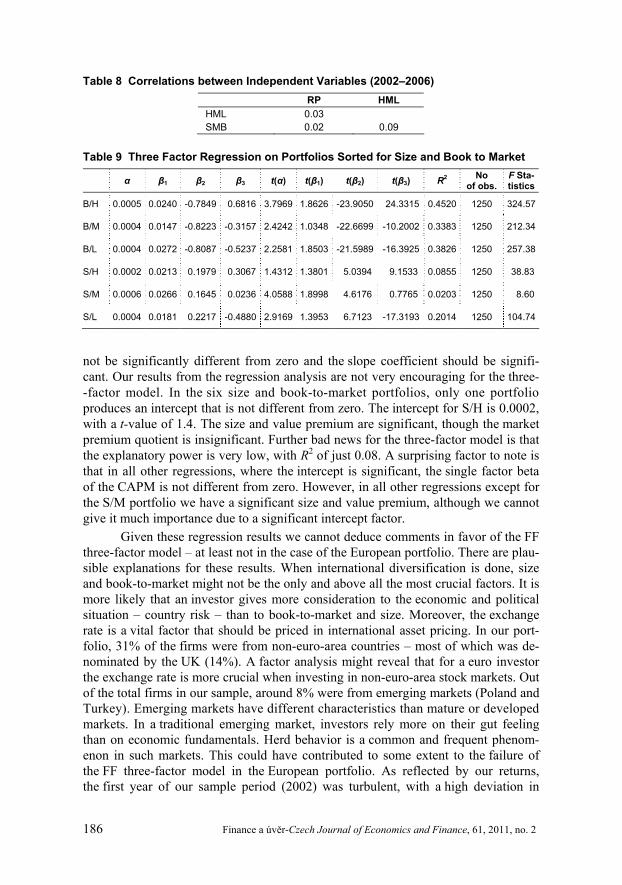
ables are the excess returns on the six size and book-to-market portfolios, while the independent variables are the three factors the risk premium (RP), the size pre-mium (SMB), and the value premium (HML). Table 8 provides the correlation ma-trix of independent variables.
The observed correlations between the three independent variables are negli-gible, with a minimum of 0.02 between the size and market premium and a maxi-mum of 0.09 between the size and value premium.
With a low correlation between SMB and HML factors, we can establish that SMB provides a valid rationale for a size premium that is relatively free of book-to- -market effects. Similarly, HML could be regarded as a measure of a value premium that is free of size effects.
We employ the following three-factor OLS regression for our sample: 1 2 3( ) ( )Pt P t t t t tER RP SMB HML eα β β β= + + + + (4)
The OLS framework is sensitive to the frequency of the stock returns used to estimate the regression equation. In the presence of thinly traded stocks, the regres-sion estimates will be biased and provide misleading factor loadings. However, our sample criteria tackle the issue of sleeping stocks, so our estimates are not likely to be affected by the data frequency. Table 9 summarizes the results of the FF three- -factor model. The tests of the three-factor model suggest that the intercept should
186 Finance a úvěr-Czech Journal of Economics and Finance, 61, 2011, no. 2
Table 8 Correlations between Independent Variables (2002–2006) RP HML HML 0.03 SMB 0.02 0.09
Table 9 Three Factor Regression on Portfolios Sorted for Size and Book to Market
α β1 β2 β3 t(α) t(β1) t(β2) t(β3) R2 No of obs.
F Sta- tistics
B/H 0.0005 0.0240 -0.7849 0.6816 3.7969 1.8626 -23.9050 24.3315 0.4520 1250 324.57
B/M 0.0004 0.0147 -0.8223 -0.3157 2.4242 1.0348 -22.6699 -10.2002 0.3383 1250 212.34
B/L 0.0004 0.0272 -0.8087 -0.5237 2.2581 1.8503 -21.5989 -16.3925 0.3826 1250 257.38
S/H 0.0002 0.0213 0.1979 0.3067 1.4312 1.3801 5.0394 9.1533 0.0855 1250 38.83
S/M 0.0006 0.0266 0.1645 0.0236 4.0588 1.8998 4.6176 0.7765 0.0203 1250 8.60
S/L 0.0004 0.0181 0.2217 -0.4880 2.9169 1.3953 6.7123 -17.3193 0.2014 1250 104.74
not be significantly different from zero and the slope coefficient should be signifi-cant. Our results from the regression analysis are not very encouraging for the three- -factor model. In the six size and book-to-market portfolios, only one portfolio produces an intercept that is not different from zero. The intercept for S/H is 0.0002, with a t-value of 1.4. The size and value premium are significant, though the market premium quotient is insignificant. Further bad news for the three-factor model is that the explanatory power is very low, with R2 of just 0.08. A surprising factor to note is that in all other regressions, where the intercept is significant, the single factor beta of the CAPM is not different from zero. However, in all other regressions except for the S/M portfolio we have a significant size and value premium, although we cannot give it much importance due to a significant intercept factor.
Given these regression results we cannot deduce comments in favor of the FF three-factor model – at least not in the case of the European portfolio. There are plau-sible explanations for these results. When international diversification is done, size and book-to-market might not be the only and above all the most crucial factors. It is more likely that an investor gives more consideration to the economic and political situation – country risk – than to book-to-market and size. Moreover, the exchange rate is a vital factor that should be priced in international asset pricing. In our port-folio, 31% of the firms were from non-euro-area countries – most of which was de-nominated by the UK (14%). A factor analysis might reveal that for a euro investor the exchange rate is more crucial when investing in non-euro-area stock markets. Out of the total firms in our sample, around 8% were from emerging markets (Poland and Turkey). Emerging markets have different characteristics than mature or developed markets. In a traditional emerging market, investors rely more on their gut feeling than on economic fundamentals. Herd behavior is a common and frequent phenom-enon in such markets. This could have contributed to some extent to the failure of the FF three-factor model in the European portfolio. As reflected by our returns, the first year of our sample period (2002) was turbulent, with a high deviation in
Finance a úvěr-Czech Journal of Economics and Finance, 61, 2011, no. 2 187
returns. It is likely that the post-September 11 era contributed to our insignificant results for the three-factor model.
Nevertheless, we have an alternate story to narrate that could be viable for the European portfolio and is subject to future research. Daniel and Titman (1997) opt for a characteristics model that says that non-zero intercepts are expected when stocks have value premium loadings that are not balanced with their book-to-market ratio. Since we form an international portfolio with a union of all countries, it is like-ly that their value loadings in the international environment are different than in their home country and the global portfolio creates disequilibrium in the HML risk load-ings and book-to-market ratios.
The FF three-factor model lacked explanatory power in at least two other studies. Although we did not test the performance of the FF three-factor model in-dividually in our sample countries, our results are consistent with those of Griffin (2002) and Moerman (2005) for the global portfolio. They employed a different meth-odology to study the FF three-factor model in local as well as international markets. Griffin (2002) suggested that the FF three-factor model is viable in a domestic setting but it cannot explain returns in an international scenario. Similar results were report-ed by Moerman (2005), who studied stocks of European countries and concluded that the FF three-factor model is domestic in nature. Our study makes an important con-tribution to the existing literature on asset pricing. Primarily, we test the three-factor proposition in an international setting using a global portfolio approach different from that of Moerman (2005) and Griffin (2002). Our framework treats the sample coun-tries as a single market and selects a sample with cross-border stocks from all sectors (except the financial sector) using currency-neutral returns. We rank these stocks on size and value factors regardless of their ranking in the domestic markets, and the re-sulting portfolios are independent of the domestic characteristics. Furthermore, un-like Moerman (2005) our results are not sector specific and we report the inability of the Fama and French factors in a global sense. Moreover, our proxy of the risk-free rate and the market return are not regression estimates from domestic proxies. Rather, we use two global indices as proxies for the risk-free rate and the market return. Therefore, our results, which confirm the inconsistency of the three-factor model in international portfolios, provide evidence against the size and value proposition using innovative methodology and indices.
5. Conclusion Asset pricing is a puzzle that financial economists have been trying to solve
for almost half a century. Some propositions have gained attention, while millions of others have been laid to rest without being noticed. The single and multi-factor asset- -pricing models have mixed results in different parts of the globe. Some advocate the single-factor beta as the most viable factor for returns, while others report that beta has long been dead. This paper tried to explore the power of the FF three-factor model in an international framework.
We selected stocks from 15 European countries and sorted them into six port-folios at the intersection of size and book-to-market. Since we were employing a global portfolio, we used the MSCI EMU index as the benchmark for market re-turns, with the EURIBOR overnight rate as the risk-free proxy. A multivariate frame-
188 Finance a úvěr-Czech Journal of Economics and Finance, 61, 2011, no. 2
work was deployed to test the validity of the three-factor model. The results showed that except for one portfolio (S/H) the intercept terms were significantly different from zero and thus the FF three-factor model could not explain global European port-folio returns.
Despite the empirical results and evidence we obtained, it is very difficult to reach an unambiguous conclusion. The first and foremost remark could be that the FF three-factor model has failed as a model. However, one cannot be that blunt, as its failure can only be established if there is a better alternate proposition. Therefore, it is more prudent to discuss the problems that might underlie our estimations and evi-dence. Theoretically, these asset-pricing models are valuable for deducing the eco-nomic rationale behind investment decisions, but they are burdened by problems when used to analyze human behavior. Financial economists have encountered numerous methodological problems whenever they have tried to model investor psychology. This is due to the uncertain future economic environment, which causes theoretical mod-els to deviate from practice. The same goes for our research. As investors’ behavior is subject to change, it is possible that a different sample period could lead to dif-ferent results. However, as also pointed out by Griffin (2002) and Moerman (2005), the FF three-factor model is poor in explaining international returns due to the vary-ing cross-section of returns across borders. Therefore, there are two possible areas of future research for European countries. The first is to examine how valid the char-acteristic model is and how we can attribute the failure of the three-factor model to the characteristics proposition. The second is to investigate whether there are addi-tional factors that are priced by investors when considering overseas stock invest-ments. REFERENCES
Aleati A, Gottardo P, Murgia M (2000): The Pricing of Italian Equity Returns. Economic Notes, 29(2):153–177. Bachelier L (1900): Théorie de la Spéculation. Annales de l'Ecole Normale Supérieure de Paris. Baesel JB (1974): On the Assessment of Risk: Some Further Consideration. Journal of Finance, 29(5):1491–1494. Barber B, Lyon J (1997): Detecting long-horizon abnormal stock returns: the empirical power and specification of test statistics. Journal of Financial Economics, 43(3):341–72. Beltratti A, Tria M di (2002): The Cross-section of Risk Premia in the Italian Stock Market. Economic Notes, 31:389–416. Berk J (1995): A Critique of Size-Related Anomalies. Review of Financial Studies, 8:275–286. Black F (1972): Capital Market Equilibrium with Restricted Borrowing. Journal of Business, 45(3):444–55. Black F (1993): Beta and Returns. Journal of Portfolio Management, 20(1):8–18. Blume EM (1971): On the Assessment of Risk. Journal of Finance, 6(1):1–10. Breeden DT (1979): An Intertemporal asset pricing model with stochastic consumption and invest-ment opportunities. Journal of Financial Economics, 7:265–296. Chan LK, Jegadeesh N, Lakonishok J (1995): Evaluating the performance of value versus glamour stocks: The impact of selection bias. Journal of Financial Economics, 38(3):269–296. Chan LKC, Hamao Y, Lakonishok J (1991): Fundamentals and Stock Returns in Japan. Journal of Finance, 46(5):1739–64.

Finance a úvěr-Czech Journal of Economics and Finance, 61, 2011, no. 2 189
Charles L, Ng D, Swaminathan B (2009): Testing International Asset Pricing Models Using Implied Costs of Capital. Journal of Financial and Quantitative Analysis, 44:307–335. Claessens S, Dasgupta S, Glen J (1995): Return Behavior in Emerging Stock Markets. World Bank Economic Review, 9(1):131–151. Connor G, Sehgal S (2001): Tests of the Fama and French Model in India. London School of Economics and Political Science (Financial Markets Group), Discussion paper, no. 379:1–23. Daniel KD, Titman S (1997): Evidence on the Characteristics of Cross Sectional Variation in Stock Returns. Journal of Finance, 52(1):1–33. Davis J (1994): The Cross-Section of Realised Stock Returns: The pre-COMPUSTAT Evidence. Journal of Finance, 49:1579–1593. Davis JL, Fama EF, French KR (2000): Characteristics, covariances and average returns: 1929 to 1997. Journal of Finance, 55:389–406. Doidge C, Griffin J, Williamson R (2006): Measuring the economic importance of exchange rate exposure. Journal of Empirical Finance, 13(4-5):550–576. Drew E, Veeraraghavan M and M (2002): A Closer Look at the Size and Value Premium in Emerging Markets: Evidencefrom the Kuala Lumpur Stock Exchange. Asian Economic Journal, 17:337–51. Drew E, Veeraraghavan M (2003): Beta, Firm Size, Book-to-Market Equity and Stock Returns. Journal of the Asia Pacific Economy, 8(3):354–379. Elton E, Gruber M (1995): Modern Portfolio Theory and Investment Analysis. 5th edition. John Wiley & Sons, New York. Fama EF, French KR (1992): The Cross-Section of Expected Stock Returns. Journal of Finance, 47(2):427–465. Fama EF, French KR (1993): Common Risk Factors in the Returns on Stocks and Bonds Journal of Financial Economics, 33(1):3–56. Fama EF, French KR (1995): Size and Book-to-Market Factors in Earnings and Returns. Journal of Finance, 50(1):131–155. Ferson WE, Sarkissian S, Simin T (1999): The Alpha Factor Asset Pricing Model: A Parable. Journal of Financial Markets, 2:49–68. Fletcher J (2000): On the Conditional Relationship between Beta and Return in International Stock Markets. International Review of Financial Analysis, 9:235–245.
Gaunt C (2004): Size and book to market effects and the Fama French three factor asset pricing model: evidence from the Australian stock market. Accounting and Finance, 44:27–44.
Griffin JM (2002): Are the Fama and French Factors Global or Country Specific? Review of Finan-cial Studies, 15:783–803. Grubel HG (1968): Internationally Diversified Portfolios. The American Economic Review, 58:1299–1314. Halliwell J, Heany RR, Sawicki J (1999): Size and Bood to Market Effects in Australian Share Markets: A Time Series Analysis. Accounting Research Journal, 12:123–137. Haugen RA (1995): The New Finance: The Case against Efficient Markets. Prentice Hall, Engle-wood Cliffs, New Jersey. Kothari SP, Shanken J, Sloan RG (1995): Another Look at the Cross-Section of Expected Stock Returns. Journal of Finance, 50(1):157–184. Lakonishok J, Shleifer A, Vishny RW (1994): Contrarian Investment, Extrapolation and Risk. Journal of Finance, 49:1541–1578. Levy H, Sarnat M (1970): International Diversification of Investment Portfolios. The American Economic Review, 60:668–675.
190 Finance a úvěr-Czech Journal of Economics and Finance, 61, 2011, no. 2
Lintner J (1965): The Valuation of Risk Assets and the Selection of Risky Investments in Stock Portfolios and Capital Budgets. Review of Economics and Statistics, 47:13–37. Markowitz H (1952): Portfolio Selection. Journal of Finance, (March):77–91. Maroney N, Protopapadakis A (2002): The Book-to-Market and Size Effects in a General Asset Pricing Model: Evidence from Seven National Markets. European Finance Review, 6:189–221. Merton RC (1973): An Intertemporal Capital Asset Pricing Model. Econometrica, 41:867–887. Moerman GA (2005): How Domestic is the Fama and French Three-Factor Model? An Application to the Euro Area. Erasmus University Rotterdam – mimeo, pp. 1–32. Mossin J (1966): Equilibrium in a Capital Asset Market. Econometrica, 34:768–783. Roenfeldt R (1978): Further Evidence on the Stationarity of Beta Coefficients. Journal of Financial and Quantitative Analysis, 13:11–21. Ross SA (1976): The arbitrage theory of capital asset pricing. Journal of Economic Theory, 13: 341–360. Sharpe W (1964): Capital Asset Prices: A Theory of Market Equilibrium under Conditions of Risk. Journal of Finance, (September):425–442. Solnik B (1974): Why Not Diversify Internationally rather than Domestically? Financial Analysts Journal, 30:48–54. Tobin J (1958): Liquidity Preference as Behaviour Towards Risk. Review of Economic Studies, 25(2):65–86. Williams JB (1939): The Theory of Investment Value. The Economic Journal,49(193):121–122. Zhang X (2006): Specification tests of international asset pricing models. Journal of International Money and Finance, 25(2):275–307.