Site Analysis
18
Site Analysis
-
Upload
independent -
Category
Documents
-
view
3 -
download
0
Transcript of Site Analysis

Site Analysis

Why Site Analysis
The Site Analysis function maps your entire website in 3-D, reports on broken links and identifies slow loading pages, old pages, even pages consuming too many gigabytes.
Immediate Results
The Site Analysis is the only web spider built inside a browser. In real time, it creates instant Reports that show where the performance of your site needs improvement.
Getting Started
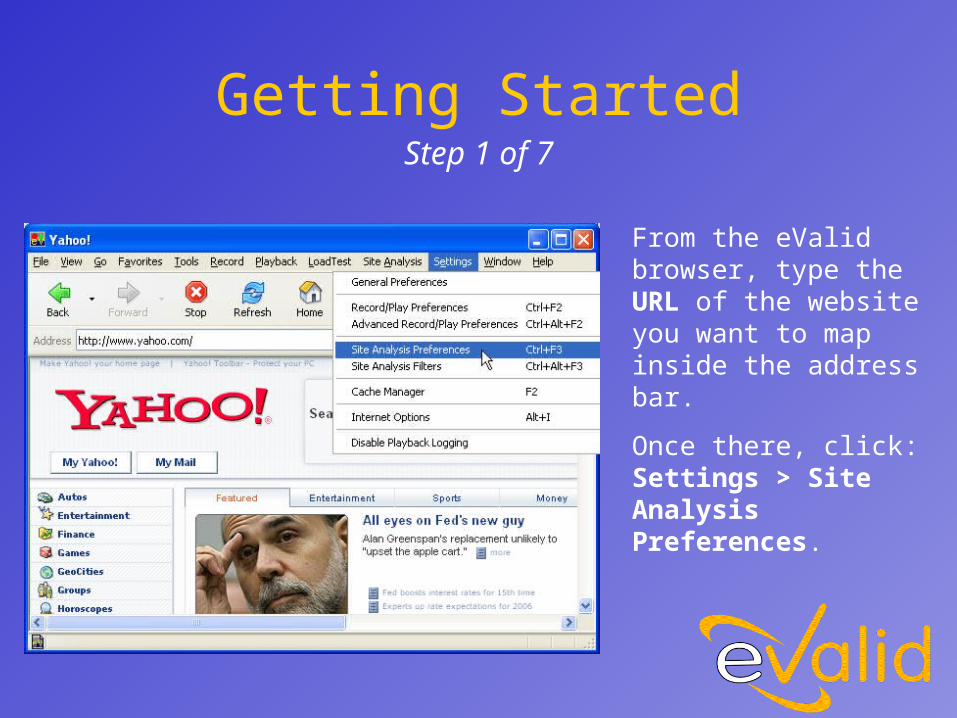
From the eValid browser, type the URL of the website you want to map inside the address bar.Once there, click: Settings > Site Analysis Preferences.
Step 1 of 7
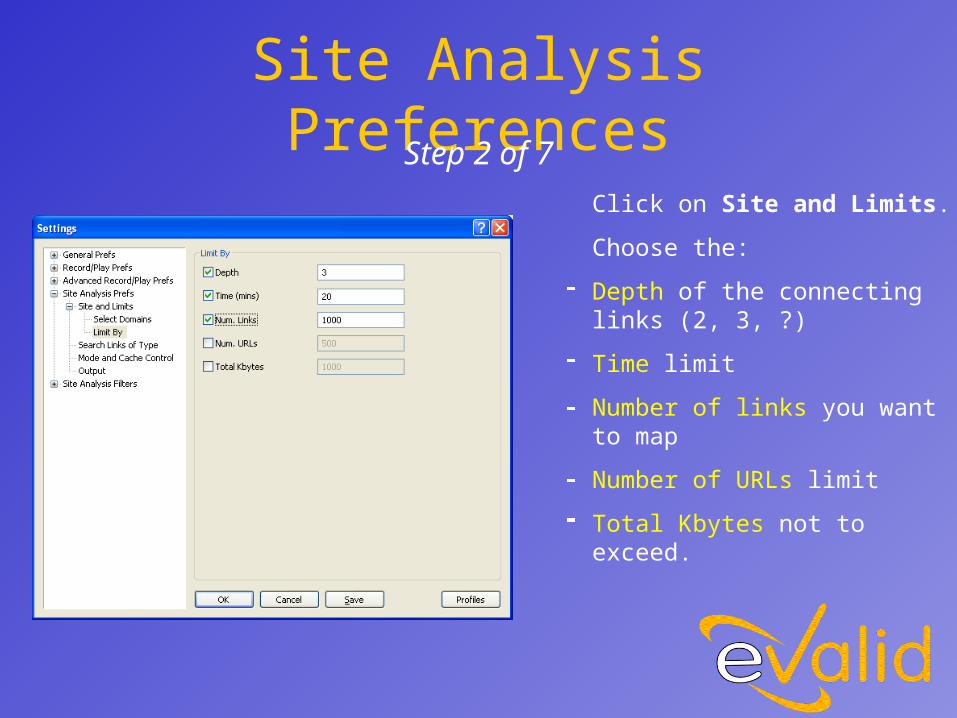
Click on Site and Limits.Choose the:Depth of the connecting links (2, 3, ?)Time limitNumber of links you want to mapNumber of URLs limitTotal Kbytes not to exceed.
Site Analysis PreferencesStep 2 of 7
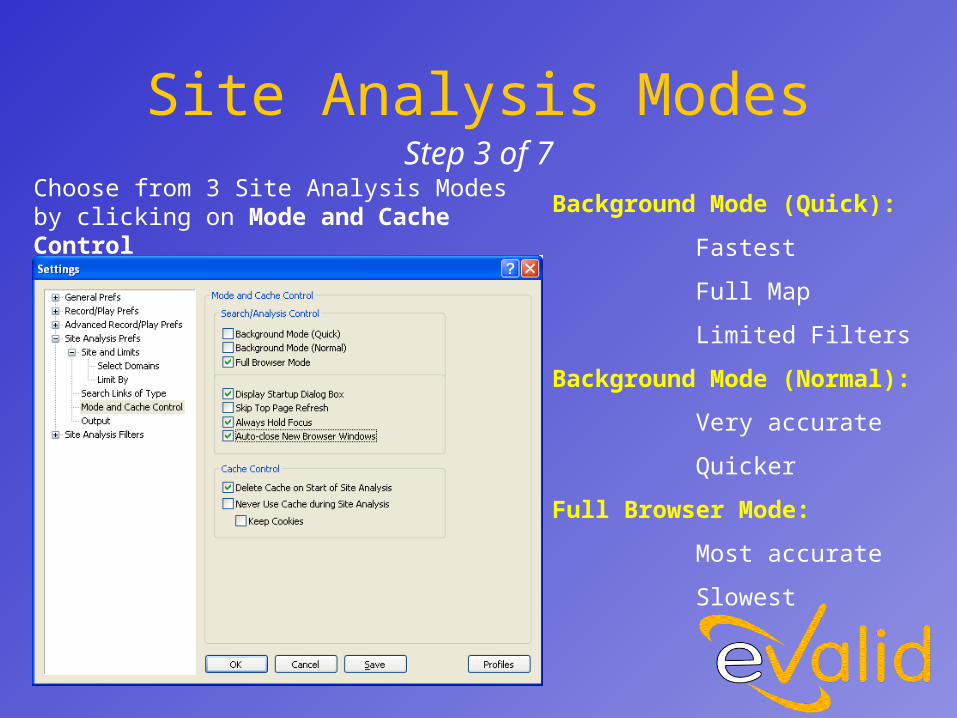
Background Mode (Quick):FastestFull MapLimited Filters
Background Mode (Normal):Very accurateQuicker
Full Browser Mode:Most accurate Slowest
Site Analysis ModesStep 3 of 7
Choose from 3 Site Analysis Modes by clicking on Mode and Cache Control
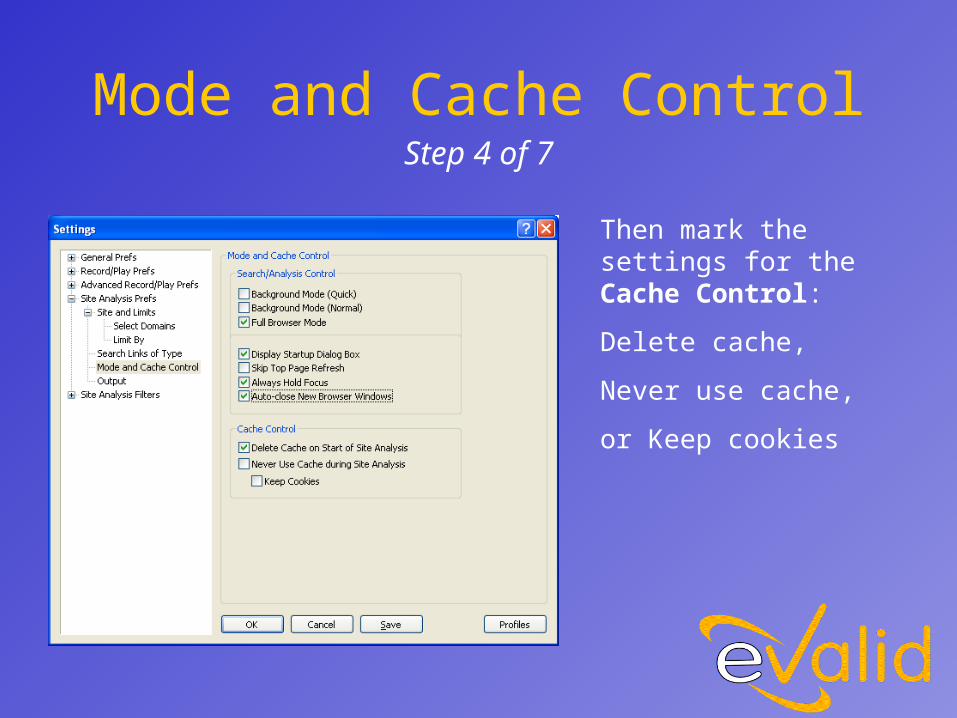
Mode and Cache Control
Then mark the settings for the Cache Control: Delete cache, Never use cache, or Keep cookies
Step 4 of 7

Site Analysis FiltersAfter setting General Filters, select Age and Size Filters for:- Loading Time- Age (days)- Byte size
Step 5 of 7

Site Analysis Complexity Filters
Next select the Complexity Filters (only available if you enabled Full Browser Mode), to determine:- Byte size- Links limit- HTML elements- Visible text charts
Step 6 of 7
- Updated after each page- Show the process in progress- Results summary appears at the end
Site Analysis Action & Reports
- Click the Site Analysis start icon- Once Site Analysis starts runningthe reports start running in real time and are:
Step 7 of 7

eValid 3-D SiteMapeValid 3-D SiteMaps are generated after each Site Analysis run. Each chart is
a complete presentation of your web site’s structure and of
the interdependence of the URLs.
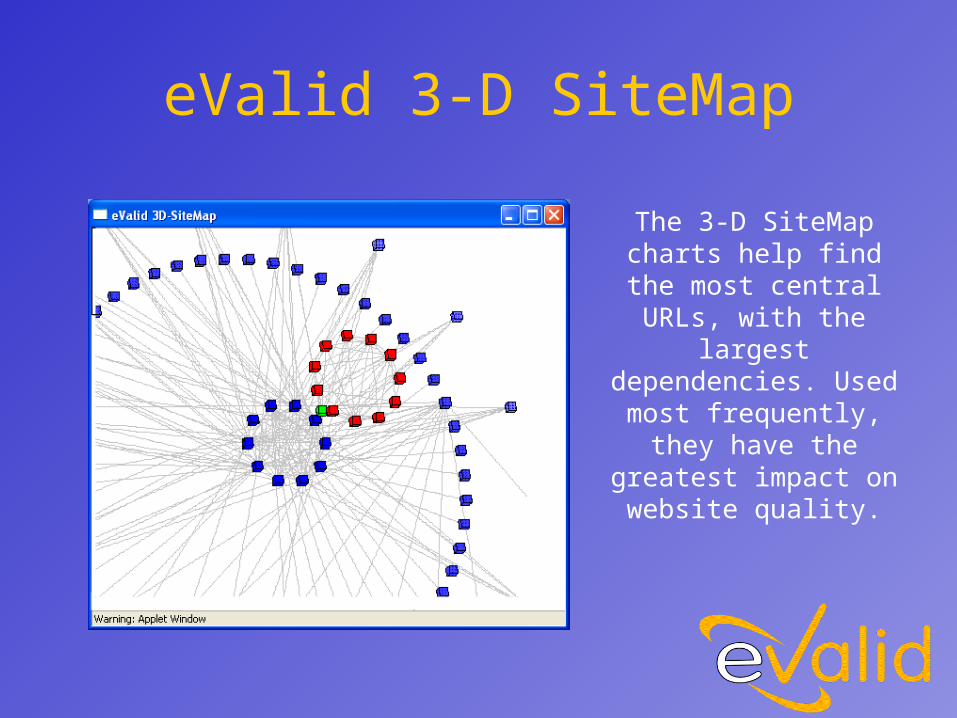
eValid 3-D SiteMapThe 3-D SiteMap charts help find the most central URLs, with the
largest dependencies. Used most frequently, they have the
greatest impact on website quality.
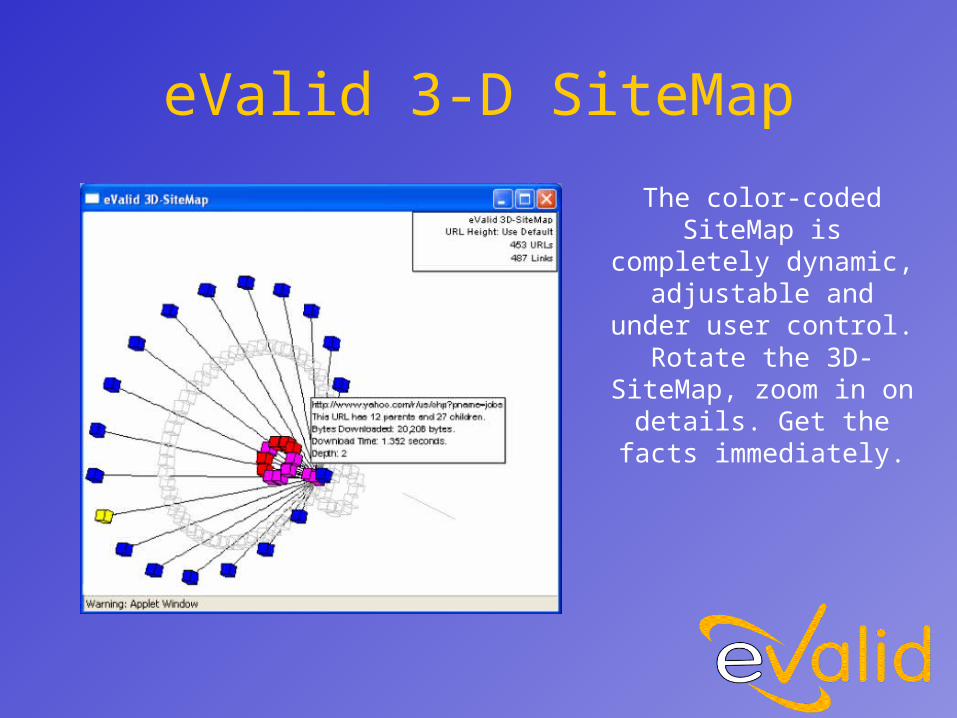
eValid 3-D SiteMapThe color-coded
SiteMap is completely dynamic,
adjustable and under user control.
Rotate the 3D-SiteMap, zoom in on details. Get the
facts immediately.

Sample Broken Links Report
The same information is also available in tabular reports.
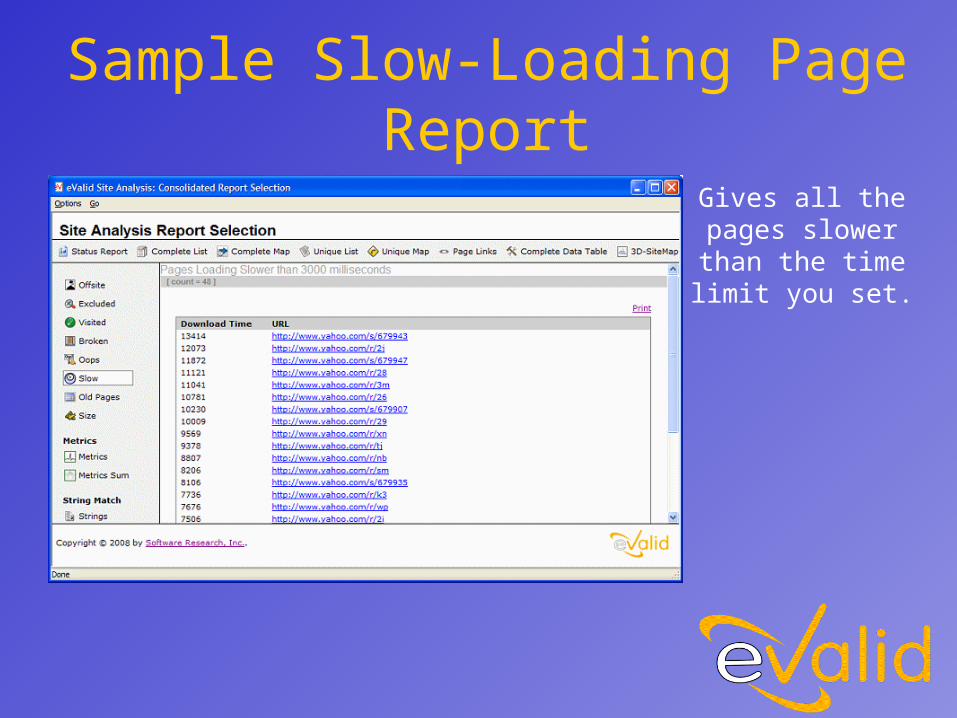
Sample Slow-Loading Page Report
Gives all the pages slower than the time limit you set.
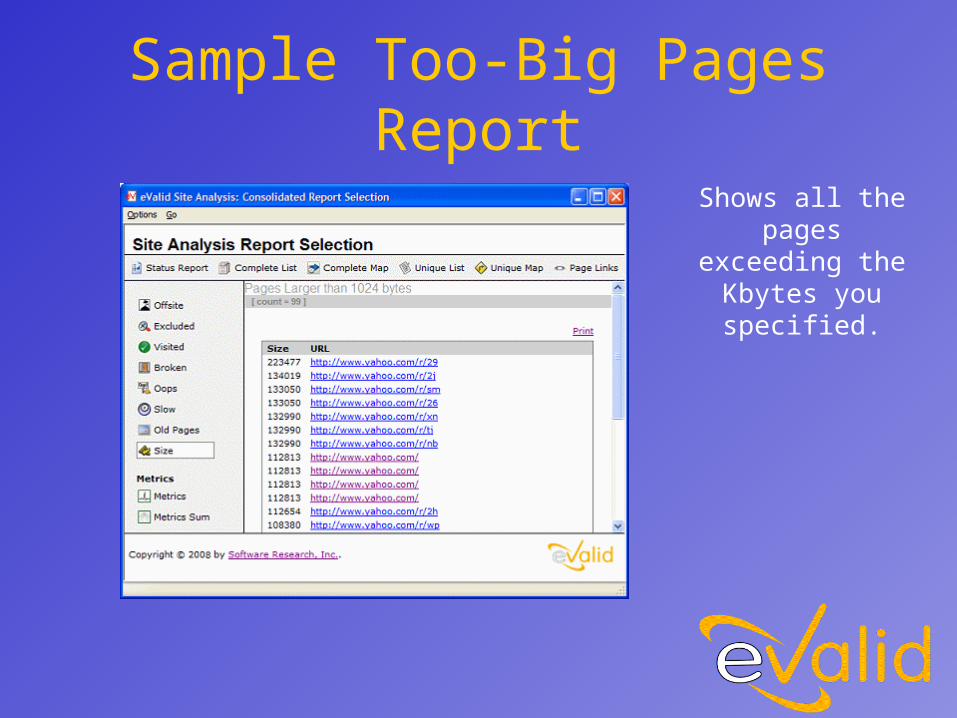
Sample Too-Big Pages Report
Shows all the pages
exceeding the Kbytes you specified.

Sample String-Match Pages Report
Lists all the pages on the topic you chose.
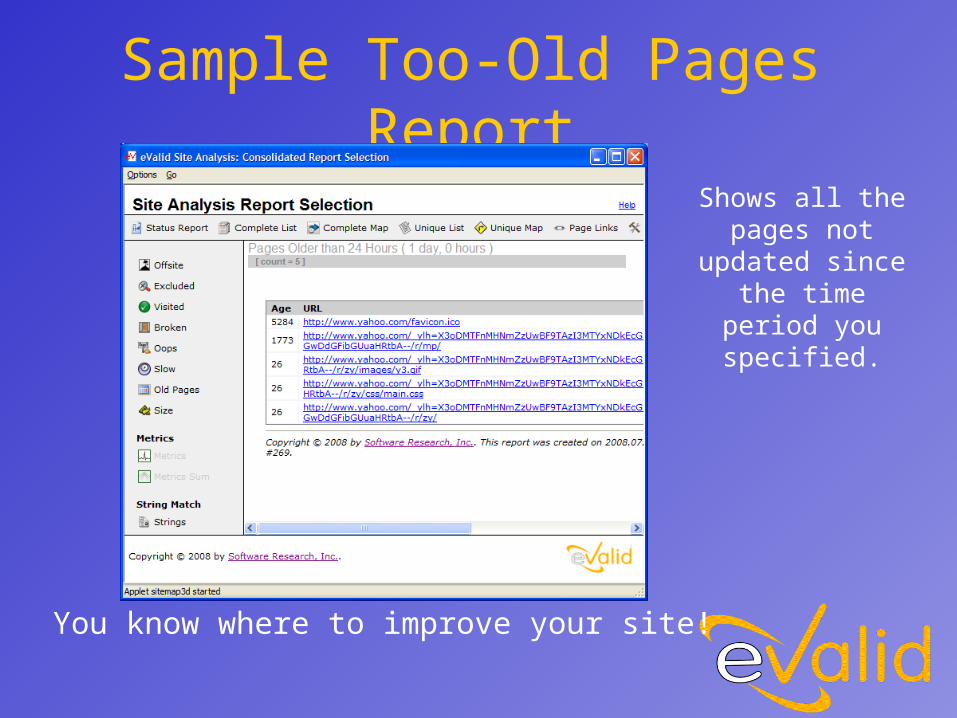
Sample Too-Old Pages Report
You know where to improve your site!
Shows all the pages not
updated since the time period you specified.