Single-energy x-ray absorption detection: a combined electronic and structural local probe for phase...
19
J. Phys.: Condens. Matter 10 (1998) 235–253. Printed in the UK PII: S0953-8984(98)87306-2 Single-energy x-ray absorption detection: a combined electronic and structural local probe for phase transitions in condensed matter A Filipponi†, M Borowski†, P W Loeffen†k, S De Panfilis†, A Di Cicco‡, F Sperandini‡, M Minicucci‡ and M Giorgetti§ † European Synchrotron Radiation Facility, BP 220, F-38043 Grenoble, France ‡ UdR INFM, Dipartimento di Matematica e Fisica, Universit` a degli Studi di Camerino, Via Madonna delle Carceri, 62032 Camerino (MC), Italy § Dipartimento di Chimica, Universit` a degli Studi di Camerino, Via S Agostino 1, 62032 Camerino (MC), Italy Received 3 September 1997 Abstract. We describe the general principle and prototypical applications of a largely unexploited x-ray absorption technique based on single-energy detection during temperature scans. The present developments take advantage of the highly automated experimental set- ups and unique x-ray radiation characteristics available at third-generation synchrotron radiation sources. The sensitivity of the x-ray absorption cross-section to the local structural order makes it possible to investigate the occurrence of phase transitions. We show that by tuning the photon energy to a spectral feature that is highly sensitive to the sample phase it is possible to follow the occurrence and the characteristics of the phase transition. The sensitivity to the atomic fraction of the sample in a certain phase can be in the 10 -3 range. The energy tunability can be used to enhance the sensitivity to structural or electronic transformations. Several applications to prototypical cases are discussed in detail, including examples of solid–solid phase transitions, melting and undercooling, melting of binary alloys, impurity melting, and non-bulk phenomena. 1. Introduction The availability of third-generation synchrotron radiation sources has given rise to new experimental opportunities in the field of x-ray absorption spectroscopy (XAS). The exceptional brilliance of undulator sources and the resulting high photon flux at the sample has made it possible to push the timescale for the collection of a complete extended x- ray absorption fine-structure (EXAFS) spectrum down to the 1 s range [1] using a set-up based on the quick EXAFS (QEXAFS) monochromator operation mode [2]. Even shorter timescales are now available in a dispersive EXAFS set-up where the best time resolution is about 100 μs [3]. Also for more conventional bending magnet sources the new dedicated machines present considerable advantages due the very small vertical emittance and stability. As a result, an excellent energy resolution can be obtained without compromising the high flux by matching the intrinsic widths of low-index Si reflections with the geometrical beam divergence defined by the slits and source. Full width at half-maximum (FWHM) resolutions in the range of k Present address: Oxford Instruments, Accelerator Technology Group, Osney Mead, Oxford OX2 0DX, UK. 0953-8984/98/010235+19$19.50 c 1998 IOP Publishing Ltd 235
Transcript of Single-energy x-ray absorption detection: a combined electronic and structural local probe for phase...

J. Phys.: Condens. Matter10 (1998) 235–253. Printed in the UK PII: S0953-8984(98)87306-2
Single-energy x-ray absorption detection: a combinedelectronic and structural local probe for phase transitionsin condensed matter
A Filipponi†, M Borowski†, P W Loeffen†‖, S De Panfilis†, A Di Cicco‡,F Sperandini‡, M Minicucci‡ and M Giorgetti§† European Synchrotron Radiation Facility, BP 220, F-38043 Grenoble, France‡ UdR INFM, Dipartimento di Matematica e Fisica, Universita degli Studi di Camerino, ViaMadonna delle Carceri, 62032 Camerino (MC), Italy§ Dipartimento di Chimica, Universita degli Studi di Camerino, Via S Agostino 1, 62032Camerino (MC), Italy
Received 3 September 1997
Abstract. We describe the general principle and prototypical applications of a largelyunexploited x-ray absorption technique based on single-energy detection during temperaturescans. The present developments take advantage of the highly automated experimental set-ups and unique x-ray radiation characteristics available at third-generation synchrotron radiationsources. The sensitivity of the x-ray absorption cross-section to the local structural order makesit possible to investigate the occurrence of phase transitions. We show that by tuning the photonenergy to a spectral feature that is highly sensitive to the sample phase it is possible to follow theoccurrence and the characteristics of the phase transition. The sensitivity to the atomic fractionof the sample in a certain phase can be in the 10−3 range. The energy tunability can be usedto enhance the sensitivity to structural or electronic transformations. Several applications toprototypical cases are discussed in detail, including examples of solid–solid phase transitions,melting and undercooling, melting of binary alloys, impurity melting, and non-bulk phenomena.
1. Introduction
The availability of third-generation synchrotron radiation sources has given rise to newexperimental opportunities in the field of x-ray absorption spectroscopy (XAS). Theexceptional brilliance of undulator sources and the resulting high photon flux at the samplehas made it possible to push the timescale for the collection of a complete extended x-ray absorption fine-structure (EXAFS) spectrum down to the 1 s range [1] using a set-upbased on the quick EXAFS (QEXAFS) monochromator operation mode [2]. Even shortertimescales are now available in a dispersive EXAFS set-up where the best time resolutionis about 100µs [3].
Also for more conventional bending magnet sources the new dedicated machines presentconsiderable advantages due the very small vertical emittance and stability. As a result, anexcellent energy resolution can be obtained without compromising the high flux by matchingthe intrinsic widths of low-index Si reflections with the geometrical beam divergence definedby the slits and source. Full width at half-maximum (FWHM) resolutions in the range of
‖ Present address: Oxford Instruments, Accelerator Technology Group, Osney Mead, Oxford OX2 0DX, UK.
0953-8984/98/010235+19$19.50c© 1998 IOP Publishing Ltd 235

236 A Filipponi et al
1/10 of the typical K-edge widths can be reached under normal operation. The stabilityof the electron orbit contributes to the energy stability of the monochromatic beam. Newexperimental opportunities arise also from the availability of complex sample environmentsand automated acquisition systems which allow the thermodynamic state of the sample,defined by the temperatureT and pressureP , to be changed. These characteristics areparticularly suitable for exploiting techniques based on time-resolved monitoring of thechanges in the absorption spectrum as a function of some sample environment parameter.
In the present paper, we describe the experimental apparatus and the general theoreticalprinciples of a largely unexploited single-energy x-ray absorption detection technique thatwe have recently made operational at the x-ray absorption spectroscopy beamline BM29of the European Synchrotron Radiation Facility (ESRF). The technique is based on thecollection of low-noise absorption scans as functions of a sample environment parameterwhich is appropriately cycled and controlled by the acquisition system. Here we will focuson the temperature variation, but the technique is suitable for further extensions to thepressure, magnetic field and other parameters which define the thermodynamic state of thesample.
It is well known that the study of the x-ray absorption fine structure (XAFS) providesdeep insight into the local structure and electronic properties around selected atomic species.In order to identify the occurrence of phase transitions one has to find the optimal balancebetween the temperature and energy resolution. For a given incoming flux it is possible tocollect complete spectra ofN points every1T . The extreme limit in which the spectrumis composed of a single energy point allows one to obtain the best temperature resolution1T/N for the same total acquisition time (and signal-to-noise ratio). We believe that fora large number of applications the precise measurement of the absorption coefficient ata single wavelength as a function of temperature is the most appropriate experiment foridentifying and studying the occurrence of a phase transition. The tunability and stabilityof the photon source are essential characteristics. By tuning the photon energy to differentx-ray absorption features it is possible to switch the sensitivity from structural to electronicsample properties, thus gaining a wide insight into the physical transformations occurringin the sample as a function of the environmental parameter.
The collection of single-energy time scans is not a new concept, but has seldom beenused to probe reaction kinetics. Examples of recent applications include solid-combustionreactions [4] and the Cu reduction leading to the activation of a catalyst [1]. In thepresent development we focus on the potential interest of this technique for studyingphase transitions in condensed matter. In order to establish the reliability of the simpleinterpretative schemes that we propose, a series of prototypical cases are treated, includingsolid–solid phase transitions, the melting of pure substances and the melting of binary alloyswith a eutectic phase diagram. The technique proves to be an extremely powerful tool forrevealing and investigating phase transitions in condensed matter.
The paper is organized as follows. The experimental set-up is described in detail insection 2, while section 3 is devoted to the discussion of the general principles. Finallyin section 4 a series of prototypical phase transitions are investigated and a quantitativeevaluation of the measurements is performed.
2. The experimental set-up
The present experimental installation is available at the European Synchrotron RadiationFacility (ESRF) x-ray absorption beamline on the bending magnet source BM29. Thebeamline is equipped with a high-stability fixed-exit double-crystal monochromator with

Single-energy x-ray absorption detection 237
the possibility of sagittal focusing [5]. The vertical source size is about 50µm (standarddeviation). Primary slits at 28.5 m from the source can be adjusted in the useful range0.05–2.0 mm of aperture. For a Si(311) crystal at 14.3 keV the smaller slits correspondto FWHM resolving power in the 105 range (ten times better than the K-edge core-holewidths). The continuous spectrum of the source allows one to scan over wide energyintervals of several keV with a reasonably constant intensity and stable beam position atthe sample. The mechanical imperfections of the coupled rotation–translation motion ofthe monochromator are corrected by a piezoelectric crystal with a feedback system. Theinstrument is well suited for collecting high-quality XAFS spectra for a wide range of edgesfrom about 4 keV to over 40 keV.
A variety of sample chambers covering the temperature range 20–3000 K are currentlyavailable. In particular the beamline is equipped with a closed cycle two-stage Hecryostat which operates in the 20–450 K range and a sample chamber for high-temperatureexperiments up to 3000 K based on a published design [6]. In this high-temperatureoven the sample is inserted in an x-ray-transparent resistive crucible and is heated bythe Joule effect in high-vacuum conditions. The temperature read-out is achieved with acombination of contact and non-contact probes including chromel–alumel, Pt–Pt:10%Rhand W:5%Re–W:26%Re thermocouples and a small-spot pyrometer probe (1000–3000◦C).Under favourable conditions simultaneous measurements from both the pyrometer and asuitable thermocouple probe are performed and the read-out is recorded in the acquisitionsystem together with the absorption measurement. The temperature is regulated by adjustingthe input power and it is possible to obtain an excellent stabilization during long acquisitionsas well as to perform programmed ramps with slopes at rates ranging from 100 K s−1 to0.01 K s−1.
With these set-ups it is possible to study phase transitions occurring between 20 Kand 3000 K at fixed pressure in the range 0–1 bar. Planned future installations includesample environment chambers with the possibility of independently varying the pressureand temperature in order to probe interesting regions of theP–T diagram. The feasibilityof studies in the range 300–1000 K and up to 6 GPa using the Paris–Edinburgh large-volumehigh-pressure cell [7] has recently been demonstrated during users’ beamtime. The examplesreported in the following sections will be focused on phase transformations occurring as afunction of temperature.
3. Single-energy x-ray absorption detection
3.1. The general principle
The x-ray absorption coefficient of a homogeneous sample with constant thicknessd isgiven byα = σρd = σρs whereσ is the x-ray absorption cross-section,ρ is the densityof the atoms in the sample andρs is the resulting surface density. In the presence of afirst-order phase transition the absorption coefficient is expected to change discontinuously.There is a trivial discontinuity due to the change in the sample densityρ which reflects intoρs . This produces a discontinuous change ofα over the whole energy range. The likelihoodof seeing such a density discontinuity is strongly related to the nature of the sample: forbulk samples like foils,1ρs/ρs = 1ρ2/3/ρ2/3, while for samples contained in a fixed-thickness container like a cell for liquids,1ρs/ρs = 1ρ/ρ. For droplet samples like thoseused for high-temperature measurements of solid and liquid matter [6] the sample particleschange their volume during phase transitions butρs is mainly governed by the volume ofthe embedding matrix. In the case of porous pellets of graphite or ceramic powder,ρs

238 A Filipponi et al
remains constant and is largely independent of the sample densityρ; therefore, at the phasetransition,1ρs = 0. This property also has a non-negligible advantage in improving thequality of the data collected in typical high-temperature x-ray absorption spectra. In fact, thebasic insensitivity to density changes results in large tolerances as regards the temperaturestability during the measurement. For comparison, in the case of most fluids, which havelarge thermal expansion coefficients, relative temperature stabilities in the 10−4 range arerequired to avoid the introduction of spurious noise in aρ-sensitive sample geometry.
More relevant to the present discussion are the discontinuous changes inσ correspondingto the change in the local structure around photoabsorbing atoms. These are particularlyevident in the energy region close to inner-shell x-ray absorption edges. When the phasetransition is accompanied by a change of the electronic density of unoccupied states closeto the Fermi energy an edge shift occurs which can be detected with very high sensitivity.The discontinuity inσ at a phase transition reflects non-trivial physical effects and can yieldinsight into the specific structural and electronic transformations.
Let us consider the simplest case of a phase transition from phase 1 to phase 2 occurringat T = T ?. The identification of the most sensitive energy points for the observation of thetransition is performed by measuring high-quality x-ray absorption spectra below and aboveT ? and by taking the difference. On tuning the photon energy to one of these points, and onscanning the temperature throughT ?, it is expected that one will observe a sudden changeof the absorption level fromα1 (for phase 1) toα2 (for phase 2) and vice versa on thecooling stroke. Any departure from this simple behaviour (apart from trivial experimentalartifacts) is representative of an interesting physical phenomenon.
A sharp instantaneous discontinuity atT ? is only obtained in the case of first-order phasetransitions characterized by fast dynamics and an absence of overheating (or undercooling)phenomena and for high-purity samples composed of bulk particles. An example of this isthe melting of pure substances and this will be discussed extensively in section 4. In thepresence of metastable phases, phase 1 can survive above the transition temperatureT ? (orvice versa) and a complete cycle will result in a hysteresisα(T ) loop. AboveT ?, phase 1is unstable and will transform eventually to phase 2.
In several cases the transformation takes place in a finite temperature interval of phasecoexistence. A single-energy x-ray absorption detection experiment provides, in these cases,a very accurate determination of the relative atomic fraction of the sample in each phase,as a function of temperature. That is, the atomic fraction of phase 1,f1(T ) is directlycalculated from the measured absorption coefficientα(T ) as
f1(T ) = (α(T )− α2)/1α with 1α = α1− α2. (1)
Considering that typical figures for|1α| and for the noise level in the absorptionmeasurement are 0.1 and 10−4 or better, respectively, it is seen that an excellent sensitivity(in the 10−3 range) in the determination off1 can be obtained. This is an excellent figurefor microscopic samples potentially under extreme conditions for which very few alternativeprobes can be used.
We point out that the technique applies to crystalline phases as well as to disorderedphases (liquids). This information can hardly be obtained with such accuracy with otherstructural techniques. For example the precise determination of the relative fraction of agiven crystalline phase from powder x-ray diffraction during a solid–solid phase transitionis hampered by the continuous change of size and orientation of the crystallites which isreflected in large spatial and temporal intensity changes in the diffraction rings.
Thus, we propose exploiting such single-energy x-ray absorption detection experimentsas functions of a sample environment parameter to investigate the occurrence and nature of
Single-energy x-ray absorption detection 239
phase transitions in condensed matter. Sensitivity to either electronic or structural propertiescan be tuned by varying the photon energy. The experimental set-up described in section 2is ideal for performing such experiments since it permits one to cycle the temperature freelyaround a phase transition at the desired rate.
It can be argued that more information on the phase transition can be gained by collectinga complete spectrum for every temperature point rather than by measuring the absorptioncoefficient at a single energy point. This is, in principle, feasible using a dispersive EXAFSset-up in a few milliseconds per spectrum [3] or on a conventional set-up in a few secondsusing a quick-EXAFS mode [2]. The problem is that of a balance between temperatureresolution, noise level and energy extension. The single-energy technique represents avery useful extremum where all of the incoming photons are used to achieve a very finetemperature resolution (≈0.1 K) and high phase sensitivity due to the lower statisticalnoise with respect to that achievable by collecting a full spectrum in the same time. Thistechnique can be naturally combined, on the same instrument, with the other extremumwhich is conventional EXAFS spectroscopy. This allows one to characterize the phasetransition and to prepare the sample in the desired state on which a complete structuralcharacterization can be successively obtained by EXAFS and/or x-ray diffraction at a fixedtemperature.
3.2. Experimental artifacts
The most critical experimental problems arise from the temperature homogeneity andmeasurement. In the classical geometry [6] the sample is surrounded on three sides bythe x-ray-transparent heating crucible assumed to be at constant temperature. The fourthside is narrow and left open to allow access for the thermocouple. The thermocouple contactis usually placed between the sample and an insulated spacer just above the beam path. Dueto the small wire size (usually 125µm) it is only a minor perturbation to the temperaturefield. The pyrometer probes the surface temperature of the crucible at the beam level. Thecoincidence of the two probes (usually within 10 K) guarantees temperature homogeneityand the correctness of the measurement.
A distribution in the sample temperature may arise from longitudinal inhomogeneitiesalong the crucible [6] (the hotter part being in the middle) or from the upper aperture wherea small side of the sample faces a low-temperature surrounding. For thick samples this mayproduce a slightly cooler inner part and slightly hotter surfaces. In the general case, whatmatters is the sample temperature distributionφ(T ) calculated for the absorbing atomic sitesalong the beam path. The measured absorption curveαmeas(T ) is given by the convolutionof the ideal curve with the temperature distribution
αmeas = φ ∗ α. (2)
All practical cases are in two main categories: either there is a temperature gradient acrossthe sample or there is an extremum. In the former case the temperature distributionis uniform and a step discontinuity at a transition is transformed into a linear risingprofile with a finite slope; the width of the profile corresponds to the width of thetemperature distribution. In the case where an extremum is present, the temperaturedistribution is characterized by an inverse-square-root singularity on one side. The resultingαmeas(T ) function is smoothed by a dependence∼√(T − T ?) on one side of the transition.These characteristic behaviours can be easily identified in test systems and appropriateimprovements of the homogeneity can be made. In general it is not difficult to reduce thetemperature spread below 1 K even for wide samples. The possibility of operating with

240 A Filipponi et al
a small beam also greatly reduces such experimental difficulties, virtually eliminating anydetectable temperature inhomogeneity.
A second experimental artifact can arise from the thermal time constants involved inthe system. In the heating phase the crucible is hotter than the sample and the temperaturegradient required for the heat transfer can be non-negligible. This puts a limit on themaximum heating or cooling rates that can be reasonably produced under equilibriumconditions. Favourable conditions are usually obtained thanks to the small sample mass,typically 100 mg, with time constants of the order of 1 s. Geometries and shapes can beoptimized for specific requirements.
4. Applications
4.1. Solid–solid phase transitions
The prototypical solid–solid phase transition that we consider is the well known transitionfrom b.c.c. (α-Fe) to f.c.c. (γ -Fe) which occurs in pure Fe atTα↔γ = 1185 K [9].
7.10 7.15 7.20 7.25
-0.08
-0.04
0.00
0.04
1.2
1.4
1.6
1.8
2.0
2.2
2.4
2.6
∆αα
γ - α
α -Fe γ -Fe
E (keV)
Figure 1. The Fe K edge for a 5µm Fe foil measured in theα-Fe andγ -Fe phases atT = 1143 K andT = 1218 K respectively. The arrow indicates the highly phase-sensitive pointchosen for the single-energy scans.
We have measured the Fe K-edge x-ray absorption coefficient of an Fe foil 5µm thickinserted between two BN spacers below (T = 1143 K) and above (T = 1218 K) theα ↔ γ transition temperature. The measurements over a wide energy region around theFe K edge are reported in figure 1 together with the difference spectrum. The transition is
Single-energy x-ray absorption detection 241
accompanied by a density increase of about 1%; this is reflected in the pre-edge region as aslight increase of the absorption level. For a quantitative analysis of this effect, the specificvolume� = 1/ρ [10] can be linearized in the vicinity of the transition region as follows:
�α = 5.238 15× 10−4 T + 11.4755 (3)
�γ = 1.284 55× 10−3 T + 10.4531 (4)
whereT is in K and� in A3.Following the previous discussion in section 3, one expects a change of the absorption
1α/α = 1ρ2/3/ρ2/3. Between the temperatures of the two measurements we find adifference1ρ/ρ = 4.7 × 10⁻³ and 1ρ2/3/ρ2/3 = 3.1 × 10⁻³. From considering thefact that at the Fe K edge the absorption coefficient below the edge is about 0.14 times theedge discontinuity, which is about 1.3 in the present case, we expect an absolute absorptiondiscontinuity of1α = 0.6× 10⁻³. The density effects can be minimized, in the presentcase, by taking two temperature values for which the density is the same—for instance,1070 K and 1232 K—or maximized by choosing the temperatures closer to the transitiontemperature.
1120 1160 1200 12402.42
2.44
2.46
2.48
2.50
2.52
α
T (K)
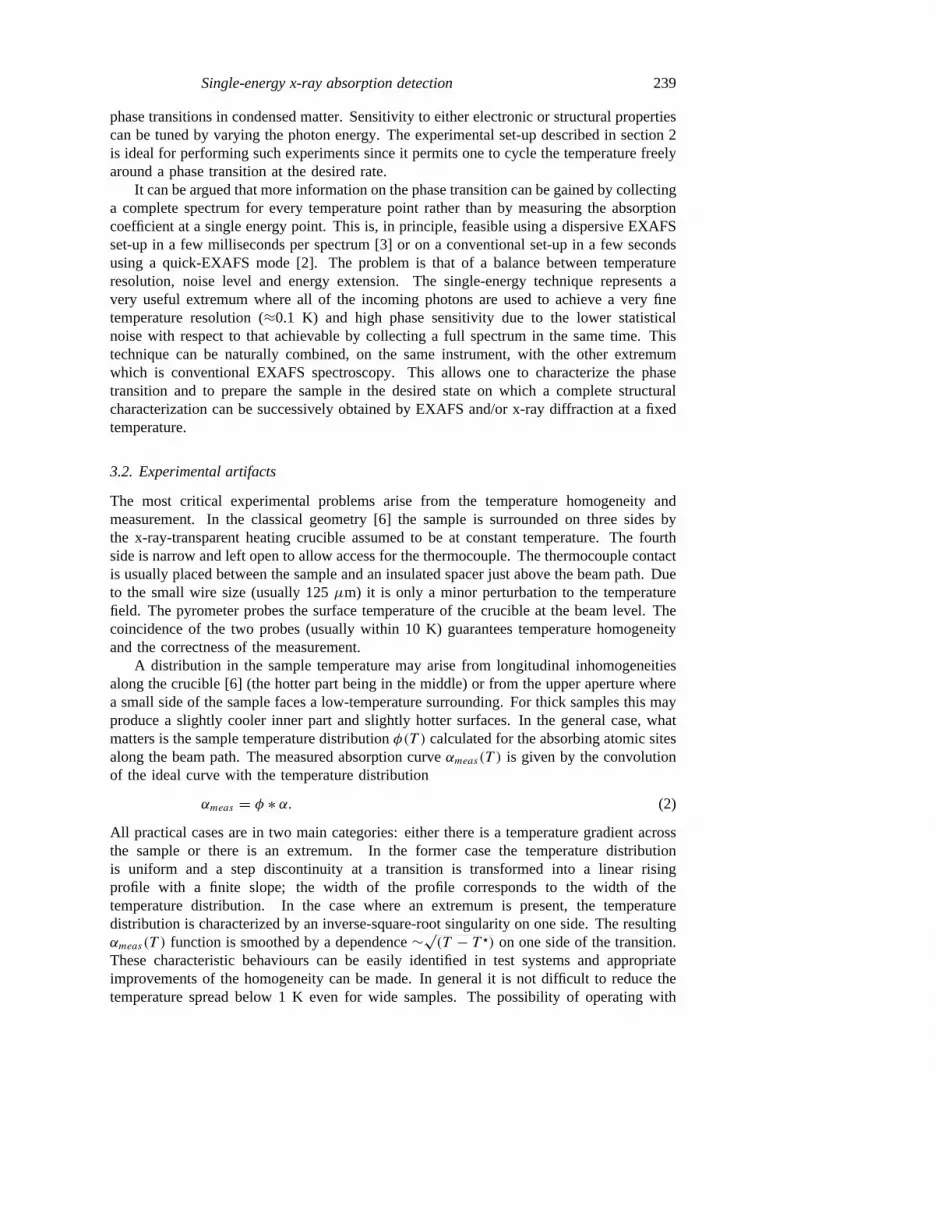
Figure 2. The single-energy x-ray absorption experiment on Fe foil performed atE =7.135 85 keV. The hysteresis of the transition is quite evident.
The difference spectrum in figure 1 shows several energy points which are highlysensitive to the transition both at the rising edge and in the EXAFS region. The formerclearly reflect more the changes in the electronic density of unoccupied states while thelatter region directly reflects structural changes. We have performed a temperature scan atfixed energy choosing one of the high-sensitivity points atE = 7.135 85 keV correspondingto the third maximum in the difference spectrum; here the discontinuity is about 7% ofthe K-edge absorption jump. The results are reported in figure 2. The transformation fromα-Fe toγ -Fe occurs, as expected, aroundTα↔γ . The complete phase transformation occurs

242 A Filipponi et al
in a temperature interval of a few degrees and it is possible to stop the temperature rampat intermediate points to follow the kinetics of the transformation. The clear hysteresisloop is about 20 K wide and it is well reproducible in successive heating cooling cycles asare the details of the absorption curve. It is well known that the Feα ↔ γ transition ischaracterized by a small hysteresis [11] whose magnitude strongly depends on the samplepurity and morphology [12]. A slight carbon contamination with a gradient through thefoil depth profile, arising from the graphite crucible, should also be taken into account toexplain the observed broadening of the transition discontinuity in the present case.
This example shows the insight that can be gained into a solid–solid phase transition bythe present x-ray absorption technique. For the specific case of the Feα ↔ γ transition it isclear that a more detailed study can be undertaken to provide further experimental evidenceto enrich the present debate on the transformation mechanisms [13].
4.2. Melting and undercooling
Melting of pure substances is associated with a discontinuous change in the absorptioncoefficient whose intensity mainly reflects the amount of change in the short-rangeenvironment. Two representative extreme cases have been considered [8]: that of Ag wherethe change in the short-range structural order, from an f.c.c. solid to a close-packed liquid,is small, and that of Ge where dramatic changes of the bonding, structural and electronicproperties occur. The latter case is investigated in more detail in this paper.
Figure 3. The K edge of solid (αS , dashed curve) and liquid (αL, solid curve) Ge at 330 Kand 1370 K respectively. The spectacular edge shift and shape change is generated by thesemiconductor-to-metal transition. The highest-sensitivity point for melting and metallization isindicated by the vertical arrow on the1α(E) curve.
Samples of Ge suitable for high-temperature studies in the solid and liquid phases havebeen prepared from mixtures of Ge and inert matrix powder as described elsewhere [14].We have used high-purity 99.9995% graphite powder and 99.95% BN. Ge K-edge spectrahave been measured with negligible resolution broadening as a function of temperature.The near-K-edge spectra of solid Ge at 330 K and liquid Ge at 1370 K are reported and

Single-energy x-ray absorption detection 243
compared in figure 3. These spectra are similar to those previously reported [14] but ofbetter quality. Melting is accompanied by a dramatic change in the spectrum, with anevident shift of the edge to lower energy by 1.3 eV, with respect to the room temperaturedata, reflecting the disappearance of the energy gap in the semiconductor-to-metal transition.The height of the first resonance increases and the fine structure is smoothed into a relativelyflat background as a consequence of the increased disorder. The difference spectrum1α
is reported in figure 3 on the same scale, indicating that selected energy points have anabsorption discontinuity of the same order of magnitude as the edge jump. The mostsensitive energy point is at the threshold (the vertical arrow atE ≈ 11.101 keV) and mainlyreflects the metallization transition. Energy points sensitive to structural transformations arefound in the fine-structure region instead.
Figure 4. X-ray absorption hysteresis loops detected at fixed energy and obtained by cyclingthe temperature above and belowTm. The upper curves refer to Ge dispersed in BN; thelarge undercooling phenomenon depending on the cooling rate is quite evident. The rates are0.05 K s−1 (solid line), 8 K s−1 (dashed line), 50 K s−1 (dotted line). The lower curve refers toGe dispersed in graphite. A sudden freezing transition is observed in this case atTf ≈ 1140 K(vertical dotted line) as a consequence of some form of interaction occurring between Ge andgraphite particles.
The previous investigation [14] has clearly shown the possibility of substantiallyundercooling liquid Ge. The observed differences in behaviour between BN and graphitematrices are demonstrated more deeply in this study. We performed a large numberof experiments on Ge samples embedded in BN and graphite matrices. Particular carewas devoted to the temperature homogeneity and calibration, which was simultaneouslymeasured by a chromel–alumel thermocouple and a pyrometer. In the absence of impuritiesand for a wide range of particle size we obtained reproducible results. In figure 4 wereport typical hysteresis curvesα(T ) obtained atE = 11.101 keV for Ge embedded inBN and graphite. The upstroke is similar for the two cases: there is a linear increase ofabsorption in the solid phase due to a linear edge shift associated with the effect of the

244 A Filipponi et al
electron–phonon interaction on the density of unoccupied states [15]. AtTm = 1210 Kthe absorption suddenly increases to the liquid value remaining basically constant over arelatively wide temperature range. This corresponds to the absorption of metallic Ge.
The normal pattern observed in the upstroke is not reversible in the downstroke,indicating the possibility of undercooling the samples and clearly shows the differentbehaviours of the BN and graphite matrices. For BN,α(T ) remains at the level ofαLdown to 900 K and then starts to curve down to theαS-value. The slope of the curveindicates a spread of the freezing of the various droplets in the sample, perhaps followingimpurity or size distribution. The freezing temperature was also found to be dependent onthe cooling rate. The three curves reported in figure 4 for BN correspond to cooling ratesof 50 K s−1, 8 K s−1, 0.05 K s−1 for which undercooling ranges of∼400 K, ∼350 K,and∼300 K belowTm were reached, respectively. These results confirm the previous x-rayabsorption findings [14] and conform to the observed behaviour for isolated Ge droplets [16].
In the case of graphite, however, a sharper decrease of absorption is observed atTf = 1140 K which can only be attributed to a sudden freezing of most of the Ge droplets.This freezing temperature is found to be largely independent of the cooling rate.
Figure 5. The temperature variation of the Ge–Ge bond length in c-Ge and of the second-neighbour distances in the hexagonal planes of BN and graphite. The different thermalexpansions of the crystals bring the Ge and graphite distances into coincidence atT ≈ 1000 K.This is relatively close toTf where the freezing of the undercooled Ge/graphite samples isobserved.
An explanation for such peculiar behaviour can be sought in the effects of the Ge/matrixinteractions. Both BN and graphite are immiscible with Ge, but it is known that the presenceof foreign particles can stimulate the crystallization. A mechanism for this phenomenoncan be associated with the close matching of the c-Ge bond length with some characteristicdistance in the matrix. To support this interpretation we report in figure 5 the calculatedGe–Ge bond length as a function of temperature [14] and the corresponding (practicallyconstant) value for the second neighbours on the graphite and BN hexagonal planes. Thereis a close matching between the temperatures at which the graphite and Ge bond lengthsintersect withTf . Thus we propose that freezing is in this case stimulated by the periodicpotential on the graphite planes on a wetting Ge layer, when the temperature is lowered to avalue for which the formation of a covalent bond cannot be avoided. Further investigationson the Ge/graphite interactions are stimulated by these findings.

Single-energy x-ray absorption detection 245
Figure 6. The phase diagram of the Ge1−xAgx alloy. The liquidus curve obtained from thesingle-energy temperature scan for the sample atx = 0.30 is reported as a dotted line. Theclose matching between known and measured curves supports our present interpretation of themeasurements of binary alloys with eutectic phase diagrams.
4.3. Melting of binary alloys
From the phenomenological point of view, melting of binary alloys is a rather complicatedphenomenon. We will limit our discussion to alloys characterized by a simple eutecticphase diagram with the elements fully miscible only in the liquid phase and a minimumof the melting curve atTe corresponding to the eutectic compositionxe. An example ofthese alloys is Ge–Ag whose phase diagram [17] is reproduced in figure 6. An alloy sampleGe1−xAgx , of average nominal compositionx, can be obtained by mixing precursor powderof the two components and by heating to high temperature for a sufficient time. The sampleis stabilized by successive heating and cooling cycles. In the liquid phase it is formed bydroplets of the macroscopic sample compositionx. Fluctuations in the composition betweendifferent droplets are eliminated by the diffusion which occurs especially at high temperaturethroughout the whole pellet. At low temperature each droplet freezes into the mixture ofthe stable solid phases, namely Ge and Ag:Ge. Most of the Ge is in the semiconductingsolid phase, so a Ge K-edge study at 11.101 keV provides the most sensitive measure ofthe Ge melting.
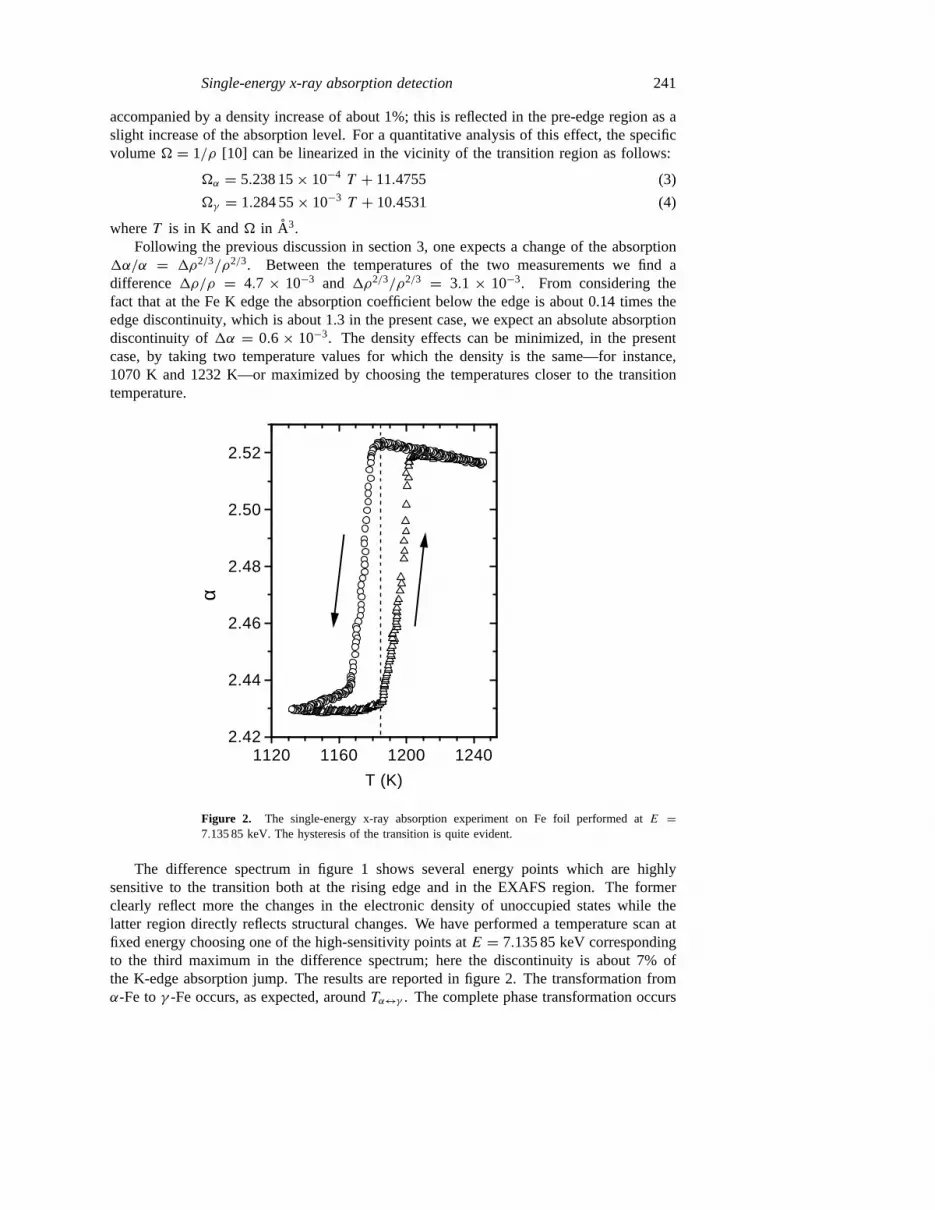
We performed a single-energy experiment on a sample withx = 0.30(1) and themeasured hysteresis curve is reported in figure 7. With respect to the pure Ge case(figure 4) the upper stroke now shows a complicated behaviour with two major absorptiondiscontinuities. The large hysteresis loop occurring in the downstroke indicates that themolten alloy can also be undercooled well belowTe. This is peculiar to Ge and is due tothe substantial undercooling observed in the pure case. A qualitative explanation of the mainfeatures in the upstroke is obtained by assuming that the absorption coefficient reflects thepercentage of metallized (i.e. molten) Ge atoms. This fraction increases with temperaturein a discontinuous way reflecting the phase transitions occurring in the phase diagram ofthe alloy.
A quantitative interpretation can be also given. The concentrationx = 0.30 lies onthe left-hand side of the eutectic compositionxe = 0.741 (figure 6). Let the liquiduscurve be described by the functionTm = θ(x) for x < xe, which we suppose invertible
246 A Filipponi et al
Figure 7. The single-energy absorption curve for Ge0.7Ag0.3. The eutectic melting atTe = 923 K and the successive gradual increase of the absorption, due to the gradual increaseof the sample molten fraction, up to the actual alloy melting point are quite evident. Regions 1,2 and 3 refer to the quantitative model reported in table 1 and described in the text.
Table 1. The sample composition and total absorption as functions of temperature. The actualmolten alloy compositiony in region 2 is determined by the melting curve asy = θ−1(T ).
Region Temperature Stable phases Sample fraction Ge fraction Absorption
1 T < Te Solid Ge 1− x
1− ε1
(1− x)(
1− x
1− ε)
αS(T )
Solid Ag1−εGeεx
1− εεx
(1− ε)(1− x) αa(ε, T )
2 Te < T < θ(x) Solid Ge 1− xy
1
(1− x)(
1− xy
)αS(T )
Molten AgyGe1−yx
y
x(1− y)y(1− x) αL(y, T )
3 T > θ(x) Molten AgxGe1−x 1 1 αL(x, T )
as x = θ−1(Tm). We distinguish three temperature regions as described in table 1 andindicated in figure 7. At low temperature,T < Te, the stable phases are pure solid Ge andsolid Ag:Ge with a small Ge impurity concentrationε. At Te all of the Ag atoms melt withan appropriate fraction
f = 1− xexe
x
1− xof the total Ge atoms to reach the eutectic melt composition. BetweenTe and θ(x) thestable phases are solid Ge and the molten alloy Ge1−yAgy . The concentration is given by
Single-energy x-ray absorption detection 247
the liquidus curve, namelyy = θ−1(T ), which decreases with increasing temperature. Thisimplies the gradual melting of the remaining solid Ge particles and the corresponding rise ofthe absorption coefficient. AboveT = θ(x) the sample is single phase: it is a homogeneousmolten Ge1−xAgx alloy. The molar fractions of the stable phases, the fraction of Ge atomsin each phase, and their absorption coefficients, are indicated in table 1. At the Ge Kedge the Ag absorption cross-section is independent of the phase and therefore this trivialconstant contribution can be neglected. Consequently we can write the x-ray absorptioncoefficient for the three regions as
α1(T ) = εx
(1− ε)(1− x)αa(ε, T )+1
(1− x)(
1− x
1− ε)αS(T ) (5a)
α2(T ) = x(1− y)y(1− x)αL(y, T )+
1
(1− x)(
1− xy
)αS(T ) (5b)
α3(T ) = αL(x, T ) (5c)
where the phase- and temperature-dependent Ge atomic absorption cross-sections areindicated byαS(T ), αa(ε, T ) and αL(x, T ) for solid Ge, Ge in solid Ag:Ge and Ge inthe molten alloy, respectively. The combination of these three expressions results ina piecewise-continuous curve with a discontinuity atTe and a discontinuity in the firstderivative atθ(x). The absorption change in the intermediate region is due, in principle, toboth increased quantity and compositional change of the molten fraction which may affectαL(y, T ). The temperature dependence ofαS(T ) has already been discussed.
A simplified expression can be obtained with the assumption that at the Ge K edgeαa(ε, T ) = αL(x, T ) = αM whereαM is a generic metallic germanium absorption. Thenthe absorption coefficient can be described by the single equation
α(T ) = 1
(1− x)αS(T )+x
y(1− x)[(1− y)αM − αS(T )
](6)
where the absorption changes are due to the variations of the alloy concentrationy in thesecond term. At low temperature,y = 1− ε; at Te, y is suddenly reduced toxe and then itgradually decreases tox at θ(x).
Equations (5) can be used in different ways. If the melting curve is known to a highdegree of accuracy the value of the absorption coefficient for the liquid phase can be obtainedas a function of the composition which changes with temperature:
αL(y) = y(1− x)x(1− y)α(T )−
(y
x− 1
)1
(1− y)αS(T ) (7)
and conversely if the absorption coefficient for the molten phase is known (or assumedknown, possibly having a constant valueαM ) the liquidus curve in the intervalx < y < xecan be obtained:
y(T ) = x[αM − αS(T )][(1− x)α(T )− αS(T )+ xαM ]
. (8)
In both cases the analysis of the temperature scan of a single sample provides interestinginformation on a continuous range of melt compositions.
In the present caseαS(T ) is not directly measured; however, it can be calculated fromthe absorption coefficient in region 1 as given by equation (5a) as
αS(T ) = α1(T )(1+ η)− ηαM (9)
where
η = xε(T )
1− x − ε(T ) . (10)

248 A Filipponi et al
We have used the known solubilityε(T ) of Ge in Ag [17] and the extrapolated values ofthe absorption coefficient measured in regions 1 and 3. In all cases a linear temperaturedependence was assumed. The experimental liquidus curve that is obtained using theseapproximations is reported in figure 6 and is found to be in excellent agreement withthe known curve. In the present case we believe that the composition dependence ofthe absorption coefficients is negligible because it is only reflecting whether Ge is in asemiconducting or metallic phase.
This example shows the degree of insight that can be obtained into binary alloys usingour single-energy technique. Several applications can be foreseen, including the detectionof anomalies of electronic or structural properties as a function of the composition andthe measurements of the liquidus curve at high pressure. Moreover, for alloy samples, thisscanning procedure is essential for establishing whether the corresponding EXAFS spectrumcan be interpreted as originating from a single phase or not. Our results indicate that themolten alloy can be studied over a wide range of temperatures from the undercooling to theevaporation limit.
4.4. Melting in the presence of impurities
For a large class of binary alloys the melting points of pure substances are lowered bythe addition of foreign elements. When these atoms are present in the low-concentrationlimit x ≈ 0 we can approximate the corresponding alloy liquidus curve by a linear functionθ(x) = T 0
m − βx. The effect on the melting curve can be calculated using equation (6) byputtingy = (T 0
m−T )/β and neglecting all first-order terms inx besides those in 1/y whichare diverging towards the melting point of the pure substanceT 0
m, which gives
α(T ) = αS(T )+ xβ
T 0m − T
[αL − αS ]. (11)
This equation indicates that, in the presence of impurities, the absorption discontinuity atmelting is rounded as an inverse functionb/(T 0
m − T ) whereb = xβ is the product of theconcentration and the slope of the melting curve for the alloy with the given impurity. Inpractice a small fraction of the sample still melts atTe but it is usually too small to bedetected. Melting around the impurities proceeds and involves a macroscopic fraction ofthe samples only very close toT 0
m. Typical values ofβ are in the range 100–500 K so, evenfor concentrations in the 10−5 range,b ≈ 10−2. In the case of high sensitivity to meltingin the 10−3 range, like for Ge, the absorption curve has already departed visibly from thepure-substance limit 10 K belowT 0
m. Thus impurities appear to be dominant among thefactors causing the rounding of the melting onset in most cases.
A typical pellet is composed of a mixture of 10–20 mg of sample with 100–500 mgof inert matrix. Typical atomic fractions are 1:50 which means that every impurity in thematrix is amplified by a factor of 50 if it alloys with the sample. In order to keep the finalimpurity concentration below 10−3 it is necessary to use a matrix of extremely high purity,possibly better than 99.999% and to work in a clean environment to avoid contaminationby more than about 10µg of foreign matter.
We point out for comparison that in the EXAFS of the majority atoms, impurities below1% can hardly be detected by their structural signature. Thus the sharpness of melting is arigorous test of overall sample purity as far as structural measurements are concerned.

Single-energy x-ray absorption detection 249
In order to illustrate the impurity melting phenomenon, the absorption curvesα(T ) canbe plotted as functions of the inverse of the molten fractionf :
1/f = αL − αS(T )α(T )− αS(T ) =
T 0m − Txβ
. (12)
αS(T ) andαL can be approximated by linear functions interpolated in the appropriate regionsof the curve. In the case of impurity melting, the first term of equation (12) versusT mustshow a linear behaviour whose slope is inversely proportional to the impurity concentrationtimesβ. In the case of the presence of more impurity species, one can directly assume anadditive effect leading to a slope equal to−1/
∑xiβi .
Figure 8. Impurity melting effects from three different Ge samples demonstrated by plottingthe inverse molten fraction 1/f as a function ofT . The linear behaviour close toT 0
m indicatesa 1/(T 0
m − T ) divergence of the absorption coefficient.
Experimental examples of the effect of impurities in the case of Ge in BN are shownin figure 8 for different impurity levels. The rounded melting pattern cannot be generatedby artifacts due to temperature homogeneity and their impurity origin is confirmed by thisgraphical treatment in which the characteristic−1 power-law behaviour is apparent.
4.5. Non-bulk phenomena
In addition to experimental artifacts or impurities, the sharp bulk melting behaviour can bemodified by the presence of non-bulk components. Samples are normally formed by smallparticles/droplets with a diameter in the 1µm range. These are still macroscopic samplesas far as the thermodynamical and microscopic properties are concerned. As the diameteris lowered down to the cluster range the individual particles are too small to be treatedin the thermodynamic limit and the notion of phase transitions is not valid any longer.As is usually found by molecular dynamics simulation of clusters, atom mobility increaseswith temperature and the structure fluctuates between different low-energy configurations[18]. Correspondingly, a smoothed variation occurring over a wide range of temperaturesis substituted for the derivative discontinuity in the thermodynamic potentials. For thesesystems the corresponding melting pattern is expected to be smeared out into a smootheddiscontinuity.
Between the bulk and the cluster regimes an intermediate situation can be identifiedwhere the particles are still big enough to possess sharp phase transitions, as in the

250 A Filipponi et al
thermodynamic limit, but where the percentage of the surface component increases andbecomes observable. This occurs well above the nanometre scale characteristic of thesmall-particle behaviour. To give a figure, we can estimate that for a spherical particle thatis 2R = 1 µm in diameter, ad = 1 nm surface layer already contributes with a macroscopicvolume percentage equal tof = 3d/R ≈ 0.6% which is above the detectability limit.
Surfaces on their own undergo phase transitions distinct from the bulk ones, includingreconstruction, order–disorder transitions and melting. In particular surface melting [19] hasattracted much attention in recent times. It has been observed for several low-index surfacesof metals [20] and is thought to be a rather general phenomenon initiating the melting ofpure solids. In the Ge(111) case the high-temperature disordering transition at≈1050 K hasbeen described as an incomplete surface melting case [21]. The theory of surface melting[19, 20] predicts a logarithmic (or low-fractional-power) divergence of the molten layeras T approachesTm. In the single-energy experiment one does not directly measure thethickness of the surface layer, but only the molten atomic fraction. However, under verygeneral conditions it can be demonstrated (see the appendix) that the atomic fraction involvedin a molten surface layer of thicknessd is directly proportional tod, for a wide range ofthicknesses, independently of the microscopic details of the matter distribution. In thepresence of a diverging molten surface layer one should, therefore, observe a correspondingdivergence ofαS towardsαL at Tm with the same functional relationship. We concludethat surface melting might be observed as a rounding of the melting onset just like in theimpurity case. We point out, however, that the−1 power law of the impurity melting iseventually going to dominate close toTm over any possible surface melting effect, whichshould be characterized by a weaker divergence. As a consequence, in those cases in whichsurface effects are visible we predict the observation of a crossover to the impurity meltingbehaviour in theα(T ) curve close toTm.
Impurity and surface melting appear to be competing phenomena in the rounding ofmelting patterns. In this work the rounding of the Ge melting curves has been interpretedas impurity melting; however, the present calculations indicate that the surface and impurityeffects in the 10−3 range can be competing. A possible way of discriminating between thetwo effects is on the basis of the different functional behaviours.
Further investigations are required to fully understand the potential of the technique foridentifying and studying surface effects. One clear disadvantage is that our samples cannotbe characterized from the surface physics point of view. They contain in general a largenumber of different surfaces, possibly confined by small lateral extension which mightmodify their behaviour from the infinite-surface case commonly considered. Moreover,surface effects and impurity effects are clearly not easily distinguishable with a volume-sensitive technique for which the surfaces can be regarded as ‘impurities’ of the bulk justlike foreign atomic species.
5. Conclusion
New installations at third-generation synchrotron radiation sources have permitted thedevelopment of novel x-ray absorption experiments and previously unexploited techniqueslike single-energy x-ray absorption detection as a function of sample environmentparameters. In this paper we have described the instrumentation available at ESRF-BM29which allows temperature scans with a closed-cycle He cryostat in the range 20–400 K andwith a high-temperature oven in the range 300–3000 K.
The general principles of single-energy x-ray absorption detection as a probe forphase transitions in condensed matter are formulated and specific cases of first-order

Single-energy x-ray absorption detection 251
phase transitions are discussed. Most of the examples are related to melting which is arepresentative example of these transformations for which a large number of experimentaldata have been collected. The case of binary alloys has been treated and a generalformulation able to explain the main features of the observed pattern has been provided.Finally we have demonstrated the high sensitivity to departures from the ideal behaviourincluding undercooling phenomena and impurity melting, and we have discussed the possiblesignatures for non-bulk effects like cluster or surface melting.
Clearly these examples do not exhaust all of the possible studies. Thermal treatmentcan activate chemical reactions, reversible or non-reversible in nature, and single-energyabsorption can be a method for studying the phenomena with a time resolution of the orderof 0.1–1 s with a very high sensitivity.
Yet, several other applications can be foreseen combined with the scanning of a differentsample environment parameter, like pressure, magnetic field or pH, which stimulate thedevelopment of several other automated control systems.
Single-energy temperature scans are an essential tool to be combined with traditionalXAS for characterizingin situ the nature of the sample and for preparing it in a precisephase. They can provide an independent check of sample purity and nature, and can beused to prepare the sample in a given non-equilibrium state and to confirm its stabilityduring acquisition of complete EXAFS spectra. In this respect the technique that we havedeveloped becomes an important characterization technique to be incorporated in an XASfacility.
The examples presented have shown that even in the case of well understood phasetransitions, like the melting of pure substances, novel information can be obtained forinstance on the undercooling phenomenon. Of course, phase transitions are normallycharacterized by differential scanning calorimetry (DSC) or temperature-dependent x-raydiffraction patterns, and our method is not a substitute for these techniques. Instead, itis largely complementary and can provide novel insight into phase transitions, as can beunderstood by considering the following remarkable characteristics: (a) the local ordersensitivity combined with the atomic selectivity, (b) the photon tunability for selectingelectronic or structural sensitivity and (c) the access to a direct structural probe (EXAFS)at the same installation.
Also, with respect to diffraction, apart from the obvious advantage as regards the numberof photons directly available for absorption measurements with respect to the diffractedones, our technique has the advantage of being extremely accurate in determining theatomic fraction in a selected phase and of being applicable also to phase transformationsinto disordered systems. All of these examples illustrate the potential of the method forinvestigating phase transitions in condensed matter.
Acknowledgments
We acknowledge J Jensen (formerly at ESRF) for his invaluable technical help. All of thebeamtime was on BM29 at the ESRF, under proposals HC-517 and MI-124.
Appendix. The atomic fraction of the molten surface layer
In order to understand the possible effect of a growing molten surface layer on theα(T )
curve close to melting we require an estimate of the atomic molten fraction as a function ofthe surface layer thicknessd. For simplicity we neglect the density differences between the

252 A Filipponi et al
solid and liquid and calculate volume fractions instead. In the limit of smalld with respectto typical particle size, the linear relationf ≈ d6/V holds, where6 is the total area ofthe melting surface andV is the sample volume. This equation breaks down when twomelting layers from equivalent surfaces come into contact yielding a negative second-orderterm. LetR be the average radius of the crystallites andd be the thickness of the moltenlayer. By dimensional arguments, the fraction of molten volume for a single particle willbe f = 1− (R − γ d)3/R3 for γ d 6 R. The dimensionless constantγ depends on thespecific shapes and extension of the melting surfaces. In the case of regular polyhedraor a sphere,γ = 1; in any caseγ is just a proportionality constant and will be omittedin the following. In the real case there will be a size distribution associated with theoriginal powder fragmentation and selection. Let us indicate asp(r), r > 0, the normalizedprobability density of the average particle radiir. The molten volume fractionf is givenby unity minus the solid fraction and is approximated by
f ≈ 1−∫ ∞d
(r − d)3p(r) dr
[∫ ∞0p(r)r3 dr
]−1
= 1
µ(3)
(3dµ(2) − 3d2µ+ d3−
∫ d
0(d − r)3 p(r) dr
). (A1)
This expression can be evaluated exactly for model distributions, but a careful analysisreveals that the leading non-linear terms are largely independent of the details of the particledistribution. They depend in fact only on integral properties like ratios ofnth moments ofthe size distribution with respect tor = 0 (indicated asµ(n)).
The last integral deserves some discussion. The integration limitd originates from thefact that particles smaller thand are completely molten; this is strictly valid for sphericalparticles. Irrespective ofp(r), the resultingf (d) is uniformly continuous with its firstderivative, at least. Ifp(r) is analytic it is possible to obtain a Taylor expansion withrespect to the parameterd, for d = 0. Due to the integration limits and the third power(d− r)3, the first non-vanishing derivative is the fourth one yielding a small corrective termd4p(0). In the general case we find the upper bound∫ d
0(d − r)3p(r) dr < d3
which indicates that the last integral is always smaller than the cubic term of the powerexpansion. In practice the effect of the last integral is negligible as far as the linearityof the relationf (d) is concerned. This result indicates that the departure from a linearrelation betweend and f is largely independent of the details of the particle distributionand depends only on average properties expressed by the moment ratios.
The second-order correction coefficient in dimensionless units equals− 13µ
(3)µ(1)/(µ(2))2
and it is always less than 1 for a large class of realistic particle size distributions. Thismeans that over the whole range up tof ∼ 0.2–0.3, the measuredf (T ) curve can bedirectly interpreted as a quantity proportional to the thickness of the surface layerd(T ),apart from an unknown sample-dependent conversion constant.
References
[1] Als-Nielsen J, Grubel G and Clausen B S 1995Nucl. Instrum. Methods Phys. Res.B 97 522[2] Frahm R 1988Nucl. Instrum. Methods Phys. Res.A 270 578
Frahm R 1989Rev. Sci. Instrum.60 2515[3] Hagelstein M, San Miguel A, Fontaine A and Goulon J 1997Proc. 9th XAFS Conf.; J. Physique Coll.IV at
press

Single-energy x-ray absorption detection 253
[4] Frahm R, Wong J, Holt J B, Larson E M, Rupp B and Waide P A 1992Phys. Rev.B 46 9205[5] Goulon J, Brookes N B, Gauthier C, Goedkoop J, Goulon-Ginet C, Hagelstein M and Rogalev A 1995
PhysicaB 208 + 209199[6] Filipponi A and Di Cicco A 1994Nucl. Instrum. Methods Phys. Res.B 93 302[7] Besson J M, Nelmes R J, Hamel G, Loveday J S, Weill G and Hull S 1992PhysicaB 180 + 181907[8] Filipponi A 1996 J. Phys.: Condens. Matter8 2335[9] Hultgren R H, Desai P D, Hawkins D J, Gleiser M, Kelley K K and Wagman D D 1973Selected Values of
the Thermodynamic Properties of the Elements(Metals Park, OH: American Society of Metals) p 630taken fromLandolt–Bornstein New Series1994 Group III, vol 19i1 (Berlin: Springer)§7.1.1.2, p 3
[10] Basinski Z S, Hume-Rothery W and Sutton A L 1995 Proc. R. Soc.A 229 459[11] Wangsgard A P 1942Trans. ASM30 1303[12] Couture A and Angers R 1986Metall. Trans.A 17 37[13] Takasaki A, Ojima K and Taneda Y 1995Phys. Status Solidia 148 159[14] Filipponi A and Di Cicco A 1995Phys. Rev.B 51 12 322[15] Lautenschlager P, Allen P B and Cardona M 1985Phys. Rev.B 31 2163[16] Devaud G and Turnbull D 1987Acta Metall.35 765[17] Landolt–Bornstein New Series1987 Group IV, vol 5a (Berlin: Springer) p 46[18] Honeycutt J D and Andersen H C 1987J. Phys. Chem.91 4950[19] Tosatti E 1988The Structure of Surfaces IIed J F van der Veen and M A VanHove (Berlin: Springer) p 535[20] Frenken J W M, Maree P M J and van der Veen J F1986Phys. Rev.B 34 7506
Denier van der Gon A W, Smith R J, Gay J M, O’Connor D J and van der Veen J F 1990Surf. Sci.227 143[21] Denier van der Gon A W, Gay J M, Frenken J W M and van der Veen J F1991Surf. Sci.241 335
Takeuchi N, Selloni A and Tosatti E 1994Phys. Rev. Lett.72 2227