Simultaneous determination of sulfadiazine, doxycycline, furaltadone and trimethoprim by partial...
10
Analytica Chimica Acta 313 (1995) 103-112 ANALmcA CHIMICA ACTA Simultaneous determination of sulfadiazine, doxycycline, furaltadone and trimethoprim by partial least squares multivariate calibration A. Espinosa-Mansilla a3 * , F. Salinas a, I. De Orbe Paya b a Department ofAnalytical Chemistq University of Extremadura, 06071 Badajoz, Spain b Department ofAnalytical Chemistry, University of Granada, 18071 Granada, Spain Received 13 October 1994; revised 16 February 1995; accepted 31 March 1995 Abstract Quaternary and ternary mixtures of doxycycline (DX), sulfadiazine (SD), furaltadone (FT) and trimethoprim (TM) were determined by application of a multivariate calibration model. Partial least squares (PLS) methods were applied. The optimized model allowed the simultaneous determination of DX, SD, FD, and TM in artificial mixtures and in milk, and also, the simultaneous determination of SD, FT and TM in artificial mixtures and in a veterinary formulation. Keywords: Sulfonamide; Furaltadone; Tetracycline derivative; Trimethoprim; Partial least squares 1. Introduction Sulfonamides are wide applied in human and veterinary practice for the treatment of several bacte- rial infections. Tetracycline and their derivatives have been also employed as bacteriostatic and antibiotic drugs [l]. The mixture of both drugs is used in veterinary treatment for several pathologies, hence, combination of two or three sulfonamides with tetra- cycline derivatives is frequently commercialized for veterinary application, but not for humans. Furalta- done is a nitrofuran derivative highly effective chemotherapeutic drug well known as antibacterial agent and widely used to fight common infections to humans and animals. It is necessary to take into account that the level dosages in animals is higher * Corresponding author. that in human patients and by this reason consider- able amounts of these drugs could be accumulated into alimentary derivatives (e.g. milk, honey, meat, etc.). Analytical control is necessary because of the possible toxic, allergic or teratogenic effects in hy- persensitive people. Sulfadiazine is a sulfonamide derivative classified as a slow elimination compound (half-life period 11-18 h). The therapeutic dosage is l-2 g/day. The hematic concentration is about 100 pg/rnl for 2 g of dosage. This compound is detected in several body fluids (urine, milk) and pass through the placenta membrane (30-70% of the seric level). On the other hand, doxycycline exhibits teratogenic effects and these compounds can be found in milk (50-100% of the serum level) and urine (30% of the serum level), being the therapeutic dosage 3-4 mg/kg/day. The authorities of many countries insist that no drugs residues be present in foods. Fast methods for 0003-2670/95/$09.50 0 1995 Elsevier Science B.V. All rights reserved SSDI 0003-2670(95)00252-9
-
Upload
independent -
Category
Documents
-
view
1 -
download
0
Transcript of Simultaneous determination of sulfadiazine, doxycycline, furaltadone and trimethoprim by partial...

Analytica Chimica Acta 313 (1995) 103-112
ANALmcA CHIMICA ACTA
Simultaneous determination of sulfadiazine, doxycycline, furaltadone and trimethoprim by partial least squares multivariate
calibration
A. Espinosa-Mansilla a3 * , F. Salinas a, I. De Orbe Paya b a Department ofAnalytical Chemistq University of Extremadura, 06071 Badajoz, Spain
b Department ofAnalytical Chemistry, University of Granada, 18071 Granada, Spain
Received 13 October 1994; revised 16 February 1995; accepted 31 March 1995
Abstract
Quaternary and ternary mixtures of doxycycline (DX), sulfadiazine (SD), furaltadone (FT) and trimethoprim (TM) were determined by application of a multivariate calibration model. Partial least squares (PLS) methods were applied. The optimized model allowed the simultaneous determination of DX, SD, FD, and TM in artificial mixtures and in milk, and also, the simultaneous determination of SD, FT and TM in artificial mixtures and in a veterinary formulation.
Keywords: Sulfonamide; Furaltadone; Tetracycline derivative; Trimethoprim; Partial least squares
1. Introduction
Sulfonamides are wide applied in human and veterinary practice for the treatment of several bacte- rial infections. Tetracycline and their derivatives have been also employed as bacteriostatic and antibiotic drugs [l]. The mixture of both drugs is used in veterinary treatment for several pathologies, hence, combination of two or three sulfonamides with tetra- cycline derivatives is frequently commercialized for veterinary application, but not for humans. Furalta- done is a nitrofuran derivative highly effective chemotherapeutic drug well known as antibacterial agent and widely used to fight common infections to humans and animals. It is necessary to take into account that the level dosages in animals is higher
* Corresponding author.
that in human patients and by this reason consider- able amounts of these drugs could be accumulated into alimentary derivatives (e.g. milk, honey, meat, etc.). Analytical control is necessary because of the possible toxic, allergic or teratogenic effects in hy- persensitive people. Sulfadiazine is a sulfonamide derivative classified as a slow elimination compound (half-life period 11-18 h). The therapeutic dosage is l-2 g/day. The hematic concentration is about 100 pg/rnl for 2 g of dosage. This compound is detected in several body fluids (urine, milk) and pass through the placenta membrane (30-70% of the seric level). On the other hand, doxycycline exhibits teratogenic effects and these compounds can be found in milk (50-100% of the serum level) and urine (30% of the serum level), being the therapeutic dosage 3-4
mg/kg/day. The authorities of many countries insist that no
drugs residues be present in foods. Fast methods for
0003-2670/95/$09.50 0 1995 Elsevier Science B.V. All rights reserved
SSDI 0003-2670(95)00252-9
104 A. Espinosa-Mansilla et al./Analytica Chimica Acta 313 (1995) 103-112
the routine analyses in the pharmaceutical industry are also necessary. Furaltadone, doxycycline and sulfonamides are formulated together for veterinary treatment but not for human treatment. Also, it is necessary to take into account that the therapeutic dosage of these drugs in veterinary treatment is higher that in human treatment (sulfadiazine: 25 mg/kg/day; trimethoprim: 5 mg/kg/day; tetracy- clines: 10 mg/kg/day and furaltadone: 0.6 mg/kg/day). On the other hand, in human treat- ment, the application of furaltadone has been re- stricted for topic use, however, in veterinary treat- ment the oral dosage is applied.
The most recent methods found in the bibliogra- phy to determine sulfonamide mixtures in the pres- ence of other drugs are based on high-performance liquid chromatography (HPLC), hence, HPLC meth- ods have been proposed to determine sulfonamides and penicillins [2], sulfamethazine residues in milk[3], sulfadiazine and trimethoprim in medicated fish [4], sulfamethoxazole, disulfiram, phenazone and clofi- brate in human urine [5] and trimethoprim and sulfa- diazine in broiler tissues [6].
Recently, derivative spectrophotometric [7] and spectrofluorimetric techniques have been applied to resolve drug mixtures with the object to decrease the total time consumed per sample in the analysis, to eliminate the background signals and to simplify the experimental steps previous to the measurements. Simultaneous determination of pharmaceuticals [8], sulfathiazole and sulfadiazine in pharmaceuticals [9], and sulfathiazole and oxytetracycline in honey [lo] by using derivative spectrophotometry have been proposed. On the other hand, these compounds have also been determined by derivative spectrofluorime- try [11,12].
Derivative techniques are good tools to the simul- taneous resolution of organic compounds in base to spectroscopic properties but normally only two com- pounds can be determined due to considerable spec- tral overlapping between these drugs.
Actually, a more powerful way to treat the ternary and more complex mixtures of organic compounds, which exhibit similar spectral characteristics, is the application of multivariate analysis methods. The application of an adequate software package is be- coming possible to apply elaborate mathematical al- gorithms and to develop faster and more certain
analysis methods. Partial least squares (PLS) is a factor analysis based method originally developed by Wold [13] and chemically applied by Wold et al. [14,15]. PLS-1 and -2 types have been described. The difference between both types is that PLS-1 performs the optimization of the number of factors for only one component at a time.
Only two examples of the application of PLS methods to sulfonamide analysis have been de- scribed in the literature. The first paper is a simulta- neous determination of sulfamethoxazole, sulfadia- zine and trimethoprim by using PLS method in tablets [16]. The proposed method is faster that the conventional wet chemical method. Recently, Sanchez Peiia et al. [17] have proposed the determi- nation of binary mixtures of sulfonamides by photo- chemically induced fluorescence and PLS methods. The resolution of binary [18] (furaltadone and fura- zolidone) and ternary [19] (furaltadone, furazolidone and nitrofurantoin) mixtures by using their differen- tial pulse polarography (DPP) signals and PLS multi- variate calibration have been also studied.
The aim of this paper was to investigate the ability of PLS method for quantifying quaternary mixtures of doxycycline, sulfadiazine, furaltadone and trimethoprim and to apply the optimized model in food (milk) and in commercial veterinary formula- tion.
2. Experimental
2.1. Apparatus
A Milton Roy Spectronic 3000 diode-array spec- trophotometer (PC 486 microcomputer) equipped with a lo-mm quartz cell was used. The Milton Roy Rapid Scan Software was used for all data acquisi- tion. The PLSplus version 2.0, application software [20] (GRAMS Software package) was used for the statistical treatment of the data and the application of the PLS methods.
2.2. Reagents and chemicals
Standard solutions (100 pg ml-’ ) of doxycycline (DX), furaltadone (FD), sulfadiazine (SD) and trimethoprim (TM) (Sigma) were prepared by disso-

A. Espinosa-Mansilla et al./Analytica Chimica Acta 313 (1995) 103-112 10.5
Table 1 Training set a composition
Standard (pgml-‘)
DX FT SD TM
8 9
10 11 12 13 14 15 16 17
18 19 20 21 22
36 12
20 16
4 8
36 12 24 16 40
2
32 20
6 20 32 12 4
20 44
8
6 20 16 4
10 8
16 24
6 12 4
20 16
12 2
12 8
20 4
8 16
2 1 2 4 4 6 6 8 8 8
10 12
4 12 12 16 16 16
20 20 20 24
8 32
8 20 48 24
4 16 40
60 20 44 16 20
4 36 40 12 28
20 12
lution in dimethylformamide. All chemicals and sol- vents used were of analytical reagent grade. The commercial formulation Trilabian soluble (Labiana Analitica) was obtained from a local veterinary labo- ratory.
2.3. Procedures
Procedure for resolving quaternary mixtures Analysis of FD, SD and TM in a commercial formu- lation
In a 25ml volumetric flask introduce an aliquot Trilabian soluble is a solid commercial formula- of the sample solution containing between 100 and tion with the stated composition: furaltadone (FD), 900 pg of DX, between 100 and 500 pg of FD, 89.99 g/kg; sodium sulfadiazine, 100 g/kg and between 100 and 400 pg of SD and between 100 trimethoprim, 20 g/kg. A Trilabian standard stock and 1300 pg of TM. Add a variable volume of solution was prepared by placing 0.25 g of the solid dimethylformamide to obtain a 10% final content, 5 product in about 5 ml of dimethylformamide, filtrate ml of pH 4.5 acetic acid/sodium acetate buffer the resultant solution through Whatmann filter paper solution and dilute with water to the mark. Record (No. 242) in a 50-ml volumetric flask and dilute to the absorption spectra between 240 and 460 nm the mark with dimethylformamide. Aliquots of the against a solution containing the same amount of standard stock solution were placed in a 25-ml volu- buffer and dimethylformamide. Prepare a calibration metric flask, a sufficient volume of dimethylfor- matrix with standard mixtures indicated in Table 1. mamide to give a final dimethylformamide-water Optimize the calibration matrix by using the spectral mixture of 10 + 90 (v/v) was added and then ana- region between 242 and 456 nm. Use 5 factors for lyzed as described above.
DX, 4 for FD, 8 for SD and 11 for TM for applica- tion of the PLS-1 method. Apply the optimized calibration matrix to analyze the problem samples and calculate the concentrations for the four compo- nents in the mixture.
Procedure for resolving ternary mixtures In a 25-ml volumetric flask introduce an aliquot
of the sample solution containing between 0 and 900 pg of DX, between 0 and 500 pg of FD, between 0 and 400 pg of SD and between 0 and 1300 pg of TM. Add a variable volume of dimethylformamide to obtain a 10% final amount, 5 ml of pH 4.5 acetic acid/sodium acetate buffer solution and dilute with water to the mark. Record the absorption spectra between 240 and 460 nm against a solution contain- ing the same amount of buffer solution and dimeth- ylformamide. The spectral data were then analyzed as in the above procedure to calculate the concentra- tions for the three components in the mixtures.
Determination of FD, SD, TM and DX in milk In a 25-ml volumetric flask introduce 0.1 ml of
milk, 2.5 ml of dimethylformamide, 5 ml of pH 4.5 acetic acid/sodium acetate buffer solution and dilute with water to the mark. Introduce in an ultrasonic bath during 10 min and centrifuge. From the super- natant solution obtain the absorption spectra and follow the above procedure.

106 A. Espinosa-Mansilla et al./Analytica Chimica Acta 313 (1995) 103-112
3. Results and discussion
As reported previously, SD, DX, TM and FD show a strong overlap between their absorption spec- tra and univariate analysis methods cannot be ap- plied for resolving this mixture. At pH 4.5, the absorption spectra for the four compounds were ob- tained (Fig. 1). SD and TM exhibit very similar spectral characteristics (absorption maxima located at 269 and 272 nm for SD and TM, respectively) being the absorption spectrum of SD, the most sensi- tive of both compounds. DX shows a similar be- haviour with absorption maxima located at 277 and 349 nm. DX overlaps with furaltadone FD for wave- lengths > 310 nm and also with the other two mentioned compounds at wavelengths < 310 nm. The influences of the acidity and basicity of the medium in the absorption spectra, for the four com- pounds, were studied with the object to select the pH value at which the smallest overlap occurs, however, no better results were observed in all pH ranges studied and a pH of 4.5 was considered as suitable. The linearity of the maximal signals was examined to select an adequate concentration range (for each individual compound) suitable for spectrophotomet- ric measurements. Hence, 1.7 to 42.0 pg ml-’ for DX, 1.1 to 25.0 pg ml-’ for FD, 0.8 to 19.0 pg
0.30
\ ‘.
‘. --._
0.00 7,~,~~““,~“‘“‘1’,‘““““,“‘“““1’~ 240 290 340 390 440
Wavelength (nm)
Fig. 1. Absorption spectra for doxycycline, furaltadone, trimetho-
prim and sulfadiazine (4 pg ml-‘) at pH 4.5 in water-dimethyl- formamide (10 + 90).
Table 2
Training set b composition
Standard (pgml-‘)
DX F-I SD TM
1’ 36 6 0 8 2’ 12 20 1 32 3’ 20 16 2 0 4’ 16 4 4 20 5’ 0 10 4 48 6’ 8 0 6 24 7’ 36 16 6 0 8’ 12 24 8 16 9’ 24 6 8 40
10’ 16 12 8 60 11’ 40 0 10 20 12’ 2 20 12 44 13’ 32 16 0 16 14’ 20 1 12 20 15’ 6 12 12 4 16’ 20 2 16 36 17’ 32 12 16 40 18’ 0 8 16 12 19’ 4 20 20 28 20’ 12 12 28 48 21’ 44 8 20 20 22’ 8 16 24 12
ml-’ for SD and 2.8 to 65.0 pg ml-’ for TM can be used.
3.1. Experimental design of the calibration matrix
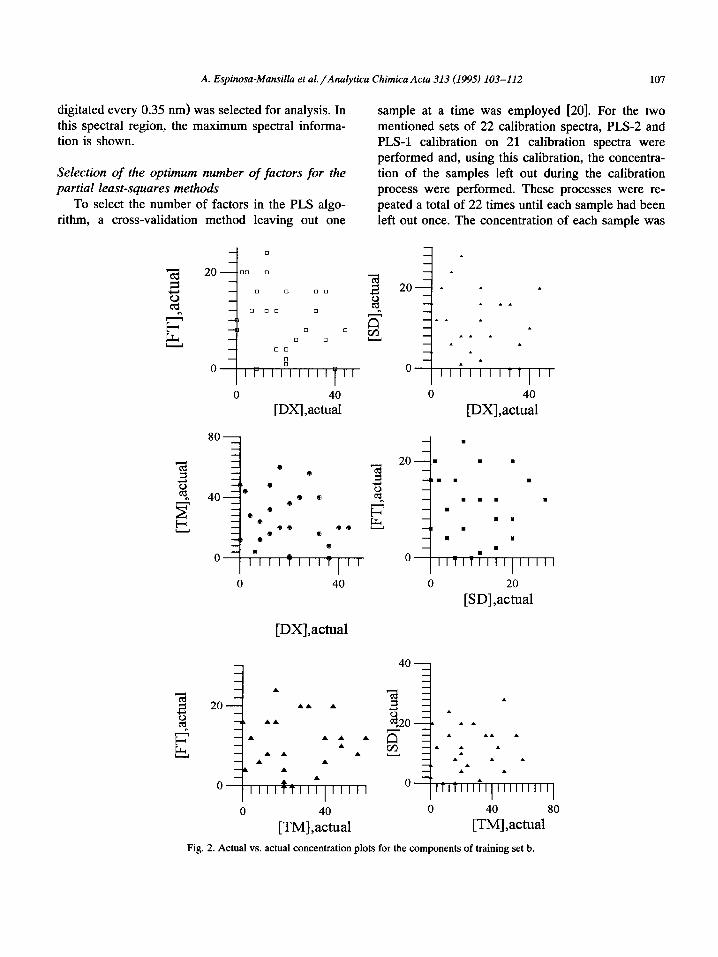
To choose the calibration samples, the con- stituents to be determined have been selected in order to span all dimensions. Two training sets of 22 samples (randomly selected) were established. In the first training set (a) only quaternary mixtures were included and in the second training set (b) also ternary mixtures were included. In both cases, the correlation between the different calibration samples was avoided because collinear components in the training set data will tend to cause underfitting in the PLS models. In Fig. 2 actual versus actual concentra- tion plots for the different calibration samples for training set b are represented A randomly distribu- tion components concentrations can be observed. Similar cloud graphs are obtained for training set a. The composition of training sets a and b are summa- rized in Tables 1 and 2. The spectral region between 242 and 456 nm, which implies working with 560 experimental points per spectrum (as the spectra are
A. Espinosa-Mansilla et al./Analytica Chimica Acta 313 (1995) 103-112 107
digitated every 0.35 mn> was selected for analysis. In this spectral region, the maximum spectral informa- tion is shown.
Selection of the optimum number of factors for the partial least-squares methods
To select the number of factors in the PLS algo- rithm, a cross-validation method leaving out one
sample at a time was employed [20]. For the two mentioned sets of 22 calibration spectra, PLS-2 and PLS-1 calibration on 21 calibration spectra were performed and, using this calibration, the concentra- tion of the samples left out during the calibration process were performed. These processes were re- peated a total of 22 times until each sample had been left out once. The concentration of each sample was
0 20
[SD],actual
[DX],actual
40
. . . . . . . .
ITITIIIII(IIIIIIIII
0 [TiiJ,actual
80
Fig. 2. Actual vs. actual concentration plots for the components of training set b.

108
Table 3
A. Espinosa-Mansilla et al. /Analytica Chimica Acta 313 (1995) 103-112
PRESS values obtained for models a and b
Training set PRESS
Conventional First-derivative
DX Fr SD TM DX FT SD TM
b (quaternary + ternary) 1.60 0.34 1.80 8.11 13.39 15.23 18.55 264.83
a (auatemarv) 2.00 0.72 2.98 41.44 100.74 11.91 55.37 555.87
then predicted and compared with the known con- centration of this reference sample, hence, the pre-
sum of squares (PRESS) was calcu-
lated. To compare the statistical results, a similar procedure was followed using two sets of 21 calibra- tion first-derivative spectra (Ah = 11 nm). The F-
0 20 40
lml,ug.~-’ 0.50
1 0
0.30 ?I ’ w E
0.20 z
& 0.10
-
0.00 g ( , , , , , , , , , , , , , , , , , , , , , , , , , ,
0 10 20 30
[SD],ug.ml-’
0.00 , , , ( , , , , , , , , , , , , , , ,
10 40 , , ( , , ( , ,
0 io l3Tl,ug.~-
0.50
0.30
0.20 ~~~~~~_~~~__~
0.10
0.00
0 60
Fig. 3. Spectral residual vs. concentrations plots for the four components. (0) model b; ( A) model a; (--_) mean spectral residual for model
b, (- - -) mean spectral residual for model a.

A. Espinosa-Mansilla et al. /Analytica Chimica Acta 313 (1995) 103-112 109
Table 4
Statistical parameters of the models optimized using the PLS-1 algorithm and conventional spectra
Model r* RMSD MSR
DX FT SD TM DX PI- SD TM DX FT SD TM
b 0.9996 0.9997 0.9984 0.9987 0.2700 0.1260 0.2866 0.6071 0.2594 0.2952 0.1917 0.1597
a 0.9994 0.9992 0.9972 0.9923 0.3014 0.1820 0.3681 0.13725 0.2126 0.3641 0.2002 0.2011
statistic was used to carry out the significance deter- mination [21].
The PRESS values obtained by optimizing the calibration matrices of the quaternary plus ternary and quatemary mixtures by using PLS-1, are summa- rized in Table 3. The results obtained with conven- tional and first-derivative spectra are included. By using training set b and conventional spectra, 5 factors for DX, 4 for Ff’, 8 for SD and 11 for TM were used as optimum (model b). By using training set a and conventional spectra, 9 factors for DX, 4 for FT, 10 for SD and 10 for TM were used as optimum (model a). The smallest PRESS values were obtained by using the training set b (quatemary plus ternary mixtures) and conventional spectra. The application of derivative spectra was not convenient because a very high number of factors and PRESS values were calculated for the four components. By application of the PLS-2 algorithm no better results were obtained.
Statistical parameters for the optimized models The root mean square difference (RMSD) is an
indication of the average error in the analysis for each component:
RMSD = [ l,iVf, (Pi - ci)’ 1
r/2
where N is the total number of calibration samples, c?~ represents the estimated concentration and ci is the reference concentration.
The square of the correlation coefficient ( r2>, which is an indication of the quality of fit of all the data to a straight line, is represented by
where Fi represents the mean of the true concentra- tions in the prediction set. On the other hand, the
residual analysis [23] permit us to determine an amount that is not explained by the model for each data point, ei = yi - ji being ji = bixi where yi is the data value and jj is the predicted value for the model; b, is a regression parameter and xi is the independent variable. In Fig. 3, the spectral residual values for all components and both models are repre- sented. No statistical differences between the mean spectral residuals values (MSR) obtained for both models are observed. By application of the model b lower values than with model a are calculated for most of the components.
The actual versus predicted concentration regres- sions have been calculated for model a and b. RMSD and r2 values have been summarized in Table 4. Also, MSR values are included.
Although, both models (a and b) exhibit very similar statistical parameters, the most notable differ- ences occur for TM determination. Model b was
Table 5
Composition sets of artificial mixtures
Sample [Actual] ( pg ml- ’ )
DX FT SD TM
Set 1 1 4 4 4 4
2 4 8 8 12
3 8 12 4 28
4 16 16 12 36
5 20 12 12 20
6 24 16 8 52
7 28 20 16 44
8 36 8 16 48
Set 2 1’ 4 4 0 4
2’ 4 0 8 12
3’ 0 12 4 28
4’ 16 0 12 36
5’ 20 12 12 0
6’ 0 16 8 52
7’ 28 20 0 44
8’ 36 8 16 0

110 A. Espinosa-Mansilla et al./Analytica Chimica Acta 313 (1995) 103-112
Table 6 Simultaneous determination of DX, SD, TM and FT in artificial mixtures
Sample DX FT SD Th4
Found a Recovery R.S.D. Found a Recovery R.S.D. Found ’ Recovery R.S.D. Found a Recovery R.S.D.
(pgml-‘1 (W) (o/o) ( pg ml- ‘1 (%) (o/o) ( pg ml- ‘1 (o/o) (%o) ( pg ml- ‘1 (%) (o/o) Set 1 1 4.50 113 4.08 3.93 98 1.87 3.61 90 2.50 5.52 138 _
2 4.17 104 2.44 7.99 100 0.26 7.93 99 0.48 12.10 101 2.85 3 8.05 101 0.45 11.98 100 0.73 3.87 97 2.54 27.17 97 2.38 4 15.96 100 1.65 16.10 101 0.48 12.06 101 1.33 34.64 96 1.92 5 20.04 100 1.46 12.08 101 1.63 12.12 101 1.24 19.83 99 3.84 6 23.94 100 0.36 16.43 103 0.96 8.50 106 2.82 50.3 97 1.94 7 28.43 102 0.89 20.35 102 0.57 16.55 104 0.76 38.96 89 4.9 8 36.20 101 0.56 8.08 101 1.50 15.93 100 2.10 46.34 97 4.78
Set 2 1’ 4.32 108 0.40 4.14 103 1.85 0.36 - 1.85 5.56 139 3.81 2’ 3.92 98 3.71 0.23 - 10.79 7.85 98 1.01 12.69 106 1.21 3’ 0.38 - 8.22 12.25 102 2.41 4.24 106 6.91 26.79 96 3.59 4’ 15.10 94 1.06 0.25 _ 9.93 12.10 101 1.20 34.83 97 2.40 5’ 19.56 98 0.47 12.45 104 1.04 12.65 105 0.59 2.54 - 18.05 6’ 0.67 - 5.38 16.38 102 0.62 8.43 105 1.26 50.73 98 2.04 7’ 27.01 96 0.26 20.33 102 0.34 1.40 _ 6.55 39.65 90 2.79 8’ 35.36 98 0.56 8.19 102 0.95 16.68 104 1.83 4.70 - 22.17
a Mean of three individual determinations.
selected as more adequate to resolve the quatemary mixture.
3.2. Applications
Artificial mixtures Two sets of eight unknown artificial samples were
predicted by applying both a and b models. In the
first (set 11, eight samples of unknown quaternary mixtures were prepared. In the second (set 2) eight samples of unknown ternary mixtures were prepared. The composition of the artificial samples is summa- rized in Table 5. The recovery values obtained using model b in the resolution of the two problem sets are summarized in Table 6. Satisfactory recovery values are obtained in most of the quatemary samples ana-
Table 7 Results obtained in the analysis of the commercial formulation Trilabian
Stock solution dilution Found ’ (u ke-‘)
1:50 1:33 1:25 1:20 1:17 1:lO 1:6 Mean
Model b HPLC
Fr R.S.D. SD R.S.D. TM R.S.D. PT R.S.D. SD R.S.D. TM R.S.D.
(%o) (%o) (%) (%I (o/o) (o/o)
99.4 2.91 101.7 1.21 19.3 20.3 98.3 1.86 102.4 1.21 15.8 22.0 97.0 0.67 101.6 0.62 15.4 15.1 96.8 0.55 101.1 1.34 16.8 16.9 95.9 0.66 99.8 1.38 11.5 11.5
91.7 3.69 101.6 3.65 16.6 8.20 100.7 2.70 108.9 1.14 18.0 3.78
97.3 101.3 15.8 96.2 105.2 17.3
Claimed levels: 90.0 g/kg for ET, 100.0 g/kg for SD and 20.0 g/kg for TM. a Mean values of seven independent replicates.

A. Espinosa-Mansilla et al. /Analytica Chimica Acta 313 (1995) 103-112 111
Table 8 Simultaneous determination of DX, TM, SD and FD in milk a
Component Added Found b Recovery R.S.D.
(pg ml-‘) (pg ml-‘) (%o)
Sample 1 DX 8.00 8.18 FT 16.00 16.00 SD 12.00 13.18 TM 12.00 10.50
Sample 2 DX 24.00 24.98 Fr 12.00 11.66 SD 12.00 14.23 TM 28.00 23.87
Sample 3 DX 12.00 11.78 F-r 8.00 8.32 SD 8.00 9.13 TM 40.00 39.14
Sample 4 DX 12.00 11.95 F-r 4.00 4.16 SD 8.00 8.70 TM 44.00 44.60
a 1250 dilution. b Mean value of five individual replicates.
102 1.96 100 0.64 110 0.83 88 4.82
104 1.57 97 2.26
119 1.20 85 2.36 98 0.67
104 0.51 114 1.76 98 1.46
100 0.38 104 1.21 109 1.45 102 1.71
lyzed. Only sample 1 exhibits a high recovery value for TM. The application of model a give rise to similar results. For ternary mixtures slightly better results are observed by application of model b.
Evaluation of the existence of drugs in the artificial mixture samples
The probability (P) associated with the null hy- pothesis [22,23] (H,,: the drug does not exist in the sample) was individually computed using four differ- ent lo-data sets (one data set for each component) and by application of model b.
Each data set consists of ternary mixtures com- posed by the three other components different of that for which the null hypothesis was computed. The ternary mixtures were randomly designed. The re- sults of computing P (true positive/Ha) were 98, 95, 80 and 99.9% for FT, SD, TM and DX, respec- tively.
Commercial formulations
Five samples (seven replicates per sample) were prepared by different dilutions of the stock solution of the commercial product (Trilabian). HPLC deter- mination was performed on a Nucleosil 5 C,, 1OOA (25 X 0.46 cm i.d.). The mobile phase was 0.01 M acetate buffer (pH 3.8)-acetonitrile (80:20), and
spectrophotometric detection was performed at 260 nm. In Table 7 the results obtained by application of model b and HPLC have been summarized. Results obtained by the proposed method are in accordance with claimed and HPLC results. A statistical compar- ison [24] between the results calculated by the mod- els has been made and significant differences have been found for SD and TM resolution but not for FT determination.
Simultaneous determination of DX TM, FT and SD in milk
Individual recovery values for each drug were calculated by means of conventional absorbance measurements in the absorption spectra obtained from samples (milk with different dilutions) previously spiked with different amounts of individual drugs and prepared according to the recommended proce- dure with the object to test the chemical procedure. Hence, mean recovery values of 98, 105, 110 and 106% for DX, FT, SD and TM, respectively, were obtained. The standard addition method was applied to analyze four milk (five replicates) samples spiked simultaneously with quatemary mixtures of the four drugs. Also, with the aim to study the influence of the background due to milk, different dilutions were assayed and later, recovery values were calculated using models b and a. Significance differences [24] were detected by application of the models. In Table 8 the results obtained by application of model b in the 1:250 diluted samples have been summarized. Also, satisfactory results for DX, m and TM were obtained for 1:50 and 1:25 diluted milk samples, but unsatisfactory results were obtained for SD.
4. Conclusions
The proposed PLS-1 model is very suitable for the simultaneous determination of DX, TM, SD and FT and can be employed to analyze commercial formulations and milk samples. To analyze the milk samples, a 1:250 dilution was necessary. The model composed by ternary and quaternary mixtures as standard samples gives rise to slightly better results. The existence of FT, SD and TM can be indicated with a high probability, but for TM only a 80% probability can be considered.

112 A. Espinosa-Mansilla et al. /Analytica Chimica Acta 313 (1995) 103-112
Acknowledgements
This work was supported by the DGICYT of the Ministry of Education and Science of Espaiia (Pro- ject PB91-0856).
References
[l] D. Damaso, M. Moreno-Lopez and R.M. Daza, Antibi6ticos
y Quimioterapicos Antibacterianos, Uso Clinico, Grutesa,
Madrid, 1984.
[2] R. Himei, K. Koide, J. Tsuji, S. Yamamoto, M. Hone, S.
Suzuki and H. Nakazama, Slokuhin Eiseigaku Zasshi, 34
(1983) 392.
[3] J.D. Weber and M.D. Smedley, J. AOAC Int., 76 (1993) 725.
[4] V. Hormazabal, J. Steffenak and M. Yndested, J. Chro-
matogr., 648 (1993) 183. [S] C. Kohl, M. Velschlaeger and D. Rothley, J. Pharm. Biomed.
Anal., 12 (1994) 249.
[6] M. Dagom and J.M. Delmas, Anal. Chim. Acta, 285 (1994)
353.
[7] F. Salinas, J.J. Berzas Nevado and A. Espinosa, Analyst, 114
(1989) 1141.
[8] J.J. Berzas Nevado, F. Salinas, I. de Orbe Paya and L.F.
Capit&Vallvey, J. Pharm. Biomed. Anal., 9 (1991) 117.
[9] J.J. Berzas Nevado, F. Salinas, I. de Orbe Paya and L.F.
Capit&Vallvey, Anal. Quim., 90 (1994) 103.
[lo] F. Salinas, A. Espinosa-Mansilla and J.J. Berzas Nevado,
Microchem. J., 43 (1991) 244.
[ll] F. Salinas, A. Muhoz de la Peha and I. Duran-Merk, Anal.
Lett., 23 (1990) 863.
[12] M. Sanchez Peha, F. Salinas, M.C. Mahedero and J.J. Aaron,
J. Pharm. Biomed. Anal., 10 (1992) 805. [13] H. Weld, in F. David (Ed.), Research Papers in Statistics,
Wiley, New York, 1966, p. 441.
[14] S. Weld, H. Martens and H. Wold, in A. Ruhe and B.
Kagstrom (Eds.), Matrix Pencils (Lecture Notes in Mathe-
matics), Springer, Heidelberg, 1983, p. 286.
[1.5] S. Wold, in H. Martens and H. Runswurm (Eds.), Food
Research and Data Analysis, Applied Science Publishers,
London, 1983.
[16] G. Zhon, J. Zhang, Z. Gu and L. Li, Huaxi Yaoxue Zerahi, 8
(1993) 95.
1171 M. Sanchez Pefra, A. Mufroz de la Peiia, F. Salinas, M.C.
Mahedero and J.J. Aaron, Analyst, 119 (1994) 1177.
1181 A. Guiberteau, T. Galeano, A. Espinosa-Mansilla, P.L. tipez-de-Alba and F. Salinas, Anal. Chim. Acta, 302 (1995) 9.
[19] A. Guiberteau, T. Galeano, A. Espinosa-Mansilla and F.
Salinas, Talanta, 41 (1994) 1821.
[20] M. Stone, J.R. Stat. Sot., B 36 (1974) 111.
[21] D.M. Haaland and E.V. Thomas, Anal. Chem., 60 (1988) 1193.
1221 D.L. Massart, B.G.M. Vandeginste, S.N. Deming, Y. Mi-
chotte and L. Kaufman, Chemometrics: A Textbook, Else- vier, Amsterdam, 1988.
[23] R.C. Graham, Data Analysis for the Chemical Sciences, A
Guide to Statistical Techniques, VCH, Weinheim, 1993.
[24] M. Valclrcel and A. Rios, La Calidad en 10s Laboratorios
Cualitativos, Revert&, Madrid, 1992.