Regulation of SIRT1 in cellular functions: Role of polyphenols

Proceedings of the International Conference on Environmental Aspects of Bangladesh (ICEAB 2011)
1
KEYNOTE SPEECH
Impact of Climate Change on Fisheries and Aquaculture: A Story of Struggle for Existence
Md. Abdul Wahab
Faculty of Fisheries, Bangladesh Agricultural University Mymensingh, Bangladesh
e-mail: [email protected]
Bangladesh has appeared as one of the most vulnerable countries in South Asia to the potential impacts of climate change. The vast majority of the people are dependent on the extensive coastal floodplains in the lower Ganges-Brahmaputra delta that are important for natural fisheries, shrimp farming, agriculture, and other natural resources including the Sundarbans mangrove forests. The inhabitants of the coastal regions are already prone to floods, cyclones, salinity intrusion, and seasonal droughts. These natural calamities have been stressful the poor people as fish catches are declining, rice farming are reducing, aqua-farms have been inundating and fish and shrimp diseases are spreading. It is expected that the climate change will exacerbate many current problems and
natural hazards due to severe tropical cyclones leading to more damage, heavier and more erratic rainfall, resulting in higher river flows, river bank erosion, and sedimentation, and sea level rises.
The impacts of two recent cyclones (Sidr and Aila) on the inland and coastal fisheries, coastal aquaculture, and the livelihood of the fishing communities, and those people who were directly and indirectly involved with shrimp farming, crab fattening, fish drying and other fisheries related activities have been evaluated. Efforts have been made to understand the adaptation measures they have taken and future coping strategies they have formulated.
The greater Khulna districts and Barguna-Patuakhali in the Southwest region were the worst suffers for both Sidr and Aila cyclones. Among the Upazillas in greater Khulna, Shyamnagor of Satkhira, and Koira and Paikgacha of Khulna were the worst victims. The trees, infrastructures, livestocks and fish and shrimp farms were severely affected, besides the loss of human lives. About 75% of the shrimp farms and 100% of the crab farms of the Munshiganj Union of Shyamnagor, Satkhira were destroyed in both cyclones. About 40% of the shrimp farms in Paikgacha and 80% in the Koira Upazila were washed away by both Sidr and Aila in two occasions. Since these two cyclones come in subsequent years, these caused a severe damage to the inland capture fisheries and incurred a great loss to the shrimp farmers.
Inland wetlands and coastal fisheries as well as shrimp and crab farming were affected due to salinity intrusion in the freshwater wetlands, losses of the crafts, gears and shelters of the coastal fishermen, and the flooding and washing away of the standing crop from the aqua - production systems. Besides shrimp farming, villagers along the rivers connected with the Sunderbans are expanding their crab fattening programmes. Both male and female are working hard and mostly depending on the resources of Sundarbans for energy as well as fishing for food fish as well as catching shrimp post larvae. The traditional fishermen of the inland wetlands have changed their profession either as day labourer or joined with the fry collectors or going to the inshore fishing.
The cyclone Sidr had partly damaged the soils but after Aila, lands are now only used for shrimp culture because of the extreme salinity. Due to the shrimp culture, the poor people are the more sufferers. Their opportunity to work in the field as a laborer has been reduced. Aila has also destroyed most tube-wells, and lack of drinking water is a major problem in the Southwest region. The people are more or less dependent on the rain water and they reserve water during the rainy season. There has been spread of various enteric diseases because people sometimes need to depend on salt water for drinking. There has been a great shortage of vegetable and fish in the local markets. Some people are trying to stock tilapia in their abandoned ponds with saline waters. In some coastal households,
women have been seen to use (portable) sack-bag for vegetable culture as the adaptation measures against the shortage of vegetable.
Fisheries management must move from seeking to maximize yield to increasing adaptive capacity. Community-based fisheries management through formation of community based organizations (CBOs) and cooperatives should be promoted to the wetland areas for conservation and sustainable exploitation of resources. An integrated approach of crops and aquatic resources development and their diversification may help improving the present livelihood options and nutrition of the coastal people. Improved salt tolerant strains of fish and crops, technologies suitable for drought conditions, surface water reserve, and conservation of major wetlands should be part of the adaptation measures.

Proceedings of the International Conference on Environmental Aspects of Bangladesh (ICEAB 2011)
2
INVITED SPEECH
Biodiversity Management in Estuaries
Satoquo Seino
Department of Urban and Environmental Engineering Graduate School of Engineering, Kyushu University, Japan
e-mail: [email protected]
(1) Spatial management of the habitat
As brackish environments, estuaries are places where biological diversity needs to be protected. Spatial management of estuaries is especially important, because protecting the topography is
indispensable to protecting the habitat. However, estuaries and other coastal areas exist in a state of dynamic equilibrium, and so management plans must be based on a particularly close observation of factors such as sand/soil, water, waves and currents. (2) Case study: protecting horseshoe crab habitat
In Japan, the horseshoe crab is a creature particular to the estuaries of Western Japan and Kyushu.
Although as a ―living fossil‖ it is considered biologically important, it is endangered in Japan. Its life cycle is played out in estuaries and shallow marine areas: adults lay their eggs on sandy beaches and sand bars in estuaries, while the hatchlings inhabit muddy tidal flats, migrating to offshore sea beds when they mature. Thus, to protect this species, these types of environments must be protected contiguously in space. If we think of this species as a biodiversity indicator, its presence signifies integrated protection of the coastal environment and, in terms of interaction with human society, a sustainable coastal fishery. (3) Japan’s biological diversity and coastal environmental policy
The 10th Conference of the Parties to the Convention on Biological Diversity (CBD/COP10) was held in Japan in 2010.
Parallel to this event, a national marine biodiversity protection strategy was also set up. This strategy deals not only with pelagic and deep-sea marine areas, but also places emphasis on the protection and restoration of coastal and brackish zones. It will be important to implement this policy not only in contiguous coastal and offshore areas, but also to comprehensively link it with river and land use policy, and moreover to do so on an on-site, local basis. (4) Drift trash – a threat to biodiversity
Trash that drifts on currents and lands on beaches is a serious issue facing estuary habitats. Trash that flows in from upstream or is discarded along coasts or on the high seas and piles up on shore not only physically smothers the habitat, but is also mistakenly ingested by coast-dwelling creatures. Chemical pollution from drift trash is also a threat, and drift trash now constitutes a new environmental pollution issue. (5) Putting Japan’s experience and lessons learned to use in the Asia-Pacific region and the world
The case study of the horseshoe crab in Japan can by itself serve as a potent warning to the world instructive of Japan‘s experiences and lessons to be learned. Horseshoe crabs are widely distributed throughout Asia, but degradation of the environment has led it to become threatened with extinction and it is now being considered for inclusion on the international Red List. Estuaries themselves are in a similar predicament. We must not go on making these same mistakes. We must take into sufficient consideration the knowledge we have about the reasons for already-present degradation and the limits of possible countermeasures.

Proceedings of the International Conference on Environmental Aspects of Bangladesh (ICEAB 2011)
3
INVITED SPEECH
Geo-environmental Approach to Restoration of
Agricultural Land Damaged by Sea Water in Tohoku Region Pacific Coast Earthquake
Kiyoshi Omine
Department of Civil Engineering, Kyushu University, Japan
e-mail: [email protected]
A disaster is the tragedy of a natural or human-made hazard (a hazard is a situation which poses a level of threat to life, health, property, or environment) that negatively affects society or environment. A natural disaster is a consequence when a natural hazard (e.g., volcanic eruption or earthquake) affects humans. Tsunamis and earthquakes are two of the most dangerous and yet most common hazards to affect population centers and economic infrastructures worldwide. Generally, tsunami flooding results from a train of long-period waves that can rapidly travel long distances from where they were generated by deep-ocean earthquakes, submarine landslides, volcanic eruptions, or asteroid impacts. Due to tsunami the sea water carry sediments along with salt itself. There have been many studies on recent and ancient tsunami deposits. These include descriptions of tsunami deposits in coastal lake, estuary, lagoon, bay floor and shelf environments and even the farmland. The mega earthquake and consequent tsunami had caused a great damage to not only human life and infrastructure but also the agricultural land and the crops in Tohoku region, Japan. The after math of the tsunami has created many problems to environment and geo-environment of these affected areas. Soil pollution and high salinity which caused the farmland unusable for cultivation is one of the major geo-environmental problems.
In this study a geo-environmental approach has been carried out for the restoration of the farmed land which was damaged by the saline water due to tsunami water in the pacific coast of Tohoku region in Japan. The mega earth quake hit the 11th March, 2011 has triggered a Tsunami in the coastal areas of Tohoku region. This huge sea water had tremendously affected the various environmental and geo-environmental parameters in that area. The salinity in the agricultural land has become a great concern for the after disaster geo-environmental restoration. Various approaches are trying to get rid of the salinity problem of the agricultural land. In this study, major chemical properties (pH, Electrical conductivity) of soil in Rikuzentakata city (one of the most affected areas due to tsunami) have been carried out in the field test during May and June, 2011. An innovative approach has been taken to restore the saline soil by using compost containing Halo bacteria in this area.
The sea water which covered the agricultural lands in these areas has created a critical situation for the farmers. The farmers have lost not only the crops they were cultivating but also the soil of the agricultural field had been seriously damaged by the sea water, salinity and other pollutants. The pH value and EC value of the soil in these areas are considered as the higher value in terms of safer limit for the regular crops. To reclaim this saline soil, compost containing the Halo bacteria will be applied. The Halo bacteria can use the excessive salts from the soil and consequently can reduce the salinity problem. This compost can also provide necessary nutrients to the soil and plant.

Proceedings of the International Conference on Environmental Aspects of Bangladesh (ICEAB 2011)
4
INVITED SPEECH
Thermal Plasma Processing for Environmental
Issues
Takayuki Watanabe
Department of Environmental Chemistry & Engineering Tokyo Institute of Technology, Yokohama 226-8502, Japan
e-mail: [email protected]
Waste treatment process using thermal plasmas has attracted the most attention because
thermal plasmas can offer distinct advantages, such as a high enthalpy, which increases reaction rate, oxidation or reduction atmospheres in accordance with required chemical reactions, and rapid quenching, which produces non-equilibrium chemical compositions.
A DC water plasma torch was developed for waste treatment processes. The hafnium embedded into a copper rod used as cathode material can overcome the erosion problems and achieve a long operating time in oxidation atmosphere. The torch can generate stable 100%-water plasmas using DC discharge at the arc power of 1 kW without additional steam generator or gas supply system. Using the water plasma produced by the plasma torch, we succeed in decomposing liquid waste of phenol, acetone, and alcohol solutions. The water plasma system was also applied for gaseous waste decomposition such as HFC and PFC.
A stable 12-phase AC arc was developed to apply to in-flight glass melting for the purpose of energy saving and emission reduction. The multi-phase AC arc was generated by transformers at a commercial electric power system. The discharge behavior and the high-temperature region can be controlled by the electrode configuration. The high decomposition and vitrification degrees achieved in milliseconds shorten the melting and fining time of glass considerably. It indicates that the new in-flight melting technology would be a promising method in glass industry.
INVITED SPEECH
Damage from the Great East Japan Earthquake
and Tsunami - A Quick Report
Kazuya Yasuhara
Institute for Global Change Adaption Science (ICAS) Ibaraki University, Mito, Japan
e-mail: [email protected]
The Tohoku region, Northeast Japan, was hit by a gigantic earthquake which occurred in the
Pacific close to Tohoku, and subsequently by a giant tsunami. These hazards have caused huge damage on the eastern coast Japan. The earthquake‘s magnitude was 9.0, the strongest ever recorded in Japan. The tsunami was also historical as its run-up height reached over 39 m. As of early May, 2011, over 24 thousand people were reported as dead or missing. Moreover, serious accidents at the Fukushima Nuclear Power Plants No.1 were caused by the effects of the tsunami. Therefore, the damage faced by Japanese people can be seen as a giant composite disaster. Although Japan, and the northeast of Japan in particular, has over a long time period increased its preparedness against earthquakes and tsunamis, huge damage still occurred. This paper considers why this tragedy occurred, and what unrecognized factors contributed to the high vulnerability of the area. To assist in answering such questions, this paper presents a timely report of the features of the earthquake and tsunami, the damage they caused, and the early efforts for recovery and reconstruction.

Proceedings of the International Conference on Environmental Aspects of Bangladesh (ICEAB 2011)
5
INVITED SPEECH
Climate Change: Effects on and Tasks for Bangladesh
Nazrul Islam
Global Coordinator Bangladesh Environment Network (BEN)
e-mail: [email protected]
Climate challenge has emerged as the most important long term challenge for Bangladesh. Bangladesh has to face this challenge in addition to the development challenge that it already faces. The most effective way to do so is therefore to find win-win solutions that can address climate and development challenges simultaneously. On the external side, Bangladesh of course has to demand necessary technical and financial assistance from developed countries which are mainly responsible for causing climate change. However, more important is the internal task of examining closely various concrete climate and development problems and identifying the solutions that can address problems along both dimensions. Without a clear identification of the solutions, the external assistance will not be of much help. On the other hand, proper identification of the solutions may help to mobilize domestic resources better.
INVITED SPEECH
Dynamics of Innovation in Solar Cell Industry: Divergence of Solar Cell Technologies
Yukihiko Nakata
Ritsumeikan Asia Pacific University 1-1, Jumonjibaru, Beppu, Oita 874-8577, Japan
e-mail: [email protected]
The dynamics of innovation in solar cell industry was researched based on the case studies of global solar cell industries. What is the dynamics of innovations in the solar cell industries?
Japanese 1st group including Sharp, Kyocera, Sanyo and Mitsubishi is mainly doing the business by crystal silicon (c-Si) and amorphous Si (a-Si) solar cell. The industrial cluster of ―Solar Island Kyusyu‖ is focusing on thin film solar cells.
In USA, SunPower focuses on c-Si solar cell, First Solar of 1st place is producing CdTe solar cell and Nanosolar, Solyndra are developing CIGS.
China including Suntech mainly produced c-Si solar cell. Q-cells in Germany expand from cell process to solar cell module and CIGS solar cell.
As the results of the case studies, the diverse technologies of solar cell are taken for business by global solar cell industry. Therefore, in case of the solar cell industry, the innovation dynamics theory of Utterback can not apply to the innovation. What are the conditions to accept the diverse technologies such as the solar cell industries?
To answer the question, the process day of the solar cell compared with LCD and semiconductor device. The main process days for poly-Si and a-Si solar cell are less than 1 day. This means that solar cell technologies are simple because they require shot process days to reduce the cost.
The conditions of diverse technologies in business are extracted from the research results. First condition is simple technology, which means short process day. Second condition is the drastically increasing market. Third condition is high motivation to enter the industry.
Under the above conditions, many companies want to enter the business even if their technology level. In other words, many companies enter the business using their adaptable technologies. As the results, the diverse technologies are accepted for business.

Proceedings of the International Conference on Environmental Aspects of Bangladesh (ICEAB 2011)
6
INVITED SPEECH
Preservation of Bamboo Forests in Kitakyushu,
Japan, NPO Kitakyushu Biotope Network Group
Bart Dewancker
Faculty of Environmental Engineering The University of Kitakyushu, Japan
e-mail: [email protected]
Recently in Japan, because bamboo forests are not well maintained any longer, and because bamboo trees are very fast growing, which result in the spread of the bamboo forest, there are devastating problems for the adjacent forests; the bamboo forests itself and the surrounding rice fields, etc.
Bamboo forest thinning is probably one of the solutions to prevent damage by spread of bamboo forests to other tree varieties and the surrounding fields. Furthermore since there is no any longer a large demand for bamboo material, as well as the high loan costs in Japan, bamboo forest thinning is quiet difficult to do.
For that, the Kitakyushu Biotope Network Group (a local Non Profit Organization) came up with the idea of thinning the bamboo trees by citizens on a voluntary base. Since November 2001, several environmental preservation activities were organized with the goal of thinning out these bamboo forests. The main purpose of these bamboo activities was to make the citizens and the local government aware of the severe problems and try to find new ways for the use of the bamboo material. Since January 2004, on every second Saturday of the month, a small group of about 35 to 40 local citizens has started to preserve the bamboo forests in the area around the Kitakyushu Science and Research Park.
It is said that the city of Kitakyushu which is located in the western part of Japan has the largest bamboo forest area of Japan, with an area which is estimated to be about 1500ha. During the ten years of activity, more than 3000 citizens have participated, and several hectares of bamboo forest are thinned out. Unfortunately, because there is no local demand for the bamboo material, nearly all the bamboo material was chipped and these chipped bamboo material has been used for making of soil products. Besides of soil making, the use of bamboo material for other purposes has been investigated as well.

Proceedings of the International Conference on Environmental Aspects of Bangladesh (ICEAB 2011)
7
INVITED SPEECH
Informatization Agriculture and its Prospect for the Future
Takashi Okayasu
Department of Agro-environmental Sciences, Faculty of Agriculture Kyushu University, Fukuoka, Japan
e-mail: [email protected]
Agriculture is a highly-complex system depending on climate, weather, soil conditions, crop types, etc. Therefore, farmers have developed their own cultivation techniques and senses from the long term experiences so as to suit their environment. If the information of field environment, growth and quality status of crops, and farm work histories are able to be collected adequately on the real time, these would be utilized not only for the evaluation of the growth of crops and the occurrence of pests and diseases but also for the optimization of the agricultural production and management systems. Moreover they would be necessary to establish the security and safety of the agricultural produce. Consequently, we are developing the informatization agricultural supporting system called ―Agri-eye‖ using Information Communication Technologies (ICT) to improve the agricultural production system in Japan. The prototype systems were installed to the test fields in Fukuoka, Oita, Nagasaki and Shiga prefecture. The validity of the system was verified by the feasibility studied during the actual cultivations for paddy rice, strawberry, tomato and cucumber. The part of information collected could be used to improve several farm processes. The detail of the developed system, result of feasibility studies, and prospect for the future will be introduced in the conference.
Informatization Agricultural Supporting System (Agri-eye)

Proceedings of the International Conference on Environmental Aspects of Bangladesh (ICEAB 2011)
8
A1.001
Fate and Transport of Metals and Toxicants in Estuaries: Naturally Occurring Arsenic in Bengal Delta
Albelee A Haque
Bangladesh Environment Network (BEN)
Harvard Extension School, Faculty of Arts and Sciences, Cambridge, MA 02138, USA e-mail: [email protected]
Abstract
Natural flooding and hydraulic flushing can reduce the impact of pollution; however, cleaner watersheds will enhance
water quality in the face of escalating climatic and anthropogenic stresses. Synergistic effects may cause a combination
of contaminants to be potentially more toxic and influence either the threshold tolerance or the probable effect levels.
Also, the bioavailability of metals is not satisfactorily understood and may be influenced by chemical, physical and
thermal parameters. Arsenic in sediments is commonly bound to iron (Fe III) oxyhydroxide particles. Anthropogenic
interferences with river flow, human and animal waste inputs and increased temperatures may lead to suboxia in
streams and estuaries causing arsenic release. Iron cannot hold metals under anoxia. Site specific monitoring and
index of biologic integrity can provide accurate water quality assessments.
INTRODUCTION
The forces in nature and climatic conditions can
greatly influence the migration of metals and
chemicals in estuaries. Recent research shows that
monsoon flooding can eliminate as much as
two-thirds of the arsenic (As) from soil. Bangladeshi
and Swiss researchers collaborated to determine As
levels in rice plants in Munshiganj area usually
subject to heavy flooding in June - October. Their
research revealed that flooding removed 13-62% As
transporting the metal and then flushing out into
the Bay of Bengal [2]. Iron is a natural binder of
arsenic and other chemicals; consumption of
As-contaminated water in rural Bangladesh has
been reported by some researchers [3]. Elevated
levels of As above the World Health Organization
(WHO) standard of 0.010 mg/L is not a human
health concern, if a contaminated public or private
well or water from a pond with arsenic in the
sediment is not being used as a source of drinking
water. Women in Bangladesh reportedly collect water
from As-tainted wells for domestic use. Studies
demonstrated that ―willingness to pay‖ for arsenic-
safe water varies with income levels and education;
user data from Delhi and an urban area in Brazil
revealed that education of the household head is
statistically significant in decision-making to purify
drinking water before consumption [16, 17, 20].
The As contamination of shallow tube wells in
Bangladesh caused WHO to declare a public health
emergency [14]. Fine sand filters (and iron) can
remove both arsenic and large pathogenic microbes
at low cost as was documented in Nepal after
implementation of a locally managed, demand-
driven and self-reliant water project involving
multiple stakeholders with strong partnership,
entrepreneurs and users [1]. However, the long term
solution for Bangladesh will rely on cleanup of
surface water and comprehensive water pollution
control programs (to eliminate industrial toxic
waste and sewage into the rivers/estuaries)
launched by the government at national and local
scales with the adaptation of a watershed-based
approach.
METAL CYCLING AND METHYLATION
Synergistic effects can affect the aPELs and bTELs increasing the toxicity of a combination of contaminants (e.g., various metals) or inorganic elements (Table 1), most likely. aPELs are the metal concentrations above which organisms exhibit adverse biological effects such as decreased numbers of species, diseased fish or mortality of sensitive species. Consumption of mercury (Hg) contaminated fish and shellfish caused Minamata disease in Japan. Public outcry after the reporting of ~ 24,500 kg of mercury compounds dumped in the open sea (1932-1968), which elevated fish methylmercury level (up to 40 mg/L) in Minamata Bay compelled the Japanese government to take
drastic measures to control industrial pollution [4]. Agricultural utilization of sewage sludge (common in the western countries) is a viable alternative to ocean dumping except that metals (e.g., cadmium, mercury) in sludge are of concern because of likely pathways into food chains. As such, pretreatment of industrial wastewater is necessary to avoid toxic discharge into public sewer systems. In the case of cadmium hydroxide, some complexes are absent at low pH, but with an increase in pH a variety of complexes become dominant. The presence of chloride can further elevate concentrations, as the solubility of cadmium can significantly increase in seawater [23].
Table 1. Probable Effect Levels (aPELs)
Inorganic
elements/
contaminants
Probable effect levels in
freshwater and saltwater
Freshwater
PELs (mg/l)
Saltwater PELs
(mg/l)
Arsenic 17 41.6
Cadmium 3.53 4.21
Copper 197 108
Mercury 0.49 0.7 Source: USGS Water-Res Investigation Report 00-4180, 2000 aPELs are higher than the bTELs (Threshold effect levels)
Bioavailability of metals in ecosystems is not fully understood. Heavy metals bioaccumulate and they can biomagnify up the food chain [5]. It is believed that adsorption and co-precipitation with sedimentary sulfide minerals may reduce bioavailability.

Proceedings of the International Conference on Environmental Aspects of Bangladesh (ICEAB 2011)
9
Because sulfides of Hg (and copper) are not readily soluble in water, bioavailability cannot be accurately measured by ratios of acid volatile sulfide to simultaneously extracted metals [6]. It is quite well known that methylated species of both Hg and As are extremely toxic. Typically, marine fish contain < 0.5 ppm MeHg (methyl mercury), with some high predator fish having levels > 1 ppm [4]. Certain Canadian rivers polluted with MeHg have fish mercury concentrations exceeding 10 ppm. Biological methylation of arsenic was discovered prior to the reported mercury methylation. Trimethylarsine can be formed by some fungi and bacteria grown in a media containing inorganic elemental arsenic [7]. Further research can be helpful in this area.
BANGLADESH ARSENIC TRANSPORT STUDY
Yan Zheng and coworkers sampled sediments along the Meghna River that merges with the Ganges and the Brahmaputra forming the vast delta in India and Bangladesh [8]. Samples taken (surface and subsurface samples taken at 9 sites) to a depth of ~ 5 cm showed relatively low As concentrations, but those from depths of ~ 1-3 m had concentrations that were two orders of magnitude higher [8]. This reveals the depth- dependence of sediment toxicity. Subsurface sediments had higher mean concentrations of As of 4000 mg/kg (n = 14) with a range from 1- 23,000 mg/kg. X-ray absorption near-edge structure spectroscopy indicated that As was mostly arsenate and arsenite, and not As bearing sulfides. They hypothesized that a significant portion of dissolved As sorbs to iron bearing minerals that work like a natural curtain and inferred that fluxes from groundwater discharges may be much less than past estimates.
Climatic factors such as wind, storm, bio-perturbation and increased temperatures may dislodge buried particles bearing As and Hg, and also cause anoxia when bacterial microorganisms undergo rapid anaerobic degradation. Iron (Fe III) oxyhydroxide is a common natural binder, but iron
does not hold metals or chemicals under anoxia [9]. Sediment flux can vary even within specific water bodies depending on the time of year, redox potential and environmental condition. High flushing rate or monsoon event (as in the Bengal delta) can transport toxic metals from freshwaters to near shore saline coastal environment. Bangladesh is one of those few countries, that are most vulnerable due to climate change, with a sensitive coastal ecosystem and the situation can be worsened by possible hydropower dam projects on international rivers - like the Yarlung Zangbo (Brahmaputra after entering India) by neighbor nations [15].
Coastal marine environments (e.g., bays, fjords, estuaries) are susceptible to tidal flushing and currents with high velocities and changing direction of ebb/flood tides. Movement of currents depends on temperature/salinity changes, which in turn can change the density of water [10]. Benthic organisms rely on sediments; the nature of substrate (native or imported minerals) is critical to the economy of
biological communities (fish and other micro or macro organisms). There are not enough studies to document plant uptake of metals in aquatic environment and estuarine sediments. However, arsenic translocation via plant root systems is a known phenomenon, which can enter human diet through rice plant uptake. It is believed that arsenic in the Bengal delta region and shallow drinking water wells contaminated with arsenic caused massive poisoning ever known in the history of world. Further investigations of biological methylation and demethylation, in marine sediments, as well as plant uptake of metals are needed to satisfactorily understand ecosystem and human health impact.
ENVIRONMENTAL CHANGES AND ADAPTATION –
TOXICANTS
Toxic metal wastes can have acute adverse impact on estuarine biota. Sustained human and animal waste inputs (e.g., organic enrichment, chemical fertilizers, manure) and sewage derived nitrate may lead to anoxic condition in lakes, streams and estuaries impacting desirable fish species of social and recreational value [10] and favoring pollution tolerant aquatic species. On the other hand, toxic metal wastes have a tendency to cause total defaunation affecting all species except probably a few types of bacteria. A Sanfrancisco Bay indepth study of benthic fauna composition at 460 Stations by Filice (1959) in the upper estuary (Southern Bay) revealed that in areas receiving highly concentrated domestic (organic) wastes, low numbers of very few species survived -- while in the adjacent areas the polychaete worm Polydora uncata became numerous [11]. Toxic industrial wastes eliminated all but 3 species with only 12 species found in the surrounding areas due to greater dilution of waste inputs. Here it is relevant to note, atmospheric deposition and contamination of water resources (lakes, rivers, estuaries) by nonpoint source industrial emissions (e.g., from coal power plants) like the hazardous air pollutants containing metals, can cause much higher loading without local generation due to dispersion. Adaptive implementation goals aspire to achieve fish mercury
target ranging from 0.1 ppm (parts per million) to 0.3 ppm for Connecticut, Maine, Massachusetts, New Hampshire, New York, Rhode Island and Vermont lakes in the northeast region of the US to ensure designated beneficial uses of New England waters [18]. This remediation goal (to address out-of-region mercury transported from upwind Midwest states of US and Mexico) was supported by the analyses using EPA Mercury Maps Model, which is based on steady state formulations of the Mercury Cycling Model (MCM) and IEM-2M Model [22]. The model assumes decrease in Hg emissions will result in a proportional decrease in Hg deposition, consequently reducing concentrations in fish tissue. The dynamic ecosystem model predicts a linear response between changes in deposition, ambient levels in water and sediments, and fish tissue Hg concentrations.
Human imprint on atmospheric and natural systems has caused ecological stress. Living

Proceedings of the International Conference on Environmental Aspects of Bangladesh (ICEAB 2011)
10
organisms in aquatic environment have always encountered toxicants released from natural rock/ soil or decomposed organic substance and excretion of flora/fauna. However, our reliance on toxicants since the industrial revolution (e.g., pesticides in agriculture/forestry) has negatively impacted aquatic biota (affecting non target organisms). Western (US) agriculture shifted from being a net producer to a net energy user in the past half-century with 3-fold as much energy used to roughly more than double the corn production per acre. This is attributable to the advent of pesticides/machines and inorganic fertilizer, all of which are energy intensive [12]. Agricultural application of treated sewage sludge has national implications for the US and may have ripple effects in the reversal of defaunation (caused by synthetic fertilizers) in the gulf zone. Bangladesh and other developed or developing countries may also benefit from switching to organic fertilizers and reducing energy demanding pesticide usage. The Bengal delta, threatened with sea level rise (that can further complicate drinking water contamination issues) due to atmospheric warming, may particularly benefit from such eco-friendly activities like optimizing machineries and pesticide usage in the agricultural sector globally. Comparison of trend of mean world temperature changes with the temperature rise in the Bangladesh delta region shows, on average, an overall warming of ~ 0.5oC [19]. Investigation by Fendorf, et al. (2008) revealed that fate and transport of arsenic is strongly influenced by anthropogenic factors [21]. Changes in agricultural practices (including irrigation methods), dredging and upstream dam installations can also alter the hydraulic regime and/or source of arsenic (groundwater vs. surface water). When
there is arsenic (natural or anthropogenic) or other metal deposited in the bottom, dredging is usually not considered a feasible option for pond rehabilitation projects in the United States (US) to avoid physical resuspension of sediments. EPA is working toward reduction of risks posed by sediment contamination due to present/historic municipal and industrial waste discharges to US lakes/rivers and reservoirs.
A. Index of Biologic Integrity (IBI)
Numeric index of biologic integrity can provide accurate water quality assessment. Based on extensive experience with the State Board of Health, Florida biologist Beck developed a simplistic numeric biotic index in the 1950s as in Equation 1 –
IBI = 2 (n Class I) + (n Class II) (1)
where, IBI is the index of biological integrity and n represents the number of macro- invertebrates either in Class I (non-tolerant of measurable organic pollution) or in Class II (tolerant of moderate organic pollution but not near anoxic condition). A body of heavily polluted water will have biotic index of zero. Generally, streams receiving no waste have IBI > 10 and 1 – 6, if receiving moderate organic wastes [10][13]. The enthusiastic reader is referred to the Biological Indices chapter of Warren (1971) for indepth
discussion [10]. Put simply, change in diversity index (d) can be computed as in equation 2 below
d = - summation (ni/n) log2 (ni/n) (2)
where N is the total number of individuals and Ni is the number of individuals in i‘th species and the population ration (Ni/N) is estimated from sample values (ni/n). Computation of diversity indices [13] based on information theory for a locale above and below waste discharges (e.g., domestic, oil refinery, storm sewer) into fresh and marine waters
demonstrated community decline below discharges but gradual return with time, distance and flow. Researchers now-a-days also use body condition indices such as relative weight (Wr) index to track ecological impact on health and growth of fish species. Based on current literature review, index of sustainable functionality (ISF) of lakes/rivers and reservoirs can be noticeably impacted by ecosystem imbalance such as higher air temperatures, lowering of water level and climate instability [24]-[26].
SUMMARY AND RECOMMENDATIONS
The fate and transport of metals are determined by climatic factors (e.g., temperature, wind) and may be influenced by metabolic activities of the aquatic/ marine flora and fauna, type of contaminants or chemical (species) input from the watershed activities as well as the ecological relationships amongst the micro and macro organisms inhabiting the coastal environment. Mathematical computation of IBI may guide coastal water quality assessments more accurately. Temperature changes at the sediment-water interface, redox potential (reducing condition will release arsenic), hydroxo complex formation and pH are important factors in metal transport mechanism. Site specific studies and baseline monitoring could help in long term planning and watershed management activities. By comparison and contrast, the effects of toxic waste may be far more detrimental than domestic waste inputs. We ought to endeavor to protect ecosystem by limiting toxic usage and/or adopting a ―zero industrial waste policy‖. Replicating nature‘s work (e.g., redesign to improve hydraulic flushing by lowering dam height as feasible) and natural flooding/river flow could potentially reduce the adverse effects of pollution.
Effective management response (e.g., wastewater treatment, industrial retrofits) to anthropogenic and climatic stresses may very well include broad education/outreach (not just sector-driven
research) programs and foster private-public entrepreneurships. Effluent treatment plants to address surface water/river pollution (including organic enrichment) can serve double purpose – 1) reduce the impact of sediment - arsenic release due to anoxia and 2) solve communal health problems associated with As- contaminated ground water use in Bangladesh [3]. The author recommends creative partnerships and integrated efforts by local, metropolitan, industrial, national, international agencies and an adaptive style to address multiple pollution threats (including naturally occurring arsenic in the Bengal delta) to sensitive estuarine

Proceedings of the International Conference on Environmental Aspects of Bangladesh (ICEAB 2011)
11
ecosystems. This may open new opportunities for all involved and chances to contribute for the greater good and a better future.
ACKNOWLEDGMENTS
The writer appreciates the comments from an anonymous reviewer and Dr. Dipen Bhattacharya, University of California – Riverside. Relevant arsenic data source is - the BEN forum.
REFERENCES
[1] TKK Ngai, S Murcott, RR Shrestha, B Dangol and M
Marharjan. 2006. Development and dissemination of
Kanchan arsenic filter in rural Nepal. IWA World
Water Congress – Sep 10-14, 2006. Beijing, China.
email: [email protected].
[2] SDN [Science and Development Network]. 2009.
Swiss Federal Institute of Aquatic Sc. and Technol.
Linda Roberts – lead researcher. Nature Geoscience.
[3] S Aftab, AKE Haque and MZH Khan. 2006. Adoption
of arsenic safe drinking water practice in rural
Bangladesh: an averting behavior model. J. of Bangladesh Studies (JBS) – 8, 1.
[4] LJ Raymond and N. Ralston. 2004. Mercury:
selenium interactions and health implications. SMDJ
Seychelles Medical and Dental Journal, Vol 7, No. 1.
[5] USGS [US Geological Survey]. 2000.
Water-Resources Investigation Report 00-4180.
[6] DC Cooper and JW Morse. 1998. Biogeochemical
controls on inorganic metal cycling in anoxic marine
sediment: Environ.Science and Technol., 32:
327-330.
[7] DP Cox, M Alexander. 1973. Appl. Microbiol. 25 (3),
408-413.
[8] S Datta, Y Zheng and MA Hoque. 2009. Redox
trapping of arsenic during groundwater discharge in
sediments from the Meghna River bank in
Bangladesh. Academy of Sciences, US.
[9] LJ Thibodeaux. 1979. Chemodynamics (ed.). John
Wiley & Sons, NY.
[10] CE Warren. 1971. Biology and Water Pollution
Control. W.B. Saunders, Philadelphia, PA.
[11] RP Filice. 1959. The effect of wastes on the
distribution of bottom invertebrates in the San
Francisco Bay Estuary. Wasmann. Journal of Biol., 17:1-17.
[12] S Neyeloff and WW Gunkel. 1975. Methane-carbon
dioxide mixtures in an internal combustion engine.
In: Jewell WJ. (ed). Energy, Agriculture and Waste
Management. Proceedings of the 1975 Cornell Agr.
Waste Mgmt. conf. Ann Arbor (MI): Ann Arbor Sc.
[13] JL Wilhm and TC Dorris. 1968. Biological
parameters for water quality criteria. Bioscience,
18:477-481.
[14] AH Smith, EO Lingas and M Rahman. 2000.
Contamination of drinking water by arsenic in
Bangladesh: A public health emergency. Bulletin of
World Health Organization. Vol. 78.
[15] BEN [Bangladesh Environment Network]. 2010.
Newsletter, Vol. 6. Nos. 17-19.
http://www.ben-global.org.
[16] J Ahmed, B Goldarb and M Smita. 2004. Value of
arsenic- free drinking water to rural households in
Bangladesh. J. of Environ Management, 74: 173-185.
[17] P Dasgupta. 2001. Valuing health damages from
water pollution in urban Delhi, India: a health
production function approach. Institute of Economic
Growth Working Paper. No. E/210/2001.
[18] NEIWPCC [New England Interstate Water Pollution
Control Commission]. 2007. Final northeast regional
mercury total maximum daily load (TMDL) report.
October 2007.
[19] RA Warrick and QK Ahmad. 1996. The implications
of climate and sea-level change for Bangladesh,
Kluwer Academic Publishers, Dordrecht, The
Netherlands.
[20] J Jalan et al. 2003. Awareness and the demand for
environmental quality. Indian statistical institute,
discussion paper 03-05.
[21] Nature, Vol. 54, p. 505-509. Online publication by
Nature (accessed through the BEN forum).
[22] USEPA [United States Environmental Protection
Agency]. 2001. Mercury Maps: A Quantitative Spatial
Link Between Air Deposition and Fish Tissue.
EPA-823-R-01-009.
[23] VL Snoeyink and D Jenkins. 1980. Water Chemistry.
John Wiley & Sons (NY) USA.
[24] R Kristiana, LC Vilhena, G Begg, JP Antenucci, J
Imberger. 2011. The management of Lake
Burragorang in a changing climate: The application
of the index of sustainable functionality. Lake Reserv Manage, 27:70-86.
[25] H Bouwer. 2002. Integrated water management for
the 21st century: Problems and solutions. J. Irrig
Drain、 E-ASCE: 128-193.
[26] S Adee. 2007. Rainfall affected by climate change
Geotimes, 52:14-15.

Proceedings of the International Conference on Environmental Aspects of Bangladesh (ICEAB 2011)
12
A1.002
Local Responsibilities for Global Climate Change: Focusing on
Sea-level Rise, Ecosystem and Health Implications
Shiba P Kar1,2, Farhana Sharmin3 and Albelee A Haque1
1Bangladesh Environment Network (BEN); e-mail: [email protected] 2Penn State University, 235 FRB, University Park, PA 16802; e-mail: [email protected]
3Practical Action- Bangladesh, Dhanmondi, Dhaka 1205, Bangladesh
Abstract To avoid operating only in a crisis mode, broader climate change awareness of the developed and the developing world
is very crucial. Based on a thorough literature review, this paper attempts to better understand the global extent of
climate change impacts and solutions with specific focus on sea-level rise, ecosystem and human health impacts. The
impact of climate change could be severely detrimental for major deltas around the world including the Bengal Delta
with rapid urbanization, worsening global water scarcity and potential loss of ecosystem benefits. Watershed
management tools (e.g., adequate wastewater collection, conveyances and treatment, in-lake methods, storm-water
control to address nutrients/pathogens, increasing shoreline vegetation) incorporating environmental science
principles, comprehensive environmental and urban policy/planning, effective implementation of the relevant policies
and laws at the local levels and cooperation among nations are critical elements of a responsible climate action plan to
avert future crises and mitigate potential health impacts.
INTRODUCTION
The likelihood of irreversible, human-induced climate warming over the next few decades is of great concern, which is marked by a number of local and global governance efforts pertaining to sustainability [24] [26], including the fifth International Conference on Community Based Adaptation (CBA5) to climate change in Bangladesh with participants like the World Bank representatives from Washington, UNDP from New York and also the Asian Development Bank [39]. Climate change along with rapid rate of urbanization is linked to ecosystem impoverishment with negative consequences for the human race and thus the subject deserves our adequate attention.
Coastal-marine ecosystems comprised of diverse flora/fauna and human populations living in the islands and also in mainland are threatened by climate change in many countries of the world. Two-thirds of the world‘s population dwell near coastal areas (> 50% living within 60 km of shoreline) and many of the largest cities are also in the coast [30]. Some climate general circulation models (GCM) indicated positive changes in precipitation and increases in peak discharge for almost all warming scenarios [5]. The changes and impacts might vary from region to region. Chowdhury Sukhan and Hannan [36] outlined Bangladesh specific (where the Bengal Delta is located) baseline average data and GCM estimates of precipitation and temperature (2030-2100) changes and their potential negative impacts on fisheries resources. Similarly, Jacobs states that evapo-transpiration rate may increase up to 15% with a 2-30C temperature rise in the Mekong river basin in Cambodia [38]. There is a growing sense of ecological stress and risk [23]-[24]. Studies investigated the impacts of climate change on local authority planning [27]-[28] in Europe, Japan as well as North America. Although suburban communities in various city-regions in the US have begun to accept local responsibilities for climate change [25], significant policy reform remains to be addressed - especially around what some observers see as a considerable implementation gap. This
paper attempts to understand the global extent of ecosystem problems, sea-level rise and health impact of climate change and suggest practical solutions. It emphasizes science-based long term watershed planning to address aquatic ecosystem vulnerability and human adaptation.
SEA-LEVEL RISE AND THE BENGAL DELTA
Sea-level rise is a major concern especially in major deltas of the world including the Bengal delta. How sea-level rise would impact the deltaic regions and what might be the possible steps to adapt with the issues have been synthesized in this section focusing on the Bengal delta as an example.
Fig. 1. Sundarbans - dried shrimp pond and winter
cranes looking for food (Photo courtesy: Dipen B.,
UC Riverside, California, USA, Jan. 2010).
Bangladesh delta is blessed with the largest block of mangrove forests (supporting a number of endangered flora/fauna no longer found elsewhere) in the world [20]. Observed data show an increase in average tidal level of 3 - 4 mm/yr along the Bangladesh coast [8]. The sea-level may further rise by about 7 mm per year in future and lead to the submergence of coastal land areas and studies inferred that with ~ 0.8 m sea-level rise, ~17% of coastal land in Bangladesh could be inundated [5][8]. However, the climate model projection does not take into account the enormous sediment load from the Himalaya that the Ganges- Brahmaputra- Meghna basin (located in Indian subcontinent) experiences. Bangladesh is crisscrossed by 57 trans- boundary rivers that transport approximately 2.4 billion tons of sediments [21] and the Bengal delta

Proceedings of the International Conference on Environmental Aspects of Bangladesh (ICEAB 2011)
13
may be naturally resilient. But, accelerated sea-level rise poses a threat to the Sundarbans (Fig. 1), a World Heritage site that has unique biodiversity.
Here it is noteworthy that coastal areas of Bangladesh are already experiencing the worse impacts of inundation and erosion, saline intrusion and loss of native flora/fauna due to sea-level rise. A large tract of arable land in Bangladesh has been affected by varying degree of salinities [16][37] due, in part, to its low elevation and increased soil salinities mainly in southwest part of the country as shown in the Table 1.
Table 1. Districts affected by increased soil 2salinity in
Bangladesh during 2000 – 2009 [36].
District Affected Year 2000
(hectare)
Year 12009
(hectare)
Khulna 145,000 148,000
Satkhira 125,000 131,000
Bagerhut 147,000 153,000
2salinity varies from 0- 20 ppt; over 120 species of fish are supported by the Sundarbans coast subject to intrusion [37]
The combined effect of anthropogenic causes (such as major hydroelectric dams constructed by co-riparian countries to power South Asia and lack of regulations/ enforcement in matters like commercial shrimp farming, which is depleting mangroves that protect coastal landmass from storm surges), coupled with sea- level rise has serious implications for deltaic Bangladesh. Some ecosystem based steps, that were proved to be effective in Southeast Asia, might be helpful in the
context of Bangladesh for habitat protection and climate change adaptation. For example, the Coastal Conservation and Education Foundation, a local NGO in the Philippines, helped the Southeast Cebu‘s ecosystem management initiative in an attempt to address the institutional, socioeconomic and environmental concerns plaguing a common fisheries ecosystem beginning at municipal level marine protected areas (MPAs) and scaling up to MPA networks within an inter- municipal governance in the Philippines. Statistical test (1-ANOVA) results showed that better law enforcement can improve MPAs with only a marginally significant decrease (p = 0.058, F = 4.74) in coral cover in Guiwanon Marine Sanctuary [9].
HYDROLOGY, SALINE INTRUSION AND ACCLIMATION
Studies for India‘s Agatti Island and Godavari Delta [2]-[3] reported that climate related increase in flood propensity and the rising of brackish surface waters in areas of low topographic relief could contaminate underlying freshwater coastal aquifers [13]. Other studies demonstrated that salt water intrusion due to climatic factors can significantly lag behind sea-level rise and may be a function of complex local hydrogeology (e.g., Atlantic coastal plain) and aquifer substrate [12]. Nonetheless, salinity (a measure of total dissolved solids or TDS and regulated by major cations and anions) fluctuations could impact the native flora/ fauna and estuarine species adapted to a specific locale due to abrupt ecosystem changes [32] [34]. Tidal cycles, temperatures, wind and precipitation are important climatic factors in salinity [32].
Anthropogenic and climatic stresses may alter algal species composition favoring toxin- producing strains. For example, Anabaena aphanizominoides can tolerate salt levels up to 15,000 mg/L [22].
Estuarine and aquatic fauna can sometimes withstand extreme temperatures through acclimation. Because enzymes influence biological processes and chemical reactions greatly rely on temperature, the combined effect of increased temperatures and low oxygen levels at interstitial sediment pore water may impact water quality and also limit growth/ survival of valuable aquatic/ marine species [34]. Faster metabolism at higher temperature leads to greater oxygen demand with accelerated decomposition at the lake-bottom and rapid oxygen depletion. However, advanced wastewater treatment (alum based processes vs. conventional) could lower nutrients and alter biochemical and bloom forming characteristics of effluents - before being discharged to a river/lake or estuary and counter the temperature effect. It is also well known that solubility of molecular (species) oxygen decreases in water containing much salt (i.e., the ―salting-out-effect‖) because of the significant amount of water of hydration bonded to ions [29]. Microorganisms are loaded with enzymes and empirical rate laws are typically used to express growth-rate-substrate relationships. While it is the norm to deduce an approximation of ionic strength (µ) as a function of TDS or specific conductance (electrical conductivity is directly proportional to ion concentrations), the DeBye-Hückel limiting law was developed for µ < 5x10⁻³ as in (1):
log γi = 0.5 Zi2 µ ½ (1)
where, µ is ionic strength; γi is the activity coefficient and Zi is the charge of ionic species i. Temperature can catalyze biogeochemical reactions and organism growth rate depends on the catalyst behavior mediating myriad reactions in biological wastewater treatment. A good question for us to ask could be – how does a fish feel or adapt in the natural aquatic environment with abrupt changes in salinity, temperature or dissolved oxygen levels?
HUMAN HEALTH IMPACT AND SOLUTIONS
Climate change could increase the rate of precipitation and pathogen impairment of urban /suburban/rural streams and lakes/ponds. The bacterial pollution of the receiving water-bodies due to nonpoint sources (e.g., rooftop/paved parking lot, street flooding, sediment re-suspension) could impose potential risk to human health, and impact quality of life worldwide. Some researchers were able to isolate the impact of sediment fecal bacteria pool by creating mechanical agitation or artificial storm/ flooding events [7]. Historical data and analyses indicate that the risk of malarial epidemic increased 5-fold in the Indian Subcontinent during the year after an El Niño [4]. Also Pascual and
associates [6] found long term positive correlation between El Niño and cholera using 18 years of data from the International Center for Diarrheal Disease Research, Bangladesh. The surface water in Bangladesh is unsafe for drinking, washing, cooking/ bathing because of high levels of total fecal coliform ranging from 6.0X10² to 1.6X10⁶ cfu/100ml [1].

Proceedings of the International Conference on Environmental Aspects of Bangladesh (ICEAB 2011)
14
Most of Bangladesh has groundwater contaminated with naturally occurring arsenic. Thus, the country needs to prepare now to meet the public health challenge of climate variability. Climate disasters may lead to a severe shortage of clean water (already scarce due to widespread river pollution by pathogens). Climate change indeed poses a tremendous challenge for Bangladesh due to a lack of access for rural populations to basic sanitation, and pathogen contamination of lakes/rivers eliminating the many ecosystem services to people living at subsistence level.
Clean water and nutrition are essential to ensure health and welfare. Contamination of water resources due to urbanization and industrialization coupled with climate change is a major concern for both developed and the developing countries [30]. Studies inferred that growing world population, watershed development without respecting the limits of natural ecosystem and climate change could worsen global water scarcity and water quality impairment problems and impact human health [15] [30]. Conversely, wastewater treatment plant effluents with mostly dissolved phosphorus (readily bioavailable) can be reused as renewable water resource for non-potable urban use and agriculture (disinfected secondary treatment effluents) rather than discharging into rivers that may induce potentially toxic algal blooms under warmer temperatures. Not too many wastewater treatment facilities in the US currently discharge phosphorus at concentrations below the threshold limit for reasonable habitat, recreational quality and water quality management without dilution. Some freshwater rivers drain into coastal waters, whence dual-nutrient control is necessary [17]. When toxicants (e.g., metal) are absent but sunlight
and nutrients are sufficient, algae will grow profusely in either tropical or temperate climate. Among the problem algae are certain filamentous greens and the blue-greens (i.e., cyanobacteria). Some cyanobacteria (e.g., Microcystis, Aphanizomenon, Anabaena) can produce toxins, magnifying the health threat from phosphorus inputs to freshwater lakes [33]. Occurrences of toxin-producing blooms have ramifications for water supply and ecosystem services (e.g., fishing, bathing/recreation), both linked to human health. Rural health problems are simple and better solved with access to clean water and nutrition. It is relevant to note that scientists with the Bangladesh Agricultural Research Council predicted agriculture to be the hardest hit sector as temperatures above 35°C for > 8 hours could cause sterility of rice plant (wetland plant). Severe flooding that inundated >33% of the country had hit 5X during 1987-2007 compared to just twice in the past two decades [10], [11], [40] causing substantial loss of crop, which is also related to nutrition and health.
Re-aeration is considered a major component of the natural balance of dissolved oxygen in aquatic environment. Natural and undiminished stream flow with enhanced re-aeration potential can reduce occurrences of harmful aquatic species/algal blooms that can choke lakes/ ponds and bays by restricting aeration. Re-aeration in low stream velocity waters is generally affected by less dynamic processes (non-energy reach characteristics)
including changes in water quality parameters (e.g., TDS, color, suspended solids). Turbulence in the water column is the primary factor that determines oxygen and gas transfer rate at the air-water interface of high-slope streams [18]-[19]. Low-slope and slow streams with large population areas discharging untreated sewage into rivers are the most vulnerable to seasonal harmful algal blooms due to climate variability (temperature, precipitation). Oxygenation can prevent formation of methane and hydrogen sulfide odor (byproducts of decaying algae/organic matter decomposition under suboxia) in the lake bottom [35]. Success of phosphorus inactivation by alum/aeration (in-lake) can be enhanced by storm water loading reduction. Repeated chemical treatments after blooms are expensive (have side-effect with respect to ecosystem/human health) and results may vary. Thus, low flow augmentation, good municipal house-keeping and appropriate levels of sewage treatment to remove nutrients (before discharge) are necessary for estuary and river protection and overall vibrant ecosystems.
SUMMERY, RECOMMENDATIONS AND
MANAGEMENT PERSPECTIVE
Water scarcity, saline intrusion and crop-failure are some of the major concerns of GCM predicted climate variability. All of these elements are profoundly linked to human health and have the potential to worsen pollution and environmental degradation problems in vulnerable deltaic coastal
regions including Bangladesh. The moral challenges for the governments, NGOs, concerned citizens, civic groups and international friends are to ensure public health/safety and welfare. This can be realized by adopting the ecosystem approach that calls for preserving MPAs, healthy riparian vegetation (protecting mangroves) and needs the cooperation of upper riparian nations to avoid damming of the international rivers for uninterrupted river flow and sediment subsidies. Bangladesh will host an international conference with participants from twenty countries from Asia, Africa, island countries and Latin America in November 2011. Certainly, this would help the vulnerable communities to share knowledge of how they are preparing to tackle climate change locally (e.g., CBA techniques) as new spheres of opportunities emerge in global authority planning, and also make the more- affected and the less-affected countries reasonably united in coming up with a philosophical framework to better understand the science, communication and resolution to deal with the twenty first century climate change phenomenon.
With regard to long term watershed planning, proper handling of domestic wastes and installation of sewage treatment facilities to counter climate related increase in water pollution (i.e., pathogens, nutrients) and associated health risks in Bangladesh are of paramount importance. Lakes and reservoirs across North America and Europe showed substantive water quality improvements after implementing similar pollution control measures [14]. Exchange of knowledge/ideas and lessons learned from each other can avert future problems for both developed and developing world and

Proceedings of the International Conference on Environmental Aspects of Bangladesh (ICEAB 2011)
15
address overall ecosystem vulnerability. Increased river pollution, sea-level rise and salt water intrusion issues linked to GCM predicted climate variability, unplanned growth/industrialization [31] and fast urbanization [15] [30] need to be resolved globally and at the local scales as part of a responsible and practical climate action plan.
ACKNOWLEDGMENTS
The authors thank prominent journalist (and educator) Monzurul Huq from Bangladesh living in Tokyo for critique. A ‗thank you‘ goes to North American Lake Management Society‘s (NALMS) Dr. Kenneth J. Wagner, Ms. Sarah Unz and M. Ahad for relevant data.
REFERENCES
[1] SM Assaduzaman, DS Kabir and RK Debnath. 2002.
Surface water pollution in rural areas of Bangladesh.
In: Proc. Bangladesh Environment, 2002.
[2] AG Bobba. 2002. Numerical modeling of salt-water
intrusion due to human activities and sea-level
change in Godavari delta, India. Hydrological Science,
47: 67-80.
[3] AG Bobba. 1998. Application of a numerical model to
predict freshwater depth in islands due to climate
change: Agatti Island, India. Journal of Environ
Hydrology, 10 (special issue): 10: 1-13.
[4] MJ Bouma, Van der Kaay. 1996. Trop. Med. Int. Health, 1: 86.
[5] IPCC [Intergovernmental Panel for Climate Change].
2007. Fourth Assess. Report, (AR4)..
[6] M. Pascual et al., Science, vol. 289, 200, pp.1766.
[7] RC Jamieson, DM Joy, H Lee, R Kostaschuk, RJ
Gordon. 2005. Resuspension of sediment associated
Escherichia coli in a natural stream. J. Env. Qual., 34: 581-589.
[8] SP Kar. 2003. Adaptation to impacts of sea level rise
in coastal areas of Bangladesh. MS Thesis, Graduate
Studies in Env. Mgmt and Dev., Australian National
Univ., Canberra, Australia.
[9] R Eisma-Osorio, RC Amolo, AP Maypa, AT White, P
Christie. 2009. Scaling up local government
initiatives toward ecosystem-based fisheries
management in southeast Cebu Island, Philippines.
Coastal Management, 37(3): 291–307.
[10] WT Pfeffer, JT Harper, and S O'Neel. 2008. Kinematic
Constraints on Glacier Contributions to 21st-Century
Sea-Level Rise, Science, 5 September 2008, p. 1340-1343.
[11] M Inman. 2009. Hot, Flat, Crowded - And Preparing
for the Worst. Science, 30 October 2009, pp. 662-663.
[12] H Kooi, J Groen. 2000. Modes of seawater intrusion
during transgressions. Water Resource Research,
36(12): 3581-3589.
[13] JP Masterson, SP Garabedian. 2006. Effects of sea
level rise on groundwater flow in a coastal aquifer
system. J. of Ground Water, 45(2): 209-217.
[14] E. Jeppesen et al. 2005. Lake response to reduced
nutrientloading – an analysis of contemporary long-
term data from 35 case studies. Freshwater Biol, 50:
1747-71.
[15] UN [United Nations]. 2007. World Urbanization
Reports. 2007.
[16] M Huq, G Nalaka and others. 2009. Top news on the
environment in Asia. Institute for Global
Environmental Strategies (IGES) Publication, Tokyo,
Japan, 2009. ISBN: 978-4-88788-054-2.
[17] DJ Conley, HW Paerl, RW Howarth, DF Boesch, SP
Seitzinger, KE Havens, C Lancelot, GE Likens. 2009.
Controlling eutrophication: Nitrogen and phosphorus.
Science, 323: 1014-1015.
[18] US Geological Survey. 1992. Estimating re-aeration
coefficients for low-slope streams in Massachusetts
and New York, 1985-88. USGS Water Res.
Investigation Report # 91-4188.
[19] JD Parkhurst, RD Pomeroy. 1972. Oxygen absorption
in streams: ASCE. J. of Sanitary Engg Div, 98: 101-124.
[20] S. Akhter. 2010. Shrimp farming, mangrove depletion
and environmental governance: A case study on the
coastal region of Bangladesh. In: Proceedings of the ICEAB10, Sep. 4, 2010, BENJP publication. Available
at: http://benjapan.org/ICEAB10.
[21] SRDI [Soil Resource Development Institute]. 2003.
Soil salinity in Bangladesh 2000. Government of
Bangladesh, Dhaka.
[22] HW Paerl. 2010. Managing harmful cyanobacterial
blooms (CyanoHABs) in the face of anthropogenic and
climate change. Fall 2010 special electronic
issue/NALMS publication.
[23] D McEvoy, D Gibbs and J Longhurts. 2001. Reducing
residential carbon intensity: The new role for English
local authorities. Urban Studies, 38(7): 7-21.
[24] Y Dierwechter. 2010. Metropolitan geographies of US
climate action: cities, suburbs, and the local divide in
global responsibilities. J. of Environ Policy & Planning,
12(1): 59–82.
[25] H Bulkeley. 2006. A changing climate for spatial
planning. Planning Theory and Practice, 7(2): 203-213.
[26] US Conference of Mayors. 2007. Climate Protection
Strategies and Best Practices Guide: 2007. US Conf of
Mayors , Seattle, WA.
[27] N Sugiyama and T Takeuchi. 2008. Local policies for
climate change in Japan. J. of Environ and Development, 17(4): 424-441.
[28] S Wheeler. 2008. State and municipal climate action
plans: The first generation. J. of the American Planning Association. 74(4): 481-496.
[29] V Snoeyink and D Jenkins. 1980. Water Chemistry–
Non-ideal behavior of ions and molecules in solution.
John Wiley and Sons, Inc. New York. USA, pp. 24-82.
[30] EC Odada. 2010. Integration of coastal and marine
areas into sustainable development strategies: A case
study of Africa. J. of Marine Science, Available at:
http://www.science-journals.org/jms,
[31] F Oneza, AICP. 2011. Growth management and
environmental protection: practices in Washington
State, USA. In: Proceedings of BEN-BAPA Conf., 2011,
Online publication of BEN.
[32] RG Wetzel. 2001. Limnology: Lake and River Ecosystems. Academic Press: CA, USA.
[33] DL Bigham, MV Hoyer and DE Canfield Jr. 2009.
Survey of toxic algal (Microcystis) distribution in
Florida lakes. Lake Reserv. Manage, 25(3): 264-275.
[34] CE Warren. 1971. Biology and Water Pollution Control. WB Saunders, Philadelphia, PA, US.
[35] JB Carr. 1984. Environmental impact assessment of
the Lake Waban cooling project. Prepared for the
Wellesley College by Carr Research Laboratory, Inc.,
Massachusetts, USA.
[36] MTH Chowdhury, ZP Sukhan, MA Hannan. 2010.
Climate change and its impact on fisheries resources
in Bangladesh. In Proceedings of ICEAB 10,
BENJapan publication, pp. 95-98.
[37] World Bank. 2000. Bangladesh, climate change and
sustainable development. Report No. 21104.
[38] JW Jacobs. 1990. International river basin
development and climate change: the lower Mekong of
southwest Asia. Ph.D. thesis, Univ. of Colorado, USA.
[39] S Huq, Sr. Fellow, Climate Change Group, International
Institute for Environment and Development (IIED),
UK, Personal Communication, 5 Jan 2011.
[40] Dennis Normile. 2008. Reinventing Rice to Feed the
World. Science, 18 July 2008, pp. 330-333.

Proceedings of the International Conference on Environmental Aspects of Bangladesh (ICEAB 2011)
16
A1.003
Suitability of Duckweed-Treated Wastewater for Multipurpose
Uses in Bangladesh
Md. Rokunuzzaman1*, M Shah Alam Khan1,2, Md. Salequzzaman1,3, Subrota Kumar
Saha1,4, Hasegawa Yuki1 and Sato Shushi1
1Faculty of Agriculture, Kochi University, B200, Nankoku City, Kochi Prefecture, Japan 783-8502. 2Institute of Water and Flood Management (IWFM), Bangladesh University of Engineering and Technology,
Dhaka, Bangladesh. 3Environmental Science Discipline, Khulna University, Khulna, Bangladesh.
4Department of Geology, University of Dhaka, Bangladesh. *Corresponding Author: e-mail: [email protected]; Tel: +81-80-4034-7475
Abstract
This study provides an overview of the suitability of duckweed-treated wastewater for multipurpose uses, example
pisciculture, agriculture, recreational water uses etc. This study was conducted in a duckweed-based wastewater
treatment facility at Mirzapur, Tangail, Bangladesh. Retention time in the pond was varied by changing the influent
pumping rate into the system. To determine the optimum retention time, three retention times, 19 days, 22 days and 27
days were tested during field experiment. From results of the water quality monitoring analysis, it was found that 22
days retention time is optimum for treating domestic wastewater by a duckweed-based system. All members of the
duckweed family concentrate organic pollutants and heavy metals. The study demonstrated that duckweeds can
efficiently reduce fecal coliform count (100% removal), TDS (79.06% removal), BOD (98.08% removal), ammonia
nitrogen (NH3-N) (99.15% removal), phosphate (98.30% removal), Fe (64.80% removal), Mn (58.64% removal), and As
(99% removal) in the wastewater after a retention time of 22 days. This study has also showed that duckweed-treated
effluent can be suitable for pisciculture and recreational water uses. However, the effluent may not be suitable as a
drinking water source since it contains fecal coliform. Co-crops grown on the pond embankment may provide additional
financial return and can be also used for other purposes such as fish and poultry feed. Since the processes in an
integrated duckweed-based wastewater system are energy efficient, such a system would be cost effective and
applicable under a wide variety of rural and urban conditions in Bangladesh.
INTRODUCTION
Rapidly growing shortage of usable water has promoted attempts to re-use effluent from wastewater treatment plants in many parts of the world. After proper processing, the effluent is used for various urban, industrial, agricultural, aquacultural or recreational purposes. Duckweed covered stabilization ponds may significantly lower the pollutant concentrations in the effluent at relatively low costs [1] [2].
Duckweed (belonging to the botanical family of Lemnaceae and genera Spirodela) the rapidly growing and small size of floating aquatic plants are capable of accumulating nutrients and minerals from wastewater. The latter are finally removed from the system as the plants are harvested from the pond surface. Duckweed, while growing in these ponds converts substantial amounts of organic compounds into biomass by converting nutrients and dissolved minerals into plant biomass. When plants are harvested, nutrients and minerals are removed from the system and a dynamic equilibrium of nutrient and mineral sink is established. This forms the basis for a highly effective wastewater treatment technology. Waste stabilization ponds (lagoons) are generally the method of choice for domestic wastewater treatment in developing countries [3].
Duckweed that grows in wastewater lagoons can be harvested and used as the only source of fish feed and poultry feed. Duckweed holds the potential
to create a financial incentive for controlled faeces and wastewater collection in both rural and urban areas and, therefore, improve sanitary conditions and reduce water pollution problem. Duckweed have a great capacity in assimilating N, P, K, Ca, Na,
and Mg, especially in heavy loaded waters. Daily, it is possible to remove up to 4.7kg/ha N, 1.6kg/ha P and 2.1 kg/ha K [4]. Duckweed has a potential for the utilization and treatment of excreta, especially in developing countries with poor sanitation and storage of high- protein animal feeds. Their high protein and low-fiber fronds are readily consumed by herbivorous fish [5]. Thus, the full potential of duckweed aquaculture lies in its combined use in the fields of sanitation, agriculture, food production and income generation.
Effective treatment of wastewater both the rural and urban areas remains an elusive objective in most developing countries. Because of industrial development and growing population density in future, countries like Bangladesh cannot afford not to treat their wastewater. While there are many reasons for this, experts generally agree that the overriding factor is cost. Conventional treatment systems, which generally rely on heavy aeration are prohibitively expensive to install and both difficult and costly to operate and maintain. Duckweed- based wastewater treatment systems provide solutions to these problems.
Duckweed-based wastewater treatment systems are inexpensive to install as well as to operate and
maintain. It does not require imported components and functionally simple, yet robust in operation. It provides tertiary treatment performance equal or superior to conventional wastewater treatment systems and now recommended for large-scale applications [6].
In Bangladesh, three relatively small duckweed- based treatment systems have been used to treat domestic wastewater. In these systems, duckweed ponds improve the treatment capability by natural
Proceedings of the International Conference on Environmental Aspects of Bangladesh (ICEAB 2011)
17
bioaccumulation process. However, suitability of the treated water for agricultural, aquacultural or recreational uses is unknown. If found suitable, duckweed-treated water may provide an additional resource in both rural and urban areas. Duckweed also holds great potential in wastewater and sanitation projects if combined with duckweed feed applications in aquaculture [7] [8] [9].
MATERIALS AND METHODS
A. Study area
The study area was selected in an experimental duckweed-based wastewater treatment demo farm operating by PRISM Bangladesh (an NGO) at Kumudini Hospital Campus (KHC) of Mirzapur Upazila under the Tangail district of Bangladesh. The location is approximately 60 km north of Dhaka, the capital city of Bangladesh. Total capacity of the wastewater treatment system is 14 million litres. 2.4 hectares of land are being used for duckweed based wastewater treatment plant and duckweed fed aquaculture. Fig.1 shows a systematic diagram of the duckweed-based system along with its different components and salient features. In this study, the duckweed plug flow system (secondary treatment) is composed of five bends (ponds) and its total length is 500 meter, each bend being 100 meter in length. The first bend is termed as the inlet and the last bend is termed as the outlet of the plug flow system.
B. Sampling of water sample
Grab samples were collected from several inflow and outflow locations (the raw sewage (Pump house), primary stabilization pond (P-1), and middle points of bend-1 (B-1), Bend-2 (B-2), Bend-4 (B-4) and last bend (LB) of the system) of the facility. Retention time in the pond was varied several times by changing the pumping rate (daily input) to determine the corresponding changes in the effluent water quality. Hydraulic Retention Time (HRT) was calculated by the following equation:
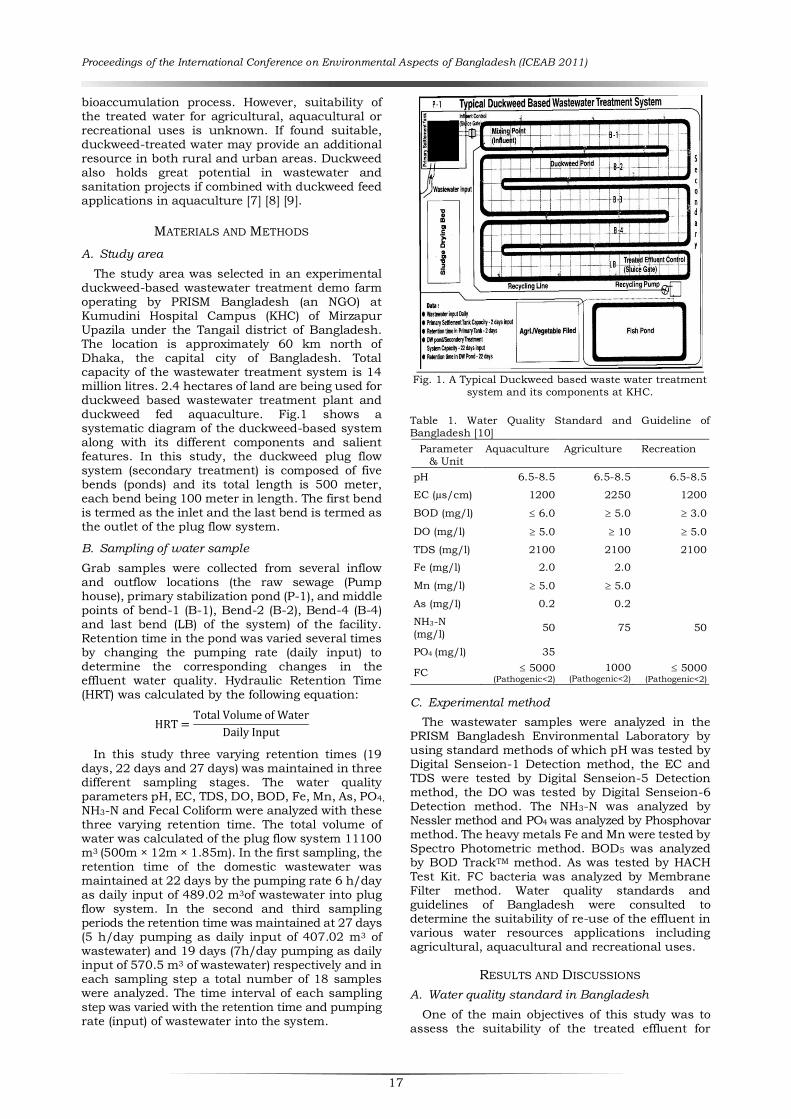
In this study three varying retention times (19 days, 22 days and 27 days) was maintained in three different sampling stages. The water quality parameters pH, EC, TDS, DO, BOD, Fe, Mn, As, PO4,
NH3-N and Fecal Coliform were analyzed with these three varying retention time. The total volume of water was calculated of the plug flow system 11100 m3 (500m × 12m × 1.85m). In the first sampling, the retention time of the domestic wastewater was maintained at 22 days by the pumping rate 6 h/day as daily input of 489.02 m3of wastewater into plug flow system. In the second and third sampling periods the retention time was maintained at 27 days (5 h/day pumping as daily input of 407.02 m3 of wastewater) and 19 days (7h/day pumping as daily input of 570.5 m3 of wastewater) respectively and in each sampling step a total number of 18 samples were analyzed. The time interval of each sampling step was varied with the retention time and pumping rate (input) of wastewater into the system.
Fig. 1. A Typical Duckweed based waste water treatment
system and its components at KHC.
Table 1. Water Quality Standard and Guideline of
Bangladesh [10]
Parameter
& Unit
Aquaculture Agriculture Recreation
pH 6.5-8.5 6.5-8.5 6.5-8.5
EC (µs/cm) 1200 2250 1200
BOD (mg/l) 6.0 5.0 3.0
DO (mg/l) 5.0 10 5.0
TDS (mg/l) 2100 2100 2100
Fe (mg/l) 2.0 2.0
Mn (mg/l) 5.0 5.0
As (mg/l) 0.2 0.2
NH3-N
(mg/l) 50 75 50
PO4 (mg/l) 35
FC 5000 (Pathogenic<2)
1000 (Pathogenic<2)
5000 (Pathogenic<2)
C. Experimental method
The wastewater samples were analyzed in the PRISM Bangladesh Environmental Laboratory by using standard methods of which pH was tested by Digital Senseion-1 Detection method, the EC and TDS were tested by Digital Senseion-5 Detection method, the DO was tested by Digital Senseion-6 Detection method. The NH3-N was analyzed by Nessler method and PO4 was analyzed by Phosphovar method. The heavy metals Fe and Mn were tested by Spectro Photometric method. BOD5 was analyzed by BOD TrackTM method. As was tested by HACH Test Kit. FC bacteria was analyzed by Membrane Filter method. Water quality standards and guidelines of Bangladesh were consulted to determine the suitability of re-use of the effluent in various water resources applications including agricultural, aquacultural and recreational uses.
RESULTS AND DISCUSSIONS
A. Water quality standard in Bangladesh
One of the main objectives of this study was to assess the suitability of the treated effluent for
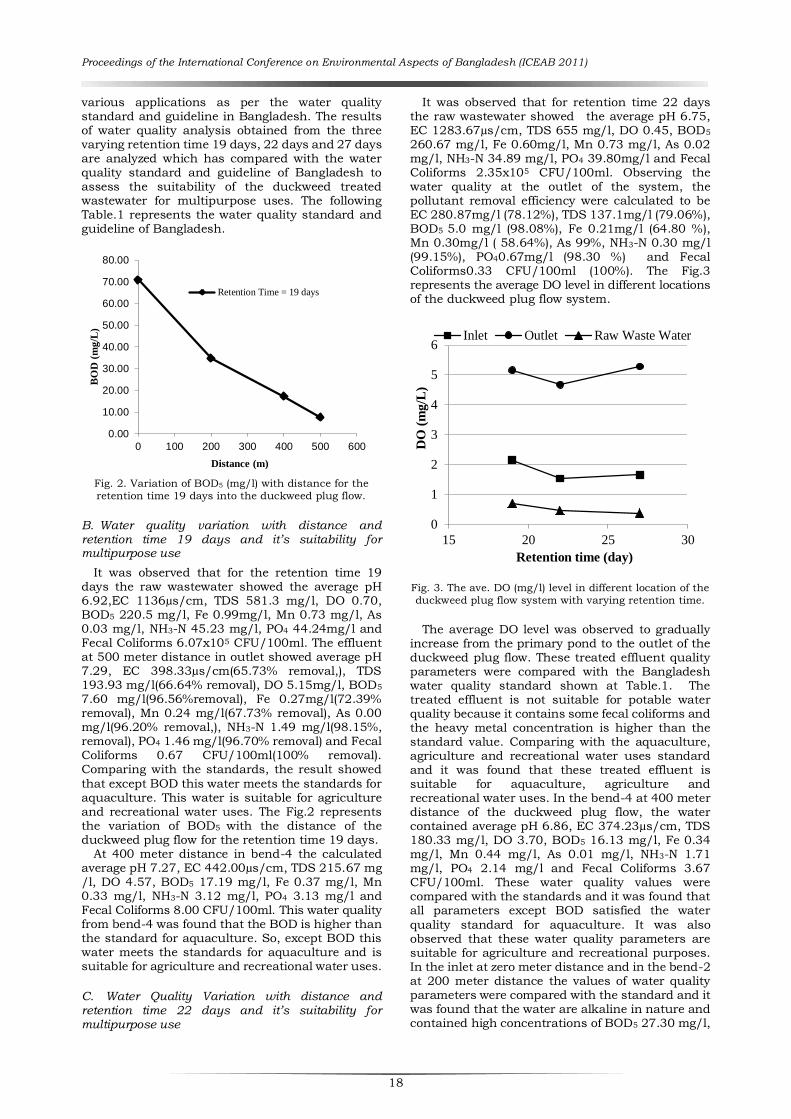
Proceedings of the International Conference on Environmental Aspects of Bangladesh (ICEAB 2011)
18
various applications as per the water quality standard and guideline in Bangladesh. The results of water quality analysis obtained from the three varying retention time 19 days, 22 days and 27 days are analyzed which has compared with the water quality standard and guideline of Bangladesh to assess the suitability of the duckweed treated wastewater for multipurpose uses. The following Table.1 represents the water quality standard and guideline of Bangladesh.
Fig. 2. Variation of BOD5 (mg/l) with distance for the
retention time 19 days into the duckweed plug flow.
B. Water quality variation with distance and retention time 19 days and it’s suitability for multipurpose use
It was observed that for the retention time 19 days the raw wastewater showed the average pH 6.92,EC 1136µs/cm, TDS 581.3 mg/l, DO 0.70, BOD5 220.5 mg/l, Fe 0.99mg/l, Mn 0.73 mg/l, As 0.03 mg/l, NH3-N 45.23 mg/l, PO4 44.24mg/l and Fecal Coliforms 6.07x10⁵ CFU/100ml. The effluent at 500 meter distance in outlet showed average pH 7.29, EC 398.33µs/cm(65.73% removal,), TDS 193.93 mg/l(66.64% removal), DO 5.15mg/l, BOD5 7.60 mg/l(96.56%removal), Fe 0.27mg/l(72.39% removal), Mn 0.24 mg/l(67.73% removal), As 0.00 mg/l(96.20% removal,), NH3-N 1.49 mg/l(98.15%, removal), PO4 1.46 mg/l(96.70% removal) and Fecal Coliforms 0.67 CFU/100ml(100% removal). Comparing with the standards, the result showed
that except BOD this water meets the standards for aquaculture. This water is suitable for agriculture and recreational water uses. The Fig.2 represents the variation of BOD5 with the distance of the duckweed plug flow for the retention time 19 days.
At 400 meter distance in bend-4 the calculated average pH 7.27, EC 442.00µs/cm, TDS 215.67 mg /l, DO 4.57, BOD5 17.19 mg/l, Fe 0.37 mg/l, Mn 0.33 mg/l, NH3-N 3.12 mg/l, PO4 3.13 mg/l and Fecal Coliforms 8.00 CFU/100ml. This water quality from bend-4 was found that the BOD is higher than the standard for aquaculture. So, except BOD this water meets the standards for aquaculture and is suitable for agriculture and recreational water uses.
C. Water Quality Variation with distance and retention time 22 days and it’s suitability for multipurpose use
It was observed that for retention time 22 days the raw wastewater showed the average pH 6.75, EC 1283.67µs/cm, TDS 655 mg/l, DO 0.45, BOD5 260.67 mg/l, Fe 0.60mg/l, Mn 0.73 mg/l, As 0.02 mg/l, NH3-N 34.89 mg/l, PO4 39.80mg/l and Fecal Coliforms 2.35x10⁵ CFU/100ml. Observing the water quality at the outlet of the system, the pollutant removal efficiency were calculated to be EC 280.87mg/l (78.12%), TDS 137.1mg/l (79.06%), BOD5 5.0 mg/l (98.08%), Fe 0.21mg/l (64.80 %), Mn 0.30mg/l ( 58.64%), As 99%, NH3-N 0.30 mg/l (99.15%), PO40.67mg/l (98.30 %) and Fecal Coliforms0.33 CFU/100ml (100%). The Fig.3 represents the average DO level in different locations of the duckweed plug flow system.
Fig. 3. The ave. DO (mg/l) level in different location of the
duckweed plug flow system with varying retention time.
The average DO level was observed to gradually increase from the primary pond to the outlet of the duckweed plug flow. These treated effluent quality parameters were compared with the Bangladesh water quality standard shown at Table.1. The treated effluent is not suitable for potable water quality because it contains some fecal coliforms and the heavy metal concentration is higher than the standard value. Comparing with the aquaculture, agriculture and recreational water uses standard and it was found that these treated effluent is suitable for aquaculture, agriculture and recreational water uses. In the bend-4 at 400 meter distance of the duckweed plug flow, the water contained average pH 6.86, EC 374.23µs/cm, TDS 180.33 mg/l, DO 3.70, BOD5 16.13 mg/l, Fe 0.34 mg/l, Mn 0.44 mg/l, As 0.01 mg/l, NH3-N 1.71 mg/l, PO4 2.14 mg/l and Fecal Coliforms 3.67 CFU/100ml. These water quality values were compared with the standards and it was found that all parameters except BOD satisfied the water
quality standard for aquaculture. It was also observed that these water quality parameters are suitable for agriculture and recreational purposes. In the inlet at zero meter distance and in the bend-2 at 200 meter distance the values of water quality parameters were compared with the standard and it was found that the water are alkaline in nature and contained high concentrations of BOD5 27.30 mg/l,
0.00
10.00
20.00
30.00
40.00
50.00
60.00
70.00
80.00
0 100 200 300 400 500 600
BO
D (
mg
/L)
Distance (m)
Retention Time = 19 days
0
1
2
3
4
5
6
15 20 25 30
DO
(m
g/L
)
Retention time (day)
Inlet Outlet Raw Waste Water

Proceedings of the International Conference on Environmental Aspects of Bangladesh (ICEAB 2011)
19
low DO level (3.61 mg/l), high concentrations of NH3-N 3.20mg/l, PO46.33 mg/l and high counts of fecal coliforms, which were higher than the standards. Thus water quality at this location was not suitable for multipurpose application.
D. Water quality variation with distance and retention time 27 days and it’s suitability for multipurpose use
For this retention time 27 days, the Fig. 4 represents the average BOD5with distance variation of the duckweed plug flow system with varying retention time.
Fig. 4. Variation of average BOD5 with distance in
the duckweed plug flow system in three varying
retention times.
The average pH in the effluent was 7.42, which was little alkaline condition. The average DO level was gradually increased from raw wastewater to the outlet; the average value was 5.28 mg/l. The water quality at 500 meter distance in outlet the average pH 7.42, EC 371.33µs/cm, TDS 191.33 mg/l, DO 5.28, BOD5 5.02 mg/l, Fe 0.23 mg/l, Mn 0.20 mg/l, As 0.00 mg/l, NH3-N 0.98 mg/l, PO4 0.72 mg/l and Fecal Coliforms 0.00 CFU/100ml. Comparing with
the Bangladesh water quality standards, it was observed that this water was suitable for aquaculture, agriculture and recreational purposes. However, it was not suitable for drinking water because of the presence of pathogen. At 400 meter distance in bend-4 the water showed the average pH 7.33, EC 453.00 µs/ cm, TDS 244.00 mg/l, DO 4.85, BOD5 12.57 mg/l, Fe 0.44 mg/l, Mn 0.300 mg/l, NH3-N 1.95 mg/l, PO4 1.97 mg/l and Fecal Coliforms 2.67 CFU/100 ml. Comparing with the standards, it was observed that except BOD5 this water meets the standards for aquaculture. However, it was found to be suitable for agriculture and recreational purposes.
CONCLUSION
This study shows that duckweed based wastewater treatment system can effectively treat wastewater. From the aforementioned results and discussion, it can be concluded that the treated effluent (outlet) from the duckweed plug flow is suitable for aquaculture application for retention time 22 days and 27 days. However, the treated
effluent for 19 days retention was not suitable for aquaculture because the BOD level was higher than the standard. The treated effluent is suitable for agriculture, aquaculture and recreational water uses for 22 days and 27 days retention time. To ensure acceptable pathogen removal and treatment efficiency, comparatively long retention times in the range of 20 to 25 days are postulated for duckweed (plug-flow) systems [11]. Considering the multipurpose applications of the treated effluent, pollutant removal efficiency, water quality variation with retention time and distance, it can also be concluded a retention time 22 days is the most suitable for the duckweed plug flow system in this study. The treated effluent is suitable for multipurpose uses while the duckweed can be used as fish and poultry feed. The effluent water quality mostly meets the chemical and microbiological water quality standards and guidelines for aquaculture, agriculture and recreational water uses. Duckweed- based system is to be economically viable if combined with duckweed feed applications in aquaculture.
ACKNOWLEDGMENTS
The author would like to acknowledge to BUET and PRISM Bangladesh to provide support and assistance to conduct the research.
REFERENCES
[1] WS Hillman and DD Culley. 1978. The uses of
duckweed. American Scientist, 66:442-451.
[2] G Oron. 1994. Duckweed culture for wastewater
renovation and biomass production. Agric. Water Man., 26:27-40.
[3] P Edwards. 1985. Aquaculture: A component of low
cost sanitation technology. In: Technical paper No. 36.
The World Bank, Washington. D.C., U.S.A.
[4] E Landolt. 1996. Duckweed (Lemnaceae):
Morphological and Ecological Characteristics and
their Potential for Recycling of Nutrients.
Environmental Research Forum, 5-6: 289-296.
[5] P Edwards, MS Hassan, CH Chao and C
Pacharaprakiti. 1992. Cultivation of Duckweeds in
Septage-Loaded Earthen Ponds. Bioresource
Technology, 40: 109-117.
[6] S Iqbal. 1999. Duckweed Aquaculture: Potentials,
Possibilities and Limitations for Combined
Wastewater Treatment and Animal Feed Production
in Developing Countries. SANDEC Report No. 6, 99,
pp.91
[7] HJ Gijzen and KM Kondke. 1997. An Overview of the
Ecology, Physiology, Cultivation and Application of
Duckweed, Inception Report, ANNEX 1: Literature
Review, Duckweed Research Project (DWRP), Dhaka,
Bangladesh, pp.53.
[8] FAO. 1999. Duckweed –A Tiny Aquatic Plant with
Enormous Potential for Agriculture and Environment,
FAO Publications, Rome, Italy.
[9] I Nhapi, J Dalu, J Ndamba, and HJ Gijzen. 2001.
Sustainable decentralized sanitation using
duckweed-based ponds, Proc. 27th WEDC Conf., Lusaka, Zambia, pp.228-231.
[10] SA Sayed. 1998. Introduction of Environmental Law
in Bangladesh.Ace Datta Products, Dhaka.
[11] Metcalf and Eddy, Inc. 1991. Wastewater engineering
-Treatment, disposal, and reuse. 3rd Edition.
McGraw-Hill,NewYork.
0.00
10.00
20.00
30.00
40.00
50.00
60.00
70.00
80.00
0 200 400 600
BO
D (
mg
/L)
Distance (m)
Retention Time = 19 days
Retention Time = 22 days
Retention Time= 27 days

Proceedings of the International Conference on Environmental Aspects of Bangladesh (ICEAB 2011)
20
A1.004
Monitoring Pollution Level of the River Khiru
at Mymensingh, Bangladesh
Md. Nazmul Hasan1, Harunur Rashid1,*, Mohosena Begum Tanu2, Rawshan Parveen2,
Zahid Parvez Sukhan3, Md. Abdus Sattar4 and Yahia Mahmud2
1Department of Fisheries Management, Bangladesh Agricultural University, Mymensingh, Bangladesh 2Bangladesh Fisheries Research Institute, Mymensingh 2201, Bangladesh
3Laboratory of Marine Biology, Faculty of Agriculture, Kyushu University, Fukuoka, Japan 4Department of Medicine, Chittagong Medical College, Chittagong, Bangladesh
*Corresponding Author: Tel: +88-01924-429971; e-mail: [email protected]
Abstract
The levels of some toxic metals in water, sediment and fish muscle, and some physico-chemical parameters of water
from three points of the Khiru River at Bhaluka, Mymensingh was analyzed. Five fish species, Puntius sophore, Glossogobius giuris, Mystus tengra, Macrognathus aculeatus and Channa Punctatus together with water and soil were
sampled for six months and analyzed for toxic metal concentrations via atomic absorption spectrophotometry. In water,
the average DO concentration was always found below the acceptable limit among all the points and ranged from
1.7±1.08 to 2.64±1.21 mg.L-1. The concentrations of Cu, Zn, Pb in the water were found within the permissible limit,
however the concentrations of Cd, K and Na were much higher than the permissible limit. Except for Cd, all other metals
were found within the permissible limit in the soil sediment. In fish muscle, the highest average bioaccumulation of Cu,
Zn, Mn, Pb, Cd, Na, K and As was found to be 3.65±1.04, 106.39±34.93, 27.52±11.27, 0.0016±0.002, 0.0043±0.01111,
3746±2871, 41.62±24.42 and 0.0008±0.0009 mg.Kg-1, respectively and within the permissible limit. The findings of the
present study indicate that due to discharges from industries, the water and sediment of the River Khiru are getting
polluted and water quality is deteriorated.
INTRODUCTION
The pollution from industrial effluents, urban and agricultural waste in some rivers and water bodies has reached alarming levels in Bangladesh [1]. The surface water qualities of the rivers of Bangladesh are getting highly polluting day by day [2], [3]. The long term effects of the water contamination by inorganic and organic substances, many of them toxic, are incalculable and the chemicals that enter into the food chain have public health implications [4].
The inorganic minerals like magnesium (Mg), sodium (Na), potassium (K), calcium (Ca), and heavy metals like manganese (Mn), lead (Pb),
chromium (Cr), zinc (Zn), mercury (Hg), cadmium (Cd), cobalt (Co), copper (Cu), arsenic (As) etc., when present above the permissible limit in food and water are harmful. The concentration of toxic metals in water samples indicate the situation at present, while the concentrations of the toxic metals in the soil sediment and organisms show the result of past as well as current pollution levels in the environment in which the organisms live [5].
Khiru River is situated in the Bhaluka upazila of Mymensingh, Bangladesh and receiving importance since industrialization advanced faster along the river bank for last two decades. Besides the industrial wastes, it receives pollutants from agricultural and municipal sources. Heavy metal pollution is a problem associated with areas of intensive industry. The technological problems resulting from the discharge of effluents from industries into Khiru River has been the most important pollution problem in this area [6]. High concentrations of several heavy metals have been reported in the rivers near capital city Dhaka receiving discharges from the industries [7]. Soils are the most important sink of trace elements. In this situation, it is necessary to evaluate the
presence of toxic metals and their limits in fish as well as water and sediment. This study allows us to determine the levels of heavy metals such as Cu, Cd, Zn, Mn, Pb and inorganic minerals such as K, Na and As in water, soil and fishes of the Khiru River along with some physico-chemical parameters of water. The information will be helpful to create awareness among the people and policy makers about the necessity of installing ‗Effluent Treatment Plant‘ in these industries.
MATERIALS AND METHODS
A. Study area
Khiru river of Bhaluka, Mymensingh was selected
as the study site as recent days this river is affected
by industrialization. Three sampling points (Fig. 1)
were selected depending on proximity to pollution
source, and those were: S1: at the industrial
discharge point; S2: near the bazar where the
municipal wastes are discharged; and S3: at the
area where industrial dumping is less.
B. Sample collection
Fish, water and soil samples were sampled at
15-day intervals for 6 months from December, 2008
to May, 2009. Soil samples were collected from top
20 cm of soil in polythene bags and water samples
were collected from 0.50 m below the water surface
using 500 ml HDPE bottle [8], stored in ice box,
transported to the laboratory and preserved in 4°C
until subsequent analysis. The fish samples of five
species (three individuals every month) such as
Punti (Puntius sophore), Bele (Glossogobius giuris),
Tengra (Mystus tengra), Baim (Macrognathus
aculeatus) and Taki (Channa Punctatus) were
collected from the each sampling point by netting
and were transported to the laboratory in ice box on
the same day of collection.

Proceedings of the International Conference on Environmental Aspects of Bangladesh (ICEAB 2011)
21
Fig. 1. The sampling sites at the River Khiru, Bhalika,
Mymensingh, Bangladesh
C. Sample preparation
Water samples were filtered through membrane filter and analyzed. The fish and soil sediments were prepared following the standard protocol.
Muscle samples of fishes were taken with a knife after removing the skin. The muscles were fragmented, homogenized and packed in a polyethylene wrap; stored at −20°C in order to be preserved for further analysis. Soil samples were also fragmented, homogenized and prepared in the same manner compliant with the acid digestion method. Both the fish and soil samples were digested with the mixture of nitric acid, perchloric acid and sulfuric acid (3:2:1) for 1 hr at 120°C [9]. Digested samples were then filtered with Whitman 42 filter and raised the volume to 100 ml with DW.
D. Sample Analysis
Water quality parameters, such as dissolve oxygen (DO), pH, alkalinity, ammonia-nitrogen (NH3-N), and nitrate-nitrogen (NO3-N) were analyzed using HACK kit on the same day of sampling. The concentration of toxic metals such as Cu, Zn, Cd, Pb, Mn, Na, K and As in fish, water and soil were determined by Atomic Absorption Spectrophotometer (AAS).
E. Data analysis
All the data were revealed using a two-way analysis of variance (ANOVA), the level of significance thereby being set at 5% (probability limit of P<0.05).
RESULTS AND DISCUSSIONS
A. Water quality parameters
Water quality parameters of three sampling
points are shown in the Table 1. Results showed that there were variations in water quality parameters from all the sampling points and the values indicated high level of water pollution in the site of industrial discharge area (S1) compared to
other two points. Possible factors involved in this variation may include differences in the rate of industrial and urban discharges.
Table 1. Mean concentrations (SE) of water quality
parameters from three sampling points of Khiru River
Parameters Sampling Point
S1 S2 S3
pH 8.41 ±0.64 7.78 ±0.39 7.96 ±0.54
DO (mgL-1) 1.7 ±1.07 2.65 ±1.21 2.54 ±1.43
Alkalinity (mgL-1)
269.58
±82.0
245.83
±84.5
250.67
±89.6
NH3-N (mgL-1) 3.25 ±1.53 3.29 ±1.36 3.20 ±1.50
NO3-N (mgL-1) 34.59
±17.04
47.23
±32.07
29.38
±19.08
Most favorable DO, alkalinity, NH3-N and NO3-N value for fish in river is 6.5-7.0, 20-200, <1.0 and <10.0 mgL-1, respectively and pH 6.5-9.0 [10], [11]. In the present study, the physico-chemical parameters in water were found beyond the acceptable limits; indicating the Khiru River as a polluted river. DO was found in the most crucial level; it was more than 3 to 4 times lower than the acceptable limit [11], 1.7 and 2.65 mgL-1 in high and low industrial discharge areas of Khiru River respectively that implying the river has become critical for fish to live. The NH3-N and NO3-N level of Khiru River among all the sampling points was found more than 3 times higher than the favorable limit [11], indicating that the river water is becoming unfavorable for fish and other aquatic organisms. In a similar study on water quality
parameters of an industrially polluted river of Bangladesh, Buriganga River, mean values of DO, pH and NO3-N to be 0.85 mgL-1, 7.41 and 4.12 mgL-1 during dry season were observed, similar to the current finding from Khiru River [12].
Table 2. Mean concentrations (SE) of toxic metals from three sampling points of Khiru River
Metals
(mgL-1)
Sampling Point
S1 S2 S3
Cu 0.0037 ±0.001 0.0044 ±0.003 0.0049 ±0.002
Zn 0.0061 ±0.003 0.0083 ±0.004 0.0053 ±0.002
Pb 0.0107 ±0.008 0.0226 ±0.020 0.0330 ±0.028
Cd 0.1748 ±0.340 0.1537 ±0.280 0.0542 ±0.080
Mn 0.0953 ±0.110 0.3243 ±0.490 0.0822 ±0.070
K 1.795 ±0.780 1.775 ±0.600 2.336 ±0.890
Na 4320 ±2371 3360 ±816 3347 ±1601
B. Toxic metals concentrations in water
The toxic metal concentrations in water samples are presented in the Table 2.
The concentrations of Cu, Zn, Pb in the water from Khiru River was within the permissible limit, however the concentrations of Cd, K and Na was much higher than the permissible limit [13]. Concentrations of toxic metal in the water of Buriganga River, Bangladesh were reported to be 65.45, 9.34, 8.08, 163.09 and 587.20 mg/L for Pb,

Proceedings of the International Conference on Environmental Aspects of Bangladesh (ICEAB 2011)
22
Cd, Ni, Cu and Cr, respectively; levels were much higher than the permissible limit [7]; in Cauvery River, India concentrations were found to be 0.32, 2.23, 1.12 1.25, 5.25, 10.70 and 9.95 mgL-1 for Cr, Co, Cu, Mn, Ni, Zn and Pb, respectively; some parameter found within the recommended limit and some parameters beyond the permissible limit [14].
C. Concentrations of metals in soil sediment
Analysis of soil sediment plays an important role in assessing the pollution status of the water environment.
The mean concentrations of toxic metals in soil sediments from Khiru River are presented in the Table 3. The permissible limit of Cu, Zn, Pb, and Cd are 135-270, 300-600, 250-500 and 3-6 mgKg-1, respectively according to Indian standard for soil (ISS) [13], and according to ISQGs, the maximum permissible limits are 35.7, 123.0, 35.0 and 0.6 mgKg-1, respectively for freshwater sediment [15].
Table 3. Mean concentrations (SE) of toxic metals in soil
sediments from three sampling points of Khiru River
Metals
(mgKg-1)
Sampling Point
S1 S2 S3
Cu 31.02±29.64 41.42±16.26 31.66±18.03
Zn 103.23±17.71 101.97±27.89 88.11±24.76
Pb 5.33 ±3.83 5.33±2.51 6.15±3.21
Cd 1.86 ± 1.94 2.41±2.58 1.88±1.78
Mn 29.94 ±14.56 27.07±8.93 28.67±12.98
K 28.13±21.70 32.78±22.95 42.11±14.47
Na 2277 ±1172 2954 ±1761 3352 ±1789
In the Khiru River sediment, all the toxic metals
were found within the permissible limit of ISS and ISQGs except for Cd. Cd concentration was more than 3 times higher than the ISQGs limit. The mean Cd concentration in sediment sample from Buriganga River, Bangladesh was found to be 3.33±0.77 mg/kg [7], higher than the concentration found in Khiru River sediments. The Cd concentration in sediment of Lake Qarun, Egypt was found more or less similar to present study [16]; while the same was higher in the Cauvery River, India [14] and lower in a water tank at Tamkur, India [17].
Zn concentration in the soil from Khiru River was much higher than that in the Jamuna River (68 μg/g) near Aricha, Bangladesh; on the other hand, Pb was found almost double (11 μg/g) [18]. Pb concentration in the sediment of Buriganga River, Bangladesh found much higher than the Khiru River samples [7].
The mean concentrations of Mn in the Khiru River ranged from 27.07 to 29.943 mgKg-1. Compared to the present study Mn concentration was found more than 7 to 15 times higher in the lake Qarun, Egypt [16] and about 10 times higher in the Cauvery River, India [14].
The K and Na concentration of Khiru River sediment was found much higher than the Lake Qarun, Egypt [16] may be due to discharge of more potassium and sodium industrial effluent into the Khiru River.
D. Concentrations of metals in fish muscle
Discharge of heavy metals into river or any aquatic environment can change both aquatic species diversity and ecosystems, due to their toxicity and accumulative behavior [19]. Fish can take up trace metals and heavy metals either in their diet or through their gills [20] and the metal accumulation in fish organs provide evidence of exposure to contaminated aquatic environment [21]. The Khiru River receives huge effluents from the industries along its banks and intensively cultivated paddy fields along with an enormous sediment loading into the river. The mean concentrations of toxic metals investigated in fish samples from the Khiru River are presented in the Table 4.
Table 4. Mean concentrations (SE) of metals in fish muscle samples from Khiru River.
Metals
(mgKg-1) Punti Bele Tengra Baim Taki
Cu 3.65
±1.04
2.95
±0.94
3.23
±1.37
2.82
±0.55
3.46
±0.85
Zn 91.00
±17.87
95.06
±28.78
106.39
±34.93
95.42
±31.08
86.96
±35.20
Pb 0.0016
±0.0022
0.0011
±0.0016
0.0002
±0.0005
0.0010
±0.0013
0.0012
± 0.0023
Cd 0.0031
±0.0068
0.0038
±0.0096
0.0039
±0.0067
0.0043
±0.0111
0.0012
±0.0018
Mn 22.64
±18.10
22.95
±14.98
24.52
±12.80
27.52
±11.26
17.43
± 10.44
K 35.01
±18.17
33.80
±18.40
33.85
±14.01
41.62
±24.42
39.22
±7.38
Na 3335
±2399
2995
±2281
2693
±2393
3746
±2871
3103
± 1602
As 0.0008
±0.0009
0.0006
±0.0007
0.0001
±0.0003
0.0004
±0.001
0.0004
±0.0007
Cu is a biogenic element, necessary for supporting the metabolic processes of all organisms and essential for the haemoglobin synthesis [22], however high intake of Cu can cause adverse health problems. In the present study, the highest Cu concentration was found in puti (3.655±1.04 mgKg-1) and the lowest in Baim (2.82±0.55 mgKg-1). In a heavily polluted river of Bangladesh, Buriganga River [7], highest Cu was found in taki (Channa punctata; 5.27 mg/kg) and lowest in chapila (Gudusia chapra; 4.25 mg/kg) in pre-monsoon fish samples. Relatively lower Cu concentration was reported on the salmonid fishes of Una River basin [23], Labeo rohita of Upper Lake in Bhupal, India [24]. On the contrary, high bioaccumulation of Cu was reported in Calrias lazera of northern Jordan Velly [25].
Zn is the essential mineral for both animals and humans. It showed a protective effect against the Cd and Pb toxicity [26]. The order of accumulation of Zn in fish samples from Khiru River was Tengra > Baim > Bele > Punti > Taki. Marked concentrations of Zn were detected in the tissues of fishes dwelling in the Khiru River; varied from 58.31 to 128.32 mgKg-1 which was higher than the threshold values
given by FAO [27], indicating Khiru River as unfavorable for fish and other aquatic life. Similar

Proceedings of the International Conference on Environmental Aspects of Bangladesh (ICEAB 2011)
23
result was observed in the fish samples from Campaign Creek stream, USA [28], northern Jordan valley, Jordan [25]. Relatively lower Zn accumulation was found in Labeo rohita from Upper Lake, Bhupal, India [24].
Pb is a toxic element which has no known biological function and shows carcinogenic effect on aquatic biota and human [21]. The order of bioaccumulation of Pb in fish samples from Khiru River was Punti > Taki > Bele > Baim > Tengra, and concentration varied from 0.0002 to 0.0016 mgKg-1 among the samples which were within the FAO recommendation limits [27]. However, much higher Pb concentrations were detected in the fishes from Buriganga River, Bangladesh [7], as much as 12.32 mg/Kg in pre-monsoon samples of tengra (M. vittatus); fishes of Upper lake, Bhopal, India [24]; River Chenab, Pakistan [21].
Cd is rarely found in natural water [29] and 0.50 mgKg-1 Cd in food is safe for human consumption [26]. The Cd concentration detected in the fishes of Khiru River is well below the recommended value. The sequence of bioaccumulation of Cd in the fish samples was Baim > Tengr > Bele > Punti > Taki, ranging from 0.0012 to 0.0043 mgKg-1. Much higher Cd was recorded in fishes of Buriganga River, Bangladesh [7], fishes of Lake Qarun, Egypt [13], Labeo rohita and Chirhinus Idella of Upper Lake, Bhupal, India [24], fishes of the River Chenab,
Pakistan [21], and salmonid fishes of Una River basin, Bosnia and Herzegovina [23].
Highest accumulation of Mn was detected in Baim (27.526 mgKg-1) and the lowest was occurred in taki (17.434 mgKg-1). The order of bioaccumulation of Mn in tested fishes was Baim > Tengra > Bele > Punti > Taki. Relatively higher concentration of Mn was detected in salmonid fishes of Una River basin [23].
The order of bioaccumulation of K in tested fishes was Baim > Taki > Punti > Tengra > Bele. The mean K concentrations ranged from 33.80 to 49.73 mgKg-1. Relatively lower K concentration was recorded in fishes of Lake Qarun, Egypt [16] and the Una River basin, Bosnia and Herzegovina [23].
The acceptable limits of As for consumption is 0.01 mgKg-1 [30]. In the presented study, very lower amount of As was found in the fishes and within the safe limits.
The order of metal accumulation in six fish muscles from Khiru River was Zn > K > Mn > Cu > Cd > Pb > As. As a whole, concentrations of all the metals in fish samples were well within the maximum permissible limit by FAO [27].
CONCLUSION
In the present study, the physico-chemical factors in the water of Khiru River were found beyond the acceptable limit for fish that indicated the Khiru River as a polluted river. DO was in most critical state, always recorded below the acceptable range among all the sampling points. DO, being the most important parameter of water for survival, distribution and growth of fish, indicates a state of unfavorable, unhealthy and polluted environment of Khiru River due to discharges from industrial sources.
While bioaccumulation of metals were within the permissible limit in fish muscle, the concentration of one heavy metal, Cd, was found beyond permissible limit both in water and soil sediment. The high concentration of Cd in water and soil of Khiru River may have been associated with the presence of glass, ceramic metal industries along the river bank.
Bangladesh depends on its river system for fishery, agriculture, navigation and sanitation. Therefore, proper management and maintenance of river is very important not just because of their crucial role in maintaining ecological balance but to increase fisheries production as well as to provide livelihood for the poor people of Bangladesh. The findings of the present study indicate that the water and sediment of Khiru River are polluted mainly by the discharges from industrial sources. A good monitoring and law enforcement on the industries regarding proper effluent treatment is necessary for preserving the environment of the rivers of Bangladesh including the River Khiru.
ACKNOWLEDGEMENT
Professor Md. Shahidur Rahman, Department of Fisheries Management, Bangladesh Agricultural University, Mymensingh for kind help in analyzing water quality parameters and the fishermen along the bank of the Khiru River for supplying with fish samples.
REFERENCES
[1] DoE. 2001. Warer Quality Data of Rivers Buriganga,
Meghna, Balu, Shitalakhya, Jamuna. Department of
Environment, Dhaka, Bangladesh
[2] DoE. 1992. Annual Report, Department of
Environment, Dhaka, Bangladesh, pp. 25.
[3] JB Alam, A Hossain, SK Khan, BK Banik, MR Islam, Z
Muyen and MH Rahman. 2007. Deterioration of water
quality of Surma River. Environmental Monitoring and Assesment, 134: 233-242.
[4] AU Ahmed and M Reazuddin. 2000. Industrial
pollution of water systems in Bangladesh. In: A.A.
Rahman, S. Huq and G.R. Conway (ed),
Environmental system of surface water systems of
Bangladesh, University Press Limited, Bangladesh,
pp 175-178.
[5] RC Ravera, M Beone, M Dantas, and P Lodigiani.
2003. Trace element concentrations in freshwater
mussels and macrophytes as related to those in their
environment. J. Limnol., 62(1): 61-70.
[6] Anonymous. 2009. Baseline survey and interview of
the local people lived near the Khiru River, Bhaluka,
Bangladesh.
[7] MK Ahmed, S Islam, S Rahman, MR Haque and MM
Islam. 2010. Heavy metals in water, sediment and
some fishes of Buriganga River, Bangladesh. Int. J.
Environ. Res., 4(2): 321-332.
[8] APHA. 1998. American public health association
―APHA‖. Standard methods for the examination of
water and wastewater. 20th ed. Washington D.C., USA,
694pp.
[9] AOAC. 2000. Official methods of analysis of. AOAC
International. Official method 937.07, fish and
marine products (17th ed.), Gaithersburg, MD:AOAC.
[10] USEPA (United States Environmental Protection
Agency). 2006. National Recommended Water Quality
Criteria. Office of Water, Office of Science and
Technology (4304T).

Proceedings of the International Conference on Environmental Aspects of Bangladesh (ICEAB 2011)
24
[11] PALMS. 2011. Water Quality Parameters: A fact sheet
of the Pennsylvania Lake Management Society
(PALMS). [Online] 2002, Available:
http://www.palakes.org/publications/wq_parameter
s.pdf , [Accessed 17 May 2011]
[12] MA Rahman and DA Bakri. 2010. A Study on Selected
Water Quality Parameters along the River Buriganga,
Bangladesh. Iranica Journal of Energy & Environment. 1(2): 81-92.
[13] SK Awasthi. 2000. Prevention of Food Adulteration
Act. No. 37 of 1954, Central and state rules as
amended for 1999. Ashoka Law House, New Delhi,
India.
[14] A Begum, M Ramaiah, HI Khan and K Veena. 2009.
Heavy metal pollution and chemical profile of Cauvery
River Water. E-J. Chem., 6(1): 47-52
[15] Canadian Council of Ministers of the Environment.
2002. Canadian sediment quality guidelines for the
protection of aquatic life: Summary tables. Updated
In: Canadian environmental quality guidelines, 1999,
Canadian Council of Ministers of the Environment,
Winninpeg.
[16] MHH Ali and MRA Fishar. 2005. Accumulation of
trace metals in some benthic Invertebrate and fish
species relevant to their concentration in water and
Sediment of Lake Qarun, Egypt. Egypt. J. Aqua. Res., 31(1): 289-301.
[17] BM Sreedhara Nayaka, S Ramakrishna, Jayaprakash
and MR Delvi. 2009. Impact of heavy metals on water,
fish (Cyprinus carpio) and sediments from a water
tank at Tumkur, India. Oceanol. Hydrobiol. Stud., XXXVIII (2): 17-28.
[18] R Ramesh, AL Ramanathan, S Ramesh, R Purvaja1
and V Subramanian. 2000. Distribution of rare earth
elements and heavy metals in the surficial sediments
of the Himalayan river system. Geochemical Journal,
34: 295-319.
[19] AG Heath. 1978. Water pollution and Fish physiology.
CRC press, Florida, USA, pp 245.
[20] R Dallinger, Prosi, H Segner and H Black. 1987.
Contaminated food and uptake of heavy metals by
fish. A review proposal for further research. Oecologia, 73: 91-98.
[21] A Qadir and RN Malik. 2011. Heavy metals in eight
edible fish species from two polluted tributaries (Aik
and Palkhu) of the River Chenab, Pakistan. Biol. Trace Elem. Re.s, DOI: 10.1007/ s12011-011-9011-3.
[22] P Sivaperumal, TV Sankar and PG Nair Viswanathan.
2007. Heavy metals concentrations in fish, shellfish
and fish products from internal markets of India
vis-à-vis international standards. Food Chemistry,
102: 612-620.
[23] A Vildana, N Vahčić and M Bajramović. 2007.
Bioaccumulation of metals in fish of salmonidae
family and the impact on fish meat quality. Env. Monitor. Assess., 131(1-3): 349–364.
[24] N Malik, AK Biswas, TA Qureshi, K Borana and R
Virha. 2010. Bioaccumulation of heavy metals in fish
tissues of a freshwater lake of Bhopal. Environ Monit Assess, 160: 267–276.
[25] SM Al-Weher. 2008. Levels of heavy metal Cd, Cu and
Zn in three fish species collected from the Northern
Jordan Valley, Jordan. Jor. J. Bio. Sci., 1(1): 41-46.
[26] HH Sanstead. 1976. Interaction of cadmium and lead
with essential minerals. In: GF Nordberg (Ed.), Effects
and dose-response relationships of toxic metals.
pp.511-525.
[27] FAO (Food and Agricultural Organization). 1983.
Compilation of legal limits of hazardous substance in
fish and fishery products. FAO fishery circular, no.
464, pp.5-100.
[28] RJ Reash, TW Lohner and KV Wood. 2006. Selenium
and other trace metals in fish inhabiting a fly ash
stream: Implications for regulatory tissue thresholds.
Env. Poll., 142: 397-408.
[29] JD Hem. 1989. Study and interpretation of the
chemical characteristics of natural water. U.S.
Geological Survey, Water Supply, pp.2254.
[30] EO Farombi, OA Adelowo and YR Ajimoko. 2007.
Biomarkers of oxidative stress and heavy metal levels
as indicator of environmental pollution in African cat
fish (Clarias gariepinus) from Nigeria Ogum River. Int. J. Env. Res. Pub. Health., 4(2): 158-165.

Proceedings of the International Conference on Environmental Aspects of Bangladesh (ICEAB 2011)
25
A1.005
Effect of Groundwater Irrigation and Fertilizers Application on the Arsenic Contamination of Farmland Soil and Rice Grain
Md. Shamim Uddin1* and Kiyoshi Kurosawa2
1Graduate School of Social and Cultural Studies, Kyushu University, Fukuoka, 819-0395, Japan. 2Institute of Tropical Agriculture, Kyushu University, 812-8581, Fukuoka, Japan
*Corresponding author: e-mail: [email protected]
Abstract To clarify the effect of groundwater irrigation and the fertilizers application on the arsenic (As) contamination of
farmland soil and rice grain, the irrigation water, farmland soil, rice grain, the chemical fertilizer containing phosphate
and organic fertilizer were sampled from a farming village in south-western Bangladesh. And then their As
concentrations were measured, and the relationships between the concentrations of the samples were examined. The
As concentration of irrigation water was positively correlated with those of farmland soil and rice grain. High As
concentrations were observed in the chemical fertilizer and organic fertilizer, which could contaminate the farmland
soil and rice grain by As. The effect of groundwater irrigation and the fertilizers application on the As contamination of
the rice grain was identified.
INTRODUCTION
Groundwater As contamination is a severe environmental problem, and a nationwide health hazard in Bangladesh. The present study was conducted in Samta village, one of the most severely As contaminated area in Bangladesh. In the village, 87% of tube well water exceeded the As concentration of Bangladeshi drinking water
standard (50 µg/L), and 153 people were suffering
from arsenical skin lesions [1]. In addition to the use of groundwater for domestic
purposes, a significant amount of the groundwater is used for irrigation purposes during dry season to grow rice in dry season, which requires about 1 m deep of irrigation water [2]. About 86% of total groundwater in amount is utilized for crop planting. To meet the food demands for increasing population in Bangladesh, the number of cropping season has been expanded from one to several times per year, to which the government subsidized chemical fertilizers to raise the crop productivity. With the intensification of crop planting, a large amount of groundwater has become to be used, because the rainfall amount available to the cropping during the dry season is limited. At the same time, a great deal of chemical fertilizers and organic compost (as an organic fertilizer) has been applied, which may affect As contamination in farmland soil.
As described later, chemical fertilizers containing phosphate and organic fertilizer, which are commonly used in Bangladesh, contain a high amount of As. Use of groundwater for irrigation and fertilizers may cause the As contamination in farmland soil and rice grain planted there. Roberts et al. (2007) estimated that more than 1,000 tons of As was transferred annually from groundwater to arable land by the groundwater irrigation, which poses a potential risk for future food production [3]. Numerous studies have been done on the As concentrations of groundwater, soils and crops in Bangladesh as introduced by Heikens (2006) [4]. Some other studies focused on the relationship between groundwater-soil-crop [5], groundwater-soil [6, 7], soil-rice [8] in the paddy fields. Heikens et al. (2007) stated that soil As concentration increased with years due to the
development of irrigation [9]. The growth of rice plants seemed to be affected negatively by the amount of As in soil, and the As damaged the roots of the rice plants, resulting to obstruct the uptake of nutrients by roots [10]. Therefore, the As concentration of the grain of rice plant, is of a great concern.
In the present study, the effect of irrigation by As contaminated groundwater, and that of application of chemical fertilizers containing phosphate and organic fertilizer on the As contamination of farmland soil and rice grain were examined, by focusing the following points: (i) how the As concentration of the irrigation water is correlated with those of rice grain and farmland soil, and (ii) how high the As concentrations of the chemical fertilizers containing phosphate and organic fertilizer is, and (iii) whether there is an effect of As concentration of irrigation water and application of fertilizers on the As concentration of rice grain or not, respectively.
MATERIALS AND METHODS
A. Study area
The study area is Samta village in Sharsha upazila (meaning sub-district), Jessore district in southwestern Bangladesh. The area belongs to the high Ganges river floodplain in the agro-ecological zoning of Bangladesh [11]. Groundwater is the main source for drinking, cooking and other household use purposes in the area. The soil in the area is calcareous dark grey/brown floodplain soil with low fertility [12]. According to meteorological data recorded at Jessore city from 1996-2003, the mean annual rainfall was 1,697 mm, the mean annual maximum and minimum temperatures were 33°C and 17°C, and the mean annual relative humidity was 80% [12]. Here the groundwater is used for domestic and agricultural purposes and a great deal of chemical fertilizer is used for crop and vegetable cultivation in the study area. Although the amount of fertilizers applied was not available for the study area, the national average rate of chemical phosphate fertilizer application for rice planting is 15 kg/ha [13].

Proceedings of the International Conference on Environmental Aspects of Bangladesh (ICEAB 2011)
26
B. Sampling of irrigation water, farmland soil, rice grain, chemical fertilizers containing phosphate and organic fertilizer
The irrigation water (groundwater) was collected
in polyethylene bottles and acidified for the As
analysis. The depths of the irrigation wells were
determined based on interviews with the local
people. The soils were collected from the surface of
the farmland. Rice grains were collected after its
harvest, the chemical fertilizers were bought at a
shop at Jamtala Bazar, neighboring to Samta
village, and organic fertilizer was collected from a
farmer household in Samta village. The collection
was done in March-April, 2010 at the beginning of
the dry season, and the collected samples were
brought to Japan for the analysis.
C. As measurement of irrigation water, farmland soil, chemical fertilizers, organic fertilizer and rice grain
The As concentration of irrigation water was
measured by inductively coupled plasma mass
spectroscopy (ICP-MS) (Agilent 7500 series, Agilent
Technologies) at Kyushu University. The farmland
soil and organic fertilizer were air-dried at room
temperature for 3 to 4 days and then ground to a
fine powder with a mortar. The soil, rice grain,
chemical fertilizers and organic fertilizer were first
digested using the USEPA 3050B method [14], and
then the digested solutions were analyzed using
ICP-MS as noted above.
RESULTS AND DISCUSSIONS
A. Depth of irrigation well, As concentration of irrigation water, farmland soil, and rice grain
Table 1 shows the depth of irrigation well, As
concentrations of irrigation water, farmland soil
and rice grain collected from the study area. The
depth of the irrigation well ranged from 34 m to 91
m. The As concentration of irrigation water ranged
from 22 µg/l to 202 µg/l, where 11 samples
exceeded the Bangladeshi drinking water standard
for As of <50 µg/l. The As concentration of the
farmland soil ranged from 4 to 153 mg/kg and that
of rice grain did from 0.11 to 0.62 mg/kg,
respectively.
B. Relationship of As concentration between irrigation water and rice grain
Fig. 1 shows the relationship of As concentration
between irrigation water and rice grain. Here, the As
concentration of rice grain appeared to increase
with the increase in the As concentration of
irrigation water. It shows that the As concentration
of rice grain was positively affected by As
concentration of irrigation water. However, the As
concentration in rice grain was below 1mg/kg of
allowable limit.
C. Relationship of As concentration between irrigation water and farmland soil
The relationship of As concentration between irrigation water and farmland soil is shown in Fig. 2. Here, as the As concentration of irrigation water increases, the As concentration of farmland soil
increase, showing that the As concentration of farmland soil is positively affected by the As concentration of irrigation water. In Bangladesh, excessive withdrawal of groundwater table by the use of groundwater for irrigation resulted in elevated As concentration of surface soils of farmland [15]. This may also lead to the elevated As concentration of rice grain planted the farmland. The positive correlation of the As concentration between the plants and the soil was also reported by another researcher [16].
Table 1. The depth of the irrigation well and As
concentrations of irrigation water, farmland soil and rice grain collected from Samta village
Sl.
No
Caretaker
Depth
of
the
Irri
gati
on
Wells (m
)
As in
Irr
igati
on
Well
Wate
r (µ
g/l)
As in
Farm
lan
d S
oil
(mg/K
g)
As in
Ric
e G
rain
(mg/K
g)
1 Dr. Abdul Jolil 76 114 19 0.15
2 Usman 76 122 16 0.26
3 Habib 76 128 79 0.35
4 Bozlur Rahman 76 150 20 0.62
5 Jakir Hossain 76 202 153 0.37
6 Mosaref 76 104 14 0.12
7 Azit Biswas 34 22 7 0.11
8 Lutfor Rahman 91 50 17 0.13
9 Akbor Ali 91 70 71 0.25
10 Monir 88 116 24 0.37
11 Hamid 76 96 15 0.22
12 Toibur Rahman 76 106 36 0.21
13 Saidul 91 154 23 0.19
14 Nobisuddin 91 36 7 0.17
15 Abdur Rasid 37 22 4 0.18
Table 2. As concentrations of the chemical fertilizers and
organic fertilizer.
Name of Fertilizer As (mg/kg)
Nitrogen-Phosphorus-Potasium (NPK) 27.7
Phophorus Pentoxide (P2O5) 33.3
Gypsum (CaSO4.2H2O) 0.3
Urea (H2N-CO-NH2) BDL
Magnesium Sulphate (MgSO4) BDL
Potasium Pentoxide (K2O5) 0.1
Organic Fertilizer 6.8
* BDL= Below Detection Level
D. As concentration of chemical fertilizers containing phosphate and organic fertilizer
Table 2 shows the As concentration of the chemical fertilizer containing phosphate of NPK compound fertilizer, P2O5 fertilizer, and organic fertilizer. The As concentration of NPK compound,
HG (c)

Proceedings of the International Conference on Environmental Aspects of Bangladesh (ICEAB 2011)
27
P2O5 fertilizers and organic fertilizer were 27.7, 33.3 and 6.8mg/kg, respectively. In addition, As concentration of gypsum, K2O5, urea and magnesium sulfate fertilizers were measured, and these were shown in Table 2. The concentration of As of gypsum and K2O5 fertilizer was very low (<1mg/kg), and that of urea and magnesium sulfate was below the detection level, respectively.
Fig. 1. Relationship of As concentration between
irrigation water and rice grain
Fig. 2. Relationship of As concentration between
irrigation water and farmland soil
The cause of the high As concentration found in the chemical fertilizers containing phosphate is that the fertilizer is produced from phosphate rocks that contained As originally. On the other hand, cow dung is used for making organic fertilizer. In the study area, cows eat As contaminated straws, grasses and drink As contaminated water, resulting to a high As concentration in organic fertilizer. The use of these As contaminated fertilizers and organic fertilizer could increase the As concentration in farmland soil. It is considered that a certain amount of As can be uptake by rice plants following to the application of As contaminated fertilizers and organic fertilizer into the farmland
CONCLUSION
The following conclusions were drawn from the present study. The As concentration of irrigation water had a positive correlation with the As concentrations of farmland soil and rice grain. A high As concentration was found in the chemical fertilizers containing phosphate and organic fertilizer, both of which are used in rice planting. Thus, the irrigation of groundwater, and application of chemical fertilizers and organic fertilizer are contaminating farmland soil and then rice grain by As. This fact poses a threat to rice production in the area. Although the As concentration of rice grain was below 1mg/kg of allowable limit, the rice grain contamination cannot be ignored, because Bangladeshi people consumes a large quantity of rice every day. The pathway of As contamination from irrigation water to rice grain is shown in Fig. 3. It cannot be clarified at this time that how highly groundwater irrigation and fertilizers application respectively contribute to the As contamination of farmland soil and rice grain, and further study is necessary.
Fig. 3. Flowchart of pathway of As contamination
from irrigation water to rice grain
ACKNOWLEDGEMENT
We acknowledge to Mr. Kamruzzaman, Samta Young Committee for his assistance during field data and samples collection in Samta village.
REFERENCES
[1] ICA/AAN. 2004. Final Report: Integrated approach
for mitigation of arsenic contamination of drinking
water in Bangladesh, arsenic mitigation project in
Sharsha upazila, Jessore, Bangladesh. Asia Arsenic
Network, Bangladesh.
[2] M Hossain, D Lewis, M Bose, A Chowdhury. 2003.
Rice Research: Technological Progress and Impacts
on the Poor: The Bangladesh Case (summary report),
International Food Policy Research Institute (IFPRI).
[3] LC Roberts, SJ Hug, J Dittmar, A Voegelin, GC Saha,
MA Ali, ABM. Badruzzaman, R Kretzschmar. 2007.
Spatial distribution and temporal variability of
arsenic in irrigated rice fields in Bangladesh. Sci. Technol., 41: 5960–5966.
[4] A Heikens. 2006. Arsenic contamination of irrigation
water, soil and crops in Bangladesh: risk implications
for sustainable agriculture and food safety in Asia.
FAO Regional Office for Asia and Pacific, Bangkok,
Thiland.
[5] K Kurosawa, K Egashira, M Tani, M Jahiruddin, AZM
Moslehuddin, ZM Rahman. 2008. Groundwater-soil-
crop relationship with respect to arsenic
0
50
100
150
200
250
0.00 0.15 0.30 0.45 0.60 0.75
As in Rice Grain (mg/kg)
As
in I
rrig
ati
on
Wate
r (µ
g/l
)
0
75
150
225
0 40 80 120 160
As in Farmland Soil (mg/kg)
As
in I
rrig
ati
on
Wate
r (µ
g/l
)

Proceedings of the International Conference on Environmental Aspects of Bangladesh (ICEAB 2011)
28
contamination in farming villages of Bangladesh - a
preliminary study. J. of Environmental Pollution, 156:
563-565.
[6] M Jahiruddin, H Harada, T Hatanaka, MR Islam.
2000. Trace element status in agricultural soils and
factors affecting their concentration. Soil Sci. Plant
Nutr., 46(4): 963-968.
[7] MM Ali, H Ishiga, T Wakatsuki. 2003. Influence of soil
type and properties on distribution and changes in
arsenic contents of different paddy soils in
Bangladesh. Soil Sci. Plant Nutr., 49(1): 111-123.
[8] I Chaturvedi. 2006. Effects of arsenic concentrations
on growth and arsenic uptake and accumulation by
rice (Oryza sativa) genotypes. Electron. J. Environ. Agric. Food Chem., 5(5): 1546-1552.
[9] A Heikens, GM Panaullah, AA Meharg. 2007. Arsenic
behavior from groundwater and soil to crops: impacts
on agriculture and food safety. Rev. Environ. Contam. Toxicol., 189: 43–87.
[10] MJ Abedin, MS Cresser, AA Meharg, J Feldmann, J
Cotter-Howells. 2002. Arsenic accumulation and
metabolism in rice (Oryza sativa L.). Environ. Sci Technol., 36: 962– 8.
[11] UNDP/FAO. 1988. Agroecological regions of Bangladesh
(Technical report 2, Project BDG/81/035) Rome,
Italy: FAO.
[12] 12. Bangladesh Bureau of Statistics, Compendium of
environment statistics of Bangladesh, Dhaka:
Bangladesh Bureau of Statistics, Ministry of Planning,
Government of the People‘s Republic of Bangladesh.
2004.
[13] FAO (Food and Agriculture Organization of the United
Nations). Plant Production and Protection Division,
Fertilizer Use Statistics.
[14] USEPA. 1996. Test methods for evaluating solid
waste, SW846, 3rd edition. USEPA, Washington, DC.
[15] AA Meharg and MM Rahman. Arsenic contamination
of Bangladesh paddy field soils: implications for rice
contribution to arsenic consumption. Environ Sci Technol, 37: 229–34.
[16] I. Chaturvedi. 2006. Effect of arsenic concentrations
on growth and arsenic uptake and accumulation by
rice genotypes. Electron. J. Agric. Food Chem., 5(5):
1546.

Proceedings of the International Conference on Environmental Aspects of Bangladesh (ICEAB 2011)
29
A1.006
Application of Kumbucha Biomass for Removing of Arsenic from Water and an Aqueous Environment
S Mamisaheby and GhR Jahed Khaniki
Department of Environmental Health Engineering, School of Public Health and Public Health Research
Institute, Medical Sciences, University of Tehran, Iran.
Abstract Arsenic contamination in water poses a serious threat on human health. The tea fungus known as Kombucha is a waste
produced during black tea fermentation. The objective of this study was to examine the main aspect of a possible
strategy for the removal of arsenates employing tea fungal biomass. The pre-treatment of biomass with FeCl3 was
found to improve the biosorption efficiency. Arsenics uptake was found to be rapid for all concentrations and reached to
79% of equilibrium capacity of biosorption in 20 min and reached equilibrium in 90 min. The pseudo second-order and
first-order models described the biosorption kinetics of As (V) with good correlation coefficient (R2>0.93) and better than
the other equations. The data obtained from the experiment of biosorption isotherm were analyzed using the Freundlich
and Langmuir isotherm models . The equation described the isotherm of As (V) biosorption with relatively high
correlation coefficient (R2>0.93). According to the Langmuir model, the maximum uptake capacities (qm) of tea fungal
biomass for As (V) were obtained 3.98×10⁻³ mmol/gr. The effect of Na+, K+, Mg+2 and Ca+2 on equilibrium capacities of
As was not significant. The variation of sorption efficiency with pH showed that optimum biosorption takes place in the
pH ranges of 6 to 8. Promising results were obtained in laboratory experiments and effective As (V) removals were
observed.
INTRODUCTION
Arsenic is causing a global mass poisoning, with thousands of people having developed cancers, skin lesions and other symptoms. In fact, already many people have died and hundreds of millions are now thought to be at serious risk in countries throughout the world such as Bangladesh, India, China, Canada, Kurdistan of Iran, Argentina and USA [1]. Estimates put the number of people poisoned by arsenic in regions of Bangladesh and eastern India alone close to 70 million, perhaps the largest poisoning in the world‘s history [2] Apart from arsenic originating from natural sources; it is also found in certain types of industrial effluents [3]. One of the main causes of this widespread arsenic poisoning is the growing current trend around the world of drinking water from underground sources, in an attempt to replace heavily polluted surface water supply.
US Environmental Protection Agency(EPA) as well as European Commission has set the Arsenic standard for drinking water at 10 μg/L from an
earlier value of 50 μg/L, to protect consumers served by public water systems from the effects of long-term, chronic exposure to the element. In the USA Water systems were forced to comply with this standard by 23 January 2006, providing additional protection to an estimated 13 million Americans.
At the present time, there appears to be no cost- effective method for the in situ cleanup of arsenic- contaminated soils and groundwater. Besides, the physicochemical technologies currently used for the ex situ cleanup of arsenic contaminated water (groundwater, drinking water, industrial wastewater, and so on), i.e., chemical precipitation, activated alumina, reverse osmosis, etc. have significant drawbacks such as, among others, high cost, generation of high volumes of toxic sludge and brine, and low water recovery. Biological materials represent a potential source of abundant, low-cost adsorbents. During the last decades, the use of biosorbents has become interesting due to high adsorption capacities, low costs and regenerability of the sorbent [4].
MATERIALS AND METHODS
A. Biosorbent preparation
The tea fungal mat was washed with an adequate
amount of deionized water until free media
components. The washed fungal mat was dried at
75oC for 24 h and the dried biomass was ground in
a laboratory blender. After this a portion of the dried
and ground mat was immersed in FeCl3 Solution
(15mg/L) for 60 min. These tow modified fungal mat
were then tested for its efficacy to remove As (V)
from an aqueous solution.
B. Chemicals
Synthetic solutions were prepared by the using of
deionized water and salts includes NaCl, KCl, MgCl2
and CaCl2 (Merck supplied). Initial pH of solutions
was adjusted with electrical pH meter (CAMLAB Lts,
Model CG 842) to the desired values by using 0.1 to
1 mol/L HCl and 0.1 to 1 mol/L NaOH.
C. Biosorption isotherm
Biosorption isotherm experiments were
conducted in a single-component system. The
initial As (V) concentration was 1mg/L and
biosorbent doses Varied from 0.1 to 1 g. Also, the
initial pH of solutions was adjusted to 6.
D. Effect of pH on equlibirum
The effect of pH on equilibrium capacities of As (V)
biosorption was studied in a single-component
system. The initial As (V) ions concentration was
1mg/L and the pH of solutions had some variations
from 2 to 9. After pH adjustment, 100mg of tea
fungus biomass was added to experiment vessels.
E. Metal analysis
The biomass was removed by filtration through
0.45 m membrane filters (Mixed cellulose esters).
Then the filtrates were analyzed for residual Arsenic
(V) concentration by ICP model AMS 100 "l-speeder".

Proceedings of the International Conference on Environmental Aspects of Bangladesh (ICEAB 2011)
30
RESULTS AND DISCUSSIONS
A. Kinetic study
The kinetic profile of As (V) biosorption by tea fungus was shown in Fig. 1 According to Fig. 1, As (V) uptake was relatively fast for all concentrations studied. At the initial As (V) concentration of 4 mg/L, the system reached to equilibrium within 90 min. In
general the heavy metals uptake reached to 79% equilibrium capacity of biosorption in 15 min. This rapid kinetic has significant practical importance as it will facilitate smaller reactor volumes ensuring efficiency and economy. Similar rapid metal uptake has been reported for the biosorption of As (V) using P.chrysogenum where in the system reached over 60-70% equilibrium uptake capacity in 10 min [5].The biosorption of As (V) by Kombucha biomass was similar and 67% of the total uptake occurred in 70 min (Murugesan et al., 2006). In present study,the pseudo first-order, pseudo second-order and saturation rate equations described the biosorption Kinetic of As (V) with good correlation coefficient (R2> 0.93). Kinetic analysis of As (V) biosorption by pretreated waste tea fungal biomass represented that the pseudo first-order rate equation described the biosorption Kinetic better than rest [6]. The rate constant of the pseudo second-order rate equation for As(V) biosorption were obtained 10.38, 1.26 and 1.14 g/mmol/min at the initial As(V) concentrations of 1, 2 and 4 mg/L, respectively. An increase in initial concentration of As(V) led to an decrease in the rate constant value. Therefore there was not a direct relationship between initial concentration of As(V) and the rate of As(V) biosorption by tea fungal biomass. In other hand, the biosorption of As (V) tea fungal biomass was slower in high initial metal ion concentration.
Fig. 1. Kinetic profile of As (V) biosorption by tea
fungus biomass
Analysis of equilibrium data is important for developing an equation that can be used for design purposes. Several isotherm equations have been used for the equilibrium modeling of biosorption systems [7].In this study, Langmuir and Freundlich isotherms have been applied. For each isotherm .The initial As (V) concentrations was kept constant whereas the biomass concentration were varied between 0.1-1 mg in each container with 0.1L volume. The Longmuir isotherms of modified biomass are presented in Fig. 3. The Langmuir
equation described the isotherm As (V) biosorption by tea fungal biomass with high correlation coefficient (R2>0.99). It was better than the Frundlich model (R2> 0.95). According to Langmuir equation the maximum capacities of As (V) biosorption (qm) were obtained 3.98×10⁻³ (mmol/gr). The Langmuir parameters of qm (maximum uptake capacity) is a suitable measure by comparing different sorbents for the some sorbate. Although due to the various experimental conditions employed in different studies, comparison of their results is difficult.
Fig. 2. Effect of pH on equilibrium capacities of As (V)
biosorption by tea fungus
Fig. 3. Isotherm analysis of As (V) biosorption by linear
plots of (a) Freundlich and (b) the Langmuir models.
B. Effect of pH on biosorption
The effect of pH on As (V) removal is shown in Fig. 4. In general it can be seen that As (V) the pH Values were decreased. The effect of pH on As (V) biosorption was studied in the initial pH range from 2 to 9. The optimum initial pH Values for As (V) biosorption were determined as 6 to 8. The sharpest increase in As (V) uptake was obtained between pH 3 and 5. Measurement of final pH represented the simultaneous release of H+ with the uptake arsenic ions, because final pH of solutions was less than initial pH of solutions. Therefore ion exchange confirmed to be one of the biosorption mechanisms. The relative distribution of dissolved arsenic is influenced by pH and the redox conditions. Under mildly reducing conditions and at pH 6 and 9 As (V) exists predominantly as H2A2so4- is likely to form a complex with iron oxide-coated biomass. At higher pH, OH ions in the solution can be increase competes with the arsenate ions and so adsorption of As (V) reduced [8].
HG (c)

Proceedings of the International Conference on Environmental Aspects of Bangladesh (ICEAB 2011)
31
C. Effect of background ions
Ionic species such as Ca2+, Mg2+, Na+ and K+ are usually present in drinking water and ground water contaminated with arsenic (9). Batch equilibrium experiments were conducted to evaluate the influence of Ca2+, Mg2+, Na+ and K+ on As (V) Removal by pretreated tea fungal biomass. As (V) removal obtained from experiments with Ci=1mg/L and several initial concentrations of Ca2+, Mg2+, Na+ and K+ displays in Fig.5. Within the initial concentration range of 50-100 mg/L, K+ , Ca2+ and Mg2+ had effect on As (V) removal by about 4-10% increasing the initial concentrations of background ions to 500 mg/L caused decrease on as removal only in Ca2+, and Mg2+, Na+ had no noticeable effect on As (V) removal by tea fungal biomass.
CONCLUSION
Biosorption of heavy metals is one of the promising technologies involved in the removal of heavy metals from industrial waste streams and natural waters. It could be considered as an eco-friendly device to the existing relatively higher cost treatment technologies. Generally, biosorptive processes can reduce capital costs, operational costs and total treatment costs, when compared with conventional systems.
Arsenate biosorption by kumbucha was strongly affected by the solution pH. Among the examined
pH values, pH 71 represented the optimum for arsenic uptake. The efficiency of kumbucha for the removal of arsenic (v) with 79.00% removal has been successfully evaluated.
REFERENCES
[1] D Chakraborti, A Hussam, M Alauddin. 2003.
Arsenic: environmental and health aspects with
special reference to groundwater in South Asia.
Foreword. J Environ Sci Health Part A, Toxic Hazard Substance Environ Eng, 38:xi–v.
[2] USEPA (United States Environmental Protection
Agency). 2002. Arsenic treatment technologies for
soil, waste, and water. Office of Solid Waste and
Emergency Response. EPA 542-R-02-004.
[3] HK Hansen, A Ribeiro and E Mateus. 2006.
Biosorption of arsenic (V) with Lessonia nigrescens.
Miner. Eng., 19: 486–490.
[4] WHO. 2001. Arsenic and arsenic compounds,
Environment Health Criteria (second edition). World
Health Organization (WHO). Geneva.
[5] MX Loukidou, KA Matis, AI Zouboulis and M
Liakopoulou Kyriakidou. 2003. Removal of As (V)
from wastewaters by chemically modified fungal
biomass. Water Res., 37: 4544–4552.
[6] GS Murugesan, M Sathishkumar and K
Swaminathan. 2006. Arsenic removal from
groundwater by pretreated waste tea fungal biomass.
Bioresource Technol., 97: 483-487.
[7] Y Sag and T Kutsal. 1995. Biosorption of heavy
metals by Zoogloea ramigera:use of adsorption
isothermsand a comparison of biosorption
characteristics. Biochem. Eng. J., 60:181–8.
[8] D Pokhrel and T Viraraghavan. 2006. Arsenic removal
from an aqueous solution by a modified fungal
biomass. Water Res., 40: 549-552.
[9] PL Smedley and DG Kinniburgh. 2002. A review of the
source, behavior and distribution of arsenic in
natural waters. Appl. Geochem, 17:517–68.
HG (c)

Proceedings of the International Conference on Environmental Aspects of Bangladesh (ICEAB 2011)
32
A1.007
The Relationship Between Variations of the Fish Fauna and Water Quality of the Reservoir in Taiwan
Yi-Ron Chen1 and Wen-Shang Hou2
1Department of Bio-Industrial Mechatronics Engineering, National Taiwan University, Taiwan 2Department of Bioenvironmental Systems Engineering, National Taiwan University, Taiwan
Abstract The fish fauna is in a close relation with the changes of water quality. It contains wide ranges of nutrition and is located
at the high level in aquatic food chain. Feitsui Reservoir is one of the important collection watersheds in the Northern
Taiwan. In 1988, successively biology monitored plan had been processed. There was no research between fish and
water quality until 1997 and it lasted about 3 years. The object of this study is to investigate the varieties of the fish and
the relations between fish mass and water quality to provide the strategies for the Feitsui Reservoir administrations.
The larger cyprinids have the higher correlation with chlorophyll-a in spring, summer and autumn, respectively. The
phenomenon possibly caused by feeding habits. The ecosystem maybe produced and changed gradually due to the
raising of the non-native species during 2000 to 2006. We proposed the monitoring of variation in the condition of fish
should be carried out continuously, and established the continuous, correlative information between fish and water
quality.
INTRODUCTION
Since Feitsui reservoir is the mainly supply sourcing of public water in Taiwan, the Management of reservoir is the most important issue to maintain reservoir quality. Taipei Feitsui reservoir administration establishes database of the relationship between aquatic and water quality from 1987. These aquatic include algae, zooplankton and fish. Algae have very close relationship with variations of water quality. In the factors of affecting algae growing and diversity, except the nutrient salt and the other chemical factors, aquatic play an important rule. This research is to investigate the season, water region, food habits of fish and compare to the water quality in Feitsui reservoir. The analysis resulted is expected to obtain proper water quality index of aquatic, estimate the relationship between water quality and Ecosystem health index, provide a valuable reference for protection and management of water resources and ensure promotion and safety of water quality.
LITERATURE REVIEW
Analysis of the European temperate waters in recent years to improve water quality using biomanipulation, and continuous monitoring of more than 5 years cases of 16 lakes, including four kinds of operation mode, namely, (A) carp Division and into the fish-eating fish , (B) carp removal, (C) fish-eating fish into, (D) non-selective fish removal, and make comparisons. It was shown that most cases of biological control, in practice one to two years, with the effect of improving water quality, can prove that the food chain control is indeed a way to effectively improve water quality. But in many cases found, weak carp fishing cannot control the number of fish-eating fish carp survival and the number of individuals, then these fish will eat zooplankton, 2 to 4 years back to the original population quantity, water quality has returned to the original state. Know that different methods of operation, affecting the level of the main key to the effectiveness of carp removal rate. Therefore,
Hansson et al. (1998) pointed out that biological control methods have to meet three objectives: (1) the elimination of algae reduced visibility caused by the phenomenon of water, (2) reduce the number of blue-green algae, (3) the effectiveness of stability.
MATERIALS AND METHODS
A. Investigation range
The Taipei Feitsui Reservoir(N24°54‘,E121°34‘) is located in northern Taiwan and has a total surface area of 1024ha, a volume of 327,000,000m3, and a maximum and mean depth of 100 m and 32 m
respectively. The investigation range of this research contains upper, middle and lower reaches of Feitsui
reservoir. The sampling sites as shown in (Fig. 1) is depending on the water quality sampling point of Feitsui reservoir. Samples from eight sites were collected once per month over year. From June 2006 to November 2007, there are researches in different seasons. Catches are obtained by using set gill net in experiments.
Fig. 1. Investigation range of fish sampling sites as the
main sampling locations in Feitsui Reservoir
B. Investigation of fish fauna
This study mainly investigates the variation of number of Fish Fauna, species, size, spatial
Lower reaches
Middle reaches
Upper reaches

Proceedings of the International Conference on Environmental Aspects of Bangladesh (ICEAB 2011)
33
distribution according to characteristic and alternation of seasons. The transparency, total phosphorus, chlorophyll a concentration and number of algae established by Feitsui Reservoir Administration during 2006 to 2007 are collected to analysis according to different seasons and water region. XY scatter plot is used to show the relationship between Fish Fauna, total phosphorus, chlorophyll a concentration and number of algae.
RESULTS AND DISCUSSIONS
This study shows the fish species having great variation in each month and the month mean value is 9.8 ±0.05SD. The species is 14, the most value, in July 2007. The species is 6 at November 2006 and March 2007 with least number. The results show the difficulty of fish catch in winner. The dynamic of fish diversity index is the same of diversity index about 2.36±0.08 SD. Fish diversity index is 3.34 the most at July 2007 and is 1.1 the least in October 2007 (Fig. 2).
Fig. 2. Within the capture of fish in the reservoir species
and Shannon-Wiener's index. The vertical axis of the
number of species of fish caught by representatives of
several
A. Cyprinidae correlation with reservoir water quality
This study Hansson et al. (1998) and Olin (2002) data classification of fish in the reservoirs, according to the survey within the reservoir species into medium and large carp (37.1% of number), small cyprinids (43.3% of number), carnivorous fish (2.8% of number) and other species (16.9% of number) of four categories. To fish in the reservoir, mainly cyprinids, so as to carp fish using XY scatter plot for the correlation of phase and water quality. X-axis-based sampling of fish in the month of the waters of other water quality data, CTSI values were affected by three water quality parameters, total phosphorus (μg/l), chlorophyll-a (μg/l) and
transparency (m), and the impact of eutrophication factor of algae (unit/ml).Y-axis respectively, for the four species each (Territorial waters) captured the weight (kg), number, fish density (kg/ha). Analyze of carp and water quality correlation (Table 1).
By the correlation analysis showed that carnivorous fish caught by weight, density and transparency of the show ending and a high correlation. The results shown in Figure 3, carnivorous fish catch weight and the transparency of the R ² value of 0.66, capture and transparency number R ² = 0.72, capture the density and transparency of the R ² value of 0.55, indicating the number of clusters in the carnivorous fish in the high waters , there is low transparency phenomenon. The other fish species have no obvious relationship with water quality. The reason of low relevancy is the small variation range at the four water quality data in Feitsui reservoir and the lack of data. Thus, the data is suggested to continuous establish and then the result will be more plentiful. The other of water quality can be analyzed by catch in the future.
CONCLUSION
The research of fish fauna in Feitsui reservoir not only establish the relationship between fish fauna, number and alternation of seasons but also establish diversity of fish fauna. The relationship between diversity of fish fauna and water quality can be found and propose the potential fish as index of water quality. The investigation of water quality and fish fauna of reservoir is the necessary information for biomanipulation and sustainable management. The eutrophication of reservoir can be improved in different country by biomanipulation with better effect for small or shallow lakes and reservoirs.
REFERENCES
[1] CY Hsu. 2008. A Study of the Correlation Between of
the Fishes and Water Quality in the Feitsui
Reservoir‖,Department of Bioenvironmental Systems
Engineering, National Taiwan University Master
Thesis.
[2] LA Hansson, H Annadotte and E Bergman. 1998.
Minireview: Biomanipulation as an application of
food-chain theory: constraints, synthesis, And
recommendations for temperate lakes. Ecosystems,1:
558-574.
[3] Olin Mikko. 2002. Fish community structure in
mesotrophic and eutrophic lakes of southern
Finland: the relative abundances of percids and
cyprinids along a trophic gradient. Journal of Fish Biology,, 60:593-612.

Proceedings of the International Conference on Environmental Aspects of Bangladesh (ICEAB 2011)
34
A1.008
Present Scenarios of Boral in Context of Environment, Economy and Livelihood
Sheikh Rokon, Rasheduzzaman and Atiqur Rahman
Riverine People Bangladesh
Abstract The study is an initiative to save Boral from unwanted depletion/ extinction by human activities by a volunteer group
The Riverine People Bangladesh. Boral River one of the offshoots of the Ganges. A sluice gate was constructed at the
source of Boral to solve the abrupt flooding problem caused by the Farraka, India unilaterally depriving of its proper
share, during the rainy season the swollen water was going unobstructed abruptly flooding. Local government has
built establishments, which are causing various impacts. The study aims to clarify the problems created by the
establishments to control river flow by sharing knowledge of local people and stake holders. Also reviewing the
parameters to compare changes and recommend some alternatives for solving the problem to maximum possible extent.
The main threats due to the loss of river flow is decrease of ground water level, extinction of several fish species,
decrease of birds in number , decrease of most of the aquatic species and depletion of the aquatic ecosystem. The river
must be recovered from illegal possessions and the establishments on the river should be withdrawn focusing the
revival of the river maximum as possible.
INTRODUCTION
Boral River one of the offshoots of the Ganges. Originating at Charghat upazila of rajshahi district, the Boral flows through Natore and Pabna and finally meets with the Hurasagar after joining with the Karatoya south of Shahjadpur. The total length of the river is 147 km, average width is 125m and average depth is 6.5 meters. The river receives water from the Ganges only in the monsoon season. But it maintains its flow throughout the year with local runoff water and water from Chalan Beel. It has a floodplain area of almost 3200 sq km, and almost 2.2 million people live on the upazilas which are cut through the Boral and about 70-80 percent of the total population here depend on the river system either direct or indirectly. It has flown through seven upazila of the three districts. Boral is divided into two parts lower & upper Boral . Upper Boral has an average depth of 9.5 meters and width of 120 meters, while lower Boral has an average depth of 5 meters and width of 60 meters.
The history of Boral and its floodplain has a very rich contribution to the communities which are dependant or live at the coverage of Boral. Boral has been the source of economy to its people, through fisheries, business and agriculture. Boral had made the locality an economic zone in ancient Bangla. Though it has a very significant role on the people who live by Boral, but it has been forced to change its nature, sometimes its course by human actions through many inconsiderate decisions of man.
The main objective of the study was to identify the problems created by the establishments made to control the river flow and sort out the possible benefits of enlivening the river again through removing the establishments.
STUDY AREA AND METHODOLOGY
The study area was Charghat and Chatmohor upazila of Rajshahi and Pabna districts respectively. The locations are representative to the changing situations of Boral.
The study was conducted incorporating various stakeholder groups direct or indirectly affected by
the change of water flow in Boral. Study includes a questionnaire survey, specialist interviews, focus group discussions with the vulnerable groups and stake holders, expert interview and reviewing data collected from respective departments to compare the changes.
The main methods used in the study are
1. FGD ( Focus Group Discussion) 2. In-depth Interview ( Specialists Opinion) 3. Analysis of data acquired from the several
government offices to get the statistical output.
PRESENT SITUATION OF BORAL
Boral has been the source of life, backbone of the local economy and the main balance between the environment and ecosystem. It originated in Charghat thana of Rajshahi district, runs through ten upazila namely Bagha, Bera, Gurudaspur, Bagatipara, Boraigram, Vangura, Atghoria, Foridpur, Chatmohor and Shahjadpur. The Boral was the largest river after the Padma in the northen region of the country. But it has been processed to kill by several procedures to empower human desires to capitalize on river systems. The Farakka Barrage, built on the Ganges River, was completed in 1974 and subsequently was put into operation in 1975. Forced the natural flow of water which was powered by the direct flow from the padma to reduced. In 1985 a sluice gate was constructed at Charghat upazila of Rajshahi district at the source of Boral to solve the abrupt flooding problem caused by the Farraka , India unilaterally diverted the flow of water during the dry season, depriving of its proper share, during the rainy season the swollen water was going unobstructed abruptly flooding. The sluice gate reduced the capacity of sluice gate to 30-35% of its original flow. Some results are obtained in flood control temporarily; and encouraged by the sluice gate, several same establishment was setup by the local government. Some other establishment was also setup in different periods lake cross dams, narrow culvert etc. all resulting in reducing the flow and siltation. Boral had impacts in many ways like social,

Proceedings of the International Conference on Environmental Aspects of Bangladesh (ICEAB 2011)
35
economic, environmental etc. The slow killing of Boral has also killed the livelihood of Boral dependent people.
IMPACT OF DRYING OF BORAL
A. Impact in navigation
In 1980s there was a navigation system in Boral, which had concluded it as major river/ water
navigation facilities of the region. It was connected with the great Chalan Beel and also with the great rivers the Padma and the Jamuna. It obviously had become the focul point of local and regional water transportation system. Now with drying up of Boral the total navigation system has collapsed.
Fig. 1. Sluice Gate constructed at the source of
Boral at Charghat, Rajshahi
Fig. 2. Cross dam across the Boral river in
Chatmohor, Pabna
B. Impact in economy
The navigation system which was created a loop of water transportation was used as the main route to transport business goods. The cost of transportation is very low compared to that through land. So business people inevitably chose water ways for trading. Such facility made places nearby to Boral and its banks focus of business. There was some local business center which supplied goods to Dhaka, Narayanganj and in ancient bangle murshidabad. There was a huge amount of fish. A large number of people were dependent on the river for their livelihood by fishing. Almost 28 percent people was directly involved in fishing. Other 3
percent people were indirectly related. Boral was a very good source of agriculture. Sediments carried by the river increased the soil fertility. Water was very much available for irrigation. Nowadays, soil fertility is decreasing. Irrigation has become much tougher.
C. Social impacts
Social conflicts are arising for conflicts in water issues. A different type of need for water is increasing the distances between the communities.
Fig. 3. Satellite imagery showing cross dam on the Boral.
D. Environmental impacts
Decrease in flow of water in rivers has forced people to look for alternative water source. These increased ground water uses, for every purpose. Pumps are being set up, to meet up demands of water for irrigation, residential and industrial purposes. Increased pressure on the groundwater leading to depletion of water layer. Another problem is rivers are the natural sources of water recharging of aquifers. Drying up of rivers causing the imbalance of river recharge to ground water aquifers, resulting in the decrease of water layer. Almost 30 feet decreased in past ten years. This decrease causing aeration of rock layers, which are made of mostly pyrites, which includes arsenic. This aeration destabilizing the arsenic and causing the release of arsenic into groundwater. Resulting in 20-25 % increase in arsenic contaminated water in tube wells. Decrease of water flow and water caused the decrease in aquatic species. Several fish species, mollusks, amphibians are extinct and endangered now. This causing imbalance to the ecosystem. Less availability of food has decreased the number of birds also.
RESULTS
The study has shown there is a significant amount of change in water discharge or water flow of Boral and this is correlated to lot of negative changes in the communities and livelihood affecting their economy, social status and environmental sustainability.
The result includes:
1. Depletion of ground water levels and the aquifer recharge process though river has been stopped.

Proceedings of the International Conference on Environmental Aspects of Bangladesh (ICEAB 2011)
36
2. Arsenic problem is broken out as a result of groundwater depleted. There is a report of approximate 25-30% increase in arsenic polluted tube wells.
3. Water for irrigation and other use are mainly being dependant on groundwater & availability of groundwater is decreasing. There‘s been a 30 feet drop in ground water level in past ten years. Water pollution is increased for increased use of fertilizers and pesticides.
4. Aquatic species like fish, mollusks are depleting.
5. Various fish species are being extinct from the river because of drying up of the river. Almost 23 fish species has been now extinct from the river. Some are
6. The number of birds has been reduced to a great amount.
7. Cropping pattern has been changed, indigenous crops are now been almost extinct and synthetic crops are now grown like IRRI instead of Amon paddy.
8. Scarcity of irrigation water suppressing the cultivable land.
9. Water navigation system has been diminished. 10. Loss of navigability caused a great loss in
economic and social aspects. Because water transportation system is the cheapest mean that businessmen can afford to carry their goods easily.
11. Loss of water flow forced the majority of people to change their livelihood, leading to imbalance of social structure which has been persisted throughout the centuries.
12. Increase of social conflicts in water issues.
RECOMMENDATIONS
There are some recommendations to restore Boral at its maximum possible extent. Every recommendation focuses the purpose of the community and their livelihood. Restoration of Boral is the only way possible to ensure a sustainable environmental condition to the communities of the region. Recommendations
include removal of most of the establishment which are made to control the river. River must be ensured its full width while constructing a bridge and restoration of laws.
1. The river should be recovered from illegal possession, and the area should be precisely indicated
2. The culverts, dam, cross dam, narrow bridges, sluice gate and regulators should be removed and full width bridge should be constructed.
3. Fertilizers, pesticides and poultry waste should be banned dumping into river for sake of agricultural and fisheries purpose.
4. Canals should be excavated appropriately and the river should be under the capital dredging.
5. Industries should not be permitted on the bank of river; older industries must install effluent treatment plants.
6. Use of groundwater should be arranged in a planned way.
7. Leasing system of the river should be banned; river should be conserved for fishes of indigenous species
CONCLUSIONS
People of the Boral bank still believe that, Boral and its glory; environment can be regenerated, by doing some simple action taken against the unplanned infrastructural nuisance. It is a fact also that it is necessary to restore Boral for sustainable environmental conditions. The ecosystem will be regenerated, also. Various sides of economy will be opened again. Agriculture will be lot more easily; transportation of goods will be easy. Boral can serve as a huge source of fish.
It is very urgent to keep thing where it was, or restore the conditions to the maximum extent or minimum damage to ensure sustainable development.
The most needed thing, to materialize the action is proper planning, political awareness and willingness and commitment to the country and environment. Some strict measures must be taken to diminish the anthropogenic symbols of dominance over river to restore Boral to its maximum possible extent; for betterment of a vast community which are directly linked with Boral.
ACKNOWLEDGMENTS
Mr. Ziaul Haque Mukta and Oxfam Bangladesh has given a tremendous support to complete the job. Mr. Mizanur Rahman has specifically been a very big help. Thanks to Mr. Habibur Rahman the editor of Weekly Chatmohor. Thanks to Boral Conservation Movement to have the opportunity as great as saving a region from a big catastrophe.
REFERENCES
[1] LGED [Local Government Engineering Department].
Government of Bangladesh.
[2] Department of Enrionment. Government of
Bangladesh, Dhaka.
[3] M Habibullah. 2009. Society and culture of Pabna
district . Bangla Academy, Dhaka, pp. 33-34.
[4] Ministry of Water Resources, Government of Peoples
Republic Bangladesh.

Proceedings of the International Conference on Environmental Aspects of Bangladesh (ICEAB 2011)
37
A1.009
River Water Pollution in Buriganga on the Context of Bangladesh
Sonya Afrin1, Subarna Sharmin2 and Md. Moksed Alam3
1Department of Architecture, Stamford University Bangladesh; e-mail: [email protected] 2RIIP II, Local Government Engineering Department; e-mail: [email protected]
3RIIP II, Local Government Engineering Department; e-mail: [email protected]
Abstract
Water is of elemental consequence for ecology and the wider environment. The increasing urbanization and
industrialization of Bangladesh have negative insinuations for water quality. The pollution from industrial, urban waste
effluents and from agrochemicals in some water bodies and rivers has reached apprehension levels these days in the
country. The marine and aquatic ecosystems are affected, and the chemicals that pierce the food chain have public
health implications. Maximum river water undergo alarming rate of pollution. Among the most polluted rivers in the
country, Buriganga in Dhaka city poses higher risk to the extensive environment. An average of 19 cubic liter water
containing more than 300 different chemical compounds is being discharged daily from surrounding industries of
Buriganga. The study entails river water pollution in Buriganga on the context of Bangladesh.
INTRODUCTION
Next to air, the other important requirement for human life to exist is water. It is the Nature‘s free gift to the human race. It‘s available in various
forms as rivers, lakes, streams etc. This valuable water can be polluted by different ways [8]. Recent years Bangladesh has been faced enormous river water pollution for the development of industrial and agricultural sector that creating higher imbalance to the environment. This study is an attempt to evaluate the pollution of water in Buriganga River on the context of Bangladesh.
BANGLADESH CONTEXT
Bangladesh had always been predominantly and agricultural based country and in early days pollution was never even felt in this region. Since early sixties, of necessity, industries of various kinds started to spring up slowly. It appears in a survey that ecological imbalance is being caused continuously due to discharge of various industrial wastes into air and water bodies. It has also been found that the intensity of pollution caused by the factories and industrial units depend on their type, location, raw materials, chemical effects, production process and discharge of gaseous, liquid and solid pollutants to the natural environment. All of Bangladesh's sewage and industrial wastes are flushed directly into Ganges and Brahmaputra Rivers. There are wide spread fears that as the region develops in industrial infrastructure, industrial pollution will accelerate, compounding the problems posed by raw municipal wastes. About 900 polluting industries in Bangladesh dispose of untreated industrial wastes directly into rivers, although the effluents contain 10 to 100 times the allowable levels permissible for human health [1].
A. The river system and pollution process in Bangladesh
The rivers of Bangladesh are glory of the country and physiography of the people. Bangladesh has around 310 rivers with a total length of 24,140 km. Among them, 54 rivers originate in India, which all eventually flow into the Bay of Bengal. These include the three major rivers; the Ganges, the Brahmaputra (Jamuna) and the Meghna (GBM),
which together constitute the largest river network in the world. These rivers carry a total of approximately 1250 million units of water per year, 93% of which flows into Bangladesh from India [2]. Every river is a large natural stream of water. The main source of cultivation water is the larger rivers. The rivers flow of the country is about 140,000 m3/sec in monsoon and 7,000 m3/sec in the dry period. The national government of the country developed major water control projects as flood control structures, drainage facilities, hydroelectric power projects and irrigation projects etc. These rivers possess great threat to the environment today for the unplanned urbanization and industrialization. The river water quality deteriorated and polluted in recent days for the industrial, agricultural and sewerage wastes and wastewater that directly discharged into the river without any kind of treatment process. This pollution emitted from point and non-point sources. Industries, sewage treatment plants, power plant etc. are point sources of water pollution and pesticides, dust, agricultural fertilizer etc. considered as non-point sources. Pollution of rivers has long been identified as an environmental concern of great magnitude [5]. In general, the term pollution is to mean the conditions disturbing the balance of natural environment in such a way that its beneficial use is adversely affected, thus it‘s causes undesirable changes and threatens the land, water, air and outer space environment. The water before washing contains impurities and hence the term water pollution is used to indicate an act of contaminating or making foul natural water bodies such as rivers, streams etc. Pollution makes the water unfit for the best use. The polluted water is objectionable to the human senses of sight, smell, feel & taste. The illustrations of polluted water are colored water, saline water, foul smelling water, water containing floating bodies, oil, grease etc. [8].
B. River water pollution in Bangladesh
Bangladesh is frequently identified as a poverty- ridden, resource-scarce and overpopulated country that faces natural calamities continually. The major environmental disasters faced by the country are floods, cyclones and tidal surges, drought, water logging, deforestation, land erosion especially river

Proceedings of the International Conference on Environmental Aspects of Bangladesh (ICEAB 2011)
38
bank erosion, and water pollution [2]. A World Bank study said four major rivers near Dhaka; the Buriganga, Shitalakhya, Turag and Balu receive 1.5 million cubic meters of waste water every day from 7,000 industrial units in surrounding areas and another 0.5 million cubic meters from other sources. Unabated encroachment that prevents the free flow of water, dumping of medicinal waste and waste of river passengers has compounded the problem, making the water unusable for humans and livestock [3]. Besides wastes from Dhaka urban population the Sitalakhya river receives untreated industrial wastes from urea fertilizer plants, textile mills and other industries. The principal polluting agent in the region is the Urea Fertilizer Factory of Ghorasal and the concentration of ammonia dissolved in water has increased over time causing fish-kills [1]. The Balu River near Tongi (15 miles north of Dhaka) receives untreated effluents from industries such as textiles, lead batteries, pulp and paper, pharmaceuticals, paints, detergents, iron and steel, rubber etc. [1]. The principal industries of Khulna (south-east of Bangladesh) are jute mills, oil mills, newsprint mills, cable, shipyards, tobacco, match factories, hardboard and others dispose molasses, starch, oil, sodium-sulphide, ethane, lissapol, soda ash, dye, sulphuric acid, salicylic acid, lime, ammonium sulphide, and chrome etc. Bhairab/Rupsa rivers show a very alarming water quality data as; conductivity 390-9500 Micro-mhos /cms, total solid 260-3500 mg/l, TDS 260-3200 mg/l. The pollution aspects of Bhairab and Rupsa Rivers is very critical; the Rupsa River does not receive a continuous flow of fresh water from the parent river, on the other hand, the Bhairab River, being subject to tides, has marked backwater effects which reduce the purification capacity of the
river [1]. The polluting industries of Chittagong, the second largest city of Bangladesh, such as 19 tanneries, 26 textile mills, 1 oil refinery, 1 TSP plant, 1 DDT plant, 2 chemical complexes, 5 fish processing units, 1 urea fertilizer factory, 1 asphalt bitumen plant, 1 steel mill, 1 paper mill (solid waste disposal hourly 1450 m³), 1 rayon mill complex, 2 cement factories, 2 pesticide manufacturing plants, 4 paint and dye manufacturing plants, several soap and detergent factories and a number of light industrial units directly discharge untreated toxic effluent into Karnaphuli river. From the survey of effluents from different industries, it has been found that the discharge is generally composed of organic and inorganic wastes. The organic wastes are the effluents from the tanneries, fish processing units, degradable wood chips, pulps and untreated municipal and sewage (about 40,000 kg BOD daily) etc. The inorganic waster are chemicals used by the industries such as various acids, bleaching powder, lissapol, hydrogen peroxide, alkali, salts, lime, dyes, pigments, aluminium- sulphate and heavy metals etc. The DDT factory and fertilizer factory disposing of DDT, toxic chemicals and heavy metals to the Karnaphuli River [1].
C. Causes of river pollution in Bangladesh
The major causes of degradation of river water quality are related to land based activities, when adequate regulatory measures are not incorporated
and the stakeholders do not show proper concern. The underlying driving forces for this are poverty, an unhealthy national economy, lack of institutional strength, and lack of awareness and education. Pollutants that enter the marine and coastal environment originate on land in the form of runoff from municipal, industrial and agricultural wastes, and from commercial seafaring activities [4].
In Bangladesh, industrial units are mostly located along the banks of the rivers. Unfortunately as a consequence, industrial units drain effluents directly into the rivers without any consideration of the environmental degradation. The organic pollutants are both biodegradable and non- biodegradable in nature. The biodegradable most problematic industries for the water sector are textiles, tanneries, pulp and paper mills, fertilizer, industrial chemical production and refineries. A complex mixture of hazardous chemicals, both organic and inorganic, is discharged into the water bodies from all these industries usually without treatment. The highest numbers of industrial establishments in the country are located in the North Central (NC) region, which comprises about 49 per cent of the total sector. About 33 per cent of the industries in the NC region are textiles, apparels and tanneries, of which Dhaka district accounts for almost half and Narayanganj about 32 per cent. About 65 per cent of the total chemicals, plastics and petroleum industries are also located in the NC region, and concentrated in and around Dhaka, Narayanganj and Gazipur districts (WARPO, 2000a). Region-wise numbers of industrial establishments and most polluting industries organic components degrade water quality during decomposition by depleting dissolved oxygen. The non-biodegradable organic components persist in the water system for
a long time and pass into the food chain. Inorganic pollutants are mostly metallic salts, and basic and acidic compounds. These inorganic components undergo different chemical and biochemical interactions in the river system, and deteriorate water quality [4].
The main suspected sources of agricultural runoff pollution are from the use of fertilizers and agrochemicals, including herbicides and pesticides. Urea, Triple Super Phosphate (TSP), Muriate of Potash (MP) and Gypsum are the major chemical fertilizers used in Bangladesh. The total amount of fertilizers used annually is about 2 million tons. Pesticide use as plant protection measures. Insecticide is commonly used for pest control which accounts for about 90 % of the total consumed pesticide [4].
Bangladesh has the highest rural population densities in the world, and with an exception in some areas, the overall density is very high. The main problem poses in respect to water is the lack of sanitation facilities in the rural areas and inadequate facilities for urban wastewater treatment. There is one sewage treatment plant in the whole country, serving only a part of Dhaka. A major program for provision of sewerage is needed to arrest the increasing fecal pollution of open watercourses around all urban areas in Bangladesh, particularly Dhaka. Outside the urban areas, there is a problem with designing adequately sealed

Proceedings of the International Conference on Environmental Aspects of Bangladesh (ICEAB 2011)
39
latrine systems at the household level, which can cope with the annual flooding and prevent fecal pollution of the water supply. Poor management of wellhead areas may be the most significant source of fecal contamination rather than direct aquifer pollution [4].
Chittagong and Mongla are the two seaports of the country do not have facilities to receive and treat bilge and ballast water, and thus ships throw wastewater into the territorial waters of Bangladesh. Oil and lube spillage also happens during refueling of vessels and cargo handling. In addition, there are innumerable mechanized trawlers and boats engaged in fishing in the Bay of Bengal. The operators of these vessels dump waste, including burnt oil, into the water, because of their ignorance about its adverse effect on environment [4].
A certain level of stream flow is required to maintain navigability, the wetland habitat and ecosystem, and equilibrium between freshwater and saline water mixing zones. Generally, reduction of water flow causes saline water intrusion into the river system which is aggravated in the coastal area of the country in dry season, when water flow from the river system becomes lean. Over the past two decades, the lowest water level data of the major rivers showed a declining tendency in the dry season [4].
The overall inland surface water quality in the monsoon season is within tolerable limits, with a few exceptions, including the rivers Buriganga, Balu, Shitalakhya, Karnaphuli and Rupsha. However, concerns over surface water quality are gradually emerging due to the dispersed locations of polluting industries, and the adverse effect on surrounding land and aquatic ecosystems, as well as subsequent impacts on the livelihood system of
the local community [4].
D. Pollution in Buriganga River
A cruise on Bangladesh's historic Buriganga River used to be a must for visiting dignitaries; is at present one of the most polluted rivers in Bangladesh that are confronted with foul smells and rotting fish resulting from massive pollution. Hundreds of years ago, the banks of the Buriganga were a prime location when the Mughals made Dhaka their capital in 1610. The house-turned- museum of the Nawab overlooks the river, which is the country's main waterway for trading and ferry travel. It was once the main source of drinking water for Dhaka's residents and an hour downstream from the capital city the river is still crystal clear. Only a small fraction of the total wastewater being generated in the city is treated. Consequently, the amount of untreated wastes, both domestic and
industrial, being released into the Buriganga is tremendous and is increasing day by day. The river is seriously polluted by discharge of industrial effluents into river water, indiscriminate throwing of household, clinical, pathological & commercial wastes, and discharge of fuel and human excreta. In fact, the river has become a dumping ground of all kinds of solid, liquid and chemical waste of bank-side population. These activities on the Buriganga have caused narrowing of the river and disruption of its normal flow of water. The water of
the river has become so polluted that its aquatic life has almost been extinguished [1]. Pollutants have eaten up all oxygen in the Buriganga and we call it biologically dead. There is no fish or aquatic life in this river apart from zero oxygen survival kind of organisms [3]. The water of this river posed a serious threat to public life and was unfit for human use. People, living near the river, use the water because they are unaware of the health risks and also having no other alternative. This causes incidents of water borne and skin diseases. But as it flows through the capital, waste from sewers and factories especially tanneries pour into it. Up to 40,000 tons of tannery waste flows into the river daily along with sewage. About 12 sq. km area of Hazaribag and adjacent area are full of offensive odors of various toxic chemicals as hydrogen sulphide, ammonia, poisonous chlorine and several nitrogen based gases to mention a few. An average of 19 cubic liter water containing more than 300 different chemical compounds is being discharged daily from these industries. The relative acidity or alkalinity of this liquid toxic waste flown through the drainage system has been observed as between 1-15-13 not only that, traces of chemical elements also remain [1].
Table 1. Metals concentrations in Buriganga River
compared to international guideline value [1]
Trace metals (ug/l) Cd Cr Cu Ni Pb
Average
concentration in
Buriganga river
(ug/l)
9.35 587.2 163.1 8.8 65.4
Australian guideline
for 95% protection of
aquatic ecosystems
(ANZECC, 2000)
0.2 1.0 1.4 11 3.4
Detergent increases the PH level in water. Although treating the water for toxic chromium, sulphuric acid, and salt and chlorine compounds is seriously being considered the practice is yet to start. According to a recent estimate, about 70,000 tons of raw hides and skins are processed in these tanneries every year polluting the environment and the quantity of untanned solid wastes namely raw trimming, we lime fleshing, pelttrimming generated in these tanneries is estimated to be 28,000 tons. Statistics provided by various sources suggest that a big tannery of the Hazaribagh area releases 2,500 gallons of chemicals wastes each day, polluting the city‘s air in addition to contaminating the water of the river Buriganga. Effluents and solid waste generated at different steps of leather processing trekking through the low-lying area of Hazaribagh contaminated by chromium, the old wounds take a longer time to heal. Long term chromium contamination may cause cancer. Laboratory tests carried out by DoE show that chromium, a carcinogenic agent, has seeped into the aquifer at some places of Hazaribagh flow into the Buriganga River. Liquid waste is contaminating the waters of the Buriganga River on the surface as well as the ground water resource base. When solid waste and effluents run into the river, the Biological Oxygen Demand (BOD) in the water rises. Among others,

Proceedings of the International Conference on Environmental Aspects of Bangladesh (ICEAB 2011)
40
effluents of tannery factories lower the dissolved oxygen (DO) content of the river water below the critical level of 4 ml/l. Table 1 showed metals concentrations in Buriganga River compared to international guideline value [1].
E. Pollution management and mitigation action
There are several government departments in Bangladesh dealing with water pollution management. Among them, the Department of Environment (DoE) deals with pollution issues. DoE has been collecting data on surface water quality since 1980, at 11 points spread amongst five rivers of the country, i.e., Buriganga, Balu, Sitalakhya, the Jamuna and the Meghna. At present, DoE is monitoring water quality data at 69 stations [4]. Various key parameters and indicators of water quality are monitored by the DoE include physiochemical characteristics of water, like the pH, dissolved oxygen (DO), biological oxygen demand (BOD), chemical oxygen demand (COD), total suspended solids (TSS), suspended solids (SS), total coliforms, heavy metals, electrical conductivity (EC), chloride, turbidity, total alkalinity and temperature. The Bangladesh Water Development Board (BWDB) collects data on suspended sediments and surface water salinity. Data on surface water and groundwater salinity of the coastal area of the country are collected by the Soil Resources Development Institute (SRDI) [4]. The EIA Guidelines for Industries covers significant water sector interventions, including flood control embankments, polders, dykes, water supply and sewage treatment, as well as roads and bridges. All these water sector interventions fall under the ‗Red‘ category. This requires the most stringent EIA process to be followed for proposed project construction, re-construction and extension. The red classification requires an additional full EIA to be undertaken [4]. The National Environmental Quality Standards are given in the Environmental Conservation Rules of 1997. These set a range of water quality criteria and limits depending upon the intended uses, including use for human drinking water, livestock drinking, fisheries, recreation, irrigated agriculture and industry. Discharge standards are also specified by sources, including public sewage outfalls, irrigation water and specific types of industrial discharges by size [4]. The overriding problem of environmental standards in Bangladesh is the difficulty in enforcing them. Moreover, the regulations are essentially ‗end-of-pipe‘ standards. Although there is an Ambient Water Standard, it covers none of the many chemical pollutants known to be discharged. There is no effective regulation that takes into
account the ability of rivers to dilute and disperse effluent, especially in times of low flow, and under complex cumulative discharge patterns [4].
The Environmental Conservation Acts and Rules and National Water Policy have adequate clauses related to industrial pollution. This includes water quality protection, institutions to prevent pollution, effluent discharge monitoring, zoning regulations for new industries and strengthening of the regulatory system for agrochemical pollution control [4]. Under Bangladesh Environment
Management Program (BEMP) and Sustainable Environment Management Program (SEMP) and the DoE is currently working towards improved water quality monitoring and estimation of pollution loads in the rivers and watercourses, along with institutional strengthening. The initiatives include preparation of Guidelines for EIA applicable to several sectors, including flood control and drainage [4]. The associated institutional strengthening is also underway. The focus of these initiatives is on ambient water quality monitoring and regulation of proposed new industries. However, there are few initiatives to address the immediate problems, for clean-up programs for the serious industrial pollution caused by existing industries. The DoE have not yet set any guidelines for these in any detail or detail clear time-bound targets. Clear measures for ensuring compliance with the environmental laws and regulations, including enforcement are lacking [4].
Industries are providing employment, increasing local incomes, and earning foreign exchange for the country. However, these industries also discharge their waste into the ecosystem which local people depend on for their livelihoods, adversely affecting livelihoods and the day-to-day life of the community. It is a legal requirement in Bangladesh for all red category factories (textile dying and tanning) to establish Effluent Treatment Plants (ETPs) [7]. Current laws and regulations are evidently not being followed otherwise Bangladesh would not have to suffer from dead or anaerobic river stretches and wetlands that are rapidly dieing [7]. The government has initiated a move to relocate the tanneries outside the capital, and also asked illegal encroachers to vacate the Buriganga river [3]. Many of them have this plant. But they don't use it as it is
expensive. The river should be fully dredged, their illegal occupation ended and the laws strictly enforced to prevent abuse of waterways [3]. The number of industries is increasing rapidly without consideration of the local impact on livelihoods from natural resources. There is no zoning policy or local development planning at the Upazila level. These policies should be strictly enforced [4].
If these new industries do not adopt clean production technologies and clean up their waste then the gains from the few that do will not be enough. Water resource degradation is a poverty and governance issue that needs to be addressed now and on a national scale [4]. Government departments especially the Department of Environment (DOE), industrial associations and chambers, research institutions, international buyers, nongovernmental organizations and legal experts need to work together to develop a framework and modalities of implementation for improved environmental governance. Existing national standards need to be enforced and adhered to [4]. Existing water quality standards need to be enforced through the following steps: Increased awareness among industrialists about the pollution problem and their legal and social responsibility to prevent it. It should be mandatory for all textile and dyeing industries to adopt more efficient production options [4]. Industries should construct and then regularly and efficiently operate their ETPs and

Proceedings of the International Conference on Environmental Aspects of Bangladesh (ICEAB 2011)
41
monitor their effluents to keep them within the standards set by law. Voluntary or public provision of common ETPs may be a solution to serve adjacent small scale industries, operating on a cost sharing basis. National and community level bodies should be established and validated to monitor water quality of khals, beels and rivers and the results used to determine anti-pollution measures, operating permits and actions (including legal actions) against offending industries [4]. Given the scale of the problem, its resource limitations, and the need to demonstrate transparency and objectivity, DoE should accredit and appoint competent third party organizations to work on its behalf to monitor industries regularly in addition to its own monitoring. DoE should seek to actively work with and inform local government at Union and Upazila levels of the issues and how local government can use its powers to Upazila Fisheries Committees to assist them in ensuring acceptable water quality in wetlands and capture fisheries [4]. International buyers have a key role in influencing industry, they need to be influenced to adopt environmental codes of conduct and then to enforce them on their supplying industries. Bangladesh trade bodies should change their role and set environmental conditions on membership, for example they could cancel membership of companies that fail to install and operate properly ETPs [4].
CONCLUSION
Water is the most crucial element among the natural resources, and is crucial for the endurance of all living organisms. The environment, economic growth and development of Bangladesh are all highly influenced by water its regional and seasonal availability and the quality of surface and groundwater. The availability of surface and groundwater is highly responsive to the monsoon climate. In terms of quality, the surface water of the country is unprotected from untreated industrial effluents and municipal wastewater, runoff pollution from chemical fertilizers and pesticides, and oil and lube spillage in the coastal area from the operation of sea and river ports. Water quality also depends on effluent types and discharge quantity from different type of industries, types of agrochemicals used in agriculture, and recurrent water flow and dilution capability by the river system. The apprehensions over water quality relate not just to the water itself, but also to the danger of dissemination of toxic substances into other ecosystems. In particular, water quality around Dhaka the capital city of Bangladesh is so deprived that water from the surrounding rivers can no longer be considered as a source of water supply for human consumption.
REFERENCES
[1] Diffuse Pollution Conference Dublin. ―Aquatic
Ecology and Dangerous Substances: Bangladesh
Perspective‖, 2003.
[2] UNPD. 2006. Inception Report Bangladesh, National
Capacity Self-Assessment, For Global Environmental
Management. UNDP/IUCN.
[3] The Independent Bangladesh, 2001.
[4] UNEP, South Asia Co-operative Environment
Programme. 2001. Bangladesh: State of the
Environment- 2001. United Nations Environment
Programme, pp. 138.
[5] KK Sunil and H Hideki. Surface Water Pollution in
Three Urban Territories of Nepal, India, and
Bangladesh.
[6] ―Worlds Rivers in Crisis - Water quality & Water
dependent Biodiversity at Risk‖
[7] NS Chowdhury and AEV Clemett. 2006. Industrial
pollution and its threat to Mokesh Beel wetland in
Kaliakoir. MACH technical report, Dhaka, 2006.
[8] Rangwala. ―Water Supply and Sanitary Engineering,
1997.

Proceedings of the International Conference on Environmental Aspects of Bangladesh (ICEAB 2011)
42
A1.010
Oxidative Stress Markers Namely-15-F2t-isoprostane and 8-OHdG Concentration in the Bangladeshi Women with Arsenic Exposure
through Drinking Water
Nayar Sultana1*, Chiho Watanabe1, Hana Furusawa1
Masahiro Umezaki1 and Tsukasa Inaoka2
1Department of Human Ecology, Graduate School of Medicine, University of Tokyo, Japan 2Department of Environmental Sciences, Faculty of Agriculture, Saga University, Japan
*Corresponding Author: e-mail: [email protected]
Abstract Arsenic acts as a carcinogen may be due to oxidative stress induction through the generation of reactive oxygen species
(ROS). However, no study had been reported about arsenic induced oxidative stress in south-western Bangladeshi
women. This study was performed to evaluate the levels of urinary 8-OHdG and F2α –isoprostane as two established
oxidative stress biomarkers in relation to the urinary arsenic within Bangladeshi arsenic-exposed women. Urine
samples were collected from113 women from arsenic-exposed area and 115 women from control area. Urinary arsenic
significantly corelated with tube well arsenic (r=76, p<0.001). Urinary arsenic and oxidative stress markers were
significantly higher in As-exposed group than control (p<0.001). Urinary arsenic was significantly correlated with
8-OHdG (r= 0.40; p<0.001) and urinary 15-F2t-IsoP (r= 0.33; p < 0.001). These results suggested that arsenic exposure increases DNA damage as well as lipid peroxidation in Bangladeshi women.
INTRODUCTION
The presence of inorganic arsenic, a potent
carcinogen and toxicant, in drinking water and crops
is one of the major global environmental health problems. Many countries are affected by
arsenic-contaminated groundwater including
Argentina, Australia, Chile, China, Hungary, India,
Mexico and the United States [1]. The most affected
region is Bangladesh, where an estimated 29 to 40
million people are at risk of ingesting arsenic-
contaminated drinking water [2].
Epidemiologic studies have shown that arsenic
exposure is associated with an increased risk of
internal organs cancers even decades after exposure
has been ceased [1, 3] as well as the cause of
cardiovascular, endocrine and neuro-developmental
disorders [1]. One possible mechanism for arsenic-
induced carcinogenicity may be due to arsenic-
induced reactive oxygen species (ROS). ROS induced by arsenicals can lead to DNA damage as well as lipid
peroxidation and carcinogenesis in mice [4].
Experimental data suggest that females are more
susceptible inorganic arsenic-induced cancers [5].
8-OHdG, the oxidized form of the nucleoside
2'-deoxyguanosine present in DNA, is one of the most
reliable, stable and abundant markers of DNA
damage as well as oxidative stress [6, 7].
F2-isoprostanes are also extensively used as
markers of lipid peroxidation and oxidative stress in
vivo [8]. In our knowledge, there are no studies
reported about the relationship of arsenic-exposure
and lipid peroxidation in Bangladeshi residents.
The present study was conducted to evaluate the
relationship between the levels of urinary arsenic
and two established oxidative stress markers namely -8-hydroxydeoxyguanosine and 15-F2t-Isoprostane
(15-F2t-IsoP) as Bangladeshi women exposed to
arsenic through drinking water. For this purpose,
analyzed urine samples obtained from two
communities in Bangladesh, in which one is exposed
to high level arsenic (>150 µg/L) and other one is
exposed but only below WHO recommended level of
arsenic (<50 µg/L).
MATERIALS AND METHODS
This study designed as an age-matched case-control study that conducted in two rural villages namely Sachiadah (arsenic-exposed area) and Jolma (control area) of Khulna district, the southern-west part of Bangladesh in March 2008.
Total 228 married females aged 18 to 45 years selected by local family planning field workers from these two villages were participated in this study. Twenty one females from total participants were excluded due to match with excluding criteria. Excluding criteria were postmenopausal women, pregnant women, lactating mothers, diabetes, and coronary heart disease. Only those women who match with criteria and gave the informed consent, joined the study. The study was approved by the ethical review committee of the Graduate school of Medicine, University of Tokyo, Japan.
Spot urine samples and drinking water samples were collected and transported to University of Tokyo, Japan for analysis. Weight and height were measured. Information regarding social status (subsistence, education, and monthly income) was obtained through questionnaire.
Urinary and tube well arsenic and selenium were determined by inductively-coupled plasma mass spectrometry (ICP-MS: Agilent 7500ce, Agilent Technologies, Waldbronn, Germany). The creatinine concentration of the spot urine sample was determined by commercial kit (‗Creatinine Wako‘ Wako pure Pharmaceuticals, Osaka, Japan) based on Jaffe‘s method. The urinary 8-OHdG level was determined according to manufacturer protocol by using a HPLC system (EICOM, Japan) with an ECD (Coulochem II, esa). Urinary15-F2t- IsoP levels were determined with ELISA kit (EA-85, Oxford Biomedical Research, Oxford, MI).
Data were analyzed using JMP statistical software (version-8; SAS Institute, Cary, NC, USA). Natural log

Proceedings of the International Conference on Environmental Aspects of Bangladesh (ICEAB 2011)
43
transformed data used for analysis in case of skweded data. Chi-square test, analysis of variance (ANOVA) was used for testing models.
RESULTS AND DISCUSSIONS
This study evaluated population of adult women living in two communities of Khulna district which were comparable in age, BMI, blood pressure, socioeconomic status, ethnicity and food habits. The mean age of study population was 28.7 years (range 18-40 years). In Arsenic-exposed and control group did not differ in term of age, BMI, blood pressure, education, household income, daily water consumption (Table 1) but spontaneous abortion and neonatal death were higher in As-exposed women in this study that was also reported in previous studies [9]. Tube well arsenic concentration in arsenic-exposed were 80 time higher than control area.
Table 1. Demographic Characteristics of Arsenic-exposed
and Controls with Interviewed Data Available, Khulna, Bangladesh 2008.
Variables Control Arsenic
exposed
N 104 103
Age (years) a 27.8 ± 5.6 26.9 ± 5.8
BMI (Kg/m2) a 21.3 ± 3.3 21.5 ± 2.7
Education (yrs) 6.5 ± 3.6 6.2 ± 3.7
Household incomea
(BDT/month)# 3377 3315
Systolic Blood pressure
(mm Hg) 113 ± 9.6 114 ± 12.4
Diastolic Blood pressure (mm
Hg) 73 ± 8.6 73 ± 8.8
Oral Contraceptive user (%) 47 (45) 48 (46)
Number of abortion
=1 13 (12.5) 23 (22.3)*
>1 3 (2.9) 45 (43.6)*
Number of neonatal death
=1 4 (3.8) 11 (10.6)$
>1 1 (0.9) 3 (2.9)$
Daily water Intake (L) a 2.3 ± 0.7 2.2 ± 0.6
Note: a Data given as mean (SD). #Bangladeshi Taka per
month *p<0.001, $p<0.05 obtained from the difference between
exposed and control group by Chi-square test.
Total urinary arsenic concentration is commonly used as a biomarker of inorganic arsenic exposure, and which reflects arsenic absorption from the arsenic contaminated drinking water. High
correlations (r= 0.76; p<0.001) was found between tube well arsenic concentration and urinary arsenic (U- As) for the total population (Figure-1), as well as for the arsenic-exposed (r=0.32, p<0.001) and control groups (r=0.21, p<0.02).
Urinary 8-OHdG and 15-F2t-IsoP concentrations was positively correlated with urinary arsenic concentration (r=0.40; p<0.001 and r=0.32; p<0.001, respectively) in total population. There was a statistically significant difference in urinary 8-OHdG and 15-F2t-IsoP between the As-exposed group and
control group (Table-2). Several epidemiological studies have demonstrated an association between arsenic exposure and urinary 8-OHdG measured by ELISA method [10, 11] and our result showed similar kind of association between urinary 8-OHdG and urinary As. Possibly due to arsenic induced polymorphism of glutathion-s tranferases (GSTM) enzyme, which enzymes involved in cellular detoxification and scavenge free radicals. Previously the GSTM1 polymorphism had been observed in arsenic- exposed population that lead increased DNA damage [10].
Fig. 1. Relationship between urinary arsenic level
with tube well arsenic (r=0.76, p<0.001); close
circle=arsenic-exposed, open triangles=control.
Both axis are scaled to natural log. Urinary arsenic
was adjusted for creatinine.
Table 2. Comparison of urinary creatinine, As, Se, 8-OHdG
and 15-F2t-IsoP between arsenic-exposed group and control group.
Variables Control group
(Mean ±SD)
Arsenic-exposed
group
(Mean ±SD)
p-
valuea
Total
N=104
Total
N=103
Creatinine g/L 0.9 ± 0.7 0.7 ± 0.5 0.01
Urinary
Arsenic µg/g
32.66
(38.8-50)b
167.9
(265.5-371.7)b 0.0001
Urinary
8OHdG µg/g
2.77
(5.5-11.9)b 8.8 (16.2-29.5)b 0.0001
Urinary
15-F2t-IsoP
µg/g
3.89
(3.89-4.8)b 4.97 (5.1 -6.4)b 0.001
Urinary Se
µg/g Cr 8.92 ± 5.6 15.27 ± 7.1 0.001
a p –value refers to the difference between exposed and control group by 2 way ANOVA. b Geometric mean of Arsenic, 8OHdG
and 15-F2t-IsoP in µg/g Creatinine with 95% confidence interval
Isoprostanes are free-radical catalysed arachidonic acid derivatives that reflect in vivo non-enzymictic lipid peroxidation [12]. Positive association between urinary arsenic and urinary15-F2t-IsoP suggested the exposure to arsenic in this area induced lipid peroxidation. To the best of our knowledge, no published studies have measured urinary 15-F2t-IsoP to investigate the effect of As-exposure on lipid peroxidation in humans.

Proceedings of the International Conference on Environmental Aspects of Bangladesh (ICEAB 2011)
44
In multiple linear regression analysis, age, BMI and urinary arsenic showed statistically significant effect on U-15-F2t-IsoP. Effects of age and BMI on 15-F2t- IsoP conc. were observed in this study, which was compatible with different studies [13]. However except age, other variate showed significant effect on U-8- OhdG which was contrast to previous studies [8, 14].
CONCLUSION
This study suggested that chronic high arsenic exposure from drinking water in humans may be related with enhanced oxidative stress, which not only cause DNA damage as indicated by the increase in urinary 8-OHdG levels but also cause lipid peroxidation as indicated by 15-F2t-IsoP. These results contribute to a growing body of evidence that arsenic exposure is associated with oxidative stress.
RECOMMENDATIONS
This reseach was financially support by Ministry of Environment, Japan.The authors thank to all particpants of Jolma and sachidah villege and Dr. Sk. Akhtar Ahmad, Mostafizur Rahman, Dr. Zakir Hussain and Dr. M. H. Bokul for their assistance and expertise.
REFERENCES
[1] WHO. 2001. Arsenic in drinking water; fact sheet
Geneva: World Health Organization.
[2] MG Alam, G Allinson, F Stagnitti, A Tanaka & M.
Westbrooke. 2002. Arsenic contamination in
Bangladesh groundwater: a major environmental and
social disaster. Int J Environ Health Res., 12: 235–253
[3] D Mazumder. 2005. Effect of chronic intake of
arsenic-contaminated water on liver. Toxicology and Applied Pharmacology, 206: 169-75.
[4] M Mizoi, F Takabayashi, M Nakano, Y An, Y Sagesaka,
K Kato, S Okada & K Yamanaka. 2005. The role of
trivalent dimethylated arsenic in dimethylarsinic
acid-promoted skin and lung tumorigenesis in mice:
tumor-promoting action through the induction of
oxidative stress. Toxicology Letters, 158: 87-94.
[5] M Vahter, A Akesson, C Lidén, S Ceccatelli, and M
Berglund. 2007. Gender differences in the disposition
and toxicity of metals. Environ Res., 104(1):85-95.
[6] MD Evans, M Dizdaroglu and MS Cooke. 2004.
Oxidative DNA damage and disease: induction, repair
and significance. Mutation Research/Genetic Toxicology and Environmental Mutagenesis, 567: 1-61.
[7] Y Matsumoto, Y Ogawa, R Yoshida, A Shimamori, H
Kasai and H Ohta. 2008. The Stability of the Oxidative
Stress Marker, Urinary 8-hydroxy-2'- deoxyguanosine
(8-OHdG), when stored at Room Temperature. Journal
of Occupational Health, 50: 366-72.
[8] T Mizoue, H Kasai, T Kubo and S Tokunag. 2006.
Leanness, smoking, and enhanced oxidative DNA
damage. Cancer Epi. Biomarkers & Pre., 15: 582-585.
[9] MA Hasnat, S Wayne, R Bayzidur, H Ziaul, K Umme
and D Keith. 2005. Chronic arsenic exposure and
adverse pregnancy outcomes in Bangladesh.
Epidemiology, 16(1): 82-6.
[10] CV Breton, ML Kile, PJ Catalano, E Hoffman, Q
Quamruzzaman, M Rahman, G Mahiuddin and DC
Christiani. 2007. GSTM1 and APE1 genotypes affect
arsenic-induced oxidative stress: a repeated measures
study. Environmental Health, 6:39
[11] X Li, J Pi, B Li, Y Xu, Y Jin and G Sun. 2008. Urinary
arsenic speciation and its correlation with 8-OHdG in
Chinese residents exposed to arsenic through coal
burning. Bull. Environ. Cont. & Toxic., 81: 406-11.
[12] J Helmersson and S Basu. 1999. F2-Isoprostane
excretion rate and diurnal variation in human urine
Prostaglandins. Leukotrienes and Essential Fatty Acids,
61: 203-205.
[13] N Sakano, DH Wang, N Takahashi, B Wang, R
Sauriasari, S Kanbara, Y Sato, T Takigawa, J Takaki
and K Ogino. 2009. Oxidative stress biomarkers and
lifestyles in Japanese healthy people. J Clin Biochem Nutr., 44(2):185-95.
[14] S Kimura, H Yamauchi, Y Hibino, M Iwamoto, K Sera &
K Ogino. 2006. Evaluation of urinary 8-hydroxy
deoxyguanine in healthy Japanese people. Basic & Clinical Pharmacology & Toxicology, 98: 496-502.

Proceedings of the International Conference on Environmental Aspects of Bangladesh (ICEAB 2011)
45
A1.011
Detection of Lead and Arsenic Contamination in Leafy Vegetables
Grown on Musi River Water, Hyderabad, India
P Shalini
Department of Chemistry, V.V. College, Hyderabad, India
Abstract
Food safety and water quality issues are of great concern due to rapid industrialization and improper waste disposal.
Musi River in Hyderabad is heavily polluted with heavy metals. Present study deals with determination of lead and
arsenic concentrations in leafy vegetables grown on Musi water and also underground water in Musi belt. This study
reveals water from Musi river and underground water in nearby region is contaminated and results in contamination of
vegetables it irrigates. In samples grown from both these water sources, Arsenic levels were found negligible. However,
lead concentrations found in leafy vegetables grown on Musi water is ten-folds higher than WHO standards. Further,
vegetables irrigated by Musi belt underground water are also contaminated with lead. HRI was calculated for people
consuming these vegetables. Even moderate contamination of edible leafy vegetables could be fatal because of limited
ability of human body metabolism for removal of lead.
INTRODUCTION
Musi River is located in Hyderabad city (17º 26´ N latitude and 78º 27´ E longitude), the capital of Andhra Pradesh, India. People living in the Musi River belt have a long history of fighting pollution from various industries and allege their air, water and crops have been poisoned for decades by factories making everything from tyres, paints, and textiles. Untreated effluents from these industries and domestic waste water are released into this river. Recent research work [1] has shown that there is
severe heavy metal contamination in this river. Amounts of lead, zinc chromium and nickel are above permissible levels. This waste water is the exclusive alternative source available for farmers to grow vegetables, fodder and few crops [2]. About 920 hectares of land is irrigated with waste water and about 48000 people are directly or indirectly dependent on waste water for their food security [3], [4]. Especially leafy vegetables have a tendency to accumulate metals because of higher transpiration and translocation as compared to other vegetables. Leafy vegetables are cheap and available throughout the year; they are consumed daily, especially by poor people. Lead (Pb) and arsenic (As) enters the human body through leafy vegetables and consumption of Pb can cause many health hazards. Excessive accumulation of these metals creates the problems like cardiovascular, kidney, nervous and bone diseases [5], [6], [7]. To investigate the nature and magnitude of the contamination of the leafy vegetables from their water sources, different leafy vegetables grown on Musi water and also on underground water were analyzed for Pb and As levels; we quantified the levels of contamination to assess whether the vegetables were safe for consumption. The study site is ―Pirjadiguda‖ (Fig. 1).
EXPERIMENTAL
A. Sampling
Four different locations were selected for collecting samples of soil water and leafy vegetables. The locations were selected based on their diversity and representativeness. The leafy vegetables analyzed are shown in Table 1. Different leafy vegetables grown on Musi water and contaminated
with heavy metals are shown in Figure 2.
Fig. 1. The test site (Pirjadiguda) on the bank of river
Musi, Hyderabad, India.
Table 1. Types of leafy vegetables analyzed.
English name Botanical name
Spinach Spinacea oleracea (L.)
Amaranthus, green Amaranthus tricolour (L.)
Roselle Hibbiscus acetocella (Welw.)
Malabar Spinach Basella alba var. rubra (MOI)
Coriander Coriandrum sativum (L.)
Taro Colocasia esculenta (L.)
B. Reagents
All the reagents used were of Analar grade.
Fig. 2. Quantification of the types of vegetable
sampled for the study.

Proceedings of the International Conference on Environmental Aspects of Bangladesh (ICEAB 2011)
46
C. Analysis for heavy metals
Concentrations of Pb and As in Musi Water and underground water (wells, which are 300 meters away from Musi River in Pirjadiguda) are determined (Table 2). Lead and Arsenic contamination in Soils are also found. Similarly leafy vegetables in triplicate were tested for Pb and As (Table 3 & 4 and Fig. 6).
The samples were washed and dried in an oven at 65ºC and dried. 1 gram of dried sample was
subjected to tri acid mixture digestion. Using Perkin Elmer atomic absorption Spectrophotometer (Model No. 700), using the specific lamp, lead and arsenic levels were detected.
Table 2. Water and soil Lead (Pb) and Arsenic (As) contamination and tolerable limits.
Pb
(µg/g)
As
(µg/g)
Pollution
Index for Pb
Musi Water 0.026 ND 0.52
Underground water 0.020 ND 0.40
Tolerable limits for water 0.050 -
Soil at MWIS 19.85 ND 0.1985
Soil at UWIS 15.24 ND 0.1524
tolerable limits for soil 100 -
Arsenic was not detectable and therefore, the tolerable limits are not shown. Pollution index is calculated for lead (Pb).
Tolerable limits for water and soil are taken from Nistida et al., 1982 (8). Pollution index (PI) is calculated [9] using formula.
PI= Conc. of lead in sample/tolerable limits PI for soil and water at MWIS and UWIS are shown in Figure 5.
Table 3. Lead and Arsenic concentrations in various leafy vegetables at Musi Water Irrigated site. (MWIS) (µg/gm)
Names of leafy
vegetables MWIS
Pb
conc.
As
conc.
TF for
Pb
HRI
for Pb
Spinach 2.782 0.003 0.1825 1.2189
Amaranthus,green 2.761 0.003 0.1811 1.2189
Roselle 2.658 0.003 0.1744 1.1735
Malbar Spinach 2.656 0.003 0.1742 1.172
Coriander 1.322 - 0.0867 0.1167
Taro 2.884 0.003 0.1892 1.273
Table 4. Lead and Arsenic concentrations i8 various leafy vegetables at under Water Irrigated site. (UWIS) (µg/gm)
Names of leafy
vegetables UWIS
Pb
conc.
As
conc.
TF for
Pb
HRI
for Pb
Spinach 3.118 0.004 0.1570 1.3767
Amaranthus,green 3.002 0.004 0.1512 1.3253
Roselle 2.886 0.004 0.1454 1.2741
Malbar Spinach 2.908 0.004 0.1465 1.2838
Coriander 1.348 - 0.0679 0.1190
Taro 3.264 0.004 0.1644 1.4410
Table 5. Comparison of TF of leafy vegetables grown at MWIS and UWIS
Names of leafy
vegetables TF for Pb TF for Pb
MWIS UWIS
Spinach 0.1570 0.1825 Amaranthus,green 0.1512 0.1811 Roselle 0.1454 0.1744 Malbar Spinach 0.1465 0.1742
Coriander 0.0679 0.0867 Taro 0.1644 0.1892
Fig.. Lead (Pb) contamination in water (conc. in µg/ml).
Fig. 4. Lead contamination in soil (conc. in µg/g).
Fig. 5. Lead pollution index for soil and water.
0
0.01
0.02
0.03
0.04
0.05
0.06
Musi Water Undergroundwater
Permissible level
Pb conc.
0
20
40
60
80
100
120
Soil at MWIS Soil at UWIS Permissiblelevels
Pb conc
0
0.1
0.2
0.3
0.4
0.5
0.6
Musi Water Undergroundwater
Soil at MWIS Soil at UWIS
Pollution Index
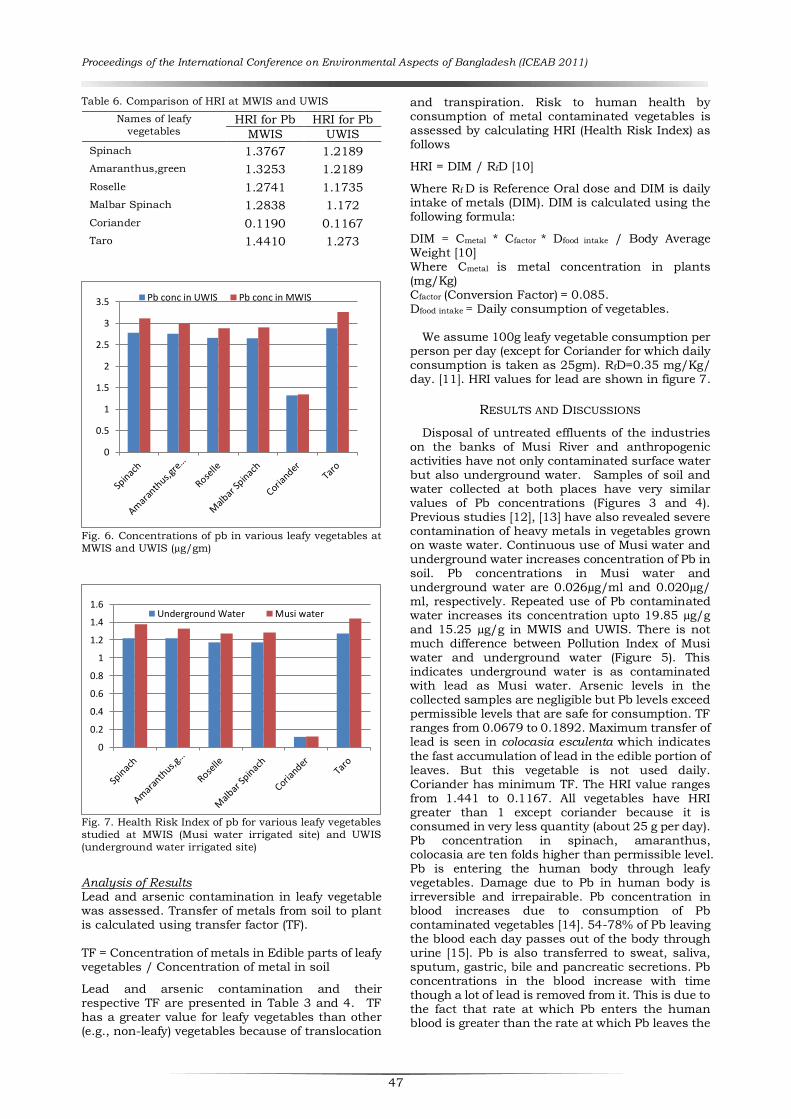
Proceedings of the International Conference on Environmental Aspects of Bangladesh (ICEAB 2011)
47
Table 6. Comparison of HRI at MWIS and UWIS
Names of leafy
vegetables HRI for Pb HRI for Pb
MWIS UWIS
Spinach 1.3767 1.2189
Amaranthus,green 1.3253 1.2189
Roselle 1.2741 1.1735
Malbar Spinach 1.2838 1.172
Coriander 0.1190 0.1167
Taro 1.4410 1.273
Fig. 6. Concentrations of pb in various leafy vegetables at
MWIS and UWIS (µg/gm)
Fig. 7. Health Risk Index of pb for various leafy vegetables
studied at MWIS (Musi water irrigated site) and UWIS
(underground water irrigated site)
Analysis of Results Lead and arsenic contamination in leafy vegetable was assessed. Transfer of metals from soil to plant is calculated using transfer factor (TF).
TF = Concentration of metals in Edible parts of leafy vegetables / Concentration of metal in soil
Lead and arsenic contamination and their respective TF are presented in Table 3 and 4. TF has a greater value for leafy vegetables than other (e.g., non-leafy) vegetables because of translocation
and transpiration. Risk to human health by consumption of metal contaminated vegetables is assessed by calculating HRI (Health Risk Index) as follows
HRI = DIM / RfD [10]
Where Rf D is Reference Oral dose and DIM is daily intake of metals (DIM). DIM is calculated using the following formula:
DIM = Cmetal * Cfactor * Dfood intake / Body Average Weight [10] Where Cmetal is metal concentration in plants (mg/Kg) Cfactor (Conversion Factor) = 0.085. Dfood intake = Daily consumption of vegetables.
We assume 100g leafy vegetable consumption per person per day (except for Coriander for which daily consumption is taken as 25gm). RfD=0.35 mg/Kg/ day. [11]. HRI values for lead are shown in figure 7.
RESULTS AND DISCUSSIONS
Disposal of untreated effluents of the industries on the banks of Musi River and anthropogenic activities have not only contaminated surface water but also underground water. Samples of soil and water collected at both places have very similar values of Pb concentrations (Figures 3 and 4). Previous studies [12], [13] have also revealed severe contamination of heavy metals in vegetables grown on waste water. Continuous use of Musi water and underground water increases concentration of Pb in soil. Pb concentrations in Musi water and underground water are 0.026µg/ml and 0.020µg/ ml, respectively. Repeated use of Pb contaminated water increases its concentration upto 19.85 µg/g and 15.25 µg/g in MWIS and UWIS. There is not much difference between Pollution Index of Musi water and underground water (Figure 5). This indicates underground water is as contaminated with lead as Musi water. Arsenic levels in the collected samples are negligible but Pb levels exceed permissible levels that are safe for consumption. TF ranges from 0.0679 to 0.1892. Maximum transfer of lead is seen in colocasia esculenta which indicates
the fast accumulation of lead in the edible portion of leaves. But this vegetable is not used daily. Coriander has minimum TF. The HRI value ranges from 1.441 to 0.1167. All vegetables have HRI greater than 1 except coriander because it is consumed in very less quantity (about 25 g per day). Pb concentration in spinach, amaranthus, colocasia are ten folds higher than permissible level. Pb is entering the human body through leafy vegetables. Damage due to Pb in human body is irreversible and irrepairable. Pb concentration in blood increases due to consumption of Pb contaminated vegetables [14]. 54-78% of Pb leaving the blood each day passes out of the body through urine [15]. Pb is also transferred to sweat, saliva, sputum, gastric, bile and pancreatic secretions. Pb concentrations in the blood increase with time though a lot of lead is removed from it. This is due to the fact that rate at which Pb enters the human blood is greater than the rate at which Pb leaves the
0
0.5
1
1.5
2
2.5
3
3.5 Pb conc in UWIS Pb conc in MWIS
0
0.2
0.4
0.6
0.8
1
1.2
1.4
1.6Underground Water Musi water

Proceedings of the International Conference on Environmental Aspects of Bangladesh (ICEAB 2011)
48
human body, which results in bio-accumulation and also bio-magnification. Hence people consuming vegetables with HRI greater than 1 are at risk because blood Pb levels cross permissible levels within a short duration.
Several studies have shown that high arsenic contamination is found in drinking water, soil, vegetables grown in Samata village and also other places in Bangladesh [16], [17]. About 80 million people in Bangladesh are at risk due to consumption of arsenic contaminated water which is 5 folds higher than limits set by the WHO. Arsenic and lead concentrations in vegetables are below permissible level but they are significant as it becomes regular source contamination in diet. Many researchers have studied about heavy metal contamination in Japan [18], [19]. Surveys were conducted in Japan from 2003 for lead, arsenic, mercury to collect basic data for future risk management measures. The conclusions of these surveys are that lead is less than 10% of allowable weekly intake set by JECFA. Total arsenic intake is about 30% of allowable intake of inorganic arsenic assessed by JECFA [18], [19]. We compared our results with similar health risk assessments elsewhere. People in Bangladesh are at higher health risk due to consumption of Arsenic through drinking water, vegetables, and crops. People in the present study are posing risk due to consumption of lead contaminated vegetables; risk due to consumption of Arsenic appeared to be negligible.For people in Japan, lead and arsenic consumption are less than the allowable intake. Therefore health risk index due to lead and arsenic is less than 1 for people in Japan
CONCLUSION
Water can be prevented from Pb contamination by treating the effluents before releasing into Musi River. Growing vegetables on the contaminated water should be avoided but as waste water is the cheapest available source for irrigation, wetlands should be constructed where different marine algae can be grown. These algae have high Biosorptive
uptake of Pb up to 270 mg/g of biomass [20]. If the same practice of growing vegetables on contaminated water is continued, then continuous monitoring of Pb levels is essential to know whether vegetables are safe and healthy for consumption.
ACKNOWLEDGMENT
The author gratefully acknowledges support from the UGC, New Delhi for granting a minor research project. (MRP – 3171/09)(MRP –UGC/SERO).
REFERENCES
[1] BG Raj, MC Patnaik, SP Babu, B Kalakumaar, MV
Singh and J Ahuja. 2006. Heavy metal contaminants
in water-soil plant animal continuum due to
pollution of Musi river around Hyderabad in India.
Indian T. Anim. Sci., 76 : 131-133.
[2] SJ Buechler, G Devi, L Raschid-Sally. 2002.
Livelihoods and wastewater irrigated agriculture
along the Musi River in Hyderabad City, Andhra
pradesh, India.Urban Agrie.Mag., 8 : 14-17.
[3] S Buechler and G Devi. 2003. Household Food
Security and Waste water dependent Livelihood
Activities aking the Musi River in Andhra Pradesh,
India. Report submitted in Jan. 2003 to WHO,
Geneva, Switzerland.
[4] SJ Buechler, GM Devi. 2003. The impact of water
Conservation and Reuse on the household economy.
In :Proceedings of of the Eighth International
Conference on Water Conservation and Reuse of
Waste water.
[5] L Jarup. 2003. Hazards of heavy metals
contamination. Br. Med. Bull., 68:167-182.
[6] K Steeland and P Boffetta. 2000. Lead and cancer in
humans: Where are we now? Am. J. Ind. Med., 38:295-299.
[7] WHO. 1992. Lead Environmental health Criteria,
Geneva. Vol. 165.
[8] H Nistida, F Miyai, E Tada, S Suzuk.. 1982.
Computation of the index of pollution caused by
heavy metaks in river sediment. Environ. Pollut., 4:
241-248.
[9] A Kloke. 1979. Content of arsenic, cadmium,
chromium, flourine, lead, mercury and nickel in
plants grow on contaminated soil. Paper presented at
United nations ECE Symposium.
[10] S Khan, R Farooq, S Shabhaz, MA Khan and M
Sadique. 2009. Health Risk Assessment of heavy
metals for population via consumption of vegetables.
World Applied Sciences Journal, 6(12):1602-1606.
[11] DEFRA (Department of Environment Food and Rural
affairs). 1999. Total diet study – aluminium, arsenic,
cadmium, chromium, copper, lead . mercury, nickel,
selenium, tin, and zinc. The Stationery office, London.
[12] A Singh, RK Sharma, M Agrawal, FM Marshall. 2010
Risk Assessment of heavy metal toxicity through
contaminated vegetables from waste water irrigated area
of Varanasi, India. tropical Ecology 51(2s):275-387.
[13] NJ Kumari, V Venkateshwarulu, B Raj Kumar. 1991.
Heavy Metal Pollution and phytoplankton in the River
Musi, Hyderabad, India. Int. J. Environ. Stud., 38:157-164.
[14] N Sridharachary, CT Kamala and RDS Suman. 2008.
Assessing risk if heavy metals from consuming food
grown on sewage irrigated soils and food chain
transfer. Ecotoxicology and Environ mental Safety
59:513-524.
[15] MB Rabinowitz, GW Wetherill, and JD Kopple. 1976.
Kinetic Analysis of Lead Metabolism in Healthy
Humans. The Journal of Clinical Investigation, 58,
260-270.
[16] MGM Alam, ET Snow, A Tanaka. 2003. Arsenic Heavy
metal contamination of vegetables grown in Samata
village, Bangladesh. The science of the total Environment, 308(1-39), June 2003, 83-96.
[17] DA Ashan and TA Del Valls. 2011. Impact of arsenic
contaminated Irrigation water water in food chain: An
overview from Bangladesh. Int. J Environ Res., 5(3):
627-638.
[18] T Yoneyama. 2007, Accumulation of heavy metals in
plants and intake by humans. Proceedings of fourth
Agromedicine Symposium in Kitasato University.
[19] M Segawa. 2007. Status of codex Alimentarius
commision and Japan's approach. Proc. of Fourth
Agromedicine Symposium in Kitsato University.
[20] B Volesky and ZR Holan. 1995. Biosorption of heavy
metals. Biotechnology Progress, 11(3): 235-250.

Proceedings of the International Conference on Environmental Aspects of Bangladesh (ICEAB 2011)
49
A1.012
Photodegradation of Benzoic Acid in Aqueous Solution by
UV/Magnetic Photocatalyst
Gui-Bing Hong1, Te-Li Su1, Chyow-San Chiou2, Hua-Wei Chen1 and Yu-Huan Li2
1Department of Cosmetic Application and Management, St. Mary’s Medicine, Nursing and Management College, Yi-Lan 266, Taiwan; e-mail: [email protected]
2Department of Environmental Engineering, National I-Lan University; I-Lan, Taiwan
Abstract
The purpose of this research is to investigate the removal of benzoic acid by magnetic photocatalytic oxidation process.
Therefore, this study was to prepare a magnetic photocatalyst (TiO2/SiO2/Fe3O4) that can be recycled by using an
external magnetic field. Magnetic photocatalysts were characterized by X-ray diffraction (XRD), vibrating sample
magnetometry (VSM) and Fourier transform infrared (FTIR) spectroscopy. The decomposition of Benzoic acid by the
UV/TiO2/SiO2/Fe3O4 process was higher than that for UV/TiO2(P25) process in this study. Furthermore, the
paramagnetic behaviors of the prepared TiO2/SiO2/Fe3O4 gave rise to the magnetic photocatalyst, which could be
separated more easily through the application of a magnetic field for reuse.
INTRODUCTION
Benzoic acid is one of the oldest chemical preservatives used in food, cosmetics and drugs. A common objective of Advanced Oxidation Processes (AOPs) [1-3] is to produce a large amount of radicals
(especially . OH), to oxidize organic matter.
Semiconductor photocatalysis has become increasingly promising technology in environmental remediation. Typically, catalytic ozonation and photocatalytic oxidation are conducted in a suspension of submicrometer-sized particles [2-4] and therefore requires an additional separation step to remove the catalyst from the treated water. One approach in overcoming this drawback has been to develop a magnetic photocatalyst that allows for easy catalyst removal by the use of an external magnet, simplifying the downstream recovery stage [4,5]. Thus, this study investigates the reaction behavior of photocatalytic processes with magnetic photocatalyst (Fe3O4 core and TiO2/SiO2 shell) in treating wastewater to enhance the activity of the prepared magnetic photocatalyst and recover the photocatalyst.
MATERIALS AND METHODS
The batch cylindrical photoreactor was made of Pyrex glass with an effective volume of 1.5 liter, and was water-jacketed to maintain the solution temperature, as illustrated in Fig. 1. The UV light illumination was carried out using two black lamp (Sparkie BLB-S8W) of 8 W power with the maximum intensity at 365 nm. The aqueous solution containing benzoic acid was initially transferred to the column reactor, and the pH value of the solution was controlled by adding sodium hydroxide and/or perchlorates during the entire reaction time. A total of 1.08 L of aqueous solution containing 20 g of Fe3O4 particles was held in a 2-L beaker at 90°C; the pH was maintained at 9.5 with 0.1 N NaOH, while being stirred by a mechanic stirrer. Magnetic photocatalysts were characterized by X-ray diffraction (XRD, Rigaku RTP 300), vibrating sample magnetometry (VSM, Lake Shore 7407, Lake Shore) and Fourier transform infrared (FTIR, Spectrum 100, Perkin Elmer) spectroscopy.
Fig. 1. Experimental sketch of UV/TiO2/SiO2/Fe3O4
system.
RESULTS AND DISCUSSIONS
The FTIR spectra of Fe3O4, SiO2/Fe3O4 and the prepared magnetic photocatalyst (TiO2/SiO2/Fe3O4) are shown in Fig. 2. The results exhibits two basic characteristic peaks of Fe3O4, SiO2/Fe3O4 and TiO2/ SiO2/Fe3O4 at about 3300 cm−1 (O-H stretching) and 550 cm−1 (Fe-O vibration), which were attributed to the presence of FeOH in Fe3O4 [6]. The peak at 1100 cm−1 was attributed to the Si-O-Si bond stretching of SiO2/Fe3O4 and TiO2/SiO2/Fe3O4. This result confirms that SiO2 was successfully coated on Fe3O4.
The magnetic properties of the SiO2/Fe3O4 and Fe3O4 core were measured with a vibrating sample magnetometer (VSM), as shown in Fig. 3. The M-H plots showed the change in Ms of the particles, after the incorporation of SiO2 and TiO2 shell. A decrease in Ms from 61.8 to 28.0 emu g-1 was observed in SiO2/Fe3O4. The decrease in mass saturation magnetization was ascribed to the contribution of the non-magnetic SiO2 and TiO2 shell to the total
mass of particles. This observation is similar those in reports where the attached gold shell was found to lower the saturation magnetization of magnetite particles [7]. The results indicated that the prepared samples exhibited paramagnetic behaviors at room temperature [5]. The paramagnetic behaviors of the prepared TiO2/SiO2/Fe3O4 gave rise to the magnetic photocatalyst TiO2/SiO2/Fe3O4, which could be separated more easily through the application of a magnetic field.
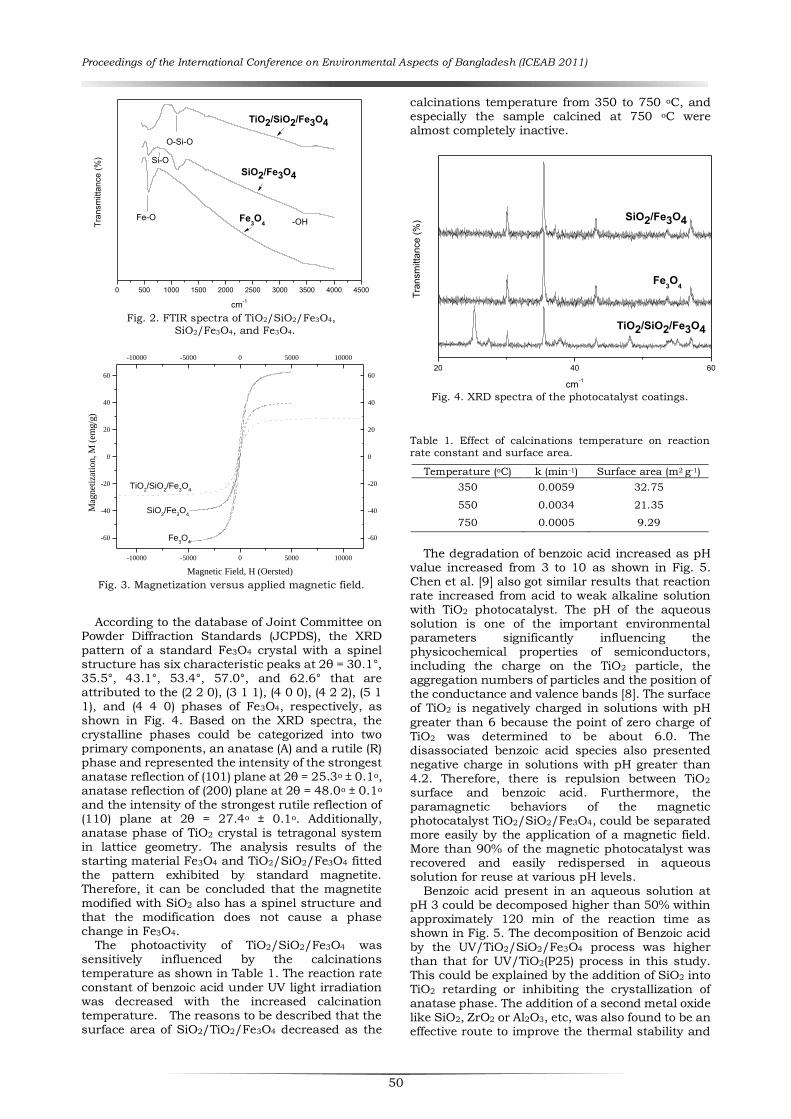
Proceedings of the International Conference on Environmental Aspects of Bangladesh (ICEAB 2011)
50
Fig. 2. FTIR spectra of TiO2/SiO2/Fe3O4,
SiO2/Fe3O4, and Fe3O4.
Fig. 3. Magnetization versus applied magnetic field.
According to the database of Joint Committee on Powder Diffraction Standards (JCPDS), the XRD pattern of a standard Fe3O4 crystal with a spinel structure has six characteristic peaks at 2θ = 30.1°, 35.5°, 43.1°, 53.4°, 57.0°, and 62.6° that are attributed to the (2 2 0), (3 1 1), (4 0 0), (4 2 2), (5 1 1), and (4 4 0) phases of Fe3O4, respectively, as shown in Fig. 4. Based on the XRD spectra, the crystalline phases could be categorized into two primary components, an anatase (A) and a rutile (R) phase and represented the intensity of the strongest anatase reflection of (101) plane at 2θ = 25.3o ± 0.1o, anatase reflection of (200) plane at 2θ = 48.0o ± 0.1o and the intensity of the strongest rutile reflection of (110) plane at 2θ = 27.4o ± 0.1o. Additionally, anatase phase of TiO2 crystal is tetragonal system in lattice geometry. The analysis results of the starting material Fe3O4 and TiO2/SiO2/Fe3O4 fitted the pattern exhibited by standard magnetite. Therefore, it can be concluded that the magnetite modified with SiO2 also has a spinel structure and that the modification does not cause a phase change in Fe3O4.
The photoactivity of TiO2/SiO2/Fe3O4 was sensitively influenced by the calcinations temperature as shown in Table 1. The reaction rate constant of benzoic acid under UV light irradiation was decreased with the increased calcination temperature. The reasons to be described that the surface area of SiO2/TiO2/Fe3O4 decreased as the
calcinations temperature from 350 to 750 oC, and especially the sample calcined at 750 oC were almost completely inactive.
Fig. 4. XRD spectra of the photocatalyst coatings.
Table 1. Effect of calcinations temperature on reaction rate constant and surface area.
Temperature (oC) k (min-1) Surface area (m2 g-1)
350 0.0059 32.75
550 0.0034 21.35
750 0.0005 9.29
The degradation of benzoic acid increased as pH
value increased from 3 to 10 as shown in Fig. 5. Chen et al. [9] also got similar results that reaction rate increased from acid to weak alkaline solution with TiO2 photocatalyst. The pH of the aqueous solution is one of the important environmental parameters significantly influencing the physicochemical properties of semiconductors, including the charge on the TiO2 particle, the aggregation numbers of particles and the position of the conductance and valence bands [8]. The surface of TiO2 is negatively charged in solutions with pH
greater than 6 because the point of zero charge of TiO2 was determined to be about 6.0. The disassociated benzoic acid species also presented negative charge in solutions with pH greater than 4.2. Therefore, there is repulsion between TiO2 surface and benzoic acid. Furthermore, the paramagnetic behaviors of the magnetic photocatalyst TiO2/SiO2/Fe3O4, could be separated more easily by the application of a magnetic field. More than 90% of the magnetic photocatalyst was recovered and easily redispersed in aqueous solution for reuse at various pH levels.
Benzoic acid present in an aqueous solution at pH 3 could be decomposed higher than 50% within approximately 120 min of the reaction time as shown in Fig. 5. The decomposition of Benzoic acid by the UV/TiO2/SiO2/Fe3O4 process was higher than that for UV/TiO2(P25) process in this study. This could be explained by the addition of SiO2 into TiO2 retarding or inhibiting the crystallization of anatase phase. The addition of a second metal oxide like SiO2, ZrO2 or Al2O3, etc, was also found to be an effective route to improve the thermal stability and
0 500 1000 1500 2000 2500 3000 3500 4000 4500
-OH
Si-O
O-Si-O
Fe-O
TiO2/SiO2/Fe3O4
SiO2/Fe3O4
Fe3O4
Tra
nsm
itta
nce
(%
)
cm-1
-10000 -5000 0 5000 10000
-60
-40
-20
0
20
40
60
-10000 -5000 0 5000 10000
-60
-40
-20
0
20
40
60
TiO2/SiO
2/Fe
3O
4
SiO2/Fe
3O
4
Fe3O
4
Magnetic Field, H (Oersted)
Mag
net
izat
ion, M
(em
g/g
)
20 40 60
TiO2/SiO2/Fe3O4
SiO2/Fe3O4
Fe3O4
Tra
nsm
itta
nce
(%
)
cm-1

Proceedings of the International Conference on Environmental Aspects of Bangladesh (ICEAB 2011)
51
UV photocatalytic activity of TiO2 [10,11]. Among them, SiO2–TiO2 materials were most widely investigated in the photocatalysis field because they exhibited higher photocatalytic activity than pure TiO2.
Fig. 5. Degradation of benzoic acid by UV/magnetic
photocatalyst process at solution temperature = 20 oC, the initial concentration of benzoic acid = 10 mg
L-1, TiO2/SiO2/Fe3O4 = 0.5 g L-1.
CONCLUSION
The degradation of benzoic acid increased as pH value increased from 3 to 10 due to repulsion between TiO2 surface and benzoic acid. Benzoic acid present in an aqueous solution at pH 3 could be decomposed higher than 50% within approximately 120 min of the reaction time. Furthermore, the paramagnetic behaviors of the prepared TiO2/SiO2/Fe3O4 gave rise to the magnetic photocatalyst, which could be separated more easily through the application of a magnetic field for reuse.
ACKNOWLEDGEMENT
This research was supported by the National Science Council, Taiwan, under grant no. NSC 99-2622-E-562-002-CC3.
REFERENCES
[1] HW Chen, YL Kuo, CS Chiou, SW You, CM Ma and
CT Chang. 2010. Mineralization of Reactive Black 5
in Aqueous Solution by Ozone/H2O2 in the Presence
of a Magnetic Catalyst. J. Hazard. Mater., 174:
795-800.
[2] C Comninellis, A Kapalka, S Malato, SA Parsons, I
Poulios, and D Mantzavinos. 2008. Advanced
oxidation processes for water treatment: advances
and trends for R&D. J. Chem. Technol. Biotechnol., 83: 769-776.
[3] HW Chen, CS Chiou and GB Hong. 2011. Effect of
Magnetic Catalysts on Kinetic Behavior of Reactive
Black 5 Decomposition by O3/H2O2 Process. J. Chem. Technol. Biotechnol., 86: 299-305.
[4] J Xu, Y Ao, D Fu and C Yuan. 2008. Low-temperature
Preparation of Anatase Titania-coated Magnetite. J. Phys. Chem. Solids, 69: 1980-1984.
[5] S Watson, J Scott, D Beydoun and R Amal. 2005.
Studies on the Preparation of Magnetic
Photocatalysts. J. Nanopart. Res., 7: 691-705.
[6] NTS Phan and CW Jones. 2006. Highly Accessible
Catalytic Sites on Recyclable Organosilane-
functionalized Magnetic Nanoparticles: An Alternative
to Functionalized Porous Silica Catalysts. J. Mol. Catal. A-Chem., 253: 123-131.
[7] CR Vestal and ZJ Zhang. 2002. Atom Transfer
Radical Polymerization Synthesis and Magnetic
Characterization of MnFe2O4/polystyrene Core/shell
Nanoparticles. J. Am. Chem. Soc., 124:.
14312-14313.
[8] K Kabra, R Chaudhary and RL Sawhney. 2004.
Treatment of Hazardous Organic and Inorganic
Compounds through Aqueous-phase Photocatalysis:
A review. Ind. Eng. Chem. Res., 43: 7683-7696.
[9] HW Chen, Y Ku and YL Kuo. 2007. Effect of Pt/TiO2
Characteristics on Temporal Behavior of o-cresol
Decomposition by Visible Light Induced
Photocatalysis. Water Res., 41: 2069-2078.
[10] XZ Fu, LA Clark, Q Yang and MA Anderson.
1996. Enhanced Photocatalytic Performance of
Titania-Based Binary Metal Oxides: TiO2/SiO2 and
TiO2/ZrO2. Environ. Sci. Technol., 30: 647-653.
[11] RS Sonawane, SG Hegde and MK Dongare. 2002.
Preparation of Titanium(IV) Oxide Thin Film
Photocatalyst by Sol-gel Dip Coating. Mater. Chem. Phys., 70: 744-750.

Proceedings of the International Conference on Environmental Aspects of Bangladesh (ICEAB 2011)
52
A1.013
The Overlooked Reasons for River Destruction and Environmental
Pollutions from the Closest View
Jibril Ahammad
Department of Physics, Shahjalal University of science and technology, Bangladesh e-mail: [email protected]
Abstract
The number of rivers in Bangladesh has come down to 230 including tributaries from about 1000 within an interval of
a few decades. In the rural areas there are some ignored reasons for river devastation such as selecting wrong crops for
ploughing in the rivers, cultivation of fishes in summer in the rivers, founding bamboo bridges in a wrong way, lifting up
sands without any plan, changing the rivers direction in an unscientific way, not displacing the plastics from the river
banks when there is less water etc. Thus the paper analyses the overlooked reasons for river destruction basically in
respect of the small rivers in the rural areas. Then, it denotes unseen some resources of air and other pollutions with a
short description that take place both in urban and rural areas and referred some recommendations for their solutions.
INTRODUCTION
Bangladesh is reputed as a riverine country,
being nurtured by 320(approximately) rivers in its
region [1], [2]. But It is a matter of regret that, this
reputation is about to be lost because of man‘s
aggressive and jealous attitude and activities. The
44 rivers of the northern region, 95 rivers across the
country are on the way of losing existence [3]. For
instance, at Thakurgaon district some rivers have
already died including the choto-chepa, the
Aman-Damon, the Lona, Lachh and additionally the
Kulik is on the way of dying. Condition is getting
worse as days going on. In Bangladesh, 140 million
people directly or indirectly rely on rivers and the
country upholds a river-based economy [4]. So,
rivers are definitely strictly associated with the
name BANGLADEH which are on the risk to be
mislaid. Although several rivers such as the
Buriganga, the Balu, the Sitalakhya , the Turag etc
locating nearby the urban areas, are being
contaminated extremely; complete annihilation is in
reality taken place in case of the small and the
middle sized rivers which flow mostly through the
rural areas.
Contrariety is still continuing against the small
rivers even after taking numerous steps, identifying
the instruments cause to be detrimental for rivers.
In reality, some reasons and resources are not
exposed straightforwardly to the policymakers and
consequently no action is taken against these,
which is ongoing on the sly. For the protection of
the rest rivers, these reasons must be known to all
and sundry.
The main purpose of the study aimed at finding
out the overlooked but significant reasons and
recourses behind river destruction with respect to
the rural and mofussil (subdivision of a district)
areas. On the other hand, the paper shortly denotes
some ignored minor reasons behind air and other
pollutions which should be taken under
consideration. Furthermore, conversing with people
of various stages, it was tried to learn their views
and outlooks about environmental disorders so that
it is easier to select exact schemes for solution.
MATERIALS AND METHODS
The study is essentially based on observation and inspection conditions of the rivers ‗The Tangon‘ and ‗The Suk‘ at various periods since last 5 years along with comparing those circumstances sincerely to reach the destination. The alterations of the rivers corresponding to man‘s activities were observed closely and scrutinized their backgrounds as well as origins for final decision concerning the alternations. Later for verification, experimentation at several rivers in Thakurgaon such as on The Kulik, The Nagar, The Timai at Ranisankail upazilla in the company of The Tangon at Pirganj upazilla was concluded with much care. Talking to the local people as regards the changes of rivers subsequent to modification of their activities and monitoring the places, Full determination on the success of the study came out that was done on those two rivers. In addition, as a resident of a rural area, the work became possible determination the origins of different pollutions and then comparing with the well-known reasons for different pollutions to detect the neglected but noteworthy causes.
RESULTS AND DISCUSSIONS
A. Overlooked reasons behind river destruction
First of all, wrong choice of crop for cultivation into the rivers affects than anything else. Actually, the farmers are interested in plowing crops in the rivers beds to have an extra storage of harvest. They select paddy for cultivation and dig the river surface for this intention devoid of using any nourishment. Categorically, this is not a caustic fact for rivers. But, troubles set up when they prefer sugarcane to paddy for this principle. Actually, they choose a part on the river bed, fill up that part with soil and start to grow sugarcane. In case of paddy farming, necessary nourishment is provided by rivers. As for sugarcane farming, they fill a part, so they don‘t get any support from the river. Therefore, they are to use fertilizer for a good harvest. Thus, it pollutes the rivers.
On the other hand, the surface get stronger, elevated and doesn‘t stay behind plane as well. That‘s mean; rivers misplace its area in this way. For example, Sugarcane field grasps about 50m of total 150m length on the Suk within the last 5 years

Proceedings of the International Conference on Environmental Aspects of Bangladesh (ICEAB 2011)
53
and nowadays the part is being used as a full time agricultural field for any crop except only the rainy season.
Though paddy is preferred, in the recent years it is experiential that the growers plow absolute whimsically and changes the direction of water wherever they wish. Therefore, it is strongly suggested to maintain regulations to let the water be flown on the rivers and to avoid sugarcane into rivers. Parenthetically, this problem was found at each and every spot of where experimentation took place and the concerning general people committed to its impact in such a way narrated above.
Secondly, Fish cultivation in a river without any planning bears immense effect. In a middle-sized or small river, there is not as much of water around the whole year except in the rainy season. Availing this, some people cultivate fish at the two sides or in the surface established into rivers. They pick up an appropriate part in a river; block that part with different elements in order that no water can flow from or into that part and begin cultivating small fishes. As a result, the area as well water supply of that river gets decreased. Note that, arranging it, they can fish only once or at best twice in a year. In previous years, very few people would do this job and they would perform it in such a way that the direction of water would be not hampered. However, in the past, the villagers had a tendency to look for water altogether into the whole river when the water level would decline. But, now things have changed, everyone tends to do work individually by the blocking system. Still, jumbled paddy farming is surely responsible for increasing this tendency. It should be kept in mind how suitable would the chosen part be regarding this respect.
Thirdly, founding bamboo bridges in an incorrect
method contributes to the investigated facts. It basically occurs in the countryside areas where modernization has the few access. Generally, the bamboo bridges over rivers are formed in such a season when the water level is lower and the bridges are formed considering that time. Water level arises later anyhow and therefore bridge touches the water level which causes to obstruct the regular flow of water and may cause to change the river‘s direction.
Fourthly, sand management in an unscientific way, is probably one of the major reasons for river destruction. People use sands of a river in different uses at different times. As river is a natural aspect, man tends to use it whimsically and the same job is done for lifting up sands too. If someone lifts up sands from here, then another one does it from there without maintaining any rule. Thus, a good number of wholes form at different spots which affect the whole water management system. Later in the rainy season though the wholes get filled by water, it is experimented that in next summer season there lacks water than the previous year. Moreover, destruction is also found for not following a scientific way. For instance, lifting up sands from the two sides just touch the water, regular flow of water and the river‘s direction take changes that may have a long term effect. When the experimentation was done, this problem was observed all most in all the rivers.
Fifthly, sometimes the cultivators make a big fault even after choosing accurate crop for cultivation. They incise river banks in different purposes such as for irrigation to the nearest crops fields (if the embankment is upper), to get more space for cultivation (if the river embankment is lower). There is a long-term effect for this reason on rivers which can be avoided being conscious while incising the embankments.
Sixthly, there founds slopes of blocks made by cement, sands to save rivers from erosion at different places especially in the mofussil areas. People throw different wastes on these places considering these as the open field dustbins. If it rains then the fact is apparent, dusts fall upon rivers. This reasons actually related to river pollution rather destruction. Sixthly, in the rainy season the general people enhance throwing wastes including plastics than any other season. When the river becomes dry, plastics agglomerate towards the embankments and sprinkle towards nearer lands. Due to not displacing these; fertility of the nearer lands gets lowered. The above reasons followed by destruction or pollution are simply ignored by the people in general due to their lack of knowledge or to have crops as their satisfaction.
B. Overlooked reasons behind air and other pollutions
1. Railway station is a renowned source for air and other pollutions. Burning plastics is very common there. Nobody helps them to get out of it which is really obligatory as such types of jobs are their earning sources.
2. Markets both of rural and mofussil areas are one of the major places of various environmental pollutions. Such a place is commonly dirty. But everybody neglect this considering it as a common fact.
3. Management of the wastes of the hotels for eating is done improperly mostly in the rural areas.
4. From discussions with various types of people in Thakurgaon, it astonishes that about 80% of the people in rural areas don‘t know the ABC about why they should protect the environment from pollutions. The rate follows 40% in the mofussil areas. However, only 10-15% knows the proper steps that need to be taken.
RECOMMENDATIONS
1. After informing proper information‘s while discussions with the common people it also astonishes that 100% of the rural people and only 60% of the people of mofussil showed interest to work for environment though literacy rate is higher in mofussil areas. The rest 40% of mofussil area actually hopeless of the environment or prefer to remain busy at self-interests or blind due to superstitions. Moreover, the rural people showed much more
positive outlook to learn more on the safety of the environment. Hence, necessary measurements must be taken to let them to

Proceedings of the International Conference on Environmental Aspects of Bangladesh (ICEAB 2011)
54
know in details. It is really tough for the government satisfying the purpose alone. Environmental organizations (national or international) must be involved in it with their volunteers having significant plans. If people can know about the real facts, consciousness will automatically generate among them.
2. In reality, man pollutes environment for energy production by and large. Bangladesh has some talented persons regarding this respect. For example, electricity production from stone-chips (PKL electricity production invented by Dr. Kamrul Alam, professor of Jagannath University in Bangladesh, can produce electricity of 143 BDT only by investing 1 core BDT. Moreover this process can easily be available and perfect too for the rural people [4], [5].Such inventions should be used throughout Bangladesh to cope with the present energy requirement. In Bangladesh, there are some more intellectuals who are rarely exposed since they can‘t afford to publish their inventions in a scientific journal due to some restrictions. So, the government and environmental organizations need to keep watch to utilize such extra-ordinaries.
3. The school students may be the main weapon to save the environment since they are willing to do whatever they learn at this stage. It should be mentioned that involvement can be found among the rural people much than expectation if media personalities are involved in it.
4. Much research on the safety of environment has been done. But, the policymakers need to know all about these opinions in details to take the proper steps. So, it is strongly recommended to provide a copy of each journal on environment to the policymakers.
CONCLUSION
Some unfamiliar sources of river destruction accompanied by environmental pollutions have been showed in this paper. Nevertheless, deep study on the topics may bring more specialties. By the way, this paper probably brings the picture of
destruction of rivers and pollution in environment all most 80% area of Bangladesh as 80% of the total area of Bangladesh is either rural or mofussil area [6], [7].
ACKNOWLEDGEMENT
The Author is highly thankful to Dr. Md Jahir Bin
Alam, professor, Department of Civil and Environmental Engineering, Shahjalal University of science and technology for his technical assistance and also to the ICEAB11 committee for providing the required supports.
REFERENCES
[1] Online resource: http://www.edutoolsbd.com/
bangladesh/360-bd-river.
[2] Online resource: http://www.irinnews.org/Report.
aspx?ReportId=79569
[3] Online resource: http://www.defence.pk/forums/
bangladesh-defence/48663-44-rivers-northern-regio
n-dying.htm
[4] The Daily Naya Diganta, 31st March,2009[
[5] Online resource: http://gscience.gurpukur.com/
product_info.php?cPath=153&products_id=836
[6] Online resource: http://www.ruralpovertyportal.org/
web/guest/country/home/tags/bangladesh
[7] Online resource: http://www.unicef.org/bangladesh
/RURAL_Water_Sanitation_and_Hygiene.pdf.

Proceedings of the International Conference on Environmental Aspects of Bangladesh (ICEAB 2011)
55
A1.014
Improvement of WO3 Thin Film Sensor by Doping
for Detecting NOx Gas in Air
MMH Bhuiya, F Mitsugi and T Ikegami
Abstract In the present study, we report the improvement of WO3 sensor by doping with titanium (Ti) prepared by pulsed excimer
laser deposition and dc sputtering. The substrate temperature and the oxygen gas pressure were changed from 400 to
500 °C and from 100 to 300 mTorr, respectively during deposition. The sensitivity of the prepared sensor substrates,
Al2O3 with Pt interdigitated electrodes, to NO gas flow was measured using two terminal resistance methods in a
chamber at atmospheric pressure. The sensitivity of the WO3 and Ti doped WO3 sensors were measured for different
concentrations of NO or NO2 gas using N2 or air as a base to get required concentration of NO or NO2 gases in a total flow
rate of 100 sccm. The sensitivity of the WO3 and Ti doped WO3 thin films measured at temperature of 200°C for 10, 20
and 50 ppm NO gas. The Ti doped WO3 sensor showed higher sensitivity at lower operating temperature and also to
lower concentration of NO gas compared to the undoped WO3 sensor. The sensitivity of the WO3 sensors was observed
to be increased by doping with Ti.
INTRODUCTION
NOx is one of the main pollutants in air and it is a serious problem over the world. The increasing demand of fast, accurate and low cost air quality analysis techniques for domestic and industrial environmental monitoring, automotive applications, sensors networks is tailoring the research toward new materials and techniques for improvement of the commercial sensors. Metal-oxide semiconducting layers are the most promising conductometric chemical sensors among solid-state devices. The sensing properties are based on reactions between semiconductor oxides and gases in the atmosphere. WO3 is a promising material for NOx gas detection [1]. The detection of NOx is important for monitoring environmental pollution resulting from combustion or automotive emissions [2]. Existing gas sensor materials include semiconducting metal oxides [3], silicon [4-5] and organic materials [5-6]. Semiconducting metal oxides such as WO3 and SnO2 had been widely used for NO2 detection [2, 7]. These sensors have to operate at 200–500 °C in order to improve the sensitivity by enhancing the chemical reaction between gas and the sensor material [8]. Nitrogen oxide NOx (NO or NO2), are known to be a kind of toxic gas that can cause diseases of the respiratory system and also is harmful to the environment as a source of acid rain and fog [9]. In order to detect such a hazardous NOx
gas, there have been lots of efforts in developing a variety of NOx gas sensors such as electrochemical sensor [8], SAW sensor [10], and polymer sensor [11]. Recently, much interest has been focused on the metal oxide semiconductor sensors (SnO2, ZnO, WO3 and TiO2, etc. [12, 13 and 14] because of their structural simplicity and low cost. Especially, WO3 is considered as one of the best candidates for NOx sensing materials due to its good selectivity to low concentration NOx gas [15]. WO3 is an n-type semiconductor and the sensing mechanism of the sensor lies in the change of film resistance resulting from physisorption, chemisorption and catalytic reactions of gas-phase species with the film surface [16]. Several methods have been used to prepare WO3 thin films, including sol–gel, magnetron sputtering, thermal evaporation and plasma
enhanced chemical vapor deposition [17-22]. Pulsed laser deposition (PLD), is a useful method since it was used successfully to synthesize high-temperature superconductor films in 1987 is very effective to deposit complex films with high quality [23-25]. In this study, WO3 films were deposited doped with Ti to improve the sensitivity of the WO3 films.
EXPERIMENTAL DETAILS
Experimental setup for PLD system and schematic illustration of the KrF excimer pulsed laser deposition (PLD) system is shown in Fig.1.
Fig. 1. Schematic of PLD system
Before deposition, the chamber was evacuated to a base pressure of 1.99 ×10⁻² Pa by a turbo-molecular pump. A target (WO3, purity of 99.99%, diameter of 30 mm) was ablated by KrF excimer laser (Lambda Physik LPX305icc, maximum energy of 650 mJ, λ=248 nm, pulse duration=25 ns) with the repetition rate of 10 Hz for 10 minutes. The substrate was located at a distance of 6 cm from the WO3 target. Oxygen pressure in the chamber was maintained from 13.3 to 26.6 Pa during the deposition by a mass flow controller. WO3 thin films were deposited on silicon substrate Si (001) and also on Al2O3 sensor substrates with Pt interdigitated electrodes by PLD for 10- 15 minutes in oxygen ambient of 13.3 Pa and at a substrate

Proceedings of the International Conference on Environmental Aspects of Bangladesh (ICEAB 2011)
56
temperature of 400 °C using an IR lamp. The gas sensor based on WO3 thin film doped with different amount of Ti was prepared by PLD and dc sputtering. Titanium in the form of wire was used for sputtering for the last 2 minutes during PLD deposition for a period of 10 minutes. During sputtering argon (Ar) gas of 25 sccm was used in the chamber. The sensitivity of the prepared sensor substrates to NO gas flow was measured using two terminal resistance methods in a chamber at atmospheric pressure and at operating temperature of 25 to 250 °C shown in Fig.2.
Fig. 2. Setup for gas sensor measurement system
The sensor was annealed few hours before
measurement to stabilize the sensor properties. The sensitivity of the sensors to NO and NO2 gas is defined as Sensor
Sensitivity =(Rg-Ra) /Rg×100 %, ……. (1)
The sensor sensitivity S (%) is defined as the ratio of the change in the electrical resistance in air (Ra) or in N2 (RN2) and test gas (Rg), ΔR = Rg − Ra or (RN2), to its resistance in dry air, Ra or RN2. i.e., S= ΔR/Ra or RN2×100%.
Where, Rg is the resistance of the sensor in NO or NO2 gas and Ra is that in N2 or air. Before exposure to NO gas, the gas sensor measurement chamber was evacuated and then filled with N2 or dray air and then the sensor was heated to a required temperature. When the resistance of the sensor reached to stable value, NO gas was flowed for 20 minutes and then N2 gas was introduced again keeping turn off the NO gas flow for 20 minutes. Similarly several cycles of flow was completed for different concentration of NO gas from 2-10 ppm.
RESULTS AND DISCUSSIONS
Fig. 3 shows the response of the sensor to 2, 5, and 10 ppm NO gas in N2. Figures 4 and 5 shows the response of the WO3 and Ti doped WO3 thin film sensors to 2-5 and 10 ppm NO gas in air at temperature of 200°C. The resistance of the sensors was increased with exposure of NO gas which indicates semi conducting property of the sensor. The sensitivity of WO3 thin film gas sensor was 5, 10 and 14% for 2, 5 and 10 ppm NO gas (Fig.4), respectively, whereas in Fig.5, it was 102,170,
227% for NO2 gas. Thus, after doping with Ti, the sensitivity was
increased by many folds compared with undoped WO3 thin film sensor. From AFM measurement, not shown here, the grain size of the film was found to
be decreased, leading to increasing surface are and this might be able to increase the sensitivity.
120
125
130
135
140
145WO3 only NO-N2
Re
sist
ance
)
Time (min)855 10525 6545 125
N2 N
2
N2
N2
10 p
pm
NO
20 p
pm
NO
50 p
pm
NO
Fig. 3. Response to NO gas in N2 of WO3 sensor only
150
155
160
165
170
175WO3 only, 200 T, NO-Air
0 25 50 75 100 125
Re
sis
tance
()
Time(min)
N2
10 p
pm
NO
10 p
pm
NO
10 p
pm
NO
N2
N2
N2
Fig. 4. Response to NO gas in air of WO3 sensor only
2000
3000
4000
5000
6000
7000
8000
0 20 40 60 80 100 120
WO3-Ti, 200 T, ppm NO-Air
Re
sist
ance
)
Time(min)
N2
10 p
pm
NO
10
pp
m N
O
10
pp
m N
O
N2
N2
N2
Fig. 5. Response to NO gas in air of Ti doped -WO3 sensor
Fig. 6 and 7 shows the sensitivity of undoped WO3
and Ti doped WO3 thin film sensors to NO2 gas in air.
PC
NO+N2
DMM
N2
Temp. Controller Exhaust
Sensor
Valve
MFC Lead wire
Silver paste
Al2O3 substrate
CNT thin film Pt electrode

Proceedings of the International Conference on Environmental Aspects of Bangladesh (ICEAB 2011)
57
170
175
180
185
190
195
0 20 40 60 80 100 120 140 160
WO3 only, 200 T ppm NO2-Air
Re
sist
ance
(
Time (min)
N2
N2
N2
N2
10 p
pm
NO
2
10
pp
m N
O2
10
pp
m N
O2
Fig. 6. Response to NO2 gas in air of WO3 sensor only
2000
4000
6000
8000
1 104
1.2 104
0 20 40 60 80 100 120
WO3-Ti, 200 T, NO2-Air
Re
sis
tance
Time(min)
N2
N2
N2
N2
2 p
pm
NO
2-A
ir
5 p
pm
NO
2-A
ir
2000
4000
6000
8000
1 104
1.2 104
0 20 40 60 80 100 120
WO3-Ti, 200 T, NO2-Air
Re
sis
tance
Time(min)
N2
N2
N2
N2
2 p
pm
NO
2-A
ir
NO
2-A
ir
NO
2-A
ir10 p
pm
Fig. 7
For undoped WO3 thin film, the sensitivity was 6,
12 and 20% to 2, 5 and 10 % NO2, respectively, whereas, for the Ti doped WO3 thin films these values were 104, 171 and 235% respectively. After doping with Ti, WO3 thin film sensor showed higher sensitivity compared with undoped WO3 for both NO and NO2 gas.
CONCLUSION
WO3 thin film gas sensor was prepared by PLD system and the sensitivity was improved by doping with Ti. The sensitivity of the sensor to NO gas in air is higher than that of in N2. The doped thin film sensors showed higher sensitivity to NO and NO2 gas compared with undoped-WO3 thin film sensor. Thus doping with Ti by dc sputtering is an important to enhance the sensitivity of WO3 thin film sensor.
REFERENCES
[1] T Inoue, K Ohtsuka, Y Yoshida, Y Matsuura and Y
Kajiyama. Metal oxide semiconductor NO2 sensor.
Sens. Actuators, B 24–25 (1995), pp. 388–391.
[2] Y Shimizu and M Egashira. 1999. Basic aspects and
challenges of semiconductor gas sensors. MRS Bull.,
24: 18–24.
[3] HM McConnell. 1992. The cytosensor
microphysiometer: biological applications of silicon
technology. Science, 257: 1906–1912.
[4] C Christofides. 1993. Physics, Chemistry and Technology
of Solid State Gas Sensor Devices. Wiley, New York.
[5] J Miasik, A Hooper and B Tofield. 1986. Conducting
polymer gas sensors. J. Chem. Soc., Faraday Trans. 182: 1117–1126.
[6] S Capone, S Mongelli, R Rella and P Siciliano. 1999.
―Gas sensitivity measurements on NO2 sensors based
on copper (II) tetrakis (n-butylaminocarbonyl)
phthalocyanine LB films. Langmuir, 15: 1748–1753.
[7] HT Sun and C Cantalini.1996. Microstructural effect
on NO2 sensitivity of WO3 thin film gas sensors‖ Part 1.
Thin film devices, sensors and actuators. Thin Solid Films, 287: 258–265.
[8] N Yamazoe and N Miura. 1994. Environmental gas
sensing. Sens. Actuat. B, 20: 95–102.
[9] H Meixner, J Gerblinger, U Lampe and M Fleischer.
1995. Thin film gas sensors based on semiconducting
metal oxides. Sens. Actuators B, 23: 119–125.
[10] MS Nieuwenhuizen and AJ Nederlof. 1989.
Preliminary results with a silicon-based surface
acoustic wave chemical sensor for NO2. Sens.
Actuators, 19: 385–392.
[11] CJ Liu, SY Wang, JC Hsieh and YH Ju. 2000. Gas
sensing properties of vacuum-deposited titanyl
phthalocyanine film. Sens. Actuators B, 65: 371–374.
[12] F Menil, V Coillard and C Lucat. 2000. Critical review
of nitrogen monoxide sensors for exhaust gases of
lean burn engines. Sens. Actuators B, 67: 1–23.
[13] N Koshizaki and T Oyama. 2000. Sensing
characteristics of ZnO-based NOx sensor. Sens. Actuators B, 66: 119–121.
[14] M Penza, C Martucci and G Gassano. 1998. NOx gas
sensing characteristics of WO3 thin films activated by
noble metals (Pd, Pt, Au) layers. Sens. Actuators B, 50: 52–59.
[15] M Akiyama, J Tamaki, N Miura and N Yamazoe. 1991.
Tungsten oxide-based semiconductor sensor highly
sensitive to NO and NO2. Chem. Lett, pp. 1611–1614.
[16] YK Chung, MH Kim and WS Um. 1999. Gas sensing
properties of WO3 thick film for NO2 gas dependent on
process condition‖, Sens. Actuators B 60 (1999), pp.
49–55.
[17] JI Yang, H Lim and SD Han. 1999. Influence of binders
on the sensing and electrical characteristics of
WO3-based gas sensors. Sens. Actuators B, 60: 71–77.
[18] AR Bertoncello, G Granozzi, G Depaoli, E Tondello
and G Battaglin. 1994. High purity WO3 sol–gel
coatings: synthesis and characterization. J. Mater. Chem., 4: 407–411.
[19] CE Tracy and DK Benson. 1986. Preparation of
amorphous electrochromic tungsten oxide and
molybdenum oxide by plasma enhanced chemical vapor
deposition. J. Vac. Sci. Technol., A, 4: 2377–2383.
[20] Z Xu, JF Vetelino, R Lee and DC Parker.1990.
Electrical properties of tungsten trioxide films. J. Vac. Sci. Technol., 8: 3434–3438.
[21] P Nelli, LE Depero, M Ferroni, S Groppelli, V Guidi, F
Ronconi, L Sangaletti and G Sberveglieri. 1996. Sub-
ppm NO2 sensors based on nanosized thin films of
titanium–tungsten oxides. Sens. Actuators, 31: 89–92.
[22] C Cantalini, HT Sun, M Faccio, M Pelino, S Santucci,
L Lozzi and M Passacantando. 1996. NO2 sensitivity
of WO3 thin film obtained by high vacuum thermal
evaporation. Sens. Actuators, B, 31: 81–87.
[23] D Dijkkamp, T Venkatesan, XD Wu, SA Shaheen, N
Jisrawi, YH Min-Lee, WL Mclean and M Croft. 1988.
Preparation of Y–Ba–Cu oxide superconductor thin
films using pulsed laser evaporation from high Tc
bulk material‖, Appl. Phys. Lett., 51: 619–621.
[24] KL Saenger. 1993. Pulsed laser deposition: Part I. A
review of process characteristics and capabilities.
Process. Adv. Mater., 2: 1–24.
[25] C Belouet. 1996. Thin film growth by the pulsed laser
assisted deposition technique. Appl. Surf. Sci., 96–98:
630–642.

Proceedings of the International Conference on Environmental Aspects of Bangladesh (ICEAB 2011)
58
A2.001
Forest Types Classification using Multi-seasonal High Resolution Satellite Images
M. Golam Mahboob1,2,*, Shinji Kuniyoshi2, Toshiharu Kojima2,3 and Seirou Shinoda2,4
1Bangladesh Agricultural Research Institute, Gazipur 1701, Bangladesh 2Graduate School of Engineering,Gifu University, 1-1 Yanagido, Japan
3River Basin Research Center, Gifu University, 1-1 Yanagido, Japan 4Information and Multimedia Center, Gifu University, 1-1 Yanagido, Japa
*Corresponding Author: e-mail: [email protected]
Abstract Remote sensing technology has been used as an efficient tool for forest type classification. However attempts to improve
the classification accuracy by using better method is a continuous process. This study is conducted to classify forest
types in the Daihachigagawa river basin area in Gifu prefecture, Japan using high resolution QickBird multispectral
satellite images. Images of April, May and July 2007 are used separately and in combination of two (leaf-off and leaf-on)
seasons. Two approaches, Maximum likelihood and Decision tree classifiers, are investigated in this study. Better
overall accuracy (OA) of forest type maps were obtained by combined use of leaf-off and leaf-on season data compared to
a single seasonal image. Among the available data, combination of April & July 2007 data shows the best maps and
results obtained from decision tree classifier (OA= 93.6%) and maximum likelihood classifier (OA= 93.4%) do not vary a
much.
INTRODUCTION
It is very important to identify forest type‘s information to study forest eco-hydrology, net primary productivity (NPP), biodiversity conservation, and regional ecological securities, especially in the current global climate change, anthropogenic environment stresses, and the impacts of natural disasters on terrestrial ecosystems in various scales. However, to acquire information on terrestrial ecosystem timely, rapidly, precisely, is challenging. For such reasons, the traditional forest inventory methods cannot obviously meet such requirements. The remote sensing, however, a unique way in which land surface information can be acquired in various scales, and satisfy the land-use and land-cover classification accurately [1].
The measurements of remote sensing in visible bands and thermal infrared can be used to extract characteristics of land-cover, to derive biophysical parameters of vegetation, and to support many study fields [2]. Phenological characteristics of different forest types in different seasons may differentiate themselves from each other. Although high spatial resolution satellite imagery can provide precise information on ground condition, higher cost and less chance of availability of frequent good scenes, deterred exploiting the potential of multi-seasonal data of this type for forest classification. Current study was aimed to exploit the potential of high resolution multi-seasonal satellite images for forest type classification.
MATERIALS AND METHODS
A. Study site
The study was conducted in a 60 km2 forested area in Daihachigagawa river basin located at the east of Takayama city in the northern part of Gifu prefecture, Japan (Fig. 1) [3]. The upstream (1595- 1000 m) zone of basin was precipitous terrain mainly covered by broadleaf forests and artificially planted conifer forests; midstream (1000-700 m)
consists of evergreen conifers and broadleaf dominating mixed forest and in downstream (700-600 m) landform is flat and open where mainly settlements are prevailing [4]. Dominant conifers are Cedar (Cryptomeria japonica), Cypress (Chamaecyparis obtusa), Red pine (Pinus densitlora) and Larch (Larix kaempfri) among which all are evergreen except Larch which is a deciduous tree. Major broadleaf species are Japanese oak (Quercus crispula), Japanese beech (Fagus crenata Blume), Japanese small oak (Quercus serrata), Japanese chestnut (Castanea crenata Siebold & Zuce), Erman‘s birch (Betula ermanii Cham), Japanese white birch (Betula platyphylla var. japonica), Japanese Big-leaf magnolia (Magnolia obovata
Thumb), Sargent‘s cherry (Prunus sargentii Rehd), etc.
Fig. 1. Location of the study area.
B. Satellite data
The QuickBird (QB) multispectral satellite images acquired on 12 April 2007, 23 May 2007 and 8 July 2007 with ground resolution 2.44 m were used in this study. April image represented the winter or leaf-off season status of forest when there was no leaf in the deciduous trees while the May and July images represented leaf-on season when there were leaves on the deciduous forests. A false color composite (FCC) of QB satellite data (RGB 432) acquired on 12 April 2007 having Daihachigagawa river basin boundary superimposed on top is shown in Fig. 2.

Proceedings of the International Conference on Environmental Aspects of Bangladesh (ICEAB 2011)
59
C. Data pre-processing
The QB images were georefererenced on a Transverse Mercator coordinate system with the spheroid of GRS 1980 and datum of JGD 2000. This is a Japanese original coordinate system popularly known as rectangular plane coordinate system. Remote sensing image acquired in mountainous area is naturally influenced by topographic effects [5][4]. To normalize topographic effects, the QB images used in this study were corrected by a semi-empirical topographic correction method based on the relation between slope-aspect and mean radiance. This is a very simple and generalized method with wide applicability requires only digital elevation model (DEM) as additional input. Based on the height information available in DEM, it assumes a rugged terrain area as an aggregate of various sized distributed cones and then divides surface of each cone in equal 16 directions of slope-aspects (Fig. 3). Finally the algorithm described in [6] adjusts radiance of every pixel based on its location in a specific slope-aspect. A Digital Surface Model (DSM) derived from airborne lider data acquired in October 2003 by Gifu Prefecture authority was used for topographic correction of the QB images for the current study. Effects of topographic correction on the QB data are shown in Fig. 4
Fig. 2. QB satellite image (RGB 432) dated 12 April 2007
with Daihachigagawa river basin boundary on top.
Fig. 3. Division of slope-aspect of a simple cone model.
D. Ground reference data
Six land use / forest type classes are targeted in this study. Ground reference data for three classes (cedar, cypress and larch) were collected by the field survey using a handheld Differential GPS
(MobileMapper Pro, Thales, USA) during 18 – 19 November 2010. Reference data for remaining three classes (red pine, broadleaf and urban area) were collected from a forest register of Gifu prefecture locally known as ―Shinrinbo‖. Reference data collected as digitized polygons, either from field or inventory register, were used both as training sites for classification and accuracy assessment.
Fig. 4. Same part of QB band 4 (NIR) image dated 8 July
2007 before (A) and after (B) topographic normalization.
E. Maximum likelihood classification
Supervised classification was conducted using the Maximum likelihood parametric rule on each of the three single dated images. Two combinations of leaf-off and leaf-on season‘s fused data one comprising of April+May and the other of April+July were also classified to check for the performance. Six classes namely Cedar, Cypress, Red pine, Larch, Broadleaf and Urban area were derived from the classification of images.
Fig. 5. Classification hierarchy followed in Decision
tree classification.
F. Decision tree classification
A decision tree is a type of multistage classifier that can be applied to a single image or a stack of images [7]. It is made up of a series of binary or tertiary decisions that are used to determine the correct category for each pixel. Classification hierarchy followed in this study is given in Fig. 5. First step, the whole of image is divided to forest and urban area. 2nd step, forest area is divided to evergreen / deciduous forest with April image. And final step,
evergreen and deciduous forest area is classified to each species with May or July images.
W
NW
N
E
S
NE SE
SW
N N
A B
Image
Urban Forest
Deciduous Evergreen
Cedar Cypress Red Pine Larch Broadleaf
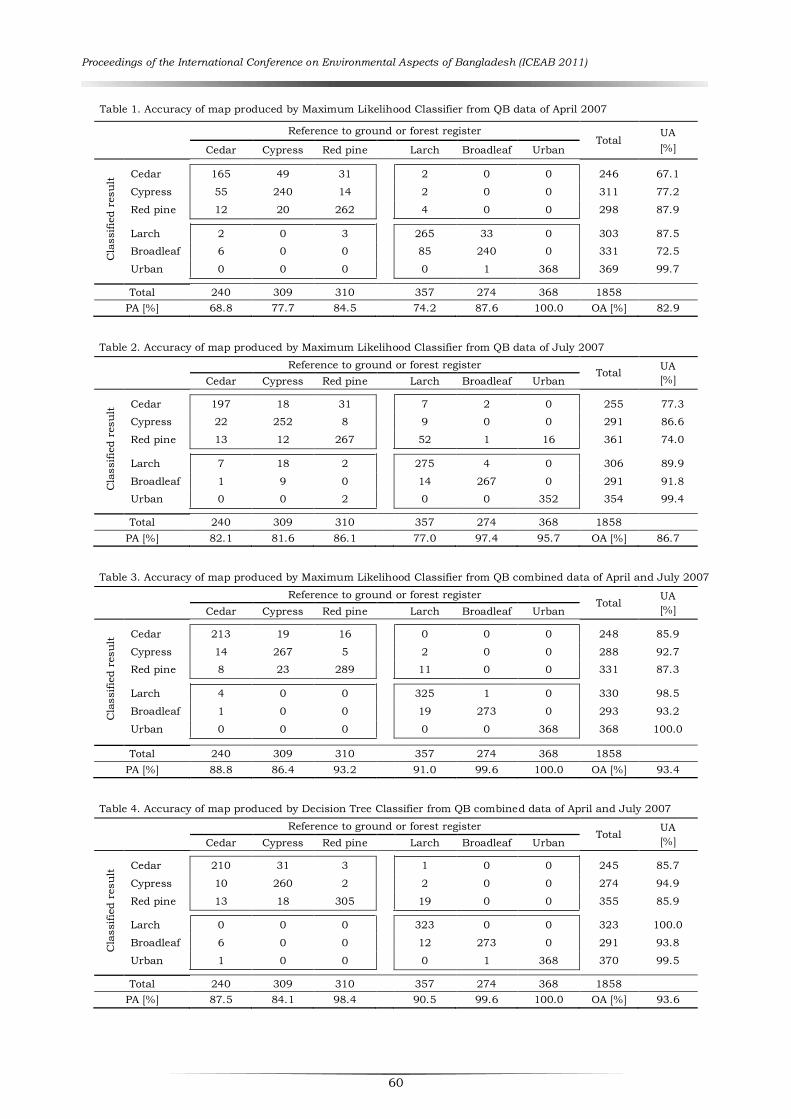
Proceedings of the International Conference on Environmental Aspects of Bangladesh (ICEAB 2011)
60
Table 1. Accuracy of map produced by Maximum Likelihood Classifier from QB data of April 2007
Reference to ground or forest register
Total UA
[%] Cedar Cypress Red pine Larch Broadleaf Urban
Cla
ssifie
d r
esu
lt
Cedar 165 49 31 2 0 0 246 67.1
Cypress 55 240 14 2 0 0 311 77.2
Red pine 12 20 262 4 0 0 298 87.9
Larch 2 0 3 265 33 0 303 87.5
Broadleaf 6 0 0 85 240 0 331 72.5
Urban 0 0 0 0 1 368 369 99.7
Total 240 309 310 357 274 368 1858
PA [%] 68.8 77.7 84.5 74.2 87.6 100.0 OA [%] 82.9
Table 2. Accuracy of map produced by Maximum Likelihood Classifier from QB data of July 2007
Reference to ground or forest register
Total UA
[%] Cedar Cypress Red pine Larch Broadleaf Urban
Cla
ssifie
d r
esu
lt
Cedar 197 18 31 7 2 0 255 77.3
Cypress 22 252 8 9 0 0 291 86.6
Red pine 13 12 267 52 1 16 361 74.0
Larch 7 18 2 275 4 0 306 89.9
Broadleaf 1 9 0 14 267 0 291 91.8
Urban 0 0 2 0 0 352 354 99.4
Total 240 309 310 357 274 368 1858
PA [%] 82.1 81.6 86.1 77.0 97.4 95.7 OA [%] 86.7
Table 3. Accuracy of map produced by Maximum Likelihood Classifier from QB combined data of April and July 2007
Reference to ground or forest register
Total UA
[%] Cedar Cypress Red pine Larch Broadleaf Urban
Cla
ssifie
d r
esu
lt
Cedar 213 19 16 0 0 0 248 85.9
Cypress 14 267 5 2 0 0 288 92.7
Red pine 8 23 289 11 0 0 331 87.3
Larch 4 0 0 325 1 0 330 98.5
Broadleaf 1 0 0 19 273 0 293 93.2
Urban 0 0 0 0 0 368 368 100.0
Total 240 309 310 357 274 368 1858
PA [%] 88.8 86.4 93.2 91.0 99.6 100.0 OA [%] 93.4
Table 4. Accuracy of map produced by Decision Tree Classifier from QB combined data of April and July 2007
Reference to ground or forest register
Total UA
[%] Cedar Cypress Red pine Larch Broadleaf Urban
Cla
ssifie
d r
esu
lt
Cedar 210 31 3 1 0 0 245 85.7
Cypress 10 260 2 2 0 0 274 94.9
Red pine 13 18 305 19 0 0 355 85.9
Larch 0 0 0 323 0 0 323 100.0
Broadleaf 6 0 0 12 273 0 291 93.8
Urban 1 0 0 0 1 368 370 99.5
Total 240 309 310 357 274 368 1858
PA [%] 87.5 84.1 98.4 90.5 99.6 100.0 OA [%] 93.6
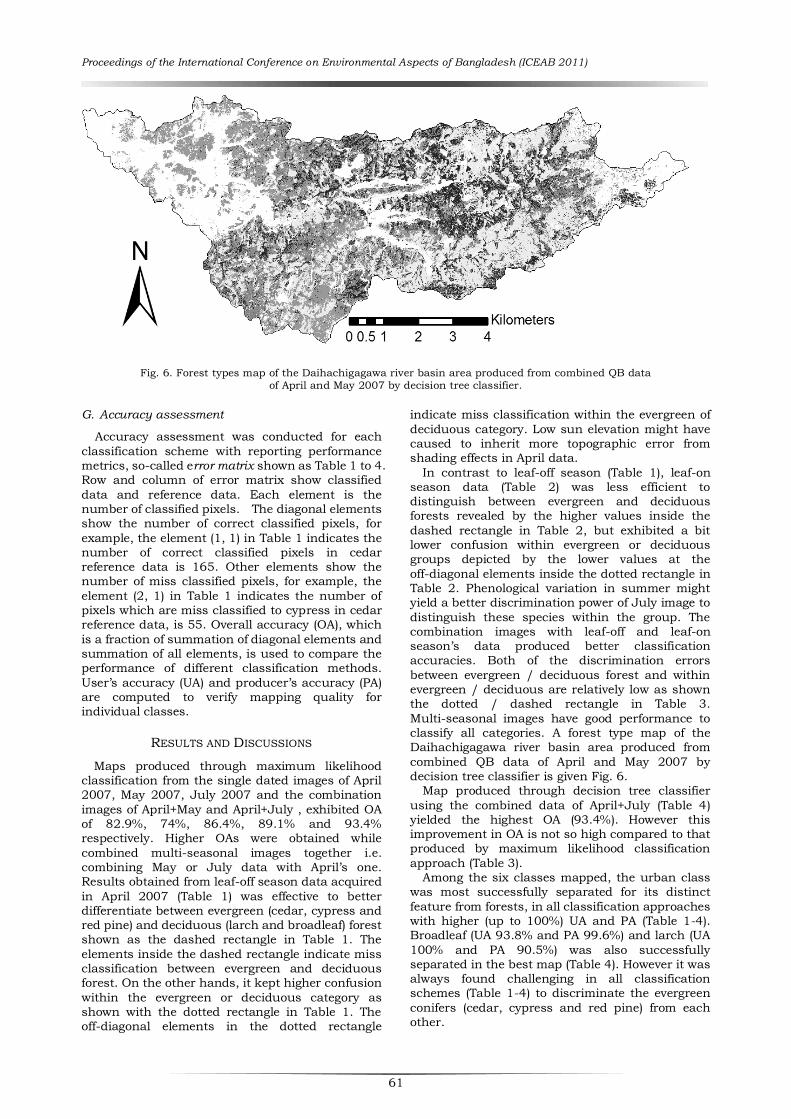
Proceedings of the International Conference on Environmental Aspects of Bangladesh (ICEAB 2011)
61
Fig. 6. Forest types map of the Daihachigagawa river basin area produced from combined QB data
of April and May 2007 by decision tree classifier.
G. Accuracy assessment
Accuracy assessment was conducted for each
classification scheme with reporting performance
metrics, so-called error matrix shown as Table 1 to 4.
Row and column of error matrix show classified
data and reference data. Each element is the
number of classified pixels. The diagonal elements
show the number of correct classified pixels, for
example, the element (1, 1) in Table 1 indicates the
number of correct classified pixels in cedar
reference data is 165. Other elements show the
number of miss classified pixels, for example, the
element (2, 1) in Table 1 indicates the number of
pixels which are miss classified to cypress in cedar
reference data, is 55. Overall accuracy (OA), which
is a fraction of summation of diagonal elements and
summation of all elements, is used to compare the
performance of different classification methods.
User‘s accuracy (UA) and producer‘s accuracy (PA)
are computed to verify mapping quality for
individual classes.
RESULTS AND DISCUSSIONS
Maps produced through maximum likelihood
classification from the single dated images of April
2007, May 2007, July 2007 and the combination
images of April+May and April+July , exhibited OA
of 82.9%, 74%, 86.4%, 89.1% and 93.4%
respectively. Higher OAs were obtained while
combined multi-seasonal images together i.e.
combining May or July data with April‘s one.
Results obtained from leaf-off season data acquired
in April 2007 (Table 1) was effective to better
differentiate between evergreen (cedar, cypress and
red pine) and deciduous (larch and broadleaf) forest
shown as the dashed rectangle in Table 1. The
elements inside the dashed rectangle indicate miss
classification between evergreen and deciduous
forest. On the other hands, it kept higher confusion
within the evergreen or deciduous category as
shown with the dotted rectangle in Table 1. The
off-diagonal elements in the dotted rectangle
indicate miss classification within the evergreen of
deciduous category. Low sun elevation might have
caused to inherit more topographic error from
shading effects in April data.
In contrast to leaf-off season (Table 1), leaf-on
season data (Table 2) was less efficient to
distinguish between evergreen and deciduous
forests revealed by the higher values inside the
dashed rectangle in Table 2, but exhibited a bit
lower confusion within evergreen or deciduous
groups depicted by the lower values at the
off-diagonal elements inside the dotted rectangle in
Table 2. Phenological variation in summer might
yield a better discrimination power of July image to
distinguish these species within the group. The
combination images with leaf-off and leaf-on
season‘s data produced better classification
accuracies. Both of the discrimination errors
between evergreen / deciduous forest and within
evergreen / deciduous are relatively low as shown
the dotted / dashed rectangle in Table 3.
Multi-seasonal images have good performance to
classify all categories. A forest type map of the
Daihachigagawa river basin area produced from
combined QB data of April and May 2007 by
decision tree classifier is given Fig. 6.
Map produced through decision tree classifier
using the combined data of April+July (Table 4)
yielded the highest OA (93.4%). However this
improvement in OA is not so high compared to that
produced by maximum likelihood classification
approach (Table 3).
Among the six classes mapped, the urban class
was most successfully separated for its distinct
feature from forests, in all classification approaches
with higher (up to 100%) UA and PA (Table 1-4).
Broadleaf (UA 93.8% and PA 99.6%) and larch (UA
100% and PA 90.5%) was also successfully
separated in the best map (Table 4). However it was
always found challenging in all classification
schemes (Table 1-4) to discriminate the evergreen
conifers (cedar, cypress and red pine) from each
other.

Proceedings of the International Conference on Environmental Aspects of Bangladesh (ICEAB 2011)
62
CONCLUSION AND RECOMMENDATIONS
The results of this study are indicative and showed the discriminative power of multi-seasonal high resolution remote sensing data for forest classification. The results of this study could be further improved by collecting in situ ground reference samples for all classes, increasing numbers of sample sites, using recent dated imagery and using advanced sensor data like airborne lidar and/or digital color photography. Special attention could be paid in developing effective classification method to discriminate the forest classes among the evergreen conifers.
ACKNOWLEDGMENTS
The research described in this paper is supported by 21st Century COE program ―Satellite Ecology for Basin Ecosystem Study‖ award from JSPS, Japan, Grant-in-aid for Scientific Research (B) No. 18310021 and (A) No. 22248017) from MEXT, Japan and Grand-in-Aid for challenging Exploratory Research (No. 22651012). Lidar data is provided from Gifu prefecture.
REFERENCES
[1] J Li, L Da, Y Wang and Y Song. 2006. Vegetation
classification of East China with multi-temporal
NOAA-AVHRR data. Front. Biol. China, 3: 303−309,
DOI: 10.1007/s11515-006-0038-3.
[2] SW Running, ER Hunt, R Nemani, J Glassy. 1994.
MODIS LAI (leaf area index) and FPAR (fraction
photosynthetically active radiation). NASA: MODIS
algorithm document.
[3] T Kojima, T Akiyama, M Ishihara and WD Ara. 2008.
Spatial evaluation of ecosystem function and
structure in basin scale. J. JASS, 24(2): 121-128.
[4] T Akiyama, T Kojima and M Maki. 2005. Ecosystem
studies in Takayama area by remote sensing-
Preliminary study on spatiotemporal changes of
vegetation and phenology. SATECO 2005: Proc. 1st Int. Symp. of 21st Century COE Program, 13-16 October,
2005, Gifu University, Gifu, Japan. pp. 5-8.
[5] M Vicini and E Frazzi. 2003. Multitemporal
evaluation of topographic normalization methods on
deciduous forest TM data. IEEE Trans. Geosci. Remote Sens., 41(11):. 2586-2590.
[6] K Takejima, H Sakaue, YQ Lee, S Kakuta, Y Awaya
and H Fukui. 2007. A semi-empirical topographic
correction method based on the relation between
slope-aspect and mean radiance. J. For. Plann., 13:
43-55.
[7] ENVI Tutorial: Decision Tree Classification, URL:
http://www.ittvis.com/portals/0/tutorials/envi/Dec
ision_Tree.pdf [Accessed 24 March 2011].

Proceedings of the International Conference on Environmental Aspects of Bangladesh (ICEAB 2011)
63
A2.002
Phenology of Bruguiera gymnorrhiza (L.) Lamk. in Manko Wetland, Okinawa Island, Japan
Md. Kamruzzaman1, Sahadev Sharma1, ATM Rafiqul Hoque2 and Akio Hagihara3
1Graduate School of Engineering and Science, University of the Ryukyus, Japan 2Institute of Forestry and Environmental Sciences, Chittagong University, Bangladesh
3Faculty of Science, University of the Ryukyus, Japan
Abstract The aim of this study is to understand both the vegetative and the reproductive phenology, like leaf emergence, leaf fall,
bud setting, flowering and propagule setting patterns, of B. gymnorrhiza of the family Rhizophoraceae. Phenological
traits were measured during the period of April 2008 to March 2011, using the litterfall data (indirect method). Leaf
litterfall showed a seasonal pattern: the main peak occurred in June and the lowest was in December. Stipule litterfall
was the highest in July, while the lowest in January. Branch litterfall did not show any clear seasonal pattern. The
reproductive component litterfall of B. gymnorrhiza continued throughout the year, but seasonal periodicity with the
maximum bud litterfall was in July-August, flower litterfall in August - September and the highest propagule litterfall in
July. The average percentage of conversion of the fertilized flowers into propagules of B. gymnorrhiza was 11.99 %.
INTRODUCTION
Bruguiera gymnorrhiza (L.) Lamk. is one of the
most important and widespread mangrove species.
It occurs in almost all tropical and subtropical
mangrove ecosystems of the world. It can grow in a
broad range of inter-tidal conditions and substrates.
B. gymnorrhiza, like other mangrove trees, has
ecological values and contributes to the
sustainability of mangrove ecosystem. The litterfall
is a main component of net primary production,
reflects phenological events and is also an
important part of energy and nutrient fluxes in
mangrove ecosystems. Phenological data are
essential to know the tree ability to adapt growth
and propagation strategies to ambient climatic
conditions. This kind of knowledge is most valuable
if available across a broad geographic scale.
However, little is known about B. gymnorrhiza
phenology and litterfall in Okinawa Island near the
northern limit of mangrove distribution, as well as
other mangrove areas.
As mangroves in Okinawa thrive in a distinct
seasonal climate, they have to cope with substantial
seasonal changes in environmental factors. Many
studies have documented mangrove litterfall to
assess mangrove productivity; however, fewer
studies have documented mangrove phenology,
particularly reproductive phenology. There are only
few studies related to the litterfall on Okinawa
Island, Japan, i.e. litter dynamics [1], [2], [3], [4]
and leaf phenological traits [5]. Detailed
site-specific phenological studies have been
documented for members of family Avicenniaceae,
for instance, the genera Avicennia [6], [7]. A detailed
reports also are available for the genera Rhizophora
[8], [9], Ceriops [10] and Kandelia candel [5], but
very few for genus Bruguiera [11].
In general, B. gymnorrhiza focused on this study shows a conspicuous seasonality regarding phenophase peaks. The aim of this study is to investigate the vegetative and reproductive phenology, using the litterfall data of mangrove B. gymnorrhiza growing in the subtropical region.
MATERIALS AND METHODS
The present study was conducted in a mangrove forest (26o11′N and 127o40′E) of Manko Wetland, Okinawa Island, Japan, from April 2008 to March 2011. This wetland is an important area for migratory birds and has been registered as the RAMSAR site since 1999. In the study area, four mangrove species were found, of which three species comes from Rhizophoraceae family such as Kandelia obovata (S., L.) Yong, Rhizophora stylosa Griff., and Bruguiera gymnorrhiza (L.) Lamk. and one species of the Euphorbiaceae family, namely Excoecaria agallocha L. The mean monthly air temperature during the study period was 23.31 ± 0.07 oC. Mean annual rainfall was 2226.50 ± 1.10 mm yr-1 during the study period.
Five plots (4 m x 4 m each) were established for a B. gymnorrhiza stand, whose mean tree density and mean tree height were 1.80 m-2 and 3.00 ± 0.06 (SE) m respectively. Litterfall was measured using litter traps. Two litterfall traps with an opening of 0.19635 m2 were placed at 1 m above the soil surface in each of 5 plots. The litterfall traps were emptied monthly from April 2008 to March 2011 and the litterfall were separated into leaves, stipules, branches, bud primordial, flower buds, flowers and propagules. The sorted litterfall were dried to a constant mass at 80oC over a 48 h period, and then weighted. Numbers of buds, flowers and propagules were counted during the sorting of litterfall.
RESULTS AND DISCUSSIONS
A. Vegetative phenology
New leaf production and leaf fall is concurrently occurred throughout the year but showed a clear trend of seasonality. Stipule litterfall which is the indicator of leaf emergence was highest in July and lowest in January (Fig 1. a). Fig 1(b) showed the leaf fall, which followed the same pattern i.e, a peak in June and lowest was in December. In the present study, branch litterfall including small twigs, bark and big branches, did not show clear seasonal trends like leaf fall and stipule litterfall (Fig. 1 c).

Proceedings of the International Conference on Environmental Aspects of Bangladesh (ICEAB 2011)
64
This finding is similar to the results as in [11] in a subtropical stand of Avicennia marina. According to the past studies, the highest branch litterfall of Kandelia obovata in Okinawa Island resulted the strong effect of typhoon [3] and the branch litterfall of Avicennia marina depended on the storm in the Brisbane river, Queensland, Australia [12]. In tropical rain forest, most of the species showed a double peak (bimodal) of leaf production correlated with rainy periods [13]. The results was observed in the other species of the same genus Bruguiera cylindrica, showed unimodal growth patterns with maximum leafing, sprouting and shedding rates in the rainy season [6].
Maximal leaf production corresponded with the summer season that temperature, day-length and humidity were at their maximum levels, whereas minimum leaf emergence occurred in winter season with low temperature, short day-length and low irradiance. This finding is similar to the results as in [14], reported that temperature had a strong correlation with the phenology of mangrove Avicennia germinans (L.), at northern latitude subtropical site in Mexico (same latitude as Okinawa).
Reference [15] showed that the leaf litterfall of Avicennia marina, increased with increasing air temperature. In the subtropical region, leaf fall and leaf production are low during the winter season [8], [16]. However, some of past studies showed little reverse results, as it was reported in [11] that the leaf fall of a B. gymnorrhiza stand was higher during the cool, dry months than during the warmer months. The same results showed in a B. gymnorrhiza stand at Ohura Bay (Okinawa Island), where leaf fall was highest during the winter months, though it had a tendency to increase at the beginning of summer [2].
B. Reproductive phenology
Reproductive materials were present in litter traps all over the year, but in a regular seasonal periodicity. Flower bud litterfall comprising the immature bud and mature bud, showed the highest peak during summer and the lowest was in winter (Fig. 2a). During April to July, mature flower buds were found in litterfall.
Flowers were found all over the year, showing the highest production in September, while the lowest was in March (Fig. 2b). If flower was not fertilized, it was aborted and then fell from the trees within a few days even pollinated flowers also fell down. After a course of time hypocotyls developed from flower and then turned in to mature propagule. Mature propagules litterfall were found throughout the year but showed the highest production during summer, while the lowest was in winter (Fig. 2c).
Although B. gymnorrhiza produced a large number of buds, most buds failed to develop into propagules. A large proportion of young buds became mature buds, most of which became flowers. There was a sharp decline in survival of reproductive units, with very few of fertilized flowers.
In the current study it was revealed that in B. gymnorrhiza, the flowering and fruiting occur continuously throughout the year. The flowers with red sepals and brown petals are quite conspicuous
against the foliage. As expected from past studies in [17], [18], flowering and propagule production were highly seasonal. B. gymnorrhiza took 35 days for producing full flower from bud initiation [19].
In the present study, the average percentage of conversion of the fertilized flowers into propagules of B. gymnorrhiza was 11.99% (Table 1). This rate is higher than the Rhizophora stylosa, Rhizophora mangle and Bruguiera gymnorrhiza (2.4% - 5.3%) reported in [20] and R. stylosa, C. australis plants reported in [21]. In Fiji, the percentage of mature propagules from flowers was the highest in Rhizophora mangle followed by Rhizophora stylosa and the lowest was in B. gymnorrhiza [20].
Fig. 1. Seasonal trends of vegetative component of B.
gymnorrhiza litterfall. Vertical bar stands for the
standard error of the mean.
0
2
4
6
8
10
12
14
(a)
Sti
pu
le li
tter
fall
(g
m-2
mon
th-1
)
0
10
20
30
40
50
60
70
80
(b)
Lea
f lit
terf
all (
g m
-2 m
onth
-1)
0
5
10
15
20
25
30
35
AMJ JASONDJ FMAMJ JASONDJ FMAMJ JASONDJ FM
(c)
Bra
nch
litt
erfa
ll (
g m
-2 m
onth
-1)
2008 2009 2010 2011

Proceedings of the International Conference on Environmental Aspects of Bangladesh (ICEAB 2011)
65
Table1. Number of flowers and propagules of B. gymnorrhiza (m-2), and the percentage of conversion of flower into propagule during the study period.
Year Flower Propagule Propagule/Flower %
1st 432.9 48.9 11.29
2nd 505.2 49.9 9.88
3rd 400.3 59.2 14.80
Average 446.1 52.68 11.99
The rate of fertilization reported in this study was much higher than that estimated in Rhizophora mangle (7%) [22]. From December to March, immature propagules were found in litter traps in the present study. The mean propagule weight and length of Bruguiera gymnorrhiza was 16.4 g and 16.9 cm respectively [20]. The immature dropping of propagules may be due to insect damage, non- availability of nutrients at the time of development and tree size. This is also true with several tropical/ subtropical tree species whose number of flowers is quite large as compared to fruit set percentage [20].
Fig. 2. Seasonal trends of reproductive component
litterfall of Bruguiera gymnorrhiza. Vertical bar stands
for the standard error of the mean.
CONCLUSION
It is concluded that the patterns of the vegetative and the reproductive components of B. gymnorrhiza litterfall are repeated each year during the study period. The timing of these patterns may be influenced by the climatic conditions of the surrounding area such as temperature, solar radiation and precipitation.
RECOMMENDATIONS
We are grateful to Drs. K. Analuddin, W. Min and Mr. K. Mouctar, Ms. R. Deshar and Ms. C. Fengxia for their invaluable help during field work and data analysis. This study was partially supported by Grants in-Aid for scientific research (nos. 18380098, 20510011 and 22658051) from the Ministry of Education, Culture, Sport, Science and Technology, Japan and 21st COE program of the University of the Ryukyus, Japan.
REFERENCES
[1] JF Mokolensang and A Tokuyama. 1998. Litter
production of mangrove forests at the Gesashi River.
Bulletin of the college of science, University of the
Ryukyus, 65: 73-79.
[2] S Hardiwinoto, T Nakasuga and T Igarashi. 1989.
Litter production and decomposition of a mangrove
forest at Ohura Bay, Okinawa. Research Bulletins of
the College Experiment Forests, Hokkaido University,
46: 577-594.
[3] K Annaluddin, S Sharma, R Suwa and A Hagihara.
2009. Temporal and spatial trends of litterfall in a
mangrove Kandelia obovata stands on Okinawa
Island, Japan. In: L Puangchit and S Diloksumpun
(eds.), Tropical Forestry Change in a Changing World:
Mangrove and Wetland Ecosystems. Vol. 6, FORTROP II Int. Conf. on Kasetsart University, Bangkok,
Thailand, pp.133-147.
[4] S Sharma, ATMR Hoque, K Analuddin and A
Hagihara. 2010. Litterfall dynamics in mangrove
Kandelia obovata (S., L.) Yong stands on Okinawa
Island, Japan, over four years. In proc. Int. Conf. on
Environmental science and Development, Forestry
Applications and Development on Singapore, 2010,
pp 417-422.
[5] P Gwada, M Tsuchiya and Y Uezu. 2000. Leaf
phenological traits in the mangrove Kandelia candel (L.) Druce. Aquat Bot., 68: 1-14.
[6] S Wium-Andersen and B Christensen. 1978.
Seasonal growth of mangrove trees in southern
Thailand: II. Phenology of Bruguiera cylindrica,
Ceriops tagal, Lumnitzera littorea and Avicennia marina. Aquat Bot.,. 5: 383-390.
[7] NC Duke. 1990. Phenological trends with latitude in
the mangrove tree Avicennia marina. J Ecol., 78:
113-133.
[8] AM Gill and PB Tomlinson. 1971. Studies on the
growth of red mangrove (Rhizophora mangle L.) 3.
Phenology of the shoot. Biotropica, 3: 109-124.
[9] S Wium-Andersen. 1981. Seasonal growth of
mangrove trees in Southern Thailand: III. Phenology
of Rhizophora mucronata Lamk and Syphiphora hydrophyllacea Gaertn. Aquat Bot., 10: 371-376.
[10] FJ Slim, P Gwada and AHemminga. 1996. Biomass
and litterfall of C. tagal and R. mucronata in the
mangrove forest of Gazi Bay, Kenya. Mar Freshwater Res., 47: 999-1007.
[11] TD Steinke and LM Charles. 1984. Productivity and
phenology of Avicennia marina and Bruguiera gymnorrhiza in Mgeni estuary, South Africa. In : HJ
0
0.5
1
1.5
2
2.5
3
3.5
(a)
Flow
er b
ud li
tter
fall
(g m
-2 m
onth
-1)
0
10
20
30
40
50
(b)
Flow
er li
tter
fall
(g m
-2 m
onth
-1)
0
20
40
60
80
100
AMJ JASONDJ FMAMJ JASONDJ FMAMJ JASONDJ FM
(c)
Prop
agul
e lit
terf
all (
g m
-2 m
onth
-1)
2008 2009 2010 2011

Proceedings of the International Conference on Environmental Aspects of Bangladesh (ICEAB 2011)
66
Teas (ed.) Physiology and Management of Mangroves,
Junk, The Hague., pp 25-36.
[12] AP Mackey and G Smail. 1995. Spatial and temporal
variation in litter fall of Avicennia marina (Forssk.)
Vierh. in the Brisbane River, Queensland, Australia..
Aquat Bot., 52,:133-142.
[13] L Medway. 1985. Phenology of a tropical rain forest in
Malaya. Biol. J. Linn. Soc., 4: 117-146.
[14] J Lopez-Portillo and E Ezcurra. 1985. Litterfall of
Avicennia germinans L. in a one year cycle in a
mudflat at the Laguna de Mecoancan, Tabasco.
Mexico. Biotropica, 17: 186-190.
[15] JD May. 1999. Spatial variation in litter production
by the mangrove Avicennia marina var. australasica
in Rangaunu Harbour, Northland, New Zealand. NZ J. Mar. Freshwat. Res., 33: 163-172.
[16] RW Parkinson, M Perez-Bedmar and JA Santangelo.
1999. Red mangrove (Rhizophora mangle L.) litter fall
response to selective pruning (Indian River Lagoon,
Florida, USA). Hydrobiologia, 413: 63-76.
[17] NC Duck, JS Bunt and WT Williams. 1984.
Observations of the floral and vegetative phenologies
of north-eastern Australian mangroves. Aust J Bot., 32: 87-99.
[18] GJ Leach and S Burgin. 1985. Litter production and
seasonality of mangroves in Papua New Guinea.
Aquat Bot., 23: 215-224.
[19] VP Upadhyay and PK Mishra. 2010. Phenology of
mangroves tree species on Orissa coast, India. Trop. Ecol., 51: 289-295.
[20] AP Tyagi. 2003. Location and interseasonal variation
in flowering, propagule setting and propagule size in
mangroves species of the family Rhizophoraceae.
Wetland Ecol Manage., 11: 167-174.
[21] GT Coupland, EI Paling and KA McGuinness. 2006.
Floral abortion and pollination in four species of
tropical mangroves from northern Australia. Aquat Bot., 84: 151-157
[22] PJ Hogarth. 1999. The Biology of Mangroves. ISBN
0-19-850222-2, Oxford, 1999, p 228.

Proceedings of the International Conference on Environmental Aspects of Bangladesh (ICEAB 2011)
67
A2.003
Rethinking the Causes of Deforestation: Experience from SAL Forests, Bangladesh
KK Islam and Noriko Sato
Forest Policy Laboratory, Graduate School of Bioresource and Bioenvironmental Sciences Kyushu University, Fukuoka, Japan
Abstract Bangladesh, with a forest cover estimated at 17.08% of all land surface area, has experienced severe degradation of its
forest resources and a considerable change in its land cover. While deforestation in Bangladesh is obviously a
multifaceted issue, one important issue emerges from previous research findings in explaining deforestation:
industrialization. This study focuses on the causes of deforestation in Bangladesh, particularly in tropical moist
deciduous Sal forests, using multi levels of factor analysis framework. Data were collected through questionnaire
surveys, formal and informal discussions with local people, expert interviews and literature reviews. The main findings
of deforestation framework show that illegal logging and forest land conversion were the ultimate causes of Sal forests
deforestation in Bangladesh. Illegal logging is a complex phenomenon and is being patronized by a local syndicate,
functioning from behind the scenes. On the other hand, land conversion into different commercial activities has direct
influence on national policy and the predisposing conditions of this country. Therefore, the immediate task of the nation
would be to stop illegal logging and land conversion of Sal forests. This can be done by involving all relevant
stakeholders in the form of effective forest policy and formulation and execution of strict environmental protection law.
INTRODUCTION
Bangladesh is a developing country in South Asia
having 14.40 million hectares of total geographic
area [1, 2]. Of them, 13.36 million hectares are land
surface, and 0.94 million hectares are rivers and
other inland water bodies [2, 3, 4]. The country has
only 17.08% (2.52 million ha) of total forest land [1],
and the Sal forests cover about 0.12 million
hectares of land comprising of 4.7% of the total
forest area of Bangladesh [1]. A few decades ago,
Bangladesh was rich in forest resources but a rapid
population growth, land conversion into different
commercial activities, increased consumption of
energy and wood and maximum utilization of
natural resources have led to the quick degradation
of forest resources [5]. The tropical moist deciduous
Sal forests are a leading example of such
degradation [6], which is surrounded by a
high-density population. Sequentially, these have
inspired exploitation of the forest at a significant
rate, bringing it close to destruction [5, 7]. As a
consequence, about 36% of the Sal forests cover
existed in 1985, and more recent estimates
mentioned that only 10% of the forest cover existed
[5, 8].
Sal forests deforestation in Bangladesh is obviously
a complex issue; one cause provides for many of the
other causes/factors that contribute to
deforestation. In addition, scanty scientific studies
have been carried out to identify the root causes of
deforestation, particularly in Sal forests, which is
the most threatened ecosystem [5, 7] of Bangladesh.
At the background of such apocalyptic situation for
Bangladesh, this study has been carried out to
identify insight into the deforestation process
through exploring the sources, underlying and
immediate causes of Sal forests deforestation.
Theoretical frameworks
This study followed Angelsen & Kaimowitz (1999: 75) multilevel (three) frameworks for explaining the
causes of tropical moist deciduous forest, i.e. Sal forests deforestation (Figure 1). Further, this study considers the causal relations among the factors operating at the three levels moving in both directions, due to their all-around relations with each other.
Fig. 1. Main causes of Sal forests deforestation at various
levels. Source: Angelsen and Kaimowitz (1999:75).
MATERIALS AND METHODS
A. Description of the study area
Sal forests constitute about 10% of the total forest land (a total of 0.12 million ha) of Bangladesh [1]. Until the beginning of the 20th century, this forest existed as a continuous belt from the Central and Northern parts of Bangladesh. Nowadays, this forest exists mainly at the central part of this country, which is mainly located at the Gazipur, Dhaka, Mymensingh and Tangail districts of Bangladesh [5]. Therefore, this study was conducted at the Central Sal forests of Bangladesh.
B. Data Collection
The study was based on different sources and methods for collecting primary and secondary data, i.e., multi methods approaches. For primary data this study used formal and informal discussion with local people, expert interviews, a case study
Underlying causes of deforestation
Macroeconomic variables and policy instruments
Intermediate causes of deforestation
Institutions Infrastructure Markets
Sources of deforestation
Agents of deforestation
Deforestation
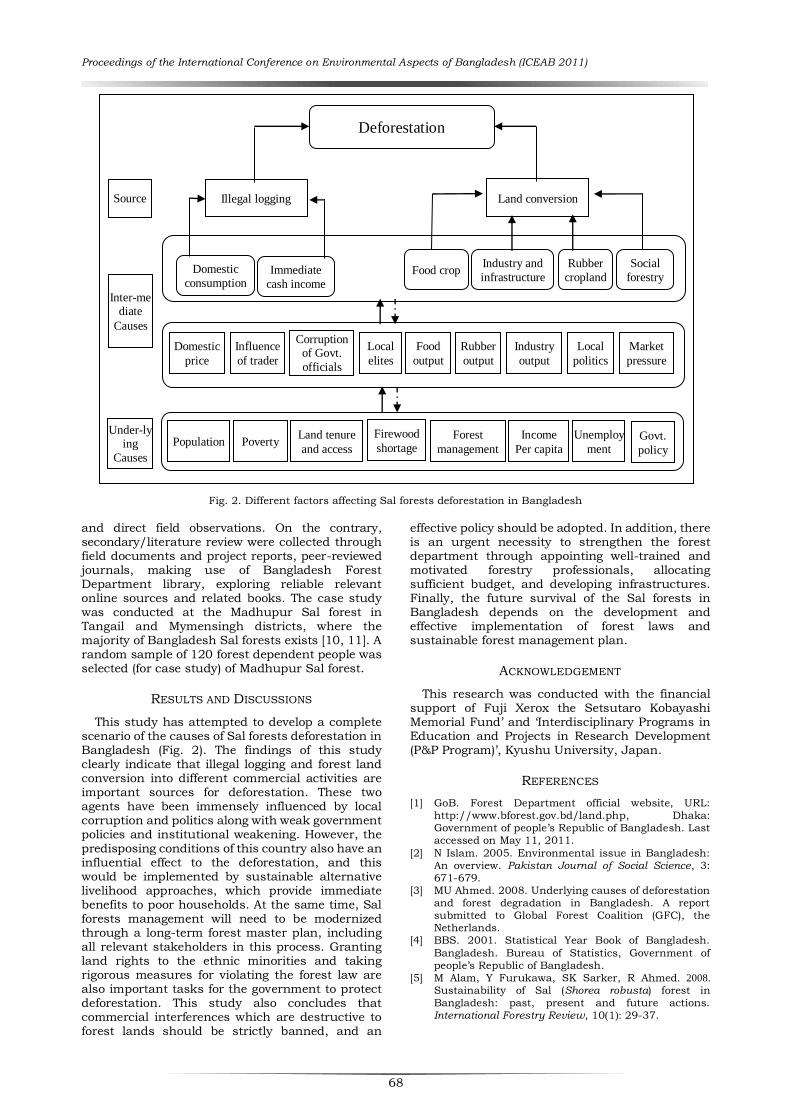
Proceedings of the International Conference on Environmental Aspects of Bangladesh (ICEAB 2011)
68
Fig. 2. Different factors affecting Sal forests deforestation in Bangladesh
and direct field observations. On the contrary, secondary/literature review were collected through field documents and project reports, peer-reviewed journals, making use of Bangladesh Forest Department library, exploring reliable relevant online sources and related books. The case study was conducted at the Madhupur Sal forest in Tangail and Mymensingh districts, where the majority of Bangladesh Sal forests exists [10, 11]. A random sample of 120 forest dependent people was selected (for case study) of Madhupur Sal forest.
RESULTS AND DISCUSSIONS
This study has attempted to develop a complete scenario of the causes of Sal forests deforestation in Bangladesh (Fig. 2). The findings of this study clearly indicate that illegal logging and forest land conversion into different commercial activities are important sources for deforestation. These two agents have been immensely influenced by local corruption and politics along with weak government policies and institutional weakening. However, the predisposing conditions of this country also have an influential effect to the deforestation, and this would be implemented by sustainable alternative livelihood approaches, which provide immediate benefits to poor households. At the same time, Sal forests management will need to be modernized through a long-term forest master plan, including all relevant stakeholders in this process. Granting land rights to the ethnic minorities and taking rigorous measures for violating the forest law are also important tasks for the government to protect deforestation. This study also concludes that commercial interferences which are destructive to forest lands should be strictly banned, and an
effective policy should be adopted. In addition, there is an urgent necessity to strengthen the forest department through appointing well-trained and motivated forestry professionals, allocating sufficient budget, and developing infrastructures. Finally, the future survival of the Sal forests in Bangladesh depends on the development and effective implementation of forest laws and sustainable forest management plan.
ACKNOWLEDGEMENT
This research was conducted with the financial support of Fuji Xerox the Setsutaro Kobayashi Memorial Fund‘ and ‗Interdisciplinary Programs in Education and Projects in Research Development (P&P Program)‘, Kyushu University, Japan.
REFERENCES
[1] GoB. Forest Department official website, URL:
http://www.bforest.gov.bd/land.php, Dhaka:
Government of people‘s Republic of Bangladesh. Last
accessed on May 11, 2011.
[2] N Islam. 2005. Environmental issue in Bangladesh:
An overview. Pakistan Journal of Social Science, 3:
671-679.
[3] MU Ahmed. 2008. Underlying causes of deforestation
and forest degradation in Bangladesh. A report
submitted to Global Forest Coalition (GFC), the
Netherlands.
[4] BBS. 2001. Statistical Year Book of Bangladesh.
Bangladesh. Bureau of Statistics, Government of
people‘s Republic of Bangladesh.
[5] M Alam, Y Furukawa, SK Sarker, R Ahmed. 2008.
Sustainability of Sal (Shorea robusta) forest in
Bangladesh: past, present and future actions.
International Forestry Review, 10(1): 29-37.
Illegal logging Land conversion
Domestic
consumption Immediate
cash income
Industry and
infrastructure
Rubber
cropland
Social
forestry Food crop
Domestic
price
Influence
of trader
Corruption of Govt.
officials
Food
output
Rubber
output
Industry
output
Local
politics
Poverty Firewood
shortage Income
Per capita
Forest
management Govt.
policy
Unemploy
ment
Land tenure
and access Population
Market
pressure
Local
elites
Source
Inter-mediate
Causes
Under-lying
Causes
Deforestation

Proceedings of the International Conference on Environmental Aspects of Bangladesh (ICEAB 2011)
69
[6] M Ali, MA Kabir, ATMR Hoque. People, Policy and
Perpetuity: Sustainability Indicators of Bangladesh
Forestry. Electronic Green Journal, 1(24): Article#3.
[7] MS Safa. 2004. The effect of participatory forest
management on the livelihood of the settlers in a
rehabilitation program of degraded forest in
Bangladesh. Small-scale Forest Economics, management and Policy, 3(2): 223-238.
[8] FAO. 2003. State of World‘s Forest. Food and
Agricultural organization, Rome, Italy.
[9] A Angelsen, D Kaimowitz. 1999. Rethinking causes of
the causes of deforestation: lessons from economic
models. The World Bank Research Observer, 14(19):
73-98.
[10] N Muhammed, M Koike, F Haque, MD Miah. 2008.
Quantitative assessment of people oriented forestry in
Bangladesh: A case study from Tangail Forest
Division. Journal of Environmental Management, 88(1):
83-92.
[11] M Rahman. 2010. [Online]. Boner adibashider
shonge nia bon rakha (Bengali). A report on national
newspaper, ‗Protom Alo‘. [Online 11 August 2010]
Available: http://www.prothom-alo.com/detail/ date/ 2010-08-11/news/85515.

Proceedings of the International Conference on Environmental Aspects of Bangladesh (ICEAB 2011)
70
A2.004
Cultural Landscape of Teknaf Peninsula
Kiho Yaoita1, Mariko Nagano2 and Noriaki Nishiyama3
1Hokkaido University; e-mail: [email protected] 2Kyushu University; e-mail: [email protected] 3Hokkaido University ; e-mail: [email protected]
Abstract
The purpose of this study is to clarify the value of Teknaf Peninsula as a cultural landscape that is generated through
people‘s daily lives, to seek for a possibility of tourism development as an alternative industry. The value will be clarified
focusing on questions like the followings: 1) how can the landscape structure of Teknaf Peninsula as a whole be
elucidated through analyses of landscape elements and space structure?; 2) how can the heritage value of an
agricultural village in Teknaf be elucidated?; 3) how can the heritage value of a fishery village in Teknaf be elucidated?
and 4) how can the heritage value of a saltpan village in Teknaf be elucidated?
INTRODUCTION
Teknaf Peninsula is located in the southeast end corner of People‘s Republic of Bangladesh. In the country whose land is mostly on the delta area formed by the Ganges, the peninula is located at where the mountain ridge of the hill country in the east part of the country is going under water and it is creating a unique natural landscape. The west coast of the peninsula is a 120km long sand beach that is said to be the longest in the world. On the peninsula that stretches north to south, village landscapes are continuously created through traditional agriculture and fishery. However, recent change of agricultural products and expansion of the agricultural land have been eroding the natural environment around the villages so that the sustainability of agriculture itself is in a critical situation.
This study aims at clarifying the value of Teknaf Peninsula as a cultural landscape generated through people‘s daily lives to seek for a possibility of tourism development as an alternative industry.
MATERIALS AND METHODS
Firstly, landscape characteristics of Teknaf Peninsula were elucidated through the analyses of aerial photo and field survey. Secondly, three villages were chosen according to the subsistence activities such as agriculture, fishery and saltpan and outlines and styles of subsistence activities of each village were clarified through analyses of land use form and interviews. Landscape elements were identified in each village in three levels: 1) large-scale landscapes to grasp a whole village or a whole hill area; 2) middle-scale landscapes to grasp rows of houses, agricultural or salt pan land, etc. and 3) small-scale landscapes to grasp each land use form such as houses, fields, forests, beaches, etc. The field survey was conducted from March 5th to 21st of 2011 with 63 man-days.
VALUE OF TEKNAF PENINSULA AS A CULTURAL LANDSCAPE
In Teknaf Peninsula, orogeny that formed Arakan Mountains created unique landscape of the peninsula in the east edge of Bay of Bengal.
The natural side of the cultural landscape value
of the peninsula is that the peninsula remains 120km long beach and that the peninsula was formed at the west end of Arakan Mountains where the ridge of mountains goes under water.
Fig. 1. Land use of Marishbonia
The cultural side of the cultural landscape value of the peninsula is that the landscape was formed through ecological lives of people where people worked to develop villages, fields, forests and fishery systems on inclined lands and narrow flat lands between mountains and beaches. This landscape is consisted of the followings: 1) beaches
in Cox Bazar where have been developed as national beach resort; 2) dozens of villages are formed continuously along beaches and showing different styles of subsistence activities and 3) in the south end part of the peninsula, salt pans are formed on lands which used to be rice fields.

Proceedings of the International Conference on Environmental Aspects of Bangladesh (ICEAB 2011)
71
CURRENT SITUATION OF CULTURAL LANDSCAPES OF VILLAGES
A. Cultural landscape of agricultural village
Marishbonia is an agricultural village located in the west side of the peninsula (Fig.1). In the village, 207 households are dwelling. Among those, 40 households own agricultural lands, 50 households are living on daily employments and others are living on service industries, fishery, etc.[1]. A national road divides the village into east side and west side. There is no clear social division in the village even though the east side is called ―paschim para‖ which means ―east village‖ and the west side is called ―purbo para‖ which means ―west village‖. Houses are built on areas close from the national road of the current village. However, they used to be built along beaches and there were no houses in the east side of the national road.
The boundary of Marishbonia is limited by ridges of mountains, shoreline and rivers (Fig. 2). From sea to the mountains, the land form changes starting from flat land, inclined land to steep land. Limited
flat land is used for agriculture. Inclined land that is not suitable for agriculture is used for residence. And steep land is used for pan boroz and thatch plant. Footpaths divide the agricultural land. Dug wells are used to stock rainwater and groundwater. Hedges which are made of bamboos, leafs of palm trees and other plants divide reside nces. The residences are one story buildings and thatched or iron roofed. There are community wells in villages and some houses also have private wells in their private lands. Shops are built along the national road.
Large-scale landscape elements in Marishbonia are land use form for residence and agriculture, roads, beaches and rivers. Middle-scale landscape elements are beaches, rivers, roads, residential buildings and sites, buildings and sites of mosques and madrasas, hedges, trees, fields, footpaths, dug wells, bridges and graveyards. Small-scale landscape elements are buildings, wells, hedges and plants.
B. Cultural Landscape of Fishery Village
Shamlapul is located about 9.4km north of Marishbonia. The boundary of Shamlapul is shown in Fig.3. There are different areas for different paras (villages) to pull up boats onto the beach. Interviews for this survey were conducted only in the area that is closest from the town center. The population is 5,000 and about 1,000 households are resided. Residents live mainly on fishery and agriculture. The residents resided in the east side of the national
road live only on agriculture. In Shamlapul, fishing is practiced through the
year. However, hauls are bigger in rainy season than dry season. In the rainy season, residents also work on agriculture. Main organizations and personnel for fishery are owners of boats, fishermen, brokers and ship carpenters. The owners of boats manage the boats and needed equipment, make decision on sailing and pay to the employees. The fishermen do not own boats and they go out fishing when they received orders from the employers. The brokers do not own boats and they buy fish on beach, treat and sell them in towns and cities. Expert groups who do not go fishing treat fishes. The ship carpenters also belong to expert groups.
The edge of Shamlapul boundary is on shoreline, ridges of mountains and rivers (Fig.3). Shamlapul extends from flat land to gently inclined land, about 2km in the south-north direction and about 500m in the east-west direction. On this gentle slope, belts of different land uses are lining in order. The first best is a beach. The second belt is residential area of sufferers from Myanmar called ―Lohinga‖. Houses are built in a windbreak forest. The third belt is residential area mainly of Lohingas located in the east side of the second belt. The fourth belt is highway. Areas between the first to the second belt and the second to the third belt are mainly used for agriculture. The fifth belt is the area in the east side of the national road where used as residential and agricultural area.
Fig. 2. Section of Marishbonia

Proceedings of the International Conference on Environmental Aspects of Bangladesh (ICEAB 2011)
72
Fig. 3. Land use of Shamulpur.
In Shamulapul, Large-scale landscape elements are land use form for residence and agriculture, roads, beaches and rivers. Middle-scale landscape elements are beaches, rivers, roads, residential buildings and sites, buildings and sites of mosques and madrasas, fish treatment area, hedges, trees, fields, footpaths, dug wells, bridges and graveyards. Small-scale landscape elements are buildings, movable equipment related to fishery, wells, hedges and plants.
C. Cultural Landscape of Fishery and Salt Pan Village
Shaplirdwip is a union (administrative district) located in south end of the peninsula (Fig.4). Its population is about 20,000 and main industry is agriculture, saltpan, fishery and trade. According to the information on the tourism boat, this area has been historically and culturally involved with Myanmar deeply because of its location. Shaplirdwip used to be a separate island from the peninsula and it was united because of the sand deposition. There are 14 paras in the union. Among those, only one para called ―Uttor Para‖ located in the north area of the union is living on Salt Pan industry and others are living on other industries as previously stated.
The salt pan industry in the para was started about 50 years ago. That is because: 1) salt pan can make more profit than rice fields; 2) it can make profit in the dry season when rice field cannot make profit and 3) fields contain high percentage of salt are not suitable for agriculture.
The management of the salt pans is carried by land owners, salt manufacturers and labors (share croppers). Land owners lease lands to the manufacturers and the manufacturers employ the labors. Equipment needed for the salt pans and the profit are shared by the manufacturers and labors. The labors come to work from Cox Bazar or Chittagong for months without going back home so that there are small sheds for them to sleep or rest in salt pans.
Shaplirdwip is located on a flat land in the south end part of the peninsula. Except for the back marsh used as salt pans, all lands are used either for residence or agriculture. The residential areas are developed on high land that was formed by sand deposition. They are shaped like the letter ―L‖. The areas between those residential areas are used for agriculture. In the east part of the union, there are paras that live on the business and those are making the center of the union.
Fig. 4. Land use of Shaplirdwip
Large-scale landscape elements in Shaplirdwip are land use form for salt pans, residence and agriculture, roads, beaches and rivers. Middle-scale landscape elements are beaches, rivers, roads, salt pans, residential and merchant buildings and sites, buildings and sites of mosques and madrasas, hedges, trees, fields, footpaths, dug wells, bridges and graveyards. Small-scale landscape elements are buildings, a wharf, wells, hedges and plants.
CONCLUSION
The value of Teknaf Peninsula as a cultural landscape can be described as follows: 1) the peninsula has a unique landscape formed by orogeny which formed Arakan Mountains and sand composition from the Ganges; 2) on that unique landscape consisted of hill areas and narrow flat lands with severe natural environment, people are making maximum use of the limited flat land for agriculture and of the land which is not suitable for agriculture for salt pan, pan boroz and thatch plant.
ACKNOWLEDGMENT
This survey was funded by Sumitomo Fund for Environmental Studies.
REFERENCES
[1] Y Iida. The study of the difference in acquisition of
water resource caused by the economic disparity of
households and its effects in rural Bangladesh.
Bachelor‘s thesis, Faculty of design, Kyushu
University, Unpublished.
[2] S Ishizuka. The study of the consumption of the forest
resources at Teknaf peninsula in Bangladesh.
Bachelor‘s thesis, Faculty of design, Kyushu
University, unpublished.

Proceedings of the International Conference on Environmental Aspects of Bangladesh (ICEAB 2011)
73
A2.005
Deforestation by Daily Activities in the Teknaf Peninsula, Bangladesh
Masakazu Tani1, Md. Zulfikar Rahman2, Abiar Rahman3, Kazuo Asahiro1, Suraia Akhter2
1Department of Environment & Heritage Design, Faculty of Design, Kyushu University, Fukuoka, Japan 2Department of Agricultural Extension Education, Bangladesh Agricultural University, Bangladesh
3Department of Agro-forestry, Bangobandhu Shiekh Mujibur Rahman Agricultural University, Bangladesh
Abstract Rich forests once nurturing wild elephants in the Teknaf Peninsula in Bangladesh have been mostly lost. The cause of
this deforestation was not commercial logging or a large-scale development, but the accumulated effects of daily
activities by local residents. This paper deals with human encroachment by colonizing the forest as new homesteads,
and by clearing the forest for cultivation of the betel plant (Piper betle) for its leaves as an important cash crop. This
paper analyzes how these activities have spread into once forested areas through time by recording the date of
establishment both of all existing homesteads and of all facilities to cultivate the betel plant (pan boroz) in field surveys
in one village. Results indicate that human encroachment to the forest started as building a few pan boroz in the 1970s;
human habitation in the forest did not start in a large scale until the 1990s when large cyclones severely damage
houses near the coast, and these catastrophic events seemed to have forced people move up the slope to the direction of
the forest.
INTRODUCTION
Environmental problems have been recognized as a global issue to be tackled as a reaction to industrialism of the 20th Century. In this scheme, the object to be conserved is the intact nature, and the aggressor is large-scale developments and industries. Recently, however, there appears a different type of environmental problems that do not fit in this scheme.
A typical example of such is deforestation due to slash-and-burn agriculture. The actor in such instances is often poor people. They may be former urban poor who were forced to move into the forest to find a more stable livelihood. Their practice destroys forests because they do not have appropriate skills and possess no knowledge for conservation [1]. There are other instances where poor people, not large industries, become a primary agent of environmental destruction [2], [3].
This study deals with such an environmental problem: that caused by the poor. The subject of the study is deforestation in the Teknaf Peninsula in Bangladesh, and the objective of this study is to elucidate the process of deforestation by ordinary activities of the residents. To that end, surveys were conducted in a village in order to document how human daily activities have encroached their surrounding forests.
METHODOLOGY A. Study area
The study area is located in the Teknaf Peninsula, where an ECA (Ecologically Critical Area) was designated by the Government of Bangladesh because the reduction of biodiversity becomes a conspicuous problem. The Teknaf Peninsula lies in the south-eastern corner of Bangladesh bordering Myanmar on the east and facing the Bay of Bengal on the west. It is a narrow shaped peninsula running north to south, and occupies a western- zmost part of the Arakan Range having low-lying hills with the elevation of 200 to 300 m on its north-south axis.
The village (―MB village‖) where we conducted surveys is located along the west coast of the peninsula, and about 30 km from the upazila town
Teknaf. While settlements scatter all along the coast, MB is part of this stretch of settlements. It is bordered by two minor streams, and its north-south span measures about 1.5 km (Fig 1). Villagers recognize their village area as from the beach to the hill top behind their village. In MB, the distance between the beach and the hill top is also about 1.5 km. Therefore, the village area lies in an area of roughly two square km. along the beach; a narrow strip (ca. 300 m wide) of farm land occupies all flat area. From the end of the farm land, a gentle slope raises to the foot of the hill to the east. An only paved road, the main road, runs in the middle of the settlement parallel to the coast. A rich forest once existed in the hill and on the gentle slope up to this road until the 1970s, but, there are now few trees, and only shrubs and vines in the hill and houses and pan boroz on the slope. An extensive area of the hill is currently utilized by chon (Imperata Cylindrica) cultivation. Fig. 2 illustrates a cross-section of the land form from the coast (West) to the hill top (East) showing areas of "beach," "rice field," "gentle slope," and steeper "hill slope."
Fig. 1. Map of MB village
MB village has 207 households and 1294 people according to our survey in 2010. Most houses are located on the gentle slope, while there used to be

Proceedings of the International Conference on Environmental Aspects of Bangladesh (ICEAB 2011)
74
houses along the coastal low-lying areas, but these housed were swept down by strong cyclones in the 1990s. People did not reconstruct houses, but relocated themselves up the slope.
Fig. 2. Cross-section map of MB village
B. Subsistence activities in MB village
Because all communities along the west coast open to the Bay of Bengal, a most notable subsistence activity in this area is fishing employing a unique type of fishing boats [4]. MB village, however, do not have many fishermen because their beach is rocky which is not suitable for landing fishing boats.
The main subsistence of the village is farming, or recognized as such. But, Among the 207 households in the village, mere 43 households own farm land.
The extent of farm land is small having 23.8 ha as a total or 0.55 ha per household who own farm land or only 0.1 ha per household in the village. The productivity of rice in this village is also low being about 10 maunds (373 kg) per kani (a native unit of land, 0.16 ha) compared to that in the central part of Bangladesh, where aman rice productivity is about 15 to 18 maunds per bigha (0.13 ha).
Therefore, most households have to buy rice and even those with farmland may still need to buy some rice. It means most people in this village need other cash earning activities. There are two types of such activities common in this village. One is foreign migration labor and the other is betel cultivation. While foreign migration does not directly affect deforestation in this village, betel cultivation seems to influence the state of the forest very much. Betel cultivation consumes a large amount of forest resources (see Zulfikar et al., presented in this conference) because it requires ―pan boroz‖ facilities to protect betel plants from the intense sun light.
In spite of this heavy environmental load, betel cultivation seems to be adaptive in other aspects. One advantage of betel cultivation is that it can be practiced on slopes. Therefore, betel cultivation does not have to compete with other agricultural activities, such as rice cultivation, and can use land that no other farming can use. Another advantage of betel is the fact that it requires only a small area and generates a large income. Betel cultivation needs only a small plot of land (typically 1/2 kani, about 800 square m) and, if successful, yield in one season may be worth as much as 70000 taka (about 700 USD).
C. Method of survey and analysis
A first major cause of deforestation in this area was illegal logging of trees for sale. During the period of President Ershad in Office, tree-logging activities were said to be at the peak because of the corruption among the Forest Department. Smaller trees are harvested for firewood by villagers to become another cause of deforestation [5].
This study does not analyze illegal activities nor fuel wood collection, but analyzes homestead and
pan boroz because these ordinary activities are tracable through time. Homestead building and pan boroz construction are not probably engaged in direct logging, but rather, prevent the forest from regenerating by occupying areas opened up by tree logging. During surveys, we recorded the timing of initiation of these two activities at all locations where houses and pan boroz currently exist. But, in other words, because our recording was based on the existing houses and pan boroz, it obviously missed ones that once existed, but left no trace. So, the result should be regarded within this limitation.
RESULTS AND DISCUSSIONS
A. The establishment of homesteads
Among 204 homesteads with the known age of establishment, 15 % of them (N=31) goes back to or before the 1970s (Table I). During this period, as Fig. 3 shows, there were a few were located near the road (Fig. 4).
In the 1990s, 67 houses, twice as many as those in the 1980s were built. While some new homesteads were situated on the coastal side, many of them spread in the gentle slope area as far as the bottom of the hill. This is a clear departure from the previous settlement pattern seen in up to the 1980s, indicating that deforestation is fixed by denying regeneration started in the 1990s. Strong cyclones in the 1990s may have been a factor driving people into the forest. After the year of 2000, the same tendency as that in the 1990s continues and even intensifies human encroachment by establishing homestead in the former forest area (Fig. 5).
Table 1. The dates of homestead establishment at the
present locations
Dates No. of Homesteads %
Before the 1950s
1950s
1960s
1970s
1980s
1990s
2000s
2010s
unknown
14
1
5
11
35
67
64
7
3
7%
0%
2%
5%
17%
33%
31%
3%
---
Total 207
B. The Construction of Pan Boroz
Our survey in March 2011 recorded 152 pan boroz. They include ones that were not in use at the time of survey, but recognizable as such. There are also pan boroz in the rice field. They are temporary ones

Proceedings of the International Conference on Environmental Aspects of Bangladesh (ICEAB 2011)
75
for they are set up after rice harvest, and are dissembled before rice planting.
Fig. 3. Homesteads existed in the 1970s
Fig. 4. Homesteads existed in the 1980s
Fig. 5. Current distribution of homesteads
There are only a few among existing pan boroz
which have been used since the 1960s (Table II). These old pan boroz are all located along the beach. Whereas, again, only a small number of existing pan boroz was established in the 1970s, some of them were built in the former forest area (Fig. 6). Among the 29 pan boroz constructed in the 1980s, all but one were located in the former forest area (Fig. 7). Compared to the pattern of homesteads
building in the 1980s where only a few homesteads existed in the former forest area, the penetration of pan boroz into the same area predated that of houses. In the 1990s, more pan boroz were constructed to fill gaps in the same general area as the 1980s. At the same time, pan boroz were also built in flat areas of regular agricultural fields. After the year of 2000, about a half of existing pan boroz were constructed in both flat and gentle slope areas as well as a few were even built in the hill area (Fig. 8). Table 2. Dates of pan boroz construction
Dates No. %
1950s
1960s
1970s
1980s
1990s
2000s
2010s
1
6
11
29
37
67
1
1%
4%
7%
19%
24%
44%
1%
Total 152 100%
SUMMARY
This paper analyzes temporal sequences in which homesteads and pan boroz progressed into the former forest area. It demonstrates that the encroachment into the forest area above the main road appears to have initially started in the 1970s in a small scale as the construction of a small number of pan boroz. As entering into the 1980s, pan boroz spread in the area between the main road and the bottom of the hill. In the 1990s, because of the influence of cyclones, many houses were established in the former forest area; at the same time, pan boroz increased in the same area. Therefore, it is probably the 1990s that deforestation in that area was fixed by denying regeneration of the forest by habitation and pan cultivation.
ACKNOWLEDGMENT
This study is supported by a grant from the Sumitomo Foundation as a grant for environmental studies (Grant No. 093293).
REFERENCES
[1] S Fujisaka, W Bell, N Thomas, L Hurtado and E
Crawford. 1995. Slash-and burn agriculture,
conversion to pasture, and deforestation in two
Brazilian Amazon colonies. Agriculture, Ecosystems and Environment, 59: 115-130.
[2] P Robbins. 2004. Political ecology. Blackwell Publishing, MA.
[3] SC Stonich. 1995. Development, rural impoverishment,
and environmental destruction in Honduras. In: The
social causes of environmental destruction in Latin
America; M Painter, WH Durham (eds.) The University
of Michigan Press, Ann Abor, USA, pp.63-99.
[4] Epler Wood International. 2009. Integrated protected
area co-management (IPAC): Teknaf Peninsula
Community-based Ecorourism Strategy. Report
submitted to USAID.
[5] Coastal Wetland Biodiversity Management Project
(CWBMP). 2006. Teknaf Peninsula ECA Draft
Conservation Plan.

Proceedings of the International Conference on Environmental Aspects of Bangladesh (ICEAB 2011)
76
A2.006
Land Use and Vegetation Type in West Coast of Teknaf Peninsula in
Bangladesh: A Case Study of Short Transect Research in Local Village
Kazuo Asahiro1, Md. Abiar Rahman2 and Masakazu Tani1
1 Department of Environment and Heritage Design, Faculty of Design, Kyushu University, Fukuoka, Japan 2 Bangabandhu Sheikh Mujibur Rahman Agricultural University (BSMRAU), Gazipur, Bangladesh
Abstract
Teknaf peninsula is experiencing a decrease in its natural resources, which are being used to support the local
population and industry. Forest destruction is a particularly serious problem. The objective of this research is to devise
a model for the conservation of biodiversity without disadvantaging the local residents. As a first step, this paper
presents a mapping of the general land use and vegetation in a local village based on a survey of 46 short transects
lines; the survey was carried out during 14–19 March 2009. The interpretation of high-resolution satellite images was
also carried out. We present the results of the mapping of general land use and obtain the following vegetation sequence
from the coast to the hilltop: sand, windbreak, farmland, main road and homestead gardens, Pan boroz (Betel, Piper
betle, leaf production facilities), community forest, Chon grass fields, and mantle community around the hillside and
hilltop areas. It was estimated that the destruction of national forests has been growing owing to harvesting of wood and
grass. On the other hand, homestead gardens provide valuable vegetation with high trees in this region.
INTRODUCTION
Teknaf peninsula is located in the south-east border of Bangladesh, west of Myanmar (Fig. 1). This region is experiencing an increase in low-income population and a decrease in its natural resources owing to population and industry demands. In particular, forest devastation has caused a reduction in the natural forest area and underground water levels; these problems are considered to be a cause for concern. The Department of Environment (DoE) under the Ministry of Environment and Forests, Government of Bangladesh, designated eight Ecologically
Critical Areas (ECAs) [1]. In the Teknaf peninsular ECA, the Coastal and Wetland Biodiversity Management Project (CWBMP) supported by UNDP had been operating between 2003 and 2009. The objective of the CWBMP project was to ensure the conservation and sustainable use of globally significant wetland biodiversity in these areas.
This report is part of a collaboration study on the management of biodiversity using a ‗Satoyama‘ model in the Teknaf Peninsula, Bangladesh, supported by the Sumitomo Foundation. ‗Satoyama‘ is a Japanese term, which means maintaining nature in a cultural landscape with human intervention. The objective of this research is to devise a model for the conservation of biodiversity in the Teknaf ECA without impairing the residents‘ livelihood. The aim of this paper is to describe the general land use and vegetation in one of the local villages on the west coast of Teknaf peninsula through the results of a landscape survey.
SITE AND METHODS
A. Site selection
The west coast of the Teknaf peninsula ECA includes 3 unions/wards and 6 mauza (villages). MB village in Baharchara union was selected for this study because it spans a short distance from the coast to the hilltop; hence, we could study a wide range of land uses and vegetation (Fig. 2). The village spans almost 1,300 m from north to south and 1,500 m from east to west. The eastern hilltop
(altitude: 215 m) descends towards the west coast. The climate zone is tropical, the dry season starts in March, and the rainy season is from June throughout the monsoon season.
Fig. 1. Bangladesh and
Teknaf Peninsula
Fig. 2 Site of study
B. Data collection and analysis
Investigations were carried out on 14–19 March 2009. The methodology used in this study involved understanding the general land use and vegetation distribution using 46 short transect lines, approx. 20 m in length. In each site, the following field data and vegetation parameters were collected: length and position of transect line, dominant species name, height and cover of each vegetation layer, GPS data, and photograph of the vegetation.
After the survey, eleven types of land use and vegetation was categorized based on the ground research data; then, an interpretation of high- resolution satellite images was carried out [2]. The vegetation data were used in the following equations to determine the cover (1) and species composition (2).
(1)
(2)
100 sec
int (%)
lengthttranTotal
speciesoflengtherceptTotalCover
100. .
.
(%)
sppallofsindividualofnoTotal
speciesaofsindividualofNo
nCompositioSpecies

Proceedings of the International Conference on Environmental Aspects of Bangladesh (ICEAB 2011)
77
RESULTS
Land use and vegetation types and the transect line numbers are listed in Table 1. The main features studied were homestead gardens (25 lines) followed by farmland (8 lines). Other land use and vegetation types were covered by only 0 to 4 lines. This is because this work was the first field study in
the region; therefore, we had limited information on hillside access, which limited our ability to collect data in those areas. In addition, while observing the whole scene, we found that the percentage of high tree areas around homestead gardens was limited. The short transect plots (GPS measurement points at the edge of each line) and the land use and vegetation type map are depicted in Fig. 3. We can see the general land use and vegetation sequence from the coast to the hilltop on this map, as follows: sand, windbreak, farmland, main road and homestead gardens on both side of the road, Pan boroz (Betel, Piper betle, leaf production facilities) between the main road and the hill, community forest on the hillside, Chon grass fields, and scrub on the hillside and hilltop areas. This village was established before 1930 and houses had been built west of the main road, close to the seaside, but moved west of the main road after the cyclone disasters of 1991 and 1994. The east side of the main road is denoted as a national forest area by CWBMP officials; however, houses, homestead gardens, Pan boroz, and other resident land use areas have been encroaching on the forest, as indicated in Fig. 3.
The percentage of vegetation cover of the dominant species for each land use and vegetation type is given in Table 2. The general land uses and vegetation types are explained below, listed by categories from west to east, and the relevant scenery photos are shown in Fig. 4.
a) Windbreak: Jhau (Casuarina equisetifolia) is planted as a windbreak and is dominant, covering 50% of the coastline. However, its continuity along
the shore is broken and the width of the windbreak belt is only about 10 m. In these coastal areas, incidents of windbreak clearing have been reported. Inland of this belt, Akand (Calotropis gigantea) and Chhagol Kuri (Ipomoea pes-caprae) are distributed as seashore vegetation.
b) Farmland: Farmland with ridges spread among the windbreaks and homestead gardens. In the rainy season, rice is grown in wet paddy fields; in the dry season, irrigation water from the stream and dug wells are used to water crops such as beans.
c) Homestead garden: Almost 207 households with thatched roof houses and homestead gardens occupy both sides of the main road. Supari (Areca
catechu L.) is planted mainly around the houses and covers 33.0% of the inside area as the most dominant species. Along the roadside, Am (Mangifera indica L., 23.8%) and Supari (16.6%) are planted, with other fruit and crop trees, as well as shrubs. Another tree that seemed prominent in the village scenery is Garjan (Dipterocarpus alatus, 8.8% along the roadside), which is almost 26 m in height. Along the stream of the homestead gardens, Bhalku (Bambusa sp., 18.6%) and native tree species such as Kola (Musa sp., 4.3%), Dumur (Ficus racemosa,
1.4%), Sheora (Streblus asper, 1.4%), and Khoi (Bridelia tomentosa, 1.4%) were observed and are assumed to have been propagated via seeds brought down by the stream from the hill area. In terms of species composition, 48.1% of the species were seen inside the homestead garden areas, which were covered by 25 of the 46 transect lines. The actual species composition in the homestead garden is estimated species were observed in homestead gardens.
Table 1. Land use and vegetation type and transect line numbers in MB Village
Land use and vegetation type Transect No.
Sand 0
Windbreak 1
Seashore vegetation 2
Farmland with ridges 8
Homestead garden with thatched
house
25
Grass land 0
Dug well 4
Pan boroz 0
Community forest (Hillside) 1
Chon grass (Hillside to Hilltop) 2
Scrub (Hillside to Hilltop) 3
d) Pan (Betel, Piper betle) boroz (leaf production
facilities): Betel leaf farming is carried out as a main crop in this area, utilizing boroz—thatched-roof structures for sun shading—made of thin timber poles and grass. These construction materials are collected mostly from locally available natural vegetation growing on the hillside. In the dry season, the Betel crop is irrigated using water supply from dug wells, which are constructed around it.
Fig. 3. Land use and vegetation type map by
satellite image interpretation.
e) Hillside: Most of the hillside area was used as a
‗community forest‘, that is, artificial forest planted with Akashmoni (Acacia auriculiformis, covers 90%) and arable land with shrub vegetation, and bare land. Chon (Imperata cylindrica) grass fields

Proceedings of the International Conference on Environmental Aspects of Bangladesh (ICEAB 2011)
78
can be seen around the drier areas close to the ridge of the hill, and there were mostly no trees and mantle community growing around the hilltop areas. The WWF has confirmed that 31 wild elephants inhabit this region, and a local farmer claimed that
they were feeding on fruit from his homestead garden, increasingly for the last 6 years. National forest destruction seems to be occurring in this region.
Table 2. Cover % of dominant species for each land use and vegetation type (Length of transect line: 20 m, No. of transect
lines: 46)
Lay
er
Tra
nse
ct
lin
e n
um
ber
Tre
e h
igh
t (m
)
Bengali
nameScientific name
Win
db
reak
Seash
ore
veg
eta
tio
n
Farm
lan
d w
ith
rid
ges
Ho
mest
ead
gard
en
(ro
ad
sid
e)
Ho
mest
ead
gard
en
(in
sid
e)
Ho
mest
ead
gard
en
(ri
ver
sid
e)
Du
g w
ell
Co
mm
un
ity
fo
rest
(H
ills
ide)
Man
tle c
om
mu
nit
y (
Hil
lsid
e t
o H
illt
op
)
Ch
on
gra
ss (
Hil
lsid
e t
o H
illt
op
)
13 10 Supari Areca catechu L. 16.6 33.0
5 12 Bhalku Bambusa sp. 1.3 6.3 18.6
5 11 Am Mangifere indica L. 23.8 4.0
5 7 Narikel Cocos nucifera 6.3 2.5 1.3
3 26 Garjan Dipterocarpus alatus 8.8 1.0 2.5
4 11 Khanthal Artocarpus heterophyllus 1.6 6.0
1 14 Jhau Casuarina equisetifolia 50.0
1 6 Kola Musa sp. 4.3
1 10 Dumur Ficus racemosa 1.4
1 10 Sheora, Streblus asper 1.4
2 13 Khoi Bridelia tomentosa 1.4 1.5
1 7 Akashmoni Acacia auriculiformis 90.0
5 Dhol kolmi Ipomoea fistulosa 10.0 0.4 0.4 22.5
6 Supari Areca catechu L. 9.5 2.0 0.8
3 Mahogini Swietenia mahagoni 1.3 1.0 0.4
1 Akand Calotropis gigantea 35.0
2 Bhalku Bambusa sp. 1.3 0.4
1 Kul, Boroi Zizyphus mauritiana 8.8
8 Badaiya Chrysopogon aciculatus 35.0 14.0 10.0 17.5
3 Chhagol Kuri Ipomoea pes-caprae 10.0 20.0
3 Guicha Lata Calycopteris floribunda 0.4 7.0 3.3
4 Supari, Gua Areca catechu L. 0.4 1.3 4.3
4 Assam lata Mikania cordata 5.3 13.3
2 Chon grass Imperata Cylindrica 50.0
3 Germanlata Chromolaena odorata 0.4 7.0 0.8
1 - Phyllanthus pendulus 10.0
1 Mashkalai Vigna mungo 8.8
1 Bhalku Bambusa sp. 1.3
1 Kachu Colocasia esculenta 2.5
1 Arjun Terminalia arjuna Bedd. 1.0
1 2 8 8 10 7 4 1 3 2
2 2 10 8 13 7 7 1 6 2
7.4 7.4 37.0 29.6 48.1 25.9 25.9 3.7 22.2 7.4
Number of species
Sh
rub
lay
er
Land use and vegetation type
Tre
e l
ay
er
Gra
ss l
ay
er
Number of transect line
Species Composition (%)

Proceedings of the International Conference on Environmental Aspects of Bangladesh (ICEAB 2011)
79
CONCLUSION
From land use and vegetation type analysis, it is estimated that destruction of the national forest has been proceeding as a result of harvesting wood and grass in the area. In the homestead gardens, Supari was heavily planted for harvesting seeds, but these areas contain other high trees including not only fruit trees but also Garjan and native species that have been propagated by the stream. The homestead garden is considered a valuable vegetation area in this region, with high trees. This research does not have enough transect lines to compare the whole vegetation cover, especially on
the hillside. A more accurate analysis including image-processing classification of satellite images combined with ground research would be useful, and a phytosociological survey of these areas is needed to understand the natural habitat situation.
REFERENCES
[1] BGD/99/G31 - Coastal and Wetland Biodiversity
Management at Cox's Bazar and Hakaluki Haor
(CWBMP) [Online]. Accessed on May 2011, Available:
http://www.doe-bd.org/cwbmp/
[2] Digital Globe Incorporated, March 17, 2008, Quick
Bird, 4Band, 60cm resolution.
Windbreak Seashore vegetation Farmland with ridges
(Jhau, Casuarina equisetifolia) (Akand, Calotropis gigantea) (Mashkalai, Vigna mungo)
Homestead garden Homestead garden Pan boroz
(Supari, Areca catechu L.) (Garjan, Dipterocarpus alatus) (Betle leaf production facilities)
Pan boroz (inside) Dug well Community forest
(Akashmoni, Acacia auriculiformis)
Scene from hillside towards the village Chon grass harvesting Hilltop scene
Fig. 4. Scenery photographs of land use and vegetation type in MB village.
Proceedings of the International Conference on Environmental Aspects of Bangladesh (ICEAB 2011)
80
A2.007
The Self-thinning of Overcrowded Kandelia obovata Stands
in Manko Wetland, Okinawa Island
Kamara Mouctar1, Kangkuso Analuddin2, Rashila Deshar1,
Sahadev Sharma1 and Akio Hagihara3
1Graduate School of Engineering and Science, University of the Ryukyus, Japan 2The Wallance Research Center, Heluoleo University, Kendari, Indonesia
3Faculty of Science, University of the Ryukyus, Japan
Abstract
The self-thinning in overcrowded Kandelia obovata stands was monitored over six years. The self-thinning exponent α
between mean mass w and population density ρ based on Weller‘s allometric model was 1.506, which was very close to
the self-thinning exponent of 1.508 (t = 0.13, df = 148, p = 0.896), which was calculated using a linear relationship
between logarthmic mean mass and density. This result concluded that the 3/2 power law of self-thinning is
undergoing in the stands. Relationship between mean tree height H and mean mass w , stated that the tree height
increases year by year with increasing mean mass. The allometric constant between mean occupied area and mean
mass was estimated to be 0.373. At the same time the allometric constant between mean mass density and mean mass
was estimated to be 0.0373, which was not significantly different from zero (t = 1.685, df = 148, p = 0.0939). The mass
density seems to be constant regardless of mean mass.
INTRODUCTION
The self-thinning exponent of 3/2 [1] or 4/3 [2] has been successfully established by using a linear relationship between the logarithms of average mass w and plant density ρ, which is known as one
of the most important concepts in ecology. The relationship can be expressed as,
α Kw (1)
where K is a multiplying coefficient and α is a self- thinning constant.
Many ecologists have also applied the relationship between mean mass and tree density for elucidating the self-thinning process [3]–[10]. Some other self-thinning studies have been focused on the basis of simple relationship between mean stem diameter and density, or mean stem volume and density for clarifying the self-thinning exponent [11].
Several allometric interpretations with numerical testing have also been proposed for elucidating the self-thinning exponent [2], [12], [13], [14]. Reference [13] argued that the slope of the self-thinning line varies with plant shape and biomass density. The shape and biomass density of terrestrial plants have been reported to have an important influence on the slope of the self-thinning line [15], [16].
Many studies have been done to test the allometric theory with population mean allometry for elucidating the self-thinning exponent [13]. By allometric analyses [17] found that the self-thinning exponent was different from the 3/2 power law of self-thinning.
The current study attempt to apply the allometric
model for enlightening the self-thinning exponent of the overcrowded mangrove Kandelia obovata stands, i.e. whether the self-thinning exponent is secure or extreme from the 3/2 power law of self-thinning. The long-term goal to use this theory and to develop high density forest systems, in which trees themselves can suppress other trees much more effectively, while offering other major improvements in forest management and sustainability.
MATERIALS AND METHODS
A. Study site
Figure 1 shows the location of study area. The present study was carried out at mangrove of Manko Wetland, which is located along the Kokuba river beside Tomigusuku city of Okinawa Island, Japan (26º11′ N and 127º40′ E). This forest is completely closed in canopy. The mean annual temperature from 2005 to 2010 was 23.33 ± 0.51 (SE) ºC, while the mean annual precipitation of these years was 2204 ± 215.5 (SE) mm.
B. Tree census and estimation of aboveground mass
A 125 m long belt-transect (5 m wide) was established in the K. obovata forest perpendicularly
to river current and divided into 25 subplots (5 × 5 m2). All individuals in the subplots were numbered.
Tree height, H (m), and stem diameter at H/10, D0.1H (cm), were measured in the summers of 2005, 2006, 2007, 2008, 2009 and 2010. These data were arranged by the subplot. Mean H and mean D0.1H of every subplot ranged from 2.17 ± 0.12 (SE) to 3.76 ± 0.03 (SE) m and 2.80 ± 0.16 (SE) to 4.84 ± 0.19 (SE) cm, respectively, as of 2005.
Aboveground mass w (kg), was estimated using the allometric relationship obtained by [18].
hHDgw )( 2H1.0 (2)
where g and h are 0.0392 (kg (cm2 m))-h and 1.022, respectively.
C. Weller’s allometric model:
Weller‘s assumptions [13]: (a) Allometric relationship between mean occupied
s area and mean mass w :
ws
1 (3)
where ρ and are respectivily, population
density and allometric constant.

Proceedings of the International Conference on Environmental Aspects of Bangladesh (ICEAB 2011)
81
Fig. 1. Location of the study area
(b) Allometric relationship between mean tree
height H and mean mass w :
wH (4)
where θ is the allometric constant.
(c) Allometric relationship between mean mass
density d and mean mass w :
w
HS
wd
(5)
where δ is the allometric constant.
Combining assumptions (a), (b) and (c) yields the following relation:
ww
ww
w
HS
wd
θ
1 (6)
Therefore,
)(1 (7)
Comparing refer to (1) and (3), the self-thinning exponent α in refer to (1) is given by the following equation,
1
11 (8)
The slope of the self-thinning line can be estimated from the allometric exponent of
refer to (4) and refer to (5).
RESULTS AND DISCUSSIONS
A. Allometric relationship between mean tree height
H and mean mass w
Fig. 2 depicts the relationships between mean
tree height and mean mass over the experimental
period. The tree height increased with increasing
mass. The value of the exponent θ was 0.3733 (R2 =
0.939).
Fig. 2. Relationship between mean tree height
and mean mass
B. Allometric relationship between mean mass
density d and mean mass w
Mean mass density was calculated by dividing mean mass with the product of mean tree height and reciprocal of density in each subplot. Mean mass density seems to be constant as the stands grew. The value of the exponent δ was 0.03728 (R2 =0.965).
Fig. 3. Relationship between mean mass density
and mean mass
C. Self-thinning line
Inserting exponent values of θ and δ in Eq. (8), resulting in predicted slope was 1.506 for self-thinning line of the present study. The self-thinning line can be ascribed by the following power equation:
1.50668.14 w (9)
The self-thinning line exponent of 1.506 was very close to the self-thinning exponent of 1.508 as estimated using a linear relationship between logarthmic of average mass and plant density [1]. This result justifies that allometric model was
1
10
1 10
200520062007200820092010
Me
an
ma
ss
den
sit
y d
(k
g m
-3)
Mean mass w (kg)
Urban area

Proceedings of the International Conference on Environmental Aspects of Bangladesh (ICEAB 2011)
82
well-described the self-thinning exponent of overcrowded K. obovata stands.
Reference [13] assumed that mass density d ,
could constant regardless of mean mass w, i.e. the exponent δ in (5) was almost zero. On the other
hand, [8] pointed out that the constancy assumption of mass density may not always hold. Reference [10] found that the exponent of δ was far from zero. However, the present study confirmed that the exponent value of δ was 0.0372, which is very close to zero (t = 1.685, df = 148, p = 0.0939). Therefore, this supports Weller‘s assumption.
The self-thinning exponent was well-described by Weller‘s allometric model, at which the value of
/1 or refer to (8) was 1.506. This is because
the value of was nearly equal to 2/3, and the
value of δ was almost zero. Therefore, the present study reveals that mass density was significantly constant with the progress of time, because the exponent δ is very close to zero. This result implies that the trees growth may maintain the same shape regardless of habitat, size or age [1].
Fig. 4. Self-thinning line of Kandelia obovata stands.
CONCLUSION
The self-thinning process was monitored in overcrowded Kandelia obovata stands over six years, having self-thinning exponent (1.506) based on Weller‘s allometric model. Reference [19] also explained the self-thinning process in K. obovata stands on the basis of the relationship between the slope of the self-thinning line and the ratio of relative growth rate to relative mortality rate. Reference [19] also found similar self-thinning exponent (1.46) in K. obovata stands. This means that the results based on the allometric model strengthens the justification of the simple geometric model proposed by [1]. According to these results, it can be concluded that the self-thinning can be explained by the simple geometric model.
ACKNOWLEDGMENT
We thanks Drs. S.M. Feroz, R. Suwa, A.T.M. Rafiqul Hoque and W. Min, and Ms. C. Fengxia for their invaluable help in the field work. This study was partially supported by Grant-in-Aid for Scientific Research (nos. 18380098 and 20510011) from Ministry of Education, Culture, Sports,
Science and Technology, Japan, and by the 21st Century COE program of the University of the Ryukyus.
REFERENCES
[1] K Yoda, T Kira, H Ogawa and K. Hozumi. 1963.
Self-thinning in overcrowded pure stands under
cultivated and natural conditions. J. Biol., Osaka City
Univ., 14: 107–129.
[2] BJ Enquist, JH Brown and GB West. 1998. Allometric
scaling of plant energetics and population density.
Nature, 395: 163-165.
[3] JF White. 1981. The allometric interpretation of the
self-thinning rule. J. Theor. Biol., 89: 475–500.
[4] J White and JL Harper. 1970. Correlated changes in
plant size and number in plant population. J. Ecol., 158: 467-486.
[5] CL Mohler, PL Mark and DG Sprugel. 1978. Stand
structure and allometry of trees during self-thinning
of pure stands. J. Ecol., 66: 599-614.
[6] M Westoby. 1984. The self-thinning rule. Adv Ecol. Res., 14: 167-226.
[7] DE Weller. 1987. A reevaluation of the -3/2 power
rule of plant self-thinning. Ecol. Monogr., 57: 23–43.
[8] B Zeide. 1991. Self-thinning and stand density. For.
Sci., 37: 517-523.
[9] A Osawa and RB Allen. 1993. Allometric theory
explains self-thinning relationship of mountain beech
and red pine. Ecology, 74: 1020-1032.
[10] L Xue and A Hagihara. 1999. Density and size
distribution in Pinus densiflora Sieb.et Zucc. Stands.
Ecol. Res., 14: 49-58.
[11] DA Coomes and RB Allen. 2007. Mortality and
tree-size distributions in natural mixed-age forests. J.
Ecol., 95: 27–40.
[12] JN Long and FW Smith. 1984. Relation between size
and density in developing stands: a description and
possible mechanisms. For. Ecol. Manage., 7: 191-206.
[13] DE Weller. 1987. Self-thinning exponent correlated
with allometric measures of plant geometry. Ecology,
68: 813–821.
[14] WM Londsale. 1990. The self-thinning rule: dead or
alive. Ecology, 71: 1373-1388.
[15] WM Lonsdale and AR Watkinson. 1983. Plant
geometry and self-thinning. J. Ecol., 71: 285–297.
[16] DE Weller. 1989. The interspecific size-density
relationship among crowded plant stands and its
implications for the -3/2 power rule of self-thinning.
Am. Nat., 133: 20–41.
[17] L Xue, K Ogawa and A Hagihara. 1997. The self-
thinning boundary line and dynamic thinning line in
Prince Rupprecht‘s Larch (Larix principis–rupprechtii Mayr) stands. Nagoya Univ. For. Soc., 16: 17-21.
[18] MNI Khan, R Suwa and A Hagihara. 2005. Allometric
relationships for estimating the aboveground
phytomass and leaf area for mangrove Kandelia candle (L.) Druce trees in the Manko wetland,
Okinawa Island, Japan. Trees, 19: 266-272.
[19] K Analuddin, R Suwa and A Hagihara. 2009. The self-
thinning process in mangrove Kandelia obovata stands. J. Plant. Res., 122: 53–59.
1
10
1 10
2006
2007
20082009
2010
Population density (m-2
)
Me
an
ma
ss
w
(kg
)
2005

Proceedings of the International Conference on Environmental Aspects of Bangladesh (ICEAB 2011)
83
A2.008
Defensive Utilization of Chemicals Extracted from Leaves
of Bursera Species on Herbivores
Md. Azharul Islam1,2, * and Judith X Becerra1
1Department of Entomology, University of Arizona, Tucson, AZ 85719, USA 2Graduate School of Agriculture, Tokyo University of Agriculture and Technology, Japan
*Corresponding authour: e-mail: [email protected], [email protected]
Abstract
Leaf extracts of three Bursera species like Bursera penicillata, Bursera vejar-vazquezii and Bursera trifoliata, and their
effects on herbivores were observed. Extracted plant samples were analyzed through GC-MS and compared with the
different standard chemicals to determine their identities. Compounds from Bursera penicillata were rich in α-pinene,
β-pinene, sabinene, β-myrcene, β-cadinene, α-farsenene etc. Chemicals from Bursera trifoliata contained different
siloxanes and β-caryophylline. The similarity of such chemicals (Phellandrene, Germacerene) occured in both Bursera penicillata and Bursera vajer-vazquezii leaves. Chemical contents of the leaves of Bursera penicillata and Bursera
vegar-vazquezii were largely apparent and differed from the leaf extract of Bursera trifoliata. Among the different
essential oils only β-caryophylline remained in leaves of three species which also showed similar effect on their pest
insect behaviors. This result might be helpful for future studies of chemical diversification of intra-species of plants as
well as their natural behaviors on other animals.
INTRODUCTION
The family Burseraceae, deciduous tree, comprises about 600 species in 20 genera of neo-tropical and temperate regions of the world. Old plants in this family were the source of frankincense (Boswellia) and myrrh (Commiphora). The genus diversified in the tropical dry forests of Mexico where about 80 species occured and about 70 species were endemic [1]. There are many Burseraceae produced copious resin from arborescent canals, providing a defense against herbivory [2]-[3]. These resins have a long history of medicinal and ceremonial use in Mesoamerica [4]. As with many other Burseraceae, the primary chemical constituents of Bursera‘s resin were terpenoid essential oils [5]-[6]. Traditionally, plant defenses have been divided into two main categories such as chemical and mechanical defense. Chemical defense included a variety of substances that were toxic, repellent, or that render plant tissues indigestible to animals. Those chemical compositions also vary from plant to plant and species to species and parts to parts of the plant [7].
The genus Bursera was the main host of Blepharida (Chrysomelidae: Alticinae) beetles, consisting of about 45 species, many of which were monophagous [8]-[9]. Larvae of Blepharida species that feed on the Bursera species which released little or no fluids after damage, did not sever the leaf veins. They feed by mining the leaves, but they sometimes rupture the canals and die because they become covered by exudates resins. Reports suggested that resins in Bursera decreased survival and growth rate of Blepharida species [1], [2], [6]. However, some Blepharida insect species depends
on Bursera‘s secondary chemistry for their defenses [5]. The above mentioned past research works showed the different chemical composition between Bursera chemopodicta and Bursera schlechtendalii species. The main purpose of this research is to characterize and compare the chemical contents in leaves of three Bursera species and determine whether the chemistry may account for a difference in Blepharida herbivores or not.
MATERIALS AND METHODS
A. Collection of plant materials
The plants samples (leaves) of three Bursera species were collected from the green house of the University of Arizona campus in June 2009. Sampling was done from 5 years old plants of each species.
B. Extraction of essential oils
Fractions of 200 gm of leaf parts for each species of Bursera were kept in distilled dichloromethane (CH2Cl2) contained glass vials. Three replications were maintained for each species. The chemicals with leaf parts were mixed well and kept in cool (below 50C) condition for 24 hours. The extracted solvent contained extracted chemicals were kept in separate 5 ml vial for further chemical analysis.
C. Chemical analysis of leaf extracts
Gas Chromatography: The extracted samples were analyzed on a Varian CP-8690 GC with flame ionization detectors and fitted with a fused silica capillary column (30 m x 0.25 mm coated with DB-23, film thickness (0.25 µm), the oven temperature was programmed from 50-200°C at 5°C/min, injector temperature 220°C, detector temperature 250°C, carrier gas N2 0.8 ml/min. The linear retention indices of the components were determined relative to the retention times of a series of n-alkanes, and the percentage compositions were obtained from electronic integration measurements without taking into account relative response factors.
Gas Chromatography-Mass Spectrometry: GC/MS analyses were performed using a Hewlett-Packard apparatus equipped with an HP-5MS fused silica column (30 m x 0.20 mm, film thickness 0.25 µm) and interfaced with a quadrupole detector (Model 5970). The oven temperature was programmed from 70-200°C at 10°C/min and injector temperature was 220°C. Helium was used as carrier gas at a flow rate of 0.6 mL/min; the mass spectrometer was operated at 70 eV.

Proceedings of the International Conference on Environmental Aspects of Bangladesh (ICEAB 2011)
84
D. Identification of Chemicals
Individual compounds were identified by matching the obtained spectra with standard mass spectral libraries (NBS 7.5K), by comparing the mass spectra and retention times of authentic standards, and by interpreting the mass spectrum [5].
E. Sources of Reference Compounds
All alkanes, 2-heptanone, 2-heptanol, different monoterpenes, diterpenes and sesquiterpenes were purchased form Aldrich Chemical Co. Nonane, 1-methylhexal acetate, benzaldehyde were collected from Bowers laboratory (Ex), University of Arizona, Tucson, AZ, USA.
F. Host chemical effects on herbivore
The identified chemicals of previous part of the chemical investigation were used to know the effects of host chemicals on the respective herbivore. Analyses of the leaves, feces, regurgitate and anal secretions of Blepharida gabrielae were conducted according to the methodology of a research group [5]
RESULTS
A. Comparison of chemical contents among Bursera species
The chemical contents of investigated three species of Bursera were dominated by terpenoids, mostly monoterpenes and sesquiterpenes, while diterpenes and triterpenes occured at a lesser extent (Table 1). During the analysis of Bursera penicillata the following chemical components were found: non-terpenoid short chain aliphatic alkanes, alcohols and ketones (Table 1). The major volatile essential oils constituents of leaves were heptane and the oxygenated 7-carbon compounds like- 2 heptanol, 1-methylhexyl acetate. The heptane was common chemicals in examined leaf of three species (Table 1). The maximum heptane occurred in Bursera penicillata than other two species. The maximum amount of sesquiterpenes was available in the examined three leave extracts followed by heptane content (Table 1). The minimum amount of short chain aliphatic alcohols, ketones and monoterpenes were observed in Bursera penicillata.
Table 1. Percentage of composition of identified extracted
and volatile components of Bursera penicillata, B. vejar-vazquezlii, and B. trifoliata *
Leaf Extract (%)
Constituent Bursera penicillata
Bursera vejar-vazquezlii
Bursera trifoliata
Heptane 25.40 19.72 24.05
2-Heptanone 3.31 - -
2-heptanol 4.23 - -
α-Thujene 1.82 - -
α-Pinene 0.87 - -
Sabinene 0.68 - 1.29
β-Myrcene 1.40 - -
β-Phillandrene 42.08 38.93 41.75
Carene 2.03 - -
Caryophyllene 4.02 6.94 5.57
Nonane - 3.44 6.20
Limonene - 2.44 2.60
* The solvent is dichloromethane
The chemical mixture of Bursera vejar-vazquezii was less volatile, simpler than Bursera penicillata.
Only three important chemicals eluted (identified) from the leaf extract of Bursera vejar-vazquezii, like- phyllandrene, caryophyllene, nonane rather than heptane which were also available in Bursera penicillata (Table 1). Quantitatively caryophyllene contents were smaller in penicillata than vejar-vazquezii. On the other hand, sesquiterpenes, caryophyllene and several unidentified compounds were found in the leaf of Bursera trifoliate (Table 1). There were many similar compounds were eluted from the leaf extracts of Bursera vejar-vazquezlii and Bursera trifoliata shown in Table 1. In case of Bursera vejar-vazquezlii leaf extract analysis, the maximum content of chemical was beta-phylandrene followed by heptane (Table 1). Similar availability remained in case of Bursera trifoliata shown in Table 1.
B. Host chemical effects on herbivore
The anti-predatory beetles belongs to the genus Blepharida, corresponds to the defenses of the Bursera trifoliata that they feed on. Larvae of Blepharida (Fig. 1b) feed on squirting Bursera festoon themselves with their own feces to form fecal mounds or shields
Fig. 1. Adult (a) and larvae (b) of Blepharida gabrielae.
The collection of their faces was the result of a dorsal anus and a neuromuscular propulsion system that conveys feces forward over larvae. Larvae that feed on hosts produced little or no fluids when damaged, released an anal secretion or carried their feces on their backs. Instead, they rear their heads up to feces their insect predators in a boxing like display and swing their abdomens rapidly and forcefully.
Results (Table 2) expressed the volatile components of the resin of β-phelandrene and limonene. Extracts of the larvae and enteric discharges of Blepharida gabrielae (Fig. 1a) contained all of the volatile compounds identified from the plant leaves. The amount of chemical that present in leaf extract and the extract of larvae of the insect were similar in the present investigation (Table 2). Slightly higher amount of beta-phyllandrene and limonene were occurred in Regurgitate and Shield extracts than leaf extracts of plant species
(Table 2). Therefore, although this beetle species was able to disarm the high pressure resin defense of its host, the plant compounds were ingested and excreted in the fecal shields.
A B

Proceedings of the International Conference on Environmental Aspects of Bangladesh (ICEAB 2011)
85
Table 2. Chemical analysis of the extracts Blepharida gabrielae and Brusera trifolita
Retention
time *
Chemical CAS
Number **
Leaf***
(%)
Resin
(%)
Larvae
(%)
Regurgitate
(%)
Shield (%)
4.35 Heptane 111-74-4 24.05 11.4 13.10 - -
5.78 Nonane 111-84-2 6.20 2.4 3.90 - -
6.43 Alpha-pinene 80-56-8 - - 3.80 - -
7.05 Benzaldehyde 100-52-7 - - 3.90 - -
7.18 Sabinene 3387-41-5 4.2 5.9 3.40 7.60 9.60
7.49 Beta-Myrcene 123-35-3 7.5 5.4 4.10 - -
8.29 Limonene 138-86-3 12.6 17.0 15.30 15.80 19.00
8.35 Beta-phellandrene 555-10-2 41.75 57.90 52.50 76.60 71.40
* indicates retention time in minutes.; ** indicates chemical abstracts service registry number.
*** indicates excluding the unidentified chemicals.
DISCUSSIONS
This study reported the relationship and comparison between the chemical contents of three Bursera species that showed different effects on their herbivores. The chemical contents of
investigated three species of Bursera were dominated by terpenoids, mostly monoterpenes and sesquiterpenes, while diterpenes and triterpenes occured at a lesser extent. This result supported from the past investigated research works conducted by [5], [10-13]. The major volatile essential oils constituents of leaves are heptane and the oxygenated 7-carbon compounds like- 2 heptanol, 1-methylhexyl acetate which was almost duplicate analysis of Bursera schlechtendalli leaf extracts [3].
Past reports on B. schlechtendalli leaf extracts showed absence of monoterpenes but the leaf extracts Bursera penicillata contained different monoterpenes at a distinct amount. In addition, leaf of another two species of Bursera did not contain such monoterpenes (Table 1). This chemical variation indicates the differentiation from other species of Bursera. It will show demand for further studies between interactions of the plant species.
Another explanation for the peculiar chemical simplicity of squirting Bursera was a relaxation of the need for chemical defenses. If the released high pressurized liquid was an effective anti-herbivore defense, the chemical nature of the individual components might not be an important as in non-releasing Bursera species. One single toxic or repellent compound that satisfies the required physical demands of the squirt defense may be an effective, economical option. Bursera species may also released regurgitate when attacked or disturbed by predators [5].
Most of the reported compounds were found to possess insecticidal activity [14] where Bursera
species eluted chemicals also showed similar results. The monoterpenes like- α-pinene and α-thujene are predominant in the essential oil of biotypes with leaves bearing glandular trichomes. The essential oil from glabrous leaves consists mostly of a blend of several sesquiterpenes [10-13] of which germacrene [7], [15] and β-caryophyllene [7] were the major components. A sesquiterpene, caryophyllene was found in investigated three species of Bursera, demonstrating that alkane resin species showed their sesquiterpenoid synthetic capabilities.
Thus rely on chemical defenses of Bursera species
have more volatile chemical mixtures as other plant sources, while biotypes that depend solely on chemical protection have more complex and less volatile chemical combinations.
The compounds of the non-releasing species are heavier and mixture is more complex. The monoterpene fraction was small, compared to the squirting species (Bursera schlechtendalii) and the mixture includes more sesquiterpenes and diterpenes (Table 1). There are few research works also supported the chemical effects of the member of Burseraceae on another plants, animals [15-16].
A recent report [16] suggested that no damage to hepatocytes as a result of the exposure to the plant bark extract (a member of Burseraceae). Medicinal and phytochemical properties also remained in Burseraceae plant [10] that supports the present study in respect of the different composition in Bursera.
The apparent interaction between the chemicals present in leaves and their herbivores existed. It has an important consequence for the tactics that Blepharida feeding on squirting plants have responded evolutionarily by cutting the resin canals, which often makes them more susceptible to predation. These beetles also compensated their higher risk of predation by utilizing the defensive compounds present in the plant against their own predators. Blepharida species that feed on non-squirting, chemically more complex plants and did not get any protection from their hosts will develop an alternative behavioral defense mechanism.
CONCLUSION
The chemical characterization and composition of the leaf extracts of three Bursera species were extracted and identified from the previous research supports. The major variations occurred among the chemical composition of the investigated leaves of three Bursera species. This result illustrated the chemical diversification among the species of same genus remained in nature. The availability of sesquiterpenes was higher than other group of chemicals that was positively supported by many research works. One of the species of Bursera
showed distinguished chemical contents than the other two species. Finally, it can be concluded that insect might be controlled through the utilization of defensive chemicals that present in plant leaf

Proceedings of the International Conference on Environmental Aspects of Bangladesh (ICEAB 2011)
86
extracts. Susceptibility of plant species mostly depend upon the chemical content or secretion from the plant parts itself. This investigation might be helpful for further research works on chemical diversification among the species of plant and their utilization for defensive mechanism from other animals. The study revealed that the naturally occurring compounds that affects the insect development and its behavior which offer a continual source of inspiration and challenge.
REFERENCES
[1] JX Becerra and DL Venable. 1999. Macroevolution of
insect-plant associations: The relevance of host
biogeography to host affiliation. Proc. Nat. Acad. Sci. USA. , 96: 12626-12631.
[2] JX Becerra. 1994. Squirt-gum defense in Bursera and
the chrysomelid counterploy. Ecology, 75: 1991-1996.
[3] PH Evans and JX Becerra. 2006. Non-terpenoid
essential oils from Bursera chemopodicta. Flavour and Fragrance Journal, 21: 616-618.
[4] RJ Case, AO Tucker, MJ Maciarello, KA Wheeler.
2003. Chemistry and ethnobotany of ommercial
incense copals copal blanco, copal oro, and copal
negro, of North America. Econ. Bot., 57: 189-202.
[5] PH Evans, JX Becerra, DL Venable and WS Bowers.
2006. Chemical Analysis of Squirt-gun Defense in
Bursera and Counterdefense by Chrysomelid Beetles.
J. Chem. Ecol., 26: 745-754.
[6] PH Evans and JX Becerra. 2006. Non-terpenoid
essential oils from Bursera chemopodicta. Flavour and
Fragrance Journal, 21: 616-618.
[7] S Karaman. 2006. OMorphogenetic variation for
essential oils in Salvia palaestina bentham leaves and
bracts from Turkey. Pak. J. Biol. Sci., 9: 2720-2722.
[8] JX Becerra. 1997. Insects on plants:
macroevolutionary chemical trends in host use.
Science, 276: 253-256.
[9] JX Becerra. 2003. Synchronous coadaptation in an
ancient case of herbivory. Proc. Natl. Acad. Sci., USA, 100: 12804-12807.
[10] SP Bako, MJ Bakfur, I John and EI Bala. 2005.
Ethnomedicinal and phytochemical profile of some
savanna plant species in Nigeria. Intl. J. Botany, 1:
147-150.
[11] AOT Ashafa, DS Grierson and AJ Afolayan. 2008.
Effects of drying methods on the chemical
composition of essential oil from felicia muricata
leaves. Asian J. Plant Sci., 7: 603-606.
[12] MA Ebrahimzadeh, SF Nabavi and SM Nabavi. 2009.
Essential oil composition and antioxidant activity of
Pterocarya fraxinifolia. Pak. J. Biol. Sci., 12: 957-963.
[13] M Ramdani and T Lograda. 2009. Foliar
sesquiterpene variations in natural populations of
Cupressus dupreziana in Tassili N`Ajjer (Algeria).
Asian J. Plant Sci., 8: 59-63.
[14] MA Deepa and NV Bai. 2010. Bioinsecticidal
compounds of celastraceae-the spindle tree family.
Int. J. Botany, 6: 220-227.
[15] MH Salehi Sourmaghi, G Amin, N Samadi, F Hemmati
and P Sarkhail. 2006. Chemical composition and
antimicrobial activity of essential oil of Salvia spinosa
L. Asian J. Plant Sci., 5: 654-656.
[16] R Aliyu, G Donatien and KH Jaryum. 2007. The
effects of Boswellia daizielii (Burseraceae) aqueous
bark extract on Rat Liver function. Asian J. Biochem.,
2: 359-363.

Proceedings of the International Conference on Environmental Aspects of Bangladesh (ICEAB 2011)
87
A2.009
Self-thinning in Bruguiera gymnorrhiza (L.) Lamk. Stands
in Okukubi River, Okinawa Island, Japan
Rashila Deshar1, Sahadev Sharma1, ATM Rafiqul Hoque2
Kamara Mouctar1 and Akio Hagihara3
1Graduate School of Engineering and Science, University of the Ryukyus, Japan 2Institute of Forestry and Environmental Sciences, Chittagong University, Bangladesh
3Faculty of Science, University of the Ryukyus, Japan
Abstract
The self-thinning exponent α between mean aboveground mass w and population density ρ in Bruguiera gymnorrhiza
stands was found to be 1.475, which was more closer to 3/2. The multiplying factor K was estimated to be 12.850 kg
m-2α. Using Weller‘s allometric model, the allometric relationships of mean tree height H and the mean aboveground
mass density d to w were studied. The values of the allometric constant θ and the multiplying factor gθ between H
and w were estimated to be 0.259 and 2.848 m kg–θ, respectively. Simultaneously, the allometric constant δ and the
multiplying factor gδ between d and w were estimated to be 0.063 and 1.981 m-3 kg1-δ, respectively. The α based on θ
and δ values, and K based on gθ, gδ and values were respectively estimated to be 1.48 and 12.85 kg m-2/ø, which
confirms that the 3/2 power law of self-thinning is undergoing in this stands.
INTRODUCTION
Self-thinning has been described in a variety of ways; among which, the self-thinning law, or the 3/2 power law of self-thinning [1] has attracted much attention for a long time. The law expresses
the relationship between mean mass w and
population density ρ in overcrowded stands during the development of an even-aged population with complete canopy closure. The relationship can be expressed as,
α Kw (1)
where K is a constant which varies from species to species, and α is the self-thinning exponent, which
is close to 3/2 regardless of species, ages, or site conditions.
The earliest geometric model [1], assumes plants do not change their properties as they grow larger and compete so the thinning slope is always 3/2. But, [2], [3] argued and proposed an allometric model predicting that the self-thinning exponent varies with plant shape and biomass density (mass per unit occupied space). Although the plant shape and biomass density have been reported to have an important influence on the slope of the self-thinning line [4]-[6], very few reports on plant shape and biomass density are based on experimental data.
The self-thinning rule is widely accepted and has become the most applicable principle in plant population dynamics. Much interest on self-thinning studies has been focused on terrestrial plant populations [7] - [11]. In contrast, little information is known about the self-thinning for mangroves [12], and there is no information of Bruguiera gymnorrhiza (L.) Lamk.
The northernmost limit of B. gymnorrhiza distribution is Amami Island in the northern part of the Ryukyu Archipelago, Japan [13]. Like many other mangrove species, B. gymnorrhiza also has some economic and ecological values and contribute to the sustainability of mangrove ecosystem. Therefore, study on self-thinning would be of fundamental importance for understanding the ecology and its management. Self-thinning
theory and statistical mechanics shows how the stochastic nature of ecological interaction among individuals, due to spatial effects such as the availability of neighborhood resources at the microscopic level, leads to self-thinning at the macroscopic level. Hence, the purpose of this study is to determine the self-thinning exponent of B. gymnorrhiza using Weller‘s allometric model and to examine whether the self-thinning exponent is different from 3/2.
MATERIALS AND METHODS
A. Study site
This study was carried out in a mangrove Bruguiera gymnorrhiza (L.) Lamk. forest along the Okukubi River (26º27' N, 127º56' E) in Okinawa Island, Japan (Fig. 1). The mean monthly minimum, mean monthly maximum and mean annual temperatures were estimated to be 16.5 ± 0.2°C in January and 28.9 ± 0.2°C in July and 22.8 ± 1.3 (SE) °C respectively during the study period. The warmth index was 213.3 ± 0.5 (SE) °C month, which is within the range of 180 to 240°C month of the subtropical region defined by [14].
B. Tree census
A non-continuous 215 m long belt-transect (5 m wide) along the river was established in the pure B. gymnorrhiza forest (Fig. 1) and divided into 43 plots (5 × 5 m2). Tree height, H (m), and stem diameter at H/10, D0.1H (cm), of all individuals in the plots were
measured in March-April 2010. Means of H and D0.1H respectively ranged from 3.46 ± 0.06 to 8.48 ± 0.39 m and 4.09 ± 0.12 to 12.81 ± 1.11 (SE) cm.
C. Harvesting method
Eleven sample trees ranging from 0.72 to 9.88 m in H, from 1.82 to 59.5 cm in D0.1H were selected in the forest for harvesting. The total fresh mass of stem, branches, and leaves of each tree were measured. Samples of stem, branches and leaves were taken for estimating the ratio of dry/fresh mass. All samples were dried in a ventilated oven at 80ºC for 48 to 168 h depending on the size of

Proceedings of the International Conference on Environmental Aspects of Bangladesh (ICEAB 2011)
88
samples and desiccated at a room temperature, and then weighed. The allometric relationship of
aboveground mass w (kg) and HD .
2
H10 (cm2 m) of
11 sample trees was established as follows,
063.12
H1.0028037.0 HDw (2)
Equation (2) was used for estimating aboveground mass of individual trees of each plot.
Fig. 1. Location map of the study area.
Symbol A, plot 1 to plot 4; B, plot 5 to plot 8; C, plot 9 to
plot 16; D, plot 17 to plot 23; E, plot 24 to plot 43.
D. Weller’s allometric model
Reference [3] proposed the allometric model based on the following three assumptions for overcrowded plant population. Assumption 1: the
mean occupied area s is related with the mean
aboveground mass w by the following allometric
relationship,
ws
1 (3)
where ρ is the population density and is the
allometric constant between s and w . Assumption
2: the relationship between the mean tree height H and the mean aboveground mass w can be
expressed by the following allometric relationship,
wH (4)
where θ is the allometric constant between H and w . Assumption 3: the relationship between the
mean aboveground mass density d and the mean
aboveground mass w can also be expressed as
follows,
wHs
wd
(5)
where δ is the allometric constant between d and
w .
Combining refer to (3), (4) and (5) yields the following relation,
ww
ww
w
Hs
wd
1 (6)
This relation stands for that the following equality holds among allometric constants,
)(1 (7)
As a result, the allometric constant in refer to (3)
can be given by the following equation, )(1 (8)
Comparing refer to (1) and (3), the self-thinning exponent α in refer to (1) is given by the following equation,
1
11 (9)
Equation (9) allows the self-thinning exponent to be estimated from the allometric constants θ refer to (4) and δ refers to (5).
RESULTS AND DISCUSSIONS
A. Self-thinning line
Fig. 2 shows the scatter plots of mean
aboveground mass w (kg) to population density ρ
(m-2) of each plot on logarithmic coordinates. The self-thinning line can be described by the following equation,
475185012 ..w (10)
The self-thinning exponent (1.475) was more closer to 3/2 (t = 0.2702, df = 41, p = 0.7884) proposed by [1] than 4/3 (t = 1.6834, df = 41, p = 0.09989) proposed by [15].
Fig. 2. Scatterplot of mean aboveground mass w to
population density ρ on log-log coordinates. The
self-thinning line is given by Eq. (10) (R2=0.87).
Reference [12] also found similar self-thinning exponent (1.46) in K. obovata stands. Reference [1] originally derived a simple geometric explanation of the self-thinning rule from two assumptions: plants of a given species maintain the same shape regardless of habitat, size, or age; and mortality occurs only when the total coverage of a plant population exceeds the available area, then acts to maintain 100% cover.
1
10
100
0.1 1 10
Mea
n a
boveg
rou
nd
ma
ss w
(k
g)
Population density (m-2
)

Proceedings of the International Conference on Environmental Aspects of Bangladesh (ICEAB 2011)
89
B. Weller’s allometric model
As shown in Fig. 3, mean tree height H (m) increased with increasing mean aboveground mass
w (kg). As a result, the allometric relationship
defined by refer to (4) was given by the form,
wgH (11)
where gθ and θ were estimated to be 2.848 m kg-θ
and 0.259, respectively. As shown in Fig. 4, mean aboveground mass
density d (kg m-3) tended to increase with
increasing w . This allometric relationship defined
by refer to (5) was given by the form,
wgHs
wd
(12)
where gδ and δ were estimated to be 1.981 m-3 kg1-δ
and 0.063, respectively. The δ value was not significantly different from zero (t = 1.312, df = 41, p
=0.1967). Reference [3] assumed that d is
constant regardless of w , i.e. δ is zero. Therefore,
our study confirmed Weller‘s assumption. However, [16] reported in Pinus tabulaeformis Carr. and Larix principis-rupprechtii Mayr stands that the δ-values concerning mean stem volume were significantly
larger than zero.
The average of d , i.e. biomass density (biomass/
H ), was estimated to be 2.49 ± 0.13 (SE) kg m-3, which was considerably higher than 1.3 to 1.5 kg m-3 of ordinary terrestrial forests except for dwarf pine (Pinus pumila Regel) forests having a quite high
value of d [14]. This is because the height of B.
gymnorrhiza growing near the northernmost limit of its distribution is low [14]. In fact, the mean height ranged from 3.5 to 8.6 m (Fig. 3); nevertheless the leaf mass might be large.
Fig. 3. Allometric relationship between mean tree height
H and mean aboveground mass w on log-log
coordinates. The straight line is fitted by Eq. (11)
(R2=0.95).
Equation (3) can be rewritten as,
wgs
1 (13)
where gø is the multiplying factor between s and
w . Inserting refer to (11) and (13) into the left-hand
side of refer to (12) and then comparing the coefficients of both-hand sides, the relation among multiplying factors is derived as,
gg
g
1
(14)
On the other hand, refer to (13) can be transformed as follows,
11
1
.
gw
(15)
Considering refer to (14), refer to (15) can be rewritten in the form,
11
.ggw (16)
Equation (16) is the same form as refer to (1) proposed by [1]. Thus, following equality holds,
1
.ggK (17)
Fig. 4. Allometric relationship between mean aboveground
mass density d and mean aboveground mass w on
log-log coordinates. The straight line is fitted by Eq. (12)
(R2=0.05).
Therefore, α and K values can be calculated on the basis of the allometric model as follows: the self-thinning exponent α in refer to (1) was estimated to be 1.48 from refer to (9) using the θ-value in refer to (11) and the δ-value in refer to (12). On the other hand, the multiplying factor K in refer to (1) was estimated to be 12.85 kg m-2/ø from refer to (17) using the -value of refer to (8), the gθ-value of refer
to (11) and the gø-value of refer to (12).
CONCLUSION
Thus, it is concluded that the resultant
self-thinning equation coincided with refer to (10),
where the self-thinning exponent was not
significantly different from 3/2 (Fig. 2). Reference
[12] also found similar self-thinning exponent (1.46)
in K. obovata stands. This means that the results
based on the allometric model strengthens the
justification of the simple geometric model proposed
by [1]. As far as the present overcrowded B.
gymnorrhiza stands are concerned, therefore, the
self-thinning can be explained by the simple
geometric model, though there are debates that the
self-thinning exponent is closer to 4/3 based on the
metabolic model proposed by [15], [18].
1
10
1 10 100
Mean
ab
ov
egrou
nd
mass
den
sity
d (
kg
m-3
)
Mean aboveground mass w (kg)
1 10 100
Mean
tree h
eig
ht
H (
m)
Mean aboveground mass w (kg)
2
10
20

Proceedings of the International Conference on Environmental Aspects of Bangladesh (ICEAB 2011)
90
ACKNOWLEDGMENT
We thank Drs. R. Suwa, K. Analuddin and W. Min, and Ms. C. Fengxia for their invaluable help in the field work. This study was partially supported by Grant-in-Aid for Scientific Research (nos. 18380098 and 20510011) from Ministry of Education, Culture, Sports, Science and Technology, Japan, and by the 21st Century COE program of the University of the Ryukyus.
REFERENCES
[1] K Yoda, T Kira, H Ogawa and K Hozumi. 1963.,
Self-thinning in overcrowded pure stands under
cultivated and natural conditions. J. Biol., Osaka City Univ., 14: 107–129.
[2] DE Weller. 1987a. A reevaluation of the -3/2 power
rule of plant self-thinning. Ecol. Monogr., 57: 23–43.
[3] DE Weller. 1987b. Self-thinning exponent correlated
with allometric measures of plant geometry. Ecology,
68: 813–821.
[4] WM Lonsdale and A Watkinson. 1983. Plant geometry
and self-thinning. J. Ecol., 71: 285–297.
[5] RA Norberg. 1988. Theory of growth geometry of
plants and self-thinning of plant populations:
geometric similarity, elastic similarity, and different
growth models of plant parts. Am. Nat., 131: 220–
256.
[6] DE Weller. 1989. The interspecific size-density
relationship among crowded plant stands and its
implications for the -3/2 power rule of self-thinning.
Am. Nat., 133: 20–41.
[7] JL Harper. 1977. Population biology of plants.
Academic press, London.
[8] J Silvertown and D Charlesworth. 2001. Introduction to plant population biology. Blackwell, Oxford.
[9] DA Coomes and RB Allen. 2007. Mortality and
tree-size distributions in natural mixed-age forests. J. Ecol., 95: 27–40.
[10] JW McCarthy and G Weetman. Self-thinning
dynamics in a balsam fir (Abies balsamea (L.) Mill.)
insect-mediated boreal forest chronosequence. For.
Ecol. Manage., 241: 295–309.
[11] J Zhang, WW Oliver and MW Ritchie. 2007. Effect of
stand densities on stand dynamics in white fir (Abies
concolor) forests in northeast California, USA. For. Ecol. Manage., 244: 50–59.
[12] K Analuddin, R Suwa and A Hagihara. 2009. The
self-thinning process in mangrove Kandelia obovata stands. J. Plant. Res., 122: 53–59.
[13] M Spalding, M Kainuma and L Collins. 2010. World
atlas of mangroves. Earthscan Publications, London.
[14] T Kira and T Shidei. 1967. Primary production and
turnover of organic matter in different forest
ecosystems of the western Pacific. Jpn. J. Ecol., 17:
70–87.
[15] BJ Enquist, GB West, EL Charnov and JH Brown.
1999. Allometric scaling of production and
life-history variation in vascular plants. Nature, 401:
907–911.
[16] L Xue, K Ogawa, A Hagihara, S Liang and J Bai. 1999.
Self-thinning exponents based on the allometric
model in Chinese pine (Pinus tabulaeformis Carr.) and
Prince Rupprecht‘s larch (Larix principis-rupprechtii Mayr) stands. For. Ecol. Manage., 177: 87–93.
[17] R Suwa, R Deshar, A Hagihara. 2009. Forest
structure of a subtropical mangrove along a river
inferred from potential tree height and biomass.
Aquat. Bot., 91: 99–104.
[18] BJ Enquist, JH Brown, GB West. 1998. Allometric
scaling of plant energetics and population density.
Nature, 395: 163–165.

Proceedings of the International Conference on Environmental Aspects of Bangladesh (ICEAB 2011)
91
A2.010
Leaf Phenological Traits in the Mangrove Rhizophora stylosa Griff.
in Okinawa Island
Sahadev Sharma1, ATM Rafiqul Hoque2, Kangkuso Analuddin3
Rashila Deshar1 and Akio Hagihara4
1Graduate School of Engineering and Science, University of the Ryukyus, Japan 2Institute of Forestry and Environmental Sciences, Chittagong University, Bangladesh
3The Wallance Research Center, Heluoleo University, Kendari, Indonesia 4Faculty of Science, University of the Ryukyus, Japan
Abstract Mangroves leaf phenological trait studies are needed to know its adaptation strategies and growth. In this study,
Phenological traits of Rhizophora stylosa are measured during the period of April 2008 to March 2010. Phenological
studies have been done using both sample tree and litterfall methods. Newely flushed leaves occurred successively
throughout the year, with a maximum in July and a minimum in January. The highest leaf death was in June, whereas
it was the lowest in December. Results of Pearson correlation analysis indicate that the seasonal variation in leaf
production was explained by variation in temperature, vapor pressure deficit, sunshine duration and rainfall, hence
supporting the hypothesis that leaf phenological traits had a strong environmental factor effect. Result of stepwise
multiple regression analysis showed that temperature is the most important environmental variable that affects the
production of leaves (adjusted R2 = 0.696, F1,10 = 26.22, p < 0.05).
INTRODUCTION
Mangroves are unique trees that are found almost exclusively in the tropics and subtropics. Rhizophora are considered the most important of all mangrove genera across the Pacific tropical and subtropical region. The leaf litterfall is a main component of net primary production [1], reflects phenological events [2], [3] and is also an important part of energy and nutrient fluxes in mangrove ecosystems [4]. Leaf available for photosynthesis plays a crucial role in biomass production [5]. Therefore, it is necessary to investigate the dynamics of leaves to understand the productivity of mangroves, which plays an important role in subtropical and tropical coastlines of the world.
Phenological studies provide information regarding the linking between plant processes (i.e. growth, senescence of plant tissues or organs) and the biotic and abiotic environment [6]. Plant varies widely in their phenological behavior according to morphological traits related to resource acquisition and conservation [7], [8]. Several studies reported contrasting leaf traits and leaf litterfall patterns among plant species or life forms from different
ecosystems [9], [10]. Phenological data are essential to know the tree ability to adapt growth and propagation strategies to ambient climatic conditions. This kind of knowledge is most valuable if available across a broad geographic scale. However, little is known about R. stylosa leaf phenology in Okinawa Island near the northern limit of mangrove distribution.
The production and fall of mangrove leaves can be investigated by direct observation and by indirect observation of litterfall measurement. Many studies have documented mangrove litterfall to assess productivity, because the litterfall helps maintain the productivity of mangroves and the adjacent ecosystems. As mangroves in Okinawa thrive in a distinct seasonal climate, they have to cope with substantial seasonal changes in environmental factors. Therefore, it can be expected that several climatically related environmental factors influence
their leaf growth and production. Some environmental factors that may relate to the production and loss of R. stylosa leaves were investigated in this study. Several authors discussed seasonal growth and productivity of mangroves and relating them to some climatic factors, such as rainfall, temperature, radiation and wind speed like [11] - [17]. Consequently, based on leaf production traits, it was possible to characterize environmental patterns that define their production and loss, and hence, the biological and environmental relationship.
MATERIALS AND METHODS
A. Study site
The study was conducted in a mangrove forest (26o11′N and 127o40′E) of Manko Wetland, Okinawa Island, Japan (Fig. 1), from April 2008 to March 2010. This wetland is an important area for migratory birds and has been registered as the RAMSAR site since 1999. The mangrove Kandelia obovata (S., L.) Yong is the dominant species in the study site. A few patches of Rhizophora stylosa Griff., Bruguiera gymnorhiza (L.) Lamk. and Excoecaria agallocha L. are also observed.
The warmth index [18] based on the data of 2000 – 2009 obtained from the Okinawa Meteorological Observatory, Naha, Okinawa, was 219.8oC month, indicating that this area belongs to the subtropical region. Figure 2a depicts the seasonal changes in monthly air temperature and VPD. Monthly mean
minimum temperature is 16.7 in January and
monthly mean maximum temperature is 29.4 in
July during the study period (Fig. 2a). Figure 2a shows the change in monthly mean air vapor pressure deficit, VPD (= 100 x VP/RH – VP), where VP in monthly mean vapor pressure (hPa) and RH is monthly mean relative humidity (%) during the study period of April 2008 to March 2009. The highest and the lowest VPD were 11.5 hPa in July and 6.44 hPa in March, respectively. Figure 2b shows the seasonal changes in monthly total

Proceedings of the International Conference on Environmental Aspects of Bangladesh (ICEAB 2011)
92
rainfall and monthly sunshine duration. Mean annual rainfall is 1417.5 mm yr-1 during the study period. The highest and the lowest rainfall were 267.5 mm in September and 37.0 mm in December, respectively (Fig. 2b). Monthly minimum sunshine duration is 87.5 h in January and monthly maximum sunshine duration is 256.8 h in July during the study period (Fig. 2b).
Fig. 1. Location of the study area. The hatched zone
indicates the mangrove area.
B. Tree census and litterfall collection
Five subplots of 4 x 4 m were established in a
monospecific R. stylosa stand, whose canopy has been completely closed. All individuals in the subplots were counted and numbered. Growth parameters, such as tree height H and diameter at breast height (DBH) were measured in March 2009. Mean tree density, mean H and mean DBH were 2.26 ± 0.14 (SE) no./m2, 3.93 ± 0.72 m and 4.16 ± 3.70 cm, respectively.
One litter trap was placed in each subplot. The litterfall traps were emptied monthly from April 2008 to March 2009, and the litterfall was sorted into leaves and stipules. The sorted litterfalls were dried to a constant mass at 80oC over a 48 h period, and then weighed.
C. Leaf recruitment and death
According to the tree census, a relatively tall tree was selected as a sample tree, whose H and DBH were 4.32 m and 5.46 cm, respectively, for the direct observation of leaf recruitment and death.
The total number of branches, including main stem, primary, secondary and tertiary branches, of the sample tree was over 200. To confirm the direct observation on the sample tree, the indirect observation based on the litterfall was performed. All leaves of the sample tree were numbered at the
beginning of April 2008. Thereafter, newly flushed leaves were labeled and counted each month. The numbers of surviving and dying new leaves were totaled monthly.
Fig. 2. Seasonal changes in monthly mean air temperature
() and monthly mean air vapor pressure VPD () (a) and
monthly total rainfall () and monthly sunshine duration
() (b).
D. Statistical analyses
The Pearson correlation analysis was performed to know the significant affect of each environmental factor on leaf recruitment and death, and leaf and stipule litterfalls. A stepwise multiple regression analysis was performed to know the strongest environmental gradient, which affect the leaf production and death, and leaf and stipule litterfalls. Both the analyses have been done using SPSS (Ver. 14.0 J, SPSS Inc., USA).
RESULTS AND DISCUSSIONS
Fig. 3 represents the seasonal changes in leaf recruitment and death of the sample tree (direct observation) and in stipule and leaf litterfalls from the plots (indirect observation). The maximum of leaf recruitment occurred in July (Fig. 3a) and of stipule litterfall indicating the flush of new leaves occurred in June (Fig. 3b), while the maximum of leaf death occurred in June (Fig. 3a) and of leaf litterfall occurred in July (Fig. 3b). The leaf recruitment and the stipule litterfall reached their
Urban area
16
18
20
22
24
26
28
30
5
6
7
8
9
10
11
12
Me
an
air
te
mp
era
ture
(oC
)
VP
D (
hP
a)
0
50
100
150
200
250
300
50
100
150
200
250
300
A M J J A S O N D J F M
Mo
nth
ly t
ota
l ra
infa
ll
(mm
mo
nth
-1)
Month
Mo
nth
ly s
un
sh
ine
du
rati
on
(h
)
2008 2009
(a)
(b)

Proceedings of the International Conference on Environmental Aspects of Bangladesh (ICEAB 2011)
93
minimum in January and February, respectively, while the leaf death and the leaf litterfall reached their minimum in December. These results suggest that the seasonal patterns of stipule and leaf litterfalls reflect well those of leaf recruitment and death based on the indirect observation. Newly flushed leaves appeared successively throughout the year, though there is a seasonal change with a maximum in the summer and a minimum in the winter (Fig. 3). The number of leaves recruited in the summer represented 48.0% of the annual total, whereas 13.6% were recruited in the winter. Reference [19] reported a similar seasonal trend in Kandelia obovata leaf production at Sashiki, Okinawa Island, Japan. In the subtropical region, leaf fall and leaf production are low during the winter season [11], [20]. In temperate mangroves, leaf litterfall has been reported to be unimodel and highest in summer [2], [21]. Although peak litterfall have been observed in other mangrove wetlands during the rainy season [22], [23]. It is obvious from Fig. 2 that new leaves were formed or expanded at different rates throughout the year, whereas shedding of old leaves took place at more even rates. Rhizophora mangle L., studied in subtropical Florida by [11], is a continuously growing species but shows a unimodel growth with a very high rate of leaf replacement in the warm and humid summer. Several studies in Australia and Papua New Guinea have reported marked seasonal periodicity in leaf emergence for Rhizophora spp., with a peak during
the wet season [24], [25], [26]. Rates of leaf emergence were significantly higher in the wet season than the dry seasons, as observed in Mekong delta, Vietnam [26]. Seasonality in leaf emergence is less clear, as [24] did not observe a seasonal periodicity in stipule production based on the dry mass collected month at sites on Hinchinbrook Island [27].
The Pearson correlation analysis results showed that leaf recruitment significantly controlled by VPD (r = 0.549, p < 0.05), sunshine duration (r = 0.698, p < 0.05), rainfall (r = 0.509, p < 0.05) and temperature (r = 0.851, p < 0.05). Leaf litterfall significantly depend on (r = 0.698, p < 0.05), sunshine duration (r = 0.700, p < 0.05) and temperature (r = 0.837, p < 0.05). However, Stipule litterfall significantly depends on only temperature (r = 0.657, p < 0.05). Leaf death did not depend on environmental factors. A stepwise multiple regression analyses showed that leaf recruitment (adjusted R2 = 0.696, F1,10 = 26.22, p = 0.005), leaf litterfall (adjusted R2 = 0.671, F1,10 = 23.44, p = 0.001) and stipule litterfall (adjusted R2 = 0.374, F1,10 = 7.581, p = 0.020) significantly strongly depends on temperature. This finding is supported by similar results from reference [21], the leaf litterfall of Avicennia marina (Forsk.) Vierh. increased with increasing air temperature. The seasonal occurrence of production and loss of leaves in R. stylosa shows similarity with trends
observed in species growing at the northern and southern latitudes, suggest existence of some adaptive strategies in the phenological traits of R. stylosa coupling to thermal environmental gradients. This is consistent with temperature-dependent seasonal growth for
mangrove species, whose distribution limits at either end of the latitudinal level [28], [2]. Other evidence also suggests a link between leaf production and temperature. Reference [29] found that the total leaves produced and the shoot growth in K. candle seedlings in southern Japan had a very high correlation to daily cumulative temperature. References [2], [14] have also reported that the distribution and phenology of A. marina in southern Australia followed a latitudinal temperature gradient.
Fig. 3. Seasonal variations in leaf recruitment () and leaf
death () of the sample tree (a) and in stipule () and leaf
() litterfalls in the plots (b). Litterfall data are shown as
mean ± SE.
CONCLUSION
Leaf recruitment and death showed the seasonal patterns. Leaf and stipule litterfalls also showed the seasonal patterns having maximum peak during summer and lowest in winter. Temperature appears to be a key factor influencing leaf production process. However, despite these clear results, the effect of temperature conditions in the timing and controls of phenological events in subtropical mangrove species still need to be investigated precisely.
0
50
100
150
200
250
300
350
400
A M J J A S O N D J F M
No
s.
of
leaf
rec
ruit
me
nts
an
d d
ea
ths
(n
o./m
on
th)
2008 2009
(a)
0
20
40
60
80
100
120
A M J J A S O N D J F M
Le
af
an
d s
tip
ule
lit
terf
all
s (
g/(
m2 m
on
th))
Month
2008 2009
(b)

Proceedings of the International Conference on Environmental Aspects of Bangladesh (ICEAB 2011)
94
ACKNOWLEDGEMENT
We thank Drs. S.M. Feroz, R. Suwa and W. Min, and Mr. K. Mouctar for their invaluable help in the field work. This study was partially supported by Grant-in-Aid for Scientific Research (nos. 18380098 and 20510011) from Ministry of Education, Culture, Sports, Science and Technology, Japan, and by the 21st Century COE program of the University of the Ryukyus.
REFERENCES
[1] JS Bunt, KG Boto, G Boto. 1979. A survey method for
estimating potential levels of mangrove forest primary
productivity. Mar. Biol., 52: 123-128.
[2] NC Duke. 1990. Phenological trends with latitude in
the mangrove tree Avicennia marina. J. Ecol., 78:
113-133.
[3] PJ Clarke. 1994. Baseline studies of temperate
mangrove growth and reproduction; demographic
and litterfall measures of leafing and flowering. Aust. J. Bot., 42: 37-48.
[4] S Wafar, AG Untawale, M Wafar. 1997. Litter fall and
energy flux in a mangrove ecosystem. Estuar. Coast. Shelf Sci., 44: 111-124.
[5] RP Shukla, PS Ramakrishnan. 1984. Leaf dynamics
of tropical trees related to successional status. New Phytol., 97: 697-706.
[6] CM Shackleton. 1999. Rainfall and topo-edaphic
influences on woody community phenology in South
African savannas. Global Ecol. Biogeo., 8: 125-136.
[7] MB Bertiller, AM Beeskow, F Coronato. 1991. Seasonal
environmental variation and plant phenology in arid
Patagonia (Argentina). J. Arid Environ., 21:1-11.
[8] P Castro Dìez, G Montserrat-Martí, JHC Cornelissen.
2003. Trade-offs between phenology, relative growth
rate, life form and seed mass among 22 Mediteranean
woody species. Plant Ecol., 166: 117-129.
[9] PB Reich, MB Watson, DS Ellsworth. 1992. Leaf
life-span in relation to leaf, plant and stand
characteristics among diverse ecosystems. Ecol. Monog., 62: 365-392.
[10] K Kikuzawa, D Ackerly. 1999. Significance of leaf
longevity in Plants,‖ Plant Spec. Bio., 14: 39-46.
[11] AM Gill, PB Tomlinson. 1971. Studies on the growth
of red mangrove (Rhizophora magle L.). 3. Phenology
of the shoot. Biotropica, 3: 109-124.
[12] S Wium-Andersen. 1981. Seasonal growth of
mangrove trees in Southern Thailand. III. Phenology
of Rhizophora mucronata Lamk. and Syphiphora hydrophyllacea Gaertn. Aquat. Bot., 10: 371-376.
[13] NC Duck, JS Bunt, WT Williams. 1984. Observations
of the floral and vegetative phenologies of
north-eastern Australian mangroves. Aust. J. Bot., 32:
87-99.
[14] P Saenger, J Moverley. 1985. Vegetative phenology of
mangroves along the Queensland coastline. Proc. Ecol. Soc. Aust., 13: 257-265.
[15] NC Duke. 1988. Phenologies and litterfall of two
mangrove trees Sonneratia alba Sm. and S. caseolaris
(L.) Engl. and their putative hybrid, S. x gulngai N.C.
Duke,‖ Aust. J. Bot., vol. 36, 1988, pp. 473-483.
[16] SM Saifullah, AK Khafaji, AS Mandura. 1989. Litter
production in a mangrove stand of the Saudi Arabian
Red Sea Coast. Aquat. Bot., 36: 79-86.
[17] FJ Slim, P Gwada, MA Hemminga. 1996. Biomass
and litterfall of C. tagal and R. mucronata in the
mangrove forest of Gazi bay, Kenya. Mar. Freshwater Res., 47: 999-1007.
[18] T Kira. 1991. Forest ecosystems of east and
Southeast Asia in a global perspective. Ecol. Res., 6:
185-200.
[19] P Gwada, M Tsuchiya, Y Uezu. 2000. Leaf
phenological traits in the mangrove Kandelia candel (L.) Druce. Aquat. Bot., 68: 1-14.
[20] RW Parkinson, M Perez-Bedmar, JA Santangelo.
1999. Red mangrove (Rhizophora mangle L.) litter fall
response to selective pruning (Indian River Lagoon,
Florida, USA). Hydrobiologia, 413: 63-76.
[21] JD May. 1999. Spatial variation in litter production
by the mangrove Avicennia marina var. australasica
in Rangaunu Harbour, Northland, New Zealand. New Zealand J. Mar. Freshwater Res., 33: 163-172.
[22] CD Woodroffe. 1982. Litter production and
decomposition in the New Zealand mangrove,
Avicennia marina var. resinifera. New Zealand J. Mar. Freshwater Res., 16: 179-188.
[23] CD Woodroffe, KN Bardsley, PJ Ward, JR Hanley.
1988. Production of mangrove litter in a macrotidal
embayment, Darwin Harbour, N.T., Australia.
Estuarine Coastal Shelf Sci., 26: 581-598.
[24] WT Williams, JS Bunt, NC Duke. 1981. Mangrove
litter fall in north-eastern Australia. II. Periodicity.
Aust J Bot., 29: 555-563.
[25] GJ Leach, S Burgin. 1985. Litter production and
seasonality of mangrove in Papua New Guinea. Aquat Bot, 23: 215-224.
[26] B Clough, DT Tan, DX Phuong, DC Buu. 2000.
Canopy leaf area index and litter fall in stands of the
mangrove Rhizophora apiculata of different age in the
Mekong Delta, Vietnam. Aquat. Bot., 66: 311-320.
[27] NC Duke, JS Bunt, WT Williams. 1981. Mangrove
litter fall in north-eastern Australia. I. Annual totals
by components of selected species. Aust. J. Bot., 29:
547-553.
[28] J Lopez-Portillo, E Ezcurra. 1985. Litterfall of
Avicennia germinans L. in a one year cycle in a
mudflat at the Laguna de Mecoancan, Tabasco,
Mexico. Biotropica, 17: 186-190.
[29] N Nakagoshi, K Hehira. Growth and Mortality of
seedlings transplanted to Hiroshima. Hikobia, 9:
439-449.

Proceedings of the International Conference on Environmental Aspects of Bangladesh (ICEAB 2011)
95
A2.011
Landuse Change in Teknaf Peninsula: Farmer’s Experience
Md. Abiar Rahman1, Kazuo Asahiro2 and Masakazu Tani2
1Bangabandhu Sheikh Mujibur Rahman Agricultural University, Gazipur, Bangladesh 2Department of Environment & Heritage Design,Faculty of Design, Kyushu University, Fukuoka, Japan
Abstract Climate change and anthropogenic activities are the outcome of landuse change in Teknaf Peninsula of Bangladesh. A
study was conducted in Marishbunia village under Teknaf upazila during the month of March 2010to understand the
landuse change and to know the farmer`s experience on conservation activities. Field survey was done to collect
primary data, while Department of Agricultural Extension (DAE), Bangladesh Space Research & Remote Sensing
Organization (SPARRSO), Bangladesh Meteorological Department (BMD) were visited to collect secondary information.
It was observed that landuse pattern has been changed remarkably in the study area since couple of decades. Local
people were interested to cultivate betel leaf, betel nut and sone grass around the hilly areas because of high cash
income. Various problems have been identified due to landuse change. Some conservation activities were undertaken in
the study area, but those were not functioning well due to lack of supports. Sustainable production systems should be
introduced in order to conserve the ecology.
INTRODUCTION
Teknaf peninsula is one of the unique areas in Bangladesh where both coastal and hill ecosystems are exists. Recently this ecosystem is highly degraded due to anthropogenic activities, natural disaster and over exploitation of natural resources [4]. Due to increasing population, the landuse pattern has been changed dramatically. As a result, both forest and marine resourced have been degraded. Now this area is highly vulnerable to landslide, cyclone and other natural disasters [3].
Moreover, cultivation of betel leaf, betel nut and sone grass in and around the hilly areas accelerating the degradation of natural ecosystems. As a result agricultural production is hampering greatly as the local people are overexploiting the natural resources. Recently some development
programs have been undertaken by GOs and NGOs to conserve the natural resources, but this is not sufficient for sustainable production systems. This paper aims to understand the history of landuse change, natural conservation activates and farmers‘ experiences.
STUDY AREA AND METHODS
The study was conducted in Marishbunia village under Teknaf upazila (Fig. 1) during the month of March 2010. Population density is below 500 persons per square km with 19% education rate. Agriculture is the occupation in the study area with around 150% cropping intensity. Forest resource is higher in the study area compared to the country average [1].
Tropical climate prevails in the study area with 15 and 33°C minimum (January) and maximum (May) temperatures, respectively. Total annual rainfall is appreciable (around 5000 mm), but it is not well distributed. Significant amount of rainfall occurs during the months of June, July and August. However, negligible rainfall occurs from December through March [2].
Farmers who received training from CWBMP were interviewed to collect necessary information. Department of Agricultural Extension (DAE), Bangladesh Space Research & Remote Sensing Organization (SPARRSO), Bangladesh Meteorological
Department (BMD) was visited to collect necessary information.
Fig. 1. Study area
RESULTS AND DISCUSSIONS
A. Landuse changes in the study area
Table 1 and Fig. 2 indicate the trend of landuse change in the study area over time. The settlement in 1972 was 228951 square meter, which was expanded almost double in 1990 (449988 square meter) and it expanded to 459282 square meter in 2006. Forest area was decreased over time and it was 1637808 square meter in 1972, which was decreased to 1300092 and 1175653 square meter in 1990 and 2006, respectively. Surprisingly there was no agricultural land in 1972 and 1990. However, 206653 square meter of agricultural land was recorded in 2006. This might be due to increasing of settlement and depletion of forest and

Proceedings of the International Conference on Environmental Aspects of Bangladesh (ICEAB 2011)
96
marine resources. On the other hand, canal area remained unchanged over time [5]. Table 1. Trend of landuse change in Marishbunia village,
Teknaf (Area in m2)
Landuse class Area
(2006)
Area
(1990)
Area
(1972)
Settlement 459282 449988 228951
Forest 1175653 1300092 1637808
Fallow/ Exposed
land 814671 906179 789500
Agriculture land 206653 0 0
Cannel 14902 14902 14902
Total 2671161 2671161 2671161
Table 2 and Fig. 3 indicate the sector wise change in landuse. It shows that 518282 square meter area was exposed in 1972, 1990 and 2006. In case of
forest land, 171950 square meter area was exposed between 1990 and 2006, which was covered by forest in 1972, while 124439 square meter area was exposed in 2006. Forest area of 161752 square meter was brought under settlement between 1990 and 2006. On the other hand, 59234 square meter area was brought under settlement in 1990 and 2006, which was fallow in 1972. Surprisingly 206653 square meter area was converted to agricultural land in 2006, which was fallow in 1972 and 1990.
Table 2. Sector wise land use change in the study area
Landuse change class Area (m2)
Fallow/Exposed land in 1972, 1990 and
2006
518282
Forest in 1972, exposed in 1990 and
2006
171950
Forest in 1972, 1990 and 2006 1175653
Forest in 1972 and 1990, exposed in
2006
124439
Forest in 1972, settlement in 1990 and
2006
161752
Settlement in 1972, 1990 and 2006 228951
Fallow land in 1972 and 1990,
settlement in 2006
5331
Fallow land in 1972, settlement in 1990
and 2006
59234
Forest in 1972, exposed in 1990,
settlement in 2006
4014
Fallow land in 1990 and 1972,
agriculture in 2006
206653
Cannel 14902
Total 2671161
B. Landuse changes: Farmers’ experiences
Around 25 years ago many settlers started cultivation in the study area. Many farmers got hilly areas from forest department with the condition to plant tree species. However, they were interested to grow betel leaf (Piper betle), betel nut (Areca catechu) and shon grass (Imperata cylindrica) in the
hilly areas and homesteads as these crops are highly profitable (Fig. 4).
Fig. 2. Satellite image of landuse change in the study area.
Fig. 3. Satellite image on sector wise landuse change
in the study area.
C. Conservation Activity
Coastal and Wetland Biodiversity Management Project (CWBMP): Under this project, Biodiversity Conservation Management Plan at Cox‘s Bazar- Teknaf Peninsula was implemented in association with Ministry of Environment and Forest, Department of Environment, Funded by UNDP since January 2007. Activities include Biophysical characteristics update, monitoring, data collection; habitat restore, rehabilitate, maintain; biodiversity

Proceedings of the International Conference on Environmental Aspects of Bangladesh (ICEAB 2011)
97
conservation; enhancement of local level awareness; village conservation group strengthen; alternate income generating activities among local community.
Fig. 4. Net benefit from different land use systems
in the study area
Farmers’ experience on conservation training: Farmers obtained four days training from NACOM under CWBMP. The major activities were: tree seedling preparation; vegetable production; nursery establishment. The training was focused on conservation of forest trees; preparation of seedbed; raising of seedlings; transplanting of seedlings; management of seedlings. Farmers got spray machine and water bucket from NACOM. Seedlings of Arjun, Bohera, Haritaki, Amlaki, Mahogani, Akashmoni, Mango, Olive, Guava,
Haugpalm and Raintree were raised in farmers` nurseries. They raised seedling for only one year and after that he could not continue due to lack of support. However, he is raising seedling in small scale for his own purpose. The price per seedling varied between 5 to 10 taka, while mango seedling was 20 taka. On an average taka 25750 was obtained by selling different seedlings/saplings that they produced (Table 3). CWBMP provided seeds only, while all input costs (water, fertilizer and pesticide) were from farmers. It also supplied cucumber and other vegetable seeds free of cost among the trainees. The trainees got short-time training on insect management, particularly organic pesticide, for vegetable cultivation. Besides, he transplanted huge number of guava, mango, jackfruit, hog palm, anola seedlings/saplings in homesteads.
Benefits: The trainees experienced some benefits with the knowledge and supports that he gathered from the training. Some benefits are as follows: conservation of forest and natural resources; earned cash income during nursery practice; preparation and utilization of organic pesticide from neem leaves; no feeling of trees; increased vegetation; increased biodiversity especially various birds are seen in and around the homestead; improved socio-economic conditions; improved healthcare and sanitation; increase food security; improved livelihood activities.
Table 3. Production and sale of seedlings of different tree seedlings
Species No. of
seedling
Price per
seedling
Total price
(taka)
Koroi 1500 5 7500
Arjun 500 5 2500
Bohera 100 5 500
Haritaki 100 5 500
Teak 200 5 1000
Mahagoni 1000 5 5000
Akashmoni 100 5 500
Anola 1500 5 7500
Mango 30 20 600
Olive 30 5 150
Total 25750
Problems: CWBMP gave very short time training and limited supports to the farmers. The project had no follow-up program, so farmers could not continue the program. Some major problems that were encountered by the farmers are: stopped support after CWBMP activity, scare of irrigation and drinking water, lack of money, unavailability of inputs.
CONCLUSION
Landuse has been changed remarkably in the study area over time. Agricultural practices have been started after 1990. Farmers usually clear hilly areas to cultivate betel leaf, betel nut and sone, which are causing reduction of biodiversity, degradation of land, incidence of landslide, depletion of resources, food insecurity etc. CWBMP had conservation program in the study area. Although the trainee received technical knowledge, it was not sustainable due to lack of supporting. However, significant change has been observed in homestead and hilly areas who received training. The local people should follow suitable production systems to conserve and sustain the ecosystems. Construction of marine drive could open big door for tourism by developing necessary facilities and infrastructure. Foreign experience can be utilized to develop tourism in the study area.
REFERENCES
[1] Anonymous. 2008. Statistical Yearbook of
Bangladesh. Bangladesh Bureau of Statistics,
Statistics Division, Ministry of Planning, Government
of People‘s Republic of Bangladesh, Dhaka.
[2] Anonymous. 2009. Weather Data. Bangladesh
Meteorological Department, Government of People‘s
Republic of Bangladesh, Dhaka.
[3] IUCN. 2005. Rehabilitation of critical coastal
ecosystem: Chokoria Sundarban. Final report. IUCN,
Bangladesh, Dhaka.
[4] Miah M.G., M.N. Bari and M.A. Rahman. 2010.
Resource degradation and livelihood in the coastal
region of Bangladesh. Front. Earth Sci. China,
4(4):427-437, June, 2010.
[5] SPARRSO. 2010. Satellite images and baseline
information of Marisbunia village of Teknaf Peninsula.
Space Research and Remote Sensing Organization,
Dhaka, Bangladesh.

Proceedings of the International Conference on Environmental Aspects of Bangladesh (ICEAB 2011)
98
A2.012
Ecological Consequences Due to Subsistence Activities of the People
in a Hill Forest Area of Bangladesh
MZ Rahman1, M Tani2, D Chattarjee1 and S Akhter1
1Dept of Agric Extension Education, Bangladesh Agricultural University, Mymensingh, Bangladesh 2Faculty of Design, Kyushu University, Fukuoka, Japan
Abstract
The main objectives of the study were to find out the extent of participation in subsistence activities of the people and
determine ecological consequences occurred due to these activities. Data were collected through interview, focus group
discussions and scored causal diagrams from Marishbonia village of Teknaf upazila under Cox‘s Bazar district. People
in the area were engaged in subsistence activities by using natural resources causing some ecological consequences.
Among the subsistence activities, pan (betel vine) cultivation was the most prevalent one. Cutting forest trees, collecting
bush, cutting bamboo etc. were the most common ecological resource degrading activities. The common consequences
were less trees on hilly areas, extinction of bamboo and bushes on hills, cutting down of hills for earth and so on.
Most of the respondents (69.33%) had less participation and 30.67% had medium participation in subsistence
activities. The main root cause behind the problems faced by the peoples in conserving ecological resources was the
cultivation of pan and making pan boroz (vine shed).
INTRODUCTION
Subsistence activity means the activities in which people live on either taking the recourse or making food from the environment in which they live. In this process, people use the resource by deteriorating the environment or by managing the environment. Most of the cases, through subsistence process, people live on the resource by hampering the environment [1]. The south-east portion of Bangladesh was
consisted of hills and terraces which was full of hill forests in past decades. But due to population pressure and food crisis, hills and forests are destroying at a constant rate by the people. Poorest people of the area, who depend most immediately upon local ecosystems for their livelihood, are responsible for the degradation of biodiversity, as well as being those who will be most affected by the consequences of this biodiversity loss [2]. People are destroying the hills and cutting the trees for living and for producing food materials. This process is growing so rapidly that after some years the existing hills and hill forest will be totally finished and biodiversity of that area will be fully extinct. Thus, the environment of that area is become susceptible to various types of natural calamities.
An alarming rate of degradation of environment in the area has been noticed highly. This is due to poor attention to its improvement and maintenance. Besides, people have lack of knowledge or a poor knowledge about the environmental safety. They do not know how to protect their environment in scientific way. So, day by day the environment and climate of that area are become unfertile for the future use due to their unmanageable subsistence activities.
From different viewpoints, it is clear that knowledge environmental safety of their locality plays a vital role in maintaining a healthy environment for their living. Since the people are using their existing sustainable resources in different but unmanageable ways other than using in proper ways, it is essential to know their problems in using existing sustainable resources towards environmentally friendly sustainable practices. This is necessary in order to develop an
extension strategy by which the resources of those people living in that locality become motivated towards sustainable agricultural, fisheries and forest management that would not create problems
to environment. In the view of the above background and facts, the present study was undertaken with the main objectives as to find out the extent of participation in subsistence activities of the people; to determine ecological consequences occurred due to subsistence activities of the people and to explore problems confronted by people in hill-forest areas in conserving ecological resources.
METHODOLOGY
The study was conducted in Marishbonia village of Baharchhara union under Teknaf upazila of Cox‘s Bazar district in Bangladesh. The village is situated in a critical position. In east side of the village there are hilly lands, sea is located in the west side and in between two sides there is a small cultivable flat land. So, different types of biodiversity are observed in this village. All people of that area in Marishbonia village were considered as the population of the study. The total number of household in Marishbonia village was 350. Among them only 75 people were randomly selected as the respondents for interview. In order to collect relevant data for the study, focus group discussions (FGDs), personal interview and scored causal diagrams (SCDs) were conducted or prepared.
In order to measure participation in the household subsistence activities, eight subsistence activities in different aspects were selected through focus group discussion with local people for the present study. A 4-point rating scale was used to obtain the score of the opinion of the peoples. To measure the extent of participation in subsistence activities three dimensions of participation namely (i) frequency of performance, (ii) part of work done and (iii) control over decision were used. The dimension included involvement, the second ensured action and the last dimension covered the psychological aspect of participation. Each of the dimensions was quantified separately with four-point rating scale against seven broad categories each of which included four sub-categories of household

Proceedings of the International Conference on Environmental Aspects of Bangladesh (ICEAB 2011)
99
subsistence activities [3]. The extent of participation has been computed according to the formula of Participation Index (PI). In this way, PI could vary
from 0 to 100%, 0 indicating no participation and 100 indicated full participation in household subsistence activities by the people.
Table 1. Salient features of the respondents‘ selected characteristics
Characteristics
(measurement unit)
Range of score Respondents Mean
Possible Observed Category No. %
Age (year) Unknown 16-60
Young (<35) 30 40.00
52 Middle (35-50) 20 26.67
Old (>51) 25 33.33
Year of schooling
(year) Unknown 0-12
Illiterate (0) 40 53.33
04 Primary (1-5) 17 22.67
Secondary (6-10) 15 20.00
HSC (>10) 03 4.00
Household size
(number of member) Unknown 2-13
Small (<4) 12 16.00
07 Medium (4-6) 31 41.33
Large (>6) 32 42.67
Annual family income
(TK―000‖) Unknown 10-200
Low (<50) 35 46.67
65.5 Medium (50-100) 30 40.00
High (>100) 10 13.33
Contact to information
sources (score) 0-64 20-55
Low (<21) 55 73.33
15 Medium (21-42) 15 20.00
High (42-64) 05 6.67
Knowledge on
environmental issues
(score)
0-26 8-20
Poor (<9)
Moderate (9-18)
Good (18-26)
56
16
03
74.67
21.33
4.00
14.67
Achievement
motivation
(score)
0-20 5-18
Low (<7)
Medium (7-14)
High (14-20)
36
30
09
48.00
40.00
12.00
7.52
Key: = ‗End‘ problem, = Intermediary problem/cause = ‗Root‘ cause,
= Causal relationship between problems and number in the parenthesis indicates score of the concerned problem
Fig. 1. SCDs showing problems of ecological resource conservation
Less
conservation
of ecological
resources
(100)
Cultivation of chon at hills (10)
Indiscriminate cutting of trees (15)
Less awareness of natural
resource conservation (20)
Destruction of hill ecosystem (20)
Less chance of forest
regeneration (10)
Landslide at hills (10)
Lack of education (20)
Illegal fishing in sea (05)
Illegal cutting of
trees (05)
Destruction of natural resources (10)
Migration of
Rohingya (10)
Less measures of govt. to conserve
natural resources (10)
More dependency on forest
and natural resources (20)
Decrease of agricultural land (10) More habitats in forest area (10)
Increasing human population (20)
Illegal dwelling at hill
forest areas (15) Cultivation of pan and making pan boroz (25)

Proceedings of the International Conference on Environmental Aspects of Bangladesh (ICEAB 2011)
100
To measure the extent of ecological consequences due to subsistence activities, twenty four consequences were selected through FGD with local people and consultation with other relevant experts. A 4-point rating scale was used for computing the extent of consequences as perceived by the respondents against each of the activities. The mean score of the respondents for a specific reason was considered as the index of severity of the effects. To measure problems faced by the people in conserving ecological resources, Scored Causal Diagrams (SCDs) of Participatory Farm Management (PFM) were used [4]. The SCDs were used to examine in detail the causes and effects of problems, and to identify the ‗root‘ causes which need to be addressed, and to analyze the relative importance of the problems and prioritize them.
FINDINGS AND DISCUSSIONS
A. Selected Characteristics of the People
The study was conducted with the people and most of them (40%) were young, 26.67% were middle-aged and 33.33% were old, while 53.33% of them were illiterate and 22.67, 20 and 4% respondents possessed primary, secondary and above secondary level education respectively (Table 1). Household size of the respondents ranged from 2 to 13 and, large, medium and small sized family families of the respondents are 42.67, 41.33 and 16% respectively. Annual household income of nearly half of the respondents‘ families was low (46.67%), 40% and 13.33 of the families were of medium and high category respectively. Contact to information sources, in most cases (73.33%) it was low, where medium contact to information sources was 20% and only 6.67% of them had high contact to information sources. 74.67, 21.33 and 4% of the respondent had poor, moderate and good knowledge on environment issues. Achievement motivation of the most of the respondents was found low (48%) whereas 40% and 12% respondent were found to have medium and higher achievement motivation.
B. Participation in Household Subsistence Activities
Household subsistence activities are those in which people had been living on for everyday life. In the study area, people were mainly involved in eight subsistence activities.
Table 2. Ranking of the subsistence activities participated by the people
Subsistence activities Total score Rank
Maintaining pan boroz 472 1
Farming in cropland 450 2
Cutting trees from the hill 425 3
Cultivating chon grass on the hill 424 4
Collecting bushes from the hill 321 5
Cutting bamboo from the hill 300 6
Collecting earth from hill 80 7
Fishing in sea 40 8
Table 2 revealed that the total score of the subsistence activities ranged from 40 to 472. It was found that ―maintaining pan boroz‖ ranked first and ―farming in cropland‖ ranked second among all the subsistence activities. This was due to high production of pan in the area. People get instant profit by cultivation of pan in low cost of production. That‘s why people are involving in pan cultivation day by day at a rapid rate. As pan cultivation claims a lot of natural resources, which mainly come from hill, it remains as number one killer of natural resources.
The observed score regarding the extent of different subsistence activities by the people ranged from 20-65 and mean score was 35 (Table 3).
Table 3. Subsistence activities participated by the people
Score Range Respondent (n=75) Mean
Score Possible Observed Categories No. %
0-100 20-65
Less (<33) 52 69.33
35 Medium (34-100) 23 30.67
High (67-100) 0 0.00
Maximum (69.33%) fall in the low category, 30.67% who were in medium and none of the respondents were fallen in the high category of participation. This is due to reason that most of people in the study area did not get scope to continue most of the activities throughout the year. Because, these activities are mostly dependent on
the cyclic processes of nature.
C. Ecological Consequences due to Subsistence Activities
Ecological consequences are resulted from subsistence activities of the people by using ecological or natural resources. These consequences cause serious damage to the ecology of the area. As a result, food supply and living standard of the people are changing rapidly. People use the natural resources in such a way that these resources once will be destroyed and also the area will be lose its potential for further uses. The main ecological consequences are identified according to its severity on the environment.
The observed score regarding the extent of participation in subsistence activities by the people ranged from 21-35 and mean score was 32.5. The categorizations of the people according to the
subsistence activities are presented (Table 4).
Table 4. Overall extents of consequences due to subsistence activities by the people
Score Range Respondent (n=75) Mean
Score Possible Observed Categories No. %
0-40 21-35
Less (<13) 11 14.67
32.5 Medium (14-27) 40 53.33
High (28-40) 24 32.00
Table 4 showed that more than half of them (53.33%) fall in the medium category of consequences and 32% and 14.67% in the high and

Proceedings of the International Conference on Environmental Aspects of Bangladesh (ICEAB 2011)
101
low categories respectively. It was found that most of the people were involved in making pan boroz and cultivation of chon grass. Participated by the people more or less in these subsistence activities were the main reasons of such natural resource degradation.
Severity of the ecological consequences is defined as how severely the people of the area using as well as destroying the existing ecological resources. People are destroying the ecological resources by utilizing these in unmanaged way so that day by day their subsistence living is at alarming condition. The result regarding severity ranking of ecological consequence has been presented in Table 5.
Table 5. Severity ranking of consequences of each of the subsistence activities
Subsistence activities Total score Rank
Maintaining pan boroz 1021 1
Cutting trees from the hill 912 2
Cultivating chon on the hill 902 3
Collecting bushes from the hill 875 4
Cutting bamboo from the hill 803 5
Collecting earth from hill 720 6
Fishing in sea 601 7
Farming in cropland 402 8
The total score of the consequences of subsistence activities ranged from 402 to 1021 for all the respondents. In the present study, it was found that ―maintaining pan boroz” ranked first and ―cutting trees from the hill‖ ranked second in severity ranking of conseuences. This is due to lack of knowledge of the inhabitants about environment. People are making pan boroz for instant and quick benefit and through this process they are changing the ecology of the area. Consequently, pan boroz are made in replace of forest and bush land on the hill. As a result, by destroying the forests and bushes, the hill environment is seriously depredated.
D. Problem Confrontation by the People in Subsistence Activities
Less conservation of natural was considered as the end problem for which the root causes and relationships among themselves were identified through group discussion (Fig. 1). The major root cause identified were cultivation of pan and making pan boroz, lack of education, increasing human population, illegal dwelling at hill forest areas and others. However, cultivation of pan and making pan boroz was the most crucial problem coming out of subsistence activities of the people. People are cultivating pan for higher and instant earning to change their living status. But people don‘t cultivate pan in a sustained manner and deteriorate the ecology of the area due to lack of education and
dare human needs.
CONCLUSION
The study area is very narrow surrounded by sea and hill-forest land and population are increasing rapidly in the area. Increased populations were
taking shelter to the hill-forest areas by cutting the trees and hills. Moreover, increased number of pan cultivation and chon on the hills are accelerating the environmental degradation in the area. People of the area were using the natural resources without recycling management of the ecology. At this crucial stage of ecological degradation due to their subsistence activities, people need to pay attention so that they can protect their ecology of the area from the hands of danger in the future. Cultivation of pan and making pan boroz, lack of education and increasing human population were the major constraints confronted by the inhabitants in conserving the ecological resources. The above mentioned problems were intermingled with each other forming a vicious complexity, which is not easy to overcome. Yet these are to be eliminated or reduced by proper management practice and creation of awareness among the people. Thus, awareness, knowledge and skill should be developed among the people. GO and concerned NGO should take this area under special consideration for the improvement, both the people and environment.
ACKNOWLEDGEMENT
This work was supported by an Environmental Studies Grant (Grant No. 093293) from the Sumitomo Foundation, Japan.
REFERENCES
[1] Anonymous. Teknaf peninsula community-based ecotourism strategy. Washington, DC: International
Resources Group. 2009.
[2] AS Mukul, MB Uddin, MS Uddin, MASA Khan and B
Marzan. 2008. Protected areas of Bangladesh: current status and efficacy for biodiversity conservation. Department of Forestry and Environmental Science,
School of Agriculture and Mineral Sciences, Shahjalal
University of Science and Technology, Sylhet,
Bangladesh.
[3] S Akhter. 2007. Participation of rural women in
homestead waste management towards integrated
plant nutrient system. M.S. Thesis, Dept. of
Agricultural Extension Education, Bangladesh
Agricultural University, Mymensingh, Bangaldesh.
[4] M Galpin, P Dorward and D Shepherd. [Online].
Accessed on March 2011, Available:
<http://www.agric.rdg.ac.uk.

Proceedings of the International Conference on Environmental Aspects of Bangladesh (ICEAB 2011)
102
A2.013
Composition of Homestead Gardens in a Local Village on the Western
Coast of Teknaf Peninsula, Bangladesh: A Case Study
Mayu Takata1, Junpei Kubota1, Kazuo Asahiro2
Md. Abiar Rahman3 and Masakazu Tani2
1Graduate School of Design, Kyushu University, Fukuoka, Japan 2Department of Environment and Heritage Design, Faculty of Design, Kyushu University, Japan
3Bangabandhu Sheikh Mujibur Rahman Agricultural University, Gazipur, Bangladesh
Abstract
Though the western coast of the Teknaf Peninsula has one of the longest white sandy beaches in the world, it have been
losing its biodiversity. A homestead garden (HG) is a cultivation area that supports the daily life of the local people, and
HG as a lifestyle has a low impact on the environment. Furthermore, an HG can improve biodiversity. To understand
the composition of trees and structure of the HGs, we measured the tree sides and performed a plane survey by a simple
measurement. Our survey showed that, landlords have widely planted supari (Areca catechu) for sale. We found that
dispersal of seeds of native species in that hilly areas or through a stream and training on planting imparted by a
non-governmental organization lead to an increase in the total number of species in an HG.
INTRODUCTION
The white sandy beach between Cox‘s bazar and Teknaf Peninsula in Bangladesh is one of the longest beaches in the world. Although this area is covered with mixed-evergreen forests and protected as a national forest, it faces the dangers of tree clearing and biodiversity loss. To sustainably manage and conserve the biodiversity, the Coastal and Wetland Biodiversity Management Project [1] has been undertaken. This project was carried out to propose a way of sustainable living for the local people and the importance of nature.
Some investigations about homestead in Bangladesh were conducted [2]. A previous investigation of the flood plains in Bangladesh indicated that homestead gardens (HG) are similar to the ‗pekarangans‘ in Indonesia. Thus, homestead gardening involving the cultivation of useful plants that cater to the necessities of food, medicine, and materials has a low impact on the environment [3]. Furthermore, an HG can improve biodiversity.
This report is part of a collaboration study on the management of biodiversity using a ‗Satoyama‘ model in the Teknaf Peninsula, Bangladesh, supported by the Sumitomo Foundation. ‗Satoyama‘ is a Japanese term, which means maintaining nature in a cultural landscape with human intervention. The objective of this research is to devise a model for the conservation of biodiversity in the Teknaf ECA without impairing the residents‘ livelihood. This paper describes a case study conducted in a village on the western coast of the Teknaf Peninsula with aims to describe the tree and vegetation distribution in several HGs and try to make clear the value of this for the local people.
SITE AND METHODS
A. Site selection
As site selection, MB village was selected as the research site (Fig. 1) because the distance of the seashore to the hilltop is less and it was feasible to conduct a study from 14 to 21 September 2010 at this site. Supari (Areca catechu) is widely planted around thatched-roofing houses. The main occupation in this village is agriculture, and the
village has numerous plantations of betel leaf vine Piper betle) around areas with HGs area.
Fig. 1. Site of study. The MB village where this
study was conducted.
B. Survey of 7 selected HGs
To understand the composition of trees in and the structure of the HGs, 7 HGs were selected. For selecting HGs, we considered the following aspects. The settlement period for the area was considered; 3 of the selected HGs (a, b, and c) were located on the western side of the main road (a comparatively old settlement area), while the other 4 HGs (d, e, g, and h) were located on the eastern side of the main road (a new site that is a part of the national forest) (Fig. 2). In addition, an HG located near a stream (c), an HG located in a hilly region (d), and an HG owned by person who had received training on planting from a non-governmental organization (NGO) (g) were selected as habitat interest.
Fig. 2. The 7 selected homestead gardens are outlined in
white colour.

Proceedings of the International Conference on Environmental Aspects of Bangladesh (ICEAB 2011)
103
C. Plane survey
To determine the boundary of the HGs, we asked a resident to walk on the edge of the HG, and we followed positions of the fences, house, toilet, and entrance were determined by a simple measurement with a compass and tape. To determine the degree of growth and composition of trees, we selected trees, except supari, with a diameter at breast height (DHB) greater than 5 cm.
RESULTS
A. Structure of HGs
The average area of the village was 1,330 m2 of which 480~4,448 m2 was covered by the 7HGs. Every HG had fences made of bamboo or supari leaves as a boundary and for shelter and a central area with hard soil formed due to activities performed in front of the house. Supari and fruit trees surrounded the house. The latter were seedlings that had grown from the seeds that had been thrown away. The larger HGs have a cultivated land and Dugwell. A agroforestry system have seen at HG(d) whose residents have settled since 2007. Papaya, guava, mango, and sajna are planted under a gourd trellis.
B. Vegetation survey
Table 1 shows the number of the species observed in each of the 7 HGs. The HG having the least number of species, i.e. 4, (a) was owned by a person running a transportation company, and seemed to regard an economical role of homestead important. On the other hand, the HG having the highest number of species, i.e. 16, (g) was owned by a person who had received training on planting by an NGO, Nature Conservation Management (NACOM) and who practiced it. This HG had 6 species belonging to frequency groups I and II. The HG besides the stream (c) also had 5 species in these groups, which may be attributable to the dispersal of seeds of native species through the stream (Fig. 2). Species belonging to frequency groups III to V were considered dominant. Of the 11
dominant species, 6 〔 am (Mangifera indica),
kanthal (Artocarpus heterophyllus), narikel (Cocos nucifera L.), amura (Spondias pinnata),
bilimbi (Averrhoa bilimbi), and sajna (Moringa
oleifera)〕 had edible parts and 2 〔Goranim (Melia
azedarach), simul (Bombax ceiba)〕 are used as
materials for cotton, or furniture. The former 6 species are used for cooking or have economic value. We found that landlords had widely planted supari, a cash crop, in their HGs.
Fig. 3. Structure of homestead gardens
HG(c)
HG(a)
HG(d)
HG(g)
HG (c)

Proceedings of the International Conference on Environmental Aspects of Bangladesh (ICEAB 2011)
104
Table 1. Trees belonging to frequency groups III to V* in the 7 homestead
*Frequency: I: 100–80%, II: 80–60%, III: 60–40%, IV: 40–20%, V: 20–0%
CONCLUSION
In this research, we found that landlords had widely planted supari, a cash crop, in their home gardens. Of all the species that we observed in the HGs, 6 species (am, kanthal, narikel, amura, bilimbi, and syazna) are edible and include trees with domestic use and 2 species (simul and goranim) are used for wood. Therefore, these trees are useful in the daily lives of the residents. In addition, we found that dispersal of seeds of native species in the hilly areas or via drifting in the stream and training by an NGO lead to an increase in the total number of species in an HG.
Feeding on fruit trees by wild elephants has increased since the past 6 years. Some residents claimed that they would probably avoid planting fruit trees. HGs are an inevitably core of cultural life and are needed for conservation. Hence, it is necessary to study the natural vegetation in the hilly areas and on the banks of streams, and to study the herbaceous plants grown in the HGs in order to analysis their relevance to humans and nature. Accordingly, a suitable lifestyle and environmental education that would be useful can be proposed.
ACKNOWLEDGEMENT
This research was supported by the Sumitomo Foundation grants provided in 2009.
REFERENCES
[1] CWBMP.[Online].Accessed on May 2011, Available;
http://www.doe-bd.org/cwbmp/
[2] AHMED, M.Fariduddin. 2003. Structure And Diversity
Of Homegarden Agroforestry: A Case Study Of Gazipur
District In Bangladesh
[3] Keiko Yoshino. 1996. Plant Resource Utilization in
‗Baribhita‘ (Homestead) in Bangladesh; A Case Study
in a Village in the Old Brahmaputra Flood plain.

Proceedings of the International Conference on Environmental Aspects of Bangladesh (ICEAB 2011)
105
A2.014
Simultaneous Determination of Solvent- and Water-soluble
Polyphenols from Three Brown Seaweed by RP-HPLC
MTH Chowdhury1, ZP Sukhan2, JY Kang, I Bangoura1
MA Hannan1, IJ Lee1 and YK Hong1*
1 Department of Biotechnology, Pukyong National University, Busan 608-737, South Korea. 1Laboratory of Marine Biology, Faculty of Agriculture, Kyushu University, Fukuoka, Japan.
*Corresponding Author: Tel: +82-51-629-5862, e-mail: [email protected]
Abstract
Marine algal polyphenol, phlorotannins exist in the brown seaweed, which are responsible for the potent
pharmaceutical effects. Purpose of the study was to develop RP-HPLC method for the analysis of two major
phlorotannins, dieckol and phlorofucofuroeckol-A from water and organic solvent extracts of Ecklonia cava, Ecklonia stolonifera and Eisenia bicyclis and to compare the extraction procedures in terms of the amount of phlorotannins
obtained. The HPLC method for dieckol and phlorofucofuroeckol-A showed good precision (92.64% and 94.02%) and
linearity (r=0.996 and 0.999). By organic solvent extraction, the highest amount of dieckol from E. cava (1.52±0.21
mg/g-dry tissue) and phlorofucofuroeckol-A from E. bicyclis (1.30±0.04 mg/g-dry tissue) were obtained. Whereas, by
water extraction, the highest amount of both dieckol and phlorofucofuroeckol-A were obtained from E. stolonifera
(1.42±0.19 and 1.00±0.06 mg/g-dry tissue, respectively). This result revealed that brown seaweed might be a potential
source of polyphenols, which can be utilized as an antioxidant agent.
INTRODUCTION
Polyphenols are receiving increasing interest from consumers and food manufacturers for several reasons. Epidemiological studies have suggested the association of the consumption of polyphenol- rich foods or beverages with the prevention of diseases like cardiovascular disease and cancer [1]. Biological properties of polyphenols depend on their bioavailability. Indirect evidence of their absorption through the gut barrier is the increase in the antioxidant capacity of the plasma after the consumption of polyphenol-rich foods. This has been observed for a wide array of food stuffs such as tea [2], red wine [3] etc. Marine algal polyphenols, known as phlorotannins, which have only been found within brown algae, are synthesized via acetate-melonate pathway, and formed by the polymerization of phloroglucinol (1,3,5-tri hydroxyl benzene) [4]. Phlorotannins like other phenolic compounds are produced by plant secondary metabolism. It has been reported that phlorotannins exist in several brown algae, such as Eisenia bicyclis [5], Ecklonia cava [6], Ecklonia stolonifera [7], Ecklonia kurome [8], Fucus vesiculosus [9], Eisenia arborea [10], Ascophyllum nodosum [11], Ishige okamurae [12], Cystophora torulosa [13], and Laminaria hyperborean [14]. Some researchers
already reported that phlorotannins have several biological activities, such as antioxidant and anti-inflammatory activities [15], HIV-1 reverse transcriptase and protease inhibitory activity [16], acetyl cholinesterase inhibitory activity [17], [18] and tyrosinase inhibitory activity [19].
Laminarian brown algae, rich source of phlorotannins are widely used as a foodstuff in Japan and Korea [15], [19]. Several phlorotannins, such as eckol, dieckol, phlorofucofuroeckol-A and 8,8´ bieckol were isolated from E. cava, E. stolonifera and E. bicyclis [15], [19], [20]. Phlorotannins can be analysed as the total amount of the whole polyphenolic compound group by the colorimetric method using phloroglucinol as a standard agent [20], or simply in dry weight basis
[21]. Total phlorotannins consist of a complex set of different types of individual phlorotannins. Some phlorotannins are highly soluble in water and the others are soluble in organic solvents. So, HPLC can offer a suitable tool for quantitative and qualitative analysis of phlorotannins. However, there was no
report on the analytical method for simultaneous determination of dieckol and phlorofucofuroeckol-A from the brown seaweed water extract by HPLC.
Main objectives of the study is to validate the HPLC method for the analysis of two major phlorotannins, dieckol and phlorofucofuroeckol-A from water and organic solvent extracts of E. cava, E. stolonifera and E. bicyclis in a single run for use of brown seaweed water extract as a polyphenol rich food ingredient, and to compare the amounts of dieckol and phlorofucofuroeckol-A by water and organic solvent extraction.
MATERIALS AND METHODS
A. Sample collection and preparation
Leafy thalli of three brown seaweed, E. cava, E. stolonifera and E. bicyclis were collected from Korean coast between June, 2006 and December 2010. Voucher specimens have been deposited in Professor Y. K. Hong‘s laboratory, Department of Biotechnology, Pukyong National University, Busan, South Korea. Epiphytes and salts were removed from seaweed by washing with fresh water and 1 min sonication. The seaweed tissues were dried completely for 1 week at room temperature and then ground to a powder using a coffee grinder. The
seaweed powder was stored in a dark room at 20OC until use. In our previous study, dieckol and phlorofucofuroeckol-A were isolated with purity over 99% from the seaweed, E. cava [22].
B. Preparation of standard solution
Purified dieckol and phlorofucofuroeckol-A were accurately weighted, dissolved in 100% methanol and diluted at 1mg/mL as stock solutions. A set of standard solutions were prepared by appropriate dilution of the stock solution with 100% methanol

Proceedings of the International Conference on Environmental Aspects of Bangladesh (ICEAB 2011)
106
at a concentration ranged of 100-750 µg/mL. Stock and standard solutions were preserved in the refrigerator at -20ºC for further analysis.
C. Solvent extraction of phlorotannins
Phlorotannins were extracted from algal powder according to the method of Shibata et al. [23], with some modification. Briefly, the algal powder (1g) was shaken with methanol (4 mL) at room temperature for 2 hrs. Chloroform (8 mL) was added, and the mixture was shaken for 5 min. After filtration, the mixture was partitioned between upper and lower layers by addition of distilled water (3mL). The upper water fraction was extracted by ethyl ether (6 mL) and evaporated under the nitrogen blower. The evaporated residue (crude phlorotannin) was dissolved in 100% methanol (1mg/mL) and stored at -20OC until use.
D. Water extraction of phlorotannins
For extraction with distilled water, the algal
powder (1g) was placed in a 250 mL beaker to which was added 100 mL of distilled water, previously brought to the boiling point. The sample was then stirred slowly with a magnetic stirrer at 100OC for 5 min. After removing the seaweed debris, the water extract was evaporated at 80OC to make 2 mL and filtered through 0.45 µm cellulose acetate syringe filter before HPLC analysis.
E. HPLC analysis
HPLC system consists of a Waters 600 pump, Waters 486 tunable absorbance detector and an Alltima C18, 5 µm (250 mmX10 mm) column. A linear gradient solvent system consisted of water and 100% methanol. The gradient was made from 70% water to 0% water for 40 min at the flow rate of 1.0 mL/min. Programming was then continued as an isocratic mode at 100% methanol for 10 min. The column temperature was ambient. 100µL sample was injected, and UV absorbance was monitored at 290 nm. Identification was accomplished by comparing integrated chromatographic peak areas from the test samples to peak areas of known amount of the standard compound. Each peak was identified by comparing the retention time and absorption spectra of unknowns to those of the standard.
F. Quantification of dieckol & phlorofucofuroeckol-A
To measure the amounts of dieckol and phlorofucofuroeckol-A from E. cava, E. stolonifera and E. bicyclis, each 100 μL aliquot of methanol dissolved crude phlorotannin and water extract was injected to HPLC. The amount of each compound
was assessed by measuring the dimension of HPLC peaks, using the standard curve of each pure compound. Validation of the HPLC quantification was performed for accuracy, precision, linearity, limit of detection (LOD) and limit of quantification (LOQ). The accuracy was determined by analyzing each standard sample at different concentrations. Three replications were performed for each concentration. The % recovery was calculated from the mean concentration of three replications. Peak height was used for quantification purpose, using the equation of Snyder et al. [24].
G. Statistical analysis
All data were mean ± S.E.M. The results shown in each of the figures in this article are representative of at least three independent experiments.
RESULTS AND DISCUSSIONS
A. HPLC method validation
To quantitatively evaluate the phlorotannins of dieckol and phlorofucofuroeckol-A from the E. cava, E. stolonifera and E. bicyclis by water extraction and solvent extraction, HPLC analysis was performed (Fig. 1). Two major peaks in the crude phlorotannin were detected at the approximate retention times of 32 and 39 min, respectively. The FAB-MS and 1H-NMR data revealed that the two compounds, P1 and P2 were dieckol and phlorofucofuroeckol-A, respectively. Amounts of the two phlorotannins from E. cava, E. stolonifera and E. bicyclis were measured, by the dimension of the HPLC peaks, using the standard curve of each pure compound. Method of the HPLC quantification was validated for justification of the data by accuracy, linearity, precision, LOD and lower LOQ. For dieckol and phlorofucofuroeckol-A, the accuracy was calculated as 92.64% and 94.02%, and precision was 3.92% and 3.94%, respectively. LOD was 7.27 µg/mL and 5.82 µg/mL, and lower LOQ was 24.15 µg/mL and 19.41 µg/mL, respectively. Standard curves for each pure compound up to 750 µg/mL were generated. The calibration plots of peak height vs. concentration of pure compound exhibit a straight linear line. The regression equation for dieckol and phlorofucofuroeckol-A were, y=16.56x+0.44 and y=20.60x+0.11, respectively and correlation coefficient (r) values were 0.996 and 0.999, respectively. The validation process is to challenge the method and determine limits of allowed variability for the conditions needed to run the quantification. For the assessment of low-level impurities, precision of 5 to 10% usually accepted [24], which is higher than our precision range. Thus the quantification of dieckol and phlorofucofuroeckol-A from E. cava, E. stolonifera and E. bicyclis seaweed using HPLC is a simple and
reliable method and does not depend on the degree of multiplicity of seaweed compounds.
B. Distribution of dieckol
To determine the distribution of dieckol in E. cava, E. stolonifera and E. bicyclis tissues, solvent and water extractions were performed. By solvent extraction method, highest amount of dieckol was obtained from E. cava (1.52±0.21 mg/g-dry tissue) and the lowest amount from E. bicyclis (1.33±0.23 mg/g-dry tissue). Lee et al. [25] reported that the dieckol yield from E. cava after freeze dry, methanol extraction and 230 nm absorbance in HPLC analysis, was 10.36±0.1 mg/g of dry tissue. From E. stolonifera after EtOH extraction and 254 nm
absorbance in HPLC analysis, it was 4.3±0.1 mg/g of dry tissue [26]. Whereas, by water extraction method, highest amount of dieckol was obtained in E. stolonifera (1.42±0.19 mg/g-dry tissue) and the lowest in E. cava (0.27 mg/g-dry tissue) (Fig. 2).

Proceedings of the International Conference on Environmental Aspects of Bangladesh (ICEAB 2011)
107
Fig. 1. HPLC chromatogram of E. cava by solvent extraction (A) and water extraction (B), E. stolonifera by
solvent extraction (C) and water extraction (D), and E. bicyclis by solvent extraction (E) and water extraction
(F). Peak 1 represents dieckol and peak 2 represents phlorofucofuroeckol-A. HPLC conditions are described
in Materials and Methods section.
Fig. 2. Comparison of solvent ( ) and water extraction
( ) for dieckol from three brown seaweed E. cava, E. stolonifera and E. bicyclis. These values were expressed
for 1 g dry tissue. Results are mean ± standard error of
three independent experiments.
Fig. 3. Comparison of solvent ( ) and water extraction ( )
for phlorofucofuroeckol-A from three brown seaweed E. cava, E. stolonifera and E. bicyclis. These values were
expressed for 1 g dry tissue. Results are mean ± standard
error of three independent experiments.

Proceedings of the International Conference on Environmental Aspects of Bangladesh (ICEAB 2011)
108
C. Distribution of Phlorofucofuroeckol-A
By solvent extraction method, highest amount of phlorofucofuroeckol-A was observed from E. bicyclis (1.30±0.04 mg/g-dry tissue) and the lowest was from E. cava (0.93±0.02 mg/g-dry tissue). By water extraction, the highest amount was observed from E. stolonifera (1.00±0.06 mg/g-dry tissue) and lowest from E. cava (0.17±0.01 mg/g-dry tissue) (Fig. 3). After hot water treatment, lots of water-soluble phlorotannins were extruded from the seaweed tissue. One explanation could be the presence of very polar phlorotannins in brown seaweed, which can be extracted by water [27].
CONCLUSION
After boiling water treatment, brown seaweed E. cava, E. stolonifera and E. bicyclis released phlorotannins of dieckol and phlorofucofuroeckol-A in the water. We quantified the dieckol and phlorofucofuroeckol-A in the water extracts by HPLC method and compared with solvent extracts. This result revealed that hot water extract of brown seaweed particularly E. cava, E. stolonifera and E. bicyclis might be a potential source of polyphenols which can be utilized as an antioxidant-rich food ingredient.
ACKNOWLEDGEMENT
We thank the Brain Busan 21 program for graduate support (MTHC, IB, MAH, IJL).
REFERENCES
[1] A Scalbert and G Williamson. 2000. Dietary intake and
bioavailability of polyphenols. J. Nutr., 130: 2073-2085.
[2] M Serafini, A Ghiselli and Ferro-Luzzi. 1996. In vivo
antioxidant effect of green and black tea in man. Eur. J. Clin. Nutr., 50: 28-32.
[3] GG Duthie, MW Pedersen, PT Gardner, PC Morrice, AM
Jenkinson, DB McPhail and GM Steele. 1998. The
effect of whisky and wine consumption on total phenol
content and antioxidant capacity of plasma from
healthy volunteers. Eur. J. Clin. Nutr., 52: 733-736.
[4] MA Ragan and K W Glombitza. 1986. Phlorotannins:
Brown algal polyphenols. Prog. Phycol. Res., 4:
130-241.
[5] K Taniguchi, K Kurata and M Suzuki. 1992. Chemical
defense mechanism of the brown alga Eisenia bicyclis
against marine herbivores. Nippon Suisan Gakkaishi,
58: 571-575.
[6] K Taniguchi, K Kurata, M Suzuki. 1992. Feeding-
deterrent activity of some laminariaceous brown
algae against the Ezo-alalone. Nippon Suisan Gakkaishi, 58: 577-581.
[7] SH Kang, HY Chung, JH Jung, BW Son and JS Choi.
2003. A new phlorotannin from the brown alga
Ecklonia stolonifera. Chem. Pharm. Bull., 51: 1012-1014.
[8] Y Fukuyama, I Miura, Z Kinjyo, H Mori, M Kido, Y
Nakayama, M Takahashi and M Ochi. 1985. Eckols,
novel phlorotannins with a dibenzo-p-dioxin skeleton
possessing inhibitory effects on α2-macroglobulin
from the brown alga Ecklonia Kurome Okamura.
Chem. Lett., 6: 739-742.
[9] R Koivikko, J Loponen, K Pihlaja and V Jormalainen.
2007. High-performance liquid chromatographic
analysis of phlorotannins from the brown alga Fucus vesiculosis. Phytochem. Anal., 18: 326-332.
[10] Y Sugiura, K Matsuda, K Yamada, M Nishikawa, K
Shioya, H Katsuzaki, K Imai and H Amano. 2007.
Anti- allergic phlorotannins from the edible brown
alga Eisenia arborea. Food Sci. Tech. Res., 13: 54-60.
[11] H Pavia, G Cervin, A Lindgren and P Aberg. 1997.
Effect of UV-B radiation and simulated herbivory on
phlorotannins in the brown alga Ascophyllum nodosum. Mar. Eco.l Prog. Ser., 157: 139-146.
[12] Y Zou, ZJ Quin, Y Li, MM Kim, SH Lee and SW Kim.
2008. Antioxidant effects of phlorotannins isolated
from Ishige okamurae in free radical mediated
oxidative system. J. Agric. Chem., 56: 7001-7009.
[13] KW Glombitza, S Hauperich and M Keusgen. 1997.
Phlorotannins from the brown algae Cystophora torulosa and Sargassum spinuligerum. Nat. Toxins, 5: 58-63.
[14] FS Stainhoff, C Wiencke, R Muller and K Bischof. 2008.
Effects of ultraviolet radiation and temperature on the
ultrastrructure of zoospores of the brown macroalga
Laminaria hyperborean. Plant Biol., 10: 388-397.
[15] AR Kim, TS Shin, JY Park, KE Park, NY Yoon, JS Kim,
JS Choi, BC Jang, DS Byun, NK Park and HR Kim.
2009. Isolation and identification of phlorotannins
from Ecklonia stolonifera with anti-oxidant and anti-
inflammatory properties. J. Agric. Food Chem., 57:
3483-3489.
[16] M Artan, Y Li, F Karadeniz, HS Lee, MM Kim and S
Kim. 2008. Anti-HIV-1 activity of phlorogluycinol
derivative, 6, 6-bieckol from Ecklonia cava. Bioorg.
Med. Chem., 16: 7921-7926.
[17] CS Myung, HC Shin, HY Bao, SJ Yeo, BH Lee and JS
Kang. 2005. Improvement of memory by dieckol and
phlorofucofuroeckol in ethanol treated mice: Possible
improvement of the inhibition of acetylcholinesterase.
Arch. Pharm. Res., 28: 691-698.
[18] NY Yoon, HY Chung, HR Kim and JS Choi. 2008.
Acetyl and butyrylcholinesterase inhibitory activities
of sterols and phlorotannins from Ecklonia stolonifera.
Fish Sci., 74: 200-207.
[19] SJ Heo, SC Ko, SH Cha, DH Kang, HS Park, YU Choi,
WK Jung and YJ Jeon. 2009. Effects of phlorotannins
isolated from Ecklonia cava on melanogenesis and their
protective effects against photo-oxidation stress induced
by UV-B radiation. Toxicol. in Vitro, 23:. 1123-1130.
[20] JL Stern, AE Hagerman, PD Stainberg, FC Winter and
JA Estes. 1998. A new assay for quantifying brown
algal phlorotannins and comparisons to previous
methods. J. Chem. Ecol., 22: 1273-1293.
[21] T Shibata, S Kawaguchi, Y Hama, M Inagaki, K
Yamaguchi and T Nakamura. 2004. Local and
chemical distribution of phlorotannins in brown algae.
J. Appl. Phycol., 16: 291-296.
[22] MTH Chowdhury, I Bangoura, JY Kang, NG Park, DH
Ahn and YK Hong. 2011. Distribution of
phlorotannins in the Phaeophyta Ecklonia cava and
comparison of pretreatments for extraction. Kor. J. Fish. Aquat. Sci., 14:xx-xx. [to be published].
[23] T Shibata, K Fujimoto, K Nagayama, K Yamaguchi
and T Nakamura. 2002. Inhibitory activity of brown
algal phlorotannins against hyaluronidase,‖ Intl. J. of Food Sci. Technol., 37: 703-709.
[24] LR Snyder, JJ Kirkland and JL Glajch. 1997.
Practical HPLC method development, 2nd edition.
John Willey & Sons, Inc, NY.
[25] SH Lee, SC Ko, SM Kang, SH Cha, GN Ahn, BH Um
and YJ Jeon. 2010. Antioxidant effect of Ecklonia
cava dried by far infrared radiation drying. Food Sci.
Biotechnol., 19: 129-135.
[26] HR Goo, JS Choi and DH Na. 2010. Quantitative
determination of major phlorotannins in Ecklonia stolonifera. Arch. Pharm. Res., 33: 539-544.
[27] YY Lim and J Murtijaya. 2007. Antioxidant properties of
Phyllanthus amarus extracts as affected by different
drying methods. LWT Food Sci. Technol., 40: 1664-1669.

Proceedings of the International Conference on Environmental Aspects of Bangladesh (ICEAB 2011)
109
A2.015
Herbicide Contamination and their Effects on Aquatic
Ecosystem: A Case of Concern
Rumana Tasmin1* and Mohammad R Islam2
1Laboratory of Marine Environmental Science, Faculty of Agriculture, Kyushu University, Japan 2Laboratory of Microbial Technology, Faculty of Agriculture, Kyushu University, Japan
*Corresponding author: e-mail: [email protected]
Abstract
Herbicides are using all over the world to reduce weeding labor, cost and time. The use of herbicide is increasing day by
day all over the world according to the increasing rate of intensive farming practice. The environmental burden of
applied herbicide heaviest in the water system such as irrigation channels and rivers. Herbicides are generally detected
in rivers in concentration levels of ng/L for 2 to 3 months after use, so herbicides have been implicated in accidents
involving fish, algae (primary producer) and other non-target organisms. Therefore it is necessary to assess the
ecological risk and develop environmentally low impact application of herbicides.
INTRODUCTION
Herbicides are a category of pesticides that are synthetically produced or naturally derived chemicals used to kill or control the growth of undesirable plants like weeds and trees that compete with crops for root space, nutrients and water or to remove brush or foliage so that land may be used for other purposes or to control aquatic weeds. Nearly 70% of all pesticides used by farmers and ranchers are herbicides. They are also widely used on lawns and in gardens and beside roadways. Selective herbicides kill certain target species, e.g. broadleaf (dicot) weeds are selectively killed by 2,4-Dichlorophenoxyacetic acid, a herbicide in turf areas leaving the desired plants unharmed, while herbicides used to clear ground are designed to be non-selective and kill all plants contacted. Some herbicides interfere with plant growth by acting as hormones. Most of the organic pollutants are herbicides [1, 2]. These herbicides can enter aquatic ecosystems as a result of terrestrial runoff, and to a lesser extent, of direct application and aerial spraying [3]. Microbial communities in aquatic ecosystems are not directly targeted, but these communities are exposed to herbicides and can be directly or indirectly affected by these compounds. Herbicides and insecticides have the potential to cause dramatic changes in natural communities. So herbicide and their impact on aquatic ecosystem as well as food chain becoming a challenging issue to protect our environment.
STUDIES ON WATER CONTAMINATION BY HERBICIDE
The French Institute for Environment has published data on the contamination of water by pesticides for every year since 1998. Their annual report is based on monitoring 453 pesticides at 2023 sampling points (groundwater and rivers). In 2007, pesticides were detected at almost 91% of the
sampling points. To compare the situation in France with that in another European country, a recent review of Greek freshwater ecosystems has shown that atrazine, simazine, metolachlor and alachlor were the most frequently detected herbicides. Gfrerer et al. have shown that triazines were detected throughout the year in three rivers from China [4, 5]. A study was conducted in Japan
on the contamination of the lake Biwa by Sudo et al. and has shown that three herbicides most frequently found in this lake and in the rivers [6]. They were simetryn, molinate and bromobutide, which are all used in paddy fields, and also found in numerous rice producing areas [6, 7]. So from the above discussion it appears that triazines and in particular atrazine and simazine, are very frequently found in surface freshwater ecosystems worldwide, as are glyphosate and its degradation product, AMPA. Herbicide uses in Bangladesh was negligible until the 1970s, but from 1990 to 2009 dramatically increase. Its use in Bangladesh increased 26 tons to 184 tons over this period [8].
ENVIRONMENTAL IMPACTS
Fig. 1. Environmental fate of herbicides
The environmental burden of applied herbicides is heaviest in water. Herbicides used in rice fields are carried by irrigation drainage and run-off sequentially from the paddy fields to irrigation channels, small rivers and large rivers, whereby they are dispersed widely throughout water systems.
Herbicide concentration in river water was closely related to the state of application on paddy fields nearby, and was high around rice planting time [9]. Run-off rates differ depending upon physicochemical properties such as water solubility and environmental conditions such as rainfall and temperature as well as amounts used per unit area and paddy water management methods. Of these factors, herbicide water solubility correlates most positively with run-off rate. For example, the water

Proceedings of the International Conference on Environmental Aspects of Bangladesh (ICEAB 2011)
110
solubility of chlornitrofen, butachlor, thiobencarb and simetryn are 0.25, 23, 30, and 450 p.p.m. respectively, while their run-off rates are 1.01, 22.58, 28.24, and 30.82 percent respectively; so, the higher their water solubility, the higher their run-off rates. Additionally, high rainfall immediately after herbicide application, as well as flow irrigation, will increase the run-off rate into water systems. Preventing a decline in herbicidal efficacy requires careful attention to water management, such as stopping the irrigation flow for a certain time period after herbicide application.
HERBICIDE MODE OF ACTION TARGET AND
NON-TARGET ORGANISM
The mode-of-action is the overall manner in which a herbicide affects a plant at the tissue or cellular level. Some vital metabolic plant processes which are targeted by the herbicides, include photosynthesis (capture of light energy and carbohydrate synthesis), amino acid and protein synthesis, fat (lipid) synthesis, pigment synthesis, nucleic acid synthesis (RNA, DNA), respiration (oxidation of carbohydrate to provide CO2 and usable energy), energy transfer and maintenance of membrane integrity (Table 1). Other vital processes such as growth and differentiation, mitosis, meiosis, uptake of ions and molecules, translocation of ions and molecules, and transpiration were also found affected (Table 1).
Table 1. Mode of action of some herbicides with their family.
Name of
herbicide
Family Mode of Action
Alachlor Chloroacetamide Inhibition of long
chain fatty acid
biosynthesis
Atrazine Triazine Inhibition of
photosynthesis at
photosystem II
Bensulfuron-
methyl
Sulfonylurea Inhibition of
acetolactate synthase
Cyclosulfamu
ron
Sulfonylurea Inhibition of
acetolactate synthase
Cyhalofop-
butyl
Aryloxyphenoxy Inhibition of acetyl
CoA
Diuron Urea Inhibition of
photosynthesis at
photosystem II
Paraquat Bipyridylium Photosystem-I-electro
n diversion
Simetryne Triazine Inhibition of
photosynthesis at
photosystem II
Thiobencarb Thiocarbamate Inhibition of
very-long-chain fatty
acid biosynthesis
EFFECT OF HERBICIDE ON AQUATIC ECOSYSTEM
Herbicide has indirect impact on growth rate and total biomass of different aquatic microorganisms. Sometimes one species become resistant while another is not. Herbicides not only act on
phytoplankton but also fish, macro zooplankton also affected by reducing their survival rate and reproduction. Herbicide atrazine can turn male frogs into female with very low reproductive capacity [10]. Herbicide also has the adverse effect on fish reproduction [10]. Herbicides in aquatic ecosystems are clearly capable of causing a variety indirect ecological effects that can be a more significant than the direct effect.
Table 2. Effective concentrations of pesticides including herbicide for bacteria, algae, crustaceans and fish [13].
Pesticide
(Including herbicide)
EC50( mg/l)
Bacteria Algae Crustaceans Fish
Fenamiphos 35.1 - 0.005 -
Benomil - 0.05 - -
Pentacchlorlophenol 0.55 - - -
Paraquat 14,88 < 1.0 - -
Deltametrin - - - 0.005
Dichlorovos - - 2.1 -
Chloropyriphos - - 3.2 381
Metalaxil - 21.1 - -
Carbenzamin - 34.6 - -
Procymidone - 0.74 - -
Zineb - 0.52 - -
Chlorothalonil - 0.007 0.03 22.6
ß-cypermethrinm - - - 0.02
Dichlofluanid 0.08 0.13 1 -
Permetherinm - - - 0.2
Carboforan 31.2 0.02
Diuron - 0.04 8 -
Isoprotoron - < 1.0 - -
Atrazine - < 1.0 - -
Formetanate 7.4 - 0.07 -
Cyromazine - - 10.7 -
ENVIRONMENTAL RISK ASSESSMENT BASIC CONCEPT
For ecological risk assessment of herbicide in EU and USA, herbicides are separately examined for their toxicity (hazard assessment) and exposure impact (exposure analysis). Then, assessment of herbicide is completed by comparing these two
results. It is thought that this method would be appropriate in Japan, too [11]. For hazard prediction, two types of information are required: the exposure levels of non-target organisms to the chemicals, and the toxic effects of the chemicals on the non-target group. The expected environmental concentration (EEC) for the agricultural usage, which is a concentration calculated based on the input of the maximum proposed application rate, is used for the estimation of the exposure levels in an aquatic habitat [12]. The toxicity is expressed as the EC50 value, which causes 50% reduction of growth, and NOEC (no observed effect concentration), which is the maximum concentration that does not harm the test organisms. EC50 of some of the widely used pesticides including herbicide are shown in table 2.

Proceedings of the International Conference on Environmental Aspects of Bangladesh (ICEAB 2011)
111
GENERAL CONSIDERATION FOR REDUCED
ENVIRONMENTAL IMPACT
It is important that integrated methods be used to control rice paddy weeds by sensibly combining ecological/agronomical, mechanical and biological control methods, instead of relying solely on chemical pesticides [11, 13]. For example, 1. Flooding paddies to a depth of 10–15 cm,
thereby creating anaerobic conditions, makes it possible to suppress the appearance and growth of barnyardgrass and galangal (Cyperus microiria) family weeds.
2. Mulching is generally an effective way of controlling weeds in fields, but is not done in rice fields. However, it is possible to control weeds in no-till paddies by covering soil with rice or barley straw.
3. Another method is to spread recycled paper as mulch, and then plant rice.
4. Selection of vulnerable site and regular monitoring should be performed.
5. There should have training program for pesticides users; as because, recommended and correct use is essential to minimize harmful impact on aquatic ecosystem.
6. Public awareness program through mass media is essential.
CONCLUSION
Herbicide pollution is generally concomitant with pollution by mineral nutrients (phosphorus and nitrogen), which also influence the structure and the function of aquatic microorganism. Microorganisms play a crucial rule in aquatic ecosystem to maintain the food web. So if there structure is hamper then the possibility to affect our all aquatic ecosystem as well as environment. Herbicide residues are found in soil, water, ground water, air. So the contamination by herbicide poses significant risk to the environment and non- target organisms.
REFERENCES
[1] M Gfrerer, D Martens, BM Gawlik, T Wenzl, A Zhang,
X Quan, C Sun, J Chen, B Platzer, E Lankmayr and A
Kettrup. 2002a. Triazines in the aquatic systems of
the eastern Chinese rivers Liao-He and Yangtse.
Chemosphere, 47: 455-66.
[2] S Maru. 1991. Study on the behavior and fate of
pesticides in aquatic environment. Spec. Bull. Chiba Agric. Exp. Stn., 18: 1–62
[3] A Carter. 2000. How pesticides get into water – and
proposed reduction measures. Pesticide Outlook,
149-156.
[4] M Gfrerer, T Wenzl, X Quan, B Platzer and E
Lankmayr. 2002b. Occurrence of triazines in surface
and drinking water of Liaoning Province in Eastern
China. Journal of Biochemical and Biophysical methods, 53: 217-28.
[5] J Kreuger. 1998. Pesticides in stream water within an
agricultural catchment in southern Sweden. The Science of the Total Environment, 216: 227-251.
[6] M Sudo, T Kawachi, Y Hida and T Kunimatsu. 2004.
Spatial distribution and seasonal changes of
pesticides in lake Biwa, Japan. Limnology, 5: 77-86.
[7] M Sudo, T Kunimatsu and T Okubo. 2002.
Concentration and loading of pesticides resisdues in
lake Biwa basin (Japan). Water Research, 36:
315-329.
[8] BBS. 2008. Bangladesh Bureau of Statistics, Dhaka
[9] Masako Ueji and Keiya Inao. 2001. Rice paddy field
herbicides and their effects on the environment and
ecosystems. Weed biology and Management,1: 71-79
[10] B Troyne, Hayes, V khoury, A Narayan, M Nazir, A
Park, T Brown, L Adame, E Chan, D Buchholz, T
Stueve, and S Gallipeau. 2010. Atrazine induces
complete feminization and chemical castration in
male African Clawed frogs (Xenopus laevis). PNAS,
DOI: 10, 1073/ pnas.0909519107
[11] S Rahman and GB Thapa. 1999. Environmental
impacts of technological change in Bangladesh
agriculture: farmers‘ perceptions and empirical
evidence. Outlook on Agriculture, 28: 233–238.
[12] C Boutin, KE Freemark and CJ Keddy. 1993.
Proposed guidelines for registration of chemical
pesticides in Canada: nontarget-plant testing and
evaluation. Canadian Wildlife Service Technical Report Series 145.
[13] D Barcelo. The handbook of Environmental chemistry.
Emerging organic pollutant in waste water and
sludge.Volume-2. ISSN 1433-6863, Page-63.

Proceedings of the International Conference on Environmental Aspects of Bangladesh (ICEAB 2011)
112
A2.016
Impact of Brackish Water Shrimp Farming on Agricultural Land
and Surrounding Environment in the Southwest Coastal Zone of Bangladesh
AFM Tariqul Islam1*, Umme Kulsum Navera2 and M Golam Mahboob1
1Bangladesh Agricultural Research Institute (BARI), Gazipur 1701, Bangladesh 2 Dept. of WRE, Bangladesh University of Engineering & Technology (BUET), Dhaka 1000, Bangladesh
*Corresponding author: e-mail: [email protected]
Abstract A study was conducted to analyze the effect of brackish water shrimp farming on agricultural land using remote
sensing and GIS as well as questionnaire survey in Kaligonj upazila of Satkhira district, Bangladesh. Classified landsat
images of year 1977, 1990 and 2004 were used to identify the extent of brackish water shrimp farming. Results showed
that no shrimp farms were existed in 1977 whereas in 2004, 36.44% land of this upazila was encroached by shrimp
farming. During these periods the agricultural land decreased from 65.26% to 27.55%. From the questionnaire survey
it was found from the people‘s perception that the unplanned expansion of shrimp farming was the prime cause for
serious environmental degradation including water scarcity, decreased land fertility, increased salinity, increased
health hazard, biodiversity loss, etc. Thus the high profitability of shrimp farming brings along a number of problems
and risks for the surrounding environment and the local people.
INTRODUCTION
Coastal shrimp farming in Southwestern areas of Bangladesh is not a recent development. For centuries the local people of these areas used to practice traditional coastal aquaculture. They used to allow tidal water to enter into the paddy fields during the month of January to July for aquaculture. During the monsoon (August-October) they used to go for rice production [1]. In early 1960s government constructed polders in this coastal areas which brought an end to the traditional shrimp aquaculture for few years. After 1970, strong international market demand and high prices for shrimp product have encouraged farmers to resume shrimp farming in polders within the embanked areas. This crustacean, which was locally cheap and not even accepted as food by many locals, suddenly became a very high priced commodity. Equally important was the fact that it was no longer financially viable to cultivate rice because the polders had become water-logged due to poor drainage. These two factors together worked as a catalyst to the process of accelerated shrimp farming [2]. The rapid expansion of shrimp farming along with the adaptation of extensive and traditional shrimp culture techniques already caused rising concern due to its adverse effect on the coastal environment. The expansion of shrimp culture has caused ecological and environmental concerns in most places [3]. It is damaging the traditional agricultural systems and also unbalancing the socio-economic scenarios of the
affected areas. The unplanned development of shrimp cultural
activities posed negative environmental impacts in terms of mangrove deforestation, biodiversity and especially degradation of agricultural lands. The loss of mangrove areas to aquaculture is a common feature, with Chakoria Sunderban. From 1967 to 1988, the total area of Chakoria Sundarban mangroves decreased from 7500 ha to only 973 ha [4] and is completely converted to shrimp and salt farming [5]. Similar situation is prevailing in all the coastal areas of Bangladesh. For Khulna, Satkhria,
Bagerhat and Patuakhali districts, local people are converting their agricultural land to shrimp farming.
The expansion of shrimp aquaculture inevitably generates competition with other users of land and water such as peasant farmers, fishermen, local traders, urban consumers and some state agencies. The shrimp industry usually does not take any responsibility for damages to the environment due to its activities. Now it is important to identify the actual development of brackish water shrimp farming which encroach the agricultural land as well as such degradation of the surrounding environments. Therefore, this study has been undertaken to find out the trend of agricultural land encroached due to brackish water shrimp farming and its impacts on surrounding environments in Kaligonj upazila of Satkhira district.
METHODOLOGY
The study area Kaligonj upazila is located approximately between latitudes 22º 21' to 22º 33' N and longitudes 88º 58' to 89º 10' E in a brackish water area of south-western part of Bangladesh. In this study, Remote Sensing and GIS data have been used for monitoring development of brackish water shrimp farming. Three Landsat satellite classified images of Kaligonj upazila were acquired for the year of 1977, 1990 and 2004 from SPARRSO. The classified image was found by digital processing of raster images using ERDAS IMAGINE software. The ground truth verification was carried out in Kaligonj
upazila by using Global Positioning System (GPS) to locate fisheries area spatially sweet water fish area. The land use status of this upazila for actual brackish water shrimp farms, crop land, water bodies and settlement area along with its changing trend from the year 1977 to 2004 were calculated. A total of 99 respondents were interviewed from this upazila with a preset open ended questionnaire interview schedule. The information was collected on the environmental changes associated with the

Proceedings of the International Conference on Environmental Aspects of Bangladesh (ICEAB 2011)
113
brackish water shrimp farming such as health hazard, biodiversity, land fertility, soil salinity and drinking water scarcity based on the local people‘s perception. After getting the data through interviews, the stakeholders‘ perception was observed to find out the types of environmental degradation on study areas due to brackish water shrimp cultivation.
RESULTS AND DISCUSSIONS
A. Impact of shrimp farming on agricultural land
The classified images containing land use pattern of Kaligonj upazila consist of settlement, water bodies including sweet water fisheries, shrimp farm and crop land (Fig 1). Agricultural land consists of all types of crop land as well as fallow or bare land and water bodies consist of river, canal, and other open water bodies as well as sweet water fisheries area. Settlement consist of residential area, different types of market, road etc and shrimp farming consist of brackish water shrimp farm.
Fig. 1. Classified Images of Kaligonj upazila, 2004
In Kaligonj upazila, there was no shrimp farms existed in year 1977 whereas those became 2070 ha (6.45 % of total area) in the year of 1990. This shrimp farming area increased gradually none to 11704 ha (36.44%) in the year 2004. The remote sensed shrimp farm was found 12527 ha in the year 2004 which became 11704 ha as actual brackish water shrimp farm after deducting sweet water fish areas. During these years other components mainly water bodies and settlement areas changed little amount whereas crop land decreased considerably. The area of agricultural land decreased rapidly from
year 1977 to 2004 spatially during year 1990 to 2004. This land area decreased from 20962 ha (65.26% of total area) in 1977 to 19177 ha (59.70%) in 1990 and 8859 ha (27.55%) in 2004 respectively. From the area statistics it is seen that shrimp farming increased rapidly whereas agricultural land decreases rapidly. It is meant that shrimp farming have been encroached the agricultural land whereas other land uses remaining almost the same. Therefore, the remote sensing data indicated that the agricultural land decreased gradually only due to increase of rapid expansion of brackish water shrimp farming.
B. Impact of shrimp farming on environment
An attempt was taken to find out the effect of this land changes on surrounding environment of the study area. According to the questionnaire survey, the local people‘s perceptions for environmental degradation due to brackish water shrimp farming were observed. The results showed that the people‘s perception about this environmental degradation were increasing salinity both in soil and water (surface and ground), decrease land fertility, health hazards, loss of biodiversity, water scarcity etc. in the study area only due to increasing saline water shrimp farming. These effects based on local peoples‘ perception are describes as follows:
a) Effects of shrimp farming on salinity: The
brackish water shrimp farming requires saline water for its growth. Farmers of Kaligonj upazila cultivate year round shrimp farming. Local people stated that unplanned brackish water ghers expansion caused increasing the salinity in this upazila. Due to unplanned bagda shrimp ghers expansion farmers were compelled to use saline water into their ghers which made both the water and soil saline. They mentioned that water logging was a serious problem in this area especially in the low land where saline water remained round the year and people very often were compelled to cultivate brackish water fishes. They also used extra salt in shrimp farm to increase salinity especially during monsoon. Most of the farmers took tidal water from river or canal through channel or flooding systems into their bagda ghers. These practices caused increasing land salinity.
b) Effects of shrimp farming on land fertility: The
effects of shrimp farming are most important for agricultural crops as its effects reflected on land fertility as well as crop production [6]. Most of the farmers mentioned that shrimp farming reduced yield capacity of land. They said that shrimp farming increased salts in the land which consequences to reduce land fertility as well as reduced crop yield and production. Vegetable yield reduced significantly in shrimp prone areas due to less salt tolerant. In the study area the fruit tree like jackfruit, date, palms etc reduced gradually. Excess salinity reduces the land fertility which turns into yield reduction. A research study based on yield loss of modern varieties of rice due to salinity showed that about 46% of saline area (EC=8-16 dS/m) of Kaligonj upazila might cause 50% yield loss of modern varieties rice at the early growth stage[7].
HG (c)

Proceedings of the International Conference on Environmental Aspects of Bangladesh (ICEAB 2011)
114
c) Effects shrimp farming on health hazards: Health hazards to local populations living near or working in shrimp farms have been reported in the study area. Respondents mentioned that various epidermis diseases increased in their locality after introduction of shrimp farming. Skin rashes from polluted water were a common problem in such communities. They mentioned that unhygienic shrimp processing might cause human health hazards especially during peeling and gut removing of shrimps. They thought that incidence of diarrhea was high and children also affected. They said that mainly poor people were the sufferer as their consumption of milk, meat, small fish, easily available vegetables reduced. Hence malnutrition was a common problem due to shrimp farming in their locality. Respondents mentioned that mosquitoes increased after introduction of shrimp farming in their localities though they have no evidence for malaria or dengue fever. They think that waste water logging in the gher may cause increased mosquitoes. They said that bagda shrimp industry posed waste directly to environment without treatment which increased the water pollution as well as risk in public and aquatic health.
d) Effects shrimp farming on Biodiversity: The
impacts of shrimp aquaculture on biodiversity (the totality of genes, species and ecosystems in a region) in Kaligonj upazila are multiple. The respondents mentioned that the habitats for animals, birds, fishes were destroyed severely only after starting the expansion of shrimp farming. They thought that shrimp farmer clear a large number of forest and mangrove area to construct the shrimp ghers. Some local common animals like frogs, crabs were killed by shrimp farmers as well. During collecting shrimp fry, a huge amount of other shrimp species, fin-fish and valuable aquatic organisms were destroyed. The fresh water pond encroached by shrimp farms as well as saline water also reduced this variety of fishes e.g. Rui, Katla etc. They mentioned that a huge amount livestock like cattle, goat, ducks etc reduced after introduction of shrimp farming. They thought unplanned expansion of shrimp ghers reduces the grazing land for cattle severely which consequently reduced livestock
e) Effects shrimp farming on Water scarcity:
Salinisations of drinking water have been frequent results due to irresponsibly-sited and poorly-managed shrimp farms in Kaligonj upazila. The respondents mentioned that water polluted due to excess use of chemical in shrimp farm. They think that during processing of shrimp pond farmers used chemical fertilizer and other drugs to kill all the species available in the ghers. They mentioned that communities adjacent to shrimp farms in the study area experienced salinisation or complete out of order or drying up of hand tube wells for domestic and drinking water supply. They mentioned that expansion of shrimp farming caused ground water contaminated and scarcity of irrigation water due to expansion of shrimp farming. Therefore the environments in the brackish water shrimp farming area have been degraded seriously.
CONCLUSION
The results of this study demonstrated an uncontrolled and unplanned expansion of shrimp farming in the study area as well as degradation in the surrounding environments basis on local people‘s perception. The major findings of this study are stated as follows:
(1) During the year 1977 there were no shrimp farm whereas the actual brackish water shrimp farming area have encroached 36.44 percent area in Kaligonj upazila of Satkhira district in the year 2004.
(2) The satellite images data provided the information that the shrimp farming areas have encroached the agricultural land mainly.
(3) The major environmental degradation was found that the increase of salinity level both in soil and ground water whereas shrimp ghers and surrounding areas became less fertile which consequently reduced the yield loss of crops; besides different diseases specially skin and gastrointestinal diseases occurred more frequently; some wild animals, birds and fishes which are slowly disappearing which caused serious biodiversity losses; excess salt caused the water unfit for drinking and irrigation purposes, etc.;
(4) Proper planning, regulation and motivation of the local people are needed to develop an environment friendly shrimp farming to avoid ecological disasters in the coastal zone.
REFERENCES
[1] MA Shahid and J Islam. 2002. Impact of denudation
of mangrove forest due to shrimp farming on the
coastal environment in Bangladesh‖, Paper presented
at National Workshop on the Environmental and
Socio-economic impacts of Shrimp Farming in
Bangladesh, 5th March 2002, Dhaka, Bangladesh.
[2] M Karim. 1986. Brackish water Shrimp Culture
Demonstration in Bangladesh. Madras, Bay of Bengal
Programme for Fisheries Development, FAO.
[3] MM Islam. 2005. Determination of Land Cover
Changes and Suitable Shrimp Farming Area Using
Remote Sensing and GIS. MS thesis, University of
Dhaka. December, 2005.
[4] AM Chowdhury, DA Quadir and MJ Islam. 1994.
Study of Chokoria Sundarbans using remote sensing
techniques. ISME (International Society of Mangrove
Ecosystems), Japan. Technical Report 4, pp. 1–33.
[5] NPA. 1999. National Programme of Action for
Protection of the Coastal and Marine Environment
from Land-Based Activities. Report Prepared by
Department of Environment- In Collaboration with
IUCN – The World Conservation Union Bangladesh
Country Office and Bangladesh Center for Advance
Studies (BCAS).
[6] BARC (Bangladesh Agricultural Research Council),
Soil and Irrigation Division, 1990. Salinity Problems
and Crop Intensification in the Coastal Regions of
Bangladesh. Soil Publication No. 33. BARC, Farmgate,
Dhaka, Bangladesh, 63 pp. [7] Das Asi Mehorta. 1971. Salt tolerance of some
agricultural crops during easily growing stage. Inelian J. Agri.Science, 882-888.

Proceedings of the International Conference on Environmental Aspects of Bangladesh (ICEAB 2011)
115
A2.017
Tropical Deforestation in Bangladesh and Global Warming
M Jinnahtul Islam1*, Thomas W Wagner2, Yichun Xie2 and M Golam Mahboob3
1* Department of Environmental Science, Stamford University Bangladesh, Dhanmondi, Dhaka, Bangladesh e-mail: [email protected],
2 Institute of Geospatial Research and Education (IGRE), 128 King Hall, Ypsilanti, Eastern Michigan University, USA; e-mail: twagner1, yxie)@emic.edu
3Bangladesh Agricultural Research Institute, Gazipur 1701, Bangladesh, e-mail: [email protected]
Abstract Global warming, in particular, is perceived as a product of tropical deforestation and as a threat to the environments of
small coastal, riverine countries like Bangladesh. This study investigated the deforestation of the coastal forest of the
Chakoria Sunderbans and the inland Sal forest of Dinajpur areas in Bangladesh using remote sensing and GIS. This
study documents that about 70,000 ha of these two forests have been cut and burned and, approximately 6581.0 Gg of
CO2 have been released into the atmosphere. The net emission of CO2 as a result of the deforestation of these two
sources is estimated to be 6581 Gg. By contrast, if these forests had not been damaged, they would have taken up an
additional 22,877 Gg of CO2 annually from the atmosphere. This study suggests that tropical deforestation has had a
profound effect on the local and regional climate and climate-related disasters in Bangladesh.
INTRODUCTION
Deforestation is a land use problem. It is the permanent change from forest to non-forest such as agriculture, human settlement, and grazing land. The Food and Agriculture Organization (FAO) estimates that some 135,680 sq. km of tropical forest have been destroyed each year since the 1980s. Deforestation and the destruction of other vegetation increase the amount of carbon dioxide (CO2) and other green house gases in the atmosphere. When a forest is cleared to establish cropland or for other uses, the carbon stored in the biomass is released into the atmosphere as CO2.
Most scientists assume that global warming is caused by burning oil and gas. But in fact between 25 and 30 percent of the greenhouse gases released into the atmosphere each year about 1.6 billion tones – is caused by deforestation. Trees are of 50 percent carbon. When they are felled or burned, the C02 they store escapes back into the air. According to FAO figures, some 13 million ha of forests worldwide are lost every year, almost entirely in the tropics. Deforestation remains high in Africa, Latin America and Southeast Asia.
The forest ecosystem in Bangladesh has been severely damaged by the destructive anthropogenic and natural impacts coupled with overexploitation of forest resources [1]. Of the total area of Bangladesh, forest lands account for approximately 2.52 million hectares (mill ha), which is about 17.08% of the country counting all the public forestland, unclassed state forests and village forests together [2]. The forests of Bangladesh fall broadly into 3 major types. They are (1) the semi-evergreen forests occurring in the eastern hills of Chittagong, the Chittagong Hill Tracts (CHT) and the Sylhet District (hill forest) and comprise roughly 50% of the total forest area where main prevailing species are natural Dipterocarpus and associated species; (2) the deciduous Sal (Shoria robusta)
forests on the central and northwestern terraces in the districts of Dhaka, Tangail, Mymensingh and Dinajpur constitute a mere 10% of the remaining forest area of Bangladesh; and (3) the extensive littoral Mangrove forest adjacent to the Bay of
Bengal, the Sunderbans, the world‘s largest mangrove forest, is divided between India and Bangladesh. This forest is species-rich and of great ecological and economic value. Being at the mouth of the great Ganges-Brahmaputra-Meghna river system, the Sunderbans is the tidal swamp of a vast delta. The Bangladesh portion of the Sunderbans stands within the districts of Barisal, Patuakhali, Bagherhat and Khulna. Its total area is 6000 sq. km, of which 4200 sq kms are forest cover and remaining 1800 sq km is water. Its average elevation above mean sea level is only about 1.5 meters.
Evidently all forest areas in Bangladesh are suffering from clear-cutting and degradation and are contributing to GHG emission. Other sources of GHG emissions include grazing animals, land cultivation, fossil fuel burning, marshland destruction, industrial wastes, brickfield kilns, and rural chulas for cooking, natural gas combustion by industries, animal and other wastes.
Here we are limited to describing forestry practices and deforestation. Our objective is to quantify the deforestation of the Dinajpur Sal forest and Chakoria Sunderbans and to estimate the timber volume using remote sensing and GIS technologies. Subsequently these data were used to estimate carbon release and the net flux from the forest ecosystem.
It is known that the forest of Bangladesh are distributed all parts of the country and they are of various kinds. In this study we have selected two major types of forests namely Dinajpur Sal Forest and Chakoria Sunderbans Mangrove Forest as the study area because they are in serious deforestation process.
The main objective of the study is to find the total deforestation and estimate the carbon release into the atmosphere. Remote sensing and GIS techniques in combination with in situ ground reference data have been used in this study. The specific tasks of this research are as follows:
(i) Prepare a digital deforestation map of Dinajpur Sal Forest and the Chakoria Sunderbans and to quantify the total deforestation;
Proceedings of the International Conference on Environmental Aspects of Bangladesh (ICEAB 2011)
116
(ii) Estimate the above ground carbon stock in the study area;
(iii) Estimate the carbon release due to deforestation and its contribution to global warming, climate change and disaster in Bangladesh.
MATERIALS AND METHODS
A. Remote sensing data
The remote sensing data for this study included Black-and-White, 1:30,000 scale aerial photographs taken in 1975 by Capital Air Survey Ltd., Canada; selected color-infrared (CIR), 1:50,000 scale aerial photographs taken in 1984 by IGN, France; digital Landsat MSS from 1987, digital Landsat TM data from 1997, and digital data from 1:25000 scale photos collected by Kevron,
Australia, in 2000.
B. Ancillary data
Topographic maps of 1:50,000 scale of the study area were obtained from the Survey of Bangladesh (SOB), Map of the Dinajpur Sal forests prepared in 1977 was obtained from the Bangladesh Forest Department (BFD), and all supporting published and unpublished documents have been used wherever possible.
C. Instruments and software
During the field survey forestry equipments like Sunto Clinometer, Blum Leiss Hypsometer, Spigel Relaskop, Diameter tape, Prismatic Compass, Ranging rods, etc. were used for standing volume inventory. For image processing and analysis software like ERDAS Imagine, Imagine OrthoBase, ArcGIS: ArcInfo were used. SPARRSO Bangladesh and IGRE USA laboratory were used during the study.
D. Ground data collection
Following a standard sampling design, a number of sample plots were located on the maps and photographs for the collection of biomass inventory data. GPS readings of the center of all sample plots were recorded. Average stand height, dominant and co-dominant height and diameter at breast height (dbh) of all living trees in the sample plots were
measured. Tree species regeneration data were recorded for each sample plot. Height and dbh were measured for the preparation of allometric regression equation for the timber volume estimation. Using the allometric regression equation, a volume table was prepared to estimate the total standing volume and biomass of each study area. This table was compared with the Volume Table of Sal prepared by Forest Research Institute (FRI), Chittagong [3].
E. Image classification and volume estimation
Supervised and unsupervised classifications were conducted on remotely sensed imagery to stratify the forest of the study area. The landuse stratification reduced sampling errors and the standard error of estimate. Two dates of remote sensing data were superimposed to identify and measure the areas of deforestation for the study
areas. The timber volume and biomass per unit area obtained from field survey was multiplied by the total area deforested to obtain a figure for the carbon released (assuming substantial forest combustion). Finally the total CO2 flux to the atmosphere due to this deforestation was estimated according to standard procedure. The international procedures for GHG inventory have been followed for this work.
F. Timber volume Inventory in the Dinajpur Sal Forest
To carrying out the year 2000 timber volume inventory of the Dinajpur Sal forest, 74 sample plots were randomly selected from the ortho-photomaps. The starting points, bearings, and distance to reach the centre of the sample plots were marked on the photographs. With the help of a Prismatic Compass and ranging rods, the field crews located the centers of the sample plots. For each plot, tree diameters at breast height (dbh) and overall tree heights were obtained using a Spiegel Relaskop with BAF 4. The dbh of all living trees and the heights of dominant and co-dominant trees were measured and recorded. The Sal Volume Table prepared by Forest Research Institute (FRI), Chittagong, has been used in computing our plot volumes [3]. After statistical calculation, the average volume/ha was calculated to be 130 m3/ha for Sal forest. Accordingly the total standing volume of the Sal forest was found to be 245 000 m3.
RESULTS AND DISCUSSIONS
A. The deforestation in Dinajpur Sal Forest
The deforestation was estimated on the basis of the quantitative changes in the forest cover between two dates. Forest type maps were prepared from the remote sensing data for two different years. The maps were then digitally superimposed upon one another for showing and measuring the changes in colors and patterns. The aerial difference was computed from the vector attribute table. One deforestation map was prepared using the 1976 and 2000 digital data shown in Fig. 1. It was found that 61,342 ha of Sal forest have been deforested over last 25 year period.
Most of the Sal forest floor is now open and cleared of undergrowth as a result of grazing and vegetation collecting. Natural regeneration of the Sal coppice has been stopped. Under these conditions, the Sal forest could not regenerate. Most of the people living here are very poor and living below the poverty line. They collect timber, the natural regeneration of Sal coppice, and the leaves and branches of trees. They use them to make household furnishings, house construction, fuel for cooking, and feed for livestock. They also sell forest products in the marketplace. Uncontrolled grazing and livestock husbandry are practiced in the forest. With the increasing population pressure, the forest is highly depleted, a process that is still in progress. Obviously the timber stock and the general condition of the forest are very poor [5].
In an effort to improve the Dinajpur forests and forest productivity, the Bangladesh Forest
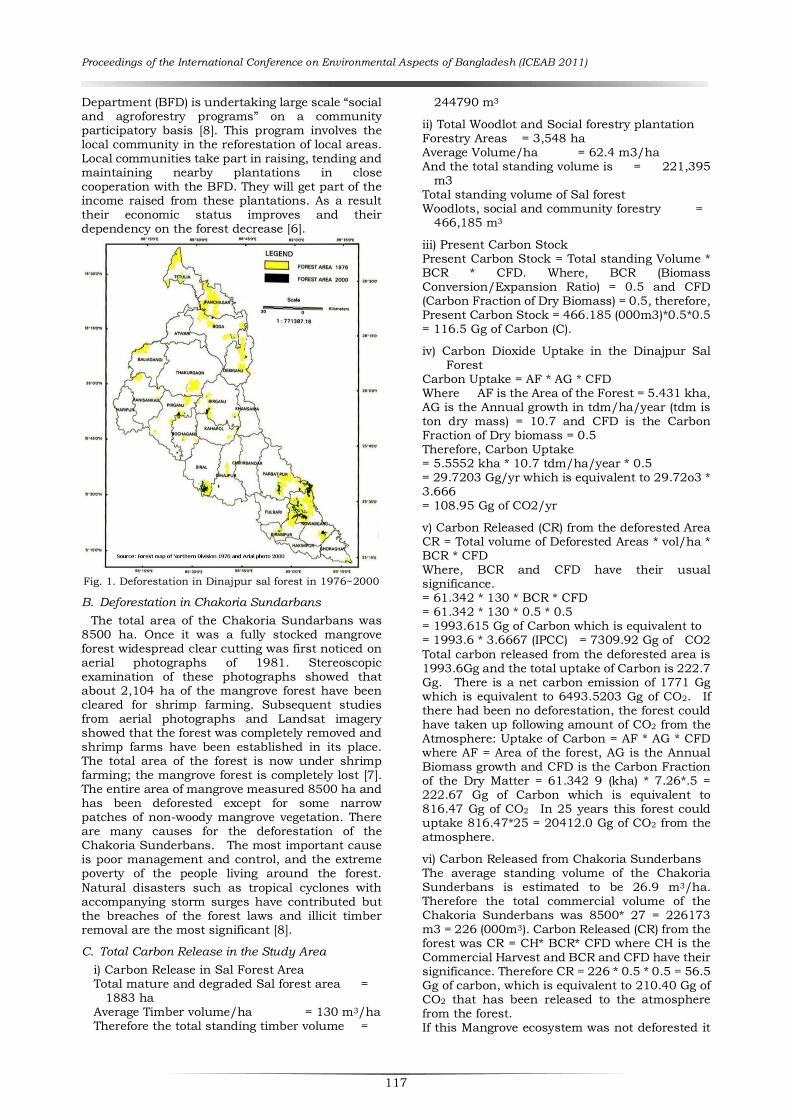
Proceedings of the International Conference on Environmental Aspects of Bangladesh (ICEAB 2011)
117
Department (BFD) is undertaking large scale ―social and agroforestry programs‖ on a community participatory basis [8]. This program involves the local community in the reforestation of local areas. Local communities take part in raising, tending and maintaining nearby plantations in close cooperation with the BFD. They will get part of the income raised from these plantations. As a result their economic status improves and their dependency on the forest decrease [6].
Fig. 1. Deforestation in Dinajpur sal forest in 1976~2000
B. Deforestation in Chakoria Sundarbans
The total area of the Chakoria Sundarbans was 8500 ha. Once it was a fully stocked mangrove forest widespread clear cutting was first noticed on aerial photographs of 1981. Stereoscopic examination of these photographs showed that about 2,104 ha of the mangrove forest have been cleared for shrimp farming. Subsequent studies from aerial photographs and Landsat imagery showed that the forest was completely removed and shrimp farms have been established in its place. The total area of the forest is now under shrimp farming; the mangrove forest is completely lost [7]. The entire area of mangrove measured 8500 ha and has been deforested except for some narrow patches of non-woody mangrove vegetation. There are many causes for the deforestation of the Chakoria Sunderbans. The most important cause is poor management and control, and the extreme poverty of the people living around the forest.
Natural disasters such as tropical cyclones with accompanying storm surges have contributed but the breaches of the forest laws and illicit timber removal are the most significant [8].
C. Total Carbon Release in the Study Area
i) Carbon Release in Sal Forest Area Total mature and degraded Sal forest area =
1883 ha Average Timber volume/ha = 130 m3/ha Therefore the total standing timber volume =
244790 m3
ii) Total Woodlot and Social forestry plantation Forestry Areas = 3,548 ha Average Volume/ha = 62.4 m3/ha And the total standing volume is = 221,395
m3 Total standing volume of Sal forest Woodlots, social and community forestry =
466,185 m3
iii) Present Carbon Stock Present Carbon Stock = Total standing Volume * BCR * CFD. Where, BCR (Biomass Conversion/Expansion Ratio) = 0.5 and CFD (Carbon Fraction of Dry Biomass) = 0.5, therefore, Present Carbon Stock = 466.185 (000m3)*0.5*0.5 = 116.5 Gg of Carbon (C).
iv) Carbon Dioxide Uptake in the Dinajpur Sal Forest
Carbon Uptake = AF * AG * CFD Where AF is the Area of the Forest = 5.431 kha, AG is the Annual growth in tdm/ha/year (tdm is ton dry mass) = 10.7 and CFD is the Carbon Fraction of Dry biomass = 0.5 Therefore, Carbon Uptake = 5.5552 kha * 10.7 tdm/ha/year * 0.5 = 29.7203 Gg/yr which is equivalent to 29.72o3 * 3.666 = 108.95 Gg of CO2/yr
v) Carbon Released (CR) from the deforested Area CR = Total volume of Deforested Areas * vol/ha * BCR * CFD Where, BCR and CFD have their usual significance. = 61.342 * 130 * BCR * CFD = 61.342 * 130 * 0.5 * 0.5 = 1993.615 Gg of Carbon which is equivalent to = 1993.6 * 3.6667 (IPCC) = 7309.92 Gg of CO2
Total carbon released from the deforested area is 1993.6Gg and the total uptake of Carbon is 222.7 Gg. There is a net carbon emission of 1771 Gg which is equivalent to 6493.5203 Gg of CO2. If there had been no deforestation, the forest could have taken up following amount of CO2 from the Atmosphere: Uptake of Carbon = AF * AG * CFD where AF = Area of the forest, AG is the Annual Biomass growth and CFD is the Carbon Fraction of the Dry Matter = 61.342 9 (kha) * 7.26*.5 = 222.67 Gg of Carbon which is equivalent to 816.47 Gg of CO2 In 25 years this forest could uptake 816.47*25 = 20412.0 Gg of CO2 from the atmosphere.
vi) Carbon Released from Chakoria Sunderbans The average standing volume of the Chakoria Sunderbans is estimated to be 26.9 m3/ha. Therefore the total commercial volume of the Chakoria Sunderbans was 8500* 27 = 226173 m3 = 226 (000m3). Carbon Released (CR) from the forest was CR = CH* BCR* CFD where CH is the Commercial Harvest and BCR and CFD have their significance. Therefore CR = 226 * 0.5 * 0.5 = 56.5 Gg of carbon, which is equivalent to 210.40 Gg of CO2 that has been released to the atmosphere from the forest. If this Mangrove ecosystem was not deforested it

Proceedings of the International Conference on Environmental Aspects of Bangladesh (ICEAB 2011)
118
could have taken up 8.500 (kha) * 7.91 * 0.5 = 33.6 Gg of Carbon which is equivalent to 123.26 Gg of CO2. The forest has been denuded for 20 years. So by this time it could absorb 123.3 * 20 = 2465.0 Gg of CO2 from the atmosphere and could reduce the greenhouse effect and consequently global warming. It is found that the total carbon released by deforestation in this area is 56.5 Gg and the total annual uptake is 33.617Gg. Thus there is a net annual carbon release of 23.0 Gg which is equivalent to 84.4Gg of CO2 emissions.
vii) Net Emission of CO2 from the two Study areas The net emission of CO2 from the deforestation of the Chakoria mangrove forest and the Dinajpur Sal forest is 23.0*3.6667 + 1771* 3.6667 = 84.0+ 6494.0 = 6578.0 Gg. This huge amount of CO2 has contributed to greenhouse effect and Global Warming. If the two forest had not been deforested they could uptake about 20,412 +2,465 = 22,877 Gg of CO2 from the atmosphere. In that case, uptake would have been more than emission (positive), reducing the GHGs in the atmosphere.
CONCLUSION AND RECOMMENDATIONS
Reducing Emission through Deforestation and Degradation is a significant task for the world community. Clearly, tropical deforestation and global warming are important environmental issues that must be of concern to our society. Deforestation appears to be contributing to global warming, which, in turn, is having direct adverse impacts on Bangladesh now. It is also clear that increasing GHG emissions to the atmosphere have been concurrent with global warming and with Bangladesh‘s changing temperature and weather patterns in the recent past. Bangladesh‘s coastal and deltaic location, low lying terrain, and high population density makes it uniquely vulnerable to global warming and sea level rise.
We concluded with the following specific recommendations:
(1) Deforested mangrove ecosystem of Bangladesh should be restored with artificial plantations to take
up CO2 from the atmosphere and reduce greenhouse gas emissions.
(2) Integrated shrimp–mangrove farming systems should be rapidly introduced to economically restore the Chakoria Sunderbans and develop a sustainable mangrove management system.
(3) All ongoing deforestation, whether for commercial purposes or as a consequence of expanding human settlement, should be stopped completely.
(4) Greenhouse gas emissions and the forest uptake of CO2 in Bangladesh should continue to be assessed using remote sensing and GIS technologies. Such biomass inventories would provide an objective basis for assessing the nature and directions of ongoing forest changes.
(5) Wherever possible, the area of Bangladesh‘s forests must be increased and managed on the sustaining yield basis.
(6) The ongoing ―Community and Agroforestry Plantation Program‖ should be expanded to insure
that local people are active participants and beneficiaries in the elimination of deforestation.
(7) Intensive study is to be undertaken on the coincidence of deforestation and the increasing trend of climatic conditions and severity of natural disasters in Bangladesh as observed in the present study.
(8) The Government and the people of Bangladesh must come together to stop the deforestation and degradation processes that are currently ongoing and address the upcoming disasters that are already a product of global warming.
(9) International society should show their readiness to act on deforestation, major portion of which is due to increased farmland to feed growing populations. Agricultural productivity should be increased so that there is less demand to convert forests into farmland. But we need financial help from developed world to conserve our forests. Such incentives could come in the form of carbon credits as further action under the Kyoto Protocol.
REFERENCES
[1] MM Rahman, MR Motiur, Z Guogang, KS Islam. A
review of the present threats to tropical moist
deciduous Sal (Shorea robusta) forest ecosystem of
central Bangladesh. Trop Conserv Sci, 3(1): 90-102.
URL: www.tropicalconservationscience.org [accessed
26.08.2010]
[2] Forest Department, Ministry of Environment and
Forest, Government of Bangladesh, Bangladesh
Forest Department Homepage, 2010, URL:
http://www.bforest.gov.bd [accessed 26.08.2010]
[3] S Das, F Rahman, A Nasir and A Latif. 1992. Tree
Volume tables for Sal in the Plantation of
Bangladesh. Bulletin -7, Forest Inventory Series,
Forest Research Institute, Chittagong, Bangladesh.
[4] IPCC. 1996. Revised IPCC Guidelines for National
Green House Gas Inventories, Work Book , Land Use Changes in Forestry, vol. 2.
[5] J. Islam, Inventory of Dinajpur Sal Forest, Report
SPARRSO 2002, Dhaka, Bangladesh.
[6] Forest Department, Ministry of Forest and
Environment, Dhaka, Bangladesh, Forest Inventory of the Sal Forest of Bangladesh, 2001.
[7] RA Warick and QK Ahmad. 1996. The Implication of Climate Change and Sea Level Change for Bangladesh,
Kluwer Academic Publication, Boston, London.
[8] AM Choudhury, DA Quadir and J Islam. 1994.
Studies on Chakoria Sunderbans Using Remote
Sensing,‖ UNESCO Report, International Society for
Mangrove Ecosystem (ISME), Japan, 1994.
[9] MG Mahboob, GMM Rahman, MJ Islam and MA
Salam. Estimation of area under agroforestry
practices in modhupur sal forest using remote
sensing. J Agroforest Environ., 1(1): 95-101.

Proceedings of the International Conference on Environmental Aspects of Bangladesh (ICEAB 2011)
119
A3.001
Responses to Rapid Decrease in Temperature of Localized
Heating-induced Cambial Activity in Conifers during Winter Dormancy
Shahanara Begum1,2*, Satoshi Nakaba1 and Ryo Funada1
1Faculty of Agriculture, Tokyo University of Agriculture and Technology, Fuchu, Tokyo 183-8509, Japan 2Department of Crop Botany, Faculty of Agriculture, Bangladesh Agricultural University, Mymensingh,
Bangladesh *Corresponding author: [email protected]
Abstract
Effects of rapid decrease in temperature on cambial activity induced by localized heating in Cryptomeria japonica and
Abies firma were investigated during winter dormancy in January-February. Localized heating induced cambial
reactivation in the stems earlier than natural cambial reactivation. In heated Cryptomeria japonica and Abies firma
stems, cambial reactivation occurred after 6 days and 2 days of heating, on 14 January 2007 and 15 January 2010,
respectively. We stopped the electric heating system just after cambial reactivation in stems. When we stopped the
heating system, the minimum atmospheric temperature was about 0˚C. After cambial reactivation, due to rapid
decrease in temperature, cell contents of cambium became coagulated but nucleus was still alive. After one month, the
shrunk cambium produced new tracheids with abnormal structure of cell. The results suggest that rapid decrease in
temperature just after cambial reactivation might induce temporary damage of cambium that produces deformed
tracheids which provides a useful experimental model system for studies of cambial biology and xylogenesis.
INTRODUCTION
Winter dormancy is an important adaptive mechanism for the survival of perennial plants and trees in temperate and cold climates. The timing of phases of cambial activity and dormancy is controlled by both environmental and genetic factors. In trees, dormancy is established in advance of the cold season and the termination of winter dormancy is a physiological process that requires timely environmental and internal signals. In temperate and cold zones, during late winter and early spring, new cell plates were formed in the cambium. This phenomenon in spring was referred to as cambial reactivation [1]-[2]. The timing of cambial reactivation plays an important role in the determination of wood quantity and environmental adaptivity of trees.
The cambial activity of coniferous trees in temperate zones is characterized by the formation of earlywood and latewood. The onset of cambial activity is strongly influenced by the environment [3] and it has been proposed that the maximum growth rate of trees might be regulated by temperature [4]. Evidence for the earlier induction of cambial reactivation by localized heating suggests that increases in the temperature of the stem might be the limiting factor in the onset of cambial reactivation during the quiescent stage of dormancy [5]-[13]. In addition, the patterns of cambial reactivation and xylem differentiation were almost identical to those in natural systems. Therefore, we postulated that artificial heating might provide a good model system to investigate the cambial biology of trees. Such a model system would allow us to compare detailed cambial activity and xylem differentiation directly over relatively short periods of time [11]-[12], [6], [8]-[9]. However, the effects of low temperature on cambial activity just after cambial reactivation are not clear.
The main purpose of the present study was to investigate whether decrease in temperature after cambial reactivation can induce any changes in cambial cells of coniferous species. Therefore, in
this paper, we analyzed the effect of rapid decrease in temperature on the cambium by using ―heated cambial reactivation system‖ in adult trees of Cryptomeria japonica and in Abies firma seedlings that can be used as a good system for studies of xylogenesis. Cambial reactivation that induced by localized heating was stopped just after cambial reactivation to observe the effects of rapid decrease in temperature on cambial activity. In addition, presence of nucleus in heated-reactivated cambial cells and non-heated cambial cells were examined to clarify the status of cambial cells whether the cells were living or not.
MATERIALS AND METHODS
A. Plant materials
Adult Cryptomeria japonica trees about 71-years- old and 3-years-old Abies firma seedlings were growing in the field nursery of the Tokyo University
of Agriculture and Technology in Fuchu, Tokyo, Japan, used in this study. The Cryptomeria japonica trees were examined from 8 January 2007 to 28 February 2007 and Abies firma seedlings were examined from 13 January 2010 to 3 March 2010.
B. Heat treatment
In case of adult Cryptomeria japonica trees, electric heating tape (Silicone–Rubber Heater; O & M Heater, Nagoya, Japan), 50 cm in length and 30 cm in width, was wrapped at one side of the main stem of each tree at breast height (Fig. 1a) [11]-[13], [6]-[8]. In case of Abies firma seedlings, electric heating ribbon (Nippon Heater Co., Ltd. Tokyo, Japan), 6 m in length and 0.5 cm in width, was encircled at the entire stem base of each seedling one by one (Fig. 1b). The temperature between the outer bark and the heating tape was recorded with a thermometer and, at the site at which the stem was heated; the temperature was adjusted to 20-22˚C
with a thermostat. No abnormal structures were found by naked eyes in the stems after artificial heating. In adult Cryptomeria japonica trees and Abies firma seedlings, localized heat treatment was

Proceedings of the International Conference on Environmental Aspects of Bangladesh (ICEAB 2011)
120
started from 8 January 2007 and 13 January 2010, respectively. Continuous heating was applied until cambial reactivation and heating system was stopped on 18 January 2007 and 19 January 2010 in both species, respectively. After stop of heating, samples were collected from heated and non-heated control portions of the stem until 27 February 2007 and 3 March 2010, in both cases, respectively.
C. Collection of samples
In Cryptomeria japonica and Abies firma, samples
were taken at one-week intervals from heated stems and stems under natural conditions. In case of adult trees, a series of small blocks (2 x 2 x 1 cm3) which contained phloem, cambium and some xylem cells, were removed with a disposable scalpel and chisel with a zigzag fashion to eliminate any effects of wounding. In case of seedlings, whole plant was cut by scissors and knife and then heated portion of stems was separated. Each block was cut into 2-mm- thick samples immediately after removal from the tree.
D. Preparation of samples for light microscopy
The samples were fixed in 4% glutaraldehyde in 0.1 M phosphate buffer (pH 7.3), under a vacuum, for 1 h at room temperature. Fixed samples were washed in 0.1 M phosphate buffer and trimmed to 3 mm in length for subsequent fixation in 1% osmium tetroxide in 0.1 M phosphate buffer for 2 h at room temperature. After washing in phosphate buffer, specimens were dehydrated in a graded ethanol
series and embedded in epoxy resin. Transverse sections were cut at a thickness of approximately 1μm and 40μm with a glass knife on an ultramicrotome (Ultracut N; Reichert, Vienna, Austria) and freezing stage of a sliding microtome for sequential observations of cambial reactivation and presence of nuclei. Sections were stained with a solution of 1% safranine in water or 1% aqueous solution of acetocarmine for observations of cambial reactivation and presence of nuclei in cambial cells and then examined under a light microscope (Axioscop; Carl Zeiss, Oberkochen) [14], [6]-[8].
E. Air temperatures during experiments
Daily maximum, average and minimum air temperatures during each experimental period were obtained from the Japan Meteorological Agency that located in Fuchu, Tokyo. Maximum, average and minimum air temperatures from 1 January to 31 March 2007 (during the first experiment for Cryptomeria japonica) and from 1 January to 31 March 2010 (during the second experiment for Abies firma) are shown in Figure 2. After stop of heating, in February 2007, the minimum temperature was -2.4 to 8.4˚C, the maximum temperature was 6.6 to 17.5˚C and the average temperature was 2.9 to 10.2˚C (Fig. 2a). In February 2010, the minimum temperature was -4.9 to 12.3˚C, the maximum temperature was 2.8 to 20.9˚C and the average temperature was 1.9 to 11.4˚C (Fig. 2b).
Fig. 1. Electric heating tape was wrapped at one
side of the main stem of adult Cryptomeria japonica trees (a) and electric heating ribbon was
encircled at the entire stem base of the seedling
of Abies firma one by one (b)
Fig. 2. Records of the maximum, average and minimum daily air
temperatures at the experimental site in Fuchu, Tokyo, from 1
January 2007 to 31 March 2007 (a) and from 1 January 2010 to 31
March 2010 (b). Arrows indicate the time of stop of heating and
horizontal dotted lines indicated the level of 0˚C in 2007 and 2010.
-10
-5
0
5
10
15
20
25 MaximumAverageMinimum
January February March
2010
Slop of heating (b)
-5
0
5
10
15
20
25
30
MaximumAverageMinimum
January February March
2007
Slop of heating
(a)

Proceedings of the International Conference on Environmental Aspects of Bangladesh (ICEAB 2011)
121
Fig. 3. Light micrographs showing the dormant cambium consists of 3-4 layers of cells (a), formation of new cell plates (b)
and at that time heating system was stopped. After one week of stop of heating, coagulated cell contents (arrowheads) were observed in Cryptomeria japonica (c) and in Abies firma (d). Arrowhead showing nucleus in shrunk cambium (e) and
shrunk cambium produced deformed earlywood tracheids (f). C, Cambium; Ph, Phloem; Xy, Xylem. Bars = 50 μm.
RESULTS
A. Dormant cambium
No division of fusiform cambial cells and ray cambial cells was detected in samples of cambium of Cryptomeria japonica and Abies firma that had been collected on 8 January 2007 (Fig. 3a) and 13 January 2010, respectively indicating that the cambium was dormant. The cambium was located between the previous year‘s sieve cells and the narrow-diameter thick-walled latewood tracheids that had formed during the previous growing season. During dormancy, the cambium consisted of four or five radial layers of radially narrow and compactly arranged cells (Fig. 3a)
B. Timing of cambial reactivation and xylem differentiation in heated stems
In heated Cryptomeria japonica and Abies firma stems, cambial reactivation occurred after 6 days
and 2 days of heating, on 14 January 2007 (Fig. 3b) and 15 January 2010, respectively. Xylem differentiation had started after 14 days and 9 days of heating on 22 January 2007 and 22 January 2010, in both species, respectively. After production of 5-6 radial files of fusiform cambium on 18 January 2007 in Cryptomeria japonica (Fig. 3b) and on 19 January 2010 in Abies firma, heating system was stopped, respectively
C. Effect of rapid decrease in temperature on cambial activity after stop of heating
One week later of stop of heating, on 25 January 2007 and 26 January 2010, the cambial cells became shrunk and cell contents coagulated in phloem and cambial cells in adult Cryptomeria japonica trees and Abies firma seedlings (Fig. 3c, d). At that time the structure of cambial zone cells were not at normal condition. Two weeks later of stop of heating, on 1 February 2007 and 2 February 2010, the cambial cells were almost at the same condition as well as shrunk cambium observed in both species. In addition, no new cell plates were observed in the cambial zone of Cryptomeria japonica and Abies firma stems indicating that cambial activity was reduced or almost stopped (Fig. 3c, d) but nucleus was still alive (Fig. 3e ). After one
month of stop of heating, on 18 February 2007, the shrunk cambium produced new tracheids with deformed structure (Fig. 3f).
D. Relationship between shrinkage of cambium
and temperature data
During localized heating, we applied a constant temperature of 20-22˚C both in Cryptomeria japonica and Abies firma stems. Due to the stop of heating, temperature decreased rapidly in the heated portions of the stems in both species (Fig. 2). When we stopped the heating system in February, the minimum atmospheric temperature was ranged from -2.4 to 8.4˚C and from -4.9 to 12.3˚C in 2007 and 2010, (Fig. 2), respectively. Therefore, cambium of those species received a temperature from 22˚C to around 0˚C during active seasons of cambium. The temperature profile and microscopic images of cambial cells clearly showed that shrunk cambium with coagulated cell contents produced due to rapid
decrease in temperature in adult Cryptomeria japonica trees and Abies firma seedlings in February (Fig. 2, 3c, d).
DISCUSSIONS
Rapid decrease in temperature on localized- heated stems induced coagulation of cell contents with deformed shape and size of phloem and cambial cells in conifers during winter dormancy in February. One week later of stop of heating, shrunk with abnormal structure of phloem parenchyma cells were observed in localized-heat-induced differentiating phloem cells. In our previous research, we observed that division of phloem cells started prior to cambial reactivation and xylem differentiation in heated stems and under natural conditions at warmer early spring of hybrid poplar, indicating that phloem cells were able to make quick response to increase in temperature than cambial cells and xylem cells [6]-[7]. In our present study, it was found that coagulation of cell contents occurred in phloem parenchyma cells due to stop of heating. This observation suggests that phloem cells might respond to decrease in temperature more rapidly than xylem cells in conifers.

Proceedings of the International Conference on Environmental Aspects of Bangladesh (ICEAB 2011)
122
It was already proved that temperature was a limiting factor in the onset of cambial reactivation and xylem differentiation during the quiescent dormant state [5]-[8], [10], [11]-[13], [15]. Increase in temperature or warmer early spring induced earlier cambial reactivation and xylem differentiation in trees [11]-[13], [10], [6]-[9]. Similarly, in the present study, earlier cambial reactivation and xylem differentiation was induced by localized heating during winter dormancy in February.
Cambial reactivation occurred when the minimum temperature exceeded 0˚C for 9 to 12 days in hybrid poplar. The maximum daily temperature often exceeded 15˚C but the minimum temperature was sometimes below 0˚C. Under these conditions, no formation of new cell plates occurred in the cambium in March. Thus, low temperatures appear to be very important for maintenance of a quiescent state [7]. Therefore, previously we hypothesized that minimum temperature above 0˚C might be critical for cambial reactivation in the stems of deciduous hardwood hybrid poplar. In our present study, it was observed that rapid decrease in temperature in heated reactivated cambium induced shrinkage of cells with coagulation of cell contents. In addition, nucleus was alive in those shrunk cambial cells indicating that cells were in lived condition.
In our previous research, we observed that cambial reactivation and xylem differentiation occurred above a certain maximum threshold value such as for hybrid poplar (Populus sieboldii x Populus grandidentata) the threshold temperature was 15˚C and for Cryptomeria japonica it was 10˚C
or 11˚C [7]-[8]. It was also reported that continuation of cambial activity and xylem differentiation required a constant threshold temperature [7]-[8]. In our present study, the subsequent rapid decrease in temperature from 22˚C to around 0˚C during active cambial cell division in localized-heat-induced stem resulted stopping of cambial activity with shrinkage of cambial cells in Cryptomeria japonica and Abies firma stems in January-February. The results suggest that cambial activity was stopped due to rapid decreasing or changes of temperature in February and for continuous cell division in the cambium and for xylem differentiation, a maximum threshold temperature might be needed.
CONCLUSION
Increase in temperatures from late winter to early spring result in earlier initiation of cambial reactivation in conifers. By contrast, earlier cambial reactivation might also result in an increase in frost damage because cold tolerance decreases after cambial reactivation. The effect of decrease in temperature on cell contents and on cell structure was observed in the phloem particularly on phloem parenchyma cells. Due to stop of heating, cambium received a rapid decreased temperature from 22˚C to around 0˚C that induced shrinkage of cambium with coagulation of cell contents. The results suggested that rapid decrease in temperature just after cambial reactivation in localized heated stem might changes endogenous balances that induced shrinkage of cambium with deformed structure of differentiating tracheids which would be helpful to
study the mechanism of cambial activity in conifers. Finally it can be concluded that without any obvious changes of day length, supply of photosynthesis and auxin, only decrease in temperature might have a direct effect on stopping of cambial activity during active seasons of cambium in Cryptomeria japonica and Abies firma trees.
REFERENCES
[1] AM Catesson. 1994. Cambial ultrastructure and
biochemistry: changes in relation to vascular tissue
differentiation and the seasonal cycle. Int. J. Plant Sci., 155: 251-261.
[2] PR Larson. 1994. The vascular cambium: development and structure. Berlin, Heidelberg, New York: Springer.
[3] FH Schweingruber. 1988. Tree Rings: Basics and
Applications of Dendrochronology. D. Reidel
Publishing Company, Dordrecht, Boston, Lancaster,
Tokyo, pp. 95-141.
[4] S Rossi, A Deslauriers and T Anfodillo. 2007.
Evidence of threshold temperatures for xylogenesis in
conifers at high altitudes. Oecologia. 152: 1-12.
[5] JR Barnett and H Miller. 1994. The effect of applied
heat on graft union formation in dormant Picea sitchensis (Bong.). Carr. J. Exp. Bot., 45: 135-14.
[6] S Begum, S Nakaba, Y Oribe, T Kubo and R Funada.
2007. Induction of cambial reactivation by localized
heating in a deciduous hardwood hybrid poplar (Populus sieboldii x P. grandidentata). Ann. Bot., 100: 439-447.
[7] S Begum, S Nakaba, V Bayramzadeh, Y Oribe, T Kubo
and R Funada. 2008. Responses to ambient
temperature of cambial reactivation and xylem
differentiation in hybrid poplar (Populus sieboldii x P. grandidentata) under natural conditions. Tree Physiol., 28: 1813-1819.
[8] S Begum, S Nakaba, Y Oribe, T Kubo and R Funada.
2010a. Cambial sensitivity to rising temperatures
from late winter to early spring in the evergreen
conifer Cryptomeria japonica. Trees., 24: 43-52.
[9] S Begum, S Nakaba, Y Oribe, T Kubo and R Funada.
2010b. Changes in the localization and levels of starch
and lipids in cambium and phloem during cambial
reactivation by artificial heating of main stems of
Cryptomeria japonica trees. Ann. Bot., 106:. 885-895.
[10] J Gričar, M Zupančič, K Čufar, G Koch, U Schmitt and
P Oven. 2006. Effect of local heating and cooling on
cambial activity and cell differentiation in the stem of
Norway spruce (Picea abies). Ann. Bot., 97: 943-951.
[11] Y Oribe and T Kubo. 1997. Effect of heat on cambial
reactivation during winter dormancy in evergreen and
deciduous conifers. Tree Physiol., 17: 81-87
[12] Y Oribe, R Funada, M Shibagaki and T Kubo. 2001.
Cambial reactivation in locally heated stems of the
evergreen conifer Abies sachalinensis (Schmidt)
Masters. Planta., 212: 684-691.
[13] Y Oribe, R Funada and T Kubo. 2003. Relationships
between cambial activity, cell differentiation and the
localization of starch in storage tissues around the
cambium in locally heated stems of Abies sachalinensis (Schmidt) Masters. Trees., 17: 185-192.
[14] S Nakaba, Y Sano, T Kubo and R Funada. 2006. The
positional distribution of cell death of ray
parenchyma in a conifer, Abies sachalinensis. Plant Cell Rep., 25: 1143-1148.
[15] RA Savidge and PF Wareing. 1981. Plant growth
regulators and the differentiation of vascular
elements. In: Barnett JR, ed. Xylem cell development.
London: Castle House, 1981, pp. 192-235.

Proceedings of the International Conference on Environmental Aspects of Bangladesh (ICEAB 2011)
123
A3.002
Historical Analysis and Aridity Index Mapping for Agricultural
Drought Study in North Western Region of Bangladesh
Shams Al-Amin1 and Umme Salma Rima2
1Graduate Student, Department of Civil Engineering, Bangladesh University of Engineering and Technology, Bangladesh; e-mail: [email protected]
2Graduate Student, Department of Environmental System Engineering, University of Regina, Canada,
e-mail: [email protected]
Abstract North-western region of Bangladesh commonly known as Barind Tract is the largest Pleistocene physiographic unit of
the Bengal Basin which is comparatively at a higher elevation than the adjoining floodplains. During monsoon the
Barind Tract remains free from flooding and is drained by a few small streams. Landscape modification has minimized
groundwater recharge through rainwater and shifting of the Tista and the Atrai and their distributaries has greatly
influenced the climatic conditions of the area too, turning this it into a hot region. This paper presents Aridity Index
map of North-western region of Bangladesh for their vulnerability of agricultural drought following UNESCO (1979)
proposed rainfall-evapotranspiration ratio approach. Through Historical analysis of precipitation & evaporation data
over 36 years in the area, annual rainfall and Potential Evapo-transpiration (PET) has been calculated. Aridity index (AI)
has been used as a numerical indicator of the degree of dryness of the climate in the area. Maps have been generated by
GIS for analyzing trend of change in precipitation.
INTRODUCTION
Increased dryness has long been recognized as a
major environmental problem affecting the living
conditions of the people in the affected regions in
many countries of the world. The studies indicated
that over the preceding 20 years, the problem of
land degradation due to increased aridity had
continued to worsen. In the past, dry lands
recovered easily following long droughts and dry
periods. Under modern conditions, however, they
tend to lose their biological and economic productivity
quickly unless they are managed in a sustainable
manner (GOI, 2001). Once the dryness of an area
increased beyond a certain level it becomes difficult
to recover. Therefore, to study the extent of dryness
of an area is essential to combat land degradation
and desertification. Measurement of dryness is also
necessary for evaluating drought vulnerability,
measuring drought severity, monitoring climatic
change, assessing bio-environment, monitoring soil
moisture and planning agricultural. Therefore, it is
very important for a country to have updated
dryness maps. For delineation and scientific study
of droughts Aridity Index based on water balance
consideration serves as a useful parameter [1] and
has been used in this paper.
MATERIALS AND METHODS
A. Study area
The study area (Fig 1) represents the drought
prone areas of Bangladesh which is basically the
North-western and central-western zone of
Bangladesh. Increased dryness has long been
recognized as a major environmental problem
affecting the living conditions of the people in these
affected regions. The ground elevation ranges from
a maximum 45 mm in the north south side to 13
mm at the central part [2]. Barind Tract constitutes
54% of the total area, and the rest 46% covers the
floodplain of the rivers flowing through the area.
Fig. 1. Study Area
B. Annual rainfall estimation
There are about 84 rainfall stations in North- western region of Bangladesh operated by BWDB. Among them, about 53 rainfall stations have been selected for the study area due to data availability which is shown in Fig 2. The daily rainfall data have been collected from BWDB and based on that, point map of annual precipitation has been generated for 1972 to 2008.The missing data have been filled up by the data of previous year and also by the data of the surrounding neighboring stations.
C. Annual evaporation estimation
There are about 11 evaporation stations in North-western region of Bangladesh operated by BWDB shown in the Figure 3. The daily potential evaporation data have been collected from BWDB and based on that, annual potential evaporation of each of the stations has been determined from 1972 to 2008. The missing data have been filled up by the data of previous year and also by the data of the surrounding neighboring stations. Based on the

Proceedings of the International Conference on Environmental Aspects of Bangladesh (ICEAB 2011)
124
data, thiessen polygon map of evaporation has been generated for the whole region.
Fig. 2. Rainfall stations of North Western Zone of
Bangladesh
Fig. 3. Evaporation stations of North Western
Zone of Bangladesh
D. Determination of Aridity Index
Precipitation-temperature based method proposed by De Martonne (1926) is widely used for measuring aridity of an area. Another widely used method is Thornthwaite‘s method based on precipitation and temperature [3]. Recently UNESCO (1979) has proposed a rainfall-evapotranspiration ratio based method for the estimation of dryness [4]. In this paper, UNESCO aridity index is used for the aridity mapping of Bangladesh. For this, thiessen polygon extension has been used to describe the area of influence of each of the evaporation stations (Fig 2).
The values of potential evaporation under these polygon areas have been considered as constant. Annual precipitation and evaporation maps have been integrated using the equation: P/PET. Finally, Aridity index maps have been generated in GIS by generating surface area on the basis of their classification.
The UNESCO (1979) proposed a method for aridity mapping from the ratio of precipitation (P) to potential evapotranspiration (PET), i.e.
AI=P/PET……………………………………… (1)
Where, PET is the Annual Potential Evapo- transpiration & P is the Annual Precipitation.
Based on the AI values, five climatic regions of aridity are proposed as given in Table 1.
Table1. The classifications of the climate region based on
UNESCO Aridity Index
AI Value Climate Class
<0.03 Hyper Arid
0.03-0.2 Arid
0.2-0.5 Semi-arid
0.5-0.65 Dry sub-humid
>0.65 Humid
E. Statistical analysis using GIS
For the statistical analysis of Aridity index values for the individual district, Arc View GIS 3.2 has been used. The surface map of these values of each of the districts have been generated individually by interpolating grid values using inverse distance weighting method and then the minimum, maximum values are calculated to find out the range of AI values for each of the districts.
RESULTS AND DISCUSSIONS
The annual precipitation values and annual evaporation values of the study area, it has been found that the total annual evapotranspiration of this zone is lower than or equal to annual rainfall. In fact, the amount of annual rainfall varies generally from 1500-1600 mm which is very lower compared to the annual rainfall of whole Bangladesh. And it means that the climate of this region can be said very close to dry climate. The rainfall changing patterns of Rajshahi & Rangpur throughout the last 36 years are shown in figure 4.
A. Statistics of Aridity Index Values
For, northwestern and central western zone of Bangladesh, aridity index has been calculated for 1971 to 2007. Aridity Index in this area; as the index shows, has been increasing over years. However, it is still very low compared to rest of the country. The improvement of drought condition can be attributed to the large scale initiatives taken by government. A project named the ―Barind Integrated Area Development Project (BIADP)‖ was initiated in mid 1980s to develop groundwater irrigation in the area. Apart from providing irrigation, there have been other programmes such as tree planting and excavation of ponds and khals to arrest the degradation of the environment. At the

Proceedings of the International Conference on Environmental Aspects of Bangladesh (ICEAB 2011)
125
beginning, the project generated a lot of concern among environmental scientists about sustainability of the groundwater resources. However, 15 years of its operation has proved it to be a success. Environmental degradation has also been checked and positive results such as higher rainfall and higher vegetation coverage are evident. The project has been renamed as the Barind Multipurpose Development Authority (BMDA) since the early 1990s and now covers a large part of the Barind Tract.
Fig. 4. Annual rainfall (1972-2005) in Rajshahi
and Rangpur
Fig. 5. Extreme drought years in Northwestern Region
B. Extreme drought years in North Western Region
Northwestern and central western zone of Bangladesh suffered extreme agricultural drought in 1972 & 1994. The drought can be attributed to the extreme low rainfall (as shown in Fig 5) associated with prolonged summer in those years. The average rainfall in 1972 was only 1360 mm and that in 1994 was 1355 mm. Average Rainfall in 1982 was also very low (1522 mm). The northwestern and central western zone suffered
heavy agricultural loss in those years.
Table 2. Statistics of Aridity Index Values
Aridity Index Values
1994 1995 1996 1997 1998 1999 2000
Min 0.57 0.96 0.72 0.60 0.04 1.04 1.07
Max 3.82 3.27 2.80 2.49 3.40 4.07 3.33
Mean 1.40 1.92 1.38 1.48 1.94 2.05 1.79
Std
Dev 0.51 0.56 0.42 0.46 0.57 0.62 0.53
Aridity Index Values
2001 2002 2003 2004 2005 2006 2007
Min 0.90 0.76 0.88 0.68 1.19 0.75 0.61
Max 3.11 3.36 4.07 4.84 4.07 3.91 3.16
Mean 1.62 1.69 1.76 2.01 2.04 1.74 1.70
Std
Dev 0.46 0.56 0.65 0.80 0.66 0.54 0.45
C. Aridity Index map for Northwestern region
The aridity index map of different years including the drought years (1972 and 1994) and recent year (2007) have been shown in the following figure 6.
From the map of 1972, it has been found that all the parts were humid zone except Naogaon, Nawabganj, Rajshahi and some parts of Thakurgaon, Dinajpur and Rangpur where the climates were close to dry subhumid zone, especially in some parts of Naogaon and Nawabganj where the conditions were even worst. From the map of 1982, it has been found out that the dry subhumid zone extends towards Natore and Bogra too, but Dinajpur and Rangpur show the better condition. In case of 1994, the dry subhumid zone extends to Joypurhat although the other parts show some better condition than from 1982. From the map of 2007, it is clearly visible that the dry condition seems to reach in a better condition in all of these parts of the study area. But Lalmonirhat is the new addition which is going to become dry zone slowly.
D. Comparison of AI with most drought prone year
Comparison of Aridity Index between the Most Drought prone Year and Recent Year has been shown in Table 3. It can be found from the maps as well as the table that except Lalmonirhat, the other
districts show the greater Aridity Index Values which means that the amount of rainfall is increasing to an extent. But most of the rainfall occurs in monsoon season. If we consider the dry season rainfall, it will be clearly visible that the rainfall is not sufficient at all. And this is the reason for agricultural drought due to shortage of rainfall in dry period. Since the area is free from flood, rainwater is the main source of groundwater recharge. A decrease in rainfall has caused the successive lowering of the groundwater table of the region, which has eventually been greatly affecting the environmental parameters. Besides lowering of the water table, there is a noticeable change in forest area. Almost 70% forestland of the region had been changed into cultivable land during the past few decades [5]. Due to the dry nature, relatively low rainfall and massive deforestation, the vegetation

Proceedings of the International Conference on Environmental Aspects of Bangladesh (ICEAB 2011)
126
cover in the area has decreased distinctively. If this trend continued, the area might become almost an arid region.
Fig. 6. Aridity Index Map of Various Years
Table 3. Comparison of AI between the Most Drought prone Year and Recent Year
Name of
District
AI
in 1972
AI
in 2007
Thakurgaon 0.69-1.50 1.37-2.02
Near Dry subhumid Humid
Dinajpur 0.69-1.53 1.42-3.16
Near Dry Subhumid Humid
Nilfamari 1.17-2.04 1.59-2.21
Humid Humid
Naogaon 0.5-1.42 1.13-1.74
Dry Subhumid Humid
Nawabganj 0.55-0.98 1.15-1.62
Dry Subhumid Humid
Rangpur 0.83-1.9 1.38-2.31
Near Dry Subhumid Humid
Gaibandha 1.09-1.45 1.24-2.22
Humid Humid
Joypurhat 0.97-1.31 1.56-1.91
Humid Humid
Rajshahi 0.66-1.09 1.15-1.93
Near Dry Subhumid Humid
Natore 0.9-1.39 1.15-1.78
Near Dry Subhumid Humid
Lalmonirhat 1.72-1.92 0.61-2.17
Humid Near Dry Subhumid
CONCLUSION
An attempt has been made for the mapping of
dryness of north-western region of Bangladesh
using geographic information system. The most
recently used model is used for this purpose. The
result shows that there exists no climatically dry
zone in Bangladesh. Although some parts in the
western side of the country have an aridity index
that is close to dry zone. Deforestation and other
environmentally harmful activities in the region
might cause a gradual declination of rainfall and
inclination of temperature, and consequent
increase of aridity of the region. If the aridity of the
area tends to increase, it might lose its productivity
and become an arid region. Necessary steps should
be taken to manage the situation in a sustainable
manner.
ACKNOWLEDGMENTS
The author would like to acknowledge to BUET and PRISM Bangladesh to provide support and assistance to conduct the research.
REFERENCES
[1] VP Subramanium. 1964. Application of water balance
concepts for a climate study of droughts in South
India. Indian J. Mat. Geophys.,15(3): 393-402
[2] CS Jahan and M Ahmed. 1997. Flow of Groundwater
in Barind Area, Bangladesh. Implication of Structural
Framework. J. Geol. Society of India., 50: 743-752.
[3] CW Thornthwaite. 1948. An approach towards a
rational classification of Climate. Geogr. Rev.,38(1):.
55-94
[4] UNESCO. 1979. Aridity definition (UN documents),
United Nations Educational, Scientific and Cultural
Organization, New York
[5] KM Ahmed. 2003. Barind Tract, In Banglapedia,
Available:http://banglapedia.search.com.bd/HT/B_
0309.htm.
[6] DR Nandy. 1980. Tectonic patterns in northeastern
India. Jour. of Earth Science, 7: 103-107.
[7] Barind Multipurpose Development Authority (BMDA),
2002. Progress report for the month of August 2002,
Office of the Executive Director, Barind Multipurpose
Development Authority, Rajshahi.

Proceedings of the International Conference on Environmental Aspects of Bangladesh (ICEAB 2011)
127
A3.003
Eco-environmental Changes of Hail Haor Wetland Resources under
Sylhet Basin of Bangladesh due to Sedimentation: A GIS Approach
MJ Uddin1*, ASM Mohiuddin1 and ST Hossain2
1Department of Soil, Water and Environment. University of Dhaka.Dhaka-1000, Bangladesh 2Friends In Village Development Bangladesh (FIVDB), Dhaka 1207, Bangladesh
Corresponding Author: * e-mail : [email protected]
Abstract
The Sylhet basin is the largest single inland depression in Bangladesh and derives its name from the multitude of the
large lake like fluvial features known as Hail haor. Hail haor is located between the geographical coordinates of
24°18'-24°26'N, 91°38'-91°45'E; under Moulvibazar district of Bangladesh. A study was conducted using the time series
database of hail haor wetland which revealed that there was a considerable amount of sediment deposition from the
surrounding highlands and the water body was shrinking from 10,000 ha to 5,200 ha and 2000 ha (approx.) during the
period from 1989 to 2003 and 2010 respectively. As a result, new soil boundaries have emerged helping the cultivation
of high yielding rice varieties. Beyond these aspects, the wetland eco-system degradation seriously affects the
bio-resources of the study sites.
INTRODUCTION
Bangladesh is a country of vast wetland resources and has been estimated to have seven to eight million hectares, which is about 50% of the total land area including the flood plains. The greater part of northeast region is taken up by the wetland basin which comprises the floodplains of the Meghna river tributaries, and is characterized by the presence of numerous large, deeply flooded depressions, known as haors, between the rivers. The geology, hydrology, soil characteristics and socio-economic attributes of the haor basin also contribute to distinguish it from its adjacent hilly land. It is believed that the basin is technically active and is undergoing subsidence [1]. During monsoon the basin receives the huge discharges of large number of rivers flowing down from the hills of Assam and Meghalaya and takes the form of a vast inland sea. Sylhet basin covers a large number of haors and among them Hakaluki haor, Tanguar haor, Hail haors cover an extensive area [2]. This basin is an extensive alluvial plain supporting a variety of wetland habitats. It contains about 47 major haors and more than 6,000 beels, or freshwater lakes, nearly half of which are seasonal [3]. The major rivers in the study area are the Surma and the Kushiyara and their tributaries Manu, Khowai, Jadukhata, Piyain, Mogra, Mahadao and Kangsha which form the dense drainage network of the haors. These hilly rivers coming down from the Khasia and Jaintia hills in Meghalaya
carry particularly high volumes of water as they come from some of the rainiest places in the world.
The main objective of this paper was to investigate the eco-environmental changes of the hail haor wetland ecosystem using GIS technology.
MATERIALS AND METHODS
A. Study area
Hail haor is located in the Sylhet basin between the Balishira and Satgaon hills under the Moulvibazar district of Bangladesh which lies between 24°18'-24°26'N, 91°38'-91°45'E. The haor originates from the surrounding hill streams. It is a large
shallow lake in a saucer-shaped depression, bounded in the south, east and west by low hills and in the north by the plains of the Manu and Kushiyara Rivers. The haor is almost encircled by a chain of tea estates and natural forests. The river Gopla flows through this wetland in a north-south direction.
Around 1,65,000 people are directly and indirectly dependent on the Hail haor for their livelihoods. The local stakeholders are mainly dependent on diverse resources of this wetland ecosystem. They collect the resources for selling and consumption. As a result, resources like fishes, wildlife, migratory birds, forests, aquatic weeds and other important flora and fauna were being depleted very quickly showing maximum risk of vulnerability to environmental degradation. Economic growth in the catchment also poses a threat: more intensive cultivation is typically associated with the use of agro-chemicals which affects water quality.
B. Data and software used
In order to compare the area of water body, two time series data sources were taken. The first one is topographic maps of Messers Capital Air Survey Ltd. Canada during 1974-75 and revised on the ground during 1982-83 and verified during 1987-88 and also 1989-90. The second one is the Land and Soil Resources Utilization Guides [4]. In addition, aerial photo of 1984 was used for verification. The scale used for these two data sources was 1:50,000. ARC/GIS version 7.1 was used in preparing the maps and the subsequent spatial analysis
RESULTS AND DISCUSSIONS
It is quite evident that huge sedimentation took place in the study sites. This phenomenon of sedimentation over a time period introduces new soil boundaries along with high yielding varieties of rice crops which enhances the shrinkage of the water body. The sedimentation process is accelerated with the flow of upstream water from the surrounding hilly areas. As a result, Goainghat-Phagu soil association and Phagu-Hakaluki soil association emerges (Fig. 1)

Proceedings of the International Conference on Environmental Aspects of Bangladesh (ICEAB 2011)
128
where HYV boro (December-May) rice cultivation is gaining popularity which ultimately shrinking the bio-resources of this wetland. The study revealed that the area covered by wetlands in the hail haor has been significantly reduced over the period from 1989 to 2003 (Fig. 1 and Fig. 2). The reasons may be due to erratic climatic changes in the Sylhet basin area. According to GIS analysis using PAT (Polygon Attribute Tables) files, total hail haor area was about 10,000 ha in 1989, covering the mapping units of 6, 6a, 7, 7a, 8 and 8a (Map-1). In 2003, the area of this water body was reduced and the area becomes 5,200 ha covering the mapping units 6a, 7a and 8a (Map-1). In 2010, this water ecosystem also decreased significantly and the area of which becomes 2000 ha (Fig. 2). The rate of reduction of the water body is alarming but in the dry season, the area of the hail haor shrinks further which become 900 ha. The study also showed that considerable changes occur due to sedimentation
and as a result depth and duration of inundation has changed. This change showed a positive impact on agricultural aspects enhancing emergence of new soil boundaries and serious negative impact on eco-environmental aspects i. e. degradation of wetland ecosystem. Similar findings were also shown [5-6] in accretion of land for edaphic use in some flood prone areas of Bangladesh [7]. Sedimentation has taken place in low lying areas where grazing land emerges in course of time in some flood prone areas [8]. Land use mapping of the surrounding areas of the Hail haor revealed that 46.0 percent is under tea estates, 28.0 percent is forest land and 13.0 percent is privately managed pineapple or other citrus gardens [4]. These citrus and pineapple gardens disproportionately contributed to siltation because the local farmers habitually grew pineapple and citrus fruits in rows running up-down slope accelerates soil erosion.
Fig. 1. Soils and Landform Map of Hail Haor under Sylhet Basin of Bangladesh

Proceedings of the International Conference on Environmental Aspects of Bangladesh (ICEAB 2011)
129
Poor land management in the neighboring hills results in serious soil erosion where pineapple is grown in lines up-down slope. A study [9] revealed that Hail haor carried over 2,00,000 m3 of sediment just in July, 1999. In 2001, silt loads of 22 hill stream carried 50,000 tons, suggesting that the total of 59 active hill stream carried over 1,00,000 tons of silt into Hail haor each year. Deposition of 8-15 cm of silt in one year was recorded near the outfalls of the hill streams, suggesting the haor bed rise on average by about 5 cm per year [9]. Hail haor is changing rapidly, the fringes of the haor are rapidly filling in and it is apprehended that one day it may disappear.
Fig. 2. Decreasing trends of Hail haor wetland ecosystem
over two decades
CONCLUSION
From the above study, it is confirmed that wetland ecosystems of Hail haor is decreasing due to sedimentation as well as erratic climatic change which affects the bio-resources of the study sites. To restore the bio-resources, shelter belts should be built surrounding the study area. Use of agro-chemicals should be limited surrounding the tea estates. Priority should be given on the livelihood improvements of the local stake holders by reducing over extraction of resources and making an eco-friendly sanctuary for fishes, birds and other wild life habitats.
REFERENCES
[1] JP Morgan and WG MCIntire. 1959. Quaternary
geology of Bengal basin East Pakistan and India.
Bulletin of Geological Society of America, 70: 330.
[2] WRI (World Resource Institute). 1990. Bangladesh
environment and natural resource assessment.
Washington DC, Centre for International Development
and Environment. Draft Report. USA. p. 86.
[3] MI Haque. 2008. Water resources management in
Bangladesh. Charu Ferdousi Naima For Anushilan,
Dhaka. pp. 218-245.
[4] SRDI (Soil Resource Development Institute). 2003.
Land and soil resource utilization guides. Ministry of
Agriculture, Government of Bangladesh, p. 90
[5] MM Hoq and JU Shoaib. 2009. Edaphological change
due to sediment: a case study in Savar area. Journal of Asiatic Society of Bangladesh (Science), 29: 27-36.
[6] MS Sultana, GMT Islam and Z Islam. 2009.
Application of geoinformatics in identifying reduction
of wetlands in Dhaka, Bangladesh Journal of Water Resources Research, 21: 17-28.
[7] NJ Erickson, QK Ahmed and AR Chowdhury. 1993.
Socio-economic implications of climate change for
Bangladesh. Bangladesh Unnayan Parishad (Brief Doc.
No. 4), Dhaka. p. 37.
[8] MS Ullah, MJ Uddin and SF Elahi. 2006. Changes in
spatial patterns of land and soil resources at
Mithamoin upazila under Sylhet Basin of Bangladesh.,
Dhaka University Journal of Biological Science, Vol. 15,
2006, pp. 105-111.
[9] MACH (Management of Aquatic Ecosystem through
Community Husbandry), Hydrology study report.
Winrock International, Dhaka, 2004.
0
2000
4000
6000
8000
10000
1989 2003 2010
year
Area (ha)

Proceedings of the International Conference on Environmental Aspects of Bangladesh (ICEAB 2011)
130
A3.004
Spatio-Temporal Variation of Extreme Rainfall Events in Bangladesh
Sharmeen Farhana1 and Mafizur Rahman2
1Graduate Student, Department of Civil Engineering, Bangladesh University of Engineering and Technology, Dhaka-1100, Bangladesh; e-Mail: [email protected]
2Professor, Department of Civil Engineering, Bangladesh University of Engineering and Technology, Dhaka-1000, Bangladesh; e-mail: [email protected]
Abstract
Climate variable like rainfall is the most important parameters for agricultural. New analysis shows that in region where
total precipitation has increased it is very likely that there have been even more pronounced increase in heavy and
extreme precipitation events. The converse is also true. The analysis is carried out to study the precipitation trend over
these fifty years. Fifty years (1950-1999) precipitation data from 24 BMD (Bangladesh Meteorological Department)
stations and relevant maps were collected. These data have been organized in terms of annual and four seasons as
pre-monsoon, monsoon, post-monsoon and winter. Data series have been applied for linear trend, so that data should
be consistent for fifty years period and to determine any significant change of trends for selected parameter (rainfall) of
different stations. The analysis is based on statistical analysis The statistical analysis include firstly, the trend analysis
of rainfall days with respect to time and space that represent the variation of no, medium, high and extreme rainfall
days with respect to year and area in different seasons at different locations of Bangladesh .The analysis result will help
the planners and policy makers to counter act the adverse effect of environmental parameter (rainfall) in different
sectors like agriculture.
INTRODUCTION
Climate of Bangladesh is tropical with a mild winter from October to March, a hot, humid summer from March to June. A warm and humid monsoon season lasts from June to October and supplies most of the country's rainfall. Over 92% of the annual runoff generated in the GBM (Ganges, Brahmaputra and Meghna) catchments area flows through Bangladesh, although it comprises only about 7 per cent of the total catchments [1]. The main concentration of this study is to study the trend of number of rainfall days (no, medium, high and extreme rainfall) with respect to area. The study area includes the whole of Bangladesh and is based on available data from 24 BMD (Bangladesh Meteorological Department) stations. Statistical analysis is done for trend analysis. The sorted data tables are exported to GIS (Geographic information System) software ArcView 9.1 to prepare map of Bangladesh showing seasonal rainfall pattern. According to Climate Change 2007 Synthesis Report over the last 50 years, it is likely that the frequency of heavy precipitation events (or proportion of total rainfall from heavy falls) has increased over most areas. Heavy precipitation is very likely to damage crops, causing increased risk of disruption of settlements and frequent soil erosion [2]. The trend of rainfall days with respect to area provides the information whether heavier rain falls in smaller area that can be verified with IPCC report [3]. If the IPCC prediction is true then the large area will fall under the draught. The analysis result will help the planners and policy makers to counter act the adverse effect of environmental parameter (rainfall) in different sectors like agriculture.
MATERIALS AND METHODS
A. Study area
The study area is 68007 km2, which covers 22 districts among 64 districts of Bangladesh (Fig 1). For convenience of analysis the study is based on
available data of 24 BMD (Bangladesh Meteorological Department) stations among 34 BMD (Bangladesh Meteorological Department) stations for measuring rainfall pattern. These stations have their respective longitude and latitude. The available rainfall data are, daily rainfall record at 24 BMD stations for 50 years (1951-2000) and monthly rainfall record at 24 BMD stations for 10 years (1996-2005).
Fig. 1. Study area
B. Categorizing rainfall
Each year rainfall data has been categorized into
four different seasons as follows:
Pre-monsoon (March – May)
Monsoon (June – September)
Post-monsoon (October – November)
Winter (December – February)
Rainfall event has been categorized to investigate number of occurrence of extreme rainfall days in comparison to number of occurrence of no rainfall days. A rainfall of less than 5mm is considered as

Proceedings of the International Conference on Environmental Aspects of Bangladesh (ICEAB 2011)
131
No rainfall where as a rainfall more than 100 mm is referred to extreme rainfall. The interval of 0-100 mm rainfall is further subdivided in two more categories of Medium rainfall (5mm<rainfall <50mm) and High rainfall (50mm<rainfall<100mm). Table 1 shows the categories of rainfall considered.
Table 1. Categorizing rainfall
Depth of Rainfall(mm) Types of rainfall
rainfall<5mm No rainfall
5mm<rainfall<50mm Medium rainfall
50mm<rainfall<100mm High rainfall
Rainfall>100mm Extreme rainfall
C. Statistical analysis for extreme events
The graphs from Fig 2 and Fig 3 represents the trend of number of no, medium, high and extreme rainfall days from 1995-1999 with respect to area in premonsoon, monsoon, post monsoon and winter over the whole country. The rainfall areas of all stations are found from GIS analysis. The graphs are prepared to verify whether heavier rain is falling in smaller areas as suggested in IPCC report. IPCC prediction will be applicable in Bangladesh if the number of medium, high and extreme rainfall days decrease and no rainfall days increase with the increase of area.
ILLUSTRATION
A. Trend of number of rainfall days with respect to area
The graphs are made for showing the trend of number of no, medium, high and extreme rainfall days from 1995-1999 with respect to area in premonsoon, monsoon, post monsoon and winter at different locations of Bangladesh. The graphs are shown in Fig 2(a), Fig 2(b) and Fig 3.
Fig. 2(a). Variation of number of rainfall days for Extreme
and High Rainfall Days
Fig. 2 (b). Variation of number of rainfall days for Medium
and No Rainfall Days
Fig. 3. Variation of number of annual rainfall days with
respect to area

Proceedings of the International Conference on Environmental Aspects of Bangladesh (ICEAB 2011)
132
B. Trend of number of rainfall days with respect to year
The graphs are made for showing the trend of number of no, medium, high and extreme rainfall days with respect to year in premonsoon, monsoon, post monsoon and winter at different locations of Bangladesh for 50 years from 1950 to 1999. The trend of number of no, medium, high and extreme rainfall in Chittagong is given in the Fig 4.
Fig. 4. Variation of number of no rainfall days over
time in monsoon
RESULTS AND DISCUSSIONS
A. Trend of number of rainfall days with respect to area
According to the assumption the area of uniform
rainfall is large. This assumption will lead to more
accurate result when the area under each rainfall
station is smaller. As the hourly rainfall data is not
available the rainfall intensity is measured in
mm/day but the actual rainfall intensity is inch/hr.
Here mm/day is the lowest or smallest unit, so it is
considered as the rainfall intensity for Bangladesh.
The number of extreme rainfall days decrease with
the increase of area and it is as per prediction. The
analysis performed over the whole country is
summarized in the following Table 2 and Table 3.
Negative value indicates the number of rainfall days decrease with the increase of area and positive value indicates the number of rainfall days increase
with the increase of area. Table 3 shows a review of no of rainfall days
prediction for premonsoon, monsoon, post
monsoon and winter.
Table 2. Trend of rainfall days with respect to area
Type
Seasonal
Pre
mon
soon
(day/km
2)x
(E-0
5)
Mon
soon
(day/km
2) x
(E-0
4)
Post-
mon
soon
(day/km
2)x
(E
-05)
Win
ter
(day/km
2)x
(E
-06)
No rainfall days -50 3 20 300
Medium rainfall days 50 11 -6 30
High rainfall days -5 -10 -10 20
Extreme rainfall days -5 -4 -2 1
Table 3. Trend of no of rainfall days with respect to area
Type
Seasonal
An
nu
al
Pre
Mon
soon
Mon
soon
Post
Mon
soon
Win
ter
No rainfall days NP APP APP APP APP
Medium rainfall days NP NP APP APP NPP
High rainfall days NP APP APP NP APP
Extreme rainfall days APP APP APP NP APP
If the number of medium, high and extreme rainfall days decrease and no rainfall days increase with the increase of area, it is denoted by APP (As per prediction). On the other hand, if the number of medium, high and extreme rainfall days increase and no rainfall days decrease with the increase of area; it is denoted by NP (Not as per prediction).
From the above Table 2 and Table 3, it is seen
that the number of no rainfall days decrease at the
same time the medium and high rainfall days
increase with the increase of area in premonsoon.
The IPCC prediction is not applicable in pre
monsoon. In case of monsoon and post monsoon
this prediction is applicable except for medium
rainfall days in monsoon as the medium rainfall
increases with the increase of area in monsoon. On
the other hand high and extreme rainfall days
increase in winter. As the number of annual no
rainfall days increases and the number of annual
high and extreme rainfall days decreases, so it is
following the IPCC prediction.
B. Trend of rainfall days with respect to year
When the number of no rainfall days decrease
with the increase of area then the number of
medium, high and extreme rainfall days should be
increased. In case of monsoon the number of no
rainfall days increase and the medium rainfall days
decrease with the increase of years except in Dhaka.
The high rainfall days decrease except in Dhaka,
Sylhet, Rajshahi and extreme rainfall days decrease

Proceedings of the International Conference on Environmental Aspects of Bangladesh (ICEAB 2011)
133
except in Sylhet. The pattern of trend is provided
in the corresponding table 4.
Table 4: Trend of rainfall days with respect to year
Zone
No rainfall days Extreme rainfall days
Winter Monsoon Monsoon Winter
(day/year) x (E-03)
Barishal -37.7 78.5 -3.7 -0.2
Bogra -14.3 -70.4 4.6 0
Chadpur -66.8 -475.8 -27.7 0
Chittagong -36.5 76.8 -19.2 0
Comilla -24.3 204.6 -12.6 0
Cox‘s
Bazar -48.6 57.5 -12.9 0
Dinajpur -31.7 -50 18.7 1.6
Dhaka -21.2 -19.3 -14.1 0
Khulna -78.1 -127 -3.8 0
Faridpur -37.1 37.8 -0.9 0
Feni -18.3 -874.2 22.6 4.3
Sylhet -21.5 95.7 29 -1.6
Jessore -51.4 -28 4.5 0.5
Kutubdia -167.9 164.3 -542.9 0
Mymen
singh -23.5 -11.3 -171 0
Rajshahi -28.4 -14.7 112.6 0
Patua
khali -98.9 0.2 1392.6 0.02
Ranga
mati -23.4 20.4 -239.2 2.3
Rangpur 97.7 42.6 -33.7 0
Sandip -29.3 -93.5 -58.7 3.2
Sitakunda -106.7 22.7 -432.8 0
Srimangal 24.4 -10.8 197.2 0
Tangail 302.2 -49.5 -417.6 0
Teknaf -55.3 184.8 79.1 0
Hatia -33.0 -45.5 142.6 0
CONCLUSION
The study area is 68007 km2, which covers 22
districts among 64 districts [4] of Bangladesh (Fig 1). For the convenience of analysis the study is based on available data of 24 BMD (Bangladesh Meteorological Department) stations among 34 BMD (Bangladesh Meteorological Department) stations for measuring. If the number of seasonal no, medium, high and extreme rainfall days are considered then IPCC prediction is applicable in Post-monsoon. This prediction is also applicable in monsoon except in case of medium rainfall days as it increases with the increase of area. If the number of annual no, medium, high and extreme rainfall days considered, the number of annual no rainfall days increases and the number of annual high and extreme rainfall days decreases, so it is following the IPCC prediction.
REFERENCES
[1] Coleman, J.M., (1969) Brahmaputra River: Channel
Processes and Sedimentation, Sedimentary Geology,
B129-239.
[2] S. M. S. U., Hossain , M. A., Rahman, M.M., (2006)
Earth observation in the service of water management,
International Workshop on Capacity Building in Asia,
Bangkok.
[3] IPCC (2001), scientific report, Intergovernmental
panel of climate change.
[4] Wikipedia [Online]. Accessed on March 2007,
Available: http://en.wikipedia.org/wiki/Climate_ change_and_agriculture.
[5] S. Farhana, ˝Spatio Temporal Variation of Rainfall in
Bangladesh˝ unpublished.

Proceedings of the International Conference on Environmental Aspects of Bangladesh (ICEAB 2011)
134
A3.005
Thunderclaps of Climate Change in Bangladesh with Special
Reference to Urban Heat Island Impact: Case Studies in Two Cities
AFM K Chowdhury1*, MAI Chowdhury2 and SU Ahmed3
1*Department of Environmental Science & Disaster Management, Patuakhali Science & Technology University (PSTU), Patuakhali, Bangladesh; e-mail: [email protected]
2Department of Civil & Environmental Engineering, Shahjalal University of Science and Technology (SUST), Sylhet, Bangladesh
3United Nation Industrial Development Organization (UNIDO), Dhaka, Bangladesh
Abstract
The universe is under threat from every dimension due to the indiscriminate activities of mankind against the harmony
of the nature, uneven deterioration, unthinkable depletion, uncontrollable change, non-restricted urbanization,
non-conformity of technical progress by leaps and bounds beyond the equilibrium without thinking of the needs of
future generation for their survival causing severe environmental degradation in soil, water and air media. Such
activities cause uncontrollable emission of greenhouse gases GHGs enhancing climate change unpredictably and
ultimately causing severe natural calamities and uncertain thunderclaps throughout the world specially in Bangladesh
leading to the natural imbalance enhancing the collapse of environmental sustainability. The city life of Bangladesh is
under coercion situation in the form of urban heat island (UHI) impacts in the urban centers of Bangladesh. In this
study, UHI effects in two cities of Bangladesh; Rajshahi and Sylhet has been reviewed to provide the guidelines to
mitigate UHI impacts in Bangladesh.
INTRODUCTION
Climate change is not only a social, an economic and a political concern but also a humanitarian issue because it will directly affect innocent victims. Following the most rapid century of warming experienced by modern civilization, the first ten years of the 21st century see an acceleration of atmospheric warming, as average temperatures worldwide rise by 0.5 degrees Fahrenheit per decade and by as much as 2 degrees Fahrenheit per decade in the harder hit regions1. Such temperature changes would vary both by region and by season over the globe, with these finer scale variations being larger or smaller than the average change. What would be very clear is that the planet is continuing the warming trend of the late 20th century. Extreme climatic events including flooding, sea level rise, storm impacts, drought, heat waves and wildfires are projected for many regions around the globe2. The latest UN report on climate change says mankind is "very likely" to be the cause of global warming and predicts a rise in temperature of between 1.8-40C (3.2-7.20F) by 2100. It also projected that sea levels were most likely to rise by 28-43cm, and global warming was likely to influence the intensity of tropical storms. Over the last century humans have begun to have a discernible influence on the earth's climate, causing it to warm 3,4. Since the beginning of the industrial age, the concentration of CO2 in the atmosphere has increased from 280 to 350 parts per million5. The destruction of carbon sink by excessive land use and deforestation might be an important cause for the atmospheric CO2 increase over the last 100 years6. It has been projected from the historical data and simulation models that the CO2 level in the atmosphere will reach 600 ppm in the last half of this century7. The increase of CO2 and several other greenhouse gases could cause an increase global temperature of about 4.2°C and possibly a change in precipitation patterns and amounts in some regions8. Global warming due to increasing
concentrations of greenhouse gases (GHG) poses a threat to human society by changing the living and working environment to which society has adapted over many generations9. Recently UHI impacts have been added to urban global warming scenario. To assess the scenario of UHI impacts in Rajshahi and Sylhet, two rapidly growing cities of Bangladesh, a research has been conducted by CEE department of SUST, Bangladesh. A UHI is a metropolitan area which is significantly warmer than its surrounding rural areas. The main cause of the urban heat island is modification of the land surface by urban development; waste heat generated by energy usage is a secondary contributor.
MATERIALS AND METHODS
A. Horizontal Distribution Change of Daily Temperature
The study has been used METO (Metropolitan Environmental Temperature Observation) system to clarify the detailed temporal and spatial patterns of Urban Heat Island (UHI) in Sylhet and Rajshahi City. Meteorological equipments were installed on the rooftop of 12 buildings as meteorological data acquisition stations from June to August, 2010. These 12 stations were installed in and out of Sylhet and Rajshahi city to show clearly the horizontal distribution change of daily temperature. Temperature data was collected daily at 6 am, 12 pm, 6 pm and 12 am from June to August, 2010 in each of the stations.
B. Vertical Temperature Profile
For acquisition of vertical temperature profile and surface temperature by different land cover 8 high-
rise buildings (Station 13 to Station 20) were selected and air temperature in each of 10 feet height was recorded at 5pm to 8pm in an interval of 1 hour.
C. Annual Mean, Maximum and Minimum Temperature
An assessment of annual mean, maximum and

Proceedings of the International Conference on Environmental Aspects of Bangladesh (ICEAB 2011)
135
minimum temperature of the cities using weather station data operated by Bangladesh Meteorological Department (BMD) and Climate Change Cell (CCC) shows continuous warming of the regions since 1961.
Fig. 1. Climatic Sub-Zones of Bangladesh
(study areas are marked as red colored rectangles)
D. Application of Global Information System (GIS) and Remote Sensing (RS)
The difference of surface temperature between urban infrastructures (buildings, roads) and
vegetation area was determined using GIS. A thermo-graphic camera system can remotely measure the surface temperature of the materials through infrared radiation. It acquits the distribution of surface temperature of the materials, easily and instantly.
RESULTS
Assessment of Temperature Fluctuations
Assessing meteorological data of 50 years (1960- 2009), collected from the Sylhet and Rajshahi Stations of Bangladesh Meteorological Department (BMD) and Climate Change Cell (CCC), the average maximum and average minimum temperature from January to December has been determined (Fig. 2). Furthermore, a climate line has been determined by calculating the mean temperature for 50 years from 1960 to 2009. Then yearly temperature deviations from that climate line have been determined.
Fig. 3 shows the average maximum and minimum temperature from January to December in Rajshahi city. Fig. 4. illustrates the average maximum temperature of 12 stations at different period of a day in Sylhet city. Climate line for summer time (April to May) average Maximum is 21.9 0C in
Rajshahi city is shown in Fig 5. Figure 6 shows the Urban Heat Island Intensity (UHII) of fine day between Station-01 and Station-11 in July, 2010 in Sylhet city. It is very interesting that UHII of Sylhet
appears larger at night than in the day and the daily maximum of UHII was around 3.00C, diurnal temperature in city center are not so much different from suburban by sky view factor and air pollution.
Fig. 2. Average max and average min temperature
from January to December in Sylhet city
Fig. 3. Average maxi and average min temperature
from January to December in Rajshahi city
Fig. 4. Average maximum temperature of 12
stations at different periods of a day in Sylhet city
Fig. 7 shows the average maximum Urban Heat Island Intensity (UHII) of 12 stations in Rajshahi City. The study has determined the maximum UHII is 2.50C at station RS-7 and minimum UHII is 1.1 0C at station RS-5 in Rajshahi City at the midnight on July 29, 2010 at 12:00 am.

Proceedings of the International Conference on Environmental Aspects of Bangladesh (ICEAB 2011)
136
Fig. 5. Climate line for Summer time (April to May) avg.
Maximum Temperature (°C) During 1964 to 2009
Fig. 6. Urban Heat Island Intensity (UHII) between Station-
01 and Station-11 in July, 2010 after sunset in Sylhet.
Fig. 7. Ave. maximum UHII of 12 stations in Rajshahi city
DISCUSSION
The study reveals that that the development of the Sylhet City is growing at an alarming rate without adequate planning. New skyscrapers are being built up all over the city. Moreover, the asphalt roads are also being elongated and expanded with the increase in population and development pattern. Hence, Sylhet city comprises a wide range of dry and dark surfaces which absorb rather than reflect more sunlight, resulting in an Urban Heat Island.
The assessment of horizontal distribution change of temperature data and the vertical temperature profile reveals Rajshahi City as an Urban Heat Island where the Climate line for Summer time (April to May) average Maximum and Minimum temperature are 41.9 0C and 20.8 0C respectively. The study shows a maximum of 2.50C Urban Heat Island Intensity (UHII).
CONCLUSION
Whoever has experienced the sweltering summer days of Sylhet and Rajshahi City will agree that average temperature of the City has increased over the decades. The scorching heat during daytime and hot, see thing nights coupled with load shedding are the bane of the city dweller's life. And it is the unique feature of the urban climate known as Urban Heat Island (UHI) Effect why the temperature is so high in both of Sylhet and Rajshahi city.
There is no doubt about that the high rate of urbanization threats the city for rising as an Urban Heat Island. The high rate of urbanization, in this regards, means that increasing numbers of people will be exposed to impacts resulting from heat islands in the future. Obviously, the policymakers and environmental activists seriously concerned with the threat of global warming urge two strategies to combat it vis-à-vis cutting the use of fossil fuels and planting trees, which sequester carbon dioxide in their wood. The planting of trees in cities does both of these, and is far more effective than planting trees in forests.
REFERENCES
[1] Peter Schwartz and Doug Randall. 2003. An Abrupt
Climate Change Scenario and Its Implications for
United States National Security. NRC
[2] IPCC (Intergovernmental Panel on Climate Change).
2007. Fourth Assessment Report. Last accessed:
1/10/2007, from: http://www.ipcc.ch
[3] RT Watson, MC Zinyowera and RH Moss (Eds.). 1996.
Climate Change 1995: Impacts, Adaptations and
Mitigation of Climate Change: Scientific-Technical
Analyses. IPCC, Cambridge University Press,
Cambridge.
[4] RT Watson, MC Zinyowera and RH Moss (Eds.). 1998.
The regional impacts of climate change: an assessment
of vulnerability. A Special Report of IPCC Working
Group II, Cambridge Univer-sity Press, Cambridge.
[5] FA Bazzaz and ED Fajer. 1992. Plant life in a
CO2-rich world. Scient. Am. pp.1821
[6] JT Houghton, GJ Jenkins and JJ Ephrauma. 1990.
Climate Change: The IPCC Scientific Assessment,
Cambridge University Press, Cambridege, UK, 365
pp.
[7] EH Stanley and HM Valett. 1991. Interactions
between drying and the hyporheic zone of a desert
stream. In: P Firth and SG Fisher (eds.), Global
Climate Change and Freshwater Ecosystems,
Springer-Verlag, New York.
[8] BA Kimball, JR Mauney, FS Nakayama and SB Idso.
1983. Effects of Increasing Atmospheric CO2 on
Vegetation. Vegetatio 104/105:65-70
[9] NS Jodha. 1989. Potential strategies for adapting to
greenhouse warming: Perspective from the developing
world. In: Green House warming: Abatement and
Adaptation, Rosenberg N.L., Earterling III W.E.

Proceedings of the International Conference on Environmental Aspects of Bangladesh (ICEAB 2011)
137
A3.006
Learning from Japanese Policies to Promote Solar Cell Case Study of
Photovoltaic Cluster "Solar Island Kyushu"
Yukihiko Nakata
Ritsumeikan Asia Pacific University, Beppu, Oita, 874-8577 Japan
Abstract
The global greenhouse gas (GHG) emissions must be reduced. One way is to use renewable energies. However, the cost
of electricity produced by renewable energy is higher than that of grid power. Thus, national and local government
policies are effective and were researched focusing on ―Solar Island Kyushu.‖ Japan began the R&D of the solar cell
after the invention of the world's first solar cell at USA. Japan was able to industrialize and promote the solar cell by the
technical development and the supports from the Japanese government policy. As the results, it was found that not
only national government policies but also local government policies are important especially for regional development.
It is expected that Bangladesh and developing countries use Japanese experiences to promote the solar cell. NEDO is
the potential candidate to create a cooperation project with Bangladesh to demonstrate solar cell technology, especially
thin film solar cell, which is fit to near the Torrid Zone.
INTRODUCTION
For environmental sustainability to be attained, the steady increase in global greenhouse gas (GHG) emissions must be reduced. One way to reduce GHG emissions is to use renewable energies. However, in many cases, the cost of electricity produced by renewable energy is higher than that of grid power, which is mainly generated by using fossil fuels. This means that most of the renewable energies have not yet achieved ―grid parity.‖ Thus, national and local government policies are effective.
Japan began the R&D of the solar cell after the invention of the world's first solar cell at USA in 1954. Then, Japan was able to industrialize and promote the solar cell by the technical development and the supports from the Japanese government
policy. Then, the Japanese production share had the 1st place of 50 % in 2004 [1].
What can be learned from Japanese government policies to promote solar cell?
The solar cell competition was researched [2]. In this paper, national and local government policies were researched focusing on ―Solar Island Kyushu‖, which is a photovoltaic (PV) cluster in Kyushu, Japan.
PARADIGM SHIFT IN COMPETITION
A. Solar cell production camount
The world solar cell production amount is rapidly increasing from as shown in Fig. 1 [1], [3]. The total has increased rapidly from 10.6 GW in 2009 to 23.9 GW in 2010, representing annual year-over-year growth of 125%. Also, solar cell module production is around 20.0 GW [3].
B. National share of solar cell production
Fig. 2 plots the changes in national share of solar cell production from 1997 to 2010. Japan‘s share reached a high point of about 50% in 2004. But, it fell to 9% in 2010 [3]. Japan exports about 70% of its production. Since, solar cell modules are bulky and the unit volume value is low, the transportation costs from Japan to Europe significantly reduce the Japanese competitiveness compared to European ones.
Germany increased the share by introducing feed-in tariff (FiT) system, in which electricity produced by using renewable energy sources is bought by the electric utilities at above market prices. Then Germany‘s share ia estimated around 10 % in 2010[3].
China/Taiwan region increased from 5.6 GW in 2009 to 14 GW in 2010, representing a year-over- year increase of 152%, and a market share of 59%, up from 50% in the previous year [3].
The U.S. share fell continuously from 40% of 1997 to 7% of 2007. However, it increased to 14% of 2008 by ―New Green Deal‖ and around 10 % of 2010 including the production at Malaysia factories of First Solar and SunPower [3].
Fig. 1. World solar cell production amount [1], [3].
EFFECT OF NATIONAL POLICY
A. Growing to No. 1 by national policy
Japan begun the R&D of the solar cell after the invention of the world's first solar cell at USA in 1954 [4], and the business has been started for a niche market of electric power supply at remote places, such as a radio relay station and a lighthouse.
However, the "first oil crisis" broke out in 1973 and the threat of the exhausted oil was exposed. And the "Sun Shine Project" was started by Japanese government in July, 1974[4]. The R&D of the solar cell was done in order to alternate the usual electric power as one of the new energy sources. Its target is to reduce the price of 1/100.
0
5000
10000
15000
20000
25000
1 2 3 4 5 6 7 8 9 10 11 12 13 14 15 16 17 18 19 20
系列1
91 92 93 94 95 96 97 98 99 00 01 02 03 04 05 06 07 08 09 10
So
lar C
ell
Pro
du
cti
on
Am
ou
nt
(MW
)
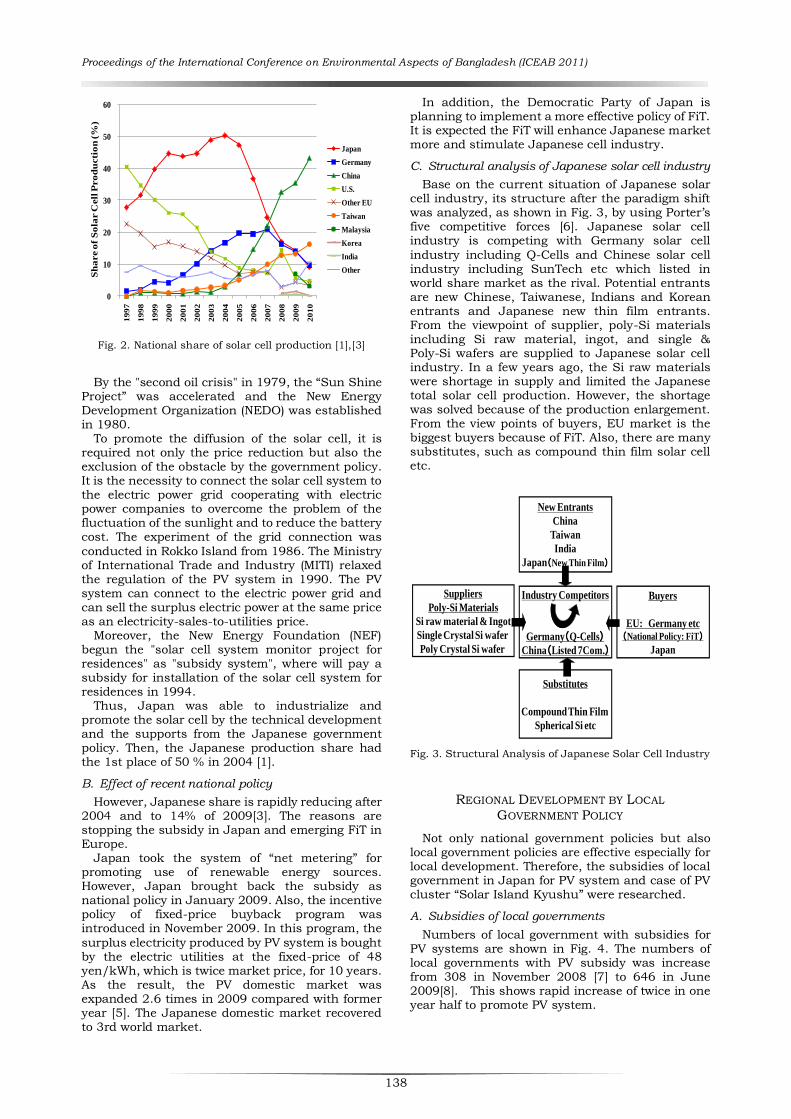
Proceedings of the International Conference on Environmental Aspects of Bangladesh (ICEAB 2011)
138
Fig. 2. National share of solar cell production [1],[3]
By the "second oil crisis" in 1979, the ―Sun Shine Project‖ was accelerated and the New Energy Development Organization (NEDO) was established in 1980.
To promote the diffusion of the solar cell, it is required not only the price reduction but also the exclusion of the obstacle by the government policy. It is the necessity to connect the solar cell system to the electric power grid cooperating with electric power companies to overcome the problem of the fluctuation of the sunlight and to reduce the battery cost. The experiment of the grid connection was
conducted in Rokko Island from 1986. The Ministry of International Trade and Industry (MITI) relaxed the regulation of the PV system in 1990. The PV system can connect to the electric power grid and can sell the surplus electric power at the same price as an electricity-sales-to-utilities price.
Moreover, the New Energy Foundation (NEF) begun the "solar cell system monitor project for residences" as "subsidy system", where will pay a subsidy for installation of the solar cell system for residences in 1994.
Thus, Japan was able to industrialize and promote the solar cell by the technical development and the supports from the Japanese government policy. Then, the Japanese production share had the 1st place of 50 % in 2004 [1].
B. Effect of recent national policy
However, Japanese share is rapidly reducing after 2004 and to 14% of 2009[3]. The reasons are stopping the subsidy in Japan and emerging FiT in Europe.
Japan took the system of ―net metering‖ for promoting use of renewable energy sources. However, Japan brought back the subsidy as national policy in January 2009. Also, the incentive policy of fixed-price buyback program was introduced in November 2009. In this program, the
surplus electricity produced by PV system is bought by the electric utilities at the fixed-price of 48 yen/kWh, which is twice market price, for 10 years. As the result, the PV domestic market was expanded 2.6 times in 2009 compared with former year [5]. The Japanese domestic market recovered to 3rd world market.
In addition, the Democratic Party of Japan is planning to implement a more effective policy of FiT. It is expected the FiT will enhance Japanese market more and stimulate Japanese cell industry.
C. Structural analysis of Japanese solar cell industry
Base on the current situation of Japanese solar cell industry, its structure after the paradigm shift was analyzed, as shown in Fig. 3, by using Porter‘s five competitive forces [6]. Japanese solar cell industry is competing with Germany solar cell
industry including Q-Cells and Chinese solar cell industry including SunTech etc which listed in world share market as the rival. Potential entrants are new Chinese, Taiwanese, Indians and Korean entrants and Japanese new thin film entrants. From the viewpoint of supplier, poly-Si materials including Si raw material, ingot, and single & Poly-Si wafers are supplied to Japanese solar cell industry. In a few years ago, the Si raw materials were shortage in supply and limited the Japanese total solar cell production. However, the shortage was solved because of the production enlargement. From the view points of buyers, EU market is the biggest buyers because of FiT. Also, there are many substitutes, such as compound thin film solar cell etc.
Fig. 3. Structural Analysis of Japanese Solar Cell Industry
REGIONAL DEVELOPMENT BY LOCAL GOVERNMENT POLICY
Not only national government policies but also local government policies are effective especially for local development. Therefore, the subsidies of local government in Japan for PV system and case of PV cluster ―Solar Island Kyushu‖ were researched.
A. Subsidies of local governments
Numbers of local government with subsidies for PV systems are shown in Fig. 4. The numbers of local governments with PV subsidy was increase from 308 in November 2008 [7] to 646 in June 2009[8]. This shows rapid increase of twice in one year half to promote PV system.
0
10
20
30
40
50
60
19
97
19
98
19
99
20
00
20
01
20
02
20
03
20
04
20
05
20
06
20
07
20
08
20
09
20
10
Japan
Germany
China
U.S.
Other EU
Taiwan
Malaysia
Korea
India
Other
Sh
are o
f S
ola
r C
ell
Pro
du
cti
on
(%)
New Entrants
China
Taiwan
India
Japan(New Thin Film)
Industry Competitors
Germany(Q-Cells)China(Listed 7Com.)
Substitutes
CompoundThin Film
Spherical Si etc
Suppliers
Poly-Si Materials
Si raw material & Ingot
Single Crystal Si wafer
Poly Crystal Si wafer
Buyers
EU: Germany etc(National Policy: FiT)
Japan

Proceedings of the International Conference on Environmental Aspects of Bangladesh (ICEAB 2011)
139
B. Case of “Solar Island Kyushu”
Porter described ―Cluster development often becomes particularly vibrant at the intersection of clusters. Here, insights, skills, and technologies from different fields merge, sparking new business. The presence of multiple intersecting clusters further lowers barriers to entry, because potential entrants and spinoffs come from several directions. Diversity of learning stimulates innovation [9].‖
Kyushu is called ―Silicon Island Kyushu‖ and
―Car Island Kyushu‖ because there are many semiconductor companies and car companies are accumulated in Kyushu. Kyushu is the intersection of clusters.
Therefore, PV cluster ―Solar Island Kyushu‖ was researched from perspective of transfer from semiconductor. It includes four thin film solar cell companies and one module company, YOCASOL, as shown in Fig. 5. The thin film solar cells can keep more electric power than the crystal Si solar cell at high temperature condition than. Thus, the thin film solar cell fit to near the Torrid Zone, such as Bangladesh, Thailand, Malaysia, Indonesia and Singapore etc.
Fig. 4. Numbers of Local Governments with PV Subsidy
Source: Author made.
1) Mitsubishi Heavy Industries
It develops tandem type a-Si solar cell. It was developing a Chemical Vapor Deposition (CVD) system for LCD, and it applied this equipment to a-Si solar cell and started the production in the company. The productive capacity will increase to about 118 MW/year by 2009[7].
2) Fuji Electric Systems
It make flexible a-Si solar cell on resin film by role-to-role CVD method. The productive capacity is about 12 MW/year at present and it be planed to increase to about 150 MW/year [7].
3) Honda Soltech
Honda's corporate culture challenges a new compound thin film solar cell of CIGS (Copper Indium Gallium DiSelenide). The productive capacity is about 27.5 MW/year in 2009 [7].
4) Solar Frontier
Solar Frontier, which is a 100% subsidiary of Showa Shell Sekiyu, began research in solar energy in 1978 and commercial production of crystalline silicone modules began in 1983, and research on CIS (Copper Indium and Selenium) technology began in 1993. It is producing the compound thin film solar cell of CIS. The newest plant in Miyazaki, Japan, scheduled to commence operations in 2011, is planned to increased production capability to
about 900 MW/year, which is one of the largest solar cell factories [10].
Fig. 5. PV Cluster ―Solar Island Kyushu‖
C. Local government policy
There are many local government policies to promote PV industries for regional development in Kyushu from semiconductor business.
1) Kyushu
Kyushu Bureau of Economic, Trade and industry established ―Kyushu PV Related Organizations‖ in November 2007. The object is to support the solar cell companies in Kyushu by sharing information and issues and using many support measures for 3 years.
2) Kumamoto Prefecture
Fuji Electric Systems and Honda Soltech are located in Kumamoto Prefecture. Therefore, "Kumamoto Solar and Green Energy Promotion Association" was established in October, 2006 at beginning of Fuji Electric Systems operation. The one of the activities is solar cell idea contest for students of universities and college of technology in Kyushu. The object is to advertise solar cell and create new application of flexible solar cell of Fuji Electric Systems.
3) Miyazaki Prefecture
Solar Frontier is located in Miyazaki Prefecture. Therefore, ―Miyazaki Solar Frontier Vision‖ was established. The basic principle is to create PV base with three functions of manufacturing, electric generation and application including some solar projects.
0
20
40
60
80
100
120
140
160
Ho
kk
aido
To
ho
ku
Kan
to
Ho
ku
riku
&K
oush
inet
u
To
kai
Kan
sai
Ch
ugo
ku
Sh
iko
ku
Ky
ush
u&O
kin
awa
Nov. 2008 June, 2010
Nu
mb
er o
f Lo
cal G
ov
ern
men
ts w
ith
PV
Su
bsid
y
Mitsubishi Heavy
Industries
YOCASOL
Fuji Electric Systems
Honda Soltec
Solar Frontier
(Showa Shell)

Proceedings of the International Conference on Environmental Aspects of Bangladesh (ICEAB 2011)
140
4) Oita Prefecture
There is a ―promotion conference of Ota LSI cluster.‖ Major semiconductor companies, such as Toshiba, Sony, Texas Instruments and NEC, are located in Oita prefecture. A subsidy for regional enterprises to develop solar cell related business from semiconductor business was begun from 2010.
Also, PV working group was established in ―Oita New Energy Industrialization Committee‖ in 2009.
There is a subsidy to develop an application product of solar cell.
From the above case studies of the current local government policies, it is found that key factor for local government to establish the policy is to understand the PV business structure to enter to solar cell business from semiconductor and LCD businesses.
D. SWOT analysis of “Solar Island Kyushu”
The ―Solar Island Kyushu‖ was analyzed by SWOT methods as follows.
1) Strength
- 4 companies are doing PV production with the factory.
- It is easy to obtain technologies & human resources because of many semiconductor companies.
- Strong technologies are held by the
horizontal development of semiconductor technologies.
- It is promising as a solar cell market.
2) Weakness
- The present production share is low. - It focuses on only thin film solar cells.
3) Opportunity
- Environmental consciousness is increasing.
- Solar cell market is rapidly expanding globally.
- It is easy to enter newly by the horizontal development from a semiconductor.
- Policies of a country and local government are active.
4) Threats
- Crystal solar cell companies are expanding the business. (Japan, Germany, China)
- Sharp ―Green Front Sakai‖ of thin film solar cell factory has operated from March 2010.
As the analysis result of the SWOT, it is found that key factor for local government to establish the policy is to understand the PV business structure to enter to solar cell business from semiconductor and LCD businesses.
NIDO INTERNATIONAL CORPORATION
New Energy and Industrial Technology Development Organization (NEDO), which is one of independent administrative institution, actively undertakes the development of new energy and energy-conservation technologies etc. including solar cell technologies. NEDO have done many
international cooperation projects to demonstrate solar cell technologies cooperated with Mongolia, Thailand, Malaysia, China, Indonesia and Singapore etc.
Thus, NEDO is the potential candidate to create a cooperation project with Bangladesh to demonstrate solar cell technology, especially thin film solar cell, which is fit to near the Torrid Zone.
CONCLUSION
Japan began the R&D of the solar cell after the invention of the world's first solar cell at USA in 1954. Japan was able to industrialize and promote the solar cell by the technical development and the supports from the Japanese government policy. Then, the Japanese production share had the 1st place.
What can be learned from Japanese government policies to promote solar cell?
In this paper, national and local government policies were researched focusing on ―Solar Island Kyushu.‖
As the results, it was found that not only national government policies but also local government policies are important especially for regional development.
It is expected that Bangladesh and developing countries use Japanese experiences to promote the solar cell. NEDO is the potential candidate to create a cooperation project with Bangladesh to demonstrate solar cell technology, especially thin film solar cell, which is fit to near the Torrid Zone.
REFERENCES
[1] Sangyo Times. 2010. Outlook of Solar Cell Industry
2011, Sangyo Times.
[2] Nakata, Yukihiko. 2009. Dilemma of Social
Contribution and Market Competition for
Environmental Sustainability. Jour. Environmental, Cultural, Economic & Social Sustainability, 5 (4):
3-30.
[3] PV News May and April 2008, and May 2001.
[4] NEDO. 2007. Why did Japan achieve the world's No.
1 share in solar cells? (Japanese)
[5] Asahi Shimbun. 2010. May 18, 2010.
[6] PE Michael. 1985. Competitive Advantage, The Free
Press.
[7] DBJ [Development Bank of Japan]. 2009. Report on
―Hint to create ―PV Cluster‖ in Kyushu‖ (Japanese).
Development Bank of Japan Inc. Kyushu Branch,
April 2009. Available at:
http://www.dbj.jp/pdf/investigate/area/kyusyu/pd
f_all/kyusyu0904_01.pdf
[8] Kankyo-business. 2011. ―PV subsidy List‖. Available
at: http://www.kankyo-business.jp/topix/solar_
topix_01html
[9] PE Michael. 1998. On Competition, A Harvard
Business Review Book.
[10] Solar Frontier. 2010. Home page of solar frontier.
Available at: http://www.solar-frontier.com/

Proceedings of the International Conference on Environmental Aspects of Bangladesh (ICEAB 2011)
141
A3.007
A Case Study on the Availability of Crop Biomass in the Rural Area
MA Rabbani1*, MA Satter2, E. Inoue3, RI Sarker2
1Graduate School of Bioresource and Bioenvironmental Sciences, Kyushu University, Fukuoka, Japan 2Department of Farm Power and Machinery, Bangladesh Agricultural University, Mymensingh, Bangladesh
3Laboratory of Bioproduction Engineering, Faculty of Agriculture, Kyushu University, Fukuoka, Japan *Corresponding author: e-mail: [email protected]
Abstract This study aimed at assessing the availability of crop biomass in rural areas based on primary data. To collect the
primary data and to study the utilization pattern of crop biomass in farm households, a survey was made through
interviewing eighty-two farmers in two selected villages, under Karimganj Upazilla of Kishoreganj district. Data on
cropped area, production and yield, plant and crop biomass, and utilization as biomass were collected from different
farmers‘ category. It was found that potential crop biomass is 222.57 GJ/Yr per household (16.74 ton/yr per
household). The amount of crop biomass is maximum from cereal crops (158.13 GJ/Yr per household), followed by dry
plant residues, oil seed residues, jute stick, pulse residues and Dhaincha (Sesbania aculeate). The total amount of
potential available biomass from all sources was 271.66 GJ/Yr per household. The average homestead fuel energy
requirement was 83.86 GJ/Yr per household. It was observed that there was surplus crop biomass (69.56 GJ/yr per
household) availability in the study area that was excess than the requirement of the farmers.
INTRODUCTION
Bangladesh, with a total surface area of about 147,570 km2, is inhabited by about 135 million people, making it one of the most densely populated countries in the world [1]. The total annual per capita energy consumption of the country in 1995 was estimated at 8.467 GJ. The shares of commercial energy (coal, oil, gas and hydropower) and biomass fuels were estimated at 3.203 and 5.264 GJ respectively [2]. This is among the lowest per capita energy consumption rate in the world. Commercial energy comprising oil, natural gas, coal and hydroelectricity accounts for about one-third of the total energy consumption. The remaining two-thirds is attributed to non-commercial renewable sources. Out of the different renewable sources, biomass, peat, solar radiation, wind and hydropower can be effectively used in Bangladesh. Biomass comprises material of tree origin, such as fuelwood, charcoal, twigs and leaves; agricultural residues (mainly from rice and wheat plants), paddy husk and bran, bagasse, jute sticks; and animal (cattle) dung. The total amount of biomass fuel consumed in the country in the year 2000 was approximately 45 million tons (Mt) [3]. The country has limited deposits of natural gas. According to Petrobangla, the total recoverable reserves of natural gas in 22 known gas fields are 439 Gm3 of which 110 Gm3 was produced up to June 2000. Net recoverable reserves in July 2000 were 329 Gm3 [2]. Although the gas being used has an impact on the national economy through fertilizer manufacture,
electricity generation and direct energy use in some industries, it will not be economically feasible to supply the gas to the rural areas through pipelines in riverine Bangladesh [3].
Agricultural residues contribute significantly to the biomass sector of Bangladesh. Crop production generates considerable amounts of residues that can be used as energy source. Crop residues can be distinguished into field residues and process residues. Field residues are residues that are left in the field after harvesting. In some cases they are just burned as waste [4]. As the country is expected to remain heavily dependent on biomass resources
for several decades, therefore, it is needed to formulate a crop biomass based rural energy policy for its future sustainable development and environmental protection. On the basis of the above proposition the present study was undertaken with the objectives to assess the biomass sources and energy use pattern in rural areas of Bangladesh and to determine the contribution of biomass on rural energy supply.
MATERIALS AND METHODS
A survey schedule was prepared to collect the various socio-economic aspects, crop biomass production and utilization pattern of the villages. 82 farm-households were surveyed in the study areas. Questions were related to the farmer‘s family description, land ownership, land utilization pattern, cropping system, farming system and other farm activities that are related to biomass production and utilization as they usually practice. For data collection two villages named Digharcolla and Neyamatpur of the union Neyamatpur under the Karimganj Upozilla of the Kishoreganj district were selected. A micro level study about the production of crop biomass and rural energy consumption was carried out for 82 families from the two villages according to the prepared questionnaire. Farmers were selected randomly from the study areas covering various economic groups, shown in Table 1, such as:
Table 1. Farmer‘s Category
Farmer‘s categories according
to the lands ownership
Number of
family %
Landless (less than 0.2 ha) 12 14.63
Small (0.2 ha – 1.0 ha) 26 31.71
Medium (1.0 ha – 3.0 ha) 30 36.59
Large (3.0 ha and above) 14 17.07
Total 82 100
A. Agricultural Residues Production
The sources of biomass are divided into four groups such as: Field crop residue, Leaves & twigs,

Proceedings of the International Conference on Environmental Aspects of Bangladesh (ICEAB 2011)
142
Livestock and Kitchen by product. Biomass from different agricultural crops such as rice (Aus, Aman and Boro), wheat, pulses, jute, oilseeds, groundnut, sugarcane, etc and some vegetable crops were selected.
The crops produce: Crop residues, which were considered in the estimation, were as follows:
(i) Rice Straw: Total rice straw production is
estimated by following equation:
RS = P(AU)LCLS(AU)LC+P(AM)BS(AM)B +
P(AM)LT S(AM)LT+P(BO)LCLS(BO)LCL
+P(BO)HYVS(BO)HYV
where, RS = Total rice straw production in a year, ton
P(AU)LCL = Production of local Aus, ton
P(AM)B = Production of broad casting Aman, ton
P(AM)LT = Production of local transplanted Aman, ton
P(BO)LCL = Production of local Boro, ton
P(BO)HYV = Production of high yielding variety Boro, ton
S(AU)LCL = Co-efficient of straw of local Aus,
S(AM)B = Co-efficient of straw of broad casting Aman,
S(AM)LT = Co-efficient of straw of local T. Aman,
S(BO)LCL = Co-efficient of straw of local Boro and
S(BO)HYV = Co-efficient of straw of HYV Boro.
(ii) Rice Husk: Total rice husk production is
calculated by the following formula: Rh = P (R) x S (R h)
where, Rh = Total rice husk production in a year, ton
P(R) = Total rice production in a year, ton and
S(Rh) = Co-efficient of rice husk
(iii) Jute Sticks: Total jute sticks production is calculated by the following formula:
Js = Jp x Sj where,
Js = Total jute stick production in a year, ton
Jp = Production of jute fibre in a year, ton and
Sj = Co-efficient of jute stick.
(iv) Other Crop Residues: Other crop residues production refers to the residues of the pulses, oilseeds, spices, vegetables, etc. and is estimated by the following formula:
CRother (i) =Pother(i) x Sother (i) where,
CR other (i) = Production of other crop residues by ith crop
in a year, ton
Pother (i) = Other crop production ith crop) in a year, ton
and
S other (i) = Co-efficient of other crop (ith crop)
Biomass from droppings leaves and twigs: The estimation of natural dropping leaves and twigs were based on gathering by the farmer. By field study data amount of gathered leaves and twigs per household per day was determined and then estimated the amount by year basis by multiplying the amount by the calorific value of the leaves and twigs.
Biomass from livestock: Total biomass from livestock used as fuel was calculated by the following formula:
Wcd =
n
1idpdpdp
n
1idpdpdpdpdpdp
PGC
fP(i)f(i)G(i)f(i)C
where, wcd = Total cow dung used as fuel of a certain class, ton
cdp = Production of dried cow- dung of (i) family, ton
Gdp = Production of dried goat faeces of (i) family, ton
Pdp = Production of dried poultry excreta of (i) family, ton
fdp (i) = Percentage of dry dung used as fuel by (i) family,
n = Number of family of a certain class.
The total number of cattle present in the household was recorded. The quantity of cowdung (dry basis) was calculated by multiplying of the cowdung production per head per year and the number of cattle in the household. The cowdung (dry basis) quantity per head per year was estimated 0.49 t for Mymensingh area [5]. The dry biomass obtained from goat faeces per household in the study area was also estimated by same method used in cattle. The quantity of dry biomass was estimated to be 19.25 kg per goat per year [6]. Similar method was also used for estimation of poultry excreta. According to Uddin, M. S. [7] average per head poultry excreta production was estimated 10.95 kg per year.
B. Homestead Energy Requirements
Homestead energy requirements for a particular household were estimated through different daily activities performed by the farmers. The activities included energy for cooking, parboiling of rice, burning in pottery works, lighting purposes, making smoke in the cowshed, room heating and others.
Total fuel consumption for cooking was calculated by using the following formula:
TFcon = (i)H(i)W fuel
n
1ifuel
where, T Fcon = Total fuel consumption for cooking, kJ/ year.
Wfuel (i) = Weight of (i) fuel for cooking, Kg/ year.
Hfuel (i) = Heating value of (i) fuel, kJ/kg.
n = Number of fuel type.
RESULTS AND DISCUSSIONS
The data for the study were compiled, tabulated and analyzed in accordance with the objective of the study. Statistical means such as number and percentage distribution, range, mean and standard deviation were used. To find out the relationships between selected variables of the farmers, Pearson‘s product moment correlation was used.
Fig. 1. Potential Amount of Biomass According to
Farmers Category (GJ/Yr-household)
0
100
200
300
400
500
Large Medium Small Landless
Field crop Animal Excreta
Leaves & Twigs Kitchen by-product
Farmer’s category
Po
ten
tial
bio
mas
s (G
J/y
r)
0
100
200
300
400
500
Large Medium Small Landless
Field crop Animal Excreta
Leaves & Twigs Kitchen by-product
Farmer’s category
Po
ten
tial
bio
mas
s (G
J/y
r)

Proceedings of the International Conference on Environmental Aspects of Bangladesh (ICEAB 2011)
143
A. Sources of Biomass
The villagers used crop field as the major source of fuel. The degrees of contribution of biomass fuel from the sources were not same for all farm categories. The sources of biomass in the study area came from different field crop residues which were cereals (Aus, Aman, Boro & Wheat), Pulses (Gram), Jute, oil seeds (mustard, groundnut, etc) and from different vegetable crops. Most of the villagers met up their biomass fuel from the crop residues (straw, husk, etc) followed by dry cowdung, leaves and twigs, kitchen by-product, etc. As there was no facility of gas, most of the farmers depend on natural sources of biomass. For lack of community forests the farmer‘s collected wood fuel from the homestead forestry.
Fig. 2. Crop Biomass Availability According to
Farmers Category (GJ/Yr-household)
B. Availability of Biomass
This research had been conducted in two villages, based on appropriate proportions of sample farmers indicated that the major source of biomass energy was the field crop residues followed by kitchen by-product, leaves and twigs and animal excreta. Available crop biomasses in the study areas were paddy straw, rice husk, jute stick, dhaincha (Sesbenia spp.) stick, mustard straw, groundnut straw, vegetable residues, etc. Potential amount of the biomass according to the farmer‘s category are shown in Fig. 1. As it is shown in figure, the availability of potential biomass increases according to the farmer‘s category. The average amount of potential biomass is 271.66 GJ/Yr households. The potential amount of biomass is maximum from the field crop 222.57 GJ/Yr household followed by leaves and twigs, kitchen by product and animal excreta. The potential amount of total biomass is greater for larger farmers having large land areas. The potential amounts of biomass from the leaves and twigs and from the animal excreta are comparatively greater for landless and small farmers, as they have fewer amounts of land properties. The amount of kitchen by product obtained from each category depends on the number of family member and the types of vegetables they consume. Average 17.14 GJ/Yr kitchen by-products per household is obtained from the study area. Availability of dry cowdung in the study area is 13.37 GJ/Yr-household.
Fig. 2 illustrates the availability of the crop biomass according to the farmer‘s category. Availability of potential crop biomass is 222.57 GJ/Yr-household. Among the entire farmers category the potential amount of crop biomass is maximum from cereal crops, which was 158.13 GJ/Yr-household, followed by dry plant residues, oil seed residue, jute stick, pulse residue and dhaincha.
C. Homestead Energy Requirement
The homestead energy requirement included the energy for cooking parboiling, room heating and making smoking in the cowshed and for the lighting purpose. Fig. 3 states the homestead energy requirement according farmer‘s category. As it is in the figure, the average homestead energy requirement was 83.86 GJ/Yr-household. Homestead energy requirement was almost same for large and medium farmer where as it decreases for small and landless farmers accordingly. Energy requirement was maximum for cooking, which accounts 57.68 GJ/Yr-household. Energy requirement for parboiling increased according to the farmer‘s category. For landless farmers it was 3.48 GJ/Yr-household due to smaller cultivable land where it was 13.64 GJ/Yr-household for the large farmer.
Fig. 3. Homestead Energy Requirement According to
Farmers Category (GJ/Yr-household)
Fig. 4 Crop biomass utilization according to the farmer‘s
category (GJ/yr-Household)
0
50
100
150
200
250
300
Large Medium Small Landless
Cereal Pulses
Jute Oil seedsDhaincha Othres
Cro
p b
iom
ass
avai
lab
ilit
y (
GJ/
yr)
Farmer’s category
0
50
100
150
200
250
300
Large Medium Small Landless
Cereal Pulses
Jute Oil seedsDhaincha Othres
Cro
p b
iom
ass
avai
lab
ilit
y (
GJ/
yr)
Farmer’s category
0
20
40
60
80
Large Medium Small Landless
Cooking ParboilingIn the cowshed Room heatingLighting Others
Farmer’s category
En
erg
y r
equ
irem
ent
(GJ/
yr)
0
20
40
60
80
Large Medium Small Landless
Cooking ParboilingIn the cowshed Room heatingLighting Others
Farmer’s category
En
erg
y r
equ
irem
ent
(GJ/
yr)
0
20
40
60
80
100
120
Large Medium Small Landless
Straw Husk
Jute Others
Dhaincha
Farmer’s category
Cro
p b
iom
ass
use
d a
s fu
el (
GJ/
yr)
0
20
40
60
80
100
120
Large Medium Small Landless
Straw Husk
Jute Others
Dhaincha
Farmer’s category
Cro
p b
iom
ass
use
d a
s fu
el (
GJ/
yr)
HG (c)
HG (c)

Proceedings of the International Conference on Environmental Aspects of Bangladesh (ICEAB 2011)
144
Fig. 4 narrates crop biomass utilization in the study area according to farmer‘s category. The utilization of crop biomass was 153.01 GJ/Yr-household in the study area where as the potential biomass availability from field was 222.57GJ/Yr-household. Thus, there remained a huge amount of crop biomass which was wasting due to ignorance or storage problem. Among the crop biomass rice straw utilization was maximum which accounted 91.93 GJ/Yr-household followed by dry crop residues, rice husk, jute stick and Dhaincha. Large farmers used crop biomass for diversified works such as fuel, animal feed animal bedding, mulching, housing materials etc. The rice bran was mainly used as animal feed. Most of the crop biomass was used as fuel for small and landless farmers.
CONCLUSION
Bangladesh is one of the most energy-starved countries in the world Biomass is a very important source of energy in rural areas. Rural people are fully dependent on biomass energy for their daily energy needs. The biomass (such as tree twigs, leaves, firewood, crop residues, jute sticks, rice husk. rice straw. cow dung, etc.) constitutes about 60% of our total energy consumption. In this study, huge amount of crop biomass was found unused due to ignorance of farmers and lack of storage facilities. So, the farmers are needed to educate about the multipurpose use of the crop biomass and modern and scientific storage facilities. Serious measure by GO and NGO‘s are necessary to recycle the huge surplus crop biomass through briquetting, solid fuel and so on.
Because of the use of firewood our forest reserve is dwindling. So, efficient use of other biomass resources should be encouraged. Improved cooking stoves are such efficient devices. The rural people specially the woman should be trained for the construction and maintenance of the improved-cooking stoves. Fast growing plants like Dhaincha, Eucalyptus, Epil-Epil, Bogamedula, etc. may be planted to save the community forest.
However, many households may need financial support for installation of biogas plant. So, biogas plant may be introduced with the help of credit supply.
The most densely populated country Bangladesh is heavily dependent on agriculture and natural resources for the major sources of energy. The shortage of traditional energy supply and the high demand for these are the growing concern of the economy and the environment. The current efforts of plantation and conventional energy development are not enough to overcome growing issue. Under the prevailing circumstances massive program needs to be undertaken to search for alternative sources of energy along with intensive an afforestation programme. In order to make these efforts a success sufficient technical and financial incentives need to be provided.
REFERENCES
[1] BBS. Statistical yearbook of Bangladesh. Bangladesh
Bureau of Statistics, Statistics & Division, Ministry of
Planing Govt. of Bangladesh. 2003.
[2] Islam, M.N. Energy Crisis: Bangladesh Aspects, Gono
Mudran Limited, Shahid Rafique-Jabbar Highway,
Nayarhat, Dhaka-1344, Bangladesh. 2001.
[3] Khan, A.H.M.R. ‗‗Renewable energy research in
Bangladesh and contribution of BCSIR‘‘, paper
presented at workshop on The Emerging Role of Science and Information & Communication Technology in Bangladesh Development Context, BCSIR, Dhaka,
24-25 June, 2002.
[4] RWEDP. Regional Wood Energy Development
Program in Asia. Report No.34. GCP/RAS/154/NET.
2001.
[5] Chowdhury, S.A., Tareque, A.M.M. and Akbar, M.A.
Bangladesh Journal of Agricultural Science. 1987.
Vol. 14 (1), pp.21-29.
[6] Shahjalal, M., Bangladesh Journal of Agricultural Science. 1998. Vol. 21(1), pp.61-69.
[7] Uddin, M.S. The effect of different dietary protein and
energy levels on the performance of layer strain
chicken in Bangladesh. Ph. D. Thesis, Department of
Animal Nutrition, BAU, Mymensingh. 1991.

Proceedings of the International Conference on Environmental Aspects of Bangladesh (ICEAB 2011)
145
A3.008
Green Energy from Bamboo (Bambusa vulgaris) by Microbial Fuel Cell
M Azizul Moqsud1,2 and Kiyoshi Omine2
1Member, BENJapan; e-mail: [email protected] 2Department of Civil Engineering, Kyushu University, Fukuoka, Japan
Abstract Bamboo (Bambusa vulgaris) is one of the widely grown plants in this world and it is used for various human activities
from food to construction material. In this study, an innovative resource recovery from bamboo is considered as
generating the bio-electricity by using microbial fuel cell method in the laboratory. The bamboo chips were collected
from Koga-shi, Fukuoka prefecture, Japan as the leftover of cleaning up operation of a bamboo mountain. The
rectangular box (10cm each) was used as one chamber microbial fuel cell using carbon fiber as electrodes. The data
logger stored the data of voltage in every 20 minutes in the constant room temperature at 250C for 45 days. It was
observed that voltage increased rapidly after anaerobic condition confirmed. The peak voltage (around 500 mV) was
generated after four weeks. The bamboo chips showed different trend of voltage generation with compare to kitchen
garbage in MFC.
INTRODUCTION
Microbial fuel cells (MFCs) are bio-electrochemical transducers that convert microbial reducing power (generated by the metabolism of organic substrates), into electrical energy [1]-[3], [13]. They use the available substrates from renewable sources and convert them into harmless by-products with simultaneous production of electricity [8]. Resource recovery and recycling from waste is a burning question both in the developing countries as well as industrialized countries. For example, the annual organic waste generated from the food industry and kitchen garbage in Japan is about 20 million tons per year [6]. Most of this waste is directly incinerated with other combustible waste, and the residual ash is disposed of in landfills. However, incineration of this water-containing waste is energy-consuming
and results in the production of dioxins. Instead of considering the organic waste as waste, it should be considered as valuable biomass for resource recovery. The scarce of electricity is one of the major hinders for development of Bangladesh. Depletion of energy reserves, global warming and the concern of environmental pollution are inspiring the search for new environment-friendly and sustainable energy production methods all over the world. Moreover, the recent Fukushima nuclear power plant accident in Japan after the east Japan earth quake and tsunami has become a great concern to find the alternate source of electricity than the traditional one. Both in developing countries and the industrialized countries people are trying to find a way how to collect the maximum recovery of resource from the unwanted or discarded materials. So far, bamboo is used for various purposes such as to build a house, to make various utilities for daily uses. However, the leaf and small branches of the bamboo are not properly reused so far. Bamboo is a fast growing plant and sometimes it can grow around 100 cm within 24 h [14]. In Bangladesh, various types of bamboos are growing in the eastern part mainly in Chittagong, Sylhet and some parts of Mymensing. According to united nation‘s statistics, around 1.6 Billion people are living without electricity in the present world [15]. In some developing countries, they can provide half of the demand of the electricity. The scarce of electricity is one of the major hinders for development. So far there had not been any
research work conducted related to MFC by using the bamboo waste. So the objective of this study is to evaluate of bio-electricity generation by reusing the bamboo chips so that the organic waste can be recycled as well as give some sorts of solution to the electricity scarce population.
SAMPLE COLLECTION
Bamboo is the common term applied to a broad
group (1250 species) of large woody grasses, ranging from 10cm to 40 m in height. Already in everyday use by about 2.5 billion people, mostly for fiber and food within Asia, bamboo may have potential as a bioenergy of fiber crop. In this study, the bamboo chips were collected from Koga city, Fukuoka prefecture, Japan. In Japan the bamboo is grown in many places especially in the mountain regions. The traditional Japanese culture (both food and festival) the bamboo is widely used. However, sometimes the rapid growth of this bamboo has created some problems to the environment. The Bamboo Mountains in Koga city area were over burdened by the rapid growth of bamboo. This extensive growth of the bamboo caused problem for the other trees such as cider. The rain water could not reach properly in the ground and also caused soil erosion. So the bamboos were cut and the leaves were made into small pieces by the grinder machine and left on the mountain for possible biodegradation. The chips were rich with green leaves as well as brown barks of the bamboo which indicated the possible sources of nitrogen and carbon for the growth of bacteria in Microbial Fuel Cell.
Fig. 1. Bamboo leaves and small barks are grinding

Proceedings of the International Conference on Environmental Aspects of Bangladesh (ICEAB 2011)
146
Fig. 2. MFC test in the laboratory
MATERIALS AND METHODS
A rectangular (10 x 10 cm) acrylic container was used in the laboratory as a cell. The bamboo leaves and chips of 120 gm mixed with water 80g and 15g effective micro-organisms were blended properly. The mixed sample then placed in the container. Carbon fibre was used for both anode and cathode [10]. The anode was placed inside the sample and cathode was placed on the top. Both the anode and cathode was connected with a data logger (Midilogger GL200, Graphtec) and a fix resistance (51 Ω). A filter paper was used to separate the anode and cathode. The data logger was set to measure the voltage and temperature data in every 20 minutes interval. The oxygen variation during the degradation was also calculated by using the voltage logger (HIOKI 3645). The stored data were collected and analysis after 45 days. The laboratory test was conducted in a constant room temperature of 250C. Figure 2 illustrates the laboratory test for MFC. So far, kitchen garbage or other organic materials were used as the biofuels in microbial fuel cell; however, this is the first time effort to use bamboo waste as the raw material for MFC.
Fig. 3. Variation of voltage with duration
Electrode output was measured in volts (V) against time. The current I in Amperes (A) was calculated using Ohm‘s law, I= V/R, where V is the measured voltage in volts (V) and R is the known value of the external load resistor in Ohms. From this it is possible to calculate the power output P in watts (W) of the MFCs by taking the product of the voltage and current i.e. P= I x V. Current density was calculated using I = V/aR, where a is the electrode surface area.
RESULTS AND DISCUSSIONS
Figure 3 illustrates that the variation of voltage with duration. The voltage (V) increased gradually but slowly in the initial time (2 weeks), after that it increased gradually but faster than initial stage and finally reached the peak after 4 weeks. In the initial stage the bacteria got ample of food and their activities increased very rapidly however the voltage did not increased at that time as the presence of air inside the bamboo chips. After the anaerobic condition prevails the voltage increased sharply during that stage. The peak voltage reached around 500 mV by using the bamboo chips. The peak voltage showed considerable higher value by comparing others value stated in other literature by using cutting grass and mixed with leaf mold [10] however it showed smaller than when used kitchen garbage [9].
Fig. 4. Polarization curve in MFC test
Figure 4 shows the polarization curve of the MFC by using the bamboo waste. A polarization curve is used to characterize current as a function of voltage. By changing the circuit external resistance a new voltage can obtain, and hence a new current at that resistance. Therefore, to obtain a polarization curve a series of different resistance on the circuit was used, measuring the voltage at each resistance. The polarization curve shows how well the MFC maintains a voltage as a function of the current production.
Fig. 5. Variation of oxygen with duration
Fig. 5 illustrates the variation of oxygen density with duration inside the biomass of MFC. It is found that oxygen density decreased sharply after initial (2 weeks) time. After that oxygen density became

Proceedings of the International Conference on Environmental Aspects of Bangladesh (ICEAB 2011)
147
constant. In the lower range of oxygen density, the voltage output was increased as the most of the anaerobic bacteria became active at that time.
Fig. 6. Variation of power density with duration
The power output data over duration is shown in Fig. 6. It is seen that power output followed the same pattern of voltage variation i.e. increased gradually but slowly in the initial time (2 weeks), after that it increased gradually but faster than initial stage and finally reached the peak after 4 weeks and reached the value of around 0.5 W/m2. The microbial activities influenced the generation of higher quantity of electricity in the initial stage. After the depletion of foods for the micro-organisms their activities also reduced and the generation of power reduced significantly. Energy, in any form, plays the most important role in the modern life and we need energy, especially electrical energy in our
daily needs. Depletion of energy reserves, global warming and the concern of environmental pollution are inspiring the search for new environment-friendly and sustainable energy production methods. In MFCs utilize bio-electrochemical processes of bacteria so that electrical energy is directly recovered from biodegradable compounds. In a MFC system, internal energy loss accounts for a significant element that inherently determines the scale of magnitude in power generation [9]. Renewable bio-energy is viewed as one of the ways to alleviate fuel needs of the future and to overcome the crisis of global warming. In this direction bioelectricity production employing microbial fuel cell (MFC) has generated considerable interest in both basic and applied research in recent years. However, by using the bamboo waste to generate electricity in MFC has not attracted the researchers before.
CONCLUSION
The organic waste produced from bamboo of can be recycled as Bio-electricity generation. The small amount of electricity is also necessary for the electricity scarce developing countries. The MFCs by using the bamboo waste is proved to be a good way to green electricity generation as well as the recycle of waste to maintain the healthy and pollution free environment. The by-product of the electricity generation in MFC by composting method can be used as soil conditioner after further treatment which is another way to serve the agricultural based nation. Though the amount of electricity is few in MFC by using bamboo waste
however it is very much needed for the future green energy era as bamboo is an abundant source of biomass in many countries.
REFERENCES
[1] RM Allen, HP Bennetto. 1993. Microbial Fuel cells.
Electricity production from carbohydrates. Journal of Applied Biochemistry and Biotechnology, 39-40:
27-40.
[2] HP Bennetto.. 1984. Microbial fuel cells. In: Life
chemistry reports. London: Harwood Academic; pp.
365-453.
[3] W Habermann, EH Pommer. 1991. Biological Fuel
Cells with sulphide storage capacity. Journal of
Applied Microbial Biotechnology, 35: 128-133.
[4] SW Hong, I Chang, Y Choi and T Chung. 2009.
Experimental evaluation of influential factors for
electricity harvesting from sediment using microbial
fuel cell. Bioresource Technology; 100: 3029-3035.
[5] IA Ieropoulos, J Greenman, C Melhuish and J Hart.
2005. Comparative study of three types of microbial
fuel cell. Enzyme and microbial technology, 37:
238-245.
[6] [Y Koike, M An, Y Tang, T Syo, N Osaka. 2009.
Morimura S and Kida K. Production of fuel ethanol
and methane from garbage by high-efficiency
two-stage fermentation process. Journal of Biosciences and Bioengineering, 108: 508-512.
[7] BE Logan and JM Regan. Electricity-Producing
Bacterial Communities in Microbial Fuel Cells.
Trends Microbiology, 14: 512-518.
[8] Y Mohan, SM Kumar and D Das. 2008. Electricity
generation using microbial fuel cells. International
Journal of Hydrogen Energy,. 33: 423-426.
[9] MA Moqsud, MH Rahman, S Hayashi and YJ Du.
2008. An assessment of modified composting barrel
for sustainable organic waste management in
Bangladesh. Journal of Solid Waste Technology and Management, 34(1): 35-46.
[10] K Omine, N Yasufuku and T Kanegae. 2009.
Development of compost type microbial fuel cell with
anaerobic biodegradation. The 2nd Microbial fuel cell
conference at Gwangju Institute of science and
technology (GIST), Korea.
[11] GTR Palmore, GM Whitesides. 1994. Microbial and
enzymatic biofuel cells. In: Enzymatic conversion of
biomass for fuels production. Oxford University Press,
pp. 271-290.
[12] L Schamphelaire, K Rabaey, P Boeckx, N Boon and W
Verstrate. 2008. Outlook for benefits of sediment
microbial fuel cells with two bio-electrodes. 1(6):
446-462.
[13] JL Stirling, HP Bennetto, GM Delaney, JR Mason, SD
Roller, K Tanaka . 1983. Microbial fuel cells. Journal of Biochemistry Society Trans., 11:.451-453.
[14] Online resource. http://en.wikipedia.org/wiki/
Bamboo
[15] Online resource. http://answers.google.com
/answers / threadview?id=46881

Proceedings of the International Conference on Environmental Aspects of Bangladesh (ICEAB 2011)
148
A3.009
Wind Energy Potentials in Bangladesh and Few Proposals
Mahmud Hasan*, Saiful Islam and Md. Nizam Sayeed
Department of Applied Physics, Electronics & Communication Engineering, University of Dhaka, Bangladesh.
e-mail: [email protected]*, [email protected], [email protected]
Abstract Whole world is now trying to develop the renewable energy sector and wind energy is one of the most reliable, clean and
rich renewable energy form. Though adequate measures haven‘t taken place but Bangladesh has a great potentiality of
producing energy from wind because of its geographical position. In this study we tried to present some potential areas
of Bangladesh based on data taken from different surveys conducted by different institutions. And we also tried to say
about various types of wind mills that will be suitable for specific areas.
INTRODUCTION
Bangladesh lies between latitudes 200 and 270 N
and longitudes 880 and 930 E. She has 720 Km long
coast line and many small islands in the Bay of
Bengal, where strong south westerly trade wind
blows in the summer and gentle north-easterly
trade wind in winter. The factors which affect the
nature of the wind close to the surface of the earth
are: Latitude of the place, Altitude of the place,
Topography of the place, Scale of the hours, months
or years etc. In Bangladesh we have found from the
previous studies that wind speed is higher in
summer and lower in winter and in rainy season it
is totally uncertain, sometimes strong stormy wind
and sometimes mild breeze. Moreover, in a day,
wind speed is highest in the afternoon and lowest at
night. Previous studies from 20 wind monitoring
stations of Bangladesh meteorological department
(BMD) have shown that off-shore areas have
sufficient wind speed to produce electricity in
Bangladesh.
POTENTIAL AREAS
Wind Power Density is one of the most reliable
ways to measure the potentiality of an area. The
formula to calculate wind power density is given by-
∫ ( )
… … … … …. … … (1)
Where, ρ= air density
T= specific time period and
v= wind speed.
If we consider ρ constant, accepting some
percentage of error, then the equation reduces into-
… … … … …. … …… … … (2)
Table-1 shows us some potential areas in
Bangladesh, their annual average wind speed and
respective wind power density (W/m2). From table-1
it is seen that Patenga and Thakurgaon are most
promising areas. Besides other areas except
Rangamati can be utilized as a good source of wind
energy.
Table 1. Average wind speed and available wind power
density for several areas [2]
Observation
Stations
Average Wind
Speed (m/s)
Available wind power
Density (W/m2)
Thakurgaon 6.59 171.73
Patenga 7.48 251.14
Rangamati 2.15 5.98
Satkhira 4.37 50.09
Teknaf 3.17 19.13
Kuakata 4.52 55.41
Hatiya 3.14 31.40
Saint Martin 4.71 62.70
kutubdia 4.40 51.11
PROPOSALS
In Thakurgaon and Patenga we can establish large wind farms by using high speed two rotor wind turbine and supply electricity to the grid. This type of high speed rotors have good power efficiency from 0.40 to 0.48 in the tip speed ratio from 4 to 7 which we will be able to see in fig-1.These types of rotors are widely being used everywhere now-a-days. In the fig-1, Cp= Power efficiency and tsr = tip speed ratio.
Fig. 1. Power efficiency vs. tip speed ratio [1].
Saint Martin and kuakata are two most beautiful tourist spots of Bangladesh. Though they are promising areas of wind energy, our government is not willing to set up any wind farm there for the

Proceedings of the International Conference on Environmental Aspects of Bangladesh (ICEAB 2011)
149
sake of the tourism. So, we can use wind turbine there in small scale to meet up their internal demands and two/three blade type rotors are also suitable for those places with high available wind speed. And these type of rotors are efficient in wind speed around 4.5 m/s.
In Kutubdia our Government has established a 1MW wind farm using high speed three rotor wind turbines where almost 12000 people have been taken under this project. But recently due to strong tidal wave the embankment for protecting the project was damaged badly and the total project is under threat.
Fig. 2. High speed two rotor wind turbine
Fig. 3. Three rotor type wind turbine
In Satkhira average annual wind speed is 4.37 m/s. char (river-side rural area) areas of Satkhira are too much deprived of electricity and most of all pure drinking water. Dutch Four-Arm type wind turbine would be perfect for this region to produce electricity and pump out water for drinking and irrigation because these type of rotors are highly efficient in tip speed ratio around 3 m/s.
Similarly Dutch Four-Arm type wind turbine can also be used in Teknaf and Hatiya in large scale to produce electricity where the average annual wind speed is 3.17 m/s and 3.14 m/s respectively.
Mountain areas of Bangladesh like Rangamati, Bandarban, Khagrachari are totally cut-off from national grid. Promising data to establish wind farm there hasn‘t been found yet, but their sufferings can be minimized by using vertical axis Savonius type rotor which works efficiently in low wind speed. Savonius type rotor has highest power efficiency of 0.18 which we can see from fig. 1. Electricity produced by this type of rotor can be used for small functions like-battery charging, using refrigerator, TV, light bulbs, drive mowing machines etc. It can function in wind speed like 2 m/s.
Fig. 4. Dutch four arm type wind turbine
Fig. 5. Vertical axis wind turbine
American multiblade type rotor can be used in different areas as it has moderately good power efficiency which is about 30%.
Darrieus type machines haven‘t suggested here because it has several disadvantages which can

Proceedings of the International Conference on Environmental Aspects of Bangladesh (ICEAB 2011)
150
cause many losses to the system. It needs external system to start up, establishment cost is high and as it encounters varied wind flow from all directions which cause vibratory stresses and thus affect the structure.
CONCLUSIN
Two wind farms have been established by our government in Patenga (0.90 MW) and in kuakata (1 MW) under Bangladesh Power Development Board (BPDB). Local Govt. Engineering Department (LGED) has installed wind-solar hybrid system (10 KWP) in Saint Martin‘s island. A small unit has also been installed in kuakata (400 W) by LGED. Several Non Govt. Organizations (NGOs) like Grameen Shakti, BRAC, have taken some wind energy program, some of which are already functioning. But we need revolutionary attempts to minimize all the sufferings and produce maximum of our energy from the renewable energy sector. Our neighboring country India has gone far ahead in renewable energy sector, especially on wind energy. They‘re generating 1.6% of total power from wind and have become 5th largest country with installed wind power capacity [6].
However, our Govt. has taken some initiatives and improved their policy about wind energy. Income taxes for commercial production of renewable energy has been exempted from 2008 for next five years [7]. On a small scale, up to a few Kilo-Watts, system is less costly. On a large scale costs can be competitive with conventional electricity and lower costs could be achieved by mass production using our man power and resources.
REFERENCES
[1] GD Rai. Solar Energy Utilisation (5th ed.). Khanna
publishers, New Delhi. pp. 580-593
[2] SI Khan, MU Mahfuz and T Aziz. 2002. Prospect of
Hybrid Wind System in Bangladesh (Thakurgaon). Second International Conference on Electrical & Computer Engineering, ICECE 2002, Dhaka, Bangladesh.
[3] MN Hoque, SK Nandi and HR Ghosh. 2010. Wind
resource assessment for southern part of
Bangladesh. As. J. Energy Env., 11(01): 1-9.
[4] ESSN. 2005. Energy Self Sufficiency Newsletter p.17.
Available at: http//www.otherpower.com/
windbasics2.html
[5] A Hossain. Wind Energy in Bangladesh. BAEC,
Dhaka.
[6] Wikipedia: Agriculture in Bangladesh, Available at:
http://en.wikipedia.org/wiki/Agriculture_in_Bangla
desh.
[7] Power Division. 2005. Renewable energy. Ministry of
power, Energy and Mineral resources, Govt. of
Bangladesh. Available at: http://www.powerdivision.
gov.bd/index.php?page_id=271.
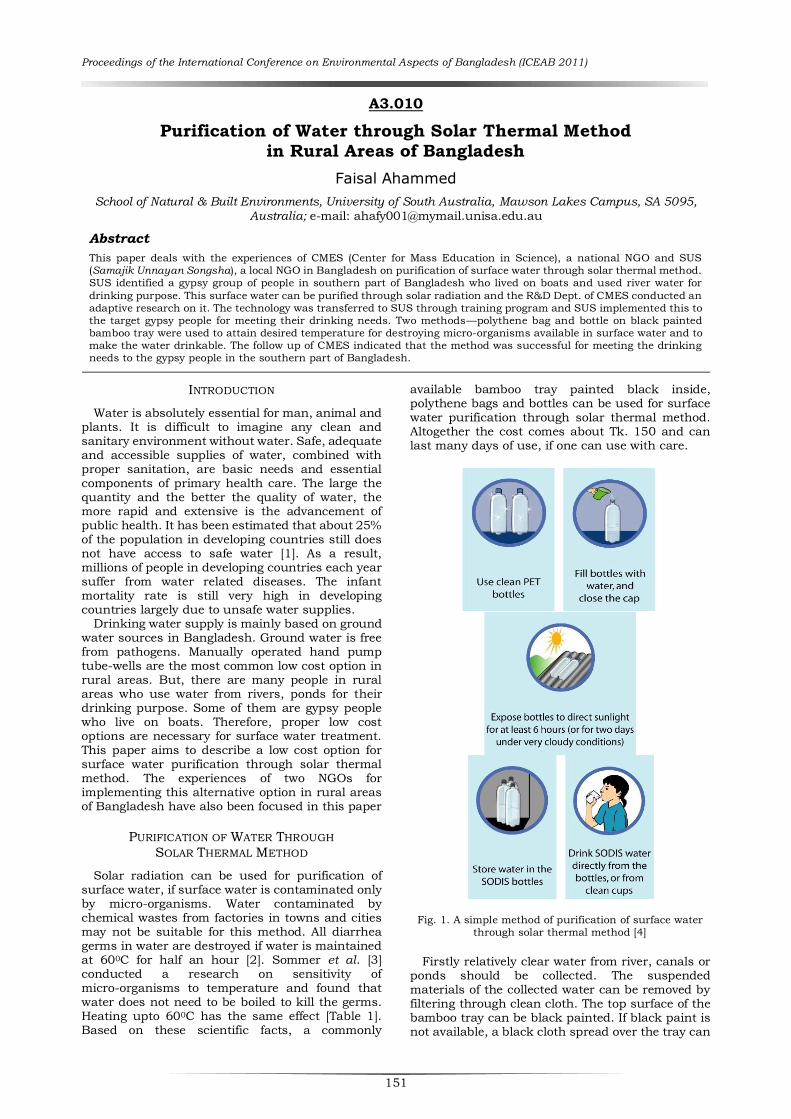
Proceedings of the International Conference on Environmental Aspects of Bangladesh (ICEAB 2011)
151
A3.010
Purification of Water through Solar Thermal Method in Rural Areas of Bangladesh
Faisal Ahammed
School of Natural & Built Environments, University of South Australia, Mawson Lakes Campus, SA 5095,
Australia; e-mail: [email protected]
Abstract This paper deals with the experiences of CMES (Center for Mass Education in Science), a national NGO and SUS
(Samajik Unnayan Songsha), a local NGO in Bangladesh on purification of surface water through solar thermal method.
SUS identified a gypsy group of people in southern part of Bangladesh who lived on boats and used river water for
drinking purpose. This surface water can be purified through solar radiation and the R&D Dept. of CMES conducted an
adaptive research on it. The technology was transferred to SUS through training program and SUS implemented this to
the target gypsy people for meeting their drinking needs. Two methods—polythene bag and bottle on black painted
bamboo tray were used to attain desired temperature for destroying micro-organisms available in surface water and to
make the water drinkable. The follow up of CMES indicated that the method was successful for meeting the drinking
needs to the gypsy people in the southern part of Bangladesh.
INTRODUCTION
Water is absolutely essential for man, animal and plants. It is difficult to imagine any clean and sanitary environment without water. Safe, adequate and accessible supplies of water, combined with proper sanitation, are basic needs and essential components of primary health care. The large the quantity and the better the quality of water, the more rapid and extensive is the advancement of public health. It has been estimated that about 25% of the population in developing countries still does not have access to safe water [1]. As a result, millions of people in developing countries each year suffer from water related diseases. The infant mortality rate is still very high in developing countries largely due to unsafe water supplies.
Drinking water supply is mainly based on ground water sources in Bangladesh. Ground water is free from pathogens. Manually operated hand pump tube-wells are the most common low cost option in rural areas. But, there are many people in rural areas who use water from rivers, ponds for their drinking purpose. Some of them are gypsy people who live on boats. Therefore, proper low cost options are necessary for surface water treatment. This paper aims to describe a low cost option for surface water purification through solar thermal method. The experiences of two NGOs for implementing this alternative option in rural areas of Bangladesh have also been focused in this paper
PURIFICATION OF WATER THROUGH SOLAR THERMAL METHOD
Solar radiation can be used for purification of surface water, if surface water is contaminated only by micro-organisms. Water contaminated by chemical wastes from factories in towns and cities may not be suitable for this method. All diarrhea germs in water are destroyed if water is maintained at 600C for half an hour [2]. Sommer et al. [3] conducted a research on sensitivity of micro-organisms to temperature and found that water does not need to be boiled to kill the germs. Heating upto 600C has the same effect [Table 1]. Based on these scientific facts, a commonly
available bamboo tray painted black inside, polythene bags and bottles can be used for surface water purification through solar thermal method. Altogether the cost comes about Tk. 150 and can last many days of use, if one can use with care.
Fig. 1. A simple method of purification of surface water
through solar thermal method [4]
Firstly relatively clear water from river, canals or ponds should be collected. The suspended materials of the collected water can be removed by filtering through clean cloth. The top surface of the bamboo tray can be black painted. If black paint is not available, a black cloth spread over the tray can

Proceedings of the International Conference on Environmental Aspects of Bangladesh (ICEAB 2011)
152
do. The diameter of the bamboo tray can be approximately thirty inches. A polythene bag with five liter water can be placed on the bamboo tray. The depth of water should be approximately two finger thickness. Another plain polythene can be put over the whole system so that it can prevent heat from escaping. In clear sunshine at noon, it will take about two to three hours to attain desired temperature for destroying all diarrhea germs. So, if there is clear sunshine, at least two harvests may be made from 10 am to 3 pm, giving about ten liters of drinking water. However, this technique will not work, if the sunshine is not strong enough, and therefore, it is advisable to produce more than necessary during sunshine days for future use.
Table 1. Temperature effect on micro-organisms
Micro-organism Temperature for complete
destruction by one hour heating
Vibrio Cholera 450C
Salmonellae 580C
Shigella 540C
Hookworm larvae 510C
Taenia eggs 510C
Instead of polythene bag, bottle method can also be used. The methodology is as same as the polythene bag, but with the availability of enough sunshine, it will take approximately three to four times to attain desired temperature to make the water suitable for drinking.
CMES‘S EXPERIENCE
CMES (Center for Mass Education in Science), a national NGO, established in 1978 aims to provide technology based education to adolescents in rural areas of Bangladesh. CMES has achieved this through its Basic School System. The technology developed is transferred and extended through its network of 377 Basic and Advanced Basic Schools and 17 Rural Technology Centers. CMES has an R&D program on socio-economic issues, appropriate technology and renewable energy including solar electricity systems [5].
The R&D Dept. of CMES conducted the adaptive research for surface water purification through
solar thermal method during the period of March to April, 2002. Two methods were used: polythene bag method and bottle method. Surface water was collected from Dhanmondi Lake and Gulshan Lake of Dhaka, Bangladesh. A polythene bag with five liter capacity was placed on black painted bamboo tray. The diameter of bamboo tray was approximately thirty inches and the depth of water was approximately two finger thickness. Another polythene sheet was placed over the polythene bag and bamboo tray so that it could absorb hot air. The whole system was placed in the sun for two to three hours. The mean temperature recorded in the water of polythene bag was 600C. The treated water was tested in ICDDR, B and was found that the water was diarrhea-germs free and was suitable to drink.
The R&D Dept. of CMES also found that diarrhea-germs are destroyed even at 500C
temperature and the ultraviolet rays in sunshine play an additional role for this purpose. The back portion of the bottle was black painted and was placed on the top of the bamboo tray. The top surface of the bamboo tray was also black painted. The whole system was kept in the sunshine for three to four hours. The mean temperature recorded in the bottle water was 550C and laboratory test of the treated water indicated that the water was suitable to drink.
The only indicator of germ free surface water to rural people was temperature. CMES introduced an innovative way to measure temperature for surface water purification through solar thermal method. A small piece of wax was placed on the top of the bottle or polythene bag filled with water to be purified. When the user showed that the wax had started to lose its solidity, the water became purified. This innovative thermometer was very much user friendly. This made the system cheap as well.
After conducting successful research by R&D Dept, CMES was trying to implement this to rural areas of Bangladesh. CMES identified a local NGO named Samajik Unnayan Songstha (SUS, means Social Development Organization) who was working for improving the livelihood of gypsy people in the southern part of Bangladesh. CMES arranged a training program for transferring this technology to gypsy people in June 2002. A team including three leaders of gypsy group and seven employees of SUS came to the Head Office of CMES which is located in Dhaka, and attended the training program. It was one week training and the training program was funded by USC-Canada-Bangladesh (USCC-B). The importance of pure drinking water, the process of
solar thermal method for surface water purification and the ways to reach the method to the gypsy people were discussed during the training sessions. The training program included both theoretical and practical sessions. Three resource persons from CMES worked as facilitators.
SUS‘s EXPERIENCE
SUS (Samajik Unnayan Songsha), is a local NGO working in the district of Barishal, southern part of Bangladesh [Fig. 2]. SUS identified a target group of gypsy people. They lived on boats and their main livelihoods were catching fish. The gypsy people were using river water for drinking purpose. SUS was trying to provide an easy solution for meeting their drinking needs.
After getting training on surface water purification through solar thermal method from CMES in June 2002, SUS conducted three training programs to the gypsy people in August 2002. SUS provided the water purification system to them with the price of TK. 150. It was also possible to pay the price through installment. A refresh training and follow up was conducted by CMES personnel in April 2003. CMES personnel noticed that almost 70% households of gypsy group were using solar thermal method for purification of river water. But, they used only polythene bag method; the use of bottle method was very limited. They placed the system on the roof of boats and started catching fish. After three to four hours, the put the water

Proceedings of the International Conference on Environmental Aspects of Bangladesh (ICEAB 2011)
153
from polythene bag to muddy made jar. Though there was an innovative technique of using wax as thermometer, the use of this wax was very limited to the gypsy people. They used their judgments to be sure that the water was purified. The gypsy people were noticed that their diseases related to diarrhea were reduced significantly and they were more attentive on catching fish.
Fig. 2. Map of Bangladesh and project area.
OBSERVATIONS AND LESSONS LEARNT
There are many people in rural areas of Bangladesh who use water from ponds and rivers for their drinking purpose. Surface water purification through solar thermal method can be appropriate option for the task. As the target groups are not aware of the system, demonstration and consumer trainings are necessary to the target people. Polythene bag method is more suitable than bottle method to get desired temperature to destroy germs. But bottle method is more durable than polythene bag method.
Table 2. Strengths and weaknesses of water purification through solar thermal method.
Strengths
The system improves the quality of water through killing the micro-organisms.
It does not require any costly infrastructure and hence, it is easy to implement.
The system is easy to understand.
It can reduce the use of traditional energy resources including firewood and kerosene.
Weaknesses
The system requires adequate solar radiation and hence, it is not suitable in cloudy days.
It is unable to do chemical treatment of water.
It can treat only small amount of water and therefore, it may not be suitable in large scale.
The cost of each system is approximately Tk. 150. Soft micro-credit can be provided to the target people so that they can get access of it very easily. Women should be encouraged to use the system for surface water purification, as they stay most of the time in the households. However, the system shows some strengths and weaknesses which are available in Table 2.
CONCLUSIONS
Surface water purification through solar thermal method is a low cost option to the target people. It can improve public health condition. This method can also be implemented to the flood affected areas for supplying drinking water. The method is more suitable to the poor target people, if soft loan is available for purchasing the system. The system can be used at household level under their own management. It can be suitable to other developing countries with similar socio-economic conditions.
ACKNOWLEDGEMENT
The authors are grateful to Dr. Muhammad Ibrahim, Executive Director, Centre for Mass Education in Science (CMES) and Dr. Khondkar Siddque-e-Rabbani, Professor, Department of Biomedical Physics and Technology, University of Dhaka for their excellent academic supports. The author was the member of the training team for transferring the technology to SUS and would like to acknowledge the contribution of other members.
REFERENCES
[1] F Ahmed and M Rahman. 2000. Water Supply and Sanitation: Rural and Low Income Urban Communities.
ITN-Bangladesh, Center for Water Supply and Waste
Management, pp.295-297.
[2] M Ibrahim. 2000. Water Purification by Solar Radiation. Department of Documentation, Center for
Mass Education in Science, Dhaka, Bangladesh, pp:
2-9.
[3] B. Sommer, A Marino, Y Solarte, ML Salas, C Dierolf,
C Valiente, D Mora, R Rechsteiner, P Setter, W
Wirojanagud, H Ajarmeh, A AlHassan and M
Wegelin. 1997. SODIS-an emerging water treatment
process. Journal of Water Supply Research and
Technology, 46(3): 127-137.
[4] Wikipedia [Online]. Available at:
http://en.wikipedia.org/wiki/File:Pictograms_SODI
S.jpg, Accessed on June 10, 2011.
[5] CMES. 2006. Annual Report. Department of
Documentation, Center for Mass Education in
Science, Dhaka, Bangladesh.

Proceedings of the International Conference on Environmental Aspects of Bangladesh (ICEAB 2011)
154
A3.011
Solar Irrigation System and Its Advancement in Bangladesh
Md. Nizam Sayeed*, Saiful Islam and Mahmud Hasan
Department of Applied Physics, Electronics & Communication Engineering, University of Dhaka, Bangladesh e-mail: [email protected]*, [email protected], [email protected]
Abstract
Solar power is absolutely perfect to use with irrigation system. In this paper utilization of solar energy in the
irrigation system of Bangladesh is elucidated. Solar energy can be used in the rural areas for irrigation where
there is no electric supply or limited electric supply. It also indicates that, the solar irrigation system can reduce the
electricity demands of Bangladesh.
INTRODUCTION
Bangladesh is an agricultural country. Agriculture remains the most important sector of Bangladeshi economy, contributing about 30% of the national GDP and providing employment for 60% of the population [4]. The economic development of rural communities in Bangladesh is heavily dependent upon increased agricultural productivity and alarming fact is
that, the feeding of population is rapidly growing and fertility of the soil is decreasing in many areas. Irrigation is widely recognized as a feasible yield increasing technology which could play a key role in improving food production. Since conventional mechanized irrigation through engine driven pumps is getting more and more expensive with climbing fuel prices, the use of solar radiation for water pumping is becoming interesting.
SOLAR IRRIGATION SYSTEM
Solar irrigation provides a viable opportunity to match peak watering demands with peak energy production. A solar irrigation system consists of following components- Photovoltaic system, Inverter, AC pump, Water tanks. The photovoltaic array is composed of many solar panels in series and in parallels and absorbs irradiation from sunlight, and converts it into electrical energy (DC). Inverter controls and regulates pumping operation system and converts DC voltage from PV arrays to AC to drive the AC pump, with the function of MPPT and it regulates the output frequency according to irradiation in actual time to achieve the maximum power. The AC pump is driven by a 3-phase induction motor, draws water from wells or rivers and lakes. Then water is reserved in tanks for irrigation systems. Based on requirements and installation conditions, different type of pumps will be required.
ADVANTAGES
The advantages of solar irrigation system are:
1. Sustainable and unlimited access to energy, due to its energy source; the sun.
2. Independent from the electrical grid and
therefore usable in rural areas that are difficult to reach.
3. The solar irrigation system does not generate pollution because the sun is a `clean‘
energy source.
4. At present there is an acute shortage of
electricity in Bangladesh. Large scale implementation of solar irrigation system can reduce the energy consumption from the grid.
5. Long life span, high reliability, over 25 years of
lifetime.
Fig. 1: Block diagram of solar irrigation system
SOLAR IRRIGATION SYSTEM IN BANGLADESH
The first solar irrigation project was established in Kumarkhali village of Borguna district. It is powered by 48 solar panels, able to lift 0.8 million liters of water a day, irrigating 40 acres of lands. This project has 8.4 KW power. Rahimafroz Renewable Energy (RRE), a private company has introduced this system. Another project by this company is established at` Kaishar Char‘ village under `Savar‘ Thana of Dhaka. This system helps to save 760 megawatt power and 800 million liter diesel every year. Bangladesh Agricultural Development Corporation (BADC) gave Rahimafroz the
opportunity to demonstrate a large solar powered irrigation scheme in Boro (a variety of rice grown during the dry season in Bangladesh)
season. The
solar irrigation projects by Rahimafroz are
- 11.9 KWP system project in Savar

Proceedings of the International Conference on Environmental Aspects of Bangladesh (ICEAB 2011)
155
- 8.4 KWP solar irrigation project in Borguna - 600 WP solar pumps in Naogaon, Dinajpur,
Rajshahi, Bagerhat, Chapai Nawabgonj, Rangamati [1].
Rural Electrification Board (REB) has taken project for solar irrigation system. Under which 20 solar irrigation pumps will be brought into action [6].
CONCLUSION
Bangladesh as a developing country stands around 32% of the total population and in the rural areas of Bangladesh, where 76% of population live in are seriously deprived of the electricity facility. During the Boro season, 120 million acre rice fields in Bangladesh is irrigated by 1.33 million different
types of water pumps among which 87 percent are
diesel operated requiring 800 million liter diesel per year[3]. Seasonal crisis and price volatility are common hazards that are associated with diesel pump based irrigation in Bangladesh. Govt. provides subsidy for diesel, electricity etc. Moreover, it provides 100hr free supplementary irrigation [5]. These problems can be minimized by utilizing solar irrigation system.
REFERENCES
[1] N Nahar. 2010. Success story of women empowerment:
solar irrigation solution in Bangladesh. In: ICCEES
2010, Day-4, 29th October 2010, Available at:
http://www.womeninenergy.org.pk/iccee/present.asp
[2] HJ Helikson, DZ Haman and CD Baird. 1991.
Pumping water for irrigation using solar energy.
University of Florida, Fact sheets EES- 63.
[3] The Daily Financial Express. 2009. Rahimafroz
launces solar-powered irrigation system. Date: 18
October 2009, Available at: http://www.thefinancial
express_bd.com/2009/10/18/81860.html
[4] Wikipedia: Agriculture in Bangladesh, Available at:
http://en.wikipedia.org/wiki/Agriculture_in_Bangla
desh.
[5] CQKM Ahmed. 2010. Agriculture in Bangladesh.
BPATC. Available at: http://www.bpatc.org.bd/
handouts/Agriculture_Bangladesh.ppt.
[6] Power Division. 2005. Renewable energy. Ministry of
power, Energy and Mineral resources, Govt. of
Bangladesh. Available at: http://www.powerdivision.
gov.bd/index.php?page_id=271.

Proceedings of the International Conference on Environmental Aspects of Bangladesh (ICEAB 2011)
156
A3.012
Potential Analysis of Compressed Natural Gas (CNG) Vehicle
and Its Use in Bangladesh
Mohammed Shahed Hossain1, AKM Nazrul Islam2, Md. Aminul Islam3
and Md. Fuhad Hassan4
1Department of MIS, University of Dhaka, Bangladesh; e-mail:[email protected] 2Department of Mechanical Engineering, BUET, Bangladesh; e-mail:[email protected]
3Department of Mechanical Engineering, Lamar University, USA; e-mail: [email protected]
4Department of Textile Engineering, Primeasia University, Bangladesh; e-mail: [email protected]
Abstract
The use of CNG in Bangladesh is increasing day by day due to the environmental benefits as well as economic benefits.
In the last decade, the importance of environment conservation has assumed great significance. Even in Bangladesh
the last couple of years have witnessed a greater devotion and awakening towards the protection of the environment.
Pollution due to petroleum products used in transportation is an ever-increasing problem for Bangladesh like other
country. So alternative solution of energy source is trying to use, thus pressure on Compressed Natural Gas (CNG) has
been increased. Though, the environmental problem is solved but the stock of gas is simultaneously decreasing. The
purpose of the study is to make coordination between the environmental awareness concept and the use of the natural
gas should be connected in such a manner to achieve the success of Bangladesh.
INTRODUCTION
Compressed Natural Gas (CNG) is an important
vehicular fuel in Bangladesh because the country
has a significant natural gas resources and the
natural gas transmission and distribution network
is well developed. Technical experts have suggested
the use of Compressed Natural Gas (CNG) as an
alternative fuel for automobiles because of it is less
hazardous, environment friendly and is quite cost
effective. CNG consists mostly of methane and is
drawn from gas wells or in conjunction with crude
oil production. CNG vehicles store natural gas in
high-pressure fuel cylinders at 3,000 to 3,600
pounds per square inch. An odorant is normally
added to CNG for safety reasons. The emission
levels of two pollutants- lead & SO2 are directly
related to fuel composition. Eliminating lead from
gasoline, which is not naturally found in gasoline
but added to enhance octane will eliminate lead
emissions associated with fuel combustion from all
gasoline-powered vehicles. CNG (130 octane) is
energy efficient fuel than petrol (93 octane). This
higher octane rating allows higher compression
ratios and improved thermal efficiency, thus
reducing carbon dioxide emissions. Compared to
petrol or diesel, CNG vehicles emit 40% less of
nitrous oxide, 90% less of hydrocarbons, 80% less
of carbon monoxide and 25% less of carbon dioxide.
Moreover, noise level of CNG engine is much lower
than that of diesel. But scientific studies have
established that CNG takes up more space for each
gasoline gallon equivalent (GGE) compared to other
gasoline power vehicle. After having this drawback
CNG has a high growth in Bangladesh due to low
fuel cost. A significant change in transport section
has been pointed after introducing CNG at
Bangladesh market. So, the high consumption of
CNG makes the government, the policy makers, the
investors and the related personnel of this sector
are concerned and willing to overcome the high
consumption rate of CNG.
LITERATURE REVIEW
There have been conducted some research [1]–[7] on CNG use in Bangladesh. The suitability of CNG as vehicular fuel has been studied on 2010 [1]. The environmental effect, economic benefits and the ways of commercialization of CNG and the growth pattern of CNG filling stations, CNG conversion workshops in Bangladesh has also been studied there. There are also studies [2] about cleaner fuels and substantial improvements in air quality as well use of CNG as an alternative fuel for air pollution control [3]. Government has given permission to the private sector entrepreneur to install CNG refueling station and to establish of CNG conversion workshop and Government has also provided land to some private entrepreneurs for establishment of CNG conversion workshop and CNG refueling station [4]. The use of CNG for vehicle of Bangladesh has been studied for last decades [5]. The environmental effect, the export opportunity and reserve of natural gas has also been studied [6]. The government of Bangladesh is taking few steps for coordination between the environmental awareness concept and the use of the CNG in vehicle. The purpose of the study is to find out present scenario of Bangladesh of using CNG as vehicular fuel and find out some proper ways for the environmental and economic
benefits of the country. And the commercialization of CNG as well as the growth pattern of CNG conversion workshops in Bangladesh
CNG IN BANGLADESH
NG was first introduced in Bangladesh in 1982 through World Bank pilot project. Rupantarita
Prakritik Gas Company Limited (RPGCL) was established in 1987 which is responsible for popularizing CNG in transport sector by the establishment of a CNG-based transportation infrastructure in Bangladesh and widening its commercial operation. After that in 1999, four private companies start their journey in CNG sector [7].

Proceedings of the International Conference on Environmental Aspects of Bangladesh (ICEAB 2011)
157
Energy resources information is critical in determining the fuel mix of the future. Table-1 shows resource information for Bangladesh. As can be seen, Bangladesh is not very well endowed with energy resources. Natural gas reserves are only 16 Trillion cubic feet (Tcf), but there exist a resource potential of 32-42 Tcf. The country‘s coal resources are under development. By 2010, annual production is projected to be able to supply coal for 600 MW of power [8].
Table 1. Significant Energy Resources of Bangladesh
Resource Amount Status
Natural Gas 20.63 Tcf Reserves
32-37 Tcf Resources (mean)
Coal 600 Mt Reserves
Venture with RPGCL to set up 51 stations wherever piped gas is available in early 2000. But the current scenario of usages of CNG in Bangladesh can be described as Table-2 [9].
Table 2. Present scenario of CNG conversion and usages
Fiscal
Year
No. of
CNG
filling
station
No. of
workshop
No. of
converted
vehicle
No. of
CNG run
vehicle
2008-09 213 17 24516 26141
2007- 08 85 13 22718 24042
2006-07 42 28 25974 38454
2005-06 23 31 23374 38353
2004-05 41 22 10135 10525
2003-04 41 19 8575 9308
2002-03 6 3 188 10571
2001-02 3 3 4516 4516
2000-01 2 1 839 839
1983-00 7 1 1379 1379
STRATEGIC STEPS OF GOVERNMENT OF
BANGLADESH IN CNG SECTOR
A. Development of management and technical capacity
The organizational structure of RPGCL was revised to reflect changes in the CNG industry. An in-depth training program is carried out by RPGCL in the development of an alternative fuels program. The training covered CNG fuel technologies and applications, regulatory frameworks, standards and code regimes, safety protocols for conversion and refueling systems, emission standards and related enforcement needs.
B. Support through government policies and regulatory changes
The changes include the banning of two-stroke
auto-rickshaws as of January 2003 in favor of four-stroke CNG vehicles and the conversion of all government official vehicles to CNG.
C. To promote into the private entrepreneurs
Government offers an attractive package for entrepreneurs to promote CNG by free of charge
registration and enlisting; assistance and cooperation to obtain bank loans; necessary information; training for manpower engaged in running the station; assistance in site selection and taking lease of government land; quick gas, water and electricity connections at CNG stations.
EXPORT OF NATURAL GAS
At the rate of production, Bangladesh has enough recoverable gas to meet consumption for between 38-40 years. The potential investors are particularly concerned that Petrobangla's financial resources are not sufficient to absorb any substantial increase in gas purchases and unless they have a hard currency market for increased production, it is very hard to justify investment on which returns are uncertain. There has been constant pressure on the Bangladesh Government by those foreign oil companies that are involved in gas exploration, to allow gas to be exported and more specifically, exported to India. The current position of the government is that exports would only be considered if Bangladesh had proven reserves to meet their consumption needs for a minimum of 50 years.
CHALLENGES FOR IMPLEMENTATIO AND EXPANSION
A. Lack of skill technician and training program
There are difficulties in retaining trained staff. As newly joined staffs are often used in CNG conversion workshops and related to others, so development is quite hard. Due to the lack of trained personnel in the private sector they are failed capable of carrying out the full range of conversions. A new tendency of CNG technician is seen to change their occupation.
B. Lack of policy and regulatory framework
A long-term policy including one that promotes a user-friendly, customer-oriented and safety-based conversion protocol is required. Government doesn‘t have any particular data on how many days CNG can be used as an alternative fuel. Lack of knowledge in both public and private sectors on how an alternative fuels program can be successfully implemented and sustained in future. At present, Petrobangla and its subsidiaries, like any other government organization, have become much less effective. Difficulty in moving to a results-oriented organizational structure based on RPGCL‘s priorities. Government support is required to provide continuing education and training to CNG industry stakeholders so that they can keep abreast of new technologies and best practices.
C. Lack of CNG conversion items
Quality kits or cylinders compatible with the different types of vehicles used in Bangladesh are not easy to find. Regarding safety standards a consistent policy is not available for the CNG conversion items. The addition of CNG fuelling equipment to the existing petrol filling stations is
problematic, because a large part of them are not having disposition over enough ground space to accommodate a safe CNG compressor, dispenser and high pressure gas storage installation. Recently,

Proceedings of the International Conference on Environmental Aspects of Bangladesh (ICEAB 2011)
158
Government of Bangladesh has imposed VAT on the CNG conversion items as a result the price of the CNG conversion increases.
D. Unavailability of gas all over the country
According to Petrobangla‘s recent research shown that Bangladesh has a gas of 32-37 Tcf where recoverable is 20.63 Tcf, after all remaining reserve will be 13.53 Tcf. Current daily average gas demand of 1,890 million cubic feet per day (MMCFD) is expected to increase to 3,559 MMCFD by 2017.
Recent investments by national oil companies and IOCs will increase gas production by 49%, to 3,055 MMCFD, by 2017. The government has finalized contracts to increase in supply by 74% and bringing it to 3,555 MMCFD by 2017. Out of the total production of around 87 MMSCMD (million standard cubic meters per day), after internal consumption, extraction of LPG and unavoidable flaring, around 74 MMSCMD is available for sale to various consumers. [10] - [11]. This alarming statistics is a clear indication of a crucial time in near future.
E. Unavailability of gas distribution
Gas distribution pipelines are not available to the whole country. Only 30-35 percent area is covered by the gas distribution network. It takes hours for refueling of CNG vehicles because of long queues due to in adequate number of filling stations. Gas stations observe a reduced gas pressure at peak hours.
F. Focus on Electricity Generation:
Government right now focuses on electricity generation with this existing gas in Bangladesh. Recently the Government of Bangladesh has not given any kind of domestic gas connection to the customer [12]. Every summer Bangladesh face huge load shedding problem. Power Development Board (PDB) sources said while the official power demand was just 5000MW, the unofficial demand was hovering around 6000 MW. Around 1500 MW power could not be generated due to short supply of gas to many power plants. Gas is a major concern also because several new gas-fired power plants with nearly 1000 MW generation capacity are expected to be drafted into service this year.
RECOMMENDATIONS
A. Import CNG driven buses
In the context of Bangladesh, there is need to bring public passenger transport as early as possible on CNG. Financial incentives should be provided to bus operators purchasing new OEM and retrofitted CNG buses in the form of sales tax and excise tax exemption and low-interest loans with the subsidies ideally recovered from enhanced road taxes on private vehicles. While capital costs compared to diesel will go up in case of CNG, operational costs will go down because of the lower fuel cost of CNG as compared to petrol or diesel. Bangladesh Road Transport Corporation (BRTC) has imported dedicated CNG passenger busses to increase the utilization of natural gas. Besides the
government initiatives, private entrepreneurs are
also importing CNG dedicated passenger busses as the operating cost is very attractive [13].
B. Promote alternative fuel
The government should promote Eco-friendly fuels and improve quality of other fuels with the relevant exhaust treatment devices and engine technology so that different options can compete in the market.
C. Import Promote market driven development model for CNG:
A market driven development model to promote CNG as transportation fuel has been pushed through various policies, such as regulatory mandates, fiscal incentives, capacity and awareness building initiatives including R & D activities. There have been limited market-driven approaches and models for promotion of natural gas as a transportation fuel especially in urban areas of Bangladesh. The extent at which both push and pull strategies have been systematically deployed by the firm both by leveraging its existing brand value as well as simultaneously building it further for consolidation and higher market penetration.
D. Prepare policy and regulatory framework:
At a high level, government should conduct integrated resource planning for the energy sector, including environmental and social objectives. Setting a long run and minimum five year moratorium on natural gas exports and using this time to develop a surplus test mechanism and domestic priorities to use of gas can be an effective initiative. An arms-length regulatory agency can be created for natural gas sector. There is a need for the government to launch a vigorous campaign to attract foreign and local investment in the energy sector. The policy should be included new exploration to find out the new gas fields also.
The government may considerably increase funds and provide facilities to Petrobangla and its subsidiary companies, can stand as more viable and effective organizations, and take up the role of gas exploration and production of gas. Government may make the natural gas networks into common carriers with predictable, independently set tariffs, allowing natural gas producers and independent power producers to negotiate directly with customers. RPGCL should provide an adequate and enhanced allocation of natural gas for Bangladesh‘s transport sector and this allocation should keep pace with the growing demand. Strengthening the legal protection by imposing more laws related to extraction of natural resources, safety and security and ensuring their appropriate enforcement will favor the entire CNG sector.
E. Proper training facilities:
The government should develop institutions to train more people in the energy sector, particularly in the areas of petroleum and natural gas engineering and CNG system.
F. Prepare gas distribution network:
In the locations where a gas distribution network is available, the best approach is to add fast fill CNG units to the existing fuel stations on the main

Proceedings of the International Conference on Environmental Aspects of Bangladesh (ICEAB 2011)
159
highways and in and around the larger cities. Also new locations with dedicated fast fill CNG outlets should be foreseen in busy metropolis areas. In the coming months a further delivery capacity from one of the two gas fields in exploration will start to operate. Government is to improve the infrastructure quickly to eliminate the long queues for CNG refueling. Plans for future distribution infrastructure should be set into motion to ensure that it stays ahead of the growing demand and takes into account the turnaround time of vehicles at the dispensing stations.
CONCLUSION
To cope with the power requirement in Bangladesh, the government is focusing their interest about using natural gas in power sector rather than in transport sector. The imprudent use of CNG is causing increase in transport cost and simultaneously effecting on the whole economy of Bangladesh. So the government should take necessary steps to generate power from other source of energy or increase the efficiency of conversion power from gas by some technical method. Renewable energy can be an answer to meet the current power crisis, saving extreme dependency on CNG. Both power and CNG sectors are inevitably important and Government should take positive approaches to incorporate both the sector.
Bangladesh has significant natural gas reserve and out of 1800 mmscfd of being marketed over the country, approximately 72 mmscfd is being used in the CNG sector. The projected demand of gas in CNG sector in the next 5 years will be around 130-150 mmscfd. The new job opportunities creation and the large number of CNG conversion stations should be increased as large number of vehicles are using CNG as a transport fuel. For the using of CNG a positive impact on the country‘s balance on payment with a substantial reduction of the annual import bills of liquid petroleum as well as reducing the environmental pollution.
REFERENCES
[1] A Salma, A Iqbal, M Iqbal and AFM Salauddin. 2011.
Present Scenario of Compressed Natural Gas (CNG)
as a Vehicular fuel in Bangladesh., 2nd International
Conference on Industrial Engineering and
Operations Management (IEOM 2011) January
22-24, 2011, Kuala Lumpur, Malaysia, page
222-227.
[2] AH Babu. Use of Cleaner Fuels & Substantial
Improvements in Air Quality in Dhaka, Bangladesh.
Clean air portal.
[3] MR Abedin. 2001. Use of CNG as an Alternative Fuel
for Transport-Air Pollution Control Perspective.
International Seminar on Air Pollution in Dhaka City,
October 30, 2001, France Bangladesh Association of
Scholars and Trainees (FBAST). Page-49-54.
[4] MS Islam. 2008. CNG as an Alternative Fuel-
Bangladesh Scenario. Presented in the 2nd
International Conference on Chemical Engineering
2008 (ICChE 2008) organized by the Department of
Chemical Engineering , BUET, Dhaka, Bangladesh.
[5] M Ahmed. 1999. Use of Compressed Natural gas for
Vehicles in Bangladesh. M.Sc. Thesis PMRE
Department, BUET, Dhaka.
[6] J Mark, MR Khan, J Richards. 2000. Natural Gas
Options for Bangladesh. Natural Gas Options for
Bangladesh, Centre for Policy Research of IUBAT.
[7] Thilotham R. Kolanu and Uma B. Kondury, 2007.
Market Driven Model for Promotion of CNG as
Transportation Fuel in Developing Countries:
Learning from a Successful Initiative in India. Asian Journal Energy Environment, 08(04): 618-626
[8] Information source – National energy policy of
Bangladesh and Hydrocarbon Unit of government of
Bangladesh.
[9] Statistics of CNG Filling Station & Conversion
Workshop in Bangladesh, from RPGCL website.
http://www.rpgcl.org.bd/exp_act.php?ltype=exp_st
at. The last date of available data is June 28, 2011
has been checked.
[10] F Navesey. Gas Quality for Natural Gas Vehicle Use,
IANGV, Toronto, pp1-7.
[11] Abdul Quader. 1999. Consumption and Options for
Development of Natural Gas in Bangladesh.
Presented at Optimising Use of Bangladesh‘s Gas
Resources, Centre for Policy Dialogue, Dhaka.
[12] Prateep Chouykerd, Navadol Laosiripojana and
Chumnong Sorapipatana. 2007. Economic
Assessment of Compressed Natural Gas for Diesel
Vehicle in Thailand. Asian Journal Energy Enviornment, 08(02): 533-539
[13] http://www.brtc.gov.bd/. The last date of available
data is June 28, 2011 has been checked.

Proceedings of the International Conference on Environmental Aspects of Bangladesh (ICEAB 2011)
160
A3.013
Climate Change and Urbanization: Impacts on Dhaka City
Rahat B Tooheen and Ahmed S Chowdhury
Independent University, Bangladesh (IUB)
Abstract Due to current, rapid global urbanization trends, the relation between climate change and urbanization has become a
key issue in the global strategy for dealing with the environmental, economical and social impacts of climate change. In
relation to the non-urban aspects of climate change, the scientific literature on urbanization and climate is scarce, but
this situation is undergoing a paradigm shift. For developing countries such as Bangladesh, where the centrality of the
capital Dhaka governs all aspects of national life, the need of a strategy to address the impacts of climate change on
Dhaka City becomes paramount in light of the present environmental situation of the country. This paper supports a
management strategy based on accepted scientific ideas but argues that small-scale and gender-focused initiatives hold
the key for an effective management strategy.
INTRODUCTION
Between 2009 and 2050, the population of urban areas is expected to increase by 2.9 billion, from 3.4 billion in 2009 to 6.3 billion in 2050 [1]. As a result the world‘s urban areas will absorb the population growth over the next few decades, and most of this growth will be concentrated in the towns and cities of less developed nations [1]. Urbanization is one of the rapid changes happening in Bangladesh [2] and the urban population is projected to reach 80 million by 2020, with Dhaka alone projected to accommodate 20 million inhabitants [2].
Cities and climate change share a complex relationship, for city-based activities are stated to contribute significant amounts of green house gases to the atmosphere, which often simultaneously make them more vulnerable to the impacts of climate change [3]. According to experts, the melting of snow and glaciers in the Himalayas, along with the increasing rainfall that can be attributed to climate change will lead to more flooding in Bangladesh, and especially cities near the coast and delta region including Dhaka [4]. Dhaka may also have to endure increased temperatures from rising levels of vehicle exhaust, increased industrial activity and use of air conditioners [4].
Climate change has become one of the recently significant environmental issues facing the world in general and countries like Bangladesh in particular for the following causes. Climate change is more than a warming trend, and increasing temperatures will lead to changes in many aspects of weather, such as wind patterns, and the types and frequency of extreme weather events [5]. Such changes can lead to unpredictable social, economical and environmental changes [5]. Global surface
temperatures have risen by 1.3 degree Fahrenheit over the last 100 years, and eight of the ten warmest years on record have occurred since 2001 [6]. As populations in the urban areas become more concentrated, urban centres will have a key role in the climate change arena [7] and Dhaka‘s growth will make it more vulnerable to negative climate change impacts [3].
DISCUSSION
A. Background Statement
The importance of Dhaka City to the Bangladesh economy due to the concentration of industrial and
economic activities in the capital makes it increasingly vulnerable to the impacts of climate change since Dhaka‘s contribution of the greenhouse gases that cause climate change are stated to increase in coming years [3]. In the context of Bangladesh, the gender-component of climate change in relation to the urbanization of Dhaka City is a neglected issue. In developing nations, women are engaged in activities must susceptible to the impacts of climate change [8]. However, the literature available on this issue has tended to concentrate on the rural areas [9], [10] while literature on urban areas is scarce. Although the discussion highlights the environmentally disadvantage portions of Dhaka, and economically vulnerable segments of the population, the final recommendations will take note of all areas of the city and segments of the population. The paper will have a qualitative focus. The contribution of this paper will be to propose small-scale and gender-focused initiatives for dealing with the impacts of climate change and urbanization on Dhaka City.
B. Limitations
The recent surge in scientific interest between climate change and its relational dynamics with urbanization has generated significant amounts of scientific literature, although the gender aspects of climate change have received relatively less coverage in relation to the non-gender aspects in the context of the developing world. Due to the broad aspects of climate change and urbanization, it is likely that an important aspect of the topic has been overlooked. The paper has sought to incorporate within the framework of the conference several general aspects of the topic into a specific focus.
C. Environmental and Social Scenario
The vulnerability of Dhaka to climate change impacts arises due to several environmental factors, including growth history, erratic rainfall, flood, water logging, temperature rise and heat stress [11]. Other key environmental concerns for the city include air quality, surface water contamination, groundwater reduction, inadequate waste management, transport congestion, and the expansion of slums and squatter settlements [3]. Due to the rapid growth of industries, commerce,

Proceedings of the International Conference on Environmental Aspects of Bangladesh (ICEAB 2011)
161
housing and infrastructure in the last decades, main service providing agencies face difficulties in meeting the demands of a growing population [12]. The city‘s boundary has expanded in all directions, but not at the same scale, and as a consequence, key environmental and social components of the city are in a continual state of decline [12]. The concentration of housing, industry and transportation in Dhaka City is expected to increase in the near future, and therefore the impacts of urbanization and climate change on the city will also consequently rise [7].
The poverty and vulnerability of Dhaka City is revealed through the living condition of millions of poor people living in slums and squatter settlements [13]. The poor, urban communities are mostly involved in a variety of occupations in the urban informal sectors, and due to a lack of employment training and education, they usually do not gain entry into the more competitive formal sectors of urban employment [13]. It is estimated that 40% of Dhaka‘s population live in slums and squatter settlements [3]. Their livelihoods are centered on industries, hotels and restaurants, the construction sector and as domestic workers [3]. This segment of the urban population is severely impacted by floods, water-logging and other related environmental problems [3, 12].
Although there is mention in the scientific literature [8, 9] about the increased vulnerability of females to the diversified impacts of climate change, the authors were not able to locate a rigorous, significant study or studies which has examined this aspect in scientific detail. From own observations, it can be stated without a notable degree of scientific support, that the activities performed by females, across the social spectrum,
are existing but do not appear to be acknowledged adequately in the scientific literature. The activities range from looking after the household, children, elderly members of the family to related household chores of procuring food, paying utilities, medicine collection, transport to and from schools, colleges, and a host of other social and economic activities.
D. Further Information
Climate change influences the resources on which human societies are dependent on for food and other required amenities [14]. Climate and society undergo long-term changes, as does the relationship between the two [14]. A significant change in the society towards an industrial market economy results in both beneficial and detrimental outcomes on society itself and the environment as well [14]. Consequently it follows that, strategies to address the multifaceted outcomes of climate change need to be formulated within the context of equity and development [15].
The paper focused the discussion on the environmentally vulnerable and economically and socially disadvantage sections of the population of Dhaka City. However, it should be noted that any strategy for dealing with the impacts of climate change and urbanization on the city has to account for those areas relatively safe from an
environmental context, and those segments of the population which are socially and economically
better off in relation to their disadvantaged counterparts.
Therefore, as a pre-requisite for the recommendations, detailed qualitative and quantitative information on the relatively environmentally safe areas of the city, and socially and economically well-off segments of the population need to be collected and compiled as part of a management strategy for climate change and urbanization in Dhaka City.
RECOMMENDATIONS FOR IMPLEMENTATION
Recommendations implemented to address the double impacts of climate change and urbanization on the environment and inhabitants of Dhaka City will need to recognize the shifting baseline against the backdrop of which such recommendations are formulated and implemented on a long-term basis under a fluid environmental management scenario. Therefore, in order to reduce the negative externalities of a shifting baseline, and the shifting nature of urbanization and climate, the following recommendations are forwarded for consideration by the concerned stakeholders and implementing bodies:
A database of Dhaka City noting and cataloging the environmental, social, economical, infrastructural, legal, logistical, and vulnerable resources. These categories will need to be updated on a regular basis in order to keep track of the shifting baseline.
Monitoring of environmentally vulnerable areas of the city and noting any changes (physical, social, etc) of those areas and drawing up action plans for addressing the same. GPS System can used here for quick and timely monitoring of the issues concerned.
Implementation of existing environmental rules and regulations with strict penalties on the violators of the laws to deter future infringements. The success of this step depends largely on political will and patience on environmental investments.
Rehabilitation and work programs for the vulnerable segments of the urban population (those residing in slums, squatter settlements, streets, etc)
so that they are absorbed into the mainstream economic activities for the reduction of their dependence on vulnerable activities and lifestyles. These programs will need to recognize the gender dimensions of climate change and urbanization through special work quotas and resource allocation for women.
Awareness campaigns on how personal habits and lifestyles can increase the vulnerability of Dhaka to climate change and urbanization and introduce incentives for individuals who make a visible effort to reverse this situation.
Introduction of mass transit system to and from Dhaka City so that the need to migrate and settle in the city for work and other purposes is reduced. This will serve to reduce the pressure on Dhaka and its environs to a certain degree. However, the success of this measure requires complimentary policies (housing, employment, education, etc) outside Dhaka in those areas from which people have been migrating on a regular basis.

Proceedings of the International Conference on Environmental Aspects of Bangladesh (ICEAB 2011)
162
CONCLUSION
The vulnerability of Dhaka City to climate change impacts is an acknowledged and scientifically proven fact. The deteriorating environmental and social situation, coupled with the unplanned development taking place in and around the city is placing Dhaka on the path to a catastrophic scenario in future. Measures to control the pollution and unplanned development have met with little or no success. The onus is now on the policy makers and city planners, and most importantly, all segments of the Dhaka inhabitants to formulate and implement small-scale and gender-focused strategies that will arrest the city‘s unplanned development and reduce future impacts from climate change.
ACKNOWLEDGMENT
This paper has benefited greatly from comments of the reviewer and senior colleagues and contemporaries from Independent University, Bangladesh. There helpful comments and suggestions are gratefully acknowledged.
REFERENCES
[1] World Urbanization Prospects, The 2009 Revision
Highlights (2010), United Nations Division of
Economic and Social Affairs, New York.
[2] Bangladesh 2020: A Long-run Perspective Study
(1998). Bangladesh Development Series The World
Bank and Bangladesh Centre for Advanced Studies,
The University Press Limited, Bangladesh.
[3] M. Alam and M.D. Golam Rabbani. 2007.
Vulnerabilities and responses to climate change for
Dhaka. Environment and Urbanization, 19(1): 81–97.
[4] UN Habitat State Of The World‘s Cities 2008/2009
Case Study Dhaka‘s extreme vulnerability to climate
change. [Online]. Accessed on June 2011, Available:
http://www.unhabitat.org
[5] Climate Change Fact Sheet. [Online]. Accessed on
June 2011, Available:
http://www.thegreatwarming.com
[6] EPA‘s Endangerment Finding Climate Change Facts.
[Online]. Accessed on June 2011, Available:
http://www.epa.gov
[7] Patricia Romero Lankao. 2008. Urban Areas and
Climate Change: Review of Current Issues and
Trends. Issues Paper for the 2011 Global Report on
Human Settkements, December 2008.
[8] Mohammed Abdul Baten and Niaz Ahmed Khan.
2010. Gender issue in climate change discourse:
theory versus reality. In: regional conference titled
Climate change and extreme cyclones in Dhaka, 17 –
18 February 2010.
[9] Naved Ahmed Chowdhury, ―Men, Women and
Environment Gender Issues in Climate Change,‖
Climate Study Series No 2, Unnayan Onneshan.
Available: http://www.unnayan.org
[10] FAO, ―People-Centered Climate Change Adaptation:
Integrating Gender Issues.‖ Available:
http://www.fao.org
[11] A. Rahman and D.L. Mallick, ―Climate Change
Impacts on Cities of Developing Countries: A Case
Study on Dhaka,‖ C40 Tokyo Conference on Climate Change – Adaptation Measures for Sustainable Low
Carbon Cities.
[12] A. Atiq Rahman and Mozaharul Alam, (eds) ―Dhaka
City State of Environment 2005.‖ Depart of
Environment, Ministry of Environment and Forest,
Government of the People‘s Republic of Bangladesh
in collaboration with United Nations Environment
Programme Regional Resource Centre for Asia and
the Pacific (UNEP RRC.AP) and Bangladesh Centre
for Advanced Studies (BCAS).
[13] Shahadat Hossain. 2006. Rapid Mass Urbanization
and Its Social Consequences in Bangladesh: The
Case of the Megacity of Dhaka. In: 16th Biennial Conference of the Asian Studies Association of Australia, Wollongong, 26 – 29 June, 2006.
[14] N.J. Ericksen, Q.K. Ahmed and A.R. Chowdhury.
―Socio-Economic Implications of Climate Change for
Bangladesh‖ Briefing Document No. 4 Bangladesh
Unnayan Parishad. Available:
www.waikato.ac.nz/igci/downloads/BriefingDoc4.p
df
[15] B Smit and O Pilifosova 2001. Adaptation to Climate
Change in the Context of Sustainable Development
and Equity. Contribution of the Working Group to
the Third Assessment Report of Intergovernmental
Panel on Climate Change, Cambridge University
Press, Cambridge, UK: 879 – 912.

Proceedings of the International Conference on Environmental Aspects of Bangladesh (ICEAB 2011)
163
A4.001
Solid Waste Management in Chittagong City
Satomi Kishimoto and Suehiro Otoma
University of Kitakyushu, Fukuoka, Japan
Abstract As waste-related problems are becoming serious in most of the developing countries which have made a rapid economic
growth, Chittagong City, Bangladesh has also faced the problems to keep the city clean from wastes. The study
focused on ―Municipal Solid Wastes‖ and ―Plastic Recycling‖ among the several processes of waste management and
applied the ―Material Flow‖ to clarify and evaluate it. The Study shows the amount of generation has been increasing
as the number of population has increasing; the percentage of collection has not improved and remained as 52% of total
generation. The Plastic materials are collected by various types of private collectors directly from household and
recycled. The study also show the amount of plastics recycled in the city is as 44~47ton per day and it is the 66~71%
of total generation of plastic.
INTRODUCTION
In this research, Municipal Solid Waste, specifically plastic was focused. The objectives of the research are to clarify and evaluate the solid waste management by City Corporation and recycling system in the city. The study is concluded with the material flow of municipal solid wastes. Chittagong, the second largest city in Bangladesh, was selected as the study area.
METHODOLOGY AND OVERVIEW OF CHITTAGONG CITY
Chittagong City is the second largest city in Bangladesh and has 450 million people in its 155 km2 wide area. Its population has been increasing every year and population density per km2 will up to 30,000, which is higher than most of capital city in the world. Administration of the city is divided into 41 wards under the control of Chittagong City Corporation. Conservancy department is responsible for waste management and mosquito eradication.
In the study, fundamental information and data
were provided from City Corporation and interview survey was conducted to Conservancy Office and private companies in recycling business.
A. Assumption of waste generation and collection
According to the official website of Chittagong City Corporation [1] and interview to Conservancy Office, Conservancy Office has 90 trucks for wastes collection and hires 1,854 persons as total. One thousand and two hundreds forty-five of fixed-typed concrete boxes called Dustbin and 95 removal-typed steel boxes called Container are placed by the order of City Corporation.
Household waste collection is classified into 2 processes; the first is the ―Primary Collection‖ from household to the dustbin and container, the second is the ―Secondary Collection‖ from dustbin and container to landfill site. It is showed that these collections are the obligation for residents and City Corporation in city corporation ordinance.
In the study, amount of generation was examined, referencing the basic unit of wastes generation that was JICA [2] used in the study of Dhaka city.
Amount of collection was calculated from the data acquired at Landfill site, especially the carrying
capacity of vehicle and its number of trips. The difference of generation and collection between rainy season and dry season was considered. Percentage of Collection was also led to from these
amounts of generation and secondary collection. Table 1 shows results of study as of 2006 and of 2010.
Table 1. Wastes generation and collection in Chittagong City
Year 2006 Year 2010
Total Population 4,000,000 4,5000,000
Amount of Generation
(ton/day)(Generation
from household)
1417
(1236)
1606
(1371)
Amount of Collection
(ton/day ) 736 833
Percentage of Collection 52% 52%
COLLECTION AND RECYCLING OF PLASTIC
MATERIALS
A. How to be collected
Various types of materials, such as plastic, iron, tin, steel, are collected from household and recycled via various types of collectors and recycling business actors. Private sector has initiatives in recycling, and City Corporation has no intervention in process.
The actual situation of the recycling was not defined clearly; however, the types of collectors and classification of the actors engaged in recycling were defined in the study. Table 2 shows the classification of collectors who collects variety of valuable materials in the process of wastes collection and Table 3 shows the classification of plastic recycling business.
Plastics classified by color Plastics flakes after crushing
Fig. 1. Plastics collected at recycling shops

Proceedings of the International Conference on Environmental Aspects of Bangladesh (ICEAB 2011)
164
B. Amount of generation and collection of plastic
Interview survey to collectors was conducted in the study to grasp the amount of collection per day. The result that Waste Concern Consultants acquired from the study in Dhaka has also referenced, such as percentage of plastic wastes in household wastes.
Table 2. Classification of valuable materials collectors
Classification Place
Feriwalla (informal
collector)
Visiting each Household,
and get recyclable materials
with barter or buying
Household
Van
Collector
Collector of household waste
hired by Ward or
communities. Picking up
recyclable materials during
carrying household wastes to
dustbin or container placed
by CCC
Household
Tokai
People who make a living by
picking up recyclable
materials at dustbin or
container placed by CCC
and selling them
Dustbin
CCC
Collector
Sweeper hired by CCC.
There are both permanent
and non-permanent
Road and
Drainage
Dump
Tokai
People who make a living by
picking up recyclable
materials at Landfill and
selling them. Most are the
Lowest income class.
Landfill
Table 3. Classification of plastic recycling business
Classification Scale of
Business
Vangari sho
(informal
recycling
shops)
Buy valuable
materials brought by
residents
Small
(Individual,
Family
business)
Wholesaler
Buy valuable material
brought by Vangari
shops, classified
materials by color and
wash them
Medium
Manufactures
Buy valuable
materials brought by
Wholesaler , crush
into flakes, wash and
dry them
Large
Factory
Buy crushed flakes
from Manufactures
and reuse.
Large
According to Waste Concern Consultants [3], 4.2 % of household wastes are recognized as plastic wastes and the collection of those plastics in the recycling flow are up to 66% of total collection.
Amount of daily collection at the shop called Vangari shop, which collects valuable material such plastics and metals was calculated from the interview. According to the owners of Vangari shops, the average of the amount of collection is 35Kg per day at per shop. Regarding the number of Vangari shops acquired at City Corporation, the result proved that the amount of collection at Vangari shop was about 66%. Table 4 shows wastes generation and collection in Dhaka city and Chittagong City.
Table 4. Wastes generation and collection in Dhaka City and Chittagong City
Dhaka Chittagong
Amount of Generation (ton/day) 3316 1606
Amount of Plastic in household
wastes (ton/day) (Percentage)
138
(4.2%)
67
(4.2%)
Amount of Collection of Plastics
(ton/day) (Percentage)
91
(66%)
44
(66%)
Amount of Collection at Vangari
shop(ton/day) Percentage)
91
(66%)
47
(71%)
As Table 4 shows, the amount of plastics recycled in Chittagong City per day is estimated between 44 ton and 47ton. Also, the percentage of collection of plastic is estimated between 66 to 71 %. Material flow of municipal solid wastes and valuable materials including plastics was described in the ―Fig2‖. The flow shows the amount of municipal solid wastes at each point of collection and also the plastics collected for recycling.
CONCLUSION AND FURTHER SURVEY
The study clarified the stakeholders and recycling system in Chittagong City and concluded with the material flow of municipal solid wastes. Waste collection rate is estimated only 52% of total generation and it is lower than Dhaka city. City Corporation is requested to improve the collection both in the way of collection and the awareness of residents who discard household wastes on the open space and drainage.
As for recycling, various stakeholders engage in recycling and there are no official data, prior research, therefore some parts of collection and distribution are still remained unclear.
As City has Further survey will be contributed to evaluate waste management in Chittagong City and it will help City Corporation to improve their policy and measures in waste management.
REFERENCES
[1] Chittagong City Corporation official Website;
http://www.ccc.org.bd/demo/index.php
[2] JICA, ―The Study on the Solid Waste Management in
Dhaka City, Final Report Volume 1 Summary.
[3] Waste Concern Consultants, ―plastic waste recycling
and its opportunities in Bangladesh,‖
Fig. 2. Wastes Material Flow in Chittagong City

Proceedings of the International Conference on Environmental Aspects of Bangladesh (ICEAB 2011)
165
A4.002
Removal of Phenol by a soil isolated Pseudomonas fluorescens PU1
Md. Mahiudddin1, ANM Fakhruddin1 and Abdullah-Al-Mahin*2
1 Department of Environmental Sciences, Jahangirnagar University, Savar, Dhaka-1342, Bangladesh
2 *Institute of Food and Radiation Biology, Atomic Energy Research Establishment, GPO Box-3787, Dhaka-1000, Bangladesh; Tel: +8801738326000; e-mail: [email protected]
Abstract Phenol, a widely used industrial organic chemical, is a characteristic pollutant of industrial wastewater effluents.
Degradation of phenolics by members of soil microflora is an important means by which these substances are removed
from the environment thus preventing from becoming a pollution problem. Biodegradation offers more opportunities to
destroy or render phenolic compounds using microorganisms. Among five bacteria isolated from soil showing great
potential as phenol degraders, the isolate PU1 was presumptively identified as Pseudomonas fluorescens. Degradation
of phenol by Pseudomonas fluoroscens PU1 strain was investigated and it demonstrated the complete degradation of
phenol up to 1000 ppm as sole source of carbon and energy. Growth yield of the strain was increased with increasing
phenol concentrations. The study concluded with the finding that Pseudomonas fluorescens PU1 strain could be a good
candidate for remediation of phenol contaminants from heavily polluted sites.
INTRODUCTION
During the last few decades, the production and usage of man-made chemicals in industry has led to the entry of many foreign compounds into the environment due to the revolution of industrial field. The accumulation of these compounds has resulted in environmental contamination and contributed to
many deleterious effects on living systems. One of such xenobiotics is phenol which has become an environmental concern due to its acute toxicity and resistance to degradation.
Phenol is a widely used organic compound and a characteristic pollutant in wastewater and effluents from chemicals, petrochemicals, pharmaceuticals, textiles, and steel industries [1]. The unwholesome and environmentally unacceptable pollution effects of the phenolic effluents have been reported worldwide [2]. Phenol contaminants are relatively soluble in water and accumulate in soil, resulting in extensive surface water, ground water and soil contamination owing to its severe toxicity [3]. Removal of phenol pollutants from contaminated sites has become a major environmental concern now-a-days.
Different techniques have been applied to remove phenolic compounds from polluted sites [4]-[10]. Recently biodegradation has been widely studied and used as a low-cost alternative and offering the possibility of complete mineralization of organic compounds [11]-[13]. Microbial metabolism of phenols has intensified in recent years environments [14]. Microbes adapt quite rapidly and grow because it is the sustainable ways to clean-up contaminated at extreme condition with the presence of hazardous compounds or on any waste streams mainly via the usage of the compound as carbon, energy and carbon source. Important examples include phenol, chloro-phenol, chloro-benzene, chloro-alkanes, atrazine and nitro-aromatics [14]. These microorganism use both aerobic and anaerobic pathway for phenol degradation and aerobic biodegradation has been studied since the beginning of the 1900s [15]. The microorganisms that are normally used in phenol degradation include Pseudomonas sp [16]-[19], Rhodoccus sp, Acinetobacter sp and Alcaligenes sp [20]. In a biological treatment system a potential strain is necessary for the effective degradation to
proceed at a faster rate. Giving concern on the above view, the present study was envisaged with the following objectives: 1) isolation and screening of phenol degrading isolates, 2) identification employing morphological and some biochemical methods, and 3) study of phenol degradation and microbial growth behavior when the compound is used as the sole carbon source.
MATERIALS AND METHODS
A. Culture Medium
The minimal medium used in the degradation studies, adapted from Goulding (1988) [21], contained (g/L) K2HPO4, 4.36; NaH2PO4, 3.45; NH4Cl, 1.0; MgSO4.6H2O, 0.912; trace salts solution 1ml/l. The trace salts solution was prepared separately in distilled water and was
stored in a dark bottle for 6-8 weeks. The trace salts solution contained (g/100 ml): CaCl2.2H2O, 4.77; FeSO4.7H2O, 0.37; CoCl2.6H2O, 0.37; MnCl2.4H2O, 0.10; Na2MoO4.2H2O, 0.02. The pH of the medium was adjusted to 7.0 with 2M NaOH. Phenol was added to the minimal medium after sterilization. Minimal media together with phenol was used for biodegradation studies.
B. Isolation and screening of phenol degrading bacteria
The soil samples were collected aseptically from different sites under three inches depth from the surface soil. After mixing and dilution, 0.1 ml soil suspension was spread over Pseudomonas minimal agar plates (pH 7±0.1) containing 200 ppm of phenol as sole carbon and energy source followed by APHA [22] and incubated for 24-48 h at 30o C. A number of bacterial colonies showing on plates were selected, streaked twice on Pseudomonas minimal agar plates by replica plate method [23] for purification. When a streaking produced only one type of colony in a plate, it was considered to be pure culture [24]. For obtaining high potential isolates a preliminary screening was done employing Pseudomonas minimal agar plates with 500 ppm phenol. Among the five high tolerant bacteria, further secondary screening was conducted applying 800 ppm of phenol in liquid media. Five microbial strains (designated as PU1, PK2, PK3, PK4 and PF6)

Proceedings of the International Conference on Environmental Aspects of Bangladesh (ICEAB 2011)
166
obtained as described above were maintained as pure culture over minimal agar slants at 4oC for further studies. The most tolerant isolate was finally characterized on the basis of morphological, cultural and biochemical properties [25]-[27].
C. Identification of the Isolate
The selected bacterial isolate PU1 was identified by morphological and biochemical characterization as per the Bergey‘s Manual of Systematic Bacteriology [28]-[29]. Bergey‘s Manual of Determinative of Bacteriology [30] and ‗ABIS6‘ online software (accessed on 20 January 2011) [31] were used as a reference to identify the isolate.
D. Cultural conditions
Isolate PU1 was used to inoculate in nutrient broth (1.3%, w/v) and incubated at 30oC for 24 h with agitation at 120 rpm. The harvested cells were centrifuged at 5000 rpm for 10 minutes and washed twice with 0.01M sodium phosphate buffer and
final pellet resuspended in the same buffer. Five ml of bacterial suspension (≈106 to 108) [21] was used to inoculate 95 ml sterile minimal medium containing appropriate phenol concentration in 250 ml conical flasks and incubated in an orbital shaker at 120 rpm at 30 °C. Samples were aseptically removed at regular intervals and analyzed for cell growth and phenol removal. Cells were removed by centrifugation at 5000 rpm for 10 minutes and the supernatants were analyzed for phenol removal.
E. Measurement of cell growth and phenol removal
Growth was measurement at 660 nm (OD660) [32] using UV-spectrophotometer (Shimadzu 1601). Phenol concentrations were determined by using the 4-aminoantipyrene colorimetric method based on the procedure detailed in Standard Methods for the Examination of Water and Wastewater [33]. The experimental data obtained from this study was analyzed using Sigma plot 7 (2001) and Microsoft Office Excel 2007.
RESULTS AND DISCUSSIONS
A. Isolation and screening of phenol degrading bacterial cultures
Sample soils were cultivated on Pseudomonas minimal media containing 200 ppm of phenol as sole carbon and energy source at 30ºC. Five phenotypically different colonies (PU1, PK2, PK3, PK4 & PF6) were picked from the plates and transferred to fresh Pseudomonas minimal agar plates with 400 ppm of phenol for purification [34]. All these isolates were grown on solid minimal medium containing 600 ppm of phenol as sole carbon and energy source within 72 hours. However, only the isolate PU1 and PK3 were shown their ability to grow on solid media containing 800 ppm of phenol. The microbial strain PU1 was finally selected as most tolerant isolate by performing liquid culture with 800 ppm of phenol as sole carbon and energy source.
B. Identification
The isolate PU1 was short-rod and round in shape, Gram negative, gave positive catalase and
oxydase activity. It gave negative result for methyl
red and indole test. Isolate PU1 also gave positive result for Voges-proskauer test and able to hydrolyze gelatin. The strain utilized glucose, fructose, sucrose, xylose and sorbitol but did not utilize rhamnose, arabinose, and lactose. On account of morphological, biochemical and carbohydrate utilization tests, it was identified as Pseudomonas fluorescens [30]-[31]. Finally, the isolate was designated as Pseudomonas fluorescens PU1.
C. Phenol degradation and cell growth by Pseudomonas fluorescens PU1.
P. fluorescens PU1 strain was allowed to grow for 72 h in the Pseudomonas minimal medium containing phenol at different concentrations as the sole source of carbon and energy. This isolate could completely degrade phenol up to 600 ppm in 24 hours and at this time the bacterial cell growth (i.e., OD660) was 0.873, where the initial OD660 was 0.110. After 24 hours the cell density was recorded to be decreased with time (Fig 2) since absence of carbon source.
Fig. 1. Removal of various concentration of phenol by P.
fluorescens PU1 when supplied as the sole source of
carbon and energy. Data points represent the means and
standard deviations of results from three independent
experiments. The standard deviation is less than the size
of symbols if no error bars are seen
Pseudomonas fluorescens PU1 also completely degraded 800 ppm and 1000 ppm of phenol in 72 h, whereas it degrades about 99% of phenol in 48 h as well (Fig 1). The highest cell growth as measured by OD660 was found at 72 h for 800 ppm and 1000 ppm
of phenol as 0.999 and 1.055, respectively (Fig 2). The results (Figs 1 & 2) exhibited that, the phenol removal correlated with growth of bacteria and the highest growth of bacteria was found in case of 1000 ppm phenol when complete degradation occurred. It was observed that in case of 1200 ppm of phenol, isolate PU1 showed lower efficiency in phenol degradation and it could degrade only 6.45 per cent phenol within 72 h. The growth of PU1 was inhibited with 1200 ppm phenol and OD660 was only 0.183. The result indicated that the isolate PU1 had a longer acclimatization time (higher than 72 h) to start degradation of 1200 ppm phenol which ultimately resulted very slow growth at this phenol concentration. The removal rate of phenol at different concentration by P. fluorescens PU1 was observed and it is significant in the sense that
0
200
400
600
800
1000
1200
1400
0 24 48 72 96
600 ppm
800 ppm
1000 ppm
1200 ppm
Ph
en
ol c
on
cen
tra
tio
n (p
pm
)
Incubation time (h)

Proceedings of the International Conference on Environmental Aspects of Bangladesh (ICEAB 2011)
167
phenol removal rate was directly related to the cell growth (Table 1). The removal rate was increased with the increasing concentration of phenol upto 1000 ppm. At 1200 ppm cell growth was inhibited although PU1 still had a slower removal rate at this concentration.
Fig. 2. The growth of P. fluorescens PU1in different phenol
concentration at different time intervals. Data points
represent the means and standard deviations of results
from three independent experiments. The standard
deviation is less than the size of symbols if no error bars
are seen
A number of aerobic phenol degrading bacteria have been described previously by other researchers [16]-[17], [19]. The concentration of phenol and presence of halo substrates seems to play a crucial role on degradation shown in our study and also reported by others. High concentrations of phenol are usually inhibitory to growth of organisms [19], [35]. In the present
investigation, the P. fluorescens PU1 was found to be highly efficient in phenol degradation. Thus, the study has provided a potential phenol degrading isolate that can be effectively used to promote the phenol degradation in the contaminated sites as well as waste water treatment system. Table 1. Phenol removal rate and removal efficiency of the
P. fluorescens PU1
Phenol
(ppm)
Incubation
time
(h)
Removal
rate
(ppm/h)
Removal
efficiency
(%)
600
24 25
100 48 -
72 -
800
24 19.583
100 48 13.420
72 0.333
1000
24 6.833
100 48 34.460
72 0.375
1200
24 0.375
6.45 48 1.792
72 1.040
REFERENCES
[1] LL Rocha, CR De Aguiar, RM Cavalcante, RF Do
Nascimento, SCS Martins, ST Santaella and VMM
Melo. 2007. Isolation and characterization of
phenol-degrading yeasts from an oil refinery
wastewater in Brazil. Mycopathologia, 164: 183–188.
[2] N Ruiz-Qrdaz, JC Riuz-Luganez, JA Castanon-
Gonzalez, E Hernandez-Manzano, E Cristiani-Urbina,
and J Galindez-Mayer. 2001. Phenol biodegradation
using a repeated batch culture of Candida Tropicalis
ina multistage bubble column. Revista Latinoamericana de Microbiologia, 43: 19-25.
[3] H Liu, X Liu, Gao, DJ Leak and N Zhou. 2005.
Arg169 is essential for catalytic activity of
3-hydroxybenzoate 6-hydroxylase from Klebsiella
pneumoniae M5a1. Microbiological Research.
[4] M Carmona, A De Lucas, JL Valverde, B Velasco and
JF Rodríguez. 2006. Combined adsorption and ion
exchange equilibrium of phenol on Amberlite
IRA-420. Chem. Eng. J., 117: 155–160.
[5] A Hamad, M Aidan, Fayed and M Mehrvar. 2005.
Experimental investigation of phenolic wastewater
treatment using combined activated carbon and UV
processes. Clean Technol. Environ. Policy, 7: 177–
181.
[6] W Kujawski, A Warszawski, W Ratajczak, T Porębski,
W Capała, and I Ostrowska. 2004. Removal of phenol
from wastewater by different separation techniques.
Desalination, 163: 287–296.
[7] Z Lazarova and S Boyadzhieva. 2004. Treatment of
phenol-containing aqueous solutions by
membrane-based solvent extraction in coupled
ultrafiltration modules. Chem. Eng. J., 100: 129–
138.
[8] M Tomaszewska, S Mozia and AW Morawski. 2004.
Removal of organic matter by coagulation enhanced
with adsorption on PAC. Desalination, 161: 79–87.
[9] J Wu, K Rudy and J Sapark. 2000. Oxidation of
aqueous phenol by ozone and peroxidase. Adv. Environ. Res., 4: 339–346.
[10] BR Kauffmann, Petersen and MJ Bjerrum. 1999.
Enzymatic removal of phenols from aqueous
solutions by Coprinus cinereus peroxidase and
hydrogen peroxide. J. Biotechnol., 73: 71–74.
[11] M Vidali. 2001. Bioremediation. An overview,‖ Pure Appl. Chem., 73: 1163–1172.
[12] LD Collins and AJ Daugulis. 1997. Characterization
and optimization of a two-phase partitioning
bioreactor for the biodegradation of phenol. Applied Microbiol. Biotechnology, 48: 18-22.
[13] RM Atlas and R Unterman. 1999. Bioremediation In: Industrial Microbiology & Biotechnology. 2nd Ed,
ASM Press, Washington. pp. 666-681.
[14] E Diaz. 2008. Microbial Biodegradation: Genomics
and Molecular Biology (1st ed.). [Online] Caister
Academic Press, ISBN 978-1-904455-17-2, Access
date December 25, 2010.
[15] PMV Schie and LY Young. 2000. Biodegradation of
phenol: mechanisms and applications.
Bioremediation J., 4: 1-17.
[16] SA Jame, AKM Rashidul Alam, ANM Fakhruddin,
and MK Alam. 2010. Degradation of Phenol by Mixed
Culture of Locally Isolated Pseudomonas Species. J. Bioremed. Biodegrad., 1:102.
[17] S Wasi, S Tabrez and M Ahmad. 2010. Isolation and
Characterization of a Pseudomonas fluorescens Strain Tolerant to Major Indian Water Pollutants. J. Bioremed. Biodegrad., 1:101.
[18] H Movahedyan, H Khorsandi, R Salehi and M.
Nikaeen. 2009. Detection of phenol degrading
bacteria and Pseudomonas putida in activated
sludge by Polymerase Chain Reaction (PCR). Iran J.
of Environ. Health Sci. Eng., 6: 115-120.
OD
at
66
0 n
m
Incubation time (h)
0
0.2
0.4
0.6
0.8
1
1.2
1.4
0 24 48 72 96
600 ppm
800 ppm
1000 ppm
1200 ppm

Proceedings of the International Conference on Environmental Aspects of Bangladesh (ICEAB 2011)
168
[19] J Lin, M Reddy, V Moorthi and BE Qoma. 2008.
Bacterial removal of toxic phenols from an industrial
effluent. Afr. J. of Biotechnol, 7(13): 2232-2238.
[20] M Mailin and R Firdausi. 2006. High Performance
Phenol Degrading Microorganism Isolated from
Wastewater anf Oil-Contaminated Soil. Malaysian J.
of Microbiol., 2(2): 32-36.
[21] CJ Goulding, Gillen and E Bolton. 1988.
Biodegradation of substituted benzenes. J. Appl. Bacteriol., 65: 1-5.
[22] APHA. 1975. Standard Methods for the examination
of water and wastewater (14th ed.). APHA, AWWA,
WEF, Washington.
[23] J Lederberg, L Cavali and EM Lederberg. 1952. Sex
compatibility in E. coli. Genetics, 37: 720-730.
[24] MSSharp and ST Lyles. 1969. Laboratory instruction
in the biology of microorganisms. st. Louis. The C.V.
Masby Company, pp. 23-25.
[25] M Goodfeelow. 1994. Bergey‘s manual of
determinative bacteriology (9th ed.). Williams and
Wilkins. London.
[26] JG Holl, NR Kreig, PHA Sneath, JT Staley and ST
Williams (Eds.). 1994. Bergey‘s Manual of
Determinative bacteriology (9th ed.). Williams and
Wilkins, Baltimore, Maryland, USA.
[27] CH Collins and M.P. Lyne. 1987. In: Microbiology
methods,‖ Butterworth and Co Ltd., vol. 32.
[28] GJ Tortor BR Funke and CL Case. 2004.
Microbiology: An introduction. Pearson Benjamin
Cumming, United State.
[29] JG Holt. 1993. Bergey‘s manual of determinative
bacteriology (9th ed.). Williams & Wikilins, New York.
[30] RF Buchanan and NF Gibbons. 1984. Bergey‘s
Manual of Determinative Bacteriology (9th ed).
Baltimore, Williums and Wilkins Co.
[31] ‗ABIS6‘ online-bacteria identification software,
http://www.tgw1916.net.bacteria_logare.html,
accessed on Jan 9, 2011.
[32] AM Hannaford and C Kuek. 1999. Aerobic batch
degradation of phenol using immobilized
Pseudomonas putida. J. of industrial microbial. and
Biotechnol., 22: 121-126.
[33] APHA. 1998. Aggregate organic constituents, in
Standard Methods for the Examination of Water and
Wastewater, (A.E. Greenberg, L.S. Clesceri, & A.D.
Eaton eds.), 20th edn, 1998, pp. 5.31-5.33. APHA,
AWWA & WEF.
[34] A Mutzel, UM Reinscheid, G Antranikian and R
Muller. 1996. Isolation and characterization of a
thermophilic Bacillus strain, that degraded phenol
and cresol as sole carbon source at 70oC. Appl.
Microbiol. Biotechnol., 46: 593-596.
[35] LG Torres, A Sanchez-de-la-Vega, A Norma, Beltran
and BE Jimenez. 2000. Production and
characterization of a Ca-alginate biocatalyst for
removal of phenol and chlorophenols from
wastewaters. Apartado Postal, pp. 470-472.

Proceedings of the International Conference on Environmental Aspects of Bangladesh (ICEAB 2011)
169
A4.003
Microbial Degradation of Polyethylene Film Waste
Sangeeta Raut1*, Suvendu Manna2, Sougata Roy Choudhury2,
Manisha Sharma2, Ramkrishna Sen3 and Basudam Adhikari2
1Department of Biotechnology, G.I.E.T, Gunupur 765022, India 2Materials Science Center, IIT, Kharagpur 721302, India
3Department of Biotechnology, IIT, Kharagpur 721302, India *Corresponding Author: e-mail: [email protected], Tel : +919438450789
Abstract
Microbial degradation of low density polyethylene (LDPE) films has been described as materials not vulnerable to
aerobic microbial attack. The purpose of this study was to investigate the biodegradation of disposable LDPE films.
Fourier transform infrared spectroscopy (FTIR), scanning electron microscopy (SEM), tensile strength, X-ray diffraction,
contact angle and weight loss were used to evaluate the changes in morphological, structural and surface chemical
composition as a result of biodegradation of LDPE exposed to the fungus Curvularia lunata and microorganisms
isolated from soil .
Different pre-treated LDPE samples were exposed to the fungus Curvularia lunata for 90 days. Percentage of weight loss
was 12.1% which showed the biodegradability of the pre-treated (heat + UV) LDPE samples. SEM shows biofilm
formation on the surface of the pre-treated LDPE samples. The pits were observed on the surface which suggested that Curvularia lunata penetrated into the polyethylene matrix during degradation making the strips physically weak.
INTRODUCTION
Polyethylene (PE), a thermoplastic commodity, is heavily used in consumer products (notably the plastic shopping bag). However, because of its xenobiotic origin and recalcitrant nature, its biodegradation is problematic and it accumulates at a rate of 25 million tons per year [7]. Polyethylene is one of the most inert plastic materials and its recalcitrant nature results from its high molecular weight, complex three-dimensional structure, and hydrophobic nature [6], all of which interfere with its availability to microorganisms. Despite of their wide applicability, the main limitation to their use is the fact that polyethylene adversely affects the environment.
Thus, to deal with this environmental menace, biodegradation appears to be the best choice, as the other two approaches, land filling and incineration, have their own limitations. However, according to some reports, partial biodegradation of polyethylene could be achieved after UV irradiation [4], thermal treatment [2], and/or oxidation with nitric acid [3]. Biodegradation resulting from the utilization of polyethylene as a nutrient (i.e., a carbon source) may be more efficient if the degrading micro-organism forms a biofilm on the polyethylene surface. However, the hydrophobicity of the polyethylene interferes with the formation of a microbial biofilm. Attempts to facilitate colonization of polyethylene by adding nonionic surfactants to the culture medium promoted the biodegradation of polyethylene [1], [4]. Presumably, the surfactant increased the hydrophilicity of the polyethylene surface and thus facilitated the adhesion of bacteria to the polymer. The ability of bacterium to form a biofilm on polyethylene was attributed to the hydrophobicity of its cell surface [5]. Searching for a solution is an ongoing process.
MATERIALS AND METHODS
Nutrient broth was obtained from Himedia Laboratories Pvt. Ltd., Mumbai-400086, India and ISO (9001-2000) certified. Isolation of microorganisms
from three different soil samples was done by serial dilution method and cultured for the purpose of degradation of LDPE films. Standard commercial LDPE films were procured from Reliance Industries Ltd. The initial weights of the cut LDPE film pieces were noted down. The corpora were sterilized.
A. Pre-treatment and microbial degradation of LDPE films
One set of LDPE strips were heated at 70˚C in an oven for 6 h. Another set of pre-weighed LDPE films was kept under UV laminar hood overnight. The third set was subjected to the combined exposure of both heat and UV. Pre-treated LDPE films were exposed to the fungus Curvularia lunata and left for 90 days.
B. Characterization of degraded PE films
Carbonyl absorbance: The degree of oxidation may be experimentally evaluated from the change in the content of carbonyl groups produced in the polymer. FTIR analysis measured this property.
Crystallinity: X-ray diffraction was used to measure the degree of crystallinity. Differential scanning calorimetric (DSC) analysis was also used to estimate the change in the degree of crystallinity by measuring changes in enthalpy.
Mechanical properties: Degradation of the PE film was roughly evaluated from the loss of mechanical strength. The mechanical properties (elongation at
break, tensile strength, etc.) were measured by a Universal Tensile Testing Machine.
Physical properties: The measurement of density of the polymer is an important parameter as it is connected with its crystallinity and its molecular weight.
RESULTS AND DISCUSSIONS
A. Weight loss during bacterial degradation
The biotically treated PE films after being exposed to bacteria for a period of 40 days were found to exhibit a loss in mass and tensile strength (TS). This loss in mass may be due to the utilization of the

Proceedings of the International Conference on Environmental Aspects of Bangladesh (ICEAB 2011)
170
oxygenated surface layer of the polymer film, which promotes the growth of bacteria.
B. Weight loss during fungal degradation
The changes in the weight of the pre-treated LDPE films exposed to Curvularia lunata is illustrated in Table I. There was an increase in weight because of the Curvularia lunata cell accumulation on the film. After the washing of the films there was a decrease in the weight. The percent weight loss of the pre-treated LDPE films exposed to Curvularia lunata was found to be 12.1% after 90 days of exposure.
Fig. 1. Weight loss (%) of pre-treated LDPE films exposed
to Curvularia lunata
Fig. 1 shows the gradual weight loss of the polyethylene film caused by the action of Curvularia lunata. In a span of 90 days culture about 12% weight loss of LDPE film was observed indicating a degradation by C. lunata.
Table 1. Weight loss of pre-treated LDPE films exposed to
Curvularia lunata
Pre-Treatment(s) Weight loss (%)
30 Days 60 Days 90 Days
Heat (60 oC) 2.48 6.56 9.05
UV (12 h) 6.89 8.78 10.94
Heat + UV (12 h) 9.90 9.34 12.1
Tensile strength: The initial tensile strength (TS) and percentage elongation at break (EB) for PE film were 47.1 ± 1 MPa and 143.2 ± 5%, respectively.
The tensile strength is related to the changes in the molecular weight of the polymer. Thus changes of the molecular weight during degradation affect directly the tensile strength. LDPE film presented a decrease in the value of tensile strength of about 37·5%.
Contact angle measurements: Contact angle measurement on the PE films was done in order to see the change in hydrophobicity / hydrophilicity as a result of bacterial degradation. The results are shown in Table II. The initial contact angle of the PE film was 80.6 ± 3.5°, which decreased to 46.0 ± 3.5° as a result of biotic degradation. This lowering of the contact angle is an indication of the increase in the hydrophilicity of the polymer surface. After the LDPE film was exposed to the biotic environment for
40 days, the wettability and the associated hydrophilicity of the polymer surface increased further, with the contact angle decreasing to 46.0 ± 3.5°. There was, however, no such decrease in the contact angle for the control set of sample.
Table 2. Contact angles for different samples after 40 days
of degradation.
Samples Initial contact angle
(degree)
Final contact angle
(degree)
1 80.6 48.3
2 78.5 46.3
3 79.5 46.0
C. Fourier Transform Infrared Spectroscopy (FTIR) analysis
PE samples were placed on a ZnSe window and analyzed on a FTIR spectrophotometer in ATR mode. Relative intensities of carbonyl band at 1715 cm-1 and double bond band at 1653 cm-1 to that of –CH2- band at 1465 cm-1 were evaluated. Each index is a relative measure of carbonyl groups and double bond concentration, respectively. Structural changes in biotically treated PE were analyzed regularly by FTIR and a significant reduction in the carbonyl peak intensity (1714 cm−1) as well as 1180 cm−1 band was observed, indicating the utilization of oxygenated segments of PE and assimilation by bacteria. Fig. 2 depicts the FTIR spectra of biotically treated LPDE films as a
function of bacterial exposure time.
Fig. 2. FTIR of PE films (after 40 days of exposure to bacteria)
The films were scanned between 500 to 4500 cm⁻¹. After the fungal degradation, the polyethylene strip showed changes in the FTIR spectra in comparison to the typical spectrum of the pure polyethylene strip. Significant peaks were observed. One main characteristic band was observed in the degraded samples which were not found in the other samples. This band was observed in the vicinity of 1624 cm-1 and assigned to the C=O group.
This represents that the polyethylene strip might have become hydrophilic. Absorption bands of 2300 to 3500 cm-1 (associated with O-H group) indicated the presence of carboxylic group. Absorption band appeared at 1453 cm-1 was due to the C-O. The bands appeared at 996 to 1081 cm-1 was due to the C-H group. The band appeared at 1376 cm-1 was due to the C-H bonding.

Proceedings of the International Conference on Environmental Aspects of Bangladesh (ICEAB 2011)
171
Fig. 3. FTIR of pre-treated PE films exposed to Curvularia
lunata (after 30 days)
D. Thermal analysis
From the TGA curves we can highlight the change in thermal stability of the degraded polymer. It is seen that the PE samples after exposure to
microorganisms for 40 days, were found to decrease in thermal stability.
Fig. 4. TG of PE films
(after 40 days of exposure to bacteria)
Fig. 5. DTG of PE films
(after 40 days of exposure to bacteria)
E. Surface morphology
Scanning electron microscopy was used to
investigate the changes in the surface morphology of the films. The SEM photographs indicate bacterial adhesion and biofilm formation on the polymer surface for films exposed to biotic environment. The biological attack generally begins with the colonization on the polyethylene surface by the bacteria. The adhesion was scattered, not uniform, indicating that the amorphous region of the polymer was more susceptible to microbial adhesion and degradation. It has been reported previously that the microbial growth is mainly concentrated around the fissures resulting from the abiotic attack, but is minimum inside the fissures, which suggests that the low molecular nutrients migrate to the surface from the bulk of the polymer.
Fig. 6. Untreated LDPE sample before biodegradation
Fig. 7. Sample 1 after 40 days biodegradation
Fig. 8. Sample 2 after 40 days biodegradation
Fig. 9. Sample 3 after 40 days biodegradation
SEM photomicrographs of samples before fungal growth show a smooth surface with little or no defects. After fungal growth, the LDPE film surface became hydrophilic. This indicated that the
control
heat
heat +uv
uv
fungi treated
3269
1624
1454
10782914
4000 3500 3000 2500 2000 1500 1000 500
abso
rban
ce (
a.u
)
wave number (cm-1)
1376

Proceedings of the International Conference on Environmental Aspects of Bangladesh (ICEAB 2011)
172
microorganisms could spread their colonies over the surface. After fungal degradation, the samples (Fig. 10) showed the adherence of microorganisms on polyethylene strips. Biofilm formation is seen by C. lunata on PE films (Fig. 11). After washing away the adhered microorganisms, some pits and eroded regions are visible on the film surface (Fig. 12). This suggests that the fungi penetrated into the polyethylene matrix during degradation making the strips physically weak.
Fig. 10. Adherence of C. lunata to the PE films
Fig. 11. Biofilm formation by C. lunata on PE
Fig. 12. PE strip after 30 days degradation by C. lunata
F. X-ray diffraction (XRD)
Changes in crystalline morphology of LDPE films were analyzed by using the X-ray diffraction technique (XRD). The XRD patterns were recorded with a Philips horizontal goniometer (PW 1380/60) fitted with a scintillation counter, a pulse-height analyzer, and a graphite crystal monochromator placed in the scattered beam.
Fig. 13. XRD of Untreated PE films
Fig. 15. XRD of PE films
(after 45 days of exposure to bacteria)
CONCLUSION
Degradability of polymeric materials is a function of the structures of polymeric materials. The microbial population in appropriate environmental conditions encourages microbial growth. The result obtained due to the exposure of LDPE film to fungi under sterile conditions indicate that these fungi are able to grow on the polyethylene strips. The results from weight loss, FTIR and SEM showed that C. lunata utilized polyethylene as a carbon source. Results here show that Curvularia lunata can degrade polyethylene films.
REFERENCES
[1] AC Albertsson, C Sares and S Karlsson. 1993.
Increased biodegradation of LDPE with nonionic
surfactants. Acta Polymerica, 44: 243–246.
[2] AC Albertsson, B Erlandsson, M Hakkarainen, and S
Karlsson.. 1998. Molecular weight changes and
polymeric matrix changes correlated with the
formation of degradation products in biodegraded
polyethylene. J. Environ. Polym. Degrad., 6: 187-195.
[3] BS Brown, J Mills, and JM Hulse. 1974. Chemical and
biological degradation of plastics. Nature. 250:161- 163.
[4] JH Cornell, AM Kaplan and MR Rogers. 1984.
Biodegradation of photooxidized polyalkylenes. J. Appl. Polym. Sci., 29: 2581-2597.
[5] K Ehara, Y Lioyshi, Y Tsutsumi and T Nishida. 2000.
Polyethylene degradation by manganese peroxidase
in the absence of hydrogen peroxide. Journal of Wood Science, 46: 180–183.
[6] D Hadad, S Geresh and A Siva. 2005. Biodegradation
of polyethylene by the thermophilic bacterium
Brevibacillus borstelensis. J. Appl. Microbiol., 98:
1093 -1100.
[7] Y Orhan and H Buyukgungor. 2000. Enhancement of
biodegradability of disposable polyethylene in controlled
biological soil. Int. Biodeterior. Biodegrad, 2000: 45-49.
0 10 20 30 40
0
500
1000
1500
2000
2500
3000
Inte
nsi
ty
raw PE(untreated)

Proceedings of the International Conference on Environmental Aspects of Bangladesh (ICEAB 2011)
173
A4.004
Safety Assessment for Casting Calcium Carbonate
with Shredder Residue Ash
T Oike1, K. Ito1, K Kakimoto2, N Yukihira3 and S Manabe4
1Department of Civil Engineering, Kyushu Institute of Technology, Fukuoka, Japan 2Department of Materials Science and Engineering, Kyushu Institute of Technology, Fukuoka, Japan
3Tagawa Sangyo Co., Ltd., Japan 4Sepa-Sigma Inc., Japan
Abstract
Ca(OH)2 hardens by absorbing CO2 and transforms into casting calcium carbonate (CCC). In case of adding inorganic
waste material into CCC, it can also immobile particles of heavy metals. However, it has not been yet confirmed if the
captured toxins may affect the performance of CCC. In this report, the authors intend to show the relationship between
the high lead content of shredder residue ash and the lead elution value of CCC manufactured with the shredder
residue ash. As a result, with an increase in forming pressure, the lead‘s elution value decreased, and the
non-carbonated samples indicated higher elution value than the carbonated samples. In the case of the carbonated
samples, the elution values were under 1.50 ppm at over 50 N・mm-2, and the lowest value was 1.00 ppm at 300 N・mm-2
of forming pressure.
INTRODUCTION
The amount of waste material has been constantly increasing, while the remaining allocated space at disposal site has been decreasing. In order to reduce the waste materials, a wide variety of recycling technologies is used to manufacture recycled products or for a more efficient use of office equipment, building materials and thermal recycling. In Japan, for example, plastics shredder residue is used to make clothes. Sewage sludge ash and coal fly ash are used in the manufacture of cement, bricks, etc. However, the problem of the remaining disposal site is still recognized as an urgent issue, especially for urban communities. To resolve the problem, we need more innovative recycling technologies, which can help create high-quality and more environmentally-friendly products. This is the meaning of a sustainable technology.
The authors recommend the casting calcium carbonate technology. The casting calcium carbonate (CCC) is a pressed compact with high forming pressure, which went through the carbonation reaction [1][2]. Ca(OH)2, the main component of CCC, hardens by absorbing CO2 and transforms into CCC which has high bending strength[3][4]. The CCC is a green and low-energy consuming technology which doesn‘t need a thermal process used to manufacture tiles or bricks as a building material. In addition, CCC allows various product designs due to its non-baking process. The technology also allows the core components of the material to be easily pre-mixed with inorganic recycled or waste materials (such as coal ash) at the
production stage, forming the final product. In the case of adding sewage sludge ash into CCC, it can immobile particles of heavy metals through the carbonation reaction of slaked lime [5], while the final product‘s strength will not compromised. Since recently, such recycled product is being manufactured by one private company. Especially using sewage sludge ash and coal fly ash, as they are relatively easier to use due to the low content of heavy metals. However, it has not yet been sufficiently confirmed how waste powder will affect the performance of CCC. In order to learn of the effects
from toxic heavy metals, it would be useful to use waste materials as recycled product components.
In this report, we intend to show the relationship between the high lead content of shredder residue ash and the lead elution value of CCC manufactured with the shredder residue ash.
METHODS
Fig.1 shows the CCC production flow. The lime
stone is burned in a kiln at approximately 1,000 C and turns into quick lime (CaO). After reacting with water, it becomes slaked lime (Ca(OH)2), which is a main component of CCC. The mixture of raw materials consists of slaked lime and aggregates, which can be inorganic waste materials such as sewage sludge ash and coal fly ash. The powdered
mixture is then mixed with 4% of water and pressed in a metal mold at vacuum condition (over -100 kPa) by a special super-high pressure vacuum press machine (Tagawa Sangyo Co.,Ltd., the mold size: 400x400xt400mm). Once compressed, the pressed compact is then cured for 8 hours at a room temperature, and then reacts with CO2 in the carbonation room (Tagawa Sangyo Co.,Ltd., the room size: 1.5x3.5xt1.8m), finally turning into CCC. The CO2 gas for the carbonation process is directed from the kiln of burning limestone. The concentration of CO2 gas is approximately 39 %.
Fig.1. Manufacturing process of casting calcium carbonate.

Proceedings of the International Conference on Environmental Aspects of Bangladesh (ICEAB 2011)
174
PREPARATION OF SAMPLES
A. CCC samples
Table.1 shows the sample preparation conditions. In this experiment, 8 samples were manufactured
with 40% of slacked lime, 60% of shredder residue ash, at four conditions of forming pressure and two cases of carbonation: non-carbonated (0 hr) and carbonated (8 hr) samples.
An average particle size of the slacked lime was approximately 10 um as manufactured by Tagawa Sangyo Co. Ltd.
The shredder residue ash was a burned ash of shredder residue of waste plastic, electronic waste and waste automobile components. The content of lead of the shredder residue ash was approximately
8,000 ppm (0.8 %). In the case of 300 N・mm-2,
cracking was often observed on the surface of the CCC samples.
Table 1. Sample preparation conditions.
Sample Forming
pressure
/N mm-2
Slacked
lime
/ %
Shredder
residue
ash/%
Carbonation
curing time
/ hr
1-1 30
40 60 0 1-2 50
1-3 100
1-4 300
2-1 30
40 60 8 2-2 50
2-3 100
2-4 300
B. Carbonation
The investigated quality of the CO2 gas is shown in Fig.2. The relative humidity was over 94 %. The
temperature range was 14.2 C – 23.5 C. The
concentration of CO2 gas was 22 % - 40 % and the average was approximately 39 %.
Fig. 2. Atmosphere of the carbonation curing box.
:Temperature/ C, :Humidity/ %RH,
:Flow rate/ m・s-1, :Conc. of CO2/ %
Fig.3 shows the inside atmospheric conditions of the carbonation curing box with 50 samples of CCC. The humidity kept at 100%RH. The temperature started to increase from minute 35. After 130 minutes, the temperature reached its peak value of
19.9 C. Then it started to decrease and remained
unchanged from minute 167 at 29.2 C. The
samples were taken out from the carbonation room at the minute 200.
Fig. 3. Change in temperature of the carbonation room.
C. Elution test for Lead
The method of announcement No. 46 by the Environmental Agency was employed for the elution test in this experiment. The non-carbonated samples were preserved without CO2 gas. After grinding CCC with ceramic mortar, the waste particles of less than 2 mm were selected for the elution test. They were then mixed with distilled water to be 10 wt% of the particles. The solution was continually shacked in a shacking apparatus at 200 times a minute for 6 hours. As a next step, the solution was filtered by a 0.45 um membrane filter, and then finally used as a suspected solution. The concentration of lead was checked using a scanning lead analyzer.
D. Bending strength test
The bending strength test was carried out
according to the JIS A 5209 of Japanese industrial standards for porcelain ceramic tile. The test samples were cut as 400 x 400 x t10-14 mm from the CCC original sample. Only CCC samples without cracks were tested.
For the purpose of a bending strength test, special bending equipment was used, as shown on Fig.4.
Fig. 4. Bending strength test apparatus.
The CCC samples were put on two supporting bars, which were 120 mm from each other, and then pressed at the center of the sample by load cell. Then the material‘s breaking strength was recorded
0
20
40
60
80
100
120
5 10 15 20 25 30 35 40 45 50 55 60 65 70 75 80
Atm
osphere
/
/%R
H /
m・s-1
/%-C
O2
Time /min
25
25.5
26
26.5
27
27.5
28
28.5
29
29.5
30
0
20
40
60
80
100
120
140
160
180
200
Tem
pera
ture
/
Time/ min

Proceedings of the International Conference on Environmental Aspects of Bangladesh (ICEAB 2011)
175
and a bending strength F(N ・ mm-2) could be
calculated by (1).
F = 30・P・B-1・D2 (1)
Where P is a breaking strength (N), B is width (mm) and D is thickness (mm) of the test samples.
According to JIS A 5209, the minimum required bending strength for a porcelain ceramic tile is 60
N・cm-1, which means that the bending strength F
must be at least 4.8 N・mm-2 for 13 mm of thickness
of the test sample.
RESULTS AND DISCUSSIONS
A. Elution test
The elution test results are shown in Fig.5. As a result, with an increase in forming pressure, the lead‘s elution value decreased, and the non-carbonated samples indicated higher elution value than the carbonated samples. At the same time, the carbonated samples had a larger downward tendency of the elution value with an increase in forming pressure. The elution value of non-carbonated samples always exceeded 3.00 ppm of the forming pressure.
In the case of the carbonated samples, the elution
values were under 1.50 ppm at over 50 N・mm-2,
and the lowest recorded value was 1.00 ppm at 300
N・mm-2 of the forming pressure.
Fig. 5. Elution test results for lead.
:Non-carbonated, : Carbonated
As for the decrease in the elution value of lead,
the lead oxide may change into lead ion in the high alkalinity solution of calcium hydroxide. It would then react with CO32- inside of CCC and change to lead carbonated as a poorly-soluble compound.
Fig. 6. Bending strength test results.
:Non-carbonated, : Carbonated
B. Bending strength test
The investigated bending strength is shown in Fig.6. The bending strength value showed an upward tendency with the increase of pressure. Under 50 N+mm-2 of the non-carbonated sample was lower than the minimum required bending strength of 4.80 N+mm-2. All samples of the carbonated samples exceeded the minimum required bending
strength, and at 100 N・mm-2 of forming pressure, the
strength reached its highest value of 7.18 N・mm-2.
In the case of the forming pressure reaching 300 N・mm-2, cracking was often observed on the surface of the CCC samples. These results indicated that CCC
with shredder residue ash formed with 100 N・mm-2
of pressure achieves an optimum performance of elution value, bending strength and in appearance.
As for the slight decrease in the binding strength
from 50 N・mm-2 to 100 N・mm-2 of forming pressure,
the densification of CCC by higher forming pressure may be a factor for the apparent attenuation of CO2 absorption [6]. Thus, the carbonation reaction may
decrease with the forming pressure over 100 N・mm-2.
CONCLUSION
As a result, with an increase in forming pressure, the lead‘s elution value decreased, and the non-carbonated samples indicated higher elution value than the carbonated samples.
In the case of the carbonated samples, the elution
values were under 1.50 ppm at over 50 N・mm-2,
and the lowest value was 1.00 ppm at 300 N・mm-2
of the forming pressure. The bending strength value showed an upward tendency with the increase of pressure. All carbonated samples exceeded the
minimum required bending strength, and at 100 N・mm-2 of forming pressure, the bending strength
reached its peak value of 7.18 N・mm-2.
In the case of the forming pressure reaching 300
N・mm-2, cracking was often observed on the surface
of the CCC samples. These results indicated that
CCC with shredder residue ash formed with 100 N・mm-2 of pressure achieves optimum performance of elution value, bending strength and in appearance.
REFERENCES
[1] O Matsuda and H Yamada. 1973. Investigation of the
manufacture of building materials by carbonation
hardening of slaked lime. J. Soc. Inorg. Mater. Japan (Sekko to sekkai) , 125: 170-178
[2] K Kamiya, M Tohmoto, M Yada and H Nasu. 1998.
Recovery of Calcium from Waste Concrete and Fixation
of Carbon Dioxide Gas by Carbonation Reaction.
Japan Ceramic Association, 106: 719-723
[3] O Matsuda. 1981. Carbonation hardening of slaked lime.
J. Soc. Inorg. Mater. Japan (Sekko to sekkai) , 170: 35-39
[4] T Yasue,Y Kojima, Y Arai. 1994. Research trend of lime.
J. Soc. Inorg. Mater. Japan (Muki-materiaru), 1: 370-379.
[5] K Fujita, T Shimaoka and S Kenmoku. 2004. Influence of
Carbon Dioxide on Removal and Capture of Lead Ions by
Molten Slag. Japan Waste Material Society, 15: 302-309.
[6] S Arinaga, M Norimasa, N Terao, N Yyukihira and T
Taniguchi. 2003. Carbonation of non-burnt casting
ceramics pressed in vacuum condition. Japan Architectural Society,574: 15-20
0.00
0.50
1.00
1.50
2.00
2.50
3.00
3.50
4.00
0 50 100 150 200 250 300 350
Elu
tio
n v
alu
e/
pp
m
Forming pressure/ N・mm-2
0.00
1.00
2.00
3.00
4.00
5.00
6.00
7.00
8.00
0 50 100 150 200 250 300 350
Be
nd
ing
str
en
gth
/ N
・m
m-2
Forming pressure/ N・mm-2

Proceedings of the International Conference on Environmental Aspects of Bangladesh (ICEAB 2011)
176
A4.005
Biodegradation and Decolorization of Methyl Red
Pijush Sarkar1, ANM Fakhruddin1 and Abdullah-Al-Mahin2
1Department of Environmental Sciences, Jahangirnagar University, Savar, Dhaka, Bangladesh, 2Institute of Food and Radiation Biology, Atomic Energy Research Establishment, Savar, Dhaka, Bangladesh
Abstract Azo dyes are the largest and the most diverse group of synthetic dyes. Because of the xenobiotic nature of dyes, they are
toxicant to biological system and cause serious damage to environment. In the present study, six methyl red
decolorizing bacteria were isolated from soil. On the basis of their decolorizing ability three isolates (PF1, PF4 and PS3)
were found potential, and among them the most potential one (PF4) was identified as Staphylococcus arlettae. S. arlettae
PF4 completely decolorized 600 ppm and 800 ppm methyl red within 24 h and 48 h, respectively. The strain decolorized
1000 ppm and 1200 ppm methyl red with decolorizing efficiency of 89.5% and 68%, respectively, after 72 h. Thus, the
results indicated that due to high potential for methyl red decolorization the soli isolate S. arlettae PF4 can be used in
the biological treatment plant of industrial effluent containing azo dyes.
INTRODUCTION
The industrial effluents contain toxic and hazardous pollutants. One particular class of synthetic chemicals which is of major concern is synthetic dyes and dye intermediates [1, 2]. More than 100000 commercially available dyes are known and close to one million tons of these dyes are produced annually worldwide [3]. Azo dyes are the largest and the most diverse group of synthetic dyes, which are essential for satisfying the ever growing demand in terms of quality, variety, and speed of coloration of large number of substances. Azo dyes are the major group of dyes used in the textile industry and contribute between 50-56% of the colors in the textile dyes [4, 5]. Azo dyes are characterized by the presence of one or more azo groups -N=N- [6], which are responsible for their coloration and when such a bond is broken (degraded) the compound loses its color [7]. It is
estimated that over 10% of the dye used in textile processing does not bind to the fibers and is therefore released to the environment [8, 9]. Some of these compounds pose a serious threat because of their carcinogenic potential or cytotoxicity [10-14]. Dyes with striking visibility in recipients may significantly affect photosynthetic activity in aquatic environment due to the reduced light penetration and may also be toxic to some aquatic lives due to the effluents containing several types of chemicals, such as, dispersants, leveling agents, acids, alkalis, carriers and various dyes [15]. Currently, the major methods of textile waste water treatment involve physical and chemical process. However, such technologies usually involve complicated procedures or economically unfeasible. Oxidation is a physical treatment used in wastewater which has a requirement for high energy and produces hazardous by-products. Chemical methods also produce high concentration of sludge during treatment [16]. Microbial decolorization and degradation is an environment friendly and cost competitive alternative to physical and chemical degradation processes [17]. Most studies on azo dye biodegradation have focused on bacteria and fungi, which are able to biodegrade and bioadsorb the dyes in textile industry effluents [2, 18, 19]. The organisms used in most of the study were Staphylococcus sp, E.coli, Bacillus sp, Clostridium sp, and Pseudomonas sp. in bacteria
[20]. Giving concern on the above view, the present study was envisaged with the following objectives: 1) isolation and screening of methyl red degrading isolates, 2) identification employing morphological and some biochemical methods, and 3) study of methyl red degradation and microbial growth behavior.
MATERIALS AND METHODS
A. Sources of samples
Soil samples were collected from different
locations of Jahangirnagar University, Bangladesh campus area. On the basis of their decolorizing capacity, a total of six methyl red decolorizing bacteria were isolated from soil and then purified by repeated subculture. Screening was performed on the basis of stab culture method in the semi-liquid media for isolation of potential isolates [21]. Among the six isolates, three methyl red decolorizing bacteria were selected on the basis of their decolorization capacity of methyl red.
B. Preparation of methyl red solution
Stock of 5000 ppm methyl red solution was prepared by dissolving 5.0 g of methyl red in 1000 ml of 50% ethanol. The methyl red solutions for the experiments were prepared by diluting the stock solution to give desire concentrations.
C. Culture Medium
Basal salt media [22] together with methyl red was used for decolorization studies. The ingredients of basal salt medium were mixed with distilled water in conical flask and the pH was adjusted to 7.0 with 3M NaOH and HCl. The trace salts solution was prepared separately in distilled water and was stored in a dark bottle for 6-8 weeks and used in experiments. Methyl red was added to the basal salt medium after sterilization. The ingredients of the per liter basal salt medium are as follows: (K2HPO4, 2.34g; KH2PO4, 1.33g; MgSO4.7H2O, 0.20g; (NH4)2SO4, 1.00g; NaCl, 0.50g; Yeast extract, 0.10g; Glucose, 1.00g; pH, 7.0). Trace salts solution was added at a concentration of 1 mll-1. The composition of the per 100 ml trace salts solution was as follows: (CaCl2.2H2O, 4.77g; FeSO4.7H2O, 0.37g; CoCl2.6H2O, 0.37g; MnCl2.4H2O, 0.10g; Na2MoO4.2H2O, 0.02 g).

Proceedings of the International Conference on Environmental Aspects of Bangladesh (ICEAB 2011)
177
D. Cultural conditions
The organisms was grown overnight in nutrient broth, centrifuged at 5000 rpm for 10 minutes and washed twice with 0.01M sodium phosphate buffer. Five ml of bacterial suspension (≈107 cells/ml) was used to inoculate in 95 ml sterile basal salt containing appropriate amount of methyl red concentration in 250ml conical flasks. After inoculation, flasks were incubated in an orbital shaker at 120 rpm at 37oC. Control flasks were run in parallel. Samples were aseptically removed at regular intervals for analyzing the methyl red decolorization and the bacterial cell growth. The study period for methyl red decolorization was 0-72 h.
E. Growth Measurement, chemical analysis and bacterial identification
Growth was monitored by noting optical density measurement at 660 nm. Decolorization of the methyl red was determined at its respective
maximum absorption wavelength (430 nm) in the culture supernatants using UV spectrophotometer. Samples were aseptically taken into the centrifuge tube at different times during incubation. Cells were removed by centrifugation at 5000 rpm for 10 minutes, before its optical density was measured. The optical densities (OD) measured were then converted to the methyl red concentration using the respective standard curve.
The efficiency of color removal was expressed as the percentage ratio of the decolorized dye concentration to that of initial one based on the following equation [23].
Color removal (%) = [Dye(i) –Dye(r)/Dye (i)]×100%
Where, Dye (i) = initial dye concentration (mg/L), Dye (r) = residual dye concentration (mg/L).
For identification of the isolated bacteria, staining, cultural, and biochemical tests were performed according to the methods described in Bergey's Manual of Determinative Bacteriology [24].
Statistical analysis was also performed for determining the methyl red concentration by using Sigma plot (2001) and Microsoft office excel (2007). ABIS6 online software was used for identifying the bacterial isolate.
RESULTS AND DISCUSSIONS
A. Isolation and screening of methyl red decolorizing bacteria
Methyl red decolorizing bacteria were isolated from soil. On the basis of their decolorizing capacity, a total of six bacteria were isolated and purified by repeated sub-culturing. These six bacteria have different potentials to grow on basal salt media containing 400 to 800 ppm of methyl red. Screening was performed on the basis of stab culture method in the semi-liquid media for isolation of potential isolates. Same screening method was used by Syed et al. [21]. Among the six isolates, three methyl red decolorizing bacteria were selected on the basis of their decolorization capacity of methyl red. These three isolates were designated as PF1, PF4 and PS3.
Incubation time, h0 h 24 h 48 h
Me
thyl re
d c
on
ce
ntr
ati
on
, p
pm
0
200
400
600
800
1000
decolorization of methyl red by isolate PF4
decolorization of methyl red by isolate PF1
decolorization of methyl red by isolate PS3
Fig. 1. Decolorization of 800 ppm methyl red by isolates
PF1, PF4 and PS3.
B. Methyl red decolorization studies in liquid culture
Decolorization of 800 ppm methyl red by these three isolates is shown in Fig 1. All these isolates showed significant removal efficiency within 48 h
incubation time. All isolates showed little differences in their removal rate. Three Methyl red decolorzing bacteria (PF1, PF4 and PS3) grew well in liquid culture containing 800 ppm methyl red in the presence of yeast extract and glucose. Another study also showed that a combination of the variables including glucose and yeast extract resulted in more than 90% decolorization of the azo dye Direct Black 22[25]. Oforka and Oranusi [26] stated that decolorization occurred only when a carbon and energy source were available in the growth medium, glucose and yeast extract along were employed as co substrates, since a metabolizable carbon sources seems to be obligatory for functioning of dye decolorizing bacteria. From these isolates, PF4 was selected for identification and further studies
Table 1. Microscopic observation of cell, colony
characteristics and other biochemical characteristics of
the isolate PF4
Isola
te
Gra
m r
eacti
on
Cell S
hape
Siz
e
Sh
ape
Colo
r
Opacit
y
Ele
vati
on
Oxid
ase
Cata
lase
Meth
yl R
ed
Voges-P
roskau
er
Gela
tin
Indol
PF
4
Posit
ive
Cir
cu
lar
Sm
all
Cocu
s
Cre
am
Opaqu
e
Con
vex
- +
+
+
- -
Table 2. Carbohydrate utilization by bacterial isolate PF4
Bacterial
Isolate
Glu
cose
Fru
cto
se
Su
cro
se
Xylo
se
Sorb
itol
Ara
bin
ose
Man
nit
ol
Rh
am
nose
Lacto
se
Malt
ose
Isolate
PF4 + + + + + - + + + +
HG (c)
HG (c)

Proceedings of the International Conference on Environmental Aspects of Bangladesh (ICEAB 2011)
178
C. Identification of bacterial isolate
Preliminary identification test was performed for isolate PF4. Morphological characteristics, colony characteristics and other biochemical characteristics of the isolate PF4 are outlined in Table 1. A wide range of carbohydrate utilization tests by isolate PF4 were also performed. It was observed that the isolate PF4 was able to utilize most of the carbohydrates except Arabinose and the results are shown in the Table 2. According to Bergey‘s manual of determinative bacteriology [24] and ABIS 6 software the results showed the similar characteristics with Staphylococcus arlettae. Therefore, the identified isolate was named as Staphylococcus arlettae PF4.
D. Decolorization studies of various concentrations of methyl red by the isolate Staphylococcus arlettae PF4
The results of the decolorization of various concentrations of methyl red by S. arlettae PF4 are shown in Figure 2. S. arlettae PF4 completely decolorized 600 ppm and 800 ppm methyl red within 24 h and 48 h respectively. But the organism partially decolorized 1000 and 1200 ppm of methyl red within 72 h. The decolorization rates (ppm/h) of 600, 800, 1000 and 1200 ppm methyl red by the isolate Staphylococcus arlettae PF4 were 25 ppm/h, 22.38 ppm/h, 8.88 ppm/h and 7.71 ppm/h respectively for the first 24 h (Fig 3). The decolorization rates (ppm/h) of 800, 1000 and 1200 ppm methyl red by the isolate S. arlettae PF4 were 10.96 ppm/h, 11.33 ppm/h and 10 ppm/h, respectively, within 24-48 h The decolorization rates (ppm/h) of 1000 and 1200 ppm methyl red by the isolate S. arlettae PF4 were 17.08 ppm/h and 16.29 ppm/h, respectively, within 48-72 h.
The maximum decolorization rates (ppm/h) by the isolate for 600, 800, 1000 and 1200 ppm methyl red concentrations were 25 ppm/h, 22.38 ppm/h, 17.08 ppm/h and 16.29 ppm/h respectively. The percentage of decolorization efficiency by S. arlettae PF4 for 600, 800, 1000 and 1200 ppm methyl red concentrations were 100%, 100%, 89.5% and 68%, respectively.
Fig. 2. Decolorization of methyl red at different
concentrations by Staphylococcus arlettae PF4.
Fig. 3. The decolorization rate (ppm/h) of methyl red at
different concentrations by Staphylococcus arlettae PF4.
So et al. [27] isolated Acinetobacter liquefaciens S-1 which could decolorize and degrade methyl red into two colorless compounds namely 2-aminobenzoic acid (ABA) and N-N-dimethyl-p- phenylene diamine (DMPD), within 7 days and could metabolize a maximum of 400 mgl-1 of MR in
the presence of 5 gl-1 of glucose. Wong and Yuen [28] isolated a bacterium Klebsiella pneumoniae RS-13, which could degrade MR 100 mgl-1 in presence of 0.5–5.0 gl-1 of glucose. Whereas in the present study only 0.1 gl-1 of glucose was used and Staphylococcus arlettae PF4 could completely decolorize 600 and 800 ppm methyl red within 24 h and 48 h respectively. Moutaouakkil et al. [29] observed that under optimal conditions, Enterobacter agglomerans completely decolorized 100 mgl-1 of methyl red within 6 h of incubation in synthetic medium. Enterobacter agglomerans had high MR decolorization at 37°C. However, at 24°C and at 44°C the Methyl Red decolorization was slower. Thus, the bacterium decolorize 92% of Methyl Red within 6 h of incubation at 37°C whereas only 20% of MR was decolorized at this time period by the bacterium incubated at 24°C and at 44°C. Adedayo et al. [3] observed that bacterial cultures from a wastewater treatment plant degraded a toxic azo dye (methyl red) by decolorization. Complete decolorization using a mixed-culture was achieved at pH 6, 300C within 6 h at 5 mgl-1 methyl red concentration, and 16 h at 20–30 mgl-1. The high methyl red decolorization efficiency of Staphylococcus arlettae PF4 enable this bacterium to be used in the biological treatment of industrial effluent containing azo dyes.
REFERENCES [1] H Ollgaad, L Frost, J Galster and OC Hensen. 1999.
Survey of azocolorant on Denmark: Milgoproject 509.
Danish Environmental Protection Agency.
[2] A Stolz. 2001. Basic and applied aspects in the
microbial degradation of azo dyes Applied Microbiology and Biotechnology, 56: 69–80.
[3] O Adedayo, S Javadpour, C Taylor, WA Anderson and
M Moo-Young. 2004. Decolourization and
detoxification of methyl red by aerobic bacteria from a
wastewater treatment plant. World Journal of
Microbiology & Biotechnology, 20: 545– 550.
0 h 24 h 48 h 72 h
Me
thy
l re
d c
on
ce
ntr
ati
on
(pp
m)
0
200
400
600
800
1000
1200
1400
Incubation time, h
600 ppm 800 ppm 1000 ppm 1200 ppm
Deco
lori
zati
on
ra
te
(pp
m/h
)
Methyl red concentration
24 h 48 h 72 h

Proceedings of the International Conference on Environmental Aspects of Bangladesh (ICEAB 2011)
179
[4] KT Chung and E Stevens.1993. Degradation of azo
dyes by environmental microorganism and
helminthes. Environ. Toxicol. Chem., 12: 2121-2132.
[5] RM Melgoza, A Cruz and G Bultron. 2004. Anaerobic/
aerobic treatment of colorants present in textile
effluents. Water sci. Technol.. 50: 149-155.
[6] B Manu and S Chaudhari. 2002. Anaerobic
decolorisation of simulated textile wastewater
containing azo dyes. Bioresource Technology, 82:
225–231.
[7] C O‘Neill, A Lopez, S Esteves, FR Hawkes, DL Hawkes,
and S Wilcox. 2000. Azo-dye degradation in an
anaerobic- aerobic treatment system operating on
simulated textile effluent. Applied Microbiology and Biotechnology, 53: 249–254.
[8] EJ Weber and VC. 1993. Hydrolysis kinetics of
reactive blue 19-vinyl sulfone. Water Research, 27:
63–67.
[9] MS Reisch. 1996. Asian textile dye makers are a
growing power in changing market. Chemical
Engineering News, 15: 10–12.
[10] KT Chung, SE Jr. Stevens and CR Cernigliar. 1992.
The reduction of azo dyes by the intestinal microflora.
CRC Critical Reviews in Microbiology, 18: 175–190.
[11] I Waldmann and F Vakilzadeh. 1997. Delayed
hypersensitivity to red azo dyes in tattoos. Der Hautarzt, 48: 666–670.
[12] S Hildenbrand, FW Schmahl, R Wodarz, R Kimmel
and PC Dartsch. 1999. Azo dyes and carcinogenic
aromatic amines in cell cultures. International Archieves of Occupational and Environmental Health
72 (suppl.), 52–56.
[13] Van der Zee, P Frank, G Lettinga and JA Field. 2001.
Azo dye decolourisation by anaerobic granular sludge.
Chemosphere., 44: 1169–1176.
[14] MAM Martins, MJ Queiroz, AJD Silvestre and N Lima.
2002. Relationship of chemical structure of textile dye
on the preadaptation medium and the potentialities
of their biodegradation by Phanerochaete
chrysosporium. Research in Microbiology, 153: 361–
368.
[15] Y Fu and T Virarahavan. 2001. Fungal
decolourization of dye wastewater: A Review.
Bioresource technology, 79: 251-262.
[16] K Saraswathi and S Balakumar. 2009.
Biodecolourization of azodye (pigmented red 208)
using Bacillus fi rmus AND Bacillus laterosporus, J Biosci Tech., 1(1): 1-7.
[17] D Wesenberg, I Kyriakides and SN Agathos. 2003. A
Review: White rot fungi and their enzymes for the
treatment of industrial dye effluents. 21: 194-202.
[18] CI Pearce, JR Lloyd and JT Guthrie. 2003. The
removal of color from textile waste water using whole
bacterial cells: A review. Dyes and Pigments, 58:
179-196.
[19] I Eichlerova, L Homolka and F Nerud. 2006.
Synthetic dye decolorization capacity of white rot
fungus, Dichomitus squalens. Bioresource Technology, 97: 2153–2159.
[20] G McMullan, C Meehan, A Connely, N Kirby, T
Robinson, R Marchant and WF Smyth. 2001.
Microbial decolourization and degradation of textile
dyes. Applied Microbiology and Biotechnology, 56:
81-87.
[21] MA Syed, HK Sim, A Khalid and M Shukor. 2009. A
simple method to screening for azo-dye-degrading
bacteria. J. Environ.Biol., 30(1): 89-92.
[22] N Hayase, K Kouno and KJ Ushio. 2000. Isolation and
characterization of Aeromonas sp. B-5 capable of
decolorizing various dyes. J. Biosci. Bioeng., 90:
570-573.
[23] KC Chen, JY Wu, DJ Liou and SCJ Hwang. 2003.
Decolorization of the textile dyes by newly isolated
bacterial strains. J. of Biotechnology, 101: 57–68.
[24] RF Buchanan and NF Gibbons. 1984. Bergey‘s
Manual of Determinative Bacteriology (9th ed.).
Baltimore, Williums and Wilkins Co., USA.
[25] S Mohana, S Shrivastava, J Divecha and D.
Madamwar, 2008. Response surface methodology for
optimization of medium for decolorization of textile
dye Direct Black 22 by a novel bacterial consortium.
Bioresource Technology, 99: 562–569.
[26] NC Oforka and NA Oranusi. 1978. Decolorization of
azo based food colorants (Camoisine and Ponceau 4R)
by Escherichia coli. Journal of Applied and Environmental Microbiology, 35: 558 – 562.
[27] KO So, PK Wong and KY Chan. 1990. Decolorization
and biodegradation of methyl red by Acetobacter liquefaciens. Toxic. Assess, 5: 221-235.
[28] PK Wong and PY Yuen. 1996. Decolorization and
degradation of methyl red by Klebsiella pneumoniae
RS 13. Water Research, 30: 1736–1744.
[29] A Moutaouakkil, Y Zeroual, FZ Dzayri, M Talbi, K Lee
and M Blaghen. 2003. Bacterial decolorization of the
azo dye methyl red by Enterobacter agglomerans.
Annals of Microbiology, 53: 161-16.

Proceedings of the International Conference on Environmental Aspects of Bangladesh (ICEAB 2011)
180
A4.006
Compost: Past, Present and Future
KM Nurul Huda
Member, Bangladesh Poribesh Andolon (BAPA)
Abstract
The paper explains how waste can be converted to resource through composting and presents a brief history of the very
important role played by this technique in the agriculture from the pre-historic society to modern world. With a special
emphasis on the scenario of Bangladesh, it shows how composting can be profit oriented as well as environment
friendly.
INTRODUCTION
Use of compost in the farmland for producing better crop was a pre-historic practice in the world of agriculture. Farmer at that age used to mix domestic animal‘s manure with bio-degradable substances and let them convert into compost on natural course of action. Chemical fertilizer came into being in the wake of industrial revolution for producing larger amount of crops to meet the demand of food for larger number of population. Nonetheless, the importance of bio-fertilizer, which is compost in nature, remained to play an essential role for producing organic food. Compost of bio-degradable wastes in the present era seems necessary for two specific reasons: proper disposal of wastes for conservation of environment, and minimization of dependency on synthetic fertilizers.
Waste can be used as raw materials for many new products. The worth mentioning areas of economic activities from wastes are- composting, recycling, reuse, recover and, generating energy. This paper, however, is set to discuss about compost alone. Composting is a process of decomposition of organic solid waste where chemical fermentation takes place by microorganism under an aerobic condition. One appropriate definition of composting is [1] -
―Composting is an aerobic process that converts waste into a humus-like material through microbial action on the organic portion of the solid waste. If carried out effectively, the final product is stable, odor-free, does not attract flies and can act as a soil conditioner.‖
A GLIMPSE OF THE PAST
The history of composting dates back to the history of early agriculture [2]. Many farmers of prehistoric age used to make compost with animals‘ manure, straw, crop residues and other organic waste for applying in agricultural field for producing better crop. Compost materials were found on the
ground as early as in the Roman era since Pliny the Elder (AD 23-79) who referred to compost in his writings [3].
E. In Indian Subcontinent
In Indian sub-continent, Sir Albert Howard (1873-1947) played a pioneering role on sustainable practices on composting in the early part of 1930s [4], [5]. He was an English botanist. Sir Howard made the farmers of his time to think that waste comes from nature can supply equal amount of nutrition to soil if it is sent back there in the form of
compost. By fertile land Howard meant the quality of
humus it contains. Talking about humus he meant a very wide term covering material ranging from peat in a bog to the sweet-smelling leaf mould found on the ground in a mixed wood. It is distributed throughout the top soil by Nature's manure distributors, of which the earthworm is the chief. The roots of trees and undergrowth then make use of the humus for growth. In this way the wood manures itself. It first converts its wastes into valuable humus, distributes this humus by means of its unpaid labour force, and then uses the humus for growth. He launched a modern composting practice to its suitability of tropical climate in India before the Second World War [6].
The long term convicts in the Indian Jails could opt to collect human waste manually from the service latrines. They were given some extra benefit for doing this kind of odd jobs. This practice continued in this part of Bangladesh until safety tank was set within the toiletry system in the jails in the 1980s. The human excreta thus collected were dumped at a distant place for making compost. It was then used in the farmland within the jail compound for producing different kinds of vegetables.
F. In Europe in early nineteenth century
The application of chemical fertilizers in the farmland started opposing production of organic food with the advent of industrial revolution. Yet the importance of application of compost for production of organic food never died. In spite of aggressive intrusion of chemical fertilizer, organic farming and organic food still remained a choice of many farmers in Europe in the 1920s. The consumers‘ preference to organic food kept many farmers applying compost made of organic substances in the farmlands. Innovation of producing compost from municipal organic waste at the industrial level was set up in Wels/Austria in 1921. Two persons, Rudolf Steiner of Germany, the founder of bio-dynamics farming, and Annie Francé-Harrar, took leading roles in establishment large scale humus organization in 1950-1958 in Mexico. This kind of compost would keep the agro-land fertile for good crops. Interruption on this activities started
taking place in the twentieth century by the influx of different kinds of synthetic fertilizers in the market. Finally, people have come to realize that synthetic fertilizers cause long term harm to soil fertility and responsible for decreasing of yield capacity of the land.

Proceedings of the International Conference on Environmental Aspects of Bangladesh (ICEAB 2011)
181
EXAMINING THE PRESENT
The concept of compost does no longer sit at the back bench of old days. The modern world has focused its look on the production of compost from different organic portion of wastes. The researchers and scientists are convinced that the organic portion of waste carries sufficient nutrients that soil needs for production of better and hygienic food. Experts on this subject suggest that the municipal solid waste be segregated into organic and inorganic portion and the organic portion be diverted to composting plants.
The US Composting Council had held its 15th annual Conference and Trade Show in January 2007 in Orlando. 36 sponsors shared the hosting of the conference. More than 750 composting and organics recycling professionals and more than 100 exhibitors attended the conference. Delegations from almost all states and 14 countries attended the conference and participated for making resolutions. The US Composting Council had organized ―International Compost Awareness Week, May 2007‖ in New York. With the backdrop of a national poster campaign, the theme ―The Possibilities Are Endless-Compost‖ is composting from backyard to large-scale.
Many countries of both developed and developing blocks have joined the row of making compost from organic wastes. Cities of Thailand, Vietnam, China, India, Egypt, Japan, USA, and Europe are on the ground for producing compost through mechanical process [7]. Even some desert countries in the Middle East apply composting method for disposing of municipal waste. Composting with organic waste has long been regarded as an alternative to landfilling in the developed countries. Landfill space is becoming difficult as time passes due to environmental concern and cost of acquiring the land for dumping waste. Neighborhood and land owner worldwide are reluctant to lease land for waste disposal. This situation has promoted many developed countries to recycling the organic portion of waste by means of composting. Industrial scale
composting in the form of in-vessel composting, aerated static pile composting and anaerobic digestion take place in most western countries.
Many countries have enacted law binding upon the producer of waste to go for composting. An extract of the report of the Committee Constituted by the Supreme Court of India published in Waste Management in Class 1 Cities in India states-
―Given the technological options available for processing and disposal of waste at the present juncture, only composting of organic food and biodegradable waste and disposal of rejects at the landfills sites is recommended.‖
Germany, Holland and Switzerland have developed product guidelines in early 1980s as to how waste should be processed into composting. The United Kingdom and the United State has also joined in the row of making compost from waste. Compost is regulated in Canada and Australia as well.
Sulabh International Institute of Technical Research and Training is working in India since 1984 in the fields of low-cost sanitation, biogas
generation from human waste, wastewater treatment, solid waste management, environment, pollution etc.
This institution observes that compost from biodegradable solid waste has direct and indirect economic return in the form of manure and soil conditioner. Normal process of composting requires more or less 35 days. But a city with huge volume of daily solid waste production cannot afford its citizens to endure odor and ugly looking due to heap of wastes for such a long time for composting. To say the least, different diseases can be transmitted into the persons who are directly exposed to waste at the time of handling compost manually. The Institute has developed a technology to address both the hazards. It now requires only 5-6 days making compost from waste without manual handling during production.
Waste Concern, an NGO in Bangladesh, has been working as a pioneer in making compost from organic portion of Municipal Solid waste (MSW) since 1990s [8]. It started community based decentralized composting program around the Mirpur area of Dhaka city in 1994. It was designed for self-employment of community people, hygienic disposal of MSW, production of organic fertilizers and realization of sale proceeds to flow back to the project management. Waste Concern has, by now, entered into a large scale production process of compost. It has established a plant named WWR (Worldwide Waste Recycling) Bio-fertilizer Ltd. at Bulta, Rupganj, Nrayangonj. It is a modern compost plant set up under the technical and financial support of the Netherlands government. . The total investment on the plant is 2.5 million euro [10].
Some steps of composting processes taken at Bulta plant are shown in flow chart:
Fig. 1. Composting process in Bulta plant Sources from the Waste Concern [11] support
that the contribution of the plant upon the socio-economy the period of January 2009 to September 2010 has been assessed. The assessment shows that daily 65 to 90 tons of MSW from Dhaka City Corporation (DCC) has been
transported to the project site. Number of beneficiaries had been about 56,452 people. BARAKA Ltd., a private transportation contractor, delivered 33133 tons of waste @US$8/ton. Waste Concern sold 4000 tons of compost @US$86/ton from the plant. The process created 150 jobs. ACI, a private Marketing and Distribution Company, marketed the product among the rural farmers.
waste collection
weighting
sorting pilling
maturing and composting
screening bagging
composting
marketing

Proceedings of the International Conference on Environmental Aspects of Bangladesh (ICEAB 2011)
182
They sold the compost @US$143/ton to the farmers. 46,000 farmers were benefited from the compost. Their crops yield increased up to 23-30%.
The total amount of compost sold in Bangladesh in a year amounts to about 30,000 tons against the demand of about 200,000 tons. At present 5 approved composting projects are in operation in Dhaka. Ministry of Agriculture has approved another 25 in May 2011.Urban Public and Environment Health Care Project, supported by Asian Development Bank plans to set up 6 compost plants in 6 City Corporations of Bangladesh by the year 2012. Mymenshing Municipality with the support of GIZ a German organization has set up a small compost plant and it is running well. UNICEE has established Ecological Park-cum composting plant in Chittagong and Rajshahi City Corporation. The plant in Chittagong is giving good result. The one in Rajshahi is on the verge of closure due to lack of demand of compost in the locality. Similarly the compost plants established in Sylhet, Dhaka, Khulna, and Faridpur under different donors‘ financial assistance could not run due to lack of flow of fund and improper management.
THE FUTURE POTENTIAL IN BANGLADESH
Composting is a labour intensive and profit- oriented proposition. Biodegradable character of waste coupled with humid climatic condition, rainfall, content of moisture and temperature in Bangladesh are favorable for making compost in both aerobic and anaerobic methods.
Municipal solid waste in Bangladesh having very high per cent of compost materials and content of larger portion of moisture with acute scarcity of landfills surely suggests considering the technology and methods discussed in the above instances. Organic components in municipal waste including food and vegetables constitute more than 84 per cent of organic substances. Only 16 per cent of waste is left for final disposal if 84 per cent can be processed through composting. If it can be made to happen the 16 percent waste would require very minimum area of land for dumping. As land around
the urban area is very costly, less waste would cause less pressure on landfills and less money of City Corporation and municipality to purchase new sites.
Once more, the organic portion of waste is responsible for production of leachate and methane gas. The more the composting program consumes organic waste the less is the possibility of leachate production and gas generation. Both are responsible for creating environmental problems and hazard to the public health. Importantly, use of organic waste as raw materials of compost reduces the environmental impacts caused at the sites by odor, dust, flies, mosquitoes, insects, germs and diseases. Massive use of chemical fertilizer and intensive agriculture causes prolong depletion of organic contents in the farming soil.
Application of compost in the agricultural land can supplement the deficiency, add necessary nutrients in the soil and sustain productivity. Recycling and returning of organic waste to the soil would significantly contribute to enhancement of
sustainability of agriculture product in the world [9]. As such substitution of chemical fertilizer by bio-fertilizer is a long standing demand of the farmers of this country. Bio-fertilizer has thus got potential market demand in an agro-based country like Bangladesh.
A. Compost as a solution of managing waste from dairy and poultry farms
The manure of dairy and poultry farms of many developed countries in the world are the serious problems for conservation of environment, ecology, aquatic life and public health. Two trillion, 730million pounds of manure is generated in the USA every year. According to a report of the Senate Agriculture Committee the waste comes from 58 million beef cattle, 103 million hogs, 300 million turkeys and 7.6 billion chickens that are raised and slaughtered in the United States every year. It is left untreated and unsanitary, bubbling with chemicals and disease-bearing organisms. It is poisoning rivers and killing fish and sickening people. Catastrophic cases of pollution, sickness and death are occurring in areas where livestock operations are concentrated. This is a real and growing danger. Whereas it has been a long proven fact that the animal and bird farm waste can be converted into very rich bio-fertilizer. The bio-fertilizer is a better substitute of chemical fertilizer. It can be produced in large scale in the developed countries like Bangladesh, for application in agriculture, nursery and plantation. This kind of waste is a source of the nitrogen needed for growing grain crops.
B. Composting as a solution of municipal waste management
The municipalities of many developing countries including those of Bangladesh are suffering from environmental problems due to generation of huge amount of solid waste with inability to dispose of hygienically. The bio-degradable portion of municipal waste is responsible for threatening public health and urban environment due to unacceptable way of its management. The landfills, the ultimate destination of dumping of wastes, cannot be managed under an internationally acceptable standard. The practice of composting can give relief to the municipal authority from the hazardous situation they face with organic solid waste. Many municipalities, however, are learnt to have inclined towards composting of bio-degradable wastes instead of sending them to landfills.
C. Composting as a way to save environment
Compost is a valuable soil conditioner. It becomes humus when applied in the field. Compost helps to resist erosion of soil against wind and water and retain water for longer period of time. Composting requires minimum capital investment. Both developed and developing countries on the globe use composting method with various levels of scientific and technical innovations. Composting meets dual purposes: to dispose of waste and to use the compost as bio-fertilizer.
Use of compost can result in a variety of environmental benefits. More the practice of composting is undertaken- less the landfills receive

Proceedings of the International Conference on Environmental Aspects of Bangladesh (ICEAB 2011)
183
organic waste resulting less the production of methane and leachate. Compost can hold back pollutants in storm water runoff from reaching surface water resources. It can control erosion and silting on embankments parallel to creeks, lakes, and rivers. Compost can be used as a soil amendment for farm fields, roadsides, lawns, nurseries, and golf courses. It can prevent turf loss of roadsides, hillsides and playing fields. In countries like Bangladesh, where land is limited we can‘t afford to make even a tiny portion of our land into toxic landfill. Besides, compost is a labour intensive industry and we have an ample source of manpower. Compost doesn‘t even require huge capital; with proper planning composting can be a cost-effective solution to save our environment.
CONCLUSION
There was a time when farmers knew nothing of chemical fertilizers. The bio-fertilizers were the only means for yielding good crops. Even the era of industrial revolution could not frustrate the farmers from using compost for production of organic food. The consumers and farmers are showing more interest in the present time for getting organic food yielding of which is possible from application of compost in the farmlands. The call of avoiding chemical fertilizer is being echoed from one end to the other end of the world. Time has come to think of an alternative way out. Large scale production of compost from bio-degradable waste can be such an alternative. Government, agriculturists, NGOs, civil society, municipal authority and others can put their heads together for promoting compost as an environment friendly fertilizer for better yield in the agriculture, horticulture, nursery etc. If can be done, the efforts would bring about changes on environment and production of organic food in addition to regaining soil fertility of the farmland from the adverse effects due to application of chemical fertilizers.
REFERENCES
[1] M Ali, A Cotton and K Westlake. 1999. Down to
Earth: Solid Waste Disposal for Low-Income
Countries, Principles and Practices for Appropriate
Landfills: a Review. WEDC, Loughborough
University, UK.
[2] http://science.jrank.org/pages/1671/Composting-
History.html#ixzz0kOvDZrBF
[3] www.answers.com/topic/Pliny-the-elder
[4] A Howard. 1933. The Waste Products of Agriculture:
Their Utilization as Humus. J. Roy. Soc. Arts, 84,
London.
[5] A Howard. 1935. The Manufacturing of Humus by
Indoor Process. J. Roy. Soc. Arts, 84, London.
[6] MZ Uddin and N Keigo. 2002. Technology Selection
for Sustainable Solid Waste Management,
Bangladesh Aspects, Bangladesh Environment 2002,
Volume 2.
[7] Y Matsumura. 200. Garbage Decomposition Processing Machine, Ecology Three Co. Ltd.,
Bangkok, Thailand.

Proceedings of the International Conference on Environmental Aspects of Bangladesh (ICEAB 2011)
184
A4.007
Development of Community Participatory in Solid Waste Management in
Khongchaipattana Municipality Khongchai District Kalasin Province, Thailand
Surasak Hunchaisri1, Ponlakit Jitto1, Choopug Suttisa2 and Adisak Singseewo1
1 Faculty of Environment and Resource Studies, Mahasarakham University, Mahasarakham, Thailand 2 Faculty of Humanities and Social Sciences, Mahasarakham University, Mahasarakha, Thailand
Abstract This study was a research and development study, aimed to develop the learning process and improve the
participation in community waste management in “Donkean‖ community, Khongchaipattana municipality, Khongchai
district, Kalasin province. The samples comprised 92 households selected through a simple random-sampling method.
This study trailed participatory action research as a method for community participation in waste management,
conducted under four participatory frameworks including decision making, practice, benefit gaining, and evaluation.
The research instruments included questionnaires, group discussions, organization and community meetings, and
observation. The data was analyzed by mean ( ), Standard Deviation (S.D.), and t-test. The results showed that the
learning process and the participation in community waste management of the participants before and after training,
each was different: after training the participation significantly increased (p<0.05); and the learning process in terms of
knowledge, attitude, and practice in solid waste management also showed a significant increase (p<0.05). Factors that
contributed to the improvement of participatory action and the learning process were having a strong community
leading team, access to information, social interaction, morale of a group, as well as social networking. Other factors
that interfered with the development of the participation and the learning process were such as personnel limits, and
budget.
INTRODUCTION
Industrial and household waste has become a major environmental problem for several countries all around the world, especially for developing countries (United Nation Center for Human Settlements (Habitate) [1]. Thailand, one of those developing countries, is undeniably encountering rigid waste problems. Countless tons of wastes are generated each day by a variety of causes such as community expansion, increase of population, and economic growth. In recent years, the problems have even worsened due to inefficiency of waste collection. Factors hindering development of community waste management include ineffective solid waste management system, weak policy for waste removal, as well as insufficient budget [2]. Therefore, a joint effort by government and local community is very crucial for waste prevention and reduction, waste separation system, as well as waste reuse. Successful rigid waste management can be done through active engagement and serious practice. The local community is responsible for waste management. Providing sufficient learning process in waste management helps encourage the local people to keep their community clean and healthy. Taking these into consideration, it is necessary to improve participation and to promote the learning process in waste management for each individual community [2], [4].
This study aimed at implementing participatory action research (PAR) serving as the link between problem-solving skills, experiences, and active participation to minimize community‘s waste problems in a particular domain. Community groups were bound together placing an emphasis on investigation of the causes of waste problems existing, to create a strategic plan to eliminate wastes in the community areas. This cooperation could reflect as a community‘s strong commitment for sustainable waste management.
The purposes of this study are two-fold: 1) to implement participatory action and enhance the learning process in community waste management and, 2) to examine problems and limitations of waste management in the community.
MATERIALS AND METHODS
The research design was participatory action research, using a combination of methods to collect data. The population was 112 households in Donkean community, Khongchaipattana sub-district, Khongchai district, Kalasin province. The samples, each over 15 years old, consisted of 92 households selected by using simple random sampling.
A. Instruments Procedures
Questionnaires were given out to examine the waste problems that had existed in the communities of Khongchaipattana sub-district. A variety of methods (observation, interview, group discussion, and community meeting) were used to determine the development of the participation and the learning process regarding community waste management. The study was carried out as the following steps:
Step 1: Preparation—setting up the research team aimed to establish and build relationships with the target community.
Step 2: Survey—using a questionnaire survey to identify waste problems currently arising in the community.
Step 3: Operation—improving participation in community waste management through four PAR approaches including decision making, practice, benefit gaining, and evaluation.
Step 4: Evaluation—employing questionnaires to evaluate the effectiveness of the process of the training program as well as to examine the outcomes of the research results.

Proceedings of the International Conference on Environmental Aspects of Bangladesh (ICEAB 2011)
185
B. Data analysis
Descriptive statistics used in analysis of the data
included percentage, mean ( ), standard deviation
(S.D.), and t-test.
RESULTS AND DISCUSSIONS
A. Participation in community waste management
The results of the study (Table 1) revealed that after training the participants had showed higher
participation ( = 4.42) than before training ( =
4.42) at the significance level of .05. By independently considering each dimension of the participation domain, it was found that 1) benefit gaining –in terms of social and environmental
benefits– was at the highest level ( = 4.60) while evaluation (of the progress of the training program)
was at the lowest level ( = 4.23); these were
consistent with earlier findings about improvement of community waste management in Myanmar from the work of Minn et al. [5]. His study suggested the greater tendency towards public participation in waste management by constantly raising awareness and providing sufficient environmental knowledge to people. However, increasing motivation within the public to actively cooperate with government agencies was still insufficient due to a certain social limit. The finding also showed that public participation after taking the PAR training program was higher than before training, in terms of beach individual dimension as well as the overall. So we might conclude here that with the implication of PAR approaches in the waste management (including activities, community study, decision making, practice, and evaluation) all significantly contributed to improvement of the participation in community waste management.
Table 1. comparison on participation in community solid
waste management before and after the developing
Factors
Participation in solid waste management
Before After
SD SD t p-value
Decision 3.48 0.61 4.45 0.48 -17.47 0.000*
Practice 3.38 0.60 4.44 0.43 -17.03 0.000*
Benefits 3.61 0.40 4.60 0.32 -20.30 0.000*
Evaluation 3.18 0.80 4.23 0.60 -13.90 0.000*
Total 3.48 0.48 4.42 0.40 -18.70 0.000*
*Statistically Significant at the level of 0.05, low=1.00-2.33,
medium=2.34-3.67, high=3.68-5.00
B. The learning process in waste management
a) Knowledge: We can see from Table 2 that the overall knowledge about community waste
management was at the high level ( =19.85);
higher than before training ( = 15.97) at the
significance level of .05. By independently considering all dimensions of the learning process, the knowledge on waste removal had
the lowest mean score ( =19.71); the highest mean score was the knowledge on sources of
waste ( =19.91).
b) Attitude: The participants‘ attitudes toward waste management in the community was at
the very high level ( =4.66(; the attitudes
increased ( =3.71) better than before receiving
the training at the significant level of .05 as showed in Table 3.
c) Practice: After taking the training program, the results shown a significance increase in practice in community waste management
which was at the very high level ( =4.51); it was reported moderately higher than before
training ( =3.50 ( at the significant level of .05.
Considering each dimension of the practice domain independently, the findings revealed that the maximized mean score was a
dimension of waste recycling ( =4.77); the
minimized mean ( =4.23) was rejection of
materials that are difficult to eliminate (Table 4).
Comparing among the knowledge, attitudes, and practices in community waste management before and after training, the improvement of the three domains was different. After training, the participants had showed an increase in knowledge, attitudes, and practices at the significant level of .05. The study results were consistent with the work of Sriharuksa et al. [6]. The findings of their work suggested that after taking the training program on community waste management, the village health volunteers had significantly showed an increase in the overall knowledge, participation skills, and practices at the significant level of .05. The results of the study claimed that implementing PAR approaches offered greater opportunities for the community to exchange knowledge and experience to each other, thus resulting in improved knowledge and realization of the importance of waste problems in their community. The community was able to appropriately change their behaviors by means of group cooperation for motivating and intensifying a variety of activities to eliminate waste problems in their community areas.
Table 2. comparison on knowledge attitude and practice in
community solid waste management of before and after
the developing
Factors
Knowledge attitude and practice in community
Before After
SD SD t p-value
Source of
waste 11.91 4.59 19.71 1.37 -15.27 0.000*
Type of
waste 16.09 5.13 19.78 1.47 -6.71 0.000*
Impact of
waste 17.64 2.73 19.86 0.68 -7.67 0.000*
Utilization
of waste 18.72 2.30 19.91 0.66 -4.71 0.000*
Option for waste
management 15.43 6.53 20.00 0.00 -6.70 0.000*
Total 15.97 1.82 19.85 0.51 -18.81 0.000*
*Statistically Significant at the level of 0.05; low = 0.00-6.99
medium = 7.00-13.99, high =14.00-2.00
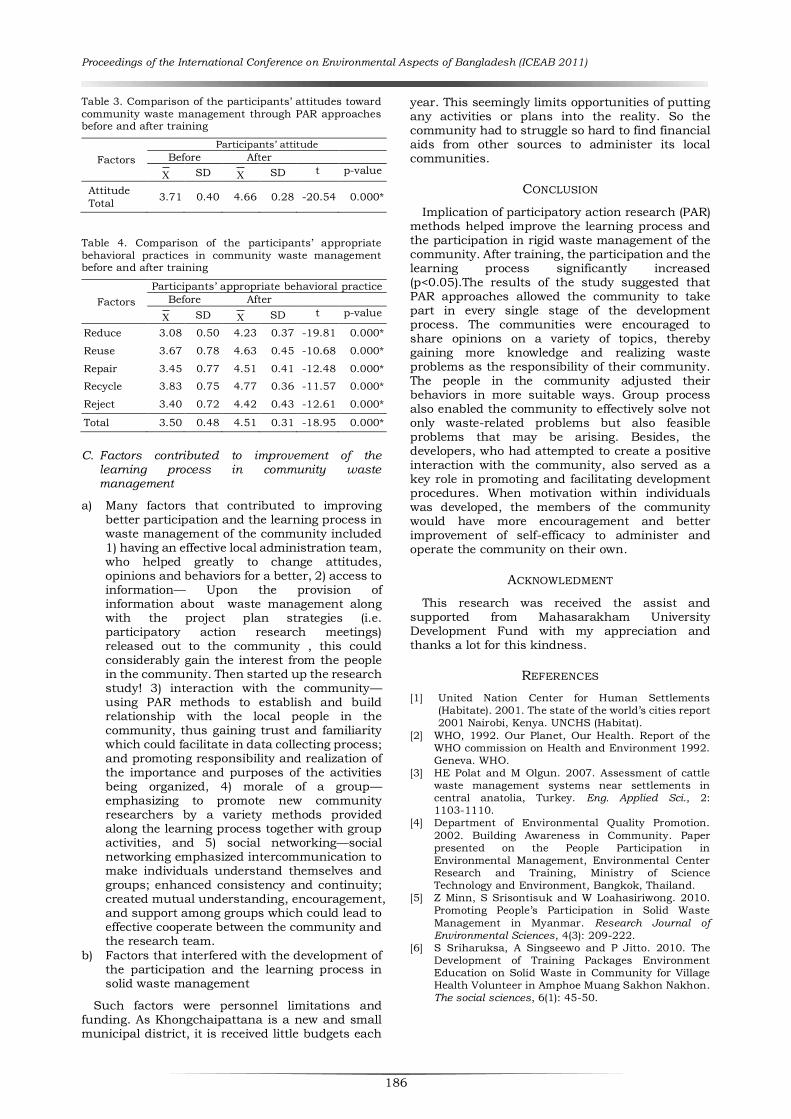
Proceedings of the International Conference on Environmental Aspects of Bangladesh (ICEAB 2011)
186
Table 3. Comparison of the participants‘ attitudes toward
community waste management through PAR approaches before and after training
Factors
Participants‘ attitude
Before After
SD SD t p-value
Attitude
Total 3.71 0.40 4.66 0.28 -20.54 0.000*
Table 4. Comparison of the participants‘ appropriate
behavioral practices in community waste management before and after training
Factors
Participants‘ appropriate behavioral practice
Before After
SD SD t p-value
Reduce 3.08 0.50 4.23 0.37 -19.81 0.000*
Reuse 3.67 0.78 4.63 0.45 -10.68 0.000*
Repair 3.45 0.77 4.51 0.41 -12.48 0.000*
Recycle 3.83 0.75 4.77 0.36 -11.57 0.000*
Reject 3.40 0.72 4.42 0.43 -12.61 0.000*
Total 3.50 0.48 4.51 0.31 -18.95 0.000*
C. Factors contributed to improvement of the learning process in community waste management
a) Many factors that contributed to improving better participation and the learning process in waste management of the community included 1) having an effective local administration team, who helped greatly to change attitudes, opinions and behaviors for a better, 2) access to information— Upon the provision of information about waste management along with the project plan strategies (i.e. participatory action research meetings) released out to the community , this could considerably gain the interest from the people in the community. Then started up the research study! 3) interaction with the community— using PAR methods to establish and build relationship with the local people in the community, thus gaining trust and familiarity which could facilitate in data collecting process; and promoting responsibility and realization of the importance and purposes of the activities being organized, 4) morale of a group— emphasizing to promote new community researchers by a variety methods provided along the learning process together with group activities, and 5) social networking—social networking emphasized intercommunication to make individuals understand themselves and groups; enhanced consistency and continuity; created mutual understanding, encouragement, and support among groups which could lead to effective cooperate between the community and the research team.
b) Factors that interfered with the development of the participation and the learning process in solid waste management
Such factors were personnel limitations and funding. As Khongchaipattana is a new and small municipal district, it is received little budgets each
year. This seemingly limits opportunities of putting any activities or plans into the reality. So the community had to struggle so hard to find financial aids from other sources to administer its local communities.
CONCLUSION
Implication of participatory action research (PAR) methods helped improve the learning process and the participation in rigid waste management of the community. After training, the participation and the learning process significantly increased (p<0.05).The results of the study suggested that PAR approaches allowed the community to take part in every single stage of the development process. The communities were encouraged to share opinions on a variety of topics, thereby gaining more knowledge and realizing waste problems as the responsibility of their community. The people in the community adjusted their behaviors in more suitable ways. Group process also enabled the community to effectively solve not only waste-related problems but also feasible problems that may be arising. Besides, the developers, who had attempted to create a positive interaction with the community, also served as a key role in promoting and facilitating development procedures. When motivation within individuals was developed, the members of the community would have more encouragement and better improvement of self-efficacy to administer and operate the community on their own.
ACKNOWLEDMENT
This research was received the assist and supported from Mahasarakham University Development Fund with my appreciation and thanks a lot for this kindness.
REFERENCES
[1] United Nation Center for Human Settlements
(Habitate). 2001. The state of the world‘s cities report
2001 Nairobi, Kenya. UNCHS (Habitat).
[2] WHO, 1992. Our Planet, Our Health. Report of the
WHO commission on Health and Environment 1992.
Geneva. WHO.
[3] HE Polat and M Olgun. 2007. Assessment of cattle
waste management systems near settlements in
central anatolia, Turkey. Eng. Applied Sci., 2:
1103-1110.
[4] Department of Environmental Quality Promotion.
2002. Building Awareness in Community. Paper
presented on the People Participation in
Environmental Management, Environmental Center
Research and Training, Ministry of Science
Technology and Environment, Bangkok, Thailand.
[5] Z Minn, S Srisontisuk and W Loahasiriwong. 2010.
Promoting People‘s Participation in Solid Waste
Management in Myanmar. Research Journal of Environmental Sciences, 4(3): 209-222.
[6] S Sriharuksa, A Singseewo and P Jitto. 2010. The
Development of Training Packages Environment
Education on Solid Waste in Community for Village
Health Volunteer in Amphoe Muang Sakhon Nakhon.
The social sciences, 6(1): 45-50.

Proceedings of the International Conference on Environmental Aspects of Bangladesh (ICEAB 2011)
187
A4.008
Removal of Heavy Metals using Biofilm Reactor
Pramanik Biplob1*, Md. Rubayet Mortuza2, Saranah Selmi2 and Asif Khan Ankur2
1Civil Engineering Department, Rajshahi University of Engineering and Technology, Rajshahi, Bangladesh. 2Civil Engineering Department, Bangladesh University of Engineering and Technology, Dhaka, Bangladesh.
*Corresponding author mail: [email protected]; [email protected] Tel: +8801716414313, +8801754050064
Abstract Biofilms reactors are effective in heavy metal removal. The current studies investigated the use of expended bed reactor
biofilms in treatment of a wastewater containing iron, copper and manganese. In particular, the influence of hydraulic
retention time (HRT) on metal accumulation was studied. Longer HRTs (3-48 h) were associated with greater metal
removal than short HRTs, particularly with regard to manganese and iron. The effective HRT was 48h, 48h and 24 h for
iron, copper and manganese, respectively. The average iron, manganese and copper removal percentage was
70.15±6.58%, 57.33±5.03% and 52.6±10.43%, respectively. It was concluded that the expended bed reactor system
proposed in this study removed by the denitrification process extremely well.
INTRODUCTION
Heavy metals are ubiquitous and persistent environments pollutants that are introduced into the environment through anthropogenic activities, such as electroplanting plants, mining, nuclear and electronics industries, metal finishing operations, as well as other sources of industrial waste. Unlike toxic metals are non-degradable [1, 5].
In order to remove toxic heavy metals from water systems several methods have been suggested and investigated. Although chemical precipitation, coagulation, ion exchange, solvent extraction, filtration, evaporation and membrane methods have been applied in this purpose which is becoming increasingly expensive [4, 5, 6], most technique have some inherent shortcomings such as requiring a large area of land, a sludge dewatering facility, skilful operations and multiple basin configurations. Advanced biological treatment processes, developed to overcome these deficiencies, are now increasing demand.
In recent years, biological processes have shown potential for heavy metal removal [8]. Both activated sludge and fixed film systems have been used for wastewater treatment for over a century. Important features of these processes which make them cost effective for industrial wastewater treatment are: low operating and maintenance costs, low excess sludge production and odourless operation. Despite the importance of fixed film systems in wastewater treatment, little research has been done to evaluate the impact of toxic chemicals, such as heavy metals, on the activity and performance of fixed film systems.
Heavy metal ions are accumulation by microorganisms, and a number of investigators have shown that microorganisms are valuable tools in removing metals from wastewater. Microbial metal accumulation has received much attention during recent years, due to the potential use of microorganisms for treatment at metal polluted water or wastewater streams [9]. A variety of media have been employed for biofilm supports such as sand, granular activated carbon (GAC), plastic and various kinds of clays. In a biofilm processes, dissolved heavy metals are generally adsorbed onto the biofilm surface as a result of interactions
between metal ions and the negatively charged microbial surfaces, gradually reducing the aqueous metal concentration [2]. Hence, this research aims to investigate the efficiency of metal removal from wastewater with different hydraulic retention time.
MATERIALS AND METHODS
A. Reactor operation condition
The height and diameter of expended bed biofilm reactors were 120 cm and 30 cm respectively. The bottom portion of reactors were packed with GAC particles which have 0.25-2.00 mm particle size, with a mean diameter of 1.30 mm and particle density of 1200 kg/m3 and the system was operated at 30±2ºC temperature with different hydraulic retention times. Sedimentation tank was used for sediment the sand and other particles during the operation period. Activated sludge from wastewater treatment plant was used for seeding process because of its high suspended biomass concentration that lead to rapid biofilm formation [3]. Raw water was supplied to the biofilm reactor from direct the channel of pond. A schematic of the experimental set up is shown in Figure 1.
B. Sample Analysis
Samples were filtered (0.45 um membrane filter) and the levels of metal concentration were analysed by AAS (Atomic Absorption Spectroscopy).
RESULTS AND DISCUSSIONS
Too short an HRT will result in low removal rates, whereas too long an HRT will not be economically feasible. In order for a biological system to compete successfully with conventional physicochemical methods of treatment, the shortest possible hydraulic retention time associated with the most efficient removal rates is required. Consequently, six different HRTs, 3 h, 6 h, 12 h, 18 h, 24 h and 48 h, were tested, in an attempt to optimise metal removal in an expanded bed reactor. At an HRT of 24 h, removal of all three metals was substantially improved with average values of 73.66%, 82.96% and 81.13% being recorded for copper, iron and manganese, respectively.

Proceedings of the International Conference on Environmental Aspects of Bangladesh (ICEAB 2011)
188
Fig. 1. Expended bed reactor
Fig. 2. Copper removal at different HRT (A= 3 HRT, B= 6 HRT, C= 12 HRT, D= 18 HRT, E= 24 HRT and F= 48 HRT)
Fig. 3. Iron removal at different HRT (A= 3 HRT, B= 6 HRT, C=12 HRT, D= 18 HRT, E= 24 HRT and F = 48 HRT)
Fig. 4. Manganese Data (A= 3 HRT, B= 6 HRT, C= 12 HRT, D= 18 HRT, E= 24 HRT and F= 48 HRT)
The daily removal percentage of copper, iron and manganese was shown in fig 2, fig 3, and fig 4, respectively at different HRT over the 16-week experimental period. For iron and copper, the maximum removal was found in an HRT of 48 h with the removal efficiency of 93.35% and 74.99%
whilst manganese removal was occurred in 24 h of HRT with the efficiency of 81.13%. No attempt was made to control the pH or temperature as one of the primary aims of the entire investigation was to develop a system which could work with minimal control.
Effluent tank
Sedimentation tank
Peristaltic pump
Pipe
Expended bed reactor Pond
Lake
Proceedings of the International Conference on Environmental Aspects of Bangladesh (ICEAB 2011)
189
The experimental results indicated that highest metal removal levels occurred when a 48 h HRT was used. Bifilms have been shown to be effective for heavy metal removal from wastewater. However, only limited information is available, on the long- term impact of heavy metals on biofilm. The biofilm clearly showed the metal-binding preference: iron, manganese, copper. The relatively high removal levels recorded for iron and manganese could be explained on the basis that both these metals have well known metabolic functions, and hence were absorbed with greater efficiency than was copper.
The fluctuating removal capacities recorded at each sampling time for all three metals indicated that metal removal rates remained unstable throughout the experimental period. The fact that metal-uptake equilibrium was not attained suggests that the maximum sorption capacity of the biofilms for any of the metals had not yet been reached and the system was thus not operating at its full potential. This would be due to the uneven nature of the biofilm throughout the system. It would thus be beneficial to ensure that biofilm development, during start-up operations, occurs evenly throughout the system, so that each unit in a multistage system operates at optimum efficiency.
A possible explanation for the lack of copper removal may be the presence of competing ions, an important environmental condition affecting the capacity of bacterial biomass to remove cations. The zero removal capacities recorded for copper at retention times, 3 h may be desorption and resolubilisation of some of the metal ions sorbed during the adaptation period. pH is an important variable known to influence biosorption [7]. Despite the pH values recorded throughout the experimental period, in the reactors, falling within
the range (pH 6-7). The reactor was able to run without backwashing
during this experimental period. Raw water was supplied to the reactor by upflow with varying fluid velocity. The biofilm process was applied in metal containing wastewater to study the treat ability of this process. Microbial metal accumulation has received much attention during recent years, due to the potential use of microorganisms for treatment at metal polluted water [9]. Biological processes have shown potential for heavy metal removal. In expanded bed reactor, the interaction between biofilm and heavy metals resulting in the adsorption of heavy metals onto biofilm. Because heavy metals have an adverse effects on intrinsic microbial activities, proteins capable of complexing metal species may be denatured by heavy metals, resulting in inhibition and even cell death and lysis at some high concentration.
Denitrification efficiency: To study the ability of the reactor in removal of Fe, Cu and Mn Figure 5 shows the denitrification efficiency in overall of reactor at different HRT. Maximum denitrification efficiency of 74.99%, 93.35% and 81.13% were achieved for Cu, Fe and Mn respectively.
With the increasing of HRT, Cu, Fe and Mn removal was found to be increased. In figure 3, denitrification efficiency rate and HRT gave almost linear increase relationship (with R2 = 0.69, R2 =
0.88 and R2 = 0.37, respectively) for this system. The linear function to define the relationship between denitrification efficiency and HRT: Denitrification efficiency for Cu = 0.677 x + 48.60 Denitriification efficiency for Mn= 0.436 x + 54.18 Denitrification efficiency for Fe = 1.056 x + 48.61
CONCLUSION
The ability to remove heavy metals from wastewater by biofilm column is now an established alternative method to traditional techniques. The expended bed reactor was very effective with GAC particles for removing heavy metals from wastewater with denitrification process. Based on the experimental results, the following conclusions were drawn:
(1) The expanded bed reactor system proposed in this study was able to effectively removal of Cu, Fe
and Mn to the biofilms was in order of Fe>Mn>Cu. (2) The proposed system was very effective for Cu,
Fe, Mn removal at 24 HRT with the average efficiency of 73.66%, 82.96% and 81.13%, respectively.
Future work will be directed at pH control and use plastic media instead of GAC of the expanded bed reactor to enhance heavy metal removal.
ACKNOWLEDGEMENTS
The author would like to express thanks to Dr Fatihah Binti Suja, Associate Prof, Dept of Civil & Structural Engineering, Universiti Kebangsaan Malaysia) for helping to write this paper.
REFERENCES
[1] C Baird. 1995. Environmental Chemistry. WH
Freeman and Company, New York.
[2] A Jang, SM Kim, SY Kim, SG Lee and IS Kim. 2001.
Effect of heavy metals (Cu, Pb and Ni) on the
composition of EPS in biofilms. Water Science & Technology, 43: 41-48.
[3] AT Mann, L Mendoza-Espinosa and T Stephenson.
1999. Performance of floating and sunken media
biological aerated filters under unsteady state
conditions. Water Research, 33(4): 1108-1113.
[4] Y Sag and T Kutsal. 1989. The use of Zoogloca
ramigera in wastewater treatment containing Cr(VI)
and Cd (II) ions. Biotechnology, 11: 145-148.
[5] SC Costley and FM Wallis. 2000. Effect of flow rate on
heavy metal accumulation by rotating biological
contactor (RBC) biofilms. Journal of Industrial
Microbiology & Biotechnology, 24: 244-250.
[6] SE II Shumate, GW Strandberg and JR Parrott Jr.
1978. Biological removal of metal ions from aqueous
process streams. Symposium on Biotechnology in
Energy Production and Conservation, Gatlinburg,
Tennessee, May 10-12, 1978.
[7] M Tsezos and B Volesky. 1982. The mechanism of
uranium biosorption by Rhizopus arrhizus.
Biotechnology and Bioengineering, 23: 385-401.
[8] P Zhou, H Ju-Chang, AWF Li and W Shirly. 1999.
Heavy metal removal from wastewater in Fluidized
bed reactor. Water Research, 33(8): 1918-1924.
[9] AI Zouboulis, MX Loukidou and KA Matis. 2004.
Biosorption of toxic metals from aqueous solutions by
bacteria strains isolated from metal-polluted soils.
Process Biochemistry, 39: 909-916.

Proceedings of the International Conference on Environmental Aspects of Bangladesh (ICEAB 2011)
190
A4.009
Sustainable Slum Improvement Process for Dhaka City, Bangladesh
Case Study: The UN-Habitat Urban Poverty Reduction Project
Mohammad Akharuzzaman
System LSI Research Center, Kyushu University, Fukuoka, Japan
Abstract
Dhaka City has a large number of development projects implemented by the local and international development
authorities for the poverty reduction issues as well for the urban slum improvement process. However, the number of
poor people and slums are still increasing in the central urban area of Dhaka City. The objective of this study is to
clarify the existing urban poverty condition and sustainable poverty reduction process for Dhaka City. This study was
conducted the field survey, secondary data collection, and participated the UN poverty reduction project in Dhaka City
due to know their project implementation process on behalf of the UN-Habitat international internship program
organized by Kyushu University. The development authorities implement their projects to improve the quality of life for
the urban poor however, the lack of project implementation process and the local community awareness, development
work become useless within short time.
INTRODUCTION
Dhaka City has more than 12.6 million population
within only 302 km2 land area [1]. In addition, more
than 31% of total urban population lives in slums and squatters area in Dhaka City as well as in the world with their own poor identity [2]. According to the Table 1, Dhaka City is a high density urban area and huge number of poor people located in central city. Within Dhaka City Corporation (DCC) area
(only 145 km2 land area) has 4,342 slum clusters with more than 2.5 million slum people with their
poverty life (CUS slum survey, 2005)*1. Based on existing urban poverty condition, a large number of local and international development organizations implement their slum improvement as well as poverty reduction projects in Dhaka City. However, the lack of development projects implementation process poor people cannot improve their quality of life. In addition, local government has no active performance due to their poverty issue. They (local
government) just perform to invite some development projects in poverty area, but they do not perform to sustain their development work. The development organization can support to the poor however, the local government and local community have to maintain and aware on their development work due to their quality of life.
Table.1 Population Density and Poverty Condition of Dhaka City
Urb
an
Are
a
Lan
d A
rea (km
2)
Tota
l Popu
lati
on
(M
illion
)
Tota
l Pop
ula
tion
Den
sit
y
Pers
on
/km
2
No.
of
Slu
m C
luste
rs
Slu
m P
opu
lati
on
(M
illion
)
Slu
m P
opu
lati
on
Den
sit
y
Pers
on
/km
2
Dhaka
Metropolitan
Area (DMA)
302 11 36424 4966 3.40 11258
Dhaka City
Corporation
(DCC)
145 8 55172 4342 2.50 17474
Source: DCC Profile and CUS, 2005
Based on poverty reduction and slum improvement issues, a large number of research and development activities exist as a part of Millennium Development Goals (MDGs). For housing issues, research was done as low-cost housing proposal [3], low cost housing [4], improving living condition [5], addressing the urban poverty [6] etc for the urban poor population growth, destination Dhaka [7], slum of urban in Bangladesh [8] etc and for the improvement issue, the challenge of slum [9].
However this study will found the existing urban poverty condition that can be essential for poverty reduction or slum improvement issue. It is become beneficial for urban researcher, planner, development authority, and local government.
This study aims to clarify the existing urban poverty condition and sustainable poverty reduction process for the central urban area of Dhaka City. Individual objectives are: i) to clarify the existing slum condition as well as poverty condition in individual urban areas of Dhaka City Corporation. ii) to find out existing slum improvement process due to the involvement of development authorities and their performances. iii) to identify the lacking points for slum improvement issues as well as the poverty reduction process for Dhaka City. iv) to suggest the sustainable way of poverty reduction process involved by the local government and local community.
METHODOLOGY
This study is conducted a field survey in September to October 2010 and authors‘ participated the UN-Habitat international internship program from March to June 2009 on behalf of the urban poverty reduction project in Dhaka City. In addition, primary and secondary data were collected from various sources, and operated GIS, AutoCAD, illustrator as the tools for the data analysis. The individual methods are as follows: i) Supplementary primary and secondary data have been collected from the relevant sources. ii) Slum mapping for poverty isolation within Dhaka City Corporation area.
iii) Surveyed three different slum areas to identify the existing development organizations and their involvements

Proceedings of the International Conference on Environmental Aspects of Bangladesh (ICEAB 2011)
191
iv) The UN poverty reduction process was found by the participation of international internship program.
STUDY AREA
Due to the Fig. 1, Dhaka City Corporation (DCC) has different size of slum clusters with huge number of poor population and more than 7% total land is occupied by slum clusters in Dhaka City Corporation area (Based on CUS slum survey, 2005). Most of them are migrated from country side due to the lack of work facility as well as the source of income in rural area. At first the poor people are accommodated in urban slum area with poor public facilities. This
study consented in the following three slums in DCC area.
A. Koril Slum
Koril is the biggest slum cluster in Dhaka City as well as in Bangladesh and it is located in GULSHAN area as central urban area of Dhaka City (Fig.1). It has more than 109 thousand population within 62.7 hectares land area and this slum was established more than 20 years ago (CUS slum survey, 2005). Actually, the current government have plan to build a IT (Information Technology) village in that area, however, it is very difficult for the government to evict them and resettlement the huge number of poor people in urban area of Dhaka City. In addition, the huge number of local and international development organizations involved this slum to improve their quality of life.
Fig. 1. Dhaka city map
B. Bauniya Bad Slum
Bauniya Bad slum is located in MIRPUR area with more than 42 thousand population within five different blocks. This slum has 21.3 hectares land area owned by the government with very few public facilities for poor people. Bauniya Bad slum has huge number of development organizations to improve the quality of life for poor people. However the lack of development project implementation process and local community awareness, most of the improvement work becomes useless and create new problems for them.
C. City Polly Slum
City Polly slum is located in SYADABAD area as old part of Dhaka City. A large number of poor people involves as a city corporation cleaner as part-time or as full-time staff. This slum is divided in to nine parts with individual name however the land is owned by the government. The several types of development organizations involved to improve the quality of life for poor.
According to the Table 2, three of these slum clusters exists more than six development organizations due to the slum improvement as well as the poverty reduction from the urban area however, their life cannot be changed. In addition, the development authorities spend the huge amount of money but their achievement cannot be sustain for the lack of local community and government awareness and poor people life condition cannot be changed.
EXISTING CONDITIONS
Dhaka City has a large number of slums with
huge number of urban poor. They live in one room seems to be a one family. According to the Fig.2, most of the slum people are living four persons per room as a family and they use their room as multiple purpose. Based on the slum survey 2009 and 2010, development organizations spend a huge amount of money from the international development authorities to improve the quality of life for the urban poor. However the lack of development projects implementation process development work cannot be sustain for long time. Due to the lack of project implementation process and local community awareness, development works become inactive within short time and create new problems for their local community life.
Fig. 2. Living condition of urban poor (Based on questionnaire survey, 2010)
Fig. 3. The development project outline
Bauniya Bad
Slum
Koril Slum
City Polly
HG (c)

Proceedings of the International Conference on Environmental Aspects of Bangladesh (ICEAB 2011)
192
Table 1. Comparetive Slum Analysis in Central Urban Area of Dhaka City
Key Factors Koril Slum Bauniya Bad Slum City Polly Slum
No. of Household 20,480 8,500 4,000
No. of Population 109,400 42,500 21,000
Land Area 62.7 Hectares 21.3 Hectares 6.5 Hectares
Area Map
Existing Service
Providers
BRAC, Proshika, Jubok,
Hard to rich, UPHCP, MSS,
Plan Bangladesh, DSK, etc
Plan Bangladesh, DSK, UPHCP,
UCEP, Surovi, Phulki, etc.
BRAC, ASA, PSTC, Phulki,
Surovi, SATI, etc
Jobs Garments Worker,
Rickshaw and Van puller,
Day labor, maidservant, etc.
Garments worker, Rickshaw
and Van puller, maidservant,
etc.
DCC cleaner, Rickshaw and
Van Puller, Small business, Day
labor, etc.
Existing living
Condition and
public facilities
-Mostly tin shed housing
-Hygienic environment
-No public school
-No public hospital
-Tin shed and semi-raw
housing
-Hygienic environment
-No public school
-No public hospital
-Tin shed and semi-raw
housing
-Hygienic environment
-No public school
-No public hospital
Image
A. Development Process
Based on the urban development or urban poverty reduction process, three authorities are involved that local government, slum community, and development organization. Based on Fig.3, the local government and development organization have a relation on project negotiation as project implementation area, population coverage, achievement etc. Both of their targets to improve the slum or the urban poverty reduction issue. However the relation between local government and slum community is just for political issue in Dhaka City. In addition, most of the biggest slum clusters are allocated in government land but the local government cannot evict them because of their political purpose or huge number of their supporters. Due to their huge number, it is too
difficult for the local government to resettlement them in different urban area.
On the other hand, according the relation between slum community and development organization (Fig.3), slum community intends to receive maximum personal benefit from the development organization and the development organization intend to provide them the quality of life with community participation. The development authorities provide them the physical improvement as roads, drain, footpaths, sanitations, water supply etc. Actually, the physical improvement become beneficial for house owner or land owner
who lead the slum community and they are not poor. Based on the UN project implementation process, they involves few number community people on their project implementation stage however, their user have no idea on maintenance issue (Fig. 4). According to the Fig. 5, most of the community people cannot understand how to use their development work. As a result, development work becomes useless very first (Fig.6).
Fig. 4. The flow of project action plan (Source: UN-Habitat Poverty Reduction Project Report, 2007)

Proceedings of the International Conference on Environmental Aspects of Bangladesh (ICEAB 2011)
193
Fig. 5. The UN Project
Implementation Flow
Fig. 6. Lack of Local
Community Awareness
B. Public Services
Basically, slum area have no legal public facilities like access road, gas, water supply, electricity etc and no public educational institute, hospital because of land ownership. Due to the absence of basic public facilities, poor people cannot improve their quality of life. For example, education is one of the big issues for poverty reduction and human development but slum people are excluded from this basic facility. On the other hand, local government cannot build the educational institute due to their legal settlement as well as land ownership. Public health care facilities are also the same condition.
Based on this existing situation, local and international development organizations involved to improve the quality of life for urban poor however; their development work cannot be sustain due to the lack of local government and local community active performance.
Fig. 7. Slum People Intention for Community Work
LOCAL COMMUNITY AWARENESS
A. Based on Slum Community
Slum community has several problems which can be solved by their active participation. For the absence of their formal education, they cannot understand how to perform their life. They created problems for the lack of their self-awareness on behalf of their living environment. In addition, the development project has no performance to aware
the community people based on their development work. According to the questionnaire survey 2010, more than 78% people intend to perform the community work but they do not have guideline (Fig.7). For example, community people have no performance to clean their water logging drains, footpaths, and living area. In addition they throw their garbage on their surrounding area, make toilet on the drains or footpaths. On the other hand, development project have no performance to aware the community people on behalf of their project issue. In that case, development work cannot be sustainable and beneficial for slum people.
Fig. 8. Local community intended project
B. Based on Development Project
The development project provides several types of services however, they have to aware their community on improvement issue. According to the field survey 2010, a large number of slum people wish to implement the skill development project but most the project based on physical development (Fig.8). On the UN project orientation seminar at 27th September 2010 in Dhaka City, a community lady‘s asked that, don’t create a project for house owner or land owner, please create a project for real poor (Field survey, 2010). By the physical
improvement, poor people have to pay more rent to the house owner. In addition, physical development cannot be sustainable due to the absence of maintenance and awareness. As a result, the development work should be implement as Sustainable Slum Improvement Model (Akharuzzaman, M and Atsushi, D. 2010) [10] that can be familiar the local community for maintenance and awareness. This model became comfortable for documentation for their donor agencies and become sustained for the community.
CONCLUSION
Dhaka City has huge number of slum clusters in the central urban area that can be identified the urban poverty condition of Dhaka City Corporation area. Each of the slum clusters has high density, hygienic environment, poor infrastructure and poor public services from their local government. Based on the existing condition, local and international development organizations took the step to improve quality of life for poor. However the lack of local community awareness and project

Proceedings of the International Conference on Environmental Aspects of Bangladesh (ICEAB 2011)
194
implementation process the development work cannot be sustained for the quality of life.
Local community and local government have to take the main responsibility to maintain their development work for the sustainability. On the other hand, development project have to aware the community people based on their development work and their maintenance system. The development organizations have enough capacity to spend huge amount of money for poor but they do not have capacity to maintain their development work. On the other hand, local community and local government have enough capacity to maintain their development work but they do not have enough money and knowledge for their development. As a result, three of the main authorities have to take their self-responsibility to reduce the urban poverty from their self-capacity area.
Note: *1. Center for Urban Studies (CUS) slum survey
2005 Dhaka 1000, Bangladesh.
REFERENCES
[1] M Kamrunzzaman et al. 2009. Urban Poor‘s
Accessibility to Decent Shelter in Dhaka City: An
Exploratory Study on Housing Enablement Through
the private Informal Sector. Journal of Architecture and Planning. 74(643): 1969-1975.
[2] UN-Habitat. 2003. Slum of the world: The face of
urban poverty in the new millennium? The global
urban Observer Nairobi, Kenya.
[3] N Islam and AS Salma. 2008. A proposal for housing
development programme in Dhaka City, Centre for
Urban Studies (CUS), Dhaka.
[4] M Kamrunzzaman et al. 2010. Construction process
in self-help housing, a study on piecemeal
construction in urban housing in Bangladesh. J. of Architecture and Planning, 75(648): 353-359.
[5] World Bank. 2007. Dhaka: Improving the living
condition for the urban poor. Bangladesh
development series, Paper No. 17, pp 13
[6] N Islam et al. 1997. Addressing the Urban Poverty
Agenda in Bangladesh Critical Issue and the 1995
Survey Findings. The University Press Limited
[7] A Begum. 1999. Destination Dhaka, Urban
migration: Expectation and reality. University press
limited, Dhaka.
[8] N Islam. 2006. Slum of urban Bangladesh, Mapping
and Census. Center for Urban Studies (CUS) Dhaka,
pp 20-21
[9] UN-Habitat. 2003. The Challenge of Slum, global
report on human settlements. Earthscan Publication
Ltd, London.
[10] M Akharuzzaman and D Atsushi. 2010. Sustainable
Slum Improvement Model Based on Community
Participation in Dhaka City, Bangladesh. Proceeding
of the 8th International Symposium on Architectural
Interchanges in Asia (ISAIA), Nov. 9-12, 2010,
Kitakyushu, Japan. pp 1090-1095.

Proceedings of the International Conference on Environmental Aspects of Bangladesh (ICEAB 2011)
195
A4.010
Validation of DDT and Its Metabolites in Tobacco Leaf
Using HPTLC Technique
M Nazrul Islam1, M Alamgir Z Chowdhury1, M Abdur Rahman1, Zeenath Fardous1, M Mahboob H. Khan2 and M. Khorshed Alam1
1Agrochemical and Environmental Research Division Institute of food and Radiation Biology, Atomic Energy Research Establishment, Ganakbari, Savar, Dahak-1344
2 Department of Biotechnology, Kustia Islamic University, Kustia, Bangladesh
Abstract
A new, simple, precise, and rapid High Perforation Thin Layer Chromatography (HPTLC) method was developed for the
analysis of Dichloro diphenyl trichloroethane (DDT) and its metabolites, Dichloro diphenyl dichloroethane (DDD) and
Dichlorodiphenylethane (DDE) in tobacco (Nicotiana tabacum L.) leaf. A calibration curve of the DDT, DDD & DDE were
linear in the range of 100 ng – 400 ng and the correlation coefficient for the calibration equation (r2) of DDT, DDD and
DDE were 0.9983, 0.9831 and 0.9855 respectively. Recoveries from laboratory-prepared test spiked samples of the
DDT, DDD and DDE using Florisil column chromatography were 80.50-92.00 % (avg. 86.25 %), 75.81-95.18 % (avg.
85.63 %) and 72.80-88.40 % (avg. 80.40 %), respectively. Out of 26 tobacco leaf samples from different areas of Kushtia
district, only one was found contaminated with DDT. The amount of DDT present in tobacco leaf sample was quantified
by HPTLC (4.36 ppm) and further confirmed by GC-MS (4.70 ppm). Minimum Detectable Quantity (MDQ) of DDT was
10 ng and of DDD & DDE were 15 ng by HPTLC method. Limit of Detection (LOD) of DDT was 0.002 ppm, and of DDD
& DDE were 0.003 ppm by HPTLC method.
INTRODUCTION
Tobacco (Nicotiana tabacum L.) cultivation, like
the production of nearly all other crops, requires appropriate measures to protect the growing plant
in order to secure desired quality and acceptable
yield, as well as to preserve the crop after harvesting.
Responsible and considerate use of agrochemicals
may, in some cases, lead to unavoidable residues
remaining on the crop. Consequently, like other
crops, agrochemical residues may be detectable on
commercial tobacco and in finished tobacco products.
More than 130 different pesticides are used
worldwide for the production of tobacco, with
approximately 25 compounds used on a regular
basis. They belong to different chemical groups,
such as organophosphates, carbamates,
organochlorine and heterocyclic pesticides, nitro
compounds, pyrethroids and amides [1]. Pesticide use has been worsened by the desire to produce
bigger crops in less time because of the decreasing
market value of tobacco. Pesticides often harm
tobacco farmers because they are unaware of the
health effects and the proper safety protocol for
working with pesticides. These pesticides as well as
fertilizers, end up in the soil, the waterway and the
food chain. Early exposure to pesticides may
increase a child's life long cancer risk as well as
harm his or her nervous and immune systems.
Many of these compounds can cause moderate to
severe respiratory and neurological damage or act
as genotoxic and carcinogenic agents [2].
It has been established that the organochlorinated
compounds (OCC) dichlorodiphenyltrichloroethane
(DDT) and its metabolites dichlorodiphenyldichloro ethane (DDD) & dichlorodiphenyldichloroethylene
(DDE) are xenoestrogens which influence both
normal and neoplastic estrogen- responsive tissues.
Therefore, it has been hypothesized that OCC
contribute to the risk for breast cancer. Although
the food chain has been recognized as a major
source of human exposure to these compounds,
tobacco and tobacco smoke were also considered as
source of exposure to OCC [3]. Furthermore, compared to other crops, tobacco leaves have wider
surface area and weight. Due to wider area, its need
excessive pesticide spray and always a chance for
more accumulation of pesticide residues in the leaf
tissues in compare to other crops [4].
The conventional analysis of pesticide residues in
agricultural commodities is a labor-intensive
procedure, since it is necessary to cover a wide
range of different chemicals, using a single
procedure [5]. Standard analysis methods include
extensive sample pretreatment (with solvent
extraction and partitioning phases) and determination
by gas chromatography (GC), high-pressure liquid
chromatography (HPLC) and mass spectrometry
(MS) to achieve the necessary selectivity and
sensitivity for the different classes of compounds under detection [6]. The current methods of
analysis provide a large number of samples analysis
capacities. Due to short samples application & spot
development time on TLC plate and less TLC plate
scanning time by densitometer, both qualitative
and quantitative results are found by High
Performance Thin Layer Chromatography (HPTLC)
technique within a short time in compare to other
instruments. When standardized conditions are
used, this HPTLC can be used for screening
compound residues in sample of unknown origin [7].
A known amount of reference grade DDT, DDD and
DDE as well as their spiked samples were subjected
to TLC, and the amount of DDT, DDD and DDE
present in the spiked sample was determined by
densitometry in a single beam, single wavelength reflectance mode. OCC are haloalkyl in nature and
black spots are developed on silica gel RP-18 F254 S
ready-made plates under low intensity UV radiation
chamber at 254 nm [8, 9]. In the present study, our
aim was to develop a screening and quantitative
method for detecting DDT, DDD and DDE in
tobacco samples using HPTLC technique.

Proceedings of the International Conference on Environmental Aspects of Bangladesh (ICEAB 2011)
196
MATERIALS AND METHODS
A. Apparatus
(a) High Performance Thin Layer Chromatography (HPTLC): HPTLC Applicator AS 30, HPTLC UV Lamp with Cabinet, HPTLC Densitometer CD 60 with evaluation software (Desaga Sarstedt-Gruppe Germany); precoated silica gel RP-18 F254 S ready- made HPTLC glass plate (Sigma-Aldrich, USA).
(b) Gas Chromatograph Mass Spectrometry (GC-MS): Finnigan Trace GC Ultra, Finnigan Trace DSQ with evaluating software (Thermo Electron Corporation, USA)
B. Reagents
(a) Reference standard: Reference grade DDT (98 %), DDD (99.50%) and DDE (97%) standard were purchased from Dr. Ehrenstorfer GmbH, D-86199 Augsburg, Germany.
(b) Solvents: Acetone, n-Hexane, diethyl ether and Petroleum ether of laboratory reagent grade were obtained from Merck (Germany) and were glass-distilled before use. Diethyl ether of IR Spectrum grade procured from BDH, England.
C. Sample collection and storage
26 Tobacco leaf samples were delivered to the laboratory from the local areas of Kushtia district of Bangladesh and refrigerated for further processing.
D. Tobacco leaf sample extraction and clean up
5 g of each tobacco leaf sample and one positive control in triplicate were taken in a 250 ml Erlenmeyer flask and extracted with 100 ml of residue grade acetone by a shaker for 12 h at 150 rpm. Extracts were then concentrated to 5 ml on a rotary evaporator. The concentrated 5 ml extract of positive control was divided into three eppendorf tubes (1 ml+2 ml+2 ml). From 1 ml, 20 µl was directly injected onto TLC plate without cleaning. 2 ml extracted sample were cleaned up by activated charcoal in 100 ml double distilled (DD) n-hexane then filtered by Whatman (No. 1) filter paper then concentrated to 2 ml on a rotary evaporator. The other 2 ml extract were passed through column (10 mm ID) packed with florisil (60-100 mesh). This extract was finally eluted with 100 ml 2% double
distilled diethyl ether in double distilled n-hexane and rotary evaporated to 2 ml for HPTLC analysis. All the 26 extracted tobacco leaf samples were cleaned up by florisil column chromatography.
E. Positive control
1000 µl each DDT, DDD and DDE spiking- standard (100 ng/ µl) were applied into one sample as positive control and give 10 min absorption time.
F. Sample analysis
(a) Sample Analysis
i) Application Mode: A spotting plan was prepared and recorded in the HPTLC lab-book in advance with the amounts of substances to be applied. 20 µl prepared each samples and three different quantification DDT, DDD and DDE standards were applied in the order of 2 mm bands on activated
(120oC for 45 min) silica gel RP-18 F254 S TLC plate (20 x 10 cm) by microprocessor controlled HPTLC
applicator (DESAGA AS 30) starting from the left corner of the plate. The bands were applied at a distance of 10 mm from the bottom and at least 10 mm from both ends of the plate. Distance between two lanes is 6 mm and distance between tip of syringe and TLC plate was fixed at 1 mm for sharp application of bands. Samples and standard solutions were applied on the TLC plate at delivery rate of 5 s/µl, and air from cylinder was used for drying the spots. Loaded plate was viewed inside a cabinet under UV light (254 nm) to ensure proper application before development.
ii) TLC Plate Development: To obtain saturated vapour phase in the tank, a filter paper was placed into the developing tank for 30 min before eluting the plate. The tank was filled with different developing solvents of n-hexane, ethyl acetate,
diethyl ether, petroleum ether individually and in different combination. The tank was filled with the developing solvent (1 % double distilled diethyl ether in double distilled n-hexane) to obtain one cm immersion depth for the plate. 1 % diethyl ether in n- hexane solvent system was found satisfactory for compact bands and sharp peaks of DDT, DDD and DDE during scanning. The developing tank was placed into a water basin for improving the reproducibility of retention values. The plate was eluted up to 95 ± 0.5 mm from the starting point with 1 % diethyl ether in n-hexane.
iii) Densitometry Evaluation: Qualitative analysis for DDT, DDD and DDE was done by HPTLC UV Chamber (DESAGA) at 254 nm wavelength while quantitative analysis by a high resolution HPTLC Densitometer (DESAGA CD 60) with Deuterium lamp wavelength 230 nm, slit length 4 mm, slit width 0.2 mm. In addition, the amount of DDT present in tobacco leaf sample was further quantified and the structure of DDT was confirmed by Gas Chromatograph Mass Spectrometry (GC-MS).
(b) Calibration Curve
The calibration curves for DDT, DDD and DDE were prepared in the range of 100-400 ng by
applying three bands of the standards.
Table 1. Calibration Equation Parameters of DDT, DDD
and DDE
Analyte Y=a*x Correlation coefficient, R2
DDT 0.3529x 0.9983
DDD 0.4983x 0.9831
DDE 0.4944x 0.9855
(c) Calibration Curve
The percentage recovery of DDT, DDD and DDE was determined. Standard solutions and positive controls for DDT, DDD and DDE were applied in triplicate and, alternately, on a precoated TLC plate. After development and quantification as described above, the percentage recovery of the spiked DDT, DDD and DDE were calculated from the equation, as below
% Recovery = [CE / CM × 100]
Where, CE is the experimental concentration determined from the calibration curve and CM is the maximum concentration expected.

Proceedings of the International Conference on Environmental Aspects of Bangladesh (ICEAB 2011)
197
DATA INTERPRETATION
A. Quantitation of DDT, DDD and DDE in tobacco leaf samples
For quantitative determination of DDT, DDD and DDE present in tobacco leaf samples, three bands (20 µl) of DDT, DDD and DDE standard solution and one of its samples were applied alternately on a
TLC plate. Plate was developed and quantified by densitometry as described above. Out of 26 tobacco leaf samples, only one was found contaminated with DDT. The amount of DDT present in tobacco leaf sample was further quantified and confirmed by GC-MS.
RESULTS AND DISCUSSIONS
A. Choice of development system
The retention factor (Rf value) of the DDT, DDD and DDE were recorded in individually and different compositions of n-hexane, diethyl ether, ethyl acetate, petroleum ether etc. 1 % diethyl ether in n-hexane solvent system was found satisfactory as bands of DDT, DDD and DDE were found compact and their peaks were sharp during scanning. The results of three replicates of analyses showed that the average recoveries of DDT, DDD and DDE in the spiked positive controls of the tobacco leaf samples without clean up, charcoal clean up and florisil clean up system were 5.20 %, 10.43 % and 86.25 %, respectively, 5.10 % , 7.55 % and 85.63 %, respectively and 3.93 %, 14.23 % and 80.40 %, respectively (Table. 2). The average recoveries of DDT, DDD and DDE obtained as high as 86.25 %,
85.63% and 80.40 %, respectively using florisil clean up system with HPTLC technique were found satisfactory. In addition, the recovery for DDT with GC-MS technique was 90.96 % [10].
DDT and its metabolites (DDD and DDE) are nonpolar in chemical nature. Elution of DDT groups with a nonpolar eluent, n-hexane through polar florisil occurs easily and the recovery is higher. Whereas, inertness of activated charcoal does not accelerate the elution and thus the recovery is poor [11]. Out of 26 tobaccos leaf samples, only one (sample ID-BD 15) was found contaminated with DDT. The amount of DDT present in the sample was 4.36 ppm determined by HPTLC and 4.70 ppm by GC-MS (Table 3).
B. Minimum detectable quantity
The Minimum Detectable Quantity (MDQ) of DDT was 10 ng and of DDD and DDE were 15 ng each on
silica gel RP-18 F254 S TLC plate.
C. Rf value
The Rf values of DDT, DDD and DDE were 0.67, 0.53 and 0.72, respectively.
D. Precision
DDT, DDD and DDE were analyzed in 26 tobacco
leaf samples on a 10×10 cm TLC plate. 20 µl of DDT, DDD and DDE standard solutions, tobacco leaf samples and positive control samples were applied on a 20×10 cm TLC plate. Quantification and plate development were performed as described in the sample analysis section. Out of 26 tobacco leaf
samples, only one was found contaminated with DDT that was further analyzed and confirmed in triplicate by GC-MS (Table 3).
Moreover, the positive control sample was also analysed by GC-MS for recovery test. Oven temperature was programmed at the initial temperature of 450C and was increased quickly up to 1300C at the rate of 650C/min where hold time was 2 min. Then temperature was increased up to 1800C at 120C/min, up to 2400C at 70C/min, and then finally up to 3200C at 120C/min. Injector, MS transfer line and MS heater temperatures were maintained at 2500C. High purity helium carrier gas was used. Flow rate of carrier gas was maintained constantly at 30 cm/sec linear velocity. Vacuum compression and septum purge were on.
Table 2. % Recovery of DDT and its Metabolites (DDD and DDE)
An
aly
te
Clean up
system
Amount (ng) on TLC
plate*
Recovery
%
Applied Found
DDT
Control 00.00 00.00 00.00
Without
clean up 400 20 05.20
Charcoal
clean up 400 41.70 10.43
Florisil
clean up 400 345.00 86.25
DDD
Control 00.00 00.00 00.00
Without
clean up 400 20.40 05.10
Charcoal
clean up 400 30.20 07.55
Florisil
clean up 400 342.50 85.63
DDE
Control 00.00 00.00 00.00
Without
clean up 400 15.70 03.93
Charcoal
clean up 400 56.90 14.23
Florisil
clean up 400 321.60 80.40
*average value of three replicates. For each analysis, 2 µl of samples and standard
solutions was injected in triplicate, and average peak area was taken for calculation. Results of both the techniques (4.36 ppm by HPTLC and 4.70 ppm by GC-MS) were in agreement (Table. 3). The recovery of DDT by GC-MS was 90.96% which was also in agreement with the result (86.25 %) obtained with HPTLC.
Table 3. Concentrations of DDT, DDD and DDE in
Tobacco Leaf Samples determined by HPTLC and GC-MS
Sample Code
Area Concentration in ppm
DDT DDD DDE
BD 15 Pragpur 4.36a
4.70b
ND ND
a-concentration determined by HPTLC, b- concentration
determined by GCMS; ND-below detection limit; Detection
limit (DDT, DDD, DDE) = (0.002, 0.003, 0.003) ppm.

Proceedings of the International Conference on Environmental Aspects of Bangladesh (ICEAB 2011)
198
Average Standard Deviation (SD) of HPTLC and GC-MS experiments for tobacco samples was ranged from 0.97 to 1.42 and 0.45 to 0.92, respectively. The described HPTLC method for the quantitative analysis of DDT, DDD and DDE in tobacco leaf samples is a simple, rapid, and economical alternative and compared with those based on GC or LC, and can be successfully applied for routine analysis [12].
CONCLUSION
The method is simple, rapid, and reproducible and has been applied successfully to determine the organochlorine pesticide residues (DDT, DDD and DDE) in tobacco samples.
REFERENCES
[1] S Mavrikou, K Flampouri, G Moschopoulou, O
Mangana, A Michaelides and S. Kintzios. 2008.
Assessment of organophosphate and carbamate
pesticide residues in cigarette tobacco with a novel
cell biosensor. Sensors, 8: 2818-2832.
[2] K Hayat, M Ashfaq, U Ashfaq and MA Saleem. 2010.
Determination of pesticide residues in blood samples
of villagers involved in pesticide application at
District Vehari (Punjab), Pakistan. African J. Envirol. Sci. Tech., 4(10): 666-684.
[3] MV Djordjevic and JHD Fan. 1995. Assessment of
chlorinated pesticide residues in cigarette tobacco
based on supercritical fluid extraction and GC-ECD.
Oxford J. Life Science & Medicine Carcinogenesis,
16(11): 2627-2632.
[4] JB Drossopoulos, DL Bouranis, S Kintzios, G
Aivalakis, J Karides and SN Chorianopoulou. 1998.
Distribution profiles of selected macro-nutrients in
oriental field grown tobacco plants as affected by
nitrogen fertilization. J.Plant Nutrition,
21:1391-1406.
[5] J Haib, I Hofer and JM Renaud. 2003. Analysis of
multiple pesticide residues in tobacco using
pressurized liquid extraction, automated solid-phase
extraction clean-up and gas chromatography
tandem mass spectrometry. J. Chromatogr. A., 1020: 173-187.
[6] J Sherma. 2007. Review of advances in the thin layer
chromatography of pesticides: 2004-2006. J Environ Sci Health B, 42: 429-440.
[7] A Ambrus, E Hargital, G Karoly, A Fulop and J
Lantos. 1981. General method for determination of
pesticide residues in samples of plant origin, soil and
water. II. Thin layer chromatographic determination.
J. AOAC, 64(3): 743-748.
[8] IAEA. 2005. Validation of thin-layer
chromatographic methods for pesticide residue
analysis. IAEA-TECDOC-1462.
[9] A Pasha and KK Nayak. 2005. A thin-layer
chromatographic method for the analysis of
pesticides containing haloalkyl group.
IAEA-TECDOC -1462, pp. 149-152.
[10] FAO. 2007. Florisil clean up method 3620C
(www.fao.org/fishery/countrysector/naso_banglade
sh/en).Revision 3, p.22.
[11] M Akeblom. 1995. Environmental monitoring of
pesticide residues. Guidelines for the SADC Region.
Clean up chapter, p. 4.
[12] J Sherma. 2007. Review of advances in the thin layer
chromatography of pesticides: 2004-2006. J Environ
Sci Health B., 42: 429-440.

Proceedings of the International Conference on Environmental Aspects of Bangladesh (ICEAB 2011)
199
A4.011
The Development of Training Packages Environment Education on
Solid Waste in Community for Village Health Volunteer in Amphoe Muang Sakon Nakhon
Somchoke Sriharuksa, Adisak Singseewo and Ponlakit Jitto
Department of Environmental Education, Faculty of Environment and Resource Studies, Mahasarakham University, Muang Mahasarakham, Thailand.
Abstract The aim of this study is to investigate as follows, to develop the training packages environment education on solid
wastes in the local community for village health volunteers and to compare the knowledge, the participatory action
and the skills of operations before and after the training by using the training packages environment education on the
topic of solid wastes in the local community. The samples size of village health community volunteers are 53 who were
selected by cluster random sampling method. The results showed that the efficiency of the training packages
environment education is 90.61/89.90 which is higher than the requirement of the setting up criterion of 80/80 and
the index of training is equal to 0.6030. After the efficiency of the training course, the village health volunteers can show
that there is an increase of knowledge and participants skills and skills of the operations, individually and overall. The
increasing levels are highly significant in statistic.
INTRODUCTION
Presently there is the development of Economic, Social and Technology which is expanding rapidly in the suburbans areas. There is an increase of population which is resulting in a higher amount of solid wastes in urban areas. The environmental pollutions concerns are priority and have a tendency to be the most severe problems in near future [1]. This mentioned the quantity of solid wastes in 2001 increased over 30 % or the daily wastes increased to 38,600 tons. Inside the city of Bangkok also showed that the amount of solid wastes has increased to 9,320 tons daily or 24% of total solid wastes of the countries solid wastes. In Pattaya Municipality area there is 11,900 tons daily of solid wastes or 31% and 17,420 tons daily solids wastes in the outer area of municipality or 45% of overall. The future expected amount over the next ten years is increasing from 39,400 tons to 4700 tons daily solid wastes in 2011 or 2.0% increase of solid wastes which is between 700-900 tons daily [2]. In 2008 solid wastes which came to15.03 million tons especially inside the municipality area and in Pattaya City the increase was 14,915tons (36%) daily. The outside of municipality increased to 17,369 tons (43%). The figures from Metropolitan of Bangkok are 8,780 tons of solid wastes daily (21%).
Sakon Nakhon Municipality has obtained the areas of 54.54 square kilometer. Which consists of 40 Community and the populations is 53,933 people (27,048 males and 26,945 females) recorded on 31st December, 2008). The numbers of residences are 18,881 household inside Sakon Nakhon Municipality which possess the amount of 55 tons of daily solid wastes. The Solid Sakon Nakhon Municipality Office is able to collect 50 tons of solid wastes collected daily.
The statistic report from Division of Public Health and Environment found that there was of 5 tons of uncollected solid wastes daily. Inside Sakon Nakhon Municipality has provided the cleaning system, well organized however it does not cover all the small rural areas. Sometimes there are the solid wastes left over in the river areas. The majority of solid wastes are plastics, papers, foods, fruits rinds,
Banana leaves, wood, glass bottles etc. The plastics and the food gabages are the most popular ones. The people have no ideas in managing since they get used to their own daily practices. The government does not have the proper way to regulate an appropriate solution in order to remove all solid wastes especially at Sakon Nakhon Municipality. The problem continues to become more severe.
There are many village health volunteers who are hired by Sakon Nakhon Municipality in order to be the center of teaching especially in environmental and community development. This organisation also is the center to represent the community in coordinating with city in various health functions.
The participatory action of village health volunteers is very essential in resolving all the problems in the community, such as health promotion problems, and environmental concerns with health problems. The roles of the village health volunteers are to be the leader of the health management team. The leads should convey all messages about health issues to the people in order to increase the quality of life and diminish all the tragedy to their lives.
The village health volunteers will transfer the messages and persuade the local people to participate in the team and guide them how to understand the training packages environment education on Solid. It is important to educate the local people to be responsible in the area of wastes management [3]. The solid wastes training packages environment education will be useful in the area of education
and developing positive attitudes and skill of attitudes in management of solid wastes, therefore the package which consists of teaching program will educate the new village health volunteers and also the previous volunteers to obtain better knowledge, better skill, and better attitude in management.
Research Objectives:
- To develop the training packages environment education on solid waste for the village health volunteers team with 80/80 criterion and to calculate the effectiveness index.
- To compare the knowledge of the management of solid waste, the participatory action and the skills of operation before and after using the

Proceedings of the International Conference on Environmental Aspects of Bangladesh (ICEAB 2011)
200
training packages environment education on solid waste. This is related to the differences of the age group, the working experiences and the location of work places.
MATERIALS AND METHODS
This research is experimental study. The sample group is village health volunteers which are located in Amphoe muang of Sakon Nakhon province. The sample selection is cluster random sampling which was composed of 4 groups of village health volunteers who have been trained inside the city for 2 groups and 2 groups outside the city. The total of 4 groups is 53 people. The research tool is training packages environment education on solid waste which has been used for village health volunteers in 4 areas as follows:
- Basic knowledge of solid wastes management - The knowledge of transformation and
separation of the solid wastes - The recycling of the solid wastes - The evaluation of participatory of
management of solid wastes including the training plan, the scale of satisfaction, evaluation, the scale for measuring the participatory action, the scale for measuring the knowledge and competency.
The statistical method used in this research was a descriptive statistic such as percentage, mean, standard deviation. The inferential statistics used for testing the hypothesis before and after training the village health volunteers was paired t-test and dependent t-test.
The statistics used for testing the knowledge and the competency ability was (one - way Mancova) by using the Mean of conceptual levels by using t-test and F-test.
RESULTS
The developing of environmental solid wastes training packages by village health volunteers found that the efficiency and the effectiveness of the operation met the 80/80 criterion level
Firstly step, the result of the efficiency index analysis of environmental solid wastes training packages by village health volunteers found that the efficiency and the effectiveness of the operation met the 80/80 criterion level by sub-testing score after training and knowledge testing score after training are as table 1.
Tables 1. The efficiency of solid waste product training
packages solid waste product in local community 80/80
criterion.
No.
of
villa
ge
healt
h v
olu
nte
er
(N)
Tota
l score
of
qu
esti
on
nair
e a
fter
train
ing (
40
score
)
E1
Tota
l score
of
qu
esti
on
nair
e
(kn
ow
ledge) aft
er
rain
ing (40 s
core
)
E2
Th
e e
ffic
ien
cy o
f
solid w
aste
pro
du
ct
train
ing p
ackages o
f
(E1/E
2)
53 36.25 90.61 35.96 89.90 90.61/89.90
In Table 1, it was found that the training by using environmental solid waste training packages has increase the efficiency from 80/80 to 90.61/89.90.
Secondary step, The result of efficiency analysis of solid waste training packages in community of village health volunteers after the training, find that efficiency index scores showed 0.6030 which meant that these the increase of knowledge of the village health volunteers and came to 60.30%.
The comparative study of the knowledge, the skills of operations before and after the training with the environmental solid wastes training packages.
From Table 2 After training it was found that the Village Health Volunteers had obtained the 92.20 % knowledge, 86.40 % in the transformation of solid waste, 89.60 % in management and 94.20 % of the participatory actions. Therefore the total scores which were of the composed of the 4 areas in knowledge, perceptions after training are higher than 80 percent of the full score. And higher than before the training at the significant in statistic level at 0.05.
After the training was performed the Village Health Volunteers obtained the participatory decision making at X= 3.93, the operational action at X= 3.82, the beneficial acceptance at X=4.12, the evaluation at X= 4.64 which are very high level. The total of the knowledge level are high level at X = 4.13 in order to operation of solid waste of the Village Health Volunteers. The overall participatory actions after training of the 4 areas are higher than before training at significant in statistic level at 0.05.
After the training was performed the Village Health Volunteers obtained Skills of Operation the collection of solid wastes management data are more
(X=4.56), the transformation (X=4.37) in operation of solid waste also increases more frequently (X= 4.48) The total scores of numbers of managing after training of the 3 areas are increased (X= 4.47) at highly significant in statistic at the level of 0.05
DISCUSSIONS
The environmental solid waste training packages is the tool for village health volunteers in managing the solid wastes disposal. The efficiency of the training Packages is 90.61/89.90 which is higher than 80/80 standard criterion. The index of effectiveness in solid wastes disposals management is 0.6030. Therefore, there is the increase of knowledge in solid wastes disposals management among the village health volunteers.
The development of Solid wastes management was derived from reviewing and analyzing of the formers training tools after reviewing the literatures and all the research articles as in the references. The experts also agreed on the contents of the environmental solid waste training packages for managing the solid wastes by the village health volunteers. All factors are related and strong in validity and also the continuation of training will be useful for the operation and managing of solid waste by the village health volunteers. The experts also have adjusted some of the necessary factors

Proceedings of the International Conference on Environmental Aspects of Bangladesh (ICEAB 2011)
201
included in the Training Packages. The mean results are very high scores after training [4] which the efficiency of training in managing model scores was 86.50/88.00. The efficiency of managing is higher than the setting up of standard criterion.
The study showed that the knowledge, the participatory action, and the skills of operation are higher after the training with highly significant in statistic level at level of 0.05.
There are also the comparative study of knowledge, the participatory action and the skills of operations before and after the training which are categorized in different in age groups, different in working experience and work location. The result also showed the village health volunteers obtained the better knowledge, better participatory action and better skills of operations at highly significant in statistical level at 0.05. The study of impact of the
participatory learning, attitudes, and operations in preventing the contamination of Lead Residue to the workers and also the study of environmental status of electronics and repair shops in Nakhon Rajchasrima.Province [5]. It was resulted after the training that there are higher in the attitudes scores and higher in perception scores in prevention of the contamination of Lead in each item and total scores with highly significant in the statistical level at 0.05. The lower of contamination level before and after the training are 13.82. The techniques of different in training course and materials should be more useful and more interesting to the village health volunteers. It is necessary to adjust the contents of training which are relevant to the needs of learners. It also is important to educate the learners to understand and bring it to daily implementation.
Table 2. The comparative study between knowledge environmental participatory action and skills of operation before and
after training by using solid waste training packages of the village health volunteers
Factors Management of solid
waste product
Before training
(n = 53)
After training
(n = 53)
t p-value
X S.D. X S.D.
The
Knowledge
General Knowledge 8.55 0.67 9.22 0.47 -5.67 .000*
Transformation 7.00 0.83 8.64 0.59 -12.16 .000*
Management 7.09 0.93 8.96 0.65 -13.86 .000*
Participation 8.57 1.23 9.42 0.93 -6.66 .000*
Total 31.21 2.33 36.24 1.23 -14.70 .000*
The
Participatory
Action
Decision Making 3.80 0.21 3.93 0.19 -9.35 .000*
Operation 3.46 0.20 3.82 0.16 -14.93 .000*
Benefits 3.82 0.24 4.12 0.19 -12.96 .000*
Evaluation 4.36 0.14 4.64 0.06 -15.56 .000*
Total 3.86 0.16 4.13 0.14 -23.72 .000*
Skills of
Operation
Collection 4.39 0.14 4.56 0.09 -14.98 .000*
Transformation 4.05 0.17 4.37 0.13 -19.52 .000*
Decomposition 3.92 0.17 4.48 0.11 -25.83 .000*
Total 4.12 0.11 4.47 0.11 -44.16 .000*
* Statistically significant at 0.05
CONCLUSION
The application of environmental solid wastes training packages in solid wastes disposals management by the village health volunteers is very effective and the training can give the result of better knowledge, better participatory actions and better in skill of operation for the village health volunteers in managing of solid wastes disposals. Therefore, it is benefit for village health volunteers for the management of solid wastes disposals and also can be useful for other organizations in training their staffs in the future.
REFERENCES
[1] Pollution Control Department. 2006. Thailand
Pollution Situation Conclusion year 2005. Available at:
http://www.pcd.go.th/info_serv/polstate2005.html#s5
[2] Pollution Control Department. 2009. Thailand Pollution
Situation Conclusion year 2008. Available at:
http://www.pcd.go.th/public/Publications/print
report.cfm?task= report2008
[3] V Veeravatnanond. 2003 . Environmental Education
(3rd ed.). Odeon Store Printing House: Bangkok. Page 9-16.
[4] P Sunthornchai, S Khotbunthou, P Boujai and P
Thamaseananupap. 2010. A Development of Waste
Management Training Model. The Social Sciences,
5(4): 302-304.
[5] W Wongpraphan, A Singseewo, T Thanee and C
Padungtod. 2010. The Effect of Group Participatory
Learning Process on Knowledge, Attitude and Practice
for Lead Contamination Prevention on Electrical
Equipments and Electronic Devices Repairmen and
Work Environment in the Area of Nakhonratchasima
Province, Thailand. The Social Sciences, 5(3): 202-207.

Proceedings of the International Conference on Environmental Aspects of Bangladesh (ICEAB 2011)
202
A4.012
Environmental Education in Bangladesh and Japan:
A Comparative Assessment
Chowdhury Mahbubul Alam
International Business, Nagasaki University of Foreign Studies, Japan
Abstract
Environmental education (EE) in Bangladesh has been slowly permeating the formal education sector at the primary,
secondary and tertiary levels, including madrasa (Islamic School) education, the training of government officials, and
sporadically the mass media and non-formal education sector.
This paper tries to correlate the EE level in primary and secondary school students in the Bangladesh and in Japan.
Specifically, its aim is to find out the cognitive level in EE of primary and secondary school students in the two countries.
It also seeks to compare the types of primary and secondary schools based on the implemented EE curricula. With the
desire to strengthen the correlation of the two variables, the same study is conducted among the Bangladesh students‘
counterparts in Japan.
INTRODUCTION
Environmental education (EE) is important in addressing issues as it provides the necessary knowledge, awareness, values and skills needed by citizens, the general public and decision makers to understand the complexities of the environment. The primary aim of EE is to enable Bangladeshi citizens to be aware of and appreciate the complex nature of the environment, as well as the role played by a properly managed environment, in social and economic development.
Bangladesh is one of the world‘s least developed country (LDC) and it have expressed at the development planning level has undertaken a number of measures to control hazards of development activities, and ensure a healthy environment of the country and the nation. This paper is intended to explore the EE which is one of the tools that help to
achieve environment problems and sustainable development (SD). Through the process of EE, individuals obtain an understanding of the concepts of and knowledge about the environment.
Since independence in 1971, Bangladesh has consistently maintained good relations with Japan and the people of Bangladesh. While the bilateral relations appear to be described in such a common expression like the JICA (Japan International Cooperation Agency) and Dhaka City Corporation‘s, ‗Clean Dhaka Master Plan‘ program has implemented. Through this kind of partnership, the link between Bangladesh and Japan is increasingly strengthened. This paper assesses those practices of EE towards SD in both countries that show some differences and similarities in terms of policies, strategies and implementations, and attempts to learn from Japanese experiences of EE. The main purpose of the study is to find out the EE problems of Bangladesh and their solution through the adoption of Japanese experience of EE. For this reason, it is necessary to understand the environmental problem of both countries. But considering constraints, like distance between Japan and Bangladesh, linguistic differences, resources and time, it was (is) decided to undertake the study mainly on the basis of primary and secondary data.
A BRIEF RECAPITULATION OF EDUCATIONAL SYSTEM
AND ENVIRONMENTAL EDUCATION IN JAPAN
The Japanese educational system was reformed by the Japanese government after World War II. The old 6-5-3-3 system was changed to a 6-3-3-4 system (six years elementary school, three years junior high school, three years senior high school and four years university). The duration of compulsory education (Gimukyoiku) is nine years, six years in elementary school (shougakkou) and three year in junior high school (chuugakkou). The compulsory education for all children provides free tuition fees and books. Educational system is centrally governed by the Ministry of Education, Culture, Sports, Science and Technology, (MEXT: Monbukagakusho). The MEXT supervises all
aspects of education from pre-school through upper secondary school and tertiary education in both the public and private sectors. At the regional level, each prefecture or major urban district has its own board of education. In some areas, high schools are under the direct authority of these boards, while elementary and junior high schools are managed by local (municipal) boards of education.
A. Education
The Japanese, education has important goals for acquisition of academic knowledge, intellectual growth, or vocational skills. Japanese education is compulsory from elementary school six years to junior high school three years. It is preceded by pre-school or kindergarten (Yochien) and Nursery Schools (Hoikuen) education. Kindergarten
education provide by education department; and nursery for provide by welfare sector, these are not compulsory education system. Elementary education (Shogakko) and junior high school (Chugaku) are compulsory.
The Ministry of Education defines the elementary school curricula and makes it uniform throughout the country, thus all students in one grade are studying the same subjects. The following subjects are included in the national curriculum: Japanese language, social studies, arithmetic, science, life environmental studies, music, arts and craft, physical education and homemaking

Proceedings of the International Conference on Environmental Aspects of Bangladesh (ICEAB 2011)
203
studies. In addition, there is an hour a week of moral education as well as extracurricular activities. The most important part of the curriculum, on the elementary level, is reading and writing (www.asianinfo.org).
Special education schools (schools for the deaf, schools for the blind, schools for the other disabled) provide physically or mentally disabled children with thorough and meticulous education, taking into consideration the type and degree of each child‘s disability.
B. Environmental Education
Japanese education provides all children with a high quality, well-balanced basic education in the EE, science, music, and art through nine years of compulsory schooling. Environmental education adopts an integrated approach to the environment, both natural and human-made, and promotes a holistic, dynamic and interactive view of its biological, physical, social, economic, technological and cultural components.
Environmental education at the school level should orient and develop students‘ perceptions and values as well as encourage their active participation toward environmental protection and conservation.
In addition, MEXT recent efforts reflect its intentions to integrate environmental awareness programs into all sectors of education. It aims to introduce students to local issues within their community by taking them out of the classroom i.e., fieldwork, meet with local NGOs. In 1997, MEXT introduced a new national curriculum called ―Sogo Gakushu‖ meaning, ―Integrated study‖ for implementation from 2002 in elementary/Junior and 2003 in senior high schools. The ―Sogo Gakushu‖ curriculum focuses on the implementation of stress free education and gives students the opportunity to learn about issues that are unique to their own community, such as environmental issues in their surroundings at leisure.
EDUCATIONAL SYSTEM AND ENVIRONMENTAL
EDUCATION IN BANGLADESH
The environmental education has largely been taught in the country since elementary school; however it is not enough curriculum system in the education. Recently there has in fact a new discourse to include environmental education in all level education policy. With this objective, the Government of Bangladesh had established several Education Commissions and Committees since the independence of the country [Masum and Akhir].
A. Education
The education system in Bangladesh can be defined as 5-5-2-4 system, which means five years of primary education, five years of secondary education and two years of higher secondary education and four years of undergraduate (honors) studies at colleges and universities.
There are six Education Boards under the Ministry of education in Bangladesh. School textbooks are published by the ministry of
education through Text Book Board of Dhaka department. The entire country follows the same curriculum. Ability to read and write is a great asset in Bangladesh and possesses multiplier effect, in that, it helps in better understanding of life, environment problems, pollution caused, efficient use of modern methods of cultivation, effective family planning, raising of children, and a democratic policy with a major focus on socioeconomic development may gradually emerge.
Since the independence of Bangladesh, governments have formed at least eight education commissions including Dr. Qudrat-e-Khuda Education Commission 1972. The new education policy 2010 has declared which are (Ministry of Education Website); to extended the level of primary education from class V to class VIII and free education; secondary education from class IX up to class XII; at the end of class X, a terminal examination will be held at upazila, (sub-districts, or subdivisions found in some Western countries. Sub-districts which called Thana or Upazila) municipality and thana level; all students would be able to study their respective religions as well as moral education. Religion will be studied at the ebtedayee (part of Islamic religious education) level in madrasah (Islamic religious education) along
with compulsory subjects like Bangla, English, moral education,
B. Environmental Education (EE)
There is currently no single long-term strategic plan for EE currently in place within Bangladesh. Consequently the approach to EE is carried out in a fairly random manner. NGO's working in the EE field produces and applies their own educational material for their own projects without consultation, for the most part, with the Ministry of Education. In terms of formal education, the Ministry of Education has played an important role through its effort to develop a curriculum for EE and implementing various teaching and learning strategies to enhance awareness and internalize values on the importance of environmental
protection in all schools. In line with the National Education Policy, ‗Environmental Education across the Curriculum‘ has been introduced in both primary and secondary schools since 1998. EE is not taught as a single subject but is taught across the subject board and integrated in each subject from Mathematics to Religious Studies.
LESSONS LEARNED FROM THE COMPARISON
Since Japan has a lack of natural resources, as does Bangladesh, it is an idea that this is a good fit to improve the environmental problems, as it (Bangladesh) should endeavor to adopt several laws and education policies of the Japanese environmental preservation system. Both countries promote EE in schools through the integration of environmental values and issues across the subject board. A separate EE subject is yet to be included in the school‘s curriculum for both primary and secondary education.
Proceedings of the International Conference on Environmental Aspects of Bangladesh (ICEAB 2011)
204
Through the EE experience between the Japanese and Bangladesh, many lessons can be learned. EE practitioners in Bangladesh can compare with and learn from the Japanese experience in EE and networking, and improve the implementation of EE in Bangladesh. A number of lessons were learnt from Japan with respect to EE related problems like, waste disposal, recycle, moral, policy, strategy, and development of plans and programs, knowledge dissemination, and training, and community activities.
CONCLUSION
Bangladesh could launch a fresh start by taking lessons from Japan by studying the way Japanese EE use the application of pollution prevention measure, waste disposal system, Reduce pollution, Reuse resources, Recycle waste and Recapture energy to overcome environment problems by utilization of the best possible technologies. It is my belief that, if Bangladesh designs its system from the experiences of the Japanese EE and SD, a favorable situation will emerge in the long run which will help it avoid problems which Japan faced at its early stage of development.
REFERENCES
[1] MA Al Masum and NSM Akhir. et.al.
―Environmental Education in Bangladesh with
Special Reference to Higher Studies (1992-2009).
[Online]. Available at: www.intconfhighered.org/
Al-Masum %20article.doc
[2] F Ahmed (ed.). Bangladesh Environment 2000: A Compilation of Papers Presented at the International Conference on Bangladesh Environment (ICBEN) 2000,
held in Dhaka on January 14-15, 2000, published by
Bangladesh Poribesh Andolon (BAPA), Dhaka 2000.
[3] BCAS. 1999. Guide to the environmental
Conservation Act 1995, And Rules 1997. Bangladesh
Centre for Advanced Studies, Dhaka, Bangladesh.
[4] Government of Bangladesh (GoB). 1998. Dainichi
Consultant Inc and others Feasibility of Light Rail
Transit in Metropolitan Dhaka, Ministry of
Communication, Government of Bangladesh, Dhaka,
Bangladesh..
[5] [5] Government of Bangladesh (GoB). 2010. Statistical Yearbook of Bangladesh.
[6] Government of Bangladesh (GoB). The First Five Year
Plan (1973-78).
[7] Government of Bangladesh (GoB). The Fourth Five
Year Plan (1990-95).
[8] Government of Bangladesh (GoB). The Fifth Five Year
Plan (1997-2002).
[9] Government of Japan, Ministry of the Environment,
Annual Report.
[10] Japan Bank for International Cooperation (JBIC),
Study on the Improvement of Transportation and
Environment in Dhaka, Dhaka, Bangladesh, 2000.
[11] N Mohammad. 2009. Environmental Law in Higher
Education of Bangladesh and Malaysia: An Approach
for Sustainability Paper presented at 3rd
International Conference on Higher Education for
Sustainable Development, 20-22 November, 2009
held at University Sains Malaysia, Penang, Malaysia.
[12] AA Rahman and D Mallick. 2001. Environmental
Issues Facing Rural Development in Bangladesh.
Bangladesh Centre for Advanced Studies, Dhaka,
Bangladesh.
[13] Japan Environmental Education [Online] accessed,
on 10 June, 2010, Available: <www.jeef.or.jp/
english>
[14] Ministry of Environment Japan, [Online] accessed, on
9 June, 2010. Available: www.env.go.jp/en/index.html
[15] Bangladesh Bureau of Education Information and
Statistics. (n.d.). Primary Education Statistics.
Retrieved April 25, 2008, from [Online] accessed, on
9th June, 2010, Available: www.banbeis.gov.bd/
db_bb/primary_education_1.html
[16] Japanese Education and Literacy. [Online] accessed,
on 9th January, 2011, Available:
www.asianinfo.org/asianinfo/japan/education
_literacy.htm

Proceedings of the International Conference on Environmental Aspects of Bangladesh (ICEAB 2011)
205
A4.013
Development of Simple Field Monitoring System for
Agriculture and Evaluation of its Validity
Takashi Okayasu1*, Hiromichi Yoshida2, Khadija Afroja3, Akinori Ozaki1,
Muneshi Mitsuoka1 and Eiji Inoue1
1 Department of Agro-enviromental Sciences, Faculty of Agriculture, Kyushu University, Japan 2 Graduate School of Bioresource and Bioenvironmental Sciences, Kyushu University, Japan
3Bangladesh Agricultural Development Corporation, Government of Bangladesh, Dhaka, Bangladesh *Corresponding Author: e-mail: [email protected]
Abstract Simple field monitoring system for agriculture has been developed by authors using weather and field monitoring
sensors, a built-in web based data logger device and the self-programmed agent system in which the data collection
program was installed. Such type of the field monitoring system called ―Fieldserver‖ has been originally proposed by
Hirafuji and Fukatsu [1]-[3]. In this system, all the measurement data were collected by the agent system and then were
stored periodically into the database via the Internet. A problem for a long term monitoring in the field has arisen by the
irregular stop of the agent system. In this study, other conceptual monitoring system was newly developed to improve
its reliability and redundancy. In this system, all the measurement data have been transferred as the mail data to the
mail server and then stored into the database. The field monitoring tests were conducted at the eight field testing sites
in Fukuoka, Nagasaki and Oita prefecture, Japan. Further the data offering system was introduced to provide the field
monitoring data timely to farmers. The convenience, scalability and interactivity of the system were also verified.
INTRODUCTION
Agriculture is a highly complex system in general. Thus long-term field environmental monitoring is very important not only to evaluate and predict growth of crops, occurrence of pests, diseases, and so on but also to optimize agricultural production operations. Under progress of the global warming, the necessity of the field monitoring is getting more and more important to improve and optimize the agricultural production system, from the emission of greenhouse gasses effect.
Various field monitoring systems have been developed by many researchers up to now. Among them, Hirafuji and Fukatsu [1]-[3] have proposed the web based field monitoring system called ―fieldserver‖ which is equipped with sensors, (temperature, humidity and solar radiation, and with switches for heaters, water sprinklers, etc.). It is possible to construct a large sensor network connecting together with other fieldservers under a de facto standard network protocol TCP/IP. It required no special software and additional hardware to collect the monitoring data and actuate the various tools installed in the server. All of the commands are fully transferred by typical web browsers such as the Internet Explorer, Firefox, etc. Jiang et al. [4] have developed the GSM (Global System of Mobile communication)-based remote wireless automatic monitoring system for field information to record both environmental variations and pest population dynamics. This monitoring system has also provided the monitoring data for users as the web-based application. On the other, authors have developed the simple field monitoring system (FMS) for agricultural production and management using the fieldserver technologies [5]. However, the agent program to
collect the measurement data has to be introduced for each the monitoring site because the self-data transfer function has not been installed in the
above monitoring system. In this study, the other conceptual FMS with
e-mail sender function was developed to improve availability for the long term monitoring in the field. The validity of the system was verified by the field monitoring test at the eight monitoring sites in Fukuoka, Nagasaki and Oita prefecture, Japan. Further the web-based data offering system was introduced using the open software to provide the field monitoring data timely to farmers. Validity of this data offering system was also verified.
FIELD MONITORING SYSTEM
Fig. 1 shows the previous FMS (G2: Generation 2). The FMS consists of the data logger unit, agent program box, weather and environment measurement sensors, solar radiation shield, wireless LAN relay unit, and Network CCD camera. The data logger unit in which the on-board web server was incorporated can measure the
surrounding weather information by using the sensors attached. The agent program box is also introduced to collect the measurement data. The measurement data are then transferred to the database system via the Internet. However if the agent program stopped due to any hardware or software troubles the previous system could not measure the field data. To overcome this defect we developed the new field monitoring system.
Figure 2 shows the developed FMS in which the data logger device with incorporation of mail sender module (TriState ltd.). The FMS does not require the web-based logger unit and agent program box in the previous system. The measurement data are sent once to the mail servers at the regular time intervals and then uploaded to the database system. Adopting the e-mail sender system, all the measurement data are protected securely in the commercial mail server even if our database system was suspended by some errors.

Proceedings of the International Conference on Environmental Aspects of Bangladesh (ICEAB 2011)
206
Fig. 1. Schematic diagram of the pervious FMS (G2).
Fig. 2. Schematic diagram of the developed FMS (G3)
FIELD MONITORING DATA OFFERING SYSTEM
Fig. 3 shows the configuration of field monitoring data offering system (FMDOS). This system is developed using the following open source ware as MySql (database system), PHP (programming language), and Xoops CMS (Contents Management System). Xoops CMS architecture is shown in Figure. 4. Xoops CMS consists of the core system, contents manager, and modules. Various extension modules such as user management, news, forum,
schedule, link etc. have also been developed by many programmers in the world. Their extension modules can be downloaded from the Internet and used freely. The Field Monitoring Data Offering module (FMDOM) was developed as one of the extension module to provide the field monitoring data. The FMDOM module consists of the following sub-functions as
1) Configuration of the field monitoring device, 2) Monitoring data viewer and manager, 3) Live-photo viewer and manager, 4) Multi-data viewer and manager, etc.
Fig. 5 shows a demonstration of the FMS configuration and the view data configuration. Information of the FMS (name, location, sensor lists and calibration data, LAN camera information, etc.)
and the list of release data are set up by the owner using the common web browser.
Fig. 6 shows the web offering demonstration of the measurement data. Some functions such as the live measurement data viewer, the daily statistical data viewer (sum, average, max, min, etc.), field photo manager and viewer, etc. are able to utilize directly on the web.
Fig. 3. Configuration of field monitoring data
offering system (FMDOS)
Fig. 4. Xoops CMS architecture.
Fig. 5. FMS and view data configurations.
FIELD MONITORING TEST
To verify the durability and validity of the developed systems, the field monitoring tests were carried out at the eight monitoring sited in Fukuoka, Nagasaki and Oita prefecture, Japan. The monitoring tests have started from June, 2009 in Fukuoka sites and then spread the other test sites in Nagasaki and Oita.

Proceedings of the International Conference on Environmental Aspects of Bangladesh (ICEAB 2011)
207
Fig. 6. Web offering demonstration of the measured data.
Fig. 7. Air temperature, humidity and solar radiation
in the inside and outside green house
Fig. 7 shows the monitoring data for the air
temperature, humidity and solar radiation in the inside and outside green house. The difference between weather information inside and outside green house can be referred immediately on the web. Horizontal lines in the graph indicate the datum lines which were set up by the farmer. In this example, the air temperature inside green house is managed properly in between 15 and 30 Celsius by using the heating and ventilation systems. The other weather information can be referred to manage the supply timing and amount of water, fertilizer, CO2, etc. During the field monitoring test the FMS could run except irregular stops such as
the network and/or energy supply troubles. To overcome this defect the data and energy backup systems and natural energy supplement system as solar or wind power generation system have to be installed.
CONCLUSION
In this study, the new FMS and the web-based FMDOS were developed in order to overcome the problem of previous system and to provide the simple data offering system to famaers. The following issues were obtained through this study.
1. The developed field monitoring system with the
e-mail sender device has the big advantages for availability and management comparing with the previous system.
2. The field monitoring database offering system
was developed by using well-known and widely-used open source ware with the field monitoring data offering (FDO) module.
3. The FDO module consisting of the FMS
configuration, the view data configuration, and the monitoring data viewer and manager was provided in order to effectively utilize the field monitoring information to the agricultural production and management.
4. The durability and validity of the developed system is substantiated by the long term monitoring test in the field.
ACKNOWLEDGMENT
This study was supported by joint research
project of Kyushu University, Acto-ichigo Farm ltd. And Oita prefecture and the research grant of Itoshima City 2010. Especially we would like to express our thanks for the valuable supports from Mr. Hirano in Kyushu University, Mr. Ono in Act-ichigo Farm, Mr. Abe, Mr. Shimizu in Oita Prefecture and Mr. Kamo in Camo Green Farm.
REFERENCES
[1] H Hirafuji, 2000, Creating comfortable, amazing,
exciting and diverse lives with CYFARS (CYber
FARmerS) and agricultural virtual corporation, Proc.
of the Second Asian Conf. Info. Technol. Agric., pp.
424-431.
[2] T Fukatsu and M Hirafuji, 2004. The agent system for
field monitoring servers to construct smart sensor-
network, In: Proc. Fifth Int. WS Artificial Intel. Agric.,
pp.1-5.
[3] T Fukatsu and M Hirafuji, 2005. Field monitoring
using sensor-nodes with a web server. J. Robotics Mech., 17(2) : 164-172.
[4] JA Jianga, CL Tsengb, FM Lua, EC Yangc, ZS Wua, CP
Chena, SH Lina, KC Linb and CS Liaob. 2008. A
GSM-based remote wireless automatic monitoring
system for field information: A case study for ecological
monitoring of the oriental fruit fly, Bactrocera dorsalis
(Hendel). Comp. Elect. Agric., 62 : 243-259. [5] R Hadano, T Okayasu, M Hirata, N Yamabe, K Nakaji,
M Mitsuoka and E Inoue. 2008. Fundamental Study
on Development of Field Monitoring System for
Supporting Agricultural Production and Management,
Sci. Bull. Fac. Agric., Kyushu Univ., 63(1): 57-63 (in
Japanese).

Proceedings of the International Conference on Environmental Aspects of Bangladesh (ICEAB 2011)
208
A4.014
Feasibility Study of Low Voltage DC Distribution System for House
Mohammad Amin and Yasir Arafat
Electric Power Engineering, Chalmers University of Technology, Sweden
Abstract
In this paper a low voltage direct current (DC) distribution system for a house or an apartment have been investigated
to make an energy efficient house and it has been done by evaluating the advantages and disadvantages of different low
voltage DC distribution systems with respect to the existing alternating current (AC) system of homes. The goal is to
make an energy efficient system suitable with local electricity generation and storage systems at the end-user level,
from DC sources. The performance of the 230V AC system and proposed low voltage DC system is analyzed by
considering factors such as losses in the wire, internal loss of the device itself, investment cost for new wiring, efficiency
of the converter and energy consumption cost. From the investigation, it can be concluded that the 48 V DC systems
with optimized cable area is most economical system compared with the 230 V AC systems and with a 20 years life time,
it will save almost 13,000 SEK.
INTRODUCTION
During the beginning of the nineteenth century
the debate between alternating current (AC) and
direct current (DC) had started [1]. Tesla showed
the practical advantages of alternating current.
Transformers made it possible to step up an AC
voltage easily; this allowed power to be transmitted
over long distances with a low loss. This was not
easy to achieve with Edison‘s DC voltage and there
were huge transmission losses. Tesla's practical
results were the deciding factor, at least for the time
being that an AC system was to prefer [1]. This
debate again came into light due to recent
development in power electronics [2] which gives a
better utilization of existing transmission corridors
with high voltage DC connections. High voltage DC
transmission allows more power to be transmitted
over a long distance with less loss compared to an
AC transmission. Power electronics makes efficient
and accurate control of electrical power possible.
Efficient AC to DC, DC to AC and DC to DC
conversion technology are now available on the
market, where DC to DC conversion is more
efficient than AC to DC conversion [3].
The number of devices that operate on DC
continues to increase in both homes and offices.
Most of the devices are using DC internally and this
requires AC to DC conversion between the AC
supply and the DC side of the device. Examples of
these devices are PCs, radios, televisions,
telephones and other electronic appliances. Energy
storage devices such as batteries, mobile phones,
and cordless tools, also require direct current as an
energy source. They are equipped with adapters
which convert 230V AC into low voltage DC [4]. All
of these AC to DC conversions have losses [5].
In case of small-scale electricity generation,
such as almost all new sustainable energy sources,
for example from solar cells, fuel cells, osmosis
batteries, and others, DC is usually the output.
Energy is required to convert the source‘s DC into
AC in order to connect to the existing 230V AC
distribution network. Which further needs to be
converted back to low voltage DC inside the DC
power consuming apparatus. This results in a low
overall efficiency of the AC system.
LOW VOLTAGE DC AS A SOLUTION FOR HOUSE
By using a low voltage DC distribution network in the residence, AC to DC conversions losses can be omitted and the use of comparatively less efficient adapters can be discarded and also there will be no power factor issues [7]. Only highly efficient DC to DC converter will be needed to run some of the DC appliances. A DC distribution network in the residence will facilitate to reduce the electro-magnetic interference and also the line losses due to the absence of reactive power [6][8], less current will be needed to transfer the same amount of power. For safe use of DC voltage without specific insulating precautions, the voltage must not exceed 50 V [4]. The majority of the devices used in households or offices only require low power that are possible to be connected directly to the low voltage DC distribution system after removing the AC to DC conversion stage. Most of the commercially available appliances are designed with an input voltage of 12V and 24V and some of the appliances are available at input voltages of 48V [7]. As the low voltage DC appliances have demand of higher currents, it makes feeder losses considerable. As a result the overall efficiency of the appliance becomes low. Feeder losses can be decreased by using higher DC voltages and the chosen appliance voltage for a DC residence is 48V [7]. Application of low DC voltage can therefore be more advantageous.
COMPARISON BETWEEN DIFFERENT DISTRIBUTION
SYSTEMS OF HOUSE
In this work, low DC voltage wiring systems of a house is investigated and compared with the wiring of the traditional 230V AC system for long run to observe the economic impact in terms of losses in the cable and cost of installation. This DC voltage can come from different sources such as a large central rectifier that converts 230VAC to 48V DC or/and renewable energy sources such as solar cells and batteries. In this study, renewable energy sources have been taken into account and the kitchen appliances as well as electronics appliances are investigated. The investigated devices are refrigerator, stove, microwave oven, rice cooker, coffee maker, dish washer, washing machine, light

Proceedings of the International Conference on Environmental Aspects of Bangladesh (ICEAB 2011)
209
bulb, vacuum cleaner, iron, window unit AC, laptop, personal computer, external modem and 32‖ LCD television. The power ratings of the investigated loads are in the range of 7 W to 2000 W [11-16]. The on-duration of household appliances is obtained from a survey at some houses of Bangladesh and Sweden. This Master thesis work has been done in Sweden and hence the amounts are presented in Swedish Krona (SEK). The standby losses of the appliances vary for different appliances from different producer [17][18]. For the calculation of stand by losses, the data of standby power is taken from [19]-[24].
A. Energy consumption and loss calculation for 230V AC distribution system in house
In this work the values of inductance and resistance for different cross section areas of the wire presented in Table 1 are used to calculate the losses in the wires of different cross section area.
Table 1. Inductance and resistance for core size
Core size
[mm2]
Inductance, L [µH/m]
Resistance, R [Ω/m]
1.0 0.6224 0.0170
1.5 0.5767 0.0113
2.5 0.5170 0.0068
4.0 0.4595 0.0043
6.0 0.4070 0.0028
10 0.3354 0.0017
13.3 0.2916 0.0013
The energy consumption of a house in a year can be obtained by summing up the energy consumption of all appliances (1-3). The amount of energy consumed in year by an appliance is given by Energy consumption = ON energy consumption + Standby energy consumption (1)
Where, ON energy consumption
=
kWh/yr (2)
Standby energy consumption
=
kWh/yr
(3) The energy losses in the AC system are calculated as the sum of the feeder cable losses and rectifier losses (if the appliances have a rectifier).
Energy losses
( )
(4)
From the calculation of losses for the appliances, it is observed that the resistive losses are 35.48 kWh per year, standby losses are 194.65 kWh per
year and losses for AC to DC rectification in electronic appliances is 55.41 kWh per year. The standby losses are 68 % of the total losses and it is 56% higher than resistive losses and 48 % higher than rectifying losses.
B. Energy consumption and loss calculation for low voltage DC distribution system in house
By increasing the cross section of the cable, the losses in the cable can be reduced. For example a load of 500 W the power losses reduces 40% if a 2.5 mm2 cable is used instead of a 1.5 mm2 cable. Increasing the cross section of the cable, of course it increases the copper cost. The cable area is optimized to minimize the total cost of the cable. The total cost is calculated as
Total cost = Cable Cost + (Feeder energy loss/yr x life time x Energy cost) (5)
Where, the life time is assumed to be 20 years and the energy cost 1 SEK/kWh
Average price of some wire and relative increment of cost compared to 1.5mm2 wire is presented in the Table 2 [25].
Table 2. Price variations with cross section of the cable.
Cable cross
section
Price per 100
m wire (SEK)
Increases price comparing
1.5 mm2 wire
1.5 mm2 560 -
2.5 mm2 860 53.6%
4 mm2 1250 123.2%
6 mm2 1800 221.4%
10 mm2 2225 297.3%
Fig. 1 presents the losses for the different distribution systems of different voltage level at home. The power loss of the 24V DC system is higher than for the other systems. In the case with the 48V DC system with the optimized wire area, the losses could be reduced by almost 44 % compared with 48 V DC systems.
Fig. 1. Losses for different AC and DC Systems.

Proceedings of the International Conference on Environmental Aspects of Bangladesh (ICEAB 2011)
210
Fig. 2 presents total energy consumption for different distribution systems with different voltage level at home. The 230 V AC systems is the highest energy consuming system and the 48 V DC with optimized cable area is the lowest energy consuming system.
Fig. 2. Energy consumptions for different systems
C. Cost Analysis
Table 3 presents the total cable length of the investigated loads for the different systems. For all systems the total cable length for all appliances is 440 m [9-10].
Table 3. Investment cost for different systems.
Cable
Cross
section
Length
of cable
required
in 230
AC
system
Length
of cable
required
in 24 DC
Length
of cable
required
in 48 DC
Length
of cable
required
in 48 DC
optimized
cable
area
1.5mm2 420 m 280 m 340 m 280 m
2.5mm2 20 m - 60 m 60 m
4 mm2 - 60 m 20 m 40 m
6 mm2 - 20 m - 40 m
10 mm2 - 60 m 20 m 20 m
13.3mm2 - 20 m - -
Total Cost
of wire
2525
SEK
4755
SEK
3115
SEK
3750
SEK
The Fig. 3 presents the copper cost of the different systems. In the case of the 48 V DC system with optimized cable area, the cross section of the cable increases the cost of copper 20 % comparing with 48V DC and 48 % increases comparing with 230V DC.
Total Cost = Cable Cost +(Energy consumption per year + Energy loss per year)*Life time* Energy cost (6)
In Fig. 4 the total cost of the system are shown. Here the life time is 20 years and unit price of energy is 1 SEK. From this figure it can be concluded that 48 V DC system with optimized cable area is most economical system compared with the 230 V AC system and within this life time it saves almost 13000 SEK.
Fig. 3. Copper cost in Different AC and DC systems.
The total cost of the system, losses and cable cost
can be calculated as
Fig. 4. Total cost for different system.
CONCLUSION
This report investigates the alternative for household appliances of using a 48 V DC supply, instead of the normal 230 V AC voltage. The losses for AC to DC and DC to AC conversion inside the home appliances can be reduced by using a DC distribution system in the house. For the wiring of the 48 V DC distribution system with optimized cable area, the cable cost will increase by 48% compared to the cable cost for 230 V AC distribution system. But the savings for the 48 V DC system will be higher in the long run due to reduced energy consumption per year. This work considered a 20 years life span for the calculation of the total cost for the different distribution systems. The savings in the total cost for the 48 V DC distribution system with optimized cable area compared to the 230 V AC distribution system, will be almost 13000 SEK within the 20 years life time.
ACKNOWLEDGEMENT
We greatly acknowledge the support of our supervisor, Dr. Stephan Mangold, Project Leader, Commercial Research and Development, Stiftelsen Chalmers Industriteknik during this master thesis project with precious guidance and many good advices. We would like to thank our examiner Dr.

Proceedings of the International Conference on Environmental Aspects of Bangladesh (ICEAB 2011)
211
Stefan Lundberg, Assistant Professor, Chalmers University of Technology for his essential help and his invaluable advice during this thesis work. Finally, we want to thank our parents and friends for their constant inspiration during these years of study.
REFERENCES
[1] Online info [online] accessed on July 2010,
Available:http://eetd.lbl.gov/ea/nordman/docs/lvd
c7.pdf
[2] Online info [online] accessed on July 2010,
Available:http://www.powerpulse.net/techPaper.ph
p?paperID=130
[3] Paajanen, Pertti; Kaipia, Tero; Partanen, Jarmo; ,
"DC supply of low-voltage electricity appliances in
residential buildings," Electricity Distribution - Part 1, 2009. CIRED 2009. 20th International Conference and Exhibition on , vol., no., pp.1-4, 8-11 June 2009
[4] Peter Vaessen. 2005. Direct-Current Voltage (DC) in
Households.
[5] http://www.leonardo-energy.org/webfm_send/366
[6] D Nilsson, A Sannino. 2004. Efficiency analysis of
low- and medium voltage. DC distribution systems.
In: IEEE Power Engineering Society General Meeting, 2004.
[7] D Nilsson. DC Distribution Systems. Licenciate of
Engineering Thesis[Online].
[8] Giovanna Postiglione. DC Distribution System for
Home and Office. Master Thesis at Dept. of Electric
Power Engineering, Chalmers University of
Technology.
[9] Online info [online] accessed on Nov 2010,
Available:http://www.diydata.com/materials/electr
ic_cable/electric_cable.php#note2
[10] Online info [online] accessed on Nov 2010,
Available:http://michaelbluejay.com/electricity/ho
wmuch.html
[11] Online info [online] accessed on Oct 2010,
Available:http://www.energysavers.gov/your_home
/appliances/index.cfm/mytopic=10040
[12] Online info [online] accessed on Oct 2010,
Available:http://www.daftlogic.com/information-ap
pliance-power-consumption.htm
[13] U.S. household electricity report, release date: July
14,2005online:http://www.eia.doe.gov/emeu/reps/
enduse/er01_us. html , Accessed on Nov 2010
[14] Jean Paul Zimmermann, ― End-use metering
campaign in 400 households in Sweden-Assessment
of the Potential Electricity Savings‖ September 2009
[15] Online info [online] accessed on Nov 2010, Available:
http://eetd.lbl.gov/ea/reports/45967.pdf
[16] Online info [online] accessed on Oct 2010,
Availble:http://www.jestr.org/volume2/fulltext140
9.pdf
[17] Nordic Power I Strömstad AB, Member of ELFA group,
accessed on Nov 2010, Available:
http://www.nordicpower.com/pdf/we060-100-150.
[18] Giovanna Postiglione ,― DC Distribution System for
Home and Office‖, Master Thesis at Dept. of Electric
Power Engineering, Chalmers University of
Technology.
[19] Online info [online] accessed on Oct 2010,
Available:http://www.diydata.com/materials/electr
ic_cable/electric_cable.php#note2
[20] Jean Paul Zimmermann, ― End-use metering
campaign in 400 households in Sweden-Assessment
of the Potential Electricity Savings‖ September 2009
[21] AJ Bredekamp, E-A Uken and L Borrill,‖ Standby
Power Consumption of Domestic Appliances in
South Africa‖ Domestic Use of Energy Conference
2006, Cape Town
[22] Clement, K.; Pardon, I.; Driesen, J.; , "Standby Power
Consumption in Belgium," Electrical Power Quality and Utilisation, 2007. EPQU 2007. 9th International Conference on , vol., no., pp.1-4, 9-11 Oct. 2007
[23] P Ajay-D-Vimal Raj, M Sudhakaran and P Philomen
-D-Anand Raj. 2009. Estimation of Standby Power
Consumption for Typical Appliances. Journal of Engineering Science and Technology, 2 (1): 71-75
[24] Alan Meier, Wolfgang Huber. Results from the
investigations on leaking electricity in the USA.
http://escholarship.org/uc/item/3t79j078
[25] Brahmanand Mohanty. Standby Power Losses in
Household Electrical Appliances and Office
Equipment. In: Regional Symposium on Energy
Efficiency Standards and Labelling, 29-31 May,
2001. Available at: http://www.datasheetcatalog.
com/datasheets _pdf/1/N/4/0/1N4007.html
[26] Online info [online] accessed on Oct 2010, Available:
https://www.elfa.se/elfa3~se_en/elfa/init.do?toc=2
0141

Proceedings of the International Conference on Environmental Aspects of Bangladesh (ICEAB 2011)
212
A4.015
Environment-friendly Rice-Duck Farming System in Bangladesh –
Progress and Prospect
ST Hossain1, H Konagaya2, T Furuno2 and H Sugimoto3
1Friends in Village Development Bangladesh, Dhaka, Bangladesh. e-mail: [email protected]
2Japan Rice-Duck Farming Society, Japan 3Faculty of Agriculture, Ehime University, Ehime, Japan
Abstract Rice is the staple food in Bangladesh. The conventional system of rice production requires the use of agro-chemicals like
fertilizers and pesticides, often in heavy doses. These chemicals are harmful to the environment, water bodies, animals,
and human beings. Integrated Rice-Duck Farming (IRDF) is a low-cost, organic method (no herbicides, insecticides or
chemical fertilizers are needed) suitable for small-scale farmers. As a source of protein, duck meat helps improve the
diet of rural people. In consideration of all its benefits and suitability, this farming concept has been extended to some
parts of Bangladesh through community-based approaches. The entire localities are enjoying economic empowerment
and the country as a whole is getting benefit with respect to food security and a safer environment.
INTRODUCTION
A. Integrated rice-duck farming (IRDF) System
The Integrated Rice-Duck Farming System is a technology of rice farming that relies on ducks to eat insects and weeds, fertilize and stimulate the rice plants. IRDF was practicing in more than 3000-4000 years back, but in 1988 by Dr. Takao Furuno, Fukuoka Prefecture, Japan was scientifically and systematically developed the method considering the ―enclosure‖. It is popularly known in Japanese as ―aigamo method". From its beginning in Japan, it has made its way to rice- growing countries like South Korea, China, Vietnam, the Philippines, Thailand, Bangladesh and so on.
In this method for growing rice involves releasing ducklings into a paddy field about one or two weeks after the seedlings have been planted. Between 100 and 350 ducklings, according to field fertility, weed and insect population, (Between 300 and 350 ducklings in Bangladesh) are released in one hectare of growing paddy field. The ducks should be stopped to release at and after the flowering of plants. In order to protect them from dogs, cats and other predators, paddies are enclosed by a net. In the IRDF, ducklings help the rice seedlings grow by eating both insects and weeds that get in the way. The ducklings' droppings become an important source of natural fertilizer. In addition, they stir up the soil with their feet and bills, a process that increases the oxygen content of the soil, making it more nutritious for the seedlings. When the time comes for harvest the rice, the ducks have grown up and can be sold in the market for meat. By allowing farmers to grow crops organically and also raising ducks for sale as meat, the IRDF really has been doing ―kill two birds with one stone.‖ This system is
not only beneficial from cost standpoint in that farmers will no longer have to purchase expensive chemical fertilizers or pesticides, but also protects farmers from pesticide toxicity. Farmers also earn extra money by selling duck meat or eggs.
B. Adoption and extrapolation of IRDF in Bangladesh
Integrated rice-duck farming technology was learned from Japan in 1998 and was first introduced in Bangladesh in 2000 under the project
PETRRA (Poverty Elimination Through Rice Research Assistance), IRRI implemented by Bangladesh Rice Research Institute (BRRI), Friends In Village Development Bangladesh (FIVDB) and Barisal Development Society (BDS). Initially the technology was introduced in Sylhet, Sunamganj, Maulvibazar and Barisal district. In 2003 it was expanded in some parts of Comilla and Khulna districts. In 2009 the technology was extrapolated to Netrokona and Kishoreganj districts on community basis. Likewise, in 2009 it was demonstrated to the farmers in the form of community farming in Kushtia and Pabna districts with the support of The Toyota Foundation, Japan (Fig. 1). Beside these demonstrations, the technology is being gradually adopted by the farmers of different districts in Bangladesh
Fig. 1. Extrapolation of IRDF in Bangladesh

Proceedings of the International Conference on Environmental Aspects of Bangladesh (ICEAB 2011)
213
C. Benefits of IRDF in perspective of Bangladesh
The farmers are getting economic benefit for its low production cost, input cost and extra income from duck meat and egg. The benefits of rice-duck farming in perspective of Bangladesh are reduce cost of inputs (chemical fertilizer and agro-chemicals), insect and weed control, reduce cost of labor, increase yield of paddy, improve soil health, conservation natural environment, promote duck farming, add nutrition (protein) for households, facilitate women involvement, generate more income, improve rural livelihood etc. IRDF is steady spreading the Bangladeshi rice farmers can feed the nation with its staple diet and help save the planet from the effects of global warming. This system is a proven organic-farming technology to improve rice-production performance and ensure rice self-sufficiency in the country. The system also eliminates the use of synthetic and chemical-based inputs, thereby eliminating farmers‘ risk to pesticide poisoning and possible contamination of groundwater.
In the paddy fields the ducks serve as pest control, weeders, stimulant and fertilizer. Worms, bugs, stem borers, green leaf hoppers and golden snails are among the farmers‘ ―enemies‖ that ducks like to eat. The system really does provide abundant pure organic and highly nutritious rice harvest at very minimal production cost as it saves all manual labor.
D. Recent issues in Bangladesh agriculture and IRDF
1. Food security: Food security is a one of the major concern in present Bangladesh context. By practicing IRDF, rice production has increased and duck and rice can be obtained from same piece of land which could meet the carbohydrate and protein demand and also improve household
nutritional requirement. 2. Climate change: Global climate change is a big
issue and Bangladesh is most vulnerable to this change. Methane, which is produced when bacteria decomposes organic matter, is the second most important greenhouse gas after carbon dioxide. Its chief sources are landfill sites, fossil fuel energy and agriculture, particularly rice and livestock farming. IRDF in organic farming can help mitigate global warming. Ducks in the rice fields effectively reduced the emission of the greenhouse gas methane. The global warming potential with the use of the organic fertilizer was about 22% lower than with the use of the chemical fertilizer [1] and the rice–duck cultivation system is an effective strategy for reducing integrated Global warming Potentials (GWPs) of the rice–duck cultivation systems based on CH4 and N2O in southern China and expected to contribute to alleviating global warming [2]. It is proven that ecological agriculture can reduce greenhouse gas emissions and can increase carbon sequestration. The promoting ecological agriculture to improve the environment and ensure the agricultural stability is an effective method to combat the impact of climate change. Global challenges of climate change, environmental degradation,
scarcity of inputs, and increasing demand for safe food present a sharp call to agricultural practice to become more sustainable.
3. Soil health and excess use of chemicals: Use of chemical compounds such as inorganic fertilizer, herbicides and pesticides are increasing gradually which has become threat to environment, soil, animal and human being. IRDF reduces the use of chemical because duck droppings act as fertilizer; duck effectively control the weeds and insects [3]. The presence of ducks could decrease N fertilizer loss rates, and thus promote N fertilizer use efficiency as compared to conventional rice field technology [4].
4. Livelihood improvement: Sustainable agricultural practices and farmers‘ livelihood improvement are major issues for the development of Bangladesh. By practicing rice-duck technology the farmers can improve their economic conditions and farm women get opportunity to involve in the production system [5].
E. Recent experiences on IRDF in Bangladesh
During last year in Kushtia and Pabna districts a number of short-term goals were achieved. More than 150 farmers have directly learned the technology from demonstration fields, and farmers were also given training that enhanced their knowledge on organic farming. The farmers opined that they could reduce the cost of weeding, insect control, chemical fertilizer, and labor by practicing this technology. They earned more money by selling additional rice and duck meat and eggs.
In IRDF, 20%-30% of rice grain yield was increased over traditional rice production. The technology has created an opportunity for household women to participate in the production system, particularly in duck rearing and management. Their supporting role has strengthened their status in the family and society as well. In practice, the duck eggs were provided to children and women first and then sold to the market. Usually rural households face hardship when purchasing eggs from the market to fulfill their household demand. The benefits of rice-duck farming over conventional rice production are clearly understood in terms of economic empowerment of rural households and an improvement of natural environment. It was observed that in variation of seasons in IRDF the net profit was achieved 35000-50000 Taka (1 US$ = 72 Taka) per hectare over conventional sole rice. It is assumed that IRDF system will help farmers elevate their economic status and transform them into protectors of the environment.
FUTURE PLANS AND PROSPECTS
1. The farmers of Bangladesh do not get premium prices for organic rice due to the consumers' lack of awareness and trust in organic products. The technology will have much impact and lead to sustainability if this model can be developed to ensure fair prices for organic rice, duck meat, and eggs. In the next phase, we are planning to develop this model based on the experience of

Proceedings of the International Conference on Environmental Aspects of Bangladesh (ICEAB 2011)
214
the Japanese Teikei system (producer-consumer direct distribution system).
2. It is also planning to involve the local government authorities in this production system taking experience from the Philippines.
3. In future, emphasis will be given to traditional fine and aromatic rice in rice-duck farming to preserve the local varieties and increase its market.
4. The integration of fish, nitrogen-fixing aquatic fern azolla and ducks with rice farming can result in nutrient enhancement, pest control, feed supplementation and biological control [6]. In next stage we have planned to work on this integrated approach.
5. Organic farming is potentially a profitable enterprise, with a growing global market, already being adopted by 90 developing countries, but not including Bangladesh [7]. An organic certification authority needs to be established on the basis of international standards. The rapid expansion of organic farming such as IRDF in Bangladesh could significantly reduce poverty of the poor farmers and protect the environment.
ACKNOWLEDGMENT The authors are grateful to Asian Neighbors
Program, The Toyata Foundation, Japan for supporting the studies.
REFERENCES
[1] JE Zhang, Y Ouyang and ZX Huang. 2008.
Characterization of nitrous oxide emission from a
rice-duck farming system in south China. Archives of Environmental Contamination and Toxicology, 54:
167-172.
[2] L Chengfang, C Cougui, W Jingping, Z Ming, Y
Weiling and S Ahmad. 2009. Nitrous oxide
emissions from wetland rice-duck cultivation systems
in southern China. Archives of Environmental Contamination and Toxicology, 56: 21-29.
[3] ST Hossain, H Sugimoto, GJU Ahmed and MR Islam.
2005. Effect of integrated rice-duck farming on rice
yield, farm productivity, and rice-provisioning ability
of farmers. Asian Journal of Agriculture and Development, 2: 79-86.
[4] L Chengfang, C Cougui, W Jingping, Z Ming, Y
Weiling and S Ahmad. 2008. Nitrogen losses from
integrated rice–duck and rice–fish ecosystems in
southern China. Plant and Soil, 307: 207-217.
[5] ST Hossain. Improvement of rural livelihood through
integrated rice-duck farming system in Bangladesh.
In: Proc. 6th Int. Rice-Ducks Conf., Cebu, Philippines, 2009, pp. 1-10.
[6] AG Cagauan, RD Branckaert and C VanHove. 2000.
Integrating fish and azolla into rice-duck farming in
Asia. Naga, 23: 4-10.
[7] MA Sarker and Y Itohara. 2008. Organic farming and
poverty elimination: a suggested model for
Bangladesh. Journal of Organic Systems, 3: 68-79.

Proceedings of the International Conference on Environmental Aspects of Bangladesh (ICEAB 2011)
215
A4.016
Determinants of Disaster Loss Recovery Plan (DLRP) for Small Scale
Business (SSB) in the Coastal Island of Bangladesh
AKM Ruhul Amin Sarker1*, Shantanu Deb Barman2 and Subrata Sarker3
1American Soybean Association-International Marketing, Bangladesh Aquaculture Program 2Department of Economics, University of Chittagong, Chittagong-4331, Bangladesh
3Institute of Marine Sciences and Fisheries, University of Chittagong, Chittagong-4331, Bangladesh *Corresponding Author: e-mail: [email protected]
Abstract
Hatiya Island is located in the south eastern coastal zone of Bangladesh and exposed with multiple natural disasters.
To identify the determinants of Disaster Loss Recovery Plan (DLRP) for the small scale business, a questionnaire survey
were conducted. Data were explored by utilizing 53 random samples from the study area and analyzed by using
computer based software SPSS (Statistical Package for Social Science). Findings show that age of business, disaster
experience, single or branch and grocery/hotel/medicine/mobile call center/rickshaw repairing were all related to
DLRP in the study area. Own or lease and wholesale or retail were not significantly related with DLRP.
INTRODUCTION
Natural disasters are ongoing part of life for the coastal community. Disaster frequency has doubled every ten years since 1960 with 96% of all deaths from natural disasters occurring in the global South [1]. Coastal disasters are increasing in frequency and magnitude-measured in terms of human lives lost, destroyed infrastructure, ecological damage and disrupted social networks. The damages from natural disasters have been increasing exponentially over the last several decades [2]. Coastal disaster (e.g. tropical cyclones, storm surges, coastal erosion and flood) has created significant impact on coastal rural people. These extreme events make the life of coastal community more complicated, keep in risk, destroy property and limit the livelihood options. Disasters serve as hinders of linear progress economical activities in the coastal area. Small Scale Business (SSB) in coastal area is facing the problem of economic loss due to lack of disaster loss recovery plan (DLRP). Developing countries average more than 1000 deaths per disaster but less than US$100 million loss, compared with high developed countries that average less than ten deaths but over US$600 million in losses per disaster [3]. Economic losses by natural disaster are very difficult to overcome by developing countries [4]. Sudden-onset disasters affect small scale business (SSB) in coastal area by damaging capital, infrastructure, means of production and stocks. Bangladesh is a coastal country bounded by Bay of Bengal on its
southern part. Unfortunately these areas are highly vulnerable to both natural and man-made hazards and disasters like coastal flooding, cyclones, storm surges, erosion, salinity, arsenic contamination, and pollution, etc. [5]. Most of the people in the coastal area of Bangladesh are poor and their businesses are in small scale. Every year natural disaster causes huge losses in business sector. So, disaster loss recovery plan (DLRP) is necessary for this area as it helps a business to overcome the disruption to normal operations and reduces potential financial losses [6]. The post-disaster period can offer opportunities to compensate for all losses [7]. Disaster Loss Recovery refers to the development and application of policies, strategies, and practices that minimize vulnerabilities. It
includes measures taken to protect livelihoods and assets of communities and individuals from the adverse impact of hazards. Efforts taken to reduce loss of disasters include: information and strengthening early warning systems; giving loan to vulnerable people from government and micro credit organizations, relief, improvement of transport and storage facilities of stocks and, finally, identification of vulnerable sectors of society including groups and infrastructure and produce plans that address their special needs.
MATERIALS AND METHODS
A. Study Area
The study was conducted in Hatiya Upazilla (Sub district) (Fig: 1) situated in the Noakhali district, a coastal area of Bangladesh. Noakhali district is a famous pathway of cyclones and the ground level in Noakhali is lower than 10 m above the mean sea level [8]. Hatiya Upazilla covers an area of about 1,508 km2 sq kilometers having 346,853 people where 87% is Muslim and 12% is Hindu [9]. The geographical location is between latitude 20°30¢ and 22° N and longitude 91°45¢ and 92°15¢ E. Household incomes within TK 5,000 per month, which is below the poverty line [10].
Fig. 1. Map and location of the study area [9]
Study Area

Proceedings of the International Conference on Environmental Aspects of Bangladesh (ICEAB 2011)
216
B. Data Collection
Data were collected through questionnaire interviews, and participatory observation. Questionnaire interviews were conducted with coastal small scale business holders to collect quantitative data. A total of 53 small scale business holders were interviewed. FGD and participatory observation were conducted mainly to collect qualitative data. The real purposes of the qualitative research were not to count the opinions or people, rather to explore the range of opinions, the different representations of the issue, and the objective was to maximize the opportunity to understand the different position taken by members of the social setting [11]. Participatory observation offered a good opportunity to get a comprehensive and authentic insight in actual situations of the evaluation topic including ―actions, conversations, and physical descriptions‖ [12]. The focused group interviews were consisted of a guided in-depth interview of a relatively homogeneous small group of individuals purposefully selected by the researcher to address a specific topic [13].
C. Data Analysis
Data those were collected from questionnaire interviews had entered into a statistical software SPSS (Statistical Package for Social Science, version 11.5) for analyzing. This analysis allowed an assessment of the importance recovery plans needed for coastal small scale business (SSB) holder to uplift economic loss caused by natural coastal disasters.
D. Description of Variables
This paper presents a model of DLRP for coastal small scale business.
Table 1. Variable Definitions
Variables Coding Scheme
Independent Variables:
Grocery/Hotel/Medicine/
Mobile call center/
Rickshaw repairing
0=Grocery/Hotel/Medici
ne/Mobile call center/
Rickshaw repairing
1=Others
Tea stall/Travel shop/
Landry/ Saloon
1= Tea stall/Travel
shop/Landry/ Saloon
0=Others
Own or lease 1= Own
0= lease1
Age of Business Continuous
Wholesale/retail 1= Wholesale
0= retail
Single/Branch
Disaster Experience
Dependent Variable:
1=Single
0=Brance
1=Yes
0=NO
Index of 12 items in
Hatiya (Same weight for
10 items and relatively
high weight for the loan
from government and
store food and water)
Variables for model consisted of a number of some characteristics including business type, owned or leased, single or branched, age of business,
whether the business property is wholesale or retail and age of business was another firm characteristic that was related to business disaster evacuation planning [14]. Ownership patterns like individual or leased, to be significantly related to disaster loss recovery planning [15, 16, 17]. Further, [14, 17] found type of business to be significantly related to disaster evacuation planning. Previous disaster experience also influences disaster loss recovery plan. Businesses with previous disaster experience had engaged in more evacuation planning than businesses with little or no disaster experience [15, 16]. Definition of considered variables is shown in Table 1.
RESULTS AND DISCUSSIONS
Disasters occur when there is a hazard impacting on a vulnerable community or population [18]. According to the workshop report on ‗Climate Change and Disaster Losses: Understanding and Attributing Trends and Projections‘ direct economic losses due to disasters had increased [14]. Coastal hazards are the triggers for the most of the disasters. Coastal hazards influence human settlement in an area by affecting livelihood. Disasters have inflationary potential through their capacity to interrupt all components of a market economy: production, distribution, marketing and consumption [6]. As Hatiya is located at the south eastern coastal region of Bangladesh, it is frequently affected by different coastal hazards and causes loss of life and property. Natural disasters offer here a challenge to sustain human life. This study investigated different coastal hazards in Hatiya by interviewing SSB holder. After finding out coastal hazards, their existing and needed disaster loss recovery plan (DLRP) have been identified. Interviews were asked about the coastal hazards. According to their view main coastal hazards were cyclones, flood, erosion, tidal surge, tornado and drought and intensity of these hazards were increasing day by day. Their multiple responses are shown in Table 2.
Table 2. Coastal hazards at Hatiya (multiple responses)
(N=53).
Costal Hazards Percentage
Cyclone 88% (47)
Tidal surge 78% (41)
Flood 70% (37)
Erosion 50% (27)
Tornado 30% (16)
Drought 15% (8)
Hatiya is well experienced by the cyclones of 1970, 1985, and 1991. About 130,000 people died due to cyclones and the storm surges in 1970, 1985, and 1991 [19]. The northern part of this island was continuously affected by river bank erosion. Approximately 108 km2 of land north and east of the Island has been eroded from 1960 to 1984; where, 30 km2 of land has been accreted south of Hatiya [20]. Frequency and percentage of DLRP undertaken by businesses in the study area are represented at table 3.

Proceedings of the International Conference on Environmental Aspects of Bangladesh (ICEAB 2011)
217
Table 3. Disaster loss recovery plan taken by Small Scale
Business in Hatiya
Action Percentage
Utilize savings 51% (27)
Help from government
Organization 34% (18)
Utilize savings 51% (27)
Help from government
Organization 34% (18)
Help from NGOs 68% (36)
Microcredit 72% (38)
Disaster warning 60% (32)
Store food and water 98% (52)
Store medicine 26% (14)
Made arrangement for
alternative location 38% (20)
Need of insurance 15% (8)
Well warning 60% (32)
Need of relief 70% (37)
Loan from government 79% (42)
During the survey, SSB holders were asked questions about the existence of a disaster loss recovery strategy for their business. Some of them replied that early warning system helped them to take shelter at cyclone center and transfer their business stock. About 100 cyclone shelters were reported in Hatiya Island [19].When tidal surges occurred; they mostly took shelter on elevated places. During flood they left their land and tried best to save their assets. Erosion effected people transferred their business to upland. The survey included a question asking all businesses holder about the need of business insurance and all most respondents answered this question. Replies indicated that such a plan was very essential for them but they could not adopt it due to inconvenient payment terms and conditions. Clearly, disaster mitigation steps increased here
after the cyclone and flood.
Table 4. Descriptive Statistics of Model Variables
Variables Mean SD
Independent Variables
Grocery/Hotel/Medicine/Mobile
call center/Rickshaw repairing
0.3396 0.4781
Tea stall/Travel shop/Landry/
Saloon 1.0189 1.0094
Own or lease 0.5472 0 .5025
Age of Business 7.5283 3.3547
Wholesale/retail 0.0566 0.2333
Single/Branch 0.9245 0.2667
Disaster Experience 0.6604 0.4781
Dependent Variable
DLRP 0.579 0.1464
Means and standard deviations for all independent variables and dependent variables those included in model are shown in Table 4. The mean number of preparedness activities undertaken by businesses in Hatiya is 0.5792 (out of a possible 12).
Some DLRP were undertaken by the business holders at highest frequency, for example, store food and water (98%), and microcredit (79%). A comparatively sizeable percentage of businesses utilize savings (52%). A proportionately larger percentage (47%) of businesses holder depended on different NGOs. Very few businesses made arrangement for (12%) alternative location during disaster. About 22% stored medicine for their emergency condition.
To assess determinants of DLRP among the small scale businesses in the area, a regression analysis was employed. From Table 5, it is clear that the mentioned model was a significant predictor of DLRP in the study area (F=27.617, p<.001). Among the characteristics variable for DLRP, the age of the business and previous disaster experience was the strongest determinants for the study area (Beta= 0.031, p<0.001 and Beta=0.112, p<0.001). As the age of business increased, they took more preparedness activities. Previously disaster experienced business holder also took strong DLRP. Single or branch and were also significant predictor of preparedness in the study area. Branch of large business took more DLRP than single business. Grocery/hotel/medicine/mobile call center/rickshaw repairing in the study area, also engaged with DLRP (Beta=-0.116, p<0.001). This type of business holder took DLRP where tea stall/travel shop/ laundry/saloon take less (Beta= -0.044, p<0.01). Own or lease and wholesale/retail were negatively co-related but statistically not highly significant. The model explains about 78 percent of the variation in DLRP for the sample in the study area (Adjusted R2=0.782).
Table 5. Regression Coefficient for Models of SSB DPRP.
Variables Unstad.
Coeff.
Std.
Coeff. t-ratio
Signific
ant
Independent
Variables:
Grocery/Hotel/Me
dicine/Mobile call
center/ Rickshaw
repairing
-0.116* -0.378 -3.441 0.001
Tea stall/Travel
shop/Landry/
Saloon
-0.044** -0.304 -2.784 0.008
Own or lease -0.041*** -0.140 -1.594 0.118
Age of Business 0.031* 0.730 6.928 0.000
Wholesale/retail -0.061*** -0.098 -1.416 0.164
Single/Branch -0.144* -0.262 - 3.735 0.001
Disaster
Experience 0.112* 0.366 4.207 0.000
R2 0.811
Adjusted R2 0.782
F 27.617*
N 53
**p<.0 1 *p<0.001 *** Not highly significant
CONCLUSION
Present study provides good predictor of DLRP among SSB holders in Hatiya. Age of business, previous disaster experience, Single or branch and

Proceedings of the International Conference on Environmental Aspects of Bangladesh (ICEAB 2011)
218
grocery/ hotel/ medicine/ mobile call center/ rickshaw repairing type business were significant predictors of DLRP in the study area. Business sector should be related to preparedness activities to minimize their economic loss during disaster. Findings of the present study have importance in policy formulation. Awareness, education and direct role of government are necessary to raise the preparedness level among the business holders to minimize the loss of disasters.
REFERENCES
[1] International Federation of the Red Cross and Red
Crescent (IFRC/RC) 1999: World disasters report 1999. Switzerland: IFRC/RC.
[2] Millennium Ecosystem Assessment. 2005.
Ecosystems and Human Well-being: General
Synthesis. World Resources Institute, Washington,
DC.
[3] International Federation of the Red Cross and Red
Crescent (IFRC/RC) 2001: World disasters report 2000. Switzerland: IFRC/RC.
[4] M Day. 2000: Nicaragua needs a break. In
International Federation of the Red Cross and Red
Crescent (IFRC/RC), World disasters report 2000.
Switzerland: IFRC/RC.
[5] MoWR. 2005. Coastal zone policy. Ministry of Water
Resources, Government of People‘s Republic of
Bangladesh, p 1
[6] JM Dahlhamer and KJ Tierney. 1998. Rebuilding
from disruptive events: Business recovery following
the Northridge earthquake. Sociological Spectrum,
18: 121–141.
[7] HA Brown. 1994: Economics of disasters with special reference to the Jamaican experience. Working paper
2. Jamaica: Centre for Environment and
Development, University of the West Indies.
[8] MR Islam (ed.). 2004. Where land meets the sea: a
profile of the coastal zone of Bangladesh. University
Press Limited, Dhaka, 77 pp
[9] Banglapedia. 2006. [Online]. Hatiya Upazila.
Available at
http://banglapedia.org/HT/H_0089.HTM. (Last
accessed on July 12, 2010).
[10] GA Parvin, F Takahashi and R Shaw. 2009. Coastal
hazards and community coping methods in
Bangladesh J Coast Conserv, 12:181–193.
[11] G Gaskell. 2000. Individual and Group Interviewing.
In Qualitative Researching with Text Image and Sound: A Practical Handbook (Bauer, M.W & Gaskell,
G (eds) London: Sage, pp. 38–56.
[12] J Gittleson and S Mookherji. 1997. The Application
of Anthropological Methods to Study the
Intrahousehold Resource Allocation. In: L. Haddad,
J. Hoddinott and H. Alderman (eds),Intrahousehold resource allocation in development countries: Models, methods, and policy.Baltimore and London: The
John Hopkins University press, pp. 193-212
[13] MA Saint-German, IL Basford & G Montano. 1993.
Surveys and Focus Groups in Health Research with
Older Hispanic Women. Qualitative Health Research,
3 (3): 341-367.
[14] T Drabek. 1991. Anticipating Organizational
Evacuations: Disaster Planning by Managers of
Tourist-Oriented Private Firms. International Journal of Mass Emergencies and Disasters, 9(2): 219-245.
[15] T Drabek. 1994a. New Study Shows that Growing
Tourist Industry is Inadequately Prepared for
Emergencies. Hazard Technology, 14(1): 17, 21.
[16] T Drabek. 1994b. Disaster Evacuation and the
Tourist Industry. Program on Environment and
Behavior Monograph No. 57, Institute of Behavioral
Science, University of Colorado.
[17] T Drabek. 1995. Disaster Responses within the
Tourist Industry. I1 International Journal of Mass Emergencies and Disasters, 13(1): 7-23.
[18] G McBean and L Ajibade. 2009. Climate change,
related hazards and human settlements. Current
Opinion in Environmental Sustainability, 1:179–186.
[19] Upazila Administration. 2005. Upazila Unnayan
(development) Profile, Hatiya, Noakhali, Published by
Upazila Administration, Hatiya, Noakhali,
Bangladesh, pp 1–4, 21
[20] S Huq, Z Karim, M Asaduzzaman, F Mahtab (eds).
1999. Vulnerability and adaptation to climate
change for Bangladesh. Kluwer, Dordrecht.

Proceedings of the International Conference on Environmental Aspects of Bangladesh (ICEAB 2011)
219
A4.017
Community Based Environmental Education for
the Sundarbans Forest Conservation
Md. Mostafizur Rahman1 and Md. Al-Mamun Azad2
1Urban and Rural Planning Discipline, Khulna University, Khulna, Bangladesh 2Jagrata Juba Shangha (JJS), Khulna, Bangladesh
Abstract
The Sundarbans forest plays a significant role in the economy of southwestern region of Bangladesh. 3.5 million people
living near the Sundarbans are heavily dependent on the resources of the forest for their livelihood. Usually people
collect timber, fuel-wood, pulpwood, thatching materials, honey, bees-wax, fish crustacean etc. Now the Sundarbans
forest is threatened by a number of natural and manmade factors like top-dying disease, climatic disaster, increasing
salinity, river erosion, encroachment of land for shrimp culture, unplanned resource extraction etc. One of the most
important leading issues is lack of environmental knowledge and education among the people who are living adjacent to
the Sundarbans especially the resource users and extractors. Significantly, promotion of environmental education
would play a pivotal role to build a sense of ownership on natural resources. This paper describes present knowledge
status of community people and use, present awareness status about the laws related with the Sundarbans forest.
INTRODUCTION
The Sundarbans is endowed with a lot of natural resources. It is the world's largest mangrove forest located at southern extremity of the Ganges river delta bordering the Bay of Bengal. The mangrove forest extends 80 km inland from the coast. Its area is 577,100 ha including 407,100 ha of mangrove forest and 170,000 ha of river channels, canals and creeks [1]. The area is rich in biotic diversity and supports 330 species of plants, possibly as many as 400 species of fishes, at least 30 species of reptiles,
over 270 species of birds and 42 species of mammals [2].
In relation to natural resource management, it is such to reduce or limiting the use of natural resources and eventually minimizing disaster vulnerability and resource vulnerability. Natural resource management efforts tend to focus on reducing resource vulnerability and ensure sustainable development [3]. Currently, poor land use policy and increasing pressure on natural resource extraction are key drivers of rising resource depletion. Adaptation measures must therefore take account of other factors that affect natural resource management risk in coastal areas, such as planning policies [4]. Moreover, to get rid off from the situations, understanding both quantitative and qualitative aspects of natural resource management and risk factors along with people‘s perception is important [5]. Again, to reduce the environmental hazards, the natural resource management project should focus on biodiversity conservation, community development, participatory resources management program and establishing a multi-sectoral management agency [6].
The Sundarbans forest is threatened by a number of factors, for instance, top-dying disease has intruded on the tree species, encroachment of land for shrimp culture and river embankments have altered cultivability thus leading further deterioration of livelihoods [7]. The majority of the rivers have lost contact with their origin due to construction of dams and bridges. This has resulted in lack of fish water flow into the ecosystem. Again shrimp cultivation is increasing the salinity in this region.
It is the most important site in Bangladesh for
nature conservation. But its biodiversity is in great threat because of its declining size due to rapid urbanization and human intervention for livelihood struggle for the last 150 years. Besides, implication of Coastal Embankment Project in early 60‘s,
increased river salinity due to Farakka Barrage, unplanned and irresponsive shrimp cultivation have contributed negative impact on its biodiversity [8]. In addition to these, around 20% trees of the Sundarbans are now facing top-dying and other diseases. Day by day resources are going to be limited due to indiscriminately extraction. Beside this people are not adequately informed about the resources of forest, sustainable use of resources and correct extraction system. This paper would focus on exploring existing knowledge level regarding the Sundarbans and its importance, causes of decreasing resources along with practice about resource extraction procedure and use.
METHODS OF DATA COLLECTION
To identify the existing level of knowledge concerning the Sundarbans and relevant data related to natural resource management were collected from the secondary sources. A detailed household questionnaire survey was also conducted for collecting data comprising 300-sampled household based on rules of thumb as a part of purposive sampling. Eventually 60 households were surveyed from each Union. Afterwards, the survey team followed systematic random sampling technique for identifying representative sample household. Overall, for primary data collection three methods were used as household questionnaire survey, case study and participatory Focus Group Discussion (FGD). However, existing environmental policies and guidelines related to natural resource management were reviewed from different literatures and time demanding journals.
SOCIO-ECONOMIC CONDITIONS OF SAMPLED
HOUSEHOLDS
According to Bangladesh Bureau of Statistics population census 2001 among the selected 5 Unions in Koyra Upazila, 18,070 people were

Proceedings of the International Conference on Environmental Aspects of Bangladesh (ICEAB 2011)
220
dependent on the resources of the Sundarbans. The sex ratio was 130:100. The average household size of resource user was 4.9. From Fig.1: age-sex structure, it was seen that 32.41% of total population were children and rest 55.56 % were adult. In Koyra Upazila most of the households were highly dependent on the Sundarbans. From the household questionnaire survey it was found, almost 69.66% of total households were dependent on the Sundarbans. Dependent occupants were mostly Baowli (wood collector), Mowali (honey collector), shrimp fry collector and fishermen. In this area also other types of occupants like farmer, day labor, shopkeeper, van puller, school-teacher etc. were also present during the survey who were indirectly dependent on the Sundarbans.
Fig. 1. Age-Sex Structure (Source: Field Survey, 2010)
PEOPLE‘S NOTION ABOUT THE SUNDARBANS
Sundarbans is the largest mangrove forest in the world. Different types of animals e.g. tigers, monkeys, crocodiles and spices are living here. It is surrounded by a huge number of rivers e.g. Poshur, Kopotakho, Sakhbaria, Sibsha etc. and located in close vicinity to the Bay of Bengal. The significant characteristic of this forest is the availability of naturally grown up mangrove tress. However, the people who are depending on the Sundarbans, particularly they do not have any idea about the mangrove forest and its importance to the Sundarbans. When they were asked from the household questionnaire survey the meaning of the Sundarbans, only 13% people didn‘t have any ideas about the Sundarbans. The field survey also showed that 62% people mentioned the Sundarbans is a type of forest that can save them from disasters and provide the daily necessity of their livelihood. Only 3% of total respondent said that the Sundarbans is special kind of forest with full of mangrove trees and the rest 22% people pointed out that the Sundarbans is part of natural resources.
RESOURCE USER OF THE SUNDARBANS
Natural forests throughout the country are decreasing in a significant rate. Various types of development activity such as highway, road
construction, and other physical infrastructural development are further intensifying deforestation, and destruction of natural forests in Bangladesh. In the Sundarbans, a huge number of people are dependent on their livelihood and meeting up their daily necessities. The household questionnaire survey in 2010 revealed that around 90.7 % had the dependency on the Sundarbans for resource extraction purpose, specifically 29.3% people caught fishes from rivers, 23.1% collected wood, 17% extracted Goalpata and 14.8% collected honey, 10% others including shrimp fry and crabs. The FGD survey also indicated that every household was either primarily or passively dependent on the Sundarbans and extracting resources directly or indirectly. Significantly, this household dependency ratio on the Sundarbans is increasing day by day.
PEOPLE'S KNOWLEDGE ABOUT THE IMPORTANCE OF
THE SUNDARBANS
Historically the Sundarbans is playing a very important role especially protecting the coastal living communities from disasters every year and promotion of diversified livelihood for the coastal living communities. However, there are different factors that have made the Sundarbans quite significant not only in southwestern coastal part but also for the whole country. Among those factors, livelihood dependency on the Sundarbans, protection from natural disasters every year, maintain ecological and environmental balance, world heritage, the Sundarbans generate employment, etc are the most important. Table1 shows the existing level of knowledge about the importance of the Sundarbans according to age. Among the nine causes pointed out from the FGD survey, all 300 respondents answered each cause on a multiple response scale. 80% respondent pointed out that their livelihood was highly dependent on the Sundarbans including the adult as majority. The above table also signifies that the respondent considerably denoted on other issues e.g. saving them from natural disasters, generation of employment and a place of different valuable resources.
Table 1. Existing level of knowledge of household about
the importance of the Sundarbans
Knowledge about the
importance
Age of respondent Total Young
>20
20-40
Adult
40+
Aged
Don't know 1 6 1 8
Livelihood dependency 12 161 66 239
Save from natural disasters 3 114 66 183
Keep ecological balance - 58 30 88
World heritage site - 15 8 23
Generate employment 4 64 36 104
Different valuable resource 3 77 52 132
Government can get tax 1 46 35 82
Earn foreign currency - 24 20 44
Total household 300
Source: Field Survey, 2010

Proceedings of the International Conference on Environmental Aspects of Bangladesh (ICEAB 2011)
221
RESPONDENT‘S KNOWLEDGE ABOUT THE CAUSES OF
DESTRUCTION OF THE SUNDARBANS
Day by day the Sundarbans is destroying due to various causes e.g. establishment of new settlements, unplanned resource extraction, resource extraction in wrong way, corruption by the forest officers, climatic disaster, shrimp fry collection, costal embankment project, river erosion, resource extraction through illegal way, shrimp cultivation, lack of awareness, sedimentation, river pollution, salinity intrusion etc. Among the 17 identified causes 25.3% respondent highlighted on the corruption issues by the forest department followed by 20.9% unplanned resource extraction, 11.5% shrimp fry collection, 10.2 % resource extraction in wrong procedure, 5.6% resource extraction with out permission or illegal way and 5.4% on salinity intrusion. The case study 2010 also revealed that the resource user or the occupants like fishermen, Baowli and Mowali didn‘t know the causes of destruction of the largest mangrove forest. However, their lack of knowledge about the right procedure of resource extraction, are destroying the natural resources of the Sundarbans. Table 2. Shows that most of the adult people, between 20-45age cohorts, didn‘t have sufficient knowledge about the causes of destruction the Sundarbans in comparison with aged group between 45 and above.
Table 2. Knowledge status about the causes of destruction of the Sundarbans according to age group
Knowledge about the
causes of destruction
Age group
Total Young
>20
20-40
Adult
40+
Aged
Don't know - 15 4 19
New settlements - 29 13 42
Resource extraction 8 130 77 215
Wrong method of extraction 2 63 40 105
Corruption of Forest
Department 11 163 86 260
Climatic change - 11 5 16
Climatic disaster 1 16 6 23
Shrimp fry collection 4 71 43 118
Costal embankment project - - 2 2
River erosion - 3 1 4
Illegal entry in forest 2 28 28 58
Shrimp cultivation 2 11 9 22
Lack of awareness 1 25 22 48
Sedimentation - 1 1
River pollution - 1 1 2
Farakka Dam - 13 14 27
Increasing salinity - 22 33 55
Use of fertilizer and
insecticides - 5 5 10
Total 13 193 94 300
Source: Field Survey, 2010
PEOPLE‘S KNOWLEDGE ABOUT THE SUNDARBANS CONSERVATION
Most of the people do not know about the Sundarbans conservation. Only 13.7% respondent from the household questionnaire survey said that they were familiar with the conservation but their knowledge was limited to different ideas e.g. totally no extraction of resources, extra control by the Department of Forest. The respondents also emphasized during the Focus Group Discussion if there would no extraction of resources from the Sundarbans for few years then it would be conserved, which is even not the ideal way of
natural resource conservation [9]. Table.3 shows the status of knowledge about the conservation of the Sundarbans with different occupational groups. The field survey 2010 explored that among the different occupants most of the Sundarbans dependent people or resource collectors didn‘t have any idea about the Sundarbans conservation. However, the non- dependent occupants were more aware about the conservation knowledge. Surprisingly, it was found that 100% young people were not aware about the Sundarbans conservation even though NGOs and public media are playing a significant role for knowledge dissemination at local level.
Table 3. Knowledge about the Sundarbans Conservation according to different occupation
Occupation
Knowledge about the
Sundarbans Conservation Total
Yes No
Baowali 1 21 22
Maowali 2 11 13
Fishermen 4 161 165
Shrimp fry
collector 6 3 9
Shrimp farmer 5 - 5
Teacher 1 - 1
Farmer 7 19 26
Day Labor - 24 24
Shopkeeper 3 2 5
Van Puller - 3 3
Service holder - 1 1
Businessman 10 6 16
Unemployed 1 1 2
Housewife - 5 5
Doctor 1 - 1
Tailor - 1 1
Motor Driver - 1 1
Total 41 259 300
Source: Field Survey, 2010
KNOWLEDGE ABOUT LAWS RELATED WITH THE
SUNDARBANS
Bangladesh government has formed a range of laws about the natural resource management, environmental development, resource extraction and conservation. But people do not know about the laws. The survey resulted that 95% people were not aware about the laws and only 5% of total respondent knew about the existence of laws. But

Proceedings of the International Conference on Environmental Aspects of Bangladesh (ICEAB 2011)
222
their knowledge was limited with the few facts e.g. for resource extraction they would need a pass or permit, without permit if they would collect resources the court would take necessary actions. Existing laws prohibited to collected green timber but they do not know. Due to lack of knowledge about the laws most of the people fall in case. Household questionnaire survey also explored that out of 300 sampled households, 32 household head were accused to case by the Department of Forest due to resource collection without permeation, non-renew of permit or pass even sometimes with the false cases.
TENTATIVE SUGGESTIONS
In order to face the challenges of the Sundarbans conservation, increasing population, decreasing availability of agricultural land, frequent disasters etc. the local stakeholders pointed out the following recommendations. However, establish a network of ecologically critical areas, and manage them properly would have a significant impact on the long-term viability of the country's nationally and globally significant biodiversity resources [10]. I. The Sundarbans generates employment but due
to declining forest resource they would require alternative jobs. As the level of awareness varies according to age, sex and occupation so the direct resource collector, young people and children should bring under grate consideration. In this case, member of youth clubs, school-teachers and resources users can play an important role for awareness building.
II. The people usually go to the Sundarbans for resource collections don‘t have the right procedure of resource collection or extraction so they need education about the correct resource extraction procedure.
III. The local youth clubs can play an important role for the Sundarbans conservation. Here the club members need training for working with environmental issues and also need to strengthen the club.
IV. In this area different organization works with the community people and different Government officials and department engaged with the Sundarbans resource management. So here need a good networking and communication or understanding among the authorities or departments.
V. Every year forest department prepare Forest Management plan but that information is not available to community people. So there is important to disseminate those related information regularly.
VI. People who are collecting resources do not know about the laws incorporated with the resource extraction and management. Due to ignorance, very often the respective authorities accuse them. So it is important to make them understand about the laws.
CONCLUSION This study was done to address the importance of the Sundarbans in southwest coastal areas of
Bangladesh in different aspects and to assess the level of knowledge from community perspectives. This framework and information can be used for application and formulation of strategies from micro to macro level like village to regional scale. It is, however, heartening that Bangladesh is in the forefront in getting to handle natural resource management. The challenge of the Sundarbans conservation lies in the preparation and implementation of sustainable environmental and natural resource management strategies, policies and plans by the Government as well as the response of local people‘s willingness.
REFERENCE
[1] ICZMP. 2005). Coastal Development Strategy.
Retrieved June 4, 2010, from Water Resources
Planning Organization (WARPO), Bangladesh:
http://www.warpo.gov.bd/rep/coast_news/c_news
14.pdf
[2] RQ Grafton, F Jotzo and M Wasson. 2004, Financing
sustainable development: Country undertakings
and rights for environmental sustainability CURES.
Ecological Economics, 51: 65-78.
[3] RMS. 2008. A Guide to Catastrophe Modeling .
London: Informa UK Ltd.
[4] Lloyd. 2008. Coastal Communities and Climate
Change. London: Lloyd.
[5] JK Stanisksis and Z Stasiskiene. 2005.
Environmental management accounting in Lithuania: exploratory study of current practices,
opportunities and strategic intents, Journal of
Cleaner Production, articles in press / accepted for
publication.
[6] K Smith. 2004. Environmental Hazards: Assessing
Risk and Reducing Disaster (4th ed.). London and
New York: Routledge.
[7] M Solaiman and ASM Azad. 2001. Sustainable
development in Bangladesh perspectives, The Cost
and Management, the Journal of the Institute of Cost
and Management Association of Bangladesh,
March – April, 25-29.
[8] UNDP. 2003. People's Report 2002 Bangladesh
Environment. Dhaka: UNDP Bangladesh.
[9] H Mountford and JH Keppler. 1999. Financing
incentives for the protection of biodiversity, The Science of the Total Environment, 240: 133-144.
[10] MO Ali and M Ahmend. 2000. Biodiversity
Conservation Vision For Bangladesh, Presented in
the Reporting Workshop on Biodiversity in
Bangladesh. Organized by Environmental Forum of
Journalists Bangladesh. National Press Club, Dhaka,
Bangladesh.
Proceedings of the International Conference on Environmental Aspects of Bangladesh (ICEAB 2011)
223
Author Index Author Paper IDs
A
Adhikari, Basudam A4.003
Afrin, Sonya A1.009
Afroja, Khadija A4.013
Ahammad, Jibril A1.013
Ahammed, Faisal A3.010
Ahmed, SU A3.005
Akharuzzaman, M A4.009
Akhter, Suraia A2.005, A2.012
Alam, M Khorshed A4.010
Alam, Md. Moksed A1.009
Al-Amin, Shams A3.002
Al-Mahin, Abdullah A4.002, A4.005
Amin, Mohammad A4.014
Analuddin, Kangkuso A2.007, A2.010
Ankur, Asif Khan A4.008
Arafat, Yasir A4.014
Asahiro, Kazuo A2.005, A2.006, A2.011, A2.013
Azad, Md. Al-Mamun A4.017
B
Bangoura, I A2.014
Barman, Shantanu Deb A4.016
Becerra, Judith X A2.008
Begum, Shahanara A3.001
Bhuiyan, MMH A1.014
Biplob, Pramanik A4.008
C
Chattarjee, D A2.012
Chen, Hua-Wei A1.012
Chen, Yi-Ron A1.007
Chiou, Chyow-San A1.012
Choudhury, Sougata R A4.003
Chowdhury, AFM K A3.005
Chowdhury, Ahmed S A3.013
Chowdhury, M.A.Z A4.010
Chowdhury, MAI A3.005
Chowdhury, M Alam A4.012
Chowdhury, MTH A2.014
D
Deshar, Rashila A2.007, A2.009, A2.010
F
Fakhruddin, ANM A4.002, A4.005
Fardous, Zeenath A4.010
Farhana, Sharmeen A3.004
Funada, Ryo A3.001
Author Paper IDs
Furuno, T A4.015
Furusawa, Hana A1.010
H
Hagihara, Akio A2.002, A2.007, A2.009, A2.010
Hannan, MA A2.014
Haque, Albelee A A1.001, A1.002
Hasan, Mahmud A3.009, A3.011
Hasan, Md. Nazmul A1.004
Hasegawa, Yuki A1.003
Hassan, Md. Fuhad A3.012
Hong, Gui-Bing A1.012
Hong, YK A2.014
Hoque, ATM Rafiqul A2.002, A2.009, A2.010
Hossain, M Shahed A3.012
Hossain, ST A3.003, A4.015
Hou, Wen-Shang A1.007
Huda, KM Nurul A4.006
Hunchaisri, Surasak A4.007
I
Ikegami, T A1.014
Inaoka, Tsukasa A1.010
Inoue, Eiji A3.007, A4.013
Islam, AFM Tariqul A2.016
Islam, AKM Nazrul A3.012
Islam, KK A2.003
Islam, M Jinnahtul A2.017
Islam, M. Nazrul A4.010
Islam, Md. Aminul A3.012
Islam, Md. Azharul A2.008
Islam, Mohammad R A2.015
Islam, Saiful A3.009, A3.011
Ito, K A4.004
J
Jitto, Ponlakit A4.007, A4.011
K
Kakimoto, K A4.004
Kamruzzaman, Md. A2.002
Kang, JY A2.014
Kar, Shiba P A1.002
Khan, M Mahboob H A4.010
Khan, M Shah Alam A1.003
Khaniki, GhR Jahed A1.006
Kishimoto, Satomi A4.001
Kojima, Toshiharu A2.001
Konagaya, H A4.015

Proceedings of the International Conference on Environmental Aspects of Bangladesh (ICEAB 2011)
224
Author Paper IDs
Kubota, Junpei A2.013
Kuniyoshi, Shinji A2.001
Kurosawa, Kiyoshi A1.005
L
Lee, IJ A2.014
Li, Yu-Huan A1.012
M
Mahboob, M Golam A2.001, A2.016,
A2.017
Mahiudddin, Md. A4.002
Mahmud, Yahia A1.004
Mamisaheby, S A1.006
Manabe, S A4.004
Manna, Suvendu A4.003
Mitsugi, F A1.014
Mitsuoka, Muneshi A4.013
Mohiuddin, ASM A3.003
Moqsud, M Azizul A3.008
Mortuza, Md. Rubayet A4.008
Mouctar, Kamara A2.007, A2.009
N
Nagano, Mariko A2.004
Nakaba, Satoshi A3.001
Nakata, Yukihiko A3.006
Navera, Umme Kulsum A2.016
Nishiyama, Noriaki A2.004
O
Oike, T. A4.004
Okayasu, Takashi A4.013
Omine, Kiyoshi A3.008
Otoma, Suehiro A4.001
Ozaki, Akinori A4.013
P
Parveen, Rawshan A1.004
R
Rabbani, MA A3.007
Rahman, Atiqur A1.008
Rahman, M Abdur A4.010
Rahman, Mafizur A3.004
Rahman, Md. Abiar A2.005, A2.006, A2.011, A2.013
Rahman, M Mostafizur A4.017
Rahman, Md. Zulfikar A2.005, A2.012
Rasheduzzaman, A1.008
Rashid, Harunur A1.004
Raut, Sangeeta A4.003
Rima, Umme Salma A3.002
Rokon, Sheikh A1.008
Rokunuzzaman, Md. A1.003
Author Paper IDs
S
Saha, Subrota Kumar A1.003
Salequzzaman, Md. A1.003
Sarkar, Pijush A4.005
Sarker, AKMR Amin A4.016
Sarker, RI A3.007
Sarker, Subrata A4.016
Sato, Noriko A2.003
Sato, Shushi A1.003
Sattar, Md. Abdus A1.004
Satter, MA A3.007
Sayeed, Md. Nizam A3.009, A3.011
Selmi, Saranah A4.008
Sen, Ramkrishna A4.003
Shalini, P A1.011
Sharma, Manisha A4.003
Sharma, Sahadev A2.002, A2.007, A2.009, A2.010
Sharmin, Farhana A1.002
Sharmin, Subarna A1.009
Shinoda, Seirou A2.001
Singseewo, Adisak A4.007, A4.011
Sriharuksa, Somchoke A4.011
Su, Te-Li A1.012
Sugimoto, H A4.015
Sukhan, Zahid Parvez A1.004, A2.014
Sultana, Nayar A1.010
Suttisa, Choopug A4.007
T
Takata, Mayu A2.013
Tani, Masakazu A2.005, A2.006, A2.011, A2.012,
A2.013
Tanu, Mohosena Begum A1.004
Tasmin, Rumana A2.015
Tooheen, Rahat B A3.013
U
Uddin, Md. Shamim A1.005
Uddin, MJ A3.003
Umezaki, Masahiro A1.010
W
Wagner, Thomas W A2.017
Watanabe, Chiho A1.010
X
Xie, Yichun A2.017
Y
Yaoita, Kiho A2.004
Yoshida, Hiromichi A4.013
Yukihira, N A4.004

Proceedings of the International Conference on Environmental Aspects of Bangladesh (ICEAB 2011)
225
Bangladesh Environment Network Japan (BENJapan)
http://benjapan.org
Introduction of BENJapan/BEN BENJapan is formed with an effort to contribute in Bangladesh's & Japan’s environment sectors, by the Bangladeshis living in Japan in collaboration with Bangladesh Environment Network (BEN) members from all over the world. BEN is working hand in hand with BAPA ("Bangladesh Poribesh Andolon" – Bangladesh Environment Campaign). BENJapan & BEN have been set up to facilitate communication among experts working on Bangladesh's environmental aspects, since September 2008 in Japan & July 1998 in USA respectively.
Objectives of BENJapan A. Gather and disseminate information about environmental issues in Bangladesh & Japan B. Gather and disseminate information about possible solutions to Bangladesh’s environmental problems C. Establish and strengthen connection among various environmental organizations in Bangladesh D. Establish and strengthen connection between environmental organizations in Bangladesh on the one hand
and international environmental organizations, on the other E. Formulate various policies that can and should be adopted to solve and avoid environmental problems in
Bangladesh F. Generate public opinion in favor of policies necessary to protect environment & G. Persuade and assist the government to adopt and implement environment-friendly policies.
5 Principles of BENJapan/BEN 1. Self-reliance: It refers to BENJapan/BEN’s practice in avoiding external funds and instead of relying on
members’ contributions to support its activities 2. Non-partisan character: BENJapan/BEN is open to people of different political persuasions (irrespective of
political views) 3. Emphasis on RB-NRB cooperation: Resident-Bangladeshis(RB)-Non-resident-Bangladeshis(NRB) cooperation
is mutually reinforcing 4. Non-hierarchical organization: BENJapan/BEN grew up as an Internet-based organization. All
BENJapan/BEN members have basically the same rights & opportunities in voicing their views & being heard. It has no formal office bearers
5. Consensus decision making: Decisions in BENJapan/BEN are arrived through discussion and consultation.
BEN Panels on Various Environmental Problems of Bangladesh
Arsenic and Other Ground Water Contamination
River and Other Water Issues
Energy Issues
Global Warming and Climate Change
Economic, Legal, and Management Aspects of Environment
Household, Industrial, and Medical Waste
Surface Water Contamination
Air Pollution and Other Problems of Urbanization
Jute
Adibashi Issues
Population Growth, Forests, and Bio-diversity
BENJapan’s Important Programs
Monthly Tele-Conference/Webiner on Environmental Aspects (WEA) on various environmental aspects: http://benjapan.org/wea.html
2nd International Conference on Environmental Aspects of Bangladesh (ICEAB11), Sept. 10-11, 2011: http://benjapan.org/ICEAB
International Journal of Environment (IJE) (ISSN: 2186-0009): http://benjapan.org/IJE
1st International Conference on Environmental Aspects of Bangladesh (ICEAB10), Sept., 2010: http://benjapan.org/ICEAB10
Symposium on Environmental Issues of Bangladesh and Japan, Sept. 2009
Climate change rally, signature campaign for the memorandum to UN Secretary General, fund-raising for Haiti victims, etc. Join BENJapan: Mail to [email protected] Contact: Coordinator, BENJapan [email protected]
Copyright © 2022 FDOKUMEN