
Similar but different: Conceptions and management of institutional policy in the United States, New...
142
-
Upload
independent -
Category
Documents
-
view
2 -
download
0
Transcript of Similar but different: Conceptions and management of institutional policy in the United States, New...
1
Association for Tertiary Education Management and Tertiary Education
Facilities Managers’ Association
Tertiary Education and Management Conference 2014 Refereed Papers
Ian R Dobson, Maree Conway & Raj Sharma (Eds.) TEMC - Refereed Papers 2014 ATEM Inc. & TEFMA Inc. ISBN 978-0-9808563-5-4

2
3
TABLE OF CONTENTS Editors’ introduction Ian R Dobson, Maree Conway & Raj Sharma
4
Sara Booth & Cassandra Saunders Operationalising academic performance: Implementing teaching performance expectations
7
Gregory Nash, Gail Crimmins, Janet Turley, Mary-Rose Adkins, Lee-anne Bye, Ann Robertson, Richard Bond & Florin Oprescu Rise of a massive on-campus course (MOCC)
19
Brigid Freeman, Miskus Lapan, Tracie Mafile’o, Nancy Capell, Andrew Goldblatt & Sue Thompson Similar but different: Conceptions and management of institutional policy in the United States, New Zealand and Papua New Guinea
31
Aggie Lim and Kelly Lanfranca Actions speak louder than words: University of Western Sydney’s myvoice staff engagement project - journey and achievements
53
Sara Booth, Jeanne Keay, David Sadler, Tim Duffy & Shannon Klekociuk Benchmarking international student experience
67
Stijn Dekeyser, Richard Watson, and Elizabeth Baré Designing an academic workload model in the age of blended learning
89
Ann Hornsby & Kai Jensen Friends across Swanston St.: Building cross-unit connectedness through mentoring partnerships
105
Chelsea Harper, Kate Kirby & Sandra Jeffries The real value of an information asset register
119
Robert A. Ellis & Kenn Fisher Adapting to change in university learning space – informing and being informed by feedback from senior university leaders
127
4
EDITORS’ INTRODUCTION Ian R Dobson, Maree Conway and Raj Sharma This document is the formal e-book of refereed stream papers of the Tertiary Education Management (TEM) Conference, 2014. TEM first provided this capacity for TEM attendees to publish their papers in 2010. It is difficult to avoid a modicum of ‘self-plagiarisation’ and paraphrasing when writing introductions such as this, because some things need to be repeated every year. Apologies are offered for this unfortunate inevitability. TEM conferences have always attracted many excellent papers, and the advent of a refereed stream was a good thing. There is no reason why a conference attended predominantly by ‘admin’ staff should not also offer the capacity for those delegates presenting a paper to be including within the system of metrics that sees the federal government providing funding. However the TEM Conference has a rather strong practitioner focus to support the sharing of knowledge and 'know how'. That is only to be expected, because it is a conference sponsored by organisations of administrators and managers. The main reason for mentioning this is that we managers and administrators don’t necessarily approach writing in the same way as academics do. It is possible that there has been minor confusion as to which papers can be included in the refereed proceedings of a conference. Papers ‘published’ in this way constitute a funded research output and therefore such papers must meet the Higher Education Research Data Collection’s definition of ‘research’ before being eligible for inclusion in refereed proceedings. Not all practitioner papers can be defined as ‘research’, but this does not mean that they are not excellent papers. This goes some way towards explaining why it took over 30 years before the TEM Conference offered a refereed stream. People that work in ‘admin’ can write up their research and practice in a scholarly manner. Look no further than the co-editors of this volume; all three of us have had our work published in scholarly refereed journals. So prolific was co-editor Sharma, that he is still the most published author ever of papers published in the Journal of Higher Education Policy and Management, ATEM’s (and now the L H Martin Institute’s) scholarly journal, now in its 36th year. Furthermore, two of the three editors have PhDs, and the third is currently enrolled in one. We are not the only publishing (ex) administrators, though. Perhaps getting started is not all that easy, but eventually you’ll be on a roll. There is a first time for everything, and the editors are more than happy to discuss these matters with authors thinking of submitting a paper to the refereed stream. For the TEM Conference 2014, of the ten papers submitted for assessment under provisions for the refereed stream, nine appear in this volume. The one not published was ruled out because it could not be deemed to be ‘research’. This issue of the TEMC Refereed Papers differs from those of recent years in that only one of the papers come from the TEFMA stream of the Conference, and that one was submitted at the death knock. This is perhaps because several TEFMA stream papers were rejected last year, because they could not be described as ‘research’. The editors hope that this trend might be reversed in subsequent years. The editors have a duty of care in this regard, because they are the front-line gatekeepers, on behalf of the federal government. The fine line between ‘research’ and ‘not research’ has to be remembered; papers have to be rejected if they cannot be described as ‘research’.
5
Looking at this year’s papers, we open with Sara Booth and Cassandra Saunders from the University of Tasmania, who examine ‘academic performance’. Building on the existing literature, they highlight the importance of cross-institutional benchmarking in improving engagement with teaching enhancement. Quoting the authors, ‘The framework that has been developed provides clear statements of expectations for all academic staff with a learning and teaching role and ensures individual accountability for managing one’s performance….[etc.]’. Gregory Nash and his colleagues report the logistical and other challenges of teaching a ‘massive on-campus course’ to all commencing undergraduates at an Australian regional university. Based on the transition and other literature, they discuss transition pedagogy and the management behind conducting such a large programme. In the wonderful world of acronyms, we now have MOCCs to consider next to MOOCs, perhaps. Brigid Freeman and an international group of researchers describe the Institutional Policy Project, the aim of which was to ‘unpack higher educational institutional policy from an international, comparative perspective’. Looking at practices in the US, Papua New Guinea, and New Zealand, the authors find ‘a pervasive dislocation between policy texts and policy practitioners, policy governance, and policy implementation and review’. Aggie Lim and Kelly Lanfranca from the University of Western Sydney present an interesting case study of how to improve organisational culture and practices through management and staff engagement. This all started with a staff survey. Achievements and challenges are discussed in the paper. In her second offering for this year’s refereed stream of the TEM conference, Sara Booth has been joined by colleagues from the University of Tasmania and the University of the West of Scotland to report on a benchmark study of three aspects of internationalisation. They share their results with us. Academic workload models are all the go these days, Stijn Dekeyser, Richard Watson and Elizabeth Baré present a paper in which they argue that ‘traditional workload models are ill suited to deal with the changing nature of tertiary teaching’ [they] present a new approach that combines the strengths of existing types of models while neutralising their weaknesses’. Ann Hornsby and Kai Jensen report on a mentoring programme for professional staff between three large groups of disparately-located professional staff at multi-campus and multi-located RMIT University. They started with the literature to identify the requirements for successful mentoring programmes, and then compare their results with those identified in the literature. We can also learn about the values of having an information asset register, a tool used to list and track an organisation’s information assets. This paper, by Chelsea Harper and colleagues from the University of the Sunshine Coast, is back grounded in the literature on information retention and auditing, and identifies the introduction of such a register through a case study approach. Finally, the paper by Robert Ellis and Kenn Fisher looks at learning space at universities, a changing feast, given the rapid and continuous change to many aspects of university life this century. Built on a survey of university leaders, the authors note that ‘pedagogically-driven
6
and shared concepts are at the core of effective learning space design and are necessary to adapt successfully to changing requirements’. Read on! The editors hope that readers find this set of papers to be of interest. They also hope that ATEM members that attend the TEM Conference regularly might start to consider submitting their work for consideration for the refereed stream. Readers’ comments on this volume and the processes behind it will be gratefully received. BIOGRAPHICAL NOTES Ian R Dobson’s career in higher education started in the early 1970s years in the Planning Branch at RMIT. Since then he enjoyed (for much of the time) long spells at the University of Melbourne and Monash University, and was a research director at the University of Helsinki, Finland, for nearly three years from 2010. Currently he is an honorary senior research fellow in the School of Education and Arts at Federation University, Ballarat, and an adjunct professional staff member at Monash University. He edits the Journal of Higher Education Policy and Management and the NTEU’s Australian Universities’ Review. He completed a PhD at Monash University on higher education equity policy in 2004. Maree Conway spent almost 30 years working as a tertiary education manager before starting Thinking Futures, a strategic foresight practice, in 2008. She now works with people in educational, non-profit and government organisations to strengthen strategy development and implementation through the use of environmental scanning, strategic thinking and enhanced strategic planning. Maree sits on the editorial boards of the Journal of Higher Education Policy and Management and On The Horizon, and recently guest edited a special issue of On The Horizon on New Media and Learning. Raj Sharma worked in higher education for nearly four decades at institutions in three Australian states, both in higher education management and as an academic. He completed the Master of Educational Administration and PhD from the University of New England during the 1980s. Raj is a consultant in higher education in areas such as planning, institutional research, resource allocation and related fields.
Ian R Dobson, Maree Conway & Raj Sharma
Email: <[email protected]>
7
OPERATIONALISING ACADEMIC PERFORMANCE: IMPLEMENTING TEACHING PERFORMANCE EXPECTATIONS
Sara Booth & Cassandra Saunders
University of Tasmania [email protected] [email protected]
ABSTRACT Universities across the higher education sector are under increasing pressure from external and internal demands to demonstrate accountability and transparency in academic performance. In July 2012, the University of Tasmania approved Opening UTAS to Talent: The UTAS Academic, which outlines minimum performance expectations in research and learning and teaching. This paper presents an overview of the development and implementation of the University’s Teaching Performance Expectations from 2012-2014. Development of these was strongly informed by the work of Gunn and Fisk, the key findings and outcomes from an international benchmarking project on promotion policies and processes and feedback from institution-wide workshops. It highlights the importance of effective cross-institutional benchmarking as an enabling process in response to the need for some institutions to improve their engagement with teaching enhancement, internal benchmarking to ensure reward and recognition processes are fair and robust across the institution and comparative mechanisms to explore and improve teaching excellence in a rapidly changing environment. The framework that has been developed provides clear statements of expectations for all academic staff with a learning and teaching role and ensures individual accountability for managing one’s performance, individual development, promotion and career opportunities in learning and teaching. KEY WORDS Performance expectations; promotion; teaching excellence INTRODUCTION Universities across the higher education sector are under increasing pressure from external and internal demands to demonstrate accountability and transparency in academic performance. External challenges include significant periods of economic turbulence and change, international ranking; changing technologies and growing economies exerting their position as higher education providers (Gunn & Fisk, 2013; Debowski, 2012). Internal challenges relate to the changing dynamic of the academic, including an escalation in the demands and roles of academics expected at different stages of their career (Gunn & Fisk, 2013). In adapting to this increasingly changing higher educational landscape, universities are turning their attention to explicit academic performance expectations in research, teaching and service. This paper provides an overview of the development and implementation of Teaching Performance Expectations at the University of Tasmania, which have been closely aligned to key strategic initiatives related to teaching excellence and reward and recognition in higher education at the international, national and institutional levels.

8
INTERNATIONAL AND NATIONAL CONTEXT Internationally, the Higher Education Academy has led a number of strategic initiatives related to teaching excellence, such as the United Kingdom (UK) Professional Standards Framework and the National Teaching Fellowship Scheme, as well as studies in reward and recognition of teaching (Cashmore & Ramsden, 2009; Cashmore, Cane & Cane, 2013). In addition to these studies, the Higher Education Academy has recently commissioned a review of teaching excellence initiatives, undertaken by Gunn and Fisk (2013). This work outlines a framework for universities to develop a shared repertoire around teaching quality and teaching excellence. Four dimensions that contribute to an understanding of how teaching excellence is operationalised in universities were identified (Figure 1).
Dimension 1: Achieving educational demands on universities - extent to which excellent learning outcomes in response to the relevant educational demands are defined and illustrated by universities
Dimension 2: Excellent structures - level of quality of different domains promoting teaching excellence in universities
Dimension 3: Demonstrating individual excellence - degrees of success in demonstrating excellence in teaching practice
Dimension 4: Quality of evidence - levels of quality of evidencing individual teacher excellence
Figure 1. Elements for developing the architecture of a teaching excellence taxonomy (adapted from Trigwell, 2010 cited in Gunn & Fisk, 2013)
Each of these dimensions (with particular emphasis on dimensions 2, 3 and 4) has strongly informed the development of Teaching Performance Expectations at the University of Tasmania. This is discussed further below. In Australia, the Office for Learning and Teaching has also instigated a number of strategic initiatives around teaching excellence and reward and recognition (Chalmers et al., 2013; James et al., 2013). Chalmers et al. (2013) have developed a framework that clarifies what constitutes quality teaching and how it can be evidenced. The second project, by James et al. (2013), is about providing a blueprint for influencing Australian policy and practice in higher education teaching. The Office for Learning and Teaching also signed a memorandum of understanding with the Higher Education Academy. The memorandum included an undertaking to explore the possibility of running a collaborative Change Programme in Australia and UK, based on the Thematic Change Programme which has run in the UK for some time. The Transforming Practice Programme (Crookes, 2014) is the first of these programmes in Australia. The theme for 2014 is reward and recognition and involves 13 Australian and nine UK universities. Both programmes are aimed at knowledge translation, as well as sharing of expertise and insights into managing successful innovation and change in reward and recognition in universities. ORIGIN OF THE TEACHING PERFORMANCE EXPECTATIONS Adapting to the changing international and national environment, the University of Tasmania undertook significant organisational changes in academic performance in 2012-2014 to align with the strategic plan Open to Talent: 2012 Onwards. The vision outlined in this plan states:
9
‘Communication of objectives and clarification of responsibilities and classifications will assist staff to understand how their endeavours contribute to UTAS. Clear articulation of performance expectations, including definition of the “UTAS Academic”, will provide guidance for confirmation and promotion…’
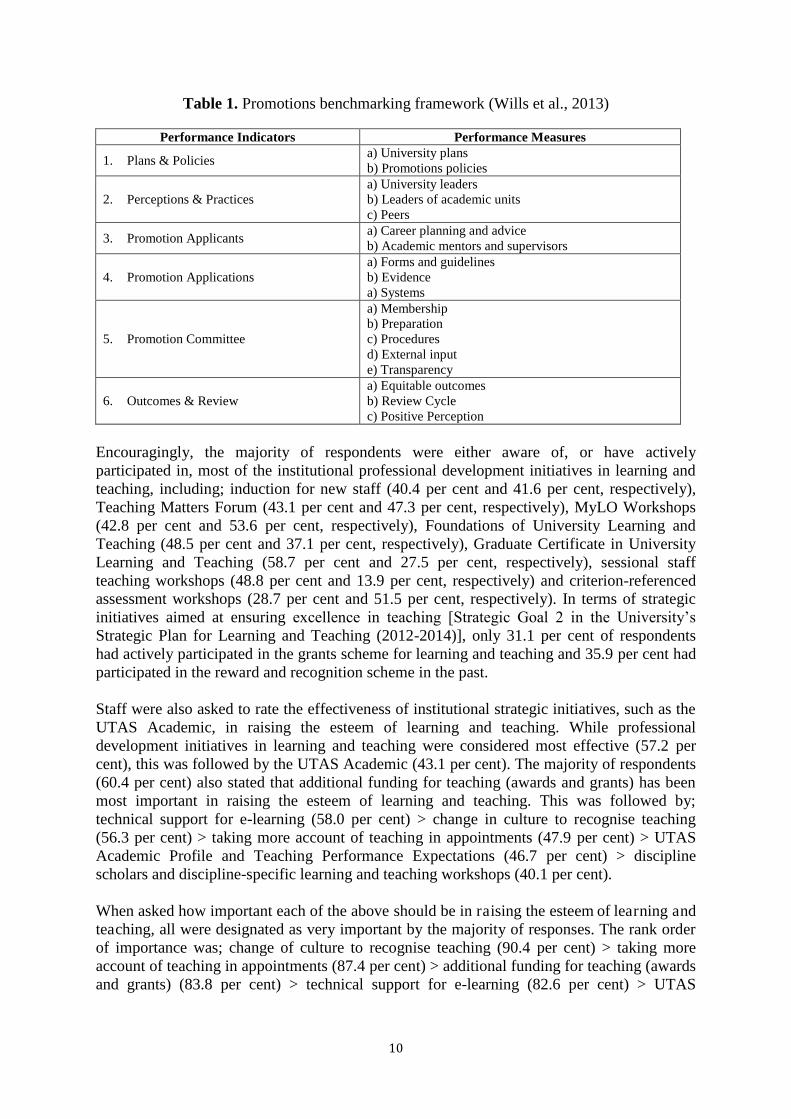
In July 2012, the University approved the document Opening UTAS to Talent: The UTAS Academic, which outlines minimum performance expectations in research and learning and teaching. A new Strategic Plan for Learning and Teaching (2012-2014) has also recently been implemented across the university. The Plan has four key goals, to: 1) facilitate excellence in learning; 2) ensure excellence in teaching; 3) develop a renewed curriculum, and 4); develop and maintain quality partnerships. The University also participated in an international benchmarking project in 2012with the universities of Leicester and Newcastle (UK) and Wollongong (Australia) funded by the Higher Education Academy comparing promotion policies and processes (Wills et al., 2013). This project has strongly informed the development of the Teaching Performance Expectations at the University of Tasmania. Promoting Teaching Benchmarking Project Benchmarking can be defined as ‘first and foremost, a learning process structured so as to enable those engaging in the process to compare their services/activities/products in order to identify their comparative strengths and weaknesses as a basis for self-improvement and/or self-regulation’ (Jackson & Lund, 2000, cited in Stella & Woodhouse, 2007, p.14). The specific purpose of this benchmarking project was to compare policies, processes and perceptions on promotion with an emphasis on the reward and recognition of teaching. The key objectives were to: 1) develop a benchmarking framework and resources for comparing promotions policies and processes; 2) collect data on current promotions policies and processes, and; 3) triangulate data on outcomes to identify areas of good practice and areas for improvement. A benchmarking framework was developed which consisted of six performance indicators and accompanying performance measures, shown in Table 1. This framework was used by the participating universities to undertake both an internal self-review and a cross-institutional peer-review. Self-Review Phase The self-review process at the University of Tasmania was undertaken by a small steering group, chaired by the Provost and Chair of the Promotions Committee. This steering group provided the majority of advice and had oversight of the self-review phase of the benchmarking project. However, it was also considered important to garner academic staff perceptions of the promotion process. Two online surveys were sent to academic staff to obtain feedback regarding their experience of strategic initiatives to enhance the quality and esteem of learning and teaching (SESIEQELT) at the University and also their perceptions of the promotions process (n=220 and 92 respondents, respectively).
10
Table 1. Promotions benchmarking framework (Wills et al., 2013)
Performance Indicators Performance Measures
1. Plans & Policies a) University plans b) Promotions policies
2. Perceptions & Practices a) University leaders b) Leaders of academic units c) Peers
3. Promotion Applicants a) Career planning and advice b) Academic mentors and supervisors
4. Promotion Applications a) Forms and guidelines b) Evidence a) Systems
5. Promotion Committee
a) Membership b) Preparation c) Procedures d) External input e) Transparency
6. Outcomes & Review a) Equitable outcomes b) Review Cycle c) Positive Perception
Encouragingly, the majority of respondents were either aware of, or have actively participated in, most of the institutional professional development initiatives in learning and teaching, including; induction for new staff (40.4 per cent and 41.6 per cent, respectively), Teaching Matters Forum (43.1 per cent and 47.3 per cent, respectively), MyLO Workshops (42.8 per cent and 53.6 per cent, respectively), Foundations of University Learning and Teaching (48.5 per cent and 37.1 per cent, respectively), Graduate Certificate in University Learning and Teaching (58.7 per cent and 27.5 per cent, respectively), sessional staff teaching workshops (48.8 per cent and 13.9 per cent, respectively) and criterion-referenced assessment workshops (28.7 per cent and 51.5 per cent, respectively). In terms of strategic initiatives aimed at ensuring excellence in teaching [Strategic Goal 2 in the University’s Strategic Plan for Learning and Teaching (2012-2014)], only 31.1 per cent of respondents had actively participated in the grants scheme for learning and teaching and 35.9 per cent had participated in the reward and recognition scheme in the past. Staff were also asked to rate the effectiveness of institutional strategic initiatives, such as the UTAS Academic, in raising the esteem of learning and teaching. While professional development initiatives in learning and teaching were considered most effective (57.2 per cent), this was followed by the UTAS Academic (43.1 per cent). The majority of respondents (60.4 per cent) also stated that additional funding for teaching (awards and grants) has been most important in raising the esteem of learning and teaching. This was followed by; technical support for e-learning (58.0 per cent) > change in culture to recognise teaching (56.3 per cent) > taking more account of teaching in appointments (47.9 per cent) > UTAS Academic Profile and Teaching Performance Expectations (46.7 per cent) > discipline scholars and discipline-specific learning and teaching workshops (40.1 per cent). When asked how important each of the above should be in raising the esteem of learning and teaching, all were designated as very important by the majority of responses. The rank order of importance was; change of culture to recognise teaching (90.4 per cent) > taking more account of teaching in appointments (87.4 per cent) > additional funding for teaching (awards and grants) (83.8 per cent) > technical support for e-learning (82.6 per cent) > UTAS
11
Academic Profile and Teaching Performance Expectations (79.1 per cent) > discipline scholars and discipline-specific workshops (70.6 per cent). The analysis of the second survey on staff perceptions of academic promotion at the University of Tasmania brought up some interesting results that correlated with the findings from the self-review process, in particular, the lack of metrics in learning and teaching and the need for support for Heads of School in dealing with cases of poor teaching in performance management. Ninety-three per cent of respondents stated that research activities are regarded as somewhat (8.5 per cent) or very (84.6 per cent) important for promotion in their School / Centre / Department. In contrast, only 73.7 per cent of respondents stated that teaching activities, including the scholarship of teaching and curriculum engagement, are regarded as somewhat (42.8 per cent) or very (30.9 per cent) important for promotion. When asked to what extent teaching and research activities should be regarded for promotion, both were designated as very important for the majority of respondents, 69.6 per cent and 77.0 per cent, respectively. Of particular note is that 70.7 per cent of respondents stated that tensions exist in dividing teaching and research activities when applying for promotion. Of these responses, there was an overwhelming perception that research activities are more highly valued and recognised than teaching activities for promotion.
‘There is a common assumption (among staff at least) that teaching is secondary to research.’
‘… we are constantly (and officially) told that teaching performance is a viable way to get promoted, but the unofficial advice is teaching is not valued in promotion circles.’
Moreover, it was highlighted by a number of staff that the measurement of excellence in teaching is challenging due to the lack of clear performance metrics.
‘Metrics associated with research are easier to find and apply.’
‘The measures of research excellence are clearly spelt out and easy to identify. The measures of teaching excellence are much less clear. It is easy to identify poor teaching. However, it is
much harder to differentiate between mediocre teaching and excellent teaching in a promotion application …’
Staff members were also unclear as to where the scholarship/research of teaching sits within the promotion application, i.e. does it sit within teaching activities, or is it considered a research activity? This, in turn, increases tension between teaching-intensive and research-intensive staff. One research-intensive respondent stated that tensions arise when teaching staff ‘double dip by counting teaching scholarship also as research.’ In contrast, teaching staff are frustrated that research into professional practice, such as teacher education, is not regarded as ‘real research.’ ‘Scholarship of teaching and learning (SoTL) research – does it count as research, teaching, or both? Can a person in a discipline be promoted on the basis of SoTL research as fulfilling
research criteria?’
12
Student evaluation was considered the most important criteria for assessing and rewarding teaching (82.5 per cent). This was followed by; contribution, evaluation and dissemination of teaching/disciplinary practices using a range of modes (e.g. institutional, national etc.) (71.3 per cent) > peer review of teaching (65.2 per cent) > pedagogical research (64.6 per cent) > more than 12hrs/week teaching contact hours (38.9 per cent). This result is interesting as some respondents stated that there is currently too much emphasis on the results of student evaluations for promotion, which are often considered as a popularity vote rather than a true measure of the quality of the teaching. Peer review of teaching was considered by many a more viable strategy to measure the quality of the teaching. ‘I worry that the use of student evaluations in a summative manner in promotion undermines the use of these formative tools for the lecturer/School. I feel that peer review is a much more
effective way of gauging teaching quality.’
The University’s participation in this self-review highlighted the need for explicit metrics for learning and teaching and that Heads of School require support for staff applying for promotion and performance management. Peer-Review Phase A peer-review workshop was held in November, 2012 at the University of Tasmania with key representatives from the four participating universities. The workshop included a discussion of institutional context statements, a structured discussion and comparison around the six performance indicators and a comparison of promotions statistics. It also identified key areas of good practice and areas for improvement across the four universities. The University of Wollongong’s Mix of Evidence Guide was identified as an area of good practice. Areas of improvement included the importance of embedding parity of esteem at Heads/Deans level, understanding how teaching is evidenced and the provision of institutional support to assist applicants to collect data on an informal/formal basis. The findings and key outcomes from both the self- and peer-review phases of this benchmarking project were paramount in the development of the Teaching Performance Expectations at the University of Tasmania. CONSULTATION PROCESS The development of the Teaching Performance Expectations also included an extensive consultation process involving key stakeholder groups, in particular academic staff, across the University during 2013, including institution-wide workshops at each of the three Tasmanian campuses, seven Deputy Vice Chancellor (Students and Education) Roadshows, email correspondence and a call-out for written formal submissions (19 of which were received). The major themes that arose from the consultation process with academic staff were: positive response for opportunity to provide feedback opportunity to focus performance in relation to learning and teaching welcomed
13
existing support through Student Evaluation, Review and Reporting Unit /Tasmanian Institute for Learning and Teaching recognised and more support required balancing the teaching expectations with the research expectations Teaching Scholar position needs to be articulated managing underperformance the need to differentiate requirements of teaching intensive staff from that of research intensive staff research supervision: where does it fit? RPEs or TPEs retention rates: difficult for academics to individually influence retention rates pass rates do not necessarily link with the quality of teaching the need to strengthen Level D and E in Domains 1 and 2 higher level appointments that undertake research as well as teach in their discipline areas have to engage in Domain 3 to improve the quality of the school/faculty learning and teaching.
These themes were addressed in the revision of the Framework. UNIVERSITY OF TASMANIA TEACHING PERFORMANCE EXPECTATIONS The development and implementation of the Teaching Performance Expectations has been approved by the Tasmania Social Sciences Human Research Ethics Committee (H0013899). These expectations have been informed by the work of Gunn and Fisk (2013), the key findings and outcomes from the international benchmarking project on promotion policies and processes and the extensive consultation process with the University’s academic staff. Dimension 2 in Gunn and Fisk’s teaching excellence taxonomy (2013) identifies the need for different domains to promote teaching excellence. The Teaching Performance Expectations are composed of three domains that have been closely aligned to the key goals in the 2012-2014 Strategic Plan for Learning and Teaching:
1) Excellence in student learning and teaching practice; 2) Excellence in contemporary curriculum design and engagement; and 3) Excellence in scholarly teaching (previously scholarship of teaching).
It should be noted that a key area of concern arising from the consultation process related to domain 3, in particular, the definition of the Scholarship of Teaching. As alluded to in the survey findings from the international benchmarking project, a tension exists between teaching-intensive and research-intensive staff about scholarly research not being considered ‘real research’ and how it could, in effect, lead to ‘double dipping by counting teaching scholarship also as research.’ In addition, feedback from academics with higher level appointments (Levels D & E) asked for clarification on what the scholarship of teaching entailed as they had already invested heavily in research. To ensure clarity, the domain was changed to ‘Scholarly Teaching’, which allows senior academics to engage both in their research as well as in domain 3 through improving the quality of the school/faculty learning and teaching but not undertaking pedagogical research. Another tension to arise in the consultation process was the need to balance the research and teaching expectations. Gunn and Fisk (2013, pp.48-49) argue that successful implementation of teaching expectations
14
‘depends on its capacity to demonstrate alignment with/integration of research excellence taxonomies and teaching quality processes’. Dimension 2 also identifies the need for structures and processes to support teaching excellence and reward and recognition. While the Teaching Performance Expectations in themselves provide a matrix to support teaching excellence, the University has also put in place nine organisational structures and processes to support these performance expectations since their implementation in 2012:
1) a Performance and Career Development process that includes training sessions for line managers and staff on career conversations; 2) Technology Enhanced Learning and Teaching Paper (TELT) White Paper that outlines a blended learning vision that encompasses high quality resources; high quality synchronous and asynchronous interaction and high impact learning experiences; 3) Professional Learning Circles for awards and grants; 4) Strategic Priority Grants with the Office for Learning and Teaching are now recognised as research on the Web Access Research Portal; 5) development of teaching focused academics, including Teaching Scholar; 6) institutional process for the peer review of teaching supported by the Tasmanian Institute of Learning and Teaching; 7) development of an institutional process and procedure and online moderation tool for external peer review of teaching through the Student Evaluation, Review and Reporting Unit; 8) development of course and unit review database to assist with monitoring course and teaching quality; and 9) development of 7 policies in course quality and learning and teaching evaluation to support institutional processes.
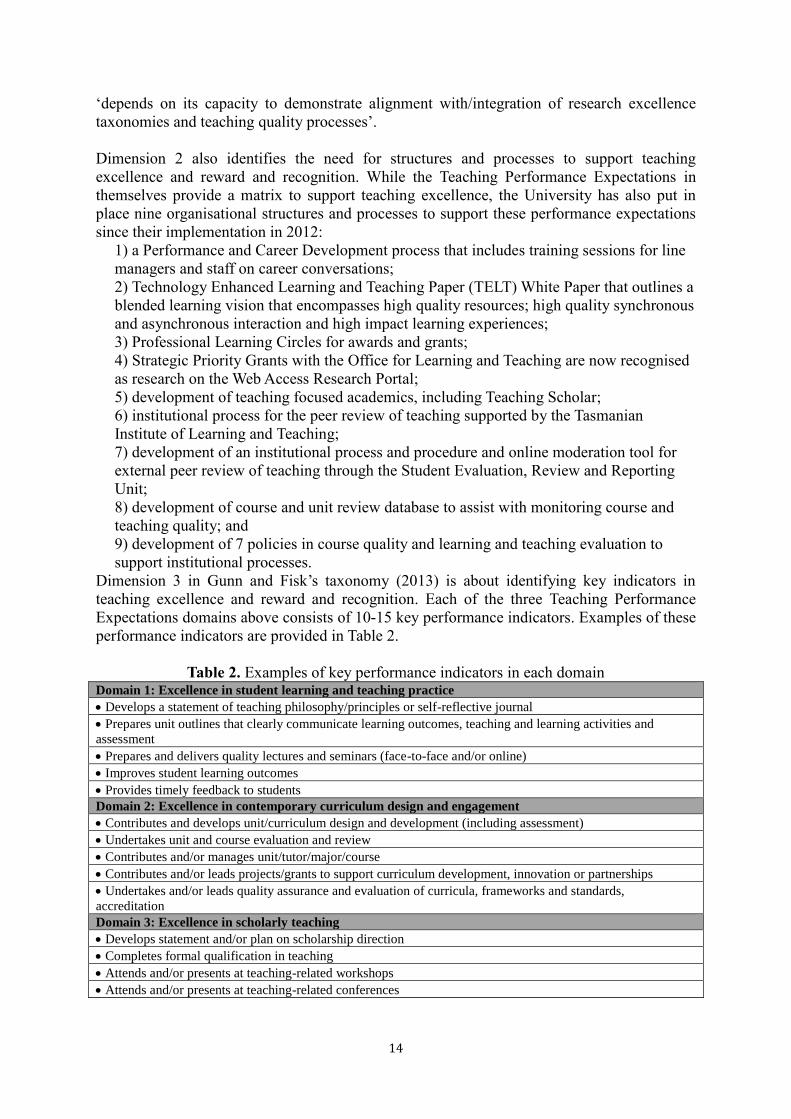
Dimension 3 in Gunn and Fisk’s taxonomy (2013) is about identifying key indicators in teaching excellence and reward and recognition. Each of the three Teaching Performance Expectations domains above consists of 10-15 key performance indicators. Examples of these performance indicators are provided in Table 2.
Table 2. Examples of key performance indicators in each domain Domain 1: Excellence in student learning and teaching practice Develops a statement of teaching philosophy/principles or self-reflective journal Prepares unit outlines that clearly communicate learning outcomes, teaching and learning activities and assessment Prepares and delivers quality lectures and seminars (face-to-face and/or online) Improves student learning outcomes Provides timely feedback to students Domain 2: Excellence in contemporary curriculum design and engagement Contributes and develops unit/curriculum design and development (including assessment) Undertakes unit and course evaluation and review Contributes and/or manages unit/tutor/major/course Contributes and/or leads projects/grants to support curriculum development, innovation or partnerships Undertakes and/or leads quality assurance and evaluation of curricula, frameworks and standards, accreditation Domain 3: Excellence in scholarly teaching Develops statement and/or plan on scholarship direction Completes formal qualification in teaching Attends and/or presents at teaching-related workshops Attends and/or presents at teaching-related conferences
15
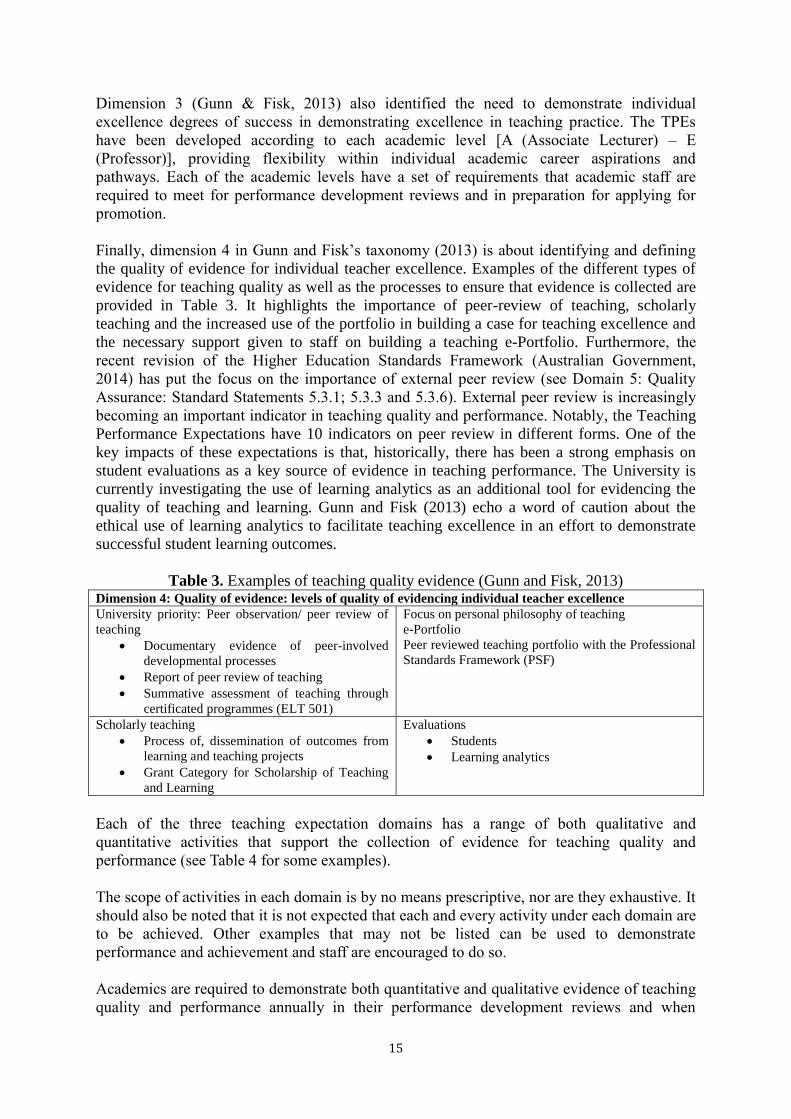
Dimension 3 (Gunn & Fisk, 2013) also identified the need to demonstrate individual excellence degrees of success in demonstrating excellence in teaching practice. The TPEs have been developed according to each academic level [A (Associate Lecturer) – E (Professor)], providing flexibility within individual academic career aspirations and pathways. Each of the academic levels have a set of requirements that academic staff are required to meet for performance development reviews and in preparation for applying for promotion. Finally, dimension 4 in Gunn and Fisk’s taxonomy (2013) is about identifying and defining the quality of evidence for individual teacher excellence. Examples of the different types of evidence for teaching quality as well as the processes to ensure that evidence is collected are provided in Table 3. It highlights the importance of peer-review of teaching, scholarly teaching and the increased use of the portfolio in building a case for teaching excellence and the necessary support given to staff on building a teaching e-Portfolio. Furthermore, the recent revision of the Higher Education Standards Framework (Australian Government, 2014) has put the focus on the importance of external peer review (see Domain 5: Quality Assurance: Standard Statements 5.3.1; 5.3.3 and 5.3.6). External peer review is increasingly becoming an important indicator in teaching quality and performance. Notably, the Teaching Performance Expectations have 10 indicators on peer review in different forms. One of the key impacts of these expectations is that, historically, there has been a strong emphasis on student evaluations as a key source of evidence in teaching performance. The University is currently investigating the use of learning analytics as an additional tool for evidencing the quality of teaching and learning. Gunn and Fisk (2013) echo a word of caution about the ethical use of learning analytics to facilitate teaching excellence in an effort to demonstrate successful student learning outcomes.
Table 3. Examples of teaching quality evidence (Gunn and Fisk, 2013) Dimension 4: Quality of evidence: levels of quality of evidencing individual teacher excellence University priority: Peer observation/ peer review of teaching Documentary evidence of peer-involved
developmental processes Report of peer review of teaching Summative assessment of teaching through certificated programmes (ELT 501)
Focus on personal philosophy of teaching e-Portfolio Peer reviewed teaching portfolio with the Professional Standards Framework (PSF)
Scholarly teaching Process of, dissemination of outcomes from learning and teaching projects Grant Category for Scholarship of Teaching and Learning
Evaluations Students Learning analytics
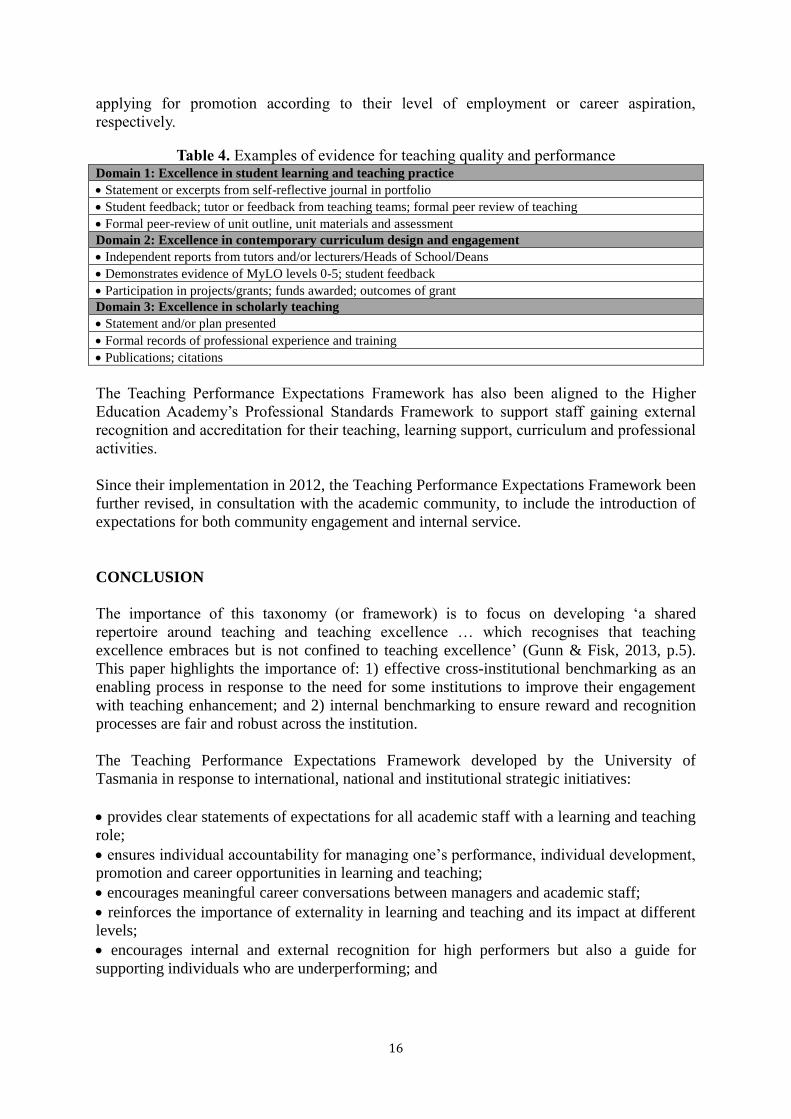
Each of the three teaching expectation domains has a range of both qualitative and quantitative activities that support the collection of evidence for teaching quality and performance (see Table 4 for some examples). The scope of activities in each domain is by no means prescriptive, nor are they exhaustive. It should also be noted that it is not expected that each and every activity under each domain are to be achieved. Other examples that may not be listed can be used to demonstrate performance and achievement and staff are encouraged to do so. Academics are required to demonstrate both quantitative and qualitative evidence of teaching quality and performance annually in their performance development reviews and when
16
applying for promotion according to their level of employment or career aspiration, respectively.
Table 4. Examples of evidence for teaching quality and performance Domain 1: Excellence in student learning and teaching practice Statement or excerpts from self-reflective journal in portfolio Student feedback; tutor or feedback from teaching teams; formal peer review of teaching Formal peer-review of unit outline, unit materials and assessment Domain 2: Excellence in contemporary curriculum design and engagement Independent reports from tutors and/or lecturers/Heads of School/Deans Demonstrates evidence of MyLO levels 0-5; student feedback Participation in projects/grants; funds awarded; outcomes of grant Domain 3: Excellence in scholarly teaching Statement and/or plan presented Formal records of professional experience and training Publications; citations The Teaching Performance Expectations Framework has also been aligned to the Higher Education Academy’s Professional Standards Framework to support staff gaining external recognition and accreditation for their teaching, learning support, curriculum and professional activities. Since their implementation in 2012, the Teaching Performance Expectations Framework been further revised, in consultation with the academic community, to include the introduction of expectations for both community engagement and internal service. CONCLUSION The importance of this taxonomy (or framework) is to focus on developing ‘a shared repertoire around teaching and teaching excellence … which recognises that teaching excellence embraces but is not confined to teaching excellence’ (Gunn & Fisk, 2013, p.5). This paper highlights the importance of: 1) effective cross-institutional benchmarking as an enabling process in response to the need for some institutions to improve their engagement with teaching enhancement; and 2) internal benchmarking to ensure reward and recognition processes are fair and robust across the institution. The Teaching Performance Expectations Framework developed by the University of Tasmania in response to international, national and institutional strategic initiatives: provides clear statements of expectations for all academic staff with a learning and teaching role; ensures individual accountability for managing one’s performance, individual development, promotion and career opportunities in learning and teaching; encourages meaningful career conversations between managers and academic staff; reinforces the importance of externality in learning and teaching and its impact at different levels; encourages internal and external recognition for high performers but also a guide for supporting individuals who are underperforming; and
17
encourages mentorship and peer-review across academic appointment levels to build capacity to maintain, improve and promote the high standards of learning and teaching at the University of Tasmania. The Framework has been slowly integrated into institutional processes across the University. Some of the unintended consequences of the Framework include increased numbers of staff submitting ethics applications to undertake research on their teaching practice; increased use of surveys to students and Senior Executive interest in tracking performance expectations in learning and teaching. There also has been an increased interest in developing the institutional architecture for learning and teaching data (through updating the Learning and Teaching Dashboard) to support teaching performance. An area of further development is how to develop processes to support staff who are achieving above the performance expectations as well as staff performing below expectations. Both nationally and internationally, the Teaching Performance Expectations Framework has been disseminated as an example of good practice through the Transforming Practice Programme (Crookes, 2013) involving 22 universities. Interestingly, the dissemination of the Framework through this Programme has uncovered similar challenges across universities in building frameworks for evidencing learning and teaching. This acknowledges Gunn and Fisk’s (2013) idea that the development of a taxonomy develops a ‘shared repertoire’ around teaching and teaching practice. ACKNOWLEDGEMENTS The authors would like to acknowledge the contributions from staff at the University of Tasmania towards the development of the Teaching Performance Expectations. They would also like to acknowledge the contributions from the universities of Leicester, Newcastle and Wollongong towards strengthening the range of teaching evidence. BIOGRAPHICAL NOTES Dr Sara Booth is head of the Student Evaluation, Review and Reporting Unit with expertise in policy, peer review, benchmarking and standards. Dr Cassandra Saunders is a researcher at the University of Tasmania whose primary area of interest is benchmarking and standards. REFERENCES Australian Government (2014). Proposed Higher Education Standards Framework. Retrieved from http://www.hestandards.gov.au/engagement/call-comment-number-3 Crookes, P. (2014). The OLT Transforming Practice Programme (TPP). Presented at UA Conference Satellite Event on Change Programmes, Canberra Conference Centre.
Cashmore, A., Cane, C., & Cane, R. (2013). Rebalancing promotion in the HE sector: Is teaching excellence being rewarded? London, UK: Higher Education Academy. Retrieved from
18
http://www.heacademy.ac.uk/assets/documents/resources/publications/HEA_Reward_Publication_RebalancingPromotion.pdf Cashmore, A., & Ramsden, P. (2009). Reward and recognition of teaching in higher education: Institutional policies and their implementation. London, UK: Higher Education Academy. Retrieved from http://www.heacademy.ac.uk/assets/documents/rewardandrecog/rewardandrecognition_2.pdf
Chalmers, D., Cummings, R., Elliot, S., Stoney, S., Tucker, B., Wicking, R., & Jorre de St Jorre, T. (2013). Australian university teaching criteria & standards framework. Office for Learning and Teaching Strategic Priority Project. Retrieved from http://uniteachingcriteria.edu.au/
Debowski, S. (2012). The new academic: A strategic handbook. Open University Press/McGraw-Hill, London. Retrieved from http://mcgraw-hill.co.uk/html/0335245358.html
Gunn, V., & Fisk, A. (2013). Considering teaching excellence in higher education: 2007-2013. London, UK: Higher Education Academy. Retrieved from http://www.heacademy.ac.uk/assets/documents/Teaching_Excellence/TELR-final.pdf
James, R., Baik, C., Krause, K.L., Sadler, D., Booth, S., Hughes-Warrington, M., Bexley, E., & Kennedy, G. (2013). Academic workforce 2020: framing a national agenda for professionalising university teaching. Office for Learning and Teaching Strategic Priority Project. Retrieved from http://www.cshe.unimelb.edu.au/research/policy_dev/acad_workforce.html
Stella, A. and Woodhouse, D. (2007). Benchmarking in Australian higher education: A thematic analysis of AUQA audit reports. Melbourne, VIC: Australian Universities Quality Agency. Retrieved from http://www.auqa.edu.au/qualityenhancement/publications/occasional/publications/ University of Tasmania (2013). Teaching performance expectations. Retrieved from http://www.utas.edu.au/provost/the-utas-academic-performance-expectations-for-academic-staff Wills, S., Cashmore, A., McHanwell, S., Robson, S., Cane, C., Brown, C., Sadler, D., & Booth, S. (2013). Promoting teaching: international inter-university benchmarking of academic promotion. Report for the Higher Education Academy.
19
RISE OF A MASSIVE ON-CAMPUS COURSE (MOCC)
Gregory Nash, Gail Crimmins, Janet Turley, Mary-Rose Adkins, Lee-anne Bye, Ann Robertson, Richard Bond & Florin Oprescu
University of the Sunshine Coast [email protected]
ABSTRACT Communication and Thought (COR109) is the first mandatory course at the University of the Sunshine Coast (USC). It experienced significant logistical challenges in the design of relevant, whole-of-institution content, the management of 60 teaching staff and faculty support, and the allocation of adequate space for both lectures and tutorials for the students. This paper discusses the challenges and solutions of COR109 in its inaugural semester. It discusses transition pedagogy, overviews the scale of COR109, and explains the management and communication structure of a massive on-campus course. As this is one of the first courses offered in an Australian university that is compulsory for all commencing students, the experience acquired may be useful for other institutions considering similar approaches. Key considerations for success include proper planning, creative logistics, pedagogically sound solutions and curriculum-integrated support for both students and staff. KEYWORDS First year course management; communication; professional development; timetabling; staff costing INTRODUCTION In semester one, 2014, Communication and Thought (COR109) became the first compulsory course (unit/subject) for all students enrolled in their first semester of study at the University of the Sunshine Coast (USC), regardless of their program of undergraduate study. The first semester offering had an enrolment of 2,415 students, which created significant logistical challenges in the design of relevant, whole-of-institution content, the management of 60 teaching staff and faculty support, and the allocation of adequate space for both lectures and tutorials for the students. Furthermore, the development of the course had to satisfy all relevant USC stakeholders. The processes of consultation and development of this massive on-campus course were conducted over a 13-month period and the result has been positively evaluated by students and staff with early indications suggesting it will not only achieve its set goals, but will also have unforeseen beneficial impacts on the student and staff experience. This paper discusses the implementation of COR109 as a massive on-campus course for first-year students and the relevant course management considerations. First, it discusses how transition pedagogy is used as a template for designing a course that provides broad-scale generic academic skills to improve the first-year experience of students. Second, it provides an overview of the scale of COR109 by discussing the locations the course is taught and the number of weekly lectures and tutorials involved. In particular, it discusses enrolment and
20
timetabling challenges and currently implemented solutions. Since student attendance was integral to the success of the course and given that the deputy vice-chancellor’s mandated that every student would be provided a place in a lecture, creating and maintaining a sustainable timetable was a priority. Finally, an explication of the course management, communication structure and professional development is provided, to offer an overview of how a course of this size can be managed and sustained. TRANSITION PEDAGOGY Transition pedagogy is an approach to student-centred teaching and learning that is based on a holistic approach to student engagement and learning at university. It is, more specifically, an approach to curriculum design and facilitation that incorporates all university support systems and processes, including academic, study skill, counselling, library and career support. COR109 was designed and facilitated with transition pedagogy so that it may provide the optimal vehicle for dealing with increasingly diverse student cohorts, many of whom are likely to need extra support with transition into higher education, by facilitating a sense of engagement, support and belonging (Kift et al., 2010). In line with transition pedagogy is the view that personal, social and academic competences of students have to be addressed by institutional-wide and integrated support facilities (Reason et al., 2007). Addressing these competencies cannot be left to chance; instead, concerted efforts should be made to ‘actively integrate students into the university community’ (Krause, 2001, p. 149). Institution-wide integration addresses what McInnis identifies as the challenge of ‘bridging the gaps between academic, administrative and support programs’ (McInnis, 2003, p. 13). This approach aligns with the findings of Kift et al. (2010) that a mature approach to an effective cross-institutional first year in higher education is to embed engagement and support facilities and experiences into the curriculum. The curriculum design of COR109, therefore attempted to integrate institution-wide support facilities, hitherto described as discrete, siloed organisations (McInnis, 2003), into a coordinated and holistic curriculum. This broad conceptualisation of the curriculum aims to encompass the ‘totality of the undergraduate student experience of, and engagement with, their new program of tertiary study’ (Kift, 2009, p. 9), through focussing holistically on the ‘educational conditions in which we place students’ (Tinto, 2009, p. 2). A coordinated and holistic curriculum design for a massive course is important to consider for a number of reasons. First, the approach to course management and delivery should be based on a whole of institution approach supported by literature. Second, there were numerous environmental challenges and solutions identified as part of the course planning process and delivery. Third, in order to deliver a massive course, appropriate and strategic support must be provided to both students and staff as part of the curriculum implementation. Incorporating transition pedagogy strategies The following specific strategies reflect how COR109 is founded on transition pedagogy and is designed to transcend ‘the silos of academic, administrative and support areas’ (McInnis, 2003). Strategy 1: COR109 is offered to all students, regardless of faculty or program of study.
21
Strategy 2: COR109 offers tutorials in week one, as opposed to only offering a lecture in week one with tutorials starting in week two. Through the use of icebreaker activities, this affords students an early opportunity to connect with peers and tutors, thus fostering a sense of connectedness, which is a key component of success at university (Lizzio & Wilson, 2010).
Strategy 3: In both the lecture and tutorial in the first week, the key predictors of success at university (Wilson & Lizzio, 2008) are shown and discussed, so that students know what they can do, and what support facilities the university offers in order to provide them with the greatest chance of success.
Strategy 4: In addition to introducing students to these normative accounts of predictors of success, tutorials also provide opportunities for tutors and students to discuss how strategies for success can be best incorporated into the lived experience of individual students. For example, a time management activity in week one raises awareness of the work, family and other non-study commitments of individual students and facilitates discussion on how such commitments might be managed. It also provides tutors with an opportunity to introduce students to the financial and counselling support services available to students for advice and assistance in these areas.
The belief in the need for tutors to appreciate who students are and ‘how they identify themselves’ (Gale, 2012, p. 251) is also reflected in the flexible approach to assessment, with students able to approach their own tutor to negotiate extensions and resubmissions rather than follow more formal avenues. Such an approach recognises that for students from under-represented or marginalised backgrounds, the university curriculum constitutes ‘a challenge to one’s identity and a threat to familiar ways of knowing and doing’ (Krause, 2006, p. 1). In order to provide a sense of inclusivity, students are also exposed to the personalised accounts of the trajectories of successful students and staff, including those from traditionally marginalised backgrounds.
Strategy 5: COR109 integrates library support in a number of ways. Library staff members attend every lecture in week two to introduce themselves and put a face to library support services and resources, which include workshops and a support desk where students can ask questions and request assistance in carrying out basic library search strategies. Drop-in library support is also offered at strategically placed times throughout the semester, such as in the weeks before COR109 assessments are due.
Online library tutorials, called ‘captivates’, are strategically imbedded into lectures and tutorials as ‘just in time’ resources. For example, during the week that students are required to search for specific literature to support their assessment development, a library-developed captivate is integrated into the tutorial, and a library based workshop related to the activity is designed and advertised in tutorial. Several captivates are integrated within COR109’s curriculum design such as ‘How to locate a journal article’, ‘How to read a research paper for purpose’, and ‘How to extrapolate information from a peer reviewed source’. Finally, one of the course co-coordinators has almost 20 years experience as a librarian, and therefore brings professional librarian skills to support the development of the course materials within COR109 and ensures full integration of library support staff and systems into the course through regular liaison.
22
Strategy 6: COR109 integrates careers support and staff into the curriculum by inviting Careers Support staff to attend at least one lecture per semester, making manifest how work-readiness graduate attributes are developed within the course and discussing the assistance Careers Support can offer students in identifying career goals and opportunities. The rationale for integrating careers advice and support, and imbedding graduate attributes into a first-year foundational course such as COR109, is based on research by Lizzio and Wilson (2010). They identified that without a sense of purpose students often fail to develop the necessary persistence required to overcome academic difficulty or failure, and specifically note that ‘A sense of purpose or fit is fundamentally a subjective and experiential process. For example, it doesn’t matter that objectively a degree will eventually deliver the vocational outcomes that a student may desire, if they don’t think or feel that it will right now, because they are less likely to stay to find out later’ (Lizzio & Wilson, 2010, pp. 3-4).
As Ecclestone (2009) points out, university study is a time of preparation for ‘becoming somebody’, and this is also recognised by a major assessment item in COR109 in which students have to research interpersonal communication skills and analyse the benefits of the application of these skills in their particular discipline or field. Strategy 7: COR109 also incorporates study skills diagnostics into the course curriculum. Within the course, students are given the opportunity to take an online diagnostic test – as part of an assessment item - based on academic skills of writing (grammar, sentence construction, formal writing conventions). If students fail to identify or create correct responses to test questions they are directed to specific study skill support resources, workshops and consultations. This diagnostic is delivered in week two to offer students early access to study skill support. As a follow up, within the week four tutorial, prior to a major piece of written assessment, students are asked to write a paragraph on a given topic. The paragraphs are also used as a diagnostic tool of academic writing skill and are assessed in terms of spelling, grammar and sentence construction, use of academic voice and paragraph structure. Students who fail the task are referred to work with academic skills support advisers.
Finally, specific study skills support workshops are designed and facilitated by study skills professionals to correspond with COR109 assessment tasks in a ‘just in time’ schedule. For example, if COR109 students are required to submit an argumentative essay in week nine, study skills workshops on writing essays are offered within weeks seven and eight. This particular integration of study skills support is based on research by Shah et al. (2011) that there is an increased number of students enrolled into universities who may be unprepared for tertiary education. COURSE MANAGEMENT: LOCATIONS, ENROLMENT, TIMETABLING AND SPACE REQUIREMENTS COR109 was conducted over the 13 teaching weeks of the semester across three campuses. To ensure a quality experience for all students, tutorial classes were capped at 20 students meaning that 142 weekly tutorials had to be scheduled into the USC timetable. Further, in order to allocate all students a seat in the scheduled lectures and account for three campus locations, 17 lectures per week needed to be scheduled (lecturers were also recorded for online viewing). The logistics involved with these numbers caused enormous challenges for
23
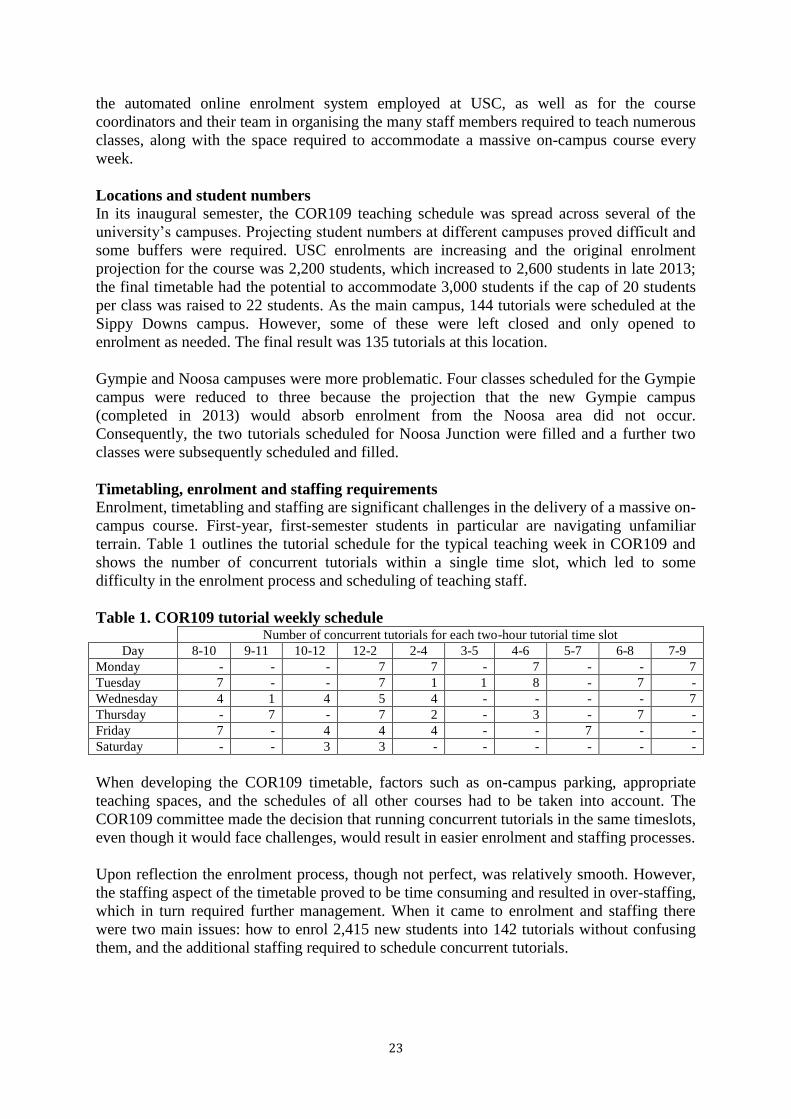
the automated online enrolment system employed at USC, as well as for the course coordinators and their team in organising the many staff members required to teach numerous classes, along with the space required to accommodate a massive on-campus course every week. Locations and student numbers In its inaugural semester, the COR109 teaching schedule was spread across several of the university’s campuses. Projecting student numbers at different campuses proved difficult and some buffers were required. USC enrolments are increasing and the original enrolment projection for the course was 2,200 students, which increased to 2,600 students in late 2013; the final timetable had the potential to accommodate 3,000 students if the cap of 20 students per class was raised to 22 students. As the main campus, 144 tutorials were scheduled at the Sippy Downs campus. However, some of these were left closed and only opened to enrolment as needed. The final result was 135 tutorials at this location. Gympie and Noosa campuses were more problematic. Four classes scheduled for the Gympie campus were reduced to three because the projection that the new Gympie campus (completed in 2013) would absorb enrolment from the Noosa area did not occur. Consequently, the two tutorials scheduled for Noosa Junction were filled and a further two classes were subsequently scheduled and filled. Timetabling, enrolment and staffing requirements Enrolment, timetabling and staffing are significant challenges in the delivery of a massive on-campus course. First-year, first-semester students in particular are navigating unfamiliar terrain. Table 1 outlines the tutorial schedule for the typical teaching week in COR109 and shows the number of concurrent tutorials within a single time slot, which led to some difficulty in the enrolment process and scheduling of teaching staff. Table 1. COR109 tutorial weekly schedule Number of concurrent tutorials for each two-hour tutorial time slot
Day 8-10 9-11 10-12 12-2 2-4 3-5 4-6 5-7 6-8 7-9 Monday - - - 7 7 - 7 - - 7 Tuesday 7 - - 7 1 1 8 - 7 - Wednesday 4 1 4 5 4 - - - - 7 Thursday - 7 - 7 2 - 3 - 7 - Friday 7 - 4 4 4 - - 7 - - Saturday - - 3 3 - - - - - - When developing the COR109 timetable, factors such as on-campus parking, appropriate teaching spaces, and the schedules of all other courses had to be taken into account. The COR109 committee made the decision that running concurrent tutorials in the same timeslots, even though it would face challenges, would result in easier enrolment and staffing processes. Upon reflection the enrolment process, though not perfect, was relatively smooth. However, the staffing aspect of the timetable proved to be time consuming and resulted in over-staffing, which in turn required further management. When it came to enrolment and staffing there were two main issues: how to enrol 2,415 new students into 142 tutorials without confusing them, and the additional staffing required to schedule concurrent tutorials.

24
COURSE MANAGEMENT: STUDENT ENROLMENT PROCESS The logistical challenge of enrolling 2,415 students into 142 tutorials was addressed well in advance of the semester’s beginning. USC has an online enrolment process where students would normally log-in to ‘USC Central’ through the university website and enrol themselves in a course by selecting a lecture and tutorial number. The initial problem for COR109 was the capacity for USC Central to function correctly with so many scheduled tutorials, and secondly the student confusion that may result from so many enrolment options. This problem was addressed through providing a single ‘shell’ per timeslot for students to enrol in. For example, if a student wanted to enrol in the Monday 7.00 pm – 9.00 pm timeslot there would be one tutorial code for this timeslot. Within this shell there would be 140 places (7 tutorials x 20 students = 140 places) and as soon as the places were filled the shell would become unavailable for further enrolment in the same way that a full class would become unavailable for any other course. The next step in this process was to divide students within these shells into classes of 20 and allocate a room to each of the separate tutorials. This was done in orientation week and students were notified through email, an announcement on Blackboard, and an updated student schedule through USC Central. This simplified the process, according to informal student feedback, and was not confusing. COURSE MANAGEMENT: STAFFING PROCESS The initial idea for scheduling up to seven tutorials in a single timeslot was based on previous successful experience with scheduling concurrent tutorial within a large first-year course. The intention was to have seven tutors teaching the concurrent two-hour tutorials in four- or six-hour blocks. The benefits of this timetabling strategy were two-fold: in limiting the number of staff employed this would provide our sessional staff with a greater (and reasonable) amount of work hours, while also limiting the staffing cost overall. This is because the sessional pay rate for the first tutorial is $116.07 and for repeat tutorials is $77.38, therefore the cost for every extra sessional staff member employed, (extra first tutorial every week amounting to $1,005.94/staff member) would have been quite significant over the semester. One issue that was not anticipated during planning was the inability to always have access to seven tutorial rooms in concurrent time slots. Significant gaps between time slots were left where rooms were not available (Table 2 provides an example). Table 2. COR109 staff scheduling example – Fridays Concurrent tutorial 8-10 10-12 12-2 2-4 6-8 Tutorial 1 Tutor 1 Tutor 1 Tutor 1 Tutor 8 Tutor 8 Tutorial 2 Tutor 2 Tutor 2 Tutor 2 Tutor 9 Tutor 9 Tutorial 3 Tutor 3 Tutor 3 Tutor 3 Tutor 10 Tutor 10 Tutorial 4 Tutor 4 Tutor 4 Tutor 4 Tutor 11 Tutor 11 Tutorial 5 Tutor 5 Tutor 12 Tutorial 6 Tutor 6 Tutor 13 Tutorial 7 Tutor 7 Tutor 14 Sessional staff were generally unwilling to agree to such a large gap between their teaching commitments, and so this required three extra teaching staff to cover either the early or late
25
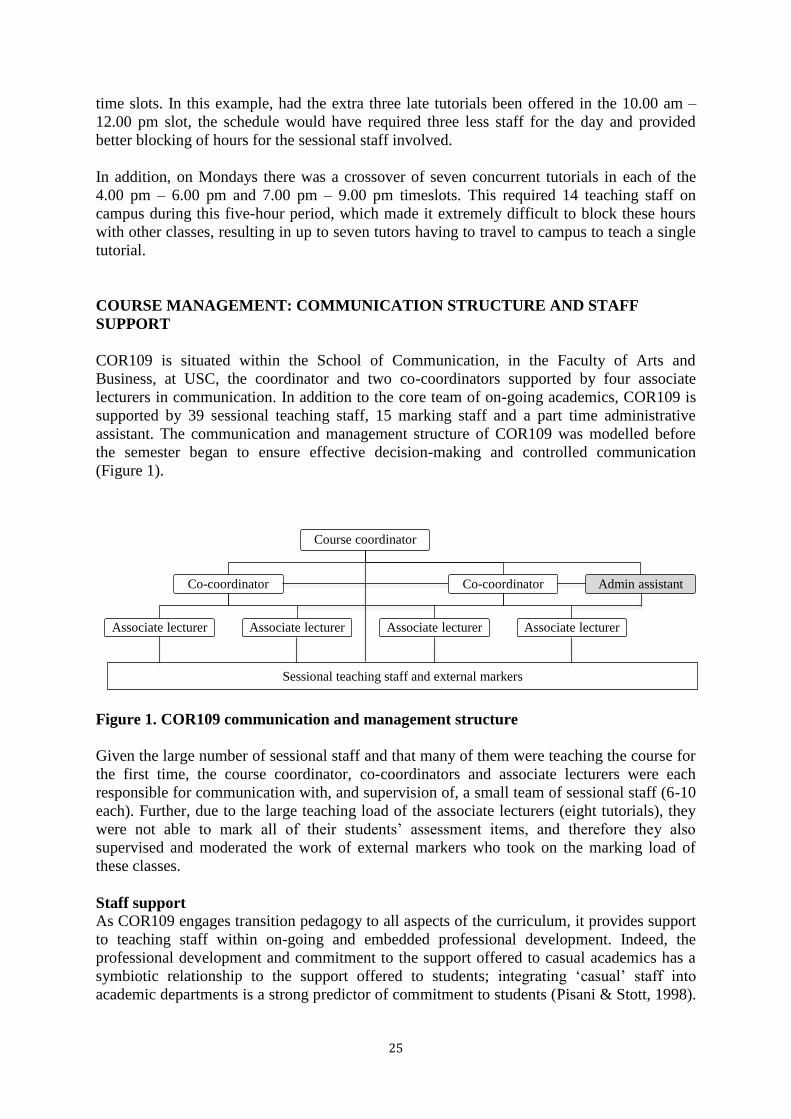
time slots. In this example, had the extra three late tutorials been offered in the 10.00 am – 12.00 pm slot, the schedule would have required three less staff for the day and provided better blocking of hours for the sessional staff involved. In addition, on Mondays there was a crossover of seven concurrent tutorials in each of the 4.00 pm – 6.00 pm and 7.00 pm – 9.00 pm timeslots. This required 14 teaching staff on campus during this five-hour period, which made it extremely difficult to block these hours with other classes, resulting in up to seven tutors having to travel to campus to teach a single tutorial. COURSE MANAGEMENT: COMMUNICATION STRUCTURE AND STAFF SUPPORT COR109 is situated within the School of Communication, in the Faculty of Arts and Business, at USC, the coordinator and two co-coordinators supported by four associate lecturers in communication. In addition to the core team of on-going academics, COR109 is supported by 39 sessional teaching staff, 15 marking staff and a part time administrative assistant. The communication and management structure of COR109 was modelled before the semester began to ensure effective decision-making and controlled communication (Figure 1).
Figure 1. COR109 communication and management structure Given the large number of sessional staff and that many of them were teaching the course for the first time, the course coordinator, co-coordinators and associate lecturers were each responsible for communication with, and supervision of, a small team of sessional staff (6-10 each). Further, due to the large teaching load of the associate lecturers (eight tutorials), they were not able to mark all of their students’ assessment items, and therefore they also supervised and moderated the work of external markers who took on the marking load of these classes. Staff support As COR109 engages transition pedagogy to all aspects of the curriculum, it provides support to teaching staff within on-going and embedded professional development. Indeed, the professional development and commitment to the support offered to casual academics has a symbiotic relationship to the support offered to students; integrating ‘casual’ staff into academic departments is a strong predictor of commitment to students (Pisani & Stott, 1998).
Course coordinator
Co-coordinator
Associate lecturer Associate lecturer
Co-coordinator
Associate lecturer Associate lecturer
Admin assistant
Sessional teaching staff and external markers
26
Thus, if we want first-year students to be nurtured and supported through their transition to university, then sessional staff that support students need nurturing as well. The embedded nature of the in-situ, semester-long professional development offered to sessional teaching staff Given that sessional staff are at the coalface of the student learning experience, with 80 per cent of undergraduate teaching undertaken by sessional staff (Percy et al., 2008), it is this group that requires most support in engaging students with their holistic transition. Yet over twenty years of research into how sessional staff feel about their integration into academia and professional development/support creates a sustained narrative of feelings of marginalisation, lack of professional development and growing discontent (Junor, 2004; Ryan et al., 2013). As a result of this narrative, and the notion that support for sessional staff extends into support for student learning and engagement (Pisani & Stott, 1998), specific measures to integrate and provide professional development support for sessional staff are employed within COR109. The RED Report (Percy, et al., 2008) commissioned by DEEWR, recommended regular and appropriate academic development opportunities for sessional staff in Australian universities. However, in 2013 Ryan et al. identified that the majority of sessional staff still feel that they do not receive regular, sufficient or appropriate academic development. Sessional staff perceptions of a lack of appropriate academic development may be in some part due to an over-reliance on generic, centrally organised, short academic development courses designed for both on-going and causal staff. For example, in a report commissioned by New Zealand’s Ministry of Education, Prebble et al. (2004) identified that short training courses are unlikely to lead to significant change in teaching behaviour or student outcomes, as they tend to be most effective when used to disseminate information about institutional policy and practice or to train staff in discrete skills and techniques. Instead of recommending the use of generic short courses, Prebble et al. (2004), who examined 150 research articles on the impact of academic development programmes on students’ academic success and programme completion, recommended that the academic work group is usually the most effective context for developing the pedagogical content knowledge required in higher education teaching. Subsequently, in-situ academic development is identified as a more appropriate and effective ‘locus’ for academic development, also offering greater opportunity for impacting positively upon teachers’ understanding and employment of discipline-specific good teaching practice. It was found, perhaps axiomatically, that the main objective of academic development is to help academic staff become more effective at their jobs. A model of academic development that challenges academics to focus on those jobs is likely to be more effective than one that attempts to separate the two. In addition, academics work within disciplines, or shared systems of organisation, so significant changes of work practices are only likely to take place when an entire work group is committed to the change. Finally, in-situ, discipline-specific academic development that is context-bound is supported by Knight and Trowler (2000) and Ramsden (1998). Therefore, the transition pedagogy offered to students is extended to sessional teachers in the shape of semester-long, in-situ professional development designed to develop discipline-specific, pedagogic content knowledge and academic self-confidence, and build positive
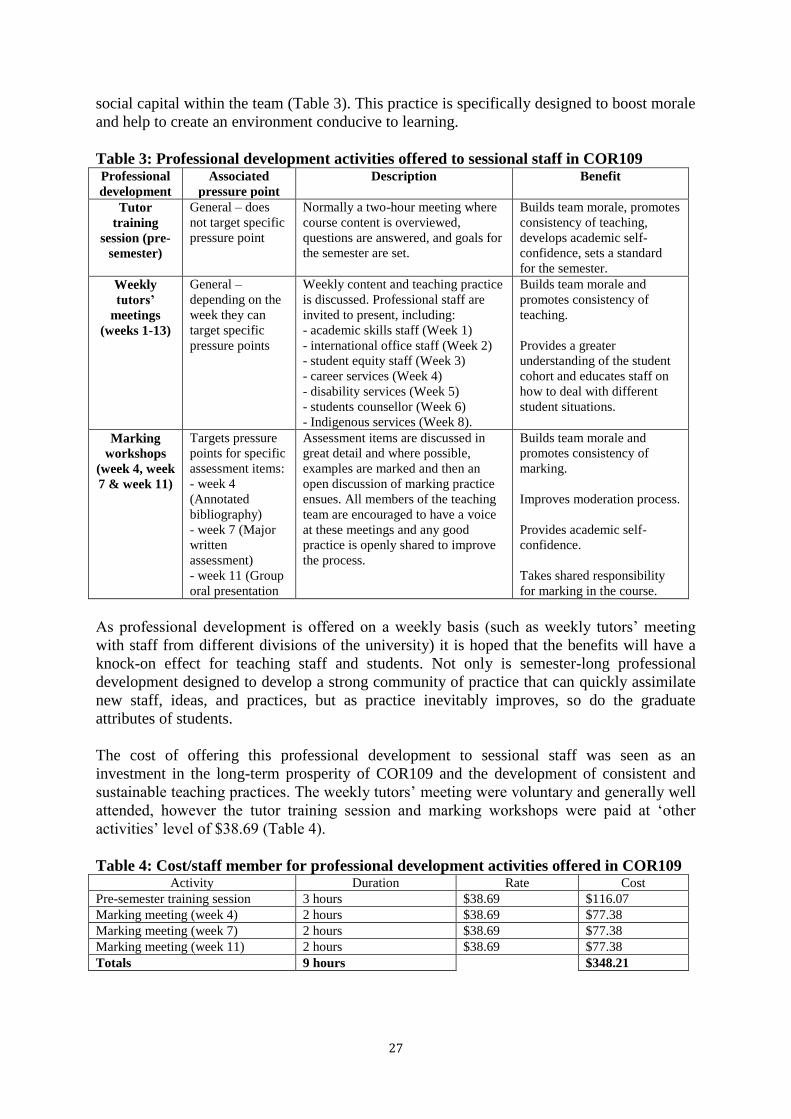
27
social capital within the team (Table 3). This practice is specifically designed to boost morale and help to create an environment conducive to learning. Table 3: Professional development activities offered to sessional staff in COR109 Professional development
Associated pressure point
Description Benefit
Tutor training
session (pre-semester)
General – does not target specific pressure point
Normally a two-hour meeting where course content is overviewed, questions are answered, and goals for the semester are set.
Builds team morale, promotes consistency of teaching, develops academic self-confidence, sets a standard for the semester.
Weekly tutors’
meetings (weeks 1-13)
General – depending on the week they can target specific pressure points
Weekly content and teaching practice is discussed. Professional staff are invited to present, including: - academic skills staff (Week 1) - international office staff (Week 2) - student equity staff (Week 3) - career services (Week 4) - disability services (Week 5) - students counsellor (Week 6) - Indigenous services (Week 8).
Builds team morale and promotes consistency of teaching. Provides a greater understanding of the student cohort and educates staff on how to deal with different student situations.
Marking workshops
(week 4, week 7 & week 11)
Targets pressure points for specific assessment items: - week 4 (Annotated bibliography) - week 7 (Major written assessment) - week 11 (Group oral presentation
Assessment items are discussed in great detail and where possible, examples are marked and then an open discussion of marking practice ensues. All members of the teaching team are encouraged to have a voice at these meetings and any good practice is openly shared to improve the process.
Builds team morale and promotes consistency of marking. Improves moderation process. Provides academic self-confidence. Takes shared responsibility for marking in the course.
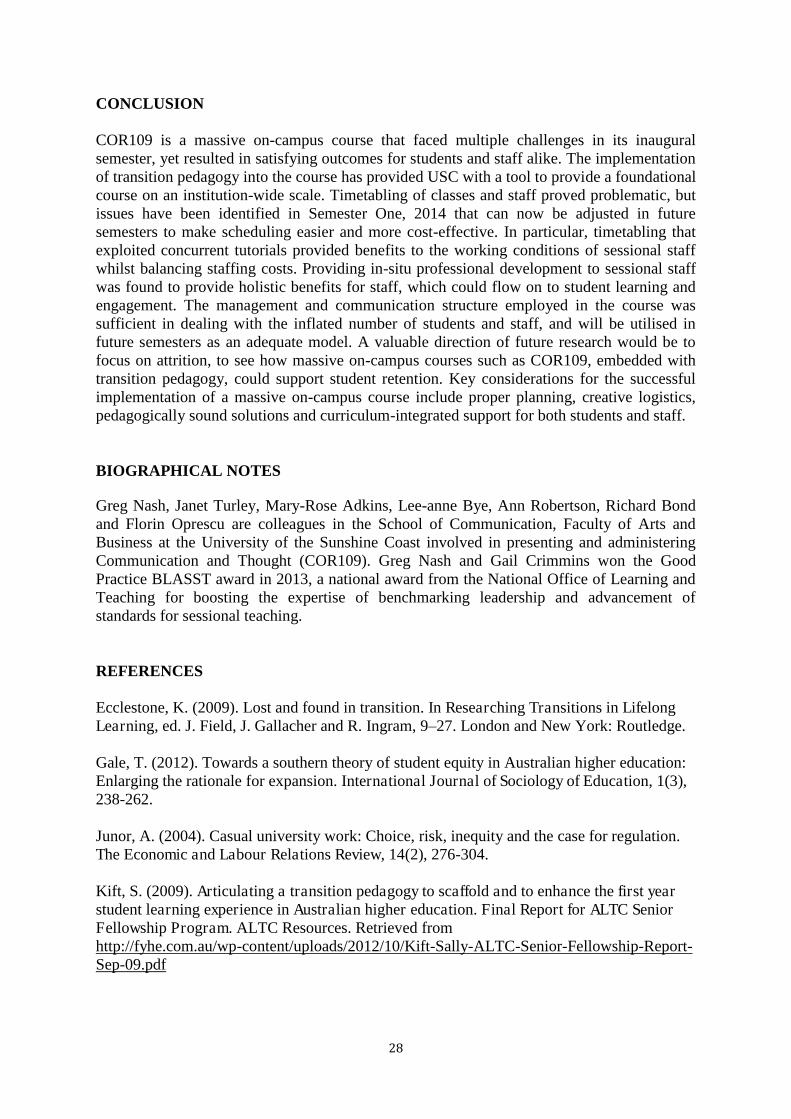
As professional development is offered on a weekly basis (such as weekly tutors’ meeting with staff from different divisions of the university) it is hoped that the benefits will have a knock-on effect for teaching staff and students. Not only is semester-long professional development designed to develop a strong community of practice that can quickly assimilate new staff, ideas, and practices, but as practice inevitably improves, so do the graduate attributes of students. The cost of offering this professional development to sessional staff was seen as an investment in the long-term prosperity of COR109 and the development of consistent and sustainable teaching practices. The weekly tutors’ meeting were voluntary and generally well attended, however the tutor training session and marking workshops were paid at ‘other activities’ level of $38.69 (Table 4). Table 4: Cost/staff member for professional development activities offered in COR109
Activity Duration Rate Cost Pre-semester training session 3 hours $38.69 $116.07 Marking meeting (week 4) 2 hours $38.69 $77.38 Marking meeting (week 7) 2 hours $38.69 $77.38 Marking meeting (week 11) 2 hours $38.69 $77.38 Totals 9 hours $348.21
28
CONCLUSION COR109 is a massive on-campus course that faced multiple challenges in its inaugural semester, yet resulted in satisfying outcomes for students and staff alike. The implementation of transition pedagogy into the course has provided USC with a tool to provide a foundational course on an institution-wide scale. Timetabling of classes and staff proved problematic, but issues have been identified in Semester One, 2014 that can now be adjusted in future semesters to make scheduling easier and more cost-effective. In particular, timetabling that exploited concurrent tutorials provided benefits to the working conditions of sessional staff whilst balancing staffing costs. Providing in-situ professional development to sessional staff was found to provide holistic benefits for staff, which could flow on to student learning and engagement. The management and communication structure employed in the course was sufficient in dealing with the inflated number of students and staff, and will be utilised in future semesters as an adequate model. A valuable direction of future research would be to focus on attrition, to see how massive on-campus courses such as COR109, embedded with transition pedagogy, could support student retention. Key considerations for the successful implementation of a massive on-campus course include proper planning, creative logistics, pedagogically sound solutions and curriculum-integrated support for both students and staff. BIOGRAPHICAL NOTES
Greg Nash, Janet Turley, Mary-Rose Adkins, Lee-anne Bye, Ann Robertson, Richard Bond and Florin Oprescu are colleagues in the School of Communication, Faculty of Arts and Business at the University of the Sunshine Coast involved in presenting and administering Communication and Thought (COR109). Greg Nash and Gail Crimmins won the Good Practice BLASST award in 2013, a national award from the National Office of Learning and Teaching for boosting the expertise of benchmarking leadership and advancement of standards for sessional teaching. REFERENCES Ecclestone, K. (2009). Lost and found in transition. In Researching Transitions in Lifelong Learning, ed. J. Field, J. Gallacher and R. Ingram, 9–27. London and New York: Routledge. Gale, T. (2012). Towards a southern theory of student equity in Australian higher education: Enlarging the rationale for expansion. International Journal of Sociology of Education, 1(3), 238-262. Junor, A. (2004). Casual university work: Choice, risk, inequity and the case for regulation. The Economic and Labour Relations Review, 14(2), 276-304. Kift, S. (2009). Articulating a transition pedagogy to scaffold and to enhance the first year student learning experience in Australian higher education. Final Report for ALTC Senior Fellowship Program. ALTC Resources. Retrieved from http://fyhe.com.au/wp-content/uploads/2012/10/Kift-Sally-ALTC-Senior-Fellowship-Report-Sep-09.pdf
29
Kift, S., Nelson, K., & Clarke, J. (2010). Transition pedagogy: A third generation approach to FYE: a case study of policy and practice for the higher education sector. The International Journal of the First Year in Higher Education, 1(1), 1-20. Krause, K-L. (2001). The university essay writing experience: A pathway for academic integration during transition. Higher Education Research & Development, 20(2), 147-168. Krause, K. (2006). Accommodating diverse approaches to student engagement. Keynote paper presented at New Zealand Quality Enhancement Meeting 11, 28-29 September 2006, Wellington, New Zealand. Lizzio, A., & Wilson, K. (2010). Strengthening commencing students’ sense of purpose: integrating theory and practice. Paper prested at the 13th Pacific Rim First Year in Higher Education Conference. Adelaide, Australia. Retrieved from http://www.fyhe.com.au/past_papers/papers10/content/pdf/12D.pdf McInnis, C. (2003). From marginal to mainstream strategies: Responding to student diversity in Australian universities. European Journal of Education 38(4), 387-400. Percy, A., Scoufis, M., Parry, S., Goody, A., & Hicks, M. (2008). The RED report: The contribution of sessional teachers to higher education. The Australian Learning and Teaching Council. Retried from: http://www.cadad.edu.au/file.php/1/RED/docs/red_report.pdf Pisani, A., & Stott, N. (1998). An investigation of part-time faculty commitment to developmental advising. Research in Higher Education, 39(2), 121-142. Prebble, T., Hargreaves, H., Leach, L., Naidoo, K., Suddaby, G., & Zepke, N. (2004). Impact of student support services and academic development programmes on student outcomes in undergraduate tertiary study: a synthesis of the research. Ministry of Education, New Zealand. Retrieved from: http://www.minedu.govt.nz/ Ramsden, P. (1998). Learning to lead in higher education. London: Routledge. Reason, R., Terenzini, P., & Domingo, R. (2007). Developing social and personal competence in the first year of college. The Review of Higher Education 30(3), 271-299. Ryan, S., Burgess, J., Connell, J., & Groen, E. (2013). Casual academic staff in an Australian university: Marginalised and excluded. Tertiary Education and Management, 19(2), 161-175. Shah, M., Lewis, I., & Fitzgerald, R. (2011). The renewal of quality assurance in Australian higher education: The challenge of balancing academic rigor, equity and quality outcomes. Quality in Higher Education, 17(3), 265-278. Tinto, V. (2009). Taking student retention seriously: rethinking the first year of university. Paper presented at the FYE Curriculum Design Symposium 2009. Brisbane, Australia. Retrieved from: http://www.fyecd2009.qut.edu.au/resources/SPE_VincentTinto_5Feb09.pdf Trowler, P., & Knight, P. (2000). Coming to know in higher education: Theorising faculty entry into new work contexts. Higher Education Research and Development, 19(1), 27–42.

30
Wilson, K. & Lizzio, A. (2008). A ‘just in time intervention’ to support the academic efficacy of at-risk first year students. Paper presented at the 11th FYE Pacific Rim Conference. Hobart, Australia. Retrieved from: http://www.fyhe.com.au/past_papers/papers10/content/pdf/4B.pdf
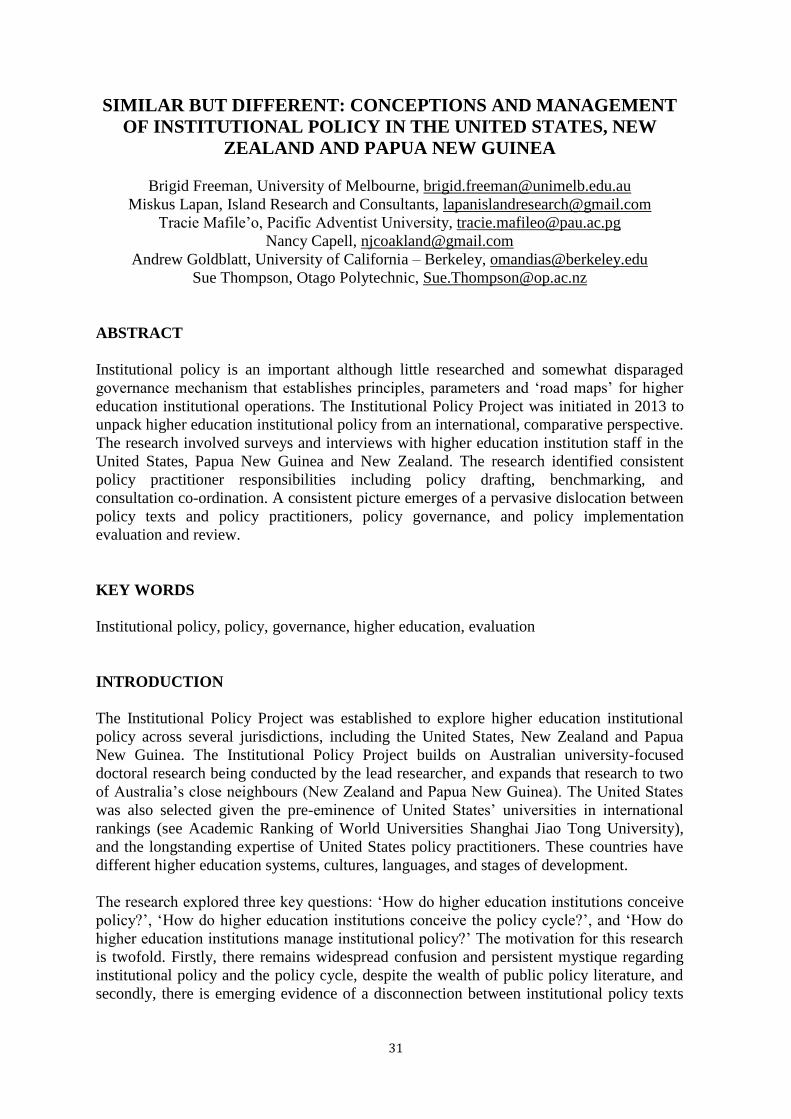
31
SIMILAR BUT DIFFERENT: CONCEPTIONS AND MANAGEMENT OF INSTITUTIONAL POLICY IN THE UNITED STATES, NEW
ZEALAND AND PAPUA NEW GUINEA
Brigid Freeman, University of Melbourne, [email protected] Miskus Lapan, Island Research and Consultants, [email protected]
Tracie Mafile’o, Pacific Adventist University, [email protected] Nancy Capell, [email protected]
Andrew Goldblatt, University of California – Berkeley, [email protected] Sue Thompson, Otago Polytechnic, [email protected]
ABSTRACT Institutional policy is an important although little researched and somewhat disparaged governance mechanism that establishes principles, parameters and ‘road maps’ for higher education institutional operations. The Institutional Policy Project was initiated in 2013 to unpack higher education institutional policy from an international, comparative perspective. The research involved surveys and interviews with higher education institution staff in the United States, Papua New Guinea and New Zealand. The research identified consistent policy practitioner responsibilities including policy drafting, benchmarking, and consultation co-ordination. A consistent picture emerges of a pervasive dislocation between policy texts and policy practitioners, policy governance, and policy implementation evaluation and review. KEY WORDS Institutional policy, policy, governance, higher education, evaluation INTRODUCTION The Institutional Policy Project was established to explore higher education institutional policy across several jurisdictions, including the United States, New Zealand and Papua New Guinea. The Institutional Policy Project builds on Australian university-focused doctoral research being conducted by the lead researcher, and expands that research to two of Australia’s close neighbours (New Zealand and Papua New Guinea). The United States was also selected given the pre-eminence of United States’ universities in international rankings (see Academic Ranking of World Universities Shanghai Jiao Tong University), and the longstanding expertise of United States policy practitioners. These countries have different higher education systems, cultures, languages, and stages of development. The research explored three key questions: ‘How do higher education institutions conceive policy?’, ‘How do higher education institutions conceive the policy cycle?’, and ‘How do higher education institutions manage institutional policy?’ The motivation for this research is twofold. Firstly, there remains widespread confusion and persistent mystique regarding institutional policy and the policy cycle, despite the wealth of public policy literature, and secondly, there is emerging evidence of a disconnection between institutional policy texts
32
and institutional policy implementation manifest in institutional practices (Freeman, Kelder & Brown, 2013). The Institutional Policy Project explored institutional policy infrastructure, including meta-policy (‘policy on policy’) (Dror, 1971), policy instruments, dedicated human resources and repositories, and characteristics of policy developers. The research also considered the current and potential congruence between policy and other organisational functions, such as compliance, audit, quality, risk, strategy and budget, and delegations of authority. The relationship between conceptions of policy, the policy cycle, and implementation can be described as follows: how institutions conceive policy influences how they develop policy; how institutions develop policy influences how they subsequently manage and implement policy. Finally, the extent to which and the manner in which institutional policy is managed, implemented, evaluated and reviewed influences institutional practices and outcomes. METHOD The Institutional Policy Project is a collaborative research program involving researchers and policy practitioners from the University of Melbourne (Australia), University of California – Berkeley (United States), Otago Polytechnic (New Zealand), Pacific Adventist University and Island Research and Consultants (Papua New Guinea). The project has involved mixed methods research (Creswell, 2013) including the conduct of semi-structured interviews, administration of a survey, and document analysis of select internet-based, publicly available governance documentation. The project received ethics clearance through the University of Melbourne human ethics committee. The researchers invited United States, New Zealand and Papua New Guinea policy practitioners and senior institutional managers to participate in a one hour, semi-structured interview by telephone or Skype. Invitations were distributed by email to United States higher education policy practitioners through the Association of College and University Policy Administrators (ACUPA) discussion list. Email invitations were also distributed to New Zealand and Papua New Guinea higher education institution staff through established professional contacts using purposive sampling (Maxwell, 1997) and snowball sampling (Goodman, 1961). In addition, invitations were extended through participants attending policy workshops held in Port Moresby and Madang, Papua New Guinea in April, 2014. The Institutional Policy Project interviews were conducted between February – April, 2014 with 39 interviewees (United States – 21; New Zealand – 11; and Papua New Guinea – 7). One PNG respondent provided written responses to the interview questions, rather than participate in an interview due to logistical constraints. The Institutional Policy Project surveys were announced in September 2013 at the Tertiary Education Management Conference (TEMC) 2013 in Tasmania, Australia and Association of College and University Policy Administrators (ACUPA) conference in Chicago, United States. The surveys were administered between February and April 2014 via email discussion lists of the Association for Tertiary Education Management (ATEM) Institutional Policy Network (IPN), United States-based organisations including the Association of College and University Policy Administrators (ACUPA), American Association of Collegiate Registrars and Admissions Officers (AACRAO), and University Risk Management & Insurance Association (URMIA). In addition, invitations were
33
extended through the ATEM Weekend Update and Australasian Association for Institutional Research (AAIR) Newsletter. The Papua New Guinea survey was also administered manually at policy workshops held in Port Moresby and Madang in April, 2014. In total, 72 survey responses were received (United States - 58, New Zealand – 10; and Papua New Guinea – four). The United States survey respondents were predominantly from Doctorate-granting Universities (45 per cent), and Master’s Colleges and Universities (29 per cent), with fewer from Baccalaureate Colleges (14 per cent), Associate’s Colleges (9 per cent) and Special Focus Institutions (three per cent). Most (89 per cent) were from four-year institutions (89 per cent) that were predominantly public (75 per cent), with great variation in size. The New Zealand survey respondents were predominantly from the Institute of Technology or Polytechnic (70 per cent) sector, with the remainder from the public university sector, varying in size between 5,001 and 30,000 students (40 per cent 5,001-10,000 students; 20 per cent 10,001-20,000 students; 40 per cent 20,001 – 30,000 students). The four Papua New Guinea respondents were from small public institutions (two universities, one polytechnic and one nursing school), most of which enrolled up to 1,000 students, and one of which enrolled between 1,001-5,000 students. The surveys were completed by respondents via SurveyMonkey, with the exception of the four Papua New Guinea surveys that were manually completed by respondents, then inputted by the researchers into SurveyMonkey. The survey results were tabulated using SurveyMonkey, and the qualitative survey results and interview responses coded using thematic analysis (Braun and Clarke, 2006). The survey results are indicative only, as the response rates, particularly for Papua New Guinea, are low. LITERATURE Policy Conceptions of policy have been extensively explored in the vast body of public policy and policy sciences (Dror, 1971) research literature. Public policy has been defined succinctly as ‘anything a government chooses to do or not do’ (Dye, 1972, p. 2) where the central actor – government – chooses and authorises a particular direction, or indeed effectively chooses a ‘non-decision’ (Smith, 1979). Public policy is frequently defined as a statement of principle and/or action regarding a particular matter:
[Policy is] the implicit or explicit specification of courses of purposive action being followed or to be followed in dealing with a recognised … problem or matter of concern, and directed towards the accomplishment of some intended or desired set of goals. Policy also can be thought of as a position or stance developed in response to a problem or issue of conflict, and directed towards a particular … objective. (Harman, 1984, p. 13)
However this rational-purposive conception fails to reflect the ‘messiness’ of policy making and implementation (Trowler, 2002). Ball (1998) captures the essence of criticisms of this approach suggesting that:
National policy making is inevitably a process of bricolage: a matter of borrowing and copying bits and pieces of ideas from elsewhere, drawing upon and amending locally tried and tested approaches, cannibalising theories, research, trends and
34
fashions and not infrequently flailing around for anything at all that looks as though it might work. Most policies are ramshackle, compromise, hit and miss affairs, that are reworked, tinkered with, nuanced and inflected through complex processes of influence, text production, dissemination and, ultimately, re-creation in contexts of practice (p. 15).
Distinctions have accordingly been made (see Hall, 1989; Hall, 1993) between ‘more or less abstract or general policy goals, the more concrete policy instruments used to implement them and the even more specific operational settings or calibrations used when these instruments are deployed’ (emphasis added, Howlett & Cashmore, 2014, p. 20). This distinction frames the three key elements explored through this paper: conceptions of policy, the development and review of policy instruments through the policy cycle, and the management of policy implementation. The policy cycle The policy making process has frequently been represented employing a stages heuristic (problem; research; solution; implementation) following the seminal work of Lasswell (1951); however, this is contested (Kingdon, 1984; Jenkins-Smith & Sabatier, 1993). Howlett and Cashore (2014) conclude that ‘policy processes generally unfold as a set of interrelated stages through which deliberations concerning some issue or problem flow in a more or less sequential fashion from being an ‘input’ to government deliberations to being an ‘output’ or subject of government action’ (p. 22). Research regarding the policy cycle, from an international perspective, is contemporary. Steiner-Khamsi (2012) suggests that ‘Today, scholars in comparative education investigate the international dimension that surfaces at various stages of the policy cycle, starting from the stage of problem definition and agenda setting, to policy implementation and evaluation’ (p. 6). Furthering the stages heuristic (Brewer, 1974; Jenkins, 1978; deLeon, 1999; Althaus, Bridgman & Davis, 2013), Howlett and Cashore’s (2014) streamlined policy cycle includes stages of agenda setting, policy formulation, decision-making, policy implementation and policy evaluation. For higher education institutions, this policy process is refracted by idiosyncratic and occasionally competing characteristics including collaborative decision making, academic autonomy and freedom of expression, combined to lesser and greater extents with ‘strength of tradition’ (McCaffery, 2010, p. 135). Policy implementation The ‘tail-end’ of the policy cycle – implementation – has received much attention, particularly with respect to public policy implementation. Cerych and Sabatier (1986) conclude that ‘implementation is a decision-making process in its own right, during which shifts, slippage, sub-goal optimisation and other distortions of the original policy’s goals must be expected’ (p. 4). Westerheijden and Kohoutek (2014) see policy implementation as a process by which policy objectives are translated by various actors to reflect local realities at the ‘street level’ (Lipsky, 1980), supporting Trowler’s (2002) implementation staircase metaphor (Figure 1) illustrating how policies change as they are implemented.
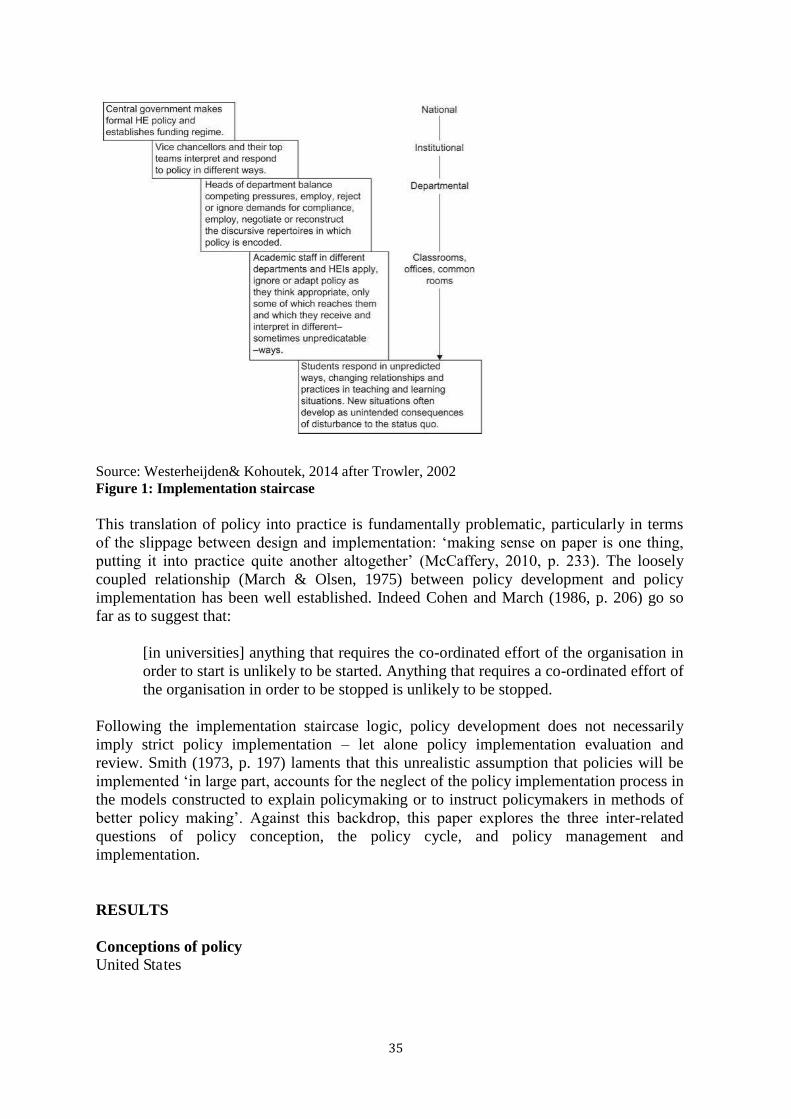
35
Source: Westerheijden& Kohoutek, 2014 after Trowler, 2002 Figure 1: Implementation staircase This translation of policy into practice is fundamentally problematic, particularly in terms of the slippage between design and implementation: ‘making sense on paper is one thing, putting it into practice quite another altogether’ (McCaffery, 2010, p. 233). The loosely coupled relationship (March & Olsen, 1975) between policy development and policy implementation has been well established. Indeed Cohen and March (1986, p. 206) go so far as to suggest that:
[in universities] anything that requires the co-ordinated effort of the organisation in order to start is unlikely to be started. Anything that requires a co-ordinated effort of the organisation in order to be stopped is unlikely to be stopped.
Following the implementation staircase logic, policy development does not necessarily imply strict policy implementation – let alone policy implementation evaluation and review. Smith (1973, p. 197) laments that this unrealistic assumption that policies will be implemented ‘in large part, accounts for the neglect of the policy implementation process in the models constructed to explain policymaking or to instruct policymakers in methods of better policy making’. Against this backdrop, this paper explores the three inter-related questions of policy conception, the policy cycle, and policy management and implementation. RESULTS Conceptions of policy United States
36
In the United States, survey respondents overwhelmingly reported that their range of policy instruments includes policies (98 per cent) and procedures (92 per cent). A smaller proportion (61 per cent) reported having guidelines. In addition to these policy instruments (policies, procedures, guidelines) survey respondents reported that their institutions have other forms of governance texts, including legislation, regulations, statutes and rules. Generally, these governance texts sit above policy instruments, as do the myriad of additional governance texts identified by interviewees as emanating from complex governance and organisational structures, such as by-laws, Board of Regents/Trustee policy and system-wide policy spanning inter-connected public institutions. Subordinate to all of these governance texts and policy instruments are a range of supporting documents (such as forms and websites). United States participants conceived policy in different ways. Some survey respondents provided ‘one stop shop’ definitions encompassing enhancement of mission, increasing organisational efficiency, mitigating risk and legislative compliance:
A University Policy is a policy with broad application throughout the University which enhances the University’s mission, promotes operational efficiencies, reduces institutional risk, helps ensure compliance with applicable laws and regulations, promotes ethical standards and integrity, and is approved in accordance with the procedures described in this Policy.
The focus on legislative compliance was evident in responses provided by both survey respondents and interviewees, with many United States interviewees conceiving policy as an instrument to operationalise government legislation and regulation to the organisational level from a legislative compliance perspective (see Freeman, Capell, Goldblatt, Lapan, Mafile’o & Thompson, 2014). United States survey respondents also conceived policy as a mechanism to articulate formalities including the location of the authoritative source texts, and information regarding instrument application (that is, institution wide, or local) and approval authorities:
University policies are maintained by the Policy Office in the policy manual. University policies often prescribe standards, requirements, restrictions, rights, or responsibilities and support the mission, values, and operation of the university. … Policies may not exist except at the university level. Divisions, colleges, schools, departments, programs, offices, etc. may have guidelines, practices, and standard operating procedures.
In terms of procedures, United States respondents conceived procedures as instruments articulating or prescribing stepped clauses or other methods required to implement or operationalise policy, for example:
Information for implementation, administration, and compliance in a consistent, efficient, and effective way. Outlines the processes, step by step, that need to be followed to comply with the policy. Outlines ‘how’ to follow the policy. Required actions are listed according to the tasks themselves. Contains similar information to the Responsibilities section which outlines required actions according to the office or job function.
37
New Zealand In New Zealand, all survey respondents reported that their range of policy instruments included policies, and most (89 per cent) included procedures and guidelines. A few respondents noted governance texts including statutes, regulations and codes of practice, and supporting documents including forms and templates. One New Zealand survey respondent provided a ‘one stop shop’ definition conceiving policy as the institution’s position, whilst also providing detailed information regarding approval authorities, compliance, and examples:
A Policy sets out the University’s position on a specific matter and requires a certain line of action to be taken, although it does not necessarily detail that line of action. Policies, except Human Resource (HR) policies, are formally documented and approved by Council or under its delegated authority. The Vice-Chancellor establishes HR Policies pursuant to his or her authority under the State Sector Act. Compliance is mandatory. Examples: Research and Study Leave Policy, Purchasing Policy, Email Policy
Another New Zealand survey respondent conceived policy as a governance instrument articulating purpose, outcomes, decision-making parameters, and authorities:
A policy is a governing tool that: Articulates purpose and outcomes; Sets parameters for decision-making to mandate or constrain actions. The focus of a policy is on intent and authority and responsibility to act. Adherence to a policy is mandatory.
Reflecting a compliance-based approach, one New Zealand survey respondent provided a behavioural definition:
Principles that identify formal expectations of staff and students on specified University matters. Policies are formally documented and approved by Council or its delegated authority. Boundaries are defined and a framework provided within which operating procedures may be developed. Compliance is expected and non-compliance may result in censure, penalties or disciplinary action.
New Zealand interviewees viewed policy as a mechanism to address government quality assurance requirements, with many respondents from Institutes of Technology and Polytechnics referring to previous efforts to establish policies aligned to quality standards (which have subsequently been superseded). This legacy of aligning policy and quality conceptually remains. Further, New Zealand interviewees conceived policy as:
… governing principles articulating the institution’s position or expectations on a certain matter. Policy establishes the parameters for institutional decision-making, guides behaviour and outcomes, and represents best practices, mandatory requirements, and principles to ensure equitable treatment. Policy represents a risk mitigation strategy. (Freeman, Capell, Goldblatt, Lapan, Mafile’o & Thompson, 2014, p. 5)
New Zealand interviewees also conceived policy as a ‘mechanism to promote achievement of obligations broadly under the Treaty of Waitangi, and address Māori and Pacifika access
38
and participation’ (Freeman, Capell, Goldblatt, Lapan, Mafile’o & Thompson, 2014, p. 5), an equity sentiment which is noticeably absent from the United States responses. One New Zealand interviewee defined policy as the rules or framework for institutional functions, including associated processes:
So policies are the sort of rules, the framework by which we dictate how we’ll address … some areas that we have to achieve. … I think of policies [as] not just being a statement of this is what we must do in … this particular matter but also embracing the guidelines and the processes by which we will achieve that.
Like the United States survey respondents, New Zealand survey respondents defined procedures as a stepped or standard set of actions required to implement policy:
Standard, step-by-step, methods of operating in line with best practice or safe practice. They generally relate back to a policy statement and may offer advice or set expectations about how a policy or regulation should be implemented or how an activity is carried out. Compliance is expected, and where a decision is taken to depart from the guidelines, actions may need to be explained and/or justified.
Papua New Guinea In Papua New Guinea, survey respondents reported that their range of policy instruments included policies (100 per cent), procedures (75 per cent) and guidelines (100 per cent). Respondents defined policy as guiding documents: ‘a guiding document for our operations’ and ‘a set of guidelines or procedures to achieve desired results’. Papua New Guinea survey respondents also conceived institutional policy as an instrument to support the achievement of the country’s development aspirations: ‘a guide to implement PNG Government Vision 2050 Plans’. Reflecting this amalgam of elements, one Papua New Guinea interviewee conceived policy as a guideline, aligned with the institutional corporate plan, to achieve the objectives of the country:
Policy is a guideline. It is a decision or some directions we make to direct the staff to achieve the institutional plan, institutional aims and goals … There is a corporate plan which includes all the aims and objectives of the university, of the country, the national plan, Vision 2050, and we follow that because we are a government institution, and we are directed from the top, from the government downwards – they fund us and all that so we have to have policies, guidelines, to direct us to do what the country wants us to do to achieve the aims and objectives of the country. … So I think policy is really, to help us achieve those aims and objectives of the university, and eventually as a country as a whole.
Another interviewee reported that policy represents the link between the institutional vision and operations:
I understand ‘policy’ as the strategic link between the University Vision and our day-to-day operations. Well-written policies and procedures allow staff to understand their roles and responsibilities within predefined limits. Basically, policies and procedures allow management to guide operations without constant management intervention.
39
One interviewee suggested that plans and policies position the university to better meet the challenges faced in Papua New Guinea:
… our students come from PNG and there is so much demand on the university too. There’s a lot of challenges here ... All these plans, policies have to be in place otherwise we are all over the place.
In Papua New Guinea, policy is seen as a necessary response to these real challenges facing universities and individual staff members:
… PNG students are … goodness. It’s very difficult to handle them … Sometimes I think that some policies I haven’t got and should develop … but I just never got to it. And in case something happens to them, somebody dies, or something happens, like if there is no policy to guard us, that’s the query, for me, for my department, that’s the thing, [because] I am dealing with them everyday! … they can get up to anything or burn down the dormitory or you never know what they [are going to] come up with so I am concerned every now and then. But the good Lord ... I have trust, faith that he is [going to] take care of these things and not get me into trouble. But that’s a big challenge for me … in my department. And I think the management and everybody too are concerned what they would get up to because we face strikes almost constantly, year after year, over little things sometimes.
This interviewee also suggested that where a policy is in place, the institution must support and safeguard individual staff members where they act within the institution’s established operational parameters. As such, policy is also conceived in terms of institutional and personal safety:
I would advise the Vice Chancellor and the Pro Vice Chancellors to ensure that all policies are in place. That’s what I would do. And just so that we are safe … And that everybody, everybody knows what’s happening at the university. Sometimes the lower downs are not aware of what the university is doing …
Consistent with United States and New Zealand survey respondents, procedures were conceived by Papua New Guinea survey respondents as ‘a step-by-step path’, and as ‘a guide to following institutional policy’. Conceptions of the policy cycle Survey respondents were asked to identify institutional requirements regarding discrete policy cycle stages. They consistently identified requirements including endorsement to proceed, consultation with policy stakeholders (academic/faculty and professional staff) and employee or enterprise bargaining representatives. In the United States, survey respondents were less likely to include the policy implementation monitoring, evaluation and review ‘tail’ of the policy cycle. In contrast, the majority of New Zealand survey respondents included these cycle stages as requirements. The requirement to ‘conduct research or benchmarking against other institution’s equivalent policies’ was comparatively low for both the United States (44 per cent) and New Zealand (25 per cent) (Table 1). Table 1: Policy cycle requirements (United States and New Zealand)*
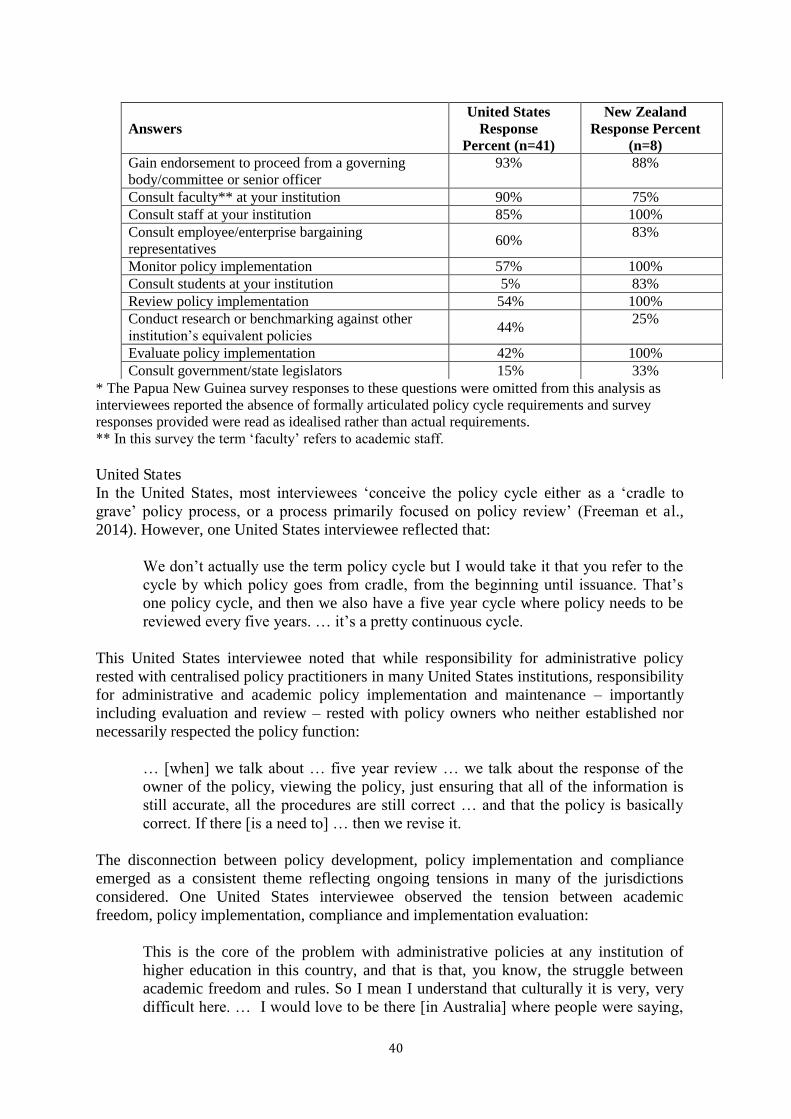
40
* The Papua New Guinea survey responses to these questions were omitted from this analysis as interviewees reported the absence of formally articulated policy cycle requirements and survey responses provided were read as idealised rather than actual requirements. ** In this survey the term ‘faculty’ refers to academic staff. United States In the United States, most interviewees ‘conceive the policy cycle either as a ‘cradle to grave’ policy process, or a process primarily focused on policy review’ (Freeman et al., 2014). However, one United States interviewee reflected that:
We don’t actually use the term policy cycle but I would take it that you refer to the cycle by which policy goes from cradle, from the beginning until issuance. That’s one policy cycle, and then we also have a five year cycle where policy needs to be reviewed every five years. … it’s a pretty continuous cycle.
This United States interviewee noted that while responsibility for administrative policy rested with centralised policy practitioners in many United States institutions, responsibility for administrative and academic policy implementation and maintenance – importantly including evaluation and review – rested with policy owners who neither established nor necessarily respected the policy function:
… [when] we talk about … five year review … we talk about the response of the owner of the policy, viewing the policy, just ensuring that all of the information is still accurate, all the procedures are still correct … and that the policy is basically correct. If there [is a need to] … then we revise it.
The disconnection between policy development, policy implementation and compliance emerged as a consistent theme reflecting ongoing tensions in many of the jurisdictions considered. One United States interviewee observed the tension between academic freedom, policy implementation, compliance and implementation evaluation:
This is the core of the problem with administrative policies at any institution of higher education in this country, and that is that, you know, the struggle between academic freedom and rules. So I mean I understand that culturally it is very, very difficult here. … I would love to be there [in Australia] where people were saying,
Answers United States
Response Percent (n=41)
New Zealand Response Percent
(n=8) Gain endorsement to proceed from a governing body/committee or senior officer
93% 88%
Consult faculty** at your institution 90% 75% Consult staff at your institution 85% 100% Consult employee/enterprise bargaining representatives
60% 83%
Monitor policy implementation 57% 100% Consult students at your institution 5% 83% Review policy implementation 54% 100% Conduct research or benchmarking against other institution’s equivalent policies 44%
25%
Evaluate policy implementation 42% 100% Consult government/state legislators 15% 33%
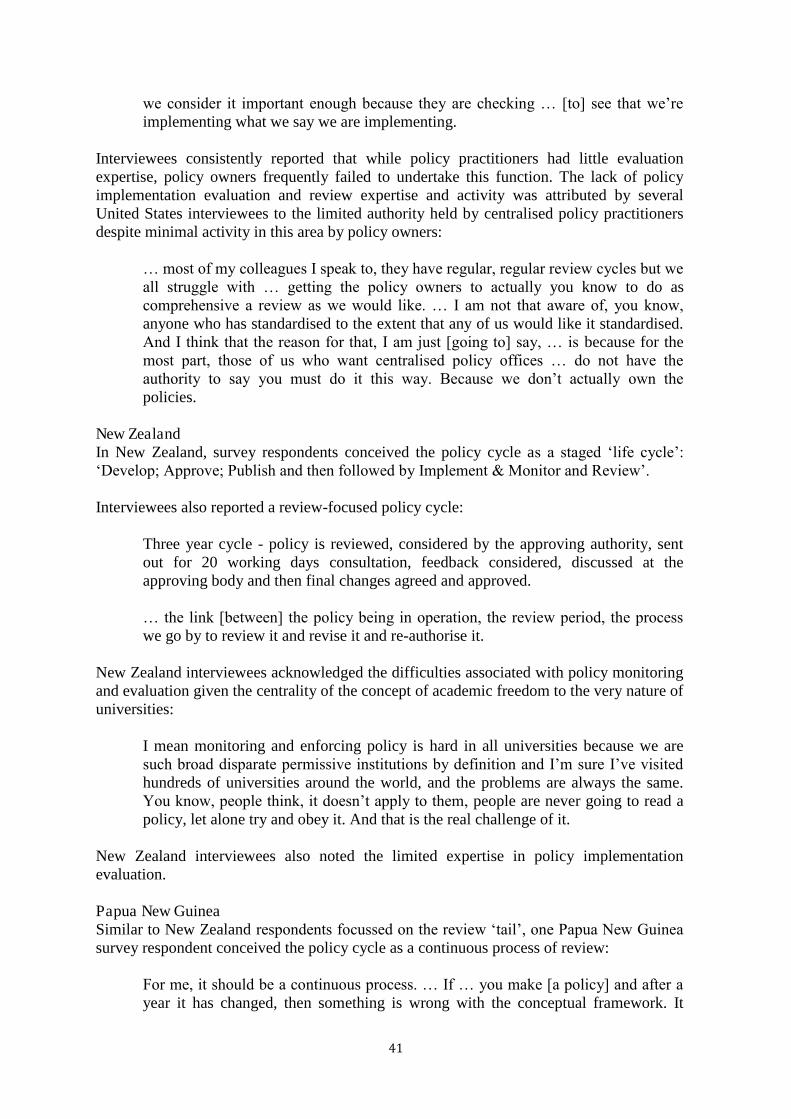
41
we consider it important enough because they are checking … [to] see that we’re implementing what we say we are implementing.
Interviewees consistently reported that while policy practitioners had little evaluation expertise, policy owners frequently failed to undertake this function. The lack of policy implementation evaluation and review expertise and activity was attributed by several United States interviewees to the limited authority held by centralised policy practitioners despite minimal activity in this area by policy owners:
… most of my colleagues I speak to, they have regular, regular review cycles but we all struggle with … getting the policy owners to actually you know to do as comprehensive a review as we would like. … I am not that aware of, you know, anyone who has standardised to the extent that any of us would like it standardised. And I think that the reason for that, I am just [going to] say, … is because for the most part, those of us who want centralised policy offices … do not have the authority to say you must do it this way. Because we don’t actually own the policies.
New Zealand In New Zealand, survey respondents conceived the policy cycle as a staged ‘life cycle’: ‘Develop; Approve; Publish and then followed by Implement & Monitor and Review’. Interviewees also reported a review-focused policy cycle:
Three year cycle - policy is reviewed, considered by the approving authority, sent out for 20 working days consultation, feedback considered, discussed at the approving body and then final changes agreed and approved.
… the link [between] the policy being in operation, the review period, the process we go by to review it and revise it and re-authorise it.
New Zealand interviewees acknowledged the difficulties associated with policy monitoring and evaluation given the centrality of the concept of academic freedom to the very nature of universities:
I mean monitoring and enforcing policy is hard in all universities because we are such broad disparate permissive institutions by definition and I’m sure I’ve visited hundreds of universities around the world, and the problems are always the same. You know, people think, it doesn’t apply to them, people are never going to read a policy, let alone try and obey it. And that is the real challenge of it.
New Zealand interviewees also noted the limited expertise in policy implementation evaluation. Papua New Guinea Similar to New Zealand respondents focussed on the review ‘tail’, one Papua New Guinea survey respondent conceived the policy cycle as a continuous process of review:
For me, it should be a continuous process. … If … you make [a policy] and after a year it has changed, then something is wrong with the conceptual framework. It
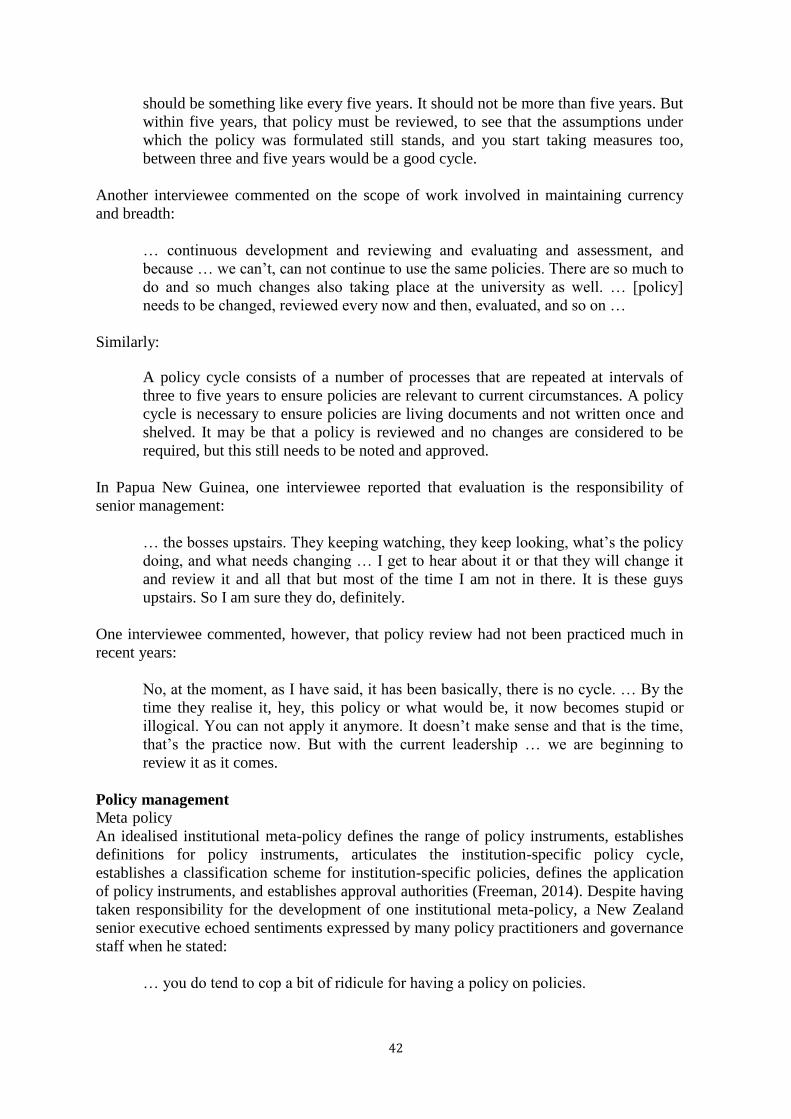
42
should be something like every five years. It should not be more than five years. But within five years, that policy must be reviewed, to see that the assumptions under which the policy was formulated still stands, and you start taking measures too, between three and five years would be a good cycle.
Another interviewee commented on the scope of work involved in maintaining currency and breadth:
… continuous development and reviewing and evaluating and assessment, and because … we can’t, can not continue to use the same policies. There are so much to do and so much changes also taking place at the university as well. … [policy] needs to be changed, reviewed every now and then, evaluated, and so on …
Similarly:
A policy cycle consists of a number of processes that are repeated at intervals of three to five years to ensure policies are relevant to current circumstances. A policy cycle is necessary to ensure policies are living documents and not written once and shelved. It may be that a policy is reviewed and no changes are considered to be required, but this still needs to be noted and approved.
In Papua New Guinea, one interviewee reported that evaluation is the responsibility of senior management:
… the bosses upstairs. They keeping watching, they keep looking, what’s the policy doing, and what needs changing … I get to hear about it or that they will change it and review it and all that but most of the time I am not in there. It is these guys upstairs. So I am sure they do, definitely.
One interviewee commented, however, that policy review had not been practiced much in recent years:
No, at the moment, as I have said, it has been basically, there is no cycle. … By the time they realise it, hey, this policy or what would be, it now becomes stupid or illogical. You can not apply it anymore. It doesn’t make sense and that is the time, that’s the practice now. But with the current leadership … we are beginning to review it as it comes.
Policy management Meta policy An idealised institutional meta-policy defines the range of policy instruments, establishes definitions for policy instruments, articulates the institution-specific policy cycle, establishes a classification scheme for institution-specific policies, defines the application of policy instruments, and establishes approval authorities (Freeman, 2014). Despite having taken responsibility for the development of one institutional meta-policy, a New Zealand senior executive echoed sentiments expressed by many policy practitioners and governance staff when he stated:
… you do tend to cop a bit of ridicule for having a policy on policies.
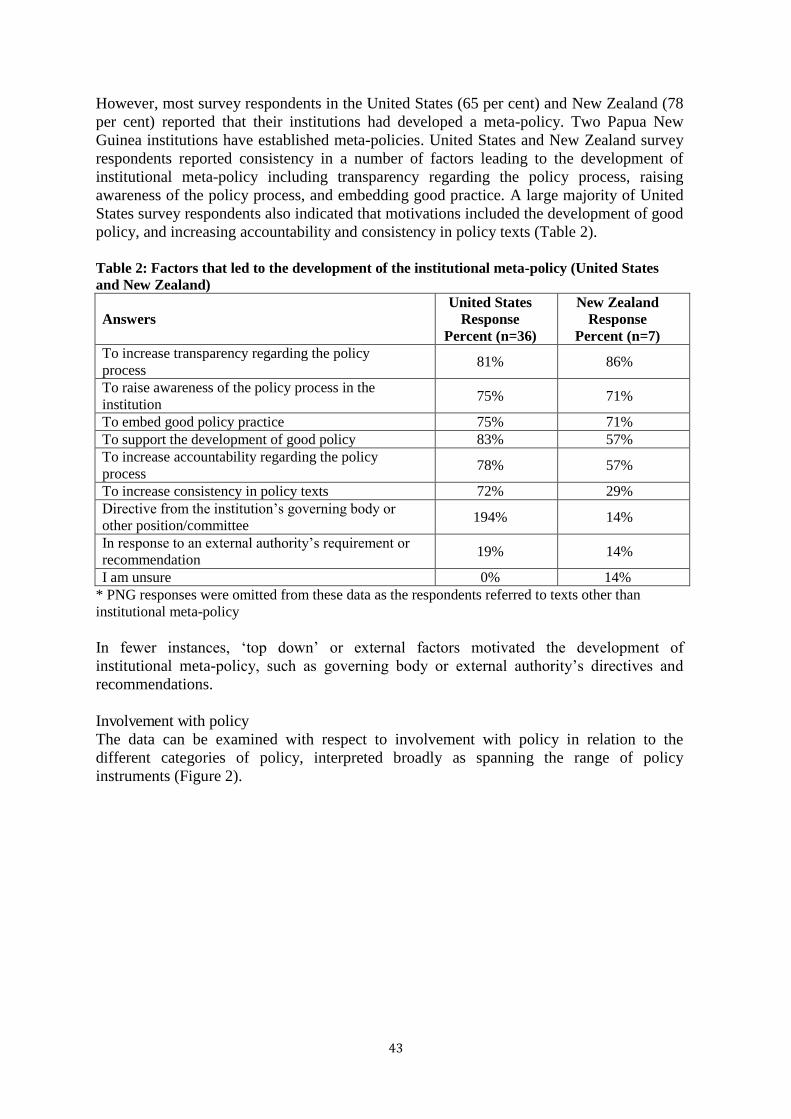
43
However, most survey respondents in the United States (65 per cent) and New Zealand (78 per cent) reported that their institutions had developed a meta-policy. Two Papua New Guinea institutions have established meta-policies. United States and New Zealand survey respondents reported consistency in a number of factors leading to the development of institutional meta-policy including transparency regarding the policy process, raising awareness of the policy process, and embedding good practice. A large majority of United States survey respondents also indicated that motivations included the development of good policy, and increasing accountability and consistency in policy texts (Table 2). Table 2: Factors that led to the development of the institutional meta-policy (United States and New Zealand)
Answers United States
Response Percent (n=36)
New Zealand Response
Percent (n=7) To increase transparency regarding the policy process
81% 86%
To raise awareness of the policy process in the institution
75% 71%
To embed good policy practice 75% 71% To support the development of good policy 83% 57% To increase accountability regarding the policy process
78% 57%
To increase consistency in policy texts 72% 29% Directive from the institution’s governing body or other position/committee
194% 14%
In response to an external authority’s requirement or recommendation
19% 14%
I am unsure 0% 14% * PNG responses were omitted from these data as the respondents referred to texts other than institutional meta-policy In fewer instances, ‘top down’ or external factors motivated the development of institutional meta-policy, such as governing body or external authority’s directives and recommendations. Involvement with policy The data can be examined with respect to involvement with policy in relation to the different categories of policy, interpreted broadly as spanning the range of policy instruments (Figure 2).
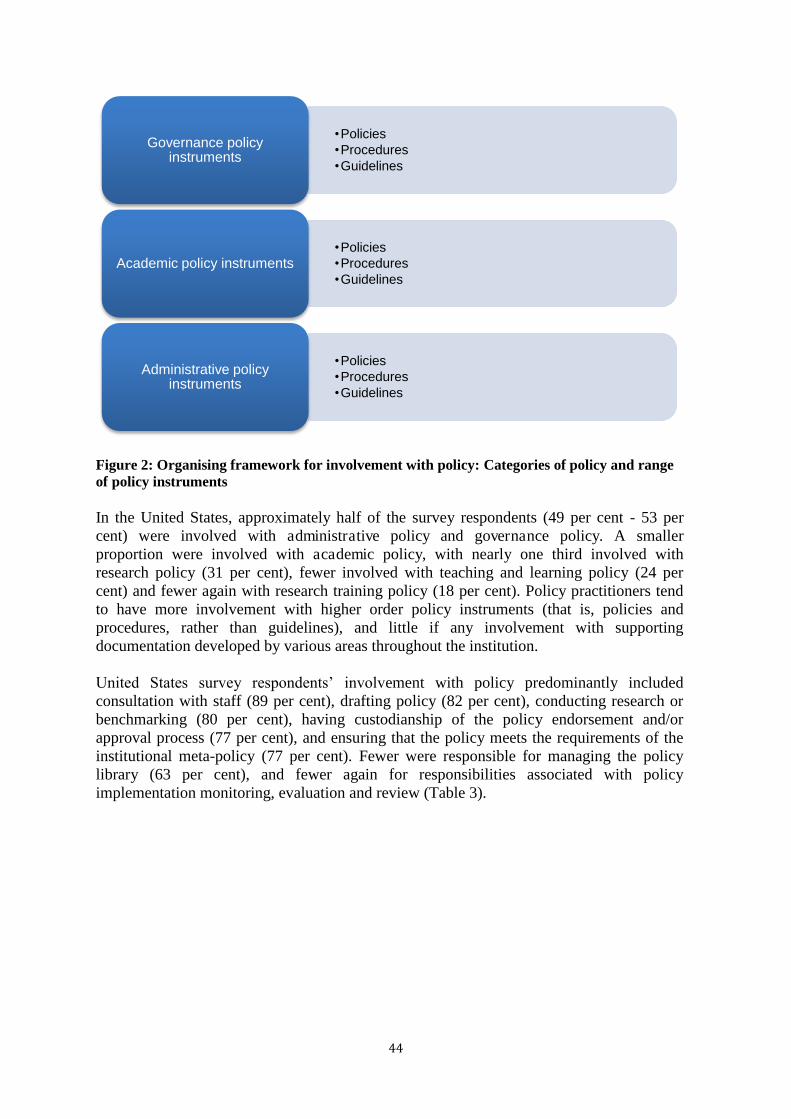
44
Figure 2: Organising framework for involvement with policy: Categories of policy and range of policy instruments In the United States, approximately half of the survey respondents (49 per cent - 53 per cent) were involved with administrative policy and governance policy. A smaller proportion were involved with academic policy, with nearly one third involved with research policy (31 per cent), fewer involved with teaching and learning policy (24 per cent) and fewer again with research training policy (18 per cent). Policy practitioners tend to have more involvement with higher order policy instruments (that is, policies and procedures, rather than guidelines), and little if any involvement with supporting documentation developed by various areas throughout the institution. United States survey respondents’ involvement with policy predominantly included consultation with staff (89 per cent), drafting policy (82 per cent), conducting research or benchmarking (80 per cent), having custodianship of the policy endorsement and/or approval process (77 per cent), and ensuring that the policy meets the requirements of the institutional meta-policy (77 per cent). Fewer were responsible for managing the policy library (63 per cent), and fewer again for responsibilities associated with policy implementation monitoring, evaluation and review (Table 3).
•Policies •Procedures •Guidelines
Governance policy instruments
•Policies •Procedures •Guidelines
Academic policy instruments
•Policies •Procedures •Guidelines
Administrative policy instruments
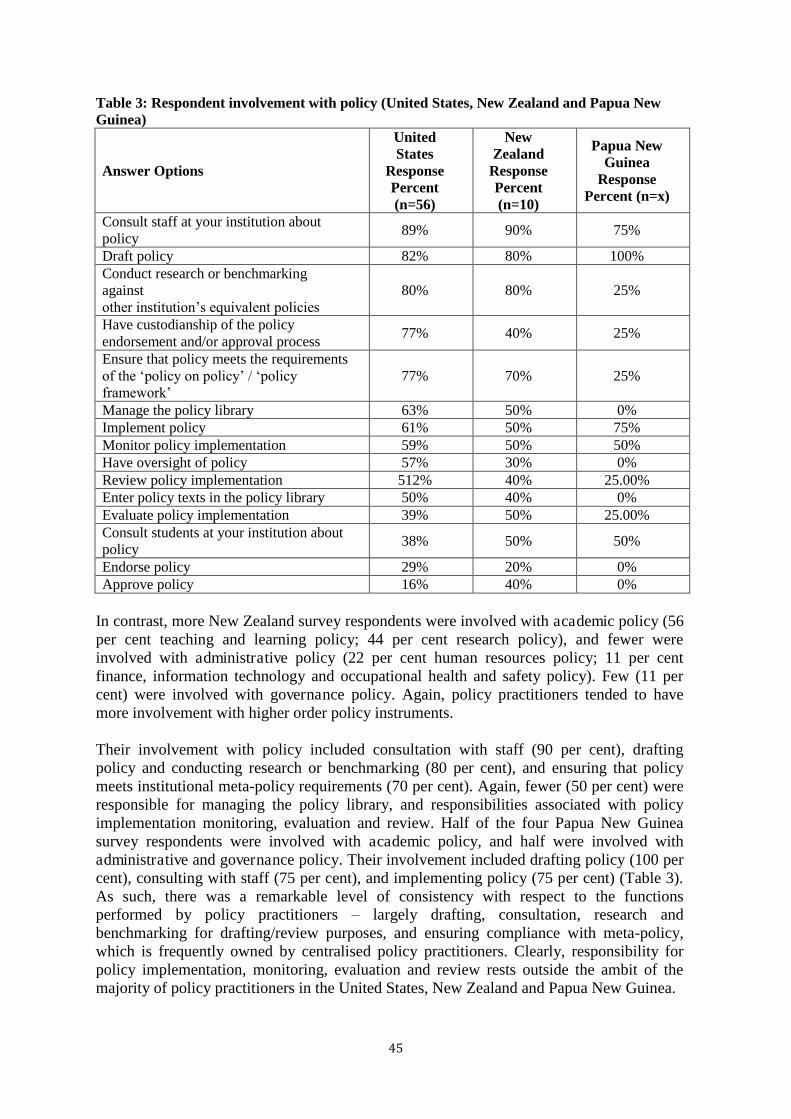
45
Table 3: Respondent involvement with policy (United States, New Zealand and Papua New Guinea)
Answer Options
United States
Response Percent (n=56)
New Zealand Response Percent (n=10)
Papua New Guinea
Response Percent (n=x)
Consult staff at your institution about policy
89% 90% 75%
Draft policy 82% 80% 100% Conduct research or benchmarking against other institution’s equivalent policies
80% 80% 25%
Have custodianship of the policy endorsement and/or approval process
77% 40% 25%
Ensure that policy meets the requirements of the ‘policy on policy’ / ‘policy framework’
77% 70% 25%
Manage the policy library 63% 50% 0% Implement policy 61% 50% 75% Monitor policy implementation 59% 50% 50% Have oversight of policy 57% 30% 0% Review policy implementation 512% 40% 25.00% Enter policy texts in the policy library 50% 40% 0% Evaluate policy implementation 39% 50% 25.00% Consult students at your institution about policy
38% 50% 50%
Endorse policy 29% 20% 0% Approve policy 16% 40% 0%
In contrast, more New Zealand survey respondents were involved with academic policy (56 per cent teaching and learning policy; 44 per cent research policy), and fewer were involved with administrative policy (22 per cent human resources policy; 11 per cent finance, information technology and occupational health and safety policy). Few (11 per cent) were involved with governance policy. Again, policy practitioners tended to have more involvement with higher order policy instruments. Their involvement with policy included consultation with staff (90 per cent), drafting policy and conducting research or benchmarking (80 per cent), and ensuring that policy meets institutional meta-policy requirements (70 per cent). Again, fewer (50 per cent) were responsible for managing the policy library, and responsibilities associated with policy implementation monitoring, evaluation and review. Half of the four Papua New Guinea survey respondents were involved with academic policy, and half were involved with administrative and governance policy. Their involvement included drafting policy (100 per cent), consulting with staff (75 per cent), and implementing policy (75 per cent) (Table 3). As such, there was a remarkable level of consistency with respect to the functions performed by policy practitioners – largely drafting, consultation, research and benchmarking for drafting/review purposes, and ensuring compliance with meta-policy, which is frequently owned by centralised policy practitioners. Clearly, responsibility for policy implementation, monitoring, evaluation and review rests outside the ambit of the majority of policy practitioners in the United States, New Zealand and Papua New Guinea.
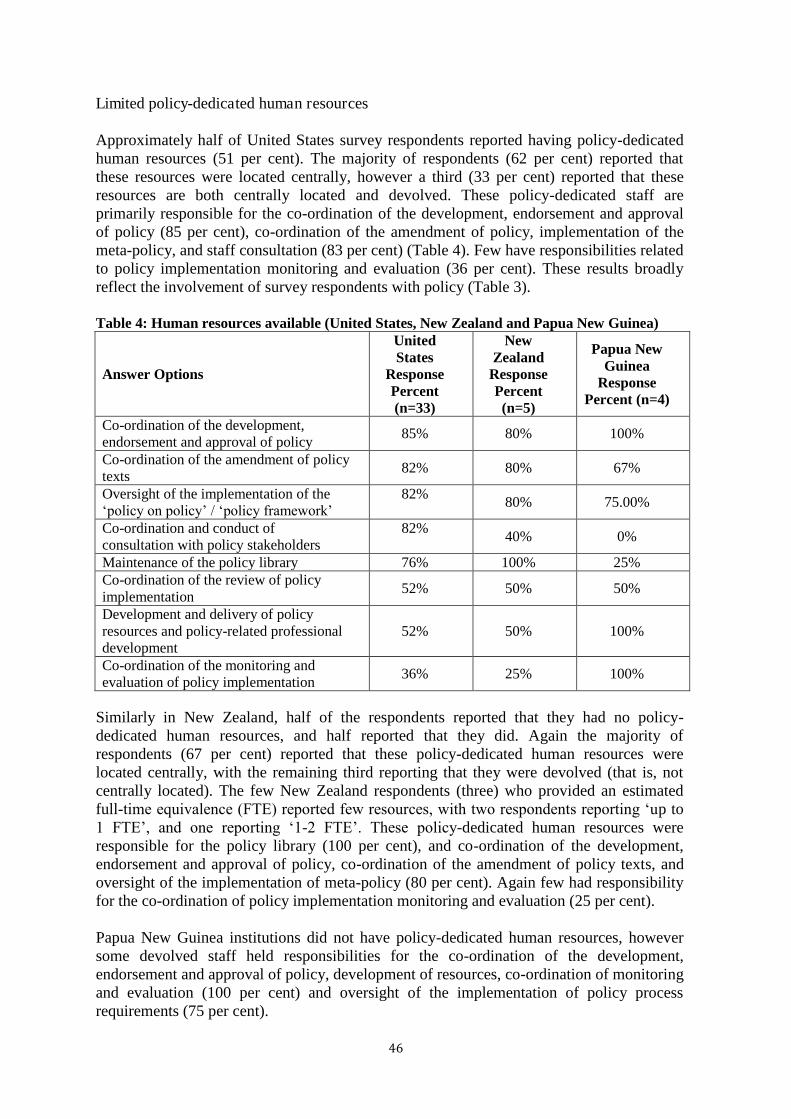
46
Limited policy-dedicated human resources Approximately half of United States survey respondents reported having policy-dedicated human resources (51 per cent). The majority of respondents (62 per cent) reported that these resources were located centrally, however a third (33 per cent) reported that these resources are both centrally located and devolved. These policy-dedicated staff are primarily responsible for the co-ordination of the development, endorsement and approval of policy (85 per cent), co-ordination of the amendment of policy, implementation of the meta-policy, and staff consultation (83 per cent) (Table 4). Few have responsibilities related to policy implementation monitoring and evaluation (36 per cent). These results broadly reflect the involvement of survey respondents with policy (Table 3). Table 4: Human resources available (United States, New Zealand and Papua New Guinea)
Answer Options
United States
Response Percent (n=33)
New Zealand Response Percent (n=5)
Papua New Guinea
Response Percent (n=4)
Co-ordination of the development, endorsement and approval of policy
85% 80% 100%
Co-ordination of the amendment of policy texts
82% 80% 67%
Oversight of the implementation of the ‘policy on policy’ / ‘policy framework’
82% 80% 75.00%
Co-ordination and conduct of consultation with policy stakeholders
82% 40% 0%
Maintenance of the policy library 76% 100% 25% Co-ordination of the review of policy implementation
52% 50% 50%
Development and delivery of policy resources and policy-related professional development
52% 50% 100%
Co-ordination of the monitoring and evaluation of policy implementation
36% 25% 100%
Similarly in New Zealand, half of the respondents reported that they had no policy-dedicated human resources, and half reported that they did. Again the majority of respondents (67 per cent) reported that these policy-dedicated human resources were located centrally, with the remaining third reporting that they were devolved (that is, not centrally located). The few New Zealand respondents (three) who provided an estimated full- time equivalence (FTE) reported few resources, with two respondents reporting ‘up to 1 FTE’, and one reporting ‘1-2 FTE’. These policy-dedicated human resources were responsible for the policy library (100 per cent), and co-ordination of the development, endorsement and approval of policy, co-ordination of the amendment of policy texts, and oversight of the implementation of meta-policy (80 per cent). Again few had responsibility for the co-ordination of policy implementation monitoring and evaluation (25 per cent). Papua New Guinea institutions did not have policy-dedicated human resources, however some devolved staff held responsibilities for the co-ordination of the development, endorsement and approval of policy, development of resources, co-ordination of monitoring and evaluation (100 per cent) and oversight of the implementation of policy process requirements (75 per cent).
47
DISCUSSION AND CONCLUSION This research contributes to the small but slowly emerging body of research regarding institutional policy (Freeman, Hatwell & Jensen, 2013; Freeman, 2010; Freeman, 2014; Harvey & Kosman, 2014; Russette et al., 2014; Starr & Graham-Matheson, 2011). Much of this research focuses specifically on the development or implementation of single policy texts at individual institutions, rather than institutional policy making systems, from a national or international perspective. Despite the paucity of literature available, policy practitioners and senior managers themselves have clear – but widely divergent – conceptions of institutional policy. In the United States, institutional policy is conceived as a compliance mechanism that intersects government requirements and institutional operations. Institutional policy promotes operational effectiveness and efficiency, mitigates risk and represents the ‘source of (institutional) truth’. In contrast, in New Zealand, institutional policy articulates an institutional position, course of action or anticipated outcomes, and establishes decision-making parameters. United States participants conceived compliance in terms of how institutional policy is used as an instrument to ensure institutions comply with government legislation (the government’s ‘rules’), partly in response to their inability to consider compliance with institutional policy given the centrality of principles of autonomy and academic freedom. In contrast, New Zealand participants discussed compliance in terms of ensuring that institutional staff and students comply with institutional policy (the institution’s ‘rules’), despite there being limited systems in place in most New Zealand higher education institutions to evidence policy compliance (Freeman, 2013). Policy compliance systems pre-suppose both policy implementation, and policy implementation consistent with policy texts. Some caution should be exercised in introducing ‘policy policing’, or policy compliance systems, before ascertaining whether policy is actually being implemented. New Zealand respondents also conceived institutional policy as instrumental in achieving quality assurance and Māori and Pacifika equity objectives. Papua New Guinea respondents conceived institutional policy quite differently, reflecting the contextual realities facing higher education institutions in their rapidly growing, developing country. In Papua New Guinea, institutions and institutional policy are vehicles to promote achievement of the objectives of the country. Institutional policy is also a mechanism to safeguard institutional and personal safety. In contrast to the divergent perspectives regarding conceptions of institutional policy, United States, New Zealand and Papua New Guinea participants consistently conceived the policy making process as a staged, sequenced, planned – but iterative - cycle consistent with the stages heuristics (Lasswell, 1956; Howlett & Cashore, 2014). In fact two policy cycles emerge; firstly, the ‘life-cycle’ (draft, consult, endorse, approve, implement); secondly, the post-approval review cycle (monitor, evaluate, review, redraft, consult, endorse, approve, implement). An idealised allocation of policy responsibilities is represented in Table 5, below, illustrating where the key intervention points may be most appropriately located for
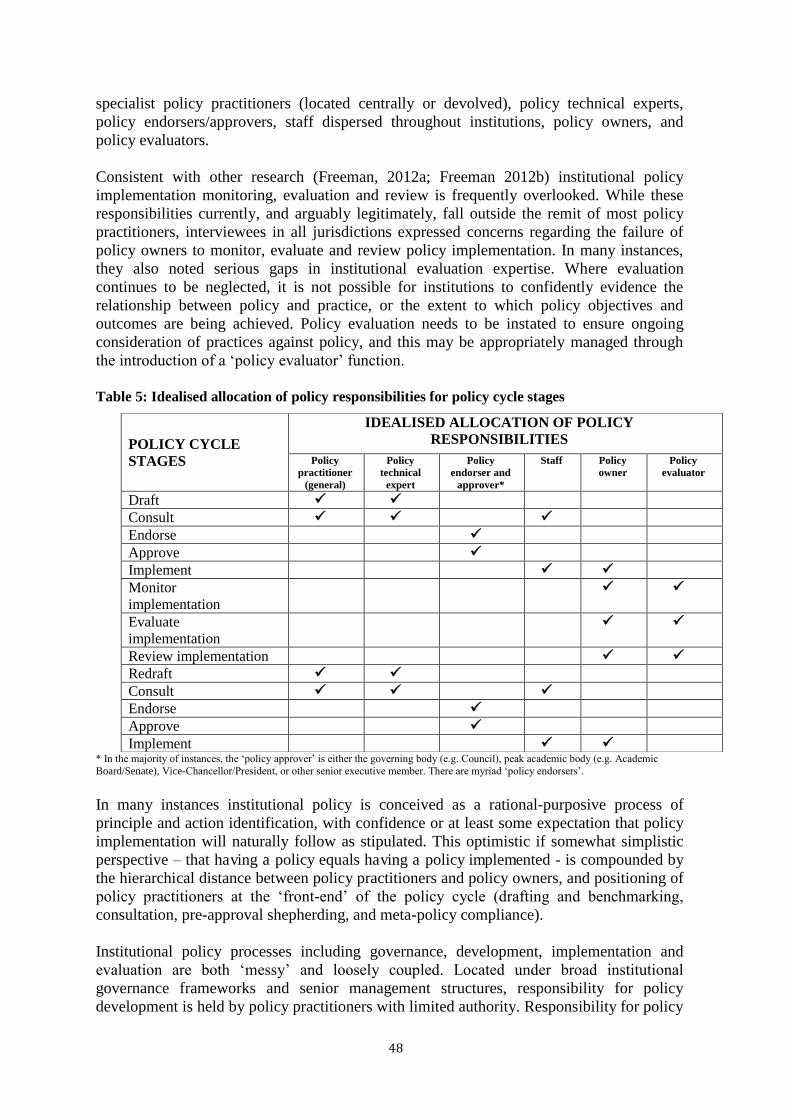
48
specialist policy practitioners (located centrally or devolved), policy technical experts, policy endorsers/approvers, staff dispersed throughout institutions, policy owners, and policy evaluators. Consistent with other research (Freeman, 2012a; Freeman 2012b) institutional policy implementation monitoring, evaluation and review is frequently overlooked. While these responsibilities currently, and arguably legitimately, fall outside the remit of most policy practitioners, interviewees in all jurisdictions expressed concerns regarding the failure of policy owners to monitor, evaluate and review policy implementation. In many instances, they also noted serious gaps in institutional evaluation expertise. Where evaluation continues to be neglected, it is not possible for institutions to confidently evidence the relationship between policy and practice, or the extent to which policy objectives and outcomes are being achieved. Policy evaluation needs to be instated to ensure ongoing consideration of practices against policy, and this may be appropriately managed through the introduction of a ‘policy evaluator’ function. Table 5: Idealised allocation of policy responsibilities for policy cycle stages
* In the majority of instances, the ‘policy approver’ is either the governing body (e.g. Council), peak academic body (e.g. Academic Board/Senate), Vice-Chancellor/President, or other senior executive member. There are myriad ‘policy endorsers’. In many instances institutional policy is conceived as a rational-purposive process of principle and action identification, with confidence or at least some expectation that policy implementation will naturally follow as stipulated. This optimistic if somewhat simplistic perspective – that having a policy equals having a policy implemented - is compounded by the hierarchical distance between policy practitioners and policy owners, and positioning of policy practitioners at the ‘front-end’ of the policy cycle (drafting and benchmarking, consultation, pre-approval shepherding, and meta-policy compliance). Institutional policy processes including governance, development, implementation and evaluation are both ‘messy’ and loosely coupled. Located under broad institutional governance frameworks and senior management structures, responsibility for policy development is held by policy practitioners with limited authority. Responsibility for policy
POLICY CY CLE STAGES
IDEALISED ALLOCATION OF POLICY RESPONSIBILITIES
Policy practitioner
(general)
Policy technical expert
Policy endorser and
approver*
Staff Policy owner
Policy evaluator
Draft Consult Endorse Approve Implement Monitor implementation
Evaluate implementation
Review implementation Redraft Consult Endorse Approve Implement
49
implementation is widely devolved throughout institutions (to the institutional ‘coal-face’), while responsibility for evaluation is largely ignored. In this respect, the research confirms a pervasive dislocation between policy texts and policy practitioners, policy governance, and policy implementation evaluation and review. Clearly, the manner in which institutions conceive policy influences how they develop policy. How institutions develop policy influences how they subsequently manage and implement policy. Understanding how institutions implement policy is important as the inter-related processes of policy management, implementation, evaluation and review drive ‘street level’ practices and subsequent outcomes for students, staff, and communities. ACKNOWLEDGEMENTS The authors would like to thank Tanya Rubin (University of Western Sydney) for announcing the Institutional Policy Project at the ACUPA 2013 conference in Chicago in September 2013. The authors gratefully acknowledge the support of professional associations circulating invitations to participate in the Institutional Policy Project, including the Association for Tertiary Education Management (ATEM), ATEM Institutional Policy Network (IPN), Association of College and University Policy Administrators (ACUPA), American Association of Collegiate Registrars and Admissions Officers (AACRAO), University Risk Management & Insurance Association (URMIA) and Australasian Association for Institutional Research (AAIR). This presentation builds on Freeman, Capell, Goldblatt, Lapan, Mafile’o, and Thompson (2014) and Freeman, Capell and Goldblatt (2014, forthcoming). BIBLIOGRAPHICAL NOTES Brigid Freeman is a Research Fellow at the University of Melbourne, Australia. Miskus Lapan is the Principal Director, Island Research and Consultants, based in Port Moresby, Papua New Guinea. Professor Tracie Mafile’o is the Deputy Vice-Chancellor (Academic) at Pacific Adventist University in Port Moresby, Papua New Guinea. Nancy Capell is formerly from the University of California Office of the President, and is based in Oakland, California. Andrew Goldblatt is Risk Manager and Policy Co-ordinator, University of California – Berkeley, in California. Sue Thompson is Director, Academic Quality, Otago Polytechnic, Dunedin, New Zealand. REFERENCES Althaus, C., Bridgman, P., & Davis, G. (2013). The Australian policy handbook. Allen &
Unwin. Ball, S. J. (1998). Big policies/small world: An introduction to international perspectives in
education policy. Comparative Education, 34, 119-130. Braun, V. & Clarke, V. (2006) Using thematic analysis in psychology. Qualitative research
in psychology, 3(2), 77-101.
50
Brewer, G. D. (1974). The policy sciences emerge: to nurture and structure a discipline. Policy Sciences, 5(3), 239-244.
Cerych, L., & Sabatier, P. (1986). Great expectations and mixed performance: The implementation of higher education reforms in Europe. Stoke-on-Trent: Trentham.
Cohen, M. D. & March, J. G. (1986). Leadership and ambiguity: The American college president. Harvard Business Press.
Creswell, J. W. (2013). Research design: Qualitative, quantitative, and mixed methods approaches. Sage.
deLeon, P. (1999). The stages approach to the policy process: What has it done? Where is it going. Theories of the policy process, I, 19-32.
Dror, Y. (1971). Universities and the teaching of policy sciences. Policy Sciences, 2(1), 83-85.
Dye, T. R. (1972). Understanding public policy. Englewood Cliffs, NJ. Prentice-Hall. Freeman, B. (2010). Benchmarking to identify good practice University Policy
Frameworks. In Tertiary Education Management Conference, Melbourne 3-6 October 2010.
Freeman, B. (2012a). Innovative approaches, systems and resources for university policy review, Tertiary Education Management Conference (TEMC), Hotel Grand Chancellor, Adelaide 16-19 September 2012.
Freeman, B. (2012b, October). University policy review: What? Why? How? What’s with the big elephant. Paper session presented at a forum of the Association for Tertiary Education Management, University of Melbourne.
Freeman, B. (2013). Trans-Tasman policy borrowing: building resilience in institutional policy systems and processes through local and international sharing, networking and collaboration. Association for Tertiary Education Management (ATEM) Aotearoa Regional Conference, 4-5 July 2013. Victoria University of Wellington, New Zealand.
Freeman, B. (2014). Benchmarking Australian and New Zealand university meta-policy in an increasingly regulated tertiary environment. Journal of Higher Education Policy and Management, 36(1), 74-87.
Freeman, B., Hatwell, M., & Jensen, K. (2013a). Policy without (much) pain (2nd ed.). Melbourne: Association of Tertiary Education Management.
Freeman, B., Kelder, J., and Brown, N. (2013b). Case Study: Development of a policy implementation evaluation framework for the University of Tasmania Casual Teaching Staff Policy. Tertiary Education Management Conference (TEMC) 2013, 15-18 September 2013, Hobart.
Freeman, B., Capell, N. & Goldblatt, A. (2014, forthcoming), First hand voices from United States policy practitioners. ACUPA 2014, Orlando, Florida, United States, 19-21 October, 2014.
Freeman, B., Capell, N., Goldblatt, A., Lapan, M., Mafile’o, T. and Thompson, S. (2014). An international comparative perspective on institutional policy to enhance institutional governance, policy-making and policy infrastructure, for improved institutional outcomes. Association of University Administrators (AUA) Annual Conference, University of Manchester, 13-16 April 2014.
Goodman, L. A. (1961). Snowball sampling. The annals of mathematical statistics 32(1), 148–170. Hall, P. A. (1989). The political power of economic ideas: Keynesianism across nations. Hall, P. A. (1993). Policy paradigms, social learning, and the state: the case of economic
policymaking in Britain. Comparative politics, 275-296. Harman, G. (1984). Conceptual and theoretical issues, in J. R. Hough (ed). Educational
Policy: An International Survey, pp. 13-29. London: Croom Helm.
51
Harvey, M. & Kosman, B. (2014). A model for higher education policy review: the case study of an assessment policy, Journal of Higher Education Policy and Management, 36(1).
Howlett, M., & Cashore, B. (2014). Conceptualizing Public Policy. In I. Engeli and C.R. Allison (2014). Comparative Policy Studies: Conceptual and Methodological Challenges. Palgrave Macmillan.
Jenkins, W. I. (1978). Policy analysis: A political and organisational perspective. London: Robertson.
Jenkins-Smith, H. C., & Sabatier, P. A. (1993). The study of public policy processes. PA. Kingdon, J. W. (1984). Agendas, alternatives, and public policies. Little, Brown, Boston. Lasswell, H. D. (1951). The Policy Orientation. In Lerner, D. & Lasswell, H. D. (eds)
(1951). The Policy Sciences, Stanford University Press, Stanford. Lipsky, M. (1980). Street-level bureaucracy: Dilemmas of the individual in public services.
New York: Russell Sage Foundation. March, J. G. & Olsen, J. P. (1975). Choice situations in loosely coupled worlds.
Unpublished manuscript, Stanford University. Maxwell, J. (1997). Designing a qualitative study. In L. Bickman & D. J. Rog (Eds.)
Handbook of applied social research methods. Thousand Oaks, CA: Sage. McCaffery, P. (2010). The higher education manager's handbook: effective leadership and
management in universities and colleges. Routledge. Russette, H. C., Harris, K. J., Schuldberg, D., & Green, L. (2014). Policy Compliance of
Smokers on a Tobacco-Free University Campus. Journal of American College Health, 62(2), 110-116.
Smith, R. A. (1979). Decision making and non-decision making in cities: Some implications for community structural research. American Sociological Review, 147-161.
Smith, T. B. (1973). The policy implementation process. Policy Sciences, 4(2), 197-209. Starr, S., & Graham-Matheson, L. (2011). Efficacy of Turnitin in Support of an
Institutional Plagiarism Policy. Steiner-Khamsi, G. (2012). Understanding policy borrowing and lending. Building
comparative policy studies. World yearbook of education, 3-17. Trowler, P. R. (2002). Higher Education Policy and Institutional Change. The Society for
Research into Higher Education & Open University Press, Buckingham. Westerheijden, D. F., & Kohoutek, J. (2014). Implementation and Translation. In Drivers
and Barriers to Achieving Quality in Higher Education, edited by Heather Eggins, 5. Amsterdam: Sense Publishers.

52
53
ACTIONS SPEAK LOUDER THAN WORDS: UNIVERSITY OF WESTERN SYDNEY’S MYVOICE STAFF ENGAGEMENT
PROJECT - JOURNEY AND ACHIEVEMENTS
Aggie Lim & Kelly Lanfranca University of Western Sydney
[email protected]; [email protected] ABSTRACT This paper provides a case study about utilising the results of an employee engagement or organisational climate survey as a launching pad for engaging management and staff in improving organisational culture and practices. It explores how a tertiary education institution has responded to the survey results by implementing an innovative approach for gaining the buy-in of senior management and for engaging staff in addressing key areas for improvement. The survey results highlighted areas of strength and weakness in organisational, management and human resource practices. A number of strategies were implemented including the establishment of working groups to support sustainable change in eight challenging and critical areas for maximising employee engagement, and to harness the engagement of the institution’s leaders as mentors and sponsors. The paper also discusses significant achievements and lessons learned for engaging managers and staff in successfully implementing a complex organisation-wide project. KEY WORDS Employee engagement, staff engagement, organisational development, human resources management, universities INTRODUCTION Most Australian universities now conduct an employee engagement survey. The experience at the University of Western Sydney provides a case study for how the employee engagement survey results can be utilised as a strategic driver for engaging stakeholders – senior management, schools, research centres and divisional units, and academic and professional staff – to improve organisational culture and management and work practices, at the local and organisational-wide levels. The common experience for organisations conducting a survey is to achieve a reasonable response rate and assess how well the organisation has performed, benchmarked against previous surveys and the sector, then to announce the results to staff and identify areas for improvement to be actioned by a senior manager(s), with variable results in achieving organisational-wide outcomes. The University of Western Sydney conducted its first engagement survey in 2012. Eighty-three per cent of academic and professional staff provided feedback on a range of organisational and management practices. The overall level of satisfaction with working at the University was one per cent higher than the sector average. This was surprising as significant organisational restructuring had occurred in the six months before the survey.
54
Responses highlighted a number of strengths as well as areas for improvement. The Office of Organisational Development seized the opportunity for utilising the survey results as a launching pad for initiating organisational cultural change. Gaining the buy-in of senior management and staff is critical for actively engaging in university initiatives and for changing organisational culture. The MyVoice Staff Engagement Project demonstrates the benefits and challenges of adopting a whole-of–institution, top-down, bottom-up approach. This paper presents some of the outcomes achieved from the establishment of working groups to address key areas of improvement identified from staff feedback and survey results. The working groups enabled a forum for the staff voice to be heard. The University of Western Sydney is a multi-campus university and it was important to have a cross-representation of academic and professional staff from each of the campuses. A critical success factor for engagement was for the university to be seen by staff to respond to their feedback, given the unfavourable results directed at university management and some organisational practices. Communication with staff, particularly by the Vice-Chancellor, and achieving visible and tangible outcomes both at the institutional and local levels, were an important element for engaging staff following the survey. A second survey will be conducted in May 2015. This will provide results within the context of a three-year period of continuous disruptive change in organisational structure, systems and leadership and management including a change of Vice-Chancellor and senior leadership in early 2014, and changes in the higher education landscape and government policy. A key challenge remains in how to create sustainable change in organisational culture while maintaining motivation and momentum in employee engagement. What is Employee Engagement? Employee engagement is defined as ‘the extent to which employees are willing to invest discretionary effort (both emotional and intellectual) to accomplish the work, mission and vision of an organisation’ (i4cp, 2012, p4). Employee engagement is a measure of the commitment and loyalty to the organisation, how proud people are to be a part of it, and how passionate they are about their work and workplace. It includes people’s satisfaction with the work they do, the sense of personal accomplishment that their work provides, and also their desire and intention to remain with the organisation. Employee engagement has been shown to be strongly connected with productivity, innovation, turnover, and a range of other factors (Langford, 2009, 2010). An engaged employee therefore is one who is fully involved in and enthusiastic about their work and who will act in a way that furthers the organisation’s interests. It includes an emotional attachment to the job, colleagues or organisation, and influences the employee’s performance and willingness to learn and contribute. Smith (2014) believes that employee engagement is ‘largely a result of people feeling like they have an opportunity to make a difference in their role. The ability to express their opinion, feel like they have been heard and feel that there was consideration given to a view is extremely powerful in achieving that’. A culture where individuals are not listened to, or where people do not feel safe to speak up when they have a concern, places the organisation at risk of experiencing critical failures in systems or processes (Smith, 2014).
55
Management practices such as leadership, job design, recruitment and selection, training, compensation, performance management, and career development, can all strongly influence an employee’s level of engagement and commitment (SHRM, 2012). Engagement Survey and Results Employee engagement surveys are widely regarded as efficient measures of work practices and outcomes. They are increasingly used by universities for diagnosing and improving engagement, culture and leadership. Surveys measure a broad range of work outcomes such as job satisfaction or employee engagement; assess how well the organisation is performing and the relative importance of specific work practices; describe the climate or culture of the organisation; benchmark performance against other organisations; and estimate which management practices are more important than others for influencing employee outcomes such as organisational commitment, job satisfaction and intention to stay (Langford, 2009). The Human Resources Leadership Council (2012) conducted engagement surveys of more than 11,000 employees across all industries. They found that engagement strategies with lasting impact are those that account for past, present, and future measures of engagement, and target engagement efforts by critical workforce segments, rather than a ‘one-size-fits-all’ approach. They include action-planning approaches with both immediate and longer-term impact. Using a well-validated and normed survey (Langford, Parkes & Metcalf, 2006) to measure employee engagement and perceptions of organisational performance along a broad range of management practices, Langford (2009, 2010) benchmarked work practices and outcomes in Australian universities against other industries. In examining the results across seventeen universities, Langford (2010) identified common areas with lower scores that included cross-unit cooperation, career opportunities, managing change, involvement, processes, trust in leadership, recruitment and selection, facilities, and learning and development. He found that higher scoring practices and outcomes in universities were teamwork, role clarity, belief in mission and values, job satisfaction, talent of staff, organisational commitment, supervision, motivation and management of diversity. Langford’s (2010) research indicates that cross-unit cooperation is a significant predictor of outcomes, including productivity, management of change, innovation, and customer satisfaction. Of particular interest is that cross-unit collaboration in universities receives unfavourable scores yet, according to Langford, it is also a key predictor of performance. As Table 1 shows, the University of Western Sydney received an unfavourable result for cross-unit collaboration and therefore identified this as a key area for improvement. As will be demonstrated in this paper, the establishment of working groups are exemplars of cross-unit collaboration, and along with other targeted areas, it is expected that improvements in performance, management of change, and innovation will occur in the next survey.
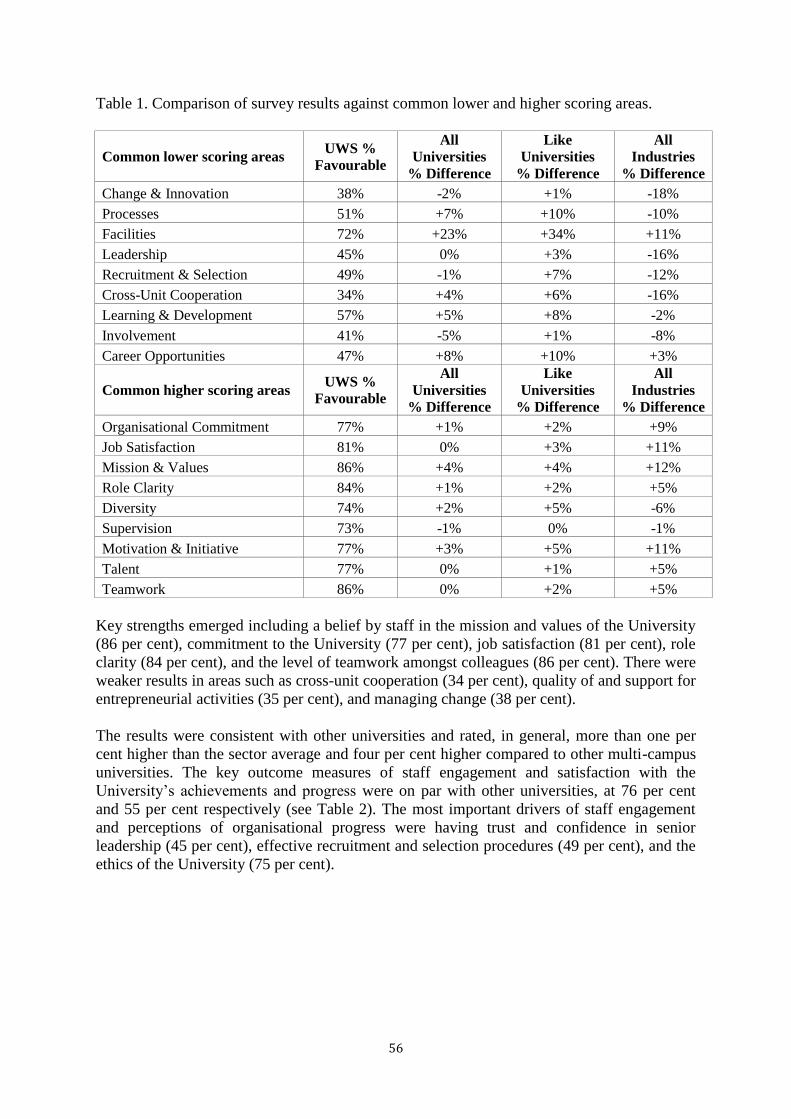
56
Table 1. Comparison of survey results against common lower and higher scoring areas.
Common lower scoring areas UWS % Favourable
All Universities
% Difference
Like Universities
% Difference
All Industries
% Difference Change & Innovation 38% -2% +1% -18% Processes 51% +7% +10% -10% Facilities 72% +23% +34% +11% Leadership 45% 0% +3% -16% Recruitment & Selection 49% -1% +7% -12% Cross-Unit Cooperation 34% +4% +6% -16% Learning & Development 57% +5% +8% -2% Involvement 41% -5% +1% -8% Career Opportunities 47% +8% +10% +3%
Common higher scoring areas UWS % Favourable
All Universities
% Difference
Like Universities
% Difference
All Industries
% Difference Organisational Commitment 77% +1% +2% +9% Job Satisfaction 81% 0% +3% +11% Mission & Values 86% +4% +4% +12% Role Clarity 84% +1% +2% +5% Diversity 74% +2% +5% -6% Supervision 73% -1% 0% -1% Motivation & Initiative 77% +3% +5% +11% Talent 77% 0% +1% +5% Teamwork 86% 0% +2% +5%
Key strengths emerged including a belief by staff in the mission and values of the University (86 per cent), commitment to the University (77 per cent), job satisfaction (81 per cent), role clarity (84 per cent), and the level of teamwork amongst colleagues (86 per cent). There were weaker results in areas such as cross-unit cooperation (34 per cent), quality of and support for entrepreneurial activities (35 per cent), and managing change (38 per cent). The results were consistent with other universities and rated, in general, more than one per cent higher than the sector average and four per cent higher compared to other multi-campus universities. The key outcome measures of staff engagement and satisfaction with the University’s achievements and progress were on par with other universities, at 76 per cent and 55 per cent respectively (see Table 2). The most important drivers of staff engagement and perceptions of organisational progress were having trust and confidence in senior leadership (45 per cent), effective recruitment and selection procedures (49 per cent), and the ethics of the University (75 per cent).
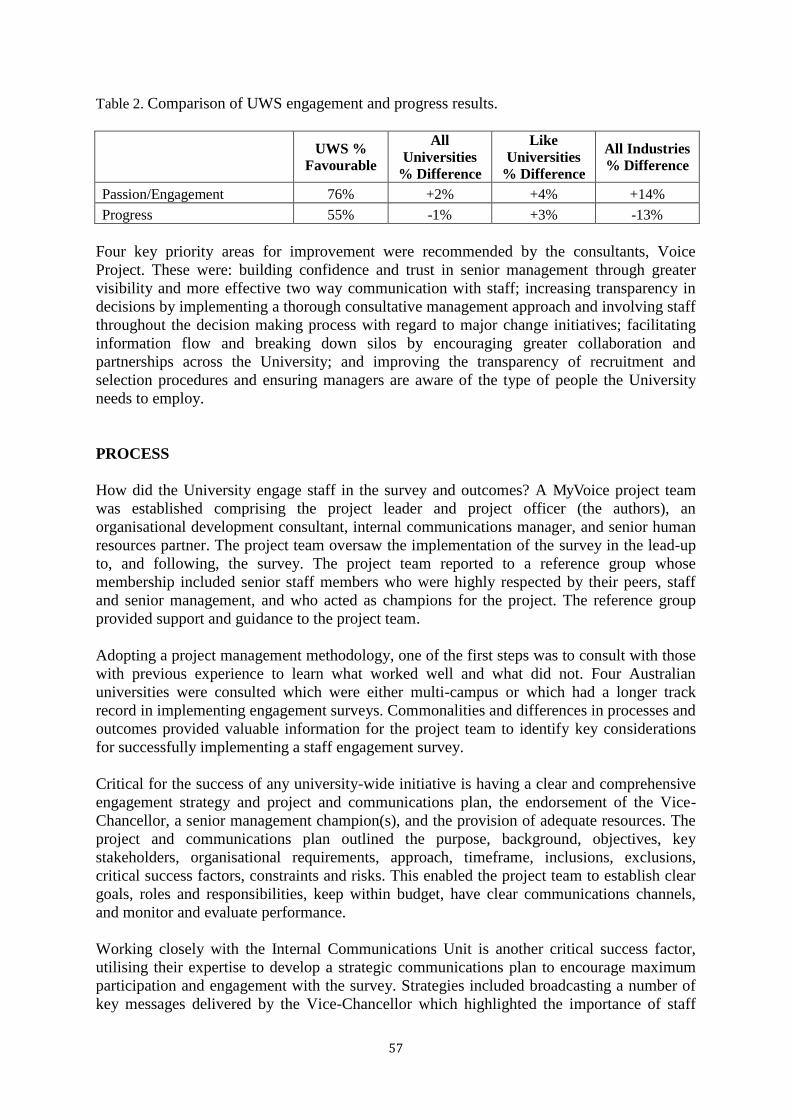
57
Table 2. Comparison of UWS engagement and progress results.
UWS % Favourable
All Universities
% Difference
Like Universities
% Difference
All Industries % Difference
Passion/Engagement 76% +2% +4% +14%
Progress 55% -1% +3% -13% Four key priority areas for improvement were recommended by the consultants, Voice Project. These were: building confidence and trust in senior management through greater visibility and more effective two way communication with staff; increasing transparency in decisions by implementing a thorough consultative management approach and involving staff throughout the decision making process with regard to major change initiatives; facilitating information flow and breaking down silos by encouraging greater collaboration and partnerships across the University; and improving the transparency of recruitment and selection procedures and ensuring managers are aware of the type of people the University needs to employ. PROCESS How did the University engage staff in the survey and outcomes? A MyVoice project team was established comprising the project leader and project officer (the authors), an organisational development consultant, internal communications manager, and senior human resources partner. The project team oversaw the implementation of the survey in the lead-up to, and following, the survey. The project team reported to a reference group whose membership included senior staff members who were highly respected by their peers, staff and senior management, and who acted as champions for the project. The reference group provided support and guidance to the project team. Adopting a project management methodology, one of the first steps was to consult with those with previous experience to learn what worked well and what did not. Four Australian universities were consulted which were either multi-campus or which had a longer track record in implementing engagement surveys. Commonalities and differences in processes and outcomes provided valuable information for the project team to identify key considerations for successfully implementing a staff engagement survey. Critical for the success of any university-wide initiative is having a clear and comprehensive engagement strategy and project and communications plan, the endorsement of the Vice-Chancellor, a senior management champion(s), and the provision of adequate resources. The project and communications plan outlined the purpose, background, objectives, key stakeholders, organisational requirements, approach, timeframe, inclusions, exclusions, critical success factors, constraints and risks. This enabled the project team to establish clear goals, roles and responsibilities, keep within budget, have clear communications channels, and monitor and evaluate performance. Working closely with the Internal Communications Unit is another critical success factor, utilising their expertise to develop a strategic communications plan to encourage maximum participation and engagement with the survey. Strategies included broadcasting a number of key messages delivered by the Vice-Chancellor which highlighted the importance of staff
58
feedback, that responses were confidential and anonymous, and what the University intended to do with the results. A wide variety of communication channels were employed with MyVoice branding on emails, posters and postcards distributed to all staff, along with a range of incentives to encourage group and individual participation. A unique approach was adopted to encourage survey completion. For every survey completed the Vice-Chancellor donated five dollars to student scholarships. As a result of the high response rate, a two-year scholarship was awarded to a student confined to a wheelchair to enable her to complete her studies. Schools and work areas were encouraged to host a MyVoice morning tea to bring their staff together and thank them for taking the opportunity to have their say. Individual prizes were randomly drawn at the end of each day where staff elected to enter a prize draw on completion of the survey. A video clip of staff sharing their views on why it was important for staff to have their say was produced. As the survey end date approached, the call centre was employed to call and invite staff to complete the survey or thank them if they had already completed the survey. The detailed, comprehensive and well thought-through communications plan was vital for maximising participation in the survey. The high response rate of eighty-three per cent ensured that a wide demographic of staff was represented and that the results were meaningful. A key message in the lead up to the survey was a commitment by the University to respond to staff feedback. Immediately following the release of survey results, it was therefore critical to inform staff how the University was responding to their feedback and acting on the results. A key lesson shared from other universities was that inaction could lead to staff having little reason to complete another survey and generate high levels of mistrust in senior management. To ensure the authenticity of the survey results, the external consultants presented the results and recommendations to the Vice-Chancellor, Board, Executive, senior managers, and schools and divisional unit management. This was particularly important for areas that received unfavourable results in order to acknowledge staff feedback. Managers were provided with information packs to then communicate and discuss the results with their staff with the support of the Project Team. For the wider university community, the Office of Organisational Development presented the results and recommendations to staff in each work unit. This also enabled the development of in-house expertise in the survey instrument and interpretation of results, and ongoing support to areas. A series of emails from the Vice-Chancellor to staff communicated the high level results, how the University was planning to respond, and invited staff to ‘Town Hall’ meetings to discuss the results. The creation of a MyVoice website enabled staff to access the results and remain informed of actions being taken. To ensure responsibility for acting on results at the local level, deans and directors were required to develop and implement action plans that targeted key areas for improvement specific to their MyVoice results, to include these in their operational plans, and to provide six-monthly progress reports to the executive.
59
Post-Survey Implementation Phase Working groups were established to address the recommendations by the external consultants and a total of eight areas of improvement were identified to support sustainable change. These were senior management communication, inclusive decision-making, cross-unit collaboration, career development for academic and professional staff, recruitment and selection, supporting new staff, and responding to workplace bullying. The survey results identified these areas as critical for improving organisational performance and maximising employee engagement, in alignment with the organisation's strategic goals. Membership of the working groups was an important factor for ensuring academic and professional staff representation from across nine schools, four institutes, three divisional portfolios, six campuses, and from early career to senior levels. Deans and directors were asked to nominate staff representing a broad cross-section of the University and who would positively and actively contribute to discussions, represent the best interests of the University, gather ideas from others and help keep colleagues informed. This process facilitated support from senior managers and helped ensure that engaged staff were selected. The project team reviewed the nominations to fill any gaps in representation from all levels of staff, campuses, schools, and divisional units. Staff received a personal invitation from the Vice-Chancellor to join the working groups, and the support of their supervisors was sought for their participation. Reference group members also chaired the working groups. This enabled cross-unit collaboration and information sharing using a distributive leadership approach. The working groups were supported by the project team and a dedicated project officer, and mentored by a member of the Executive and a dean, enabling a flow of communication up and down with senior management and staff. Each of the working groups developed comprehensive action plans and the Vice-Chancellor provided seed money to implement their plans. The working groups have met bi-monthly to implement their plans. All working groups are brought together every six months to participate in a MyVoice forum attended by the Vice-Chancellor and mentors, to showcase achievements and engage in discussions on key areas of focus leading to the next survey in 2015. MyVoice forums have been successfully designed to engage staff and senior management using innovative processes such as café conversations engaging participants in focussed discussions that generate high levels of energy, participation and identification of common themes. Working group membership continues two years following the survey with the majority of original members continuing, a testament to the commitment of staff whose involvement is entirely voluntary. Over ninety academic and professional staff continue to be involved in the working groups. OUTCOMES A number of tangible outcomes have been achieved at the university-wide level. These include: ‘Meet the Executive’ campus forums, regular email and social media (Yammer)
communication from the Vice-Chancellor, and opportunities for small groups of staff to meet informally with the Vice-Chancellor over coffee a framework for decision-making using guiding principles
60
an online recruitment process map, glossary and guidelines ‘Effective Emails’ web page and desk tent card an improved welcome pack for new staff a booklet on Checklists to Capture Evidence for Academic Achievement, mentors and resources for promotion applications, and a speed mentoring program for early career academic staff online modules on career development for early career academics and professional staff an improved Professional Development Policy and increase in the Education Support Allowance, and an online stop bullying toolkit and information sessions for responding to workplace bullying.
At the school and divisional level, reported outcomes include: piloting a mentoring program for professional staff in the Library and School of Science and Health to enhance career opportunities and increase cross-unit collaboration; changing the culture and leadership model of the Library to one of open communication and empowerment; establishment of gardens and sporting events in the School of Science and Health to improve staff wellness; reengineering end-to-end processes and building leadership capacity in Information Technology Services; holding BBQ lunches and a Community of Practice Forum for cross-unit information sharing in the Office of People and Culture; and introducing a program for creating a positive culture to foster positive workplaces. DISCUSSION The Gallup State of the Global Workplace Report (2013) estimates that 24 per cent of Australian employees are engaged, that is, about one in four employees are psychologically committed to their jobs and making positive contributions to their organisations. They estimate that 76 per cent of Australian employees are either not engaged (60 per cent) – that is, lack motivation and are less likely to invest discretionary effort in the organisation’s goals or outcomes, or are actively disengaged (16 per cent) – that is, are unhappy and unproductive at work and liable to spread negativity in the workplace (Crabtree, 2013; Gallup, 2013). It is estimated that a disengaged worker costs approximately $US13,000 in yearly productivity losses (Gallup, 2013). Shuck et. al., (2011) estimate that employees who are disengaged cost organisations in the United States approximately 35 per cent of their payrolls and disengaged employees cost organisations US$343 billion annually. Thus, the costs of a disengaged workforce are significantly high with low levels of engagement among workers globally continuing to hinder gains in economic productivity and quality of life. Various authors have researched the relative importance of employee engagement on performance (Baysinger, 2012; Gallup, 2013; HRLC, 2012; Langford, 2010) and on trust in senior management (Rees, Alfes & Gatenby, 2013; Wang & Hsieh, 2013). A meta-analysis of studies on engagement (Gallup, 2013; Reilly, 2014) confirms that employee engagement relates to nine key performance outcomes and that strong correlations between engagement and performance are highly consistent across different organisations from diverse industries and regions of the world. How much change is achievable? Langford (2010) believes that measurable improvements can occur when a long term view is taken, achievable change is benchmarked, expectations
61
are managed, quick wins are planned and achieved, and what is working well is continuously reviewed and polished. With these perspectives in mind, the business case for investing in a short- to long-term engagement strategy that is comprehensive and integrated into school and business unit operations is critical for having an engaged workforce that positively contributes to the organisation’s mission and goals, and increases employee engagement and organisational performance. A number of lessons have been learned through the MyVoice Project for engaging employees. The first lesson relates to identifying the critical success factors. Langford (2011) describes a number of traps to avoid when conducting an employee survey. The University of Western Sydney has managed to avoid and turn these traps into critical success factors for responding to staff feedback. These include: an organisational willingness to act on feedback; providing the survey results to staff when the final results were available, and by doing so, demonstrate a level of employee trust and engagement; requiring work units to develop an action plan and report on progress, thereby demonstrating accountability for addressing areas of improvement; and specifically targeting improvements in areas that have shown the greatest improvement in performance and engagement. Of the areas identified by Langford (2011), the University performed well in staff understanding organisational direction and the quality of facilities, and performed less favourably, and therefore targeted improving trust in senior leadership, career opportunities, satisfaction with recruitment and selection processes, and involvement in decision-making. The second lesson related to leadership and employee engagement. Although there is little research on the impact of leadership on engagement in the higher education sector, we can draw on studies such as that by Wang & Hsieh (2013) who examined the effect of authentic leadership on employee engagement in over 1,500 Taiwanese companies and found that supervisors' consistency between words and actions and moral perceptions are positively related to employee engagement, and that employee trust was positively related to employee engagement. Improving the level of trust between staff and senior leaders is a stronger predictor of engagement and performance than the relationship between staff and supervisors (Langford, 2011). Langford (2011) suggests that senior management must actively promote and communicate the survey and results and demand concrete action from all work units. He suggests that staff expect the Executive to respond to the survey results and staff feedback and that this should not be delegated to managers. Langford (2011) also suggests that managers should have the freedom, resources and be rewarded for being innovative in addressing areas for development. Thus, leadership is key to employee engagement with the mission of the organisation and improving performance and productivity. The third lesson relates to effective communication with staff. According to Langford (2011), failing to communicate to staff what was done and how it was linked to what staff asked for is a trap that should be avoided. Communicating the actions and achievements and linking these back to the survey results is critical for staff to understand the usefulness of the survey and that their feedback is taken seriously and is making a genuine difference to the workplace. Internal communication underpins organisational effectiveness and positive relationships by enabling communication between senior managers and employees (Welch, 2012). A two-way flow of communication both top-down and across the organisation is essential for promoting and maintaining employee engagement and motivation (Groysberg &
62
Slind, 2012). Communication helps establish transparency of decisions and gaining trust in leadership, the building of positive relations and interactive dialogue, a sense of involvement in the organisation, and commitment by management to responding to feedback. Partnering with the Internal Communications Unit was a key measure of success at every point in the pre-, during and post-survey process and in responding to feedback directed at university management and organisational practices. The development and implementation of a communications plan has facilitated ongoing engagement and being seen by staff that the University and Vice-Chancellor have been responding to their feedback. Communication with staff, particularly by the Vice-Chancellor, and achieving visible and tangible outcomes both at the institutional and local levels were important elements for the project’s success. The fourth lesson relates to the role of human resource partners and organisational developers. Langford (2011) believes that throughout the survey and results implementation process, the role of the Office of Human Resources is important for supporting and overseeing the development of action plans at the university-wide and local levels, while school and business unit managers are responsible and accountable for making and implementing the action plans within their work units. The fifth lesson relates to employee-led engagement initiatives. Cardus (2013) discusses five levers for achieving employee engagement including hiring competent managers, setting broad goals and objective measures of progress, providing sufficient autonomy and appropriate resources. Autonomous employees tend to feel responsible for the choices they make. Involving staff in the working groups, inviting them to contribute ideas for addressing areas of improvement and providing seed funding to implement their ideas, creates the conditions for leveraging engagement and supporting autonomy and responsibility. There is little research on the effectiveness of employee-led rather than management-driven initiatives. A United States government department undertook a substantive employee-led, employee engagement initiative, resulting in improved employee satisfaction and sense of ownership in creating a positive place to work for public service workers (Shuck et. al., 2011). The working groups at the University of Western Sydney have essentially been employee-led and the tangible outcomes that have been achieved demonstrate the kinds of initiatives that can be produced by staff to make a difference in the workplace. Finally, a comment should be made about the value of benchmarking. Benchmarking survey results and practices, either externally with other universities, or internally between schools and divisional areas, is considered favourable (Langford, 2010) under several circumstances if: appropriate comparison organisations or areas are identified the comparison data is interpreted in the context of different organisational cultures
and operating environments valid, reliable and generalisable measures are used management is committed to act on identified gaps, and the benefits exceed the costs of the benchmarking and change process. Benchmarking with over forty universities in Australia and New Zealand has the potential to provide the University with valuable data on a range of work practices to inform workforce planning.
63
Limitations There are several limitations to conducting engagement surveys and the interpretation of results. One limitation is that, despite various reassurances and mechanisms for ensuring anonymity, staff may not believe they will remain anonymous or that their feedback is confidential. On this basis, they may either choose not to participate or question the interpretation of the results. The demographic questions relating to position levels, gender, organisational unit and campus, may lead staff to believe they and their responses are identifiable. A second limitation is that staff opinion is influenced by both the reality and perception of the item being rated, and the communication of the rating (Langford, 2010). Feedback from employee engagement surveys are dependent on self-reported scores that are influenced by both the organisational context at the time of undertaking the survey and employee interpretations and perceptions of that reality (Langford, Parkes & Metcalf, 2006). The timing of the survey and what is happening in the organisation will therefore be reflected in the survey results, and the rapidly changing higher education context and organisational priorities provide caution in how the results are interpreted and benchmarked against other organisations. It is too early in the experience of the University of Western Sydney to benefit from a longitudinal perspective of survey results. A third limitation is that, despite the concerted effort at engaging staff through the processes outlined in this paper, whether these efforts result in improved engagement and performance will not be known until the second survey is conducted in 2015 and the results benchmarked against the first survey and the sector. This will provide results over a three-year period of significant organisational and leadership change. The key challenge remains in how to create sustainable change while maintaining motivation and momentum in employee engagement. Finally, Langford (2011) suggests that choosing too many things to improve or trying to achieve too much, acts to thinly spread attention, time, and resources, rather than focusing on a few things and doing them well. Only the results of the next survey will prove the success and effectiveness of the approach taken by the University and in the choice of the eight areas for improvement. CONCLUSION Organisations that have or develop high levels of employee engagement, benefit from increased engagement and commitment to the organisation, increased job satisfaction with lower staff turnover, and higher levels of performance and productivity. The business case for universities capitalising on employee engagement surveys to measure engagement and performance is clear. There is a distinct competitive advantage in having higher levels of engagement. Most research on employee engagement focuses on leveraging outcomes toward increasing performance. There is little research or focus on identifying the conditions that nurture sustained employee engagement and performance (Shuck, & Rose, 2013). This paper suggests several factors or conditions for sustained employee engagement and harnessing the commitment of management and staff in collaboratively working towards addressing key areas for improvement and producing tangible outcomes that are communicated and seen by staff to be responding to their feedback.
64
This paper presents a case study for what strategies an organisation, and specifically human resource or organisational development practitioners can employ to cultivate positive conditions for employee engagement and for gaining the buy-in of management. The experience at the University of Western Sydney provides a model for cross-unit collaboration where the success of an organisational-wide project is dependent on strong and collaborative partnerships and relationships, linking the survey results and actions to the organisation’s strategic goals, and identifying and communicating quick wins and outcomes to staff on a regular basis. The use of working groups with cross-representation of staff from all areas, roles and job families, with a focussed area of improvement, and with mentoring by a member of the Executive, provides an effective approach to reframing engagement within the context of meaningful and purposeful collaboration that crosses the academic and professional staff and manager and staff divide, whether real or hierarchically imposed. Together these provide an organisational development and employee-led rather than management driven approach and perspective from which to view the conditions that effectively cultivate sustained engagement. ACKNOWLEDGEMENTS The authors would like to acknowledge Dr. Peter Langford from Voice Project for the provision of support and reference materials, members of the project team including Leanne Findlay, Phillip Marler, and Abigail Srinivasan; members of the reference group including Jonathon Allen, Scott Christensen, Susan Hudson, Tatiana Lozano, Jennifer Purcell, Deborah Sweeney, Ann Tout and Chris Youness; and mentors and all members of the MyVoice working groups. The authors also acknowledge all who provided helpful comments on the draft of this paper including Leone Cripps and Reena Dobson. Further information on the MyVoice Project is available from the authors and website at www.uws.edu.au/myvoice. BIOGRAPHICAL NOTES Aggie Lim MAppSc (Coaching Psyc) is Director, Organisational Development, Office of People and Culture, University of Western Sydney, Sydney, New South Wales, Australia. Kelly Lanfranca BBus is the Project Officer, Organisational Development, Office of People and Culture, University of Western Sydney, Sydney, New South Wales, Australia. REFERENCES Baysinger, M. (2012). The relative importance of employee engagement, other job attitudes, and trait affect as Predictors of Job Performance. Journal of Applied Social Psychology, 42, 295-326. Cardus, M. (2013). The five levers of employee engagement. The Journal for Quality and Participation, 36(2), 28-31.
65
Crabtree, S. (2013). Low workplace engagement offers opportunities to improve business outcomes. Retrieved from http://www.gallup.com/poll/165269/worldwide-employees-engaged-work.aspx#1 Gallup. (2013). State of the Global Workplace: Employee Engagement Insights for Business Leaders Worldwide. Retrieved from http://www.gallup.com/strategicconsulting/164735/state-global-workplace.aspx Groysberg, B. & Slind, M. (2012). Leadership is a conversation: how to improve employee engagement and alignment in today's flatter, more networked organizations. Harvard Business Review, 90(6), 76-85. Human Resource Leadership Council (HRLC). (2012). Engagement Strategy Playbook: Ten Steps for Improving Your Employee Engagement Strategy. Corporate Leadership Council, The Corporate Executive Board Company. Retrieved from http://www.HRLeadershipCouncil.com Institute for Corporate Productivity (i4cp). (2012). Employee Engagement Survey Preliminary Results. Seattle, WA, USA. Langford, P. H., Parkes, L. P. & Metcalf, L. (2006). Developing a structural equation model of organisational performance and employee engagement. Paper presented at the Joint Conference of the APS and NZPsS, 26-30 September 2006, Auckland, New Zealand. Langford, P. H. (2009). Measuring organisational climate and employee engagement: Evidence for a 7 Ps model of work practices and outcomes. Australian Journal of Psychology, 61(4), 185-198. Langford, P. H. (2010). Benchmarking work practices and outcomes in Australian universities using an employee survey. Journal of Higher Education Policy and Management, 32(1), 41-53. Langford, P. H. (2011). Top ten traps to avoid when running an employee survey. Capacity, 13. Rees, C., Alfes, K. & Gatenby, M. (2013). Employee voice and engagement: connections and consequences. The International Journal of Human Resource Management, 24(14). 2780-2798. Reilly, R. (2014). Five ways to improve employee engagement now. Gallup Business Journal. Retrieved from http://businessjournal.gallup.com/content/166667/five-ways-improve-employee-engagement.aspx Shuck, B., Reio, T. G., Wollard, K. K., Rivera, A. & Flinck, J. (2011). Employee-Led, Employee Engagement in the Federal Government. Advances in Developing Human Resources, 13(4), 479-493. Shuck, B. & Rose, K. (2013). Reframing employee engagement within the context of meaning and purpose. Advances in Developing Human Resources, 15(4), 341-355.
66
SHRM. (2012). Employee Engagement: Your Competitive Advantage. SHRM Foundation Executive Briefing. Retrieved from www.shrmfoundation.org Smith, A-L., (2014). On the importance of employee engagement. Interview by HRM online 12 June 2014. Retrieved from http://www.hrmonline.com.au/section/profiles/five-minutes-amanda-lea-smith/?utm_source=HRM&utm_medium=e%2Dnews&utm_campaign=HRM+announcement Wang, D-S. & Hsieh, C-C., (2013). The effect of authentic leadership on employee trust and employee engagement. Social Behavior and Personality, 41(4), 613-623. Welch, M., (2012). Appropriateness and acceptability: Employee perspectives of internal communication. Public Relations Review, 38(2), 246-254.
67
BENCHMARKING INTERNATIONAL STUDENT EXPERIENCE
Sara Booth, University of Tasmania, [email protected] Jeanne Keay, University of the West of Scotland, [email protected]
David Sadler, University of Tasmania, [email protected] Tim Duffy, University of the West of Scotland, [email protected]
Shannon Klekociuk, University of Tasmania, [email protected] ABSTRACT An international benchmarking project with the universities of Tasmania and the West of Scotland was undertaken (February-July, 2014) to understand three aspects of internationalisation: 1) international student experience; 2) external relationships and collaborations and 3) domestic students’ internationalisation experience. Findings and key lessons learnt from the cross-institutional, international peer review benchmarking exercise are presented and discussed. KEY WORDS Benchmarking, international students, internationalisation, student experience INTRODUCTION The globalisation of higher education has stimulated many changes in the sector such as students and staff being recruited from around the world and universities building alliances and networks with others on common interests and profiles (Debowski, 2012). These changes have had significant impacts on universities in relation to their internationalisation agendas and investment in international student recruitment. Internationalisation can be defined as ‘the process of integrating an international, intercultural or global dimension into the purpose, functions or delivery of post-secondary education’ (Knight, 2003, p. 2). Universities often
address internationalisation through their mission statements. They sometimes use it as an organisational change strategy in an attempt to fully integrate internationalisation across the institution and to brand themselves for competitive purposes (Altbach & Knight, 2007; Knight, 2004). Interestingly, the global shift in universities that include internationalisation in their missions has highlighted the often contradictory ideologies and tensions within the sphere of internationalisation, such as the pragmatics of internationalisation, commercial motives, cultural ideologies and how to provide students with global competencies (Agnew, 2012). The international higher education drivers which impact on a university’s approach to internationalisation include an increasingly mature international marketplace; increased demand for ‘in country’ provision; the need for domestic students to appreciate a global and international environment; the employability agenda and the global citizenship agenda. In relation to the United Kingdom (UK) and specifically Scotland, a number of national drivers have been identified. These include the need to: internationalise the learner experience; generate additional income; improve employability potential and improve position in UK university league tables. Similarly, in Australia the national drivers include the employability agenda; uncapping; the global citizenship agenda and the recruitment of international students as a national economic indicator. The release of the New Colombo Plan in Australia, which is a $100 million initiative of the Australian Government, is about providing support to

68
Australian undergraduates to study and undertake internships in the Indo Pacific region and involve partnerships with governments, universities and business to drive this initiative (DFAT, 2014). With the uptake of internationalisation agendas and strategies across the higher education sector, there has been keen interest in external reference points or frameworks for internationalisation, particularly for quality assurance purposes. With the recent release of the draft Higher Education Standards Framework (HESF) in Australia, the onus has been put on higher education providers to assure the quality of the student experience such as academic preparation, orientation, diversity and equity, wellbeing and safety and the opportunity for students to provide feedback. In the UK, the Higher Education Academy (HEA) has recently released a strategic framework called Internationalising Higher Education: Framework for action (HEA, 2014). The purpose of the framework is that it can be used by higher education providers as a reference point to discuss various strategies and approaches to internationalisation across the sector. The Framework can be used as a self-reflective audit tool; communication tool; staff development tool; curriculum review tool and a benchmarking and planning tool (HEA, 2014). Reference points for measuring the quality of the international student experience in higher education providers include the International Student Barometer (ISB) across many countries; the National Survey of Student Engagement (NSSE) in the UK and the University Experience Survey (UES) in Australia. However, these are outcome indicators rather than process indicators and provide a limited overview of quality of the student experience. Van Gaalen (2009) developed a mapping/benchmarking tool for internationalisation based on outcome indicators but used it for ranking purposes only. Krause, Coates and James (2005) developed a framework of internationalisation indicators which included five dimensions: strategic, teaching and learning, student, faculty and research. However, there is very little reference to criteria to measure the quality of the internationalised student experience (Arkoudis, Baik, Marginson & Cassidy, 2012). A review of the literature to date indicates that explicit benchmarking of internationalisation processes has not been undertaken. BACKGROUND An international benchmarking project was undertaken (February-July, 2014) with the universities of Tasmania and the West of Scotland to understand three aspects of internationalisation: 1) international student experience; 2) external relationships and collaborations and 3) domestic students’ internationalisation experience. The University of Tasmania in its strategic plan, Open to Talent: Strategic Plan 2012-Onwards, explicitly states that:
‘International students comprise a relatively small proportion of our student body when compared to other Australian universities. By working in partnership with our schools and our state, we expect significant growth of this cohort (p .7)’.
In addition to this, the University has developed a global engagement and internationalisation plan, Engaged Globally (2013-2018), which outlines a set of goals focused on key dimensions of global engagement. These dimensions embody three themes: engagement and partnerships; internationalising the curriculum for global competency and international
69
student recruitment. The Pro Vice-Chancellor for Global Engagement (PVC-GE) has oversight of this plan and reports directly to the Deputy Vice Chancellor Students and Education (DVC-SE). The Global Engagement Committee is the key internal academic governance committee for internationalisation. The Office of the PVC-GE provides strategic and operational support in the portfolio. The University of the West of Scotland’s strategic plan, Looking Forward-Strategic Plan 2008-2015, highlights internationalisation;
‘For a university such as UWS, which has taken significant strides in recent years in increasing its international student recruitment and other activities, but is starting from a historically low base; this is a major challenge… Overseas, our principal approach must be to build our international activities through partnership working, ensuring that we use our institutional relationships to develop the whole range of our offering with our international partner (p. 6)’.
UWS also has in place an Internationalisation and Global Citizenship Strategy (2011-2015) which outlines the main themes in internationalisation: UWS students; effective governance and operations; UWS colleagues; learning and teaching; research and knowledge exchange; and financial management. The University of the West of Scotland has a Vice Principal International who has oversight of all internationalisation activities. Both universities have identified international student recruitment and partnerships as key themes in internationalisation. METHODS The approach used for this international benchmarking project is underpinned by the methodology used in the Australasian Council on Open, Distance and E-Learning (ACODE) (2007) e-learning benchmarks. Benchmarking can be described as ‘first and foremost, a learning process structure so as to enable those engaging in the process to compare their services/activities/products in order to identify their comparative strengths and weaknesses as a basis for self-improvement and/or self-regulation’ (Jackson & Lund, 2000, cited in Stella & Woodhouse, 2007, p. 14). The aims of this benchmarking project are: To compare internationalisation across two countries. To compare internationalisation processes across two universities. To identify areas of good practice, areas for improvement and areas for sharing
potential developments. The methods used during this study included the production of institutional context statements; completion of a self-review survey and a face-to-face peer review workshop between the benchmarking partners. Transcripts from the peer review workshop were collated by both universities and sent back to participants for validation. The institutional context statements were discussed at the peer review workshop and allowed comparison of approaches to internationalisation. Key points of interest and difference such as higher education drivers, national regulatory policies, institutional drivers and overview of the university were also identified and discussed (see Appendix 1).
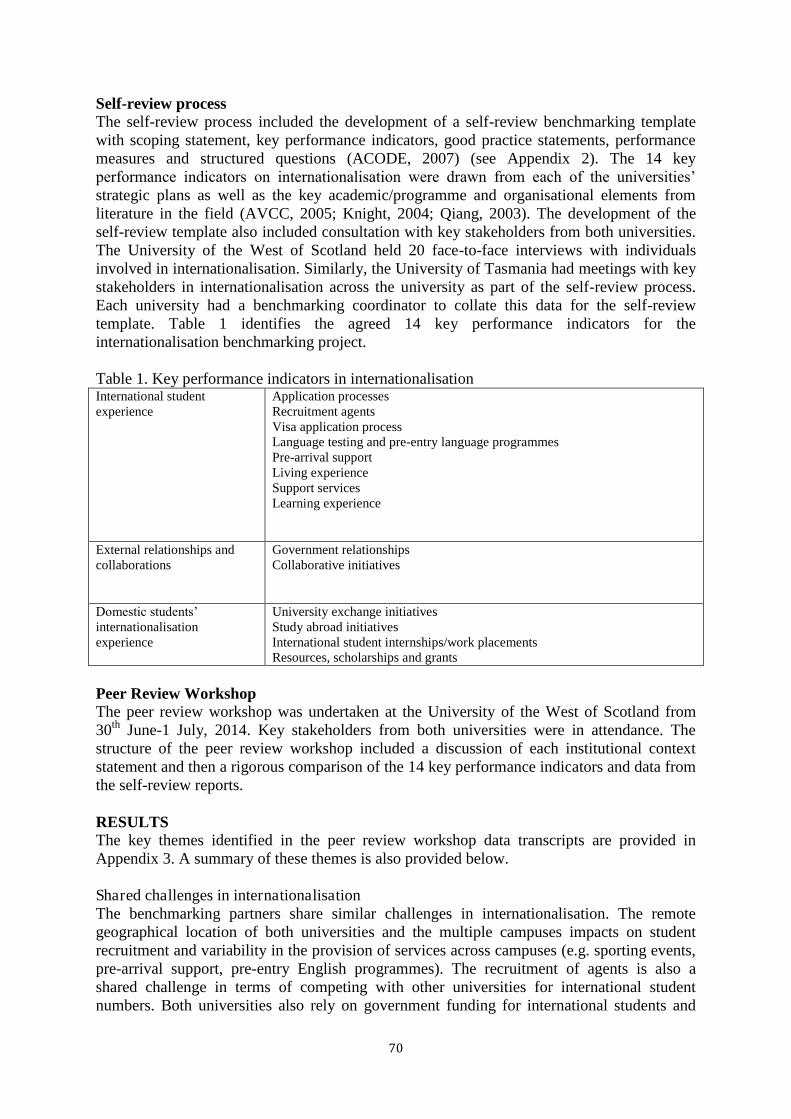
70
Self-review process The self-review process included the development of a self-review benchmarking template with scoping statement, key performance indicators, good practice statements, performance measures and structured questions (ACODE, 2007) (see Appendix 2). The 14 key performance indicators on internationalisation were drawn from each of the universities’ strategic plans as well as the key academic/programme and organisational elements from literature in the field (AVCC, 2005; Knight, 2004; Qiang, 2003). The development of the self-review template also included consultation with key stakeholders from both universities. The University of the West of Scotland held 20 face-to-face interviews with individuals involved in internationalisation. Similarly, the University of Tasmania had meetings with key stakeholders in internationalisation across the university as part of the self-review process. Each university had a benchmarking coordinator to collate this data for the self-review template. Table 1 identifies the agreed 14 key performance indicators for the internationalisation benchmarking project. Table 1. Key performance indicators in internationalisation International student experience
Application processes Recruitment agents Visa application process Language testing and pre-entry language programmes Pre-arrival support Living experience Support services Learning experience
External relationships and collaborations
Government relationships Collaborative initiatives
Domestic students’ internationalisation experience
University exchange initiatives Study abroad initiatives International student internships/work placements Resources, scholarships and grants
Peer Review Workshop The peer review workshop was undertaken at the University of the West of Scotland from 30th June-1 July, 2014. Key stakeholders from both universities were in attendance. The structure of the peer review workshop included a discussion of each institutional context statement and then a rigorous comparison of the 14 key performance indicators and data from the self-review reports. RESULTS The key themes identified in the peer review workshop data transcripts are provided in Appendix 3. A summary of these themes is also provided below. Shared challenges in internationalisation The benchmarking partners share similar challenges in internationalisation. The remote geographical location of both universities and the multiple campuses impacts on student recruitment and variability in the provision of services across campuses (e.g. sporting events, pre-arrival support, pre-entry English programmes). The recruitment of agents is also a shared challenge in terms of competing with other universities for international student numbers. Both universities also rely on government funding for international students and
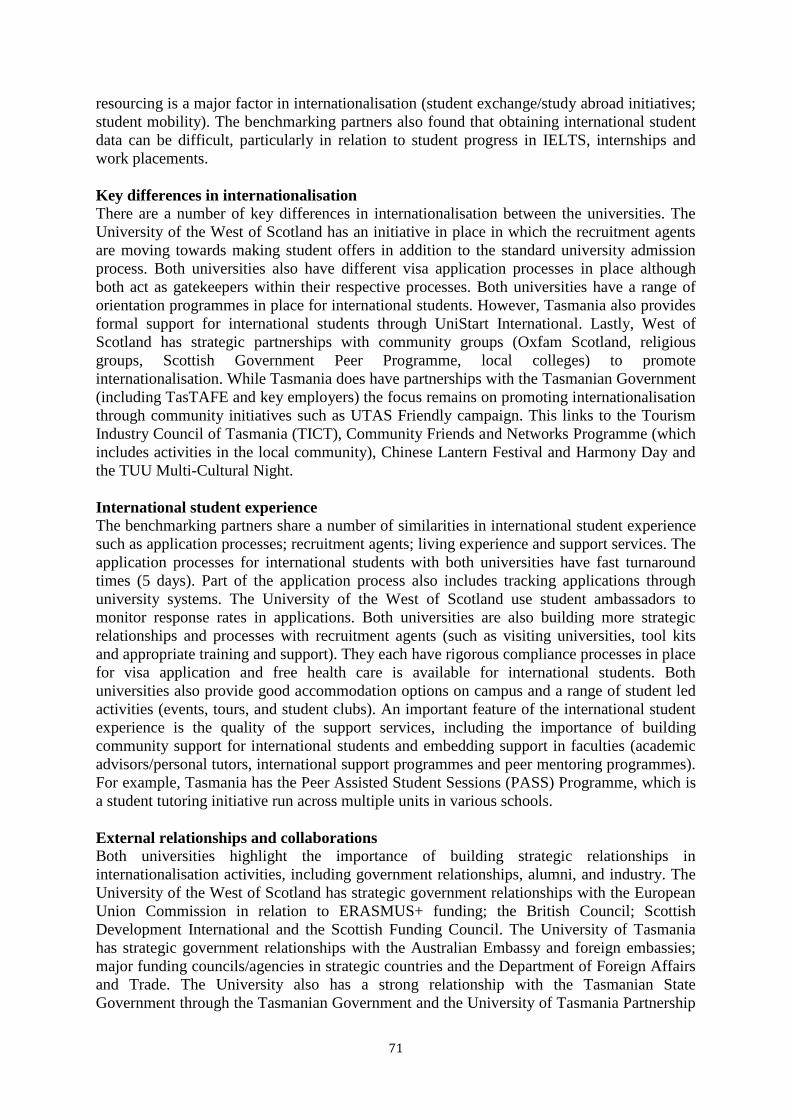
71
resourcing is a major factor in internationalisation (student exchange/study abroad initiatives; student mobility). The benchmarking partners also found that obtaining international student data can be difficult, particularly in relation to student progress in IELTS, internships and work placements. Key differences in internationalisation There are a number of key differences in internationalisation between the universities. The University of the West of Scotland has an initiative in place in which the recruitment agents are moving towards making student offers in addition to the standard university admission process. Both universities also have different visa application processes in place although both act as gatekeepers within their respective processes. Both universities have a range of orientation programmes in place for international students. However, Tasmania also provides formal support for international students through UniStart International. Lastly, West of Scotland has strategic partnerships with community groups (Oxfam Scotland, religious groups, Scottish Government Peer Programme, local colleges) to promote internationalisation. While Tasmania does have partnerships with the Tasmanian Government (including TasTAFE and key employers) the focus remains on promoting internationalisation through community initiatives such as UTAS Friendly campaign. This links to the Tourism Industry Council of Tasmania (TICT), Community Friends and Networks Programme (which includes activities in the local community), Chinese Lantern Festival and Harmony Day and the TUU Multi-Cultural Night. International student experience The benchmarking partners share a number of similarities in international student experience such as application processes; recruitment agents; living experience and support services. The application processes for international students with both universities have fast turnaround times (5 days). Part of the application process also includes tracking applications through university systems. The University of the West of Scotland use student ambassadors to monitor response rates in applications. Both universities are also building more strategic relationships and processes with recruitment agents (such as visiting universities, tool kits and appropriate training and support). They each have rigorous compliance processes in place for visa application and free health care is available for international students. Both universities also provide good accommodation options on campus and a range of student led activities (events, tours, and student clubs). An important feature of the international student experience is the quality of the support services, including the importance of building community support for international students and embedding support in faculties (academic advisors/personal tutors, international support programmes and peer mentoring programmes). For example, Tasmania has the Peer Assisted Student Sessions (PASS) Programme, which is a student tutoring initiative run across multiple units in various schools. External relationships and collaborations Both universities highlight the importance of building strategic relationships in internationalisation activities, including government relationships, alumni, and industry. The University of the West of Scotland has strategic government relationships with the European Union Commission in relation to ERASMUS+ funding; the British Council; Scottish Development International and the Scottish Funding Council. The University of Tasmania has strategic government relationships with the Australian Embassy and foreign embassies; major funding councils/agencies in strategic countries and the Department of Foreign Affairs and Trade. The University also has a strong relationship with the Tasmanian State Government through the Tasmanian Government and the University of Tasmania Partnership
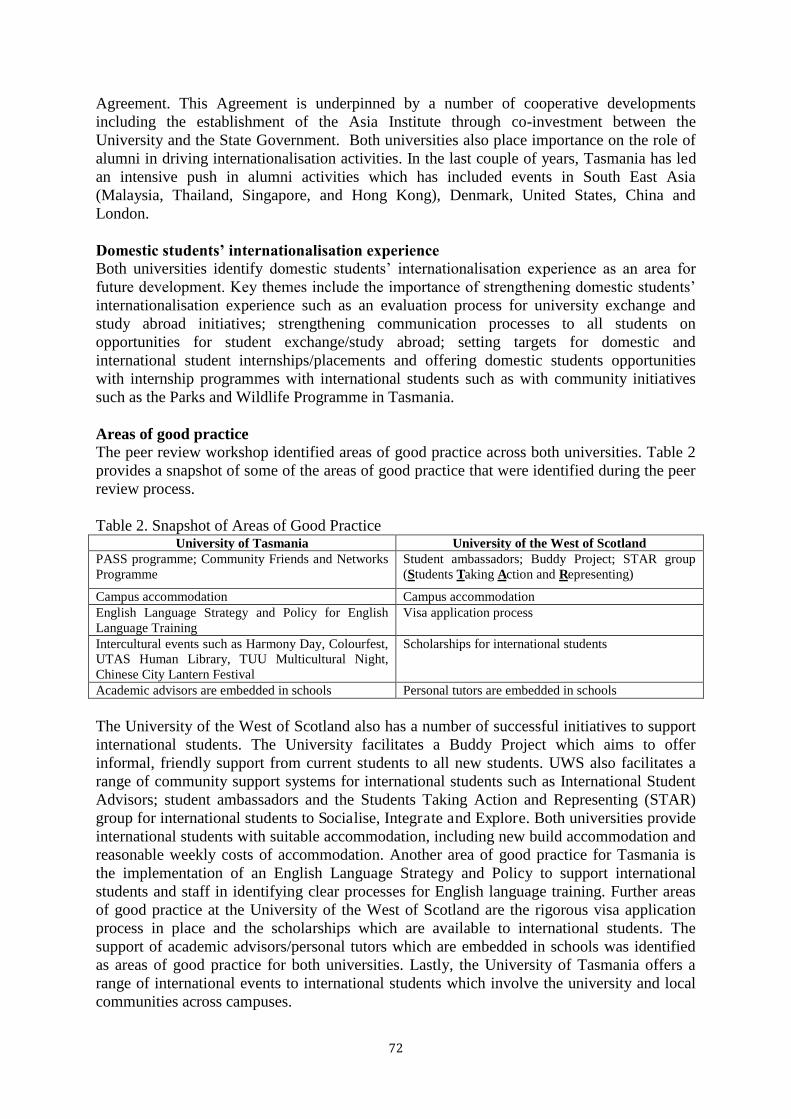
72
Agreement. This Agreement is underpinned by a number of cooperative developments including the establishment of the Asia Institute through co-investment between the University and the State Government. Both universities also place importance on the role of alumni in driving internationalisation activities. In the last couple of years, Tasmania has led an intensive push in alumni activities which has included events in South East Asia (Malaysia, Thailand, Singapore, and Hong Kong), Denmark, United States, China and London. Domestic students’ internationalisation experience Both universities identify domestic students’ internationalisation experience as an area for future development. Key themes include the importance of strengthening domestic students’ internationalisation experience such as an evaluation process for university exchange and study abroad initiatives; strengthening communication processes to all students on opportunities for student exchange/study abroad; setting targets for domestic and international student internships/placements and offering domestic students opportunities with internship programmes with international students such as with community initiatives such as the Parks and Wildlife Programme in Tasmania. Areas of good practice The peer review workshop identified areas of good practice across both universities. Table 2 provides a snapshot of some of the areas of good practice that were identified during the peer review process. Table 2. Snapshot of Areas of Good Practice
University of Tasmania University of the West of Scotland PASS programme; Community Friends and Networks Programme
Student ambassadors; Buddy Project; STAR group (Students Taking Action and Representing)
Campus accommodation Campus accommodation English Language Strategy and Policy for English Language Training
Visa application process
Intercultural events such as Harmony Day, Colourfest, UTAS Human Library, TUU Multicultural Night, Chinese City Lantern Festival
Scholarships for international students
Academic advisors are embedded in schools Personal tutors are embedded in schools The University of the West of Scotland also has a number of successful initiatives to support international students. The University facilitates a Buddy Project which aims to offer informal, friendly support from current students to all new students. UWS also facilitates a range of community support systems for international students such as International Student Advisors; student ambassadors and the Students Taking Action and Representing (STAR) group for international students to Socialise, Integrate and Explore. Both universities provide international students with suitable accommodation, including new build accommodation and reasonable weekly costs of accommodation. Another area of good practice for Tasmania is the implementation of an English Language Strategy and Policy to support international students and staff in identifying clear processes for English language training. Further areas of good practice at the University of the West of Scotland are the rigorous visa application process in place and the scholarships which are available to international students. The support of academic advisors/personal tutors which are embedded in schools was identified as areas of good practice for both universities. Lastly, the University of Tasmania offers a range of international events to international students which involve the university and local communities across campuses.
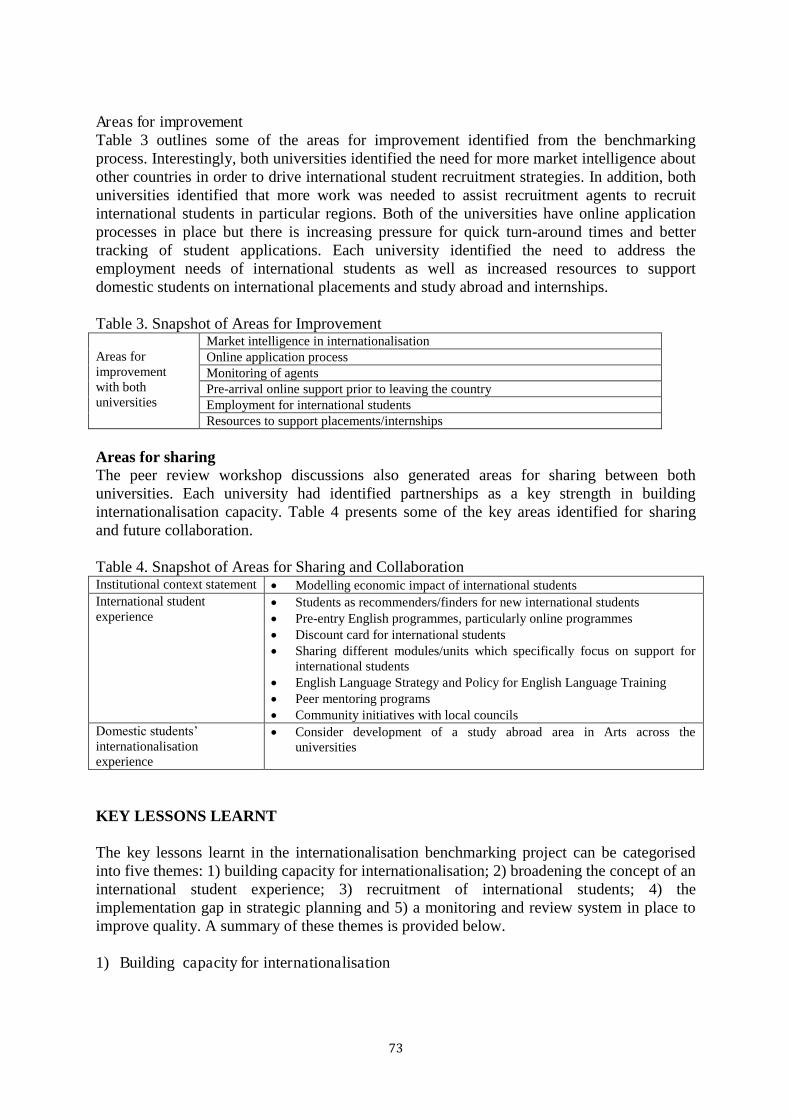
73
Areas for improvement Table 3 outlines some of the areas for improvement identified from the benchmarking process. Interestingly, both universities identified the need for more market intelligence about other countries in order to drive international student recruitment strategies. In addition, both universities identified that more work was needed to assist recruitment agents to recruit international students in particular regions. Both of the universities have online application processes in place but there is increasing pressure for quick turn-around times and better tracking of student applications. Each university identified the need to address the employment needs of international students as well as increased resources to support domestic students on international placements and study abroad and internships. Table 3. Snapshot of Areas for Improvement Areas for improvement with both universities
Market intelligence in internationalisation Online application process Monitoring of agents Pre-arrival online support prior to leaving the country Employment for international students Resources to support placements/internships
Areas for sharing The peer review workshop discussions also generated areas for sharing between both universities. Each university had identified partnerships as a key strength in building internationalisation capacity. Table 4 presents some of the key areas identified for sharing and future collaboration. Table 4. Snapshot of Areas for Sharing and Collaboration Institutional context statement Modelling economic impact of international students International student experience
Students as recommenders/finders for new international students Pre-entry English programmes, particularly online programmes Discount card for international students Sharing different modules/units which specifically focus on support for international students English Language Strategy and Policy for English Language Training Peer mentoring programs Community initiatives with local councils
Domestic students’ internationalisation experience
Consider development of a study abroad area in Arts across the universities
KEY LESSONS LEARNT The key lessons learnt in the internationalisation benchmarking project can be categorised into five themes: 1) building capacity for internationalisation; 2) broadening the concept of an international student experience; 3) recruitment of international students; 4) the implementation gap in strategic planning and 5) a monitoring and review system in place to improve quality. A summary of these themes is provided below. 1) Building capacity for internationalisation
74
Bissonette and Wooden (2013) in their study of internationalisation in community colleges found that these highly complex institutions can be conceptualised as progressing from independent or disaggregated parts towards integrated or aggregated parts. Their study describes five stages from no international activity to a strategically integrated institution: pre-interest; seeking; building; reaching and innovative. Both universities are working towards improving the integration of internationalisation into institutional processes including internal and external communications which have global themes to students and staff; co-curricular events or activities featuring international topics for both international and domestic students; and an integrated academic support process for international students. Professional development for staff on international activities is also important for building capacity across the institution as well as building international student capacity through strategies such as establishing online support programmes for students before their leave their home countries. 2) Broadening the concept of an international student experience The benchmarking partners identified a need to further develop opportunities for broadening the concept of the international student experience including domestic students’ experience of internationalisation; study abroad initiatives, study exchange programmes and internships. Daly and Barker (2010) studied the relationship between participation rates in Australian university exchange programmes and the presence of a clear strategic goal related to student exchange. Findings demonstrated that very few Australian students (approximately 2 percent in undergraduate studies) participated in student exchange programmes. Daly and Barker also found that the level of institutional resourcing was critical to achieving the universities’ strategic goals for student exchange. The implementation of the new Colombo Plan in Australia has identified this gap by offering $100 million support to Australian undergraduates to study and undertake internships in the Indo Pacific region. These initiatives are important for building domestic students’ global identity. Broadening the concept of an international student experience is also about building the regional and global identity of the university. Knight (2013) emphasises the importance of universities developing their regional and global identities for academic mobility, although this can equally apply to student mobility. This can be achieved by working with local communities to develop programmes that uniquely fit with the regional identity of the host university and working with local governments and communities to develop community events (such as the Chinese Lanterns Festival in Tasmania). 3) Recruitment of international students The recruitment of international students has become a significant factor for institutional income and of national economic interest (Qiang, 2003). International student recruitment is a key indicator in increasing the income revenue for universities. UTAS now models the economic impact of international students on a regular basis for senior executives so that there is an evidence-based approach to decision making in internationalisation. Due to the challenges of declining resources impacting internationalisation (Green & Ferguson, 2011) universities are increasingly required to come up with alternative strategies to increase student recruitment. 4) Implementation gap in strategic planning
75
One of the criticisms of internationalisation is the implementation gap between internationalisation strategic plans and their outcomes (Hann, 2014). The benchmarking project has highlighted some gaps in strategic planning for both universities. In the UWS Internationalisation and Global Citizenship Strategy (2011-2015) the gaps include the following: monitoring the recruitment of agents; employment opportunities for international students; building a market intelligence process to support internationalisation; and resources to support student mobility (placements/internships). In the University of Tasmania: Engaged Globally: Strategic Plan 2013-2018 the gaps include: Ensuring students are given expanded opportunities for internships, placements or work overseas; improving agent-sourced commencements through better selection and vetting of agents [including evaluation]; providing pre-arrival support to international students and the provision of employment opportunities for international students. 5) Monitoring and review system to improve quality An important part of internationalisation at universities is the development of a continuous support, monitoring and review process to improve quality which involves incentives, recognition and rewards (Qiang, 2003). The benchmarking project was both a self-review and peer review process, particularly in relation to improving the quality of internationalisation processes, inputs and outputs of each university. One area for improvement across both universities is improving the evaluation of international and domestic student on their international student experience and more emphasis placed on monitoring recruitment agents in terms of their experiences of internationalisation. Arkoudis et al (2012) recommend including items relating to internationalisation in routine student surveys. CONCLUSION Crossman and Burdett (2012, p. 227) observe that ‘the challenge for university leaders of internationalisation is immense given the complexity of this multi-layered phenomenon’. The immense challenge for university leaders to drive internationalisation plans across their institutions has highlighted the importance of building strategic partnerships with similar profile universities in order to find collaborative solutions. This internationalisation benchmarking project has identified the importance of universities building alliances and networks with others on common interests and profiles (Debowski, 2012). At the international and institutional levels, the benchmarking project has emphasised: the importance of building capacity for internationalisation across higher education
institutions; broadening the concept of an international student experience to contribute to the regional and global identity of the university; the importance of reviewing strategic plans for implementation gaps; and the need for monitoring and reviewing internationalisation processes to improve the quality of the student experience for both domestic and international students.
ACKNOWLEDGEMENTS The authors would like to acknowledge the tremendous amount of preparation and work undertaken by staff at both universities in the preparation of the self-review and peer review process.
76
BIOGRAPHICAL NOTE Professor Jeanne Keay is Vice Principal (International) at the University of the West of Scotland. Professor David Sadler is Deputy Vice-Chancellor (Students and Education) at the University of Tasmania. Dr Sara Booth is the head of the Student Evaluation, Review and Reporting Unit (SERRU) at the University of Tasmania. Dr Tim Duffy is International Developments’ Lead within the University of the West of Scotland. Dr Shannon Klekociuk is a research officer in the Student Evaluation, Review and Reporting Unit (SERRU) at the University of Tasmania. REFERENCES Agnew, M. (2012). A false dictomy of serving either the local or the global community and its impact on internationalisation of the university. Journal of Higher Education Policy and Management, 34(5), 476-489. Altbach, P., & Knight, J. (2007). The internationalisation of higher education: Motivations and realities. Journal of Studies in International Higher Education, 11, 290– 306. Arkoudis, S., Baik, C., Marginson, S., & Cassidy, E. (2012). Internationalising the student experience in Australian tertiary education: Developing criteria and indicators. Report by the Australian Government and the Centre for the Study of Higher Education. Retrieved from https://cshe.unimelb.edu.au/research/internationalisation/docs/Janu_2012AEI_indicators.pdf Australasian Council on Open, Distance and E-Learning (ACODE) (2007). ACODE benchmarks for e-learning in universities and guidelines for use. Retrieved from http://www.acode.edu.au/resources/acodebmgudieline0607.pdf Australian Vice Chancellor’s Committee (AVCC) (2005). Provision of education to international students: Code of practice and guidelines for Australian universities. Canberra, ACT: Australian Vice Chancellors Committee. Retrieved from http://sydney.edu.au/documents/future_students/CodeOfPractice.pdf Bissonette, B., & Woodin, S. (2013). Building support for internationalisation through institutional assessment and leadership engagement. New Directions for Community Colleges, 161, 11-26. Crossman, J., & Burdett, J. (2012). Matters arising. Australian University Quality Agency feedback in relation to the academic engagement of international students enrolled in onshore university programmes. Quality in Higher Education, 18(2), 221-234. Daly, A., & Barker, A. (2010). Australian universities’ strategic goals of student exchange and participation rates in outbound exchange programmes. Journal of Higher Education Policy and Management, 32(4), 333-342.
77
Debowski, S. (2012). The new academic: A strategic handbook. Open University Press/McGraw-Hill, London. Retrieved from http://mcgraw-hill.co.uk/html/0335245358.html DFAT (2014). New Colombo Plan. Retrieved from http://www.dfat.gov.au/new-colombo-plan/downloads/pilot-program-fact-sheet.pdf Green, M., & Ferguson, A. (2011) Internationalisation of U.S. higher education in a time of declining resources. Report commissioned by Australian Government (to fill in) Retrieved from https://www.aei.gov.au/International-network/northamerica/PolicyUpdates-USA/Documents/Internationalisation%20of%20US%20Higher%20Education%20in%20a%20Time%20of%20Declining%20Resources.pdf Higher Education Academy (HEA). (2014). Internationalising higher education: Framework for Action, Higher Education. UK. Retrieved from http://www.heacademy.ac.uk/assets/documents/internationalisation/IntHE-framework-consultation-doc27.03.14.pdf Knight, J. (2013). The changing landscape of higher education internationalisation-for better or worse? Perspectives: Policy and Practice in Higher Education, 17 (3), 84-90. Knight, J. (2004). Internationalization Remodeled: Definition, approaches and rationales. Journal of Studies in International Education. 8(1), 5-31. Knight, J. (2003). Updated internationalization definition. International Higher Education, 33, 2-3. Krause, K-L., Coates, H., & James, R. (2005). Monitoring the internationalisation of higher education: Are there useful quantitative indicators? In M. Tight (Ed.), International Relations, Oxford: Elsevier, pp. 233-254. Qiang, Z. (2003). Internationalization of higher education: Towards a conceptual framework. Policy Futures in Education, 1(2), 248-270. Stella, A., & Woodhouse, D. (2007). Benchmarking in Australian higher education: A thematic analysis of AUQA audit reports. Melbourne, Victoria: Australian Universities Quality Agency. University of Tasmania, Open to Talent: Strategic Plan 2012-Onwards. Retrieved from http://www.UTAS.edu.au/vc/strategic-plan University of Tasmania, Engaged Globally: Strategic Plan 2013-2018. Retrieved from http://www.UTAS.edu.au/global-engagement/engaged-globally-strategic-plan-2013-2018 University of the West of Scotland, Internationalisation and Global Citizenship Strategy 2011-2015. Retrieved from http://www.uws.ac.uk/about-uws/overview/missions-and-strategies/ University of the West of Scotland, Looking Forward: Strategic Plan 2008-2015. Retrieved from http://www.uws.ac.uk/about-uws/overview/missions-and-strategies/

78
Van Gaalen, A. (2009). Developing a tool for mapping internationalisation: A case study. In H. de Wit (Ed.), European Association for International Education: Measuring success in the internationalisation of higher education, Occasional Paper 22, (pp. 77-91). Retrieved from http://aplicaciones2.colombiaaprende.edu.co/mesas_dialogo/documentos/mesa80/2057MeasuringinternasionalisationEAIE.pdf
79
Appendix 1: Institutional context questions on internationalisation Questions include: What internationalisation higher education drivers impact on the University’s
approach to internationalisation? What national higher education drivers impact on the University’s approach to internationalisation? What regulatory policies underpin internationalisation? What are the university drivers for internationalisation? What strategic plans cover international student experience and domestic students’ experience of internationalisation? Provide a brief overview of the university (size, location, student numbers/EFTSL, number of faculties/schools/disciplines) What are the strategic themes in your internationalisation strategy? What are the key international regions that the university targets as part of the internationalisation strategy? What are the key targets for international students? What is the organisational structure for internationalisation? What role do Deans/Heads of School/Department/Associate Deans have in internationalisation? What are the main university committees responsible for internationalisation?
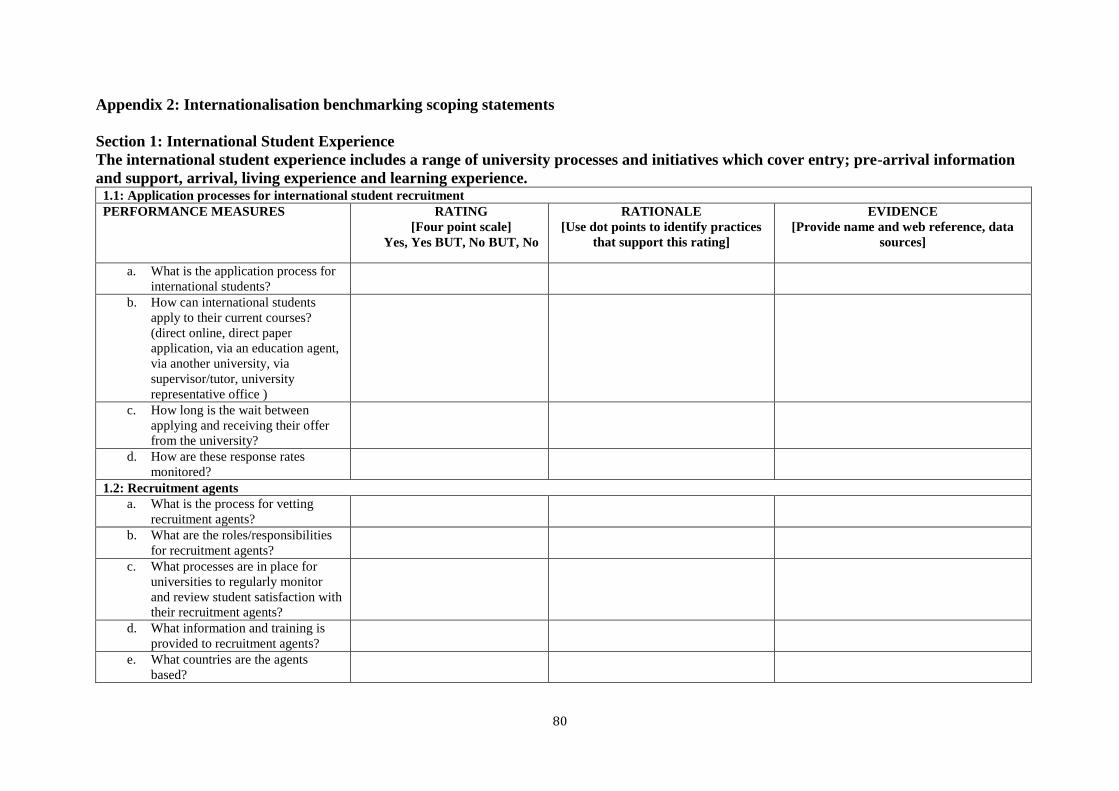
80
Appendix 2: Internationalisation benchmarking scoping statements Section 1: International Student Experience The international student experience includes a range of university processes and initiatives which cover entry; pre-arrival information and support, arrival, living experience and learning experience. 1.1: Application processes for international student recruitment PERFORMANCE MEASURES RATING
[Four point scale] Yes, Yes BUT, No BUT, No
RATIONALE [Use dot points to identify practices
that support this rating]
EVIDENCE [Provide name and web reference, data
sources]
a. What is the application process for international students?
b. How can international students apply to their current courses? (direct online, direct paper application, via an education agent, via another university, via supervisor/tutor, university representative office )
c. How long is the wait between applying and receiving their offer from the university?
d. How are these response rates monitored?
1.2: Recruitment agents a. What is the process for vetting
recruitment agents?
b. What are the roles/responsibilities for recruitment agents?
c. What processes are in place for universities to regularly monitor and review student satisfaction with their recruitment agents?
d. What information and training is provided to recruitment agents?
e. What countries are the agents based?
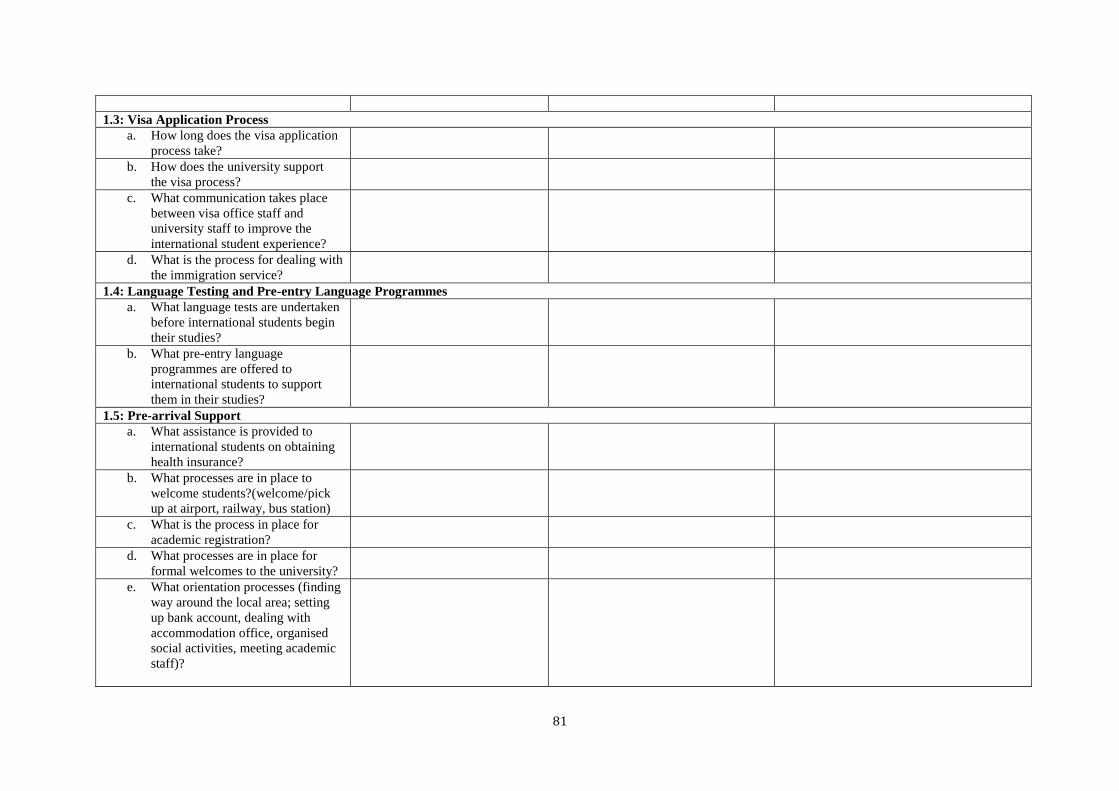
81
1.3: Visa Application Process
a. How long does the visa application process take?
b. How does the university support the visa process?
c. What communication takes place between visa office staff and university staff to improve the international student experience?
d. What is the process for dealing with the immigration service?
1.4: Language Testing and Pre-entry Language Programmes a. What language tests are undertaken
before international students begin their studies?
b. What pre-entry language programmes are offered to international students to support them in their studies?
1.5: Pre-arrival Support a. What assistance is provided to
international students on obtaining health insurance?
b. What processes are in place to welcome students?(welcome/pick up at airport, railway, bus station)
c. What is the process in place for academic registration?
d. What processes are in place for formal welcomes to the university?
e. What orientation processes (finding way around the local area; setting up bank account, dealing with accommodation office, organised social activities, meeting academic staff)?
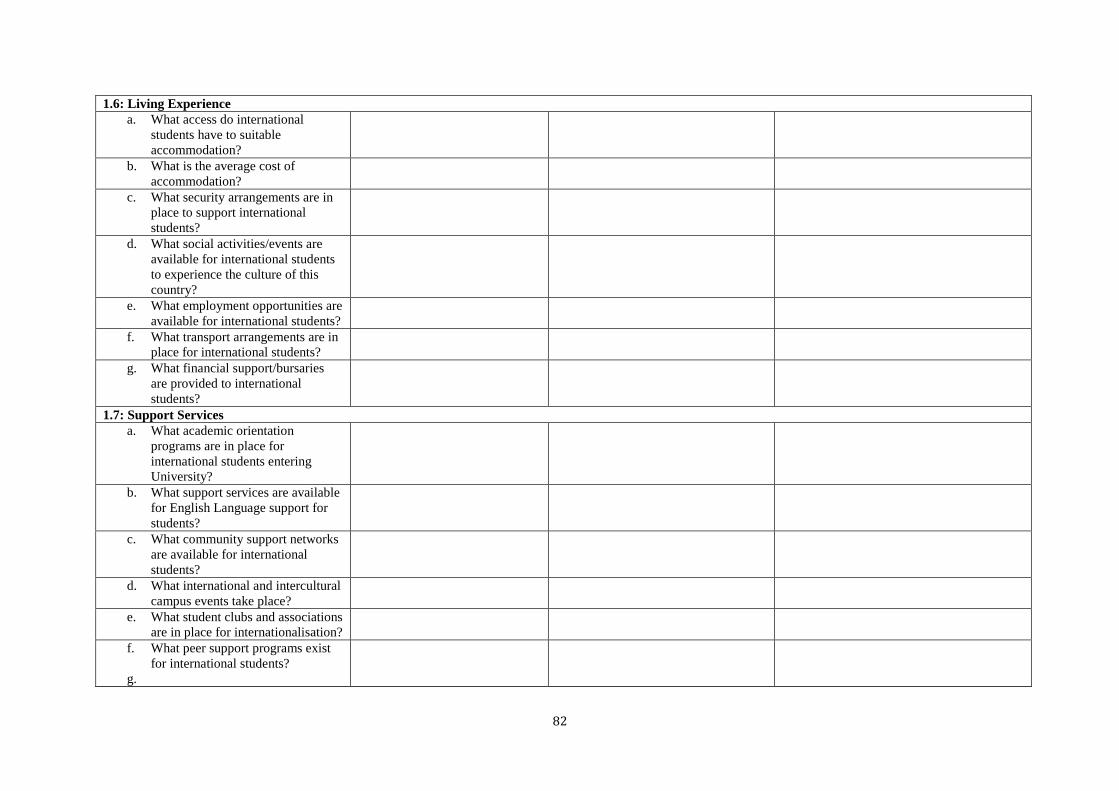
82
1.6: Living Experience a. What access do international
students have to suitable accommodation?
b. What is the average cost of accommodation?
c. What security arrangements are in place to support international students?
d. What social activities/events are available for international students to experience the culture of this country?
e. What employment opportunities are available for international students?
f. What transport arrangements are in place for international students?
g. What financial support/bursaries are provided to international students?
1.7: Support Services a. What academic orientation
programs are in place for international students entering University?
b. What support services are available for English Language support for students?
c. What community support networks are available for international students?
d. What international and intercultural campus events take place?
e. What student clubs and associations are in place for internationalisation?
f. What peer support programs exist for international students?
g.
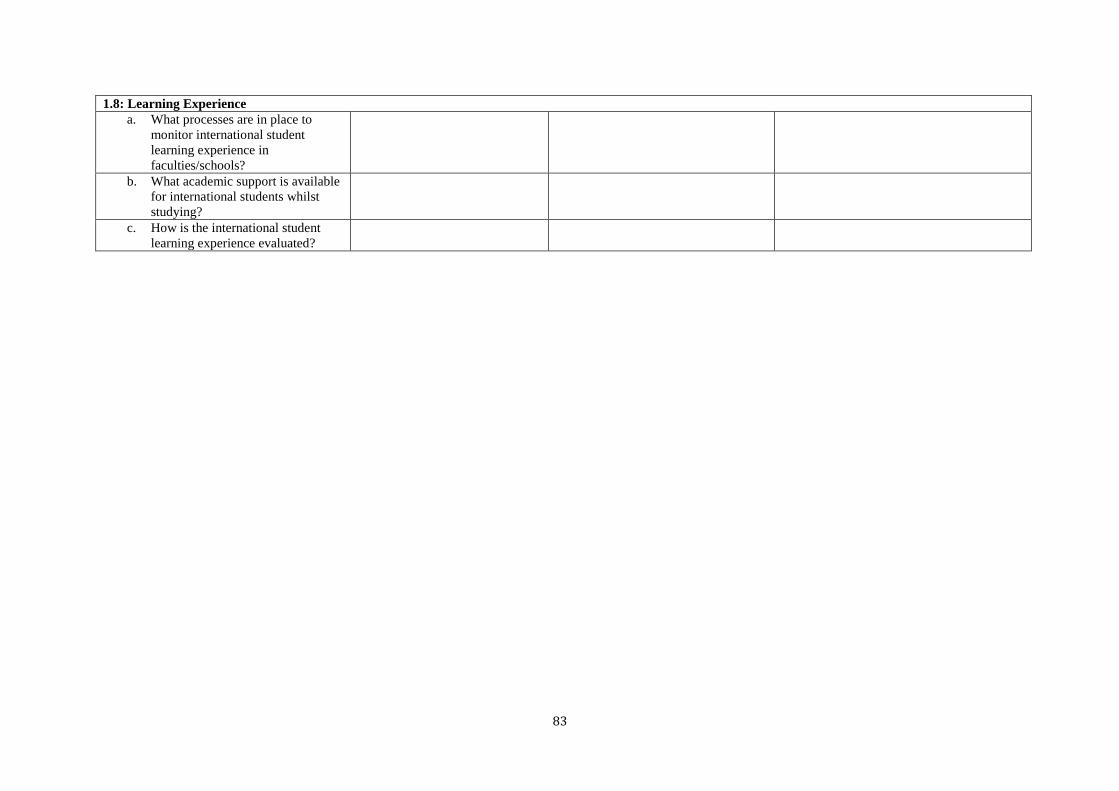
83
1.8: Learning Experience a. What processes are in place to
monitor international student learning experience in faculties/schools?
b. What academic support is available for international students whilst studying?
c. How is the international student learning experience evaluated?
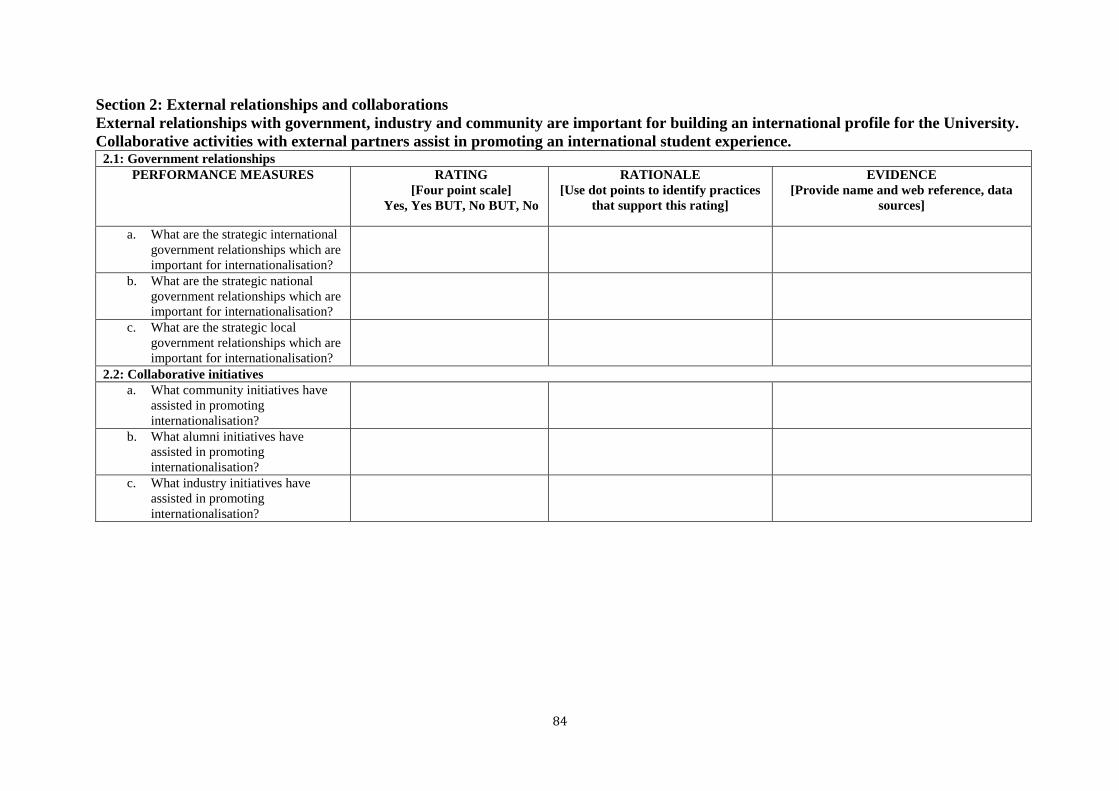
84
Section 2: External relationships and collaborations External relationships with government, industry and community are important for building an international profile for the University. Collaborative activities with external partners assist in promoting an international student experience. 2.1: Government relationships
PERFORMANCE MEASURES RATING [Four point scale]
Yes, Yes BUT, No BUT, No
RATIONALE [Use dot points to identify practices
that support this rating]
EVIDENCE [Provide name and web reference, data
sources]
a. What are the strategic international government relationships which are important for internationalisation?
b. What are the strategic national government relationships which are important for internationalisation?
c. What are the strategic local government relationships which are important for internationalisation?
2.2: Collaborative initiatives a. What community initiatives have
assisted in promoting internationalisation?
b. What alumni initiatives have assisted in promoting internationalisation?
c. What industry initiatives have assisted in promoting internationalisation?

85
Section 3: Domestic students’ internationalisation experience The University offers domestic students opportunities for an international student experience through student exchange programmes; foreign language study; work/study abroad programmes. Student exchange programmes represent an opportunity for domestic students to develop intercultural competencies during their study. 3.1: University exchange initiatives
PERFORMANCE MEASURES RATING [Four point scale]
Yes, Yes BUT, No BUT, No
RATIONALE [Use dot points to identify practices
that support this rating]
EVIDENCE [Provide name and web reference, data
sources]
a. What university process is in place to manage and coordinate university exchange initiatives?
b. Are these exchange initiatives evaluated on a regular basis? What are the participation rates?
.
3.2: Study abroad initiatives a. What are the university’s study
abroad initiatives?
b. How are these study abroad initiatives managed and evaluated? What are the participation rates?
3.3: International student internships/work placements a. What have been the numbers for
these international student internships/work placements?
b. What documentation is provided to students to support them on these international student internships/work placements?
3.4: Resources, Scholarships and Grants a. What resources are allocated to
support student mobility?
b. What scholarships and grants are offered to support student mobility?
c. How are these initiatives communicated to domestic students?

86
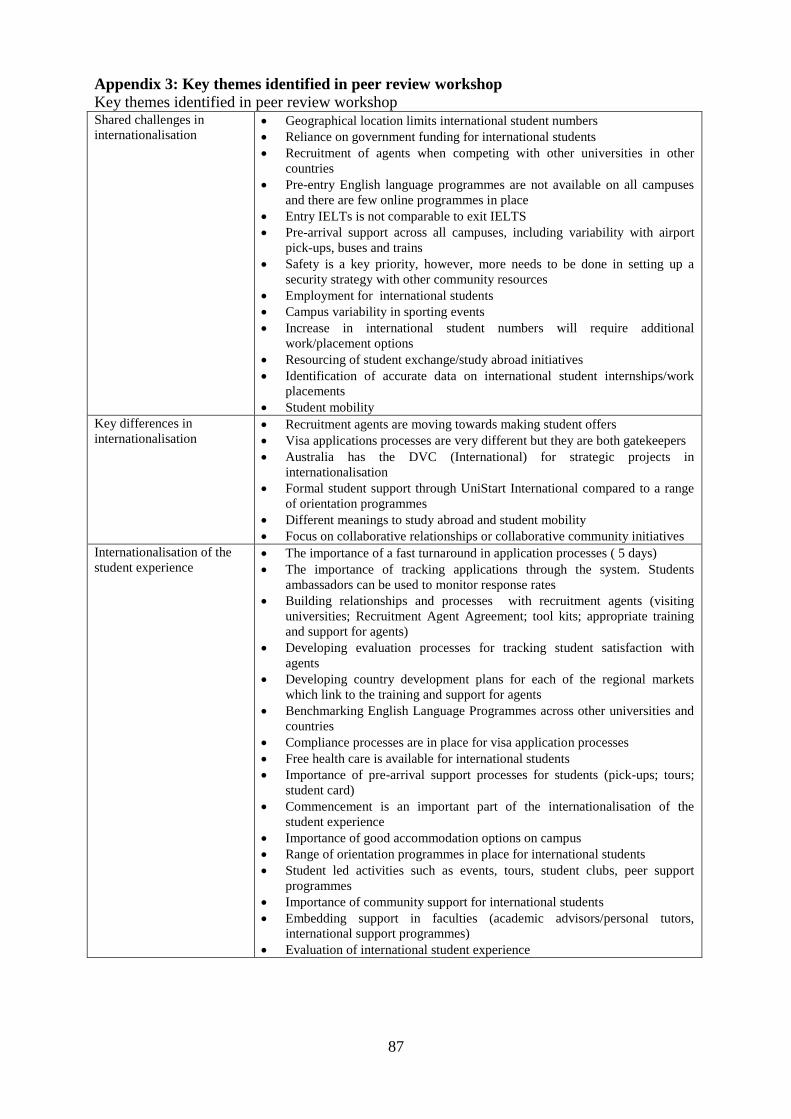
87
Appendix 3: Key themes identified in peer review workshop Key themes identified in peer review workshop Shared challenges in internationalisation
Geographical location limits international student numbers Reliance on government funding for international students Recruitment of agents when competing with other universities in other countries Pre-entry English language programmes are not available on all campuses and there are few online programmes in place Entry IELTs is not comparable to exit IELTS Pre-arrival support across all campuses, including variability with airport pick-ups, buses and trains Safety is a key priority, however, more needs to be done in setting up a security strategy with other community resources Employment for international students Campus variability in sporting events Increase in international student numbers will require additional work/placement options Resourcing of student exchange/study abroad initiatives Identification of accurate data on international student internships/work placements Student mobility
Key differences in internationalisation
Recruitment agents are moving towards making student offers Visa applications processes are very different but they are both gatekeepers Australia has the DVC (International) for strategic projects in internationalisation Formal student support through UniStart International compared to a range of orientation programmes Different meanings to study abroad and student mobility Focus on collaborative relationships or collaborative community initiatives
Internationalisation of the student experience
The importance of a fast turnaround in application processes ( 5 days) The importance of tracking applications through the system. Students ambassadors can be used to monitor response rates Building relationships and processes with recruitment agents (visiting universities; Recruitment Agent Agreement; tool kits; appropriate training and support for agents) Developing evaluation processes for tracking student satisfaction with agents Developing country development plans for each of the regional markets which link to the training and support for agents Benchmarking English Language Programmes across other universities and countries Compliance processes are in place for visa application processes Free health care is available for international students Importance of pre-arrival support processes for students (pick-ups; tours; student card) Commencement is an important part of the internationalisation of the student experience Importance of good accommodation options on campus Range of orientation programmes in place for international students Student led activities such as events, tours, student clubs, peer support programmes Importance of community support for international students Embedding support in faculties (academic advisors/personal tutors, international support programmes) Evaluation of international student experience
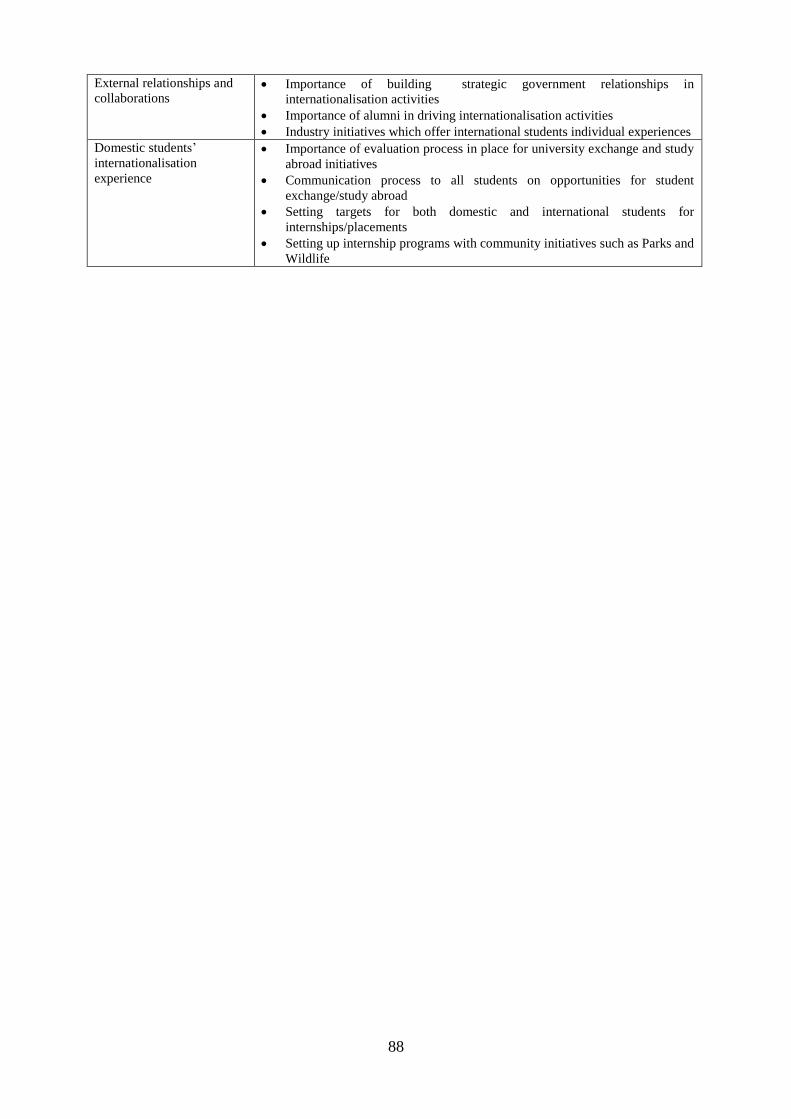
88
External relationships and collaborations
Importance of building strategic government relationships in internationalisation activities Importance of alumni in driving internationalisation activities Industry initiatives which offer international students individual experiences
Domestic students’ internationalisation experience
Importance of evaluation process in place for university exchange and study abroad initiatives Communication process to all students on opportunities for student exchange/study abroad Setting targets for both domestic and international students for internships/placements Setting up internship programs with community initiatives such as Parks and Wildlife

89
DESIGNING AN ACADEMIC WORKLOAD MODEL IN THE AGE OF BLENDED LEARNING
Stijn Dekeyser, University of Southern Queensland, [email protected]
Richard Watson, University of Southern Queensland, [email protected] Elizabeth Baré, University of Melbourne, [email protected]
ABSTRACT Managing academic workload is increasingly becoming an important topic in the Australian tertiary education sector. While workload pressure has been a concern to academics for more than two decades, the continuing advancement of online and blended learning is further complicating the problem. We argue that traditional workload models are ill suited to deal with the changing nature of tertiary teaching and present a new approach that combines the strengths of existing types of models while neutralising their weaknesses. We also provide a detailed example that implements the new approach, and compare outcomes with those generated by existing models. KEYWORDS Academic workload management, staff experience, resource planning, teaching in blended and online mode
INTRODUCTION, MOTIVATION AND CONTRIBUTION Academic workload models have progressively become more important over the past few decades. Since workload models are a significant tool in managing academic productivity, they are expected to become more vital yet with ever increasing requirements of accountability and financial demands on the sector. Rising workloads, or the perception thereof (Tight, 2011), have been a concern for academic staff for decades (Fredman & Doughney, 2011). Often the discussion has been on the trend of burdening faculty with a wide variety of administrative or regulatory tasks, for example around quality assurance reporting (Saunders and Booth, 2013). Hornibrook (2012) found that from the perspective of academic staff, the introduction of workload models contributes towards the administrative burden rather than ameliorate the problem; nevertheless, most Australian universities now have workload models in place. The same author further reports that implementing workload models can also result in perceptions of unfairness; this is in direct contradiction with the aims stated in most Enterprise Agreements that models are to improve equity, transparency, and fairness (Lyons & Ingersoll, 2010). An important recent aspect in the evolution of models is the growing need to address the complex reality of changing universities, especially, but not solely, in terms of new delivery practices for online and blended learning. A majority of Australian universities have adopted aspects of blended learning and some offer fully online programs. In her search for a common definition of blended learning, Torrisi-Steele (2011) surveyed 39 Australian universities and found that all of 20 respondents profess to offer study programs in this mode. The Australian Learning & Teaching Council's report on blended learning (Partridge, 2011) cites research (Kearsley & Blomeyer, 2004; Vaughan, 2007; Welker & Berardino, 2005) that has documented academic staff concerns around increased time commitments for blended
90
learning, and concludes that: ‘blended courses take longer to prepare and administer than their traditional counterparts.’ In the international context MOOCs are growing in prominence as an online delivery tool. While much of the attention around MOOCs is on the student learning experience, there is evidence of growing concern among academic staff globally about the impact of non-traditional teaching on workloads. At Georgia State University in the United States, a motion on MOOCs and workloads (GSU, 2013) states: ‘There are many issues surrounding MOOCs and faculty workload. It is not clear how to translate existing workload policies to apply to MOOCs.’ Likewise, the University and College Union in the United Kingdom published a policy position on MOOCs and workloads (Copeland, 2014): ‘UCU has concerns about the workload implications of the new MOOCs, including the heavy burdens that can be experienced by course leaders and tutors resulting from the increased volume of students.’ Adding to the motivation for this paper, our research team has previously established through a pilot survey (King, 2014) that traditional types of workload models, including actual hours and cost based models, are not a good fit for institutions that encompass multiple campuses and employ online and blended learning. This is both from a perspective of aiming for equitable distribution of work on the one hand (the staff perspective), and on the other of ensuring that a true measure of the actual work involved is established (the unit perspective). In the survey, 68 per cent of respondents at institutions that offer multi-mode programs indicated that their workload model assigns different workload values for traditional on-campus-only versus blended learning. One respondent noted that ‘[their] model will need to be changed to allow for the University’s move to greater flexibility in teaching modes.’ Another respondent wrote: ‘[there] is insufficient acknowledgement of the time required to service an external unit properly.’ In this paper we improve existing definitions associated with academic workload models and describe the design parameters of a new type of workload model that we contend is a better fit for a growing number of multi-campus multi-mode institutions dealing with increasingly constrained resourcing. The new model was constructed on the basis of more than twenty-five interviews with senior staff (including a deputy vice-chancellor, two deans, two human resources directors and several heads of school) at nine Australian universities including two members of the Group of Eight (Go8), two of the Innovative Research Universities network, and two of the Regional Universities Network. In addition to the interviews, we obtained and analysed documentation about workload models used in the corresponding organisational sections. The resulting model essentially combines desirable properties of traditional actual hours models with those of cost based models, and introduces a so-called cap function. We show that the function’s inclusion of parameters additional to the generally used measure of student enrolments requires careful analysis to ensure that workload allocations reflect actual costs. Finally, we evaluate the proposed model by comparing its allocations for an example unit to that of two existing models.
TYPES OF ACADEMIC WORKLOAD MODELS Over the past three decades multiple authors have published research about the introduction and effects of academic workload models. An unsophisticated categorisation of peer reviewed articles in this context leads to two main groups of publications: those reporting on a case
91
study (often, but not always, in a single institution) detailing the process of implementation (e.g. Barrett & Barrett, 2010); and those looking at their effects, mostly through the analysis of staff surveys (e.g. Barrett & Barrett, 2007; Vardi, 2008). While there is a smaller group of papers that do not fit either category, we found that only the first group contains descriptions of workload models that are detailed enough to allow classification. It should be noted that we did not find a common, sufficiently formal definition of academic workload models; rather, it seems accepted that readers intuitively understand what is meant by a model. It should also be noted that most articles discuss workload pertaining to ‘regular’ academics; workload arrangements for casual staff as well as those that are employed in special roles (e.g. ‘teaching focussed’ or ‘research intensive’) are usually not considered. In the absence of a formal definition, however, the existing descriptions allow us to categorise models on the basis of two dimensions. The first one concentrates on the relative amount of time that an academic staff member is to devote to teaching as compared to other tasks such as research and service. This dimension leads to the following three common approaches: Fixed. In this approach the percentage of time spent for the various groups (or envelopes, as we will refer to them henceforth) of academic tasks is fixed and equal for all staff. An example of distribution of percentages that, judged from our detailed perusal of more than twenty Australian models, appears to be quite common still is 40-40-20, meaning 40 per cent for teaching-related tasks, 40 per cent for research-related tasks, and 20 per cent for ‘other’ tasks such as service, engagement, and administration. The fixed approach was documented by Harris (1993), although the author detailed four envelopes rather than three. Those models where the percentages for Teaching and for Research are equal, are often called ‘balanced’. Teaching-Last. In this approach, first described loosely in Burgess (1996), academic staff are given an individual and annual allocation for research, based mostly on past performance (typically looking back at the publication and grant income record over the last two or three years) and, as we found in a few cases, also on negotiated plans for the year or years ahead. The remainder, after also allocating a service component which is often a default percentage between 10 per cent and 20 per cent, is then the size of that academic’s teaching envelope for the year. An important aspect of this approach is that Teaching and Research percentages may differ between regular academic staff (those employed to both teach and perform research) as well as from year to year. Teaching-First. In this approach the teaching duties are allocated equitably over continuing staff members (with or without first subtracting duties allocated to sessional staff) and whatever time remains is available for research. The resulting percentage available for research is hence the same for all regular (non-teaching specialised) academic staff. This approach was documented by Paewei (2007) who reported on a case study at Massey University in New Zealand, and noted that ‘there did not appear to be enough time available to complete quality research in many areas.’ In addition to these three envelope approaches, it should be noted that Barrett & Barrett (2007) indicate that there are cases where percentages are allocated in an informal manner, following negotiation between academics and their supervisors. The first dimension detailed above leads to the classification of workload models into groups arranged by ‘Envelope Approach’. The second dimension of workload model categorisation concentrates on how currency is allocated for specific teaching-related tasks that are performed in the context of specific units of study (in some institutions known as subjects or
92
courses). This second dimension leads to the following five ‘traditional’ workload model ‘Teaching Allocation Methods’. Constant. The delivery of each unit is deemed to take the same amount of effort. Hence, the teaching workload for an academic is expressed simply as the number of units (courses) that person is teaching in a year. This approach is comprehensively critiqued in Hull (2006). Contact Hours. Teaching allocations are based on the number of hours that an academic is teaching in a face-to-face manner; this may include lectures, tutorials, labs and similar types of delivery. Burgess (1996) notes that ‘this method either ignores the non-teaching dimensions or makes some partial attempt to convert such non-teaching aspects to their equivalent in contact hours.’ Anecdotally, this approach is a popular method for academics from different countries to compare their teaching loads; often the number of contact hours are quoted per week rather than year or semester, which then fails to account for summer semesters. Actual Hours. A number of hours are associated with each discrete teaching-related task. The hours are an estimate of the actual time spent (on average, over all academics) on the task and may scale on the number of students in a unit or on other metrics. Described in Vardi (2009), actual hours models can vary significantly between academic sections. Some models define a long list of possible tasks with fine granularity, whereas others use a short list of relatively generic tasks. For example, we’ve studied a model that lists more than five distinct activities for ‘student consultation’, with different weightings depending on parameters such as unit level (e.g. first year), delivery mode, and presence of other blended teaching methods. Other, coarser grained actual hours models combine this task with overall unit coordination. Our pilot survey (King, 2014) suggests that the actual hours method may be the dominant one currently in use in Australian universities; examination of the detailed workload model documentation we received during the interviews strengthens that presumption. Points. This is similar to the Actual Hours method; however, instead of attempting to quantify a task in terms of the (average) time needed to complete it, staff gain an amount of points for activities. Furthermore, instead of the hours needing to sum to the total available in a year, staff are usually given a points range which they should reach. Often the range depends on one or more parameters, such as employment level, discipline, history etc. One particular points system is detailed in Ringwood (2005). Cost Based. This is often referred to as the Equivalent Full Time Student Load model. In its simplest form, the amount of time or points available for teaching a unit depends solely on the number of students enrolled in it. A more detailed description of the Student Load method is given in Filby & Higson (2005).
EVALUATING MODEL TYPES In this section we critically evaluate the ability of existing models to handle the workload management issues that exist in multi-campus institutions with multiple delivery modes. This exercise informs the design of a new style of model, presented in the following section that addresses the shortcomings identified here. We only evaluate the Teaching Allocation Methods aspect of workload models as we are primarily concerned in this paper with the ability to adequately model all the tasks required to deliver a unit. The Envelope Approach dimension has no effect on the details of unit management and is therefore not relevant. Note
93
that Envelope construction rules affect unit delivery costs, as they determine staffing levels, but not the per-unit resource requirements which is the role of the Teaching Allocation Methods rules. We proceed in two steps. Initially we review the ability of the methods to adequately handle multi-campus, multiple mode units; those that fail to adequately do so are removed from further consideration. The second step examines the remaining teaching allocation methods on a selection of properties that we identified through the interviews as being desirable from the perspective of academic managers tasked with implementing the relevant workload clauses in the enterprise agreement at their institutions while advancing the academic portfolio of their sections within budget constraints. Evaluation: multiple campuses and multiple modes Consider each Method with respect to numbers of campuses and delivery modes.
Constant Method. This method is able to deal effectively with different modes and campuses only if each combination of those is treated as a separate unit. If they are not, repeating lectures at various locations would have no impact on workload allocations and hence the model would incorrectly address the real cost of running the unit. Treating each campus offer as a separate unit is unlikely to be controversial among faculty staff, as typically different staff would be involved for the campuses and hence each of them can reasonably expect to be assigned time for the unit regardless of the fact that it also being run somewhere else. However, as exposed through the interviews, treating each mode offer as an independent unit is unattractive to academic leadership because those running the unit would be seen to ‘double dip’: some effort is expected to be shared over diverse modes of offer for the same unit. An example of this is in the preparation of assessment items: normally the assignments for on campus students are the same as those for on-line students.
Contact Hours. Essentially only on-campus teaching modes are catered for in this
method; an external or fully on-line class will typically not be allocated any resources as there are no face-to-face components such as lectures and tutorials. On-line units that exclusively feature regularly scheduled synchronous internet conferencing sessions, however, are catered for, as under the contact hours method this would be equivalent to an on-campus unit. The method addresses additional campuses well, as those would be treated as separate units with their own face-to-face components. Overall, however, this method is not well suited to the large range of blended learning approaches (Torrisi-Steele, 2011) that do not include face-to-face components.
Actual Hours and Points behave similarly and can be grouped together. Both methods
are able to deal effectively with both multiple campuses and multiple teaching modes. Much depends on the granularity and on the weightings chosen for each teaching activity. Specifically, it is non-trivial to define blended learning activities and to assign them weightings that are comparable to those activities that are considered equivalent in traditional on-campus teaching modes. From the workload model documentation that we have seen, as well as from responses to our preliminary survey, it would appear that undervaluing non-face-to-face teaching in terms of workload allocation is common in Australian universities at present.
Student Load method. This method assigns the same level of resourcing to units
regardless of modes or locations. That is mainly positive for the presence of blended learning modes: in theory external and on-line students in a unit garner just as much teaching attention
94
as their on-campus counterparts. This is a significant strength that we will aim to maintain in our proposed workload model. However, it can be problematic from a perspective of multiple campuses: a unit taught in face-to-face mode in two locations each with 40 students would typically require two sets of lectures, while a single location unit with 80 students would receive the same resourcing but only need to cater for one set of lectures. The above evaluation eliminates both the Constant and Contact Hours methods from further consideration as neither adequately address multiple teaching modes. In addition we can also discard the Constant method on the grounds of the equity principle that is enshrined in most enterprise agreements. The method fails to take student numbers (as well as any other parameters) into account leading to very significant differences in real workload for staff that teach the same number of units (Hull, 2006). Finally, we note that for the purposes of this paper the Actual Hours and Points methods are highly similar and hence can be considered as one. The teaching allocation methods that then remain as candidates on which to build a new model, are the Actual Hours/Points and the Student Load methods. EVALUATION: DESIRED PROPERTIES We proceed now to take a closer look at these methods with respect to criteria identified as important by workload managers we have interviewed.
Equity . Work associated with a unit scales largely with two parameters: the number of students enrolled in the unit, and the number of face-to-face contact hours employed in it. To some extent, the latter is itself a function of the former: there will be repeated tutorial or equivalent sessions for higher enrolments. In addition, we found that many institutions standardise the number of lecture hours for the majority of its units. In other words, of the two main parameters in unit workload, the enrolment figure is dominant. Given that the Student Load teaching allocation method allocated work based solely on enrolments, it would appear that the method allocates unit workload equitably. However, interviews with academic leaders in four sections that employ the method reveal that significant problems exist. The main issue occurs in units taught by more than one academic and entails that actual tasks need to be allocated to individuals. Since the Student Load method does not place a currency on those tasks, it is conceivable that one individual (e.g. Jane) gets assigned those tasks that are (perceived or otherwise) more time consuming than those assigned to others teaching into the same unit. The method’s equity problem then occurs when the portion of Student Load distributed to Jane may not reflect the higher actual workload. Our interviewees indicated that the equitable distribution of Student Load among staff teaching into the same units is non-trivial and that problems are more likely to occur in units that have multiple modes of offer (on campus as well as external or online) because the tasks involved are more difficult to quantify and compare.
On the other hand, how well the Actual Hours method addresses the equity requirement is highly dependent on the level of granularity in its set of activities and also on their weightings. Models that include a large set of activities fare better than those that lump tasks together because the former increase precision in allocating real work. While highly detailed actual hours models perform best in terms of equity, employing them is often unpopular with academic staff because it is seen as an exponent of micro-management. Furthermore, the problem of determining reasonable and comparable weightings for blended learning activities (as opposed to traditional lectures, for example) remains.
95
Transparency. This requirement is often explicit in institutions’ enterprise agreements.
However, the semantics are often vague. During our interviews, academic managers within the same institution have interpreted the transparency clause differently. For some it means that the policy as well as process needs to be transparent, but the outcome need not be. For others it means that additionally individual outcomes should be available for the relevant member of staff, but that the outcome is not shared with the person’s colleagues. The least restrictive interpretation is that all outcomes, including tasks and resulting hours, are shared among all staff, either within the academic section itself, or at higher organisational level. The Actual Hours method can cater for all interpretations and is only limited by system implementation. In contrast, the Student Load model is intrinsically limited in that it can only show the resulting load distribution. Because it does not have teaching activities, it cannot show staff the division of teaching tasks within a particular unit.
Foster Innovation. Torrisi-Steele (2011) outlines a broad range of techniques that
institutions have self-reported as constituting blended-learning modes. The range is strongly associated with the complexity of information technology solutions deployed at the institution. For institutions that value blended learning, experimentation with unit delivery modes is important. In contrast to the equity requirement, highly fine-grained actual hours model perform poorly in this respect. Any new approach that a teaching team wishes to try out (assuming approval from their academic managers) would require the creation of one or more new workload activities, with their attendant weightings. Coarse grained actual hours models may cope better with experimentation provided that sufficiently general activities are available. However, the Student Load method fares best, at least from a managerial perspective: experimentation has no workload implications and the associated cost is equivalent to the unit being run in an established mode. From the perspective of academic, the Student Load method enables bottom-up decision making: the teaching teams can decide what the best approach is given the unit’s content. On the other hand, staff involved in the experiment may feel that a Student Load model provides little incentive for ‘pushing the envelope’.
Flexibility . In addition to support for experimentation with blended-learning methods in
established units with stable content, our interviews revealed that academic managers expect a workload model to provide flexibility when modifying the section’s curriculum. In some disciplines (notably those related to STEM) the content for some units, even at undergraduate level, changes relatively quickly, while that of other units does not. Modifying content and creating new units are time-intensive and often collaborative tasks that are sometimes seen as service-type rather than teaching-related tasks. Since the cost of the task is tied to a unit, and it can mean a significant effort by a group of individuals, we treat unit development as a teaching-related activity that needs inclusion in the workload model and must adhere to equity and other principles. The Student Load method is only able to cater for all units in the section having the same amount of development requirements, whether high or low. Such a situation is unrealistic and hence the method does not deal well with the flexibility requirement. Actual Hours models can address the requirement effectively by introducing one or more explicit development activities. From our study of existing models, such activities are usually weighted at three distinct steps, representing a low amount of redevelopment, a high amount, and the creation of a wholly new unit.
Drive Change. Some managers expressed a desire to use workload models to drive
change within their academic section. The type of change here is additional to the principles of flexibility and fostering innovation discussed above. A relatively common example is the
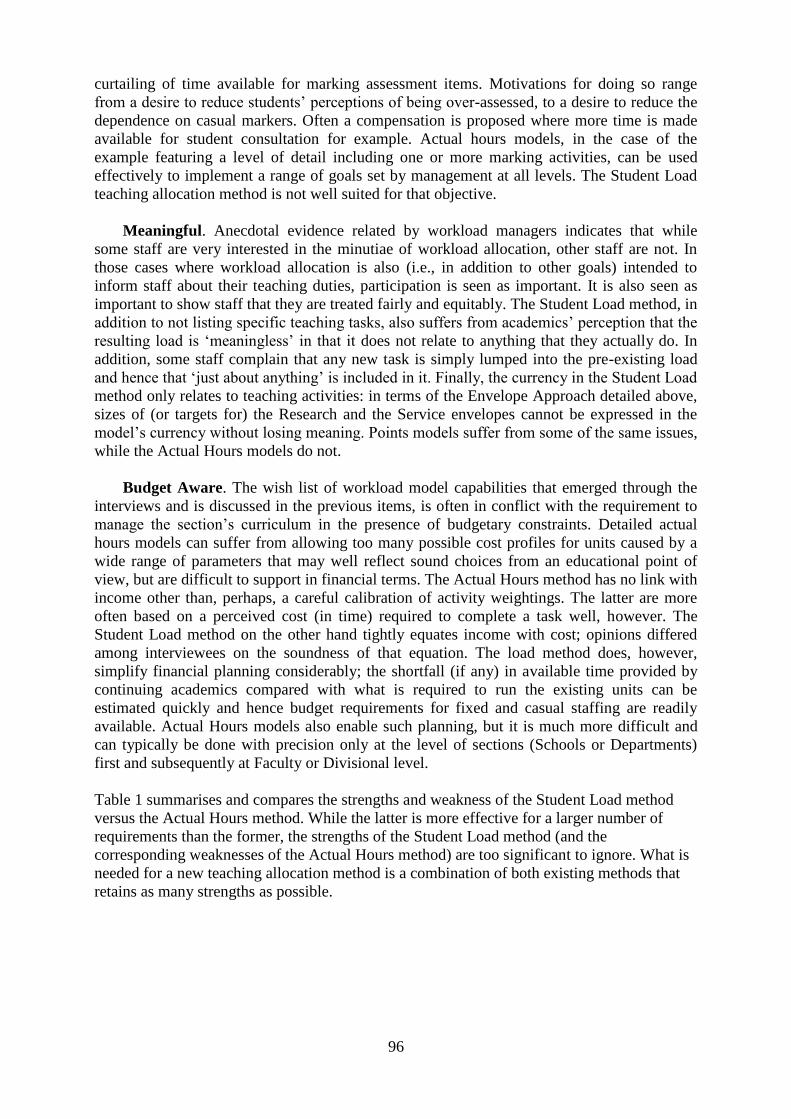
96
curtailing of time available for marking assessment items. Motivations for doing so range from a desire to reduce students’ perceptions of being over-assessed, to a desire to reduce the dependence on casual markers. Often a compensation is proposed where more time is made available for student consultation for example. Actual hours models, in the case of the example featuring a level of detail including one or more marking activities, can be used effectively to implement a range of goals set by management at all levels. The Student Load teaching allocation method is not well suited for that objective.
Meaningful. Anecdotal evidence related by workload managers indicates that while
some staff are very interested in the minutiae of workload allocation, other staff are not. In those cases where workload allocation is also (i.e., in addition to other goals) intended to inform staff about their teaching duties, participation is seen as important. It is also seen as important to show staff that they are treated fairly and equitably. The Student Load method, in addition to not listing specific teaching tasks, also suffers from academics’ perception that the resulting load is ‘meaningless’ in that it does not relate to anything that they actually do. In addition, some staff complain that any new task is simply lumped into the pre-existing load and hence that ‘just about anything’ is included in it. Finally, the currency in the Student Load method only relates to teaching activities: in terms of the Envelope Approach detailed above, sizes of (or targets for) the Research and the Service envelopes cannot be expressed in the model’s currency without losing meaning. Points models suffer from some of the same issues, while the Actual Hours models do not.
Budget Aware. The wish list of workload model capabilities that emerged through the
interviews and is discussed in the previous items, is often in conflict with the requirement to manage the section’s curriculum in the presence of budgetary constraints. Detailed actual hours models can suffer from allowing too many possible cost profiles for units caused by a wide range of parameters that may well reflect sound choices from an educational point of view, but are difficult to support in financial terms. The Actual Hours method has no link with income other than, perhaps, a careful calibration of activity weightings. The latter are more often based on a perceived cost (in time) required to complete a task well, however. The Student Load method on the other hand tightly equates income with cost; opinions differed among interviewees on the soundness of that equation. The load method does, however, simplify financial planning considerably; the shortfall (if any) in available time provided by continuing academics compared with what is required to run the existing units can be estimated quickly and hence budget requirements for fixed and casual staffing are readily available. Actual Hours models also enable such planning, but it is much more difficult and can typically be done with precision only at the level of sections (Schools or Departments) first and subsequently at Faculty or Divisional level. Table 1 summarises and compares the strengths and weakness of the Student Load method versus the Actual Hours method. While the latter is more effective for a larger number of requirements than the former, the strengths of the Student Load method (and the corresponding weaknesses of the Actual Hours method) are too significant to ignore. What is needed for a new teaching allocation method is a combination of both existing methods that retains as many strengths as possible.
97
Table 1. Evaluating the Student Load and Actual Hours methods Student Load method Actual Hours method Blended teaching Equal treatment of students
enforced
Difficult to choose weightings, but in theory can treat blended learning cohorts equally, overvalue, or undervalue them. ±
Multiple campuses Problematic
Effective
Equity Problematic
Fine-grained rules are best
Transparency / communication
Intrinsic limitation Can cater for all interpretations, and used for communication
Foster innovation Best for bottom-up innovation Weak on incentives ±
Fine-grained is weak on flexibility Strong on incentives ±
Flexible unit development
Problematic
Effective
Drive change Not well suited
Both carrots and sticks possible
Meaningful Not meaningful Cannot be used outside Teaching
Fine-grained rules are best Usable for all envelopes
Budget awareness straightforward budgetary planning
too many possible cost profiles
ASSEMBLING A NEW TEACHING ALLOCATION METHOD We observed one such combination in use in two distinct academic sections of a single institution that used the Student Load method for its teaching allocations. Simply put, both models improved the equity and transparency/communication properties of the Student Load model by underpinning it with an Actual Hours model. Both sections first allocate specific teaching tasks (including resulting hours) to staff and then use the outcome to determine that percentage of time allocated to different staff in the same unit. That percentage is then used to determine the distribution of load between staff in the university’s overall cost-based model. While this approach could be judged to better address equity compared to Student Load sections that did not use it, critical shortcomings remained, especially around support for multiple campuses, and for flexible unit content development. During the course of our interviews we have not observed the second logical combination that can be imagined between the two methods; that combination is the basis for the new teaching allocation method that we present in this paper. In essence, we propose overlaying a fine-grained actual hours model with a cap function that is inspired by the Student Load method. However, the cap function is more complex in that it considers more parameters than only the number of enrolments in a unit. The additional parameters cater, for example, for the presence
98
of more than one campus and for the possible existence of content development or teaching innovation. We call the new method the ‘Capped Actual Hours’ teaching allocation method. In the process of using the proposed method, one first calculates the maximum number of hours available for allocation in a unit, based on a limited number of parameters. In this respect it is similar to the Student Load method, where a load for a unit is determined only on the basis of the enrolment figure. In the second phase, the method is similar to the Actual Hours method: activities are assigned to staff teaching into the unit; each activity corresponds to an amount of time. The sum of the time for the assigned activities must then be equal or less to the value calculated by the cap function. The properties of the Capped Actual Hours method are essentially the strengths of the Student Load method combined with those of the Actual Hours method. With respect to the requirements of multiple campuses, equity, meaningfulness, and transparency and communication, the new method retains the properties of the Actual Hours method. We briefly evaluate the capped method against the remaining requirements, on which it performs better than the traditional methods. Blended Teaching. The Capped Actual Hours method at first sight resembles the Actual Hours method in that it may still be difficult to choose weightings for blended activities as compared to purely face-to-face activities. However, the presence of a cap makes it simpler for models that use the new method to create generic activities that cater for all modes and treat all students in a unit equally in terms of expended resources. Thus it can behave similarly as the Student Load method if so required. Foster Innovation. The weakness of the Student Load method (not being able to use incentives) can be eliminated by adding the presence of effort to revise teaching practice in a unit as a parameter to the cap function. Hence the time available for running the unit will be larger than if staff were running it in an established mode. The strength of the Student Load method in terms of catering for the possibility of bottom-up decision making around appropriate pedagogy, can be retained by allowing the teaching staff to fill the unit’s allowance as pre-computed by management. Flexible unit development. As with the innovation property above, the Capped Actual Hours method includes a development parameter in the definition of the cap function. Drive Change. Instead of modifying weightings to desired activities as in the Actual Hours method, in the Capped method the cap function itself can be modified to include additional parameters. Budget Awareness and Planning. The cap function allows for straightforward budgetary planning: managers need not know exactly which activities will be assigned to a unit; instead, only the value for each of the cap function’s parameters is needed for each unit to work out what the cost is of running it. This can be done well in advance of the allocation of detailed workload activities to units and staff. In the course of our work we have identified a number of techniques to create an appropriate cap function; due to paper length restrictions we do not detail those techniques here. It should be noted that creating the cap function is a critical and non-trivial task that, given its budgetary effect, should be undertaken with care. In the next section we will provide an
99
example of a possible cap function, as well as its application within a sample workload model. A SAMPLE WORKLOAD MODEL COMPARED TO EXISTING MODELS This paper has so far discussed academic workload model types rather than actual instances of those types. As we noted earlier, we were unable to find a clear definition for workload models in the literature. To evaluate the usefulness of the proposed Capped Actual Hours teaching allocation method, however, we introduce a working definition here. A workload model is an explicit choice for both the envelope approach and the teaching allocation method, together with concrete rules that govern the use of both parts. We now introduce three distinct workload models; the first two are simplified versions of models that we have observed in our study, while the third is a constructed example to demonstrate the use of the Capped Actual Hours method proposed in the preceding sections of this paper. Given that we focus on teaching allocations, we limit the detail regarding envelope rules. In addition, we limit detail of the teaching allocation rules to that which is required for the evaluation of allocations later in this section. Model 1. Envelope approach: Fixed. Envelope rules: 40-40-20 for all ‘regular’ academic staff. Teaching allocation method: cost based. Rules: Student Load is determined solely on enrolment numbers (eight students equal one Equivalent Full Time Student Load), and distribution among staff co-teaching a unit is based on negotiation. Model 2. Envelope approach: Teaching Last. Envelope rules: default 10 per cent service, variable research envelope of 10 per cent to 40 per cent depending only on past performance, and the remainder is available for teaching. Teaching allocation method: actual hours. Rules:
● marking, assigned to unit: 1 hour per student overall assessment items in the unit ● lecturing, assigned to unit offer: 2 hours of preparation for each hour of delivery ● tutoring, assigned to unit offer: 1 hour of preparation for each hour of original delivery ● repeat tutoring, assigned to unit offer: per hour of delivery ● consultation, assigned to unit: 30 minutes per student ● overall unit leadership, assigned to unit: 25 hours, plus 5 minutes per student ● additional campus leadership, assigned to unit offer: 5 hours, plus 5 minutes per student ● unit content development (major), assigned to unit: 50 hours
Note that for each teaching activity listed above, we indicate to what portion of a unit the activity can be allocated. Units typically consist of more than one offer, each essentially identifying a student cohort. For example, an Introductory Statistics unit may comprise two on-campus offers (one each per campus) as well as an external offer. A lecture is then an activity that is only offered for the on-campus student cohorts in the unit, hence is allocated to each of the two on campus offers. Content redevelopment, in contrast, is allocated to the unit as a whole since all student cohorts will be handed the same content. Model 3. Envelope approach and rules: identical to Model 2. Teaching allocation method: Capped Actual Hours. Rules:
● marking, assigned to unit: 1 hour per student over all the assessment items in the unit ● lecture (delivery only), assigned to unit offer: per hour of delivery ● tutorial (delivery only), assigned to unit offer: per hour of delivery ● preparation of delivery, assigned to unit offer: 4 hours per week
100
● non-face-to-face activities, assigned to unit offer: remainder as subtracted from cap ● overall unit leadership, assigned to unit: 25 hours, plus 5 minutes per student ● additional offer leadership, assigned to unit offer: 5 hours, plus 5 minutes per student
Cap function parameters: enrolment (5 hours per student), campus count (75 hours per additional campus), content redevelopment (50 hours for presence of major redevelopment). Continuing with the Introductory Statistics example unit introduced above, we now consider a scenario in which workload for the unit is allocated based on the following unit properties. The unit has 150 students enrolled over three offers: one in on campus mode at Campus 1 (60 students), one in on campus mode at Campus 2 (50 students), and one in external mode (40 students). There are 13 weeks of delivery, and each student has two hours of lectures per week, and two hours of tutorials. The tutorials are conducted in groups of 30; hence there are two groups at Campus 1 and two groups at Campus 2. Content redevelopment is approved to take place for this unit. The allocations for the example unit under the three workload models are as follows. Allocations under Model 1. The total of 150 students equates to an Equivalent Full Time Student Load of 18.75. After negotiation, the load is split over three academics as follows: Academic 1, at Campus 1: 60 per cent of load = 11.25 Academic 2, at Campus 2: 20 per cent of load = 3.75 Academic 3, at Campus 2: 20 per cent of load = 3.75 The weaknesses associated with the Student Load method as listed earlier in this paper can be shown through this example. If the unit had been taught in on campus mode at only one campus, it would have been allocated the same load, but only one set of lectures would need to be run. In addition, the staff involved must work out which activities correspond to the load that has been allocated to them; in the absence of objective weighting on those activities, the distribution of work may not be equitable and is likely to be inconsistent across units. Finally, the load assigned to the unit is irrespective of the presence of a major content redevelopment. Hence staff running a similar unit without such redevelopment would attract the same load but be required to do significantly less work. Before we turn to the allocations under the two other models, we note that the actual numbers (i.e. the total load under Model 1 and the hours under Models 2 and 3) generated by the models for the example unit are immaterial with respect to the focus of this paper. Indeed, the fundamental properties of the models with respect to the requirements examined before, would remain even if the weightings in Models 2 and 3, and the cap function in Model 3 were changed such that they generated the same total number of hours. Hence the allocations that we detail here should not be compared in terms of the resulting totals, but in how they address the issues of multiple campuses, blended learning, and flexible content development. Allocations under Model 2. Total is 668 hours.
● marking, assigned to Academic 1 (at Campus 1), for 60 students = 60 hours ● marking, assigned to Academic 2 (at Campus 2), for 50 students = 50 hours ● marking, assigned to Academic 3 (at Campus 3), for 40 students = 40 hours ● lecturing, Academic 1 at Campus 1, 13 weeks, 2 hours per week = 26 * 3 = 78 hours ● lecturing, Academic 2 at Campus 2, 8 weeks, 2 hours per week = 16 * 3 = 48 hours ● lecturing, Academic 3 at Campus 3, 5 weeks, 2 hours per week = 10 * 3 = 30 hours ● tutoring, Academic 1 at C1, 13 weeks, 2 hours per week first group = 26 * 2 = 52 hours ● tutoring, Academic 1 at C1, 13 weeks, 2 hours per week repeat group = 26 hours
101
● tutoring, Academic 2 at C2, 13 weeks, 2 hours per week group 1 = 26 * 2 = 52 hours ● tutoring, Academic 3 at C2, 13 weeks, 2 hours per week group 2 = 26 * 2 = 52 hours ● consultation, Academic 1 at Campus 1, for 60 students = 30 hours ● consultation, Academic 2 at Campus 2, for 90 students = 45 hours ● overall unit leadership, assigned to Academic 1: 25 hours + 12.5 hours = 37.5 hours ● additional campus leadership, Academic 2 at Campus 2: 5 + 12.5 hours = 17.5 hours ● unit content development, assigned to Academic 1 at Campus 1: 50 hours
The strength of a fine-grained model lies with its ability to plan at a detailed level and communicate responsibilities to staff. In addition, an engaged workload manager can, in consultation with affected staff, ensure optimal equity in the distribution of tasks. However, actual hours models typically combine the delivery of a lecture (and any other face-to-face activity) with preparation for it. For multiple campuses, this ignores that some of the preparation (e.g. updating lecture slides) only need to happen once. Tutorials and similar activities often include student consultation that is limited to the on-campus cohorts. It is non-trivial to define activities (and their weightings) meant only for other cohorts. Model 2 given here is an example of how most existing actual hours models that we studied focus on traditional on-campus teaching at the expense of other modes. Some models attempt to resolve the problem by introducing higher-weighted versions of the consultation activity that apply only to non-on-campus student cohorts, but the effort often fails to provide comparable resourcing. Allocations under Model 3. Cap function: 5 * 150 = 750 hours, plus 75 (second campus) + 50 (development) = total of 875 hours available for allocation.
● marking, assigned to Academic 1 (at Campus 1), for 60 students = 60 hours ● marking, assigned to Academic 2 (at Campus 2), for 50 students = 50 hours ● marking, assigned to Academic 3 (at Campus 3), for 40 students = 40 hours ● lecture (delivery only), Academic 1 at Campus 1, 13 weeks, 2 hours per week = 26 hours ● lecture (delivery only), Academic 2 at Campus 2, 8 weeks, 2 hours per week = 16 hours ● lecture (delivery only), Academic 3 at Campus 3, 5 weeks, 2 hours per week = 10 hours ● tutorial (delivery only), Academic 1, 13 weeks, 2 hours/wk, 2 groups = 26 * 2 = 52 hours ● tutorial (delivery only), Academic 2, 13 weeks, 2 hours/week group 1 = 26 hours ● tutorial (delivery only), Academic 3, 13 weeks, 2 hours/week group 2 = 26 hours ● preparation of delivery: 60 per cent to Academic 1, 13 weeks = 13 * 4 * 0.6 = 31.2 hours ● preparation of delivery: 20 per cent to Academic 2, 13 weeks = 13 * 4 * 0.2 = 10.4 hours ● preparation of delivery: 20 per cent to Academic 3, 13 weeks = 13 * 4 * 0.2 = 10.4 hours ● overall unit leadership, assigned to Academic 1: 25 hours + 12.5 hours = 37.5 hours ● additional campus leadership, Academic 2 at Campus 2: 5 + 12.5 hours = 17.5 hours ● unit content development, assigned to Academic 1 at Campus 1: 50 hours ● blended activities, split 60-20-20 over the 3 academics: remainder of time available
A major strength of the capped method is that the total number of hours available for teaching a given unit is calculated in advance and is immutable. Staff involved can then discuss what the most appropriate pedagogical tools are for the unit, and work out an equitable distribution of allocations. This bottom-up approach can be mediated and subsequently approved by a supervisor. The unique and most important property of the model, however, lies with the allocation for non-face-to-face blended teaching activities. Rather than needing to define activities and weightings equivalent to standard on-campus activities such as lectures, the academics work out the quantity of resources to be allocated to on-campus students only, with the remainder (412 hours in this example) becoming available for blended-learning cohorts as well as all cohorts together.
102
The example cap function allows more time than was available under Model 2 because that traditional actual hours model undervalued non-traditional teaching. We note again that the example could have been constructed differently, with the outcome of the cap function generating a value much closer to the 668 hours allocated by Model 2. Doing so would not have affected the essence of the proposed model, which is that the total available hours can be distributed equitably over various teaching modes, but can also be utilised to favour one mode over others if so desired. Flexibility while retaining budgetary control is what sets this method apart. The size of the allowance in this example again makes it very clear that the construction of the cap function is critical and must be done with utmost care. In this example of a capped actual hours model, the delivery of face-to-face activities is decoupled from their preparation, on the grounds that the latter can be shared over several campuses and also with non-face-to-face teaching activities. This also simplifies the allocation for tutorials in the presence of multiple tutorial groups. CONCLUSIONS Academic institutions need to consider workload allocation in the presence of online and blended learning. Methods used in existing academic workload models are unable to meet a set of requirements identified by workload managers. Given the experimental nature of the new teaching modes the resulting workload model needs to be flexible while meeting traditional objectives of equity, transparency and fairness. In this paper we introduced a new type of workload model and we argued that a cap function is needed to keep the flexibility in check and ensure affordability. We presented an example model that is based on the proposed new teaching allocation method and compared outcomes with those of existing models as applied to a sample unit. Institutions or academic organisational units seeking to implement a model based on the novel teaching allocation method presented in this paper, are advised to direct significant effort to constructing an appropriate cap function. In future work we will formalise the various techniques that we have identified to undertake that task. BIOGRAPHICAL NOTES Stijn Dekeyser and Richard Watson are associate professors in computer science at the University of Southern Queensland and have both been Heads of Department. Elizabeth Baré is an Honorary Senior Fellow at the L.H. Martin Institute and a past Head of Administration at the University of Melbourne. REFERENCES Barrett, L. & Barrett, P. (2007). Current Practice in the Allocation of Academic Workloads. Higher Education Quarterly, 61(4), 461–478. Barrett, L. & Barrett, P. (2010). Cycles of Innovation in Managing Academic Workloads. Higher Education Quarterly, 64(2), 183-199. doi: 10.1111/j.1468-2273.2009.00436.x

103
Copeland, R. (2014). UCU policy position on MOOCs. University and College Union (UK), February 2014. Filby, J. & Higson, H. (2005). The contribution model: A school-level funding model. Perspectives: Policy and Practice in Higher Education, 9:3, 86-91. Fredman, N. & Doughney, J. (2011). Academic dissatisfaction, managerial change and neo-liberalism. Higher Education, 64, 41–58. doi: 10.1007/s10734-011-9479-y Georgia State University (2013). Motion on Massive Open Online Courses. GSU Senate Motion, 17 January 2013. Hull, R. (2006). Workload allocation models and ‘collegiality’ in academic departments, Journal of Organizational Change Management, 19(1), pp.38 - 53. doi: 10.1108/09534810610643677. Kearsley, G., & Blomeyer, R. (2004). Preparing Teachers to Teach Online. Educational Technology, 44(1), 49-52. King, R., Watson, R., Dekeyser, S., Bare, E. (2014). Current Australian practice in academic workload allocation: results of a pilot study. Technical Report, USQ Australia. Lyons, M. & Ingersoll, L. (2010). Regulated autonomy or autonomous regulation? Collective bargaining and academic workloads in Australian universities. Journal of Higher Education Policy and Management, 32(2), 137–148. doi: 10.1080/13600800903440592. Partridge, H., Ponting, D., & McCay, M. (2011). Good Practice Report: Blended Learning. Australian Learning & Teaching Council. Saunders, C. & Booth, S. (2013). Measuring learning outcomes at the course and unit level: Development and implementation of electronic course and unit reports at the University of Tasmania. In Proceedings of the 27th Tertiary Education Management Conference, Hobart, September 2013. Tight, M. (2010). Are Academic Workloads Increasing? The Post-War Survey Evidence in the UK. Higher Education Quarterly, 64(2), 200-215. doi: 10.1111/j.1468-2273.2009.00433.x Torrisi-Steele, G. (2011). This thing called blended learning – a definition and planning approach. Proceedings of the 34th HERDSA Annual International Conference. Gold Coast, Australia, July 2011. Vardi, I. (2008). The impacts of different types of workload allocation models on academic satisfaction and working life. Higher Education (2009) 57:499–508. DOI 10.1007/s10734-008-9159-8. Vaughan, N. D. (2007). Perspectives on Blended Learning in Higher Education. International Journal on E-Learning, 6(1), 81-94. Welker, J., & Berardino, L. (2005). Blended learning: understanding the middle ground between traditional classroom and fully online instruction. Journal of Educational Technology Systems, 34(1), 33–55. doi:10.2190/67FX-B7P8-PYUX-TDUP.

104
105
FRIENDS ACROSS SWANSTON STREET: BUILDING CROSS-UNIT CONNECTEDNESS THROUGH MENTORING PARTNERSHI PS
Ann Hornsby & Kai Jensen, RMIT University
[email protected] [email protected] (Corresponding author)
ABSTRACT This paper describes a mentoring programme for professional staff offered in partnership between three organisational units at RMIT University in 2013. We seek to offer other tertiary education professional staff managers a possible model of resource-efficient mentoring, while also alerting them to some of the risks of poorly planned mentoring programs. A survey of the literature suggests a set of requirements for a well-run workplace mentoring programme, and we measure our programme against this model. KEY WORDS mentor, mentoring INTRODUCTION In 2013 a mentoring programme was offered in partnership between three units of RMIT University: the Academic Registrar’s Group, a large central student administration unit; the Student Services Group, a large central unit providing support services to students;
and the College of Science, Engineering and Health (the College), one of the university’s three academic divisions in Australia, comprising a college office and ten academic schools spread across two campuses, the Melbourne City campus and the campus at Bundoora, an outer suburb.
The Academic Registrar’s Group is situated in a leased building on Elizabeth Street, a block away from the main campus, which is bounded by Swanston Street. Each of these three units has 150 or more professional staff (as opposed to academic or teaching staff): in the case of the College, considerably more. The programme was offered in the absence of a university-wide mentoring programme. Such a programme is intended by Human Resources, but has not yet commenced. The specific motives to offer the 2013 programme arose from the 2012 staff experience survey, in which Academic Registrar’s Group staff (and indeed, staff across the university) expressed lower levels of satisfaction with cross-unit communication, and also with career support. These dissatisfactions were explored in a plenary session at the 2012 Academic Registrar’s Group staff conference, during which staff were divided into discussion groups and invited to come up with suggestions for improvement. Several groups suggested mentoring to help staff develop their careers. A subsequent survey of Academic Registrar’s Group staff, to establish levels of support for the various suggestions, identified mentoring as a popular improvement.
106
The Academic Registrar’s Group executive team then proposed a mentoring programme in partnership with the two other units. This cross-unit approach would have two benefits: mentors and mentees from different units could be paired, enabling mentees to confide in mentors without concern that their confidences might become known to their own unit’s management; and the mentoring pairs would gain an understanding of one another’s area, thus improving cross-unit communication and connectedness. The programme would address two areas of staff dissatisfaction in a single activity. The proposal was supported by Academic Registrar’s Group unit managers, and was proposed to the most senior professional staff member in each of Student Services Group and the College, who welcomed the initiative and readily agreed to their unit’s participation. A steering group was formed comprising one or two executive staff or managers from each unit and an advisor from Human Resources. The steering group was supported by a senior project officer in the Academic Registrar’s Group, who coordinated communication during the project, and a masters student intern in Human Resources, who developed resources for mentors and mentees, and evaluation surveys. LITERATURE REVIEW An extensive literature has built up since mentoring became an object of university research in the mid-1970s (Anderson, 1995). Current leading scholars of mentoring such as de Vries et al. (2011), Megginson et al. (2006) and Ragins and Kram (2008) comment on the way ideas of mentoring have evolved since the 1970s: in particular, they have evolved away from models of mentoring as merely instrumental (about achieving promotion and improved performance in mentees) towards a developmental model in which both partners learn from the mentoring relationship: ‘there is now a collective view that outcomes related to personal learning, development and growth are equally relevant and important.’ (Ragins & Kram, 2008, p. 668) Although the literature consistently suggests that mentoring programmes yield numerous benefits for mentees, mentors and the organisation, it is also strewn with warnings of the ill effects of mentoring that is not done well, and of mentoring programmes that are poorly run. Long, in her paper ‘The Dark Side of Mentoring’ (1997), provides a list of risks and negative effects. Haggard (2012) suggests that poor experiences of either formal or informal mentoring may contribute significantly to staff perception of a ‘breach of psychological contract’ between the organisation and themselves, and thus alienate staff from the organisation. Expectations of mentoring are high, and the risks of disappointment are correspondingly present. To mitigate these risks, and ensure that mentoring yields the promised benefits, various authors advance sets of requirements for an effective workplace mentoring programme. There is now even an International Standard for Mentoring Programmes in Employment. The various models may be collated into the following 16 points, against which the RMIT programme is assessed to consider how it could have been improved. 1. Establish a mentoring culture in the organisation Megginson et al. (2006) propose that success of mentoring programmes is partly dependent on the organisation’s existing level of awareness of mentoring’s benefits, and commitment to mentoring. This aspect was outside organisers’ control, as none of the participating units had responsibility for the organisation as a whole. The project could be seen as a contribution to

107
developing a mentoring culture in the wider organisation, by piloting a formal mentoring programme involving a number of staff. Certainly it raised the profile of mentoring in the participating units. 2. Be aware of the mentoring literature Ehrich et al. (2004), in their survey of mentoring literature, suggest as a requirement for success of a mentoring programme, that organisers are aware of the literature on mentoring so they can set up the programme to ensure positive outcomes. The initial proposers of the programme had only a general idea of mentoring and its benefits. The Human Resources advisor, however, had undertaken a paper on mentoring as part of her master’s degree study, which had familiarised her with the literature. As will be seen, her advice enabled the programme to fulfil most of the requirements for a successful workplace mentoring programme, but perhaps not all. In retrospect it would have been better if the other active organisers of the programme had had some familiarity with the literature as well. 3. Articulate the goals/purposes of the programme This requirement encompasses the need for both the programme as a whole, and the individual mentoring relationships, to have clear objectives. Ehrich and Hansford (1999) identify this as a prerequisite for success; while Megginson et al. (2006, p. 8) observe: ‘Mentoring schemes are developed in response to a need’ – and thus require a clear understanding of what is intended. The programme had relatively clear goals. As described above, it was established to address low staff satisfaction ratings for career development and cross-unit communication. These goals were further elaborated in planning into the following statement of the programme’s objectives:
The Mentoring Programme 2013 aims to support the career development of mentees, to build mentoring skills of mentors, and improve mutual understanding and connectedness between the three participating units. The mentoring relationship is voluntary and private, and will be based around the learning goals of the mentee, which may include a desire to learn more about the organisation, guidance on career path, or a range of topics to support the staff member in their professional and personal aspirations. At times the relationship may involve coaching, which aims to develop a specific skill or task that may be necessary for a staff member to perform their role.
This statement was used in communication with senior managers seeking their support for the programme, and in the invitation for expressions of interest from staff to participate in the programme as mentors or mentees. With regard to individuals’ goals in the programme, Megginson et al. (2006, p. 16) observe that: ‘Current research…indicates the relationship satisfaction and relationship quality, as perceived by both mentor and mentees, are closely correlated with the mentee having specific and/or individual learning goals.’ The programme placed considerable emphasis on the need for mentoring pairs to establish the mentee’s objectives in the first mentoring meeting, and for these to be measurable goals. The formal programme was to be limited to six months’ duration, and so specific goals were
108
necessary, both in order to provide some structure for the mentoring conversations, and to enable evaluation of whether the programme proved effective in supporting mentees’ development. To this end, in separate training sessions held for mentees before the mentoring commenced, they were asked to set SMART goals (specific, measurable, assignable, realistic and time-related) for their mentoring partnership. Comments in evaluation surveys during the programme, however, indicated that at least some mentors and mentees found this emphasis on SMART goals overly constraining, and that they preferred to allow their mentoring conversations to find their own path. Gold (2002) suggests that the programme should prompt mentoring pairs to review their original goals regularly, to consider whether these should be adjusted or replaced in light of the way the mentoring relationship is playing out. It sounds as though some mentoring pairs introduced this flexibility on their own initiative. 4. Resource the programme adequately Ehrich and Hansford (1999) propose that sufficient resourcing is necessary to ensure the success of a mentoring programme, while Rolfe (2011) suggests programmes must be sufficiently thoroughly promoted that staff will understand participation can be treated as a priority. This programme was, however, run ‘off the side of the desk’ – alongside the organisers’ existing roles. The challenge of organising the programme in the absence of dedicated resources was a topic of discussion at early meetings of the steering group. Some resources were cobbled together. The Academic Registrar’s Group provided a Senior Project Officer to coordinate the programme – who, however, had to squeeze this work in among her other projects. A resource book for mentors, and a resource book for mentees, were able to be prepared because a masters intern was available for this task in Human Resources. Long (1997) notes the risk of overloading good mentors with multiple mentoring relationships. Fortunately the number of mentors (20) and the number of mentees (23) was fairly close, so that only three mentors (all on the organising committee) had to take two mentees. 5. Ensure senior officers support the programme As described above, the most senior professional staff member in each participating unit welcomed the mentoring initiative and nominated staff for the steering committee. The organisers also informed the senior manager of each unit that the programme was being initiated. These arrangements do not, however, equate to active support. In particular, it would have been desirable for senior officers to communicate to staff of participating units that participation in the programme could take precedence over other work priorities. Evaluation later revealed that some mentoring relationships met less frequently than monthly, perhaps because the mentoring was not seen as a high priority. 6. Establish a programme timeline Ehrich and Hansford (1999) recommend that a mentoring programme be time-limited. Gold (2002, p. 32-33) observes: 'The notion of closure sets a time-frame. This can act as a motivator for those who would otherwise drift along in the relationship. The ending is one way of encouraging people to actively choose to remain in the relationship or not.’ This programme was stated at the outset to have a duration of six months, during which mentoring pairs were asked to meet at least monthly. Pairs could elect to continue informally after the end of the formal programme, and some are still meeting. 7. Appoint a programme coordinator Ehrich and Hansford (1999) recommend that the programme have a designated coordinator. As described above, a staff member of the Academic Registrar’s Group served as programme
109
coordinator, servicing the steering group and managing communications, with support from an intern in Human Resources, who provided programme resources and developed evaluation surveys. 8. Communicate and promote the programme Communication and promotion are one component of the good practice model proposed by Ehrich and Hansford (1999). The programme was announced to staff in the three units by emails sent to the senior professional staff member in each unit, with a request to forward these to team or (in the College) school managers, for circulation to staff. These emails invited staff to express interest in participating as mentors or mentees, by completing an online application form. An information sheet explaining the objectives and structure of the programme was attached to these emails. In the Academic Registrar’s Group the programme was also announced via the staff bulletin. This scheme of communication and promotion was perhaps somewhat minimal. 9. Enable voluntary involvement in the programme as mentors or mentees Voluntary involvement in mentoring programmes is preferred by Ehrich and Hansford (1999), while Megginson et al. (2006) regard voluntarism as a condition for success of mentoring programmes. They also caution that ‘it is very easy to create situations where one or both participants are reluctant volunteers’ (Megginson et al. (2006). This programme was voluntary: participants had to apply to participate, and in their application had to describe their objectives in participating (mentees) and what they had to offer (mentors). 10. Have a no-fault exit clause Ehrich and Hansford (1999) and Megginson et al. (2006) state that participants must have the option of terminating the mentoring relationship without blame. The International Standards for Mentoring Programmes in Employment go further, requiring under standard 3, Process for Selection and Matching that: ‘There is a process for recognising and unwinding matches that do not work; and for reassigning the participants, if they wish.’ This programme did provide an explicit process for exiting from mentoring relationships: participants could contact the organiser or the steering group member for their unit. No participants used this process, although feedback suggested that some mentoring pairs ceased to meet of their own volition. There was no process for re-pairing, although when one mentor left the organisation, a new mentor was found. 11. Set out roles, expectations and responsibilities clearly This common sense requirement is part of the mentoring good practice model proposed by Ehrich and Hansford (1999). In this programme separate 1.5 hour training workshops were held for mentors, and for mentees, during which they were provided with a resource book for the programme, talked through the key sections, and led in a training activity. Particular emphasis was placed on their role and its responsibilities. Mentors were told that they were responsible for providing a safe learning environment for the mentee, being reliable and committed to the relationship, for challenging and ‘stretching’ the mentee – ‘encourag[ing] them to see new ways of thinking and working to achieve their desired development objectives’. Mentees were told that they were expected to organise the meeting arrangements, set the topics for discussion, listen and be open to suggestions for new ways of working and thinking, take responsibility to progress agreed actions and report back, give feedback to the mentor, and show enthusiasm and commitment to the mentoring process. Both mentor and mentee were told that they were expected to maintain the confidentiality of the process. 12. Select mentors with good skills
110
Central to the success of mentoring relationships are the skills and qualities of mentors. ‘Authors who describe formal mentoring programmes often identify personal support and good human relations skills as key characteristics of the mentor’s role.’ (Ehrich & Hansford, 1999, p. 104). Megginson et al. (2006, p. 18) find as common factors in basic mentoring competencies identified in the literature: ‘the communication skills to articulate problems and ideas, to listen and to challenge constructively; the ability to be honest with oneself and the other partner and to reflect upon what is said, both at the time and subsequently; and a capacity for empathy’. Gold (2002, p. 34) observes:
I believe a key element for successful mentoring relationships is a desire to learn through a collaborative relationship that enhances exploration of knowledge and practice. Development of such a relationship is ultimately dependent on the interpersonal characteristics of the mentor and to a lesser extent of the mentee. Desirable characteristics of interpersonal skills include the ability to suspend judgement, and to employ acceptance, active listening, openness and self-awareness. These form a gateway ... into a positive mentoring relationship. These skills must have been developed to a certain level before assuming the role of mentor. ... mentoring skills include ... the ability to constructively challenge, bravery in becoming involved in new experiences, making time available, enthusiasm and interest.
The 2013 programme cannot be said to have selected mentors on the basis of good mentoring skills. Staff at Higher Education Worker Level 8 or above up to executive level could participate as mentors, so that they would have some experience of leadership and staff supervision to offer mentees, who could be staff from HEW Levels 6 to 10. Applicants to be mentors were selected on the basis of their answers to questions in the online application form. They were asked to state their personal objectives in participating as mentors in the programme, and to state what skills/experience they had to offer mentees. Some applicants who did not answer these questions were not selected to be mentors, but those who did answer them, were. This was hardly a close scrutiny of their skills for the role, although it did eliminate those with low motivation. The programme was based on the assumption that if mentors showed some commitment to the programme, and had more experience than the mentees, the mentees would be likely to experience benefit from the relationship. Remember that one of the stated objectives of the programme was to develop mentoring skills. 13. Train mentors and mentees Megginson et al. (2006, p. 10) suggest that mentoring training falls into three broad categories: developing mentors’ skills for mentoring conversations (such as asking open questions, and active listening); encouraging participants to see the value of the programme and commit themselves to it; and what they describe as ‘the conscious seeking approach’, which focuses on drawing out of participants their existing skills and understanding of mentoring, so that they will be aware of these and able to add to them. Long (1997) observes that many mentoring schemes provide an insufficiently sustained sequence of training and follow-up support. This criticism could be directed at the RMIT programme, since the only training provided to mentors was an initial 1.5 hour workshop, which included an activity on asking open questions. The resource book provided to mentors had sections on giving feedback to mentees and on effective communication skills: it is unclear, however, whether mentors read the resource book. 14. Match mentors and mentees well A number of commentators identify effective matching of mentors and mentees as vital to programme success (Ehrich et al. (2004); Megginson et al. (2006); Johnson et al. (1999);
111
Long (1997) – though recommendations on how to achieve this are less common. Ragins and Kram (2008) suggest that the matching process should include matching by personality type, which implies personality testing as a component in induction into the programme. In the RMIT programme, 30 staff applied to be mentees, and 28 to be mentors. Of these, 23 were accepted into the programme as mentees (17 women and six men), and 20 as mentors (16 women and four men). By good fortune the mentors and mentees were fairly well distributed between the three participating units: 10 mentees were from the Academic Registrar’s Group, nine from the College and four from Student Services Group; nine mentors were from the Academic Registrar’s Group, eight from the College and three from Student Services Group. Mentors and mentees were paired by the steering group based on the mentee’s objectives, the requirement to match people in different organisational units, and steering group members’ knowledge of the individuals and whether they seemed likely to be a good match. Many mentees’ stated objectives were relatively general and thus similar, and given the small numbers and the need for the pairs to operate across unit boundaries, matching choice was somewhat constrained. Clearly, matching was a subjective process, but what care could be taken, was. 15. Provide support for mentors and mentees Rolfe (2011) identifies support for both mentors and mentees as necessary for an effective mentoring programme. Megginson et al. (2006, p. 12) recommend supervision of mentors: ‘Consider mentoring your mentors. Provide them with the support you want them to give to others. Ensuring that they experience expert mentoring themselves will produce better outcomes.’ Gold’s programme assisted participants ‘to recognise, prevent or manage dysfunctional behaviours: the sabotaging of the relationship, bullying, deception and psycho-social dependence’ (Gold (2002): 34-35). At the same time, Megginson et al. (2006, p. 19) express some ambivalence about the level of central control involved in supervision of mentors, observing that a programme ‘can adopt a highly interventionist or a laissez-faire approach, and a centralist or decentralising structure. A critical question here is the extent to which the relationship is enhanced by the degree of support given and, in spite of a considerable weight of academic literature on formality and informality, there are no clear answers.’ Again, this programme, within its resource constraints, provided only a slight degree of supervision for mentors and mentees, in the form of a non-compulsory workshop for each category of participant halfway through the programme, to offer opportunities for them to compare notes on their experience, and provide feedback in discussion (to supplement the evaluation surveys described below). In retrospect, it would have been more effective to offer these workshops straight after the first month’s mentoring meetings, to support mentors and mentees in the critical phase of forming their relationships. Among the comments received in surveys, participants commented that they would have liked more structure or formal training following the initial meetings with their partners. Although a declared objective of the programme was to develop mentoring skills in mentors, participants were largely left to manage their skills development for themselves. 16. Monitor and evaluate the programme to support ongoing improvement, and to
measure whether the programme meets its objectives Ehrich et al. (2004) identify evaluation as essential to a well-run mentoring programme; not only evaluation but monitoring and ongoing improvement of the programme are recommended by Ehrich and Hansford (1999). The International Standards for Mentoring
112
Programmes in Employment include ‘effective processes for mentoring and review’ as the fourth standard, defining these as follows:
The programme is measured sufficiently frequently and appropriately to: Identify problems with individual relationships Make timely adjustments to programme Provide a meaningful cost-benefit and impact analysis. So good practice evaluation and review need to monitor the overall benefit of the programme, whether it needs improving while in process (this is perhaps more applicable to ongoing programmes as opposed to time-limited programmes), and also whether individual mentoring relationships are running into problems. This programme was evaluated by online surveys of participants at one month in, three months in (the mid-point), and at termination, after six months. Response rates to these surveys were high among mentees to begin with, although less than half of mentors responded to the first one; mentees’ response rates fell over time: see Table 1. Table 1: Evaluation survey response rates
Evaluation Surveys No. respondents Response rate
Mentees Mentors Mentees Mentors Initial 19 10 83% 48% Mid-point 12 6 52% 29% Final 11 9 48% 43%
The initial low response of mentors, and the falling off of mentee responses, are disturbing. Although workload pressures may account for some of this, the low initial response from mentors suggests a lack of commitment to the programme, and the later lowered response rates from mentees may mean that some mentees disengaged subsequently. Most of those who did respond indicated that their mentoring partnerships continued for the six months, with partners meeting once a month. In some cases the meetings were fortnightly, but others occurred at varying intervals depending on workload. Most partners met for one hour sessions. Diagram 1 shows that, by the end of the programme, 60 per cent of mentee respondents assessed the programme as contributing to their preparedness to reach their career goals, and 20 per cent as contributing ‘somewhat’. Diagram 2 shows that 89 per cent of mentors indicated that their support as mentor contributed to the mentee’s preparedness to reach their career goals.
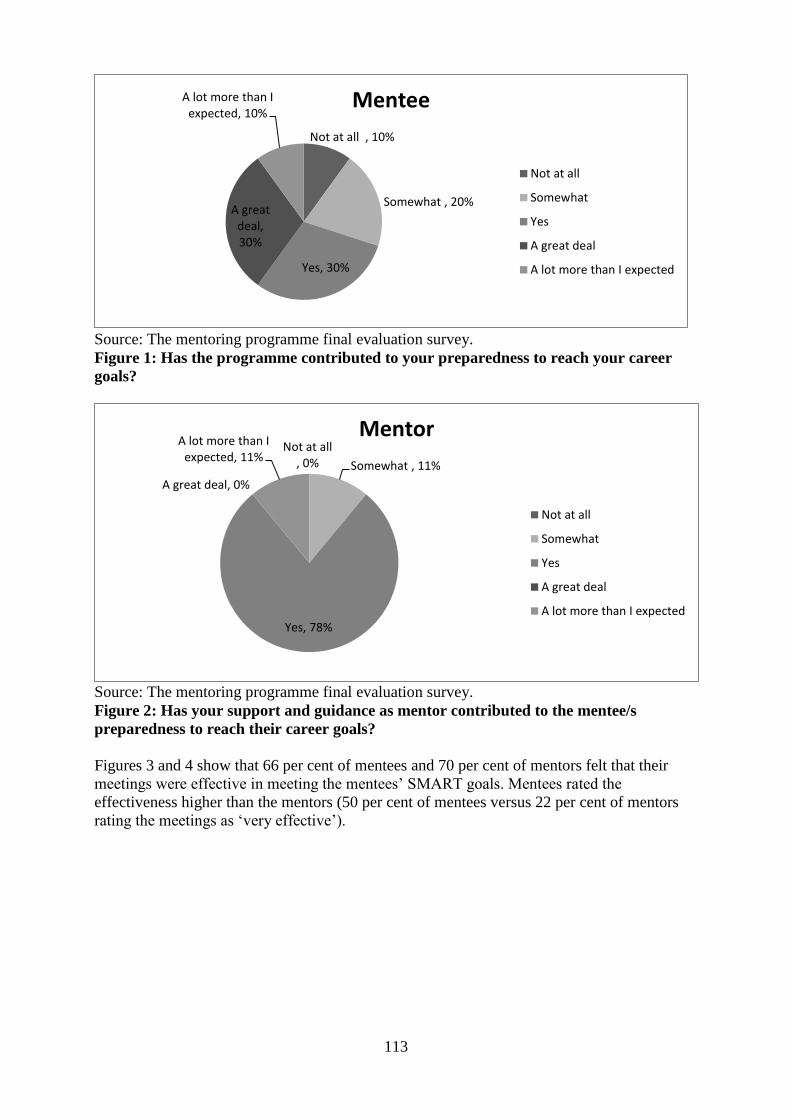
113
Source: The mentoring programme final evaluation survey. Figure 1: Has the programme contributed to your preparedness to reach your career goals?
Source: The mentoring programme final evaluation survey. Figure 2: Has your support and guidance as mentor contributed to the mentee/s preparedness to reach their career goals? Figures 3 and 4 show that 66 per cent of mentees and 70 per cent of mentors felt that their meetings were effective in meeting the mentees’ SMART goals. Mentees rated the effectiveness higher than the mentors (50 per cent of mentees versus 22 per cent of mentors rating the meetings as ‘very effective’).
Not at all , 10%
Somewhat , 20%
Yes, 30%
A great
deal,
30%
A lot more than I
expected, 10% Mentee
Not at all
Somewhat
Yes
A great deal
A lot more than I expected
Not at all
, 0% Somewhat , 11%
Yes, 78%
A great deal, 0%
A lot more than I
expected, 11%
Mentor
Not at all
Somewhat
Yes
A great deal
A lot more than I expected
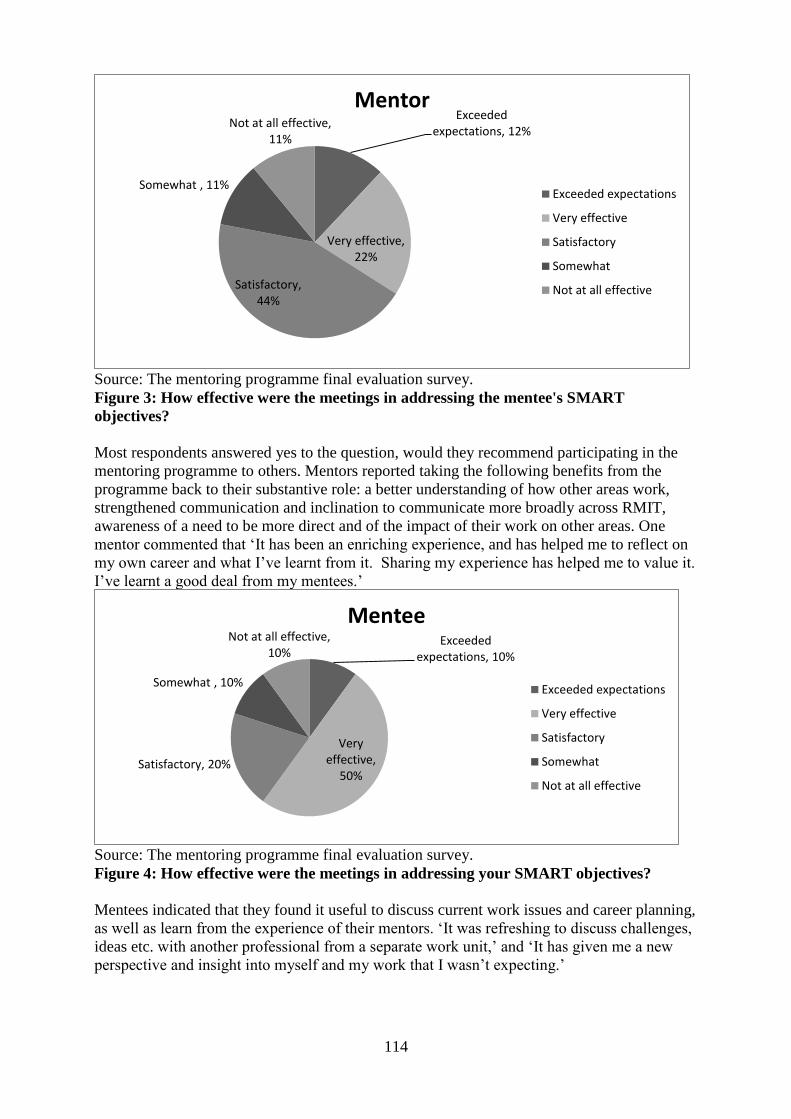
114
Source: The mentoring programme final evaluation survey. Figure 3: How effective were the meetings in addressing the mentee's SMART objectives? Most respondents answered yes to the question, would they recommend participating in the mentoring programme to others. Mentors reported taking the following benefits from the programme back to their substantive role: a better understanding of how other areas work, strengthened communication and inclination to communicate more broadly across RMIT, awareness of a need to be more direct and of the impact of their work on other areas. One mentor commented that ‘It has been an enriching experience, and has helped me to reflect on my own career and what I’ve learnt from it. Sharing my experience has helped me to value it. I’ve learnt a good deal from my mentees.’
Source: The mentoring programme final evaluation survey. Figure 4: How effective were the meetings in addressing your SMART objectives? Mentees indicated that they found it useful to discuss current work issues and career planning, as well as learn from the experience of their mentors. ‘It was refreshing to discuss challenges, ideas etc. with another professional from a separate work unit,’ and ‘It has given me a new perspective and insight into myself and my work that I wasn’t expecting.’
Exceeded
expectations, 12%
Very effective,
22%
Satisfactory,
44%
Somewhat , 11%
Not at all effective,
11%
Mentor
Exceeded expectations
Very effective
Satisfactory
Somewhat
Not at all effective
Exceeded
expectations, 10%
Very
effective,
50% Satisfactory, 20%
Somewhat , 10%
Not at all effective,
10%
Mentee
Exceeded expectations
Very effective
Satisfactory
Somewhat
Not at all effective

115
Benefits identified by mentees included strategies for dealing with specific situations they found challenging, increased knowledge of how other areas of the university work, viewing things from an alternative perspective and increased confidence in handling difficult situations. ‘My mentor provided me with a template for planning a current project. I will be able to complete this related to my project; this will help me manage my time and potential resources that may be available.’ One mentee, however, commented: ‘I wouldn’t recommend participating. I didn’t have the right fit with my mentor unfortunately and found I have mentors in a more informal environment.’ Respondents indicated that SMART goals formed a component of the meetings but were not the whole focus. Some comments were that: ‘Our meetings were more informal and didn’t directly address SMART objectives, however both myself and the mentee achieved a great deal discussing various issues and how the mentee could deal with them.’; ‘The SMART objectives were referred to, however weren’t a main focus of our meetings. However tended to address the current projects and issues she was encountering at the time,’ and ‘The SMART goals seem too rigid and structured.’ When asked what their mentor had done well, mentees responded that their mentor was ‘relaxed and casual’, asked good questions, offered advice, gave reassurance as to what the mentee was capable of, made the mentee think outside the square, suggested reading and training courses, and showed understanding. The mentor ‘listened to me and made useful suggestions. She was also able to relate to my issue, the issues she had experienced in the past. Showed some sympathy with the struggle of jobs to be done and time to do it, something that is not always received.’ When asked what their mentee had done well, mentors reported mentees being open to making the relationship work, listening well, trying suggested ideas back at work, leading the topics of conversation of the meetings and revealing issues, concerns and difficulties at work. When asked what the mentee could have improved, mentors suggested being better prepared for the meetings, and to follow through with suggestions and actions discussed in meetings. Responses to a question about whether the programme had met their expectations were generally positive. Respondents reported having satisfying experiences which improved mentoring skills, that the programme was well organised, staff felt well matched with their partner, had gained strategies to use every day and had built good networks. Both groups were asked how the programme could be improved. There was common feedback that the SMART goals emphasis of the training session was too prescriptive and that less emphasis should be placed on these. Respondents suggested a number of other improvements: greater assistance to start the relationship and advice on what mentors can do if mentees don’t engage, a process to offer alternative pairings should the relationship fail, lengthening the programme duration, and expanding the programme to the wider university. Respondents said they didn’t refer to the resource book much and a shorter resource book would have been better. CONCLUSION
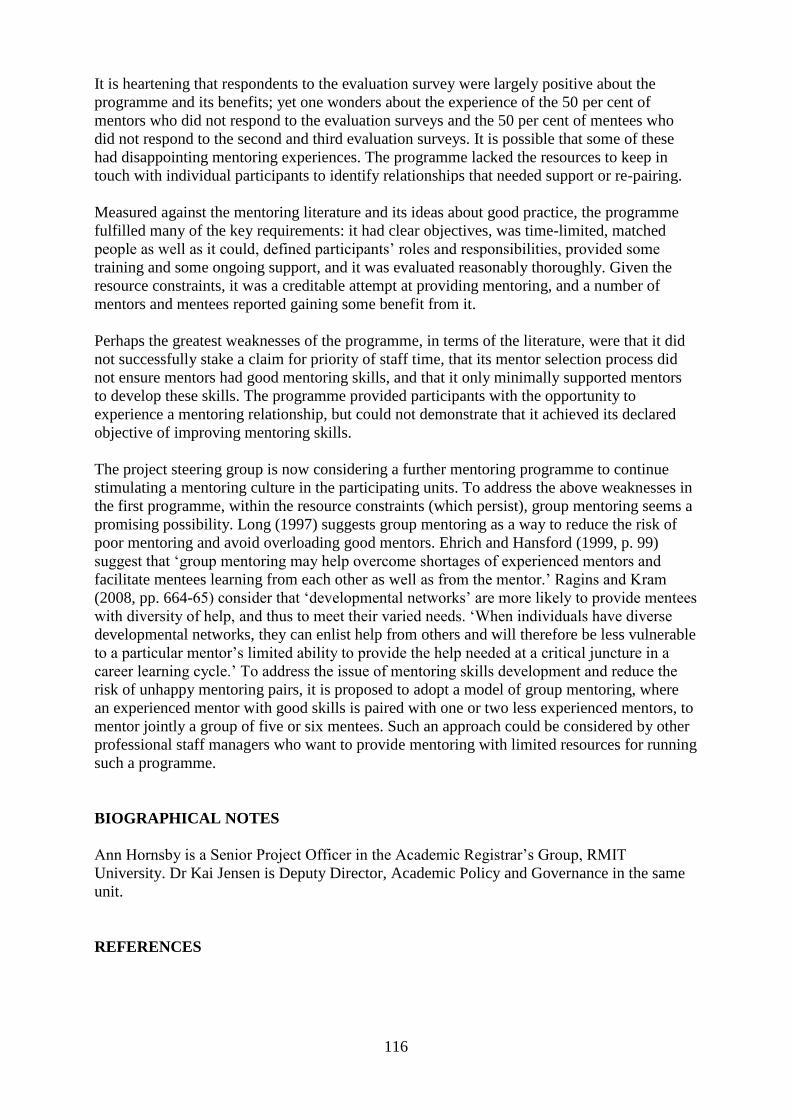
116
It is heartening that respondents to the evaluation survey were largely positive about the programme and its benefits; yet one wonders about the experience of the 50 per cent of mentors who did not respond to the evaluation surveys and the 50 per cent of mentees who did not respond to the second and third evaluation surveys. It is possible that some of these had disappointing mentoring experiences. The programme lacked the resources to keep in touch with individual participants to identify relationships that needed support or re-pairing. Measured against the mentoring literature and its ideas about good practice, the programme fulfilled many of the key requirements: it had clear objectives, was time-limited, matched people as well as it could, defined participants’ roles and responsibilities, provided some training and some ongoing support, and it was evaluated reasonably thoroughly. Given the resource constraints, it was a creditable attempt at providing mentoring, and a number of mentors and mentees reported gaining some benefit from it. Perhaps the greatest weaknesses of the programme, in terms of the literature, were that it did not successfully stake a claim for priority of staff time, that its mentor selection process did not ensure mentors had good mentoring skills, and that it only minimally supported mentors to develop these skills. The programme provided participants with the opportunity to experience a mentoring relationship, but could not demonstrate that it achieved its declared objective of improving mentoring skills. The project steering group is now considering a further mentoring programme to continue stimulating a mentoring culture in the participating units. To address the above weaknesses in the first programme, within the resource constraints (which persist), group mentoring seems a promising possibility. Long (1997) suggests group mentoring as a way to reduce the risk of poor mentoring and avoid overloading good mentors. Ehrich and Hansford (1999, p. 99) suggest that ‘group mentoring may help overcome shortages of experienced mentors and facilitate mentees learning from each other as well as from the mentor.’ Ragins and Kram (2008, pp. 664-65) consider that ‘developmental networks’ are more likely to provide mentees with diversity of help, and thus to meet their varied needs. ‘When individuals have diverse developmental networks, they can enlist help from others and will therefore be less vulnerable to a particular mentor’s limited ability to provide the help needed at a critical juncture in a career learning cycle.’ To address the issue of mentoring skills development and reduce the risk of unhappy mentoring pairs, it is proposed to adopt a model of group mentoring, where an experienced mentor with good skills is paired with one or two less experienced mentors, to mentor jointly a group of five or six mentees. Such an approach could be considered by other professional staff managers who want to provide mentoring with limited resources for running such a programme. BIOGRAPHICAL NOTES Ann Hornsby is a Senior Project Officer in the Academic Registrar’s Group, RMIT University. Dr Kai Jensen is Deputy Director, Academic Policy and Governance in the same unit. REFERENCES
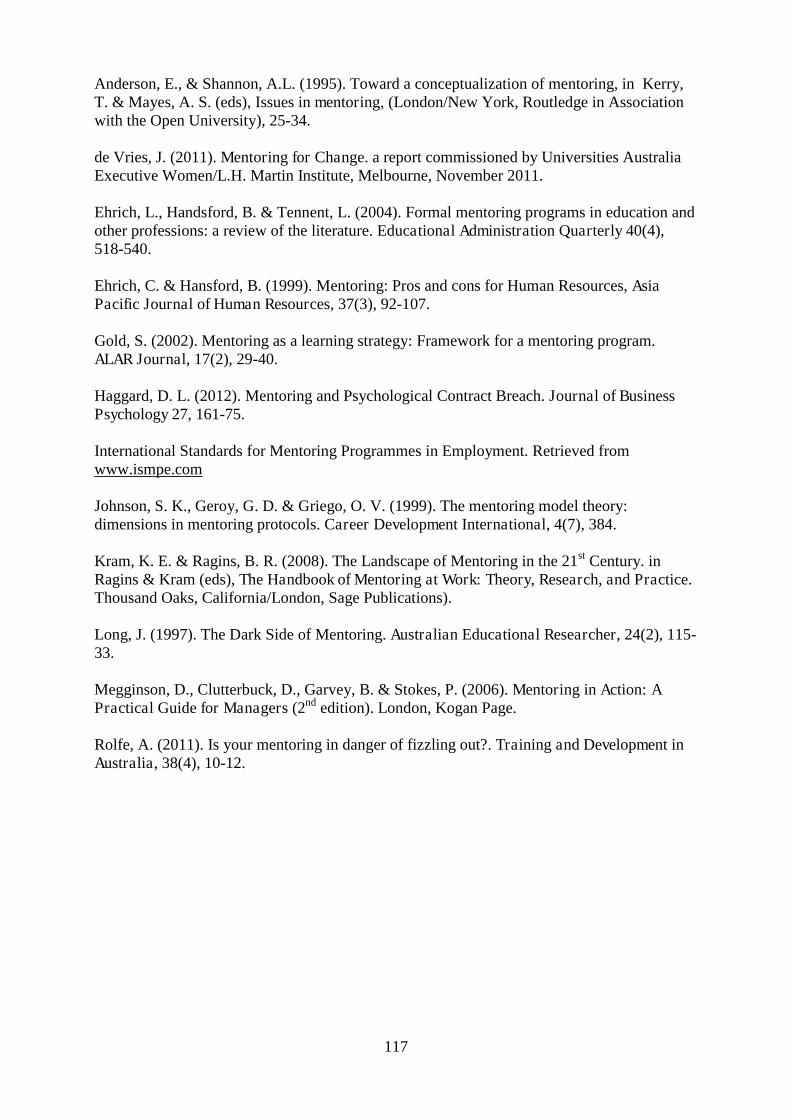
117
Anderson, E., & Shannon, A.L. (1995). Toward a conceptualization of mentoring, in Kerry, T. & Mayes, A. S. (eds), Issues in mentoring, (London/New York, Routledge in Association with the Open University), 25-34. de Vries, J. (2011). Mentoring for Change. a report commissioned by Universities Australia Executive Women/L.H. Martin Institute, Melbourne, November 2011. Ehrich, L., Handsford, B. & Tennent, L. (2004). Formal mentoring programs in education and other professions: a review of the literature. Educational Administration Quarterly 40(4), 518-540. Ehrich, C. & Hansford, B. (1999). Mentoring: Pros and cons for Human Resources, Asia Pacific Journal of Human Resources, 37(3), 92-107. Gold, S. (2002). Mentoring as a learning strategy: Framework for a mentoring program. ALAR Journal, 17(2), 29-40. Haggard, D. L. (2012). Mentoring and Psychological Contract Breach. Journal of Business Psychology 27, 161-75. International Standards for Mentoring Programmes in Employment. Retrieved from www.ismpe.com Johnson, S. K., Geroy, G. D. & Griego, O. V. (1999). The mentoring model theory: dimensions in mentoring protocols. Career Development International, 4(7), 384. Kram, K. E. & Ragins, B. R. (2008). The Landscape of Mentoring in the 21st Century. in Ragins & Kram (eds), The Handbook of Mentoring at Work: Theory, Research, and Practice. Thousand Oaks, California/London, Sage Publications). Long, J. (1997). The Dark Side of Mentoring. Australian Educational Researcher, 24(2), 115-33. Megginson, D., Clutterbuck, D., Garvey, B. & Stokes, P. (2006). Mentoring in Action: A Practical Guide for Managers (2nd edition). London, Kogan Page. Rolfe, A. (2011). Is your mentoring in danger of fizzling out?. Training and Development in Australia, 38(4), 10-12.

118
119
THE REAL VALUE OF AN INFORMATION ASSET REGISTER
Chelsea Harper, Kate Kirby & Sandra Jeffries University of the Sunshine Coast
[email protected], [email protected], [email protected] ABSTRACT Conducting an information asset audit, along with the creation of an information asset register (IAR), is a key step in understanding the information management needs of an organisation. The benefits of establishing and maintaining an IAR are well documented, specifically IAR use in the identification of a single source of truth for each information asset, and the allocation of responsibilities for each information asset. However, an IAR is also a rich dataset that can be tapped to make good business decisions and grow information management knowledge within an organisation. This case study discusses how the IAR established at the University of the Sunshine Coast (USC) has been used not only as a key tool in understanding the current information landscape, but also to enhance a number of other initiatives and projects throughout the University. The case study outlines a methodology for conducting an information asset audit and establishing an IAR in an Australian university environment, and presents various uses for IAR analytics both within the information management sphere and beyond. KEYWORDS Information asset, information asset register, information management. INTRODUCTION The University of the Sunshine Coast (USC) adopted a formal Information Management Framework and Strategy in 2012. The Strategy, endorsed by the Vice-Chancellor, aligns with and supports the University’s Strategic Plan and reflects an increasing need to manage information assets strategically. By providing a vision, priorities and plan for the best use of the University’s information assets, it aims to position the University for appropriate systems infrastructure, sound information governance, and an organisational culture of information sharing. Specifically the plan outlines the following: key information assets will be recorded and managed within an information asset
register a single source of truth will be identified for each information asset processes and systems will be developed to ensure the quality and integrity of information throughout its lifecycle information asset custodians will be assigned responsibility for the management of information assets and the authorisation of user access.
Annual Information Management Implementation Plans support the Strategy through endorsed operational activities. The Plans are prioritised and governed by an Information Management Steering Committee, providing information and advice to an Information and Communication Technology (ICT) Governance Committee and senior staff meetings as required. The Plans are implemented by a newly established Information Management

120
Services Unit, specifically through the employment of an Information Management Coordinator and an Information Officer (Strategy). In line with the Strategy, the 2013 Implementation Plan included an initiative to conduct an information asset audit to identify the information assets of the University and to establish an Information Asset Register to store this information. BACKGROUND Information asset registers Information asset registers (IARs) are tools used to list and track information assets of an organisation and have been developed in response to organisational needs to record information assets and their value (Brimson, 2005). Information asset means information in any format which supports a business process (National Archives of Australia, 2014) and is recognised as having value to the organisation. IARs are populated via an information asset audit process, and maintained as a valuable organisational dataset and information asset itself. An information asset audit is the systematic examination of information assets within an organisation. IARs can be scoped minimally, to include a high level granularity or specific type of information, or they can be more comprehensive and include information asset detail from entire enterprises (Brimson, 2005). In Australia, IARs are increasingly recommended by peak bodies for information management best practice. In 2009, the Queensland Government released ‘Information Standard 44: Information custodianship’, requiring Queensland Government agencies to establish and maintain an IAR. In 2011, the Office of the Australian Information Commissioner released principles on open public sector information, with principle 4 advising ‘robust information asset management’, requiring agencies to maintain an asset inventory or register of the agency’s information. Also released in 2011, the National Archives of Australia ‘Digital Continuity Plan’ identified information review (and subsequent information asset register) as key actions. The purpose of an IAR is to record the relationship of information to the business (Brimson, 2013). Benefits include: information valuation (National Archives, n.d.; Stevens, 2005; Higson & Waltho,
2010) identification of a single source of truth (and duplication avoidance) (Queensland Government, 2011) facilitation of access and reuse (National Archives, n.d.; Queensland Government, 2011; Office of Public Sector Information, 2009; Higson & Waltho, 2010) identification of information ownership/custodianship (Queensland Government, 2011) supporting business process improvements (Brimson, 2013; Griffiths, 2010) supporting information cleansing (Brimson, 2013) understanding information risks (Brimson, 2013) identification of key themes and patterns across organisational information use (Brimson, 2013).
The size of an IAR will relate directly to organisational information size, as well as the amount of detail or metadata recorded against each information asset. IARs grow quickly once the information asset audit process has commenced, so it is important to establish a
121
suitable IAR structure in the planning stages. The National Archives (n.d.) advises an IAR should be structured so that it is easy to see what information is affected by changes to business requirements or technical environment. The Queensland Government (2011), Stevens (2005) and the National Archives (n.d.) all provide (different) example structures of IARs that outline metadata fields for consideration. Organisations must ensure the chosen IAR structure aligns with organisational information needs, and only includes metadata fields that will be of value for the organisation to track. In terms of how much to capture, Stevens (2005) notes the idea of asset profiling is to capture just enough information so that the profile produces by the process is useful but not cumbersome to manage and change. Information asset audits The process for undertaking information asset audits to create IARs varies between organisations, however Stevens (2005) recommends an easy-to-follow approach with a six step iterative process for conducting an information asset profile. The steps include: 1. capture background information; 2. define information asset; 3. identify asset owner; 4. identify containers; 5. identify security requirements; and 6. determine the information asset valuation. In terms of the manner in which information asset audits should be conducted, Griffiths (2012) notes information audits should be collaborative and non-confrontational, and should deliver assurance and benefits that can be explained persuasively at corporate and team levels. USC CONTEXT USC’s information asset audit and the subsequent establishment of an IAR aligned with the University’s wider Information Management objective of establishing a sound information governance framework. The audit process, as well as identifying and capturing information assets, also provided Information Management Services staff the opportunity to raise awareness with USC staff about information assets, information management and associated issues. A key objective of the IAR was to ensure that organisational information was identified, defined and organised in a way that facilitated access to and reuse of this information. It was also expected to enable other information management outcomes, including: the identification of a single source of truth for each information asset; and the allocation of responsibilities for each information asset. Into the future, it is expected that the IAR would be used for University planning and decision-making through outcomes such as: the identification of information asset risks (to be managed using the University’s Risk Management Framework and Business Continuity Policy); the matching of information assets to organisational goals and objectives (with related values applied); the identification of information flow; the identification of information asset dependencies (both information and technology dependencies); and the planning for information business process improvements. METHODOLOGY The information asset audit was conducted in a phased approach. This included the following phases: planning
122
collection of data data analysis reporting. The planning phase included outlining the processes, resources and timelines of the audit, and the development of a project plan that was approved by the Information Management Steering Committee. The collection phase involved the systematic examination of information assets within the University, identifying to an agreed level of granularity what information assets were held. The collection phase duration was eight months and was resourced with an Information Management Services staff member two days a week. All organisational business systems, including shared drives, the corporate website, and the staff intranet, were assessed as sources/containers for potential information assets. Communication with managers in each department was conducted prior to accessing relevant business systems. This was to ensure the department understood the purpose and expected outcomes of the information audit. This communication was undertaken face-to-face, touching on all the information management tasks underway, including the information asset audit. Overall, discussions were held with 19 departments across the University. The IAR structure utilised at USC included 13 metadata fields in the first instance. These are Asset type Asset detail Creator Amount detail Original acquisition/creation date Location Source system Storage Storage format Content type Category Owner Custodian The IAR was maintained in Microsoft Excel, with a list of asset types included in a separate worksheet. The data analysis phase duration was one month and resourced with an Information Management Services staff member two days a week. Microsoft Excel pivot tables were used for data mining and data trend identification. The reporting phase involved three aspects for reporting. Initial visual reports were provided to managers of departments once the information asset audit was completed for their area. These reports included asset, source, and asset type analysis as well as department observations. The reports were discussed in person with the manager and presented to the team leaders of the area when requested by the department manager. Comprehensive organisational reports were provided to the Information Management Steering Committee on completion of the audit process. This included both a comprehensive organisational information trend report, and a one page visual of ‘current state’ information assets at the
123
University. Finally, on request reporting was undertaken for organisational project managers on information states and trends related to organisational projects underway at USC. RESULTS The intended result of the information asset audit was to discover and identify the University’s information assets and to establish an Information Asset Register to facilitate better management of these assets. At the end of the project in 2013, the IAR included more than 3,000 individual assets categorised by 168 different asset types. To date these asset types are not aligned with any endorsed classification scheme or thesaurus, having been developed through consultation with the different University subject matter experts. Assets were identified primarily across the University intranet, the external website and two shared network drives. University systems (e.g. PeopleSoft) were also included in the register as assets. The project was limited by changes that occurred during the data collection phase. Information assets were originally collected at a high level of granularity. As the audit progressed it became evident that a lower level of granularity would be of more benefit. Accessibility of information was also a limiting factor. Some information sources were deemed too sensitive to be included in the asset register at the same level of granularity as other sources. In some instances accessibility was limited because the exact sources were unknown, particularly where private folders had been established on the shared network drives. The assets included in the register highlighted the amount of duplication across the University, both in terms of duplicated content and duplicated effort. There were a number of documents, forms in particular, that had been saved by different departments. In other instances, similar types of documents had been created in isolation by different departments. The use of source systems, and the storage of information in them, was also inconsistent. Some departments used the intranet to store and disseminate information, other departments used the shared network drives. The storage location of information assets was department driven, not purpose or audience driven. This was primarily due to there being no formal guidance for staff on where or how to store, disseminate and publish information. Seeking access to the University’s information sources also revealed issues with discoverability of information. One of the shared network drives was permission based (i.e. only those folders an employee had been granted permission to access would appear). Only a small proportion of this content was therefore included in the audit. A number of problematic asset types were identified during the audit. These included forms, business process instructions, images and contact information. Primarily these issues surrounded the duplication, redundancy and/or inconsistencies in formatting and function. For example, over 400 forms were identified and included in the IAR. Although it was relatively easy to identify which forms had been duplicated, it was more difficult to differentiate between different versions of the same form.
124
DISCUSSION Whilst the information asset review process populated the IAR for further information management application (what information assets are held, who was responsible for them, and where the assets are held), it also led to a clear picture regarding current organisational information state. This included intelligence on technology, information movement, asset type performance, and information behaviour. The University works to a comprehensive enterprise architecture for information technology delivery and planning, and the results of the information asset review process augmented this by outlining information asset types within each business system, as well as the business areas engaging with each system. The process also identified other smaller sources in use at the University. From this, Information Management Services staff are able to look further to determine if an established central business system could meet the information need, or alternatively if a gap in centrally supported business systems functionality existed. Whilst the information asset audit did not formally track information flow throughout the organisation, IAR analytics enabled basic information movement analysis. This included tracking the difference in locations for structured and unstructured information, as well as the heat spots for information duplication across the organisation (for both asset types commonly duplicated, and common sources of duplication). Highlighting these areas enabled the Information Management team to prioritize and target future activities, including an intranet replacement project. The IAR also provided opportunity to data-mine specific information asset types, with asset types able to be mapped across the organisation. This led to a greater understanding of gaps in information asset type guidance at the University and flowed through to other information management activities planned for the future focusing on forms, contact information, guidelines, and business process methodology. Asset type analytics drawn from the IAR have been used by project managers for other central USC projects. This intelligence on current state information has been used by staff leading: data warehouse strategy project; intranet replacement project; managing information in shared drives project; website redesign project; and curriculum management system project. Being able to cross-analyse asset types and their source systems was also valuable. For example, the majority of business process instructions (much of which would have been for general consumption) was located on non-public source systems. It enabled the Information Management team to collate a list of asset types that were locked up in secure source systems, when their use was broader. The process also provided intelligence on organisational information behaviours. Differences in information behaviours of departments was noted, and where confusion or different practices existed, future information management support and training is planned to support organisational information management practices. A good example was some differences across the organisation on the correct place to store specific information asset types. To address this, plans are underway to outline information classification structures mapped to existing sources, with statements included in a new information policy supported by training material. Essentially, whilst a key part of an information asset audit process and a key objective of an IAR is to allocate value to organisational information assets, the IAR itself is an information
125
asset with high value to the organisation, providing intelligence on information state that can be used to inform current and future organisational projects. In the USC experience, taking analytics from the IAR need not wait until IAR population is completed, it can be undertaken to provide value along the way. For example, when added to the Stevens (2005) six step iterative process for conducting an information asset profile, IAR analytics can be conducted alongside steps 2-6. Maintenance of the IAR is ongoing at USC, with the Director of Information Services as the asset owner, and the Information Management Coordinator as the asset custodian. Further expansion on the IAR is expected in the next twelve months including: Further work on defining information asset ownership (with related responsibility
embedded in organisational information policy, and training to ensure these responsibilities are understood by staff). Allocating information security classifications to asset types. Defining an organisational methodology for valuing information assets. Expanding the information asset audit scope and analytics as required to support new projects at the University. Undertaking information management projects to address the information glut identified throughout the process that are not information assets. Transitioning the IAR from Microsoft Excel to a new system to provide further accessibility to staff and ensure scalability.
CONCLUSION The USC Information Asset Register, and the information asset audit process, has provided the Information Management Services unit with qualitative and quantitative data on how information is being created, used and stored at the University. It has also highlighted issues around how information is stored and disseminated at the University, and identified information behaviours that have developed in response to these issues. The process undertaken by USC to audit its information assets and the establishment of the IAR provides a useful template for other institutions seeking a greater understanding of information asset management. This case study highlights the importance of the IAR in not only identifying and categorising information assets, but using the data provided to establish the context within which better information management practices need to take place. BIBLIOGRAPHICAL NOTES Chelsea Harper is the Information Officer – Strategy at the University of the Sunshine Coast. Kate Kirby is the Information Management Coordinator at the University of the Sunshine Coast. Sandra Jeffries is the Director, Information Services at the University of the Sunshine Coast. REFERENCES Brimson, J. (2013). Information Asset Registers: A brief guide. InfoRed Consulting. Retrieved from http://www.infored.com.au/infored-resources Department of Public Works, Queensland Government. (2011). Identification and classification of information assets. Retrieved from
126
http://www.qgcio.qld.gov.au/images/documents/QGEA_documents/SiteCollectionDocuments/Architecture%20and%20Standards/Information%20Standards/Toolbox/Information%20Asset%20Custodianship/Ident%20and%20Class%20of%20Info%20Assets.pdf Department of Public Works, Queensland Government. (2011). Information Asset Register. Retrieved from https://www.qgcio.qld.gov.au/products/qgea-documents/548-information/2343-information-assets-register-guideline-is44-toolbox Griffiths, P. (2010). Where next for information audit? Business Information Review, 27 (December), 216-224. Griffiths, P. (2012). Information audit: towards a common standardised methodology. Business Information Review, 29 (March), 39-51. Higson, C. & Waltho, D. (2010). Valuing information as an asset. SAS. Retrieved from http://www.eurim.org.uk/activities/ig/InformationAsset.pdf Lacy, S., Midgley, F., Riley, J., & Williamson, N. (2011). ITIL Managing Digital Information Assets. Retrieved from https://www.axelos.com/gempdf/ITIL_Digital_Assets_White_Paper.pdf Moody, D. & Walsh, P. (1999). Measuring the value of information: an asset valuation approach. Paper presented at the European Conference on Information Systems, 23-25 June 1999, Copenhagen, Denmark. Retrieved from http://wwwinfo.deis.unical.it/zumpano/2004-2005/PSI/lezione2/ValueOfInformation.pdf The National Archives. (n.d.). What is an Information Asset Register? Retrieved from http://www.nationalarchives.gov.uk/documents/information-management/info-asset-register-factsheet.pdf National Archive of Australia (2011). Digital Continuity Plan. Retrieved from http://www.naa.gov.au/Images/12.02.05%20Digital%20Continuity%20Plan%20web_tcm16-52027.pdf National Archives of Australia (2014). Conducting an Information Review. Retrieved from http://www.naa.gov.au/records-management/agency/digital/digital-continuity/plan/conducting-an-information-review.aspx Office of the Australian Information Commissioner. (2011). Principles on open public sector information. Retrieved from http://www.oaic.gov.au/information-policy/information-policy-resources/information-policy-agency-resources/principles-on-open-public-sector-information Office of Public Sector Information (OPSI). (2009). Information Asset Register. Retrieved from http://tna.europarchive.org/20100402134329/http://www.opsi.gov.uk/iar/index.htm Stevens J. F., (2005). Information Asset Profiling. Software Engineering Institute, Carnegie Melon University. Retrieved from http://resources.sei.cmu.edu/library/asset-view.cfm?assetid=7443
127
ADAPTING TO CHANGE IN UNIVERSITY LEARNING SPACE – INFORMING AND BEING INFORMED BY FEEDBACK FROM
SENIOR UNIVERSITY LEADERS
Robert A. Ellis Institute for Teaching and Learning, University of Sydney
Kenn Fisher Faculty of Architecture, Building and Planning, University of Melbourne
[email protected] ABSTRACT Transformation of learning space at university is a global phenomenon as universities adapt to new drivers in the international higher education environment. The specification of requirements for learning space in universities from multiple perspectives is necessary to meet the expectations and outcomes of students, faculties and university leadership. This paper reports on a national workshop for university leaders (n=50) (Australasian Council of Deans National Conference) and their considerations of the design requirements for informal learning space for university students. It discusses the outcomes of focus group discussions and then contextualises those within a case-study of a large informal learning space development at a metropolitan Australian university. The implications arising from the feedback of university leaders are discussed, noting that pedagogically-driven and shared concepts are at the core of effective learning space design and are necessary to adapt successfully to changing requirements. KEYWORDS Learning space, stakeholder feedback, case study INTRODUCTION The design of learning space in universities has been attracting significant attention, particularly in Australia since the Federal Government’s Education Investment Fund supported most universities to renew or build learning and teaching space facilities over the last six years (DIISRTE, 2012). Key to designing spaces that work is the input of stakeholders who will use the spaces (Gee, 2006). The feedback from stakeholders is likely to vary depending on the perspective they bring. Feedback from students is valuable in order to get student perspectives on the general layout, the functionalities and services that will be provided by the space. This feedback can highlight student preferences on issues such as types of seating and lighting and types of technologies. Equally important but much less investigated is the perspectives of those who are responsible for leading the development of learning space, who often have substantial experience in the practice of teaching, and who seek a framework for the conceptualisation, design and build process of learning space. Some aspects of their feedback is likely to be informed by the same concerns as students, but other
128
aspects may be different and informed by more institutional concerns which, if identified, will help to flesh out more rounded and robust requirements for learning space design In this paper we canvass the perspectives of senior university leaders across Australia nationally on the requirements of learning space. To give the university leaders a context in which to formulate their ideas, the process drew on a case-study of the development of a large informal learning space at a large metropolitan university. In this paper, the process of discovering coherence amongst the ideas from the senior leaders using the case study, and the case study itself, are discussed as a way of teasing apart the issues involved in shaping learning space design with the feedback of senior leaders. RESEARCH INTO STAKEHOLDER FEEDBACK ON LEARNING SPACE The benefits of stakeholder feedback on design processes are well recognised in the literature (see for example Wisner & Stea, 1996; Sanoff, 2000). One area of systematic research into stakeholder feedback is in ‘participatory design’. Techniques for eliciting participant input into design processes includes workshops, focus groups, design charrettes and the use of case studies as stimulus (Luck, 2007). These methods help to develop material for design processes which are part of a collectively produced repository of knowledge which can be used to inform the design process and the engagement of all stakeholders. More active forms of participatory design processes shift stakeholder roles from users to design recipients, engaged in the decisions involved in the design (Binder, 1996). Such approaches move towards higher rungs on the ‘ladder of citizen participation’ described by Arnstein (1969), which indicates a significant difference between going through a formulaic process without any real influence in comparison to participating with the influence to affect outcomes. This is one of the potential pitfalls of seeking stakeholder feedback in design processes and needs to be avoided. Internationally, there has been some evidence of a culture of stakeholder participation in design processes in learning space. At a national level in the United Kingdom, open-plan education in the 1960s and 1970s gave designers cause to examine how learning space was designed and used (Woolner et. al., 2007). Much of this development was unaligned to practice that occurred because the educationalists who advised the designers and architects tended to interested in the novel, rather than the fundamental. They also did not initiate a parallel teacher professional development strategy to accompany new more flexible, open spaces. A lesson learnt from this experience was that when seeking advice from an educational institution on where its pedagogy is heading in order to inform design, it is just as valuable to consult those leaders who are cautious about change as well as those who are adventurous and optimistic about change. Balanced feedback is more likely to result in designs which match the culture. Recently in Japan, significant stakeholder feedback was sought at a national level on the ideas of integrating the function of learning commons into libraries. In 2010, the leaders of 755 libraries country-wide were surveyed for their feedback on the costs and benefits of the existing functions of learning commons in libraries and which functions, facilities and services were required in design solutions (Donkai et al., 2011). The outcomes of the feedback strengthened the understanding of the types of activities in which the Japanese students engaged in the learning commons and how this knowledge could inform the design and standards for similar facilities in future builds.
129
In the following, we discuss feedback from senior academic leaders from faculties across Australia, how it relates to a case-study of informal learning space development, and how the two relate to informed approaches to learning space design. METHOD To coordinate feedback on learning space from a group of senior academics in the Arts and Social Sciences from universities across Australia, a two hour learning space workshop was integrated into their annual meeting and structured using focus group methodology (Morgan, 1988). The focus group process involved some fifty participants who were presented with a scenario of having received sufficient capital monies in order to gut and refurbish the floor of a building for the provision of new informal learning space to students, a learning hub. The key questions guiding the focus group process were;
1. How would you go about developing a plan for university learning space? What are the main issues that you feel should be considered?
2. In order to develop the plan for university learning space, what perspectives would you adopt to guide it?
3. In the context of planning for learning space while considering a number of perspectives, what are some key characteristics of learning space which should be emphasised in the design?
In order to provide a frame of reference to make sense of the ideas provided by the participants, a case study of informal learning space development at a large metropolitan university, a learning hub, was used. The learning hub case study was presented and discussed with participants and helped to sharpen the ideas raised in the focus group process discussing the above three questions. The process for collecting the responses from participants involved the fifty participants, a facilitator and a note taker for the focus group workshop. The participants were allocated to tables in seven groups of 6-8 people. The questions above were used by the focus group facilitator to structure the two hour workshop. Each group had its own note-taker and respondent. After contextualisation of each question by the facilitator to the group as a whole, each table had approximately 20 minutes to discuss their responses from their own perspectives. The respondent in each group summarised the main ideas of the table to the full the plenary session after each question. The workshop ended with a summary session of the findings from the discussions using a storyboarding approach which clustered the responses into themes. PARTICIPANT FEEDBACK The participant feedback is summarised in the affinity diagram shown in Figure 1. Affinity diagrams are a useful way of organising a lot of information into coherent groupings (Cohen, 1995). In the context of learning space, they can be used to translate the experience of stakeholders into recognisable educational functions (K ksal & E tman, 1998). Figure 1 presents the main issues arising from the feedback process from the trigger questions. Overall it was clear that the participants thought the student and teaching experience should be the perspective from which most of the issues were considered. For this reason, the ‘student and teaching experience’ is at the centre of Figure 1. The three areas
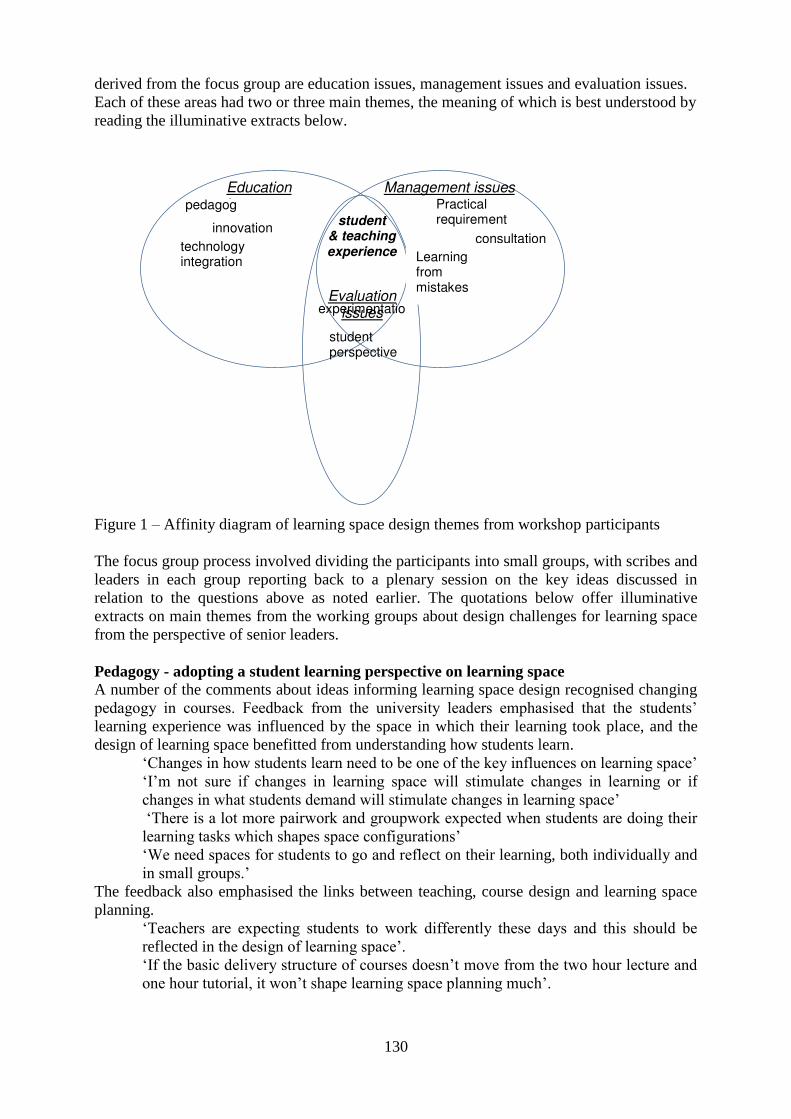
130
derived from the focus group are education issues, management issues and evaluation issues. Each of these areas had two or three main themes, the meaning of which is best understood by reading the illuminative extracts below. Figure 1 – Affinity diagram of learning space design themes from workshop participants The focus group process involved dividing the participants into small groups, with scribes and leaders in each group reporting back to a plenary session on the key ideas discussed in relation to the questions above as noted earlier. The quotations below offer illuminative extracts on main themes from the working groups about design challenges for learning space from the perspective of senior leaders. Pedagogy - adopting a student learning perspective on learning space A number of the comments about ideas informing learning space design recognised changing pedagogy in courses. Feedback from the university leaders emphasised that the students’ learning experience was influenced by the space in which their learning took place, and the design of learning space benefitted from understanding how students learn.
‘Changes in how students learn need to be one of the key influences on learning space’ ‘I’m not sure if changes in learning space will stimulate changes in learning or if changes in what students demand will stimulate changes in learning space’ ‘There is a lot more pairwork and groupwork expected when students are doing their learning tasks which shapes space configurations’ ‘We need spaces for students to go and reflect on their learning, both individually and in small groups.’
The feedback also emphasised the links between teaching, course design and learning space planning.
‘Teachers are expecting students to work differently these days and this should be reflected in the design of learning space’. ‘If the basic delivery structure of courses doesn’t move from the two hour lecture and one hour tutorial, it won’t shape learning space planning much’.
Education issues
Management issues
student & teaching experience
Evaluation issues
pedagogy
Practical requirements
Learning from mistakes
technology integration
innovation
experimentation
student perspective
consultation

131
It was noted that if the change in learning space design was not accompanied by a change in course design and approaches to teaching, then lasting impact on pedagogy was not likely to occur. This raised the question of the role of innovation in learning and teaching and learning space design. Stimulating an innovative culture Some participants argued that there was insufficient change occurring in the learning and teaching in their institutions to motivate new designs for learning space
‘Changing pedagogies do not always develop widespread use….flipping classrooms has not taken hold across enough faculties to motivate change.’ ‘Students do not always understand how to use new technologies in their learning…particularly when they have to work together.’ ‘Any change in the provision of learning space should be accompanied by significant staff development. Teachers need support for how to approach teaching in new ways.’ ‘Some individual leaders at universities don’t necessarily have experience in this area.’
As a solution or strategy to encourage innovation, many of the leaders reported success in stimulating change through the inclusion of technologies to support the process of learning of students. This observation was accompanied by the recognition that technology in learning had moved from just the innovative space to a ubiquitous part of the student experience. Technology integration The senior leaders commented that the inclusion of technology in learning space design, both technologies within physical space as well as technologies providing virtual space, was now a fundamental aspect of university learning environments. Getting the balance right in the design for the contribution of technology to learning was cited as a particular challenge, reliant on both good support and on an awareness of how student activity both in class and online needed to be integrated.
‘New learning space designs are rich in technology provision. They provide lots of opportunities for individual, pair and groupwork supported by technology.’ ‘Some new ways of learning require more technology support. Often there is not sufficient support provided in informal learning space for students’. ‘Learning tasks that require students to engage in online inquiry can shape the way they work together in physical learning space’.
This last area created significant discussion in how virtual learning space should be thought of in relation to physical learning space. The two were clearly related for the senior leaders group, but there was no consensus on the best way to think of their contribution to learning in the design process.
‘Incorporating different categories of space together in design solutions is a challenge. I’m not sure how online space should be thought of in relation to the physical.’ ‘Planning for online learning space should influence the design of physical learning space, but it is not always clear how to do this.’
A number of groups during the feedback process made the observation that a failure to really embrace the student and teaching perspective was likely to produce outcomes which did not meet their needs and could lead to mistakes. Learning from mistakes Some of the comments were observations made about space development projects from past experience. Many of the senior leaders had been involved in projects which had produced outcomes to be avoided, often citing insufficient development of the links between pedagogic activity and the design solutions during the design process.
132
‘If the learning space design is not well thought out, it can feel like a Bunnings warehouse’ ‘Sometimes the space looks good from an architectural perspective, but the students don’t really use it’. ‘Getting the balance right with technology can be tricky. Too much is as bad as too little.’
Another lesson from past mistakes was related to the extent of integration of the redesigned learning and teaching facilities into existing structures of the University. The necessity of integrating the new learning space into the governance and management structures was emphasised.
‘If learning spaces are not integrated into management structures at the university, they won’t be sustainable.’ ‘New designs are often sought after by teachers, but if they are not integrated into the support services, they won’t work effectively for the students’.
Having considered some of the educational challenges, the senior leaders turned their attention to some of the practical drivers for learning space provision. Practical drivers for learning space design One group of comments from the feedback dealt with practical considerations such as capacity and functions of learning space. Observations were made about the drivers of learning space design, such as growth in student numbers and the availability of sufficiently large footprints.
‘Increasing student numbers means that there is often not enough learning space provided at the level of the university’ ‘There is a tension between increasing enrolment numbers and modern designs for learning space which often increases the metres squared allocated to each student’ ‘Within rooms, mechanical services and data points should not determine the education function of teaching spaces.’
The purpose of learning space, particularly the rise in importance of informal learning space, was emphasised in the feedback.
‘Not all faculties are willing to share space, but this is particularly important for informal learning space provision provided at the level of the university’. ‘Getting enough space allocated to you to redevelop for informal learning is difficult’. ‘We don’t always know where to locate informal learning space for students across campus.’
When asked why informal space allocation was such a problem, some Deans reported that there was sometimes insufficient understanding of how student learning tasks were increasingly dependent on groupwork and technology facilities outside of formal class. As a consequence, in the face of demand for services online and in the classroom, informal learning space in learning hubs and commons often did not receive sufficient attention, support or funding. Stakeholder consultation and evaluation To establish new projects, particularly those that may not receive enough attention, the senior leaders argued that with the right consultation, even less favoured projects can be established. Integrating stakeholders appropriately into the governance structures of learning space development projects was identified as a key strategy.
‘Governance and leadership groups involving the right stakeholders for the space design is essential to demonstrate appropriate consultation.’
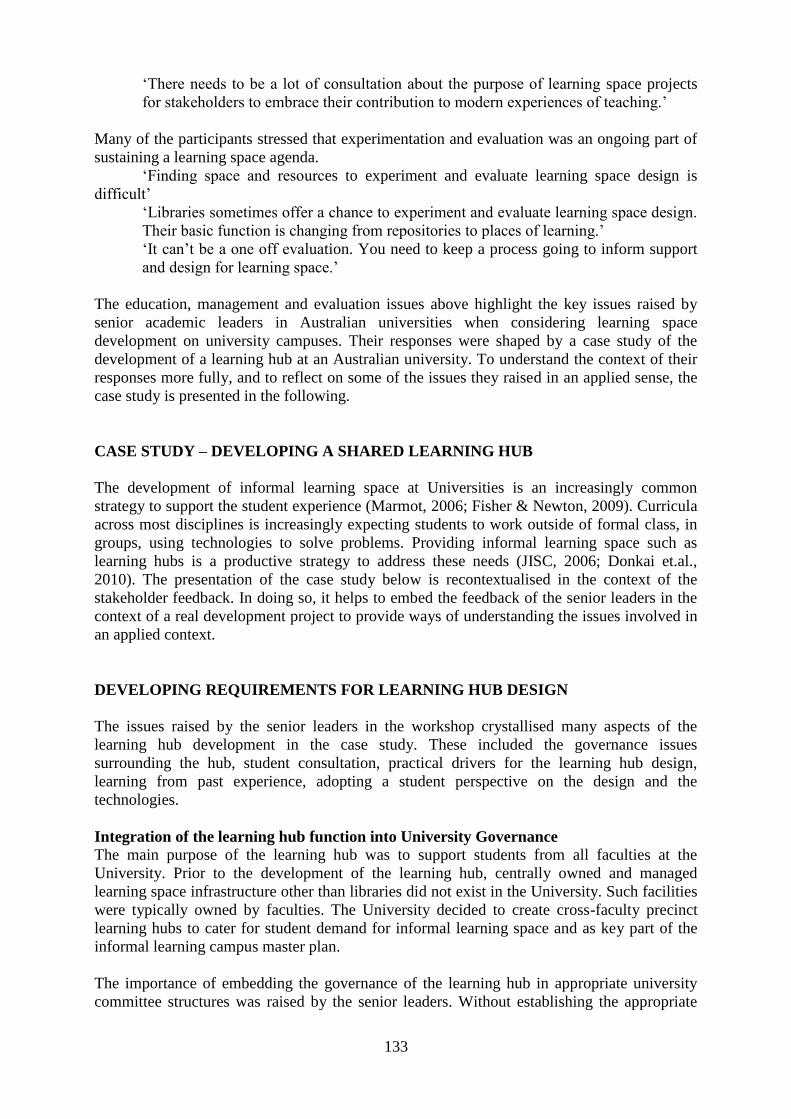
133
‘There needs to be a lot of consultation about the purpose of learning space projects for stakeholders to embrace their contribution to modern experiences of teaching.’
Many of the participants stressed that experimentation and evaluation was an ongoing part of sustaining a learning space agenda. ‘Finding space and resources to experiment and evaluate learning space design is difficult’
‘Libraries sometimes offer a chance to experiment and evaluate learning space design. Their basic function is changing from repositories to places of learning.’ ‘It can’t be a one off evaluation. You need to keep a process going to inform support and design for learning space.’
The education, management and evaluation issues above highlight the key issues raised by senior academic leaders in Australian universities when considering learning space development on university campuses. Their responses were shaped by a case study of the development of a learning hub at an Australian university. To understand the context of their responses more fully, and to reflect on some of the issues they raised in an applied sense, the case study is presented in the following. CASE STUDY – DEVELOPING A SHARED LEARNING HUB The development of informal learning space at Universities is an increasingly common strategy to support the student experience (Marmot, 2006; Fisher & Newton, 2009). Curricula across most disciplines is increasingly expecting students to work outside of formal class, in groups, using technologies to solve problems. Providing informal learning space such as learning hubs is a productive strategy to address these needs (JISC, 2006; Donkai et.al., 2010). The presentation of the case study below is recontextualised in the context of the stakeholder feedback. In doing so, it helps to embed the feedback of the senior leaders in the context of a real development project to provide ways of understanding the issues involved in an applied context. DEVELOPING REQUIREMENTS FOR LEARNING HUB DESIGN The issues raised by the senior leaders in the workshop crystallised many aspects of the learning hub development in the case study. These included the governance issues surrounding the hub, student consultation, practical drivers for the learning hub design, learning from past experience, adopting a student perspective on the design and the technologies. Integration of the learning hub function into University Governance The main purpose of the learning hub was to support students from all faculties at the University. Prior to the development of the learning hub, centrally owned and managed learning space infrastructure other than libraries did not exist in the University. Such facilities were typically owned by faculties. The University decided to create cross-faculty precinct learning hubs to cater for student demand for informal learning space and as key part of the informal learning campus master plan. The importance of embedding the governance of the learning hub in appropriate university committee structures was raised by the senior leaders. Without establishing the appropriate
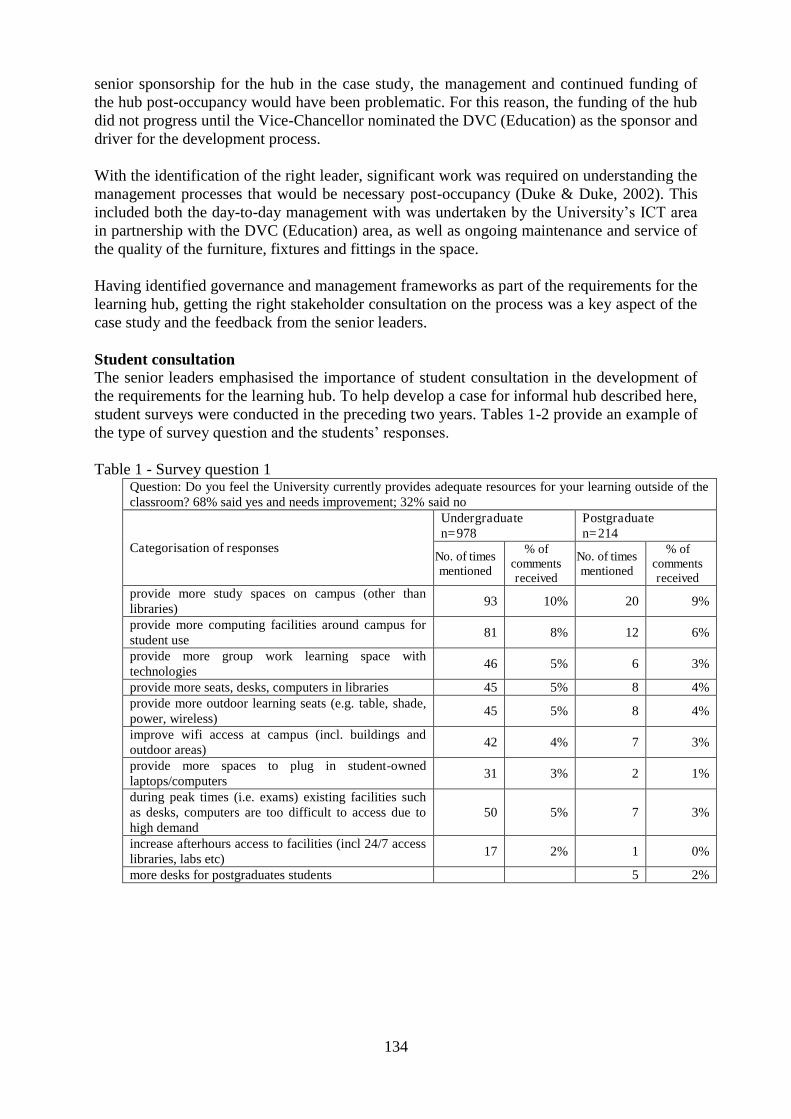
134
senior sponsorship for the hub in the case study, the management and continued funding of the hub post-occupancy would have been problematic. For this reason, the funding of the hub did not progress until the Vice-Chancellor nominated the DVC (Education) as the sponsor and driver for the development process. With the identification of the right leader, significant work was required on understanding the management processes that would be necessary post-occupancy (Duke & Duke, 2002). This included both the day-to-day management with was undertaken by the University’s ICT area in partnership with the DVC (Education) area, as well as ongoing maintenance and service of the quality of the furniture, fixtures and fittings in the space. Having identified governance and management frameworks as part of the requirements for the learning hub, getting the right stakeholder consultation on the process was a key aspect of the case study and the feedback from the senior leaders. Student consultation The senior leaders emphasised the importance of student consultation in the development of the requirements for the learning hub. To help develop a case for informal hub described here, student surveys were conducted in the preceding two years. Tables 1-2 provide an example of the type of survey question and the students’ responses. Table 1 - Survey question 1
Question: Do you feel the University currently provides adequate resources for your learning outside of the classroom? 68% said yes and needs improvement; 32% said no
Categorisation of responses
Undergraduate n=978
Postgraduate n=214
No. of times mentioned
% of comments received
No. of times mentioned
% of comments received
provide more study spaces on campus (other than libraries)
93 10% 20 9%
provide more computing facilities around campus for student use
81 8% 12 6%
provide more group work learning space with technologies
46 5% 6 3%
provide more seats, desks, computers in libraries 45 5% 8 4% provide more outdoor learning seats (e.g. table, shade, power, wireless)
45 5% 8 4%
improve wifi access at campus (incl. buildings and outdoor areas)
42 4% 7 3%
provide more spaces to plug in student-owned laptops/computers
31 3% 2 1%
during peak times (i.e. exams) existing facilities such as desks, computers are too difficult to access due to high demand
50 5% 7 3%
increase afterhours access to facilities (incl 24/7 access libraries, labs etc)
17 2% 1 0%
more desks for postgraduates students 5 2%
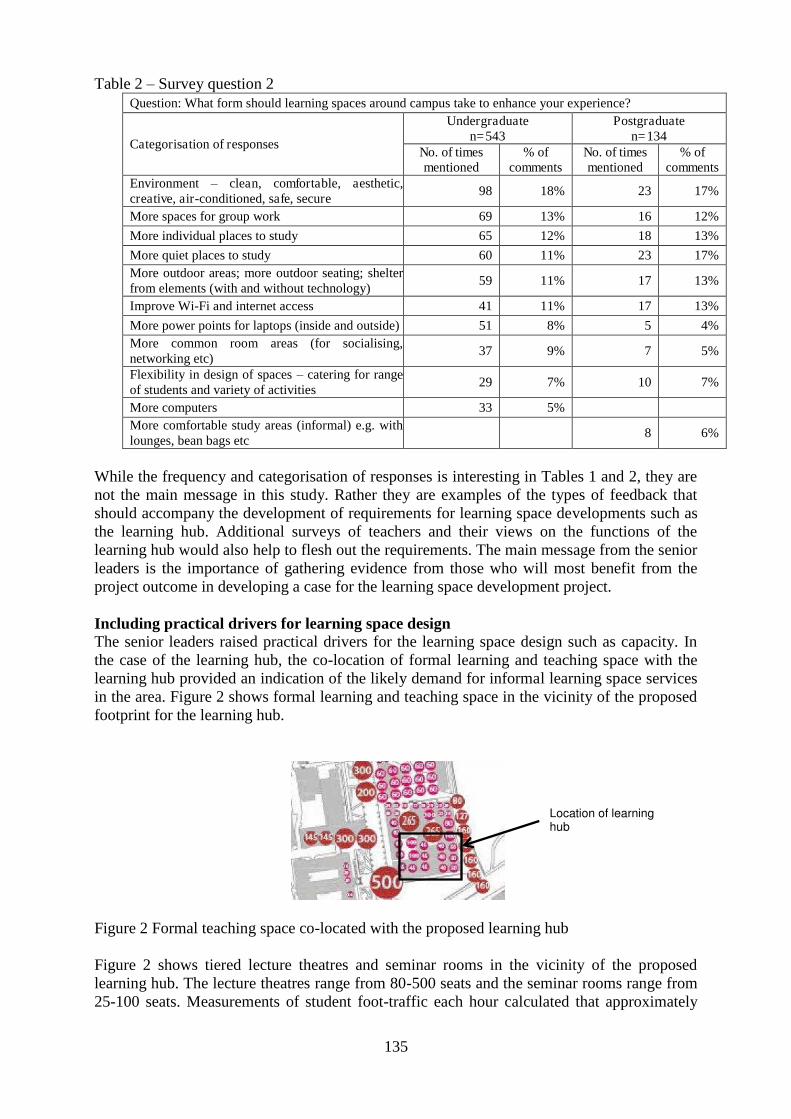
135
Table 2 – Survey question 2 Question: What form should learning spaces around campus take to enhance your experience?
Categorisation of responses
Undergraduate n=543
Postgraduate n=134
No. of times mentioned
% of comments
No. of times mentioned
% of comments
Environment – clean, comfortable, aesthetic, creative, air-conditioned, safe, secure
98 18% 23 17%
More spaces for group work 69 13% 16 12%
More individual places to study 65 12% 18 13%
More quiet places to study 60 11% 23 17% More outdoor areas; more outdoor seating; shelter from elements (with and without technology)
59 11% 17 13%
Improve Wi-Fi and internet access 41 11% 17 13%
More power points for laptops (inside and outside) 51 8% 5 4% More common room areas (for socialising, networking etc)
37 9% 7 5%
Flexibility in design of spaces – catering for range of students and variety of activities
29 7% 10 7%
More computers 33 5% More comfortable study areas (informal) e.g. with lounges, bean bags etc
8 6%
While the frequency and categorisation of responses is interesting in Tables 1 and 2, they are not the main message in this study. Rather they are examples of the types of feedback that should accompany the development of requirements for learning space developments such as the learning hub. Additional surveys of teachers and their views on the functions of the learning hub would also help to flesh out the requirements. The main message from the senior leaders is the importance of gathering evidence from those who will most benefit from the project outcome in developing a case for the learning space development project. Including practical drivers for learning space design The senior leaders raised practical drivers for the learning space design such as capacity. In the case of the learning hub, the co-location of formal learning and teaching space with the learning hub provided an indication of the likely demand for informal learning space services in the area. Figure 2 shows formal learning and teaching space in the vicinity of the proposed footprint for the learning hub.
Figure 2 Formal teaching space co-located with the proposed learning hub Figure 2 shows tiered lecture theatres and seminar rooms in the vicinity of the proposed learning hub. The lecture theatres range from 80-500 seats and the seminar rooms range from 25-100 seats. Measurements of student foot-traffic each hour calculated that approximately
Location of learning hub
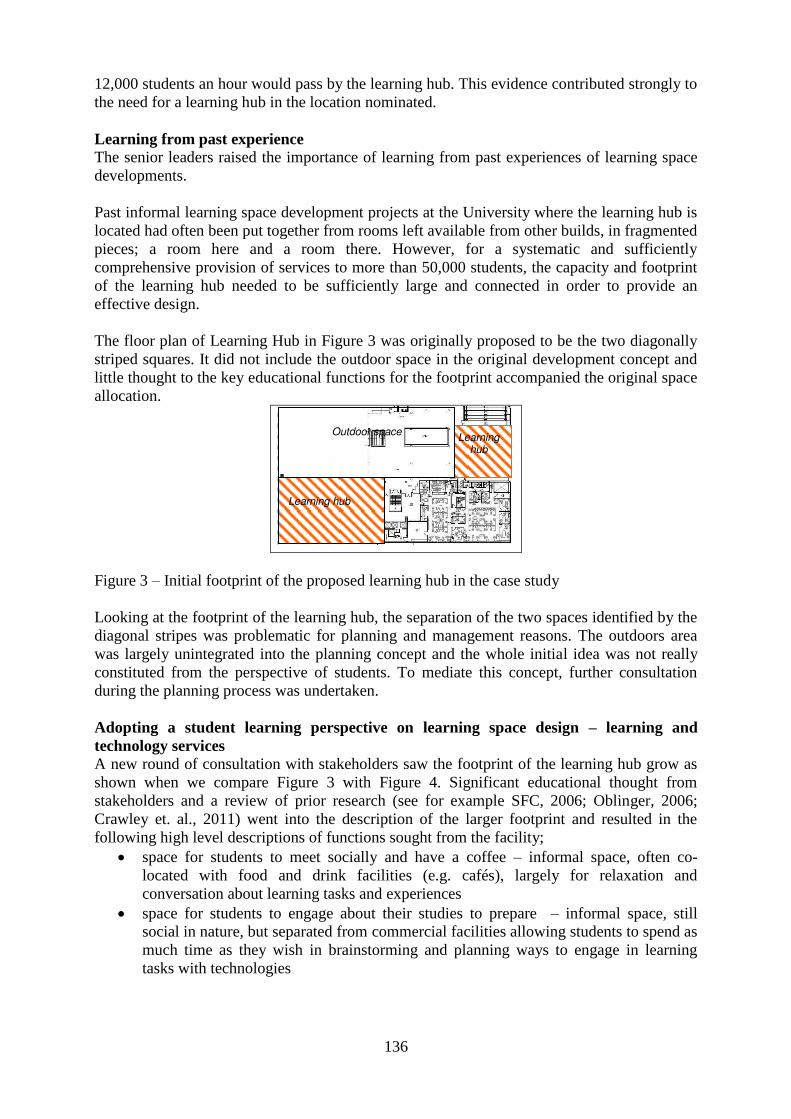
136
12,000 students an hour would pass by the learning hub. This evidence contributed strongly to the need for a learning hub in the location nominated. Learning from past experience The senior leaders raised the importance of learning from past experiences of learning space developments. Past informal learning space development projects at the University where the learning hub is located had often been put together from rooms left available from other builds, in fragmented pieces; a room here and a room there. However, for a systematic and sufficiently comprehensive provision of services to more than 50,000 students, the capacity and footprint of the learning hub needed to be sufficiently large and connected in order to provide an effective design. The floor plan of Learning Hub in Figure 3 was originally proposed to be the two diagonally striped squares. It did not include the outdoor space in the original development concept and little thought to the key educational functions for the footprint accompanied the original space allocation.
Figure 3 – Initial footprint of the proposed learning hub in the case study Looking at the footprint of the learning hub, the separation of the two spaces identified by the diagonal stripes was problematic for planning and management reasons. The outdoors area was largely unintegrated into the planning concept and the whole initial idea was not really constituted from the perspective of students. To mediate this concept, further consultation during the planning process was undertaken. Adopting a student learning perspective on learning space design – learning and technology services A new round of consultation with stakeholders saw the footprint of the learning hub grow as shown when we compare Figure 3 with Figure 4. Significant educational thought from stakeholders and a review of prior research (see for example SFC, 2006; Oblinger, 2006; Crawley et. al., 2011) went into the description of the larger footprint and resulted in the following high level descriptions of functions sought from the facility; space for students to meet socially and have a coffee – informal space, often co-
located with food and drink facilities (e.g. cafés), largely for relaxation and conversation about learning tasks and experiences space for students to engage about their studies to prepare – informal space, still social in nature, but separated from commercial facilities allowing students to spend as much time as they wish in brainstorming and planning ways to engage in learning tasks with technologies
Learning hub
Learning hub
Outdoor space
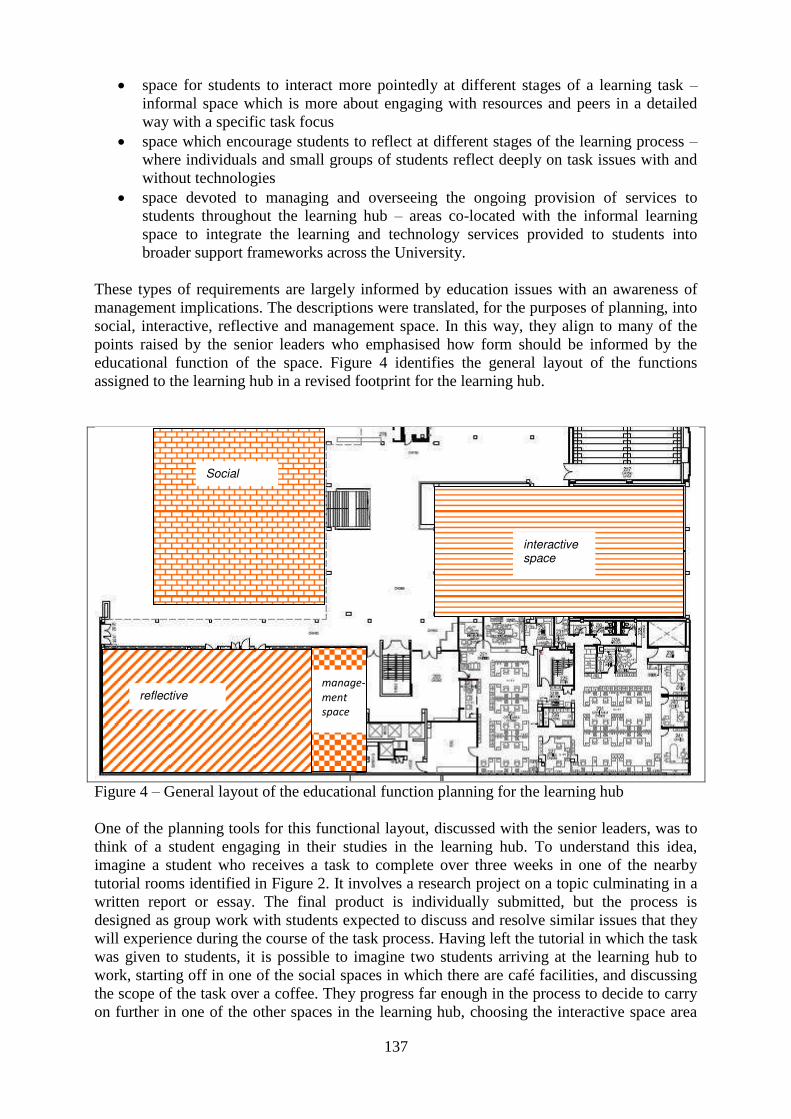
137
space for students to interact more pointedly at different stages of a learning task – informal space which is more about engaging with resources and peers in a detailed way with a specific task focus space which encourage students to reflect at different stages of the learning process – where individuals and small groups of students reflect deeply on task issues with and without technologies space devoted to managing and overseeing the ongoing provision of services to students throughout the learning hub – areas co-located with the informal learning space to integrate the learning and technology services provided to students into broader support frameworks across the University.
These types of requirements are largely informed by education issues with an awareness of management implications. The descriptions were translated, for the purposes of planning, into social, interactive, reflective and management space. In this way, they align to many of the points raised by the senior leaders who emphasised how form should be informed by the educational function of the space. Figure 4 identifies the general layout of the functions assigned to the learning hub in a revised footprint for the learning hub.
Figure 4 – General layout of the educational function planning for the learning hub One of the planning tools for this functional layout, discussed with the senior leaders, was to think of a student engaging in their studies in the learning hub. To understand this idea, imagine a student who receives a task to complete over three weeks in one of the nearby tutorial rooms identified in Figure 2. It involves a research project on a topic culminating in a written report or essay. The final product is individually submitted, but the process is designed as group work with students expected to discuss and resolve similar issues that they will experience during the course of the task process. Having left the tutorial in which the task was given to students, it is possible to imagine two students arriving at the learning hub to work, starting off in one of the social spaces in which there are café facilities, and discussing the scope of the task over a coffee. They progress far enough in the process to decide to carry on further in one of the other spaces in the learning hub, choosing the interactive space area
Social space
reflective space
manage-
ment
space
interactive space
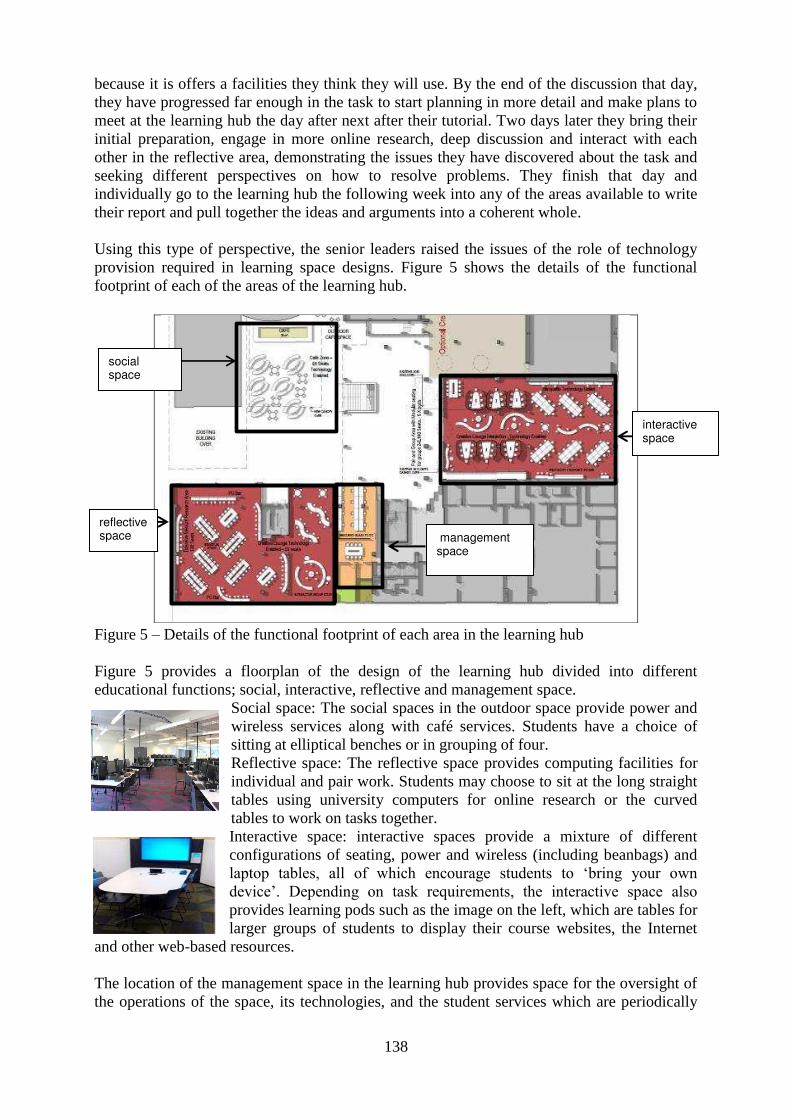
138
because it is offers a facilities they think they will use. By the end of the discussion that day, they have progressed far enough in the task to start planning in more detail and make plans to meet at the learning hub the day after next after their tutorial. Two days later they bring their initial preparation, engage in more online research, deep discussion and interact with each other in the reflective area, demonstrating the issues they have discovered about the task and seeking different perspectives on how to resolve problems. They finish that day and individually go to the learning hub the following week into any of the areas available to write their report and pull together the ideas and arguments into a coherent whole. Using this type of perspective, the senior leaders raised the issues of the role of technology provision required in learning space designs. Figure 5 shows the details of the functional footprint of each of the areas of the learning hub. Figure 5 – Details of the functional footprint of each area in the learning hub Figure 5 provides a floorplan of the design of the learning hub divided into different educational functions; social, interactive, reflective and management space.
Social space: The social spaces in the outdoor space provide power and wireless services along with café services. Students have a choice of sitting at elliptical benches or in grouping of four. Reflective space: The reflective space provides computing facilities for individual and pair work. Students may choose to sit at the long straight tables using university computers for online research or the curved tables to work on tasks together. Interactive space: interactive spaces provide a mixture of different configurations of seating, power and wireless (including beanbags) and laptop tables, all of which encourage students to ‘bring your own device’. Depending on task requirements, the interactive space also provides learning pods such as the image on the left, which are tables for larger groups of students to display their course websites, the Internet
and other web-based resources. The location of the management space in the learning hub provides space for the oversight of the operations of the space, its technologies, and the student services which are periodically
social space
reflective space management
space
interactive space
139
located in the hub such as enrolment support, accommodation support, student welfare support and learning support. The appearance of these services in the learning hub occurs in alignment with the academic cycle of the students each semester over the course of the year. CONCLUSIONS – ADAPTING TO CHANGING LEARNING SPACE THROUGH STAKEHOLDER FEEDBACK Including the feedback from stakeholders such as university leaders, students and teachers to inform design processes for learning space is a difficult but necessary strategy to support meaningful change for learning space development. Without including the appropriate range of stakeholders in the design and development process, the designs required to meet the changing requirements of students, teachers and leaders are unlikely to be realised. Including the feedback from stakeholders such as senior leaders in universities in learning space design is often overlooked yet is essential to include the full range of key issues that need to be considered. A healthy organisation learns from experience, from the ideas of its stakeholders (Bates, 2003). When engaging in learning space development, change is likely to be successful if the right mix of stakeholders are involved and they contribute their experience as well as learning from the experience outside of their organisational boundary. The discussion in this paper has provided some ideas for how the combination of these experiences helps to improve our knowledge of the challenges involved. The discussion presented here suggests that the design and development of university learning space needs to be a not only a consultative one, but also symbiotic, with both the experience of the stakeholders informing the structure of the process, and examples from past learning space developments also informing the design. If such a process is followed with the intent of providing real participatory influence on the outcomes (Arnsetin, 1969), it will reduce criticisms in university planning processes that pay lip-service to stakeholder consultation, but fail to embrace the suggestions made. Avoiding this trap will improve a university’s ability to change to the new requirements of learning space. BIOGRAPHICAL NOTES Dr Robert Ellis is Associate Professor and Director of eLearning and Learning Space at the University of Sydney and a coordinating editor for Higher Education published by Springer. Dr Kenn Fisher is Associate Professor in Learning Environments in the Faculty of Architecture, Building and Planning at The University of Melbourne. REFERENCES Arnstein, S. R. (1969). A ladder of citizen participation. Journal of the American Institute of planners, 35(4), 216-224. Bates, A. T. (2003). Managing technological change. San Francisco, Jossey-Bass.
140
Binder, T. (1996). Learning and knowing with artefacts: an interview with Donald A Schon. Artificial Intelligence and Society, 10(1), 51-57. Cohen, L. (1995). Quality function deployment: How to make QFD work for you. Reading, MA, Addison-Wesley. Crawley, E., Malmqvist, J., Lucas, W. & Brodeur, D. (2011). The CDIO Syllabus v2.0 - An Updated Statement of Goals for Engineering Education Proceedings of the 7th International CDIO Conference, Technical University of Denmark, Copenhagen, June 20 – 23. DIISRTE. (2012). Building a smarter future: Australia’s cutting-edge tertiary education and research facilities. Canberra, Australia. Donkai, S., Toshimori, A., & Mizoue, C. (2011). Academic libraries as learning spaces in Japan: Toward the development of learning commons. The International Information & Library Review, 43(4), 215-220. Duke, C., & Duke, C. (2002). Managing the learning university. England: Society for Research into Higher Education. Fisher, K., & Newton, C. (2009). Transforming Learning Environments in the 21st Century. Sydney: Australian Institute of Architects. Gee L. (2006) Human-Centered Design Guidelines. In D. Oblinger, (2006). (Ed) Learning spaces. Washington,D.C, Educause. JISC (Joint Information Systems Committee) (2006). Designing spaces for effective learning: a guide to 21st century learning space design. Bristol, JISC. K ksal, G., & E tman, A. (1998). Planning and design of industrial engineering education quality. Computers & Industrial Engineering, 35(3), 639-642. Luck, R. (2007). Learning to talk to users in participatory design situations. Design Studies, 28(3), 217-242. Marmot, A. (2006) Spaces for Learning: A Review of Learning Spaces in Further and Higher Education. Scotland, Scottish Funding Council. Morgan, D. L. (1988). Focus groups as qualitative research. London, Sage Publications, Inc. Oblinger, D. (Ed.) (2006). Learning spaces. Washington, D.C., Educause. Sanoff, H. (2000). Community participation methods in design and planning. New York, John Wiley & Sons Inc. SFC (Scottish Funding Council), (2006). Spaces for learning: a review of learning spaces in further and higher education. Scotland, Scottish Funding Review. Wisner, B & Stea, D. (1996). Participatory and action research methods. In E.Zube and G Moore (eds.) Advances in environment behaviour and design. New York, Plenam Press.

141
Woolner, P., Hall, E., Wall, K. & Dennison, D. (2007). Getting together to improve the school environment: user consultation, participatory design and student voice. Improving Schools, 10(3), 233-248.